2020 - texas real estate
TRANSCRIPT
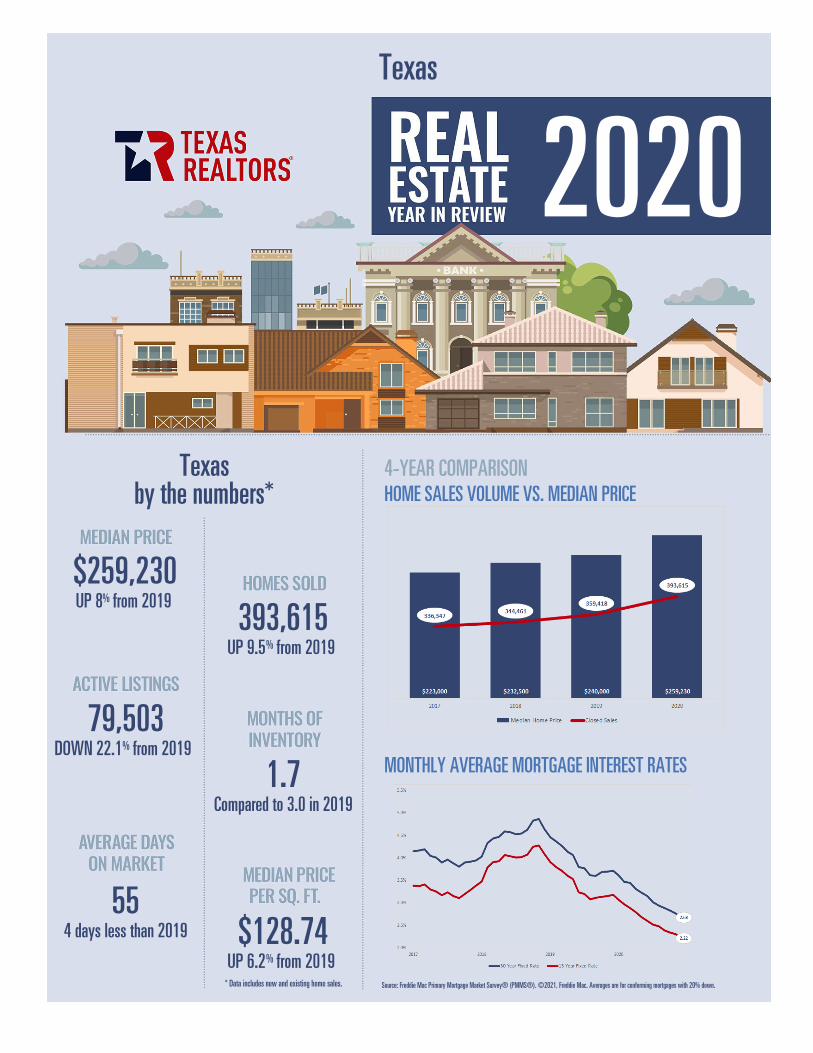
Texas
Texasby the numbers*
$259,230UP 8% from 2019
79,503DOWN 22.1% from 2019
554 days less than 2019
393,615UP 9.5% from 2019
1.7Compared to 3.0 in 2019
$128.74UP 6.2% from 2019
* Data includes new and existing home sales.
4-YEAR COMPARISONHOME SALES VOLUME VS. MEDIAN PRICE
MONTHLY AVERAGE MORTGAGE INTEREST RATES
Source: Freddie Mac Primary Mortgage Market Survey® (PMMS®). ©2021, Freddie Mac. Averages are for conforming mortgages with 20% down.
2020

PERCENT OF HOMES SOLD IN 2020 BY PRICE CLASS
$64,034 TEXAS
Texas $0 - $99,999 4.6%
$100,000 - $199,999 22.9%$200,000 - $299,999 34.5%$300,000 - $399,999 18.3%$400,000 - $499,999 8.7%$500,000 - $749,999 7.3%$750,000 - $999,999 2.0%
$1,000,000+ 1.8%
The median price per square foot in Texashas increased 23.2% since 2016.
Dallas-Fort Worth-Arlington MSA $0 - $99,999 1.4%
$100,000 - $199,999 14.3%$200,000 - $299,999 36.8%$300,000 - $399,999 23.1%$400,000 - $499,999 11.2%$500,000 - $749,999 8.8%$750,000 - $999,999 2.3%
$1,000,000+ 2.1%
Houston-The Woodlands-Sugar Land MSA $0 - $99,999 2.6%
$100,000 - $199,999 22.0%$200,000 - $299,999 37.3%$300,000 - $399,999 18.7%$400,000 - $499,999 8.4%$500,000 - $749,999 7.0%$750,000 - $999,999 1.9%
$1,000,000+ 2.1%
The availability of homes priced under $200,000 hasdecreased 19.2% since 2016.
Austin-Round Rock MSA $0 - $99,999 0.2%
$100,000 - $199,999 4.6%$200,000 - $299,999 33.0%$300,000 - $399,999 24.9%$400,000 - $499,999 14.1%$500,000 - $749,999 14.7%$750,000 - $999,999 4.3%
$1,000,000+ 4.3%
San Antonio-New Braunfels MSA $0 - $99,999 2.7%
$100,000 - $199,999 23.7%$200,000 - $299,999 40.8%$300,000 - $399,999 16.8%$400,000 - $499,999 7.9%$500,000 - $749,999 5.8%$750,000 - $999,999 1.3%
$1,000,000+ 0.9%
Unless otherwise specified, data for this report is provided by the Data Relevance Project, a partnership among Texas REALTORS® and local REALTOR® associations throughout the state. Data analysis is provided by the Texas Real Estate Research Center.
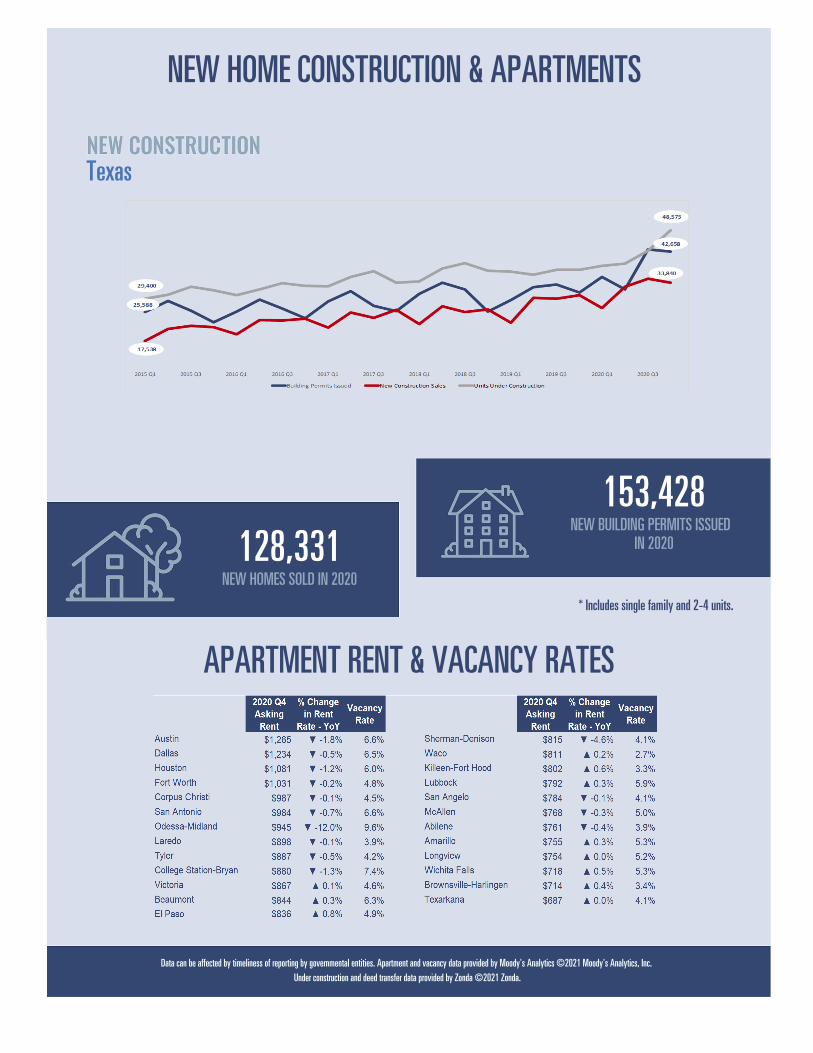
NEW HOME CONSTRUCTION & APARTMENTS
Texas
128,331NEW HOMES SOLD IN 2020
153,428NEW BUILDING PERMITS ISSUED
IN 2020
* Includes single family and 2-4 units.
APARTMENT RENT & VACANCY RATES
Data can be affected by timeliness of reporting by governmental entities. Apartment and vacancy data provided by Moody's Analytics ©2021 Moody's Analytics, Inc. Under construction and deed transfer data provided by Zonda ©2021 Zonda.

Abilene Metropolitan Statistical Area
Abilene MSAby the numbers*
$188,950UP 9.2% from 2019
538DOWN 16.6% from 2019
543 days less than 2019
2,715UP 13.8% from 2019
1.6Compared to 3.0 in 2019
$110.24UP 7.5% from 2019
* Data includes new and existing home sales.
4-YEAR COMPARISONHOME SALES VOLUME VS. MEDIAN PRICE
MONTHLY AVERAGE MORTGAGE INTEREST RATES
Source: Freddie Mac Primary Mortgage Market Survey® (PMMS®). ©2021, Freddie Mac. Averages are for conforming mortgages with 20% down.
2020

PERCENT OF HOMES SOLD IN 2020 BY PRICE CLASS
$54,808 ABILENE
Abilene MSA $0 - $99,999 12.9%
$100,000 - $199,999 43.0%$200,000 - $299,999 29.5%$300,000 - $399,999 9.6%$400,000 - $499,999 3.2%$500,000 - $749,999 1.5%$750,000 - $999,999 0.2%
$1,000,000+ 0.1%
The median price per square foot in Abilenehas increased 23.5% since 2016.
Taylor County $0 - $99,999 10.5%
$100,000 - $199,999 43.1%$200,000 - $299,999 30.8%$300,000 - $399,999 10.2%$400,000 - $499,999 3.5%$500,000 - $749,999 1.7%$750,000 - $999,999 0.2%
$1,000,000+ 0.1%
Callahan County $0 - $99,999 26.1%
$100,000 - $199,999 45.8%$200,000 - $299,999 21.6%$300,000 - $399,999 5.9%$400,000 - $499,999 0.7%$500,000 - $749,999 0.0%$750,000 - $999,999 0.0%
$1,000,000+ 0.0%
The availability of homes priced under $200,000 hasdecreased 16.1% since 2016.
Jones County $0 - $99,999 39.1%
$100,000 - $199,999 39.0%$200,000 - $299,999 16.4%$300,000 - $399,999 3.4%$400,000 - $499,999 1.4%$500,000 - $749,999 0.7%$750,000 - $999,999 0.0%
$1,000,000+ 0.0%
Runnels County $0 - $99,999 43.6%
$100,000 - $199,999 33.3%$200,000 - $299,999 18.0%$300,000 - $399,999 5.1%$400,000 - $499,999 0.0%$500,000 - $749,999 0.0%$750,000 - $999,999 0.0%
$1,000,000+ 0.0%
Unless otherwise specified, data for this report is provided by the Data Relevance Project, a partnership among Texas REALTORS® and local REALTOR® associations throughout the state. Data analysis is provided by the Texas Real Estate Research Center.

NEW HOME CONSTRUCTION & APARTMENTS
Abilene
381NEW HOMES SOLD IN 2020
441NEW BUILDING PERMITS ISSUED
IN 2020
* Includes single family and 2-4 units.
APARTMENT RENT & VACANCY RATES
Data can be affected by timeliness of reporting by governmental entities. Apartment and vacancy data provided by Moody's Analytics ©2021 Moody's Analytics, Inc. Under construction and deed transfer data provided by Zonda ©2021 Zonda.
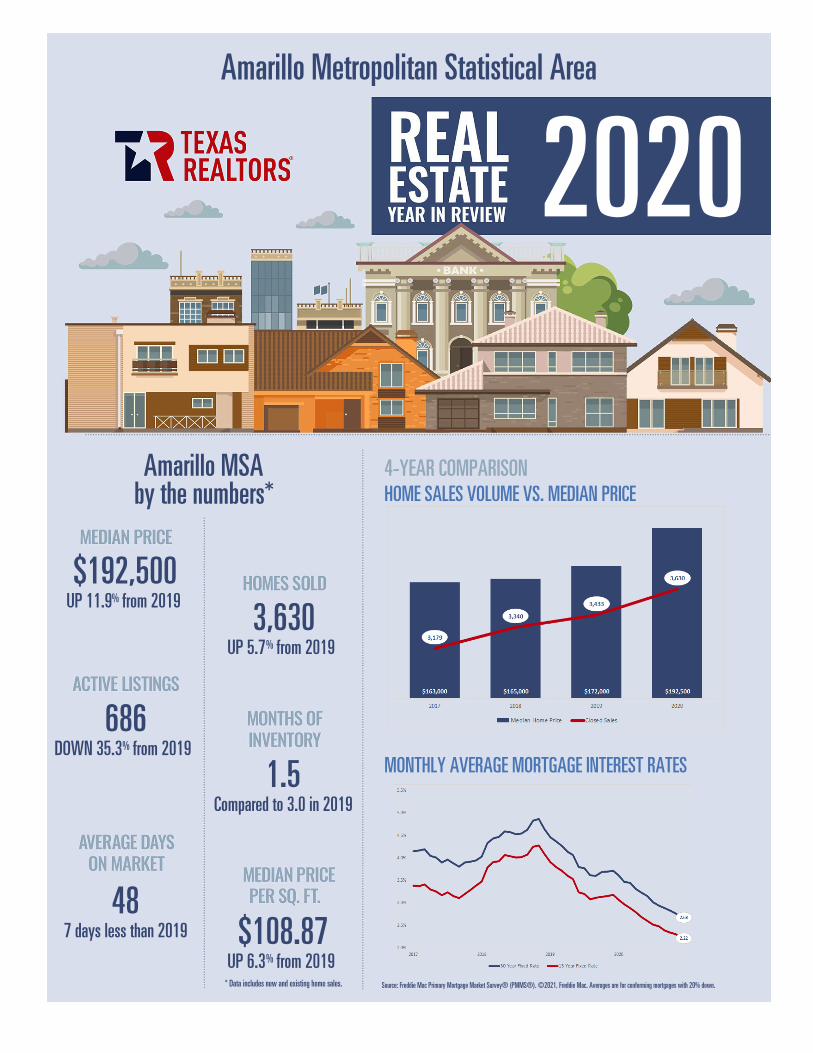
Amarillo Metropolitan Statistical Area
Amarillo MSAby the numbers*
$192,500UP 11.9% from 2019
686DOWN 35.3% from 2019
487 days less than 2019
3,630UP 5.7% from 2019
1.5Compared to 3.0 in 2019
$108.87UP 6.3% from 2019
* Data includes new and existing home sales.
4-YEAR COMPARISONHOME SALES VOLUME VS. MEDIAN PRICE
MONTHLY AVERAGE MORTGAGE INTEREST RATES
Source: Freddie Mac Primary Mortgage Market Survey® (PMMS®). ©2021, Freddie Mac. Averages are for conforming mortgages with 20% down.
2020

PERCENT OF HOMES SOLD IN 2020 BY PRICE CLASS
$53,510 AMARILLO
Amarillo MSA $0 - $99,999 10.8%
$100,000 - $199,999 42.6%$200,000 - $299,999 26.8%$300,000 - $399,999 11.8%$400,000 - $499,999 4.4%$500,000 - $749,999 2.6%$750,000 - $999,999 0.6%
$1,000,000+ 0.4%
The median price per square foot in Amarillohas increased 17.0% since 2016.
Randall County $0 - $99,999 4.6%
$100,000 - $199,999 43.3%$200,000 - $299,999 31.2%$300,000 - $399,999 12.0%$400,000 - $499,999 4.7%$500,000 - $749,999 3.2%$750,000 - $999,999 0.7%
$1,000,000+ 0.4%
Potter County $0 - $99,999 24.5%
$100,000 - $199,999 39.9%$200,000 - $299,999 17.4%$300,000 - $399,999 11.9%$400,000 - $499,999 3.9%$500,000 - $749,999 1.5%$750,000 - $999,999 0.5%
$1,000,000+ 0.4%
The availability of homes priced under $200,000 hasdecreased 15.0% since 2016.
Texas $0 - $99,999 4.6%
$100,000 - $199,999 22.9%$200,000 - $299,999 34.5%$300,000 - $399,999 18.3%$400,000 - $499,999 8.7%$500,000 - $749,999 7.3%$750,000 - $999,999 2.0%
$1,000,000+ 1.8%
Unless otherwise specified, data for this report is provided by the Data Relevance Project, a partnership among Texas REALTORS® and local REALTOR® associations throughout the state. Data analysis is provided by the Texas Real Estate Research Center.

NEW HOME CONSTRUCTION & APARTMENTS
Amarillo
889NEW HOMES SOLD IN 2020
560NEW BUILDING PERMITS ISSUED
IN 2020
* Includes single family and 2-4 units.
APARTMENT RENT & VACANCY RATES
Data can be affected by timeliness of reporting by governmental entities. Apartment and vacancy data provided by Moody's Analytics ©2021 Moody's Analytics, Inc. Under construction and deed transfer data provided by Zonda ©2021 Zonda.

Austin-Round Rock Metropolitan Statistical Area
Austin-Round Rock MSAby the numbers*
$344,000UP 9.2% from 2019
4,554DOWN 34.2% from 2019
4511 days less than 2019
40,308UP 8.8% from 2019
0.6Compared to 1.7 in 2019
$170.42UP 7.5% from 2019
* Data includes new and existing home sales.
4-YEAR COMPARISONHOME SALES VOLUME VS. MEDIAN PRICE
MONTHLY AVERAGE MORTGAGE INTEREST RATES
Source: Freddie Mac Primary Mortgage Market Survey® (PMMS®). ©2021, Freddie Mac. Averages are for conforming mortgages with 20% down.
2020

PERCENT OF HOMES SOLD IN 2020 BY PRICE CLASS
$80,954 AUSTIN-ROUND ROCK
Austin-Round Rock MSA $0 - $99,999 0.2%
$100,000 - $199,999 4.6%$200,000 - $299,999 33.0%$300,000 - $399,999 24.9%$400,000 - $499,999 14.1%$500,000 - $749,999 14.7%$750,000 - $999,999 4.3%
$1,000,000+ 4.3%
The median price per square foot inAustin-Round Rock has increased 21.6%since 2016.
Travis County $0 - $99,999 0.1%
$100,000 - $199,999 3.4%$200,000 - $299,999 21.8%$300,000 - $399,999 23.6%$400,000 - $499,999 16.3%$500,000 - $749,999 19.9%$750,000 - $999,999 7.0%
$1,000,000+ 7.9%
Williamson County $0 - $99,999 0.2%
$100,000 - $199,999 4.5%$200,000 - $299,999 42.6%$300,000 - $399,999 29.6%$400,000 - $499,999 13.0%$500,000 - $749,999 8.7%$750,000 - $999,999 1.1%
$1,000,000+ 0.3%
The availability of homes priced under $200,000 hasdecreased 15.5% since 2016.
Hays County $0 - $99,999 0.2%
$100,000 - $199,999 4.5%$200,000 - $299,999 47.0%$300,000 - $399,999 19.3%$400,000 - $499,999 10.1%$500,000 - $749,999 13.4%$750,000 - $999,999 3.5%
$1,000,000+ 2.0%
Bastrop County $0 - $99,999 1.0%
$100,000 - $199,999 16.0%$200,000 - $299,999 48.4%$300,000 - $399,999 20.6%$400,000 - $499,999 7.8%$500,000 - $749,999 5.5%$750,000 - $999,999 0.5%
$1,000,000+ 0.2%
Unless otherwise specified, data for this report is provided by the Data Relevance Project, a partnership among Texas REALTORS® and local REALTOR® associations throughout the state. Data analysis is provided by the Texas Real Estate Research Center.

NEW HOME CONSTRUCTION & APARTMENTS
Austin-Round Rock
21,127NEW HOMES SOLD IN 2020
22,076NEW BUILDING PERMITS ISSUED
IN 2020
* Includes single family and 2-4 units.
APARTMENT RENT & VACANCY RATES
Data can be affected by timeliness of reporting by governmental entities. Apartment and vacancy data provided by Moody's Analytics ©2021 Moody's Analytics, Inc. Under construction and deed transfer data provided by Zonda ©2021 Zonda.

Beaumont-Port Arthur Metropolitan Statistical Area
Beaumont-Port Arthur MSAby the numbers*
$175,000UP 6.1% from 2019
1,250DOWN 6.5% from 2019
833 days more than 2019
3,987UP 2.1% from 2019
3.3Compared to 4.0 in 2019
$100.63UP 4.1% from 2019
* Data includes new and existing home sales.
4-YEAR COMPARISONHOME SALES VOLUME VS. MEDIAN PRICE
MONTHLY AVERAGE MORTGAGE INTEREST RATES
Source: Freddie Mac Primary Mortgage Market Survey® (PMMS®). ©2021, Freddie Mac. Averages are for conforming mortgages with 20% down.
2020

PERCENT OF HOMES SOLD IN 2020 BY PRICE CLASS
$58,818 BEAUMONT-PORT ARTHUR
Beaumont-Port Arthur MSA $0 - $99,999 19.3%
$100,000 - $199,999 40.0%$200,000 - $299,999 26.0%$300,000 - $399,999 10.2%$400,000 - $499,999 3.4%$500,000 - $749,999 1.0%$750,000 - $999,999 0.1%
$1,000,000+ 0.0%
The median price per square foot inBeaumont-Port Arthur has increased 21.5%since 2016.
Jefferson County $0 - $99,999 19.9%
$100,000 - $199,999 40.1%$200,000 - $299,999 26.2%$300,000 - $399,999 9.6%$400,000 - $499,999 3.1%$500,000 - $749,999 1.1%$750,000 - $999,999 0.0%
$1,000,000+ 0.0%
Orange County $0 - $99,999 23.0%
$100,000 - $199,999 42.4%$200,000 - $299,999 24.8%$300,000 - $399,999 7.6%$400,000 - $499,999 1.8%$500,000 - $749,999 0.3%$750,000 - $999,999 0.1%
$1,000,000+ 0.0%
The availability of homes priced under $200,000 hasdecreased 12.3% since 2016.
Hardin County $0 - $99,999 11.4%
$100,000 - $199,999 37.5%$200,000 - $299,999 27.1%$300,000 - $399,999 15.9%$400,000 - $499,999 6.4%$500,000 - $749,999 1.5%$750,000 - $999,999 0.3%
$1,000,000+ 0.0%
Texas $0 - $99,999 4.6%
$100,000 - $199,999 22.9%$200,000 - $299,999 34.5%$300,000 - $399,999 18.3%$400,000 - $499,999 8.7%$500,000 - $749,999 7.3%$750,000 - $999,999 2.0%
$1,000,000+ 1.8%
Unless otherwise specified, data for this report is provided by the Data Relevance Project, a partnership among Texas REALTORS® and local REALTOR® associations throughout the state. Data analysis is provided by the Texas Real Estate Research Center.

NEW HOME CONSTRUCTION & APARTMENTS
Beaumont-Port Arthur
326NEW HOMES SOLD IN 2020
1,131NEW BUILDING PERMITS ISSUED
IN 2020
* Includes single family and 2-4 units.
APARTMENT RENT & VACANCY RATES
Data can be affected by timeliness of reporting by governmental entities. Apartment and vacancy data provided by Moody's Analytics ©2021 Moody's Analytics, Inc. Under construction and deed transfer data provided by Zonda ©2021 Zonda.

Brownsville-Harlingen Metropolitan Statistical Area
Brownsville-Harlingen MSAby the numbers*
$173,000UP 15.3% from 2019
987DOWN 26.8% from 2019
1026 days less than 2019
2,978UP 21.9% from 2019
2.8Compared to 6.1 in 2019
$105.33UP 12.3% from 2019 * Data includes new and existing home sales.
4-YEAR COMPARISONHOME SALES VOLUME VS. MEDIAN PRICE
MONTHLY AVERAGE MORTGAGE INTEREST RATES
Source: Freddie Mac Primary Mortgage Market Survey® (PMMS®). ©2021, Freddie Mac. Averages are for conforming mortgages with 20% down.
2020

PERCENT OF HOMES SOLD IN 2020 BY PRICE CLASS
$41,123 BROWNSVILLE-HARLINGEN
Brownsville-Harlingen MSA $0 - $99,999 12.8%
$100,000 - $199,999 49.1%$200,000 - $299,999 23.6%$300,000 - $399,999 7.6%$400,000 - $499,999 3.1%$500,000 - $749,999 2.6%$750,000 - $999,999 0.6%
$1,000,000+ 0.6%
The median price per square foot inBrownsville-Harlingen has increased 32.1%since 2016.
Hidalgo County $0 - $99,999 11.0%
$100,000 - $199,999 55.4%$200,000 - $299,999 24.8%$300,000 - $399,999 5.6%$400,000 - $499,999 1.7%$500,000 - $749,999 1.1%$750,000 - $999,999 0.3%
$1,000,000+ 0.2%
Cameron County $0 - $99,999 12.8%
$100,000 - $199,999 49.1%$200,000 - $299,999 23.6%$300,000 - $399,999 7.6%$400,000 - $499,999 3.1%$500,000 - $749,999 2.6%$750,000 - $999,999 0.6%
$1,000,000+ 0.6%
The availability of homes priced under $200,000 hasdecreased 15.3% since 2016.
Willacy County $0 - $99,999 26.8%
$100,000 - $199,999 28.6%$200,000 - $299,999 33.9%$300,000 - $399,999 5.4%$400,000 - $499,999 5.4%$500,000 - $749,999 0.0%$750,000 - $999,999 0.0%
$1,000,000+ 0.0%
Texas $0 - $99,999 4.6%
$100,000 - $199,999 22.9%$200,000 - $299,999 34.5%$300,000 - $399,999 18.3%$400,000 - $499,999 8.7%$500,000 - $749,999 7.3%$750,000 - $999,999 2.0%
$1,000,000+ 1.8%
Unless otherwise specified, data for this report is provided by the Data Relevance Project, a partnership among Texas REALTORS® and local REALTOR® associations throughout the state. Data analysis is provided by the Texas Real Estate Research Center.

NEW HOME CONSTRUCTION & APARTMENTS
Brownsville-Harlingen
334NEW HOMES SOLD IN 2020
1,193NEW BUILDING PERMITS ISSUED
IN 2020
* Includes single family and 2-4 units.
APARTMENT RENT & VACANCY RATES
Data can be affected by timeliness of reporting by governmental entities. Apartment and vacancy data provided by Moody's Analytics ©2021 Moody's Analytics, Inc. Under construction and deed transfer data provided by Zonda ©2021 Zonda.

College Station-Bryan Metropolitan Statistical Area
College Station-Bryan MSAby the numbers*
$233,989UP 5.2% from 2019
1,297DOWN 7.1% from 2019
755 days more than 2019
4,115UP 21.2% from 2019
2.8Compared to 4.3 in 2019
$135.02UP 3.5% from 2019
* Data includes new and existing home sales.
4-YEAR COMPARISONHOME SALES VOLUME VS. MEDIAN PRICE
MONTHLY AVERAGE MORTGAGE INTEREST RATES
Source: Freddie Mac Primary Mortgage Market Survey® (PMMS®). ©2021, Freddie Mac. Averages are for conforming mortgages with 20% down.
2020

PERCENT OF HOMES SOLD IN 2020 BY PRICE CLASS
$55,670 COLLEGE STATION-BRYAN
College Station-Bryan MSA $0 - $99,999 4.5%
$100,000 - $199,999 29.4%$200,000 - $299,999 37.1%$300,000 - $399,999 15.9%$400,000 - $499,999 5.8%$500,000 - $749,999 5.6%$750,000 - $999,999 1.3%
$1,000,000+ 0.6%
The median price per square foot in CollegeStation-Bryan has increased 11.1% since2016.
Brazos County $0 - $99,999 2.7%
$100,000 - $199,999 28.1%$200,000 - $299,999 39.5%$300,000 - $399,999 16.1%$400,000 - $499,999 5.8%$500,000 - $749,999 5.9%$750,000 - $999,999 1.4%
$1,000,000+ 0.6%
Burleson County $0 - $99,999 20.1%
$100,000 - $199,999 43.8%$200,000 - $299,999 20.1%$300,000 - $399,999 9.6%$400,000 - $499,999 3.2%$500,000 - $749,999 2.4%$750,000 - $999,999 0.8%
$1,000,000+ 0.0%
The availability of homes priced under $200,000 hasdecreased 13.8% since 2016.
Robertson County $0 - $99,999 19.4%
$100,000 - $199,999 36.0%$200,000 - $299,999 10.9%$300,000 - $399,999 18.9%$400,000 - $499,999 8.6%$500,000 - $749,999 4.0%$750,000 - $999,999 1.1%
$1,000,000+ 1.1%
Leon County $0 - $99,999 22.2%
$100,000 - $199,999 35.6%$200,000 - $299,999 26.9%$300,000 - $399,999 8.1%$400,000 - $499,999 4.7%$500,000 - $749,999 2.7%$750,000 - $999,999 0.0%
$1,000,000+ 0.0%
Unless otherwise specified, data for this report is provided by the Data Relevance Project, a partnership among Texas REALTORS® and local REALTOR® associations throughout the state. Data analysis is provided by the Texas Real Estate Research Center.

NEW HOME CONSTRUCTION & APARTMENTS
College Station-Bryan
942NEW HOMES SOLD IN 2020
1,430NEW BUILDING PERMITS ISSUED
IN 2020
* Includes single family and 2-4 units.
APARTMENT RENT & VACANCY RATES
Data can be affected by timeliness of reporting by governmental entities. Apartment and vacancy data provided by Moody's Analytics ©2021 Moody's Analytics, Inc. Under construction and deed transfer data provided by Zonda ©2021 Zonda.

Corpus Christi Metropolitan Statistical Area
Corpus Christi MSAby the numbers*
$225,000UP 12.5% from 2019
1,827DOWN 25.5% from 2019
764 days less than 2019
6,980UP 20.2% from 2019
2.3Compared to 4.5 in 2019
$133.09UP 9.3% from 2019
* Data includes new and existing home sales.
4-YEAR COMPARISONHOME SALES VOLUME VS. MEDIAN PRICE
MONTHLY AVERAGE MORTGAGE INTEREST RATES
Source: Freddie Mac Primary Mortgage Market Survey® (PMMS®). ©2021, Freddie Mac. Averages are for conforming mortgages with 20% down.
2020

PERCENT OF HOMES SOLD IN 2020 BY PRICE CLASS
$56,991 CORPUS CHRISTI
Corpus Christi MSA $0 - $99,999 8.3%
$100,000 - $199,999 30.8%$200,000 - $299,999 32.2%$300,000 - $399,999 13.6%$400,000 - $499,999 6.1%$500,000 - $749,999 6.5%$750,000 - $999,999 1.6%
$1,000,000+ 0.9%
The median price per square foot in CorpusChristi has increased 18.3% since 2016.
Nueces County $0 - $99,999 8.3%
$100,000 - $199,999 30.5%$200,000 - $299,999 32.5%$300,000 - $399,999 13.4%$400,000 - $499,999 6.7%$500,000 - $749,999 6.2%$750,000 - $999,999 1.6%
$1,000,000+ 0.9%
San Patricio County $0 - $99,999 8.9%
$100,000 - $199,999 38.5%$200,000 - $299,999 32.9%$300,000 - $399,999 11.2%$400,000 - $499,999 3.8%$500,000 - $749,999 4.2%$750,000 - $999,999 0.3%
$1,000,000+ 0.3%
The availability of homes priced under $200,000 hasdecreased 17.4% since 2016.
Aransas County $0 - $99,999 7.8%
$100,000 - $199,999 24.5%$200,000 - $299,999 29.3%$300,000 - $399,999 17.0%$400,000 - $499,999 5.2%$500,000 - $749,999 11.1%$750,000 - $999,999 3.2%
$1,000,000+ 1.9%
Texas $0 - $99,999 4.6%
$100,000 - $199,999 22.9%$200,000 - $299,999 34.5%$300,000 - $399,999 18.3%$400,000 - $499,999 8.7%$500,000 - $749,999 7.3%$750,000 - $999,999 2.0%
$1,000,000+ 1.8%
Unless otherwise specified, data for this report is provided by the Data Relevance Project, a partnership among Texas REALTORS® and local REALTOR® associations throughout the state. Data analysis is provided by the Texas Real Estate Research Center.

NEW HOME CONSTRUCTION & APARTMENTS
Corpus Christi
1,062NEW HOMES SOLD IN 2020
1,412NEW BUILDING PERMITS ISSUED
IN 2020
* Includes single family and 2-4 units.
APARTMENT RENT & VACANCY RATES
Data can be affected by timeliness of reporting by governmental entities. Apartment and vacancy data provided by Moody's Analytics ©2021 Moody's Analytics, Inc. Under construction and deed transfer data provided by Zonda ©2021 Zonda.

Dallas-Fort Worth-Arlington Metropolitan Statistical Area
Dallas-Fort Worth-Arlington MSAby the numbers*
$291,000UP 6.4% from 2019
18,696DOWN 25.1% from 2019
455 days less than 2019
112,545UP 8.7% from 2019
1.1Compared to 2.3 in 2019
$138.99UP 5.8% from 2019
* Data includes new and existing home sales.
4-YEAR COMPARISONHOME SALES VOLUME VS. MEDIAN PRICE
MONTHLY AVERAGE MORTGAGE INTEREST RATES
Source: Freddie Mac Primary Mortgage Market Survey® (PMMS®). ©2021, Freddie Mac. Averages are for conforming mortgages with 20% down.
2020

PERCENT OF HOMES SOLD IN 2020 BY PRICE CLASS
$72,265 DALLAS-FORT WORTH-ARLINGTON
Dallas-Fort Worth-Arlington MSA $0 - $99,999 1.4%
$100,000 - $199,999 14.3%$200,000 - $299,999 36.8%$300,000 - $399,999 23.1%$400,000 - $499,999 11.2%$500,000 - $749,999 8.8%$750,000 - $999,999 2.3%
$1,000,000+ 2.1%
The median price per square foot inDallas-Fort Worth-Arlington has increased26.2% since 2016.
Tarrant County $0 - $99,999 1.2%
$100,000 - $199,999 18.5%$200,000 - $299,999 46.2%$300,000 - $399,999 18.2%$400,000 - $499,999 7.0%$500,000 - $749,999 5.5%$750,000 - $999,999 2.0%
$1,000,000+ 1.4%
Dallas County $0 - $99,999 2.4%
$100,000 - $199,999 22.8%$200,000 - $299,999 31.4%$300,000 - $399,999 16.2%$400,000 - $499,999 9.6%$500,000 - $749,999 9.5%$750,000 - $999,999 3.2%
$1,000,000+ 4.9%
The availability of homes priced under $200,000 hasdecreased 23.5% since 2016.
Collin County $0 - $99,999 0.2%
$100,000 - $199,999 2.6%$200,000 - $299,999 26.8%$300,000 - $399,999 33.5%$400,000 - $499,999 18.7%$500,000 - $749,999 13.9%$750,000 - $999,999 2.8%
$1,000,000+ 1.6%
Denton County $0 - $99,999 0.1%
$100,000 - $199,999 3.0%$200,000 - $299,999 36.1%$300,000 - $399,999 29.4%$400,000 - $499,999 15.3%$500,000 - $749,999 12.1%$750,000 - $999,999 2.8%
$1,000,000+ 1.3%
Unless otherwise specified, data for this report is provided by the Data Relevance Project, a partnership among Texas REALTORS® and local REALTOR® associations throughout the state. Data analysis is provided by the Texas Real Estate Research Center.

NEW HOME CONSTRUCTION & APARTMENTS
Dallas-Fort Worth-Arlington
40,382NEW HOMES SOLD IN 2020
44,929NEW BUILDING PERMITS ISSUED
IN 2020
* Includes single family and 2-4 units.
APARTMENT RENT & VACANCY RATES
Data can be affected by timeliness of reporting by governmental entities. Apartment and vacancy data provided by Moody's Analytics ©2021 Moody's Analytics, Inc. Under construction and deed transfer data provided by Zonda ©2021 Zonda.
Dallas Fort Worth

El Paso Metropolitan Statistical Area
El Paso MSAby the numbers*
$177,950UP 9.2% from 2019
1,654DOWN 34% from 2019
6311 days less than 2019
9,819UP 12.3% from 2019
1.5Compared to 3.1 in 2019
$104.21UP 8.9% from 2019
* Data includes new and existing home sales.
4-YEAR COMPARISONHOME SALES VOLUME VS. MEDIAN PRICE
MONTHLY AVERAGE MORTGAGE INTEREST RATES
Source: Freddie Mac Primary Mortgage Market Survey® (PMMS®). ©2021, Freddie Mac. Averages are for conforming mortgages with 20% down.
2020

PERCENT OF HOMES SOLD IN 2020 BY PRICE CLASS
$48,823 EL PASO
El Paso MSA $0 - $99,999 5.8%
$100,000 - $199,999 58.3%$200,000 - $299,999 26.1%$300,000 - $399,999 6.1%$400,000 - $499,999 2.0%$500,000 - $749,999 1.4%$750,000 - $999,999 0.3%
$1,000,000+ 0.1%
The median price per square foot in El Pasohas increased 21.2% since 2016.
El Paso County $0 - $99,999 5.8%
$100,000 - $199,999 58.6%$200,000 - $299,999 25.8%$300,000 - $399,999 6.1%$400,000 - $499,999 1.9%$500,000 - $749,999 1.4%$750,000 - $999,999 0.3%
$1,000,000+ 0.1%
Texas $0 - $99,999 4.6%
$100,000 - $199,999 22.9%$200,000 - $299,999 34.5%$300,000 - $399,999 18.3%$400,000 - $499,999 8.7%$500,000 - $749,999 7.3%$750,000 - $999,999 2.0%
$1,000,000+ 1.8%
The availability of homes priced under $200,000 hasdecreased 14.9% since 2016.
Unless otherwise specified, data for this report is provided by the Data Relevance Project, a partnership among Texas REALTORS® and local REALTOR® associations throughout the state. Data analysis is provided by the Texas Real Estate Research Center.

NEW HOME CONSTRUCTION & APARTMENTS
El Paso
3,235NEW HOMES SOLD IN 2020
3,018NEW BUILDING PERMITS ISSUED
IN 2020
* Includes single family and 2-4 units.
APARTMENT RENT & VACANCY RATES
Data can be affected by timeliness of reporting by governmental entities. Apartment and vacancy data provided by Moody's Analytics ©2021 Moody's Analytics, Inc. Under construction and deed transfer data provided by Zonda ©2021 Zonda.

Houston-The Woodlands-Sugar Land Metropolitan Statistical Area
Houston-The Woodlands-Sugar Land MSAby the numbers
$260,000UP 6.1% from 2019
22,036DOWN 20.6% from 2019
543 days less than 2019
© 2021 Houston Realtors Information Service, Inc. - Certaininformation contained herein is derived from information which isthe licensed property of, and copyrighted by, Houston Realtors
Information Service, Inc.
99,321UP 9.3% from 2019
2.0Compared to 3.2 in 2019
$119.36UP 5.6% from 2019
* Data includes new and existing home sales.
4-YEAR COMPARISONHOME SALES VOLUME VS. MEDIAN PRICE
MONTHLY AVERAGE MORTGAGE INTEREST RATES
Source: Freddie Mac Primary Mortgage Market Survey® (PMMS®). ©2021, Freddie Mac. Averages are for conforming mortgages with 20% down.
2020

PERCENT OF HOMES SOLD IN 2020 BY PRICE CLASS
$69,193 HOUSTON-THE WOODLANDS-SUGARLAND
Houston-The Woodlands-Sugar Land MSA $0 - $99,999 2.6%
$100,000 - $199,999 22.0%$200,000 - $299,999 37.3%$300,000 - $399,999 18.7%$400,000 - $499,999 8.4%$500,000 - $749,999 7.0%$750,000 - $999,999 1.9%
$1,000,000+ 2.1%
The median price per square foot inHouston-The Woodlands-Sugar Land hasincreased 18.2% since 2016.
Harris County $0 - $99,999 3.1%
$100,000 - $199,999 26.8%$200,000 - $299,999 35.6%$300,000 - $399,999 15.9%$400,000 - $499,999 7.2%$500,000 - $749,999 6.5%$750,000 - $999,999 2.1%
$1,000,000+ 2.9%
Fort Bend County $0 - $99,999 0.4%
$100,000 - $199,999 9.9%$200,000 - $299,999 42.0%$300,000 - $399,999 25.8%$400,000 - $499,999 10.8%$500,000 - $749,999 9.0%$750,000 - $999,999 1.6%
$1,000,000+ 0.7%
The availability of homes priced under $200,000 hasdecreased 18.3% since 2016.
Montgomery County $0 - $99,999 1.8%
$100,000 - $199,999 16.9%$200,000 - $299,999 37.6%$300,000 - $399,999 19.5%$400,000 - $499,999 10.9%$500,000 - $749,999 9.1%$750,000 - $999,999 2.5%
$1,000,000+ 1.8%
Galveston County $0 - $99,999 3.8%
$100,000 - $199,999 20.7%$200,000 - $299,999 34.7%$300,000 - $399,999 21.0%$400,000 - $499,999 8.6%$500,000 - $749,999 7.7%$750,000 - $999,999 2.1%
$1,000,000+ 1.3%
Unless otherwise specified, data for this report is provided by the Data Relevance Project, a partnership among Texas REALTORS® and local REALTOR® associations throughout the state. Data analysis is provided by the Texas Real Estate Research Center.

NEW HOME CONSTRUCTION & APARTMENTS
Houston-The Woodlands-Sugar Land
33,366NEW HOMES SOLD IN 2020
48,557NEW BUILDING PERMITS ISSUED
IN 2020
* Includes single family and 2-4 units.
APARTMENT RENT & VACANCY RATES
Data can be affected by timeliness of reporting by governmental entities. Apartment and vacancy data provided by Moody's Analytics ©2021 Moody's Analytics, Inc. Under construction and deed transfer data provided by Zonda ©2021 Zonda.

Killeen-Temple Metropolitan Statistical Area
Killeen-Temple MSAby the numbers*
$190,000UP 13.1% from 2019
846DOWN 36.1% from 2019
518 days less than 2019
7,855UP 8.2% from 2019
0.7Compared to 2.1 in 2019
$102.67UP 11.1% from 2019 * Data includes new and existing home sales.
4-YEAR COMPARISONHOME SALES VOLUME VS. MEDIAN PRICE
MONTHLY AVERAGE MORTGAGE INTEREST RATES
Source: Freddie Mac Primary Mortgage Market Survey® (PMMS®). ©2021, Freddie Mac. Averages are for conforming mortgages with 20% down.
2020
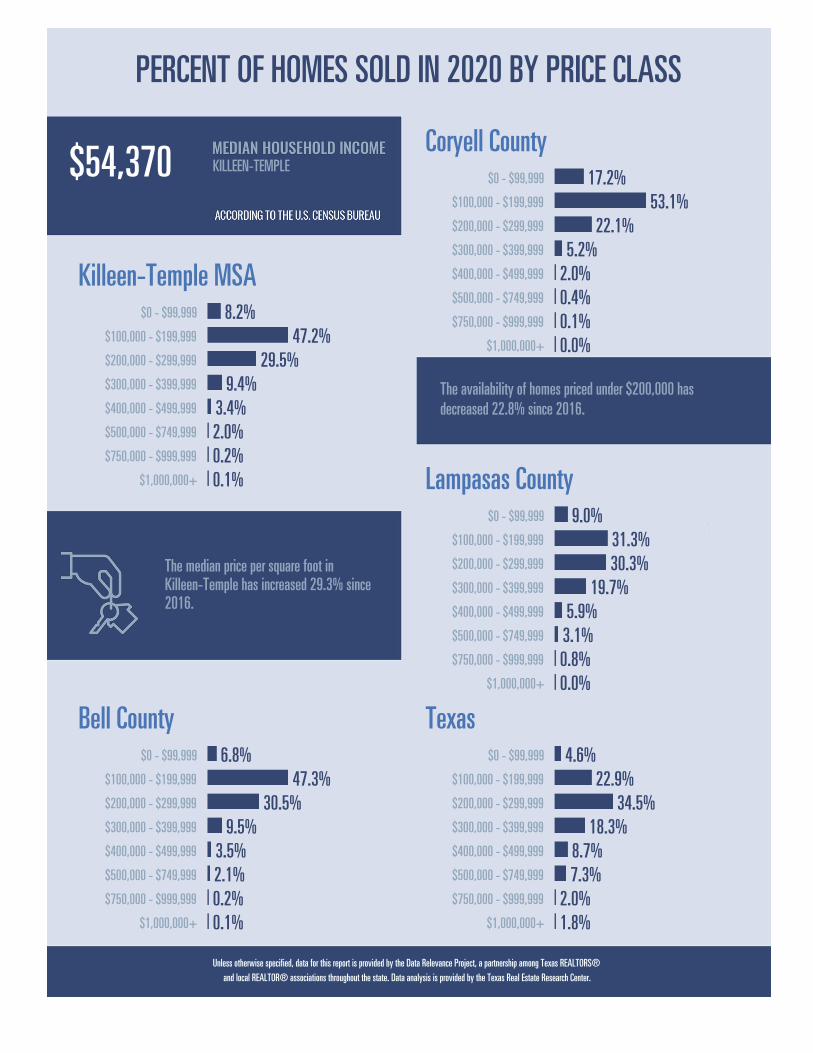
PERCENT OF HOMES SOLD IN 2020 BY PRICE CLASS
$54,370 KILLEEN-TEMPLE
Killeen-Temple MSA $0 - $99,999 8.2%
$100,000 - $199,999 47.2%$200,000 - $299,999 29.5%$300,000 - $399,999 9.4%$400,000 - $499,999 3.4%$500,000 - $749,999 2.0%$750,000 - $999,999 0.2%
$1,000,000+ 0.1%
The median price per square foot inKilleen-Temple has increased 29.3% since2016.
Bell County $0 - $99,999 6.8%
$100,000 - $199,999 47.3%$200,000 - $299,999 30.5%$300,000 - $399,999 9.5%$400,000 - $499,999 3.5%$500,000 - $749,999 2.1%$750,000 - $999,999 0.2%
$1,000,000+ 0.1%
Coryell County $0 - $99,999 17.2%
$100,000 - $199,999 53.1%$200,000 - $299,999 22.1%$300,000 - $399,999 5.2%$400,000 - $499,999 2.0%$500,000 - $749,999 0.4%$750,000 - $999,999 0.1%
$1,000,000+ 0.0%
The availability of homes priced under $200,000 hasdecreased 22.8% since 2016.
Lampasas County $0 - $99,999 9.0%
$100,000 - $199,999 31.3%$200,000 - $299,999 30.3%$300,000 - $399,999 19.7%$400,000 - $499,999 5.9%$500,000 - $749,999 3.1%$750,000 - $999,999 0.8%
$1,000,000+ 0.0%
Texas $0 - $99,999 4.6%
$100,000 - $199,999 22.9%$200,000 - $299,999 34.5%$300,000 - $399,999 18.3%$400,000 - $499,999 8.7%$500,000 - $749,999 7.3%$750,000 - $999,999 2.0%
$1,000,000+ 1.8%
Unless otherwise specified, data for this report is provided by the Data Relevance Project, a partnership among Texas REALTORS® and local REALTOR® associations throughout the state. Data analysis is provided by the Texas Real Estate Research Center.

NEW HOME CONSTRUCTION & APARTMENTS
Killeen-Temple
2,484NEW HOMES SOLD IN 2020
3,485NEW BUILDING PERMITS ISSUED
IN 2020
* Includes single family and 2-4 units.
APARTMENT RENT & VACANCY RATES
Data can be affected by timeliness of reporting by governmental entities. Apartment and vacancy data provided by Moody's Analytics ©2021 Moody's Analytics, Inc. Under construction and deed transfer data provided by Zonda ©2021 Zonda.

Laredo Metropolitan Statistical Area
Laredo MSAby the numbers*
$186,000UP 6.3% from 2019
372DOWN 22.3% from 2019
524 days less than 2019
1,472UP 6.7% from 2019
2.0Compared to 4.5 in 2019
$112.93UP 5.5% from 2019
* Data includes new and existing home sales.
4-YEAR COMPARISONHOME SALES VOLUME VS. MEDIAN PRICE
MONTHLY AVERAGE MORTGAGE INTEREST RATES
Source: Freddie Mac Primary Mortgage Market Survey® (PMMS®). ©2021, Freddie Mac. Averages are for conforming mortgages with 20% down.
2020

PERCENT OF HOMES SOLD IN 2020 BY PRICE CLASS
$56,084 LAREDO
Laredo MSA $0 - $99,999 7.0%
$100,000 - $199,999 50.7%$200,000 - $299,999 31.1%$300,000 - $399,999 8.1%$400,000 - $499,999 2.1%$500,000 - $749,999 0.9%$750,000 - $999,999 0.1%
$1,000,000+ 0.1%
The median price per square foot in Laredohas increased 14.1% since 2016.
Webb County $0 - $99,999 7.0%
$100,000 - $199,999 50.7%$200,000 - $299,999 31.1%$300,000 - $399,999 8.1%$400,000 - $499,999 2.1%$500,000 - $749,999 0.9%$750,000 - $999,999 0.1%
$1,000,000+ 0.1%
Maverick County $0 - $99,999 15.9%
$100,000 - $199,999 63.7%$200,000 - $299,999 16.5%$300,000 - $399,999 3.3%$400,000 - $499,999 0.3%$500,000 - $749,999 0.3%$750,000 - $999,999 0.0%
$1,000,000+ 0.0%
The availability of homes priced under $200,000 hasdecreased 11.2% since 2016.
Duval County $0 - $99,999 65.0%
$100,000 - $199,999 20.0%$200,000 - $299,999 15.0%$300,000 - $399,999 0.0%$400,000 - $499,999 0.0%$500,000 - $749,999 0.0%$750,000 - $999,999 0.0%
$1,000,000+ 0.0%
Texas $0 - $99,999 4.6%
$100,000 - $199,999 22.9%$200,000 - $299,999 34.5%$300,000 - $399,999 18.3%$400,000 - $499,999 8.7%$500,000 - $749,999 7.3%$750,000 - $999,999 2.0%
$1,000,000+ 1.8%
Unless otherwise specified, data for this report is provided by the Data Relevance Project, a partnership among Texas REALTORS® and local REALTOR® associations throughout the state. Data analysis is provided by the Texas Real Estate Research Center.

NEW HOME CONSTRUCTION & APARTMENTS
Laredo
913NEW HOMES SOLD IN 2020
1,510NEW BUILDING PERMITS ISSUED
IN 2020
* Includes single family and 2-4 units.
APARTMENT RENT & VACANCY RATES
Data can be affected by timeliness of reporting by governmental entities. Apartment and vacancy data provided by Moody's Analytics ©2021 Moody's Analytics, Inc. Under construction and deed transfer data provided by Zonda ©2021 Zonda.

Longview Metropolitan Statistical Area
Longview MSAby the numbers*
$175,000UP 8.1% from 2019
688DOWN 19.3% from 2019
689 days less than 2019
2,311UP 5.1% from 2019
2.6Compared to 4.0 in 2019
$ 93.97UP 7.5% from 2019
* Data includes new and existing home sales.
4-YEAR COMPARISONHOME SALES VOLUME VS. MEDIAN PRICE
MONTHLY AVERAGE MORTGAGE INTEREST RATES
Source: Freddie Mac Primary Mortgage Market Survey® (PMMS®). ©2021, Freddie Mac. Averages are for conforming mortgages with 20% down.
2020

PERCENT OF HOMES SOLD IN 2020 BY PRICE CLASS
$55,970 LONGVIEW
Longview MSA $0 - $99,999 15.2%
$100,000 - $199,999 47.5%$200,000 - $299,999 22.7%$300,000 - $399,999 8.5%$400,000 - $499,999 3.2%$500,000 - $749,999 2.3%$750,000 - $999,999 0.3%
$1,000,000+ 0.3%
The median price per square foot in Longviewhas increased 19.1% since 2016.
Gregg County $0 - $99,999 12.2%
$100,000 - $199,999 46.6%$200,000 - $299,999 25.7%$300,000 - $399,999 9.0%$400,000 - $499,999 3.3%$500,000 - $749,999 2.7%$750,000 - $999,999 0.3%
$1,000,000+ 0.3%
Rusk County $0 - $99,999 19.9%
$100,000 - $199,999 52.2%$200,000 - $299,999 17.7%$300,000 - $399,999 6.0%$400,000 - $499,999 3.1%$500,000 - $749,999 1.0%$750,000 - $999,999 0.2%
$1,000,000+ 0.0%
The availability of homes priced under $200,000 hasdecreased 12.8% since 2016.
Texas $0 - $99,999 4.6%
$100,000 - $199,999 22.9%$200,000 - $299,999 34.5%$300,000 - $399,999 18.3%$400,000 - $499,999 8.7%$500,000 - $749,999 7.3%$750,000 - $999,999 2.0%
$1,000,000+ 1.8%
Unless otherwise specified, data for this report is provided by the Data Relevance Project, a partnership among Texas REALTORS® and local REALTOR® associations throughout the state. Data analysis is provided by the Texas Real Estate Research Center.

NEW HOME CONSTRUCTION & APARTMENTS
Longview
137NEW HOMES SOLD IN 2020
225NEW BUILDING PERMITS ISSUED
IN 2020
* Includes single family and 2-4 units.
APARTMENT RENT & VACANCY RATES
Data can be affected by timeliness of reporting by governmental entities. Apartment and vacancy data provided by Moody's Analytics ©2021 Moody's Analytics, Inc. Under construction and deed transfer data provided by Zonda ©2021 Zonda.

Lubbock Metropolitan Statistical Area
Lubbock MSAby the numbers*
$191,600UP 9.6% from 2019
687DOWN 20.7% from 2019
366 days less than 2019
4,959UP 6.8% from 2019
1.4Compared to 1.8 in 2019
$103.74UP 8.1% from 2019
* Data includes new and existing home sales.
4-YEAR COMPARISONHOME SALES VOLUME VS. MEDIAN PRICE
MONTHLY AVERAGE MORTGAGE INTEREST RATES
Source: Freddie Mac Primary Mortgage Market Survey® (PMMS®). ©2021, Freddie Mac. Averages are for conforming mortgages with 20% down.
2020

PERCENT OF HOMES SOLD IN 2020 BY PRICE CLASS
$54,598 LUBBOCK
Lubbock MSA $0 - $99,999 9.6%
$100,000 - $199,999 44.2%$200,000 - $299,999 26.4%$300,000 - $399,999 11.4%$400,000 - $499,999 4.6%$500,000 - $749,999 3.0%$750,000 - $999,999 0.6%
$1,000,000+ 0.2%
The median price per square foot in Lubbockhas increased 22.3% since 2016.
Lubbock County $0 - $99,999 9.0%
$100,000 - $199,999 44.7%$200,000 - $299,999 26.7%$300,000 - $399,999 11.4%$400,000 - $499,999 4.5%$500,000 - $749,999 3.0%$750,000 - $999,999 0.6%
$1,000,000+ 0.2%
Hale County $0 - $99,999 38.7%
$100,000 - $199,999 45.6%$200,000 - $299,999 13.1%$300,000 - $399,999 1.8%$400,000 - $499,999 0.0%$500,000 - $749,999 0.7%$750,000 - $999,999 0.0%
$1,000,000+ 0.0%
The availability of homes priced under $200,000 hasdecreased 18.4% since 2016.
Hockley County $0 - $99,999 28.1%
$100,000 - $199,999 49.1%$200,000 - $299,999 17.0%$300,000 - $399,999 4.1%$400,000 - $499,999 1.2%$500,000 - $749,999 0.6%$750,000 - $999,999 0.0%
$1,000,000+ 0.0%
Texas $0 - $99,999 4.6%
$100,000 - $199,999 22.9%$200,000 - $299,999 34.5%$300,000 - $399,999 18.3%$400,000 - $499,999 8.7%$500,000 - $749,999 7.3%$750,000 - $999,999 2.0%
$1,000,000+ 1.8%
Unless otherwise specified, data for this report is provided by the Data Relevance Project, a partnership among Texas REALTORS® and local REALTOR® associations throughout the state. Data analysis is provided by the Texas Real Estate Research Center.
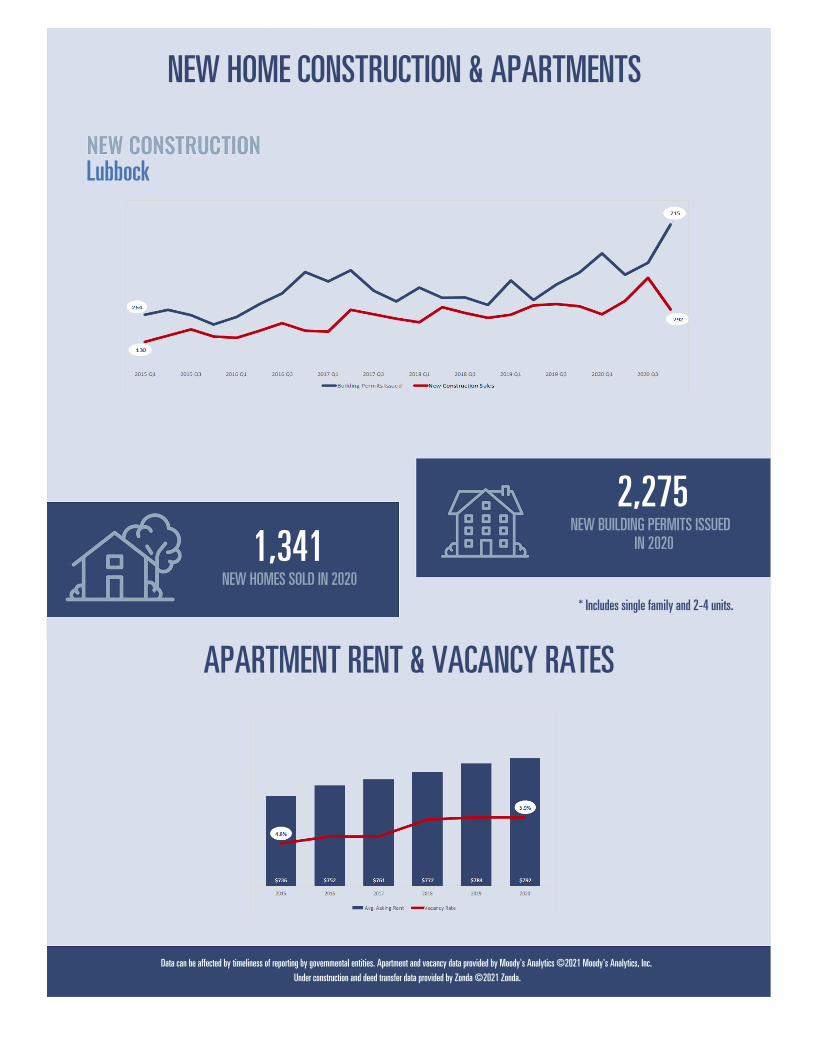
NEW HOME CONSTRUCTION & APARTMENTS
Lubbock
1,341NEW HOMES SOLD IN 2020
2,275NEW BUILDING PERMITS ISSUED
IN 2020
* Includes single family and 2-4 units.
APARTMENT RENT & VACANCY RATES
Data can be affected by timeliness of reporting by governmental entities. Apartment and vacancy data provided by Moody's Analytics ©2021 Moody's Analytics, Inc. Under construction and deed transfer data provided by Zonda ©2021 Zonda.

McAllen-Edinburg-Mission Metropolitan Statistical Area
McAllen-Edinburg-Mission MSAby the numbers*
$170,000UP 9.7% from 2019
1,353DOWN 28.2% from 2019
816 days less than 2019
3,784UP 9.4% from 2019
3.4Compared to 5.9 in 2019
$107.06UP 29.8% from 2019 * Data includes new and existing home sales.
4-YEAR COMPARISONHOME SALES VOLUME VS. MEDIAN PRICE
MONTHLY AVERAGE MORTGAGE INTEREST RATES
Source: Freddie Mac Primary Mortgage Market Survey® (PMMS®). ©2021, Freddie Mac. Averages are for conforming mortgages with 20% down.
2020

PERCENT OF HOMES SOLD IN 2020 BY PRICE CLASS
$41,800 MCALLEN-EDINBURG-MISSION
McAllen-Edinburg-Mission MSA $0 - $99,999 11.0%
$100,000 - $199,999 55.4%$200,000 - $299,999 24.8%$300,000 - $399,999 5.6%$400,000 - $499,999 1.7%$500,000 - $749,999 1.1%$750,000 - $999,999 0.3%
$1,000,000+ 0.2%
The median price per square foot inMcAllen-Edinburg-Mission has increased39.2% since 2016.
Hidalgo County $0 - $99,999 11.0%
$100,000 - $199,999 55.4%$200,000 - $299,999 24.8%$300,000 - $399,999 5.6%$400,000 - $499,999 1.7%$500,000 - $749,999 1.1%$750,000 - $999,999 0.3%
$1,000,000+ 0.2%
Cameron County $0 - $99,999 12.8%
$100,000 - $199,999 49.1%$200,000 - $299,999 23.6%$300,000 - $399,999 7.6%$400,000 - $499,999 3.1%$500,000 - $749,999 2.6%$750,000 - $999,999 0.6%
$1,000,000+ 0.6%
The availability of homes priced under $200,000 hasdecreased 14.2% since 2016.
Willacy County $0 - $99,999 26.8%
$100,000 - $199,999 28.6%$200,000 - $299,999 33.9%$300,000 - $399,999 5.4%$400,000 - $499,999 5.4%$500,000 - $749,999 0.0%$750,000 - $999,999 0.0%
$1,000,000+ 0.0%
Starr County $0 - $99,999 38.6%
$100,000 - $199,999 52.3%$200,000 - $299,999 6.8%$300,000 - $399,999 2.3%$400,000 - $499,999 0.0%$500,000 - $749,999 0.0%$750,000 - $999,999 0.0%
$1,000,000+ 0.0%
Unless otherwise specified, data for this report is provided by the Data Relevance Project, a partnership among Texas REALTORS® and local REALTOR® associations throughout the state. Data analysis is provided by the Texas Real Estate Research Center.

NEW HOME CONSTRUCTION & APARTMENTS
McAllen-Edinburg-Mission
1,286NEW HOMES SOLD IN 2020
4,430NEW BUILDING PERMITS ISSUED
IN 2020
* Includes single family and 2-4 units.
APARTMENT RENT & VACANCY RATES
Data can be affected by timeliness of reporting by governmental entities. Apartment and vacancy data provided by Moody's Analytics ©2021 Moody's Analytics, Inc. Under construction and deed transfer data provided by Zonda ©2021 Zonda.

Midland Metropolitan Statistical Area
Midland MSAby the numbers*
$299,000DOWN 0.3% from 2019
775UP 57.2% from 2019
4815 days more than 2019
2,570DOWN 11.5% from 2019
3.6Compared to 2.3 in 2019
$149.14DOWN 0.5% from 2019
* Data includes new and existing home sales.
4-YEAR COMPARISONHOME SALES VOLUME VS. MEDIAN PRICE
MONTHLY AVERAGE MORTGAGE INTEREST RATES
Source: Freddie Mac Primary Mortgage Market Survey® (PMMS®). ©2021, Freddie Mac. Averages are for conforming mortgages with 20% down.
2020

PERCENT OF HOMES SOLD IN 2020 BY PRICE CLASS
$82,650 MIDLAND
Midland MSA $0 - $99,999 1.9%
$100,000 - $199,999 11.2%$200,000 - $299,999 37.4%$300,000 - $399,999 24.9%$400,000 - $499,999 10.6%$500,000 - $749,999 10.3%$750,000 - $999,999 2.7%
$1,000,000+ 1.1%
The median price per square foot in Midlandhas increased 24.8% since 2016.
Midland County $0 - $99,999 1.9%
$100,000 - $199,999 10.9%$200,000 - $299,999 37.4%$300,000 - $399,999 25.1%$400,000 - $499,999 10.5%$500,000 - $749,999 10.3%$750,000 - $999,999 2.8%
$1,000,000+ 1.2%
Ector County $0 - $99,999 5.3%
$100,000 - $199,999 31.7%$200,000 - $299,999 43.2%$300,000 - $399,999 14.2%$400,000 - $499,999 3.1%$500,000 - $749,999 2.3%$750,000 - $999,999 0.1%
$1,000,000+ 0.0%
The availability of homes priced under $200,000 hasdecreased 21.3% since 2016.
Howard County $0 - $99,999 23.8%
$100,000 - $199,999 40.3%$200,000 - $299,999 21.3%$300,000 - $399,999 9.9%$400,000 - $499,999 3.2%$500,000 - $749,999 1.5%$750,000 - $999,999 0.0%
$1,000,000+ 0.0%
Scurry County $0 - $99,999 34.2%
$100,000 - $199,999 43.0%$200,000 - $299,999 17.5%$300,000 - $399,999 4.0%$400,000 - $499,999 0.7%$500,000 - $749,999 0.7%$750,000 - $999,999 0.0%
$1,000,000+ 0.0%
Unless otherwise specified, data for this report is provided by the Data Relevance Project, a partnership among Texas REALTORS® and local REALTOR® associations throughout the state. Data analysis is provided by the Texas Real Estate Research Center.

NEW HOME CONSTRUCTION & APARTMENTS
Midland
888NEW HOMES SOLD IN 2020
1,289NEW BUILDING PERMITS ISSUED
IN 2020
* Includes single family and 2-4 units.
APARTMENT RENT & VACANCY RATES
Data can be affected by timeliness of reporting by governmental entities. Apartment and vacancy data provided by Moody's Analytics ©2021 Moody's Analytics, Inc. Under construction and deed transfer data provided by Zonda ©2021 Zonda.

Odessa Metropolitan Statistical Area
Odessa MSAby the numbers*
$228,000UP 0.4% from 2019
447UP 73.3% from 2019
4812 days more than 2019
1,437DOWN 14.4% from 2019
4.8Compared to 2.3 in 2019
$129.53UP 1.1% from 2019
* Data includes new and existing home sales.
4-YEAR COMPARISONHOME SALES VOLUME VS. MEDIAN PRICE
MONTHLY AVERAGE MORTGAGE INTEREST RATES
Source: Freddie Mac Primary Mortgage Market Survey® (PMMS®). ©2021, Freddie Mac. Averages are for conforming mortgages with 20% down.
2020

PERCENT OF HOMES SOLD IN 2020 BY PRICE CLASS
$67,205 ODESSA
Odessa MSA $0 - $99,999 5.3%
$100,000 - $199,999 31.7%$200,000 - $299,999 43.2%$300,000 - $399,999 14.2%$400,000 - $499,999 3.1%$500,000 - $749,999 2.3%$750,000 - $999,999 0.1%
$1,000,000+ 0.0%
The median price per square foot in Odessahas increased 32.4% since 2016.
Midland County $0 - $99,999 1.9%
$100,000 - $199,999 10.9%$200,000 - $299,999 37.4%$300,000 - $399,999 25.1%$400,000 - $499,999 10.5%$500,000 - $749,999 10.3%$750,000 - $999,999 2.8%
$1,000,000+ 1.2%
Ector County $0 - $99,999 5.3%
$100,000 - $199,999 31.7%$200,000 - $299,999 43.2%$300,000 - $399,999 14.2%$400,000 - $499,999 3.1%$500,000 - $749,999 2.3%$750,000 - $999,999 0.1%
$1,000,000+ 0.0%
The availability of homes priced under $200,000 hasdecreased 31.4% since 2016.
Andrews County $0 - $99,999 8.3%
$100,000 - $199,999 25.4%$200,000 - $299,999 36.1%$300,000 - $399,999 21.3%$400,000 - $499,999 6.5%$500,000 - $749,999 1.8%$750,000 - $999,999 0.6%
$1,000,000+ 0.0%
Ward County $0 - $99,999 13.0%
$100,000 - $199,999 43.5%$200,000 - $299,999 31.9%$300,000 - $399,999 10.1%$400,000 - $499,999 1.5%$500,000 - $749,999 0.0%$750,000 - $999,999 0.0%
$1,000,000+ 0.0%
Unless otherwise specified, data for this report is provided by the Data Relevance Project, a partnership among Texas REALTORS® and local REALTOR® associations throughout the state. Data analysis is provided by the Texas Real Estate Research Center.
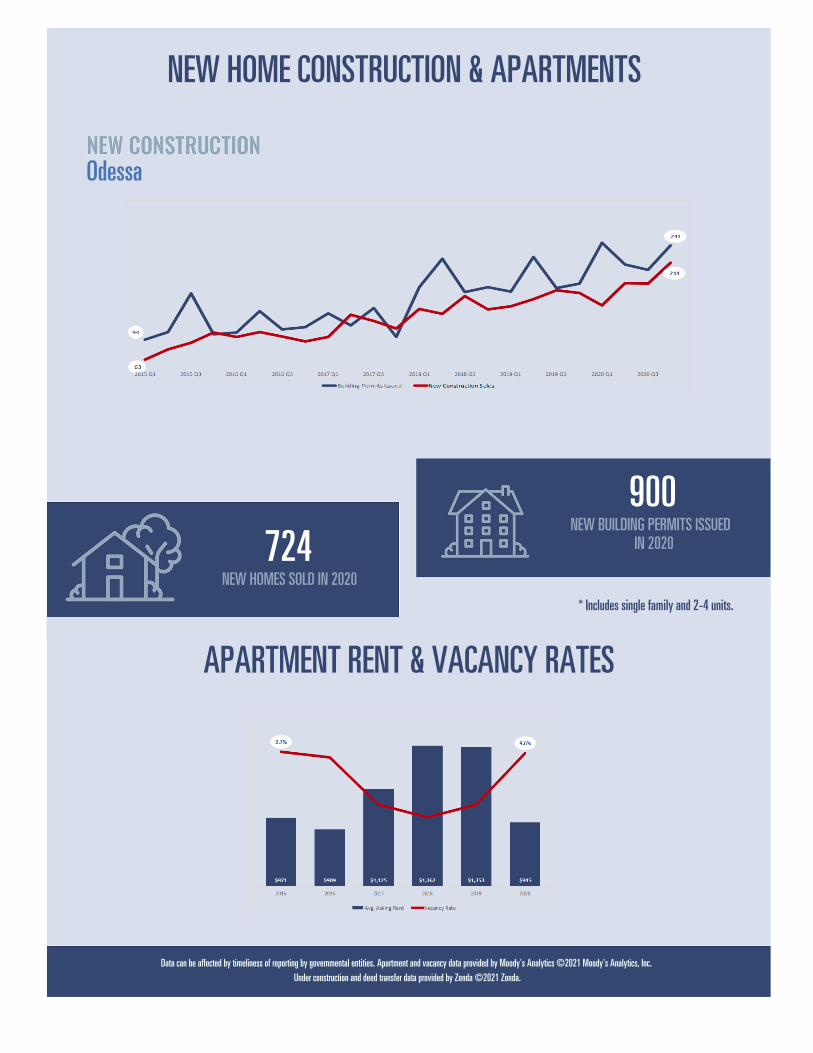
NEW HOME CONSTRUCTION & APARTMENTS
Odessa
724NEW HOMES SOLD IN 2020
900NEW BUILDING PERMITS ISSUED
IN 2020
* Includes single family and 2-4 units.
APARTMENT RENT & VACANCY RATES
Data can be affected by timeliness of reporting by governmental entities. Apartment and vacancy data provided by Moody's Analytics ©2021 Moody's Analytics, Inc. Under construction and deed transfer data provided by Zonda ©2021 Zonda.

San Angelo Metropolitan Statistical Area
San Angelo MSAby the numbers*
$200,000UP 8.1% from 2019
243DOWN 29.2% from 2019
4310 days less than 2019
1,823UP 4.5% from 2019
1.3Compared to 2.2 in 2019
$118.19UP 8.8% from 2019
* Data includes new and existing home sales.
4-YEAR COMPARISONHOME SALES VOLUME VS. MEDIAN PRICE
MONTHLY AVERAGE MORTGAGE INTEREST RATES
Source: Freddie Mac Primary Mortgage Market Survey® (PMMS®). ©2021, Freddie Mac. Averages are for conforming mortgages with 20% down.
2020

PERCENT OF HOMES SOLD IN 2020 BY PRICE CLASS
$55,097 SAN ANGELO
San Angelo MSA $0 - $99,999 8.7%
$100,000 - $199,999 40.7%$200,000 - $299,999 34.2%$300,000 - $399,999 10.7%$400,000 - $499,999 3.0%$500,000 - $749,999 1.9%$750,000 - $999,999 0.5%
$1,000,000+ 0.2%
The median price per square foot in SanAngelo has increased 22.0% since 2016.
Tom Green County $0 - $99,999 8.6%
$100,000 - $199,999 40.8%$200,000 - $299,999 34.3%$300,000 - $399,999 10.7%$400,000 - $499,999 3.0%$500,000 - $749,999 1.9%$750,000 - $999,999 0.5%
$1,000,000+ 0.2%
Runnels County $0 - $99,999 43.6%
$100,000 - $199,999 33.3%$200,000 - $299,999 18.0%$300,000 - $399,999 5.1%$400,000 - $499,999 0.0%$500,000 - $749,999 0.0%$750,000 - $999,999 0.0%
$1,000,000+ 0.0%
The availability of homes priced under $200,000 hasdecreased 18.4% since 2016.
Coke County $0 - $99,999 43.3%
$100,000 - $199,999 43.2%$200,000 - $299,999 8.1%$300,000 - $399,999 2.7%$400,000 - $499,999 0.0%$500,000 - $749,999 0.0%$750,000 - $999,999 0.0%
$1,000,000+ 2.7%
Irion County $0 - $99,999 18.2%
$100,000 - $199,999 27.3%$200,000 - $299,999 27.3%$300,000 - $399,999 18.2%$400,000 - $499,999 0.0%$500,000 - $749,999 9.1%$750,000 - $999,999 0.0%
$1,000,000+ 0.0%
Unless otherwise specified, data for this report is provided by the Data Relevance Project, a partnership among Texas REALTORS® and local REALTOR® associations throughout the state. Data analysis is provided by the Texas Real Estate Research Center.
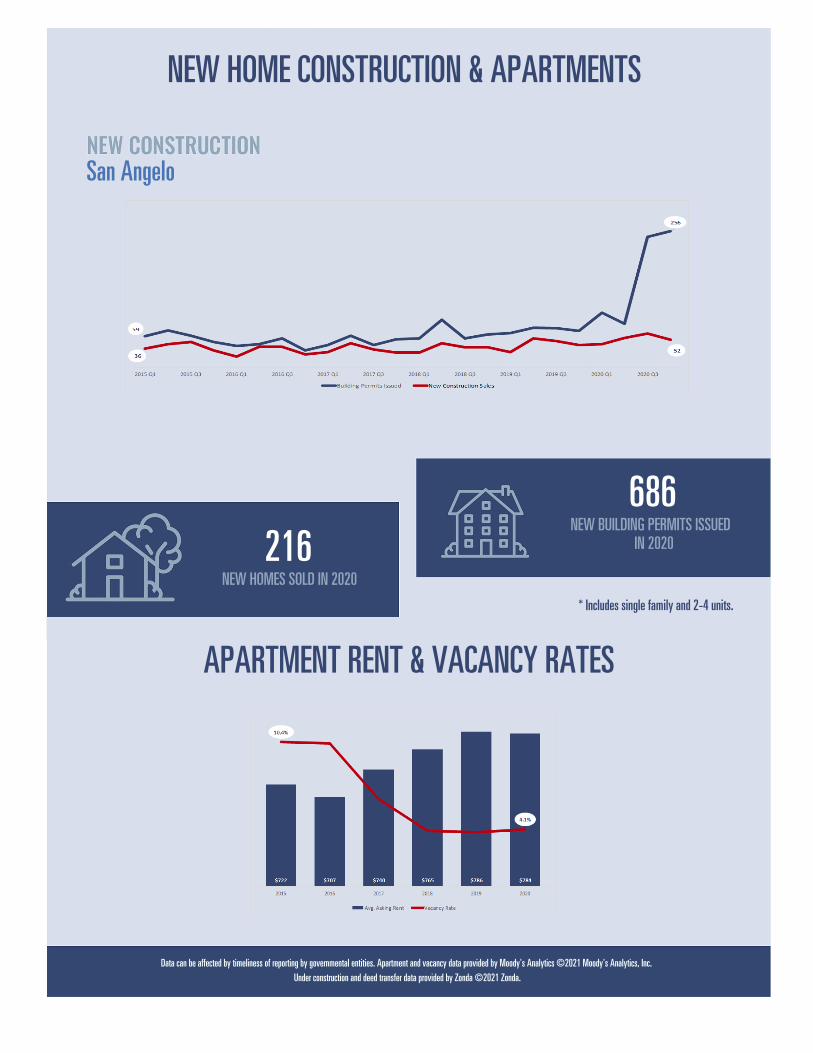
NEW HOME CONSTRUCTION & APARTMENTS
San Angelo
216NEW HOMES SOLD IN 2020
686NEW BUILDING PERMITS ISSUED
IN 2020
* Includes single family and 2-4 units.
APARTMENT RENT & VACANCY RATES
Data can be affected by timeliness of reporting by governmental entities. Apartment and vacancy data provided by Moody's Analytics ©2021 Moody's Analytics, Inc. Under construction and deed transfer data provided by Zonda ©2021 Zonda.

San Antonio-New Braunfels Metropolitan Statistical Area
San Antonio-New Braunfels MSAby the numbers*
$249,000UP 8.2% from 2019
8,066DOWN 20.4% from 2019
572 days less than 2019
40,128UP 11.6% from 2019
1.7Compared to 3.2 in 2019
$128.85UP 7.1% from 2019
* Data includes new and existing home sales.
4-YEAR COMPARISONHOME SALES VOLUME VS. MEDIAN PRICE
MONTHLY AVERAGE MORTGAGE INTEREST RATES
Source: Freddie Mac Primary Mortgage Market Survey® (PMMS®). ©2021, Freddie Mac. Averages are for conforming mortgages with 20% down.
2020

PERCENT OF HOMES SOLD IN 2020 BY PRICE CLASS
$62,355 SAN ANTONIO-NEW BRAUNFELS
San Antonio-New Braunfels MSA $0 - $99,999 2.7%
$100,000 - $199,999 23.7%$200,000 - $299,999 40.8%$300,000 - $399,999 16.8%$400,000 - $499,999 7.9%$500,000 - $749,999 5.8%$750,000 - $999,999 1.3%
$1,000,000+ 0.9%
The median price per square foot in SanAntonio-New Braunfels has increased 25.4%since 2016.
Bexar County $0 - $99,999 3.0%
$100,000 - $199,999 28.2%$200,000 - $299,999 41.0%$300,000 - $399,999 15.1%$400,000 - $499,999 6.5%$500,000 - $749,999 4.5%$750,000 - $999,999 1.0%
$1,000,000+ 0.7%
Comal County $0 - $99,999 0.7%
$100,000 - $199,999 9.3%$200,000 - $299,999 34.6%$300,000 - $399,999 23.6%$400,000 - $499,999 14.3%$500,000 - $749,999 14.1%$750,000 - $999,999 2.4%
$1,000,000+ 1.0%
The availability of homes priced under $200,000 hasdecreased 22.4% since 2016.
Guadalupe County $0 - $99,999 1.8%
$100,000 - $199,999 12.7%$200,000 - $299,999 60.1%$300,000 - $399,999 18.0%$400,000 - $499,999 4.4%$500,000 - $749,999 2.3%$750,000 - $999,999 0.2%
$1,000,000+ 0.5%
Kendall County $0 - $99,999 0.2%
$100,000 - $199,999 0.9%$200,000 - $299,999 15.6%$300,000 - $399,999 23.1%$400,000 - $499,999 21.6%$500,000 - $749,999 20.4%$750,000 - $999,999 9.3%
$1,000,000+ 9.0%
Unless otherwise specified, data for this report is provided by the Data Relevance Project, a partnership among Texas REALTORS® and local REALTOR® associations throughout the state. Data analysis is provided by the Texas Real Estate Research Center.

NEW HOME CONSTRUCTION & APARTMENTS
San Antonio-New Braunfels
14,915NEW HOMES SOLD IN 2020
10,912NEW BUILDING PERMITS ISSUED
IN 2020
* Includes single family and 2-4 units.
APARTMENT RENT & VACANCY RATES
Data can be affected by timeliness of reporting by governmental entities. Apartment and vacancy data provided by Moody's Analytics ©2021 Moody's Analytics, Inc. Under construction and deed transfer data provided by Zonda ©2021 Zonda.

Sherman-Denison Metropolitan Statistical Area
Sherman-Denison MSAby the numbers*
$200,000UP 8.7% from 2019
547DOWN 17.7% from 2019
602 days more than 2019
2,366UP 15.5% from 2019
1.7Compared to 3.5 in 2019
$121.11UP 9.7% from 2019
* Data includes new and existing home sales.
4-YEAR COMPARISONHOME SALES VOLUME VS. MEDIAN PRICE
MONTHLY AVERAGE MORTGAGE INTEREST RATES
Source: Freddie Mac Primary Mortgage Market Survey® (PMMS®). ©2021, Freddie Mac. Averages are for conforming mortgages with 20% down.
2020

PERCENT OF HOMES SOLD IN 2020 BY PRICE CLASS
$57,476 SHERMAN-DENISON
Sherman-Denison MSA $0 - $99,999 10.0%
$100,000 - $199,999 39.8%$200,000 - $299,999 29.9%$300,000 - $399,999 11.3%$400,000 - $499,999 4.8%$500,000 - $749,999 3.3%$750,000 - $999,999 0.6%
$1,000,000+ 0.3%
The median price per square foot inSherman-Denison has increased 45.1% since2016.
Grayson County $0 - $99,999 10.0%
$100,000 - $199,999 39.8%$200,000 - $299,999 29.9%$300,000 - $399,999 11.3%$400,000 - $499,999 4.8%$500,000 - $749,999 3.3%$750,000 - $999,999 0.6%
$1,000,000+ 0.3%
Cooke County $0 - $99,999 4.7%
$100,000 - $199,999 34.2%$200,000 - $299,999 28.7%$300,000 - $399,999 18.4%$400,000 - $499,999 4.9%$500,000 - $749,999 6.5%$750,000 - $999,999 2.0%
$1,000,000+ 0.6%
The availability of homes priced under $200,000 hasdecreased 23.2% since 2016.
Fannin County $0 - $99,999 19.1%
$100,000 - $199,999 42.2%$200,000 - $299,999 20.2%$300,000 - $399,999 13.8%$400,000 - $499,999 3.5%$500,000 - $749,999 1.1%$750,000 - $999,999 0.3%
$1,000,000+ 0.0%
Texas $0 - $99,999 4.6%
$100,000 - $199,999 22.9%$200,000 - $299,999 34.5%$300,000 - $399,999 18.3%$400,000 - $499,999 8.7%$500,000 - $749,999 7.3%$750,000 - $999,999 2.0%
$1,000,000+ 1.8%
Unless otherwise specified, data for this report is provided by the Data Relevance Project, a partnership among Texas REALTORS® and local REALTOR® associations throughout the state. Data analysis is provided by the Texas Real Estate Research Center.

NEW HOME CONSTRUCTION & APARTMENTS
Sherman-Denison
677NEW HOMES SOLD IN 2020
APARTMENT RENT & VACANCY RATES
Data can be affected by timeliness of reporting by governmental entities. Apartment and vacancy data provided by Moody's Analytics ©2021 Moody's Analytics, Inc. Under construction and deed transfer data provided by Zonda ©2021 Zonda.

Texarkana Metropolitan Statistical Area
Texarkana MSAby the numbers*
$160,000UP 10.3% from 2019
242DOWN 9% from 2019
7410 days less than 2019
785UP 1.8% from 2019
3.4Compared to 3.5 in 2019
$ 86.36UP 7.3% from 2019
* Data includes new and existing home sales.
4-YEAR COMPARISONHOME SALES VOLUME VS. MEDIAN PRICE
MONTHLY AVERAGE MORTGAGE INTEREST RATES
Source: Freddie Mac Primary Mortgage Market Survey® (PMMS®). ©2021, Freddie Mac. Averages are for conforming mortgages with 20% down.
2020

PERCENT OF HOMES SOLD IN 2020 BY PRICE CLASS
$51,544 TEXARKANA
Texarkana MSA $0 - $99,999 26.7%
$100,000 - $199,999 37.8%$200,000 - $299,999 23.5%$300,000 - $399,999 7.9%$400,000 - $499,999 2.9%$500,000 - $749,999 1.2%$750,000 - $999,999 0.0%
$1,000,000+ 0.1%
The median price per square foot inTexarkana has increased 21.0% since 2016.
Bowie County $0 - $99,999 26.7%
$100,000 - $199,999 37.8%$200,000 - $299,999 23.5%$300,000 - $399,999 7.9%$400,000 - $499,999 2.9%$500,000 - $749,999 1.2%$750,000 - $999,999 0.0%
$1,000,000+ 0.1%
Cass County $0 - $99,999 33.1%
$100,000 - $199,999 41.4%$200,000 - $299,999 15.9%$300,000 - $399,999 6.4%$400,000 - $499,999 2.8%$500,000 - $749,999 0.4%$750,000 - $999,999 0.0%
$1,000,000+ 0.0%
The availability of homes priced under $200,000 hasdecreased 14.7% since 2016.
Titus County $0 - $99,999 15.2%
$100,000 - $199,999 39.1%$200,000 - $299,999 23.9%$300,000 - $399,999 13.2%$400,000 - $499,999 3.7%$500,000 - $749,999 4.5%$750,000 - $999,999 0.0%
$1,000,000+ 0.4%
Morris County $0 - $99,999 45.1%
$100,000 - $199,999 42.9%$200,000 - $299,999 5.5%$300,000 - $399,999 4.4%$400,000 - $499,999 2.2%$500,000 - $749,999 0.0%$750,000 - $999,999 0.0%
$1,000,000+ 0.0%
Unless otherwise specified, data for this report is provided by the Data Relevance Project, a partnership among Texas REALTORS® and local REALTOR® associations throughout the state. Data analysis is provided by the Texas Real Estate Research Center.

NEW HOME CONSTRUCTION & APARTMENTS
Texarkana
27NEW BUILDING PERMITS ISSUED
IN 2020
* Includes single family and 2-4 units.
APARTMENT RENT & VACANCY RATES
Data can be affected by timeliness of reporting by governmental entities. Apartment and vacancy data provided by Moody's Analytics ©2021 Moody's Analytics, Inc. Under construction and deed transfer data provided by Zonda ©2021 Zonda.

Tyler Metropolitan Statistical Area
Tyler MSAby the numbers*
$230,000UP 10.1% from 2019
751DOWN 16.1% from 2019
763 days less than 2019
3,357UP 13% from 2019
1.8Compared to 3.4 in 2019
$119.96UP 8.7% from 2019
* Data includes new and existing home sales.
4-YEAR COMPARISONHOME SALES VOLUME VS. MEDIAN PRICE
MONTHLY AVERAGE MORTGAGE INTEREST RATES
Source: Freddie Mac Primary Mortgage Market Survey® (PMMS®). ©2021, Freddie Mac. Averages are for conforming mortgages with 20% down.
2020

PERCENT OF HOMES SOLD IN 2020 BY PRICE CLASS
$59,584 TYLER
Tyler MSA $0 - $99,999 5.0%
$100,000 - $199,999 32.1%$200,000 - $299,999 35.4%$300,000 - $399,999 14.5%$400,000 - $499,999 6.8%$500,000 - $749,999 4.5%$750,000 - $999,999 1.2%
$1,000,000+ 0.4%
The median price per square foot in Tyler hasincreased 26.8% since 2016.
Smith County $0 - $99,999 5.0%
$100,000 - $199,999 32.1%$200,000 - $299,999 35.4%$300,000 - $399,999 14.5%$400,000 - $499,999 6.8%$500,000 - $749,999 4.5%$750,000 - $999,999 1.2%
$1,000,000+ 0.4%
Wood County $0 - $99,999 16.8%
$100,000 - $199,999 38.9%$200,000 - $299,999 24.1%$300,000 - $399,999 12.0%$400,000 - $499,999 4.6%$500,000 - $749,999 3.0%$750,000 - $999,999 0.4%
$1,000,000+ 0.4%
The availability of homes priced under $200,000 hasdecreased 25.0% since 2016.
Cherokee County $0 - $99,999 24.5%
$100,000 - $199,999 29.6%$200,000 - $299,999 19.1%$300,000 - $399,999 17.4%$400,000 - $499,999 4.2%$500,000 - $749,999 2.7%$750,000 - $999,999 1.7%
$1,000,000+ 0.7%
Texas $0 - $99,999 4.6%
$100,000 - $199,999 22.9%$200,000 - $299,999 34.5%$300,000 - $399,999 18.3%$400,000 - $499,999 8.7%$500,000 - $749,999 7.3%$750,000 - $999,999 2.0%
$1,000,000+ 1.8%
Unless otherwise specified, data for this report is provided by the Data Relevance Project, a partnership among Texas REALTORS® and local REALTOR® associations throughout the state. Data analysis is provided by the Texas Real Estate Research Center.

NEW HOME CONSTRUCTION & APARTMENTS
Tyler
532NEW HOMES SOLD IN 2020
446NEW BUILDING PERMITS ISSUED
IN 2020
* Includes single family and 2-4 units.
APARTMENT RENT & VACANCY RATES
Data can be affected by timeliness of reporting by governmental entities. Apartment and vacancy data provided by Moody's Analytics ©2021 Moody's Analytics, Inc. Under construction and deed transfer data provided by Zonda ©2021 Zonda.
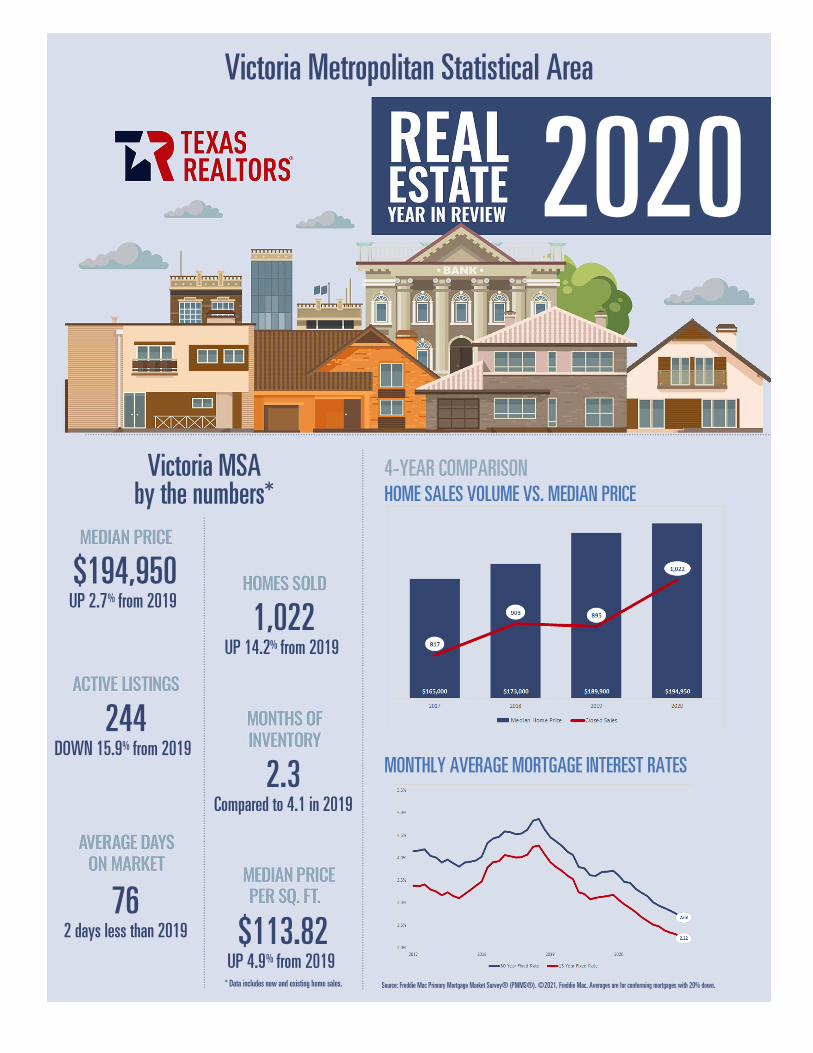
Victoria Metropolitan Statistical Area
Victoria MSAby the numbers*
$194,950UP 2.7% from 2019
244DOWN 15.9% from 2019
762 days less than 2019
1,022UP 14.2% from 2019
2.3Compared to 4.1 in 2019
$113.82UP 4.9% from 2019
* Data includes new and existing home sales.
4-YEAR COMPARISONHOME SALES VOLUME VS. MEDIAN PRICE
MONTHLY AVERAGE MORTGAGE INTEREST RATES
Source: Freddie Mac Primary Mortgage Market Survey® (PMMS®). ©2021, Freddie Mac. Averages are for conforming mortgages with 20% down.
2020

PERCENT OF HOMES SOLD IN 2020 BY PRICE CLASS
$56,627 VICTORIA
Victoria MSA $0 - $99,999 11.4%
$100,000 - $199,999 41.4%$200,000 - $299,999 30.6%$300,000 - $399,999 9.4%$400,000 - $499,999 4.5%$500,000 - $749,999 2.4%$750,000 - $999,999 0.3%
$1,000,000+ 0.1%
The median price per square foot in Victoriahas increased 10.3% since 2016.
Victoria County $0 - $99,999 11.1%
$100,000 - $199,999 42.2%$200,000 - $299,999 31.0%$300,000 - $399,999 8.8%$400,000 - $499,999 4.5%$500,000 - $749,999 2.1%$750,000 - $999,999 0.3%
$1,000,000+ 0.0%
Calhoun County $0 - $99,999 20.4%
$100,000 - $199,999 36.1%$200,000 - $299,999 24.1%$300,000 - $399,999 7.9%$400,000 - $499,999 7.9%$500,000 - $749,999 3.2%$750,000 - $999,999 0.5%
$1,000,000+ 0.0%
The availability of homes priced under $200,000 hasdecreased 11.1% since 2016.
Lavaca County $0 - $99,999 21.6%
$100,000 - $199,999 44.8%$200,000 - $299,999 21.6%$300,000 - $399,999 6.0%$400,000 - $499,999 5.2%$500,000 - $749,999 0.9%$750,000 - $999,999 0.0%
$1,000,000+ 0.0%
Goliad County $0 - $99,999 19.4%
$100,000 - $199,999 19.4%$200,000 - $299,999 19.4%$300,000 - $399,999 25.0%$400,000 - $499,999 5.6%$500,000 - $749,999 8.3%$750,000 - $999,999 0.0%
$1,000,000+ 2.8%
Unless otherwise specified, data for this report is provided by the Data Relevance Project, a partnership among Texas REALTORS® and local REALTOR® associations throughout the state. Data analysis is provided by the Texas Real Estate Research Center.

NEW HOME CONSTRUCTION & APARTMENTS
Victoria
88NEW HOMES SOLD IN 2020
APARTMENT RENT & VACANCY RATES
Data can be affected by timeliness of reporting by governmental entities. Apartment and vacancy data provided by Moody's Analytics ©2021 Moody's Analytics, Inc. Under construction and deed transfer data provided by Zonda ©2021 Zonda.

Waco Metropolitan Statistical Area
Waco MSAby the numbers*
$213,060UP 12.7% from 2019
539DOWN 23% from 2019
496 days less than 2019
3,391UP 7.9% from 2019
1.1Compared to 2.4 in 2019
$119.50UP 9.1% from 2019
* Data includes new and existing home sales.
4-YEAR COMPARISONHOME SALES VOLUME VS. MEDIAN PRICE
MONTHLY AVERAGE MORTGAGE INTEREST RATES
Source: Freddie Mac Primary Mortgage Market Survey® (PMMS®). ©2021, Freddie Mac. Averages are for conforming mortgages with 20% down.
2020

PERCENT OF HOMES SOLD IN 2020 BY PRICE CLASS
$50,368 WACO
Waco MSA $0 - $99,999 10.9%
$100,000 - $199,999 33.5%$200,000 - $299,999 31.9%$300,000 - $399,999 13.5%$400,000 - $499,999 5.2%$500,000 - $749,999 4.0%$750,000 - $999,999 0.6%
$1,000,000+ 0.3%
The median price per square foot in Wacohas increased 37.3% since 2016.
McLennan County $0 - $99,999 10.0%
$100,000 - $199,999 33.5%$200,000 - $299,999 32.6%$300,000 - $399,999 13.7%$400,000 - $499,999 5.2%$500,000 - $749,999 4.1%$750,000 - $999,999 0.6%
$1,000,000+ 0.3%
Limestone County $0 - $99,999 30.0%
$100,000 - $199,999 38.8%$200,000 - $299,999 14.7%$300,000 - $399,999 8.8%$400,000 - $499,999 4.7%$500,000 - $749,999 2.9%$750,000 - $999,999 0.0%
$1,000,000+ 0.0%
The availability of homes priced under $200,000 hasdecreased 25.6% since 2016.
Texas $0 - $99,999 4.6%
$100,000 - $199,999 22.9%$200,000 - $299,999 34.5%$300,000 - $399,999 18.3%$400,000 - $499,999 8.7%$500,000 - $749,999 7.3%$750,000 - $999,999 2.0%
$1,000,000+ 1.8%
Unless otherwise specified, data for this report is provided by the Data Relevance Project, a partnership among Texas REALTORS® and local REALTOR® associations throughout the state. Data analysis is provided by the Texas Real Estate Research Center.

NEW HOME CONSTRUCTION & APARTMENTS
Waco
606NEW HOMES SOLD IN 2020
746NEW BUILDING PERMITS ISSUED
IN 2020
* Includes single family and 2-4 units.
APARTMENT RENT & VACANCY RATES
Data can be affected by timeliness of reporting by governmental entities. Apartment and vacancy data provided by Moody's Analytics ©2021 Moody's Analytics, Inc. Under construction and deed transfer data provided by Zonda ©2021 Zonda.

Wichita Falls Metropolitan Statistical Area
Wichita Falls MSAby the numbers*
$145,000UP 12.8% from 2019
296DOWN 25.8% from 2019
3710 days less than 2019
1,981UP 5.6% from 2019
1.2Compared to 2.3 in 2019
$ 89.52UP 12.2% from 2019 * Data includes new and existing home sales.
4-YEAR COMPARISONHOME SALES VOLUME VS. MEDIAN PRICE
MONTHLY AVERAGE MORTGAGE INTEREST RATES
Source: Freddie Mac Primary Mortgage Market Survey® (PMMS®). ©2021, Freddie Mac. Averages are for conforming mortgages with 20% down.
2020

PERCENT OF HOMES SOLD IN 2020 BY PRICE CLASS
$52,233 WICHITA FALLS
Wichita Falls MSA $0 - $99,999 28.5%
$100,000 - $199,999 43.7%$200,000 - $299,999 20.0%$300,000 - $399,999 5.0%$400,000 - $499,999 1.6%$500,000 - $749,999 1.2%$750,000 - $999,999 0.1%
$1,000,000+ 0.1%
The median price per square foot in WichitaFalls has increased 28.4% since 2016.
Wichita County $0 - $99,999 28.4%
$100,000 - $199,999 44.7%$200,000 - $299,999 19.7%$300,000 - $399,999 4.6%$400,000 - $499,999 1.6%$500,000 - $749,999 0.9%$750,000 - $999,999 0.1%
$1,000,000+ 0.1%
Young County $0 - $99,999 32.7%
$100,000 - $199,999 42.6%$200,000 - $299,999 17.9%$300,000 - $399,999 4.3%$400,000 - $499,999 0.6%$500,000 - $749,999 1.9%$750,000 - $999,999 0.0%
$1,000,000+ 0.0%
The availability of homes priced under $200,000 hasdecreased 11.3% since 2016.
Clay County $0 - $99,999 34.1%
$100,000 - $199,999 44.5%$200,000 - $299,999 15.1%$300,000 - $399,999 2.4%$400,000 - $499,999 0.8%$500,000 - $749,999 3.2%$750,000 - $999,999 0.0%
$1,000,000+ 0.0%
Archer County $0 - $99,999 21.6%
$100,000 - $199,999 23.9%$200,000 - $299,999 31.8%$300,000 - $399,999 15.9%$400,000 - $499,999 2.3%$500,000 - $749,999 4.6%$750,000 - $999,999 0.0%
$1,000,000+ 0.0%
Unless otherwise specified, data for this report is provided by the Data Relevance Project, a partnership among Texas REALTORS® and local REALTOR® associations throughout the state. Data analysis is provided by the Texas Real Estate Research Center.
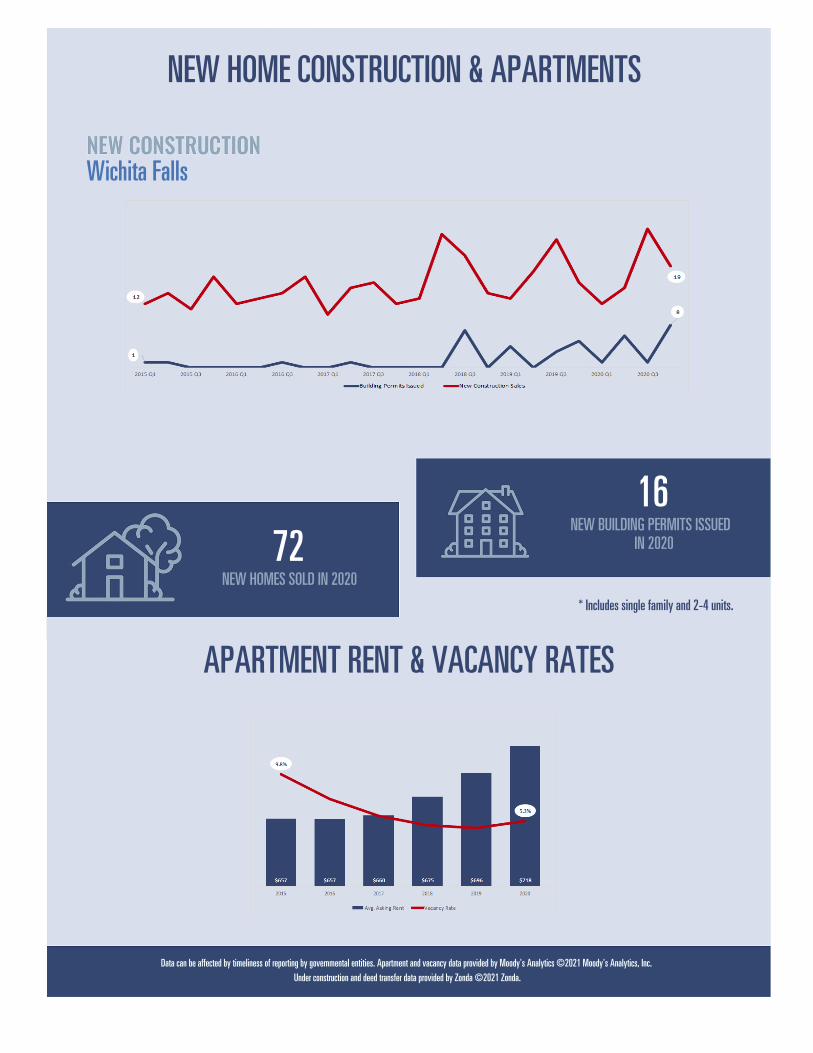
NEW HOME CONSTRUCTION & APARTMENTS
Wichita Falls
72NEW HOMES SOLD IN 2020
16NEW BUILDING PERMITS ISSUED
IN 2020
* Includes single family and 2-4 units.
APARTMENT RENT & VACANCY RATES
Data can be affected by timeliness of reporting by governmental entities. Apartment and vacancy data provided by Moody's Analytics ©2021 Moody's Analytics, Inc. Under construction and deed transfer data provided by Zonda ©2021 Zonda.