2020 september policy and strategy board slides - tbr
TRANSCRIPT

Student Access, Equity, and Success in 2020: Data InsightsQuarterly Meeting of the Tennessee Board of RegentsSeptember 2020

Fall 2020 Enrollment at TCATs
K-12 Pipeline
Adults
Graduates
Workforce Training
Labor Force
TransfersTN Transfer Pathways
SAILSTN Pathways
EPSOs
High Impact PracticesLearning Support
MindsetBeyond Financial Aid
Digital Engagement Initiative
Supporting Students
Student Access,
Retention, Success, &
Equity
Achieving the DreamAcademic and Financial OperationsData Science, Analytics & ToolsStrategic Enrollment ManagementOutcomes-Based Funding Formula
Supporting Colleges

Guiding Questions
Enrollment & Access
What does enrollment look like in an open access system this fall?
How does enrollment reflect the communities that we serve?
How has COVID-19 affected who we serve or how we serve them?
Student Success
What progress have colleges made toward the Drive to 55?
How do we measure success? Are those metrics consistent with our mission and the students we serve?
What do we know about the causes of student success?

Enrollment & Access
Students at Roane State’s Oak Ridge Campus in 2019

What does enrollment look like in an open access system this fall?
Enrollment & Access

Fall 2020 at Community Colleges96
,780
92,7
42
90,6
15
87,0
64
87,9
29
86,1
62
87,2
20
89,0
78
88,9
46
78,7
53
62,0
32
58,6
56
56,3
92
54,1
92
57,2
90
56,5
11
58,0
05
58,7
12
58,2
07
50,8
71
2011 2012 2013 2014 2015 2016 2017 2018 2019 2020Fall Terms
Headcount FTE
*Preliminary fall 2020 enrollment is based on unedited census (14th day) enrollment data. Prior years are reported with official end-of-term data. Historically, the end-of-term headcount is 1% higher than census, while end-of-term full-time equivalent (FTE) enrollment is 2% higher than census. Census FTE may not reflect enrollments in courses that begin after the 14th day.
Enrollment in fall 2020 declined 11.5% compared to total enrollment in fall 2019. That’s 10,000 fewer students.
Full-time equivalent (FTE) enrollment declined 12.6% from fall 2019 to fall 2020.

Headcount at Community Colleges
*Preliminary fall 2020 enrollment is based on unedited census (14th day) enrollment data. Prior years are reported with official end-of-term data.
0
2,000
4,000
6,000
8,000
10,000
2019 2020
Small Changes
2019 2020
Moderate Changes
2019 2020
Significant Changes
Volunteer
MotlowColumbia
Dyersburg
Nashville
WaltersNortheast
Cleveland
Pellissippi
Southwest
Jackson
-4%
-7%-8%
-7%
-12%
-9%-12%
-9%
-14%
-24%
-15%
Roane
-14%
Chattanooga
-9%

Fall 2020 at Community Colleges: Summary
Dual enrollmentdeclined 9% from 2019 to 2020.That’s 1,500 fewer students.
First-time, full-time freshmendeclined 19% from 2019 to 2020.That’s 3,600 fewer students.
Adult enrollmentdeclined 13% from 2019 to 2020.That’s 3,300 fewer students.
0
5,000
10,000
15,000
20,000
25,000
'11 '12 '13 '14 '15 '16 '17 '18 '19 '200
5,000
10,000
15,000
20,000
25,000
'11 '12 '13 '14 '15 '16 '17 '18 '19 '200
8,000
16,000
24,000
32,000
40,000
'11 '12 '13 '14 '15 '16 '17 '18 '19 '20

Community College Enrollment by Type
0
8,000
16,000
24,000
32,000
40,000
48,000
2011 2012 2013 2014 2015 2016 2017 2018 2019 2020
Hea
dcou
nt
Fall Terms
Dual Enrollment Non-Degree Seeking Certificate SeekingAssociate Seeking - Freshmen Associate Seeking - Sophomore
-22%-7%
Enrollment by dual enrolled high school students declined 9% from fall 2019 to fall 2020.
Enrollment by freshmen students seeking an associate degree declined 16% from fall 2019 to fall 2020.
Enrollment by associate-seeing sophomores declined by only 6%.
-16%
-6%
-9%
*Preliminary fall 2020 enrollment is based on unedited census (14th day) enrollment data.

First-Time Freshmen Enrollment
0
5,000
10,000
15,000
20,000
25,000
2011 2012 2013 2014 2015 2016 2017 2018 2019 2020
Hea
dcou
nt
Fall Terms
All First-Time Students First-Time, Full-Time First-Time, Full-Time, Recent HS Graduate
15,104 first-time, full-time (FTFT) freshmen enrolled at community colleges in fall 2020. Enrollment by this group declined 19%compared to fall 2019.
13,313 FTFT students in fall 2020 enrolled within one year of high school graduation. This group is also 19% smaller than in fall 2019.
-16%
-19%-19%
*Preliminary fall 2020 enrollment is based on unedited census (14th day) enrollment data.

Community College Enrollment by Age
*Preliminary fall 2020 enrollment is based on unedited census (14th day) enrollment data.
Enrollment among non-dual enrollment students age 19 or younger declined 10%from fall 2019 to 2020.
The number of students age 35 and older declined 17% from fall 2019 to fall 2020.
Enrollment by all adults (those 25 and older) declined 13%.
0
5,000
10,000
15,000
20,000
25,000
30,000
2011 2012 2013 2014 2015 2016 2017 2018 2019 2020
Hea
dcou
nt
Fall Terms
Dual Enrollment Age 19 or Younger Age 20-24 Age 25-34 Age 35 or Older
-10%
-13%-9%
-10%
-17%

Tennessee Promise and Reconnect
According to preliminary data…
*Preliminary fall 2020 enrollment is based on unedited census (14th day) enrollment data. Data on Promise and Reconnect students is preliminary and based on the number of applicants, not the number of recipients.
13,000new Tennessee Promise applicants are enrolled at community colleges this fall.
Down approximately
6%from last fall.
11,800Tennessee Reconnect applicants are enrolled at community colleges this fall.
Down approximately
15%from last fall.

Fall-to-Fall Retention
30%
40%
50%
60%
70%
2011-12 2012-13 2013-14 2014-15 2015-16 2016-17 2017-18 2018-19 2019-20*
Fall FTFT Cohort
First-Year Retention Rates for FTFT Students
All Black Hispanic White
*First-year retention rates reflect the number of students in the first-time, full-time freshmen cohort who returned the next fall or earned a certificate or degree anytime during the first year of enrollment. Data for the 2019 cohort is preliminary and based on unedited census (14th day) enrollment data for fall 2020.
54% of students who enrolled as first-time, full-time freshmen in fall 2019 were retained in fall 2020.
The fall-to-fall retention rate declined 1 point since last year.
Among Hispanic students who enrolled in fall 2019, the retention rate declined from 60% to 55%.

Fall 2020 Enrollment at TCATs
According to preliminary data…
10,772students have registered at the Tennessee Colleges of Applied Technology for fall 2020.
Up 3%
from this time last fall.
*Preliminary fall 2020 TCAT data is based on the number of students who registered at TCATs as of the second week of September.

How does enrollment reflect the communities that we serve?
Enrollment & Access

Fall 2020 at Community Colleges: Summary
Black & African American enrollment
declined 19% from 2019 to 2020.That’s 2,680 fewer students.
Black male enrollment
declined 24% from 2019 to 2020.That’s 1,160 fewer students.
Female student enrollment
declined 9% from 2019 to 2020.That’s 4,790 fewer students.
0
5,000
10,000
15,000
20,000
'11 '12 '13 '14 '15 '16 '17 '18 '19 '200
5,000
10,000
15,000
20,000
'11 '12 '13 '14 '15 '16 '17 '18 '19 '200
15,000
30,000
45,000
60,000
'11 '12 '13 '14 '15 '16 '17 '18 '19 '20

Fall 2020 Enrollment at TCATs
https://www.tbr.edu/sites/default/files/media/2020/03/TN-Promise_March2020.pdf
Community College Enrollment by Group
*Preliminary fall 2020 enrollment is based on unedited census (14th day) enrollment data.
Enrollment by Black and African American students declined 19% from fall 2019 to fall 2020.
Enrollment by Black and African American male students declined 24% compared to fall 2019.
Enrollment by Hispanic students declined only 4% compared to fall 2019.
0
10,000
20,000
30,000
40,000
50,000
60,000
70,000
2019 2020
Headcount by Race/Ethnicity
0
5,000
10,000
15,000
20,000
25,000
30,000
35,000
40,000
2019 2020
Headcount By Gender
White
Black
Hispanic
-11%
-19%
-4%
White Female
White Male
Black FemaleBlack Male
-8%
-15%
-16%
-24%

Fall 2020 Enrollment at TCATs
https://www.tbr.edu/sites/default/files/media/2020/03/TN-Promise_March2020.pdf
First-Time, Full-Time Freshmen Enrollment by Group
First time, full-time (FTFT) enrollment by Black and African American students declined 31% from fall 2019 to fall 2020.
FTFT enrollment by Black male students declined 35% compared to fall 2019.
FTFT enrollment by Hispanic students declined 18%.0
3,000
6,000
9,000
12,000
15,000
2019 2020
FTFT by Race/Ethnicity
0
2,000
4,000
6,000
8,000
10,000
2019 2020
FTFT By Gender
White
Black
Hispanic
-17%
-31%-18%
White Female
White Male
Black Female
Black Male
-14%
-20%
-27%-35%
*Preliminary fall 2020 enrollment is based on unedited census (14th day) enrollment data.

Fall 2020 Enrollment at TCATs
https://www.tbr.edu/sites/default/files/media/2020/03/TN-Promise_March2020.pdf
How does the freshman class compare to the high school graduating class of 2020?
64,500+ students
Tennessee High School Class of 2020
13,313 students
Recent HS Grads Enrolled at Community Colleges in Fall 2020
*Data on the Tennessee high school class of 2020 represents graduates from the 2019-20 academic year, based on data from the Tennessee Department of Education.
For more about the high school pipeline, visit the TBR Research Library.

Fall 2020 Enrollment at TCATs
County Unemployment Rate in
July 2020
Change in Adult
Enrollment (2019 to 2020)
Shelby 14% -23%
Davidson 12% -6%
Lauderdale 12% +16%
McNairy 12% -26%
Cocke 11% -21%
Grundy 11% +17%
Sevier 10% -11%
How does adult enrollment reflect unemployment rates?
*Data on unemployment rates is provided by the Tennessee Department of Labor and Workforce Development. Adults are defined as students age 25 and older.
Change in Adult Enrollment by CountyFall 2019 to Fall 2020
Most counties saw a decline in adult enrollment. This was true even in counties with higher unemployment rates.

How has COVID-19 affected who we serve or how we serve them?
Enrollment & Access

Dual enrollment decreased systemwide.
0
400
800
1,200
1,600
2,000
2019 2020Fall Terms
+4%-15%-16%
-19%
-37%
At community colleges, dual enrollment declined 9% from fall 2019 to fall 2020.
That represents 1,500 fewer students compared to last fall.
Dual Enrollment Headcount
MotlowVolunteer
Chattanooga
RoanePellissippi
NashvilleSouthwest
+1%+7%

Academic preparation increased.
The number of students with ACT scores below 19 declined 25% from fall 2019 to fall 2020.
That represents 1,900 fewer students with ACT scores below 19.
The average high school GPA also rose. The number of students with GPAs below 3.0 dropped by 30%.
0
400
800
1,200
1,600
<13 13 14 15 16 17 18 19 20 21 22 23 24 25 26 27 28 29 30 31 32+
Perc
ent o
f Stu
dent
s
ACT Composite Scores
ACT Scores among First-Time, Full-Time Freshmen
Fall 2019 Fall 2020
High School GPAs among First-Time, Full-Time Freshmen
0 1,000 2,000 3,000 4,000 5,000
2.0 or Less
2.1 to 2.5
2.6 to 3.0
3.1 to 3.5
3.6 to 4.0+
Fall 2019
Fall 2020

Fall 2020 Enrollment at TCATsThe steepest declines among students with lower ACT scores.
This group declined 25%. That’s 753 fewer students
(463 fewer Black students).
0
300
600
900
2019 2020FTFT Cohort
White Female White Male
Black Female Black Male
ACT 15 or Less
0
600
1,200
1,800
2019 2020FTFT Cohort
White Female White Male
Black Female Black Male
ACT 16-18
0
1,000
2,000
3,000
2019 2020FTFT Cohort
White Female White Male
Black Female Black Male
ACT 19-23
0
400
800
1,200
2019 2020FTFT Cohort
White Female White Male
Black Female Black Male
ACT 24+
This group declined 24%. That’s 1,151 fewer students (345 fewer Black students).
This group declined 19%. That’s 1,289 fewer students(541 fewer male students).
This group declined 16%. That’s 387 fewer students(186 fewer white female
students).

Learning support needs decreased.55% of first-time, full-time freshmen at community colleges in fall 2020 required learning support in at least one subject area.
This was 3 percentage points lower than in fall 2019.
0%
20%
40%
60%
80%
100%
2011 2012 2013 2014 2015 2016 2017 2018 2019 2020
Fall TermsMath LS Reading LS
Writing LS Any LS
First-Time, Full-Time Freshmen Requiring Learning Support
*The percent of students requiring learning support is based on students who would require learning support based on their academic preparedness, not actual counts of students enrolled in learning support courses.

Enrollment in online & hybrid courses nearly doubled.The number of community college students enrolled in at least one online/remote course in fall 2020 increased 70% over fall 2019, and the number of students in hybrid courses doubled.
0
10,000
20,000
30,000
40,000
50,000
60,000
70,000
80,000
90,000
2011 2012 2013 2014 2015 2016 2017 2018 2019 2020
Fall Term
Headcount by Delivery Method
Conventional Hybrid Online/Remote Other
*Summing the delivery method categories will result in a headcount higher than the total headcount, as students taking classes though multiple delivery methods will be counted multiple times.
-81%
+70%
+101%
-21%

Enrollment & Access: Key Takeaways
• Community college enrollment in fall 2020 is 11.5% lower than in fall 2019.
• TCAT registrations have increased 3%.
What does enrollment look like in an open access system this fall?
• At community colleges, full-time enrollment by recent high school graduates declined by 19%.
• Declines were especially pronounced for Black students and male students.
How does enrollment reflect the communities that we serve?
• Dual enrollment and adult enrollment decreased.• The most significant declines in freshmen enrollment were
among students with ACT scores below 19.• Enrollment in online and hybrid courses nearly doubled.
How has COVID-19 affected who we serve or how we serve them?

Student Success
A Classroom at Southwest Tennessee Community College in 2019

What progress have colleges made toward the Drive to 55?
Student Success

Community College Students Set a New Record for Awards in 2019-2020
*Preliminary fall 2020 enrollment is based on unedited census (14th day) enrollment data. Prior years are reported with official end-of-term data. Awards include degrees and technical certificates for the academic year.
11,04412,51412,65812,76212,993
13,64314,136
15,24014,968
15,874
2011
2012
2013
2014
2015
2016
2017
2018
2019
2020
Awards44% increase in awards from 2011 to 2020
96,7
80
92,7
42
90,6
15
87,0
64
87,9
29
86,1
62
87,2
20
89,0
78
88,9
46
78,7
532011 2012 2013 2014 2015 2016 2017 2018 2019 2020
Enrollment19% decrease in enrollment from 2011 to 2020

Awards at Community Colleges
*Awards include degrees and technical certificates for the academic year (preceding summer, fall, and spring).
15,874 degrees and certificates were earned by community college students in 2019-20.
This is the highest number of awards in TBR history.
At 11 community colleges, awards in 2019-20 increased over the prior year. At Jackson, awards increased 21%. At Cleveland, awards increased 32% over the prior year.
Cleveland853
Columbia1,040
Jackson704
Pellissippi2,189
Volunteer1,710
Walters 1,323
0
300
600
900
1,200
1,500
1,800
2,100
2019 2020
Award Increases at Community Colleges

Graduates at Community Colleges
*Associate degrees designed to transfer include the Associate of Arts, Associate of Science, Associate of Science in Teaching, and Associate of Fine Arts.
19%
32%
26%
16%
6%
Associate Degrees in Tennessee Transfer Pathways
Other Associate Degrees Designed to Transfer
Associate of Applied Science
Short-Term Certificate
Long-Term Certificate
Awards in 2019-20 by TypeAbout the Graduates
55%are female students.
41%are adult students (25+).
10%are Black or African American students.
5%are Hispanic students.

Awards and Success at TCATs
*Awards include diplomas and certificates for the academic year (fall, spring, and trailing summer). Data on completion, job placement, and licensure are based on data reported to the Council on Occupational Education (COE).Awards for the 2019-20 academic year are based on preliminary data. The total number of 2019-20 awards will be revised when final data is available.
TCAT StudentSuccess
in 2018-19
89%Job Placement Rate
95%Licensure Pass Rate
Completion Rate82%
7,235
7,038
7,528
7,470
7,709
7,219
7,165
7,124
2013
2014
2015
2016
2017
2018
2019
2020*
Awards

Progress toward Drive to 55 Goals
*Drive to 55 targets capture the annual number of unique graduates. Since some individuals earn multiple awards, the number of award recipients differs from the number of awards.
6,980
1,543
TCAT Goal
In 2018-19, 6,980 students graduated from TCATs.
An additional 1,543 graduates next year will help us reach the target.
Target: 8,523
14,622
273
Community College Goal
In 2019-20, 14,622 students graduated from community colleges.
An additional 273 graduates next year will help us reach the annual target.
Target: 14,895Graduates Graduates

How do we measure success? Are those metrics consistent with our mission and the students we serve?
Student Success

Fall 2020 Enrollment at TCATsCommunity College Graduation Rates
*Graduation rates include degrees and technical certificates earned at any TBR community college.
14%16%
17%20%
22%24%
25% 25%
2010-13 2011-14 2012-15 2013-16 2014-17 2015-18 2016-19 2017-20
Three-Year Graduation Rate25.3% of students from the 2017 cohort graduated within three years.
Graduation rates have nearly doubled since 2010.
At four community colleges, 2017-20 graduation rates exceeded 30%:
Motlow 33%Northeast 32%Walters 31%Roane 31%
For more about graduation rates, visit the TBR Research Library.

Fall 2020 Enrollment at TCATsGaps in Graduation Rates by Race
*Graduation rates include degrees and technical certificates earned at any TBR community college.
0%
5%
10%
15%
20%
25%
30%
2010-13 2011-14 2012-15 2013-16 2014-17 2015-18 2016-19 2017-20
Three-Year Graduation Rate by Race and Ethnicity
Black and African American Hispanic White
23% of Hispanic students graduated within three years.
11% of Black students from the 2017 cohort graduated within three years.
To close the gap between white and Black students in 2017, community colleges would have needed to graduate 614 additional Black students.
For more about graduation rates, visit the TBR Research Library.

Fall 2020 Enrollment at TCATsEquity Gaps Persist in Graduation Rates
*Graduation rates include degrees and technical certificates earned at any TBR community college.
One third (32%) of white students in the 2017 cohort had ACT scores below 19. By 2020, 17% of these students graduated.
Nearly three-quarters (71%) of Black students in the 2017 cohort had ACT scores below 19. By 2020, 9% of these students graduated.
24%
34%30%
27%
17%12%
41%
29%
9%
17%12% 11% 9% 6%
28%
11%0%
10%
20%
30%
40%
Three-Year Graduation Rate for the 2017 Cohort
White Students Black and African American Students
Pell Not Pell Recent HS Adult ACT HS GPA HS GPA All 2017 Grad (25+) <19 <3.0 3.0+ Cohort
2017 FTFT Cohort

Fall 2020 Enrollment at TCATsGraduation Rates by Academic Preparation
*Graduation rates include degrees and technical certificates earned at any TBR community college.
4% 6% 8% 9%14%
18%22%
26%30%
34%39% 40% 41%
46%49% 49%
<= 12 13 14 15 16 17 18 19 20 21 22 23 24 25 26 >= 27
ACT Composite Score
Three-Year Graduation Rate for the 2017 CohortBy ACT Score
4%11%
39%
Below 2.0 2.0-3.0 3.0 or Above
High School GPA
By High School GPA
Med
ian
ACT

Fall 2020 Enrollment at TCATsEarly Indicators of Success Rates Early indicators suggested that graduation rates increases might plateau with the 2017 cohort:
*Data for gateway course completion includes first-time-ever-in-college students. The 2019 cohort does not yet include courses completed in summer 2020. First-year retention rates reflect the number of students in the first-time, full-time freshmen cohort who returned the next fall or earned a certificate or degree anytime during the first year. Data for the 2019 cohort is preliminary and based on census enrollment for fall 2020.
0%
15%
30%
45%
60%
'11 '12 '13 '14 '15 '16 '17 '18 '19*
Cohort
Completed Gateway Math in First Year
0%
15%
30%
45%
60%
'11 '12 '13 '14 '15 '16 '17 '18 '19*
Cohort
Completed Gateway English in First Year
0%
15%
30%
45%
60%
'11 '12 '13 '14 '15 '16 '17 '18 '19*
Cohort
Returned for Second Year
Gateway math completion declined 3 pointsfrom 2016 to 2017.
Gateway English completion declined 1.3 pointsfrom 2016 to 2017.
First-year retention ratesdeclined 3 pointsfrom 2016 to 2017.

Fall 2020 Enrollment at TCATsGraduation Rates Beyond Three Years
*The cumulative graduation rate reflects the cumulative number of students in a cohort who earned a technical certificate or degree from any TBR community in each semester, beginning with the student’s first semester of enrollment as a first-time, full-time freshman.
16%
25%29% 30% 31%
30%29%
26%25%
0%
5%
10%
15%
20%
25%
30%
35%
1 2 3 4 5 6 7 8 9 10 11 12 13 14 15 16 17 18 19 20 21 22 23 24 25 26 27 28 29 30
Cum
ulat
ive
Gra
duat
ion
Rate
Number of Semesters Since First Enrollment
2018
2017
2016
2015
2014
2013
2012
2011
2010
2009

Fall 2020 Enrollment at TCATsUnpacking Student Success: Tennessee Promise Students
22%
23%
23%
2015 Cohort 2016 Cohort 2017 Cohort
Tennessee Promise Students Within five semesters of initial enrollment, 49% of students who enrolled in 2017 within a year of high school graduation:
• earned a credential,
• transferred, or
• were still enrolled at a community college.
Among Promise students who enrolled in 2017, 51% had succeeded in 5 semesters.
For more about Tennessee Promise students’ success, visit the TBR
Research Library.
14%
18%
20%
21%
0%
10%
20%
30%
40%
50%
60%
2014 Cohort 2015 Cohort 2016 Cohort 2017 Cohort
Still Enrolled Transferred Graduated
Success after Five SemestersAll Recent High School Graduates
50% 49% 49% 52% 52% 51%49%
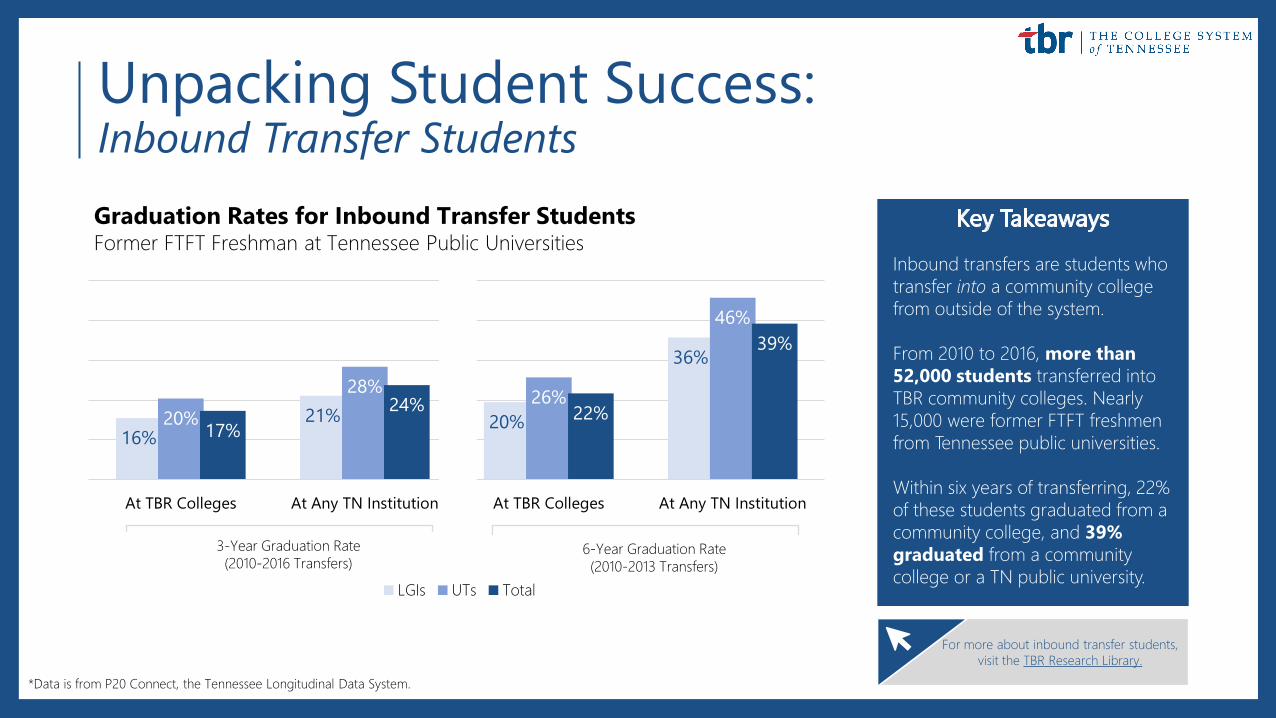
Fall 2020 Enrollment at TCATsUnpacking Student Success: Inbound Transfer Students
*Data is from P20 Connect, the Tennessee Longitudinal Data System.
For more about inbound transfer students, visit the TBR Research Library.
16%21% 20%
36%
20%28% 26%
46%
17%24% 22%
39%
At TBR Colleges At Any TN Institution At TBR Colleges At Any TN Institution
LGIs UTs Total
Graduation Rates for Inbound Transfer Students Former FTFT Freshman at Tennessee Public Universities
6-Year Graduation Rate (2010-2013 Transfers)
3-Year Graduation Rate (2010-2016 Transfers)
Inbound transfers are students who transfer into a community college from outside of the system.
From 2010 to 2016, more than 52,000 students transferred into TBR community colleges. Nearly 15,000 were former FTFT freshmen from Tennessee public universities.
Within six years of transferring, 22% of these students graduated from a community college, and 39% graduated from a community college or a TN public university.

What do we know about the causes of student success?
Student Success

Gateway course completion has doubled since 2011.Completion of gateway courses, like college-level math, has improved significantly.
Completion of gateway mathdoubled, from 20% in 2011-12 to 40% in 2019-20. But gaps persist.
*Data for the 2019 first-time-ever-in-college cohort does not yet include summer 2020.
Core
quisi
te R
emed
iatio
n
0%
5%
10%
15%
20%
25%
30%
35%
40%
45%
50%
2011 2012 2013 2014 2015 2016 2017 2018 2019*Pe
rcen
t of S
tude
nts P
assin
g Co
urse
in F
irst Y
ear
First-Time-Ever-in-College Cohort
Success in Gateway Math
White Black Hispanic All
For more about gateway course completion, visit the TBR Research
Library.

Success in online courses lags behind in-person courses.
70%
78%81%
83%
75%
69%
79%
61%
69%
75% 76%
70%
64%
73%
55%
60%
65%
70%
75%
80%
85%
90%
Course Success Rates in Fall 2019
In-Person Courses Campus-Based Online Courses
Black White Hispanic Age 25+ Pell ACT < 19 All
*Course success rates include the percent of students who earned a grade of A, B, C, D, P, or S in the course.
For more about online course success, visit the TBR Research Library.
Many students took online courses prior to 2020. But success rates in online courses were typically lower than success rates forin-person courses.

Students’ life circumstances influence their success.
Results from the Community College Survey of Student Engagement (CCSSE)
For more about this study, visit the TBR Research Library.
According to the 2019 CCSSE at TBR colleges:
of students worked while enrolled.
of students worked more than 20 hours per week.
of students are responsible for the care of dependents.
of students said caring for dependents made them likely or very likely to withdraw from college.
A 2020 TBR/UT study of CCSSE responses found:
• Time spent caring for dependents had a negative effect on the probability of graduation and on students’ grades.
• Long commutes to school had a negative effect on time to graduation.
• Student advising increased the likelihood of graduation and was associated with higher grades.
77%
62%
52%
28%

Student Success: Key Takeaways
• Community colleges set a record, with 15,874 awards earned in 2019-20.
• TCAT students earned 7,124 awards.
What progress have colleges made toward the Drive to 55?
• 25% of students from the 2017 freshman cohort have graduated.
• Equity gaps persist, especially between white and Black students.
How do we measure success? Are those metrics consistent with our mission and the students we serve?
• Online course success rates lag behind success rates for in-person courses.
• Students’ life and personal circumstances play a significant role in their success.
What do we know about the causes of student success?

Ongoing Research
Adult enrollment declined 13% from 2019 to 2020.
Which strategies promote the enrollment, retention, and success of returning adult students?
Support from Lumina Foundation and Ascendium
25% of incoming students graduate within three years.
How do we improve learning support and promote the use of high impact teaching practices?
Support from the Education Commission of the States
Nearly 23,000 students graduated from TBR colleges in 2019-20.
How do community college and TCAT graduates perform in the workforce?
Support from the Heckscher Foundation and partnership with the University of Virginia Nudge4 Lab