2020 annual report - ishares us - blackrock
TRANSCRIPT

2020 Annual Report
iShares Trust
• iShares 0-5 Year High Yield Corporate Bond ETF | SHYG | NYSE Arca
• iShares Broad USD High Yield Corporate Bond ETF | USHY | Cboe BZX
• iShares ESG Advanced High Yield Corporate Bond ETF | HYXF | NASDAQ
• iShares Fallen Angels USD Bond ETF | FALN | NASDAQ
Beginning on January 1, 2021, as permitted by regulations adopted by the Securities and Exchange Commission, paper copies of
each Fund’s shareholder reports will no longer be sent by mail, unless you specifically request paper copies of the reports from your
financial intermediary, such as a broker-dealer or bank. Instead, the reports will be made available on a website, and you will be
notified by mail each time a report is posted and provided with a website link to access the report.
You may elect to receive all future reports in paper free of charge. If you hold accounts through a financial intermediary, you can follow
the instructions included with this disclosure, if applicable, or contact your financial intermediary to request that you continue to
receive paper copies of your shareholder reports. Please note that not all financial intermediaries may offer this service. Your election
to receive reports in paper will apply to all funds held with your financial intermediary.
If you already elected to receive shareholder reports electronically, you will not be affected by this change and you need not take any
action. You may elect to receive electronic delivery of shareholder reports and other communications by contacting your financial
intermediary. Please note that not all financial intermediaries may offer this service.
OCTOBER 31, 2020

Dear Shareholder,
The 12-month reporting period as of October 31, 2020 has been a time of sudden change in globalfinancial markets, as the emergence and spread of the coronavirus (or “COVID-19”) led to a vastdisruption in the global economy and financial markets. Prior to the outbreak of the virus, U.S. equities andbonds both delivered solid returns, despite fears and doubts about the economy that were ultimately laidto rest with unprecedented monetary stimulus and a sluggish yet resolute performance from the U.S.economy. But as the threat from the coronavirus became more apparent throughout February and March2020, countries around the world took economically disruptive countermeasures. Stay-at-home ordersand closures of non-essential businesses became widespread, many workers were laid off, andunemployment claims spiked, causing a global recession and a sharp fall in equity prices.
After markets hit their lowest point of the reporting period in late March 2020, a steady recovery ensued,as businesses began to re-open and governments learned to adapt to life with the virus. Equity pricescontinued to rise throughout the summer, fed by strong fiscal and monetary support and improvingeconomic indicators. Many equity indices neared or surpassed all-time highs in early September 2020before retreating amid concerns about a second wave of infections. In the United States, large-capitalization stocks advanced, outperforming small-capitalization stocks, which declined marginallyduring the reporting period. International equities from developed economies declined, significantlylagging emerging market stocks, which rebounded sharply.
During the market downturn, the performance of different types of fixed-income securities initiallydiverged due to a reduced investor appetite for risk. U.S. Treasuries benefited from the risk-off environ-ment, and posted solid returns, as the 10-year U.S. Treasury yield (which is inversely related to bondprices) touched an all-time low. In the corporate bond market, support from the U.S. Federal Reserve (the“Fed”) assuaged credit concerns and both investment-grade and high-yield bonds recovered to postpositive returns.
The Fed took an accommodative monetary stance in late 2019 to support slowing economic growth. Afterthe coronavirus outbreak, the Fed instituted two emergency interest rate cuts, pushing short-term interestrates close to zero. To stabilize credit markets, the Fed also implemented a new bond-buying program, asdid several other central banks around the world, including the European Central Bank and the Bank ofJapan.
Looking ahead, while coronavirus-related disruptions have clearly hindered worldwide economic growth,we believe that the global expansion is likely to continue as economic activity resumes. Several risksremain, however, including a potential resurgence of the coronavirus amid loosened restrictions, policyfatigue among governments already deep into deficit spending, and structural damage to the financialsystem from lengthy economic interruptions.
Overall, we favor a moderately positive stance toward risk, and in particular toward credit given theextraordinary central bank measures taken in recent months. This support extends beyond investment-grade corporates and into high-yield, leading to attractive opportunities in that end of the market. Webelieve that international diversification and a focus on sustainability can help provide portfolio resilience,and the disruption created by the coronavirus appears to be accelerating the shift toward sustainableinvestments. We remain neutral on equities overall while favoring emerging market stocks and tiltingtoward the quality factor for its resilience.
In this environment, our view is that investors need to think globally, extend their scope across a broadarray of asset classes, and be nimble as market conditions change. We encourage you to talk with yourfinancial advisor and visit iShares.com for further insight about investing in today’s markets.
Sincerely,
Rob KapitoPresident, BlackRock, Inc.
Total Returns as of October 31, 2020
6-Month 12-Month
U.S. large cap equities(S&P 500� Index)
13.29% 9.71%
U.S. small cap equities(Russell 2000� Index)
18.13 (0.14)
International equities(MSCI Europe, Australasia,Far East Index)
8.57 (6.86)
Emerging market equities(MSCI Emerging MarketsIndex)
20.96 8.25
3-month Treasury bills(ICE BofA 3-MonthU.S. Treasury Bill Index)
0.06 0.92
U.S. Treasury securities(ICE BofA 10-YearU.S. Treasury Index)
(1.63) 8.92
U.S. investment grade bonds(Bloomberg BarclaysU.S. Aggregate Bond Index)
1.27 6.19
Tax-exempt municipal bonds(S&P Municipal Bond Index)
4.87 3.55
U.S. high yield bonds(Bloomberg BarclaysU.S. Corporate High Yield 2%Issuer Capped Index)
10.73 3.42
Past performance is no guarantee of future results. Indexperformance is shown for illustrative purposes only. Youcannot invest directly in an index.
The Markets in Review
Rob KapitoPresident, BlackRock, Inc.
2 T H I S P A G E I S N O T P A R T O F Y O U R F U N D R E P O R T
Page
The Markets in Review. . . . . . . . . . . . . . . . . . . . . . . . . . . . . . . . . . . . . . . . . . . . . . . . . . . . . . . . . . . . . . . . . . . . . . . . . . . . . . . . . . . . . . . . . . . . . . . . . . . . . . . . . . . . . . . . . . . . . . . . . . . . . . . . . . . . . . . . . . . . . . . . . . . . . . . 2Market Overview . . . . . . . . . . . . . . . . . . . . . . . . . . . . . . . . . . . . . . . . . . . . . . . . . . . . . . . . . . . . . . . . . . . . . . . . . . . . . . . . . . . . . . . . . . . . . . . . . . . . . . . . . . . . . . . . . . . . . . . . . . . . . . . . . . . . . . . . . . . . . . . . . . . . . . . . . . . . 4Fund Summary . . . . . . . . . . . . . . . . . . . . . . . . . . . . . . . . . . . . . . . . . . . . . . . . . . . . . . . . . . . . . . . . . . . . . . . . . . . . . . . . . . . . . . . . . . . . . . . . . . . . . . . . . . . . . . . . . . . . . . . . . . . . . . . . . . . . . . . . . . . . . . . . . . . . . . . . . . . . . . 5About Fund Performance . . . . . . . . . . . . . . . . . . . . . . . . . . . . . . . . . . . . . . . . . . . . . . . . . . . . . . . . . . . . . . . . . . . . . . . . . . . . . . . . . . . . . . . . . . . . . . . . . . . . . . . . . . . . . . . . . . . . . . . . . . . . . . . . . . . . . . . . . . . . . . . . . . . . 13Shareholder Expenses. . . . . . . . . . . . . . . . . . . . . . . . . . . . . . . . . . . . . . . . . . . . . . . . . . . . . . . . . . . . . . . . . . . . . . . . . . . . . . . . . . . . . . . . . . . . . . . . . . . . . . . . . . . . . . . . . . . . . . . . . . . . . . . . . . . . . . . . . . . . . . . . . . . . . . . 13Schedules of Investments . . . . . . . . . . . . . . . . . . . . . . . . . . . . . . . . . . . . . . . . . . . . . . . . . . . . . . . . . . . . . . . . . . . . . . . . . . . . . . . . . . . . . . . . . . . . . . . . . . . . . . . . . . . . . . . . . . . . . . . . . . . . . . . . . . . . . . . . . . . . . . . . . . . . 14Financial Statements
Statements of Assets and Liabilities. . . . . . . . . . . . . . . . . . . . . . . . . . . . . . . . . . . . . . . . . . . . . . . . . . . . . . . . . . . . . . . . . . . . . . . . . . . . . . . . . . . . . . . . . . . . . . . . . . . . . . . . . . . . . . . . . . . . . . . . . . . . . . . . . . . . . . . . 68Statements of Operations . . . . . . . . . . . . . . . . . . . . . . . . . . . . . . . . . . . . . . . . . . . . . . . . . . . . . . . . . . . . . . . . . . . . . . . . . . . . . . . . . . . . . . . . . . . . . . . . . . . . . . . . . . . . . . . . . . . . . . . . . . . . . . . . . . . . . . . . . . . . . . . . . 69Statements of Changes in Net Assets . . . . . . . . . . . . . . . . . . . . . . . . . . . . . . . . . . . . . . . . . . . . . . . . . . . . . . . . . . . . . . . . . . . . . . . . . . . . . . . . . . . . . . . . . . . . . . . . . . . . . . . . . . . . . . . . . . . . . . . . . . . . . . . . . . . . . . 70
Financial Highlights . . . . . . . . . . . . . . . . . . . . . . . . . . . . . . . . . . . . . . . . . . . . . . . . . . . . . . . . . . . . . . . . . . . . . . . . . . . . . . . . . . . . . . . . . . . . . . . . . . . . . . . . . . . . . . . . . . . . . . . . . . . . . . . . . . . . . . . . . . . . . . . . . . . . . . . . . . 72Notes to Financial Statements. . . . . . . . . . . . . . . . . . . . . . . . . . . . . . . . . . . . . . . . . . . . . . . . . . . . . . . . . . . . . . . . . . . . . . . . . . . . . . . . . . . . . . . . . . . . . . . . . . . . . . . . . . . . . . . . . . . . . . . . . . . . . . . . . . . . . . . . . . . . . . . . 76Report of Independent Registered Public Accounting Firm . . . . . . . . . . . . . . . . . . . . . . . . . . . . . . . . . . . . . . . . . . . . . . . . . . . . . . . . . . . . . . . . . . . . . . . . . . . . . . . . . . . . . . . . . . . . . . . . . . . . . . . . . . . . . . . . . . . . . 86Important Tax Information (Unaudited) . . . . . . . . . . . . . . . . . . . . . . . . . . . . . . . . . . . . . . . . . . . . . . . . . . . . . . . . . . . . . . . . . . . . . . . . . . . . . . . . . . . . . . . . . . . . . . . . . . . . . . . . . . . . . . . . . . . . . . . . . . . . . . . . . . . . . . . . 87Board Review and Approval of Investment Advisory Contract . . . . . . . . . . . . . . . . . . . . . . . . . . . . . . . . . . . . . . . . . . . . . . . . . . . . . . . . . . . . . . . . . . . . . . . . . . . . . . . . . . . . . . . . . . . . . . . . . . . . . . . . . . . . . . . . . . 88Supplemental Information . . . . . . . . . . . . . . . . . . . . . . . . . . . . . . . . . . . . . . . . . . . . . . . . . . . . . . . . . . . . . . . . . . . . . . . . . . . . . . . . . . . . . . . . . . . . . . . . . . . . . . . . . . . . . . . . . . . . . . . . . . . . . . . . . . . . . . . . . . . . . . . . . . . . 92Trustee and Officer Information. . . . . . . . . . . . . . . . . . . . . . . . . . . . . . . . . . . . . . . . . . . . . . . . . . . . . . . . . . . . . . . . . . . . . . . . . . . . . . . . . . . . . . . . . . . . . . . . . . . . . . . . . . . . . . . . . . . . . . . . . . . . . . . . . . . . . . . . . . . . . . . 93General Information . . . . . . . . . . . . . . . . . . . . . . . . . . . . . . . . . . . . . . . . . . . . . . . . . . . . . . . . . . . . . . . . . . . . . . . . . . . . . . . . . . . . . . . . . . . . . . . . . . . . . . . . . . . . . . . . . . . . . . . . . . . . . . . . . . . . . . . . . . . . . . . . . . . . . . . . . 95Glossary of Terms Used in this Report . . . . . . . . . . . . . . . . . . . . . . . . . . . . . . . . . . . . . . . . . . . . . . . . . . . . . . . . . . . . . . . . . . . . . . . . . . . . . . . . . . . . . . . . . . . . . . . . . . . . . . . . . . . . . . . . . . . . . . . . . . . . . . . . . . . . . . . . 96
Table of Contents
iShares Trust
U.S. Bond Market Overview
The U.S. bond market advanced for the 12 months ended October 31, 2020 (“reporting period”). The Bloomberg Barclays U.S. Aggregate Bond Index, a broad measureof U.S. fixed-income performance, returned 6.19%.
U.S. economic growth was unusually volatile during the reporting period, reflecting the sudden economic impact of the coronavirus pandemic and the subsequent recovery.Growth was negative in the first two quarters of 2020, with annualized contractions of -5.0% and -31.4%, respectively, as the U.S. officially entered recession for the firsttime since the 2008 financial crisis. The latter figure represented the largest quarterly economic contraction on record, as efforts to contain the virus through restrictions ontravel and business led to widespread disruption of the U.S. economy.
Despite the continued presence of the coronavirus in the U.S., businesses and consumers adapted to the new conditions, and many states began to loosen restrictions onactivity beginning May 2020. The U.S. economy rapidly rebalanced toward remote economic activity; working and shopping from home flourished, while traditional,in-person economic activity at malls, hotels, and restaurants remained subdued. Along with a significant series of fiscal stimulus measures, easing restrictions led to a largeincrease in consumer spending as many commercial activities resumed, and government payments to individuals boosted household incomes. Consequently, the economybegan to show signs of recovery, growing at an annualized rate of 33.1% in the third quarter of 2020.
In response to the pandemic and subsequent economic downturn, the U.S. Federal Reserve (“Fed”) enacted two emergency decreases to short-term interest rates in March2020, setting them near zero for only the second time in history. The Fed further acted to stabilize bond markets by implementing an unlimited, open-ended, bond buyingprogram for U.S. Treasuries and mortgage-backed securities. The Fed later widened its program by directly purchasing corporate bonds for the first time, includinghigh-yield bonds. In August 2020, the Fed revised its long-standing inflation policy, allowing it to exceed its 2% target in order to stimulate the economy.
The pandemic-related volatility in the U.S. economy was reflected in bond yields (which are inversely related to prices). U.S. Treasury yields declined significantly beginninglate February 2020, as uncertainty drove investors toward the most highly rated segment of the bond market, driving the yields on the two-, 10-, and 30-year U.S. Treasuriesto record lows. Short-term U.S. Treasury yields declined more than long-term U.S. Treasuries, as the Fed committed to keeping interest rates near zero until at least 2023.However, returns for long-term U.S. Treasuries, which are more sensitive to interest rate changes, significantly exceeded returns from short-term U.S. Treasuries.
Corporate bond prices were also significantly impacted by the economic disruption. In February and March 2020, investors became concerned that sudden changes inconsumer behavior could lead to a sharp increase in bankruptcies, which drove a significant increase in corporate bond yields. Consequently, prices of corporate bondsdeclined sharply, particularly lower-rated, high-yield bonds, which are considered to have a greater probability of default. However, Fed actions to support the corporatebond market and signs that defaults could be lower than anticipated drove a recovery in corporate bond prices, beginning in late March 2020.
Securitized bonds also advanced, particularly commercial mortgage backed securities (“CMBS”). Despite significant disruption to the commercial property market, CMBSshowed resiliency later in the reporting period, and delinquencies declined after reaching an all-time high in June 2020.
Market Overview
4 2 0 2 0 I S H A R E S A N N U A L R E P O R T T O S H A R E H O L D E R S
Investment Objective
The iShares 0-5 Year High Yield Corporate Bond ETF (the “Fund”) seeks to track the investment results of an index composed of U.S. dollar-denominated, high yieldcorporate bonds with remaining maturities of less than five years, as represented by the Markit iBoxx� USD Liquid High Yield 0-5 Index (the "Index"). The Fund invests ina representative sample of securities included in the Index that collectively has an investment profile similar to the Index. Due to the use of representative sampling, the Fundmay or may not hold all of the securities that are included in the Index.
Performance
Average Annual Total Returns Cumulative Total Returns
1 Year 5 YearsSince
Inception 1 Year 5 YearsSince
Inception
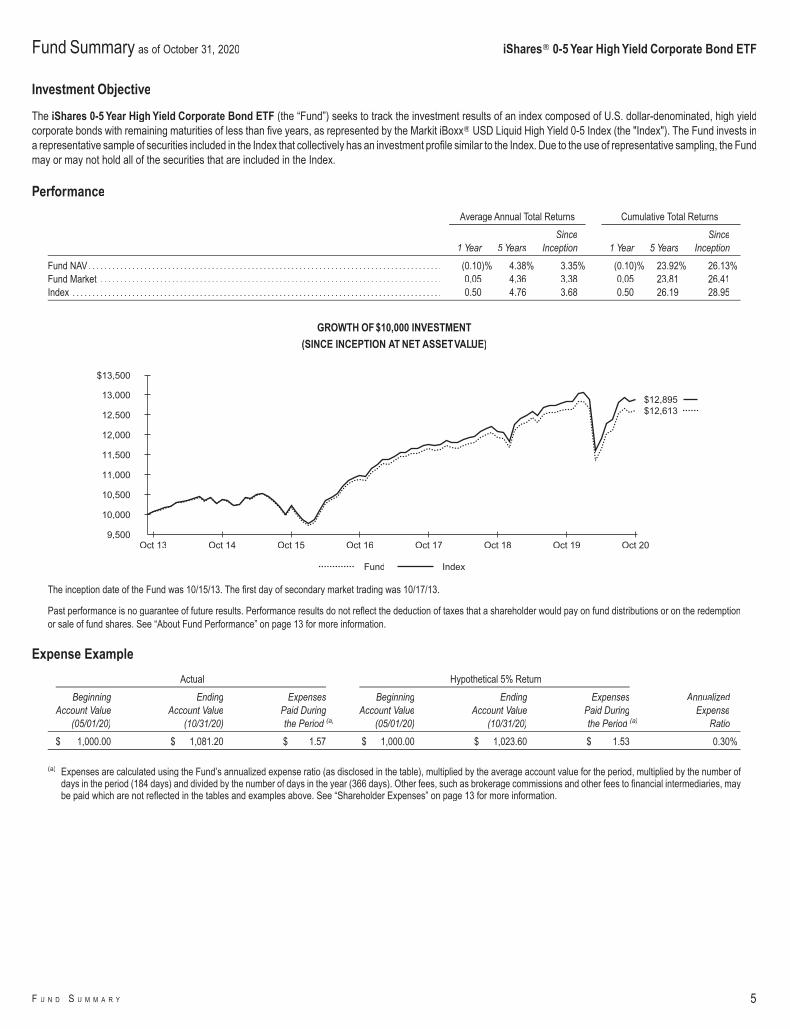
Fund NAV. . . . . . . . . . . . . . . . . . . . . . . . . . . . . . . . . . . . . . . . . . . . . . . . . . . . . . . . . . . . . . . . . . . . . . . . . . . . . . . . . . . . . . . . . (0.10)% 4.38% 3.35% (0.10)% 23.92% 26.13%Fund Market . . . . . . . . . . . . . . . . . . . . . . . . . . . . . . . . . . . . . . . . . . . . . . . . . . . . . . . . . . . . . . . . . . . . . . . . . . . . . . . . . . . . . . 0.05 4.36 3.38 0.05 23.81 26.41Index . . . . . . . . . . . . . . . . . . . . . . . . . . . . . . . . . . . . . . . . . . . . . . . . . . . . . . . . . . . . . . . . . . . . . . . . . . . . . . . . . . . . . . . . . . . . . 0.50 4.76 3.68 0.50 26.19 28.95
GROWTH OF $10,000 INVESTMENT
(SINCE INCEPTION AT NET ASSETVALUE)
$12,613$12,895
9,500
10,000
10,500
11,000
11,500
12,000
12,500
13,000
$13,500
Oct 20Oct 19Oct 18Oct 17Oct 16Oct 15Oct 14Oct 13
Fund Index
The inception date of the Fund was 10/15/13. The first day of secondary market trading was 10/17/13.
Past performance is no guarantee of future results. Performance results do not reflect the deduction of taxes that a shareholder would pay on fund distributions or on the redemptionor sale of fund shares. See “About Fund Performance” on page 13 for more information.
Expense Example
Actual Hypothetical 5% Return
BeginningAccount Value
(05/01/20)
EndingAccount Value
(10/31/20)
ExpensesPaid Duringthe Period (a)
BeginningAccount Value
(05/01/20)
EndingAccount Value
(10/31/20)
ExpensesPaid Duringthe Period (a)
AnnualizedExpense
Ratio
$ 1,000.00 $ 1,081.20 $ 1.57 $ 1,000.00 $ 1,023.60 $ 1.53 0.30%
(a) Expenses are calculated using the Fund’s annualized expense ratio (as disclosed in the table), multiplied by the average account value for the period, multiplied by the number ofdays in the period (184 days) and divided by the number of days in the year (366 days). Other fees, such as brokerage commissions and other fees to financial intermediaries, maybe paid which are not reflected in the tables and examples above. See “Shareholder Expenses” on page 13 for more information.
Fund Summary as of October 31, 2020 iShares� 0-5 Year High Yield Corporate Bond ETF
F U N D S U M M A R Y 5

Portfolio Management Commentary
Short-term high-yield corporate bonds ended the reporting period with flat returns amid the Fed’s significant monetary stimulus measures to counter the coronavirusrecession. Ultra-low yields in most of the bond market drove income-seeking investors to buy more high-yield corporate bonds. The Fed’s announcement of limited directpurchases of some high-yield corporate bonds also strengthened demand. On the supply side, companies issued record amounts of high-yield bonds to compensate forlower revenues during the pandemic.
High-yield credit spreads, the difference in yield between high-yield bonds and U.S. Treasuries, rose slightly during the reporting period amid high market volatility. In early2020, credit spreads increased to the highest levels since the 2008 financial crisis as the economic uncertainty of the pandemic led investors to sell other assets to raisecash. High-yield spreads declined notably as the Fed’s interest rate reductions and bond purchases restored liquidity to the market, but these spreads remained abovepre-pandemic levels.
Credit rating agencies downgraded significant amounts of investment-grade debt, and these “fallen angels” increased the supply of higher-rated debt in the high-yieldmarket. On the other hand, default potential increased amid the pandemic, especially in heavily affected industries, such as restaurants, airlines, and some parts of theenergy sector. In this environment, short-term bonds rated Ba contributed to the Index’s return, while other high-yield short-term bonds detracted.
High-yield corporate bonds issued by companies in the consumer non-cyclicals industry contributed the most to the Index's performance, due in part to the lowervulnerability of healthcare companies to the pandemic’s economic disruptions. The consumer cyclicals industry also contributed, as Fed purchases helped automotivebonds. On the downside, high-yield bonds of energy companies detracted from the Index’s return amid rising defaults and bankruptcies in the oil industry.
Portfolio Information
ALLOCATION BY CREDIT QUALITY
Moody's Credit Rating*
Percent ofTotal Investments(a)
Baa . . . . . . . . . . . . . . . . . . . . . . . . . . . . . . . . . . . . . . . . . . . . . . . . . . . . . . . . 1.4%Ba . . . . . . . . . . . . . . . . . . . . . . . . . . . . . . . . . . . . . . . . . . . . . . . . . . . . . . . . . 47.2B . . . . . . . . . . . . . . . . . . . . . . . . . . . . . . . . . . . . . . . . . . . . . . . . . . . . . . . . . . 36.0Caa . . . . . . . . . . . . . . . . . . . . . . . . . . . . . . . . . . . . . . . . . . . . . . . . . . . . . . . . 13.2Ca . . . . . . . . . . . . . . . . . . . . . . . . . . . . . . . . . . . . . . . . . . . . . . . . . . . . . . . . . 0.5Not Rated . . . . . . . . . . . . . . . . . . . . . . . . . . . . . . . . . . . . . . . . . . . . . . . . . . 1.7
ALLOCATION BY MATURITY
MaturityPercent of
Total Investments(a)
0-1 Year. . . . . . . . . . . . . . . . . . . . . . . . . . . . . . . . . . . . . . . . . . . . . . . . . . . . 4.1%1-2 Years. . . . . . . . . . . . . . . . . . . . . . . . . . . . . . . . . . . . . . . . . . . . . . . . . . . 10.32-3 Years. . . . . . . . . . . . . . . . . . . . . . . . . . . . . . . . . . . . . . . . . . . . . . . . . . . 19.03-4 Years. . . . . . . . . . . . . . . . . . . . . . . . . . . . . . . . . . . . . . . . . . . . . . . . . . . 24.14-5 Years. . . . . . . . . . . . . . . . . . . . . . . . . . . . . . . . . . . . . . . . . . . . . . . . . . . 41.75-6 Years. . . . . . . . . . . . . . . . . . . . . . . . . . . . . . . . . . . . . . . . . . . . . . . . . . . 0.56-7 Years. . . . . . . . . . . . . . . . . . . . . . . . . . . . . . . . . . . . . . . . . . . . . . . . . . . 0.27-8 Years. . . . . . . . . . . . . . . . . . . . . . . . . . . . . . . . . . . . . . . . . . . . . . . . . . . 0.1
* Credit quality ratings shown reflect the ratings assigned by Moody’s Investors Service (“Moody’s”), a widely used independent, nationally recognized statistical rating organization.Moody’s credit ratings are opinions of the credit quality of individual obligations or of an issuer’s general creditworthiness. Investment grade ratings are credit ratings of Baa or higher.Below investment grade ratings are credit ratings of Ba or lower. Unrated investments do not necessarily indicate low credit quality. Credit quality ratings are subject to change.
(a) Excludes money market funds.
Fund Summary as of October 31, 2020 (continued) iShares� 0-5 Year High Yield Corporate Bond ETF
6 2 0 2 0 I S H A R E S A N N U A L R E P O R T T O S H A R E H O L D E R S
Investment Objective
The iShares Broad USD HighYield Corporate Bond ETF (the “Fund”) seeks to track the investment results of an index composed of U.S. dollar-denominated, high yieldcorporate bonds, as represented by the ICE BofA U.S. High Yield Constrained Index (the "Index"). The Fund invests in a representative sample of securities included in theIndex that collectively has an investment profile similar to the Index. Due to the use of representative sampling, the Fund may or may not hold all of the securities that areincluded in the Index.
Performance
Average Annual Total Returns Cumulative Total Returns
1 YearSince
Inception 1 YearSince
Inception
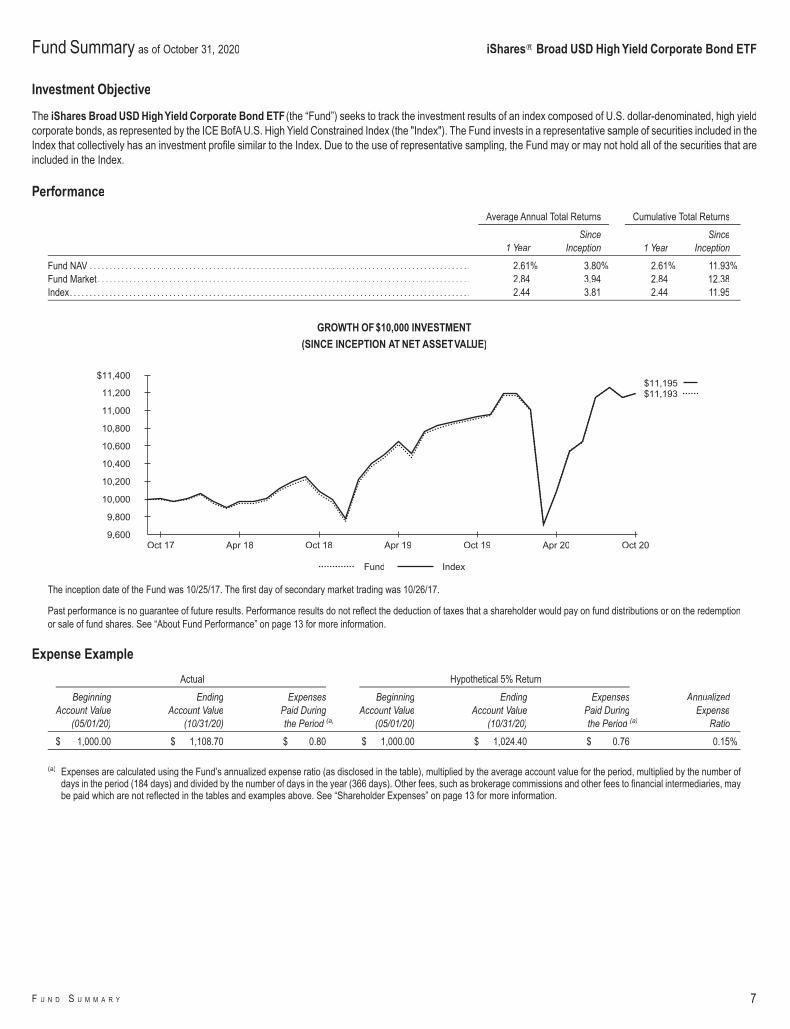
Fund NAV . . . . . . . . . . . . . . . . . . . . . . . . . . . . . . . . . . . . . . . . . . . . . . . . . . . . . . . . . . . . . . . . . . . . . . . . . . . . . . . . . . . . . . . . . . . . . . . . 2.61% 3.80% 2.61% 11.93%Fund Market . . . . . . . . . . . . . . . . . . . . . . . . . . . . . . . . . . . . . . . . . . . . . . . . . . . . . . . . . . . . . . . . . . . . . . . . . . . . . . . . . . . . . . . . . . . . . . 2.84 3.94 2.84 12.38Index. . . . . . . . . . . . . . . . . . . . . . . . . . . . . . . . . . . . . . . . . . . . . . . . . . . . . . . . . . . . . . . . . . . . . . . . . . . . . . . . . . . . . . . . . . . . . . . . . . . . . 2.44 3.81 2.44 11.95
GROWTH OF $10,000 INVESTMENT
(SINCE INCEPTION AT NET ASSETVALUE)
$11,193$11,195
9,600
9,800
10,000
10,200
10,400
10,600
10,800
11,000
11,200
$11,400
Oct 20Apr 20Oct 19Apr 19Oct 18Apr 18Oct 17
Fund Index
The inception date of the Fund was 10/25/17. The first day of secondary market trading was 10/26/17.
Past performance is no guarantee of future results. Performance results do not reflect the deduction of taxes that a shareholder would pay on fund distributions or on the redemptionor sale of fund shares. See “About Fund Performance” on page 13 for more information.
Expense Example
Actual Hypothetical 5% Return
BeginningAccount Value
(05/01/20)
EndingAccount Value
(10/31/20)
ExpensesPaid Duringthe Period (a)
BeginningAccount Value
(05/01/20)
EndingAccount Value
(10/31/20)
ExpensesPaid Duringthe Period (a)
AnnualizedExpense
Ratio
$ 1,000.00 $ 1,108.70 $ 0.80 $ 1,000.00 $ 1,024.40 $ 0.76 0.15%
(a) Expenses are calculated using the Fund’s annualized expense ratio (as disclosed in the table), multiplied by the average account value for the period, multiplied by the number ofdays in the period (184 days) and divided by the number of days in the year (366 days). Other fees, such as brokerage commissions and other fees to financial intermediaries, maybe paid which are not reflected in the tables and examples above. See “Shareholder Expenses” on page 13 for more information.
Fund Summary as of October 31, 2020 iShares� Broad USD High Yield Corporate Bond ETF
F U N D S U M M A R Y 7

Portfolio Management Commentary
High-yield corporate bonds advanced modestly during the reporting period amid the Fed’s significant monetary stimulus measures to counter the coronavirus recession.Ultra-low yields in most of the bond market drove income-seeking investors to buy more high-yield corporate bonds. The Fed's announcement of limited direct purchasesof some high-yield corporate bonds also strengthened demand. On the supply side, companies issued record amounts of high-yield bonds to compensate for lowerrevenues during the pandemic.
High-yield credit spreads, the difference in yield between high-yield bonds and U.S. Treasuries, rose slightly during the reporting period amid high market volatility. In early2020, credit spreads increased to the highest levels since the 2008 financial crisis, as the economic uncertainty of the pandemic led investors to sell other assets to raisecash. High-yield spreads declined notably as the Fed's interest rate reductions and bond purchases restored liquidity to the market, but remained above pre-pandemiclevels.
Credit rating agencies downgraded significant amounts of investment-grade debt, and these "fallen angels" increased the supply of higher-rated debt in the high-yieldmarket. On the other hand, default potential increased during the pandemic, especially in heavily affected industries such as restaurants, airlines, and some parts of theenergy sector. In this environment, high-yield bonds with higher credit ratings contributed to the Index's return, while those with lower ratings detracted.
High-yield corporate bonds issued by companies in the consumer non-cyclicals industry contributed the most to the Index's performance, due in part to the lowervulnerability of healthcare companies to the pandemic’s economic disruptions. The consumer cyclicals industry also contributed, as Fed purchases helped automotivebonds. On the downside, high-yield bonds of energy companies detracted from the Index's return amid rising defaults and bankruptcies in the oil industry.
Portfolio Information
ALLOCATION BY CREDIT QUALITY
Moody's Credit Rating*
Percent ofTotal Investments(a)
Baa . . . . . . . . . . . . . . . . . . . . . . . . . . . . . . . . . . . . . . . . . . . . . . . . . . . . . . . . 3.5%Ba . . . . . . . . . . . . . . . . . . . . . . . . . . . . . . . . . . . . . . . . . . . . . . . . . . . . . . . . . 46.0B . . . . . . . . . . . . . . . . . . . . . . . . . . . . . . . . . . . . . . . . . . . . . . . . . . . . . . . . . . 37.1Caa . . . . . . . . . . . . . . . . . . . . . . . . . . . . . . . . . . . . . . . . . . . . . . . . . . . . . . . . 11.7Ca . . . . . . . . . . . . . . . . . . . . . . . . . . . . . . . . . . . . . . . . . . . . . . . . . . . . . . . . . 0.4C . . . . . . . . . . . . . . . . . . . . . . . . . . . . . . . . . . . . . . . . . . . . . . . . . . . . . . . . . . 0.1Not Rated . . . . . . . . . . . . . . . . . . . . . . . . . . . . . . . . . . . . . . . . . . . . . . . . . . 1.2
ALLOCATION BY MATURITY
MaturityPercent of
Total Investments(a)
0-1 Year. . . . . . . . . . . . . . . . . . . . . . . . . . . . . . . . . . . . . . . . . . . . . . . . . . . . 0.1%1-5 Years. . . . . . . . . . . . . . . . . . . . . . . . . . . . . . . . . . . . . . . . . . . . . . . . . . . 39.45-10 Years . . . . . . . . . . . . . . . . . . . . . . . . . . . . . . . . . . . . . . . . . . . . . . . . . 51.710-15 Years . . . . . . . . . . . . . . . . . . . . . . . . . . . . . . . . . . . . . . . . . . . . . . . . 3.915-20 Years . . . . . . . . . . . . . . . . . . . . . . . . . . . . . . . . . . . . . . . . . . . . . . . . 1.9More than 20 Years . . . . . . . . . . . . . . . . . . . . . . . . . . . . . . . . . . . . . . . . . 3.0
* Credit quality ratings shown reflect the ratings assigned by Moody’s Investors Service (“Moody’s”), a widely used independent, nationally recognized statistical rating organization.Moody’s credit ratings are opinions of the credit quality of individual obligations or of an issuer’s general creditworthiness. Investment grade ratings are credit ratings of Baa or higher.Below investment grade ratings are credit ratings of Ba or lower. Unrated investments do not necessarily indicate low credit quality. Credit quality ratings are subject to change.
(a) Excludes money market funds.
Fund Summary as of October 31, 2020 (continued) iShares� Broad USD High Yield Corporate Bond ETF
8 2 0 2 0 I S H A R E S A N N U A L R E P O R T T O S H A R E H O L D E R S
Investment Objective
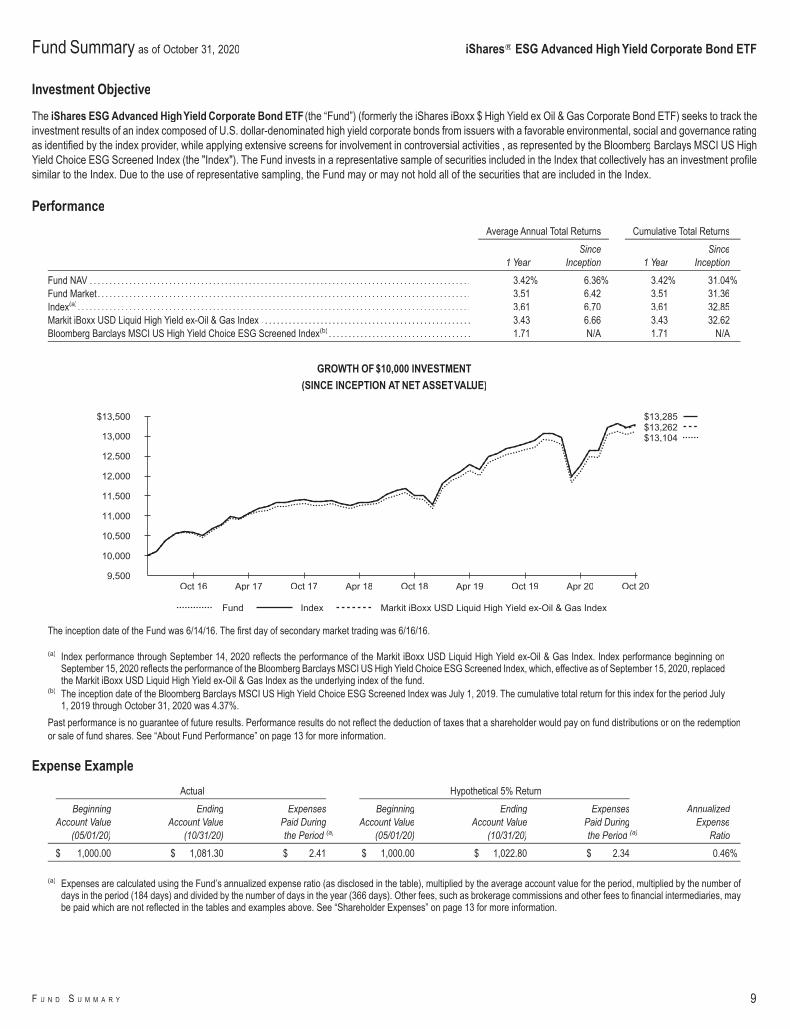
The iShares ESG Advanced HighYield Corporate Bond ETF (the “Fund”) (formerly the iShares iBoxx $ High Yield ex Oil & Gas Corporate Bond ETF) seeks to track theinvestment results of an index composed of U.S. dollar-denominated high yield corporate bonds from issuers with a favorable environmental, social and governance ratingas identified by the index provider, while applying extensive screens for involvement in controversial activities , as represented by the Bloomberg Barclays MSCI US HighYield Choice ESG Screened Index (the "Index"). The Fund invests in a representative sample of securities included in the Index that collectively has an investment profilesimilar to the Index. Due to the use of representative sampling, the Fund may or may not hold all of the securities that are included in the Index.
Performance
Average Annual Total Returns Cumulative Total Returns
1 YearSince
Inception 1 YearSince
Inception
Fund NAV . . . . . . . . . . . . . . . . . . . . . . . . . . . . . . . . . . . . . . . . . . . . . . . . . . . . . . . . . . . . . . . . . . . . . . . . . . . . . . . . . . . . . . . . . . . . . . . . 3.42% 6.36% 3.42% 31.04%Fund Market . . . . . . . . . . . . . . . . . . . . . . . . . . . . . . . . . . . . . . . . . . . . . . . . . . . . . . . . . . . . . . . . . . . . . . . . . . . . . . . . . . . . . . . . . . . . . . 3.51 6.42 3.51 31.36Index(a). . . . . . . . . . . . . . . . . . . . . . . . . . . . . . . . . . . . . . . . . . . . . . . . . . . . . . . . . . . . . . . . . . . . . . . . . . . . . . . . . . . . . . . . . . . . . . . . . . . 3.61 6.70 3.61 32.85Markit iBoxx USD Liquid High Yield ex-Oil & Gas Index . . . . . . . . . . . . . . . . . . . . . . . . . . . . . . . . . . . . . . . . . . . . . . . . . . . . . 3.43 6.66 3.43 32.62Bloomberg Barclays MSCI US High Yield Choice ESG Screened Index(b) . . . . . . . . . . . . . . . . . . . . . . . . . . . . . . . . . . . . 1.71 N/A 1.71 N/A
GROWTH OF $10,000 INVESTMENT
(SINCE INCEPTION AT NET ASSETVALUE)
$13,104$13,262$13,285
9,500
10,000
10,500
11,000
11,500
12,000
12,500
13,000
$13,500
Oct 20Apr 20Oct 19Apr 19Oct 18Apr 18Oct 17Apr 17Oct 16
Fund Index Markit iBoxx USD Liquid High Yield ex-Oil & Gas Index
The inception date of the Fund was 6/14/16. The first day of secondary market trading was 6/16/16.
(a) Index performance through September 14, 2020 reflects the performance of the Markit iBoxx USD Liquid High Yield ex-Oil & Gas Index. Index performance beginning onSeptember 15, 2020 reflects the performance of the Bloomberg Barclays MSCI US High Yield Choice ESG Screened Index, which, effective as of September 15, 2020, replacedthe Markit iBoxx USD Liquid High Yield ex-Oil & Gas Index as the underlying index of the fund.
(b) The inception date of the Bloomberg Barclays MSCI US High Yield Choice ESG Screened Index was July 1, 2019. The cumulative total return for this index for the period July1, 2019 through October 31, 2020 was 4.37%.
Past performance is no guarantee of future results. Performance results do not reflect the deduction of taxes that a shareholder would pay on fund distributions or on the redemptionor sale of fund shares. See “About Fund Performance” on page 13 for more information.
Expense Example
Actual Hypothetical 5% Return
BeginningAccount Value
(05/01/20)
EndingAccount Value
(10/31/20)
ExpensesPaid Duringthe Period (a)
BeginningAccount Value
(05/01/20)
EndingAccount Value
(10/31/20)
ExpensesPaid Duringthe Period (a)
AnnualizedExpense
Ratio
$ 1,000.00 $ 1,081.30 $ 2.41 $ 1,000.00 $ 1,022.80 $ 2.34 0.46%
(a) Expenses are calculated using the Fund’s annualized expense ratio (as disclosed in the table), multiplied by the average account value for the period, multiplied by the number ofdays in the period (184 days) and divided by the number of days in the year (366 days). Other fees, such as brokerage commissions and other fees to financial intermediaries, maybe paid which are not reflected in the tables and examples above. See “Shareholder Expenses” on page 13 for more information.
Fund Summary as of October 31, 2020 iShares� ESG Advanced High Yield Corporate Bond ETF
F U N D S U M M A R Y 9
Portfolio Management Commentary
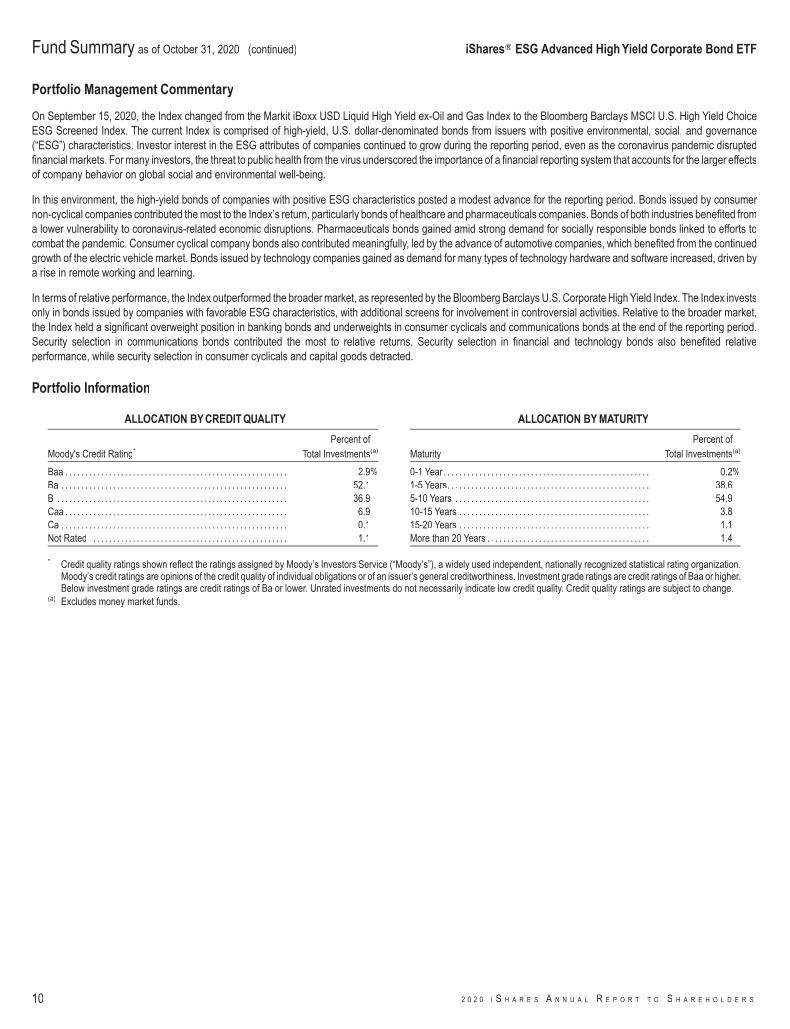
On September 15, 2020, the Index changed from the Markit iBoxx USD Liquid High Yield ex-Oil and Gas Index to the Bloomberg Barclays MSCI U.S. High Yield ChoiceESG Screened Index. The current Index is comprised of high-yield, U.S. dollar-denominated bonds from issuers with positive environmental, social, and governance(“ESG”) characteristics. Investor interest in the ESG attributes of companies continued to grow during the reporting period, even as the coronavirus pandemic disruptedfinancial markets. For many investors, the threat to public health from the virus underscored the importance of a financial reporting system that accounts for the larger effectsof company behavior on global social and environmental well-being.
In this environment, the high-yield bonds of companies with positive ESG characteristics posted a modest advance for the reporting period. Bonds issued by consumernon-cyclical companies contributed the most to the Index’s return, particularly bonds of healthcare and pharmaceuticals companies. Bonds of both industries benefited froma lower vulnerability to coronavirus-related economic disruptions. Pharmaceuticals bonds gained amid strong demand for socially responsible bonds linked to efforts tocombat the pandemic. Consumer cyclical company bonds also contributed meaningfully, led by the advance of automotive companies, which benefited from the continuedgrowth of the electric vehicle market. Bonds issued by technology companies gained as demand for many types of technology hardware and software increased, driven bya rise in remote working and learning.
In terms of relative performance, the Index outperformed the broader market, as represented by the Bloomberg Barclays U.S. Corporate High Yield Index. The Index investsonly in bonds issued by companies with favorable ESG characteristics, with additional screens for involvement in controversial activities. Relative to the broader market,the Index held a significant overweight position in banking bonds and underweights in consumer cyclicals and communications bonds at the end of the reporting period.Security selection in communications bonds contributed the most to relative returns. Security selection in financial and technology bonds also benefited relativeperformance, while security selection in consumer cyclicals and capital goods detracted.
Portfolio Information
ALLOCATION BY CREDIT QUALITY
Moody's Credit Rating*
Percent ofTotal Investments(a)
Baa . . . . . . . . . . . . . . . . . . . . . . . . . . . . . . . . . . . . . . . . . . . . . . . . . . . . . . . . 2.9%Ba . . . . . . . . . . . . . . . . . . . . . . . . . . . . . . . . . . . . . . . . . . . . . . . . . . . . . . . . . 52.1B . . . . . . . . . . . . . . . . . . . . . . . . . . . . . . . . . . . . . . . . . . . . . . . . . . . . . . . . . . 36.9Caa . . . . . . . . . . . . . . . . . . . . . . . . . . . . . . . . . . . . . . . . . . . . . . . . . . . . . . . . 6.9Ca . . . . . . . . . . . . . . . . . . . . . . . . . . . . . . . . . . . . . . . . . . . . . . . . . . . . . . . . . 0.1Not Rated . . . . . . . . . . . . . . . . . . . . . . . . . . . . . . . . . . . . . . . . . . . . . . . . . . 1.1
ALLOCATION BY MATURITY
MaturityPercent of
Total Investments(a)
0-1 Year. . . . . . . . . . . . . . . . . . . . . . . . . . . . . . . . . . . . . . . . . . . . . . . . . . . . 0.2%1-5 Years. . . . . . . . . . . . . . . . . . . . . . . . . . . . . . . . . . . . . . . . . . . . . . . . . . . 38.65-10 Years . . . . . . . . . . . . . . . . . . . . . . . . . . . . . . . . . . . . . . . . . . . . . . . . . 54.910-15 Years . . . . . . . . . . . . . . . . . . . . . . . . . . . . . . . . . . . . . . . . . . . . . . . . 3.815-20 Years . . . . . . . . . . . . . . . . . . . . . . . . . . . . . . . . . . . . . . . . . . . . . . . . 1.1More than 20 Years . . . . . . . . . . . . . . . . . . . . . . . . . . . . . . . . . . . . . . . . . 1.4
* Credit quality ratings shown reflect the ratings assigned by Moody’s Investors Service (“Moody’s”), a widely used independent, nationally recognized statistical rating organization.Moody’s credit ratings are opinions of the credit quality of individual obligations or of an issuer’s general creditworthiness. Investment grade ratings are credit ratings of Baa or higher.Below investment grade ratings are credit ratings of Ba or lower. Unrated investments do not necessarily indicate low credit quality. Credit quality ratings are subject to change.
(a) Excludes money market funds.
Fund Summary as of October 31, 2020 (continued) iShares� ESG Advanced High Yield Corporate Bond ETF
10 2 0 2 0 I S H A R E S A N N U A L R E P O R T T O S H A R E H O L D E R S
Investment Objective
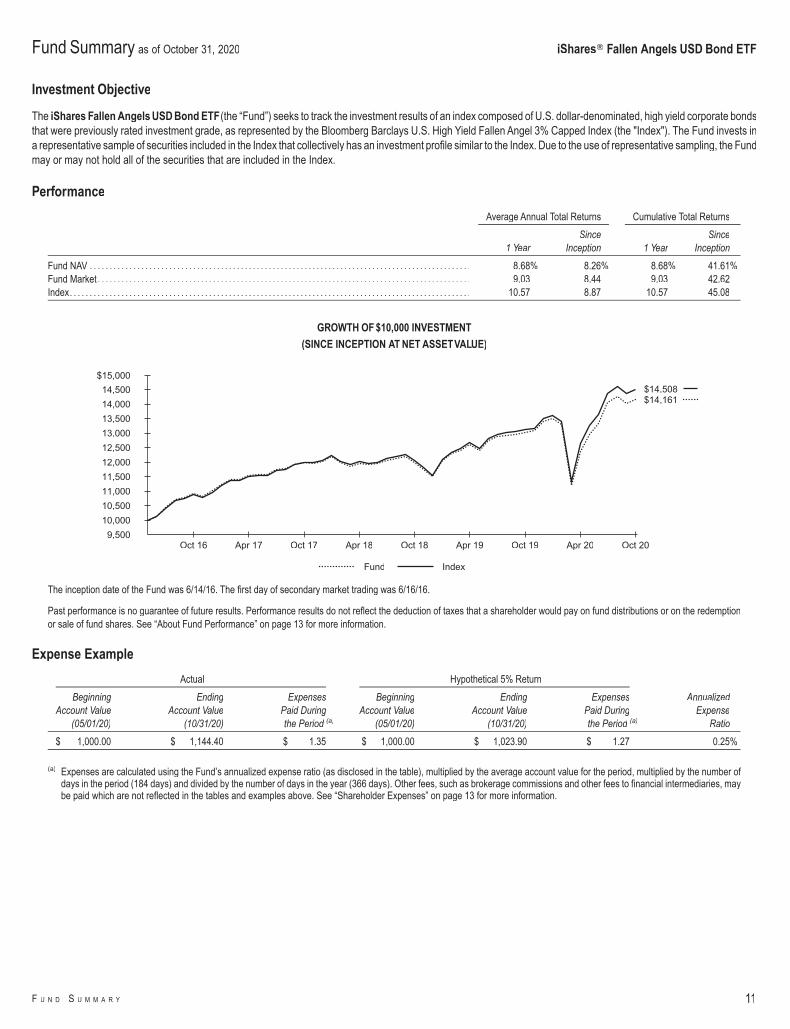
The iShares Fallen Angels USD Bond ETF(the “Fund”) seeks to track the investment results of an index composed of U.S. dollar-denominated, high yield corporate bondsthat were previously rated investment grade, as represented by the Bloomberg Barclays U.S. High Yield Fallen Angel 3% Capped Index (the "Index"). The Fund invests ina representative sample of securities included in the Index that collectively has an investment profile similar to the Index. Due to the use of representative sampling, the Fundmay or may not hold all of the securities that are included in the Index.
Performance
Average Annual Total Returns Cumulative Total Returns
1 YearSince
Inception 1 YearSince
Inception
Fund NAV . . . . . . . . . . . . . . . . . . . . . . . . . . . . . . . . . . . . . . . . . . . . . . . . . . . . . . . . . . . . . . . . . . . . . . . . . . . . . . . . . . . . . . . . . . . . . . . . 8.68% 8.26% 8.68% 41.61%Fund Market . . . . . . . . . . . . . . . . . . . . . . . . . . . . . . . . . . . . . . . . . . . . . . . . . . . . . . . . . . . . . . . . . . . . . . . . . . . . . . . . . . . . . . . . . . . . . . 9.03 8.44 9.03 42.62Index. . . . . . . . . . . . . . . . . . . . . . . . . . . . . . . . . . . . . . . . . . . . . . . . . . . . . . . . . . . . . . . . . . . . . . . . . . . . . . . . . . . . . . . . . . . . . . . . . . . . . 10.57 8.87 10.57 45.08
GROWTH OF $10,000 INVESTMENT
(SINCE INCEPTION AT NET ASSETVALUE)
$14,161$14,508
9,50010,00010,50011,00011,50012,00012,50013,00013,50014,00014,500
$15,000
Oct 20Apr 20Oct 19Apr 19Oct 18Apr 18Oct 17Apr 17Oct 16
Fund Index
The inception date of the Fund was 6/14/16. The first day of secondary market trading was 6/16/16.
Past performance is no guarantee of future results. Performance results do not reflect the deduction of taxes that a shareholder would pay on fund distributions or on the redemptionor sale of fund shares. See “About Fund Performance” on page 13 for more information.
Expense Example
Actual Hypothetical 5% Return
BeginningAccount Value
(05/01/20)
EndingAccount Value
(10/31/20)
ExpensesPaid Duringthe Period (a)
BeginningAccount Value
(05/01/20)
EndingAccount Value
(10/31/20)
ExpensesPaid Duringthe Period (a)
AnnualizedExpense
Ratio
$ 1,000.00 $ 1,144.40 $ 1.35 $ 1,000.00 $ 1,023.90 $ 1.27 0.25%
(a) Expenses are calculated using the Fund’s annualized expense ratio (as disclosed in the table), multiplied by the average account value for the period, multiplied by the number ofdays in the period (184 days) and divided by the number of days in the year (366 days). Other fees, such as brokerage commissions and other fees to financial intermediaries, maybe paid which are not reflected in the tables and examples above. See “Shareholder Expenses” on page 13 for more information.
Fund Summary as of October 31, 2020 iShares� Fallen Angels USD Bond ETF
F U N D S U M M A R Y 11
Portfolio Management Commentary
The high-yield corporate bonds of companies formerly rated as high-quality issuers advanced significantly for the reporting period. Credit rating downgrades early in thecoronavirus pandemic added to the ranks of these "fallen angels," and these bonds benefited from Fed bond purchases to support credit markets.
Despite disruptions, issuance of high-yield bonds rose to record highs beginning in May 2020 amid low interest rates and borrowing costs. Pandemic-related revenuereductions drove the increase in issuance, while low yields on other bonds increased investor interest in high-yield debt.
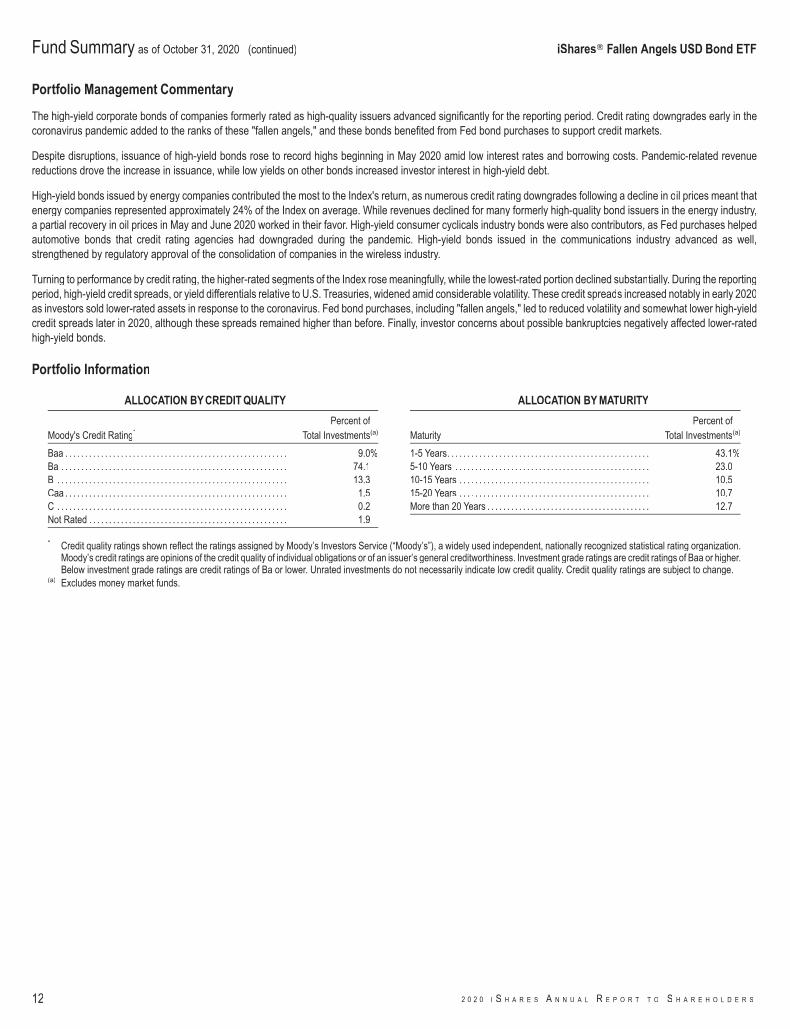
High-yield bonds issued by energy companies contributed the most to the Index's return, as numerous credit rating downgrades following a decline in oil prices meant thatenergy companies represented approximately 24% of the Index on average. While revenues declined for many formerly high-quality bond issuers in the energy industry,a partial recovery in oil prices in May and June 2020 worked in their favor. High-yield consumer cyclicals industry bonds were also contributors, as Fed purchases helpedautomotive bonds that credit rating agencies had downgraded during the pandemic. High-yield bonds issued in the communications industry advanced as well,strengthened by regulatory approval of the consolidation of companies in the wireless industry.
Turning to performance by credit rating, the higher-rated segments of the Index rose meaningfully, while the lowest-rated portion declined substantially. During the reportingperiod, high-yield credit spreads, or yield differentials relative to U.S. Treasuries, widened amid considerable volatility. These credit spreads increased notably in early 2020as investors sold lower-rated assets in response to the coronavirus. Fed bond purchases, including "fallen angels," led to reduced volatility and somewhat lower high-yieldcredit spreads later in 2020, although these spreads remained higher than before. Finally, investor concerns about possible bankruptcies negatively affected lower-ratedhigh-yield bonds.
Portfolio Information
ALLOCATION BY CREDIT QUALITY
Moody's Credit Rating*
Percent ofTotal Investments(a)
Baa . . . . . . . . . . . . . . . . . . . . . . . . . . . . . . . . . . . . . . . . . . . . . . . . . . . . . . . . 9.0%Ba . . . . . . . . . . . . . . . . . . . . . . . . . . . . . . . . . . . . . . . . . . . . . . . . . . . . . . . . . 74.1B . . . . . . . . . . . . . . . . . . . . . . . . . . . . . . . . . . . . . . . . . . . . . . . . . . . . . . . . . . 13.3Caa . . . . . . . . . . . . . . . . . . . . . . . . . . . . . . . . . . . . . . . . . . . . . . . . . . . . . . . . 1.5C . . . . . . . . . . . . . . . . . . . . . . . . . . . . . . . . . . . . . . . . . . . . . . . . . . . . . . . . . . 0.2Not Rated . . . . . . . . . . . . . . . . . . . . . . . . . . . . . . . . . . . . . . . . . . . . . . . . . . 1.9
ALLOCATION BY MATURITY
MaturityPercent of
Total Investments(a)
1-5 Years. . . . . . . . . . . . . . . . . . . . . . . . . . . . . . . . . . . . . . . . . . . . . . . . . . . 43.1%5-10 Years . . . . . . . . . . . . . . . . . . . . . . . . . . . . . . . . . . . . . . . . . . . . . . . . . 23.010-15 Years . . . . . . . . . . . . . . . . . . . . . . . . . . . . . . . . . . . . . . . . . . . . . . . . 10.515-20 Years . . . . . . . . . . . . . . . . . . . . . . . . . . . . . . . . . . . . . . . . . . . . . . . . 10.7More than 20 Years . . . . . . . . . . . . . . . . . . . . . . . . . . . . . . . . . . . . . . . . . 12.7
* Credit quality ratings shown reflect the ratings assigned by Moody’s Investors Service (“Moody’s”), a widely used independent, nationally recognized statistical rating organization.Moody’s credit ratings are opinions of the credit quality of individual obligations or of an issuer’s general creditworthiness. Investment grade ratings are credit ratings of Baa or higher.Below investment grade ratings are credit ratings of Ba or lower. Unrated investments do not necessarily indicate low credit quality. Credit quality ratings are subject to change.
(a) Excludes money market funds.
Fund Summary as of October 31, 2020 (continued) iShares� Fallen Angels USD Bond ETF
12 2 0 2 0 I S H A R E S A N N U A L R E P O R T T O S H A R E H O L D E R S
Past performance is not an indication of future results. Financial markets have experienced extreme volatility and trading in many instruments has been disrupted. Thesecircumstances may continue for an extended period of time and may continue to affect adversely the value and liquidity of the fund's investments. As a result, currentperformance may be lower or higher than the performance data quoted. Performance data current to the most recent month-end is available at iShares.com. Performanceresults assume reinvestment of all dividends and capital gain distributions and do not reflect the deduction of taxes that a shareholder would pay on fund distributions oron the redemption or sale of fund shares. The investment return and principal value of shares will vary with changes in market conditions. Shares may be worth more orless than their original cost when they are redeemed or sold in the market. Performance for certain funds may reflect a waiver of a portion of investment advisory fees.Without such a waiver, performance would have been lower.
Net asset value or “NAV” is the value of one share of a fund as calculated in accordance with the standard formula for valuing mutual fund shares. The price used to calculatemarket return (“Market Price”) is determined by using the midpoint between the highest bid and the lowest ask on the primary stock exchange on which shares of a fundare listed for trading, as of the time that such fund’s NAV is calculated. Since shares of a fund may not trade in the secondary market until after the fund’s inception, for theperiod from inception to the first day of secondary market trading in shares of the fund, the NAV of the fund is used as a proxy for the Market Price to calculate market returns.Market and NAV returns assume that dividends and capital gain distributions have been reinvested at Market Price and NAV, respectively.
An index is a statistical composite that tracks a specified financial market or sector. Unlike a fund, an index does not actually hold a portfolio of securities and therefore doesnot incur the expenses incurred by a fund. These expenses negatively impact fund performance. Also, market returns do not include brokerage commissions that may bepayable on secondary market transactions. If brokerage commissions were included, market returns would be lower.
Shareholder Expenses
As a shareholder of your Fund, you incur two types of costs: (1) transaction costs, including brokerage commissions on purchases and sales of fund shares and (2) ongoingcosts, including management fees and other fund expenses. The expense example, which is based on an investment of $1,000 invested at the beginning of the period (orfrom the commencement of operations if less than 6 months) and held through the end of the period, is intended to help you understand your ongoing costs (in dollars andcents) of investing in your Fund and to compare these costs with the ongoing costs of investing in other funds.
Actual Expenses – The table provides information about actual account values and actual expenses. Annualized expense ratios reflect contractual and voluntary feewaivers, if any. To estimate the expenses that you paid on your account over the period, simply divide your account value by $1,000 (for example, an $8,600 account valuedivided by $1,000 = 8.6), then multiply the result by the number under the heading entitled “Expenses Paid During the Period.”
Hypothetical Example for Comparison Purposes – The table also provides information about hypothetical account values and hypothetical expenses based on yourFund’s actual expense ratio and an assumed rate of return of 5% per year before expenses. You may use this information to compare the ongoing costs of investing in yourFund and other funds. To do so, compare this 5% hypothetical example with the 5% hypothetical examples that appear in the shareholder reports of the other funds.
Please note that the expenses shown in the table are meant to highlight your ongoing costs only and do not reflect any transactional costs, such as brokerage commissionsand other fees paid on purchases and sales of fund shares. Therefore, the hypothetical examples are useful in comparing ongoing costs only and will not help you determinethe relative total costs of owning different funds. In addition, if these transactional costs were included, your costs would have been higher.
About Fund Performance
A B O U T F U N D P E R F O R M A N C E / S H A R E H O L D E R E X P E N S E S 13
SecurityPar
(000) Value
Corporate Bonds & NotesAdvertising — 0.4%Clear Channel International BV, 6.63%, 08/01/25
(Call 02/01/22)(a)(b) . . . . . . . . . . . . . . . . . . . . . . . . . . . . . . . . . . . . $ 3,260 $ 3,319,065MDC Partners Inc., 6.50%, 05/01/24 (Call 11/30/20)(a)(b) . . . 8,223 7,860,448Outfront Media Capital LLC/Outfront Media Capital Corp.
5.63%, 02/15/24 (Call 11/30/20)(b). . . . . . . . . . . . . . . . . . . . . . 4,896 4,974,0426.25%, 06/15/25 (Call 06/15/22)(a) . . . . . . . . . . . . . . . . . . . . . 3,790 3,863,431
20,016,986Aerospace & Defense — 1.7%Howmet Aerospace Inc.
5.13%, 10/01/24 (Call 07/01/24)(b) . . . . . . . . . . . . . . . . . . . . . 11,142 11,724,7275.87%, 02/23/22 . . . . . . . . . . . . . . . . . . . . . . . . . . . . . . . . . . . . . . 5,160 5,429,6106.88%, 05/01/25 (Call 04/01/25) . . . . . . . . . . . . . . . . . . . . . . . 11,504 12,798,200
Spirit AeroSystems Inc.5.50%, 01/15/25 (Call 10/15/22)(a)(b) . . . . . . . . . . . . . . . . . . . 4,530 4,605,1467.50%, 04/15/25 (Call 04/15/22)(a) . . . . . . . . . . . . . . . . . . . . . 11,190 11,301,900
SSL Robotics LLC, 9.75%, 12/31/23 (Call 12/15/21)(a)(b) . . . 9,029 10,022,190TransDigm Inc.
6.50%, 07/15/24 (Call 11/30/20). . . . . . . . . . . . . . . . . . . . . . . . 10,817 10,818,5026.50%, 05/15/25 (Call 11/30/20). . . . . . . . . . . . . . . . . . . . . . . . 7,125 7,125,000
Triumph Group Inc.6.25%, 09/15/24 (Call 11/30/20)(a)(b). . . . . . . . . . . . . . . . . . . . 4,991 4,317,2157.75%, 08/15/25 (Call 11/30/20). . . . . . . . . . . . . . . . . . . . . . . . 750 488,2508.88%, 06/01/24 (Call 02/01/23)(a) . . . . . . . . . . . . . . . . . . . . . 6,600 7,003,680
85,634,420Agriculture — 0.2%Vector Group Ltd., 6.13%, 02/01/25 (Call 11/30/20)(a) . . . . . . 8,200 8,197,950
Airlines — 1.3%Air Canada, 7.75%, 04/15/21(a) . . . . . . . . . . . . . . . . . . . . . . . . . . . 3,802 3,802,000American Airlines Group Inc., 5.00%, 06/01/22(a)(b) . . . . . . . . 4,800 3,132,000American Airlines Inc., 11.75%, 07/15/25(a). . . . . . . . . . . . . . . . 23,550 22,915,327Delta Air Lines Inc.
2.90%, 10/28/24 (Call 09/28/24) . . . . . . . . . . . . . . . . . . . . . . . 8,200 7,148,7603.40%, 04/19/21 . . . . . . . . . . . . . . . . . . . . . . . . . . . . . . . . . . . . . . 3,400 3,387,2503.63%, 03/15/22 (Call 02/15/22) . . . . . . . . . . . . . . . . . . . . . . . 9,575 9,352,3743.80%, 04/19/23 (Call 03/19/23) . . . . . . . . . . . . . . . . . . . . . . . 4,750 4,534,231
Spirit Loyalty Cayman Ltd./Spirit IP Cayman Ltd., 8.00%,09/20/25 (Call 09/20/23)(a)(b) . . . . . . . . . . . . . . . . . . . . . . . . . . . 5,135 5,434,542
United Airlines Holdings Inc.4.25%, 10/01/22(b) . . . . . . . . . . . . . . . . . . . . . . . . . . . . . . . . . . . . 3,964 3,603,0464.88%, 01/15/25(b) . . . . . . . . . . . . . . . . . . . . . . . . . . . . . . . . . . . . 3,012 2,529,176
65,838,706Apparel — 0.7%Hanesbrands Inc.
4.63%, 05/15/24 (Call 02/15/24)(a) . . . . . . . . . . . . . . . . . . . . . 8,450 8,801,0975.38%, 05/15/25 (Call 05/15/22)(a) . . . . . . . . . . . . . . . . . . . . . 6,530 6,864,662
Levi Strauss & Co., 5.00%, 05/01/25 (Call 11/30/20)(b) . . . . . 9,245 9,470,347Michael Kors USA Inc., 4.50%, 11/01/24 (Call 09/01/24)(a) . 4,275 4,200,188William Carter Co. (The), 5.50%, 05/15/25
(Call 05/15/22)(a) . . . . . . . . . . . . . . . . . . . . . . . . . . . . . . . . . . . . . . 4,775 5,027,359
34,363,653Auto Manufacturers — 3.4%Allison Transmission Inc., 5.00%, 10/01/24
(Call 11/10/20)(a) . . . . . . . . . . . . . . . . . . . . . . . . . . . . . . . . . . . . . . 9,602 9,693,939Aston Martin Capital Holdings Ltd.
6.50%, 04/15/22 (Call 11/30/20)(a)(b). . . . . . . . . . . . . . . . . . . . 3,655 3,682,41310.50%, 11/30/25 (Call 11/01/24) . . . . . . . . . . . . . . . . . . . . . . 1,760 1,760,000
BCD Acquisition Inc., 9.63%, 09/15/23 (Call 11/30/20)(a) . . . 6,292 6,354,920
SecurityPar
(000) Value
Auto Manufacturers (continued)Fiat Chrysler Automobiles NV, 5.25%, 04/15/23(b) . . . . . . . . . $ 14,193 $ 15,041,600Ford Motor Co.
8.50%, 04/21/23 . . . . . . . . . . . . . . . . . . . . . . . . . . . . . . . . . . . . . . 25,695 28,360,8569.00%, 04/22/25 (Call 03/22/25) . . . . . . . . . . . . . . . . . . . . . . . 27,999 33,029,860
Ford Motor Credit Co. LLC2.98%, 08/03/22 (Call 07/03/22) . . . . . . . . . . . . . . . . . . . . . . . 700 693,3973.09%, 01/09/23 . . . . . . . . . . . . . . . . . . . . . . . . . . . . . . . . . . . . . . 6,050 5,989,5003.10%, 05/04/23(b) . . . . . . . . . . . . . . . . . . . . . . . . . . . . . . . . . . . . 900 886,6473.22%, 01/09/22(b) . . . . . . . . . . . . . . . . . . . . . . . . . . . . . . . . . . . . 1,500 1,492,3453.34%, 03/18/21 . . . . . . . . . . . . . . . . . . . . . . . . . . . . . . . . . . . . . . 600 600,0003.34%, 03/28/22 (Call 02/28/22) . . . . . . . . . . . . . . . . . . . . . . . 1,750 1,744,1673.35%, 11/01/22 . . . . . . . . . . . . . . . . . . . . . . . . . . . . . . . . . . . . . . 4,650 4,632,5633.37%, 11/17/23 . . . . . . . . . . . . . . . . . . . . . . . . . . . . . . . . . . . . . . 4,790 4,737,1544.06%, 11/01/24 (Call 10/01/24)(b). . . . . . . . . . . . . . . . . . . . . . 2,500 2,507,0004.13%, 08/04/25 . . . . . . . . . . . . . . . . . . . . . . . . . . . . . . . . . . . . . . 2,800 2,785,6954.14%, 02/15/23 (Call 01/15/23) . . . . . . . . . . . . . . . . . . . . . . . 1,100 1,110,1764.25%, 09/20/22(b) . . . . . . . . . . . . . . . . . . . . . . . . . . . . . . . . . . . . 3,500 3,550,9164.38%, 08/06/23 . . . . . . . . . . . . . . . . . . . . . . . . . . . . . . . . . . . . . . 1,100 1,122,1105.13%, 06/16/25 (Call 05/16/25)(b) . . . . . . . . . . . . . . . . . . . . . 6,905 7,188,3815.58%, 03/18/24 (Call 02/18/24) . . . . . . . . . . . . . . . . . . . . . . . 4,400 4,613,2245.60%, 01/07/22 . . . . . . . . . . . . . . . . . . . . . . . . . . . . . . . . . . . . . . 3,000 3,072,0005.88%, 08/02/21 . . . . . . . . . . . . . . . . . . . . . . . . . . . . . . . . . . . . . . 3,000 3,063,120
Jaguar Land Rover Automotive PLC5.63%, 02/01/23 (Call 11/30/20)(a)(b). . . . . . . . . . . . . . . . . . . . 4,469 4,328,1597.75%, 10/15/25 (Call 10/15/22)(a) . . . . . . . . . . . . . . . . . . . . . 2,065 2,079,842
Navistar International Corp., 9.50%, 05/01/25(Call 05/01/22)(a) . . . . . . . . . . . . . . . . . . . . . . . . . . . . . . . . . . . . . . 6,030 6,681,994
Tesla Inc., 5.30%, 08/15/25 (Call 11/30/20)(a)(b) . . . . . . . . . . . . 4,500 4,658,634
165,460,612Auto Parts & Equipment — 1.3%Adient U.S. LLC, 9.00%, 04/15/25 (Call 04/15/22)(a) . . . . . . . 5,975 6,578,176American Axle & Manufacturing Inc., 6.25%, 04/01/25
(Call 11/30/20)(b) . . . . . . . . . . . . . . . . . . . . . . . . . . . . . . . . . . . . . . 6,600 6,659,796Clarios Global LP, 6.75%, 05/15/25 (Call 05/15/22)(a) . . . . . . 4,945 5,229,832Dana Financing Luxembourg Sarl, 5.75%, 04/15/25
(Call 11/30/20)(a) . . . . . . . . . . . . . . . . . . . . . . . . . . . . . . . . . . . . . . 3,850 3,975,125Dana Inc., 5.50%, 12/15/24 (Call 11/30/20)(b). . . . . . . . . . . . . . 4,507 4,584,934Goodyear Tire & Rubber Co. (The)
5.13%, 11/15/23 (Call 11/30/20)(b). . . . . . . . . . . . . . . . . . . . . . 9,764 9,699,6319.50%, 05/31/25 (Call 05/31/22) . . . . . . . . . . . . . . . . . . . . . . . 7,195 7,900,254
Meritor Inc., 6.25%, 02/15/24 (Call 11/30/20)(b) . . . . . . . . . . . . 4,519 4,603,731ZF North America Capital Inc.
4.50%, 04/29/22(a) . . . . . . . . . . . . . . . . . . . . . . . . . . . . . . . . . . . . 5,400 5,534,6744.75%, 04/29/25(a) . . . . . . . . . . . . . . . . . . . . . . . . . . . . . . . . . . . . 10,069 10,401,097
65,167,250Banks — 1.9%CIT Group Inc.
3.93%, 06/19/24 (Call 06/19/23)(c) . . . . . . . . . . . . . . . . . . . . . 4,815 5,010,9134.13%, 03/09/21 (Call 02/09/21) . . . . . . . . . . . . . . . . . . . . . . . 4,966 4,992,8164.75%, 02/16/24 (Call 11/16/23). . . . . . . . . . . . . . . . . . . . . . . . 5,187 5,569,5415.00%, 08/15/22 . . . . . . . . . . . . . . . . . . . . . . . . . . . . . . . . . . . . . . 10,258 10,860,6585.00%, 08/01/23 . . . . . . . . . . . . . . . . . . . . . . . . . . . . . . . . . . . . . . 7,489 8,060,0365.25%, 03/07/25 (Call 12/07/24)(b) . . . . . . . . . . . . . . . . . . . . . 4,000 4,466,667
Commerzbank AG, 8.13%, 09/19/23(a)(b) . . . . . . . . . . . . . . . . . . 9,450 10,845,495Deutsche Bank AG, 4.50%, 04/01/25(b) . . . . . . . . . . . . . . . . . . . 13,800 13,981,411Freedom Mortgage Corp.
8.13%, 11/15/24 (Call 11/30/20)(a). . . . . . . . . . . . . . . . . . . . . . 4,106 4,138,8858.25%, 04/15/25 (Call 04/15/21)(a) . . . . . . . . . . . . . . . . . . . . . 6,350 6,433,185
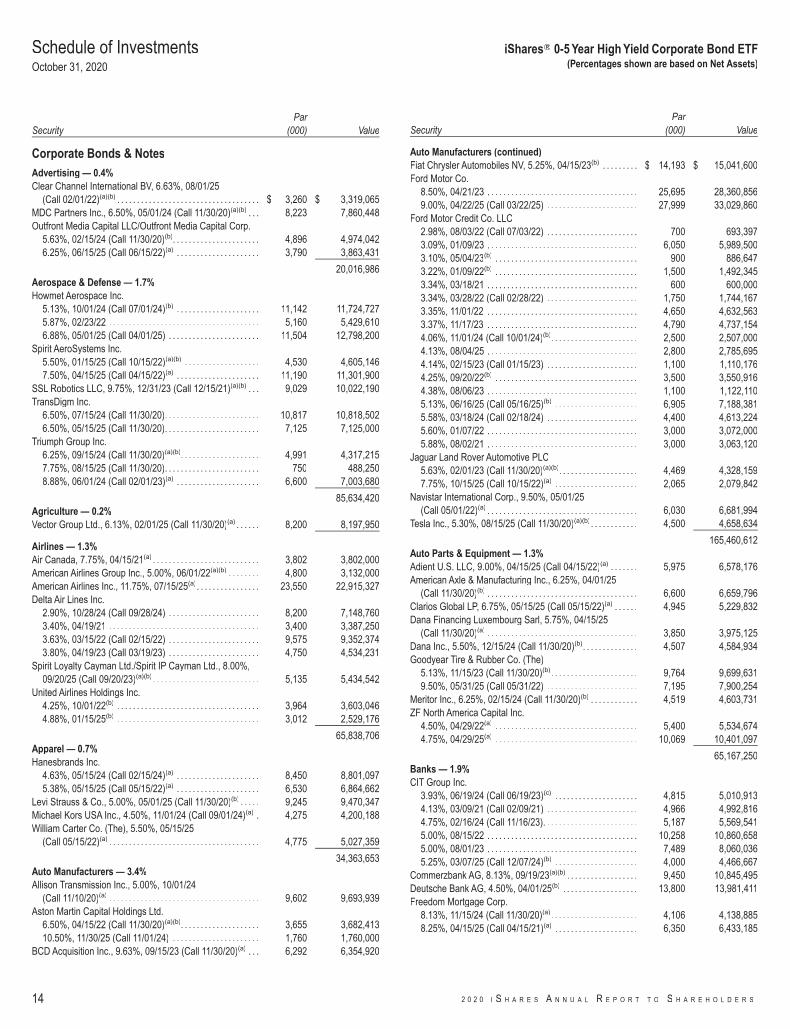
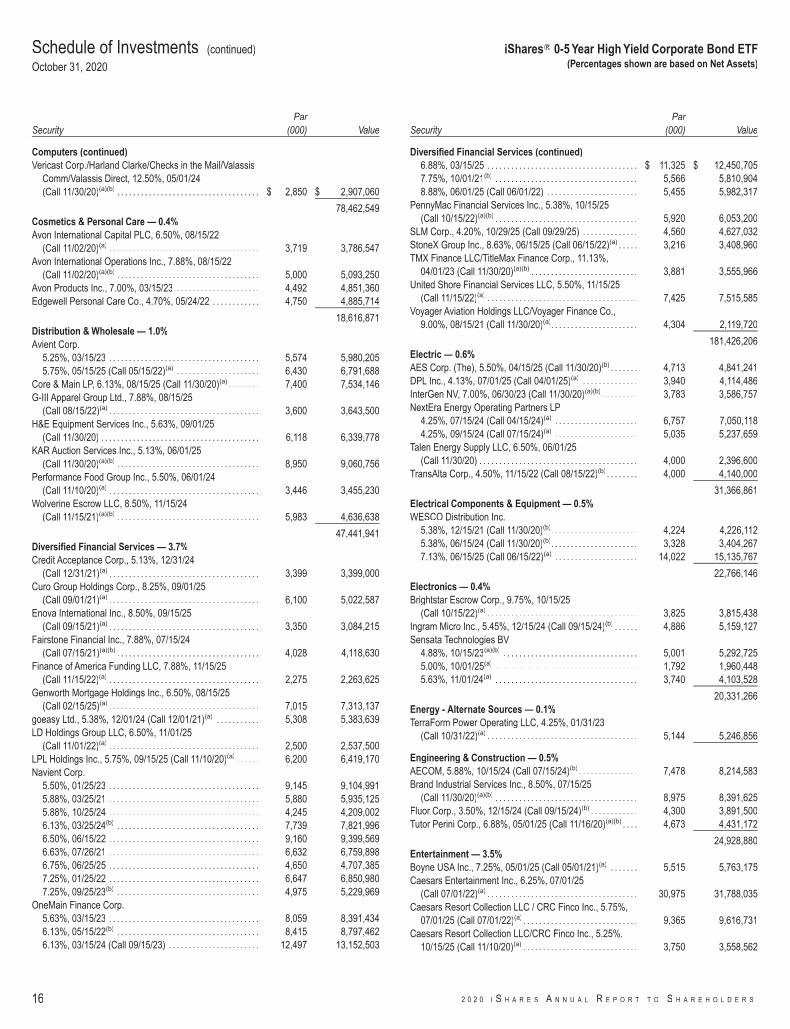
Schedule of InvestmentsOctober 31, 2020
iShares� 0-5 Year High Yield Corporate Bond ETF(Percentages shown are based on Net Assets)
14 2 0 2 0 I S H A R E S A N N U A L R E P O R T T O S H A R E H O L D E R S

SecurityPar
(000) Value
Banks (continued)Intesa Sanpaolo SpA, 5.02%, 06/26/24(a) . . . . . . . . . . . . . . . . . $ 18,497 $ 19,520,241
93,879,848Beverages — 0.2%Ajecorp BV, 6.50%, 05/14/22 (Call 11/30/20)(a)(b) . . . . . . . . . . 4,255 4,222,875Primo Water Holdings Inc., 5.50%, 04/01/25
(Call 11/10/20)(a) . . . . . . . . . . . . . . . . . . . . . . . . . . . . . . . . . . . . . . 7,500 7,743,750
11,966,625Building Materials — 0.4%BMC East LLC, 5.50%, 10/01/24 (Call 11/16/20)(a)(b). . . . . . . 3,621 3,711,525Forterra Finance LLC/FRTA Finance Corp., 6.50%,
07/15/25 (Call 07/15/22)(a)(b) . . . . . . . . . . . . . . . . . . . . . . . . . . . 4,935 5,159,542James Hardie International Finance DAC, 4.75%, 01/15/25
(Call 01/15/21)(a)(b) . . . . . . . . . . . . . . . . . . . . . . . . . . . . . . . . . . . . 3,924 4,016,320Louisiana-Pacific Corp., 4.88%, 09/15/24
(Call 11/30/20)(b) . . . . . . . . . . . . . . . . . . . . . . . . . . . . . . . . . . . . . . 3,374 3,445,237U.S. Concrete Inc., 6.38%, 06/01/24 (Call 11/30/20)(b) . . . . . 2,184 2,245,350
18,577,974Chemicals — 2.5%Ashland LLC, 4.75%, 08/15/22 (Call 05/15/22) . . . . . . . . . . . . 3,929 4,112,091Atotech Alpha 3 BV/Alpha U.S. Bidco Inc., 6.25%,
02/01/25 (Call 11/30/20)(a)(b) . . . . . . . . . . . . . . . . . . . . . . . . . . . 4,287 4,329,870Axalta Coating Systems LLC, 4.88%, 08/15/24
(Call 11/10/20)(a)(b) . . . . . . . . . . . . . . . . . . . . . . . . . . . . . . . . . . . . 5,103 5,198,142Blue Cube Spinco LLC, 9.75%, 10/15/23 (Call 11/30/20)(b) . 931 957,794CF Industries Inc., 3.45%, 06/01/23. . . . . . . . . . . . . . . . . . . . . . . 7,389 7,564,489Chemours Co. (The)
6.63%, 05/15/23 (Call 11/30/20). . . . . . . . . . . . . . . . . . . . . . . . 8,337 8,296,6437.00%, 05/15/25 (Call 11/30/20)(b). . . . . . . . . . . . . . . . . . . . . . 7,095 7,151,831
Cornerstone Chemical Co., 6.75%, 08/15/24(Call 11/30/20)(a) . . . . . . . . . . . . . . . . . . . . . . . . . . . . . . . . . . . . . . 3,933 3,683,500
CVR Partners LP/CVR Nitrogen Finance Corp., 9.25%,06/15/23 (Call 11/16/20)(a)(b) . . . . . . . . . . . . . . . . . . . . . . . . . . . 5,978 5,468,376
INEOS Group Holdings SA, 5.63%, 08/01/24(Call 11/30/20)(a)(b) . . . . . . . . . . . . . . . . . . . . . . . . . . . . . . . . . . . . 4,598 4,661,498
Kraton Polymers LLC/Kraton Polymers Capital Corp.,7.00%, 04/15/25 (Call 11/30/20)(a)(b). . . . . . . . . . . . . . . . . . . . 3,925 4,025,929
NOVA Chemicals Corp.4.88%, 06/01/24 (Call 03/03/24)(a)(b) . . . . . . . . . . . . . . . . . . . 9,774 9,668,4415.00%, 05/01/25 (Call 01/31/25)(a)(b) . . . . . . . . . . . . . . . . . . . 4,450 4,394,3755.25%, 08/01/23 (Call 11/30/20)(a). . . . . . . . . . . . . . . . . . . . . . 4,497 4,464,740
OCI NV4.63%, 10/15/25 (Call 10/15/22)(a)(b) . . . . . . . . . . . . . . . . . . . 3,605 3,649,9005.25%, 11/01/24 (Call 11/01/21)(a). . . . . . . . . . . . . . . . . . . . . . 5,126 5,241,335
Olin Corp., 9.50%, 06/01/25 (Call 03/01/25)(a) . . . . . . . . . . . . . 4,550 5,379,420Rain CII Carbon LLC/CII Carbon Corp., 7.25%, 04/01/25
(Call 11/30/20)(a) . . . . . . . . . . . . . . . . . . . . . . . . . . . . . . . . . . . . . . 5,175 5,092,523Rayonier AM Products Inc., 5.50%, 06/01/24
(Call 11/30/20)(a) . . . . . . . . . . . . . . . . . . . . . . . . . . . . . . . . . . . . . . 3,800 2,616,571SPCM SA, 4.88%, 09/15/25 (Call 11/10/20)(a) . . . . . . . . . . . . . 3,800 3,905,292TPC Group Inc., 10.50%, 08/01/24 (Call 08/01/21)(a)(b) . . . . 8,407 7,145,950Trinseo Materials Operating SCA/Trinseo Materials
Finance Inc., 5.38%, 09/01/25 (Call 11/30/20)(a)(b) . . . . . . 4,800 4,872,000Tronox Finance PLC, 5.75%, 10/01/25 (Call 11/30/20)(a) . . . 2,850 2,845,939Tronox Inc., 6.50%, 05/01/25 (Call 05/01/22)(a) . . . . . . . . . . . . 5,180 5,458,222Valvoline Inc., 4.38%, 08/15/25 (Call 11/30/20)(b) . . . . . . . . . . 1,150 1,183,063Venator Finance Sarl/Venator Materials LLC, 5.75%,
07/15/25 (Call 11/30/20)(a)(b) . . . . . . . . . . . . . . . . . . . . . . . . . . . 305 260,394
121,628,328
SecurityPar
(000) Value
Coal — 0.1%SunCoke Energy Partners LP/SunCoke Energy Partners
Finance Corp., 7.50%, 06/15/25 (Call 11/30/20)(a). . . . . . . $ 5,925 $ 5,302,875
Commercial Services — 2.6%ADT Security Corp. (The)
3.50%, 07/15/22 . . . . . . . . . . . . . . . . . . . . . . . . . . . . . . . . . . . . . . 9,247 9,402,8124.13%, 06/15/23(b) . . . . . . . . . . . . . . . . . . . . . . . . . . . . . . . . . . . . 7,008 7,290,072
Algeco Global Finance PLC, 8.00%, 02/15/23(Call 11/10/20)(a) . . . . . . . . . . . . . . . . . . . . . . . . . . . . . . . . . . . . . . 4,817 4,780,120
APX Group Inc.7.63%, 09/01/23 (Call 11/30/20)(b). . . . . . . . . . . . . . . . . . . . . . 4,051 4,090,4977.88%, 12/01/22 (Call 11/30/20). . . . . . . . . . . . . . . . . . . . . . . . 6,793 6,782,675
Avis Budget Car Rental LLC/Avis Budget Finance Inc.5.25%, 03/15/25 (Call 11/30/20)(a). . . . . . . . . . . . . . . . . . . . . . 3,397 3,208,5736.38%, 04/01/24 (Call 11/30/20)(a). . . . . . . . . . . . . . . . . . . . . . 3,366 3,286,05810.50%, 05/15/25 (Call 05/15/22)(a)(b) . . . . . . . . . . . . . . . . . . 4,465 5,145,912
Brink's Co. (The), 5.50%, 07/15/25 (Call 07/15/22)(a) . . . . . . 4,015 4,165,562Capitol Investment Merger Sub 2 LLC, 10.00%, 08/01/24
(Call 08/01/21)(a)(b) . . . . . . . . . . . . . . . . . . . . . . . . . . . . . . . . . . . . 4,573 4,866,434Jaguar Holding Co. II/PPD Development LP, 4.63%,
06/15/25 (Call 06/15/22)(a)(b) . . . . . . . . . . . . . . . . . . . . . . . . . . . 4,695 4,853,456Laureate Education Inc., 8.25%, 05/01/25
(Call 11/30/20)(a)(b) . . . . . . . . . . . . . . . . . . . . . . . . . . . . . . . . . . . . 7,900 8,415,159Midas Intermediate Holdco II LLC/Midas Intermediate
Holdco II Finance Inc., 7.88%, 10/01/22(Call 11/16/20)(a)(b) . . . . . . . . . . . . . . . . . . . . . . . . . . . . . . . . . . . . 2,322 1,911,089
Nielsen Co Luxembourg Sarl (The)5.00%, 02/01/25 (Call 11/30/20)(a)(b). . . . . . . . . . . . . . . . . . . . 4,964 5,099,0215.50%, 10/01/21 (Call 11/30/20)(a). . . . . . . . . . . . . . . . . . . . . . 1,138 1,139,717
Nielsen Finance LLC/Nielsen Finance Co., 5.00%,04/15/22 (Call 11/30/20)(a) . . . . . . . . . . . . . . . . . . . . . . . . . . . . . 6,979 6,987,724
Prime Security Services Borrower LLC/Prime Finance Inc.,5.25%, 04/15/24(a) . . . . . . . . . . . . . . . . . . . . . . . . . . . . . . . . . . . . 7,139 7,459,363
Ritchie Bros. Auctioneers Inc., 5.38%, 01/15/25(Call 11/30/20)(a)(b) . . . . . . . . . . . . . . . . . . . . . . . . . . . . . . . . . . . . 5,170 5,326,703
Sabre GLBL Inc.5.25%, 11/15/23 (Call 11/30/20)(a)(b). . . . . . . . . . . . . . . . . . . . 4,831 4,752,4967.38%, 09/01/25 (Call 09/01/22)(a)(b) . . . . . . . . . . . . . . . . . . . 7,845 8,016,0219.25%, 04/15/25 (Call 03/16/25)(a)(b) . . . . . . . . . . . . . . . . . . . 6,870 7,608,525
ServiceMaster Co. LLC (The), 5.13%, 11/15/24(Call 11/15/20)(a) . . . . . . . . . . . . . . . . . . . . . . . . . . . . . . . . . . . . . . 7,525 7,724,412
WEX Inc., 4.75%, 02/01/23 (Call 11/30/20)(a)(b) . . . . . . . . . . . . 3,312 3,317,862
125,630,263Computers — 1.6%Dell Inc., 4.63%, 04/01/21(b) . . . . . . . . . . . . . . . . . . . . . . . . . . . . . . 3,943 3,980,851Dell International LLC/EMC Corp.
5.88%, 06/15/21 (Call 11/16/20)(a). . . . . . . . . . . . . . . . . . . . . . 10,019 10,043,1467.13%, 06/15/24 (Call 11/16/20)(a). . . . . . . . . . . . . . . . . . . . . . 16,021 16,608,170
Diebold Nixdorf Inc.8.50%, 04/15/24 (Call 11/30/20)(b). . . . . . . . . . . . . . . . . . . . . . 3,842 3,496,2209.38%, 07/15/25 (Call 07/15/22)(a) . . . . . . . . . . . . . . . . . . . . . 6,237 6,611,220
EMC Corp., 3.38%, 06/01/23 (Call 03/01/23) . . . . . . . . . . . . . . 9,720 9,910,023NCR Corp., 8.13%, 04/15/25 (Call 04/15/22)(a)(b) . . . . . . . . . . 4,355 4,742,682Tempo Acquisition LLC/Tempo Acquisition Finance Corp.,
6.75%, 06/01/25 (Call 11/10/20)(a). . . . . . . . . . . . . . . . . . . . . . 11,835 12,024,360Vericast Corp.
8.38%, 08/15/22 (Call 11/30/20)(a). . . . . . . . . . . . . . . . . . . . . . 6,081 5,989,7859.25%, 03/01/21 (Call 11/27/20)(a). . . . . . . . . . . . . . . . . . . . . . 2,145 2,149,032
Schedule of Investments (continued)
October 31, 2020
iShares� 0-5 Year High Yield Corporate Bond ETF(Percentages shown are based on Net Assets)
S C H E D U L E O F I N V E S T M E N T S 15
SecurityPar
(000) Value
Computers (continued)Vericast Corp./Harland Clarke/Checks in the Mail/Valassis
Comm/Valassis Direct, 12.50%, 05/01/24(Call 11/30/20)(a)(b) . . . . . . . . . . . . . . . . . . . . . . . . . . . . . . . . . . . . $ 2,850 $ 2,907,060
78,462,549Cosmetics & Personal Care — 0.4%Avon International Capital PLC, 6.50%, 08/15/22
(Call 11/02/20)(a) . . . . . . . . . . . . . . . . . . . . . . . . . . . . . . . . . . . . . . 3,719 3,786,547Avon International Operations Inc., 7.88%, 08/15/22
(Call 11/02/20)(a)(b) . . . . . . . . . . . . . . . . . . . . . . . . . . . . . . . . . . . . 5,000 5,093,250Avon Products Inc., 7.00%, 03/15/23 . . . . . . . . . . . . . . . . . . . . . 4,492 4,851,360Edgewell Personal Care Co., 4.70%, 05/24/22 . . . . . . . . . . . . 4,750 4,885,714
18,616,871Distribution & Wholesale — 1.0%Avient Corp.
5.25%, 03/15/23 . . . . . . . . . . . . . . . . . . . . . . . . . . . . . . . . . . . . . . 5,574 5,980,2055.75%, 05/15/25 (Call 05/15/22)(a) . . . . . . . . . . . . . . . . . . . . . 6,430 6,791,688
Core & Main LP, 6.13%, 08/15/25 (Call 11/30/20)(a) . . . . . . . . 7,400 7,534,146G-III Apparel Group Ltd., 7.88%, 08/15/25
(Call 08/15/22)(a) . . . . . . . . . . . . . . . . . . . . . . . . . . . . . . . . . . . . . . 3,600 3,643,500H&E Equipment Services Inc., 5.63%, 09/01/25
(Call 11/30/20) . . . . . . . . . . . . . . . . . . . . . . . . . . . . . . . . . . . . . . . . 6,118 6,339,778KAR Auction Services Inc., 5.13%, 06/01/25
(Call 11/30/20)(a)(b) . . . . . . . . . . . . . . . . . . . . . . . . . . . . . . . . . . . . 8,950 9,060,756Performance Food Group Inc., 5.50%, 06/01/24
(Call 11/10/20)(a) . . . . . . . . . . . . . . . . . . . . . . . . . . . . . . . . . . . . . . 3,446 3,455,230Wolverine Escrow LLC, 8.50%, 11/15/24
(Call 11/15/21)(a)(b) . . . . . . . . . . . . . . . . . . . . . . . . . . . . . . . . . . . . 5,983 4,636,638
47,441,941Diversified Financial Services — 3.7%Credit Acceptance Corp., 5.13%, 12/31/24
(Call 12/31/21)(a) . . . . . . . . . . . . . . . . . . . . . . . . . . . . . . . . . . . . . . 3,399 3,399,000Curo Group Holdings Corp., 8.25%, 09/01/25
(Call 09/01/21)(a) . . . . . . . . . . . . . . . . . . . . . . . . . . . . . . . . . . . . . . 6,100 5,022,587Enova International Inc., 8.50%, 09/15/25
(Call 09/15/21)(a) . . . . . . . . . . . . . . . . . . . . . . . . . . . . . . . . . . . . . . 3,350 3,084,215Fairstone Financial Inc., 7.88%, 07/15/24
(Call 07/15/21)(a)(b) . . . . . . . . . . . . . . . . . . . . . . . . . . . . . . . . . . . . 4,028 4,118,630Finance of America Funding LLC, 7.88%, 11/15/25
(Call 11/15/22)(a) . . . . . . . . . . . . . . . . . . . . . . . . . . . . . . . . . . . . . . 2,275 2,263,625Genworth Mortgage Holdings Inc., 6.50%, 08/15/25
(Call 02/15/25)(a) . . . . . . . . . . . . . . . . . . . . . . . . . . . . . . . . . . . . . . 7,015 7,313,137goeasy Ltd., 5.38%, 12/01/24 (Call 12/01/21)(a) . . . . . . . . . . . 5,308 5,383,639LD Holdings Group LLC, 6.50%, 11/01/25
(Call 11/01/22)(a) . . . . . . . . . . . . . . . . . . . . . . . . . . . . . . . . . . . . . . 2,500 2,537,500LPL Holdings Inc., 5.75%, 09/15/25 (Call 11/10/20)(a) . . . . . . 6,200 6,419,170Navient Corp.
5.50%, 01/25/23 . . . . . . . . . . . . . . . . . . . . . . . . . . . . . . . . . . . . . . 9,145 9,104,9915.88%, 03/25/21 . . . . . . . . . . . . . . . . . . . . . . . . . . . . . . . . . . . . . . 5,880 5,935,1255.88%, 10/25/24 . . . . . . . . . . . . . . . . . . . . . . . . . . . . . . . . . . . . . . 4,245 4,209,0026.13%, 03/25/24(b) . . . . . . . . . . . . . . . . . . . . . . . . . . . . . . . . . . . . 7,739 7,821,9966.50%, 06/15/22 . . . . . . . . . . . . . . . . . . . . . . . . . . . . . . . . . . . . . . 9,160 9,399,5696.63%, 07/26/21 . . . . . . . . . . . . . . . . . . . . . . . . . . . . . . . . . . . . . . 6,632 6,759,8986.75%, 06/25/25 . . . . . . . . . . . . . . . . . . . . . . . . . . . . . . . . . . . . . . 4,650 4,707,3857.25%, 01/25/22 . . . . . . . . . . . . . . . . . . . . . . . . . . . . . . . . . . . . . . 6,647 6,850,9807.25%, 09/25/23(b) . . . . . . . . . . . . . . . . . . . . . . . . . . . . . . . . . . . . 4,975 5,229,969
OneMain Finance Corp.5.63%, 03/15/23 . . . . . . . . . . . . . . . . . . . . . . . . . . . . . . . . . . . . . . 8,059 8,391,4346.13%, 05/15/22(b) . . . . . . . . . . . . . . . . . . . . . . . . . . . . . . . . . . . . 8,415 8,797,4626.13%, 03/15/24 (Call 09/15/23) . . . . . . . . . . . . . . . . . . . . . . . 12,497 13,152,503
SecurityPar
(000) Value
Diversified Financial Services (continued)6.88%, 03/15/25 . . . . . . . . . . . . . . . . . . . . . . . . . . . . . . . . . . . . . . $ 11,325 $ 12,450,7057.75%, 10/01/21(b) . . . . . . . . . . . . . . . . . . . . . . . . . . . . . . . . . . . . 5,566 5,810,9048.88%, 06/01/25 (Call 06/01/22) . . . . . . . . . . . . . . . . . . . . . . . 5,455 5,982,317
PennyMac Financial Services Inc., 5.38%, 10/15/25(Call 10/15/22)(a)(b) . . . . . . . . . . . . . . . . . . . . . . . . . . . . . . . . . . . . 5,920 6,053,200
SLM Corp., 4.20%, 10/29/25 (Call 09/29/25) . . . . . . . . . . . . . . 4,560 4,627,032StoneX Group Inc., 8.63%, 06/15/25 (Call 06/15/22)(a) . . . . . 3,216 3,408,960TMX Finance LLC/TitleMax Finance Corp., 11.13%,
04/01/23 (Call 11/30/20)(a)(b) . . . . . . . . . . . . . . . . . . . . . . . . . . . 3,881 3,555,966United Shore Financial Services LLC, 5.50%, 11/15/25
(Call 11/15/22)(a) . . . . . . . . . . . . . . . . . . . . . . . . . . . . . . . . . . . . . . 7,425 7,515,585Voyager Aviation Holdings LLC/Voyager Finance Co.,
9.00%, 08/15/21 (Call 11/30/20)(a). . . . . . . . . . . . . . . . . . . . . . 4,304 2,119,720
181,426,206Electric — 0.6%AES Corp. (The), 5.50%, 04/15/25 (Call 11/30/20)(b) . . . . . . . 4,713 4,841,241DPL Inc., 4.13%, 07/01/25 (Call 04/01/25)(a) . . . . . . . . . . . . . . 3,940 4,114,486InterGen NV, 7.00%, 06/30/23 (Call 11/30/20)(a)(b) . . . . . . . . . 3,783 3,586,757NextEra Energy Operating Partners LP
4.25%, 07/15/24 (Call 04/15/24)(a) . . . . . . . . . . . . . . . . . . . . . 6,757 7,050,1184.25%, 09/15/24 (Call 07/15/24)(a) . . . . . . . . . . . . . . . . . . . . . 5,035 5,237,659
Talen Energy Supply LLC, 6.50%, 06/01/25(Call 11/30/20) . . . . . . . . . . . . . . . . . . . . . . . . . . . . . . . . . . . . . . . . 4,000 2,396,600
TransAlta Corp., 4.50%, 11/15/22 (Call 08/15/22)(b) . . . . . . . . 4,000 4,140,000
31,366,861Electrical Components & Equipment — 0.5%WESCO Distribution Inc.
5.38%, 12/15/21 (Call 11/30/20)(b). . . . . . . . . . . . . . . . . . . . . . 4,224 4,226,1125.38%, 06/15/24 (Call 11/30/20)(b). . . . . . . . . . . . . . . . . . . . . . 3,328 3,404,2677.13%, 06/15/25 (Call 06/15/22)(a) . . . . . . . . . . . . . . . . . . . . . 14,022 15,135,767
22,766,146Electronics — 0.4%Brightstar Escrow Corp., 9.75%, 10/15/25
(Call 10/15/22)(a) . . . . . . . . . . . . . . . . . . . . . . . . . . . . . . . . . . . . . . 3,825 3,815,438Ingram Micro Inc., 5.45%, 12/15/24 (Call 09/15/24)(b) . . . . . . 4,886 5,159,127Sensata Technologies BV
4.88%, 10/15/23(a)(b) . . . . . . . . . . . . . . . . . . . . . . . . . . . . . . . . . . 5,001 5,292,7255.00%, 10/01/25(a) . . . . . . . . . . . . . . . . . . . . . . . . . . . . . . . . . . . . 1,792 1,960,4485.63%, 11/01/24(a) . . . . . . . . . . . . . . . . . . . . . . . . . . . . . . . . . . . . 3,740 4,103,528
20,331,266Energy - Alternate Sources — 0.1%TerraForm Power Operating LLC, 4.25%, 01/31/23
(Call 10/31/22)(a) . . . . . . . . . . . . . . . . . . . . . . . . . . . . . . . . . . . . . . 5,144 5,246,856
Engineering & Construction — 0.5%AECOM, 5.88%, 10/15/24 (Call 07/15/24)(b) . . . . . . . . . . . . . . . 7,478 8,214,583Brand Industrial Services Inc., 8.50%, 07/15/25
(Call 11/30/20)(a)(b) . . . . . . . . . . . . . . . . . . . . . . . . . . . . . . . . . . . . 8,975 8,391,625Fluor Corp., 3.50%, 12/15/24 (Call 09/15/24)(b) . . . . . . . . . . . . 4,300 3,891,500Tutor Perini Corp., 6.88%, 05/01/25 (Call 11/16/20)(a)(b) . . . . 4,673 4,431,172
24,928,880Entertainment — 3.5%Boyne USA Inc., 7.25%, 05/01/25 (Call 05/01/21)(a) . . . . . . . 5,515 5,763,175Caesars Entertainment Inc., 6.25%, 07/01/25
(Call 07/01/22)(a) . . . . . . . . . . . . . . . . . . . . . . . . . . . . . . . . . . . . . . 30,975 31,788,035Caesars Resort Collection LLC / CRC Finco Inc., 5.75%,
07/01/25 (Call 07/01/22)(a) . . . . . . . . . . . . . . . . . . . . . . . . . . . . . 9,365 9,616,731Caesars Resort Collection LLC/CRC Finco Inc., 5.25%,
10/15/25 (Call 11/10/20)(a) . . . . . . . . . . . . . . . . . . . . . . . . . . . . . 3,750 3,558,562
Schedule of Investments (continued)
October 31, 2020
iShares� 0-5 Year High Yield Corporate Bond ETF(Percentages shown are based on Net Assets)
16 2 0 2 0 I S H A R E S A N N U A L R E P O R T T O S H A R E H O L D E R S
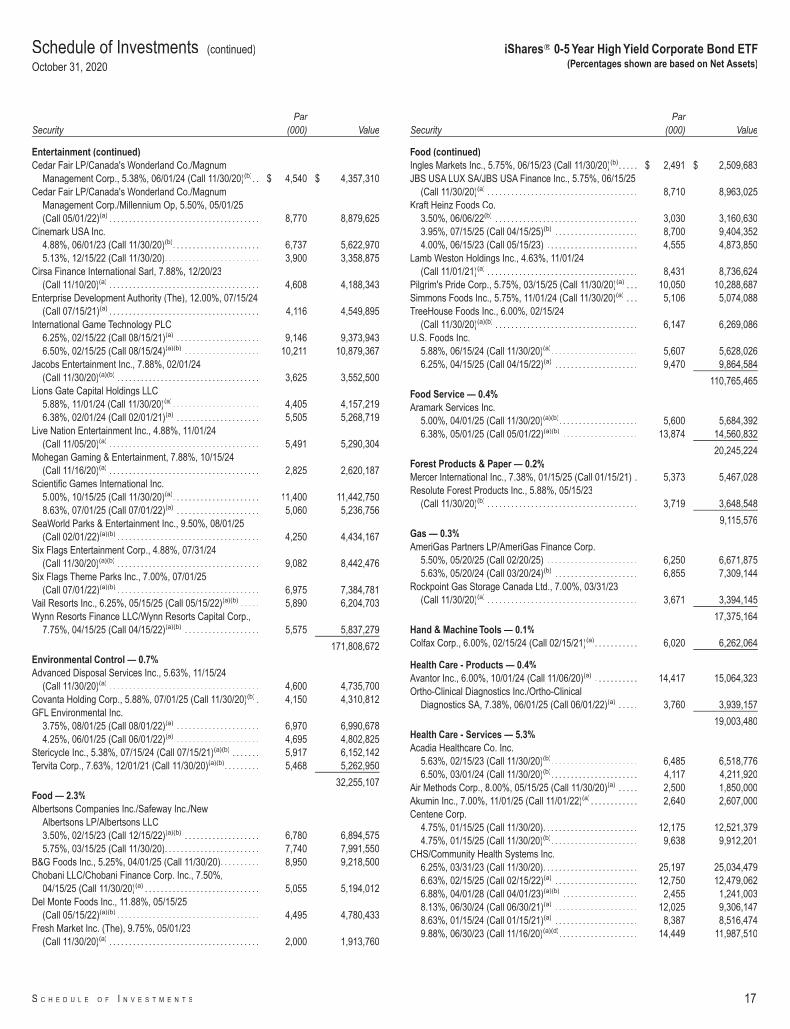
SecurityPar
(000) Value
Entertainment (continued)Cedar Fair LP/Canada's Wonderland Co./Magnum
Management Corp., 5.38%, 06/01/24 (Call 11/30/20)(b). . $ 4,540 $ 4,357,310Cedar Fair LP/Canada's Wonderland Co./Magnum
Management Corp./Millennium Op, 5.50%, 05/01/25(Call 05/01/22)(a) . . . . . . . . . . . . . . . . . . . . . . . . . . . . . . . . . . . . . . 8,770 8,879,625
Cinemark USA Inc.4.88%, 06/01/23 (Call 11/30/20)(b). . . . . . . . . . . . . . . . . . . . . . 6,737 5,622,9705.13%, 12/15/22 (Call 11/30/20). . . . . . . . . . . . . . . . . . . . . . . . 3,900 3,358,875
Cirsa Finance International Sarl, 7.88%, 12/20/23(Call 11/10/20)(a) . . . . . . . . . . . . . . . . . . . . . . . . . . . . . . . . . . . . . . 4,608 4,188,343
Enterprise Development Authority (The), 12.00%, 07/15/24(Call 07/15/21)(a) . . . . . . . . . . . . . . . . . . . . . . . . . . . . . . . . . . . . . . 4,116 4,549,895
International Game Technology PLC6.25%, 02/15/22 (Call 08/15/21)(a) . . . . . . . . . . . . . . . . . . . . . 9,146 9,373,9436.50%, 02/15/25 (Call 08/15/24)(a)(b) . . . . . . . . . . . . . . . . . . . 10,211 10,879,367
Jacobs Entertainment Inc., 7.88%, 02/01/24(Call 11/30/20)(a)(b) . . . . . . . . . . . . . . . . . . . . . . . . . . . . . . . . . . . . 3,625 3,552,500
Lions Gate Capital Holdings LLC5.88%, 11/01/24 (Call 11/30/20)(a). . . . . . . . . . . . . . . . . . . . . . 4,405 4,157,2196.38%, 02/01/24 (Call 02/01/21)(a) . . . . . . . . . . . . . . . . . . . . . 5,505 5,268,719
Live Nation Entertainment Inc., 4.88%, 11/01/24(Call 11/05/20)(a) . . . . . . . . . . . . . . . . . . . . . . . . . . . . . . . . . . . . . . 5,491 5,290,304
Mohegan Gaming & Entertainment, 7.88%, 10/15/24(Call 11/16/20)(a) . . . . . . . . . . . . . . . . . . . . . . . . . . . . . . . . . . . . . . 2,825 2,620,187
Scientific Games International Inc.5.00%, 10/15/25 (Call 11/30/20)(a). . . . . . . . . . . . . . . . . . . . . . 11,400 11,442,7508.63%, 07/01/25 (Call 07/01/22)(a) . . . . . . . . . . . . . . . . . . . . . 5,060 5,236,756
SeaWorld Parks & Entertainment Inc., 9.50%, 08/01/25(Call 02/01/22)(a)(b) . . . . . . . . . . . . . . . . . . . . . . . . . . . . . . . . . . . . 4,250 4,434,167
Six Flags Entertainment Corp., 4.88%, 07/31/24(Call 11/30/20)(a)(b) . . . . . . . . . . . . . . . . . . . . . . . . . . . . . . . . . . . . 9,082 8,442,476
Six Flags Theme Parks Inc., 7.00%, 07/01/25(Call 07/01/22)(a)(b) . . . . . . . . . . . . . . . . . . . . . . . . . . . . . . . . . . . . 6,975 7,384,781
Vail Resorts Inc., 6.25%, 05/15/25 (Call 05/15/22)(a)(b) . . . . . 5,890 6,204,703Wynn Resorts Finance LLC/Wynn Resorts Capital Corp.,
7.75%, 04/15/25 (Call 04/15/22)(a)(b) . . . . . . . . . . . . . . . . . . . 5,575 5,837,279
171,808,672Environmental Control — 0.7%Advanced Disposal Services Inc., 5.63%, 11/15/24
(Call 11/30/20)(a) . . . . . . . . . . . . . . . . . . . . . . . . . . . . . . . . . . . . . . 4,600 4,735,700Covanta Holding Corp., 5.88%, 07/01/25 (Call 11/30/20)(b) . 4,150 4,310,812GFL Environmental Inc.
3.75%, 08/01/25 (Call 08/01/22)(a) . . . . . . . . . . . . . . . . . . . . . 6,970 6,990,6784.25%, 06/01/25 (Call 06/01/22)(a) . . . . . . . . . . . . . . . . . . . . . 4,695 4,802,825
Stericycle Inc., 5.38%, 07/15/24 (Call 07/15/21)(a)(b) . . . . . . . 5,917 6,152,142Tervita Corp., 7.63%, 12/01/21 (Call 11/30/20)(a)(b). . . . . . . . . 5,468 5,262,950
32,255,107Food — 2.3%Albertsons Companies Inc./Safeway Inc./New
Albertsons LP/Albertsons LLC3.50%, 02/15/23 (Call 12/15/22)(a)(b) . . . . . . . . . . . . . . . . . . . 6,780 6,894,5755.75%, 03/15/25 (Call 11/30/20). . . . . . . . . . . . . . . . . . . . . . . . 7,740 7,991,550
B&G Foods Inc., 5.25%, 04/01/25 (Call 11/30/20). . . . . . . . . . 8,950 9,218,500Chobani LLC/Chobani Finance Corp. Inc., 7.50%,
04/15/25 (Call 11/30/20)(a) . . . . . . . . . . . . . . . . . . . . . . . . . . . . . 5,055 5,194,012Del Monte Foods Inc., 11.88%, 05/15/25
(Call 05/15/22)(a)(b) . . . . . . . . . . . . . . . . . . . . . . . . . . . . . . . . . . . . 4,495 4,780,433Fresh Market Inc. (The), 9.75%, 05/01/23
(Call 11/30/20)(a) . . . . . . . . . . . . . . . . . . . . . . . . . . . . . . . . . . . . . . 2,000 1,913,760
SecurityPar
(000) Value
Food (continued)Ingles Markets Inc., 5.75%, 06/15/23 (Call 11/30/20)(b). . . . . $ 2,491 $ 2,509,683JBS USA LUX SA/JBS USA Finance Inc., 5.75%, 06/15/25
(Call 11/30/20)(a) . . . . . . . . . . . . . . . . . . . . . . . . . . . . . . . . . . . . . . 8,710 8,963,025Kraft Heinz Foods Co.
3.50%, 06/06/22(b) . . . . . . . . . . . . . . . . . . . . . . . . . . . . . . . . . . . . 3,030 3,160,6303.95%, 07/15/25 (Call 04/15/25)(b) . . . . . . . . . . . . . . . . . . . . . 8,700 9,404,3524.00%, 06/15/23 (Call 05/15/23) . . . . . . . . . . . . . . . . . . . . . . . 4,555 4,873,850
Lamb Weston Holdings Inc., 4.63%, 11/01/24(Call 11/01/21)(a) . . . . . . . . . . . . . . . . . . . . . . . . . . . . . . . . . . . . . . 8,431 8,736,624
Pilgrim's Pride Corp., 5.75%, 03/15/25 (Call 11/30/20)(a) . . . 10,050 10,288,687Simmons Foods Inc., 5.75%, 11/01/24 (Call 11/30/20)(a) . . . 5,106 5,074,088TreeHouse Foods Inc., 6.00%, 02/15/24
(Call 11/30/20)(a)(b) . . . . . . . . . . . . . . . . . . . . . . . . . . . . . . . . . . . . 6,147 6,269,086U.S. Foods Inc.
5.88%, 06/15/24 (Call 11/30/20)(a). . . . . . . . . . . . . . . . . . . . . . 5,607 5,628,0266.25%, 04/15/25 (Call 04/15/22)(a) . . . . . . . . . . . . . . . . . . . . . 9,470 9,864,584
110,765,465Food Service — 0.4%Aramark Services Inc.
5.00%, 04/01/25 (Call 11/30/20)(a)(b). . . . . . . . . . . . . . . . . . . . 5,600 5,684,3926.38%, 05/01/25 (Call 05/01/22)(a)(b) . . . . . . . . . . . . . . . . . . . 13,874 14,560,832
20,245,224Forest Products & Paper — 0.2%Mercer International Inc., 7.38%, 01/15/25 (Call 01/15/21) . 5,373 5,467,028Resolute Forest Products Inc., 5.88%, 05/15/23
(Call 11/30/20)(b) . . . . . . . . . . . . . . . . . . . . . . . . . . . . . . . . . . . . . . 3,719 3,648,548
9,115,576Gas — 0.3%AmeriGas Partners LP/AmeriGas Finance Corp.
5.50%, 05/20/25 (Call 02/20/25) . . . . . . . . . . . . . . . . . . . . . . . 6,250 6,671,8755.63%, 05/20/24 (Call 03/20/24)(b) . . . . . . . . . . . . . . . . . . . . . 6,855 7,309,144
Rockpoint Gas Storage Canada Ltd., 7.00%, 03/31/23(Call 11/30/20)(a) . . . . . . . . . . . . . . . . . . . . . . . . . . . . . . . . . . . . . . 3,671 3,394,145
17,375,164Hand & Machine Tools — 0.1%Colfax Corp., 6.00%, 02/15/24 (Call 02/15/21)(a). . . . . . . . . . . 6,020 6,262,064
Health Care - Products — 0.4%Avantor Inc., 6.00%, 10/01/24 (Call 11/06/20)(a) . . . . . . . . . . . 14,417 15,064,323Ortho-Clinical Diagnostics Inc./Ortho-Clinical
Diagnostics SA, 7.38%, 06/01/25 (Call 06/01/22)(a) . . . . . 3,760 3,939,157
19,003,480Health Care - Services — 5.3%Acadia Healthcare Co. Inc.
5.63%, 02/15/23 (Call 11/30/20)(b). . . . . . . . . . . . . . . . . . . . . . 6,485 6,518,7766.50%, 03/01/24 (Call 11/30/20)(b). . . . . . . . . . . . . . . . . . . . . . 4,117 4,211,920
Air Methods Corp., 8.00%, 05/15/25 (Call 11/30/20)(a) . . . . . 2,500 1,850,000Akumin Inc., 7.00%, 11/01/25 (Call 11/01/22)(a) . . . . . . . . . . . . 2,640 2,607,000Centene Corp.
4.75%, 01/15/25 (Call 11/30/20). . . . . . . . . . . . . . . . . . . . . . . . 12,175 12,521,3794.75%, 01/15/25 (Call 11/30/20)(b). . . . . . . . . . . . . . . . . . . . . . 9,638 9,912,201
CHS/Community Health Systems Inc.6.25%, 03/31/23 (Call 11/30/20). . . . . . . . . . . . . . . . . . . . . . . . 25,197 25,034,4796.63%, 02/15/25 (Call 02/15/22)(a) . . . . . . . . . . . . . . . . . . . . . 12,750 12,479,0626.88%, 04/01/28 (Call 04/01/23)(a)(b) . . . . . . . . . . . . . . . . . . . 2,455 1,241,0038.13%, 06/30/24 (Call 06/30/21)(a) . . . . . . . . . . . . . . . . . . . . . 12,025 9,306,1478.63%, 01/15/24 (Call 01/15/21)(a) . . . . . . . . . . . . . . . . . . . . . 8,387 8,516,4749.88%, 06/30/23 (Call 11/16/20)(a)(d). . . . . . . . . . . . . . . . . . . . 14,449 11,987,510
Schedule of Investments (continued)
October 31, 2020
iShares� 0-5 Year High Yield Corporate Bond ETF(Percentages shown are based on Net Assets)
S C H E D U L E O F I N V E S T M E N T S 17
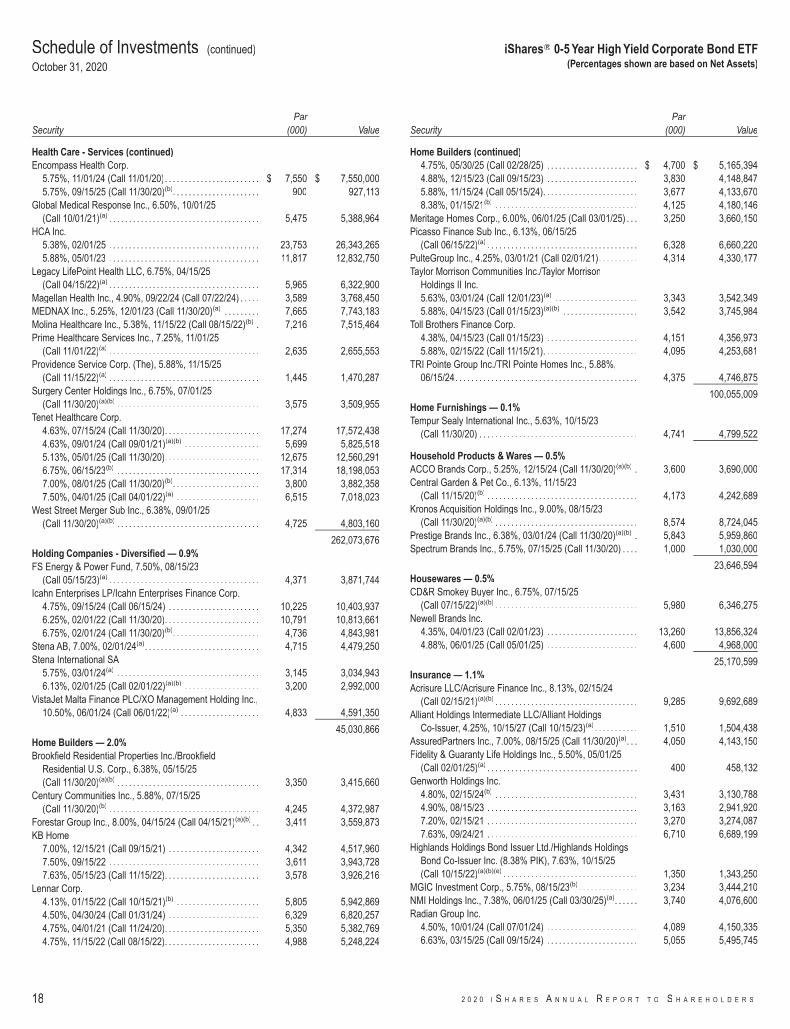
SecurityPar
(000) Value
Health Care - Services (continued)Encompass Health Corp.
5.75%, 11/01/24 (Call 11/01/20). . . . . . . . . . . . . . . . . . . . . . . . $ 7,550 $ 7,550,0005.75%, 09/15/25 (Call 11/30/20)(b). . . . . . . . . . . . . . . . . . . . . . 900 927,113
Global Medical Response Inc., 6.50%, 10/01/25(Call 10/01/21)(a) . . . . . . . . . . . . . . . . . . . . . . . . . . . . . . . . . . . . . . 5,475 5,388,964
HCA Inc.5.38%, 02/01/25 . . . . . . . . . . . . . . . . . . . . . . . . . . . . . . . . . . . . . . 23,753 26,343,2655.88%, 05/01/23 . . . . . . . . . . . . . . . . . . . . . . . . . . . . . . . . . . . . . . 11,817 12,832,750
Legacy LifePoint Health LLC, 6.75%, 04/15/25(Call 04/15/22)(a) . . . . . . . . . . . . . . . . . . . . . . . . . . . . . . . . . . . . . . 5,965 6,322,900
Magellan Health Inc., 4.90%, 09/22/24 (Call 07/22/24) . . . . . 3,589 3,768,450MEDNAX Inc., 5.25%, 12/01/23 (Call 11/30/20)(a) . . . . . . . . . 7,665 7,743,183Molina Healthcare Inc., 5.38%, 11/15/22 (Call 08/15/22)(b) . 7,216 7,515,464Prime Healthcare Services Inc., 7.25%, 11/01/25
(Call 11/01/22)(a) . . . . . . . . . . . . . . . . . . . . . . . . . . . . . . . . . . . . . . 2,635 2,655,553Providence Service Corp. (The), 5.88%, 11/15/25
(Call 11/15/22)(a) . . . . . . . . . . . . . . . . . . . . . . . . . . . . . . . . . . . . . . 1,445 1,470,287Surgery Center Holdings Inc., 6.75%, 07/01/25
(Call 11/30/20)(a)(b) . . . . . . . . . . . . . . . . . . . . . . . . . . . . . . . . . . . . 3,575 3,509,955Tenet Healthcare Corp.
4.63%, 07/15/24 (Call 11/30/20). . . . . . . . . . . . . . . . . . . . . . . . 17,274 17,572,4384.63%, 09/01/24 (Call 09/01/21)(a)(b) . . . . . . . . . . . . . . . . . . . 5,699 5,825,5185.13%, 05/01/25 (Call 11/30/20). . . . . . . . . . . . . . . . . . . . . . . . 12,675 12,560,2916.75%, 06/15/23(b) . . . . . . . . . . . . . . . . . . . . . . . . . . . . . . . . . . . . 17,314 18,198,0537.00%, 08/01/25 (Call 11/30/20)(b). . . . . . . . . . . . . . . . . . . . . . 3,800 3,882,3587.50%, 04/01/25 (Call 04/01/22)(a) . . . . . . . . . . . . . . . . . . . . . 6,515 7,018,023
West Street Merger Sub Inc., 6.38%, 09/01/25(Call 11/30/20)(a)(b) . . . . . . . . . . . . . . . . . . . . . . . . . . . . . . . . . . . . 4,725 4,803,160
262,073,676Holding Companies - Diversified — 0.9%FS Energy & Power Fund, 7.50%, 08/15/23
(Call 05/15/23)(a) . . . . . . . . . . . . . . . . . . . . . . . . . . . . . . . . . . . . . . 4,371 3,871,744Icahn Enterprises LP/Icahn Enterprises Finance Corp.
4.75%, 09/15/24 (Call 06/15/24) . . . . . . . . . . . . . . . . . . . . . . . 10,225 10,403,9376.25%, 02/01/22 (Call 11/30/20). . . . . . . . . . . . . . . . . . . . . . . . 10,791 10,813,6616.75%, 02/01/24 (Call 11/30/20)(b). . . . . . . . . . . . . . . . . . . . . . 4,736 4,843,981
Stena AB, 7.00%, 02/01/24(a). . . . . . . . . . . . . . . . . . . . . . . . . . . . . 4,715 4,479,250Stena International SA
5.75%, 03/01/24(a) . . . . . . . . . . . . . . . . . . . . . . . . . . . . . . . . . . . . 3,145 3,034,9436.13%, 02/01/25 (Call 02/01/22)(a)(b) . . . . . . . . . . . . . . . . . . . 3,200 2,992,000
VistaJet Malta Finance PLC/XO Management Holding Inc.,10.50%, 06/01/24 (Call 06/01/22)(a) . . . . . . . . . . . . . . . . . . . . 4,833 4,591,350
45,030,866Home Builders — 2.0%Brookfield Residential Properties Inc./Brookfield
Residential U.S. Corp., 6.38%, 05/15/25(Call 11/30/20)(a)(b) . . . . . . . . . . . . . . . . . . . . . . . . . . . . . . . . . . . . 3,350 3,415,660
Century Communities Inc., 5.88%, 07/15/25(Call 11/30/20)(b) . . . . . . . . . . . . . . . . . . . . . . . . . . . . . . . . . . . . . . 4,245 4,372,987
Forestar Group Inc., 8.00%, 04/15/24 (Call 04/15/21)(a)(b) . . 3,411 3,559,873KB Home
7.00%, 12/15/21 (Call 09/15/21) . . . . . . . . . . . . . . . . . . . . . . . 4,342 4,517,9607.50%, 09/15/22 . . . . . . . . . . . . . . . . . . . . . . . . . . . . . . . . . . . . . . 3,611 3,943,7287.63%, 05/15/23 (Call 11/15/22). . . . . . . . . . . . . . . . . . . . . . . . 3,578 3,926,216
Lennar Corp.4.13%, 01/15/22 (Call 10/15/21)(b) . . . . . . . . . . . . . . . . . . . . . 5,805 5,942,8694.50%, 04/30/24 (Call 01/31/24) . . . . . . . . . . . . . . . . . . . . . . . 6,329 6,820,2574.75%, 04/01/21 (Call 11/24/20). . . . . . . . . . . . . . . . . . . . . . . . 5,350 5,382,7694.75%, 11/15/22 (Call 08/15/22). . . . . . . . . . . . . . . . . . . . . . . . 4,988 5,248,224
SecurityPar
(000) Value
Home Builders (continued)4.75%, 05/30/25 (Call 02/28/25) . . . . . . . . . . . . . . . . . . . . . . . $ 4,700 $ 5,165,3944.88%, 12/15/23 (Call 09/15/23) . . . . . . . . . . . . . . . . . . . . . . . 3,830 4,148,8475.88%, 11/15/24 (Call 05/15/24). . . . . . . . . . . . . . . . . . . . . . . . 3,677 4,133,6708.38%, 01/15/21(b) . . . . . . . . . . . . . . . . . . . . . . . . . . . . . . . . . . . . 4,125 4,180,146
Meritage Homes Corp., 6.00%, 06/01/25 (Call 03/01/25) . . . 3,250 3,660,150Picasso Finance Sub Inc., 6.13%, 06/15/25
(Call 06/15/22)(a) . . . . . . . . . . . . . . . . . . . . . . . . . . . . . . . . . . . . . . 6,328 6,660,220PulteGroup Inc., 4.25%, 03/01/21 (Call 02/01/21). . . . . . . . . . 4,314 4,330,177Taylor Morrison Communities Inc./Taylor Morrison
Holdings II Inc.5.63%, 03/01/24 (Call 12/01/23)(a) . . . . . . . . . . . . . . . . . . . . . 3,343 3,542,3495.88%, 04/15/23 (Call 01/15/23)(a)(b) . . . . . . . . . . . . . . . . . . . 3,542 3,745,984
Toll Brothers Finance Corp.4.38%, 04/15/23 (Call 01/15/23) . . . . . . . . . . . . . . . . . . . . . . . 4,151 4,356,9735.88%, 02/15/22 (Call 11/15/21). . . . . . . . . . . . . . . . . . . . . . . . 4,095 4,253,681
TRI Pointe Group Inc./TRI Pointe Homes Inc., 5.88%,06/15/24. . . . . . . . . . . . . . . . . . . . . . . . . . . . . . . . . . . . . . . . . . . . . . 4,375 4,746,875
100,055,009Home Furnishings — 0.1%Tempur Sealy International Inc., 5.63%, 10/15/23
(Call 11/30/20) . . . . . . . . . . . . . . . . . . . . . . . . . . . . . . . . . . . . . . . . 4,741 4,799,522
Household Products & Wares — 0.5%ACCO Brands Corp., 5.25%, 12/15/24 (Call 11/30/20)(a)(b) . 3,600 3,690,000Central Garden & Pet Co., 6.13%, 11/15/23
(Call 11/15/20)(b) . . . . . . . . . . . . . . . . . . . . . . . . . . . . . . . . . . . . . . 4,173 4,242,689Kronos Acquisition Holdings Inc., 9.00%, 08/15/23
(Call 11/30/20)(a)(b) . . . . . . . . . . . . . . . . . . . . . . . . . . . . . . . . . . . . 8,574 8,724,045Prestige Brands Inc., 6.38%, 03/01/24 (Call 11/30/20)(a)(b) . 5,843 5,959,860Spectrum Brands Inc., 5.75%, 07/15/25 (Call 11/30/20) . . . . 1,000 1,030,000
23,646,594Housewares — 0.5%CD&R Smokey Buyer Inc., 6.75%, 07/15/25
(Call 07/15/22)(a)(b) . . . . . . . . . . . . . . . . . . . . . . . . . . . . . . . . . . . . 5,980 6,346,275Newell Brands Inc.
4.35%, 04/01/23 (Call 02/01/23) . . . . . . . . . . . . . . . . . . . . . . . 13,260 13,856,3244.88%, 06/01/25 (Call 05/01/25) . . . . . . . . . . . . . . . . . . . . . . . 4,600 4,968,000
25,170,599Insurance — 1.1%Acrisure LLC/Acrisure Finance Inc., 8.13%, 02/15/24
(Call 02/15/21)(a)(b) . . . . . . . . . . . . . . . . . . . . . . . . . . . . . . . . . . . . 9,285 9,692,689Alliant Holdings Intermediate LLC/Alliant Holdings
Co-Issuer, 4.25%, 10/15/27 (Call 10/15/23)(a) . . . . . . . . . . . 1,510 1,504,438AssuredPartners Inc., 7.00%, 08/15/25 (Call 11/30/20)(a). . . 4,050 4,143,150Fidelity & Guaranty Life Holdings Inc., 5.50%, 05/01/25
(Call 02/01/25)(a) . . . . . . . . . . . . . . . . . . . . . . . . . . . . . . . . . . . . . . 400 458,132Genworth Holdings Inc.
4.80%, 02/15/24(b) . . . . . . . . . . . . . . . . . . . . . . . . . . . . . . . . . . . . 3,431 3,130,7884.90%, 08/15/23 . . . . . . . . . . . . . . . . . . . . . . . . . . . . . . . . . . . . . . 3,163 2,941,9207.20%, 02/15/21 . . . . . . . . . . . . . . . . . . . . . . . . . . . . . . . . . . . . . . 3,270 3,274,0877.63%, 09/24/21 . . . . . . . . . . . . . . . . . . . . . . . . . . . . . . . . . . . . . . 6,710 6,689,199
Highlands Holdings Bond Issuer Ltd./Highlands HoldingsBond Co-Issuer Inc. (8.38% PIK), 7.63%, 10/15/25(Call 10/15/22)(a)(b)(e) . . . . . . . . . . . . . . . . . . . . . . . . . . . . . . . . . . 1,350 1,343,250
MGIC Investment Corp., 5.75%, 08/15/23(b) . . . . . . . . . . . . . . . 3,234 3,444,210NMI Holdings Inc., 7.38%, 06/01/25 (Call 03/30/25)(a). . . . . . 3,740 4,076,600Radian Group Inc.
4.50%, 10/01/24 (Call 07/01/24) . . . . . . . . . . . . . . . . . . . . . . . 4,089 4,150,3356.63%, 03/15/25 (Call 09/15/24) . . . . . . . . . . . . . . . . . . . . . . . 5,055 5,495,745
Schedule of Investments (continued)
October 31, 2020
iShares� 0-5 Year High Yield Corporate Bond ETF(Percentages shown are based on Net Assets)
18 2 0 2 0 I S H A R E S A N N U A L R E P O R T T O S H A R E H O L D E R S
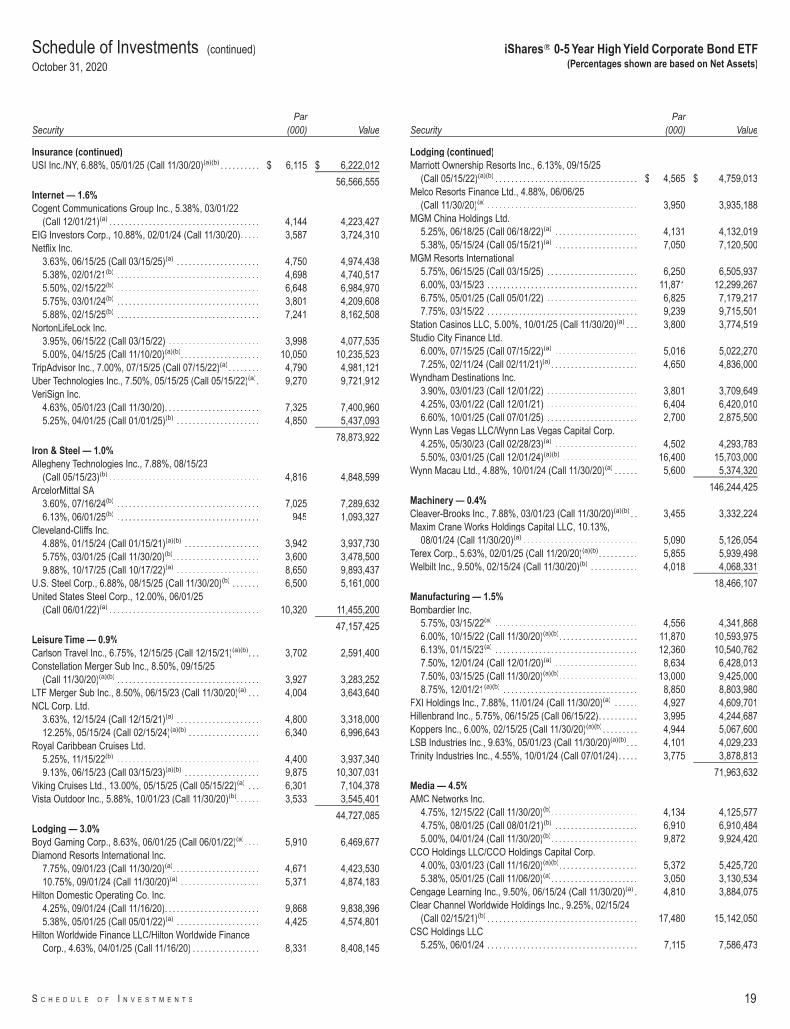
SecurityPar
(000) Value
Insurance (continued)USI Inc./NY, 6.88%, 05/01/25 (Call 11/30/20)(a)(b) . . . . . . . . . . $ 6,115 $ 6,222,012
56,566,555Internet — 1.6%Cogent Communications Group Inc., 5.38%, 03/01/22
(Call 12/01/21)(a) . . . . . . . . . . . . . . . . . . . . . . . . . . . . . . . . . . . . . . 4,144 4,223,427EIG Investors Corp., 10.88%, 02/01/24 (Call 11/30/20). . . . . 3,587 3,724,310Netflix Inc.
3.63%, 06/15/25 (Call 03/15/25)(a) . . . . . . . . . . . . . . . . . . . . . 4,750 4,974,4385.38%, 02/01/21(b) . . . . . . . . . . . . . . . . . . . . . . . . . . . . . . . . . . . . 4,698 4,740,5175.50%, 02/15/22(b) . . . . . . . . . . . . . . . . . . . . . . . . . . . . . . . . . . . . 6,648 6,984,9705.75%, 03/01/24(b) . . . . . . . . . . . . . . . . . . . . . . . . . . . . . . . . . . . . 3,801 4,209,6085.88%, 02/15/25(b) . . . . . . . . . . . . . . . . . . . . . . . . . . . . . . . . . . . . 7,241 8,162,508
NortonLifeLock Inc.3.95%, 06/15/22 (Call 03/15/22) . . . . . . . . . . . . . . . . . . . . . . . 3,998 4,077,5355.00%, 04/15/25 (Call 11/10/20)(a)(b). . . . . . . . . . . . . . . . . . . . 10,050 10,235,523
TripAdvisor Inc., 7.00%, 07/15/25 (Call 07/15/22)(a) . . . . . . . . 4,790 4,981,121Uber Technologies Inc., 7.50%, 05/15/25 (Call 05/15/22)(a). 9,270 9,721,912VeriSign Inc.
4.63%, 05/01/23 (Call 11/30/20). . . . . . . . . . . . . . . . . . . . . . . . 7,325 7,400,9605.25%, 04/01/25 (Call 01/01/25)(b) . . . . . . . . . . . . . . . . . . . . . 4,850 5,437,093
78,873,922Iron & Steel — 1.0%Allegheny Technologies Inc., 7.88%, 08/15/23
(Call 05/15/23)(b) . . . . . . . . . . . . . . . . . . . . . . . . . . . . . . . . . . . . . . 4,816 4,848,599ArcelorMittal SA
3.60%, 07/16/24(b) . . . . . . . . . . . . . . . . . . . . . . . . . . . . . . . . . . . . 7,025 7,289,6326.13%, 06/01/25(b) . . . . . . . . . . . . . . . . . . . . . . . . . . . . . . . . . . . . 945 1,093,327
Cleveland-Cliffs Inc.4.88%, 01/15/24 (Call 01/15/21)(a)(b) . . . . . . . . . . . . . . . . . . . 3,942 3,937,7305.75%, 03/01/25 (Call 11/30/20)(b). . . . . . . . . . . . . . . . . . . . . . 3,600 3,478,5009.88%, 10/17/25 (Call 10/17/22)(a) . . . . . . . . . . . . . . . . . . . . . 8,650 9,893,437
U.S. Steel Corp., 6.88%, 08/15/25 (Call 11/30/20)(b) . . . . . . . 6,500 5,161,000United States Steel Corp., 12.00%, 06/01/25
(Call 06/01/22)(a) . . . . . . . . . . . . . . . . . . . . . . . . . . . . . . . . . . . . . . 10,320 11,455,200
47,157,425Leisure Time — 0.9%Carlson Travel Inc., 6.75%, 12/15/25 (Call 12/15/21)(a)(b). . . 3,702 2,591,400Constellation Merger Sub Inc., 8.50%, 09/15/25
(Call 11/30/20)(a)(b) . . . . . . . . . . . . . . . . . . . . . . . . . . . . . . . . . . . . 3,927 3,283,252LTF Merger Sub Inc., 8.50%, 06/15/23 (Call 11/30/20)(a) . . . 4,004 3,643,640NCL Corp. Ltd.
3.63%, 12/15/24 (Call 12/15/21)(a) . . . . . . . . . . . . . . . . . . . . . 4,800 3,318,00012.25%, 05/15/24 (Call 02/15/24)(a)(b) . . . . . . . . . . . . . . . . . . 6,340 6,996,643
Royal Caribbean Cruises Ltd.5.25%, 11/15/22(b) . . . . . . . . . . . . . . . . . . . . . . . . . . . . . . . . . . . . 4,400 3,937,3409.13%, 06/15/23 (Call 03/15/23)(a)(b) . . . . . . . . . . . . . . . . . . . 9,875 10,307,031
Viking Cruises Ltd., 13.00%, 05/15/25 (Call 05/15/22)(a) . . . 6,301 7,104,378Vista Outdoor Inc., 5.88%, 10/01/23 (Call 11/30/20)(b). . . . . . 3,533 3,545,401
44,727,085Lodging — 3.0%Boyd Gaming Corp., 8.63%, 06/01/25 (Call 06/01/22)(a). . . . 5,910 6,469,677Diamond Resorts International Inc.
7.75%, 09/01/23 (Call 11/30/20)(a). . . . . . . . . . . . . . . . . . . . . . 4,671 4,423,53010.75%, 09/01/24 (Call 11/30/20)(a) . . . . . . . . . . . . . . . . . . . . 5,371 4,874,183
Hilton Domestic Operating Co. Inc.4.25%, 09/01/24 (Call 11/16/20). . . . . . . . . . . . . . . . . . . . . . . . 9,868 9,838,3965.38%, 05/01/25 (Call 05/01/22)(a) . . . . . . . . . . . . . . . . . . . . . 4,425 4,574,801
Hilton Worldwide Finance LLC/Hilton Worldwide FinanceCorp., 4.63%, 04/01/25 (Call 11/16/20) . . . . . . . . . . . . . . . . . 8,331 8,408,145
SecurityPar
(000) Value
Lodging (continued)Marriott Ownership Resorts Inc., 6.13%, 09/15/25
(Call 05/15/22)(a)(b) . . . . . . . . . . . . . . . . . . . . . . . . . . . . . . . . . . . . $ 4,565 $ 4,759,013Melco Resorts Finance Ltd., 4.88%, 06/06/25
(Call 11/30/20)(a) . . . . . . . . . . . . . . . . . . . . . . . . . . . . . . . . . . . . . . 3,950 3,935,188MGM China Holdings Ltd.
5.25%, 06/18/25 (Call 06/18/22)(a) . . . . . . . . . . . . . . . . . . . . . 4,131 4,132,0195.38%, 05/15/24 (Call 05/15/21)(a) . . . . . . . . . . . . . . . . . . . . . 7,050 7,120,500
MGM Resorts International5.75%, 06/15/25 (Call 03/15/25) . . . . . . . . . . . . . . . . . . . . . . . 6,250 6,505,9376.00%, 03/15/23 . . . . . . . . . . . . . . . . . . . . . . . . . . . . . . . . . . . . . . 11,871 12,299,2676.75%, 05/01/25 (Call 05/01/22) . . . . . . . . . . . . . . . . . . . . . . . 6,825 7,179,2177.75%, 03/15/22 . . . . . . . . . . . . . . . . . . . . . . . . . . . . . . . . . . . . . . 9,239 9,715,501
Station Casinos LLC, 5.00%, 10/01/25 (Call 11/30/20)(a) . . . 3,800 3,774,519Studio City Finance Ltd.
6.00%, 07/15/25 (Call 07/15/22)(a) . . . . . . . . . . . . . . . . . . . . . 5,016 5,022,2707.25%, 02/11/24 (Call 02/11/21)(a). . . . . . . . . . . . . . . . . . . . . . 4,650 4,836,000
Wyndham Destinations Inc.3.90%, 03/01/23 (Call 12/01/22) . . . . . . . . . . . . . . . . . . . . . . . 3,801 3,709,6494.25%, 03/01/22 (Call 12/01/21) . . . . . . . . . . . . . . . . . . . . . . . 6,404 6,420,0106.60%, 10/01/25 (Call 07/01/25) . . . . . . . . . . . . . . . . . . . . . . . 2,700 2,875,500
Wynn Las Vegas LLC/Wynn Las Vegas Capital Corp.4.25%, 05/30/23 (Call 02/28/23)(a) . . . . . . . . . . . . . . . . . . . . . 4,502 4,293,7835.50%, 03/01/25 (Call 12/01/24)(a)(b) . . . . . . . . . . . . . . . . . . . 16,400 15,703,000
Wynn Macau Ltd., 4.88%, 10/01/24 (Call 11/30/20)(a) . . . . . . 5,600 5,374,320
146,244,425Machinery — 0.4%Cleaver-Brooks Inc., 7.88%, 03/01/23 (Call 11/30/20)(a)(b) . . 3,455 3,332,224Maxim Crane Works Holdings Capital LLC, 10.13%,
08/01/24 (Call 11/30/20)(a) . . . . . . . . . . . . . . . . . . . . . . . . . . . . . 5,090 5,126,054Terex Corp., 5.63%, 02/01/25 (Call 11/20/20)(a)(b). . . . . . . . . . 5,855 5,939,498Welbilt Inc., 9.50%, 02/15/24 (Call 11/30/20)(b) . . . . . . . . . . . . 4,018 4,068,331
18,466,107Manufacturing — 1.5%Bombardier Inc.
5.75%, 03/15/22(a) . . . . . . . . . . . . . . . . . . . . . . . . . . . . . . . . . . . . 4,556 4,341,8686.00%, 10/15/22 (Call 11/30/20)(a)(b). . . . . . . . . . . . . . . . . . . . 11,870 10,593,9756.13%, 01/15/23(a) . . . . . . . . . . . . . . . . . . . . . . . . . . . . . . . . . . . . 12,360 10,540,7627.50%, 12/01/24 (Call 12/01/20)(a) . . . . . . . . . . . . . . . . . . . . . 8,634 6,428,0137.50%, 03/15/25 (Call 11/30/20)(a)(b). . . . . . . . . . . . . . . . . . . . 13,000 9,425,0008.75%, 12/01/21(a)(b) . . . . . . . . . . . . . . . . . . . . . . . . . . . . . . . . . . 8,850 8,803,980
FXI Holdings Inc., 7.88%, 11/01/24 (Call 11/30/20)(a) . . . . . . 4,927 4,609,701Hillenbrand Inc., 5.75%, 06/15/25 (Call 06/15/22). . . . . . . . . . 3,995 4,244,687Koppers Inc., 6.00%, 02/15/25 (Call 11/30/20)(a)(b) . . . . . . . . . 4,944 5,067,600LSB Industries Inc., 9.63%, 05/01/23 (Call 11/30/20)(a)(b). . . 4,101 4,029,233Trinity Industries Inc., 4.55%, 10/01/24 (Call 07/01/24). . . . . 3,775 3,878,813
71,963,632Media — 4.5%AMC Networks Inc.
4.75%, 12/15/22 (Call 11/30/20)(b). . . . . . . . . . . . . . . . . . . . . . 4,134 4,125,5774.75%, 08/01/25 (Call 08/01/21)(b) . . . . . . . . . . . . . . . . . . . . . 6,910 6,910,4845.00%, 04/01/24 (Call 11/30/20)(b). . . . . . . . . . . . . . . . . . . . . . 9,872 9,924,420
CCO Holdings LLC/CCO Holdings Capital Corp.4.00%, 03/01/23 (Call 11/16/20)(a)(b). . . . . . . . . . . . . . . . . . . . 5,372 5,425,7205.38%, 05/01/25 (Call 11/06/20)(a). . . . . . . . . . . . . . . . . . . . . . 3,050 3,130,534
Cengage Learning Inc., 9.50%, 06/15/24 (Call 11/30/20)(a) . 4,810 3,884,075Clear Channel Worldwide Holdings Inc., 9.25%, 02/15/24
(Call 02/15/21)(b) . . . . . . . . . . . . . . . . . . . . . . . . . . . . . . . . . . . . . . 17,480 15,142,050CSC Holdings LLC
5.25%, 06/01/24 . . . . . . . . . . . . . . . . . . . . . . . . . . . . . . . . . . . . . . 7,115 7,586,473
Schedule of Investments (continued)
October 31, 2020
iShares� 0-5 Year High Yield Corporate Bond ETF(Percentages shown are based on Net Assets)
S C H E D U L E O F I N V E S T M E N T S 19

SecurityPar
(000) Value
Media (continued)5.88%, 09/15/22 . . . . . . . . . . . . . . . . . . . . . . . . . . . . . . . . . . . . . . $ 6,138 $ 6,473,3986.75%, 11/15/21 . . . . . . . . . . . . . . . . . . . . . . . . . . . . . . . . . . . . . . 8,877 9,275,726
DISH DBS Corp.5.00%, 03/15/23(b) . . . . . . . . . . . . . . . . . . . . . . . . . . . . . . . . . . . . 13,815 13,887,0005.88%, 07/15/22 . . . . . . . . . . . . . . . . . . . . . . . . . . . . . . . . . . . . . . 17,848 18,345,1945.88%, 11/15/24 . . . . . . . . . . . . . . . . . . . . . . . . . . . . . . . . . . . . . . 18,389 18,515,4246.75%, 06/01/21 . . . . . . . . . . . . . . . . . . . . . . . . . . . . . . . . . . . . . . 18,082 18,443,640
Entercom Media Corp., 7.25%, 11/01/24(Call 11/30/20)(a)(b) . . . . . . . . . . . . . . . . . . . . . . . . . . . . . . . . . . . . 3,660 3,092,700
EW Scripps Co. (The), 5.13%, 05/15/25(Call 11/30/20)(a)(b) . . . . . . . . . . . . . . . . . . . . . . . . . . . . . . . . . . . . 3,750 3,571,875
Quebecor Media Inc., 5.75%, 01/15/23(b) . . . . . . . . . . . . . . . . . 7,724 8,295,576Sinclair Television Group Inc., 5.63%, 08/01/24
(Call 11/16/20)(a) . . . . . . . . . . . . . . . . . . . . . . . . . . . . . . . . . . . . . . 5,373 5,358,758Sirius XM Radio Inc.
3.88%, 08/01/22 (Call 11/30/20)(a)(b). . . . . . . . . . . . . . . . . . . . 9,359 9,429,1924.63%, 07/15/24 (Call 07/15/21)(a) . . . . . . . . . . . . . . . . . . . . . 14,350 14,797,720
Univision Communications Inc.5.13%, 02/15/25 (Call 11/10/20)(a)(b). . . . . . . . . . . . . . . . . . . . 13,766 13,537,2099.50%, 05/01/25 (Call 05/01/22)(a) . . . . . . . . . . . . . . . . . . . . . 3,370 3,650,552
Urban One Inc., 7.38%, 04/15/22 (Call 11/30/20)(a) . . . . . . . . 3,413 3,179,210Videotron Ltd.
5.00%, 07/15/22 . . . . . . . . . . . . . . . . . . . . . . . . . . . . . . . . . . . . . . 7,882 8,236,7625.38%, 06/15/24 (Call 03/15/24)(a) . . . . . . . . . . . . . . . . . . . . . 5,679 6,168,012
220,387,281Metal Fabricate & Hardware — 0.2%Grinding Media Inc./Moly-Cop AltaSteel Ltd., 7.38%,
12/15/23 (Call 11/30/20)(a)(b) . . . . . . . . . . . . . . . . . . . . . . . . . . . 8,492 8,534,460
Mining — 1.7%Alcoa Nederland Holding BV, 6.75%, 09/30/24
(Call 11/30/20)(a) . . . . . . . . . . . . . . . . . . . . . . . . . . . . . . . . . . . . . . 7,078 7,286,801Arconic Corp., 6.00%, 05/15/25 (Call 05/15/22)(a). . . . . . . . . . 6,825 7,225,969Constellium SE
5.75%, 05/15/24 (Call 11/30/20)(a). . . . . . . . . . . . . . . . . . . . . . 3,887 3,936,4046.63%, 03/01/25 (Call 11/30/20)(a)(b). . . . . . . . . . . . . . . . . . . . 6,350 6,454,409
FMG Resources August 2006 Pty Ltd.4.75%, 05/15/22 (Call 02/15/22)(a) . . . . . . . . . . . . . . . . . . . . . 6,525 6,679,6425.13%, 03/15/23 (Call 12/15/22)(a) . . . . . . . . . . . . . . . . . . . . . 4,850 5,053,0945.13%, 05/15/24 (Call 02/15/24)(a) . . . . . . . . . . . . . . . . . . . . . 7,200 7,680,672
Freeport-McMoRan Inc.3.55%, 03/01/22 (Call 12/01/21)(b) . . . . . . . . . . . . . . . . . . . . . 5,945 6,021,7903.88%, 03/15/23 (Call 12/15/22)(b) . . . . . . . . . . . . . . . . . . . . . 15,681 16,190,6324.55%, 11/14/24 (Call 08/14/24)(b). . . . . . . . . . . . . . . . . . . . . . 7,149 7,679,680
Kaiser Aluminum Corp., 6.50%, 05/01/25(Call 05/01/22)(a)(b) . . . . . . . . . . . . . . . . . . . . . . . . . . . . . . . . . . . . 3,490 3,708,125
Perenti Finance Pty Ltd., 6.50%, 10/07/25(Call 10/07/22)(a) . . . . . . . . . . . . . . . . . . . . . . . . . . . . . . . . . . . . . . 3,800 3,967,833
81,885,051Office & Business Equipment — 0.7%CDW LLC/CDW Finance Corp.
4.13%, 05/01/25 (Call 05/01/22) . . . . . . . . . . . . . . . . . . . . . . . 5,095 5,290,9035.50%, 12/01/24 (Call 06/01/24)(b) . . . . . . . . . . . . . . . . . . . . . 5,900 6,505,045
Pitney Bowes Inc.4.63%, 03/15/24 (Call 12/15/23)(b) . . . . . . . . . . . . . . . . . . . . . 3,250 3,136,2505.95%, 04/01/23 (Call 03/01/23) . . . . . . . . . . . . . . . . . . . . . . . 691 687,545
Xerox Corp.4.38%, 03/15/23 (Call 02/15/23)(b) . . . . . . . . . . . . . . . . . . . . . 9,226 9,613,2614.50%, 05/15/21(b) . . . . . . . . . . . . . . . . . . . . . . . . . . . . . . . . . . . . 3,137 3,184,055
SecurityPar
(000) Value
Office & Business Equipment (continued)Xerox Holdings Corp., 5.00%, 08/15/25 (Call 07/15/25)(a) . . $ 6,990 $ 6,874,945
35,292,004Oil & Gas — 7.8%Aker BP ASA, 5.88%, 03/31/25 (Call 03/31/21)(a)(b) . . . . . . . . 4,850 5,006,170Antero Resources Corp.
5.00%, 03/01/25 (Call 11/30/20)(b). . . . . . . . . . . . . . . . . . . . . . 3,800 2,820,5505.13%, 12/01/22 (Call 11/30/20). . . . . . . . . . . . . . . . . . . . . . . . 7,275 6,747,5625.38%, 11/01/21 (Call 11/30/20)(b). . . . . . . . . . . . . . . . . . . . . . 9,743 9,762,4865.63%, 06/01/23 (Call 11/30/20)(b). . . . . . . . . . . . . . . . . . . . . . 5,400 4,553,438
Apache Corp., 4.63%, 11/15/25 (Call 08/15/25). . . . . . . . . . . . 650 615,875Ascent Resources Utica Holdings LLC/ARU Finance
Corp., 9.00%, 11/01/27 (Call 11/01/26)(a) . . . . . . . . . . . . . . . 3,116 3,022,520Baytex Energy Corp., 5.63%, 06/01/24 (Call 11/30/20)(a) . . . 675 363,488Calumet Specialty Products Partners LP/Calumet
Finance Corp.7.63%, 01/15/22 (Call 11/30/20). . . . . . . . . . . . . . . . . . . . . . . . 917 907,8309.25%, 07/15/24 (Call 07/15/21)(a) . . . . . . . . . . . . . . . . . . . . . 1,767 1,917,19511.00%, 04/15/25 (Call 10/15/21)(a)(b) . . . . . . . . . . . . . . . . . . 4,380 4,244,001
Cenovus Energy Inc.3.00%, 08/15/22 (Call 05/15/22) . . . . . . . . . . . . . . . . . . . . . . . 4,250 4,207,2023.80%, 09/15/23 (Call 06/15/23) . . . . . . . . . . . . . . . . . . . . . . . 4,850 4,899,4775.38%, 07/15/25 (Call 04/15/25)(b) . . . . . . . . . . . . . . . . . . . . . 9,120 9,610,200
Citgo Holding Inc., 9.25%, 08/01/24 (Call 08/01/21)(a). . . . . . 12,330 10,326,375CITGO Petroleum Corp.
6.25%, 08/15/22 (Call 11/30/20)(a). . . . . . . . . . . . . . . . . . . . . . 5,636 5,424,6507.00%, 06/15/25 (Call 06/15/22)(a) . . . . . . . . . . . . . . . . . . . . . 10,400 9,647,040
Comstock Resources Inc., 7.50%, 05/15/25(Call 11/30/20)(a) . . . . . . . . . . . . . . . . . . . . . . . . . . . . . . . . . . . . . . 5,754 5,711,804
Continental Resources Inc./OK3.80%, 06/01/24 (Call 03/01/24) . . . . . . . . . . . . . . . . . . . . . . . 9,550 8,893,4374.50%, 04/15/23 (Call 01/15/23)(b) . . . . . . . . . . . . . . . . . . . . . 14,350 13,675,5505.00%, 09/15/22 (Call 11/30/20). . . . . . . . . . . . . . . . . . . . . . . . 8,050 7,932,809
CrownRock LP/CrownRock Finance Inc., 5.63%, 10/15/25(Call 11/30/20)(a) . . . . . . . . . . . . . . . . . . . . . . . . . . . . . . . . . . . . . . 4,000 3,930,000
CVR Energy Inc., 5.25%, 02/15/25 (Call 02/15/22)(a). . . . . . . 5,405 3,932,138Endeavor Energy Resources LP/EER Finance Inc., 6.63%,
07/15/25 (Call 07/15/22)(a) . . . . . . . . . . . . . . . . . . . . . . . . . . . . . 5,400 5,622,750EQT Corp.
3.00%, 10/01/22 (Call 09/01/22)(b) . . . . . . . . . . . . . . . . . . . . . 7,310 7,293,9187.88%, 02/01/25 (Call 01/01/25) . . . . . . . . . . . . . . . . . . . . . . . 9,050 10,068,125
Hilcorp Energy I LP/Hilcorp Finance Co.5.00%, 12/01/24 (Call 11/30/20)(a). . . . . . . . . . . . . . . . . . . . . . 4,625 4,244,8835.75%, 10/01/25 (Call 11/30/20)(a). . . . . . . . . . . . . . . . . . . . . . 2,475 2,280,094
Ithaca Energy North Sea PLC, 9.38%, 07/15/24(Call 07/15/21)(a) . . . . . . . . . . . . . . . . . . . . . . . . . . . . . . . . . . . . . . 4,497 3,912,390
Laredo Petroleum Inc., 9.50%, 01/15/25 (Call 01/15/22) . . . 3,650 1,692,688Leviathan Bond Ltd.
5.75%, 06/30/23 (Call 03/30/23)(a) . . . . . . . . . . . . . . . . . . . . . 4,455 4,553,4556.13%, 06/30/25 (Call 03/30/25)(a) . . . . . . . . . . . . . . . . . . . . . 5,160 5,326,410
MEG Energy Corp.6.50%, 01/15/25 (Call 11/30/20)(a). . . . . . . . . . . . . . . . . . . . . . 4,500 4,396,5007.00%, 03/31/24 (Call 11/30/20)(a). . . . . . . . . . . . . . . . . . . . . . 5,469 5,170,484
Montage Resources Corp., 8.88%, 07/15/23(Call 11/13/20) . . . . . . . . . . . . . . . . . . . . . . . . . . . . . . . . . . . . . . . . 5,161 5,256,847
Murphy Oil Corp.4.95%, 12/01/22 (Call 09/01/22) . . . . . . . . . . . . . . . . . . . . . . . 455 434,9805.75%, 08/15/25 (Call 11/30/20). . . . . . . . . . . . . . . . . . . . . . . . 4,700 3,860,5336.88%, 08/15/24 (Call 11/30/20). . . . . . . . . . . . . . . . . . . . . . . . 5,143 4,534,606
Neptune Energy Bondco PLC, 6.63%, 05/15/25(Call 05/15/21)(a) . . . . . . . . . . . . . . . . . . . . . . . . . . . . . . . . . . . . . . 7,750 6,744,050
Schedule of Investments (continued)
October 31, 2020
iShares� 0-5 Year High Yield Corporate Bond ETF(Percentages shown are based on Net Assets)
20 2 0 2 0 I S H A R E S A N N U A L R E P O R T T O S H A R E H O L D E R S
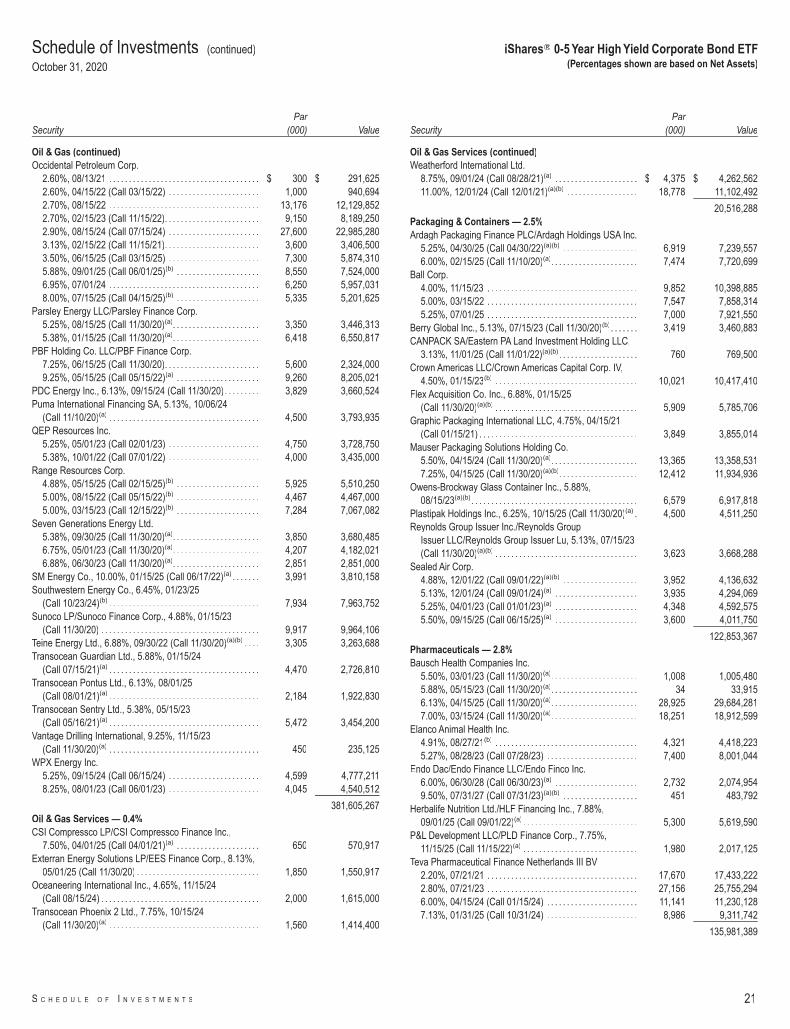
SecurityPar
(000) Value
Oil & Gas (continued)Occidental Petroleum Corp.
2.60%, 08/13/21 . . . . . . . . . . . . . . . . . . . . . . . . . . . . . . . . . . . . . . $ 300 $ 291,6252.60%, 04/15/22 (Call 03/15/22) . . . . . . . . . . . . . . . . . . . . . . . 1,000 940,6942.70%, 08/15/22 . . . . . . . . . . . . . . . . . . . . . . . . . . . . . . . . . . . . . . 13,176 12,129,8522.70%, 02/15/23 (Call 11/15/22). . . . . . . . . . . . . . . . . . . . . . . . 9,150 8,189,2502.90%, 08/15/24 (Call 07/15/24) . . . . . . . . . . . . . . . . . . . . . . . 27,600 22,985,2803.13%, 02/15/22 (Call 11/15/21). . . . . . . . . . . . . . . . . . . . . . . . 3,600 3,406,5003.50%, 06/15/25 (Call 03/15/25) . . . . . . . . . . . . . . . . . . . . . . . 7,300 5,874,3105.88%, 09/01/25 (Call 06/01/25)(b) . . . . . . . . . . . . . . . . . . . . . 8,550 7,524,0006.95%, 07/01/24 . . . . . . . . . . . . . . . . . . . . . . . . . . . . . . . . . . . . . . 6,250 5,957,0318.00%, 07/15/25 (Call 04/15/25)(b) . . . . . . . . . . . . . . . . . . . . . 5,335 5,201,625
Parsley Energy LLC/Parsley Finance Corp.5.25%, 08/15/25 (Call 11/30/20)(a). . . . . . . . . . . . . . . . . . . . . . 3,350 3,446,3135.38%, 01/15/25 (Call 11/30/20)(a). . . . . . . . . . . . . . . . . . . . . . 6,418 6,550,817
PBF Holding Co. LLC/PBF Finance Corp.7.25%, 06/15/25 (Call 11/30/20). . . . . . . . . . . . . . . . . . . . . . . . 5,600 2,324,0009.25%, 05/15/25 (Call 05/15/22)(a) . . . . . . . . . . . . . . . . . . . . . 9,260 8,205,021
PDC Energy Inc., 6.13%, 09/15/24 (Call 11/30/20). . . . . . . . . 3,829 3,660,524Puma International Financing SA, 5.13%, 10/06/24
(Call 11/10/20)(a) . . . . . . . . . . . . . . . . . . . . . . . . . . . . . . . . . . . . . . 4,500 3,793,935QEP Resources Inc.
5.25%, 05/01/23 (Call 02/01/23) . . . . . . . . . . . . . . . . . . . . . . . 4,750 3,728,7505.38%, 10/01/22 (Call 07/01/22) . . . . . . . . . . . . . . . . . . . . . . . 4,000 3,435,000
Range Resources Corp.4.88%, 05/15/25 (Call 02/15/25)(b) . . . . . . . . . . . . . . . . . . . . . 5,925 5,510,2505.00%, 08/15/22 (Call 05/15/22)(b) . . . . . . . . . . . . . . . . . . . . . 4,467 4,467,0005.00%, 03/15/23 (Call 12/15/22)(b) . . . . . . . . . . . . . . . . . . . . . 7,284 7,067,082
Seven Generations Energy Ltd.5.38%, 09/30/25 (Call 11/30/20)(a). . . . . . . . . . . . . . . . . . . . . . 3,850 3,680,4856.75%, 05/01/23 (Call 11/30/20)(a). . . . . . . . . . . . . . . . . . . . . . 4,207 4,182,0216.88%, 06/30/23 (Call 11/30/20)(a). . . . . . . . . . . . . . . . . . . . . . 2,851 2,851,000
SM Energy Co., 10.00%, 01/15/25 (Call 06/17/22)(a) . . . . . . . 3,991 3,810,158Southwestern Energy Co., 6.45%, 01/23/25
(Call 10/23/24)(b) . . . . . . . . . . . . . . . . . . . . . . . . . . . . . . . . . . . . . . 7,934 7,963,752Sunoco LP/Sunoco Finance Corp., 4.88%, 01/15/23
(Call 11/30/20) . . . . . . . . . . . . . . . . . . . . . . . . . . . . . . . . . . . . . . . . 9,917 9,964,106Teine Energy Ltd., 6.88%, 09/30/22 (Call 11/30/20)(a)(b) . . . . 3,305 3,263,688Transocean Guardian Ltd., 5.88%, 01/15/24
(Call 07/15/21)(a) . . . . . . . . . . . . . . . . . . . . . . . . . . . . . . . . . . . . . . 4,470 2,726,810Transocean Pontus Ltd., 6.13%, 08/01/25
(Call 08/01/21)(a) . . . . . . . . . . . . . . . . . . . . . . . . . . . . . . . . . . . . . . 2,184 1,922,830Transocean Sentry Ltd., 5.38%, 05/15/23
(Call 05/16/21)(a) . . . . . . . . . . . . . . . . . . . . . . . . . . . . . . . . . . . . . . 5,472 3,454,200Vantage Drilling International, 9.25%, 11/15/23
(Call 11/30/20)(a) . . . . . . . . . . . . . . . . . . . . . . . . . . . . . . . . . . . . . . 450 235,125WPX Energy Inc.
5.25%, 09/15/24 (Call 06/15/24) . . . . . . . . . . . . . . . . . . . . . . . 4,599 4,777,2118.25%, 08/01/23 (Call 06/01/23) . . . . . . . . . . . . . . . . . . . . . . . 4,045 4,540,512
381,605,267Oil & Gas Services — 0.4%CSI Compressco LP/CSI Compressco Finance Inc.,
7.50%, 04/01/25 (Call 04/01/21)(a) . . . . . . . . . . . . . . . . . . . . . 650 570,917Exterran Energy Solutions LP/EES Finance Corp., 8.13%,
05/01/25 (Call 11/30/20) . . . . . . . . . . . . . . . . . . . . . . . . . . . . . . . 1,850 1,550,917Oceaneering International Inc., 4.65%, 11/15/24
(Call 08/15/24) . . . . . . . . . . . . . . . . . . . . . . . . . . . . . . . . . . . . . . . . 2,000 1,615,000Transocean Phoenix 2 Ltd., 7.75%, 10/15/24
(Call 11/30/20)(a) . . . . . . . . . . . . . . . . . . . . . . . . . . . . . . . . . . . . . . 1,560 1,414,400
SecurityPar
(000) Value
Oil & Gas Services (continued)Weatherford International Ltd.
8.75%, 09/01/24 (Call 08/28/21)(a) . . . . . . . . . . . . . . . . . . . . . $ 4,375 $ 4,262,56211.00%, 12/01/24 (Call 12/01/21)(a)(b) . . . . . . . . . . . . . . . . . . 18,778 11,102,492
20,516,288Packaging & Containers — 2.5%Ardagh Packaging Finance PLC/Ardagh Holdings USA Inc.
5.25%, 04/30/25 (Call 04/30/22)(a)(b) . . . . . . . . . . . . . . . . . . . 6,919 7,239,5576.00%, 02/15/25 (Call 11/10/20)(a). . . . . . . . . . . . . . . . . . . . . . 7,474 7,720,699
Ball Corp.4.00%, 11/15/23 . . . . . . . . . . . . . . . . . . . . . . . . . . . . . . . . . . . . . . 9,852 10,398,8855.00%, 03/15/22 . . . . . . . . . . . . . . . . . . . . . . . . . . . . . . . . . . . . . . 7,547 7,858,3145.25%, 07/01/25 . . . . . . . . . . . . . . . . . . . . . . . . . . . . . . . . . . . . . . 7,000 7,921,550
Berry Global Inc., 5.13%, 07/15/23 (Call 11/30/20)(b). . . . . . . 3,419 3,460,883CANPACK SA/Eastern PA Land Investment Holding LLC,
3.13%, 11/01/25 (Call 11/01/22)(a)(b). . . . . . . . . . . . . . . . . . . . 760 769,500Crown Americas LLC/Crown Americas Capital Corp. IV,
4.50%, 01/15/23(b) . . . . . . . . . . . . . . . . . . . . . . . . . . . . . . . . . . . . 10,021 10,417,410Flex Acquisition Co. Inc., 6.88%, 01/15/25
(Call 11/30/20)(a)(b) . . . . . . . . . . . . . . . . . . . . . . . . . . . . . . . . . . . . 5,909 5,785,706Graphic Packaging International LLC, 4.75%, 04/15/21
(Call 01/15/21) . . . . . . . . . . . . . . . . . . . . . . . . . . . . . . . . . . . . . . . . 3,849 3,855,014Mauser Packaging Solutions Holding Co.
5.50%, 04/15/24 (Call 11/30/20)(a). . . . . . . . . . . . . . . . . . . . . . 13,365 13,358,5317.25%, 04/15/25 (Call 11/30/20)(a)(b). . . . . . . . . . . . . . . . . . . . 12,412 11,934,936
Owens-Brockway Glass Container Inc., 5.88%,08/15/23(a)(b) . . . . . . . . . . . . . . . . . . . . . . . . . . . . . . . . . . . . . . . . . . 6,579 6,917,818
Plastipak Holdings Inc., 6.25%, 10/15/25 (Call 11/30/20)(a) . 4,500 4,511,250Reynolds Group Issuer Inc./Reynolds Group
Issuer LLC/Reynolds Group Issuer Lu, 5.13%, 07/15/23(Call 11/30/20)(a)(b) . . . . . . . . . . . . . . . . . . . . . . . . . . . . . . . . . . . . 3,623 3,668,288
Sealed Air Corp.4.88%, 12/01/22 (Call 09/01/22)(a)(b) . . . . . . . . . . . . . . . . . . . 3,952 4,136,6325.13%, 12/01/24 (Call 09/01/24)(a) . . . . . . . . . . . . . . . . . . . . . 3,935 4,294,0695.25%, 04/01/23 (Call 01/01/23)(a) . . . . . . . . . . . . . . . . . . . . . 4,348 4,592,5755.50%, 09/15/25 (Call 06/15/25)(a) . . . . . . . . . . . . . . . . . . . . . 3,600 4,011,750
122,853,367Pharmaceuticals — 2.8%Bausch Health Companies Inc.
5.50%, 03/01/23 (Call 11/30/20)(a). . . . . . . . . . . . . . . . . . . . . . 1,008 1,005,4805.88%, 05/15/23 (Call 11/30/20)(a). . . . . . . . . . . . . . . . . . . . . . 34 33,9156.13%, 04/15/25 (Call 11/30/20)(a). . . . . . . . . . . . . . . . . . . . . . 28,925 29,684,2817.00%, 03/15/24 (Call 11/30/20)(a). . . . . . . . . . . . . . . . . . . . . . 18,251 18,912,599
Elanco Animal Health Inc.4.91%, 08/27/21(b) . . . . . . . . . . . . . . . . . . . . . . . . . . . . . . . . . . . . 4,321 4,418,2235.27%, 08/28/23 (Call 07/28/23) . . . . . . . . . . . . . . . . . . . . . . . 7,400 8,001,044
Endo Dac/Endo Finance LLC/Endo Finco Inc.6.00%, 06/30/28 (Call 06/30/23)(a) . . . . . . . . . . . . . . . . . . . . . 2,732 2,074,9549.50%, 07/31/27 (Call 07/31/23)(a)(b) . . . . . . . . . . . . . . . . . . . 451 483,792
Herbalife Nutrition Ltd./HLF Financing Inc., 7.88%,09/01/25 (Call 09/01/22)(a) . . . . . . . . . . . . . . . . . . . . . . . . . . . . . 5,300 5,619,590
P&L Development LLC/PLD Finance Corp., 7.75%,11/15/25 (Call 11/15/22)(a) . . . . . . . . . . . . . . . . . . . . . . . . . . . . . 1,980 2,017,125
Teva Pharmaceutical Finance Netherlands III BV2.20%, 07/21/21 . . . . . . . . . . . . . . . . . . . . . . . . . . . . . . . . . . . . . . 17,670 17,433,2222.80%, 07/21/23 . . . . . . . . . . . . . . . . . . . . . . . . . . . . . . . . . . . . . . 27,156 25,755,2946.00%, 04/15/24 (Call 01/15/24) . . . . . . . . . . . . . . . . . . . . . . . 11,141 11,230,1287.13%, 01/31/25 (Call 10/31/24) . . . . . . . . . . . . . . . . . . . . . . . 8,986 9,311,742
135,981,389
Schedule of Investments (continued)
October 31, 2020
iShares� 0-5 Year High Yield Corporate Bond ETF(Percentages shown are based on Net Assets)
S C H E D U L E O F I N V E S T M E N T S 21

SecurityPar
(000) Value
Pipelines — 3.9%American Midstream Partners LP/American Midstream
Finance Corp., 9.50%, 12/15/21 (Call 11/30/20)(a). . . . . . . $ 3,916 $ 3,798,520Antero Midstream Partners LP/Antero Midstream Finance
Corp., 5.38%, 09/15/24 (Call 11/16/20) . . . . . . . . . . . . . . . . . 6,070 5,676,664Blue Racer Midstream LLC/Blue Racer Finance Corp.,
6.13%, 11/15/22 (Call 11/30/20)(a). . . . . . . . . . . . . . . . . . . . . . 6,726 6,557,850Buckeye Partners LP
4.13%, 03/01/25 (Call 02/01/25)(a) . . . . . . . . . . . . . . . . . . . . . 4,398 4,156,1104.15%, 07/01/23 (Call 04/01/23) . . . . . . . . . . . . . . . . . . . . . . . 5,159 5,100,961
Cheniere Energy Partners LP, 5.25%, 10/01/25(Call 11/30/20) . . . . . . . . . . . . . . . . . . . . . . . . . . . . . . . . . . . . . . . . 7,000 7,120,400
Crestwood Midstream Partners LP/Crestwood MidstreamFinance Corp.5.75%, 04/01/25 (Call 11/30/20). . . . . . . . . . . . . . . . . . . . . . . . 4,100 3,717,3336.25%, 04/01/23 (Call 11/16/20). . . . . . . . . . . . . . . . . . . . . . . . 7,360 7,120,285
DCP Midstream Operating LP3.88%, 03/15/23 (Call 12/15/22) . . . . . . . . . . . . . . . . . . . . . . . 4,788 4,792,9884.75%, 09/30/21 (Call 06/30/21)(a) . . . . . . . . . . . . . . . . . . . . . 4,386 4,401,3514.95%, 04/01/22 (Call 01/01/22)(b) . . . . . . . . . . . . . . . . . . . . . 3,007 3,053,9845.38%, 07/15/25 (Call 04/15/25) . . . . . . . . . . . . . . . . . . . . . . . 7,620 8,001,000
EnLink Midstream Partners LP4.15%, 06/01/25 (Call 03/01/25) . . . . . . . . . . . . . . . . . . . . . . . 5,550 4,767,9434.40%, 04/01/24 (Call 01/01/24) . . . . . . . . . . . . . . . . . . . . . . . 5,298 4,797,127
EQM Midstream Partners LP4.00%, 08/01/24 (Call 05/01/24) . . . . . . . . . . . . . . . . . . . . . . . 4,074 3,952,5134.75%, 07/15/23 (Call 06/15/23) . . . . . . . . . . . . . . . . . . . . . . . 10,400 10,339,2926.00%, 07/01/25 (Call 04/01/25)(a) . . . . . . . . . . . . . . . . . . . . . 6,660 6,793,200
Genesis Energy LP/Genesis Energy Finance Corp.5.63%, 06/15/24 (Call 11/30/20). . . . . . . . . . . . . . . . . . . . . . . . 2,385 2,051,6016.00%, 05/15/23 (Call 11/30/20). . . . . . . . . . . . . . . . . . . . . . . . 4,174 3,808,7756.50%, 10/01/25 (Call 11/30/20). . . . . . . . . . . . . . . . . . . . . . . . 825 687,299
New Fortress Energy Inc., 6.75%, 09/15/25(Call 09/15/22)(a) . . . . . . . . . . . . . . . . . . . . . . . . . . . . . . . . . . . . . . 8,700 8,937,423
NGL Energy Partners LP/NGL Energy Finance Corp.6.13%, 03/01/25 (Call 11/30/20). . . . . . . . . . . . . . . . . . . . . . . . 1,725 849,5637.50%, 11/01/23 (Call 11/30/20). . . . . . . . . . . . . . . . . . . . . . . . 5,384 2,907,360
Northriver Midstream Finance LP, 5.63%, 02/15/26(Call 10/15/22)(a) . . . . . . . . . . . . . . . . . . . . . . . . . . . . . . . . . . . . . . 4,825 4,779,162
NuStar Logistics LP, 5.75%, 10/01/25 (Call 07/01/25) . . . . . . 5,435 5,457,311PBF Logistics LP/PBF Logistics Finance Corp., 6.88%,
05/15/23 (Call 11/30/20) . . . . . . . . . . . . . . . . . . . . . . . . . . . . . . . 4,864 3,781,760Rattler Midstream LP, 5.63%, 07/15/25 (Call 07/15/22)(a). . . 4,825 4,974,113Rockies Express Pipeline LLC, 3.60%, 05/15/25
(Call 04/15/25)(a) . . . . . . . . . . . . . . . . . . . . . . . . . . . . . . . . . . . . . . 3,300 3,286,826Ruby Pipeline LLC, 7.75%, 04/01/22(a). . . . . . . . . . . . . . . . . . . . 707 594,205Tallgrass Energy Partners LP/Tallgrass Energy
Finance Corp.4.75%, 10/01/23 (Call 11/30/20)(a). . . . . . . . . . . . . . . . . . . . . . 4,748 4,534,3405.50%, 09/15/24 (Call 11/30/20)(a). . . . . . . . . . . . . . . . . . . . . . 6,555 6,277,9657.50%, 10/01/25 (Call 10/01/22)(a) . . . . . . . . . . . . . . . . . . . . . 5,460 5,514,600
Targa Resources Partners LP/Targa Resources PartnersFinance Corp.4.25%, 11/15/23 (Call 11/30/20). . . . . . . . . . . . . . . . . . . . . . . . 5,384 5,390,7305.13%, 02/01/25 (Call 11/30/20). . . . . . . . . . . . . . . . . . . . . . . . 4,425 4,436,0625.25%, 05/01/23 (Call 11/02/20). . . . . . . . . . . . . . . . . . . . . . . . 5,940 5,940,000
Western Midstream Operating LP3.95%, 06/01/25 (Call 03/01/25) . . . . . . . . . . . . . . . . . . . . . . . 4,600 4,230,5284.00%, 07/01/22 (Call 04/01/22) . . . . . . . . . . . . . . . . . . . . . . . 5,050 5,055,4544.10%, 02/01/25 (Call 01/01/25) . . . . . . . . . . . . . . . . . . . . . . . 9,350 8,862,321
SecurityPar
(000) Value
Pipelines (continued)5.38%, 06/01/21 (Call 03/01/21) . . . . . . . . . . . . . . . . . . . . . . . $ 2,750 $ 2,767,188
189,272,107Real Estate — 0.8%Howard Hughes Corp. (The), 5.38%, 03/15/25
(Call 11/30/20)(a)(b) . . . . . . . . . . . . . . . . . . . . . . . . . . . . . . . . . . . . 9,350 9,379,219Kennedy-Wilson Inc., 5.88%, 04/01/24 (Call 11/30/20) . . . . . 10,725 10,478,325Newmark Group Inc., 6.13%, 11/15/23 (Call 10/15/23)(b) . . . 5,438 5,755,783Realogy Group LLC/Realogy Co-Issuer Corp.
4.88%, 06/01/23 (Call 03/01/23)(a) . . . . . . . . . . . . . . . . . . . . . 3,947 3,937,1327.63%, 06/15/25 (Call 06/15/22)(a) . . . . . . . . . . . . . . . . . . . . . 5,075 5,360,469
WeWork Companies Inc., 7.88%, 05/01/25(a). . . . . . . . . . . . . . 4,750 3,004,375
37,915,303Real Estate Investment Trusts — 4.2%Diversified Healthcare Trust, 9.75%, 06/15/25
(Call 06/15/22) . . . . . . . . . . . . . . . . . . . . . . . . . . . . . . . . . . . . . . . . 9,525 10,489,406ESH Hospitality Inc., 5.25%, 05/01/25 (Call 11/30/20)(a). . . . 12,275 12,277,106Felcor Lodging LP, 6.00%, 06/01/25 (Call 11/16/20)(b). . . . . . 3,250 3,186,524HAT Holdings I LLC/HAT Holdings II LLC
5.25%, 07/15/24 (Call 07/15/21)(a)(b) . . . . . . . . . . . . . . . . . . . 4,765 4,931,7756.00%, 04/15/25 (Call 04/15/22)(a) . . . . . . . . . . . . . . . . . . . . . 4,090 4,309,838
iStar Inc.4.25%, 08/01/25 (Call 05/01/25) . . . . . . . . . . . . . . . . . . . . . . . 5,026 4,622,7644.75%, 10/01/24 (Call 07/01/24) . . . . . . . . . . . . . . . . . . . . . . . 7,155 6,838,992
Ladder Capital Finance Holdings LLLP/Ladder CapitalFinance Corp., 5.25%, 03/15/22 (Call 09/15/21)(a) . . . . . . 5,144 4,996,515
MGM Growth Properties Operating Partnership LP/MGPFinance Co-Issuer Inc.4.63%, 06/15/25 (Call 03/15/25)(a)(b) . . . . . . . . . . . . . . . . . . . 7,250 7,373,0195.63%, 05/01/24 (Call 02/01/24)(b) . . . . . . . . . . . . . . . . . . . . . 9,833 10,341,858
MPT Operating Partnership LP/MPT Finance Corp.,6.38%, 03/01/24 (Call 11/30/20). . . . . . . . . . . . . . . . . . . . . . . . 4,859 4,963,711
New Residential Investment Corp., 6.25%, 10/15/25(Call 10/15/22)(a)(b) . . . . . . . . . . . . . . . . . . . . . . . . . . . . . . . . . . . . 5,225 5,002,938
Park Intermediate Holdings LLC/PK DomesticProperty LLC/PK Finance Co-Issuer, 7.50%, 06/01/25(Call 06/01/22)(a)(b) . . . . . . . . . . . . . . . . . . . . . . . . . . . . . . . . . . . . 5,550 5,812,931
RHP Hotel Properties LP/RHP Finance Corp., 5.00%,04/15/23 (Call 11/30/20)(b) . . . . . . . . . . . . . . . . . . . . . . . . . . . . . 3,842 3,755,928
SBA Communications Corp.4.00%, 10/01/22 (Call 11/30/20). . . . . . . . . . . . . . . . . . . . . . . . 7,196 7,252,4304.88%, 09/01/24 (Call 11/30/20)(b). . . . . . . . . . . . . . . . . . . . . . 10,632 10,894,079
Service Properties Trust4.35%, 10/01/24 (Call 09/01/24) . . . . . . . . . . . . . . . . . . . . . . . 8,350 7,376,6254.50%, 06/15/23 (Call 12/15/22)(b) . . . . . . . . . . . . . . . . . . . . . 5,050 4,839,8954.50%, 03/15/25 (Call 09/15/24)(b) . . . . . . . . . . . . . . . . . . . . . 2,500 2,150,0004.65%, 03/15/24 (Call 09/15/23) . . . . . . . . . . . . . . . . . . . . . . . 3,300 2,974,1255.00%, 08/15/22 (Call 02/15/22)(b) . . . . . . . . . . . . . . . . . . . . . 4,450 4,406,2667.50%, 09/15/25 (Call 06/15/25) . . . . . . . . . . . . . . . . . . . . . . . 7,050 7,372,523
Starwood Property Trust Inc.3.63%, 02/01/21 (Call 11/18/20)(b). . . . . . . . . . . . . . . . . . . . . . 5,061 5,059,8704.75%, 03/15/25 (Call 09/15/24) . . . . . . . . . . . . . . . . . . . . . . . 4,695 4,565,9815.00%, 12/15/21 (Call 09/15/21) . . . . . . . . . . . . . . . . . . . . . . . 6,450 6,433,875
Uniti Group LP/Uniti Fiber Holdings Inc./CSL Capital LLC7.13%, 12/15/24 (Call 11/30/20)(a)(b). . . . . . . . . . . . . . . . . . . . 4,850 4,637,3037.88%, 02/15/25 (Call 02/15/22)(a) . . . . . . . . . . . . . . . . . . . . . 21,355 22,636,558
Uniti Group LP/Uniti Group Finance Inc./CSL Capital LLC6.00%, 04/15/23 (Call 11/30/20)(a). . . . . . . . . . . . . . . . . . . . . . 5,129 5,199,5248.25%, 10/15/23 (Call 11/30/20). . . . . . . . . . . . . . . . . . . . . . . . 10,261 10,098,983
Schedule of Investments (continued)
October 31, 2020
iShares� 0-5 Year High Yield Corporate Bond ETF(Percentages shown are based on Net Assets)
22 2 0 2 0 I S H A R E S A N N U A L R E P O R T T O S H A R E H O L D E R S
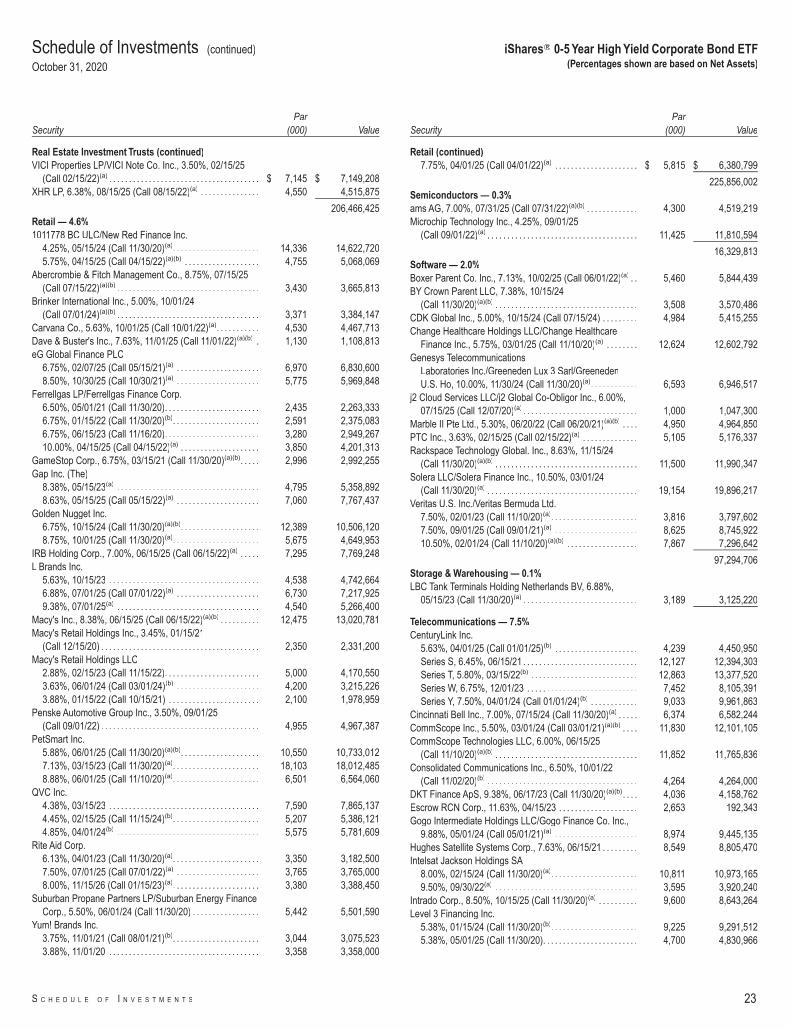
SecurityPar
(000) Value
Real Estate Investment Trusts (continued)VICI Properties LP/VICI Note Co. Inc., 3.50%, 02/15/25
(Call 02/15/22)(a) . . . . . . . . . . . . . . . . . . . . . . . . . . . . . . . . . . . . . . $ 7,145 $ 7,149,208XHR LP, 6.38%, 08/15/25 (Call 08/15/22)(a) . . . . . . . . . . . . . . . 4,550 4,515,875
206,466,425Retail — 4.6%1011778 BC ULC/New Red Finance Inc.
4.25%, 05/15/24 (Call 11/30/20)(a). . . . . . . . . . . . . . . . . . . . . . 14,336 14,622,7205.75%, 04/15/25 (Call 04/15/22)(a)(b) . . . . . . . . . . . . . . . . . . . 4,755 5,068,069
Abercrombie & Fitch Management Co., 8.75%, 07/15/25(Call 07/15/22)(a)(b) . . . . . . . . . . . . . . . . . . . . . . . . . . . . . . . . . . . . 3,430 3,665,813
Brinker International Inc., 5.00%, 10/01/24(Call 07/01/24)(a)(b) . . . . . . . . . . . . . . . . . . . . . . . . . . . . . . . . . . . . 3,371 3,384,147
Carvana Co., 5.63%, 10/01/25 (Call 10/01/22)(a). . . . . . . . . . . 4,530 4,467,713Dave & Buster's Inc., 7.63%, 11/01/25 (Call 11/01/22)(a)(b) . 1,130 1,108,813eG Global Finance PLC
6.75%, 02/07/25 (Call 05/15/21)(a) . . . . . . . . . . . . . . . . . . . . . 6,970 6,830,6008.50%, 10/30/25 (Call 10/30/21)(a) . . . . . . . . . . . . . . . . . . . . . 5,775 5,969,848
Ferrellgas LP/Ferrellgas Finance Corp.6.50%, 05/01/21 (Call 11/30/20). . . . . . . . . . . . . . . . . . . . . . . . 2,435 2,263,3336.75%, 01/15/22 (Call 11/30/20)(b). . . . . . . . . . . . . . . . . . . . . . 2,591 2,375,0836.75%, 06/15/23 (Call 11/16/20). . . . . . . . . . . . . . . . . . . . . . . . 3,280 2,949,26710.00%, 04/15/25 (Call 04/15/22)(a) . . . . . . . . . . . . . . . . . . . . 3,850 4,201,313
GameStop Corp., 6.75%, 03/15/21 (Call 11/30/20)(a)(b). . . . . 2,996 2,992,255Gap Inc. (The)
8.38%, 05/15/23(a) . . . . . . . . . . . . . . . . . . . . . . . . . . . . . . . . . . . . 4,795 5,358,8928.63%, 05/15/25 (Call 05/15/22)(a) . . . . . . . . . . . . . . . . . . . . . 7,060 7,767,437
Golden Nugget Inc.6.75%, 10/15/24 (Call 11/30/20)(a)(b). . . . . . . . . . . . . . . . . . . . 12,389 10,506,1208.75%, 10/01/25 (Call 11/30/20)(a). . . . . . . . . . . . . . . . . . . . . . 5,675 4,649,953
IRB Holding Corp., 7.00%, 06/15/25 (Call 06/15/22)(a) . . . . . 7,295 7,769,248L Brands Inc.
5.63%, 10/15/23 . . . . . . . . . . . . . . . . . . . . . . . . . . . . . . . . . . . . . . 4,538 4,742,6646.88%, 07/01/25 (Call 07/01/22)(a) . . . . . . . . . . . . . . . . . . . . . 6,730 7,217,9259.38%, 07/01/25(a) . . . . . . . . . . . . . . . . . . . . . . . . . . . . . . . . . . . . 4,540 5,266,400
Macy's Inc., 8.38%, 06/15/25 (Call 06/15/22)(a)(b) . . . . . . . . . . 12,475 13,020,781Macy's Retail Holdings Inc., 3.45%, 01/15/21
(Call 12/15/20) . . . . . . . . . . . . . . . . . . . . . . . . . . . . . . . . . . . . . . . . 2,350 2,331,200Macy's Retail Holdings LLC
2.88%, 02/15/23 (Call 11/15/22). . . . . . . . . . . . . . . . . . . . . . . . 5,000 4,170,5503.63%, 06/01/24 (Call 03/01/24)(b) . . . . . . . . . . . . . . . . . . . . . 4,200 3,215,2263.88%, 01/15/22 (Call 10/15/21) . . . . . . . . . . . . . . . . . . . . . . . 2,100 1,978,959
Penske Automotive Group Inc., 3.50%, 09/01/25(Call 09/01/22) . . . . . . . . . . . . . . . . . . . . . . . . . . . . . . . . . . . . . . . . 4,955 4,967,387
PetSmart Inc.5.88%, 06/01/25 (Call 11/30/20)(a)(b). . . . . . . . . . . . . . . . . . . . 10,550 10,733,0127.13%, 03/15/23 (Call 11/30/20)(a). . . . . . . . . . . . . . . . . . . . . . 18,103 18,012,4858.88%, 06/01/25 (Call 11/10/20)(a). . . . . . . . . . . . . . . . . . . . . . 6,501 6,564,060
QVC Inc.4.38%, 03/15/23 . . . . . . . . . . . . . . . . . . . . . . . . . . . . . . . . . . . . . . 7,590 7,865,1374.45%, 02/15/25 (Call 11/15/24)(b). . . . . . . . . . . . . . . . . . . . . . 5,207 5,386,1214.85%, 04/01/24(b) . . . . . . . . . . . . . . . . . . . . . . . . . . . . . . . . . . . . 5,575 5,781,609
Rite Aid Corp.6.13%, 04/01/23 (Call 11/30/20)(a). . . . . . . . . . . . . . . . . . . . . . 3,350 3,182,5007.50%, 07/01/25 (Call 07/01/22)(a) . . . . . . . . . . . . . . . . . . . . . 3,765 3,765,0008.00%, 11/15/26 (Call 01/15/23)(a). . . . . . . . . . . . . . . . . . . . . . 3,380 3,388,450
Suburban Propane Partners LP/Suburban Energy FinanceCorp., 5.50%, 06/01/24 (Call 11/30/20) . . . . . . . . . . . . . . . . . 5,442 5,501,590
Yum! Brands Inc.3.75%, 11/01/21 (Call 08/01/21)(b). . . . . . . . . . . . . . . . . . . . . . 3,044 3,075,5233.88%, 11/01/20 . . . . . . . . . . . . . . . . . . . . . . . . . . . . . . . . . . . . . . 3,358 3,358,000
SecurityPar
(000) Value
Retail (continued)7.75%, 04/01/25 (Call 04/01/22)(a) . . . . . . . . . . . . . . . . . . . . . $ 5,815 $ 6,380,799
225,856,002Semiconductors — 0.3%ams AG, 7.00%, 07/31/25 (Call 07/31/22)(a)(b) . . . . . . . . . . . . . 4,300 4,519,219Microchip Technology Inc., 4.25%, 09/01/25
(Call 09/01/22)(a) . . . . . . . . . . . . . . . . . . . . . . . . . . . . . . . . . . . . . . 11,425 11,810,594
16,329,813Software — 2.0%Boxer Parent Co. Inc., 7.13%, 10/02/25 (Call 06/01/22)(a) . . 5,460 5,844,439BY Crown Parent LLC, 7.38%, 10/15/24
(Call 11/30/20)(a)(b) . . . . . . . . . . . . . . . . . . . . . . . . . . . . . . . . . . . . 3,508 3,570,486CDK Global Inc., 5.00%, 10/15/24 (Call 07/15/24) . . . . . . . . . 4,984 5,415,255Change Healthcare Holdings LLC/Change Healthcare
Finance Inc., 5.75%, 03/01/25 (Call 11/10/20)(a) . . . . . . . . 12,624 12,602,792Genesys Telecommunications
Laboratories Inc./Greeneden Lux 3 Sarl/GreenedenU.S. Ho, 10.00%, 11/30/24 (Call 11/30/20)(a). . . . . . . . . . . . 6,593 6,946,517
j2 Cloud Services LLC/j2 Global Co-Obligor Inc., 6.00%,07/15/25 (Call 12/07/20)(a) . . . . . . . . . . . . . . . . . . . . . . . . . . . . . 1,000 1,047,300
Marble II Pte Ltd., 5.30%, 06/20/22 (Call 06/20/21)(a)(b) . . . . 4,950 4,964,850PTC Inc., 3.63%, 02/15/25 (Call 02/15/22)(a) . . . . . . . . . . . . . . 5,105 5,176,337Rackspace Technology Global. Inc., 8.63%, 11/15/24
(Call 11/30/20)(a)(b) . . . . . . . . . . . . . . . . . . . . . . . . . . . . . . . . . . . . 11,500 11,990,347Solera LLC/Solera Finance Inc., 10.50%, 03/01/24
(Call 11/30/20)(a) . . . . . . . . . . . . . . . . . . . . . . . . . . . . . . . . . . . . . . 19,154 19,896,217Veritas U.S. Inc./Veritas Bermuda Ltd.
7.50%, 02/01/23 (Call 11/10/20)(a). . . . . . . . . . . . . . . . . . . . . . 3,816 3,797,6027.50%, 09/01/25 (Call 09/01/21)(a) . . . . . . . . . . . . . . . . . . . . . 8,625 8,745,92210.50%, 02/01/24 (Call 11/10/20)(a)(b) . . . . . . . . . . . . . . . . . . 7,867 7,296,642
97,294,706Storage & Warehousing — 0.1%LBC Tank Terminals Holding Netherlands BV, 6.88%,
05/15/23 (Call 11/30/20)(a) . . . . . . . . . . . . . . . . . . . . . . . . . . . . . 3,189 3,125,220
Telecommunications — 7.5%CenturyLink Inc.
5.63%, 04/01/25 (Call 01/01/25)(b) . . . . . . . . . . . . . . . . . . . . . 4,239 4,450,950Series S, 6.45%, 06/15/21 . . . . . . . . . . . . . . . . . . . . . . . . . . . . . 12,127 12,394,303Series T, 5.80%, 03/15/22(b) . . . . . . . . . . . . . . . . . . . . . . . . . . . 12,863 13,377,520Series W, 6.75%, 12/01/23 . . . . . . . . . . . . . . . . . . . . . . . . . . . . 7,452 8,105,391Series Y, 7.50%, 04/01/24 (Call 01/01/24)(b) . . . . . . . . . . . . 9,033 9,961,863
Cincinnati Bell Inc., 7.00%, 07/15/24 (Call 11/30/20)(a) . . . . . 6,374 6,582,244CommScope Inc., 5.50%, 03/01/24 (Call 03/01/21)(a)(b) . . . . 11,830 12,101,105CommScope Technologies LLC, 6.00%, 06/15/25
(Call 11/10/20)(a)(b) . . . . . . . . . . . . . . . . . . . . . . . . . . . . . . . . . . . . 11,852 11,765,836Consolidated Communications Inc., 6.50%, 10/01/22
(Call 11/02/20)(b) . . . . . . . . . . . . . . . . . . . . . . . . . . . . . . . . . . . . . . 4,264 4,264,000DKT Finance ApS, 9.38%, 06/17/23 (Call 11/30/20)(a)(b). . . . 4,036 4,158,762Escrow RCN Corp., 11.63%, 04/15/23 . . . . . . . . . . . . . . . . . . . . 2,653 192,343Gogo Intermediate Holdings LLC/Gogo Finance Co. Inc.,
9.88%, 05/01/24 (Call 05/01/21)(a) . . . . . . . . . . . . . . . . . . . . . 8,974 9,445,135Hughes Satellite Systems Corp., 7.63%, 06/15/21 . . . . . . . . . 8,549 8,805,470Intelsat Jackson Holdings SA
8.00%, 02/15/24 (Call 11/30/20)(a). . . . . . . . . . . . . . . . . . . . . . 10,811 10,973,1659.50%, 09/30/22(a) . . . . . . . . . . . . . . . . . . . . . . . . . . . . . . . . . . . . 3,595 3,920,240
Intrado Corp., 8.50%, 10/15/25 (Call 11/30/20)(a) . . . . . . . . . . 9,600 8,643,264Level 3 Financing Inc.
5.38%, 01/15/24 (Call 11/30/20)(b). . . . . . . . . . . . . . . . . . . . . . 9,225 9,291,5125.38%, 05/01/25 (Call 11/30/20). . . . . . . . . . . . . . . . . . . . . . . . 4,700 4,830,966
Schedule of Investments (continued)
October 31, 2020
iShares� 0-5 Year High Yield Corporate Bond ETF(Percentages shown are based on Net Assets)
S C H E D U L E O F I N V E S T M E N T S 23
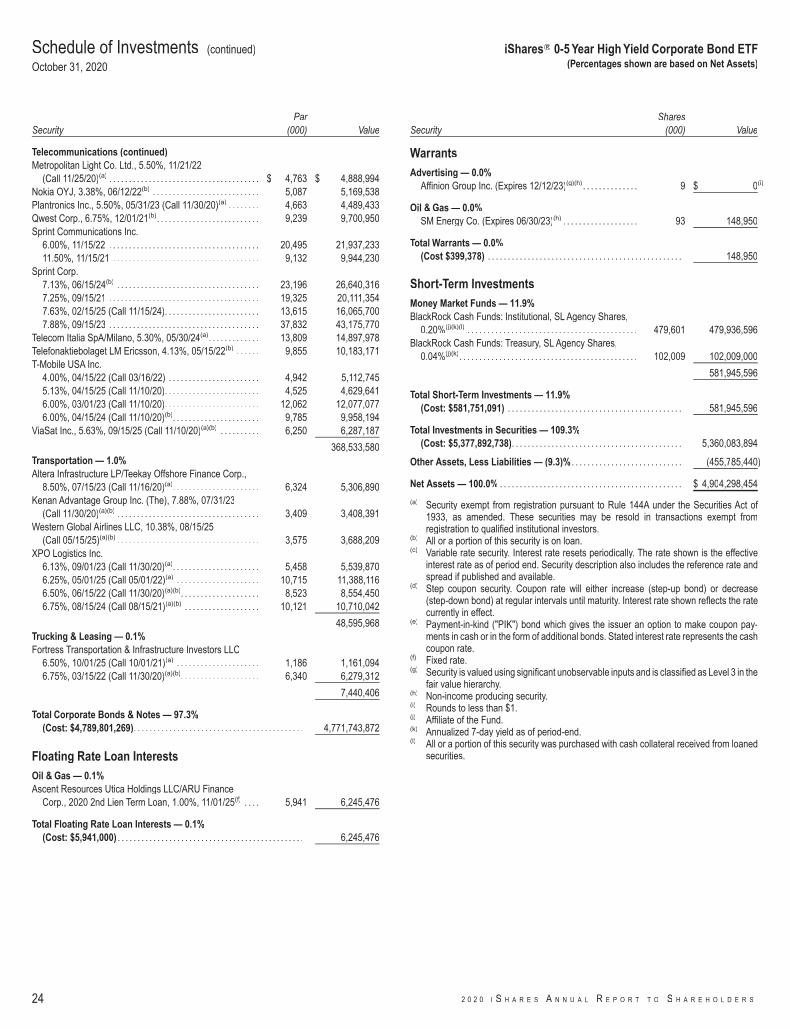
SecurityPar
(000) Value
Telecommunications (continued)Metropolitan Light Co. Ltd., 5.50%, 11/21/22
(Call 11/25/20)(a) . . . . . . . . . . . . . . . . . . . . . . . . . . . . . . . . . . . . . . $ 4,763 $ 4,888,994Nokia OYJ, 3.38%, 06/12/22(b) . . . . . . . . . . . . . . . . . . . . . . . . . . . 5,087 5,169,538Plantronics Inc., 5.50%, 05/31/23 (Call 11/30/20)(a) . . . . . . . . 4,663 4,489,433Qwest Corp., 6.75%, 12/01/21(b). . . . . . . . . . . . . . . . . . . . . . . . . . 9,239 9,700,950Sprint Communications Inc.
6.00%, 11/15/22 . . . . . . . . . . . . . . . . . . . . . . . . . . . . . . . . . . . . . . 20,495 21,937,23311.50%, 11/15/21 . . . . . . . . . . . . . . . . . . . . . . . . . . . . . . . . . . . . . 9,132 9,944,230
Sprint Corp.7.13%, 06/15/24(b) . . . . . . . . . . . . . . . . . . . . . . . . . . . . . . . . . . . . 23,196 26,640,3167.25%, 09/15/21 . . . . . . . . . . . . . . . . . . . . . . . . . . . . . . . . . . . . . . 19,325 20,111,3547.63%, 02/15/25 (Call 11/15/24). . . . . . . . . . . . . . . . . . . . . . . . 13,615 16,065,7007.88%, 09/15/23 . . . . . . . . . . . . . . . . . . . . . . . . . . . . . . . . . . . . . . 37,832 43,175,770
Telecom Italia SpA/Milano, 5.30%, 05/30/24(a). . . . . . . . . . . . . 13,809 14,897,978Telefonaktiebolaget LM Ericsson, 4.13%, 05/15/22(b) . . . . . . 9,855 10,183,171T-Mobile USA Inc.
4.00%, 04/15/22 (Call 03/16/22) . . . . . . . . . . . . . . . . . . . . . . . 4,942 5,112,7455.13%, 04/15/25 (Call 11/10/20). . . . . . . . . . . . . . . . . . . . . . . . 4,525 4,629,6416.00%, 03/01/23 (Call 11/10/20). . . . . . . . . . . . . . . . . . . . . . . . 12,062 12,077,0776.00%, 04/15/24 (Call 11/10/20)(b). . . . . . . . . . . . . . . . . . . . . . 9,785 9,958,194
ViaSat Inc., 5.63%, 09/15/25 (Call 11/10/20)(a)(b) . . . . . . . . . . 6,250 6,287,187
368,533,580Transportation — 1.0%Altera Infrastructure LP/Teekay Offshore Finance Corp.,
8.50%, 07/15/23 (Call 11/16/20)(a). . . . . . . . . . . . . . . . . . . . . . 6,324 5,306,890Kenan Advantage Group Inc. (The), 7.88%, 07/31/23
(Call 11/30/20)(a)(b) . . . . . . . . . . . . . . . . . . . . . . . . . . . . . . . . . . . . 3,409 3,408,391Western Global Airlines LLC, 10.38%, 08/15/25
(Call 05/15/25)(a)(b) . . . . . . . . . . . . . . . . . . . . . . . . . . . . . . . . . . . . 3,575 3,688,209XPO Logistics Inc.
6.13%, 09/01/23 (Call 11/30/20)(a). . . . . . . . . . . . . . . . . . . . . . 5,458 5,539,8706.25%, 05/01/25 (Call 05/01/22)(a) . . . . . . . . . . . . . . . . . . . . . 10,715 11,388,1166.50%, 06/15/22 (Call 11/30/20)(a)(b). . . . . . . . . . . . . . . . . . . . 8,523 8,554,4506.75%, 08/15/24 (Call 08/15/21)(a)(b) . . . . . . . . . . . . . . . . . . . 10,121 10,710,042
48,595,968Trucking & Leasing — 0.1%Fortress Transportation & Infrastructure Investors LLC
6.50%, 10/01/25 (Call 10/01/21)(a) . . . . . . . . . . . . . . . . . . . . . 1,186 1,161,0946.75%, 03/15/22 (Call 11/30/20)(a)(b). . . . . . . . . . . . . . . . . . . . 6,340 6,279,312
7,440,406
Total Corporate Bonds & Notes — 97.3%(Cost: $4,789,801,269). . . . . . . . . . . . . . . . . . . . . . . . . . . . . . . . . . . . . . . . . . . 4,771,743,872
Floating Rate Loan InterestsOil & Gas — 0.1%Ascent Resources Utica Holdings LLC/ARU Finance
Corp., 2020 2nd Lien Term Loan, 1.00%, 11/01/25(f) . . . . 5,941 6,245,476
Total Floating Rate Loan Interests — 0.1%(Cost: $5,941,000) . . . . . . . . . . . . . . . . . . . . . . . . . . . . . . . . . . . . . . . . . . . . . . . 6,245,476
SecurityShares
(000) Value
WarrantsAdvertising — 0.0%
Affinion Group Inc. (Expires 12/12/23)(g)(h) . . . . . . . . . . . . . . 9 $ 0(i)
Oil & Gas — 0.0%SM Energy Co. (Expires 06/30/23)(h) . . . . . . . . . . . . . . . . . . . 93 148,950
Total Warrants — 0.0%(Cost $399,378) . . . . . . . . . . . . . . . . . . . . . . . . . . . . . . . . . . . . . . . . . . . . . . . . . 148,950
Short-Term InvestmentsMoney Market Funds — 11.9%BlackRock Cash Funds: Institutional, SL Agency Shares,
0.20%(j)(k)(l) . . . . . . . . . . . . . . . . . . . . . . . . . . . . . . . . . . . . . . . . . . . 479,601 479,936,596BlackRock Cash Funds: Treasury, SL Agency Shares,
0.04%(j)(k). . . . . . . . . . . . . . . . . . . . . . . . . . . . . . . . . . . . . . . . . . . . . 102,009 102,009,000
581,945,596
Total Short-Term Investments — 11.9%(Cost: $581,751,091) . . . . . . . . . . . . . . . . . . . . . . . . . . . . . . . . . . . . . . . . . . . . 581,945,596
Total Investments in Securities — 109.3%(Cost: $5,377,892,738). . . . . . . . . . . . . . . . . . . . . . . . . . . . . . . . . . . . . . . . . . . 5,360,083,894
Other Assets, Less Liabilities — (9.3)% . . . . . . . . . . . . . . . . . . . . . . . . . . . . (455,785,440)
Net Assets — 100.0% . . . . . . . . . . . . . . . . . . . . . . . . . . . . . . . . . . . . . . . . . . . . . . $ 4,904,298,454
(a) Security exempt from registration pursuant to Rule 144A under the Securities Act of1933, as amended. These securities may be resold in transactions exempt fromregistration to qualified institutional investors.
(b) All or a portion of this security is on loan.(c) Variable rate security. Interest rate resets periodically. The rate shown is the effective
interest rate as of period end. Security description also includes the reference rate andspread if published and available.
(d) Step coupon security. Coupon rate will either increase (step-up bond) or decrease(step-down bond) at regular intervals until maturity. Interest rate shown reflects the ratecurrently in effect.
(e) Payment-in-kind ("PIK") bond which gives the issuer an option to make coupon pay-ments in cash or in the form of additional bonds. Stated interest rate represents the cashcoupon rate.
(f) Fixed rate.(g) Security is valued using significant unobservable inputs and is classified as Level 3 in the
fair value hierarchy.(h) Non-income producing security.(i) Rounds to less than $1.(j) Affiliate of the Fund.(k) Annualized 7-day yield as of period-end.(l) All or a portion of this security was purchased with cash collateral received from loaned
securities.
Schedule of Investments (continued)
October 31, 2020
iShares� 0-5 Year High Yield Corporate Bond ETF(Percentages shown are based on Net Assets)
24 2 0 2 0 I S H A R E S A N N U A L R E P O R T T O S H A R E H O L D E R S
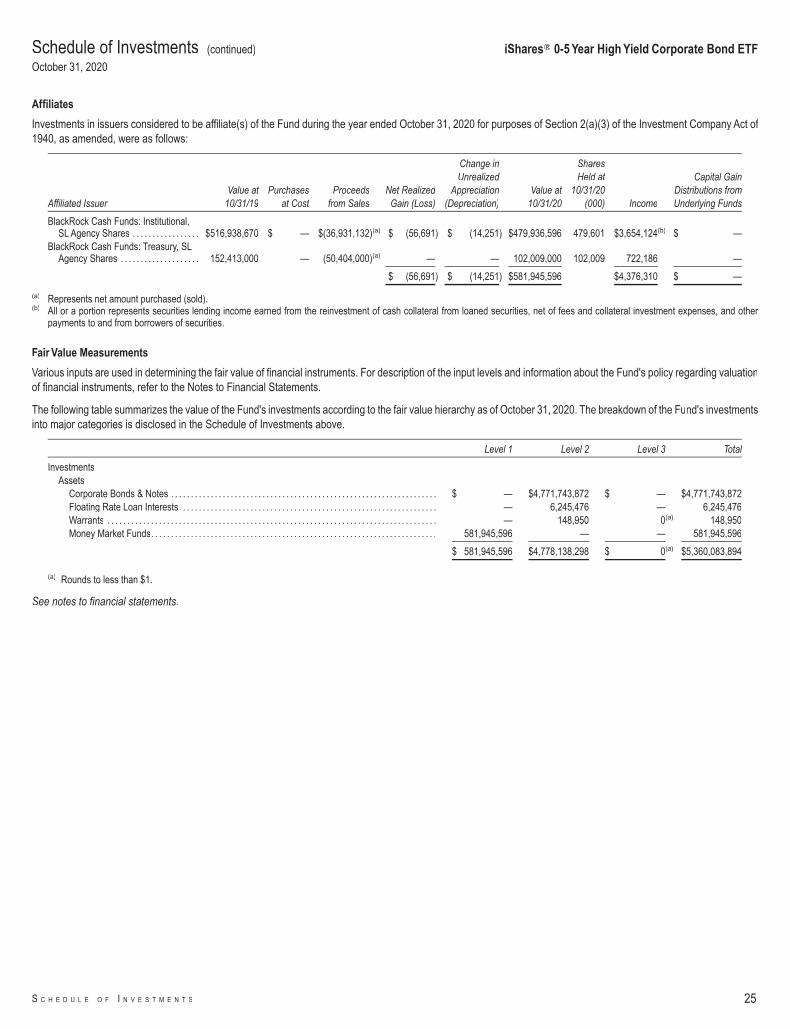
Affiliates
Investments in issuers considered to be affiliate(s) of the Fund during the year ended October 31, 2020 for purposes of Section 2(a)(3) of the Investment Company Act of1940, as amended, were as follows:
Affiliated IssuerValue at
10/31/19Purchases
at CostProceeds
from SalesNet Realized
Gain (Loss)
Change inUnrealized
Appreciation(Depreciation)
Value at10/31/20
SharesHeld at
10/31/20(000) Income
Capital GainDistributions fromUnderlying Funds
BlackRock Cash Funds: Institutional,SL Agency Shares . . . . . . . . . . . . . . . . . $516,938,670 $ — $(36,931,132)(a) $ (56,691) $ (14,251) $479,936,596 479,601 $3,654,124(b) $ —
BlackRock Cash Funds: Treasury, SLAgency Shares . . . . . . . . . . . . . . . . . . . . 152,413,000 — (50,404,000)(a) — — 102,009,000 102,009 722,186 —
$ (56,691) $ (14,251) $581,945,596 $4,376,310 $ —
(a) Represents net amount purchased (sold).(b) All or a portion represents securities lending income earned from the reinvestment of cash collateral from loaned securities, net of fees and collateral investment expenses, and other
payments to and from borrowers of securities.
Fair Value Measurements
Various inputs are used in determining the fair value of financial instruments. For description of the input levels and information about the Fund's policy regarding valuationof financial instruments, refer to the Notes to Financial Statements.
The following table summarizes the value of the Fund's investments according to the fair value hierarchy as of October 31, 2020. The breakdown of the Fund's investmentsinto major categories is disclosed in the Schedule of Investments above.
Level 1 Level 2 Level 3 Total
InvestmentsAssets
Corporate Bonds & Notes . . . . . . . . . . . . . . . . . . . . . . . . . . . . . . . . . . . . . . . . . . . . . . . . . . . . . . . . . . . . . . . . . . . $ — $4,771,743,872 $ — $4,771,743,872Floating Rate Loan Interests. . . . . . . . . . . . . . . . . . . . . . . . . . . . . . . . . . . . . . . . . . . . . . . . . . . . . . . . . . . . . . . . . — 6,245,476 — 6,245,476Warrants . . . . . . . . . . . . . . . . . . . . . . . . . . . . . . . . . . . . . . . . . . . . . . . . . . . . . . . . . . . . . . . . . . . . . . . . . . . . . . . . . . . — 148,950 0(a) 148,950Money Market Funds. . . . . . . . . . . . . . . . . . . . . . . . . . . . . . . . . . . . . . . . . . . . . . . . . . . . . . . . . . . . . . . . . . . . . . . . 581,945,596 — — 581,945,596
$ 581,945,596 $4,778,138,298 $ 0(a) $5,360,083,894
(a) Rounds to less than $1.
See notes to financial statements.
Schedule of Investments (continued)
October 31, 2020
iShares� 0-5 Year High Yield Corporate Bond ETF
S C H E D U L E O F I N V E S T M E N T S 25

SecurityPar
(000) Value
Corporate Bonds & NotesAdvertising — 0.5%Advantage Sales & Marketing Inc., 6.50%, 11/15/28
(Call 11/15/23)(a) . . . . . . . . . . . . . . . . . . . . . . . . . . . . . . . . . . . . . . $ 2,225 $ 2,172,156Clear Channel International BV, 6.63%, 08/01/25
(Call 02/01/22)(a)(b) . . . . . . . . . . . . . . . . . . . . . . . . . . . . . . . . . . . . 765 776,475Lamar Media Corp.
3.75%, 02/15/28 (Call 02/15/23) . . . . . . . . . . . . . . . . . . . . . . . 2,701 2,690,0884.00%, 02/15/30 (Call 02/15/25) . . . . . . . . . . . . . . . . . . . . . . . 1,970 1,987,2384.88%, 01/15/29 (Call 01/15/24) . . . . . . . . . . . . . . . . . . . . . . . 1,170 1,216,8005.75%, 02/01/26 (Call 02/01/21) . . . . . . . . . . . . . . . . . . . . . . . 3,359 3,475,557
MDC Partners Inc., 6.50%, 05/01/24 (Call 11/30/20)(a)(b) . . . 4,053 3,877,991National CineMedia LLC, 5.88%, 04/15/28
(Call 04/15/23)(a)(b) . . . . . . . . . . . . . . . . . . . . . . . . . . . . . . . . . . . . 1,726 1,199,570Outfront Media Capital LLC/Outfront Media Capital Corp.
4.63%, 03/15/30 (Call 03/15/25)(a)(b) . . . . . . . . . . . . . . . . . . . 2,119 1,946,8315.00%, 08/15/27 (Call 08/15/22)(a) . . . . . . . . . . . . . . . . . . . . . 2,897 2,744,9375.63%, 02/15/24 (Call 11/30/20)(b). . . . . . . . . . . . . . . . . . . . . . 1,887 1,901,1536.25%, 06/15/25 (Call 06/15/22)(a) . . . . . . . . . . . . . . . . . . . . . 2,050 2,092,281
Terrier Media Buyer Inc., 8.88%, 12/15/27(Call 12/15/22)(a) . . . . . . . . . . . . . . . . . . . . . . . . . . . . . . . . . . . . . . 4,596 4,698,238
30,779,315Aerospace & Defense — 1.8%Howmet Aerospace Inc.
5.13%, 10/01/24 (Call 07/01/24)(b) . . . . . . . . . . . . . . . . . . . . . 5,597 5,889,7235.87%, 02/23/22 . . . . . . . . . . . . . . . . . . . . . . . . . . . . . . . . . . . . . . 2,287 2,412,2135.90%, 02/01/27(b) . . . . . . . . . . . . . . . . . . . . . . . . . . . . . . . . . . . . 2,971 3,253,2455.95%, 02/01/37(b) . . . . . . . . . . . . . . . . . . . . . . . . . . . . . . . . . . . . 2,419 2,636,7106.75%, 01/15/28(b) . . . . . . . . . . . . . . . . . . . . . . . . . . . . . . . . . . . . 1,504 1,716,3206.88%, 05/01/25 (Call 04/01/25) . . . . . . . . . . . . . . . . . . . . . . . 5,525 6,146,562
Kratos Defense & Security Solutions Inc., 6.50%, 11/30/25(Call 11/30/20)(a)(b) . . . . . . . . . . . . . . . . . . . . . . . . . . . . . . . . . . . . 1,310 1,365,675
Moog Inc., 4.25%, 12/15/27 (Call 12/15/22)(a) . . . . . . . . . . . . . 2,435 2,498,919Rolls-Royce PLC
3.63%, 10/14/25 (Call 07/14/25)(a) . . . . . . . . . . . . . . . . . . . . . 4,325 4,119,5625.75%, 10/15/27 (Call 07/15/27)(a) . . . . . . . . . . . . . . . . . . . . . 2,125 2,151,563
Signature Aviation U.S. Holdings Inc.4.00%, 03/01/28 (Call 03/01/23)(a) . . . . . . . . . . . . . . . . . . . . . 2,999 2,900,2135.38%, 05/01/26 (Call 05/01/21)(a) . . . . . . . . . . . . . . . . . . . . . 2,285 2,307,850
Spirit AeroSystems Inc.3.85%, 06/15/26 (Call 03/15/26)(b) . . . . . . . . . . . . . . . . . . . . . 675 645,5033.95%, 06/15/23 (Call 05/15/23)(b) . . . . . . . . . . . . . . . . . . . . . 1,319 1,177,2084.60%, 06/15/28 (Call 03/15/28)(b) . . . . . . . . . . . . . . . . . . . . . 3,219 2,677,1945.50%, 01/15/25 (Call 10/15/22)(a)(b) . . . . . . . . . . . . . . . . . . . 375 381,5637.50%, 04/15/25 (Call 04/15/22)(a) . . . . . . . . . . . . . . . . . . . . . 5,266 5,305,442
SSL Robotics LLC, 9.75%, 12/31/23 (Call 12/15/21)(a) . . . . . 3,679 4,091,508TransDigm Inc.
5.50%, 11/15/27 (Call 11/15/22)(b). . . . . . . . . . . . . . . . . . . . . . 11,735 11,456,2946.25%, 03/15/26 (Call 03/15/22)(a)(b) . . . . . . . . . . . . . . . . . . . 18,951 19,756,2286.38%, 06/15/26 (Call 06/15/21) . . . . . . . . . . . . . . . . . . . . . . . 4,396 4,383,6916.50%, 07/15/24 (Call 11/30/20)(b). . . . . . . . . . . . . . . . . . . . . . 5,020 5,013,7256.50%, 05/15/25 (Call 11/30/20). . . . . . . . . . . . . . . . . . . . . . . . 3,391 3,391,0007.50%, 03/15/27 (Call 03/15/22) . . . . . . . . . . . . . . . . . . . . . . . 2,530 2,613,1108.00%, 12/15/25 (Call 04/08/22)(a)(b) . . . . . . . . . . . . . . . . . . . 4,585 4,964,638
TransDigm UK Holdings PLC, 6.88%, 05/15/26(Call 05/15/21) . . . . . . . . . . . . . . . . . . . . . . . . . . . . . . . . . . . . . . . . 1,832 1,822,840
Triumph Group Inc.5.25%, 06/01/22 (Call 11/30/20). . . . . . . . . . . . . . . . . . . . . . . . 1,112 947,9806.25%, 09/15/24 (Call 11/30/20)(a)(b). . . . . . . . . . . . . . . . . . . . 2,428 2,096,6517.75%, 08/15/25 (Call 11/30/20)(b). . . . . . . . . . . . . . . . . . . . . . 2,424 1,563,480
SecurityPar
(000) Value
Aerospace & Defense (continued)8.88%, 06/01/24 (Call 02/01/23)(a) . . . . . . . . . . . . . . . . . . . . . $ 2,646 $ 2,808,861
112,495,471Agriculture — 0.2%Cooke Omega Investments Inc./Alpha VesselCo
Holdings Inc., 8.50%, 12/15/22 (Call 11/30/20)(a). . . . . . . . 1,516 1,561,480Darling Ingredients Inc., 5.25%, 04/15/27
(Call 04/15/22)(a) . . . . . . . . . . . . . . . . . . . . . . . . . . . . . . . . . . . . . . 1,945 2,061,700Vector Group Ltd.
6.13%, 02/01/25 (Call 11/30/20)(a)(b). . . . . . . . . . . . . . . . . . . . 3,729 3,719,67810.50%, 11/01/26 (Call 11/01/21)(a) . . . . . . . . . . . . . . . . . . . . 2,593 2,670,790
10,013,648Airlines — 0.7%American Airlines Group Inc.
3.75%, 03/01/25(a)(b) . . . . . . . . . . . . . . . . . . . . . . . . . . . . . . . . . . 1,630 813,3385.00%, 06/01/22(a) . . . . . . . . . . . . . . . . . . . . . . . . . . . . . . . . . . . . 2,801 1,815,608
American Airlines Inc., 11.75%, 07/15/25(a). . . . . . . . . . . . . . . . 10,850 10,551,625Delta Air Lines Inc.
2.90%, 10/28/24 (Call 09/28/24) . . . . . . . . . . . . . . . . . . . . . . . 4,005 3,486,4503.63%, 03/15/22 (Call 02/15/22) . . . . . . . . . . . . . . . . . . . . . . . 3,572 3,500,5033.75%, 10/28/29 (Call 07/28/29) . . . . . . . . . . . . . . . . . . . . . . . 2,860 2,389,8263.80%, 04/19/23 (Call 03/19/23) . . . . . . . . . . . . . . . . . . . . . . . 2,613 2,471,3614.38%, 04/19/28 (Call 01/19/28) . . . . . . . . . . . . . . . . . . . . . . . 2,325 2,010,1217.38%, 01/15/26 (Call 12/15/25)(b) . . . . . . . . . . . . . . . . . . . . . 5,075 5,252,625
Spirit Loyalty Cayman Ltd./Spirit IP Cayman Ltd., 8.00%,09/20/25 (Call 09/20/23)(a)(b) . . . . . . . . . . . . . . . . . . . . . . . . . . . 3,815 4,043,900
United Airlines Holdings Inc.4.25%, 10/01/22(b) . . . . . . . . . . . . . . . . . . . . . . . . . . . . . . . . . . . . 1,806 1,642,1964.88%, 01/15/25(b) . . . . . . . . . . . . . . . . . . . . . . . . . . . . . . . . . . . . 1,494 1,254,5125.00%, 02/01/24(b) . . . . . . . . . . . . . . . . . . . . . . . . . . . . . . . . . . . . 1,190 1,041,250
40,273,315Apparel — 0.4%Hanesbrands Inc.
4.63%, 05/15/24 (Call 02/15/24)(a) . . . . . . . . . . . . . . . . . . . . . 3,668 3,820,4054.88%, 05/15/26 (Call 02/15/26)(a)(b) . . . . . . . . . . . . . . . . . . . 4,232 4,549,4005.38%, 05/15/25 (Call 05/15/22)(a) . . . . . . . . . . . . . . . . . . . . . 3,465 3,646,912
Levi Strauss & Co., 5.00%, 05/01/25 (Call 11/30/20)(b) . . . . . 3,401 3,486,025Michael Kors USA Inc., 4.50%, 11/01/24 (Call 09/01/24)(a) . 2,034 1,985,693Under Armour Inc., 3.25%, 06/15/26 (Call 03/15/26)(b) . . . . . 2,803 2,708,090William Carter Co. (The)
5.50%, 05/15/25 (Call 05/15/22)(a) . . . . . . . . . . . . . . . . . . . . . 2,035 2,136,7505.63%, 03/15/27 (Call 03/15/22)(a)(b) . . . . . . . . . . . . . . . . . . . 2,224 2,333,810
Wolverine World Wide Inc.5.00%, 09/01/26 (Call 09/01/21)(a)(b) . . . . . . . . . . . . . . . . . . . 967 974,2536.38%, 05/15/25 (Call 05/15/22)(a) . . . . . . . . . . . . . . . . . . . . . 1,150 1,224,750
26,866,088Auto Manufacturers — 2.8%Allison Transmission Inc.
4.75%, 10/01/27 (Call 10/01/22)(a) . . . . . . . . . . . . . . . . . . . . . 2,067 2,129,0105.00%, 10/01/24 (Call 11/10/20)(a). . . . . . . . . . . . . . . . . . . . . . 4,206 4,243,6445.88%, 06/01/29 (Call 06/01/24)(a) . . . . . . . . . . . . . . . . . . . . . 2,262 2,474,062
Aston Martin Capital Holdings Ltd.6.50%, 04/15/22 (Call 11/30/20)(a)(b). . . . . . . . . . . . . . . . . . . . 1,825 1,823,17510.50%, 11/30/25 . . . . . . . . . . . . . . . . . . . . . . . . . . . . . . . . . . . . . 415 415,000
BCD Acquisition Inc., 9.63%, 09/15/23 (Call 11/30/20)(a) . . . 2,979 2,982,724Fiat Chrysler Automobiles NV, 5.25%, 04/15/23 . . . . . . . . . . . 6,435 6,861,319Ford Holdings LLC, 9.30%, 03/01/30(b). . . . . . . . . . . . . . . . . . . . 223 268,760Ford Motor Co.
4.35%, 12/08/26 (Call 09/08/26)(b) . . . . . . . . . . . . . . . . . . . . . 4,168 4,198,4684.75%, 01/15/43 . . . . . . . . . . . . . . . . . . . . . . . . . . . . . . . . . . . . . . 5,275 4,872,517
Schedule of InvestmentsOctober 31, 2020
iShares� Broad USD High Yield Corporate Bond ETF(Percentages shown are based on Net Assets)
26 2 0 2 0 I S H A R E S A N N U A L R E P O R T T O S H A R E H O L D E R S
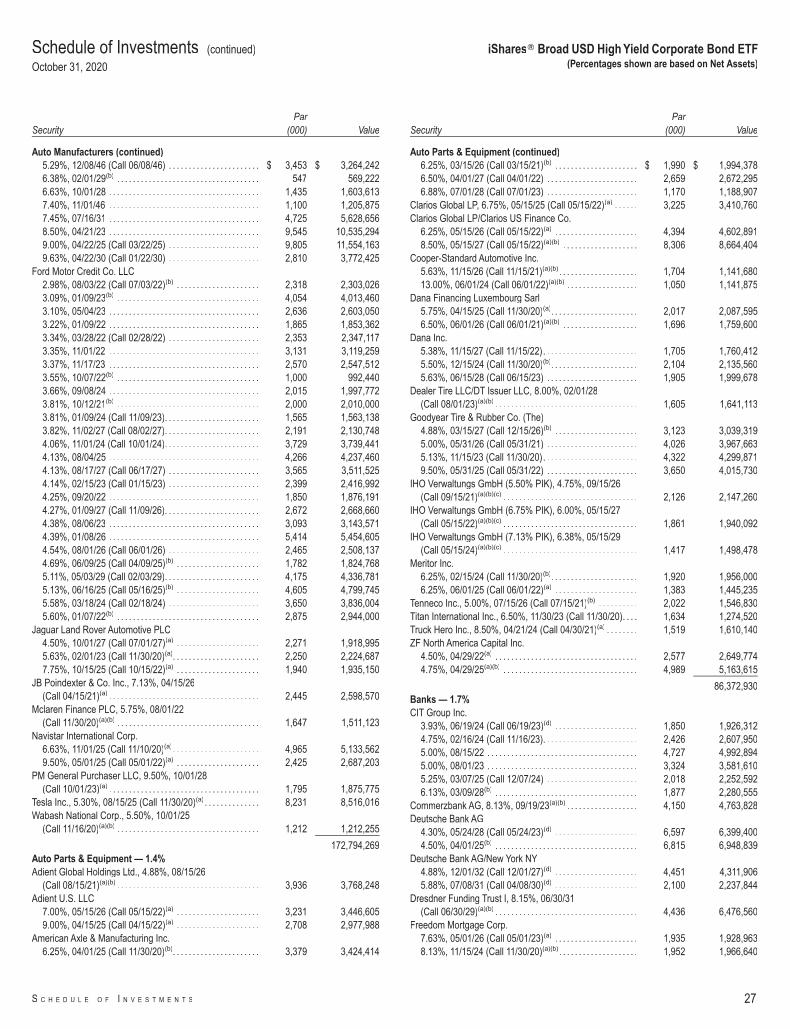
SecurityPar
(000) Value
Auto Manufacturers (continued)5.29%, 12/08/46 (Call 06/08/46) . . . . . . . . . . . . . . . . . . . . . . . $ 3,453 $ 3,264,2426.38%, 02/01/29(b) . . . . . . . . . . . . . . . . . . . . . . . . . . . . . . . . . . . . 547 569,2226.63%, 10/01/28 . . . . . . . . . . . . . . . . . . . . . . . . . . . . . . . . . . . . . . 1,435 1,603,6137.40%, 11/01/46 . . . . . . . . . . . . . . . . . . . . . . . . . . . . . . . . . . . . . . 1,100 1,205,8757.45%, 07/16/31 . . . . . . . . . . . . . . . . . . . . . . . . . . . . . . . . . . . . . . 4,725 5,628,6568.50%, 04/21/23 . . . . . . . . . . . . . . . . . . . . . . . . . . . . . . . . . . . . . . 9,545 10,535,2949.00%, 04/22/25 (Call 03/22/25) . . . . . . . . . . . . . . . . . . . . . . . 9,805 11,554,1639.63%, 04/22/30 (Call 01/22/30) . . . . . . . . . . . . . . . . . . . . . . . 2,810 3,772,425
Ford Motor Credit Co. LLC2.98%, 08/03/22 (Call 07/03/22)(b) . . . . . . . . . . . . . . . . . . . . . 2,318 2,303,0263.09%, 01/09/23(b) . . . . . . . . . . . . . . . . . . . . . . . . . . . . . . . . . . . . 4,054 4,013,4603.10%, 05/04/23 . . . . . . . . . . . . . . . . . . . . . . . . . . . . . . . . . . . . . . 2,636 2,603,0503.22%, 01/09/22 . . . . . . . . . . . . . . . . . . . . . . . . . . . . . . . . . . . . . . 1,865 1,853,3623.34%, 03/28/22 (Call 02/28/22) . . . . . . . . . . . . . . . . . . . . . . . 2,353 2,347,1173.35%, 11/01/22 . . . . . . . . . . . . . . . . . . . . . . . . . . . . . . . . . . . . . . 3,131 3,119,2593.37%, 11/17/23 . . . . . . . . . . . . . . . . . . . . . . . . . . . . . . . . . . . . . . 2,570 2,547,5123.55%, 10/07/22(b) . . . . . . . . . . . . . . . . . . . . . . . . . . . . . . . . . . . . 1,000 992,4403.66%, 09/08/24 . . . . . . . . . . . . . . . . . . . . . . . . . . . . . . . . . . . . . . 2,015 1,997,7723.81%, 10/12/21(b) . . . . . . . . . . . . . . . . . . . . . . . . . . . . . . . . . . . . 2,000 2,010,0003.81%, 01/09/24 (Call 11/09/23). . . . . . . . . . . . . . . . . . . . . . . . 1,565 1,563,1383.82%, 11/02/27 (Call 08/02/27). . . . . . . . . . . . . . . . . . . . . . . . 2,191 2,130,7484.06%, 11/01/24 (Call 10/01/24). . . . . . . . . . . . . . . . . . . . . . . . 3,729 3,739,4414.13%, 08/04/25 . . . . . . . . . . . . . . . . . . . . . . . . . . . . . . . . . . . . . . 4,266 4,237,4604.13%, 08/17/27 (Call 06/17/27) . . . . . . . . . . . . . . . . . . . . . . . 3,565 3,511,5254.14%, 02/15/23 (Call 01/15/23) . . . . . . . . . . . . . . . . . . . . . . . 2,399 2,416,9924.25%, 09/20/22 . . . . . . . . . . . . . . . . . . . . . . . . . . . . . . . . . . . . . . 1,850 1,876,1914.27%, 01/09/27 (Call 11/09/26). . . . . . . . . . . . . . . . . . . . . . . . 2,672 2,668,6604.38%, 08/06/23 . . . . . . . . . . . . . . . . . . . . . . . . . . . . . . . . . . . . . . 3,093 3,143,5714.39%, 01/08/26 . . . . . . . . . . . . . . . . . . . . . . . . . . . . . . . . . . . . . . 5,414 5,454,6054.54%, 08/01/26 (Call 06/01/26) . . . . . . . . . . . . . . . . . . . . . . . 2,465 2,508,1374.69%, 06/09/25 (Call 04/09/25)(b) . . . . . . . . . . . . . . . . . . . . . 1,782 1,824,7685.11%, 05/03/29 (Call 02/03/29). . . . . . . . . . . . . . . . . . . . . . . . 4,175 4,336,7815.13%, 06/16/25 (Call 05/16/25)(b) . . . . . . . . . . . . . . . . . . . . . 4,605 4,799,7455.58%, 03/18/24 (Call 02/18/24) . . . . . . . . . . . . . . . . . . . . . . . 3,650 3,836,0045.60%, 01/07/22(b) . . . . . . . . . . . . . . . . . . . . . . . . . . . . . . . . . . . . 2,875 2,944,000
Jaguar Land Rover Automotive PLC4.50%, 10/01/27 (Call 07/01/27)(a) . . . . . . . . . . . . . . . . . . . . . 2,271 1,918,9955.63%, 02/01/23 (Call 11/30/20)(a). . . . . . . . . . . . . . . . . . . . . . 2,250 2,224,6877.75%, 10/15/25 (Call 10/15/22)(a) . . . . . . . . . . . . . . . . . . . . . 1,940 1,935,150
JB Poindexter & Co. Inc., 7.13%, 04/15/26(Call 04/15/21)(a) . . . . . . . . . . . . . . . . . . . . . . . . . . . . . . . . . . . . . . 2,445 2,598,570
Mclaren Finance PLC, 5.75%, 08/01/22(Call 11/30/20)(a)(b) . . . . . . . . . . . . . . . . . . . . . . . . . . . . . . . . . . . . 1,647 1,511,123
Navistar International Corp.6.63%, 11/01/25 (Call 11/10/20)(a). . . . . . . . . . . . . . . . . . . . . . 4,965 5,133,5629.50%, 05/01/25 (Call 05/01/22)(a) . . . . . . . . . . . . . . . . . . . . . 2,425 2,687,203
PM General Purchaser LLC, 9.50%, 10/01/28(Call 10/01/23)(a) . . . . . . . . . . . . . . . . . . . . . . . . . . . . . . . . . . . . . . 1,795 1,875,775
Tesla Inc., 5.30%, 08/15/25 (Call 11/30/20)(a) . . . . . . . . . . . . . . 8,231 8,516,016Wabash National Corp., 5.50%, 10/01/25
(Call 11/16/20)(a)(b) . . . . . . . . . . . . . . . . . . . . . . . . . . . . . . . . . . . . 1,212 1,212,255
172,794,269Auto Parts & Equipment — 1.4%Adient Global Holdings Ltd., 4.88%, 08/15/26
(Call 08/15/21)(a)(b) . . . . . . . . . . . . . . . . . . . . . . . . . . . . . . . . . . . . 3,936 3,768,248Adient U.S. LLC
7.00%, 05/15/26 (Call 05/15/22)(a) . . . . . . . . . . . . . . . . . . . . . 3,231 3,446,6059.00%, 04/15/25 (Call 04/15/22)(a) . . . . . . . . . . . . . . . . . . . . . 2,708 2,977,988
American Axle & Manufacturing Inc.6.25%, 04/01/25 (Call 11/30/20)(b). . . . . . . . . . . . . . . . . . . . . . 3,379 3,424,414
SecurityPar
(000) Value
Auto Parts & Equipment (continued)6.25%, 03/15/26 (Call 03/15/21)(b) . . . . . . . . . . . . . . . . . . . . . $ 1,990 $ 1,994,3786.50%, 04/01/27 (Call 04/01/22) . . . . . . . . . . . . . . . . . . . . . . . 2,659 2,672,2956.88%, 07/01/28 (Call 07/01/23) . . . . . . . . . . . . . . . . . . . . . . . 1,170 1,188,907
Clarios Global LP, 6.75%, 05/15/25 (Call 05/15/22)(a) . . . . . . 3,225 3,410,760Clarios Global LP/Clarios US Finance Co.
6.25%, 05/15/26 (Call 05/15/22)(a) . . . . . . . . . . . . . . . . . . . . . 4,394 4,602,8918.50%, 05/15/27 (Call 05/15/22)(a)(b) . . . . . . . . . . . . . . . . . . . 8,306 8,664,404
Cooper-Standard Automotive Inc.5.63%, 11/15/26 (Call 11/15/21)(a)(b). . . . . . . . . . . . . . . . . . . . 1,704 1,141,68013.00%, 06/01/24 (Call 06/01/22)(a)(b) . . . . . . . . . . . . . . . . . . 1,050 1,141,875
Dana Financing Luxembourg Sarl5.75%, 04/15/25 (Call 11/30/20)(a). . . . . . . . . . . . . . . . . . . . . . 2,017 2,087,5956.50%, 06/01/26 (Call 06/01/21)(a)(b) . . . . . . . . . . . . . . . . . . . 1,696 1,759,600
Dana Inc.5.38%, 11/15/27 (Call 11/15/22). . . . . . . . . . . . . . . . . . . . . . . . 1,705 1,760,4125.50%, 12/15/24 (Call 11/30/20)(b). . . . . . . . . . . . . . . . . . . . . . 2,104 2,135,5605.63%, 06/15/28 (Call 06/15/23) . . . . . . . . . . . . . . . . . . . . . . . 1,905 1,999,678
Dealer Tire LLC/DT Issuer LLC, 8.00%, 02/01/28(Call 08/01/23)(a)(b) . . . . . . . . . . . . . . . . . . . . . . . . . . . . . . . . . . . . 1,605 1,641,113
Goodyear Tire & Rubber Co. (The)4.88%, 03/15/27 (Call 12/15/26)(b) . . . . . . . . . . . . . . . . . . . . . 3,123 3,039,3195.00%, 05/31/26 (Call 05/31/21) . . . . . . . . . . . . . . . . . . . . . . . 4,026 3,967,6635.13%, 11/15/23 (Call 11/30/20). . . . . . . . . . . . . . . . . . . . . . . . 4,322 4,299,8719.50%, 05/31/25 (Call 05/31/22) . . . . . . . . . . . . . . . . . . . . . . . 3,650 4,015,730
IHO Verwaltungs GmbH (5.50% PIK), 4.75%, 09/15/26(Call 09/15/21)(a)(b)(c) . . . . . . . . . . . . . . . . . . . . . . . . . . . . . . . . . . 2,126 2,147,260
IHO Verwaltungs GmbH (6.75% PIK), 6.00%, 05/15/27(Call 05/15/22)(a)(b)(c) . . . . . . . . . . . . . . . . . . . . . . . . . . . . . . . . . . 1,861 1,940,092
IHO Verwaltungs GmbH (7.13% PIK), 6.38%, 05/15/29(Call 05/15/24)(a)(b)(c) . . . . . . . . . . . . . . . . . . . . . . . . . . . . . . . . . . 1,417 1,498,478
Meritor Inc.6.25%, 02/15/24 (Call 11/30/20)(b). . . . . . . . . . . . . . . . . . . . . . 1,920 1,956,0006.25%, 06/01/25 (Call 06/01/22)(a) . . . . . . . . . . . . . . . . . . . . . 1,383 1,445,235
Tenneco Inc., 5.00%, 07/15/26 (Call 07/15/21)(b) . . . . . . . . . . 2,022 1,546,830Titan International Inc., 6.50%, 11/30/23 (Call 11/30/20). . . . 1,634 1,274,520Truck Hero Inc., 8.50%, 04/21/24 (Call 04/30/21)(a) . . . . . . . . 1,519 1,610,140ZF North America Capital Inc.
4.50%, 04/29/22(a) . . . . . . . . . . . . . . . . . . . . . . . . . . . . . . . . . . . . 2,577 2,649,7744.75%, 04/29/25(a)(b) . . . . . . . . . . . . . . . . . . . . . . . . . . . . . . . . . . 4,989 5,163,615
86,372,930Banks — 1.7%CIT Group Inc.
3.93%, 06/19/24 (Call 06/19/23)(d) . . . . . . . . . . . . . . . . . . . . . 1,850 1,926,3124.75%, 02/16/24 (Call 11/16/23). . . . . . . . . . . . . . . . . . . . . . . . 2,426 2,607,9505.00%, 08/15/22 . . . . . . . . . . . . . . . . . . . . . . . . . . . . . . . . . . . . . . 4,727 4,992,8945.00%, 08/01/23 . . . . . . . . . . . . . . . . . . . . . . . . . . . . . . . . . . . . . . 3,324 3,581,6105.25%, 03/07/25 (Call 12/07/24) . . . . . . . . . . . . . . . . . . . . . . . 2,018 2,252,5926.13%, 03/09/28(b) . . . . . . . . . . . . . . . . . . . . . . . . . . . . . . . . . . . . 1,877 2,280,555
Commerzbank AG, 8.13%, 09/19/23(a)(b) . . . . . . . . . . . . . . . . . . 4,150 4,763,828Deutsche Bank AG
4.30%, 05/24/28 (Call 05/24/23)(d) . . . . . . . . . . . . . . . . . . . . . 6,597 6,399,4004.50%, 04/01/25(b) . . . . . . . . . . . . . . . . . . . . . . . . . . . . . . . . . . . . 6,815 6,948,839
Deutsche Bank AG/New York NY4.88%, 12/01/32 (Call 12/01/27)(d) . . . . . . . . . . . . . . . . . . . . . 4,451 4,311,9065.88%, 07/08/31 (Call 04/08/30)(d) . . . . . . . . . . . . . . . . . . . . . 2,100 2,237,844
Dresdner Funding Trust I, 8.15%, 06/30/31(Call 06/30/29)(a)(b) . . . . . . . . . . . . . . . . . . . . . . . . . . . . . . . . . . . . 4,436 6,476,560
Freedom Mortgage Corp.7.63%, 05/01/26 (Call 05/01/23)(a) . . . . . . . . . . . . . . . . . . . . . 1,935 1,928,9638.13%, 11/15/24 (Call 11/30/20)(a)(b). . . . . . . . . . . . . . . . . . . . 1,952 1,966,640
Schedule of Investments (continued)
October 31, 2020
iShares� Broad USD High Yield Corporate Bond ETF(Percentages shown are based on Net Assets)
S C H E D U L E O F I N V E S T M E N T S 27
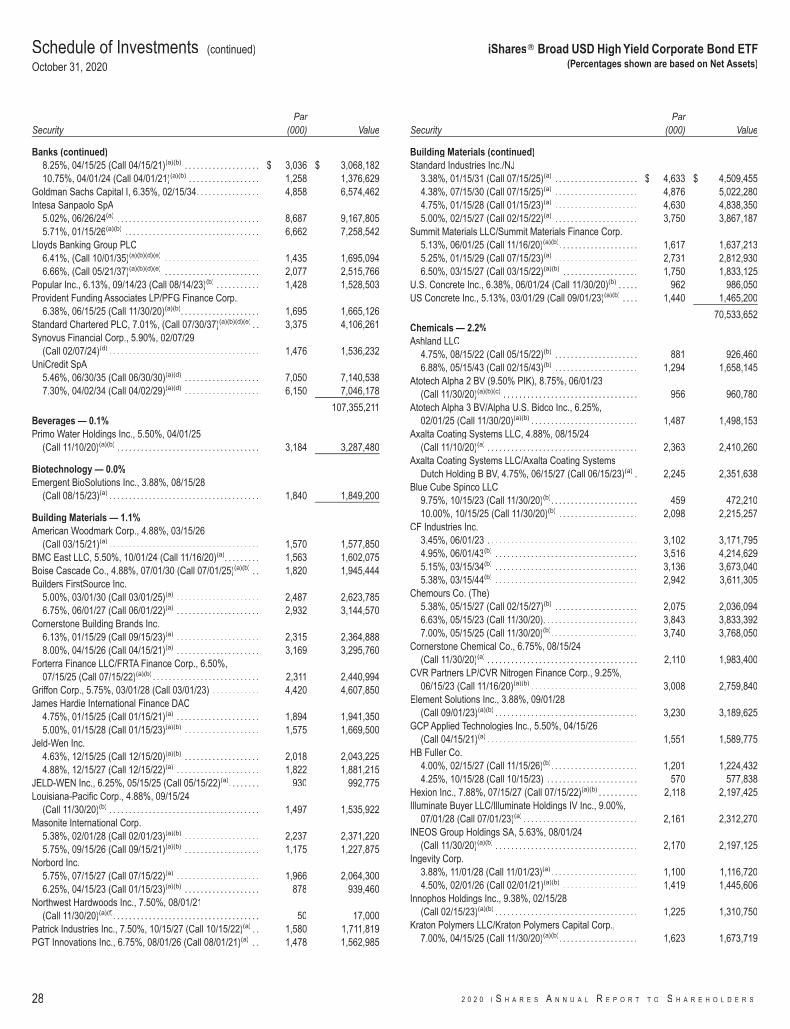
SecurityPar
(000) Value
Banks (continued)8.25%, 04/15/25 (Call 04/15/21)(a)(b) . . . . . . . . . . . . . . . . . . . $ 3,036 $ 3,068,18210.75%, 04/01/24 (Call 04/01/21)(a)(b) . . . . . . . . . . . . . . . . . . 1,258 1,376,629
Goldman Sachs Capital I, 6.35%, 02/15/34. . . . . . . . . . . . . . . . 4,858 6,574,462Intesa Sanpaolo SpA
5.02%, 06/26/24(a) . . . . . . . . . . . . . . . . . . . . . . . . . . . . . . . . . . . . 8,687 9,167,8055.71%, 01/15/26(a)(b) . . . . . . . . . . . . . . . . . . . . . . . . . . . . . . . . . . 6,662 7,258,542
Lloyds Banking Group PLC6.41%, (Call 10/01/35)(a)(b)(d)(e) . . . . . . . . . . . . . . . . . . . . . . . . 1,435 1,695,0946.66%, (Call 05/21/37)(a)(b)(d)(e) . . . . . . . . . . . . . . . . . . . . . . . . 2,077 2,515,766
Popular Inc., 6.13%, 09/14/23 (Call 08/14/23)(b) . . . . . . . . . . . 1,428 1,528,503Provident Funding Associates LP/PFG Finance Corp.,
6.38%, 06/15/25 (Call 11/30/20)(a)(b). . . . . . . . . . . . . . . . . . . . 1,695 1,665,126Standard Chartered PLC, 7.01%, (Call 07/30/37)(a)(b)(d)(e) . . 3,375 4,106,261Synovus Financial Corp., 5.90%, 02/07/29
(Call 02/07/24)(d) . . . . . . . . . . . . . . . . . . . . . . . . . . . . . . . . . . . . . . 1,476 1,536,232UniCredit SpA
5.46%, 06/30/35 (Call 06/30/30)(a)(d) . . . . . . . . . . . . . . . . . . . 7,050 7,140,5387.30%, 04/02/34 (Call 04/02/29)(a)(d) . . . . . . . . . . . . . . . . . . . 6,150 7,046,178
107,355,211Beverages — 0.1%Primo Water Holdings Inc., 5.50%, 04/01/25
(Call 11/10/20)(a)(b) . . . . . . . . . . . . . . . . . . . . . . . . . . . . . . . . . . . . 3,184 3,287,480
Biotechnology — 0.0%Emergent BioSolutions Inc., 3.88%, 08/15/28
(Call 08/15/23)(a) . . . . . . . . . . . . . . . . . . . . . . . . . . . . . . . . . . . . . . 1,840 1,849,200
Building Materials — 1.1%American Woodmark Corp., 4.88%, 03/15/26
(Call 03/15/21)(a) . . . . . . . . . . . . . . . . . . . . . . . . . . . . . . . . . . . . . . 1,570 1,577,850BMC East LLC, 5.50%, 10/01/24 (Call 11/16/20)(a). . . . . . . . . 1,563 1,602,075Boise Cascade Co., 4.88%, 07/01/30 (Call 07/01/25)(a)(b) . . 1,820 1,945,444Builders FirstSource Inc.
5.00%, 03/01/30 (Call 03/01/25)(a) . . . . . . . . . . . . . . . . . . . . . 2,487 2,623,7856.75%, 06/01/27 (Call 06/01/22)(a) . . . . . . . . . . . . . . . . . . . . . 2,932 3,144,570
Cornerstone Building Brands Inc.6.13%, 01/15/29 (Call 09/15/23)(a) . . . . . . . . . . . . . . . . . . . . . 2,315 2,364,8888.00%, 04/15/26 (Call 04/15/21)(a) . . . . . . . . . . . . . . . . . . . . . 3,169 3,295,760
Forterra Finance LLC/FRTA Finance Corp., 6.50%,07/15/25 (Call 07/15/22)(a)(b) . . . . . . . . . . . . . . . . . . . . . . . . . . . 2,311 2,440,994
Griffon Corp., 5.75%, 03/01/28 (Call 03/01/23) . . . . . . . . . . . . 4,420 4,607,850James Hardie International Finance DAC
4.75%, 01/15/25 (Call 01/15/21)(a) . . . . . . . . . . . . . . . . . . . . . 1,894 1,941,3505.00%, 01/15/28 (Call 01/15/23)(a)(b) . . . . . . . . . . . . . . . . . . . 1,575 1,669,500
Jeld-Wen Inc.4.63%, 12/15/25 (Call 12/15/20)(a)(b) . . . . . . . . . . . . . . . . . . . 2,018 2,043,2254.88%, 12/15/27 (Call 12/15/22)(a) . . . . . . . . . . . . . . . . . . . . . 1,822 1,881,215
JELD-WEN Inc., 6.25%, 05/15/25 (Call 05/15/22)(a). . . . . . . . 930 992,775Louisiana-Pacific Corp., 4.88%, 09/15/24
(Call 11/30/20)(b) . . . . . . . . . . . . . . . . . . . . . . . . . . . . . . . . . . . . . . 1,497 1,535,922Masonite International Corp.
5.38%, 02/01/28 (Call 02/01/23)(a)(b) . . . . . . . . . . . . . . . . . . . 2,237 2,371,2205.75%, 09/15/26 (Call 09/15/21)(a)(b) . . . . . . . . . . . . . . . . . . . 1,175 1,227,875
Norbord Inc.5.75%, 07/15/27 (Call 07/15/22)(a) . . . . . . . . . . . . . . . . . . . . . 1,966 2,064,3006.25%, 04/15/23 (Call 01/15/23)(a)(b) . . . . . . . . . . . . . . . . . . . 878 939,460
Northwest Hardwoods Inc., 7.50%, 08/01/21(Call 11/30/20)(a)(f). . . . . . . . . . . . . . . . . . . . . . . . . . . . . . . . . . . . . 50 17,000
Patrick Industries Inc., 7.50%, 10/15/27 (Call 10/15/22)(a) . . 1,580 1,711,819PGT Innovations Inc., 6.75%, 08/01/26 (Call 08/01/21)(a) . . 1,478 1,562,985
SecurityPar
(000) Value
Building Materials (continued)Standard Industries Inc./NJ
3.38%, 01/15/31 (Call 07/15/25)(a) . . . . . . . . . . . . . . . . . . . . . $ 4,633 $ 4,509,4554.38%, 07/15/30 (Call 07/15/25)(a) . . . . . . . . . . . . . . . . . . . . . 4,876 5,022,2804.75%, 01/15/28 (Call 01/15/23)(a) . . . . . . . . . . . . . . . . . . . . . 4,630 4,838,3505.00%, 02/15/27 (Call 02/15/22)(a) . . . . . . . . . . . . . . . . . . . . . 3,750 3,867,187
Summit Materials LLC/Summit Materials Finance Corp.5.13%, 06/01/25 (Call 11/16/20)(a)(b). . . . . . . . . . . . . . . . . . . . 1,617 1,637,2135.25%, 01/15/29 (Call 07/15/23)(a) . . . . . . . . . . . . . . . . . . . . . 2,731 2,812,9306.50%, 03/15/27 (Call 03/15/22)(a)(b) . . . . . . . . . . . . . . . . . . . 1,750 1,833,125
U.S. Concrete Inc., 6.38%, 06/01/24 (Call 11/30/20)(b) . . . . . 962 986,050US Concrete Inc., 5.13%, 03/01/29 (Call 09/01/23)(a)(b) . . . . 1,440 1,465,200
70,533,652Chemicals — 2.2%Ashland LLC
4.75%, 08/15/22 (Call 05/15/22)(b) . . . . . . . . . . . . . . . . . . . . . 881 926,4606.88%, 05/15/43 (Call 02/15/43)(b) . . . . . . . . . . . . . . . . . . . . . 1,294 1,658,145
Atotech Alpha 2 BV (9.50% PIK), 8.75%, 06/01/23(Call 11/30/20)(a)(b)(c) . . . . . . . . . . . . . . . . . . . . . . . . . . . . . . . . . . 956 960,780
Atotech Alpha 3 BV/Alpha U.S. Bidco Inc., 6.25%,02/01/25 (Call 11/30/20)(a)(b) . . . . . . . . . . . . . . . . . . . . . . . . . . . 1,487 1,498,153
Axalta Coating Systems LLC, 4.88%, 08/15/24(Call 11/10/20)(a) . . . . . . . . . . . . . . . . . . . . . . . . . . . . . . . . . . . . . . 2,363 2,410,260
Axalta Coating Systems LLC/Axalta Coating SystemsDutch Holding B BV, 4.75%, 06/15/27 (Call 06/15/23)(a) . 2,245 2,351,638
Blue Cube Spinco LLC9.75%, 10/15/23 (Call 11/30/20)(b). . . . . . . . . . . . . . . . . . . . . . 459 472,21010.00%, 10/15/25 (Call 11/30/20)(b) . . . . . . . . . . . . . . . . . . . . 2,098 2,215,257
CF Industries Inc.3.45%, 06/01/23 . . . . . . . . . . . . . . . . . . . . . . . . . . . . . . . . . . . . . . 3,102 3,171,7954.95%, 06/01/43(b) . . . . . . . . . . . . . . . . . . . . . . . . . . . . . . . . . . . . 3,516 4,214,6295.15%, 03/15/34(b) . . . . . . . . . . . . . . . . . . . . . . . . . . . . . . . . . . . . 3,136 3,673,0405.38%, 03/15/44(b) . . . . . . . . . . . . . . . . . . . . . . . . . . . . . . . . . . . . 2,942 3,611,305
Chemours Co. (The)5.38%, 05/15/27 (Call 02/15/27)(b) . . . . . . . . . . . . . . . . . . . . . 2,075 2,036,0946.63%, 05/15/23 (Call 11/30/20). . . . . . . . . . . . . . . . . . . . . . . . 3,843 3,833,3927.00%, 05/15/25 (Call 11/30/20)(b). . . . . . . . . . . . . . . . . . . . . . 3,740 3,768,050
Cornerstone Chemical Co., 6.75%, 08/15/24(Call 11/30/20)(a) . . . . . . . . . . . . . . . . . . . . . . . . . . . . . . . . . . . . . . 2,110 1,983,400
CVR Partners LP/CVR Nitrogen Finance Corp., 9.25%,06/15/23 (Call 11/16/20)(a)(b) . . . . . . . . . . . . . . . . . . . . . . . . . . . 3,008 2,759,840
Element Solutions Inc., 3.88%, 09/01/28(Call 09/01/23)(a)(b) . . . . . . . . . . . . . . . . . . . . . . . . . . . . . . . . . . . . 3,230 3,189,625
GCP Applied Technologies Inc., 5.50%, 04/15/26(Call 04/15/21)(a) . . . . . . . . . . . . . . . . . . . . . . . . . . . . . . . . . . . . . . 1,551 1,589,775
HB Fuller Co.4.00%, 02/15/27 (Call 11/15/26)(b). . . . . . . . . . . . . . . . . . . . . . 1,201 1,224,4324.25%, 10/15/28 (Call 10/15/23) . . . . . . . . . . . . . . . . . . . . . . . 570 577,838
Hexion Inc., 7.88%, 07/15/27 (Call 07/15/22)(a)(b) . . . . . . . . . . 2,118 2,197,425Illuminate Buyer LLC/Illuminate Holdings IV Inc., 9.00%,
07/01/28 (Call 07/01/23)(a) . . . . . . . . . . . . . . . . . . . . . . . . . . . . . 2,161 2,312,270INEOS Group Holdings SA, 5.63%, 08/01/24
(Call 11/30/20)(a)(b) . . . . . . . . . . . . . . . . . . . . . . . . . . . . . . . . . . . . 2,170 2,197,125Ingevity Corp.
3.88%, 11/01/28 (Call 11/01/23)(a). . . . . . . . . . . . . . . . . . . . . . 1,100 1,116,7204.50%, 02/01/26 (Call 02/01/21)(a)(b) . . . . . . . . . . . . . . . . . . . 1,419 1,445,606
Innophos Holdings Inc., 9.38%, 02/15/28(Call 02/15/23)(a)(b) . . . . . . . . . . . . . . . . . . . . . . . . . . . . . . . . . . . . 1,225 1,310,750
Kraton Polymers LLC/Kraton Polymers Capital Corp.,7.00%, 04/15/25 (Call 11/30/20)(a)(b). . . . . . . . . . . . . . . . . . . . 1,623 1,673,719
Schedule of Investments (continued)
October 31, 2020
iShares� Broad USD High Yield Corporate Bond ETF(Percentages shown are based on Net Assets)
28 2 0 2 0 I S H A R E S A N N U A L R E P O R T T O S H A R E H O L D E R S
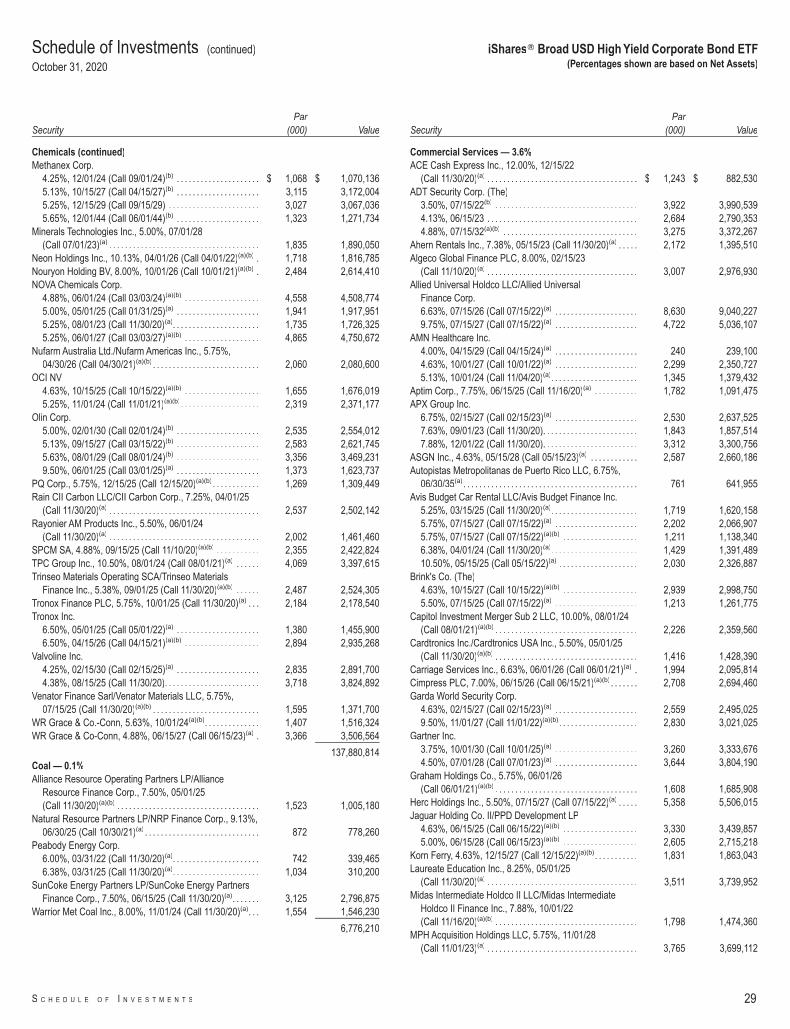
SecurityPar
(000) Value
Chemicals (continued)Methanex Corp.
4.25%, 12/01/24 (Call 09/01/24)(b) . . . . . . . . . . . . . . . . . . . . . $ 1,068 $ 1,070,1365.13%, 10/15/27 (Call 04/15/27)(b) . . . . . . . . . . . . . . . . . . . . . 3,115 3,172,0045.25%, 12/15/29 (Call 09/15/29) . . . . . . . . . . . . . . . . . . . . . . . 3,027 3,067,0365.65%, 12/01/44 (Call 06/01/44)(b) . . . . . . . . . . . . . . . . . . . . . 1,323 1,271,734
Minerals Technologies Inc., 5.00%, 07/01/28(Call 07/01/23)(a) . . . . . . . . . . . . . . . . . . . . . . . . . . . . . . . . . . . . . . 1,835 1,890,050
Neon Holdings Inc., 10.13%, 04/01/26 (Call 04/01/22)(a)(b) . 1,718 1,816,785Nouryon Holding BV, 8.00%, 10/01/26 (Call 10/01/21)(a)(b) . 2,484 2,614,410NOVA Chemicals Corp.
4.88%, 06/01/24 (Call 03/03/24)(a)(b) . . . . . . . . . . . . . . . . . . . 4,558 4,508,7745.00%, 05/01/25 (Call 01/31/25)(a) . . . . . . . . . . . . . . . . . . . . . 1,941 1,917,9515.25%, 08/01/23 (Call 11/30/20)(a). . . . . . . . . . . . . . . . . . . . . . 1,735 1,726,3255.25%, 06/01/27 (Call 03/03/27)(a)(b) . . . . . . . . . . . . . . . . . . . 4,865 4,750,672
Nufarm Australia Ltd./Nufarm Americas Inc., 5.75%,04/30/26 (Call 04/30/21)(a)(b) . . . . . . . . . . . . . . . . . . . . . . . . . . . 2,060 2,080,600
OCI NV4.63%, 10/15/25 (Call 10/15/22)(a)(b) . . . . . . . . . . . . . . . . . . . 1,655 1,676,0195.25%, 11/01/24 (Call 11/01/21)(a)(b). . . . . . . . . . . . . . . . . . . . 2,319 2,371,177
Olin Corp.5.00%, 02/01/30 (Call 02/01/24)(b) . . . . . . . . . . . . . . . . . . . . . 2,535 2,554,0125.13%, 09/15/27 (Call 03/15/22)(b) . . . . . . . . . . . . . . . . . . . . . 2,583 2,621,7455.63%, 08/01/29 (Call 08/01/24)(b) . . . . . . . . . . . . . . . . . . . . . 3,356 3,469,2319.50%, 06/01/25 (Call 03/01/25)(a) . . . . . . . . . . . . . . . . . . . . . 1,373 1,623,737
PQ Corp., 5.75%, 12/15/25 (Call 12/15/20)(a)(b) . . . . . . . . . . . . 1,269 1,309,449Rain CII Carbon LLC/CII Carbon Corp., 7.25%, 04/01/25
(Call 11/30/20)(a) . . . . . . . . . . . . . . . . . . . . . . . . . . . . . . . . . . . . . . 2,537 2,502,142Rayonier AM Products Inc., 5.50%, 06/01/24
(Call 11/30/20)(a) . . . . . . . . . . . . . . . . . . . . . . . . . . . . . . . . . . . . . . 2,002 1,461,460SPCM SA, 4.88%, 09/15/25 (Call 11/10/20)(a)(b) . . . . . . . . . . . 2,355 2,422,824TPC Group Inc., 10.50%, 08/01/24 (Call 08/01/21)(a) . . . . . . 4,069 3,397,615Trinseo Materials Operating SCA/Trinseo Materials
Finance Inc., 5.38%, 09/01/25 (Call 11/30/20)(a)(b) . . . . . . 2,487 2,524,305Tronox Finance PLC, 5.75%, 10/01/25 (Call 11/30/20)(a) . . . 2,184 2,178,540Tronox Inc.
6.50%, 05/01/25 (Call 05/01/22)(a) . . . . . . . . . . . . . . . . . . . . . 1,380 1,455,9006.50%, 04/15/26 (Call 04/15/21)(a)(b) . . . . . . . . . . . . . . . . . . . 2,894 2,935,268
Valvoline Inc.4.25%, 02/15/30 (Call 02/15/25)(a) . . . . . . . . . . . . . . . . . . . . . 2,835 2,891,7004.38%, 08/15/25 (Call 11/30/20). . . . . . . . . . . . . . . . . . . . . . . . 3,718 3,824,892
Venator Finance Sarl/Venator Materials LLC, 5.75%,07/15/25 (Call 11/30/20)(a)(b) . . . . . . . . . . . . . . . . . . . . . . . . . . . 1,595 1,371,700
WR Grace & Co.-Conn, 5.63%, 10/01/24(a)(b). . . . . . . . . . . . . . 1,407 1,516,324WR Grace & Co-Conn, 4.88%, 06/15/27 (Call 06/15/23)(a) . 3,366 3,506,564
137,880,814Coal — 0.1%Alliance Resource Operating Partners LP/Alliance
Resource Finance Corp., 7.50%, 05/01/25(Call 11/30/20)(a)(b) . . . . . . . . . . . . . . . . . . . . . . . . . . . . . . . . . . . . 1,523 1,005,180
Natural Resource Partners LP/NRP Finance Corp., 9.13%,06/30/25 (Call 10/30/21)(a) . . . . . . . . . . . . . . . . . . . . . . . . . . . . . 872 778,260
Peabody Energy Corp.6.00%, 03/31/22 (Call 11/30/20)(a). . . . . . . . . . . . . . . . . . . . . . 742 339,4656.38%, 03/31/25 (Call 11/30/20)(a). . . . . . . . . . . . . . . . . . . . . . 1,034 310,200
SunCoke Energy Partners LP/SunCoke Energy PartnersFinance Corp., 7.50%, 06/15/25 (Call 11/30/20)(a). . . . . . . 3,125 2,796,875
Warrior Met Coal Inc., 8.00%, 11/01/24 (Call 11/30/20)(a). . . 1,554 1,546,230
6,776,210
SecurityPar
(000) Value
Commercial Services — 3.6%ACE Cash Express Inc., 12.00%, 12/15/22
(Call 11/30/20)(a) . . . . . . . . . . . . . . . . . . . . . . . . . . . . . . . . . . . . . . $ 1,243 $ 882,530ADT Security Corp. (The)
3.50%, 07/15/22(b) . . . . . . . . . . . . . . . . . . . . . . . . . . . . . . . . . . . . 3,922 3,990,5394.13%, 06/15/23 . . . . . . . . . . . . . . . . . . . . . . . . . . . . . . . . . . . . . . 2,684 2,790,3534.88%, 07/15/32(a)(b) . . . . . . . . . . . . . . . . . . . . . . . . . . . . . . . . . . 3,275 3,372,267
Ahern Rentals Inc., 7.38%, 05/15/23 (Call 11/30/20)(a) . . . . . 2,172 1,395,510Algeco Global Finance PLC, 8.00%, 02/15/23
(Call 11/10/20)(a) . . . . . . . . . . . . . . . . . . . . . . . . . . . . . . . . . . . . . . 3,007 2,976,930Allied Universal Holdco LLC/Allied Universal
Finance Corp.6.63%, 07/15/26 (Call 07/15/22)(a) . . . . . . . . . . . . . . . . . . . . . 8,630 9,040,2279.75%, 07/15/27 (Call 07/15/22)(a) . . . . . . . . . . . . . . . . . . . . . 4,722 5,036,107
AMN Healthcare Inc.4.00%, 04/15/29 (Call 04/15/24)(a) . . . . . . . . . . . . . . . . . . . . . 240 239,1004.63%, 10/01/27 (Call 10/01/22)(a) . . . . . . . . . . . . . . . . . . . . . 2,299 2,350,7275.13%, 10/01/24 (Call 11/04/20)(a). . . . . . . . . . . . . . . . . . . . . . 1,345 1,379,432
Aptim Corp., 7.75%, 06/15/25 (Call 11/16/20)(a) . . . . . . . . . . . 1,782 1,091,475APX Group Inc.
6.75%, 02/15/27 (Call 02/15/23)(a) . . . . . . . . . . . . . . . . . . . . . 2,530 2,637,5257.63%, 09/01/23 (Call 11/30/20). . . . . . . . . . . . . . . . . . . . . . . . 1,843 1,857,5147.88%, 12/01/22 (Call 11/30/20). . . . . . . . . . . . . . . . . . . . . . . . 3,312 3,300,756
ASGN Inc., 4.63%, 05/15/28 (Call 05/15/23)(a) . . . . . . . . . . . . 2,587 2,660,186Autopistas Metropolitanas de Puerto Rico LLC, 6.75%,
06/30/35(a) . . . . . . . . . . . . . . . . . . . . . . . . . . . . . . . . . . . . . . . . . . . . 761 641,955Avis Budget Car Rental LLC/Avis Budget Finance Inc.
5.25%, 03/15/25 (Call 11/30/20)(a). . . . . . . . . . . . . . . . . . . . . . 1,719 1,620,1585.75%, 07/15/27 (Call 07/15/22)(a) . . . . . . . . . . . . . . . . . . . . . 2,202 2,066,9075.75%, 07/15/27 (Call 07/15/22)(a)(b) . . . . . . . . . . . . . . . . . . . 1,211 1,138,3406.38%, 04/01/24 (Call 11/30/20)(a). . . . . . . . . . . . . . . . . . . . . . 1,429 1,391,48910.50%, 05/15/25 (Call 05/15/22)(a) . . . . . . . . . . . . . . . . . . . . 2,030 2,326,887
Brink's Co. (The)4.63%, 10/15/27 (Call 10/15/22)(a)(b) . . . . . . . . . . . . . . . . . . . 2,939 2,998,7505.50%, 07/15/25 (Call 07/15/22)(a) . . . . . . . . . . . . . . . . . . . . . 1,213 1,261,775
Capitol Investment Merger Sub 2 LLC, 10.00%, 08/01/24(Call 08/01/21)(a)(b) . . . . . . . . . . . . . . . . . . . . . . . . . . . . . . . . . . . . 2,226 2,359,560
Cardtronics Inc./Cardtronics USA Inc., 5.50%, 05/01/25(Call 11/30/20)(a)(b) . . . . . . . . . . . . . . . . . . . . . . . . . . . . . . . . . . . . 1,416 1,428,390
Carriage Services Inc., 6.63%, 06/01/26 (Call 06/01/21)(a) . 1,994 2,095,814Cimpress PLC, 7.00%, 06/15/26 (Call 06/15/21)(a)(b) . . . . . . . 2,708 2,694,460Garda World Security Corp.
4.63%, 02/15/27 (Call 02/15/23)(a) . . . . . . . . . . . . . . . . . . . . . 2,559 2,495,0259.50%, 11/01/27 (Call 11/01/22)(a)(b). . . . . . . . . . . . . . . . . . . . 2,830 3,021,025
Gartner Inc.3.75%, 10/01/30 (Call 10/01/25)(a) . . . . . . . . . . . . . . . . . . . . . 3,260 3,333,6764.50%, 07/01/28 (Call 07/01/23)(a) . . . . . . . . . . . . . . . . . . . . . 3,644 3,804,190
Graham Holdings Co., 5.75%, 06/01/26(Call 06/01/21)(a)(b) . . . . . . . . . . . . . . . . . . . . . . . . . . . . . . . . . . . . 1,608 1,685,908
Herc Holdings Inc., 5.50%, 07/15/27 (Call 07/15/22)(a) . . . . . 5,358 5,506,015Jaguar Holding Co. II/PPD Development LP
4.63%, 06/15/25 (Call 06/15/22)(a)(b) . . . . . . . . . . . . . . . . . . . 3,330 3,439,8575.00%, 06/15/28 (Call 06/15/23)(a)(b) . . . . . . . . . . . . . . . . . . . 2,605 2,715,218
Korn Ferry, 4.63%, 12/15/27 (Call 12/15/22)(a)(b). . . . . . . . . . . 1,831 1,863,043Laureate Education Inc., 8.25%, 05/01/25
(Call 11/30/20)(a) . . . . . . . . . . . . . . . . . . . . . . . . . . . . . . . . . . . . . . 3,511 3,739,952Midas Intermediate Holdco II LLC/Midas Intermediate
Holdco II Finance Inc., 7.88%, 10/01/22(Call 11/16/20)(a)(b) . . . . . . . . . . . . . . . . . . . . . . . . . . . . . . . . . . . . 1,798 1,474,360
MPH Acquisition Holdings LLC, 5.75%, 11/01/28(Call 11/01/23)(a) . . . . . . . . . . . . . . . . . . . . . . . . . . . . . . . . . . . . . . 3,765 3,699,112
Schedule of Investments (continued)
October 31, 2020
iShares� Broad USD High Yield Corporate Bond ETF(Percentages shown are based on Net Assets)
S C H E D U L E O F I N V E S T M E N T S 29
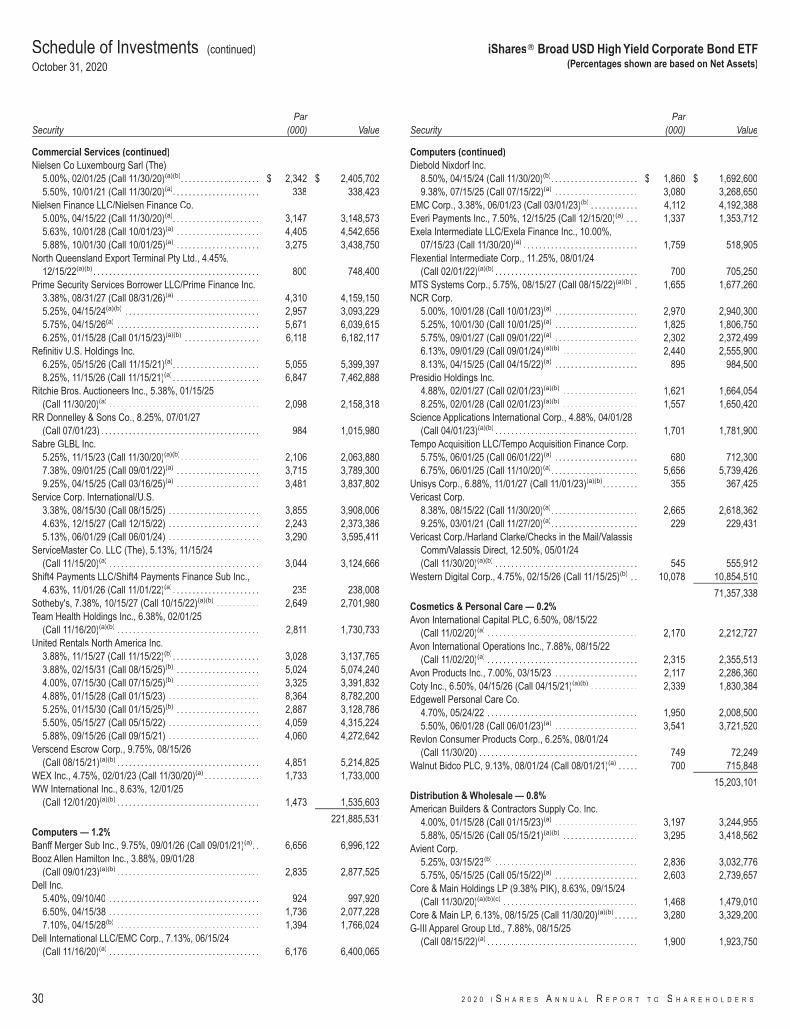
SecurityPar
(000) Value
Commercial Services (continued)Nielsen Co Luxembourg Sarl (The)
5.00%, 02/01/25 (Call 11/30/20)(a)(b). . . . . . . . . . . . . . . . . . . . $ 2,342 $ 2,405,7025.50%, 10/01/21 (Call 11/30/20)(a). . . . . . . . . . . . . . . . . . . . . . 338 338,423
Nielsen Finance LLC/Nielsen Finance Co.5.00%, 04/15/22 (Call 11/30/20)(a). . . . . . . . . . . . . . . . . . . . . . 3,147 3,148,5735.63%, 10/01/28 (Call 10/01/23)(a) . . . . . . . . . . . . . . . . . . . . . 4,405 4,542,6565.88%, 10/01/30 (Call 10/01/25)(a) . . . . . . . . . . . . . . . . . . . . . 3,275 3,438,750
North Queensland Export Terminal Pty Ltd., 4.45%,12/15/22(a)(b) . . . . . . . . . . . . . . . . . . . . . . . . . . . . . . . . . . . . . . . . . . 800 748,400
Prime Security Services Borrower LLC/Prime Finance Inc.3.38%, 08/31/27 (Call 08/31/26)(a) . . . . . . . . . . . . . . . . . . . . . 4,310 4,159,1505.25%, 04/15/24(a)(b) . . . . . . . . . . . . . . . . . . . . . . . . . . . . . . . . . . 2,957 3,093,2295.75%, 04/15/26(a) . . . . . . . . . . . . . . . . . . . . . . . . . . . . . . . . . . . . 5,671 6,039,6156.25%, 01/15/28 (Call 01/15/23)(a)(b) . . . . . . . . . . . . . . . . . . . 6,118 6,182,117
Refinitiv U.S. Holdings Inc.6.25%, 05/15/26 (Call 11/15/21)(a). . . . . . . . . . . . . . . . . . . . . . 5,055 5,399,3978.25%, 11/15/26 (Call 11/15/21)(a). . . . . . . . . . . . . . . . . . . . . . 6,847 7,462,888
Ritchie Bros. Auctioneers Inc., 5.38%, 01/15/25(Call 11/30/20)(a) . . . . . . . . . . . . . . . . . . . . . . . . . . . . . . . . . . . . . . 2,098 2,158,318
RR Donnelley & Sons Co., 8.25%, 07/01/27(Call 07/01/23) . . . . . . . . . . . . . . . . . . . . . . . . . . . . . . . . . . . . . . . . 984 1,015,980
Sabre GLBL Inc.5.25%, 11/15/23 (Call 11/30/20)(a)(b). . . . . . . . . . . . . . . . . . . . 2,106 2,063,8807.38%, 09/01/25 (Call 09/01/22)(a) . . . . . . . . . . . . . . . . . . . . . 3,715 3,789,3009.25%, 04/15/25 (Call 03/16/25)(a) . . . . . . . . . . . . . . . . . . . . . 3,481 3,837,802
Service Corp. International/U.S.3.38%, 08/15/30 (Call 08/15/25) . . . . . . . . . . . . . . . . . . . . . . . 3,855 3,908,0064.63%, 12/15/27 (Call 12/15/22) . . . . . . . . . . . . . . . . . . . . . . . 2,243 2,373,3865.13%, 06/01/29 (Call 06/01/24) . . . . . . . . . . . . . . . . . . . . . . . 3,290 3,595,411
ServiceMaster Co. LLC (The), 5.13%, 11/15/24(Call 11/15/20)(a) . . . . . . . . . . . . . . . . . . . . . . . . . . . . . . . . . . . . . . 3,044 3,124,666
Shift4 Payments LLC/Shift4 Payments Finance Sub Inc.,4.63%, 11/01/26 (Call 11/01/22)(a). . . . . . . . . . . . . . . . . . . . . . 235 238,008
Sotheby's, 7.38%, 10/15/27 (Call 10/15/22)(a)(b) . . . . . . . . . . . 2,649 2,701,980Team Health Holdings Inc., 6.38%, 02/01/25
(Call 11/16/20)(a)(b) . . . . . . . . . . . . . . . . . . . . . . . . . . . . . . . . . . . . 2,811 1,730,733United Rentals North America Inc.
3.88%, 11/15/27 (Call 11/15/22)(b). . . . . . . . . . . . . . . . . . . . . . 3,028 3,137,7653.88%, 02/15/31 (Call 08/15/25)(b) . . . . . . . . . . . . . . . . . . . . . 5,024 5,074,2404.00%, 07/15/30 (Call 07/15/25)(b) . . . . . . . . . . . . . . . . . . . . . 3,325 3,391,8324.88%, 01/15/28 (Call 01/15/23) . . . . . . . . . . . . . . . . . . . . . . . 8,364 8,782,2005.25%, 01/15/30 (Call 01/15/25)(b) . . . . . . . . . . . . . . . . . . . . . 2,887 3,128,7865.50%, 05/15/27 (Call 05/15/22) . . . . . . . . . . . . . . . . . . . . . . . 4,059 4,315,2245.88%, 09/15/26 (Call 09/15/21) . . . . . . . . . . . . . . . . . . . . . . . 4,060 4,272,642
Verscend Escrow Corp., 9.75%, 08/15/26(Call 08/15/21)(a)(b) . . . . . . . . . . . . . . . . . . . . . . . . . . . . . . . . . . . . 4,851 5,214,825
WEX Inc., 4.75%, 02/01/23 (Call 11/30/20)(a) . . . . . . . . . . . . . . 1,733 1,733,000WW International Inc., 8.63%, 12/01/25
(Call 12/01/20)(a)(b) . . . . . . . . . . . . . . . . . . . . . . . . . . . . . . . . . . . . 1,473 1,535,603
221,885,531Computers — 1.2%Banff Merger Sub Inc., 9.75%, 09/01/26 (Call 09/01/21)(a). . 6,656 6,996,122Booz Allen Hamilton Inc., 3.88%, 09/01/28
(Call 09/01/23)(a)(b) . . . . . . . . . . . . . . . . . . . . . . . . . . . . . . . . . . . . 2,835 2,877,525Dell Inc.
5.40%, 09/10/40 . . . . . . . . . . . . . . . . . . . . . . . . . . . . . . . . . . . . . . 924 997,9206.50%, 04/15/38 . . . . . . . . . . . . . . . . . . . . . . . . . . . . . . . . . . . . . . 1,736 2,077,2287.10%, 04/15/28(b) . . . . . . . . . . . . . . . . . . . . . . . . . . . . . . . . . . . . 1,394 1,766,024
Dell International LLC/EMC Corp., 7.13%, 06/15/24(Call 11/16/20)(a) . . . . . . . . . . . . . . . . . . . . . . . . . . . . . . . . . . . . . . 6,176 6,400,065
SecurityPar
(000) Value
Computers (continued)Diebold Nixdorf Inc.
8.50%, 04/15/24 (Call 11/30/20)(b). . . . . . . . . . . . . . . . . . . . . . $ 1,860 $ 1,692,6009.38%, 07/15/25 (Call 07/15/22)(a) . . . . . . . . . . . . . . . . . . . . . 3,080 3,268,650
EMC Corp., 3.38%, 06/01/23 (Call 03/01/23)(b) . . . . . . . . . . . . 4,112 4,192,388Everi Payments Inc., 7.50%, 12/15/25 (Call 12/15/20)(a) . . . 1,337 1,353,712Exela Intermediate LLC/Exela Finance Inc., 10.00%,
07/15/23 (Call 11/30/20)(a) . . . . . . . . . . . . . . . . . . . . . . . . . . . . . 1,759 518,905Flexential Intermediate Corp., 11.25%, 08/01/24
(Call 02/01/22)(a)(b) . . . . . . . . . . . . . . . . . . . . . . . . . . . . . . . . . . . . 700 705,250MTS Systems Corp., 5.75%, 08/15/27 (Call 08/15/22)(a)(b) . 1,655 1,677,260NCR Corp.
5.00%, 10/01/28 (Call 10/01/23)(a) . . . . . . . . . . . . . . . . . . . . . 2,970 2,940,3005.25%, 10/01/30 (Call 10/01/25)(a) . . . . . . . . . . . . . . . . . . . . . 1,825 1,806,7505.75%, 09/01/27 (Call 09/01/22)(a) . . . . . . . . . . . . . . . . . . . . . 2,302 2,372,4996.13%, 09/01/29 (Call 09/01/24)(a)(b) . . . . . . . . . . . . . . . . . . . 2,440 2,555,9008.13%, 04/15/25 (Call 04/15/22)(a) . . . . . . . . . . . . . . . . . . . . . 895 984,500
Presidio Holdings Inc.4.88%, 02/01/27 (Call 02/01/23)(a)(b) . . . . . . . . . . . . . . . . . . . 1,621 1,664,0548.25%, 02/01/28 (Call 02/01/23)(a)(b) . . . . . . . . . . . . . . . . . . . 1,557 1,650,420
Science Applications International Corp., 4.88%, 04/01/28(Call 04/01/23)(a)(b) . . . . . . . . . . . . . . . . . . . . . . . . . . . . . . . . . . . . 1,701 1,781,900
Tempo Acquisition LLC/Tempo Acquisition Finance Corp.5.75%, 06/01/25 (Call 06/01/22)(a) . . . . . . . . . . . . . . . . . . . . . 680 712,3006.75%, 06/01/25 (Call 11/10/20)(a). . . . . . . . . . . . . . . . . . . . . . 5,656 5,739,426
Unisys Corp., 6.88%, 11/01/27 (Call 11/01/23)(a)(b). . . . . . . . . 355 367,425Vericast Corp.
8.38%, 08/15/22 (Call 11/30/20)(a). . . . . . . . . . . . . . . . . . . . . . 2,665 2,618,3629.25%, 03/01/21 (Call 11/27/20)(a). . . . . . . . . . . . . . . . . . . . . . 229 229,431
Vericast Corp./Harland Clarke/Checks in the Mail/ValassisComm/Valassis Direct, 12.50%, 05/01/24(Call 11/30/20)(a)(b) . . . . . . . . . . . . . . . . . . . . . . . . . . . . . . . . . . . . 545 555,912
Western Digital Corp., 4.75%, 02/15/26 (Call 11/15/25)(b) . . 10,078 10,854,510
71,357,338Cosmetics & Personal Care — 0.2%Avon International Capital PLC, 6.50%, 08/15/22
(Call 11/02/20)(a) . . . . . . . . . . . . . . . . . . . . . . . . . . . . . . . . . . . . . . 2,170 2,212,727Avon International Operations Inc., 7.88%, 08/15/22
(Call 11/02/20)(a) . . . . . . . . . . . . . . . . . . . . . . . . . . . . . . . . . . . . . . 2,315 2,355,513Avon Products Inc., 7.00%, 03/15/23 . . . . . . . . . . . . . . . . . . . . . 2,117 2,286,360Coty Inc., 6.50%, 04/15/26 (Call 04/15/21)(a)(b) . . . . . . . . . . . . 2,339 1,830,384Edgewell Personal Care Co.
4.70%, 05/24/22 . . . . . . . . . . . . . . . . . . . . . . . . . . . . . . . . . . . . . . 1,950 2,008,5005.50%, 06/01/28 (Call 06/01/23)(a) . . . . . . . . . . . . . . . . . . . . . 3,541 3,721,520
Revlon Consumer Products Corp., 6.25%, 08/01/24(Call 11/30/20) . . . . . . . . . . . . . . . . . . . . . . . . . . . . . . . . . . . . . . . . 749 72,249
Walnut Bidco PLC, 9.13%, 08/01/24 (Call 08/01/21)(a) . . . . . 700 715,848
15,203,101Distribution & Wholesale — 0.8%American Builders & Contractors Supply Co. Inc.
4.00%, 01/15/28 (Call 01/15/23)(a) . . . . . . . . . . . . . . . . . . . . . 3,197 3,244,9555.88%, 05/15/26 (Call 05/15/21)(a)(b) . . . . . . . . . . . . . . . . . . . 3,295 3,418,562
Avient Corp.5.25%, 03/15/23(b) . . . . . . . . . . . . . . . . . . . . . . . . . . . . . . . . . . . . 2,836 3,032,7765.75%, 05/15/25 (Call 05/15/22)(a) . . . . . . . . . . . . . . . . . . . . . 2,603 2,739,657
Core & Main Holdings LP (9.38% PIK), 8.63%, 09/15/24(Call 11/30/20)(a)(b)(c) . . . . . . . . . . . . . . . . . . . . . . . . . . . . . . . . . . 1,468 1,479,010
Core & Main LP, 6.13%, 08/15/25 (Call 11/30/20)(a)(b) . . . . . . 3,280 3,329,200G-III Apparel Group Ltd., 7.88%, 08/15/25
(Call 08/15/22)(a) . . . . . . . . . . . . . . . . . . . . . . . . . . . . . . . . . . . . . . 1,900 1,923,750
Schedule of Investments (continued)
October 31, 2020
iShares� Broad USD High Yield Corporate Bond ETF(Percentages shown are based on Net Assets)
30 2 0 2 0 I S H A R E S A N N U A L R E P O R T T O S H A R E H O L D E R S
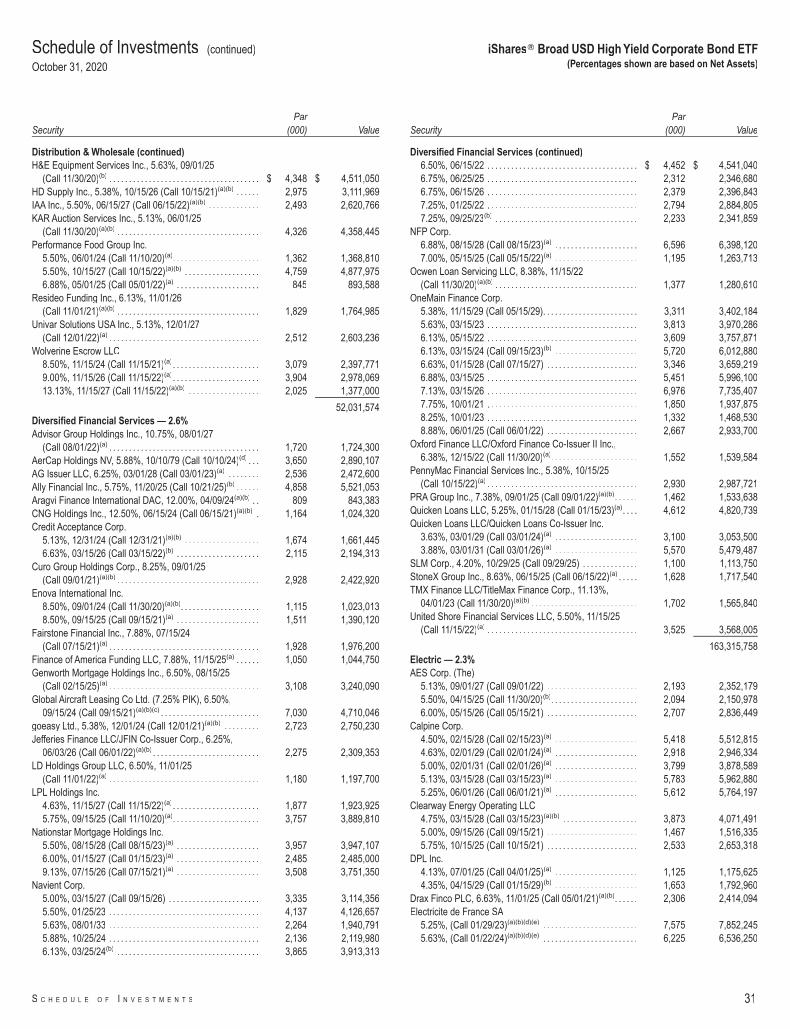
SecurityPar
(000) Value
Distribution & Wholesale (continued)H&E Equipment Services Inc., 5.63%, 09/01/25
(Call 11/30/20)(b) . . . . . . . . . . . . . . . . . . . . . . . . . . . . . . . . . . . . . . $ 4,348 $ 4,511,050HD Supply Inc., 5.38%, 10/15/26 (Call 10/15/21)(a)(b) . . . . . . 2,975 3,111,969IAA Inc., 5.50%, 06/15/27 (Call 06/15/22)(a)(b) . . . . . . . . . . . . . 2,493 2,620,766KAR Auction Services Inc., 5.13%, 06/01/25
(Call 11/30/20)(a)(b) . . . . . . . . . . . . . . . . . . . . . . . . . . . . . . . . . . . . 4,326 4,358,445Performance Food Group Inc.
5.50%, 06/01/24 (Call 11/10/20)(a). . . . . . . . . . . . . . . . . . . . . . 1,362 1,368,8105.50%, 10/15/27 (Call 10/15/22)(a)(b) . . . . . . . . . . . . . . . . . . . 4,759 4,877,9756.88%, 05/01/25 (Call 05/01/22)(a) . . . . . . . . . . . . . . . . . . . . . 845 893,588
Resideo Funding Inc., 6.13%, 11/01/26(Call 11/01/21)(a)(b) . . . . . . . . . . . . . . . . . . . . . . . . . . . . . . . . . . . . 1,829 1,764,985
Univar Solutions USA Inc., 5.13%, 12/01/27(Call 12/01/22)(a) . . . . . . . . . . . . . . . . . . . . . . . . . . . . . . . . . . . . . . 2,512 2,603,236
Wolverine Escrow LLC8.50%, 11/15/24 (Call 11/15/21)(a). . . . . . . . . . . . . . . . . . . . . . 3,079 2,397,7719.00%, 11/15/26 (Call 11/15/22)(a). . . . . . . . . . . . . . . . . . . . . . 3,904 2,978,06913.13%, 11/15/27 (Call 11/15/22)(a)(b) . . . . . . . . . . . . . . . . . . 2,025 1,377,000
52,031,574Diversified Financial Services — 2.6%Advisor Group Holdings Inc., 10.75%, 08/01/27
(Call 08/01/22)(a) . . . . . . . . . . . . . . . . . . . . . . . . . . . . . . . . . . . . . . 1,720 1,724,300AerCap Holdings NV, 5.88%, 10/10/79 (Call 10/10/24)(d) . . . 3,650 2,890,107AG Issuer LLC, 6.25%, 03/01/28 (Call 03/01/23)(a) . . . . . . . . 2,536 2,472,600Ally Financial Inc., 5.75%, 11/20/25 (Call 10/21/25)(b) . . . . . . 4,858 5,521,053Aragvi Finance International DAC, 12.00%, 04/09/24(a)(b) . . 809 843,383CNG Holdings Inc., 12.50%, 06/15/24 (Call 06/15/21)(a)(b) . 1,164 1,024,320Credit Acceptance Corp.
5.13%, 12/31/24 (Call 12/31/21)(a)(b) . . . . . . . . . . . . . . . . . . . 1,674 1,661,4456.63%, 03/15/26 (Call 03/15/22)(b) . . . . . . . . . . . . . . . . . . . . . 2,115 2,194,313
Curo Group Holdings Corp., 8.25%, 09/01/25(Call 09/01/21)(a)(b) . . . . . . . . . . . . . . . . . . . . . . . . . . . . . . . . . . . . 2,928 2,422,920
Enova International Inc.8.50%, 09/01/24 (Call 11/30/20)(a)(b). . . . . . . . . . . . . . . . . . . . 1,115 1,023,0138.50%, 09/15/25 (Call 09/15/21)(a) . . . . . . . . . . . . . . . . . . . . . 1,511 1,390,120
Fairstone Financial Inc., 7.88%, 07/15/24(Call 07/15/21)(a) . . . . . . . . . . . . . . . . . . . . . . . . . . . . . . . . . . . . . . 1,928 1,976,200
Finance of America Funding LLC, 7.88%, 11/15/25(a) . . . . . . 1,050 1,044,750Genworth Mortgage Holdings Inc., 6.50%, 08/15/25
(Call 02/15/25)(a) . . . . . . . . . . . . . . . . . . . . . . . . . . . . . . . . . . . . . . 3,108 3,240,090Global Aircraft Leasing Co Ltd. (7.25% PIK), 6.50%,
09/15/24 (Call 09/15/21)(a)(b)(c) . . . . . . . . . . . . . . . . . . . . . . . . . 7,030 4,710,046goeasy Ltd., 5.38%, 12/01/24 (Call 12/01/21)(a)(b) . . . . . . . . . 2,723 2,750,230Jefferies Finance LLC/JFIN Co-Issuer Corp., 6.25%,
06/03/26 (Call 06/01/22)(a)(b) . . . . . . . . . . . . . . . . . . . . . . . . . . . 2,275 2,309,353LD Holdings Group LLC, 6.50%, 11/01/25
(Call 11/01/22)(a) . . . . . . . . . . . . . . . . . . . . . . . . . . . . . . . . . . . . . . 1,180 1,197,700LPL Holdings Inc.
4.63%, 11/15/27 (Call 11/15/22)(a). . . . . . . . . . . . . . . . . . . . . . 1,877 1,923,9255.75%, 09/15/25 (Call 11/10/20)(a). . . . . . . . . . . . . . . . . . . . . . 3,757 3,889,810
Nationstar Mortgage Holdings Inc.5.50%, 08/15/28 (Call 08/15/23)(a) . . . . . . . . . . . . . . . . . . . . . 3,957 3,947,1076.00%, 01/15/27 (Call 01/15/23)(a) . . . . . . . . . . . . . . . . . . . . . 2,485 2,485,0009.13%, 07/15/26 (Call 07/15/21)(a) . . . . . . . . . . . . . . . . . . . . . 3,508 3,751,350
Navient Corp.5.00%, 03/15/27 (Call 09/15/26) . . . . . . . . . . . . . . . . . . . . . . . 3,335 3,114,3565.50%, 01/25/23 . . . . . . . . . . . . . . . . . . . . . . . . . . . . . . . . . . . . . . 4,137 4,126,6575.63%, 08/01/33 . . . . . . . . . . . . . . . . . . . . . . . . . . . . . . . . . . . . . . 2,264 1,940,7915.88%, 10/25/24 . . . . . . . . . . . . . . . . . . . . . . . . . . . . . . . . . . . . . . 2,136 2,119,9806.13%, 03/25/24(b) . . . . . . . . . . . . . . . . . . . . . . . . . . . . . . . . . . . . 3,865 3,913,313
SecurityPar
(000) Value
Diversified Financial Services (continued)6.50%, 06/15/22 . . . . . . . . . . . . . . . . . . . . . . . . . . . . . . . . . . . . . . $ 4,452 $ 4,541,0406.75%, 06/25/25 . . . . . . . . . . . . . . . . . . . . . . . . . . . . . . . . . . . . . . 2,312 2,346,6806.75%, 06/15/26 . . . . . . . . . . . . . . . . . . . . . . . . . . . . . . . . . . . . . . 2,379 2,396,8437.25%, 01/25/22 . . . . . . . . . . . . . . . . . . . . . . . . . . . . . . . . . . . . . . 2,794 2,884,8057.25%, 09/25/23(b) . . . . . . . . . . . . . . . . . . . . . . . . . . . . . . . . . . . . 2,233 2,341,859
NFP Corp.6.88%, 08/15/28 (Call 08/15/23)(a) . . . . . . . . . . . . . . . . . . . . . 6,596 6,398,1207.00%, 05/15/25 (Call 05/15/22)(a) . . . . . . . . . . . . . . . . . . . . . 1,195 1,263,713
Ocwen Loan Servicing LLC, 8.38%, 11/15/22(Call 11/30/20)(a)(b) . . . . . . . . . . . . . . . . . . . . . . . . . . . . . . . . . . . . 1,377 1,280,610
OneMain Finance Corp.5.38%, 11/15/29 (Call 05/15/29). . . . . . . . . . . . . . . . . . . . . . . . 3,311 3,402,1845.63%, 03/15/23 . . . . . . . . . . . . . . . . . . . . . . . . . . . . . . . . . . . . . . 3,813 3,970,2866.13%, 05/15/22 . . . . . . . . . . . . . . . . . . . . . . . . . . . . . . . . . . . . . . 3,609 3,757,8716.13%, 03/15/24 (Call 09/15/23)(b) . . . . . . . . . . . . . . . . . . . . . 5,720 6,012,8806.63%, 01/15/28 (Call 07/15/27) . . . . . . . . . . . . . . . . . . . . . . . 3,346 3,659,2196.88%, 03/15/25 . . . . . . . . . . . . . . . . . . . . . . . . . . . . . . . . . . . . . . 5,451 5,996,1007.13%, 03/15/26 . . . . . . . . . . . . . . . . . . . . . . . . . . . . . . . . . . . . . . 6,976 7,735,4077.75%, 10/01/21 . . . . . . . . . . . . . . . . . . . . . . . . . . . . . . . . . . . . . . 1,850 1,937,8758.25%, 10/01/23 . . . . . . . . . . . . . . . . . . . . . . . . . . . . . . . . . . . . . . 1,332 1,468,5308.88%, 06/01/25 (Call 06/01/22) . . . . . . . . . . . . . . . . . . . . . . . 2,667 2,933,700
Oxford Finance LLC/Oxford Finance Co-Issuer II Inc.,6.38%, 12/15/22 (Call 11/30/20)(a). . . . . . . . . . . . . . . . . . . . . . 1,552 1,539,584
PennyMac Financial Services Inc., 5.38%, 10/15/25(Call 10/15/22)(a) . . . . . . . . . . . . . . . . . . . . . . . . . . . . . . . . . . . . . . 2,930 2,987,721
PRA Group Inc., 7.38%, 09/01/25 (Call 09/01/22)(a)(b). . . . . . 1,462 1,533,638Quicken Loans LLC, 5.25%, 01/15/28 (Call 01/15/23)(a). . . . 4,612 4,820,739Quicken Loans LLC/Quicken Loans Co-Issuer Inc.
3.63%, 03/01/29 (Call 03/01/24)(a) . . . . . . . . . . . . . . . . . . . . . 3,100 3,053,5003.88%, 03/01/31 (Call 03/01/26)(a) . . . . . . . . . . . . . . . . . . . . . 5,570 5,479,487
SLM Corp., 4.20%, 10/29/25 (Call 09/29/25) . . . . . . . . . . . . . . 1,100 1,113,750StoneX Group Inc., 8.63%, 06/15/25 (Call 06/15/22)(a) . . . . . 1,628 1,717,540TMX Finance LLC/TitleMax Finance Corp., 11.13%,
04/01/23 (Call 11/30/20)(a)(b) . . . . . . . . . . . . . . . . . . . . . . . . . . . 1,702 1,565,840United Shore Financial Services LLC, 5.50%, 11/15/25
(Call 11/15/22)(a) . . . . . . . . . . . . . . . . . . . . . . . . . . . . . . . . . . . . . . 3,525 3,568,005
163,315,758Electric — 2.3%AES Corp. (The)
5.13%, 09/01/27 (Call 09/01/22) . . . . . . . . . . . . . . . . . . . . . . . 2,193 2,352,1795.50%, 04/15/25 (Call 11/30/20)(b). . . . . . . . . . . . . . . . . . . . . . 2,094 2,150,9786.00%, 05/15/26 (Call 05/15/21) . . . . . . . . . . . . . . . . . . . . . . . 2,707 2,836,449
Calpine Corp.4.50%, 02/15/28 (Call 02/15/23)(a) . . . . . . . . . . . . . . . . . . . . . 5,418 5,512,8154.63%, 02/01/29 (Call 02/01/24)(a) . . . . . . . . . . . . . . . . . . . . . 2,918 2,946,3345.00%, 02/01/31 (Call 02/01/26)(a) . . . . . . . . . . . . . . . . . . . . . 3,799 3,878,5895.13%, 03/15/28 (Call 03/15/23)(a) . . . . . . . . . . . . . . . . . . . . . 5,783 5,962,8805.25%, 06/01/26 (Call 06/01/21)(a) . . . . . . . . . . . . . . . . . . . . . 5,612 5,764,197
Clearway Energy Operating LLC4.75%, 03/15/28 (Call 03/15/23)(a)(b) . . . . . . . . . . . . . . . . . . . 3,873 4,071,4915.00%, 09/15/26 (Call 09/15/21) . . . . . . . . . . . . . . . . . . . . . . . 1,467 1,516,3355.75%, 10/15/25 (Call 10/15/21) . . . . . . . . . . . . . . . . . . . . . . . 2,533 2,653,318
DPL Inc.4.13%, 07/01/25 (Call 04/01/25)(a) . . . . . . . . . . . . . . . . . . . . . 1,125 1,175,6254.35%, 04/15/29 (Call 01/15/29)(b) . . . . . . . . . . . . . . . . . . . . . 1,653 1,792,960
Drax Finco PLC, 6.63%, 11/01/25 (Call 05/01/21)(a)(b). . . . . . 2,306 2,414,094Electricite de France SA
5.25%, (Call 01/29/23)(a)(b)(d)(e) . . . . . . . . . . . . . . . . . . . . . . . . 7,575 7,852,2455.63%, (Call 01/22/24)(a)(b)(d)(e) . . . . . . . . . . . . . . . . . . . . . . . . 6,225 6,536,250
Schedule of Investments (continued)
October 31, 2020
iShares� Broad USD High Yield Corporate Bond ETF(Percentages shown are based on Net Assets)
S C H E D U L E O F I N V E S T M E N T S 31
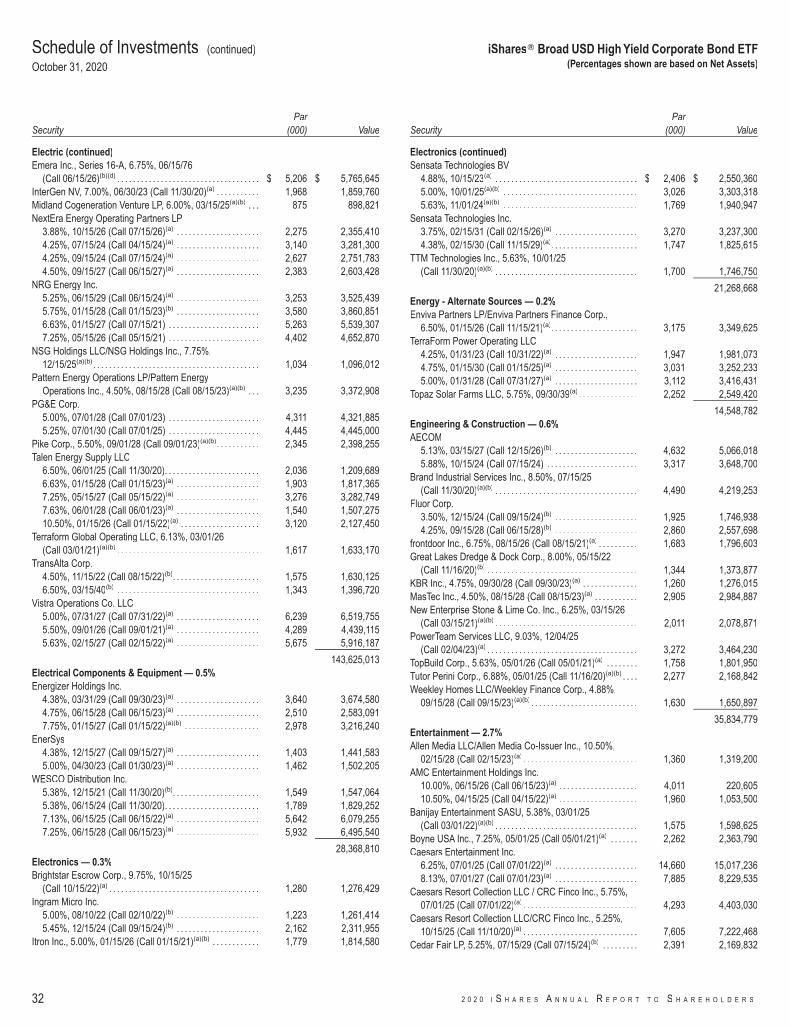
SecurityPar
(000) Value
Electric (continued)Emera Inc., Series 16-A, 6.75%, 06/15/76
(Call 06/15/26)(b)(d) . . . . . . . . . . . . . . . . . . . . . . . . . . . . . . . . . . . . $ 5,206 $ 5,765,645InterGen NV, 7.00%, 06/30/23 (Call 11/30/20)(a) . . . . . . . . . . . 1,968 1,859,760Midland Cogeneration Venture LP, 6.00%, 03/15/25(a)(b) . . . 875 898,821NextEra Energy Operating Partners LP
3.88%, 10/15/26 (Call 07/15/26)(a) . . . . . . . . . . . . . . . . . . . . . 2,275 2,355,4104.25%, 07/15/24 (Call 04/15/24)(a) . . . . . . . . . . . . . . . . . . . . . 3,140 3,281,3004.25%, 09/15/24 (Call 07/15/24)(a) . . . . . . . . . . . . . . . . . . . . . 2,627 2,751,7834.50%, 09/15/27 (Call 06/15/27)(a) . . . . . . . . . . . . . . . . . . . . . 2,383 2,603,428
NRG Energy Inc.5.25%, 06/15/29 (Call 06/15/24)(a) . . . . . . . . . . . . . . . . . . . . . 3,253 3,525,4395.75%, 01/15/28 (Call 01/15/23)(b) . . . . . . . . . . . . . . . . . . . . . 3,580 3,860,8516.63%, 01/15/27 (Call 07/15/21) . . . . . . . . . . . . . . . . . . . . . . . 5,263 5,539,3077.25%, 05/15/26 (Call 05/15/21) . . . . . . . . . . . . . . . . . . . . . . . 4,402 4,652,870
NSG Holdings LLC/NSG Holdings Inc., 7.75%,12/15/25(a)(b) . . . . . . . . . . . . . . . . . . . . . . . . . . . . . . . . . . . . . . . . . . 1,034 1,096,012
Pattern Energy Operations LP/Pattern EnergyOperations Inc., 4.50%, 08/15/28 (Call 08/15/23)(a)(b) . . . 3,235 3,372,908
PG&E Corp.5.00%, 07/01/28 (Call 07/01/23) . . . . . . . . . . . . . . . . . . . . . . . 4,311 4,321,8855.25%, 07/01/30 (Call 07/01/25) . . . . . . . . . . . . . . . . . . . . . . . 4,445 4,445,000
Pike Corp., 5.50%, 09/01/28 (Call 09/01/23)(a)(b). . . . . . . . . . . 2,345 2,398,255Talen Energy Supply LLC
6.50%, 06/01/25 (Call 11/30/20). . . . . . . . . . . . . . . . . . . . . . . . 2,036 1,209,6896.63%, 01/15/28 (Call 01/15/23)(a) . . . . . . . . . . . . . . . . . . . . . 1,903 1,817,3657.25%, 05/15/27 (Call 05/15/22)(a) . . . . . . . . . . . . . . . . . . . . . 3,276 3,282,7497.63%, 06/01/28 (Call 06/01/23)(a) . . . . . . . . . . . . . . . . . . . . . 1,540 1,507,27510.50%, 01/15/26 (Call 01/15/22)(a) . . . . . . . . . . . . . . . . . . . . 3,120 2,127,450
Terraform Global Operating LLC, 6.13%, 03/01/26(Call 03/01/21)(a)(b) . . . . . . . . . . . . . . . . . . . . . . . . . . . . . . . . . . . . 1,617 1,633,170
TransAlta Corp.4.50%, 11/15/22 (Call 08/15/22)(b). . . . . . . . . . . . . . . . . . . . . . 1,575 1,630,1256.50%, 03/15/40(b) . . . . . . . . . . . . . . . . . . . . . . . . . . . . . . . . . . . . 1,343 1,396,720
Vistra Operations Co. LLC5.00%, 07/31/27 (Call 07/31/22)(a) . . . . . . . . . . . . . . . . . . . . . 6,239 6,519,7555.50%, 09/01/26 (Call 09/01/21)(a) . . . . . . . . . . . . . . . . . . . . . 4,289 4,439,1155.63%, 02/15/27 (Call 02/15/22)(a) . . . . . . . . . . . . . . . . . . . . . 5,675 5,916,187
143,625,013Electrical Components & Equipment — 0.5%Energizer Holdings Inc.
4.38%, 03/31/29 (Call 09/30/23)(a) . . . . . . . . . . . . . . . . . . . . . 3,640 3,674,5804.75%, 06/15/28 (Call 06/15/23)(a) . . . . . . . . . . . . . . . . . . . . . 2,510 2,583,0917.75%, 01/15/27 (Call 01/15/22)(a)(b) . . . . . . . . . . . . . . . . . . . 2,978 3,216,240
EnerSys4.38%, 12/15/27 (Call 09/15/27)(a) . . . . . . . . . . . . . . . . . . . . . 1,403 1,441,5835.00%, 04/30/23 (Call 01/30/23)(a) . . . . . . . . . . . . . . . . . . . . . 1,462 1,502,205
WESCO Distribution Inc.5.38%, 12/15/21 (Call 11/30/20)(b). . . . . . . . . . . . . . . . . . . . . . 1,549 1,547,0645.38%, 06/15/24 (Call 11/30/20). . . . . . . . . . . . . . . . . . . . . . . . 1,789 1,829,2527.13%, 06/15/25 (Call 06/15/22)(a) . . . . . . . . . . . . . . . . . . . . . 5,642 6,079,2557.25%, 06/15/28 (Call 06/15/23)(a) . . . . . . . . . . . . . . . . . . . . . 5,932 6,495,540
28,368,810Electronics — 0.3%Brightstar Escrow Corp., 9.75%, 10/15/25
(Call 10/15/22)(a) . . . . . . . . . . . . . . . . . . . . . . . . . . . . . . . . . . . . . . 1,280 1,276,429Ingram Micro Inc.
5.00%, 08/10/22 (Call 02/10/22)(b) . . . . . . . . . . . . . . . . . . . . . 1,223 1,261,4145.45%, 12/15/24 (Call 09/15/24)(b) . . . . . . . . . . . . . . . . . . . . . 2,162 2,311,955
Itron Inc., 5.00%, 01/15/26 (Call 01/15/21)(a)(b) . . . . . . . . . . . . 1,779 1,814,580
SecurityPar
(000) Value
Electronics (continued)Sensata Technologies BV
4.88%, 10/15/23(a) . . . . . . . . . . . . . . . . . . . . . . . . . . . . . . . . . . . . $ 2,406 $ 2,550,3605.00%, 10/01/25(a)(b) . . . . . . . . . . . . . . . . . . . . . . . . . . . . . . . . . . 3,026 3,303,3185.63%, 11/01/24(a)(b) . . . . . . . . . . . . . . . . . . . . . . . . . . . . . . . . . . 1,769 1,940,947
Sensata Technologies Inc.3.75%, 02/15/31 (Call 02/15/26)(a) . . . . . . . . . . . . . . . . . . . . . 3,270 3,237,3004.38%, 02/15/30 (Call 11/15/29)(a). . . . . . . . . . . . . . . . . . . . . . 1,747 1,825,615
TTM Technologies Inc., 5.63%, 10/01/25(Call 11/30/20)(a)(b) . . . . . . . . . . . . . . . . . . . . . . . . . . . . . . . . . . . . 1,700 1,746,750
21,268,668Energy - Alternate Sources — 0.2%Enviva Partners LP/Enviva Partners Finance Corp.,
6.50%, 01/15/26 (Call 11/15/21)(a). . . . . . . . . . . . . . . . . . . . . . 3,175 3,349,625TerraForm Power Operating LLC
4.25%, 01/31/23 (Call 10/31/22)(a) . . . . . . . . . . . . . . . . . . . . . 1,947 1,981,0734.75%, 01/15/30 (Call 01/15/25)(a) . . . . . . . . . . . . . . . . . . . . . 3,031 3,252,2335.00%, 01/31/28 (Call 07/31/27)(a) . . . . . . . . . . . . . . . . . . . . . 3,112 3,416,431
Topaz Solar Farms LLC, 5.75%, 09/30/39(a) . . . . . . . . . . . . . . . 2,252 2,549,420
14,548,782Engineering & Construction — 0.6%AECOM
5.13%, 03/15/27 (Call 12/15/26)(b) . . . . . . . . . . . . . . . . . . . . . 4,632 5,066,0185.88%, 10/15/24 (Call 07/15/24) . . . . . . . . . . . . . . . . . . . . . . . 3,317 3,648,700
Brand Industrial Services Inc., 8.50%, 07/15/25(Call 11/30/20)(a)(b) . . . . . . . . . . . . . . . . . . . . . . . . . . . . . . . . . . . . 4,490 4,219,253
Fluor Corp.3.50%, 12/15/24 (Call 09/15/24)(b) . . . . . . . . . . . . . . . . . . . . . 1,925 1,746,9384.25%, 09/15/28 (Call 06/15/28)(b) . . . . . . . . . . . . . . . . . . . . . 2,860 2,557,698
frontdoor Inc., 6.75%, 08/15/26 (Call 08/15/21)(a) . . . . . . . . . . 1,683 1,796,603Great Lakes Dredge & Dock Corp., 8.00%, 05/15/22
(Call 11/16/20)(b) . . . . . . . . . . . . . . . . . . . . . . . . . . . . . . . . . . . . . . 1,344 1,373,877KBR Inc., 4.75%, 09/30/28 (Call 09/30/23)(a) . . . . . . . . . . . . . . 1,260 1,276,015MasTec Inc., 4.50%, 08/15/28 (Call 08/15/23)(a) . . . . . . . . . . . 2,905 2,984,887New Enterprise Stone & Lime Co. Inc., 6.25%, 03/15/26
(Call 03/15/21)(a)(b) . . . . . . . . . . . . . . . . . . . . . . . . . . . . . . . . . . . . 2,011 2,078,871PowerTeam Services LLC, 9.03%, 12/04/25
(Call 02/04/23)(a) . . . . . . . . . . . . . . . . . . . . . . . . . . . . . . . . . . . . . . 3,272 3,464,230TopBuild Corp., 5.63%, 05/01/26 (Call 05/01/21)(a) . . . . . . . . 1,758 1,801,950Tutor Perini Corp., 6.88%, 05/01/25 (Call 11/16/20)(a)(b) . . . . 2,277 2,168,842Weekley Homes LLC/Weekley Finance Corp., 4.88%,
09/15/28 (Call 09/15/23)(a)(b) . . . . . . . . . . . . . . . . . . . . . . . . . . . 1,630 1,650,897
35,834,779Entertainment — 2.7%Allen Media LLC/Allen Media Co-Issuer Inc., 10.50%,
02/15/28 (Call 02/15/23)(a) . . . . . . . . . . . . . . . . . . . . . . . . . . . . . 1,360 1,319,200AMC Entertainment Holdings Inc.
10.00%, 06/15/26 (Call 06/15/23)(a) . . . . . . . . . . . . . . . . . . . . 4,011 220,60510.50%, 04/15/25 (Call 04/15/22)(a) . . . . . . . . . . . . . . . . . . . . 1,960 1,053,500
Banijay Entertainment SASU, 5.38%, 03/01/25(Call 03/01/22)(a)(b) . . . . . . . . . . . . . . . . . . . . . . . . . . . . . . . . . . . . 1,575 1,598,625
Boyne USA Inc., 7.25%, 05/01/25 (Call 05/01/21)(a) . . . . . . . 2,262 2,363,790Caesars Entertainment Inc.
6.25%, 07/01/25 (Call 07/01/22)(a) . . . . . . . . . . . . . . . . . . . . . 14,660 15,017,2368.13%, 07/01/27 (Call 07/01/23)(a) . . . . . . . . . . . . . . . . . . . . . 7,885 8,229,535
Caesars Resort Collection LLC / CRC Finco Inc., 5.75%,07/01/25 (Call 07/01/22)(a) . . . . . . . . . . . . . . . . . . . . . . . . . . . . . 4,293 4,403,030
Caesars Resort Collection LLC/CRC Finco Inc., 5.25%,10/15/25 (Call 11/10/20)(a) . . . . . . . . . . . . . . . . . . . . . . . . . . . . . 7,605 7,222,468
Cedar Fair LP, 5.25%, 07/15/29 (Call 07/15/24)(b) . . . . . . . . . 2,391 2,169,832
Schedule of Investments (continued)
October 31, 2020
iShares� Broad USD High Yield Corporate Bond ETF(Percentages shown are based on Net Assets)
32 2 0 2 0 I S H A R E S A N N U A L R E P O R T T O S H A R E H O L D E R S

SecurityPar
(000) Value
Entertainment (continued)Cedar Fair LP/Canada's Wonderland Co./Magnum
Management Corp., 5.38%, 06/01/24 (Call 11/30/20)(b). . $ 2,028 $ 1,951,950Cedar Fair LP/Canada's Wonderland Co./Magnum
Management Corp./Millennium Op5.38%, 04/15/27 (Call 04/15/22)(b) . . . . . . . . . . . . . . . . . . . . . 2,208 2,045,1605.50%, 05/01/25 (Call 05/01/22)(a) . . . . . . . . . . . . . . . . . . . . . 3,393 3,435,4126.50%, 10/01/28 (Call 10/01/23)(a) . . . . . . . . . . . . . . . . . . . . . 1,000 975,000
Churchill Downs Inc.4.75%, 01/15/28 (Call 01/15/23)(a) . . . . . . . . . . . . . . . . . . . . . 2,435 2,471,5255.50%, 04/01/27 (Call 04/01/22)(a)(b) . . . . . . . . . . . . . . . . . . . 2,845 2,946,353
Cinemark USA Inc.4.88%, 06/01/23 (Call 11/30/20)(b). . . . . . . . . . . . . . . . . . . . . . 3,453 2,894,9615.13%, 12/15/22 (Call 11/30/20). . . . . . . . . . . . . . . . . . . . . . . . 1,816 1,575,3808.75%, 05/01/25 (Call 05/01/22)(a) . . . . . . . . . . . . . . . . . . . . . 855 882,788
Cirsa Finance International Sarl, 7.88%, 12/20/23(Call 11/10/20)(a) . . . . . . . . . . . . . . . . . . . . . . . . . . . . . . . . . . . . . . 2,016 1,824,480
Codere Finance 2 Luxembourg SA, 7.63%, 11/01/21(Call 11/30/20)(a)(f). . . . . . . . . . . . . . . . . . . . . . . . . . . . . . . . . . . . . 652 316,872
Downstream Development Authority of the Quapaw Tribeof Oklahoma, 10.50%, 02/15/23 (Call 11/30/20)(a)(b). . . . . 992 922,560
Enterprise Development Authority (The), 12.00%, 07/15/24(Call 07/15/21)(a)(b) . . . . . . . . . . . . . . . . . . . . . . . . . . . . . . . . . . . . 2,162 2,394,415
Gateway Casinos & Entertainment Ltd., 8.25%, 03/01/24(Call 11/30/20)(a) . . . . . . . . . . . . . . . . . . . . . . . . . . . . . . . . . . . . . . 1,176 981,960
Golden Entertainment Inc., 7.63%, 04/15/26(Call 04/15/22)(a)(b) . . . . . . . . . . . . . . . . . . . . . . . . . . . . . . . . . . . . 1,606 1,606,000
International Game Technology PLC5.25%, 01/15/29 (Call 01/15/24)(a) . . . . . . . . . . . . . . . . . . . . . 1,610 1,593,9006.25%, 02/15/22 (Call 08/15/21)(a) . . . . . . . . . . . . . . . . . . . . . 3,377 3,457,2216.25%, 01/15/27 (Call 07/15/26)(a) . . . . . . . . . . . . . . . . . . . . . 4,970 5,280,6256.50%, 02/15/25 (Call 08/15/24)(a)(b) . . . . . . . . . . . . . . . . . . . 4,914 5,257,980
Jacobs Entertainment Inc., 7.88%, 02/01/24(Call 11/30/20)(a)(b) . . . . . . . . . . . . . . . . . . . . . . . . . . . . . . . . . . . . 1,877 1,839,460
Lions Gate Capital Holdings LLC5.88%, 11/01/24 (Call 11/30/20)(a). . . . . . . . . . . . . . . . . . . . . . 2,384 2,240,9606.38%, 02/01/24 (Call 02/01/21)(a) . . . . . . . . . . . . . . . . . . . . . 2,526 2,424,960
Live Nation Entertainment Inc.4.75%, 10/15/27 (Call 10/15/22)(a) . . . . . . . . . . . . . . . . . . . . . 4,410 4,053,0554.88%, 11/01/24 (Call 11/05/20)(a). . . . . . . . . . . . . . . . . . . . . . 2,673 2,573,7785.63%, 03/15/26 (Call 03/15/21)(a) . . . . . . . . . . . . . . . . . . . . . 946 903,4306.50%, 05/15/27 (Call 05/15/23)(a)(b) . . . . . . . . . . . . . . . . . . . 5,186 5,549,020
Merlin Entertainments Ltd., 5.75%, 06/15/26(Call 03/17/26)(a) . . . . . . . . . . . . . . . . . . . . . . . . . . . . . . . . . . . . . . 1,870 1,720,400
Mohegan Gaming & Entertainment, 7.88%, 10/15/24(Call 11/16/20)(a)(f). . . . . . . . . . . . . . . . . . . . . . . . . . . . . . . . . . . . . 2,290 2,129,700
Motion Bondco DAC, 6.63%, 11/15/27 (Call 11/15/22)(a)(b) . 1,675 1,437,904Peninsula Pacific Entertainment LLC/Peninsula Pacific
Entertainment Finance Inc., 8.50%, 11/15/27(Call 11/15/23)(a) . . . . . . . . . . . . . . . . . . . . . . . . . . . . . . . . . . . . . . 1,435 1,492,587
Penn National Gaming Inc., 5.63%, 01/15/27(Call 01/15/22)(a) . . . . . . . . . . . . . . . . . . . . . . . . . . . . . . . . . . . . . . 2,007 2,052,559
Powdr Corp., 6.00%, 08/01/25 (Call 08/01/22)(a)(b). . . . . . . . . 1,575 1,588,073Scientific Games International Inc.
5.00%, 10/15/25 (Call 11/30/20)(a). . . . . . . . . . . . . . . . . . . . . . 5,410 5,430,2877.00%, 05/15/28 (Call 05/15/23)(a) . . . . . . . . . . . . . . . . . . . . . 3,121 3,100,1217.25%, 11/15/29 (Call 11/15/24)(a)(b). . . . . . . . . . . . . . . . . . . . 2,297 2,278,4408.25%, 03/15/26 (Call 03/15/22)(a)(b) . . . . . . . . . . . . . . . . . . . 4,931 5,001,9578.63%, 07/01/25 (Call 07/01/22)(a) . . . . . . . . . . . . . . . . . . . . . 2,180 2,266,502
SeaWorld Parks & Entertainment Inc., 9.50%, 08/01/25(Call 02/01/22)(a) . . . . . . . . . . . . . . . . . . . . . . . . . . . . . . . . . . . . . . 1,240 1,302,000
SecurityPar
(000) Value
Entertainment (continued)Six Flags Entertainment Corp.
4.88%, 07/31/24 (Call 11/30/20)(a)(b). . . . . . . . . . . . . . . . . . . . $ 4,467 $ 4,150,9155.50%, 04/15/27 (Call 04/15/22)(a)(b) . . . . . . . . . . . . . . . . . . . 2,268 2,109,920
Six Flags Theme Parks Inc., 7.00%, 07/01/25(Call 07/01/22)(a) . . . . . . . . . . . . . . . . . . . . . . . . . . . . . . . . . . . . . . 3,201 3,389,059
Speedway Motorsports LLC/Speedway Funding II Inc.,4.88%, 11/01/27 (Call 11/01/22)(a). . . . . . . . . . . . . . . . . . . . . . 1,555 1,477,250
Stars Group Holdings BV/Stars Group USCo-Borrower LLC, 7.00%, 07/15/26 (Call 07/15/21)(a) . . . 4,170 4,408,211
Twin River Worldwide Holdings Inc., 6.75%, 06/01/27(Call 06/01/22)(a)(b) . . . . . . . . . . . . . . . . . . . . . . . . . . . . . . . . . . . . 1,994 2,019,085
Vail Resorts Inc., 6.25%, 05/15/25 (Call 05/15/22)(a) . . . . . . . 2,230 2,341,500WMG Acquisition Corp.
3.00%, 02/15/31 (Call 02/15/26)(a) . . . . . . . . . . . . . . . . . . . . . 3,320 3,154,0003.88%, 07/15/30 (Call 07/15/25)(a) . . . . . . . . . . . . . . . . . . . . . 2,179 2,193,2835.50%, 04/15/26 (Call 04/15/21)(a)(b) . . . . . . . . . . . . . . . . . . . 880 913,000
Wynn Resorts Finance LLC/Wynn Resorts Capital Corp.5.13%, 10/01/29 (Call 07/01/29)(a) . . . . . . . . . . . . . . . . . . . . . 3,328 3,186,5607.75%, 04/15/25 (Call 04/15/22)(a) . . . . . . . . . . . . . . . . . . . . . 2,777 2,922,029
168,062,368Environmental Control — 0.6%Advanced Disposal Services Inc., 5.63%, 11/15/24
(Call 11/30/20)(a) . . . . . . . . . . . . . . . . . . . . . . . . . . . . . . . . . . . . . . 1,933 1,977,865Clean Harbors Inc.
4.88%, 07/15/27 (Call 07/15/22)(a)(b) . . . . . . . . . . . . . . . . . . . 2,647 2,766,1155.13%, 07/15/29 (Call 07/15/24)(a)(b) . . . . . . . . . . . . . . . . . . . 1,354 1,471,703
Covanta Holding Corp.5.00%, 09/01/30 (Call 09/01/25)(b) . . . . . . . . . . . . . . . . . . . . . 1,870 1,902,7255.88%, 07/01/25 (Call 11/30/20). . . . . . . . . . . . . . . . . . . . . . . . 1,557 1,609,8766.00%, 01/01/27 (Call 01/01/22)(b) . . . . . . . . . . . . . . . . . . . . . 2,215 2,306,790
GFL Environmental Inc.3.75%, 08/01/25 (Call 08/01/22)(a) . . . . . . . . . . . . . . . . . . . . . 2,933 2,933,0004.25%, 06/01/25 (Call 06/01/22)(a) . . . . . . . . . . . . . . . . . . . . . 1,892 1,929,8405.13%, 12/15/26 (Call 12/15/22)(a) . . . . . . . . . . . . . . . . . . . . . 2,597 2,727,3697.00%, 06/01/26 (Call 06/01/21)(a)(b) . . . . . . . . . . . . . . . . . . . 1,983 2,067,2778.50%, 05/01/27 (Call 05/01/22)(a)(b) . . . . . . . . . . . . . . . . . . . 1,631 1,777,790
Harsco Corp., 5.75%, 07/31/27 (Call 07/31/22)(a)(b) . . . . . . . . 2,320 2,372,200Stericycle Inc., 5.38%, 07/15/24 (Call 07/15/21)(a)(b) . . . . . . . 3,185 3,311,572Tervita Corp., 7.63%, 12/01/21 (Call 11/30/20)(a)(b). . . . . . . . . 2,459 2,360,640Waste Pro USA Inc., 5.50%, 02/15/26 (Call 02/15/21)(a). . . . 2,411 2,435,110
33,949,872Food — 3.6%Albertsons Companies Inc./Safeway Inc./New
Albertsons LP/Albertsons LLC3.25%, 03/15/26 (Call 09/15/22)(a) . . . . . . . . . . . . . . . . . . . . . 2,585 2,535,7563.50%, 02/15/23 (Call 12/15/22)(a)(b) . . . . . . . . . . . . . . . . . . . 3,233 3,284,4013.50%, 03/15/29 (Call 09/15/23)(a)(b) . . . . . . . . . . . . . . . . . . . 3,415 3,312,8924.63%, 01/15/27 (Call 01/15/23)(a) . . . . . . . . . . . . . . . . . . . . . 5,730 5,908,4614.88%, 02/15/30 (Call 02/15/25)(a) . . . . . . . . . . . . . . . . . . . . . 4,407 4,680,6755.75%, 03/15/25 (Call 11/30/20)(b). . . . . . . . . . . . . . . . . . . . . . 3,750 3,864,8445.88%, 02/15/28 (Call 08/15/22)(a) . . . . . . . . . . . . . . . . . . . . . 3,819 4,038,5927.50%, 03/15/26 (Call 03/15/22)(a)(b) . . . . . . . . . . . . . . . . . . . 2,467 2,733,436
B&G Foods Inc.5.25%, 04/01/25 (Call 11/30/20). . . . . . . . . . . . . . . . . . . . . . . . 3,998 4,117,9405.25%, 09/15/27 (Call 03/01/22)(b) . . . . . . . . . . . . . . . . . . . . . 2,555 2,644,425
Chobani LLC/Chobani Finance Corp. Inc.4.63%, 11/15/28 (Call 11/15/23)(a). . . . . . . . . . . . . . . . . . . . . . 400 401,3207.50%, 04/15/25 (Call 11/30/20)(a). . . . . . . . . . . . . . . . . . . . . . 2,429 2,492,810
Schedule of Investments (continued)
October 31, 2020
iShares� Broad USD High Yield Corporate Bond ETF(Percentages shown are based on Net Assets)
S C H E D U L E O F I N V E S T M E N T S 33

SecurityPar
(000) Value
Food (continued)Clearwater Seafoods Inc., 6.88%, 05/01/25
(Call 11/30/20)(a) . . . . . . . . . . . . . . . . . . . . . . . . . . . . . . . . . . . . . . $ 1,157 $ 1,201,556Del Monte Foods Inc., 11.88%, 05/15/25 (Call 05/15/22)(a) . 2,305 2,457,706Dole Food Co. Inc., 7.25%, 06/15/25 (Call 11/30/20)(a) . . . . . 1,263 1,263,000FAGE International SA/FAGE USA Dairy Industry Inc.,
5.63%, 08/15/26 (Call 08/15/21)(a) . . . . . . . . . . . . . . . . . . . . . 1,566 1,500,040Fresh Market Inc. (The), 9.75%, 05/01/23
(Call 11/30/20)(a) . . . . . . . . . . . . . . . . . . . . . . . . . . . . . . . . . . . . . . 1,018 974,104H-Food Holdings LLC/Hearthside Finance Co. Inc., 8.50%,
06/01/26 (Call 06/01/21)(a) . . . . . . . . . . . . . . . . . . . . . . . . . . . . . 1,510 1,506,225Ingles Markets Inc., 5.75%, 06/15/23 (Call 11/30/20). . . . . . . 923 929,923Kraft Heinz Foods Co.
3.00%, 06/01/26 (Call 03/01/26)(b) . . . . . . . . . . . . . . . . . . . . . 8,295 8,429,1643.75%, 04/01/30 (Call 01/01/30)(a)(b) . . . . . . . . . . . . . . . . . . . 4,475 4,701,8813.88%, 05/15/27 (Call 02/15/27)(a) . . . . . . . . . . . . . . . . . . . . . 5,601 5,925,0623.95%, 07/15/25 (Call 04/15/25)(b) . . . . . . . . . . . . . . . . . . . . . 6,568 7,102,4464.00%, 06/15/23 (Call 05/15/23) . . . . . . . . . . . . . . . . . . . . . . . 900 952,6424.25%, 03/01/31 (Call 12/01/30)(a) . . . . . . . . . . . . . . . . . . . . . 6,090 6,608,5714.38%, 06/01/46 (Call 12/01/45)(b) . . . . . . . . . . . . . . . . . . . . . 12,925 13,267,3814.63%, 01/30/29 (Call 10/30/28) . . . . . . . . . . . . . . . . . . . . . . . 4,925 5,494,7404.63%, 10/01/39 (Call 04/01/39)(a)(b) . . . . . . . . . . . . . . . . . . . 2,075 2,225,0504.88%, 10/01/49 (Call 04/01/49)(a) . . . . . . . . . . . . . . . . . . . . . 6,665 7,046,5195.00%, 07/15/35 (Call 01/15/35)(b) . . . . . . . . . . . . . . . . . . . . . 4,465 5,146,1065.00%, 06/04/42 . . . . . . . . . . . . . . . . . . . . . . . . . . . . . . . . . . . . . . 8,517 9,359,9145.20%, 07/15/45 (Call 01/15/45) . . . . . . . . . . . . . . . . . . . . . . . 8,655 9,588,2365.50%, 06/01/50 (Call 12/01/49)(a) . . . . . . . . . . . . . . . . . . . . . 3,425 3,904,9256.50%, 02/09/40 . . . . . . . . . . . . . . . . . . . . . . . . . . . . . . . . . . . . . . 3,443 4,372,5946.75%, 03/15/32 . . . . . . . . . . . . . . . . . . . . . . . . . . . . . . . . . . . . . . 1,925 2,533,5416.88%, 01/26/39 . . . . . . . . . . . . . . . . . . . . . . . . . . . . . . . . . . . . . . 3,675 4,916,3667.13%, 08/01/39(a)(b) . . . . . . . . . . . . . . . . . . . . . . . . . . . . . . . . . . 4,025 5,427,465
Lamb Weston Holdings Inc.4.63%, 11/01/24 (Call 11/01/21)(a). . . . . . . . . . . . . . . . . . . . . . 3,461 3,573,4824.88%, 11/01/26 (Call 11/01/21)(a). . . . . . . . . . . . . . . . . . . . . . 3,926 4,077,5834.88%, 05/15/28 (Call 11/15/27)(a)(b). . . . . . . . . . . . . . . . . . . . 2,380 2,578,718
Pilgrim's Pride Corp.5.75%, 03/15/25 (Call 11/30/20)(a). . . . . . . . . . . . . . . . . . . . . . 4,695 4,806,5065.88%, 09/30/27 (Call 09/30/22)(a)(b) . . . . . . . . . . . . . . . . . . . 3,693 3,901,211
Post Holdings Inc.4.63%, 04/15/30 (Call 04/15/25)(a) . . . . . . . . . . . . . . . . . . . . . 7,259 7,458,6225.00%, 08/15/26 (Call 08/15/21)(a)(b) . . . . . . . . . . . . . . . . . . . 7,346 7,617,8025.50%, 12/15/29 (Call 12/15/24)(a) . . . . . . . . . . . . . . . . . . . . . 3,238 3,501,0875.63%, 01/15/28 (Call 12/01/22)(a)(b) . . . . . . . . . . . . . . . . . . . 4,294 4,530,1705.75%, 03/01/27 (Call 03/01/22)(a)(b) . . . . . . . . . . . . . . . . . . . 5,642 5,911,180
Safeway Inc., 7.25%, 02/01/31(b) . . . . . . . . . . . . . . . . . . . . . . . . . 1,111 1,255,430SEG Holding LLC/SEG Finance Corp., 5.63%, 10/15/28
(Call 10/15/23)(a) . . . . . . . . . . . . . . . . . . . . . . . . . . . . . . . . . . . . . . 540 550,152Sigma Holdco BV, 7.88%, 05/15/26 (Call 05/15/21)(a)(b) . . . . 2,517 2,479,245Simmons Foods Inc.
5.75%, 11/01/24 (Call 11/30/20)(a)(b). . . . . . . . . . . . . . . . . . . . 2,497 2,468,9097.75%, 01/15/24 (Call 01/15/21)(a) . . . . . . . . . . . . . . . . . . . . . 1,031 1,074,818
TreeHouse Foods Inc.4.00%, 09/01/28 (Call 09/01/23) . . . . . . . . . . . . . . . . . . . . . . . 2,116 2,118,6456.00%, 02/15/24 (Call 11/30/20)(a)(b). . . . . . . . . . . . . . . . . . . . 2,332 2,375,725
U.S. Foods Inc.5.88%, 06/15/24 (Call 11/30/20)(a). . . . . . . . . . . . . . . . . . . . . . 2,269 2,260,4916.25%, 04/15/25 (Call 04/15/22)(a) . . . . . . . . . . . . . . . . . . . . . 4,515 4,718,175
United Natural Foods Inc., 6.75%, 10/15/28(Call 10/15/23)(a)(b) . . . . . . . . . . . . . . . . . . . . . . . . . . . . . . . . . . . . 1,740 1,761,750
225,870,410
SecurityPar
(000) Value
Food Service — 0.3%Aramark Services Inc.
4.75%, 06/01/26 (Call 06/01/21) . . . . . . . . . . . . . . . . . . . . . . . $ 2,376 $ 2,361,1505.00%, 04/01/25 (Call 11/30/20)(a)(b). . . . . . . . . . . . . . . . . . . . 2,421 2,457,4845.00%, 02/01/28 (Call 02/01/23)(a)(b) . . . . . . . . . . . . . . . . . . . 5,043 5,087,6816.38%, 05/01/25 (Call 05/01/22)(a)(b) . . . . . . . . . . . . . . . . . . . 6,552 6,872,262
16,778,577Forest Products & Paper — 0.2%Clearwater Paper Corp.
4.75%, 08/15/28 (Call 08/15/23)(a)(b) . . . . . . . . . . . . . . . . . . . 1,200 1,206,0005.38%, 02/01/25(a)(b) . . . . . . . . . . . . . . . . . . . . . . . . . . . . . . . . . . 930 977,663
Mercer International Inc.5.50%, 01/15/26 (Call 01/15/21) . . . . . . . . . . . . . . . . . . . . . . . 1,401 1,327,4486.50%, 02/01/24 (Call 11/30/20)(b). . . . . . . . . . . . . . . . . . . . . . 667 670,3357.38%, 01/15/25 (Call 01/15/21)(b) . . . . . . . . . . . . . . . . . . . . . 2,557 2,600,162
Resolute Forest Products Inc., 5.88%, 05/15/23(Call 11/30/20)(b) . . . . . . . . . . . . . . . . . . . . . . . . . . . . . . . . . . . . . . 1,717 1,695,537
Schweitzer-Mauduit International Inc., 6.88%, 10/01/26(Call 10/01/21)(a) . . . . . . . . . . . . . . . . . . . . . . . . . . . . . . . . . . . . . . 1,560 1,645,800
Smurfit Kappa Treasury Funding DAC, 7.50%, 11/20/25(b) . 1,242 1,502,820
11,625,765Gas — 0.2%AmeriGas Partners LP/AmeriGas Finance Corp.
5.50%, 05/20/25 (Call 02/20/25) . . . . . . . . . . . . . . . . . . . . . . . 3,392 3,629,4405.63%, 05/20/24 (Call 03/20/24) . . . . . . . . . . . . . . . . . . . . . . . 3,045 3,235,3125.75%, 05/20/27 (Call 02/20/27) . . . . . . . . . . . . . . . . . . . . . . . 2,076 2,274,8195.88%, 08/20/26 (Call 05/20/26) . . . . . . . . . . . . . . . . . . . . . . . 3,043 3,333,211
Rockpoint Gas Storage Canada Ltd., 7.00%, 03/31/23(Call 11/30/20)(a) . . . . . . . . . . . . . . . . . . . . . . . . . . . . . . . . . . . . . . 1,775 1,646,312
14,119,094Hand & Machine Tools — 0.1%Apex Tool Group LLC/BC Mountain Finance Inc., 9.00%,
02/15/23 (Call 11/30/20)(a)(b) . . . . . . . . . . . . . . . . . . . . . . . . . . . 1,433 1,323,734Colfax Corp.
6.00%, 02/15/24 (Call 02/15/21)(a) . . . . . . . . . . . . . . . . . . . . . 2,433 2,530,8316.38%, 02/15/26 (Call 02/15/22)(a) . . . . . . . . . . . . . . . . . . . . . 1,553 1,634,532
Werner FinCo LP/Werner FinCo Inc., 8.75%, 07/15/25(Call 11/30/20)(a)(b) . . . . . . . . . . . . . . . . . . . . . . . . . . . . . . . . . . . . 1,234 1,153,790
6,642,887Health Care - Products — 0.6%Avantor Funding Inc., 4.63%, 07/15/28 (Call 07/15/23)(a)(b). 7,000 7,253,400Avantor Inc., 6.00%, 10/01/24 (Call 11/06/20)(a) . . . . . . . . . . . 5,964 6,231,783Hill-Rom Holdings Inc.
4.38%, 09/15/27 (Call 09/15/22)(a)(b) . . . . . . . . . . . . . . . . . . . 1,845 1,907,2695.00%, 02/15/25 (Call 11/30/20)(a)(b). . . . . . . . . . . . . . . . . . . . 1,121 1,147,624
Hologic Inc.3.25%, 02/15/29 (Call 09/28/23)(a) . . . . . . . . . . . . . . . . . . . . . 4,120 4,140,6004.63%, 02/01/28 (Call 02/01/23)(a)(b) . . . . . . . . . . . . . . . . . . . 1,662 1,736,790
Ortho-Clinical Diagnostics Inc./Ortho-ClinicalDiagnostics SA7.25%, 02/01/28 (Call 02/01/23)(a)(b) . . . . . . . . . . . . . . . . . . . 3,224 3,369,0807.38%, 06/01/25 (Call 06/01/22)(a) . . . . . . . . . . . . . . . . . . . . . 1,440 1,519,200
Teleflex Inc.4.25%, 06/01/28 (Call 06/01/23)(a) . . . . . . . . . . . . . . . . . . . . . 2,225 2,325,1254.63%, 11/15/27 (Call 11/15/22)(b). . . . . . . . . . . . . . . . . . . . . . 2,370 2,499,2244.88%, 06/01/26 (Call 06/01/21) . . . . . . . . . . . . . . . . . . . . . . . 1,518 1,578,720
Varex Imaging Corp., 7.88%, 10/15/27 (Call 10/15/23)(a) . . . 1,300 1,322,750
35,031,565
Schedule of Investments (continued)
October 31, 2020
iShares� Broad USD High Yield Corporate Bond ETF(Percentages shown are based on Net Assets)
34 2 0 2 0 I S H A R E S A N N U A L R E P O R T T O S H A R E H O L D E R S
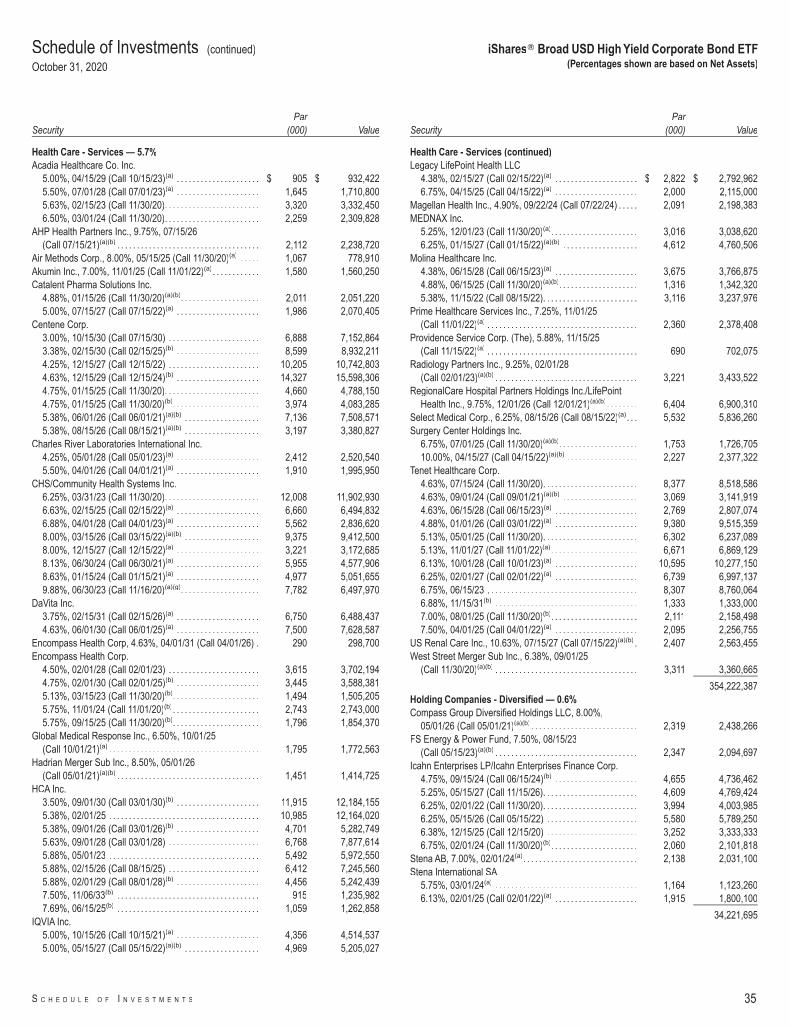
SecurityPar
(000) Value
Health Care - Services — 5.7%Acadia Healthcare Co. Inc.
5.00%, 04/15/29 (Call 10/15/23)(a) . . . . . . . . . . . . . . . . . . . . . $ 905 $ 932,4225.50%, 07/01/28 (Call 07/01/23)(a) . . . . . . . . . . . . . . . . . . . . . 1,645 1,710,8005.63%, 02/15/23 (Call 11/30/20). . . . . . . . . . . . . . . . . . . . . . . . 3,320 3,332,4506.50%, 03/01/24 (Call 11/30/20). . . . . . . . . . . . . . . . . . . . . . . . 2,259 2,309,828
AHP Health Partners Inc., 9.75%, 07/15/26(Call 07/15/21)(a)(b) . . . . . . . . . . . . . . . . . . . . . . . . . . . . . . . . . . . . 2,112 2,238,720
Air Methods Corp., 8.00%, 05/15/25 (Call 11/30/20)(a) . . . . . 1,067 778,910Akumin Inc., 7.00%, 11/01/25 (Call 11/01/22)(a) . . . . . . . . . . . . 1,580 1,560,250Catalent Pharma Solutions Inc.
4.88%, 01/15/26 (Call 11/30/20)(a)(b). . . . . . . . . . . . . . . . . . . . 2,011 2,051,2205.00%, 07/15/27 (Call 07/15/22)(a) . . . . . . . . . . . . . . . . . . . . . 1,986 2,070,405
Centene Corp.3.00%, 10/15/30 (Call 07/15/30) . . . . . . . . . . . . . . . . . . . . . . . 6,888 7,152,8643.38%, 02/15/30 (Call 02/15/25)(b) . . . . . . . . . . . . . . . . . . . . . 8,599 8,932,2114.25%, 12/15/27 (Call 12/15/22) . . . . . . . . . . . . . . . . . . . . . . . 10,205 10,742,8034.63%, 12/15/29 (Call 12/15/24)(b) . . . . . . . . . . . . . . . . . . . . . 14,327 15,598,3064.75%, 01/15/25 (Call 11/30/20). . . . . . . . . . . . . . . . . . . . . . . . 4,660 4,788,1504.75%, 01/15/25 (Call 11/30/20)(b). . . . . . . . . . . . . . . . . . . . . . 3,974 4,083,2855.38%, 06/01/26 (Call 06/01/21)(a)(b) . . . . . . . . . . . . . . . . . . . 7,136 7,508,5715.38%, 08/15/26 (Call 08/15/21)(a)(b) . . . . . . . . . . . . . . . . . . . 3,197 3,380,827
Charles River Laboratories International Inc.4.25%, 05/01/28 (Call 05/01/23)(a) . . . . . . . . . . . . . . . . . . . . . 2,412 2,520,5405.50%, 04/01/26 (Call 04/01/21)(a) . . . . . . . . . . . . . . . . . . . . . 1,910 1,995,950
CHS/Community Health Systems Inc.6.25%, 03/31/23 (Call 11/30/20). . . . . . . . . . . . . . . . . . . . . . . . 12,008 11,902,9306.63%, 02/15/25 (Call 02/15/22)(a) . . . . . . . . . . . . . . . . . . . . . 6,660 6,494,8326.88%, 04/01/28 (Call 04/01/23)(a) . . . . . . . . . . . . . . . . . . . . . 5,562 2,836,6208.00%, 03/15/26 (Call 03/15/22)(a)(b) . . . . . . . . . . . . . . . . . . . 9,375 9,412,5008.00%, 12/15/27 (Call 12/15/22)(a) . . . . . . . . . . . . . . . . . . . . . 3,221 3,172,6858.13%, 06/30/24 (Call 06/30/21)(a) . . . . . . . . . . . . . . . . . . . . . 5,955 4,577,9068.63%, 01/15/24 (Call 01/15/21)(a) . . . . . . . . . . . . . . . . . . . . . 4,977 5,051,6559.88%, 06/30/23 (Call 11/16/20)(a)(g). . . . . . . . . . . . . . . . . . . . 7,782 6,497,970
DaVita Inc.3.75%, 02/15/31 (Call 02/15/26)(a) . . . . . . . . . . . . . . . . . . . . . 6,750 6,488,4374.63%, 06/01/30 (Call 06/01/25)(a) . . . . . . . . . . . . . . . . . . . . . 7,500 7,628,587
Encompass Health Corp, 4.63%, 04/01/31 (Call 04/01/26) . 290 298,700Encompass Health Corp.
4.50%, 02/01/28 (Call 02/01/23) . . . . . . . . . . . . . . . . . . . . . . . 3,615 3,702,1944.75%, 02/01/30 (Call 02/01/25)(b) . . . . . . . . . . . . . . . . . . . . . 3,445 3,588,3815.13%, 03/15/23 (Call 11/30/20)(b). . . . . . . . . . . . . . . . . . . . . . 1,494 1,505,2055.75%, 11/01/24 (Call 11/01/20)(b). . . . . . . . . . . . . . . . . . . . . . 2,743 2,743,0005.75%, 09/15/25 (Call 11/30/20)(b). . . . . . . . . . . . . . . . . . . . . . 1,796 1,854,370
Global Medical Response Inc., 6.50%, 10/01/25(Call 10/01/21)(a) . . . . . . . . . . . . . . . . . . . . . . . . . . . . . . . . . . . . . . 1,795 1,772,563
Hadrian Merger Sub Inc., 8.50%, 05/01/26(Call 05/01/21)(a)(b) . . . . . . . . . . . . . . . . . . . . . . . . . . . . . . . . . . . . 1,451 1,414,725
HCA Inc.3.50%, 09/01/30 (Call 03/01/30)(b) . . . . . . . . . . . . . . . . . . . . . 11,915 12,184,1555.38%, 02/01/25 . . . . . . . . . . . . . . . . . . . . . . . . . . . . . . . . . . . . . . 10,985 12,164,0205.38%, 09/01/26 (Call 03/01/26)(b) . . . . . . . . . . . . . . . . . . . . . 4,701 5,282,7495.63%, 09/01/28 (Call 03/01/28) . . . . . . . . . . . . . . . . . . . . . . . 6,768 7,877,6145.88%, 05/01/23 . . . . . . . . . . . . . . . . . . . . . . . . . . . . . . . . . . . . . . 5,492 5,972,5505.88%, 02/15/26 (Call 08/15/25) . . . . . . . . . . . . . . . . . . . . . . . 6,412 7,245,5605.88%, 02/01/29 (Call 08/01/28)(b) . . . . . . . . . . . . . . . . . . . . . 4,456 5,242,4397.50%, 11/06/33(b) . . . . . . . . . . . . . . . . . . . . . . . . . . . . . . . . . . . . 915 1,235,9827.69%, 06/15/25(b) . . . . . . . . . . . . . . . . . . . . . . . . . . . . . . . . . . . . 1,059 1,262,858
IQVIA Inc.5.00%, 10/15/26 (Call 10/15/21)(a) . . . . . . . . . . . . . . . . . . . . . 4,356 4,514,5375.00%, 05/15/27 (Call 05/15/22)(a)(b) . . . . . . . . . . . . . . . . . . . 4,969 5,205,027
SecurityPar
(000) Value
Health Care - Services (continued)Legacy LifePoint Health LLC
4.38%, 02/15/27 (Call 02/15/22)(a) . . . . . . . . . . . . . . . . . . . . . $ 2,822 $ 2,792,9626.75%, 04/15/25 (Call 04/15/22)(a) . . . . . . . . . . . . . . . . . . . . . 2,000 2,115,000
Magellan Health Inc., 4.90%, 09/22/24 (Call 07/22/24) . . . . . 2,091 2,198,383MEDNAX Inc.
5.25%, 12/01/23 (Call 11/30/20)(a). . . . . . . . . . . . . . . . . . . . . . 3,016 3,038,6206.25%, 01/15/27 (Call 01/15/22)(a)(b) . . . . . . . . . . . . . . . . . . . 4,612 4,760,506
Molina Healthcare Inc.4.38%, 06/15/28 (Call 06/15/23)(a) . . . . . . . . . . . . . . . . . . . . . 3,675 3,766,8754.88%, 06/15/25 (Call 11/30/20)(a)(b). . . . . . . . . . . . . . . . . . . . 1,316 1,342,3205.38%, 11/15/22 (Call 08/15/22). . . . . . . . . . . . . . . . . . . . . . . . 3,116 3,237,976
Prime Healthcare Services Inc., 7.25%, 11/01/25(Call 11/01/22)(a) . . . . . . . . . . . . . . . . . . . . . . . . . . . . . . . . . . . . . . 2,360 2,378,408
Providence Service Corp. (The), 5.88%, 11/15/25(Call 11/15/22)(a) . . . . . . . . . . . . . . . . . . . . . . . . . . . . . . . . . . . . . . 690 702,075
Radiology Partners Inc., 9.25%, 02/01/28(Call 02/01/23)(a)(b) . . . . . . . . . . . . . . . . . . . . . . . . . . . . . . . . . . . . 3,221 3,433,522
RegionalCare Hospital Partners Holdings Inc./LifePointHealth Inc., 9.75%, 12/01/26 (Call 12/01/21)(a)(b). . . . . . . . 6,404 6,900,310
Select Medical Corp., 6.25%, 08/15/26 (Call 08/15/22)(a). . . 5,532 5,836,260Surgery Center Holdings Inc.
6.75%, 07/01/25 (Call 11/30/20)(a)(b). . . . . . . . . . . . . . . . . . . . 1,753 1,726,70510.00%, 04/15/27 (Call 04/15/22)(a)(b) . . . . . . . . . . . . . . . . . . 2,227 2,377,322
Tenet Healthcare Corp.4.63%, 07/15/24 (Call 11/30/20). . . . . . . . . . . . . . . . . . . . . . . . 8,377 8,518,5864.63%, 09/01/24 (Call 09/01/21)(a)(b) . . . . . . . . . . . . . . . . . . . 3,069 3,141,9194.63%, 06/15/28 (Call 06/15/23)(a) . . . . . . . . . . . . . . . . . . . . . 2,769 2,807,0744.88%, 01/01/26 (Call 03/01/22)(a) . . . . . . . . . . . . . . . . . . . . . 9,380 9,515,3595.13%, 05/01/25 (Call 11/30/20). . . . . . . . . . . . . . . . . . . . . . . . 6,302 6,237,0895.13%, 11/01/27 (Call 11/01/22)(a). . . . . . . . . . . . . . . . . . . . . . 6,671 6,869,1296.13%, 10/01/28 (Call 10/01/23)(a) . . . . . . . . . . . . . . . . . . . . . 10,595 10,277,1506.25%, 02/01/27 (Call 02/01/22)(a) . . . . . . . . . . . . . . . . . . . . . 6,739 6,997,1376.75%, 06/15/23 . . . . . . . . . . . . . . . . . . . . . . . . . . . . . . . . . . . . . . 8,307 8,760,0646.88%, 11/15/31(b) . . . . . . . . . . . . . . . . . . . . . . . . . . . . . . . . . . . . 1,333 1,333,0007.00%, 08/01/25 (Call 11/30/20)(b). . . . . . . . . . . . . . . . . . . . . . 2,111 2,158,4987.50%, 04/01/25 (Call 04/01/22)(a) . . . . . . . . . . . . . . . . . . . . . 2,095 2,256,755
US Renal Care Inc., 10.63%, 07/15/27 (Call 07/15/22)(a)(b) . 2,407 2,563,455West Street Merger Sub Inc., 6.38%, 09/01/25
(Call 11/30/20)(a)(b) . . . . . . . . . . . . . . . . . . . . . . . . . . . . . . . . . . . . 3,311 3,360,665
354,222,387Holding Companies - Diversified — 0.6%Compass Group Diversified Holdings LLC, 8.00%,
05/01/26 (Call 05/01/21)(a)(b) . . . . . . . . . . . . . . . . . . . . . . . . . . . 2,319 2,438,266FS Energy & Power Fund, 7.50%, 08/15/23
(Call 05/15/23)(a)(b) . . . . . . . . . . . . . . . . . . . . . . . . . . . . . . . . . . . . 2,347 2,094,697Icahn Enterprises LP/Icahn Enterprises Finance Corp.
4.75%, 09/15/24 (Call 06/15/24)(b) . . . . . . . . . . . . . . . . . . . . . 4,655 4,736,4625.25%, 05/15/27 (Call 11/15/26). . . . . . . . . . . . . . . . . . . . . . . . 4,609 4,769,4246.25%, 02/01/22 (Call 11/30/20). . . . . . . . . . . . . . . . . . . . . . . . 3,994 4,003,9856.25%, 05/15/26 (Call 05/15/22) . . . . . . . . . . . . . . . . . . . . . . . 5,580 5,789,2506.38%, 12/15/25 (Call 12/15/20) . . . . . . . . . . . . . . . . . . . . . . . 3,252 3,333,3336.75%, 02/01/24 (Call 11/30/20)(b). . . . . . . . . . . . . . . . . . . . . . 2,060 2,101,818
Stena AB, 7.00%, 02/01/24(a). . . . . . . . . . . . . . . . . . . . . . . . . . . . . 2,138 2,031,100Stena International SA
5.75%, 03/01/24(a) . . . . . . . . . . . . . . . . . . . . . . . . . . . . . . . . . . . . 1,164 1,123,2606.13%, 02/01/25 (Call 02/01/22)(a) . . . . . . . . . . . . . . . . . . . . . 1,915 1,800,100
34,221,695
Schedule of Investments (continued)
October 31, 2020
iShares� Broad USD High Yield Corporate Bond ETF(Percentages shown are based on Net Assets)
S C H E D U L E O F I N V E S T M E N T S 35
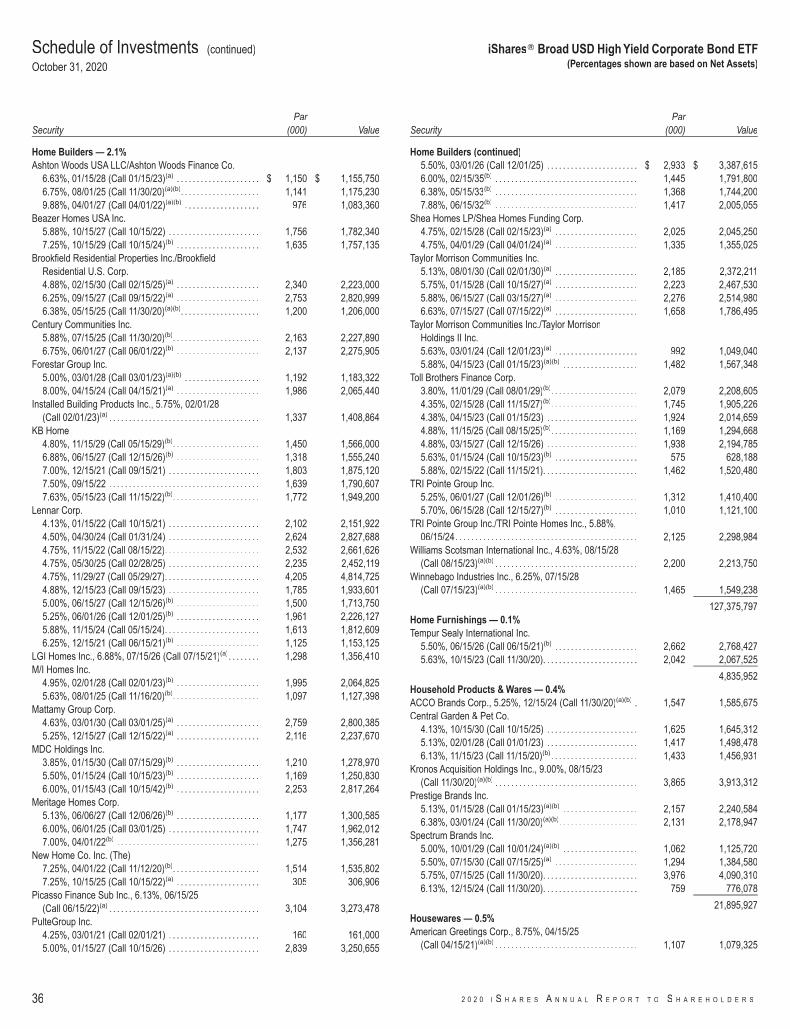
SecurityPar
(000) Value
Home Builders — 2.1%Ashton Woods USA LLC/Ashton Woods Finance Co.
6.63%, 01/15/28 (Call 01/15/23)(a) . . . . . . . . . . . . . . . . . . . . . $ 1,150 $ 1,155,7506.75%, 08/01/25 (Call 11/30/20)(a)(b). . . . . . . . . . . . . . . . . . . . 1,141 1,175,2309.88%, 04/01/27 (Call 04/01/22)(a)(b) . . . . . . . . . . . . . . . . . . . 976 1,083,360
Beazer Homes USA Inc.5.88%, 10/15/27 (Call 10/15/22) . . . . . . . . . . . . . . . . . . . . . . . 1,756 1,782,3407.25%, 10/15/29 (Call 10/15/24)(b) . . . . . . . . . . . . . . . . . . . . . 1,635 1,757,135
Brookfield Residential Properties Inc./BrookfieldResidential U.S. Corp.4.88%, 02/15/30 (Call 02/15/25)(a) . . . . . . . . . . . . . . . . . . . . . 2,340 2,223,0006.25%, 09/15/27 (Call 09/15/22)(a) . . . . . . . . . . . . . . . . . . . . . 2,753 2,820,9996.38%, 05/15/25 (Call 11/30/20)(a)(b). . . . . . . . . . . . . . . . . . . . 1,200 1,206,000
Century Communities Inc.5.88%, 07/15/25 (Call 11/30/20)(b). . . . . . . . . . . . . . . . . . . . . . 2,163 2,227,8906.75%, 06/01/27 (Call 06/01/22)(b) . . . . . . . . . . . . . . . . . . . . . 2,137 2,275,905
Forestar Group Inc.5.00%, 03/01/28 (Call 03/01/23)(a)(b) . . . . . . . . . . . . . . . . . . . 1,192 1,183,3228.00%, 04/15/24 (Call 04/15/21)(a) . . . . . . . . . . . . . . . . . . . . . 1,986 2,065,440
Installed Building Products Inc., 5.75%, 02/01/28(Call 02/01/23)(a) . . . . . . . . . . . . . . . . . . . . . . . . . . . . . . . . . . . . . . 1,337 1,408,864
KB Home4.80%, 11/15/29 (Call 05/15/29)(b). . . . . . . . . . . . . . . . . . . . . . 1,450 1,566,0006.88%, 06/15/27 (Call 12/15/26)(b) . . . . . . . . . . . . . . . . . . . . . 1,318 1,555,2407.00%, 12/15/21 (Call 09/15/21) . . . . . . . . . . . . . . . . . . . . . . . 1,803 1,875,1207.50%, 09/15/22 . . . . . . . . . . . . . . . . . . . . . . . . . . . . . . . . . . . . . . 1,639 1,790,6077.63%, 05/15/23 (Call 11/15/22)(b). . . . . . . . . . . . . . . . . . . . . . 1,772 1,949,200
Lennar Corp.4.13%, 01/15/22 (Call 10/15/21) . . . . . . . . . . . . . . . . . . . . . . . 2,102 2,151,9224.50%, 04/30/24 (Call 01/31/24) . . . . . . . . . . . . . . . . . . . . . . . 2,624 2,827,6884.75%, 11/15/22 (Call 08/15/22). . . . . . . . . . . . . . . . . . . . . . . . 2,532 2,661,6264.75%, 05/30/25 (Call 02/28/25) . . . . . . . . . . . . . . . . . . . . . . . 2,235 2,452,1194.75%, 11/29/27 (Call 05/29/27). . . . . . . . . . . . . . . . . . . . . . . . 4,205 4,814,7254.88%, 12/15/23 (Call 09/15/23) . . . . . . . . . . . . . . . . . . . . . . . 1,785 1,933,6015.00%, 06/15/27 (Call 12/15/26)(b) . . . . . . . . . . . . . . . . . . . . . 1,500 1,713,7505.25%, 06/01/26 (Call 12/01/25)(b) . . . . . . . . . . . . . . . . . . . . . 1,961 2,226,1275.88%, 11/15/24 (Call 05/15/24). . . . . . . . . . . . . . . . . . . . . . . . 1,613 1,812,6096.25%, 12/15/21 (Call 06/15/21)(b) . . . . . . . . . . . . . . . . . . . . . 1,125 1,153,125
LGI Homes Inc., 6.88%, 07/15/26 (Call 07/15/21)(a). . . . . . . . 1,298 1,356,410M/I Homes Inc.
4.95%, 02/01/28 (Call 02/01/23)(b) . . . . . . . . . . . . . . . . . . . . . 1,995 2,064,8255.63%, 08/01/25 (Call 11/16/20)(b). . . . . . . . . . . . . . . . . . . . . . 1,097 1,127,398
Mattamy Group Corp.4.63%, 03/01/30 (Call 03/01/25)(a) . . . . . . . . . . . . . . . . . . . . . 2,759 2,800,3855.25%, 12/15/27 (Call 12/15/22)(a) . . . . . . . . . . . . . . . . . . . . . 2,116 2,237,670
MDC Holdings Inc.3.85%, 01/15/30 (Call 07/15/29)(b) . . . . . . . . . . . . . . . . . . . . . 1,210 1,278,9705.50%, 01/15/24 (Call 10/15/23)(b) . . . . . . . . . . . . . . . . . . . . . 1,169 1,250,8306.00%, 01/15/43 (Call 10/15/42)(b) . . . . . . . . . . . . . . . . . . . . . 2,253 2,817,264
Meritage Homes Corp.5.13%, 06/06/27 (Call 12/06/26)(b) . . . . . . . . . . . . . . . . . . . . . 1,177 1,300,5856.00%, 06/01/25 (Call 03/01/25) . . . . . . . . . . . . . . . . . . . . . . . 1,747 1,962,0127.00%, 04/01/22(b) . . . . . . . . . . . . . . . . . . . . . . . . . . . . . . . . . . . . 1,275 1,356,281
New Home Co. Inc. (The)7.25%, 04/01/22 (Call 11/12/20)(b). . . . . . . . . . . . . . . . . . . . . . 1,514 1,535,8027.25%, 10/15/25 (Call 10/15/22)(a) . . . . . . . . . . . . . . . . . . . . . 305 306,906
Picasso Finance Sub Inc., 6.13%, 06/15/25(Call 06/15/22)(a) . . . . . . . . . . . . . . . . . . . . . . . . . . . . . . . . . . . . . . 3,104 3,273,478
PulteGroup Inc.4.25%, 03/01/21 (Call 02/01/21) . . . . . . . . . . . . . . . . . . . . . . . 160 161,0005.00%, 01/15/27 (Call 10/15/26) . . . . . . . . . . . . . . . . . . . . . . . 2,839 3,250,655
SecurityPar
(000) Value
Home Builders (continued)5.50%, 03/01/26 (Call 12/01/25) . . . . . . . . . . . . . . . . . . . . . . . $ 2,933 $ 3,387,6156.00%, 02/15/35(b) . . . . . . . . . . . . . . . . . . . . . . . . . . . . . . . . . . . . 1,445 1,791,8006.38%, 05/15/33(b) . . . . . . . . . . . . . . . . . . . . . . . . . . . . . . . . . . . . 1,368 1,744,2007.88%, 06/15/32(b) . . . . . . . . . . . . . . . . . . . . . . . . . . . . . . . . . . . . 1,417 2,005,055
Shea Homes LP/Shea Homes Funding Corp.4.75%, 02/15/28 (Call 02/15/23)(a) . . . . . . . . . . . . . . . . . . . . . 2,025 2,045,2504.75%, 04/01/29 (Call 04/01/24)(a) . . . . . . . . . . . . . . . . . . . . . 1,335 1,355,025
Taylor Morrison Communities Inc.5.13%, 08/01/30 (Call 02/01/30)(a) . . . . . . . . . . . . . . . . . . . . . 2,185 2,372,2115.75%, 01/15/28 (Call 10/15/27)(a) . . . . . . . . . . . . . . . . . . . . . 2,223 2,467,5305.88%, 06/15/27 (Call 03/15/27)(a) . . . . . . . . . . . . . . . . . . . . . 2,276 2,514,9806.63%, 07/15/27 (Call 07/15/22)(a) . . . . . . . . . . . . . . . . . . . . . 1,658 1,786,495
Taylor Morrison Communities Inc./Taylor MorrisonHoldings II Inc.5.63%, 03/01/24 (Call 12/01/23)(a) . . . . . . . . . . . . . . . . . . . . . 992 1,049,0405.88%, 04/15/23 (Call 01/15/23)(a)(b) . . . . . . . . . . . . . . . . . . . 1,482 1,567,348
Toll Brothers Finance Corp.3.80%, 11/01/29 (Call 08/01/29)(b). . . . . . . . . . . . . . . . . . . . . . 2,079 2,208,6054.35%, 02/15/28 (Call 11/15/27)(b). . . . . . . . . . . . . . . . . . . . . . 1,745 1,905,2264.38%, 04/15/23 (Call 01/15/23) . . . . . . . . . . . . . . . . . . . . . . . 1,924 2,014,6594.88%, 11/15/25 (Call 08/15/25)(b). . . . . . . . . . . . . . . . . . . . . . 1,169 1,294,6684.88%, 03/15/27 (Call 12/15/26) . . . . . . . . . . . . . . . . . . . . . . . 1,938 2,194,7855.63%, 01/15/24 (Call 10/15/23)(b) . . . . . . . . . . . . . . . . . . . . . 575 628,1885.88%, 02/15/22 (Call 11/15/21). . . . . . . . . . . . . . . . . . . . . . . . 1,462 1,520,480
TRI Pointe Group Inc.5.25%, 06/01/27 (Call 12/01/26)(b) . . . . . . . . . . . . . . . . . . . . . 1,312 1,410,4005.70%, 06/15/28 (Call 12/15/27)(b) . . . . . . . . . . . . . . . . . . . . . 1,010 1,121,100
TRI Pointe Group Inc./TRI Pointe Homes Inc., 5.88%,06/15/24. . . . . . . . . . . . . . . . . . . . . . . . . . . . . . . . . . . . . . . . . . . . . . 2,125 2,298,984
Williams Scotsman International Inc., 4.63%, 08/15/28(Call 08/15/23)(a)(b) . . . . . . . . . . . . . . . . . . . . . . . . . . . . . . . . . . . . 2,200 2,213,750
Winnebago Industries Inc., 6.25%, 07/15/28(Call 07/15/23)(a)(b) . . . . . . . . . . . . . . . . . . . . . . . . . . . . . . . . . . . . 1,465 1,549,238
127,375,797Home Furnishings — 0.1%Tempur Sealy International Inc.
5.50%, 06/15/26 (Call 06/15/21)(b) . . . . . . . . . . . . . . . . . . . . . 2,662 2,768,4275.63%, 10/15/23 (Call 11/30/20). . . . . . . . . . . . . . . . . . . . . . . . 2,042 2,067,525
4,835,952Household Products & Wares — 0.4%ACCO Brands Corp., 5.25%, 12/15/24 (Call 11/30/20)(a)(b) . 1,547 1,585,675Central Garden & Pet Co.
4.13%, 10/15/30 (Call 10/15/25) . . . . . . . . . . . . . . . . . . . . . . . 1,625 1,645,3125.13%, 02/01/28 (Call 01/01/23) . . . . . . . . . . . . . . . . . . . . . . . 1,417 1,498,4786.13%, 11/15/23 (Call 11/15/20)(b). . . . . . . . . . . . . . . . . . . . . . 1,433 1,456,931
Kronos Acquisition Holdings Inc., 9.00%, 08/15/23(Call 11/30/20)(a)(b) . . . . . . . . . . . . . . . . . . . . . . . . . . . . . . . . . . . . 3,865 3,913,312
Prestige Brands Inc.5.13%, 01/15/28 (Call 01/15/23)(a)(b) . . . . . . . . . . . . . . . . . . . 2,157 2,240,5846.38%, 03/01/24 (Call 11/30/20)(a)(b). . . . . . . . . . . . . . . . . . . . 2,131 2,178,947
Spectrum Brands Inc.5.00%, 10/01/29 (Call 10/01/24)(a)(b) . . . . . . . . . . . . . . . . . . . 1,062 1,125,7205.50%, 07/15/30 (Call 07/15/25)(a) . . . . . . . . . . . . . . . . . . . . . 1,294 1,384,5805.75%, 07/15/25 (Call 11/30/20). . . . . . . . . . . . . . . . . . . . . . . . 3,976 4,090,3106.13%, 12/15/24 (Call 11/30/20). . . . . . . . . . . . . . . . . . . . . . . . 759 776,078
21,895,927Housewares — 0.5%American Greetings Corp., 8.75%, 04/15/25
(Call 04/15/21)(a)(b) . . . . . . . . . . . . . . . . . . . . . . . . . . . . . . . . . . . . 1,107 1,079,325
Schedule of Investments (continued)
October 31, 2020
iShares� Broad USD High Yield Corporate Bond ETF(Percentages shown are based on Net Assets)
36 2 0 2 0 I S H A R E S A N N U A L R E P O R T T O S H A R E H O L D E R S
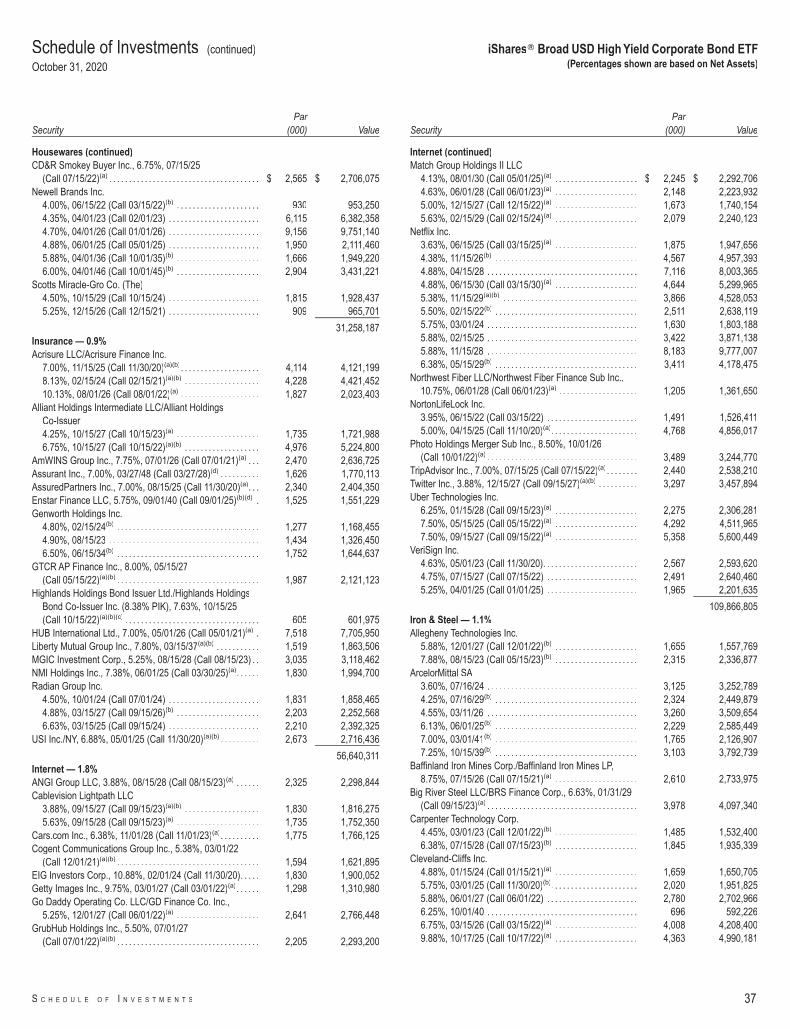
SecurityPar
(000) Value
Housewares (continued)CD&R Smokey Buyer Inc., 6.75%, 07/15/25
(Call 07/15/22)(a) . . . . . . . . . . . . . . . . . . . . . . . . . . . . . . . . . . . . . . $ 2,565 $ 2,706,075Newell Brands Inc.
4.00%, 06/15/22 (Call 03/15/22)(b) . . . . . . . . . . . . . . . . . . . . . 930 953,2504.35%, 04/01/23 (Call 02/01/23) . . . . . . . . . . . . . . . . . . . . . . . 6,115 6,382,3584.70%, 04/01/26 (Call 01/01/26) . . . . . . . . . . . . . . . . . . . . . . . 9,156 9,751,1404.88%, 06/01/25 (Call 05/01/25) . . . . . . . . . . . . . . . . . . . . . . . 1,950 2,111,4605.88%, 04/01/36 (Call 10/01/35)(b) . . . . . . . . . . . . . . . . . . . . . 1,666 1,949,2206.00%, 04/01/46 (Call 10/01/45)(b) . . . . . . . . . . . . . . . . . . . . . 2,904 3,431,221
Scotts Miracle-Gro Co. (The)4.50%, 10/15/29 (Call 10/15/24) . . . . . . . . . . . . . . . . . . . . . . . 1,815 1,928,4375.25%, 12/15/26 (Call 12/15/21) . . . . . . . . . . . . . . . . . . . . . . . 909 965,701
31,258,187Insurance — 0.9%Acrisure LLC/Acrisure Finance Inc.
7.00%, 11/15/25 (Call 11/30/20)(a)(b). . . . . . . . . . . . . . . . . . . . 4,114 4,121,1998.13%, 02/15/24 (Call 02/15/21)(a)(b) . . . . . . . . . . . . . . . . . . . 4,228 4,421,45210.13%, 08/01/26 (Call 08/01/22)(a) . . . . . . . . . . . . . . . . . . . . 1,827 2,023,403
Alliant Holdings Intermediate LLC/Alliant HoldingsCo-Issuer4.25%, 10/15/27 (Call 10/15/23)(a) . . . . . . . . . . . . . . . . . . . . . 1,735 1,721,9886.75%, 10/15/27 (Call 10/15/22)(a)(b) . . . . . . . . . . . . . . . . . . . 4,976 5,224,800
AmWINS Group Inc., 7.75%, 07/01/26 (Call 07/01/21)(a) . . . 2,470 2,636,725Assurant Inc., 7.00%, 03/27/48 (Call 03/27/28)(d) . . . . . . . . . . 1,626 1,770,113AssuredPartners Inc., 7.00%, 08/15/25 (Call 11/30/20)(a). . . 2,340 2,404,350Enstar Finance LLC, 5.75%, 09/01/40 (Call 09/01/25)(b)(d) . 1,525 1,551,229Genworth Holdings Inc.
4.80%, 02/15/24(b) . . . . . . . . . . . . . . . . . . . . . . . . . . . . . . . . . . . . 1,277 1,168,4554.90%, 08/15/23 . . . . . . . . . . . . . . . . . . . . . . . . . . . . . . . . . . . . . . 1,434 1,326,4506.50%, 06/15/34(b) . . . . . . . . . . . . . . . . . . . . . . . . . . . . . . . . . . . . 1,752 1,644,637
GTCR AP Finance Inc., 8.00%, 05/15/27(Call 05/15/22)(a)(b) . . . . . . . . . . . . . . . . . . . . . . . . . . . . . . . . . . . . 1,987 2,121,123
Highlands Holdings Bond Issuer Ltd./Highlands HoldingsBond Co-Issuer Inc. (8.38% PIK), 7.63%, 10/15/25(Call 10/15/22)(a)(b)(c) . . . . . . . . . . . . . . . . . . . . . . . . . . . . . . . . . . 605 601,975
HUB International Ltd., 7.00%, 05/01/26 (Call 05/01/21)(a) . 7,518 7,705,950Liberty Mutual Group Inc., 7.80%, 03/15/37(a)(b) . . . . . . . . . . . 1,519 1,863,506MGIC Investment Corp., 5.25%, 08/15/28 (Call 08/15/23) . . 3,035 3,118,462NMI Holdings Inc., 7.38%, 06/01/25 (Call 03/30/25)(a). . . . . . 1,830 1,994,700Radian Group Inc.
4.50%, 10/01/24 (Call 07/01/24) . . . . . . . . . . . . . . . . . . . . . . . 1,831 1,858,4654.88%, 03/15/27 (Call 09/15/26)(b) . . . . . . . . . . . . . . . . . . . . . 2,203 2,252,5686.63%, 03/15/25 (Call 09/15/24) . . . . . . . . . . . . . . . . . . . . . . . 2,210 2,392,325
USI Inc./NY, 6.88%, 05/01/25 (Call 11/30/20)(a)(b) . . . . . . . . . . 2,673 2,716,436
56,640,311Internet — 1.8%ANGI Group LLC, 3.88%, 08/15/28 (Call 08/15/23)(a) . . . . . . 2,325 2,298,844Cablevision Lightpath LLC
3.88%, 09/15/27 (Call 09/15/23)(a)(b) . . . . . . . . . . . . . . . . . . . 1,830 1,816,2755.63%, 09/15/28 (Call 09/15/23)(a) . . . . . . . . . . . . . . . . . . . . . 1,735 1,752,350
Cars.com Inc., 6.38%, 11/01/28 (Call 11/01/23)(a). . . . . . . . . . 1,775 1,766,125Cogent Communications Group Inc., 5.38%, 03/01/22
(Call 12/01/21)(a)(b) . . . . . . . . . . . . . . . . . . . . . . . . . . . . . . . . . . . . 1,594 1,621,895EIG Investors Corp., 10.88%, 02/01/24 (Call 11/30/20). . . . . 1,830 1,900,052Getty Images Inc., 9.75%, 03/01/27 (Call 03/01/22)(a). . . . . . 1,298 1,310,980Go Daddy Operating Co. LLC/GD Finance Co. Inc.,
5.25%, 12/01/27 (Call 06/01/22)(a) . . . . . . . . . . . . . . . . . . . . . 2,641 2,766,448GrubHub Holdings Inc., 5.50%, 07/01/27
(Call 07/01/22)(a)(b) . . . . . . . . . . . . . . . . . . . . . . . . . . . . . . . . . . . . 2,205 2,293,200
SecurityPar
(000) Value
Internet (continued)Match Group Holdings II LLC
4.13%, 08/01/30 (Call 05/01/25)(a) . . . . . . . . . . . . . . . . . . . . . $ 2,245 $ 2,292,7064.63%, 06/01/28 (Call 06/01/23)(a) . . . . . . . . . . . . . . . . . . . . . 2,148 2,223,9325.00%, 12/15/27 (Call 12/15/22)(a) . . . . . . . . . . . . . . . . . . . . . 1,673 1,740,1545.63%, 02/15/29 (Call 02/15/24)(a) . . . . . . . . . . . . . . . . . . . . . 2,079 2,240,123
Netflix Inc.3.63%, 06/15/25 (Call 03/15/25)(a) . . . . . . . . . . . . . . . . . . . . . 1,875 1,947,6564.38%, 11/15/26(b) . . . . . . . . . . . . . . . . . . . . . . . . . . . . . . . . . . . . 4,567 4,957,3934.88%, 04/15/28 . . . . . . . . . . . . . . . . . . . . . . . . . . . . . . . . . . . . . . 7,116 8,003,3654.88%, 06/15/30 (Call 03/15/30)(a) . . . . . . . . . . . . . . . . . . . . . 4,644 5,299,9655.38%, 11/15/29(a)(b) . . . . . . . . . . . . . . . . . . . . . . . . . . . . . . . . . . 3,866 4,528,0535.50%, 02/15/22(b) . . . . . . . . . . . . . . . . . . . . . . . . . . . . . . . . . . . . 2,511 2,638,1195.75%, 03/01/24 . . . . . . . . . . . . . . . . . . . . . . . . . . . . . . . . . . . . . . 1,630 1,803,1885.88%, 02/15/25 . . . . . . . . . . . . . . . . . . . . . . . . . . . . . . . . . . . . . . 3,422 3,871,1385.88%, 11/15/28 . . . . . . . . . . . . . . . . . . . . . . . . . . . . . . . . . . . . . . 8,183 9,777,0076.38%, 05/15/29(b) . . . . . . . . . . . . . . . . . . . . . . . . . . . . . . . . . . . . 3,411 4,178,475
Northwest Fiber LLC/Northwest Fiber Finance Sub Inc.,10.75%, 06/01/28 (Call 06/01/23)(a) . . . . . . . . . . . . . . . . . . . . 1,205 1,361,650
NortonLifeLock Inc.3.95%, 06/15/22 (Call 03/15/22) . . . . . . . . . . . . . . . . . . . . . . . 1,491 1,526,4115.00%, 04/15/25 (Call 11/10/20)(a). . . . . . . . . . . . . . . . . . . . . . 4,768 4,856,017
Photo Holdings Merger Sub Inc., 8.50%, 10/01/26(Call 10/01/22)(a) . . . . . . . . . . . . . . . . . . . . . . . . . . . . . . . . . . . . . . 3,489 3,244,770
TripAdvisor Inc., 7.00%, 07/15/25 (Call 07/15/22)(a) . . . . . . . . 2,440 2,538,210Twitter Inc., 3.88%, 12/15/27 (Call 09/15/27)(a)(b) . . . . . . . . . . 3,297 3,457,894Uber Technologies Inc.
6.25%, 01/15/28 (Call 09/15/23)(a) . . . . . . . . . . . . . . . . . . . . . 2,275 2,306,2817.50%, 05/15/25 (Call 05/15/22)(a) . . . . . . . . . . . . . . . . . . . . . 4,292 4,511,9657.50%, 09/15/27 (Call 09/15/22)(a) . . . . . . . . . . . . . . . . . . . . . 5,358 5,600,449
VeriSign Inc.4.63%, 05/01/23 (Call 11/30/20). . . . . . . . . . . . . . . . . . . . . . . . 2,567 2,593,6204.75%, 07/15/27 (Call 07/15/22) . . . . . . . . . . . . . . . . . . . . . . . 2,491 2,640,4605.25%, 04/01/25 (Call 01/01/25) . . . . . . . . . . . . . . . . . . . . . . . 1,965 2,201,635
109,866,805Iron & Steel — 1.1%Allegheny Technologies Inc.
5.88%, 12/01/27 (Call 12/01/22)(b) . . . . . . . . . . . . . . . . . . . . . 1,655 1,557,7697.88%, 08/15/23 (Call 05/15/23)(b) . . . . . . . . . . . . . . . . . . . . . 2,315 2,336,877
ArcelorMittal SA3.60%, 07/16/24 . . . . . . . . . . . . . . . . . . . . . . . . . . . . . . . . . . . . . . 3,125 3,252,7894.25%, 07/16/29(b) . . . . . . . . . . . . . . . . . . . . . . . . . . . . . . . . . . . . 2,324 2,449,8794.55%, 03/11/26 . . . . . . . . . . . . . . . . . . . . . . . . . . . . . . . . . . . . . . 3,260 3,509,6546.13%, 06/01/25(b) . . . . . . . . . . . . . . . . . . . . . . . . . . . . . . . . . . . . 2,229 2,585,4497.00%, 03/01/41(b) . . . . . . . . . . . . . . . . . . . . . . . . . . . . . . . . . . . . 1,765 2,126,9077.25%, 10/15/39(b) . . . . . . . . . . . . . . . . . . . . . . . . . . . . . . . . . . . . 3,103 3,792,739
Baffinland Iron Mines Corp./Baffinland Iron Mines LP,8.75%, 07/15/26 (Call 07/15/21)(a) . . . . . . . . . . . . . . . . . . . . . 2,610 2,733,975
Big River Steel LLC/BRS Finance Corp., 6.63%, 01/31/29(Call 09/15/23)(a) . . . . . . . . . . . . . . . . . . . . . . . . . . . . . . . . . . . . . . 3,978 4,097,340
Carpenter Technology Corp.4.45%, 03/01/23 (Call 12/01/22)(b) . . . . . . . . . . . . . . . . . . . . . 1,485 1,532,4006.38%, 07/15/28 (Call 07/15/23)(b) . . . . . . . . . . . . . . . . . . . . . 1,845 1,935,339
Cleveland-Cliffs Inc.4.88%, 01/15/24 (Call 01/15/21)(a) . . . . . . . . . . . . . . . . . . . . . 1,659 1,650,7055.75%, 03/01/25 (Call 11/30/20)(b). . . . . . . . . . . . . . . . . . . . . . 2,020 1,951,8255.88%, 06/01/27 (Call 06/01/22) . . . . . . . . . . . . . . . . . . . . . . . 2,780 2,702,9666.25%, 10/01/40 . . . . . . . . . . . . . . . . . . . . . . . . . . . . . . . . . . . . . . 696 592,2266.75%, 03/15/26 (Call 03/15/22)(a) . . . . . . . . . . . . . . . . . . . . . 4,008 4,208,4009.88%, 10/17/25 (Call 10/17/22)(a) . . . . . . . . . . . . . . . . . . . . . 4,363 4,990,181
Schedule of Investments (continued)
October 31, 2020
iShares� Broad USD High Yield Corporate Bond ETF(Percentages shown are based on Net Assets)
S C H E D U L E O F I N V E S T M E N T S 37
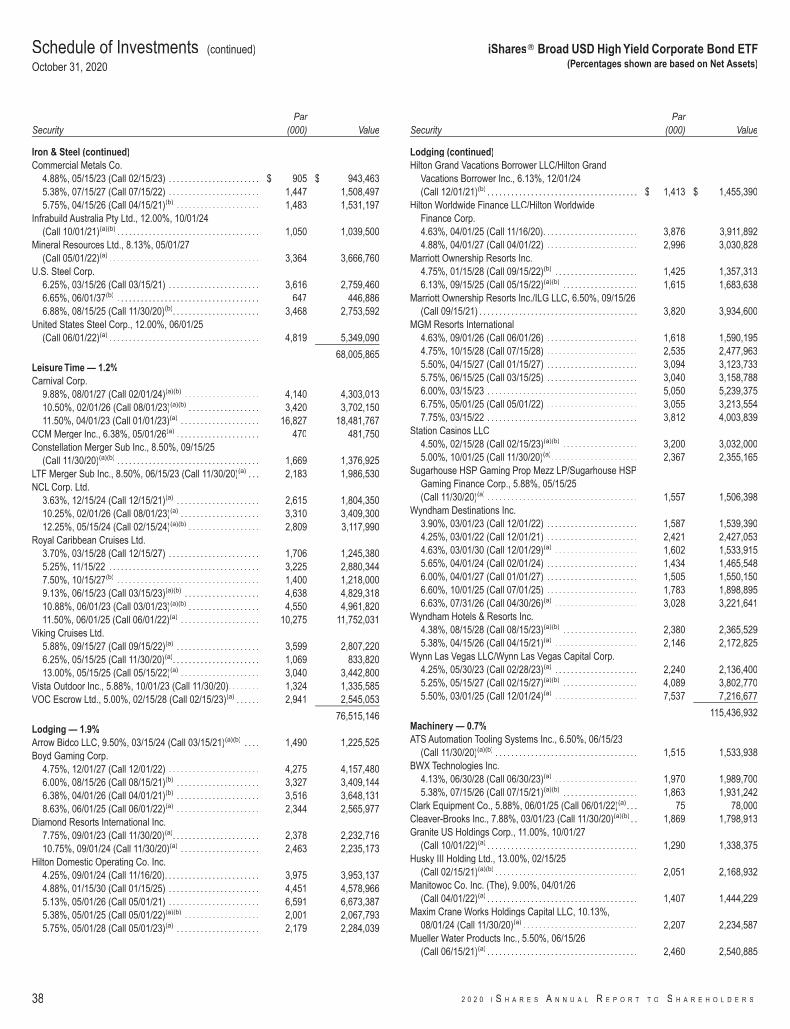
SecurityPar
(000) Value
Iron & Steel (continued)Commercial Metals Co.
4.88%, 05/15/23 (Call 02/15/23) . . . . . . . . . . . . . . . . . . . . . . . $ 905 $ 943,4635.38%, 07/15/27 (Call 07/15/22) . . . . . . . . . . . . . . . . . . . . . . . 1,447 1,508,4975.75%, 04/15/26 (Call 04/15/21)(b) . . . . . . . . . . . . . . . . . . . . . 1,483 1,531,197
Infrabuild Australia Pty Ltd., 12.00%, 10/01/24(Call 10/01/21)(a)(b) . . . . . . . . . . . . . . . . . . . . . . . . . . . . . . . . . . . . 1,050 1,039,500
Mineral Resources Ltd., 8.13%, 05/01/27(Call 05/01/22)(a) . . . . . . . . . . . . . . . . . . . . . . . . . . . . . . . . . . . . . . 3,364 3,666,760
U.S. Steel Corp.6.25%, 03/15/26 (Call 03/15/21) . . . . . . . . . . . . . . . . . . . . . . . 3,616 2,759,4606.65%, 06/01/37(b) . . . . . . . . . . . . . . . . . . . . . . . . . . . . . . . . . . . . 647 446,8866.88%, 08/15/25 (Call 11/30/20)(b). . . . . . . . . . . . . . . . . . . . . . 3,468 2,753,592
United States Steel Corp., 12.00%, 06/01/25(Call 06/01/22)(a) . . . . . . . . . . . . . . . . . . . . . . . . . . . . . . . . . . . . . . 4,819 5,349,090
68,005,865Leisure Time — 1.2%Carnival Corp.
9.88%, 08/01/27 (Call 02/01/24)(a)(b) . . . . . . . . . . . . . . . . . . . 4,140 4,303,01310.50%, 02/01/26 (Call 08/01/23)(a)(b) . . . . . . . . . . . . . . . . . . 3,420 3,702,15011.50%, 04/01/23 (Call 01/01/23)(a) . . . . . . . . . . . . . . . . . . . . 16,827 18,481,767
CCM Merger Inc., 6.38%, 05/01/26(a) . . . . . . . . . . . . . . . . . . . . . 470 481,750Constellation Merger Sub Inc., 8.50%, 09/15/25
(Call 11/30/20)(a)(b) . . . . . . . . . . . . . . . . . . . . . . . . . . . . . . . . . . . . 1,669 1,376,925LTF Merger Sub Inc., 8.50%, 06/15/23 (Call 11/30/20)(a) . . . 2,183 1,986,530NCL Corp. Ltd.
3.63%, 12/15/24 (Call 12/15/21)(a) . . . . . . . . . . . . . . . . . . . . . 2,615 1,804,35010.25%, 02/01/26 (Call 08/01/23)(a) . . . . . . . . . . . . . . . . . . . . 3,310 3,409,30012.25%, 05/15/24 (Call 02/15/24)(a)(b) . . . . . . . . . . . . . . . . . . 2,809 3,117,990
Royal Caribbean Cruises Ltd.3.70%, 03/15/28 (Call 12/15/27) . . . . . . . . . . . . . . . . . . . . . . . 1,706 1,245,3805.25%, 11/15/22 . . . . . . . . . . . . . . . . . . . . . . . . . . . . . . . . . . . . . . 3,225 2,880,3447.50%, 10/15/27(b) . . . . . . . . . . . . . . . . . . . . . . . . . . . . . . . . . . . . 1,400 1,218,0009.13%, 06/15/23 (Call 03/15/23)(a)(b) . . . . . . . . . . . . . . . . . . . 4,638 4,829,31810.88%, 06/01/23 (Call 03/01/23)(a)(b) . . . . . . . . . . . . . . . . . . 4,550 4,961,82011.50%, 06/01/25 (Call 06/01/22)(a) . . . . . . . . . . . . . . . . . . . . 10,275 11,752,031
Viking Cruises Ltd.5.88%, 09/15/27 (Call 09/15/22)(a) . . . . . . . . . . . . . . . . . . . . . 3,599 2,807,2206.25%, 05/15/25 (Call 11/30/20)(a). . . . . . . . . . . . . . . . . . . . . . 1,069 833,82013.00%, 05/15/25 (Call 05/15/22)(a) . . . . . . . . . . . . . . . . . . . . 3,040 3,442,800
Vista Outdoor Inc., 5.88%, 10/01/23 (Call 11/30/20). . . . . . . . 1,324 1,335,585VOC Escrow Ltd., 5.00%, 02/15/28 (Call 02/15/23)(a) . . . . . . 2,941 2,545,053
76,515,146Lodging — 1.9%Arrow Bidco LLC, 9.50%, 03/15/24 (Call 03/15/21)(a)(b) . . . . 1,490 1,225,525Boyd Gaming Corp.
4.75%, 12/01/27 (Call 12/01/22) . . . . . . . . . . . . . . . . . . . . . . . 4,275 4,157,4806.00%, 08/15/26 (Call 08/15/21)(b) . . . . . . . . . . . . . . . . . . . . . 3,327 3,409,1446.38%, 04/01/26 (Call 04/01/21)(b) . . . . . . . . . . . . . . . . . . . . . 3,516 3,648,1318.63%, 06/01/25 (Call 06/01/22)(a) . . . . . . . . . . . . . . . . . . . . . 2,344 2,565,977
Diamond Resorts International Inc.7.75%, 09/01/23 (Call 11/30/20)(a). . . . . . . . . . . . . . . . . . . . . . 2,378 2,232,71610.75%, 09/01/24 (Call 11/30/20)(a) . . . . . . . . . . . . . . . . . . . . 2,463 2,235,173
Hilton Domestic Operating Co. Inc.4.25%, 09/01/24 (Call 11/16/20). . . . . . . . . . . . . . . . . . . . . . . . 3,975 3,953,1374.88%, 01/15/30 (Call 01/15/25) . . . . . . . . . . . . . . . . . . . . . . . 4,451 4,578,9665.13%, 05/01/26 (Call 05/01/21) . . . . . . . . . . . . . . . . . . . . . . . 6,591 6,673,3875.38%, 05/01/25 (Call 05/01/22)(a)(b) . . . . . . . . . . . . . . . . . . . 2,001 2,067,7935.75%, 05/01/28 (Call 05/01/23)(a) . . . . . . . . . . . . . . . . . . . . . 2,179 2,284,039
SecurityPar
(000) Value
Lodging (continued)Hilton Grand Vacations Borrower LLC/Hilton Grand
Vacations Borrower Inc., 6.13%, 12/01/24(Call 12/01/21)(b) . . . . . . . . . . . . . . . . . . . . . . . . . . . . . . . . . . . . . . $ 1,413 $ 1,455,390
Hilton Worldwide Finance LLC/Hilton WorldwideFinance Corp.4.63%, 04/01/25 (Call 11/16/20). . . . . . . . . . . . . . . . . . . . . . . . 3,876 3,911,8924.88%, 04/01/27 (Call 04/01/22) . . . . . . . . . . . . . . . . . . . . . . . 2,996 3,030,828
Marriott Ownership Resorts Inc.4.75%, 01/15/28 (Call 09/15/22)(b) . . . . . . . . . . . . . . . . . . . . . 1,425 1,357,3136.13%, 09/15/25 (Call 05/15/22)(a)(b) . . . . . . . . . . . . . . . . . . . 1,615 1,683,638
Marriott Ownership Resorts Inc./ILG LLC, 6.50%, 09/15/26(Call 09/15/21) . . . . . . . . . . . . . . . . . . . . . . . . . . . . . . . . . . . . . . . . 3,820 3,934,600
MGM Resorts International4.63%, 09/01/26 (Call 06/01/26) . . . . . . . . . . . . . . . . . . . . . . . 1,618 1,590,1954.75%, 10/15/28 (Call 07/15/28) . . . . . . . . . . . . . . . . . . . . . . . 2,535 2,477,9635.50%, 04/15/27 (Call 01/15/27) . . . . . . . . . . . . . . . . . . . . . . . 3,094 3,123,7335.75%, 06/15/25 (Call 03/15/25) . . . . . . . . . . . . . . . . . . . . . . . 3,040 3,158,7886.00%, 03/15/23 . . . . . . . . . . . . . . . . . . . . . . . . . . . . . . . . . . . . . . 5,050 5,239,3756.75%, 05/01/25 (Call 05/01/22) . . . . . . . . . . . . . . . . . . . . . . . 3,055 3,213,5547.75%, 03/15/22 . . . . . . . . . . . . . . . . . . . . . . . . . . . . . . . . . . . . . . 3,812 4,003,839
Station Casinos LLC4.50%, 02/15/28 (Call 02/15/23)(a)(b) . . . . . . . . . . . . . . . . . . . 3,200 3,032,0005.00%, 10/01/25 (Call 11/30/20)(a). . . . . . . . . . . . . . . . . . . . . . 2,367 2,355,165
Sugarhouse HSP Gaming Prop Mezz LP/Sugarhouse HSPGaming Finance Corp., 5.88%, 05/15/25(Call 11/30/20)(a) . . . . . . . . . . . . . . . . . . . . . . . . . . . . . . . . . . . . . . 1,557 1,506,398
Wyndham Destinations Inc.3.90%, 03/01/23 (Call 12/01/22) . . . . . . . . . . . . . . . . . . . . . . . 1,587 1,539,3904.25%, 03/01/22 (Call 12/01/21) . . . . . . . . . . . . . . . . . . . . . . . 2,421 2,427,0534.63%, 03/01/30 (Call 12/01/29)(a) . . . . . . . . . . . . . . . . . . . . . 1,602 1,533,9155.65%, 04/01/24 (Call 02/01/24) . . . . . . . . . . . . . . . . . . . . . . . 1,434 1,465,5486.00%, 04/01/27 (Call 01/01/27) . . . . . . . . . . . . . . . . . . . . . . . 1,505 1,550,1506.60%, 10/01/25 (Call 07/01/25) . . . . . . . . . . . . . . . . . . . . . . . 1,783 1,898,8956.63%, 07/31/26 (Call 04/30/26)(a) . . . . . . . . . . . . . . . . . . . . . 3,028 3,221,641
Wyndham Hotels & Resorts Inc.4.38%, 08/15/28 (Call 08/15/23)(a)(b) . . . . . . . . . . . . . . . . . . . 2,380 2,365,5295.38%, 04/15/26 (Call 04/15/21)(a) . . . . . . . . . . . . . . . . . . . . . 2,146 2,172,825
Wynn Las Vegas LLC/Wynn Las Vegas Capital Corp.4.25%, 05/30/23 (Call 02/28/23)(a) . . . . . . . . . . . . . . . . . . . . . 2,240 2,136,4005.25%, 05/15/27 (Call 02/15/27)(a)(b) . . . . . . . . . . . . . . . . . . . 4,089 3,802,7705.50%, 03/01/25 (Call 12/01/24)(a) . . . . . . . . . . . . . . . . . . . . . 7,537 7,216,677
115,436,932Machinery — 0.7%ATS Automation Tooling Systems Inc., 6.50%, 06/15/23
(Call 11/30/20)(a)(b) . . . . . . . . . . . . . . . . . . . . . . . . . . . . . . . . . . . . 1,515 1,533,938BWX Technologies Inc.
4.13%, 06/30/28 (Call 06/30/23)(a) . . . . . . . . . . . . . . . . . . . . . 1,970 1,989,7005.38%, 07/15/26 (Call 07/15/21)(a)(b) . . . . . . . . . . . . . . . . . . . 1,863 1,931,242
Clark Equipment Co., 5.88%, 06/01/25 (Call 06/01/22)(a). . . 75 78,000Cleaver-Brooks Inc., 7.88%, 03/01/23 (Call 11/30/20)(a)(b) . . 1,869 1,798,913Granite US Holdings Corp., 11.00%, 10/01/27
(Call 10/01/22)(a) . . . . . . . . . . . . . . . . . . . . . . . . . . . . . . . . . . . . . . 1,290 1,338,375Husky III Holding Ltd., 13.00%, 02/15/25
(Call 02/15/21)(a)(b) . . . . . . . . . . . . . . . . . . . . . . . . . . . . . . . . . . . . 2,051 2,168,932Manitowoc Co. Inc. (The), 9.00%, 04/01/26
(Call 04/01/22)(a) . . . . . . . . . . . . . . . . . . . . . . . . . . . . . . . . . . . . . . 1,407 1,444,229Maxim Crane Works Holdings Capital LLC, 10.13%,
08/01/24 (Call 11/30/20)(a) . . . . . . . . . . . . . . . . . . . . . . . . . . . . . 2,207 2,234,587Mueller Water Products Inc., 5.50%, 06/15/26
(Call 06/15/21)(a) . . . . . . . . . . . . . . . . . . . . . . . . . . . . . . . . . . . . . . 2,460 2,540,885
Schedule of Investments (continued)
October 31, 2020
iShares� Broad USD High Yield Corporate Bond ETF(Percentages shown are based on Net Assets)
38 2 0 2 0 I S H A R E S A N N U A L R E P O R T T O S H A R E H O L D E R S
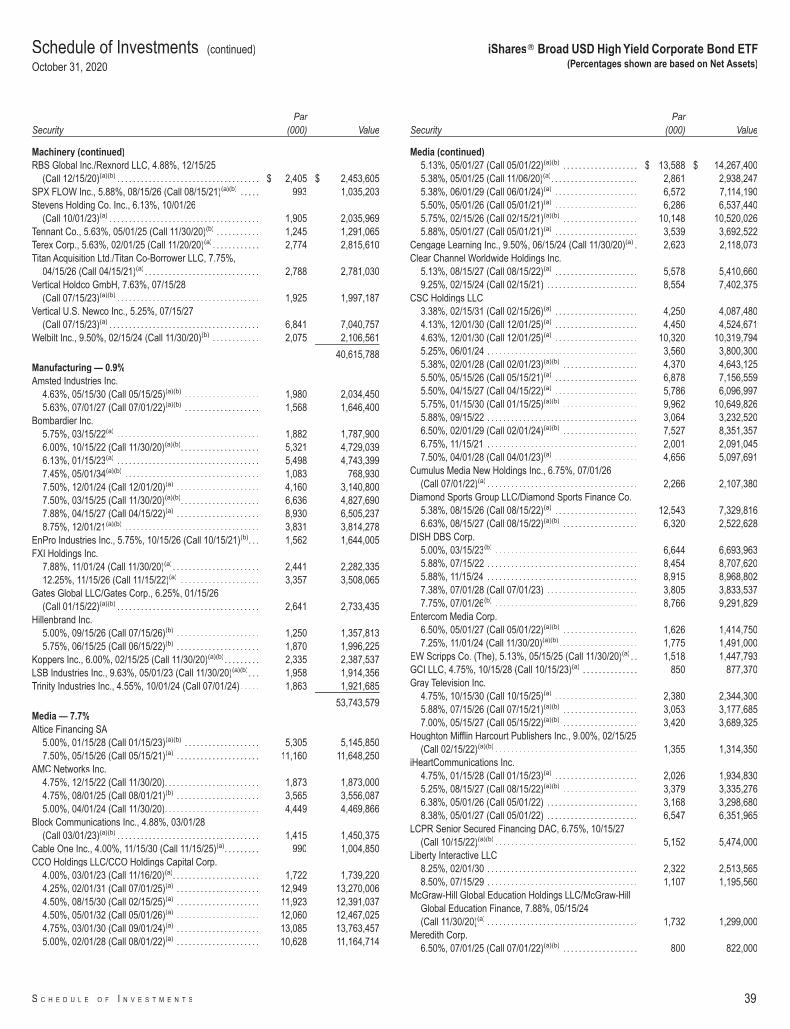
SecurityPar
(000) Value
Machinery (continued)RBS Global Inc./Rexnord LLC, 4.88%, 12/15/25
(Call 12/15/20)(a)(b) . . . . . . . . . . . . . . . . . . . . . . . . . . . . . . . . . . . . $ 2,405 $ 2,453,605SPX FLOW Inc., 5.88%, 08/15/26 (Call 08/15/21)(a)(b) . . . . . 993 1,035,203Stevens Holding Co. Inc., 6.13%, 10/01/26
(Call 10/01/23)(a) . . . . . . . . . . . . . . . . . . . . . . . . . . . . . . . . . . . . . . 1,905 2,035,969Tennant Co., 5.63%, 05/01/25 (Call 11/30/20)(b) . . . . . . . . . . . 1,245 1,291,065Terex Corp., 5.63%, 02/01/25 (Call 11/20/20)(a). . . . . . . . . . . . 2,774 2,815,610Titan Acquisition Ltd./Titan Co-Borrower LLC, 7.75%,
04/15/26 (Call 04/15/21)(a) . . . . . . . . . . . . . . . . . . . . . . . . . . . . . 2,788 2,781,030Vertical Holdco GmbH, 7.63%, 07/15/28
(Call 07/15/23)(a)(b) . . . . . . . . . . . . . . . . . . . . . . . . . . . . . . . . . . . . 1,925 1,997,187Vertical U.S. Newco Inc., 5.25%, 07/15/27
(Call 07/15/23)(a) . . . . . . . . . . . . . . . . . . . . . . . . . . . . . . . . . . . . . . 6,841 7,040,757Welbilt Inc., 9.50%, 02/15/24 (Call 11/30/20)(b) . . . . . . . . . . . . 2,075 2,106,561
40,615,788Manufacturing — 0.9%Amsted Industries Inc.
4.63%, 05/15/30 (Call 05/15/25)(a)(b) . . . . . . . . . . . . . . . . . . . 1,980 2,034,4505.63%, 07/01/27 (Call 07/01/22)(a)(b) . . . . . . . . . . . . . . . . . . . 1,568 1,646,400
Bombardier Inc.5.75%, 03/15/22(a) . . . . . . . . . . . . . . . . . . . . . . . . . . . . . . . . . . . . 1,882 1,787,9006.00%, 10/15/22 (Call 11/30/20)(a)(b). . . . . . . . . . . . . . . . . . . . 5,321 4,729,0396.13%, 01/15/23(a) . . . . . . . . . . . . . . . . . . . . . . . . . . . . . . . . . . . . 5,498 4,743,3997.45%, 05/01/34(a)(b) . . . . . . . . . . . . . . . . . . . . . . . . . . . . . . . . . . 1,083 768,9307.50%, 12/01/24 (Call 12/01/20)(a) . . . . . . . . . . . . . . . . . . . . . 4,160 3,140,8007.50%, 03/15/25 (Call 11/30/20)(a)(b). . . . . . . . . . . . . . . . . . . . 6,636 4,827,6907.88%, 04/15/27 (Call 04/15/22)(a) . . . . . . . . . . . . . . . . . . . . . 8,930 6,505,2378.75%, 12/01/21(a)(b) . . . . . . . . . . . . . . . . . . . . . . . . . . . . . . . . . . 3,831 3,814,278
EnPro Industries Inc., 5.75%, 10/15/26 (Call 10/15/21)(b). . . 1,562 1,644,005FXI Holdings Inc.
7.88%, 11/01/24 (Call 11/30/20)(a). . . . . . . . . . . . . . . . . . . . . . 2,441 2,282,33512.25%, 11/15/26 (Call 11/15/22)(a) . . . . . . . . . . . . . . . . . . . . 3,357 3,508,065
Gates Global LLC/Gates Corp., 6.25%, 01/15/26(Call 01/15/22)(a)(b) . . . . . . . . . . . . . . . . . . . . . . . . . . . . . . . . . . . . 2,641 2,733,435
Hillenbrand Inc.5.00%, 09/15/26 (Call 07/15/26)(b) . . . . . . . . . . . . . . . . . . . . . 1,250 1,357,8135.75%, 06/15/25 (Call 06/15/22)(b) . . . . . . . . . . . . . . . . . . . . . 1,870 1,996,225
Koppers Inc., 6.00%, 02/15/25 (Call 11/30/20)(a)(b) . . . . . . . . . 2,335 2,387,537LSB Industries Inc., 9.63%, 05/01/23 (Call 11/30/20)(a)(b). . . 1,958 1,914,356Trinity Industries Inc., 4.55%, 10/01/24 (Call 07/01/24). . . . . 1,863 1,921,685
53,743,579Media — 7.7%Altice Financing SA
5.00%, 01/15/28 (Call 01/15/23)(a)(b) . . . . . . . . . . . . . . . . . . . 5,305 5,145,8507.50%, 05/15/26 (Call 05/15/21)(a) . . . . . . . . . . . . . . . . . . . . . 11,160 11,648,250
AMC Networks Inc.4.75%, 12/15/22 (Call 11/30/20). . . . . . . . . . . . . . . . . . . . . . . . 1,873 1,873,0004.75%, 08/01/25 (Call 08/01/21)(b) . . . . . . . . . . . . . . . . . . . . . 3,565 3,556,0875.00%, 04/01/24 (Call 11/30/20). . . . . . . . . . . . . . . . . . . . . . . . 4,449 4,469,866
Block Communications Inc., 4.88%, 03/01/28(Call 03/01/23)(a)(b) . . . . . . . . . . . . . . . . . . . . . . . . . . . . . . . . . . . . 1,415 1,450,375
Cable One Inc., 4.00%, 11/15/30 (Call 11/15/25)(a). . . . . . . . . 990 1,004,850CCO Holdings LLC/CCO Holdings Capital Corp.
4.00%, 03/01/23 (Call 11/16/20)(a). . . . . . . . . . . . . . . . . . . . . . 1,722 1,739,2204.25%, 02/01/31 (Call 07/01/25)(a) . . . . . . . . . . . . . . . . . . . . . 12,949 13,270,0064.50%, 08/15/30 (Call 02/15/25)(a) . . . . . . . . . . . . . . . . . . . . . 11,923 12,391,0374.50%, 05/01/32 (Call 05/01/26)(a) . . . . . . . . . . . . . . . . . . . . . 12,060 12,467,0254.75%, 03/01/30 (Call 09/01/24)(a) . . . . . . . . . . . . . . . . . . . . . 13,085 13,763,4575.00%, 02/01/28 (Call 08/01/22)(a) . . . . . . . . . . . . . . . . . . . . . 10,628 11,164,714
SecurityPar
(000) Value
Media (continued)5.13%, 05/01/27 (Call 05/01/22)(a)(b) . . . . . . . . . . . . . . . . . . . $ 13,588 $ 14,267,4005.38%, 05/01/25 (Call 11/06/20)(a). . . . . . . . . . . . . . . . . . . . . . 2,861 2,938,2475.38%, 06/01/29 (Call 06/01/24)(a) . . . . . . . . . . . . . . . . . . . . . 6,572 7,114,1905.50%, 05/01/26 (Call 05/01/21)(a) . . . . . . . . . . . . . . . . . . . . . 6,286 6,537,4405.75%, 02/15/26 (Call 02/15/21)(a)(b) . . . . . . . . . . . . . . . . . . . 10,148 10,520,0265.88%, 05/01/27 (Call 05/01/21)(a) . . . . . . . . . . . . . . . . . . . . . 3,539 3,692,522
Cengage Learning Inc., 9.50%, 06/15/24 (Call 11/30/20)(a) . 2,623 2,118,073Clear Channel Worldwide Holdings Inc.
5.13%, 08/15/27 (Call 08/15/22)(a) . . . . . . . . . . . . . . . . . . . . . 5,578 5,410,6609.25%, 02/15/24 (Call 02/15/21) . . . . . . . . . . . . . . . . . . . . . . . 8,554 7,402,375
CSC Holdings LLC3.38%, 02/15/31 (Call 02/15/26)(a) . . . . . . . . . . . . . . . . . . . . . 4,250 4,087,4804.13%, 12/01/30 (Call 12/01/25)(a) . . . . . . . . . . . . . . . . . . . . . 4,450 4,524,6714.63%, 12/01/30 (Call 12/01/25)(a) . . . . . . . . . . . . . . . . . . . . . 10,320 10,319,7945.25%, 06/01/24 . . . . . . . . . . . . . . . . . . . . . . . . . . . . . . . . . . . . . . 3,560 3,800,3005.38%, 02/01/28 (Call 02/01/23)(a)(b) . . . . . . . . . . . . . . . . . . . 4,370 4,643,1255.50%, 05/15/26 (Call 05/15/21)(a) . . . . . . . . . . . . . . . . . . . . . 6,878 7,156,5595.50%, 04/15/27 (Call 04/15/22)(a) . . . . . . . . . . . . . . . . . . . . . 5,786 6,096,9975.75%, 01/15/30 (Call 01/15/25)(a)(b) . . . . . . . . . . . . . . . . . . . 9,962 10,649,8265.88%, 09/15/22 . . . . . . . . . . . . . . . . . . . . . . . . . . . . . . . . . . . . . . 3,064 3,232,5206.50%, 02/01/29 (Call 02/01/24)(a)(b) . . . . . . . . . . . . . . . . . . . 7,527 8,351,3576.75%, 11/15/21 . . . . . . . . . . . . . . . . . . . . . . . . . . . . . . . . . . . . . . 2,001 2,091,0457.50%, 04/01/28 (Call 04/01/23)(a) . . . . . . . . . . . . . . . . . . . . . 4,656 5,097,691
Cumulus Media New Holdings Inc., 6.75%, 07/01/26(Call 07/01/22)(a) . . . . . . . . . . . . . . . . . . . . . . . . . . . . . . . . . . . . . . 2,266 2,107,380
Diamond Sports Group LLC/Diamond Sports Finance Co.5.38%, 08/15/26 (Call 08/15/22)(a) . . . . . . . . . . . . . . . . . . . . . 12,543 7,329,8166.63%, 08/15/27 (Call 08/15/22)(a)(b) . . . . . . . . . . . . . . . . . . . 6,320 2,522,628
DISH DBS Corp.5.00%, 03/15/23(b) . . . . . . . . . . . . . . . . . . . . . . . . . . . . . . . . . . . . 6,644 6,693,9635.88%, 07/15/22 . . . . . . . . . . . . . . . . . . . . . . . . . . . . . . . . . . . . . . 8,454 8,707,6205.88%, 11/15/24 . . . . . . . . . . . . . . . . . . . . . . . . . . . . . . . . . . . . . . 8,915 8,968,8027.38%, 07/01/28 (Call 07/01/23) . . . . . . . . . . . . . . . . . . . . . . . 3,805 3,833,5377.75%, 07/01/26(b) . . . . . . . . . . . . . . . . . . . . . . . . . . . . . . . . . . . . 8,766 9,291,829
Entercom Media Corp.6.50%, 05/01/27 (Call 05/01/22)(a)(b) . . . . . . . . . . . . . . . . . . . 1,626 1,414,7507.25%, 11/01/24 (Call 11/30/20)(a)(b). . . . . . . . . . . . . . . . . . . . 1,775 1,491,000
EW Scripps Co. (The), 5.13%, 05/15/25 (Call 11/30/20)(a) . . 1,518 1,447,793GCI LLC, 4.75%, 10/15/28 (Call 10/15/23)(a) . . . . . . . . . . . . . . 850 877,370Gray Television Inc.
4.75%, 10/15/30 (Call 10/15/25)(a) . . . . . . . . . . . . . . . . . . . . . 2,380 2,344,3005.88%, 07/15/26 (Call 07/15/21)(a)(b) . . . . . . . . . . . . . . . . . . . 3,053 3,177,6857.00%, 05/15/27 (Call 05/15/22)(a)(b) . . . . . . . . . . . . . . . . . . . 3,420 3,689,325
Houghton Mifflin Harcourt Publishers Inc., 9.00%, 02/15/25(Call 02/15/22)(a)(b) . . . . . . . . . . . . . . . . . . . . . . . . . . . . . . . . . . . . 1,355 1,314,350
iHeartCommunications Inc.4.75%, 01/15/28 (Call 01/15/23)(a) . . . . . . . . . . . . . . . . . . . . . 2,026 1,934,8305.25%, 08/15/27 (Call 08/15/22)(a)(b) . . . . . . . . . . . . . . . . . . . 3,379 3,335,2766.38%, 05/01/26 (Call 05/01/22) . . . . . . . . . . . . . . . . . . . . . . . 3,168 3,298,6808.38%, 05/01/27 (Call 05/01/22) . . . . . . . . . . . . . . . . . . . . . . . 6,547 6,351,965
LCPR Senior Secured Financing DAC, 6.75%, 10/15/27(Call 10/15/22)(a)(b) . . . . . . . . . . . . . . . . . . . . . . . . . . . . . . . . . . . . 5,152 5,474,000
Liberty Interactive LLC8.25%, 02/01/30 . . . . . . . . . . . . . . . . . . . . . . . . . . . . . . . . . . . . . . 2,322 2,513,5658.50%, 07/15/29 . . . . . . . . . . . . . . . . . . . . . . . . . . . . . . . . . . . . . . 1,107 1,195,560
McGraw-Hill Global Education Holdings LLC/McGraw-HillGlobal Education Finance, 7.88%, 05/15/24(Call 11/30/20)(a) . . . . . . . . . . . . . . . . . . . . . . . . . . . . . . . . . . . . . . 1,732 1,299,000
Meredith Corp.6.50%, 07/01/25 (Call 07/01/22)(a)(b) . . . . . . . . . . . . . . . . . . . 800 822,000
Schedule of Investments (continued)
October 31, 2020
iShares� Broad USD High Yield Corporate Bond ETF(Percentages shown are based on Net Assets)
S C H E D U L E O F I N V E S T M E N T S 39
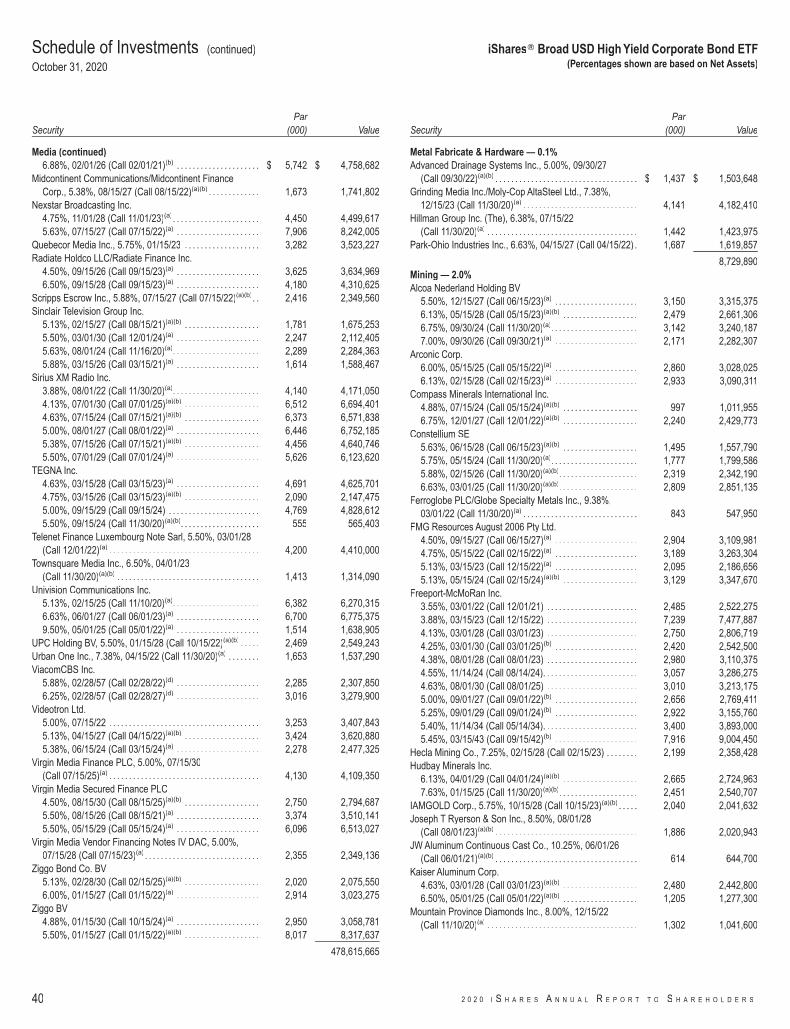
SecurityPar
(000) Value
Media (continued)6.88%, 02/01/26 (Call 02/01/21)(b) . . . . . . . . . . . . . . . . . . . . . $ 5,742 $ 4,758,682
Midcontinent Communications/Midcontinent FinanceCorp., 5.38%, 08/15/27 (Call 08/15/22)(a)(b) . . . . . . . . . . . . . 1,673 1,741,802
Nexstar Broadcasting Inc.4.75%, 11/01/28 (Call 11/01/23)(a). . . . . . . . . . . . . . . . . . . . . . 4,450 4,499,6175.63%, 07/15/27 (Call 07/15/22)(a) . . . . . . . . . . . . . . . . . . . . . 7,906 8,242,005
Quebecor Media Inc., 5.75%, 01/15/23 . . . . . . . . . . . . . . . . . . . 3,282 3,523,227Radiate Holdco LLC/Radiate Finance Inc.
4.50%, 09/15/26 (Call 09/15/23)(a) . . . . . . . . . . . . . . . . . . . . . 3,625 3,634,9696.50%, 09/15/28 (Call 09/15/23)(a) . . . . . . . . . . . . . . . . . . . . . 4,180 4,310,625
Scripps Escrow Inc., 5.88%, 07/15/27 (Call 07/15/22)(a)(b). . 2,416 2,349,560Sinclair Television Group Inc.
5.13%, 02/15/27 (Call 08/15/21)(a)(b) . . . . . . . . . . . . . . . . . . . 1,781 1,675,2535.50%, 03/01/30 (Call 12/01/24)(a) . . . . . . . . . . . . . . . . . . . . . 2,247 2,112,4055.63%, 08/01/24 (Call 11/16/20)(a). . . . . . . . . . . . . . . . . . . . . . 2,289 2,284,3635.88%, 03/15/26 (Call 03/15/21)(a) . . . . . . . . . . . . . . . . . . . . . 1,614 1,588,467
Sirius XM Radio Inc.3.88%, 08/01/22 (Call 11/30/20)(a). . . . . . . . . . . . . . . . . . . . . . 4,140 4,171,0504.13%, 07/01/30 (Call 07/01/25)(a)(b) . . . . . . . . . . . . . . . . . . . 6,512 6,694,4014.63%, 07/15/24 (Call 07/15/21)(a)(b) . . . . . . . . . . . . . . . . . . . 6,373 6,571,8385.00%, 08/01/27 (Call 08/01/22)(a) . . . . . . . . . . . . . . . . . . . . . 6,446 6,752,1855.38%, 07/15/26 (Call 07/15/21)(a)(b) . . . . . . . . . . . . . . . . . . . 4,456 4,640,7465.50%, 07/01/29 (Call 07/01/24)(a) . . . . . . . . . . . . . . . . . . . . . 5,626 6,123,620
TEGNA Inc.4.63%, 03/15/28 (Call 03/15/23)(a) . . . . . . . . . . . . . . . . . . . . . 4,691 4,625,7014.75%, 03/15/26 (Call 03/15/23)(a)(b) . . . . . . . . . . . . . . . . . . . 2,090 2,147,4755.00%, 09/15/29 (Call 09/15/24) . . . . . . . . . . . . . . . . . . . . . . . 4,769 4,828,6125.50%, 09/15/24 (Call 11/30/20)(a)(b). . . . . . . . . . . . . . . . . . . . 555 565,403
Telenet Finance Luxembourg Note Sarl, 5.50%, 03/01/28(Call 12/01/22)(a) . . . . . . . . . . . . . . . . . . . . . . . . . . . . . . . . . . . . . . 4,200 4,410,000
Townsquare Media Inc., 6.50%, 04/01/23(Call 11/30/20)(a)(b) . . . . . . . . . . . . . . . . . . . . . . . . . . . . . . . . . . . . 1,413 1,314,090
Univision Communications Inc.5.13%, 02/15/25 (Call 11/10/20)(a). . . . . . . . . . . . . . . . . . . . . . 6,382 6,270,3156.63%, 06/01/27 (Call 06/01/23)(a) . . . . . . . . . . . . . . . . . . . . . 6,700 6,775,3759.50%, 05/01/25 (Call 05/01/22)(a) . . . . . . . . . . . . . . . . . . . . . 1,514 1,638,905
UPC Holding BV, 5.50%, 01/15/28 (Call 10/15/22)(a)(b) . . . . . 2,469 2,549,243Urban One Inc., 7.38%, 04/15/22 (Call 11/30/20)(a) . . . . . . . . 1,653 1,537,290ViacomCBS Inc.
5.88%, 02/28/57 (Call 02/28/22)(d) . . . . . . . . . . . . . . . . . . . . . 2,285 2,307,8506.25%, 02/28/57 (Call 02/28/27)(d) . . . . . . . . . . . . . . . . . . . . . 3,016 3,279,900
Videotron Ltd.5.00%, 07/15/22 . . . . . . . . . . . . . . . . . . . . . . . . . . . . . . . . . . . . . . 3,253 3,407,8435.13%, 04/15/27 (Call 04/15/22)(a)(b) . . . . . . . . . . . . . . . . . . . 3,424 3,620,8805.38%, 06/15/24 (Call 03/15/24)(a) . . . . . . . . . . . . . . . . . . . . . 2,278 2,477,325
Virgin Media Finance PLC, 5.00%, 07/15/30(Call 07/15/25)(a) . . . . . . . . . . . . . . . . . . . . . . . . . . . . . . . . . . . . . . 4,130 4,109,350
Virgin Media Secured Finance PLC4.50%, 08/15/30 (Call 08/15/25)(a)(b) . . . . . . . . . . . . . . . . . . . 2,750 2,794,6875.50%, 08/15/26 (Call 08/15/21)(a) . . . . . . . . . . . . . . . . . . . . . 3,374 3,510,1415.50%, 05/15/29 (Call 05/15/24)(a) . . . . . . . . . . . . . . . . . . . . . 6,096 6,513,027
Virgin Media Vendor Financing Notes IV DAC, 5.00%,07/15/28 (Call 07/15/23)(a) . . . . . . . . . . . . . . . . . . . . . . . . . . . . . 2,355 2,349,136
Ziggo Bond Co. BV5.13%, 02/28/30 (Call 02/15/25)(a)(b) . . . . . . . . . . . . . . . . . . . 2,020 2,075,5506.00%, 01/15/27 (Call 01/15/22)(a) . . . . . . . . . . . . . . . . . . . . . 2,914 3,023,275
Ziggo BV4.88%, 01/15/30 (Call 10/15/24)(a) . . . . . . . . . . . . . . . . . . . . . 2,950 3,058,7815.50%, 01/15/27 (Call 01/15/22)(a)(b) . . . . . . . . . . . . . . . . . . . 8,017 8,317,637
478,615,665
SecurityPar
(000) Value
Metal Fabricate & Hardware — 0.1%Advanced Drainage Systems Inc., 5.00%, 09/30/27
(Call 09/30/22)(a)(b) . . . . . . . . . . . . . . . . . . . . . . . . . . . . . . . . . . . . $ 1,437 $ 1,503,648Grinding Media Inc./Moly-Cop AltaSteel Ltd., 7.38%,
12/15/23 (Call 11/30/20)(a) . . . . . . . . . . . . . . . . . . . . . . . . . . . . . 4,141 4,182,410Hillman Group Inc. (The), 6.38%, 07/15/22
(Call 11/30/20)(a) . . . . . . . . . . . . . . . . . . . . . . . . . . . . . . . . . . . . . . 1,442 1,423,975Park-Ohio Industries Inc., 6.63%, 04/15/27 (Call 04/15/22) . 1,687 1,619,857
8,729,890Mining — 2.0%Alcoa Nederland Holding BV
5.50%, 12/15/27 (Call 06/15/23)(a) . . . . . . . . . . . . . . . . . . . . . 3,150 3,315,3756.13%, 05/15/28 (Call 05/15/23)(a)(b) . . . . . . . . . . . . . . . . . . . 2,479 2,661,3066.75%, 09/30/24 (Call 11/30/20)(a). . . . . . . . . . . . . . . . . . . . . . 3,142 3,240,1877.00%, 09/30/26 (Call 09/30/21)(a) . . . . . . . . . . . . . . . . . . . . . 2,171 2,282,307
Arconic Corp.6.00%, 05/15/25 (Call 05/15/22)(a) . . . . . . . . . . . . . . . . . . . . . 2,860 3,028,0256.13%, 02/15/28 (Call 02/15/23)(a) . . . . . . . . . . . . . . . . . . . . . 2,933 3,090,311
Compass Minerals International Inc.4.88%, 07/15/24 (Call 05/15/24)(a)(b) . . . . . . . . . . . . . . . . . . . 997 1,011,9556.75%, 12/01/27 (Call 12/01/22)(a)(b) . . . . . . . . . . . . . . . . . . . 2,240 2,429,773
Constellium SE5.63%, 06/15/28 (Call 06/15/23)(a)(b) . . . . . . . . . . . . . . . . . . . 1,495 1,557,7905.75%, 05/15/24 (Call 11/30/20)(a). . . . . . . . . . . . . . . . . . . . . . 1,777 1,799,5865.88%, 02/15/26 (Call 11/30/20)(a)(b). . . . . . . . . . . . . . . . . . . . 2,319 2,342,1906.63%, 03/01/25 (Call 11/30/20)(a)(b). . . . . . . . . . . . . . . . . . . . 2,809 2,851,135
Ferroglobe PLC/Globe Specialty Metals Inc., 9.38%,03/01/22 (Call 11/30/20)(a) . . . . . . . . . . . . . . . . . . . . . . . . . . . . . 843 547,950
FMG Resources August 2006 Pty Ltd.4.50%, 09/15/27 (Call 06/15/27)(a) . . . . . . . . . . . . . . . . . . . . . 2,904 3,109,9814.75%, 05/15/22 (Call 02/15/22)(a) . . . . . . . . . . . . . . . . . . . . . 3,189 3,263,3045.13%, 03/15/23 (Call 12/15/22)(a) . . . . . . . . . . . . . . . . . . . . . 2,095 2,186,6565.13%, 05/15/24 (Call 02/15/24)(a)(b) . . . . . . . . . . . . . . . . . . . 3,129 3,347,670
Freeport-McMoRan Inc.3.55%, 03/01/22 (Call 12/01/21) . . . . . . . . . . . . . . . . . . . . . . . 2,485 2,522,2753.88%, 03/15/23 (Call 12/15/22) . . . . . . . . . . . . . . . . . . . . . . . 7,239 7,477,8874.13%, 03/01/28 (Call 03/01/23) . . . . . . . . . . . . . . . . . . . . . . . 2,750 2,806,7194.25%, 03/01/30 (Call 03/01/25)(b) . . . . . . . . . . . . . . . . . . . . . 2,420 2,542,5004.38%, 08/01/28 (Call 08/01/23) . . . . . . . . . . . . . . . . . . . . . . . 2,980 3,110,3754.55%, 11/14/24 (Call 08/14/24). . . . . . . . . . . . . . . . . . . . . . . . 3,057 3,286,2754.63%, 08/01/30 (Call 08/01/25) . . . . . . . . . . . . . . . . . . . . . . . 3,010 3,213,1755.00%, 09/01/27 (Call 09/01/22)(b) . . . . . . . . . . . . . . . . . . . . . 2,656 2,769,4115.25%, 09/01/29 (Call 09/01/24)(b) . . . . . . . . . . . . . . . . . . . . . 2,922 3,155,7605.40%, 11/14/34 (Call 05/14/34). . . . . . . . . . . . . . . . . . . . . . . . 3,400 3,893,0005.45%, 03/15/43 (Call 09/15/42)(b) . . . . . . . . . . . . . . . . . . . . . 7,916 9,004,450
Hecla Mining Co., 7.25%, 02/15/28 (Call 02/15/23) . . . . . . . . 2,199 2,358,428Hudbay Minerals Inc.
6.13%, 04/01/29 (Call 04/01/24)(a)(b) . . . . . . . . . . . . . . . . . . . 2,665 2,724,9637.63%, 01/15/25 (Call 11/30/20)(a)(b). . . . . . . . . . . . . . . . . . . . 2,451 2,540,707
IAMGOLD Corp., 5.75%, 10/15/28 (Call 10/15/23)(a)(b) . . . . . 2,040 2,041,632Joseph T Ryerson & Son Inc., 8.50%, 08/01/28
(Call 08/01/23)(a)(b) . . . . . . . . . . . . . . . . . . . . . . . . . . . . . . . . . . . . 1,886 2,020,943JW Aluminum Continuous Cast Co., 10.25%, 06/01/26
(Call 06/01/21)(a)(b) . . . . . . . . . . . . . . . . . . . . . . . . . . . . . . . . . . . . 614 644,700Kaiser Aluminum Corp.
4.63%, 03/01/28 (Call 03/01/23)(a)(b) . . . . . . . . . . . . . . . . . . . 2,480 2,442,8006.50%, 05/01/25 (Call 05/01/22)(a)(b) . . . . . . . . . . . . . . . . . . . 1,205 1,277,300
Mountain Province Diamonds Inc., 8.00%, 12/15/22(Call 11/10/20)(a) . . . . . . . . . . . . . . . . . . . . . . . . . . . . . . . . . . . . . . 1,302 1,041,600
Schedule of Investments (continued)
October 31, 2020
iShares� Broad USD High Yield Corporate Bond ETF(Percentages shown are based on Net Assets)
40 2 0 2 0 I S H A R E S A N N U A L R E P O R T T O S H A R E H O L D E R S

SecurityPar
(000) Value
Mining (continued)New Gold Inc.
6.38%, 05/15/25 (Call 11/30/20)(a). . . . . . . . . . . . . . . . . . . . . . $ 1,570 $ 1,617,1007.50%, 07/15/27 (Call 07/15/23)(a)(b) . . . . . . . . . . . . . . . . . . . 1,832 1,979,476
Novelis Corp.4.75%, 01/30/30 (Call 01/30/25)(a) . . . . . . . . . . . . . . . . . . . . . 7,088 7,188,0475.88%, 09/30/26 (Call 09/30/21)(a) . . . . . . . . . . . . . . . . . . . . . 6,524 6,731,985
Perenti Finance Pty Ltd., 6.50%, 10/07/25(Call 10/07/22)(a) . . . . . . . . . . . . . . . . . . . . . . . . . . . . . . . . . . . . . . 1,250 1,300,038
Taseko Mines Ltd., 8.75%, 06/15/22 (Call 11/30/20)(a) . . . . . 960 924,000
122,681,047Office & Business Equipment — 0.5%CDW LLC/CDW Finance Corp.
3.25%, 02/15/29 (Call 02/15/23) . . . . . . . . . . . . . . . . . . . . . . . 2,955 2,951,3064.13%, 05/01/25 (Call 05/01/22) . . . . . . . . . . . . . . . . . . . . . . . 2,590 2,692,2534.25%, 04/01/28 (Call 10/01/22) . . . . . . . . . . . . . . . . . . . . . . . 2,817 2,909,4965.50%, 12/01/24 (Call 06/01/24) . . . . . . . . . . . . . . . . . . . . . . . 2,723 3,008,915
Pitney Bowes Inc.4.63%, 03/15/24 (Call 12/15/23)(b) . . . . . . . . . . . . . . . . . . . . . 1,346 1,308,9855.95%, 04/01/23 (Call 03/01/23) . . . . . . . . . . . . . . . . . . . . . . . 1,649 1,640,755
Xerox Corp.3.80%, 05/15/24(b) . . . . . . . . . . . . . . . . . . . . . . . . . . . . . . . . . . . . 1,466 1,507,7084.07%, 03/17/22(b) . . . . . . . . . . . . . . . . . . . . . . . . . . . . . . . . . . . . 964 984,7164.38%, 03/15/23 (Call 02/15/23) . . . . . . . . . . . . . . . . . . . . . . . 4,605 4,792,5394.80%, 03/01/35(b) . . . . . . . . . . . . . . . . . . . . . . . . . . . . . . . . . . . . 1,222 1,160,9006.75%, 12/15/39 . . . . . . . . . . . . . . . . . . . . . . . . . . . . . . . . . . . . . . 1,381 1,452,122
Xerox Holdings Corp.5.00%, 08/15/25 (Call 07/15/25)(a)(b) . . . . . . . . . . . . . . . . . . . 3,336 3,293,5995.50%, 08/15/28 (Call 07/15/28)(a)(b) . . . . . . . . . . . . . . . . . . . 3,285 3,242,952
30,946,246Oil & Gas — 7.4%Aker BP ASA, 5.88%, 03/31/25 (Call 03/31/21)(a) . . . . . . . . . . 2,596 2,679,688Antero Resources Corp.
5.00%, 03/01/25 (Call 11/30/20)(b). . . . . . . . . . . . . . . . . . . . . . 2,301 1,703,6035.13%, 12/01/22 (Call 11/30/20). . . . . . . . . . . . . . . . . . . . . . . . 2,771 2,565,9465.38%, 11/01/21 (Call 11/30/20)(b). . . . . . . . . . . . . . . . . . . . . . 2,204 2,208,4085.63%, 06/01/23 (Call 11/30/20)(b). . . . . . . . . . . . . . . . . . . . . . 3,192 2,681,280
Apache Corp.4.25%, 01/15/30 (Call 10/15/29) . . . . . . . . . . . . . . . . . . . . . . . 2,655 2,346,3564.25%, 01/15/44 (Call 07/15/43)(b) . . . . . . . . . . . . . . . . . . . . . 2,955 2,504,3624.38%, 10/15/28 (Call 07/15/28) . . . . . . . . . . . . . . . . . . . . . . . 4,417 4,039,3464.63%, 11/15/25 (Call 08/15/25). . . . . . . . . . . . . . . . . . . . . . . . 1,540 1,463,0004.75%, 04/15/43 (Call 10/15/42) . . . . . . . . . . . . . . . . . . . . . . . 5,341 4,726,7854.88%, 11/15/27 (Call 05/15/27)(b). . . . . . . . . . . . . . . . . . . . . . 2,175 2,041,2385.10%, 09/01/40 (Call 03/01/40)(b) . . . . . . . . . . . . . . . . . . . . . 5,779 5,305,2095.25%, 02/01/42 (Call 08/01/41) . . . . . . . . . . . . . . . . . . . . . . . 2,425 2,218,8755.35%, 07/01/49 (Call 01/01/49) . . . . . . . . . . . . . . . . . . . . . . . 1,672 1,454,6406.00%, 01/15/37 . . . . . . . . . . . . . . . . . . . . . . . . . . . . . . . . . . . . . . 1,650 1,559,250
Ascent Resources Utica Holdings LLC/ARU Finance Corp.7.00%, 11/01/26 (Call 11/01/21)(a). . . . . . . . . . . . . . . . . . . . . . 2,663 2,356,7559.00%, 11/01/27 (Call 11/01/26)(a). . . . . . . . . . . . . . . . . . . . . . 1,339 1,298,830
Athabasca Oil Corp., 9.88%, 02/24/22 (Call 11/30/20)(a) . . . 861 290,588Baytex Energy Corp.
5.63%, 06/01/24 (Call 11/30/20)(a). . . . . . . . . . . . . . . . . . . . . . 1,509 833,7238.75%, 04/01/27 (Call 04/01/23)(a) . . . . . . . . . . . . . . . . . . . . . 2,025 891,000
Berry Petroleum Co. LLC, 7.00%, 02/15/26(Call 02/15/21)(a) . . . . . . . . . . . . . . . . . . . . . . . . . . . . . . . . . . . . . . 1,749 1,191,226
Callon Petroleum Co.6.13%, 10/01/24 (Call 11/30/20). . . . . . . . . . . . . . . . . . . . . . . . 1,884 678,2406.25%, 04/15/23 (Call 11/30/20). . . . . . . . . . . . . . . . . . . . . . . . 2,279 888,810
SecurityPar
(000) Value
Oil & Gas (continued)6.38%, 07/01/26 (Call 07/01/21) . . . . . . . . . . . . . . . . . . . . . . . $ 1,329 $ 318,9608.25%, 07/15/25 (Call 11/30/20). . . . . . . . . . . . . . . . . . . . . . . . 755 207,625
Calumet Specialty Products Partners LP/CalumetFinance Corp.7.63%, 01/15/22 (Call 11/30/20). . . . . . . . . . . . . . . . . . . . . . . . 448 443,5207.75%, 04/15/23 (Call 11/30/20)(b). . . . . . . . . . . . . . . . . . . . . . 1,579 1,515,84011.00%, 04/15/25 (Call 10/15/21)(a)(b) . . . . . . . . . . . . . . . . . . 2,168 2,097,995
Cenovus Energy Inc.3.00%, 08/15/22 (Call 05/15/22) . . . . . . . . . . . . . . . . . . . . . . . 2,428 2,404,7873.80%, 09/15/23 (Call 06/15/23) . . . . . . . . . . . . . . . . . . . . . . . 2,247 2,282,4194.25%, 04/15/27 (Call 01/15/27) . . . . . . . . . . . . . . . . . . . . . . . 4,355 4,433,6515.25%, 06/15/37 (Call 12/15/36) . . . . . . . . . . . . . . . . . . . . . . . 3,068 3,001,9385.38%, 07/15/25 (Call 04/15/25)(b) . . . . . . . . . . . . . . . . . . . . . 4,247 4,477,8965.40%, 06/15/47 (Call 12/15/46)(b) . . . . . . . . . . . . . . . . . . . . . 3,486 3,439,3696.75%, 11/15/39 . . . . . . . . . . . . . . . . . . . . . . . . . . . . . . . . . . . . . . 5,654 6,286,769
Centennial Resource Production LLC5.38%, 01/15/26 (Call 01/15/21)(a)(b) . . . . . . . . . . . . . . . . . . . 1,155 424,4636.88%, 04/01/27 (Call 04/01/22)(a)(b) . . . . . . . . . . . . . . . . . . . 1,388 510,090
Citgo Holding Inc., 9.25%, 08/01/24 (Call 08/01/21)(a). . . . . . 5,910 4,949,625CITGO Petroleum Corp.
6.25%, 08/15/22 (Call 11/30/20)(a). . . . . . . . . . . . . . . . . . . . . . 2,484 2,390,8507.00%, 06/15/25 (Call 06/15/22)(a) . . . . . . . . . . . . . . . . . . . . . 5,035 4,661,529
CNX Resources Corp., 7.25%, 03/14/27 (Call 03/14/22)(a) . 3,174 3,348,570Comstock Resources Inc.
7.50%, 05/15/25 (Call 11/30/20)(a). . . . . . . . . . . . . . . . . . . . . . 3,061 3,038,6559.75%, 08/15/26 (Call 08/15/21) . . . . . . . . . . . . . . . . . . . . . . . 6,724 7,084,460
Continental Resources Inc./OK3.80%, 06/01/24 (Call 03/01/24) . . . . . . . . . . . . . . . . . . . . . . . 4,307 4,010,8944.38%, 01/15/28 (Call 10/15/27)(b) . . . . . . . . . . . . . . . . . . . . . 4,590 4,131,0004.50%, 04/15/23 (Call 01/15/23) . . . . . . . . . . . . . . . . . . . . . . . 7,050 6,702,3644.90%, 06/01/44 (Call 12/01/43) . . . . . . . . . . . . . . . . . . . . . . . 3,000 2,479,6505.00%, 09/15/22 (Call 11/30/20). . . . . . . . . . . . . . . . . . . . . . . . 3,766 3,709,510
CrownRock LP/CrownRock Finance Inc., 5.63%, 10/15/25(Call 11/30/20)(a) . . . . . . . . . . . . . . . . . . . . . . . . . . . . . . . . . . . . . . 5,297 5,208,964
CVR Energy Inc.5.25%, 02/15/25 (Call 02/15/22)(a) . . . . . . . . . . . . . . . . . . . . . 2,622 1,907,5055.75%, 02/15/28 (Call 02/15/23)(a) . . . . . . . . . . . . . . . . . . . . . 1,790 1,221,675
Endeavor Energy Resources LP/EER Finance Inc.5.50%, 01/30/26 (Call 01/30/21)(a) . . . . . . . . . . . . . . . . . . . . . 2,648 2,661,2405.75%, 01/30/28 (Call 01/30/23)(a)(b) . . . . . . . . . . . . . . . . . . . 4,366 4,529,7256.63%, 07/15/25 (Call 07/15/22)(a) . . . . . . . . . . . . . . . . . . . . . 2,308 2,394,550
Energy Ventures Gom LLC/EnVen Finance Corp., 11.00%,02/15/23 (Call 11/30/20)(a) . . . . . . . . . . . . . . . . . . . . . . . . . . . . . 950 700,625
Ensign Drilling Inc., 9.25%, 04/15/24 (Call 04/15/21)(a) . . . . . 2,289 789,705EQT Corp.
3.00%, 10/01/22 (Call 09/01/22)(b) . . . . . . . . . . . . . . . . . . . . . 3,405 3,399,6373.90%, 10/01/27 (Call 07/01/27) . . . . . . . . . . . . . . . . . . . . . . . 5,550 5,329,7765.00%, 01/15/29 . . . . . . . . . . . . . . . . . . . . . . . . . . . . . . . . . . . . . . 990 990,0007.88%, 02/01/25 (Call 01/01/25) . . . . . . . . . . . . . . . . . . . . . . . 4,400 4,895,0008.75%, 02/01/30 (Call 11/01/29). . . . . . . . . . . . . . . . . . . . . . . . 3,095 3,845,537
Global Marine Inc., 7.00%, 06/01/28 . . . . . . . . . . . . . . . . . . . . . . 972 191,970Gran Tierra Energy Inc., 7.75%, 05/23/27
(Call 05/23/23)(a)(b) . . . . . . . . . . . . . . . . . . . . . . . . . . . . . . . . . . . . 1,054 337,291Gran Tierra Energy International Holdings Ltd., 6.25%,
02/15/25 (Call 02/15/22)(a)(b) . . . . . . . . . . . . . . . . . . . . . . . . . . . 1,024 353,280Great Western Petroleum LLC/Great Western Finance
Corp., 9.00%, 09/30/21 (Call 11/30/20)(a) . . . . . . . . . . . . . . . 1,004 552,200Gulfport Energy Corp.
6.00%, 10/15/24 (Call 11/30/20). . . . . . . . . . . . . . . . . . . . . . . . 2,267 1,235,5156.38%, 05/15/25 (Call 11/30/20). . . . . . . . . . . . . . . . . . . . . . . . 1,331 738,705
Schedule of Investments (continued)
October 31, 2020
iShares� Broad USD High Yield Corporate Bond ETF(Percentages shown are based on Net Assets)
S C H E D U L E O F I N V E S T M E N T S 41
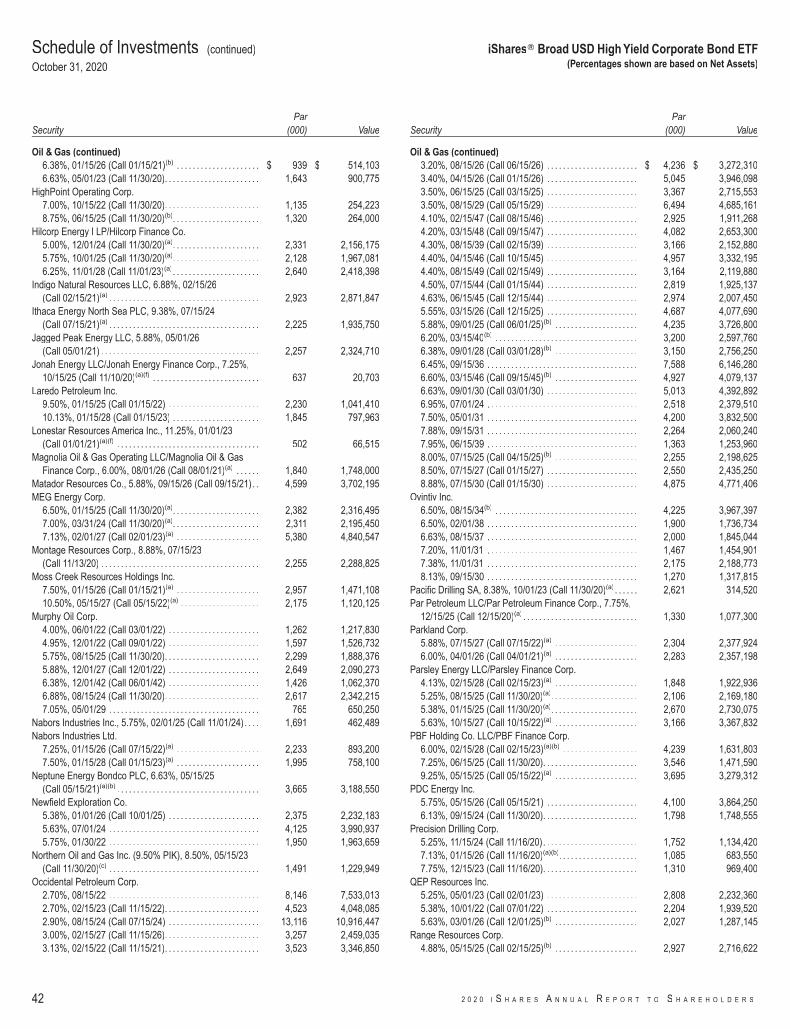
SecurityPar
(000) Value
Oil & Gas (continued)6.38%, 01/15/26 (Call 01/15/21)(b) . . . . . . . . . . . . . . . . . . . . . $ 939 $ 514,1036.63%, 05/01/23 (Call 11/30/20). . . . . . . . . . . . . . . . . . . . . . . . 1,643 900,775
HighPoint Operating Corp.7.00%, 10/15/22 (Call 11/30/20). . . . . . . . . . . . . . . . . . . . . . . . 1,135 254,2238.75%, 06/15/25 (Call 11/30/20)(b). . . . . . . . . . . . . . . . . . . . . . 1,320 264,000
Hilcorp Energy I LP/Hilcorp Finance Co.5.00%, 12/01/24 (Call 11/30/20)(a). . . . . . . . . . . . . . . . . . . . . . 2,331 2,156,1755.75%, 10/01/25 (Call 11/30/20)(a). . . . . . . . . . . . . . . . . . . . . . 2,128 1,967,0816.25%, 11/01/28 (Call 11/01/23)(a). . . . . . . . . . . . . . . . . . . . . . 2,640 2,418,398
Indigo Natural Resources LLC, 6.88%, 02/15/26(Call 02/15/21)(a) . . . . . . . . . . . . . . . . . . . . . . . . . . . . . . . . . . . . . . 2,923 2,871,847
Ithaca Energy North Sea PLC, 9.38%, 07/15/24(Call 07/15/21)(a) . . . . . . . . . . . . . . . . . . . . . . . . . . . . . . . . . . . . . . 2,225 1,935,750
Jagged Peak Energy LLC, 5.88%, 05/01/26(Call 05/01/21) . . . . . . . . . . . . . . . . . . . . . . . . . . . . . . . . . . . . . . . . 2,257 2,324,710
Jonah Energy LLC/Jonah Energy Finance Corp., 7.25%,10/15/25 (Call 11/10/20)(a)(f) . . . . . . . . . . . . . . . . . . . . . . . . . . . 637 20,703
Laredo Petroleum Inc.9.50%, 01/15/25 (Call 01/15/22) . . . . . . . . . . . . . . . . . . . . . . . 2,230 1,041,41010.13%, 01/15/28 (Call 01/15/23) . . . . . . . . . . . . . . . . . . . . . . 1,845 797,963
Lonestar Resources America Inc., 11.25%, 01/01/23(Call 01/01/21)(a)(f) . . . . . . . . . . . . . . . . . . . . . . . . . . . . . . . . . . . . 502 66,515
Magnolia Oil & Gas Operating LLC/Magnolia Oil & GasFinance Corp., 6.00%, 08/01/26 (Call 08/01/21)(a) . . . . . . 1,840 1,748,000
Matador Resources Co., 5.88%, 09/15/26 (Call 09/15/21). . 4,599 3,702,195MEG Energy Corp.
6.50%, 01/15/25 (Call 11/30/20)(a). . . . . . . . . . . . . . . . . . . . . . 2,382 2,316,4957.00%, 03/31/24 (Call 11/30/20)(a). . . . . . . . . . . . . . . . . . . . . . 2,311 2,195,4507.13%, 02/01/27 (Call 02/01/23)(a) . . . . . . . . . . . . . . . . . . . . . 5,380 4,840,547
Montage Resources Corp., 8.88%, 07/15/23(Call 11/13/20) . . . . . . . . . . . . . . . . . . . . . . . . . . . . . . . . . . . . . . . . 2,255 2,288,825
Moss Creek Resources Holdings Inc.7.50%, 01/15/26 (Call 01/15/21)(a) . . . . . . . . . . . . . . . . . . . . . 2,957 1,471,10810.50%, 05/15/27 (Call 05/15/22)(a) . . . . . . . . . . . . . . . . . . . . 2,175 1,120,125
Murphy Oil Corp.4.00%, 06/01/22 (Call 03/01/22) . . . . . . . . . . . . . . . . . . . . . . . 1,262 1,217,8304.95%, 12/01/22 (Call 09/01/22) . . . . . . . . . . . . . . . . . . . . . . . 1,597 1,526,7325.75%, 08/15/25 (Call 11/30/20). . . . . . . . . . . . . . . . . . . . . . . . 2,299 1,888,3765.88%, 12/01/27 (Call 12/01/22) . . . . . . . . . . . . . . . . . . . . . . . 2,649 2,090,2736.38%, 12/01/42 (Call 06/01/42) . . . . . . . . . . . . . . . . . . . . . . . 1,426 1,062,3706.88%, 08/15/24 (Call 11/30/20). . . . . . . . . . . . . . . . . . . . . . . . 2,617 2,342,2157.05%, 05/01/29 . . . . . . . . . . . . . . . . . . . . . . . . . . . . . . . . . . . . . . 765 650,250
Nabors Industries Inc., 5.75%, 02/01/25 (Call 11/01/24). . . . 1,691 462,489Nabors Industries Ltd.
7.25%, 01/15/26 (Call 07/15/22)(a) . . . . . . . . . . . . . . . . . . . . . 2,233 893,2007.50%, 01/15/28 (Call 01/15/23)(a) . . . . . . . . . . . . . . . . . . . . . 1,995 758,100
Neptune Energy Bondco PLC, 6.63%, 05/15/25(Call 05/15/21)(a)(b) . . . . . . . . . . . . . . . . . . . . . . . . . . . . . . . . . . . . 3,665 3,188,550
Newfield Exploration Co.5.38%, 01/01/26 (Call 10/01/25) . . . . . . . . . . . . . . . . . . . . . . . 2,375 2,232,1835.63%, 07/01/24 . . . . . . . . . . . . . . . . . . . . . . . . . . . . . . . . . . . . . . 4,125 3,990,9375.75%, 01/30/22 . . . . . . . . . . . . . . . . . . . . . . . . . . . . . . . . . . . . . . 1,950 1,963,659
Northern Oil and Gas Inc. (9.50% PIK), 8.50%, 05/15/23(Call 11/30/20)(c) . . . . . . . . . . . . . . . . . . . . . . . . . . . . . . . . . . . . . . 1,491 1,229,949
Occidental Petroleum Corp.2.70%, 08/15/22 . . . . . . . . . . . . . . . . . . . . . . . . . . . . . . . . . . . . . . 8,146 7,533,0132.70%, 02/15/23 (Call 11/15/22). . . . . . . . . . . . . . . . . . . . . . . . 4,523 4,048,0852.90%, 08/15/24 (Call 07/15/24) . . . . . . . . . . . . . . . . . . . . . . . 13,116 10,916,4473.00%, 02/15/27 (Call 11/15/26). . . . . . . . . . . . . . . . . . . . . . . . 3,257 2,459,0353.13%, 02/15/22 (Call 11/15/21). . . . . . . . . . . . . . . . . . . . . . . . 3,523 3,346,850
SecurityPar
(000) Value
Oil & Gas (continued)3.20%, 08/15/26 (Call 06/15/26) . . . . . . . . . . . . . . . . . . . . . . . $ 4,236 $ 3,272,3103.40%, 04/15/26 (Call 01/15/26) . . . . . . . . . . . . . . . . . . . . . . . 5,045 3,946,0983.50%, 06/15/25 (Call 03/15/25) . . . . . . . . . . . . . . . . . . . . . . . 3,367 2,715,5533.50%, 08/15/29 (Call 05/15/29) . . . . . . . . . . . . . . . . . . . . . . . 6,494 4,685,1614.10%, 02/15/47 (Call 08/15/46) . . . . . . . . . . . . . . . . . . . . . . . 2,925 1,911,2684.20%, 03/15/48 (Call 09/15/47) . . . . . . . . . . . . . . . . . . . . . . . 4,082 2,653,3004.30%, 08/15/39 (Call 02/15/39) . . . . . . . . . . . . . . . . . . . . . . . 3,166 2,152,8804.40%, 04/15/46 (Call 10/15/45) . . . . . . . . . . . . . . . . . . . . . . . 4,957 3,332,1954.40%, 08/15/49 (Call 02/15/49) . . . . . . . . . . . . . . . . . . . . . . . 3,164 2,119,8804.50%, 07/15/44 (Call 01/15/44) . . . . . . . . . . . . . . . . . . . . . . . 2,819 1,925,1374.63%, 06/15/45 (Call 12/15/44) . . . . . . . . . . . . . . . . . . . . . . . 2,974 2,007,4505.55%, 03/15/26 (Call 12/15/25) . . . . . . . . . . . . . . . . . . . . . . . 4,687 4,077,6905.88%, 09/01/25 (Call 06/01/25)(b) . . . . . . . . . . . . . . . . . . . . . 4,235 3,726,8006.20%, 03/15/40(b) . . . . . . . . . . . . . . . . . . . . . . . . . . . . . . . . . . . . 3,200 2,597,7606.38%, 09/01/28 (Call 03/01/28)(b) . . . . . . . . . . . . . . . . . . . . . 3,150 2,756,2506.45%, 09/15/36 . . . . . . . . . . . . . . . . . . . . . . . . . . . . . . . . . . . . . . 7,588 6,146,2806.60%, 03/15/46 (Call 09/15/45)(b) . . . . . . . . . . . . . . . . . . . . . 4,927 4,079,1376.63%, 09/01/30 (Call 03/01/30) . . . . . . . . . . . . . . . . . . . . . . . 5,013 4,392,8926.95%, 07/01/24 . . . . . . . . . . . . . . . . . . . . . . . . . . . . . . . . . . . . . . 2,518 2,379,5107.50%, 05/01/31 . . . . . . . . . . . . . . . . . . . . . . . . . . . . . . . . . . . . . . 4,200 3,832,5007.88%, 09/15/31 . . . . . . . . . . . . . . . . . . . . . . . . . . . . . . . . . . . . . . 2,264 2,060,2407.95%, 06/15/39 . . . . . . . . . . . . . . . . . . . . . . . . . . . . . . . . . . . . . . 1,363 1,253,9608.00%, 07/15/25 (Call 04/15/25)(b) . . . . . . . . . . . . . . . . . . . . . 2,255 2,198,6258.50%, 07/15/27 (Call 01/15/27) . . . . . . . . . . . . . . . . . . . . . . . 2,550 2,435,2508.88%, 07/15/30 (Call 01/15/30) . . . . . . . . . . . . . . . . . . . . . . . 4,875 4,771,406
Ovintiv Inc.6.50%, 08/15/34(b) . . . . . . . . . . . . . . . . . . . . . . . . . . . . . . . . . . . . 4,225 3,967,3976.50%, 02/01/38 . . . . . . . . . . . . . . . . . . . . . . . . . . . . . . . . . . . . . . 1,900 1,736,7346.63%, 08/15/37 . . . . . . . . . . . . . . . . . . . . . . . . . . . . . . . . . . . . . . 2,000 1,845,0447.20%, 11/01/31 . . . . . . . . . . . . . . . . . . . . . . . . . . . . . . . . . . . . . . 1,467 1,454,9017.38%, 11/01/31 . . . . . . . . . . . . . . . . . . . . . . . . . . . . . . . . . . . . . . 2,175 2,188,7738.13%, 09/15/30 . . . . . . . . . . . . . . . . . . . . . . . . . . . . . . . . . . . . . . 1,270 1,317,815
Pacific Drilling SA, 8.38%, 10/01/23 (Call 11/30/20)(a) . . . . . . 2,621 314,520Par Petroleum LLC/Par Petroleum Finance Corp., 7.75%,
12/15/25 (Call 12/15/20)(a) . . . . . . . . . . . . . . . . . . . . . . . . . . . . . 1,330 1,077,300Parkland Corp.
5.88%, 07/15/27 (Call 07/15/22)(a) . . . . . . . . . . . . . . . . . . . . . 2,304 2,377,9246.00%, 04/01/26 (Call 04/01/21)(a) . . . . . . . . . . . . . . . . . . . . . 2,283 2,357,198
Parsley Energy LLC/Parsley Finance Corp.4.13%, 02/15/28 (Call 02/15/23)(a) . . . . . . . . . . . . . . . . . . . . . 1,848 1,922,9365.25%, 08/15/25 (Call 11/30/20)(a). . . . . . . . . . . . . . . . . . . . . . 2,106 2,169,1805.38%, 01/15/25 (Call 11/30/20)(a). . . . . . . . . . . . . . . . . . . . . . 2,670 2,730,0755.63%, 10/15/27 (Call 10/15/22)(a) . . . . . . . . . . . . . . . . . . . . . 3,166 3,367,832
PBF Holding Co. LLC/PBF Finance Corp.6.00%, 02/15/28 (Call 02/15/23)(a)(b) . . . . . . . . . . . . . . . . . . . 4,239 1,631,8037.25%, 06/15/25 (Call 11/30/20). . . . . . . . . . . . . . . . . . . . . . . . 3,546 1,471,5909.25%, 05/15/25 (Call 05/15/22)(a) . . . . . . . . . . . . . . . . . . . . . 3,695 3,279,312
PDC Energy Inc.5.75%, 05/15/26 (Call 05/15/21) . . . . . . . . . . . . . . . . . . . . . . . 4,100 3,864,2506.13%, 09/15/24 (Call 11/30/20). . . . . . . . . . . . . . . . . . . . . . . . 1,798 1,748,555
Precision Drilling Corp.5.25%, 11/15/24 (Call 11/16/20). . . . . . . . . . . . . . . . . . . . . . . . 1,752 1,134,4207.13%, 01/15/26 (Call 11/16/20)(a)(b). . . . . . . . . . . . . . . . . . . . 1,085 683,5507.75%, 12/15/23 (Call 11/16/20). . . . . . . . . . . . . . . . . . . . . . . . 1,310 969,400
QEP Resources Inc.5.25%, 05/01/23 (Call 02/01/23) . . . . . . . . . . . . . . . . . . . . . . . 2,808 2,232,3605.38%, 10/01/22 (Call 07/01/22) . . . . . . . . . . . . . . . . . . . . . . . 2,204 1,939,5205.63%, 03/01/26 (Call 12/01/25)(b) . . . . . . . . . . . . . . . . . . . . . 2,027 1,287,145
Range Resources Corp.4.88%, 05/15/25 (Call 02/15/25)(b) . . . . . . . . . . . . . . . . . . . . . 2,927 2,716,622
Schedule of Investments (continued)
October 31, 2020
iShares� Broad USD High Yield Corporate Bond ETF(Percentages shown are based on Net Assets)
42 2 0 2 0 I S H A R E S A N N U A L R E P O R T T O S H A R E H O L D E R S
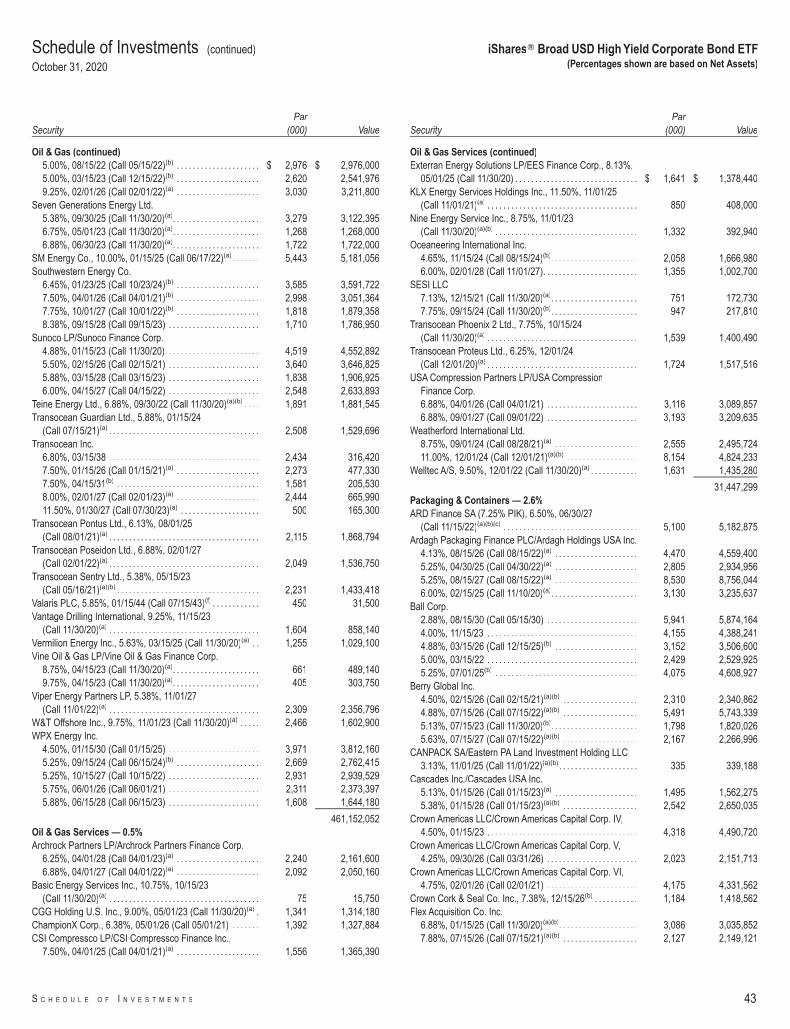
SecurityPar
(000) Value
Oil & Gas (continued)5.00%, 08/15/22 (Call 05/15/22)(b) . . . . . . . . . . . . . . . . . . . . . $ 2,976 $ 2,976,0005.00%, 03/15/23 (Call 12/15/22)(b) . . . . . . . . . . . . . . . . . . . . . 2,620 2,541,9769.25%, 02/01/26 (Call 02/01/22)(a) . . . . . . . . . . . . . . . . . . . . . 3,030 3,211,800
Seven Generations Energy Ltd.5.38%, 09/30/25 (Call 11/30/20)(a). . . . . . . . . . . . . . . . . . . . . . 3,279 3,122,3956.75%, 05/01/23 (Call 11/30/20)(a). . . . . . . . . . . . . . . . . . . . . . 1,268 1,268,0006.88%, 06/30/23 (Call 11/30/20)(a). . . . . . . . . . . . . . . . . . . . . . 1,722 1,722,000
SM Energy Co., 10.00%, 01/15/25 (Call 06/17/22)(a) . . . . . . . 5,443 5,181,056Southwestern Energy Co.
6.45%, 01/23/25 (Call 10/23/24)(b) . . . . . . . . . . . . . . . . . . . . . 3,585 3,591,7227.50%, 04/01/26 (Call 04/01/21)(b) . . . . . . . . . . . . . . . . . . . . . 2,998 3,051,3647.75%, 10/01/27 (Call 10/01/22)(b) . . . . . . . . . . . . . . . . . . . . . 1,818 1,879,3588.38%, 09/15/28 (Call 09/15/23) . . . . . . . . . . . . . . . . . . . . . . . 1,710 1,786,950
Sunoco LP/Sunoco Finance Corp.4.88%, 01/15/23 (Call 11/30/20). . . . . . . . . . . . . . . . . . . . . . . . 4,519 4,552,8925.50%, 02/15/26 (Call 02/15/21) . . . . . . . . . . . . . . . . . . . . . . . 3,640 3,646,8255.88%, 03/15/28 (Call 03/15/23) . . . . . . . . . . . . . . . . . . . . . . . 1,838 1,906,9256.00%, 04/15/27 (Call 04/15/22) . . . . . . . . . . . . . . . . . . . . . . . 2,548 2,633,893
Teine Energy Ltd., 6.88%, 09/30/22 (Call 11/30/20)(a)(b) . . . . 1,891 1,881,545Transocean Guardian Ltd., 5.88%, 01/15/24
(Call 07/15/21)(a) . . . . . . . . . . . . . . . . . . . . . . . . . . . . . . . . . . . . . . 2,508 1,529,696Transocean Inc.
6.80%, 03/15/38 . . . . . . . . . . . . . . . . . . . . . . . . . . . . . . . . . . . . . . 2,434 316,4207.50%, 01/15/26 (Call 01/15/21)(a) . . . . . . . . . . . . . . . . . . . . . 2,273 477,3307.50%, 04/15/31(b) . . . . . . . . . . . . . . . . . . . . . . . . . . . . . . . . . . . . 1,581 205,5308.00%, 02/01/27 (Call 02/01/23)(a) . . . . . . . . . . . . . . . . . . . . . 2,444 665,99011.50%, 01/30/27 (Call 07/30/23)(a) . . . . . . . . . . . . . . . . . . . . 500 165,300
Transocean Pontus Ltd., 6.13%, 08/01/25(Call 08/01/21)(a) . . . . . . . . . . . . . . . . . . . . . . . . . . . . . . . . . . . . . . 2,115 1,868,794
Transocean Poseidon Ltd., 6.88%, 02/01/27(Call 02/01/22)(a) . . . . . . . . . . . . . . . . . . . . . . . . . . . . . . . . . . . . . . 2,049 1,536,750
Transocean Sentry Ltd., 5.38%, 05/15/23(Call 05/16/21)(a)(b) . . . . . . . . . . . . . . . . . . . . . . . . . . . . . . . . . . . . 2,231 1,433,418
Valaris PLC, 5.85%, 01/15/44 (Call 07/15/43)(f) . . . . . . . . . . . . 450 31,500Vantage Drilling International, 9.25%, 11/15/23
(Call 11/30/20)(a) . . . . . . . . . . . . . . . . . . . . . . . . . . . . . . . . . . . . . . 1,604 858,140Vermilion Energy Inc., 5.63%, 03/15/25 (Call 11/30/20)(a) . . 1,255 1,029,100Vine Oil & Gas LP/Vine Oil & Gas Finance Corp.
8.75%, 04/15/23 (Call 11/30/20)(a). . . . . . . . . . . . . . . . . . . . . . 661 489,1409.75%, 04/15/23 (Call 11/30/20)(a). . . . . . . . . . . . . . . . . . . . . . 405 303,750
Viper Energy Partners LP, 5.38%, 11/01/27(Call 11/01/22)(a) . . . . . . . . . . . . . . . . . . . . . . . . . . . . . . . . . . . . . . 2,309 2,356,796
W&T Offshore Inc., 9.75%, 11/01/23 (Call 11/30/20)(a) . . . . . 2,466 1,602,900WPX Energy Inc.
4.50%, 01/15/30 (Call 01/15/25) . . . . . . . . . . . . . . . . . . . . . . . 3,971 3,812,1605.25%, 09/15/24 (Call 06/15/24)(b) . . . . . . . . . . . . . . . . . . . . . 2,669 2,762,4155.25%, 10/15/27 (Call 10/15/22) . . . . . . . . . . . . . . . . . . . . . . . 2,931 2,939,5295.75%, 06/01/26 (Call 06/01/21) . . . . . . . . . . . . . . . . . . . . . . . 2,311 2,373,3975.88%, 06/15/28 (Call 06/15/23) . . . . . . . . . . . . . . . . . . . . . . . 1,608 1,644,180
461,152,052Oil & Gas Services — 0.5%Archrock Partners LP/Archrock Partners Finance Corp.
6.25%, 04/01/28 (Call 04/01/23)(a) . . . . . . . . . . . . . . . . . . . . . 2,240 2,161,6006.88%, 04/01/27 (Call 04/01/22)(a) . . . . . . . . . . . . . . . . . . . . . 2,092 2,050,160
Basic Energy Services Inc., 10.75%, 10/15/23(Call 11/30/20)(a) . . . . . . . . . . . . . . . . . . . . . . . . . . . . . . . . . . . . . . 75 15,750
CGG Holding U.S. Inc., 9.00%, 05/01/23 (Call 11/30/20)(a) . 1,341 1,314,180ChampionX Corp., 6.38%, 05/01/26 (Call 05/01/21) . . . . . . . 1,392 1,327,884CSI Compressco LP/CSI Compressco Finance Inc.,
7.50%, 04/01/25 (Call 04/01/21)(a) . . . . . . . . . . . . . . . . . . . . . 1,556 1,365,390
SecurityPar
(000) Value
Oil & Gas Services (continued)Exterran Energy Solutions LP/EES Finance Corp., 8.13%,
05/01/25 (Call 11/30/20) . . . . . . . . . . . . . . . . . . . . . . . . . . . . . . . $ 1,641 $ 1,378,440KLX Energy Services Holdings Inc., 11.50%, 11/01/25
(Call 11/01/21)(a) . . . . . . . . . . . . . . . . . . . . . . . . . . . . . . . . . . . . . . 850 408,000Nine Energy Service Inc., 8.75%, 11/01/23
(Call 11/30/20)(a)(b) . . . . . . . . . . . . . . . . . . . . . . . . . . . . . . . . . . . . 1,332 392,940Oceaneering International Inc.
4.65%, 11/15/24 (Call 08/15/24)(b). . . . . . . . . . . . . . . . . . . . . . 2,058 1,666,9806.00%, 02/01/28 (Call 11/01/27). . . . . . . . . . . . . . . . . . . . . . . . 1,355 1,002,700
SESI LLC7.13%, 12/15/21 (Call 11/30/20)(a). . . . . . . . . . . . . . . . . . . . . . 751 172,7307.75%, 09/15/24 (Call 11/30/20)(b). . . . . . . . . . . . . . . . . . . . . . 947 217,810
Transocean Phoenix 2 Ltd., 7.75%, 10/15/24(Call 11/30/20)(a) . . . . . . . . . . . . . . . . . . . . . . . . . . . . . . . . . . . . . . 1,539 1,400,490
Transocean Proteus Ltd., 6.25%, 12/01/24(Call 12/01/20)(a) . . . . . . . . . . . . . . . . . . . . . . . . . . . . . . . . . . . . . . 1,724 1,517,516
USA Compression Partners LP/USA CompressionFinance Corp.6.88%, 04/01/26 (Call 04/01/21) . . . . . . . . . . . . . . . . . . . . . . . 3,116 3,089,8576.88%, 09/01/27 (Call 09/01/22) . . . . . . . . . . . . . . . . . . . . . . . 3,193 3,209,635
Weatherford International Ltd.8.75%, 09/01/24 (Call 08/28/21)(a) . . . . . . . . . . . . . . . . . . . . . 2,555 2,495,72411.00%, 12/01/24 (Call 12/01/21)(a)(b) . . . . . . . . . . . . . . . . . . 8,154 4,824,233
Welltec A/S, 9.50%, 12/01/22 (Call 11/30/20)(a) . . . . . . . . . . . . 1,631 1,435,280
31,447,299Packaging & Containers — 2.6%ARD Finance SA (7.25% PIK), 6.50%, 06/30/27
(Call 11/15/22)(a)(b)(c) . . . . . . . . . . . . . . . . . . . . . . . . . . . . . . . . . . 5,100 5,182,875Ardagh Packaging Finance PLC/Ardagh Holdings USA Inc.
4.13%, 08/15/26 (Call 08/15/22)(a) . . . . . . . . . . . . . . . . . . . . . 4,470 4,559,4005.25%, 04/30/25 (Call 04/30/22)(a) . . . . . . . . . . . . . . . . . . . . . 2,805 2,934,9565.25%, 08/15/27 (Call 08/15/22)(a) . . . . . . . . . . . . . . . . . . . . . 8,530 8,756,0446.00%, 02/15/25 (Call 11/10/20)(a). . . . . . . . . . . . . . . . . . . . . . 3,130 3,235,637
Ball Corp.2.88%, 08/15/30 (Call 05/15/30) . . . . . . . . . . . . . . . . . . . . . . . 5,941 5,874,1644.00%, 11/15/23 . . . . . . . . . . . . . . . . . . . . . . . . . . . . . . . . . . . . . . 4,155 4,388,2414.88%, 03/15/26 (Call 12/15/25)(b) . . . . . . . . . . . . . . . . . . . . . 3,152 3,506,6005.00%, 03/15/22 . . . . . . . . . . . . . . . . . . . . . . . . . . . . . . . . . . . . . . 2,429 2,529,9255.25%, 07/01/25(b) . . . . . . . . . . . . . . . . . . . . . . . . . . . . . . . . . . . . 4,075 4,608,927
Berry Global Inc.4.50%, 02/15/26 (Call 02/15/21)(a)(b) . . . . . . . . . . . . . . . . . . . 2,310 2,340,8624.88%, 07/15/26 (Call 07/15/22)(a)(b) . . . . . . . . . . . . . . . . . . . 5,491 5,743,3395.13%, 07/15/23 (Call 11/30/20)(b). . . . . . . . . . . . . . . . . . . . . . 1,798 1,820,0265.63%, 07/15/27 (Call 07/15/22)(a)(b) . . . . . . . . . . . . . . . . . . . 2,167 2,266,996
CANPACK SA/Eastern PA Land Investment Holding LLC,3.13%, 11/01/25 (Call 11/01/22)(a)(b). . . . . . . . . . . . . . . . . . . . 335 339,188
Cascades Inc./Cascades USA Inc.5.13%, 01/15/26 (Call 01/15/23)(a) . . . . . . . . . . . . . . . . . . . . . 1,495 1,562,2755.38%, 01/15/28 (Call 01/15/23)(a)(b) . . . . . . . . . . . . . . . . . . . 2,542 2,650,035
Crown Americas LLC/Crown Americas Capital Corp. IV,4.50%, 01/15/23 . . . . . . . . . . . . . . . . . . . . . . . . . . . . . . . . . . . . . . 4,318 4,490,720
Crown Americas LLC/Crown Americas Capital Corp. V,4.25%, 09/30/26 (Call 03/31/26) . . . . . . . . . . . . . . . . . . . . . . . 2,023 2,151,713
Crown Americas LLC/Crown Americas Capital Corp. VI,4.75%, 02/01/26 (Call 02/01/21) . . . . . . . . . . . . . . . . . . . . . . . 4,175 4,331,562
Crown Cork & Seal Co. Inc., 7.38%, 12/15/26(b) . . . . . . . . . . . 1,184 1,418,562Flex Acquisition Co. Inc.
6.88%, 01/15/25 (Call 11/30/20)(a)(b). . . . . . . . . . . . . . . . . . . . 3,086 3,035,8527.88%, 07/15/26 (Call 07/15/21)(a)(b) . . . . . . . . . . . . . . . . . . . 2,127 2,149,121
Schedule of Investments (continued)
October 31, 2020
iShares� Broad USD High Yield Corporate Bond ETF(Percentages shown are based on Net Assets)
S C H E D U L E O F I N V E S T M E N T S 43
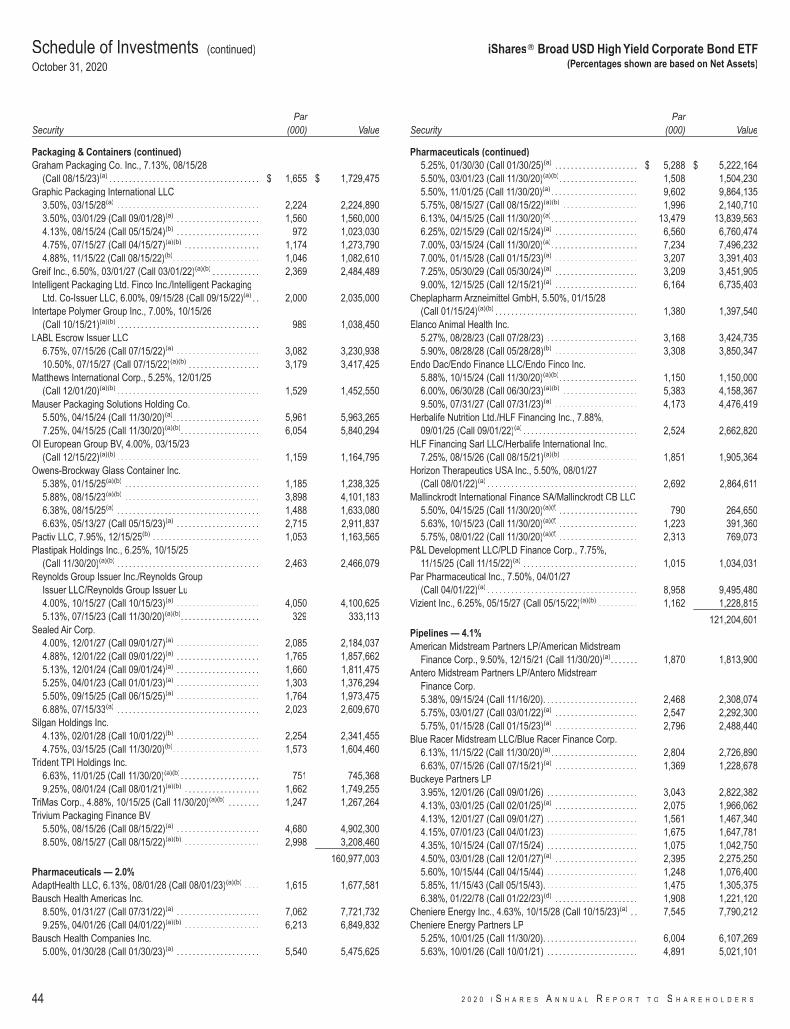
SecurityPar
(000) Value
Packaging & Containers (continued)Graham Packaging Co. Inc., 7.13%, 08/15/28
(Call 08/15/23)(a) . . . . . . . . . . . . . . . . . . . . . . . . . . . . . . . . . . . . . . $ 1,655 $ 1,729,475Graphic Packaging International LLC
3.50%, 03/15/28(a) . . . . . . . . . . . . . . . . . . . . . . . . . . . . . . . . . . . . 2,224 2,224,8903.50%, 03/01/29 (Call 09/01/28)(a) . . . . . . . . . . . . . . . . . . . . . 1,560 1,560,0004.13%, 08/15/24 (Call 05/15/24)(b) . . . . . . . . . . . . . . . . . . . . . 972 1,023,0304.75%, 07/15/27 (Call 04/15/27)(a)(b) . . . . . . . . . . . . . . . . . . . 1,174 1,273,7904.88%, 11/15/22 (Call 08/15/22)(b). . . . . . . . . . . . . . . . . . . . . . 1,046 1,082,610
Greif Inc., 6.50%, 03/01/27 (Call 03/01/22)(a)(b) . . . . . . . . . . . . 2,369 2,484,489Intelligent Packaging Ltd. Finco Inc./Intelligent Packaging
Ltd. Co-Issuer LLC, 6.00%, 09/15/28 (Call 09/15/22)(a) . . 2,000 2,035,000Intertape Polymer Group Inc., 7.00%, 10/15/26
(Call 10/15/21)(a)(b) . . . . . . . . . . . . . . . . . . . . . . . . . . . . . . . . . . . . 989 1,038,450LABL Escrow Issuer LLC
6.75%, 07/15/26 (Call 07/15/22)(a) . . . . . . . . . . . . . . . . . . . . . 3,082 3,230,93810.50%, 07/15/27 (Call 07/15/22)(a)(b) . . . . . . . . . . . . . . . . . . 3,179 3,417,425
Matthews International Corp., 5.25%, 12/01/25(Call 12/01/20)(a)(b) . . . . . . . . . . . . . . . . . . . . . . . . . . . . . . . . . . . . 1,529 1,452,550
Mauser Packaging Solutions Holding Co.5.50%, 04/15/24 (Call 11/30/20)(a). . . . . . . . . . . . . . . . . . . . . . 5,961 5,963,2657.25%, 04/15/25 (Call 11/30/20)(a)(b). . . . . . . . . . . . . . . . . . . . 6,054 5,840,294
OI European Group BV, 4.00%, 03/15/23(Call 12/15/22)(a)(b) . . . . . . . . . . . . . . . . . . . . . . . . . . . . . . . . . . . . 1,159 1,164,795
Owens-Brockway Glass Container Inc.5.38%, 01/15/25(a)(b) . . . . . . . . . . . . . . . . . . . . . . . . . . . . . . . . . . 1,185 1,238,3255.88%, 08/15/23(a)(b) . . . . . . . . . . . . . . . . . . . . . . . . . . . . . . . . . . 3,898 4,101,1836.38%, 08/15/25(a) . . . . . . . . . . . . . . . . . . . . . . . . . . . . . . . . . . . . 1,488 1,633,0806.63%, 05/13/27 (Call 05/15/23)(a) . . . . . . . . . . . . . . . . . . . . . 2,715 2,911,837
Pactiv LLC, 7.95%, 12/15/25(b) . . . . . . . . . . . . . . . . . . . . . . . . . . . 1,053 1,163,565Plastipak Holdings Inc., 6.25%, 10/15/25
(Call 11/30/20)(a)(b) . . . . . . . . . . . . . . . . . . . . . . . . . . . . . . . . . . . . 2,463 2,466,079Reynolds Group Issuer Inc./Reynolds Group
Issuer LLC/Reynolds Group Issuer Lu4.00%, 10/15/27 (Call 10/15/23)(a) . . . . . . . . . . . . . . . . . . . . . 4,050 4,100,6255.13%, 07/15/23 (Call 11/30/20)(a)(b). . . . . . . . . . . . . . . . . . . . 329 333,113
Sealed Air Corp.4.00%, 12/01/27 (Call 09/01/27)(a) . . . . . . . . . . . . . . . . . . . . . 2,085 2,184,0374.88%, 12/01/22 (Call 09/01/22)(a) . . . . . . . . . . . . . . . . . . . . . 1,765 1,857,6625.13%, 12/01/24 (Call 09/01/24)(a) . . . . . . . . . . . . . . . . . . . . . 1,660 1,811,4755.25%, 04/01/23 (Call 01/01/23)(a) . . . . . . . . . . . . . . . . . . . . . 1,303 1,376,2945.50%, 09/15/25 (Call 06/15/25)(a) . . . . . . . . . . . . . . . . . . . . . 1,764 1,973,4756.88%, 07/15/33(a) . . . . . . . . . . . . . . . . . . . . . . . . . . . . . . . . . . . . 2,023 2,609,670
Silgan Holdings Inc.4.13%, 02/01/28 (Call 10/01/22)(b) . . . . . . . . . . . . . . . . . . . . . 2,254 2,341,4554.75%, 03/15/25 (Call 11/30/20)(b). . . . . . . . . . . . . . . . . . . . . . 1,573 1,604,460
Trident TPI Holdings Inc.6.63%, 11/01/25 (Call 11/30/20)(a)(b). . . . . . . . . . . . . . . . . . . . 751 745,3689.25%, 08/01/24 (Call 08/01/21)(a)(b) . . . . . . . . . . . . . . . . . . . 1,662 1,749,255
TriMas Corp., 4.88%, 10/15/25 (Call 11/30/20)(a)(b) . . . . . . . . 1,247 1,267,264Trivium Packaging Finance BV
5.50%, 08/15/26 (Call 08/15/22)(a) . . . . . . . . . . . . . . . . . . . . . 4,680 4,902,3008.50%, 08/15/27 (Call 08/15/22)(a)(b) . . . . . . . . . . . . . . . . . . . 2,998 3,208,460
160,977,003Pharmaceuticals — 2.0%AdaptHealth LLC, 6.13%, 08/01/28 (Call 08/01/23)(a)(b) . . . . 1,615 1,677,581Bausch Health Americas Inc.
8.50%, 01/31/27 (Call 07/31/22)(a) . . . . . . . . . . . . . . . . . . . . . 7,062 7,721,7329.25%, 04/01/26 (Call 04/01/22)(a)(b) . . . . . . . . . . . . . . . . . . . 6,213 6,849,832
Bausch Health Companies Inc.5.00%, 01/30/28 (Call 01/30/23)(a) . . . . . . . . . . . . . . . . . . . . . 5,540 5,475,625
SecurityPar
(000) Value
Pharmaceuticals (continued)5.25%, 01/30/30 (Call 01/30/25)(a) . . . . . . . . . . . . . . . . . . . . . $ 5,288 $ 5,222,1645.50%, 03/01/23 (Call 11/30/20)(a)(b). . . . . . . . . . . . . . . . . . . . 1,508 1,504,2305.50%, 11/01/25 (Call 11/30/20)(a). . . . . . . . . . . . . . . . . . . . . . 9,602 9,864,1355.75%, 08/15/27 (Call 08/15/22)(a)(b) . . . . . . . . . . . . . . . . . . . 1,996 2,140,7106.13%, 04/15/25 (Call 11/30/20)(a). . . . . . . . . . . . . . . . . . . . . . 13,479 13,839,5636.25%, 02/15/29 (Call 02/15/24)(a) . . . . . . . . . . . . . . . . . . . . . 6,560 6,760,4747.00%, 03/15/24 (Call 11/30/20)(a). . . . . . . . . . . . . . . . . . . . . . 7,234 7,496,2327.00%, 01/15/28 (Call 01/15/23)(a) . . . . . . . . . . . . . . . . . . . . . 3,207 3,391,4037.25%, 05/30/29 (Call 05/30/24)(a) . . . . . . . . . . . . . . . . . . . . . 3,209 3,451,9059.00%, 12/15/25 (Call 12/15/21)(a) . . . . . . . . . . . . . . . . . . . . . 6,164 6,735,403
Cheplapharm Arzneimittel GmbH, 5.50%, 01/15/28(Call 01/15/24)(a)(b) . . . . . . . . . . . . . . . . . . . . . . . . . . . . . . . . . . . . 1,380 1,397,540
Elanco Animal Health Inc.5.27%, 08/28/23 (Call 07/28/23) . . . . . . . . . . . . . . . . . . . . . . . 3,168 3,424,7355.90%, 08/28/28 (Call 05/28/28)(b) . . . . . . . . . . . . . . . . . . . . . 3,308 3,850,347
Endo Dac/Endo Finance LLC/Endo Finco Inc.5.88%, 10/15/24 (Call 11/30/20)(a)(b). . . . . . . . . . . . . . . . . . . . 1,150 1,150,0006.00%, 06/30/28 (Call 06/30/23)(a)(b) . . . . . . . . . . . . . . . . . . . 5,383 4,158,3679.50%, 07/31/27 (Call 07/31/23)(a) . . . . . . . . . . . . . . . . . . . . . 4,173 4,476,419
Herbalife Nutrition Ltd./HLF Financing Inc., 7.88%,09/01/25 (Call 09/01/22)(a) . . . . . . . . . . . . . . . . . . . . . . . . . . . . . 2,524 2,662,820
HLF Financing Sarl LLC/Herbalife International Inc.,7.25%, 08/15/26 (Call 08/15/21)(a)(b) . . . . . . . . . . . . . . . . . . . 1,851 1,905,364
Horizon Therapeutics USA Inc., 5.50%, 08/01/27(Call 08/01/22)(a) . . . . . . . . . . . . . . . . . . . . . . . . . . . . . . . . . . . . . . 2,692 2,864,611
Mallinckrodt International Finance SA/Mallinckrodt CB LLC5.50%, 04/15/25 (Call 11/30/20)(a)(f) . . . . . . . . . . . . . . . . . . . . 790 264,6505.63%, 10/15/23 (Call 11/30/20)(a)(f) . . . . . . . . . . . . . . . . . . . . 1,223 391,3605.75%, 08/01/22 (Call 11/30/20)(a)(f) . . . . . . . . . . . . . . . . . . . . 2,313 769,073
P&L Development LLC/PLD Finance Corp., 7.75%,11/15/25 (Call 11/15/22)(a) . . . . . . . . . . . . . . . . . . . . . . . . . . . . . 1,015 1,034,031
Par Pharmaceutical Inc., 7.50%, 04/01/27(Call 04/01/22)(a) . . . . . . . . . . . . . . . . . . . . . . . . . . . . . . . . . . . . . . 8,958 9,495,480
Vizient Inc., 6.25%, 05/15/27 (Call 05/15/22)(a)(b) . . . . . . . . . . 1,162 1,228,815
121,204,601Pipelines — 4.1%American Midstream Partners LP/American Midstream
Finance Corp., 9.50%, 12/15/21 (Call 11/30/20)(a). . . . . . . 1,870 1,813,900Antero Midstream Partners LP/Antero Midstream
Finance Corp.5.38%, 09/15/24 (Call 11/16/20). . . . . . . . . . . . . . . . . . . . . . . . 2,468 2,308,0745.75%, 03/01/27 (Call 03/01/22)(a) . . . . . . . . . . . . . . . . . . . . . 2,547 2,292,3005.75%, 01/15/28 (Call 01/15/23)(a) . . . . . . . . . . . . . . . . . . . . . 2,796 2,488,440
Blue Racer Midstream LLC/Blue Racer Finance Corp.6.13%, 11/15/22 (Call 11/30/20)(a). . . . . . . . . . . . . . . . . . . . . . 2,804 2,726,8906.63%, 07/15/26 (Call 07/15/21)(a) . . . . . . . . . . . . . . . . . . . . . 1,369 1,228,678
Buckeye Partners LP3.95%, 12/01/26 (Call 09/01/26) . . . . . . . . . . . . . . . . . . . . . . . 3,043 2,822,3824.13%, 03/01/25 (Call 02/01/25)(a) . . . . . . . . . . . . . . . . . . . . . 2,075 1,966,0624.13%, 12/01/27 (Call 09/01/27) . . . . . . . . . . . . . . . . . . . . . . . 1,561 1,467,3404.15%, 07/01/23 (Call 04/01/23) . . . . . . . . . . . . . . . . . . . . . . . 1,675 1,647,7814.35%, 10/15/24 (Call 07/15/24) . . . . . . . . . . . . . . . . . . . . . . . 1,075 1,042,7504.50%, 03/01/28 (Call 12/01/27)(a) . . . . . . . . . . . . . . . . . . . . . 2,395 2,275,2505.60%, 10/15/44 (Call 04/15/44) . . . . . . . . . . . . . . . . . . . . . . . 1,248 1,076,4005.85%, 11/15/43 (Call 05/15/43). . . . . . . . . . . . . . . . . . . . . . . . 1,475 1,305,3756.38%, 01/22/78 (Call 01/22/23)(d) . . . . . . . . . . . . . . . . . . . . . 1,908 1,221,120
Cheniere Energy Inc., 4.63%, 10/15/28 (Call 10/15/23)(a) . . 7,545 7,790,212Cheniere Energy Partners LP
5.25%, 10/01/25 (Call 11/30/20). . . . . . . . . . . . . . . . . . . . . . . . 6,004 6,107,2695.63%, 10/01/26 (Call 10/01/21) . . . . . . . . . . . . . . . . . . . . . . . 4,891 5,021,101
Schedule of Investments (continued)
October 31, 2020
iShares� Broad USD High Yield Corporate Bond ETF(Percentages shown are based on Net Assets)
44 2 0 2 0 I S H A R E S A N N U A L R E P O R T T O S H A R E H O L D E R S
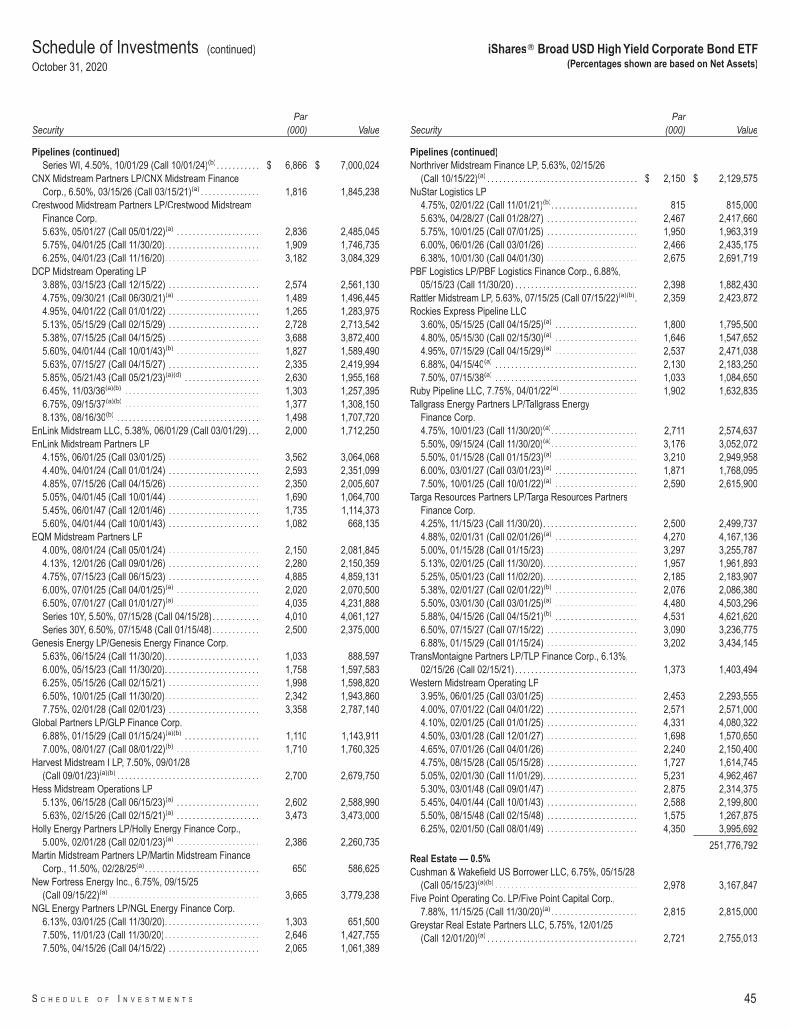
SecurityPar
(000) Value
Pipelines (continued)Series WI, 4.50%, 10/01/29 (Call 10/01/24)(b). . . . . . . . . . . $ 6,866 $ 7,000,024
CNX Midstream Partners LP/CNX Midstream FinanceCorp., 6.50%, 03/15/26 (Call 03/15/21)(a) . . . . . . . . . . . . . . . 1,816 1,845,238
Crestwood Midstream Partners LP/Crestwood MidstreamFinance Corp.5.63%, 05/01/27 (Call 05/01/22)(a) . . . . . . . . . . . . . . . . . . . . . 2,836 2,485,0455.75%, 04/01/25 (Call 11/30/20). . . . . . . . . . . . . . . . . . . . . . . . 1,909 1,746,7356.25%, 04/01/23 (Call 11/16/20). . . . . . . . . . . . . . . . . . . . . . . . 3,182 3,084,329
DCP Midstream Operating LP3.88%, 03/15/23 (Call 12/15/22) . . . . . . . . . . . . . . . . . . . . . . . 2,574 2,561,1304.75%, 09/30/21 (Call 06/30/21)(a) . . . . . . . . . . . . . . . . . . . . . 1,489 1,496,4454.95%, 04/01/22 (Call 01/01/22) . . . . . . . . . . . . . . . . . . . . . . . 1,265 1,283,9755.13%, 05/15/29 (Call 02/15/29) . . . . . . . . . . . . . . . . . . . . . . . 2,728 2,713,5425.38%, 07/15/25 (Call 04/15/25) . . . . . . . . . . . . . . . . . . . . . . . 3,688 3,872,4005.60%, 04/01/44 (Call 10/01/43)(b) . . . . . . . . . . . . . . . . . . . . . 1,827 1,589,4905.63%, 07/15/27 (Call 04/15/27) . . . . . . . . . . . . . . . . . . . . . . . 2,335 2,419,9945.85%, 05/21/43 (Call 05/21/23)(a)(d) . . . . . . . . . . . . . . . . . . . 2,630 1,955,1686.45%, 11/03/36(a)(b) . . . . . . . . . . . . . . . . . . . . . . . . . . . . . . . . . . 1,303 1,257,3956.75%, 09/15/37(a)(b) . . . . . . . . . . . . . . . . . . . . . . . . . . . . . . . . . . 1,377 1,308,1508.13%, 08/16/30(b) . . . . . . . . . . . . . . . . . . . . . . . . . . . . . . . . . . . . 1,498 1,707,720
EnLink Midstream LLC, 5.38%, 06/01/29 (Call 03/01/29). . . 2,000 1,712,250EnLink Midstream Partners LP
4.15%, 06/01/25 (Call 03/01/25) . . . . . . . . . . . . . . . . . . . . . . . 3,562 3,064,0684.40%, 04/01/24 (Call 01/01/24) . . . . . . . . . . . . . . . . . . . . . . . 2,593 2,351,0994.85%, 07/15/26 (Call 04/15/26) . . . . . . . . . . . . . . . . . . . . . . . 2,350 2,005,6075.05%, 04/01/45 (Call 10/01/44) . . . . . . . . . . . . . . . . . . . . . . . 1,690 1,064,7005.45%, 06/01/47 (Call 12/01/46) . . . . . . . . . . . . . . . . . . . . . . . 1,735 1,114,3735.60%, 04/01/44 (Call 10/01/43) . . . . . . . . . . . . . . . . . . . . . . . 1,082 668,135
EQM Midstream Partners LP4.00%, 08/01/24 (Call 05/01/24) . . . . . . . . . . . . . . . . . . . . . . . 2,150 2,081,8454.13%, 12/01/26 (Call 09/01/26) . . . . . . . . . . . . . . . . . . . . . . . 2,280 2,150,3594.75%, 07/15/23 (Call 06/15/23) . . . . . . . . . . . . . . . . . . . . . . . 4,885 4,859,1316.00%, 07/01/25 (Call 04/01/25)(a) . . . . . . . . . . . . . . . . . . . . . 2,020 2,070,5006.50%, 07/01/27 (Call 01/01/27)(a) . . . . . . . . . . . . . . . . . . . . . 4,035 4,231,888Series 10Y, 5.50%, 07/15/28 (Call 04/15/28). . . . . . . . . . . . 4,010 4,061,127Series 30Y, 6.50%, 07/15/48 (Call 01/15/48). . . . . . . . . . . . 2,500 2,375,000
Genesis Energy LP/Genesis Energy Finance Corp.5.63%, 06/15/24 (Call 11/30/20). . . . . . . . . . . . . . . . . . . . . . . . 1,033 888,5976.00%, 05/15/23 (Call 11/30/20). . . . . . . . . . . . . . . . . . . . . . . . 1,758 1,597,5836.25%, 05/15/26 (Call 02/15/21) . . . . . . . . . . . . . . . . . . . . . . . 1,998 1,598,8206.50%, 10/01/25 (Call 11/30/20). . . . . . . . . . . . . . . . . . . . . . . . 2,342 1,943,8607.75%, 02/01/28 (Call 02/01/23) . . . . . . . . . . . . . . . . . . . . . . . 3,358 2,787,140
Global Partners LP/GLP Finance Corp.6.88%, 01/15/29 (Call 01/15/24)(a)(b) . . . . . . . . . . . . . . . . . . . 1,110 1,143,9117.00%, 08/01/27 (Call 08/01/22)(b) . . . . . . . . . . . . . . . . . . . . . 1,710 1,760,325
Harvest Midstream I LP, 7.50%, 09/01/28(Call 09/01/23)(a)(b) . . . . . . . . . . . . . . . . . . . . . . . . . . . . . . . . . . . . 2,700 2,679,750
Hess Midstream Operations LP5.13%, 06/15/28 (Call 06/15/23)(a) . . . . . . . . . . . . . . . . . . . . . 2,602 2,588,9905.63%, 02/15/26 (Call 02/15/21)(a) . . . . . . . . . . . . . . . . . . . . . 3,473 3,473,000
Holly Energy Partners LP/Holly Energy Finance Corp.,5.00%, 02/01/28 (Call 02/01/23)(a) . . . . . . . . . . . . . . . . . . . . . 2,386 2,260,735
Martin Midstream Partners LP/Martin Midstream FinanceCorp., 11.50%, 02/28/25(a). . . . . . . . . . . . . . . . . . . . . . . . . . . . . 650 586,625
New Fortress Energy Inc., 6.75%, 09/15/25(Call 09/15/22)(a) . . . . . . . . . . . . . . . . . . . . . . . . . . . . . . . . . . . . . . 3,665 3,779,238
NGL Energy Partners LP/NGL Energy Finance Corp.6.13%, 03/01/25 (Call 11/30/20). . . . . . . . . . . . . . . . . . . . . . . . 1,303 651,5007.50%, 11/01/23 (Call 11/30/20). . . . . . . . . . . . . . . . . . . . . . . . 2,646 1,427,7557.50%, 04/15/26 (Call 04/15/22) . . . . . . . . . . . . . . . . . . . . . . . 2,065 1,061,389
SecurityPar
(000) Value
Pipelines (continued)Northriver Midstream Finance LP, 5.63%, 02/15/26
(Call 10/15/22)(a) . . . . . . . . . . . . . . . . . . . . . . . . . . . . . . . . . . . . . . $ 2,150 $ 2,129,575NuStar Logistics LP
4.75%, 02/01/22 (Call 11/01/21)(b). . . . . . . . . . . . . . . . . . . . . . 815 815,0005.63%, 04/28/27 (Call 01/28/27) . . . . . . . . . . . . . . . . . . . . . . . 2,467 2,417,6605.75%, 10/01/25 (Call 07/01/25) . . . . . . . . . . . . . . . . . . . . . . . 1,950 1,963,3196.00%, 06/01/26 (Call 03/01/26) . . . . . . . . . . . . . . . . . . . . . . . 2,466 2,435,1756.38%, 10/01/30 (Call 04/01/30) . . . . . . . . . . . . . . . . . . . . . . . 2,675 2,691,719
PBF Logistics LP/PBF Logistics Finance Corp., 6.88%,05/15/23 (Call 11/30/20) . . . . . . . . . . . . . . . . . . . . . . . . . . . . . . . 2,398 1,882,430
Rattler Midstream LP, 5.63%, 07/15/25 (Call 07/15/22)(a)(b). 2,359 2,423,872Rockies Express Pipeline LLC
3.60%, 05/15/25 (Call 04/15/25)(a) . . . . . . . . . . . . . . . . . . . . . 1,800 1,795,5004.80%, 05/15/30 (Call 02/15/30)(a) . . . . . . . . . . . . . . . . . . . . . 1,646 1,547,6524.95%, 07/15/29 (Call 04/15/29)(a) . . . . . . . . . . . . . . . . . . . . . 2,537 2,471,0386.88%, 04/15/40(a) . . . . . . . . . . . . . . . . . . . . . . . . . . . . . . . . . . . . 2,130 2,183,2507.50%, 07/15/38(a) . . . . . . . . . . . . . . . . . . . . . . . . . . . . . . . . . . . . 1,033 1,084,650
Ruby Pipeline LLC, 7.75%, 04/01/22(a). . . . . . . . . . . . . . . . . . . . 1,902 1,632,835Tallgrass Energy Partners LP/Tallgrass Energy
Finance Corp.4.75%, 10/01/23 (Call 11/30/20)(a). . . . . . . . . . . . . . . . . . . . . . 2,711 2,574,6375.50%, 09/15/24 (Call 11/30/20)(a). . . . . . . . . . . . . . . . . . . . . . 3,176 3,052,0725.50%, 01/15/28 (Call 01/15/23)(a) . . . . . . . . . . . . . . . . . . . . . 3,210 2,949,9586.00%, 03/01/27 (Call 03/01/23)(a) . . . . . . . . . . . . . . . . . . . . . 1,871 1,768,0957.50%, 10/01/25 (Call 10/01/22)(a) . . . . . . . . . . . . . . . . . . . . . 2,590 2,615,900
Targa Resources Partners LP/Targa Resources PartnersFinance Corp.4.25%, 11/15/23 (Call 11/30/20). . . . . . . . . . . . . . . . . . . . . . . . 2,500 2,499,7374.88%, 02/01/31 (Call 02/01/26)(a) . . . . . . . . . . . . . . . . . . . . . 4,270 4,167,1365.00%, 01/15/28 (Call 01/15/23) . . . . . . . . . . . . . . . . . . . . . . . 3,297 3,255,7875.13%, 02/01/25 (Call 11/30/20). . . . . . . . . . . . . . . . . . . . . . . . 1,957 1,961,8935.25%, 05/01/23 (Call 11/02/20). . . . . . . . . . . . . . . . . . . . . . . . 2,185 2,183,9075.38%, 02/01/27 (Call 02/01/22)(b) . . . . . . . . . . . . . . . . . . . . . 2,076 2,086,3805.50%, 03/01/30 (Call 03/01/25)(a) . . . . . . . . . . . . . . . . . . . . . 4,480 4,503,2965.88%, 04/15/26 (Call 04/15/21)(b) . . . . . . . . . . . . . . . . . . . . . 4,531 4,621,6206.50%, 07/15/27 (Call 07/15/22) . . . . . . . . . . . . . . . . . . . . . . . 3,090 3,236,7756.88%, 01/15/29 (Call 01/15/24) . . . . . . . . . . . . . . . . . . . . . . . 3,202 3,434,145
TransMontaigne Partners LP/TLP Finance Corp., 6.13%,02/15/26 (Call 02/15/21) . . . . . . . . . . . . . . . . . . . . . . . . . . . . . . . 1,373 1,403,494
Western Midstream Operating LP3.95%, 06/01/25 (Call 03/01/25) . . . . . . . . . . . . . . . . . . . . . . . 2,453 2,293,5554.00%, 07/01/22 (Call 04/01/22) . . . . . . . . . . . . . . . . . . . . . . . 2,571 2,571,0004.10%, 02/01/25 (Call 01/01/25) . . . . . . . . . . . . . . . . . . . . . . . 4,331 4,080,3224.50%, 03/01/28 (Call 12/01/27) . . . . . . . . . . . . . . . . . . . . . . . 1,698 1,570,6504.65%, 07/01/26 (Call 04/01/26) . . . . . . . . . . . . . . . . . . . . . . . 2,240 2,150,4004.75%, 08/15/28 (Call 05/15/28) . . . . . . . . . . . . . . . . . . . . . . . 1,727 1,614,7455.05%, 02/01/30 (Call 11/01/29). . . . . . . . . . . . . . . . . . . . . . . . 5,231 4,962,4675.30%, 03/01/48 (Call 09/01/47) . . . . . . . . . . . . . . . . . . . . . . . 2,875 2,314,3755.45%, 04/01/44 (Call 10/01/43) . . . . . . . . . . . . . . . . . . . . . . . 2,588 2,199,8005.50%, 08/15/48 (Call 02/15/48) . . . . . . . . . . . . . . . . . . . . . . . 1,575 1,267,8756.25%, 02/01/50 (Call 08/01/49) . . . . . . . . . . . . . . . . . . . . . . . 4,350 3,995,692
251,776,792Real Estate — 0.5%Cushman & Wakefield US Borrower LLC, 6.75%, 05/15/28
(Call 05/15/23)(a)(b) . . . . . . . . . . . . . . . . . . . . . . . . . . . . . . . . . . . . 2,978 3,167,847Five Point Operating Co. LP/Five Point Capital Corp.,
7.88%, 11/15/25 (Call 11/30/20)(a). . . . . . . . . . . . . . . . . . . . . . 2,815 2,815,000Greystar Real Estate Partners LLC, 5.75%, 12/01/25
(Call 12/01/20)(a) . . . . . . . . . . . . . . . . . . . . . . . . . . . . . . . . . . . . . . 2,721 2,755,013
Schedule of Investments (continued)
October 31, 2020
iShares� Broad USD High Yield Corporate Bond ETF(Percentages shown are based on Net Assets)
S C H E D U L E O F I N V E S T M E N T S 45
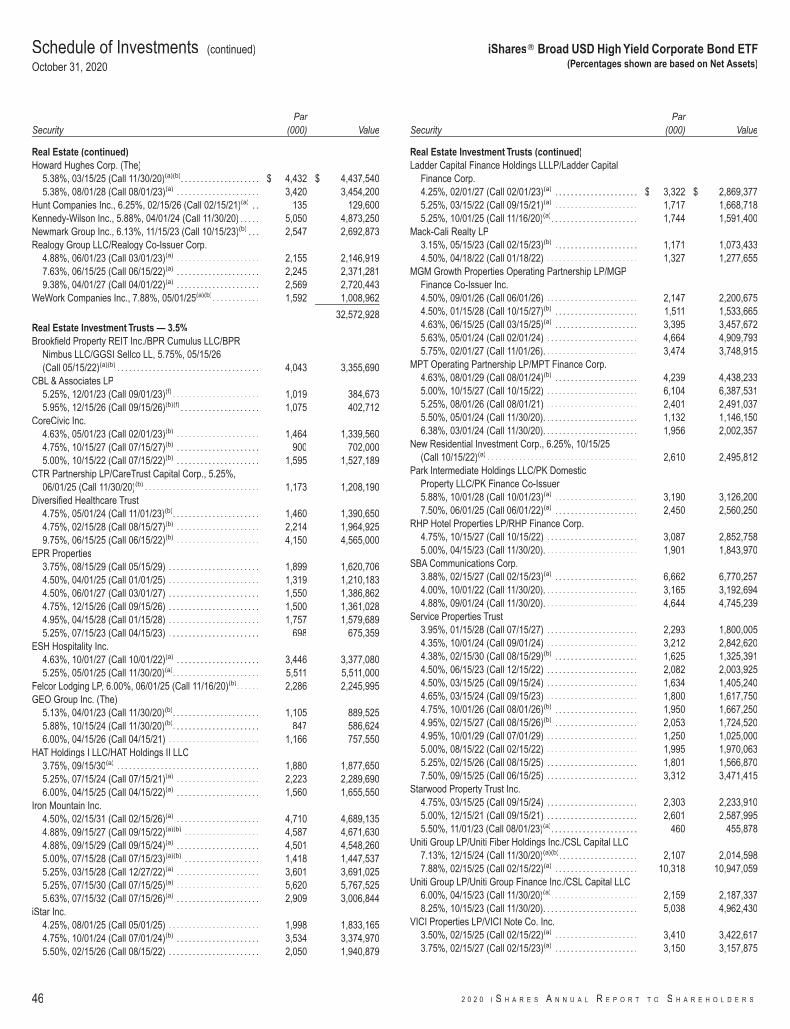
SecurityPar
(000) Value
Real Estate (continued)Howard Hughes Corp. (The)
5.38%, 03/15/25 (Call 11/30/20)(a)(b). . . . . . . . . . . . . . . . . . . . $ 4,432 $ 4,437,5405.38%, 08/01/28 (Call 08/01/23)(a) . . . . . . . . . . . . . . . . . . . . . 3,420 3,454,200
Hunt Companies Inc., 6.25%, 02/15/26 (Call 02/15/21)(a) . . 135 129,600Kennedy-Wilson Inc., 5.88%, 04/01/24 (Call 11/30/20) . . . . . 5,050 4,873,250Newmark Group Inc., 6.13%, 11/15/23 (Call 10/15/23)(b) . . . 2,547 2,692,873Realogy Group LLC/Realogy Co-Issuer Corp.
4.88%, 06/01/23 (Call 03/01/23)(a) . . . . . . . . . . . . . . . . . . . . . 2,155 2,146,9197.63%, 06/15/25 (Call 06/15/22)(a) . . . . . . . . . . . . . . . . . . . . . 2,245 2,371,2819.38%, 04/01/27 (Call 04/01/22)(a) . . . . . . . . . . . . . . . . . . . . . 2,569 2,720,443
WeWork Companies Inc., 7.88%, 05/01/25(a)(b). . . . . . . . . . . . 1,592 1,008,962
32,572,928Real Estate Investment Trusts — 3.5%Brookfield Property REIT Inc./BPR Cumulus LLC/BPR
Nimbus LLC/GGSI Sellco LL, 5.75%, 05/15/26(Call 05/15/22)(a)(b) . . . . . . . . . . . . . . . . . . . . . . . . . . . . . . . . . . . . 4,043 3,355,690
CBL & Associates LP5.25%, 12/01/23 (Call 09/01/23)(f) . . . . . . . . . . . . . . . . . . . . . . 1,019 384,6735.95%, 12/15/26 (Call 09/15/26)(b)(f) . . . . . . . . . . . . . . . . . . . . 1,075 402,712
CoreCivic Inc.4.63%, 05/01/23 (Call 02/01/23)(b) . . . . . . . . . . . . . . . . . . . . . 1,464 1,339,5604.75%, 10/15/27 (Call 07/15/27)(b) . . . . . . . . . . . . . . . . . . . . . 900 702,0005.00%, 10/15/22 (Call 07/15/22)(b) . . . . . . . . . . . . . . . . . . . . . 1,595 1,527,189
CTR Partnership LP/CareTrust Capital Corp., 5.25%,06/01/25 (Call 11/30/20)(b) . . . . . . . . . . . . . . . . . . . . . . . . . . . . . 1,173 1,208,190
Diversified Healthcare Trust4.75%, 05/01/24 (Call 11/01/23)(b). . . . . . . . . . . . . . . . . . . . . . 1,460 1,390,6504.75%, 02/15/28 (Call 08/15/27)(b) . . . . . . . . . . . . . . . . . . . . . 2,214 1,964,9259.75%, 06/15/25 (Call 06/15/22)(b) . . . . . . . . . . . . . . . . . . . . . 4,150 4,565,000
EPR Properties3.75%, 08/15/29 (Call 05/15/29) . . . . . . . . . . . . . . . . . . . . . . . 1,899 1,620,7064.50%, 04/01/25 (Call 01/01/25) . . . . . . . . . . . . . . . . . . . . . . . 1,319 1,210,1834.50%, 06/01/27 (Call 03/01/27) . . . . . . . . . . . . . . . . . . . . . . . 1,550 1,386,8624.75%, 12/15/26 (Call 09/15/26) . . . . . . . . . . . . . . . . . . . . . . . 1,500 1,361,0284.95%, 04/15/28 (Call 01/15/28) . . . . . . . . . . . . . . . . . . . . . . . 1,757 1,579,6895.25%, 07/15/23 (Call 04/15/23) . . . . . . . . . . . . . . . . . . . . . . . 698 675,359
ESH Hospitality Inc.4.63%, 10/01/27 (Call 10/01/22)(a) . . . . . . . . . . . . . . . . . . . . . 3,446 3,377,0805.25%, 05/01/25 (Call 11/30/20)(a). . . . . . . . . . . . . . . . . . . . . . 5,511 5,511,000
Felcor Lodging LP, 6.00%, 06/01/25 (Call 11/16/20)(b). . . . . . 2,286 2,245,995GEO Group Inc. (The)
5.13%, 04/01/23 (Call 11/30/20)(b). . . . . . . . . . . . . . . . . . . . . . 1,105 889,5255.88%, 10/15/24 (Call 11/30/20)(b). . . . . . . . . . . . . . . . . . . . . . 847 586,6246.00%, 04/15/26 (Call 04/15/21) . . . . . . . . . . . . . . . . . . . . . . . 1,166 757,550
HAT Holdings I LLC/HAT Holdings II LLC3.75%, 09/15/30(a) . . . . . . . . . . . . . . . . . . . . . . . . . . . . . . . . . . . . 1,880 1,877,6505.25%, 07/15/24 (Call 07/15/21)(a) . . . . . . . . . . . . . . . . . . . . . 2,223 2,289,6906.00%, 04/15/25 (Call 04/15/22)(a) . . . . . . . . . . . . . . . . . . . . . 1,560 1,655,550
Iron Mountain Inc.4.50%, 02/15/31 (Call 02/15/26)(a) . . . . . . . . . . . . . . . . . . . . . 4,710 4,689,1354.88%, 09/15/27 (Call 09/15/22)(a)(b) . . . . . . . . . . . . . . . . . . . 4,587 4,671,6304.88%, 09/15/29 (Call 09/15/24)(a) . . . . . . . . . . . . . . . . . . . . . 4,501 4,548,2605.00%, 07/15/28 (Call 07/15/23)(a)(b) . . . . . . . . . . . . . . . . . . . 1,418 1,447,5375.25%, 03/15/28 (Call 12/27/22)(a) . . . . . . . . . . . . . . . . . . . . . 3,601 3,691,0255.25%, 07/15/30 (Call 07/15/25)(a) . . . . . . . . . . . . . . . . . . . . . 5,620 5,767,5255.63%, 07/15/32 (Call 07/15/26)(a) . . . . . . . . . . . . . . . . . . . . . 2,909 3,006,844
iStar Inc.4.25%, 08/01/25 (Call 05/01/25) . . . . . . . . . . . . . . . . . . . . . . . 1,998 1,833,1654.75%, 10/01/24 (Call 07/01/24)(b) . . . . . . . . . . . . . . . . . . . . . 3,534 3,374,9705.50%, 02/15/26 (Call 08/15/22) . . . . . . . . . . . . . . . . . . . . . . . 2,050 1,940,879
SecurityPar
(000) Value
Real Estate Investment Trusts (continued)Ladder Capital Finance Holdings LLLP/Ladder Capital
Finance Corp.4.25%, 02/01/27 (Call 02/01/23)(a) . . . . . . . . . . . . . . . . . . . . . $ 3,322 $ 2,869,3775.25%, 03/15/22 (Call 09/15/21)(a) . . . . . . . . . . . . . . . . . . . . . 1,717 1,668,7185.25%, 10/01/25 (Call 11/16/20)(a). . . . . . . . . . . . . . . . . . . . . . 1,744 1,591,400
Mack-Cali Realty LP3.15%, 05/15/23 (Call 02/15/23)(b) . . . . . . . . . . . . . . . . . . . . . 1,171 1,073,4334.50%, 04/18/22 (Call 01/18/22) . . . . . . . . . . . . . . . . . . . . . . . 1,327 1,277,655
MGM Growth Properties Operating Partnership LP/MGPFinance Co-Issuer Inc.4.50%, 09/01/26 (Call 06/01/26) . . . . . . . . . . . . . . . . . . . . . . . 2,147 2,200,6754.50%, 01/15/28 (Call 10/15/27)(b) . . . . . . . . . . . . . . . . . . . . . 1,511 1,533,6654.63%, 06/15/25 (Call 03/15/25)(a) . . . . . . . . . . . . . . . . . . . . . 3,395 3,457,6725.63%, 05/01/24 (Call 02/01/24) . . . . . . . . . . . . . . . . . . . . . . . 4,664 4,909,7935.75%, 02/01/27 (Call 11/01/26). . . . . . . . . . . . . . . . . . . . . . . . 3,474 3,748,915
MPT Operating Partnership LP/MPT Finance Corp.4.63%, 08/01/29 (Call 08/01/24)(b) . . . . . . . . . . . . . . . . . . . . . 4,239 4,438,2335.00%, 10/15/27 (Call 10/15/22) . . . . . . . . . . . . . . . . . . . . . . . 6,104 6,387,5315.25%, 08/01/26 (Call 08/01/21) . . . . . . . . . . . . . . . . . . . . . . . 2,401 2,491,0375.50%, 05/01/24 (Call 11/30/20). . . . . . . . . . . . . . . . . . . . . . . . 1,132 1,146,1506.38%, 03/01/24 (Call 11/30/20). . . . . . . . . . . . . . . . . . . . . . . . 1,956 2,002,357
New Residential Investment Corp., 6.25%, 10/15/25(Call 10/15/22)(a) . . . . . . . . . . . . . . . . . . . . . . . . . . . . . . . . . . . . . . 2,610 2,495,812
Park Intermediate Holdings LLC/PK DomesticProperty LLC/PK Finance Co-Issuer5.88%, 10/01/28 (Call 10/01/23)(a) . . . . . . . . . . . . . . . . . . . . . 3,190 3,126,2007.50%, 06/01/25 (Call 06/01/22)(a) . . . . . . . . . . . . . . . . . . . . . 2,450 2,560,250
RHP Hotel Properties LP/RHP Finance Corp.4.75%, 10/15/27 (Call 10/15/22) . . . . . . . . . . . . . . . . . . . . . . . 3,087 2,852,7585.00%, 04/15/23 (Call 11/30/20). . . . . . . . . . . . . . . . . . . . . . . . 1,901 1,843,970
SBA Communications Corp.3.88%, 02/15/27 (Call 02/15/23)(a) . . . . . . . . . . . . . . . . . . . . . 6,662 6,770,2574.00%, 10/01/22 (Call 11/30/20). . . . . . . . . . . . . . . . . . . . . . . . 3,165 3,192,6944.88%, 09/01/24 (Call 11/30/20). . . . . . . . . . . . . . . . . . . . . . . . 4,644 4,745,239
Service Properties Trust3.95%, 01/15/28 (Call 07/15/27) . . . . . . . . . . . . . . . . . . . . . . . 2,293 1,800,0054.35%, 10/01/24 (Call 09/01/24) . . . . . . . . . . . . . . . . . . . . . . . 3,212 2,842,6204.38%, 02/15/30 (Call 08/15/29)(b) . . . . . . . . . . . . . . . . . . . . . 1,625 1,325,3914.50%, 06/15/23 (Call 12/15/22) . . . . . . . . . . . . . . . . . . . . . . . 2,082 2,003,9254.50%, 03/15/25 (Call 09/15/24) . . . . . . . . . . . . . . . . . . . . . . . 1,634 1,405,2404.65%, 03/15/24 (Call 09/15/23) . . . . . . . . . . . . . . . . . . . . . . . 1,800 1,617,7504.75%, 10/01/26 (Call 08/01/26)(b) . . . . . . . . . . . . . . . . . . . . . 1,950 1,667,2504.95%, 02/15/27 (Call 08/15/26)(b) . . . . . . . . . . . . . . . . . . . . . 2,053 1,724,5204.95%, 10/01/29 (Call 07/01/29) . . . . . . . . . . . . . . . . . . . . . . . 1,250 1,025,0005.00%, 08/15/22 (Call 02/15/22) . . . . . . . . . . . . . . . . . . . . . . . 1,995 1,970,0635.25%, 02/15/26 (Call 08/15/25) . . . . . . . . . . . . . . . . . . . . . . . 1,801 1,566,8707.50%, 09/15/25 (Call 06/15/25) . . . . . . . . . . . . . . . . . . . . . . . 3,312 3,471,415
Starwood Property Trust Inc.4.75%, 03/15/25 (Call 09/15/24) . . . . . . . . . . . . . . . . . . . . . . . 2,303 2,233,9105.00%, 12/15/21 (Call 09/15/21) . . . . . . . . . . . . . . . . . . . . . . . 2,601 2,587,9955.50%, 11/01/23 (Call 08/01/23)(a). . . . . . . . . . . . . . . . . . . . . . 460 455,878
Uniti Group LP/Uniti Fiber Holdings Inc./CSL Capital LLC7.13%, 12/15/24 (Call 11/30/20)(a)(b). . . . . . . . . . . . . . . . . . . . 2,107 2,014,5987.88%, 02/15/25 (Call 02/15/22)(a) . . . . . . . . . . . . . . . . . . . . . 10,318 10,947,059
Uniti Group LP/Uniti Group Finance Inc./CSL Capital LLC6.00%, 04/15/23 (Call 11/30/20)(a). . . . . . . . . . . . . . . . . . . . . . 2,159 2,187,3378.25%, 10/15/23 (Call 11/30/20). . . . . . . . . . . . . . . . . . . . . . . . 5,038 4,962,430
VICI Properties LP/VICI Note Co. Inc.3.50%, 02/15/25 (Call 02/15/22)(a) . . . . . . . . . . . . . . . . . . . . . 3,410 3,422,6173.75%, 02/15/27 (Call 02/15/23)(a) . . . . . . . . . . . . . . . . . . . . . 3,150 3,157,875
Schedule of Investments (continued)
October 31, 2020
iShares� Broad USD High Yield Corporate Bond ETF(Percentages shown are based on Net Assets)
46 2 0 2 0 I S H A R E S A N N U A L R E P O R T T O S H A R E H O L D E R S
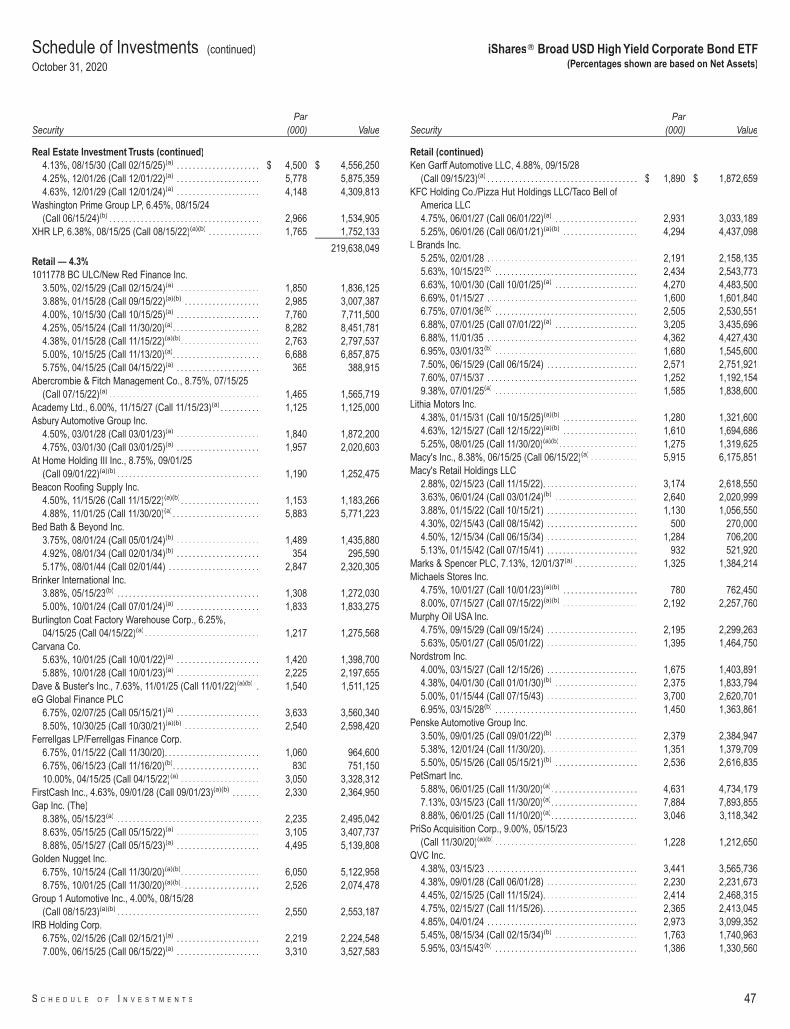
SecurityPar
(000) Value
Real Estate Investment Trusts (continued)4.13%, 08/15/30 (Call 02/15/25)(a) . . . . . . . . . . . . . . . . . . . . . $ 4,500 $ 4,556,2504.25%, 12/01/26 (Call 12/01/22)(a) . . . . . . . . . . . . . . . . . . . . . 5,778 5,875,3594.63%, 12/01/29 (Call 12/01/24)(a) . . . . . . . . . . . . . . . . . . . . . 4,148 4,309,813
Washington Prime Group LP, 6.45%, 08/15/24(Call 06/15/24)(b) . . . . . . . . . . . . . . . . . . . . . . . . . . . . . . . . . . . . . . 2,966 1,534,905
XHR LP, 6.38%, 08/15/25 (Call 08/15/22)(a)(b) . . . . . . . . . . . . . 1,765 1,752,133
219,638,049Retail — 4.3%1011778 BC ULC/New Red Finance Inc.
3.50%, 02/15/29 (Call 02/15/24)(a) . . . . . . . . . . . . . . . . . . . . . 1,850 1,836,1253.88%, 01/15/28 (Call 09/15/22)(a)(b) . . . . . . . . . . . . . . . . . . . 2,985 3,007,3874.00%, 10/15/30 (Call 10/15/25)(a) . . . . . . . . . . . . . . . . . . . . . 7,760 7,711,5004.25%, 05/15/24 (Call 11/30/20)(a). . . . . . . . . . . . . . . . . . . . . . 8,282 8,451,7814.38%, 01/15/28 (Call 11/15/22)(a)(b). . . . . . . . . . . . . . . . . . . . 2,763 2,797,5375.00%, 10/15/25 (Call 11/13/20)(a). . . . . . . . . . . . . . . . . . . . . . 6,688 6,857,8755.75%, 04/15/25 (Call 04/15/22)(a) . . . . . . . . . . . . . . . . . . . . . 365 388,915
Abercrombie & Fitch Management Co., 8.75%, 07/15/25(Call 07/15/22)(a) . . . . . . . . . . . . . . . . . . . . . . . . . . . . . . . . . . . . . . 1,465 1,565,719
Academy Ltd., 6.00%, 11/15/27 (Call 11/15/23)(a) . . . . . . . . . . 1,125 1,125,000Asbury Automotive Group Inc.
4.50%, 03/01/28 (Call 03/01/23)(a) . . . . . . . . . . . . . . . . . . . . . 1,840 1,872,2004.75%, 03/01/30 (Call 03/01/25)(a) . . . . . . . . . . . . . . . . . . . . . 1,957 2,020,603
At Home Holding III Inc., 8.75%, 09/01/25(Call 09/01/22)(a)(b) . . . . . . . . . . . . . . . . . . . . . . . . . . . . . . . . . . . . 1,190 1,252,475
Beacon Roofing Supply Inc.4.50%, 11/15/26 (Call 11/15/22)(a)(b). . . . . . . . . . . . . . . . . . . . 1,153 1,183,2664.88%, 11/01/25 (Call 11/30/20)(a). . . . . . . . . . . . . . . . . . . . . . 5,883 5,771,223
Bed Bath & Beyond Inc.3.75%, 08/01/24 (Call 05/01/24)(b) . . . . . . . . . . . . . . . . . . . . . 1,489 1,435,8804.92%, 08/01/34 (Call 02/01/34)(b) . . . . . . . . . . . . . . . . . . . . . 354 295,5905.17%, 08/01/44 (Call 02/01/44) . . . . . . . . . . . . . . . . . . . . . . . 2,847 2,320,305
Brinker International Inc.3.88%, 05/15/23(b) . . . . . . . . . . . . . . . . . . . . . . . . . . . . . . . . . . . . 1,308 1,272,0305.00%, 10/01/24 (Call 07/01/24)(a) . . . . . . . . . . . . . . . . . . . . . 1,833 1,833,275
Burlington Coat Factory Warehouse Corp., 6.25%,04/15/25 (Call 04/15/22)(a) . . . . . . . . . . . . . . . . . . . . . . . . . . . . . 1,217 1,275,568
Carvana Co.5.63%, 10/01/25 (Call 10/01/22)(a) . . . . . . . . . . . . . . . . . . . . . 1,420 1,398,7005.88%, 10/01/28 (Call 10/01/23)(a) . . . . . . . . . . . . . . . . . . . . . 2,225 2,197,655
Dave & Buster's Inc., 7.63%, 11/01/25 (Call 11/01/22)(a)(b) . 1,540 1,511,125eG Global Finance PLC
6.75%, 02/07/25 (Call 05/15/21)(a) . . . . . . . . . . . . . . . . . . . . . 3,633 3,560,3408.50%, 10/30/25 (Call 10/30/21)(a)(b) . . . . . . . . . . . . . . . . . . . 2,540 2,598,420
Ferrellgas LP/Ferrellgas Finance Corp.6.75%, 01/15/22 (Call 11/30/20). . . . . . . . . . . . . . . . . . . . . . . . 1,060 964,6006.75%, 06/15/23 (Call 11/16/20)(b). . . . . . . . . . . . . . . . . . . . . . 830 751,15010.00%, 04/15/25 (Call 04/15/22)(a) . . . . . . . . . . . . . . . . . . . . 3,050 3,328,312
FirstCash Inc., 4.63%, 09/01/28 (Call 09/01/23)(a)(b) . . . . . . . 2,330 2,364,950Gap Inc. (The)
8.38%, 05/15/23(a) . . . . . . . . . . . . . . . . . . . . . . . . . . . . . . . . . . . . 2,235 2,495,0428.63%, 05/15/25 (Call 05/15/22)(a) . . . . . . . . . . . . . . . . . . . . . 3,105 3,407,7378.88%, 05/15/27 (Call 05/15/23)(a) . . . . . . . . . . . . . . . . . . . . . 4,495 5,139,808
Golden Nugget Inc.6.75%, 10/15/24 (Call 11/30/20)(a)(b). . . . . . . . . . . . . . . . . . . . 6,050 5,122,9588.75%, 10/01/25 (Call 11/30/20)(a)(b). . . . . . . . . . . . . . . . . . . . 2,526 2,074,478
Group 1 Automotive Inc., 4.00%, 08/15/28(Call 08/15/23)(a)(b) . . . . . . . . . . . . . . . . . . . . . . . . . . . . . . . . . . . . 2,550 2,553,187
IRB Holding Corp.6.75%, 02/15/26 (Call 02/15/21)(a) . . . . . . . . . . . . . . . . . . . . . 2,219 2,224,5487.00%, 06/15/25 (Call 06/15/22)(a) . . . . . . . . . . . . . . . . . . . . . 3,310 3,527,583
SecurityPar
(000) Value
Retail (continued)Ken Garff Automotive LLC, 4.88%, 09/15/28
(Call 09/15/23)(a) . . . . . . . . . . . . . . . . . . . . . . . . . . . . . . . . . . . . . . $ 1,890 $ 1,872,659KFC Holding Co./Pizza Hut Holdings LLC/Taco Bell of
America LLC4.75%, 06/01/27 (Call 06/01/22)(a) . . . . . . . . . . . . . . . . . . . . . 2,931 3,033,1895.25%, 06/01/26 (Call 06/01/21)(a)(b) . . . . . . . . . . . . . . . . . . . 4,294 4,437,098
L Brands Inc.5.25%, 02/01/28 . . . . . . . . . . . . . . . . . . . . . . . . . . . . . . . . . . . . . . 2,191 2,158,1355.63%, 10/15/23(b) . . . . . . . . . . . . . . . . . . . . . . . . . . . . . . . . . . . . 2,434 2,543,7736.63%, 10/01/30 (Call 10/01/25)(a) . . . . . . . . . . . . . . . . . . . . . 4,270 4,483,5006.69%, 01/15/27 . . . . . . . . . . . . . . . . . . . . . . . . . . . . . . . . . . . . . . 1,600 1,601,8406.75%, 07/01/36(b) . . . . . . . . . . . . . . . . . . . . . . . . . . . . . . . . . . . . 2,505 2,530,5516.88%, 07/01/25 (Call 07/01/22)(a) . . . . . . . . . . . . . . . . . . . . . 3,205 3,435,6966.88%, 11/01/35 . . . . . . . . . . . . . . . . . . . . . . . . . . . . . . . . . . . . . . 4,362 4,427,4306.95%, 03/01/33(b) . . . . . . . . . . . . . . . . . . . . . . . . . . . . . . . . . . . . 1,680 1,545,6007.50%, 06/15/29 (Call 06/15/24) . . . . . . . . . . . . . . . . . . . . . . . 2,571 2,751,9217.60%, 07/15/37 . . . . . . . . . . . . . . . . . . . . . . . . . . . . . . . . . . . . . . 1,252 1,192,1549.38%, 07/01/25(a) . . . . . . . . . . . . . . . . . . . . . . . . . . . . . . . . . . . . 1,585 1,838,600
Lithia Motors Inc.4.38%, 01/15/31 (Call 10/15/25)(a)(b) . . . . . . . . . . . . . . . . . . . 1,280 1,321,6004.63%, 12/15/27 (Call 12/15/22)(a)(b) . . . . . . . . . . . . . . . . . . . 1,610 1,694,6865.25%, 08/01/25 (Call 11/30/20)(a)(b). . . . . . . . . . . . . . . . . . . . 1,275 1,319,625
Macy's Inc., 8.38%, 06/15/25 (Call 06/15/22)(a) . . . . . . . . . . . . 5,915 6,175,851Macy's Retail Holdings LLC
2.88%, 02/15/23 (Call 11/15/22). . . . . . . . . . . . . . . . . . . . . . . . 3,174 2,618,5503.63%, 06/01/24 (Call 03/01/24)(b) . . . . . . . . . . . . . . . . . . . . . 2,640 2,020,9993.88%, 01/15/22 (Call 10/15/21) . . . . . . . . . . . . . . . . . . . . . . . 1,130 1,056,5504.30%, 02/15/43 (Call 08/15/42) . . . . . . . . . . . . . . . . . . . . . . . 500 270,0004.50%, 12/15/34 (Call 06/15/34) . . . . . . . . . . . . . . . . . . . . . . . 1,284 706,2005.13%, 01/15/42 (Call 07/15/41) . . . . . . . . . . . . . . . . . . . . . . . 932 521,920
Marks & Spencer PLC, 7.13%, 12/01/37(a) . . . . . . . . . . . . . . . . 1,325 1,384,214Michaels Stores Inc.
4.75%, 10/01/27 (Call 10/01/23)(a)(b) . . . . . . . . . . . . . . . . . . . 780 762,4508.00%, 07/15/27 (Call 07/15/22)(a)(b) . . . . . . . . . . . . . . . . . . . 2,192 2,257,760
Murphy Oil USA Inc.4.75%, 09/15/29 (Call 09/15/24) . . . . . . . . . . . . . . . . . . . . . . . 2,195 2,299,2635.63%, 05/01/27 (Call 05/01/22) . . . . . . . . . . . . . . . . . . . . . . . 1,395 1,464,750
Nordstrom Inc.4.00%, 03/15/27 (Call 12/15/26) . . . . . . . . . . . . . . . . . . . . . . . 1,675 1,403,8914.38%, 04/01/30 (Call 01/01/30)(b) . . . . . . . . . . . . . . . . . . . . . 2,375 1,833,7945.00%, 01/15/44 (Call 07/15/43) . . . . . . . . . . . . . . . . . . . . . . . 3,700 2,620,7016.95%, 03/15/28(b) . . . . . . . . . . . . . . . . . . . . . . . . . . . . . . . . . . . . 1,450 1,363,861
Penske Automotive Group Inc.3.50%, 09/01/25 (Call 09/01/22)(b) . . . . . . . . . . . . . . . . . . . . . 2,379 2,384,9475.38%, 12/01/24 (Call 11/30/20). . . . . . . . . . . . . . . . . . . . . . . . 1,351 1,379,7095.50%, 05/15/26 (Call 05/15/21)(b) . . . . . . . . . . . . . . . . . . . . . 2,536 2,616,835
PetSmart Inc.5.88%, 06/01/25 (Call 11/30/20)(a). . . . . . . . . . . . . . . . . . . . . . 4,631 4,734,1797.13%, 03/15/23 (Call 11/30/20)(a). . . . . . . . . . . . . . . . . . . . . . 7,884 7,893,8558.88%, 06/01/25 (Call 11/10/20)(a). . . . . . . . . . . . . . . . . . . . . . 3,046 3,118,342
PriSo Acquisition Corp., 9.00%, 05/15/23(Call 11/30/20)(a)(b) . . . . . . . . . . . . . . . . . . . . . . . . . . . . . . . . . . . . 1,228 1,212,650
QVC Inc.4.38%, 03/15/23 . . . . . . . . . . . . . . . . . . . . . . . . . . . . . . . . . . . . . . 3,441 3,565,7364.38%, 09/01/28 (Call 06/01/28) . . . . . . . . . . . . . . . . . . . . . . . 2,230 2,231,6734.45%, 02/15/25 (Call 11/15/24). . . . . . . . . . . . . . . . . . . . . . . . 2,414 2,468,3154.75%, 02/15/27 (Call 11/15/26). . . . . . . . . . . . . . . . . . . . . . . . 2,365 2,413,0454.85%, 04/01/24 . . . . . . . . . . . . . . . . . . . . . . . . . . . . . . . . . . . . . . 2,973 3,099,3525.45%, 08/15/34 (Call 02/15/34)(b) . . . . . . . . . . . . . . . . . . . . . 1,763 1,740,9635.95%, 03/15/43(b) . . . . . . . . . . . . . . . . . . . . . . . . . . . . . . . . . . . . 1,386 1,330,560
Schedule of Investments (continued)
October 31, 2020
iShares� Broad USD High Yield Corporate Bond ETF(Percentages shown are based on Net Assets)
S C H E D U L E O F I N V E S T M E N T S 47
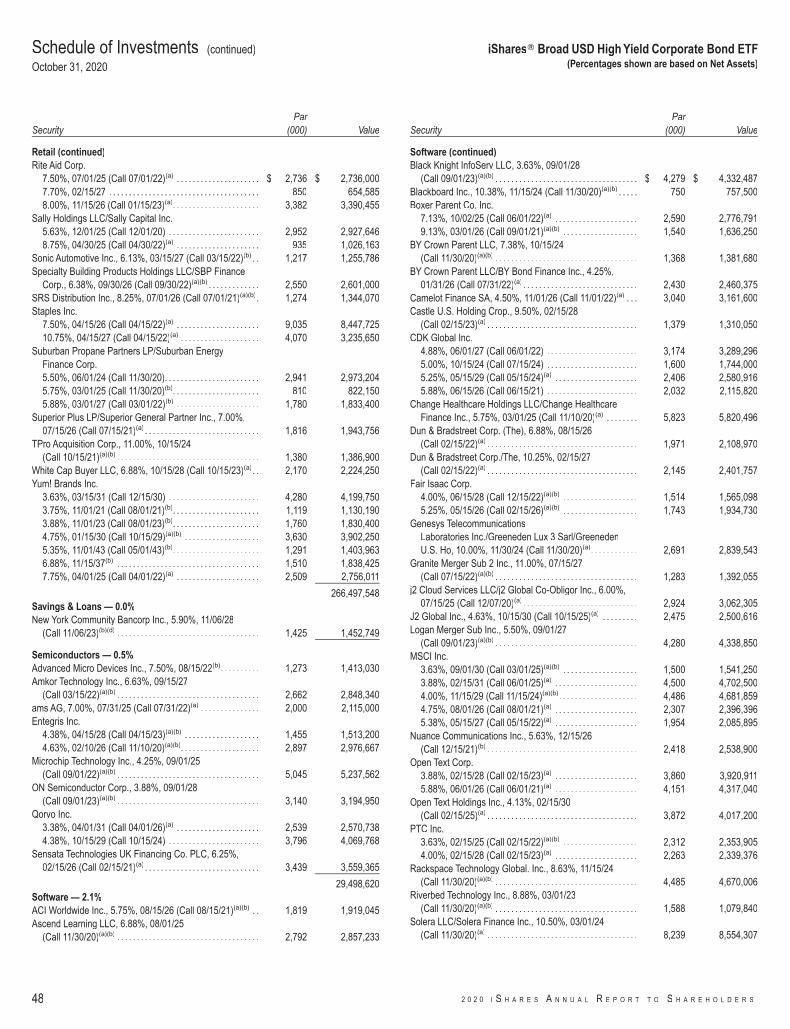
SecurityPar
(000) Value
Retail (continued)Rite Aid Corp.
7.50%, 07/01/25 (Call 07/01/22)(a) . . . . . . . . . . . . . . . . . . . . . $ 2,736 $ 2,736,0007.70%, 02/15/27 . . . . . . . . . . . . . . . . . . . . . . . . . . . . . . . . . . . . . . 850 654,5858.00%, 11/15/26 (Call 01/15/23)(a). . . . . . . . . . . . . . . . . . . . . . 3,382 3,390,455
Sally Holdings LLC/Sally Capital Inc.5.63%, 12/01/25 (Call 12/01/20) . . . . . . . . . . . . . . . . . . . . . . . 2,952 2,927,6468.75%, 04/30/25 (Call 04/30/22)(a) . . . . . . . . . . . . . . . . . . . . . 935 1,026,163
Sonic Automotive Inc., 6.13%, 03/15/27 (Call 03/15/22)(b) . . 1,217 1,255,786Specialty Building Products Holdings LLC/SBP Finance
Corp., 6.38%, 09/30/26 (Call 09/30/22)(a)(b) . . . . . . . . . . . . . 2,550 2,601,000SRS Distribution Inc., 8.25%, 07/01/26 (Call 07/01/21)(a)(b). 1,274 1,344,070Staples Inc.
7.50%, 04/15/26 (Call 04/15/22)(a) . . . . . . . . . . . . . . . . . . . . . 9,035 8,447,72510.75%, 04/15/27 (Call 04/15/22)(a) . . . . . . . . . . . . . . . . . . . . 4,070 3,235,650
Suburban Propane Partners LP/Suburban EnergyFinance Corp.5.50%, 06/01/24 (Call 11/30/20). . . . . . . . . . . . . . . . . . . . . . . . 2,941 2,973,2045.75%, 03/01/25 (Call 11/30/20)(b). . . . . . . . . . . . . . . . . . . . . . 810 822,1505.88%, 03/01/27 (Call 03/01/22)(b) . . . . . . . . . . . . . . . . . . . . . 1,780 1,833,400
Superior Plus LP/Superior General Partner Inc., 7.00%,07/15/26 (Call 07/15/21)(a) . . . . . . . . . . . . . . . . . . . . . . . . . . . . . 1,816 1,943,756
TPro Acquisition Corp., 11.00%, 10/15/24(Call 10/15/21)(a)(b) . . . . . . . . . . . . . . . . . . . . . . . . . . . . . . . . . . . . 1,380 1,386,900
White Cap Buyer LLC, 6.88%, 10/15/28 (Call 10/15/23)(a). . 2,170 2,224,250Yum! Brands Inc.
3.63%, 03/15/31 (Call 12/15/30) . . . . . . . . . . . . . . . . . . . . . . . 4,280 4,199,7503.75%, 11/01/21 (Call 08/01/21)(b). . . . . . . . . . . . . . . . . . . . . . 1,119 1,130,1903.88%, 11/01/23 (Call 08/01/23)(b). . . . . . . . . . . . . . . . . . . . . . 1,760 1,830,4004.75%, 01/15/30 (Call 10/15/29)(a)(b) . . . . . . . . . . . . . . . . . . . 3,630 3,902,2505.35%, 11/01/43 (Call 05/01/43)(b). . . . . . . . . . . . . . . . . . . . . . 1,291 1,403,9636.88%, 11/15/37(b) . . . . . . . . . . . . . . . . . . . . . . . . . . . . . . . . . . . . 1,510 1,838,4257.75%, 04/01/25 (Call 04/01/22)(a) . . . . . . . . . . . . . . . . . . . . . 2,509 2,756,011
266,497,548Savings & Loans — 0.0%New York Community Bancorp Inc., 5.90%, 11/06/28
(Call 11/06/23)(b)(d) . . . . . . . . . . . . . . . . . . . . . . . . . . . . . . . . . . . . 1,425 1,452,749
Semiconductors — 0.5%Advanced Micro Devices Inc., 7.50%, 08/15/22(b). . . . . . . . . . 1,273 1,413,030Amkor Technology Inc., 6.63%, 09/15/27
(Call 03/15/22)(a)(b) . . . . . . . . . . . . . . . . . . . . . . . . . . . . . . . . . . . . 2,662 2,848,340ams AG, 7.00%, 07/31/25 (Call 07/31/22)(a) . . . . . . . . . . . . . . . 2,000 2,115,000Entegris Inc.
4.38%, 04/15/28 (Call 04/15/23)(a)(b) . . . . . . . . . . . . . . . . . . . 1,455 1,513,2004.63%, 02/10/26 (Call 11/10/20)(a)(b). . . . . . . . . . . . . . . . . . . . 2,897 2,976,667
Microchip Technology Inc., 4.25%, 09/01/25(Call 09/01/22)(a)(b) . . . . . . . . . . . . . . . . . . . . . . . . . . . . . . . . . . . . 5,045 5,237,562
ON Semiconductor Corp., 3.88%, 09/01/28(Call 09/01/23)(a)(b) . . . . . . . . . . . . . . . . . . . . . . . . . . . . . . . . . . . . 3,140 3,194,950
Qorvo Inc.3.38%, 04/01/31 (Call 04/01/26)(a) . . . . . . . . . . . . . . . . . . . . . 2,539 2,570,7384.38%, 10/15/29 (Call 10/15/24) . . . . . . . . . . . . . . . . . . . . . . . 3,796 4,069,768
Sensata Technologies UK Financing Co. PLC, 6.25%,02/15/26 (Call 02/15/21)(a) . . . . . . . . . . . . . . . . . . . . . . . . . . . . . 3,439 3,559,365
29,498,620Software — 2.1%ACI Worldwide Inc., 5.75%, 08/15/26 (Call 08/15/21)(a)(b) . . 1,819 1,919,045Ascend Learning LLC, 6.88%, 08/01/25
(Call 11/30/20)(a)(b) . . . . . . . . . . . . . . . . . . . . . . . . . . . . . . . . . . . . 2,792 2,857,233
SecurityPar
(000) Value
Software (continued)Black Knight InfoServ LLC, 3.63%, 09/01/28
(Call 09/01/23)(a)(b) . . . . . . . . . . . . . . . . . . . . . . . . . . . . . . . . . . . . $ 4,279 $ 4,332,487Blackboard Inc., 10.38%, 11/15/24 (Call 11/30/20)(a)(b) . . . . . 750 757,500Boxer Parent Co. Inc.
7.13%, 10/02/25 (Call 06/01/22)(a) . . . . . . . . . . . . . . . . . . . . . 2,590 2,776,7919.13%, 03/01/26 (Call 09/01/21)(a)(b) . . . . . . . . . . . . . . . . . . . 1,540 1,636,250
BY Crown Parent LLC, 7.38%, 10/15/24(Call 11/30/20)(a)(b) . . . . . . . . . . . . . . . . . . . . . . . . . . . . . . . . . . . . 1,368 1,381,680
BY Crown Parent LLC/BY Bond Finance Inc., 4.25%,01/31/26 (Call 07/31/22)(a) . . . . . . . . . . . . . . . . . . . . . . . . . . . . . 2,430 2,460,375
Camelot Finance SA, 4.50%, 11/01/26 (Call 11/01/22)(a) . . . 3,040 3,161,600Castle U.S. Holding Crop., 9.50%, 02/15/28
(Call 02/15/23)(a) . . . . . . . . . . . . . . . . . . . . . . . . . . . . . . . . . . . . . . 1,379 1,310,050CDK Global Inc.
4.88%, 06/01/27 (Call 06/01/22) . . . . . . . . . . . . . . . . . . . . . . . 3,174 3,289,2965.00%, 10/15/24 (Call 07/15/24) . . . . . . . . . . . . . . . . . . . . . . . 1,600 1,744,0005.25%, 05/15/29 (Call 05/15/24)(a) . . . . . . . . . . . . . . . . . . . . . 2,406 2,580,9165.88%, 06/15/26 (Call 06/15/21) . . . . . . . . . . . . . . . . . . . . . . . 2,032 2,115,820
Change Healthcare Holdings LLC/Change HealthcareFinance Inc., 5.75%, 03/01/25 (Call 11/10/20)(a) . . . . . . . . 5,823 5,820,496
Dun & Bradstreet Corp. (The), 6.88%, 08/15/26(Call 02/15/22)(a) . . . . . . . . . . . . . . . . . . . . . . . . . . . . . . . . . . . . . . 1,971 2,108,970
Dun & Bradstreet Corp./The, 10.25%, 02/15/27(Call 02/15/22)(a) . . . . . . . . . . . . . . . . . . . . . . . . . . . . . . . . . . . . . . 2,145 2,401,757
Fair Isaac Corp.4.00%, 06/15/28 (Call 12/15/22)(a)(b) . . . . . . . . . . . . . . . . . . . 1,514 1,565,0985.25%, 05/15/26 (Call 02/15/26)(a)(b) . . . . . . . . . . . . . . . . . . . 1,743 1,934,730
Genesys TelecommunicationsLaboratories Inc./Greeneden Lux 3 Sarl/GreenedenU.S. Ho, 10.00%, 11/30/24 (Call 11/30/20)(a). . . . . . . . . . . . 2,691 2,839,543
Granite Merger Sub 2 Inc., 11.00%, 07/15/27(Call 07/15/22)(a)(b) . . . . . . . . . . . . . . . . . . . . . . . . . . . . . . . . . . . . 1,283 1,392,055
j2 Cloud Services LLC/j2 Global Co-Obligor Inc., 6.00%,07/15/25 (Call 12/07/20)(a) . . . . . . . . . . . . . . . . . . . . . . . . . . . . . 2,924 3,062,305
J2 Global Inc., 4.63%, 10/15/30 (Call 10/15/25)(a) . . . . . . . . . 2,475 2,500,616Logan Merger Sub Inc., 5.50%, 09/01/27
(Call 09/01/23)(a)(b) . . . . . . . . . . . . . . . . . . . . . . . . . . . . . . . . . . . . 4,280 4,338,850MSCI Inc.
3.63%, 09/01/30 (Call 03/01/25)(a)(b) . . . . . . . . . . . . . . . . . . . 1,500 1,541,2503.88%, 02/15/31 (Call 06/01/25)(a) . . . . . . . . . . . . . . . . . . . . . 4,500 4,702,5004.00%, 11/15/29 (Call 11/15/24)(a)(b). . . . . . . . . . . . . . . . . . . . 4,486 4,681,8594.75%, 08/01/26 (Call 08/01/21)(a) . . . . . . . . . . . . . . . . . . . . . 2,307 2,396,3965.38%, 05/15/27 (Call 05/15/22)(a) . . . . . . . . . . . . . . . . . . . . . 1,954 2,085,895
Nuance Communications Inc., 5.63%, 12/15/26(Call 12/15/21)(b) . . . . . . . . . . . . . . . . . . . . . . . . . . . . . . . . . . . . . . 2,418 2,538,900
Open Text Corp.3.88%, 02/15/28 (Call 02/15/23)(a) . . . . . . . . . . . . . . . . . . . . . 3,860 3,920,9115.88%, 06/01/26 (Call 06/01/21)(a) . . . . . . . . . . . . . . . . . . . . . 4,151 4,317,040
Open Text Holdings Inc., 4.13%, 02/15/30(Call 02/15/25)(a) . . . . . . . . . . . . . . . . . . . . . . . . . . . . . . . . . . . . . . 3,872 4,017,200
PTC Inc.3.63%, 02/15/25 (Call 02/15/22)(a)(b) . . . . . . . . . . . . . . . . . . . 2,312 2,353,9054.00%, 02/15/28 (Call 02/15/23)(a) . . . . . . . . . . . . . . . . . . . . . 2,263 2,339,376
Rackspace Technology Global. Inc., 8.63%, 11/15/24(Call 11/30/20)(a)(b) . . . . . . . . . . . . . . . . . . . . . . . . . . . . . . . . . . . . 4,485 4,670,006
Riverbed Technology Inc., 8.88%, 03/01/23(Call 11/30/20)(a)(b) . . . . . . . . . . . . . . . . . . . . . . . . . . . . . . . . . . . . 1,588 1,079,840
Solera LLC/Solera Finance Inc., 10.50%, 03/01/24(Call 11/30/20)(a) . . . . . . . . . . . . . . . . . . . . . . . . . . . . . . . . . . . . . . 8,239 8,554,307
Schedule of Investments (continued)
October 31, 2020
iShares� Broad USD High Yield Corporate Bond ETF(Percentages shown are based on Net Assets)
48 2 0 2 0 I S H A R E S A N N U A L R E P O R T T O S H A R E H O L D E R S
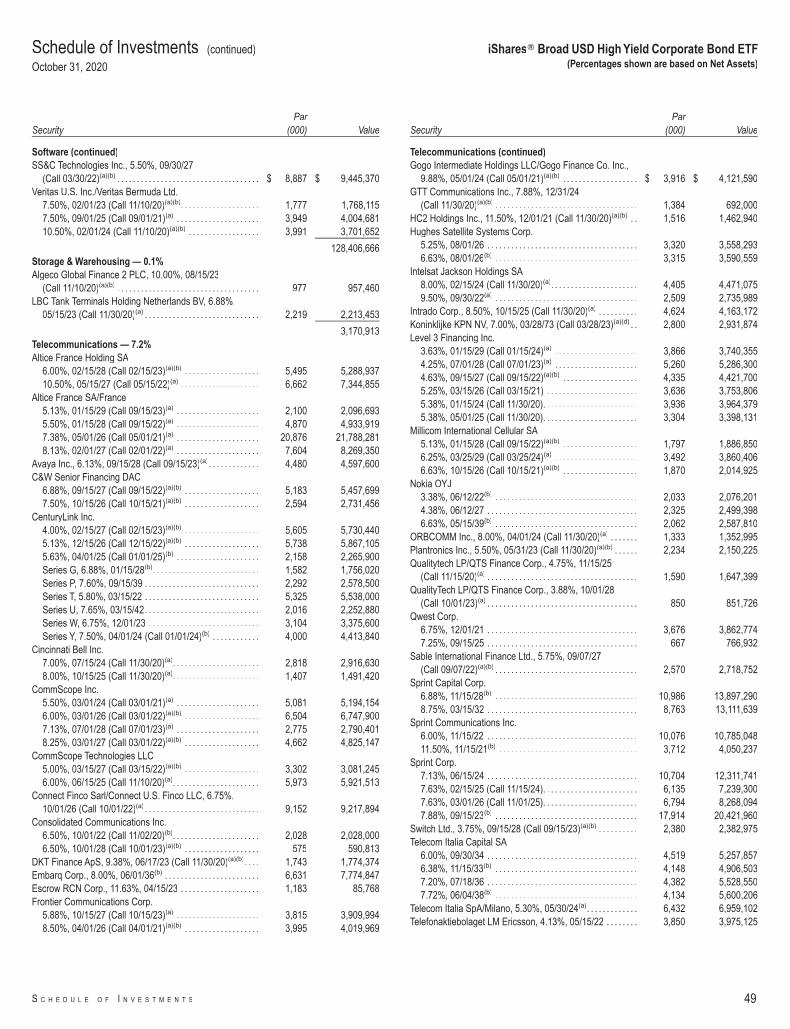
SecurityPar
(000) Value
Software (continued)SS&C Technologies Inc., 5.50%, 09/30/27
(Call 03/30/22)(a)(b) . . . . . . . . . . . . . . . . . . . . . . . . . . . . . . . . . . . . $ 8,887 $ 9,445,370Veritas U.S. Inc./Veritas Bermuda Ltd.
7.50%, 02/01/23 (Call 11/10/20)(a)(b). . . . . . . . . . . . . . . . . . . . 1,777 1,768,1157.50%, 09/01/25 (Call 09/01/21)(a) . . . . . . . . . . . . . . . . . . . . . 3,949 4,004,68110.50%, 02/01/24 (Call 11/10/20)(a)(b) . . . . . . . . . . . . . . . . . . 3,991 3,701,652
128,406,666Storage & Warehousing — 0.1%Algeco Global Finance 2 PLC, 10.00%, 08/15/23
(Call 11/10/20)(a)(b) . . . . . . . . . . . . . . . . . . . . . . . . . . . . . . . . . . . . 977 957,460LBC Tank Terminals Holding Netherlands BV, 6.88%,
05/15/23 (Call 11/30/20)(a) . . . . . . . . . . . . . . . . . . . . . . . . . . . . . 2,219 2,213,453
3,170,913Telecommunications — 7.2%Altice France Holding SA
6.00%, 02/15/28 (Call 02/15/23)(a)(b) . . . . . . . . . . . . . . . . . . . 5,495 5,288,93710.50%, 05/15/27 (Call 05/15/22)(a) . . . . . . . . . . . . . . . . . . . . 6,662 7,344,855
Altice France SA/France5.13%, 01/15/29 (Call 09/15/23)(a) . . . . . . . . . . . . . . . . . . . . . 2,100 2,096,6935.50%, 01/15/28 (Call 09/15/22)(a) . . . . . . . . . . . . . . . . . . . . . 4,870 4,933,9197.38%, 05/01/26 (Call 05/01/21)(a) . . . . . . . . . . . . . . . . . . . . . 20,876 21,788,2818.13%, 02/01/27 (Call 02/01/22)(a) . . . . . . . . . . . . . . . . . . . . . 7,604 8,269,350
Avaya Inc., 6.13%, 09/15/28 (Call 09/15/23)(a). . . . . . . . . . . . . 4,480 4,597,600C&W Senior Financing DAC
6.88%, 09/15/27 (Call 09/15/22)(a)(b) . . . . . . . . . . . . . . . . . . . 5,183 5,457,6997.50%, 10/15/26 (Call 10/15/21)(a)(b) . . . . . . . . . . . . . . . . . . . 2,594 2,731,456
CenturyLink Inc.4.00%, 02/15/27 (Call 02/15/23)(a)(b) . . . . . . . . . . . . . . . . . . . 5,605 5,730,4405.13%, 12/15/26 (Call 12/15/22)(a)(b) . . . . . . . . . . . . . . . . . . . 5,738 5,867,1055.63%, 04/01/25 (Call 01/01/25)(b) . . . . . . . . . . . . . . . . . . . . . 2,158 2,265,900Series G, 6.88%, 01/15/28(b). . . . . . . . . . . . . . . . . . . . . . . . . . . 1,582 1,756,020Series P, 7.60%, 09/15/39 . . . . . . . . . . . . . . . . . . . . . . . . . . . . . 2,292 2,578,500Series T, 5.80%, 03/15/22 . . . . . . . . . . . . . . . . . . . . . . . . . . . . . 5,325 5,538,000Series U, 7.65%, 03/15/42. . . . . . . . . . . . . . . . . . . . . . . . . . . . . 2,016 2,252,880Series W, 6.75%, 12/01/23 . . . . . . . . . . . . . . . . . . . . . . . . . . . . 3,104 3,375,600Series Y, 7.50%, 04/01/24 (Call 01/01/24)(b) . . . . . . . . . . . . 4,000 4,413,840
Cincinnati Bell Inc.7.00%, 07/15/24 (Call 11/30/20)(a). . . . . . . . . . . . . . . . . . . . . . 2,818 2,916,6308.00%, 10/15/25 (Call 11/30/20)(a). . . . . . . . . . . . . . . . . . . . . . 1,407 1,491,420
CommScope Inc.5.50%, 03/01/24 (Call 03/01/21)(a) . . . . . . . . . . . . . . . . . . . . . 5,081 5,194,1546.00%, 03/01/26 (Call 03/01/22)(a)(b) . . . . . . . . . . . . . . . . . . . 6,504 6,747,9007.13%, 07/01/28 (Call 07/01/23)(a) . . . . . . . . . . . . . . . . . . . . . 2,775 2,790,4018.25%, 03/01/27 (Call 03/01/22)(a)(b) . . . . . . . . . . . . . . . . . . . 4,662 4,825,147
CommScope Technologies LLC5.00%, 03/15/27 (Call 03/15/22)(a)(b) . . . . . . . . . . . . . . . . . . . 3,302 3,081,2456.00%, 06/15/25 (Call 11/10/20)(a). . . . . . . . . . . . . . . . . . . . . . 5,973 5,921,513
Connect Finco Sarl/Connect U.S. Finco LLC, 6.75%,10/01/26 (Call 10/01/22)(a) . . . . . . . . . . . . . . . . . . . . . . . . . . . . . 9,152 9,217,894
Consolidated Communications Inc.6.50%, 10/01/22 (Call 11/02/20)(b). . . . . . . . . . . . . . . . . . . . . . 2,028 2,028,0006.50%, 10/01/28 (Call 10/01/23)(a)(b) . . . . . . . . . . . . . . . . . . . 575 590,813
DKT Finance ApS, 9.38%, 06/17/23 (Call 11/30/20)(a)(b). . . . 1,743 1,774,374Embarq Corp., 8.00%, 06/01/36(b) . . . . . . . . . . . . . . . . . . . . . . . . 6,631 7,774,847Escrow RCN Corp., 11.63%, 04/15/23 . . . . . . . . . . . . . . . . . . . . 1,183 85,768Frontier Communications Corp.
5.88%, 10/15/27 (Call 10/15/23)(a) . . . . . . . . . . . . . . . . . . . . . 3,815 3,909,9948.50%, 04/01/26 (Call 04/01/21)(a)(b) . . . . . . . . . . . . . . . . . . . 3,995 4,019,969
SecurityPar
(000) Value
Telecommunications (continued)Gogo Intermediate Holdings LLC/Gogo Finance Co. Inc.,
9.88%, 05/01/24 (Call 05/01/21)(a)(b) . . . . . . . . . . . . . . . . . . . $ 3,916 $ 4,121,590GTT Communications Inc., 7.88%, 12/31/24
(Call 11/30/20)(a)(b) . . . . . . . . . . . . . . . . . . . . . . . . . . . . . . . . . . . . 1,384 692,000HC2 Holdings Inc., 11.50%, 12/01/21 (Call 11/30/20)(a)(b) . . 1,516 1,462,940Hughes Satellite Systems Corp.
5.25%, 08/01/26 . . . . . . . . . . . . . . . . . . . . . . . . . . . . . . . . . . . . . . 3,320 3,558,2936.63%, 08/01/26(b) . . . . . . . . . . . . . . . . . . . . . . . . . . . . . . . . . . . . 3,315 3,590,559
Intelsat Jackson Holdings SA8.00%, 02/15/24 (Call 11/30/20)(a). . . . . . . . . . . . . . . . . . . . . . 4,405 4,471,0759.50%, 09/30/22(a) . . . . . . . . . . . . . . . . . . . . . . . . . . . . . . . . . . . . 2,509 2,735,989
Intrado Corp., 8.50%, 10/15/25 (Call 11/30/20)(a) . . . . . . . . . . 4,624 4,163,172Koninklijke KPN NV, 7.00%, 03/28/73 (Call 03/28/23)(a)(d) . . 2,800 2,931,874Level 3 Financing Inc.
3.63%, 01/15/29 (Call 01/15/24)(a) . . . . . . . . . . . . . . . . . . . . . 3,866 3,740,3554.25%, 07/01/28 (Call 07/01/23)(a) . . . . . . . . . . . . . . . . . . . . . 5,260 5,286,3004.63%, 09/15/27 (Call 09/15/22)(a)(b) . . . . . . . . . . . . . . . . . . . 4,335 4,421,7005.25%, 03/15/26 (Call 03/15/21) . . . . . . . . . . . . . . . . . . . . . . . 3,636 3,753,8065.38%, 01/15/24 (Call 11/30/20). . . . . . . . . . . . . . . . . . . . . . . . 3,936 3,964,3795.38%, 05/01/25 (Call 11/30/20). . . . . . . . . . . . . . . . . . . . . . . . 3,304 3,398,131
Millicom International Cellular SA5.13%, 01/15/28 (Call 09/15/22)(a)(b) . . . . . . . . . . . . . . . . . . . 1,797 1,886,8506.25%, 03/25/29 (Call 03/25/24)(a) . . . . . . . . . . . . . . . . . . . . . 3,492 3,860,4066.63%, 10/15/26 (Call 10/15/21)(a)(b) . . . . . . . . . . . . . . . . . . . 1,870 2,014,925
Nokia OYJ3.38%, 06/12/22(b) . . . . . . . . . . . . . . . . . . . . . . . . . . . . . . . . . . . . 2,033 2,076,2014.38%, 06/12/27 . . . . . . . . . . . . . . . . . . . . . . . . . . . . . . . . . . . . . . 2,325 2,499,3986.63%, 05/15/39(b) . . . . . . . . . . . . . . . . . . . . . . . . . . . . . . . . . . . . 2,062 2,587,810
ORBCOMM Inc., 8.00%, 04/01/24 (Call 11/30/20)(a) . . . . . . . 1,333 1,352,995Plantronics Inc., 5.50%, 05/31/23 (Call 11/30/20)(a)(b) . . . . . . 2,234 2,150,225Qualitytech LP/QTS Finance Corp., 4.75%, 11/15/25
(Call 11/15/20)(a) . . . . . . . . . . . . . . . . . . . . . . . . . . . . . . . . . . . . . . 1,590 1,647,399QualityTech LP/QTS Finance Corp., 3.88%, 10/01/28
(Call 10/01/23)(a) . . . . . . . . . . . . . . . . . . . . . . . . . . . . . . . . . . . . . . 850 851,726Qwest Corp.
6.75%, 12/01/21 . . . . . . . . . . . . . . . . . . . . . . . . . . . . . . . . . . . . . . 3,676 3,862,7747.25%, 09/15/25 . . . . . . . . . . . . . . . . . . . . . . . . . . . . . . . . . . . . . . 667 766,932
Sable International Finance Ltd., 5.75%, 09/07/27(Call 09/07/22)(a)(b) . . . . . . . . . . . . . . . . . . . . . . . . . . . . . . . . . . . . 2,570 2,718,752
Sprint Capital Corp.6.88%, 11/15/28(b) . . . . . . . . . . . . . . . . . . . . . . . . . . . . . . . . . . . . 10,986 13,897,2908.75%, 03/15/32 . . . . . . . . . . . . . . . . . . . . . . . . . . . . . . . . . . . . . . 8,763 13,111,639
Sprint Communications Inc.6.00%, 11/15/22 . . . . . . . . . . . . . . . . . . . . . . . . . . . . . . . . . . . . . . 10,076 10,785,04811.50%, 11/15/21(b) . . . . . . . . . . . . . . . . . . . . . . . . . . . . . . . . . . . 3,712 4,050,237
Sprint Corp.7.13%, 06/15/24 . . . . . . . . . . . . . . . . . . . . . . . . . . . . . . . . . . . . . . 10,704 12,311,7417.63%, 02/15/25 (Call 11/15/24). . . . . . . . . . . . . . . . . . . . . . . . 6,135 7,239,3007.63%, 03/01/26 (Call 11/01/25). . . . . . . . . . . . . . . . . . . . . . . . 6,794 8,268,0947.88%, 09/15/23(b) . . . . . . . . . . . . . . . . . . . . . . . . . . . . . . . . . . . . 17,914 20,421,960
Switch Ltd., 3.75%, 09/15/28 (Call 09/15/23)(a)(b) . . . . . . . . . . 2,380 2,382,975Telecom Italia Capital SA
6.00%, 09/30/34 . . . . . . . . . . . . . . . . . . . . . . . . . . . . . . . . . . . . . . 4,519 5,257,8576.38%, 11/15/33(b) . . . . . . . . . . . . . . . . . . . . . . . . . . . . . . . . . . . . 4,148 4,906,5037.20%, 07/18/36 . . . . . . . . . . . . . . . . . . . . . . . . . . . . . . . . . . . . . . 4,382 5,528,5507.72%, 06/04/38(b) . . . . . . . . . . . . . . . . . . . . . . . . . . . . . . . . . . . . 4,134 5,600,206
Telecom Italia SpA/Milano, 5.30%, 05/30/24(a). . . . . . . . . . . . . 6,432 6,959,102Telefonaktiebolaget LM Ericsson, 4.13%, 05/15/22 . . . . . . . . 3,850 3,975,125
Schedule of Investments (continued)
October 31, 2020
iShares� Broad USD High Yield Corporate Bond ETF(Percentages shown are based on Net Assets)
S C H E D U L E O F I N V E S T M E N T S 49
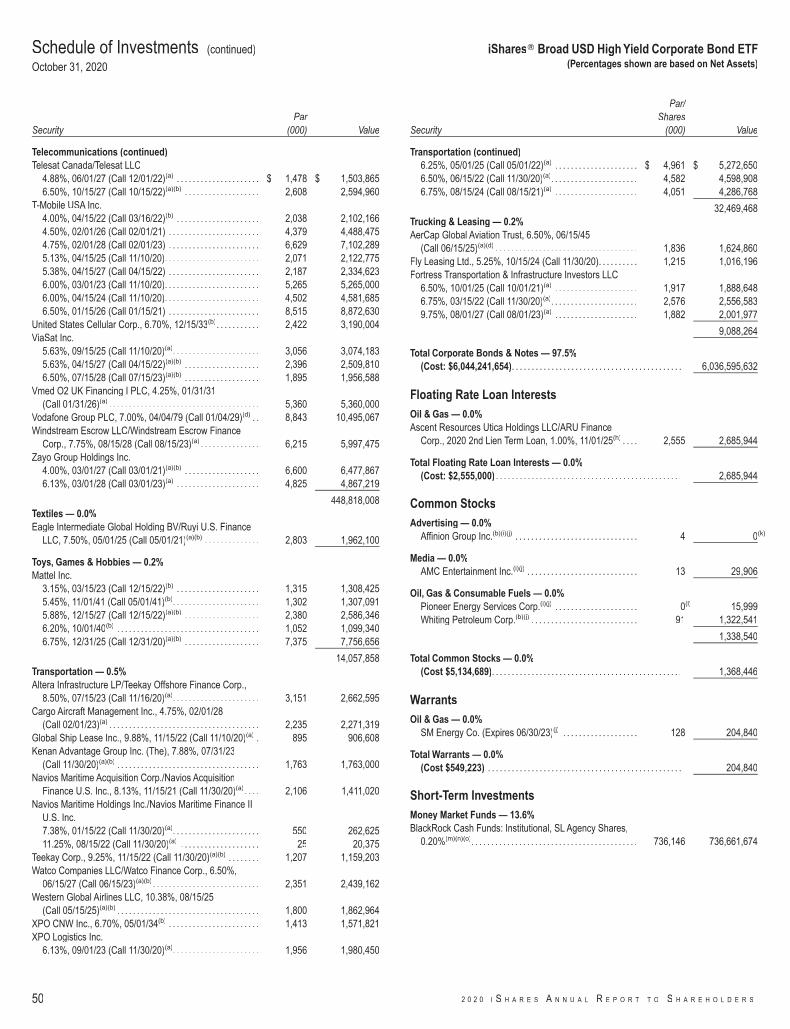
SecurityPar
(000) Value
Telecommunications (continued)Telesat Canada/Telesat LLC
4.88%, 06/01/27 (Call 12/01/22)(a) . . . . . . . . . . . . . . . . . . . . . $ 1,478 $ 1,503,8656.50%, 10/15/27 (Call 10/15/22)(a)(b) . . . . . . . . . . . . . . . . . . . 2,608 2,594,960
T-Mobile USA Inc.4.00%, 04/15/22 (Call 03/16/22)(b) . . . . . . . . . . . . . . . . . . . . . 2,038 2,102,1664.50%, 02/01/26 (Call 02/01/21) . . . . . . . . . . . . . . . . . . . . . . . 4,379 4,488,4754.75%, 02/01/28 (Call 02/01/23) . . . . . . . . . . . . . . . . . . . . . . . 6,629 7,102,2895.13%, 04/15/25 (Call 11/10/20). . . . . . . . . . . . . . . . . . . . . . . . 2,071 2,122,7755.38%, 04/15/27 (Call 04/15/22) . . . . . . . . . . . . . . . . . . . . . . . 2,187 2,334,6236.00%, 03/01/23 (Call 11/10/20). . . . . . . . . . . . . . . . . . . . . . . . 5,265 5,265,0006.00%, 04/15/24 (Call 11/10/20). . . . . . . . . . . . . . . . . . . . . . . . 4,502 4,581,6856.50%, 01/15/26 (Call 01/15/21) . . . . . . . . . . . . . . . . . . . . . . . 8,515 8,872,630
United States Cellular Corp., 6.70%, 12/15/33(b). . . . . . . . . . . 2,422 3,190,004ViaSat Inc.
5.63%, 09/15/25 (Call 11/10/20)(a). . . . . . . . . . . . . . . . . . . . . . 3,056 3,074,1835.63%, 04/15/27 (Call 04/15/22)(a)(b) . . . . . . . . . . . . . . . . . . . 2,396 2,509,8106.50%, 07/15/28 (Call 07/15/23)(a)(b) . . . . . . . . . . . . . . . . . . . 1,895 1,956,588
Vmed O2 UK Financing I PLC, 4.25%, 01/31/31(Call 01/31/26)(a) . . . . . . . . . . . . . . . . . . . . . . . . . . . . . . . . . . . . . . 5,360 5,360,000
Vodafone Group PLC, 7.00%, 04/04/79 (Call 01/04/29)(d) . . 8,843 10,495,067Windstream Escrow LLC/Windstream Escrow Finance
Corp., 7.75%, 08/15/28 (Call 08/15/23)(a) . . . . . . . . . . . . . . . 6,215 5,997,475Zayo Group Holdings Inc.
4.00%, 03/01/27 (Call 03/01/21)(a)(b) . . . . . . . . . . . . . . . . . . . 6,600 6,477,8676.13%, 03/01/28 (Call 03/01/23)(a) . . . . . . . . . . . . . . . . . . . . . 4,825 4,867,219
448,818,008Textiles — 0.0%Eagle Intermediate Global Holding BV/Ruyi U.S. Finance
LLC, 7.50%, 05/01/25 (Call 05/01/21)(a)(b) . . . . . . . . . . . . . . 2,803 1,962,100
Toys, Games & Hobbies — 0.2%Mattel Inc.
3.15%, 03/15/23 (Call 12/15/22)(b) . . . . . . . . . . . . . . . . . . . . . 1,315 1,308,4255.45%, 11/01/41 (Call 05/01/41)(b). . . . . . . . . . . . . . . . . . . . . . 1,302 1,307,0915.88%, 12/15/27 (Call 12/15/22)(a)(b) . . . . . . . . . . . . . . . . . . . 2,380 2,586,3466.20%, 10/01/40(b) . . . . . . . . . . . . . . . . . . . . . . . . . . . . . . . . . . . . 1,052 1,099,3406.75%, 12/31/25 (Call 12/31/20)(a)(b) . . . . . . . . . . . . . . . . . . . 7,375 7,756,656
14,057,858Transportation — 0.5%Altera Infrastructure LP/Teekay Offshore Finance Corp.,
8.50%, 07/15/23 (Call 11/16/20)(a). . . . . . . . . . . . . . . . . . . . . . 3,151 2,662,595Cargo Aircraft Management Inc., 4.75%, 02/01/28
(Call 02/01/23)(a) . . . . . . . . . . . . . . . . . . . . . . . . . . . . . . . . . . . . . . 2,235 2,271,319Global Ship Lease Inc., 9.88%, 11/15/22 (Call 11/10/20)(a) . 895 906,608Kenan Advantage Group Inc. (The), 7.88%, 07/31/23
(Call 11/30/20)(a)(b) . . . . . . . . . . . . . . . . . . . . . . . . . . . . . . . . . . . . 1,763 1,763,000Navios Maritime Acquisition Corp./Navios Acquisition
Finance U.S. Inc., 8.13%, 11/15/21 (Call 11/30/20)(a). . . . 2,106 1,411,020Navios Maritime Holdings Inc./Navios Maritime Finance II
U.S. Inc.7.38%, 01/15/22 (Call 11/30/20)(a). . . . . . . . . . . . . . . . . . . . . . 550 262,62511.25%, 08/15/22 (Call 11/30/20)(a) . . . . . . . . . . . . . . . . . . . . 25 20,375
Teekay Corp., 9.25%, 11/15/22 (Call 11/30/20)(a)(b) . . . . . . . . 1,207 1,159,203Watco Companies LLC/Watco Finance Corp., 6.50%,
06/15/27 (Call 06/15/23)(a)(b) . . . . . . . . . . . . . . . . . . . . . . . . . . . 2,351 2,439,162Western Global Airlines LLC, 10.38%, 08/15/25
(Call 05/15/25)(a)(b) . . . . . . . . . . . . . . . . . . . . . . . . . . . . . . . . . . . . 1,800 1,862,964XPO CNW Inc., 6.70%, 05/01/34(b) . . . . . . . . . . . . . . . . . . . . . . . 1,413 1,571,821XPO Logistics Inc.
6.13%, 09/01/23 (Call 11/30/20)(a). . . . . . . . . . . . . . . . . . . . . . 1,956 1,980,450
Security
Par/Shares
(000) Value
Transportation (continued)6.25%, 05/01/25 (Call 05/01/22)(a) . . . . . . . . . . . . . . . . . . . . . $ 4,961 $ 5,272,6506.50%, 06/15/22 (Call 11/30/20)(a). . . . . . . . . . . . . . . . . . . . . . 4,582 4,598,9086.75%, 08/15/24 (Call 08/15/21)(a) . . . . . . . . . . . . . . . . . . . . . 4,051 4,286,768
32,469,468Trucking & Leasing — 0.2%AerCap Global Aviation Trust, 6.50%, 06/15/45
(Call 06/15/25)(a)(d) . . . . . . . . . . . . . . . . . . . . . . . . . . . . . . . . . . . . 1,836 1,624,860Fly Leasing Ltd., 5.25%, 10/15/24 (Call 11/30/20). . . . . . . . . . 1,215 1,016,196Fortress Transportation & Infrastructure Investors LLC
6.50%, 10/01/25 (Call 10/01/21)(a) . . . . . . . . . . . . . . . . . . . . . 1,917 1,888,6486.75%, 03/15/22 (Call 11/30/20)(a). . . . . . . . . . . . . . . . . . . . . . 2,576 2,556,5839.75%, 08/01/27 (Call 08/01/23)(a) . . . . . . . . . . . . . . . . . . . . . 1,882 2,001,977
9,088,264
Total Corporate Bonds & Notes — 97.5%(Cost: $6,044,241,654). . . . . . . . . . . . . . . . . . . . . . . . . . . . . . . . . . . . . . . . . . . 6,036,595,632
Floating Rate Loan InterestsOil & Gas — 0.0%Ascent Resources Utica Holdings LLC/ARU Finance
Corp., 2020 2nd Lien Term Loan, 1.00%, 11/01/25(h) . . . . 2,555 2,685,944
Total Floating Rate Loan Interests — 0.0%(Cost: $2,555,000) . . . . . . . . . . . . . . . . . . . . . . . . . . . . . . . . . . . . . . . . . . . . . . . 2,685,944
Common StocksAdvertising — 0.0%
Affinion Group Inc.(b)(i)(j) . . . . . . . . . . . . . . . . . . . . . . . . . . . . . . . 4 0(k)
Media — 0.0%AMC Entertainment Inc.(i)(j) . . . . . . . . . . . . . . . . . . . . . . . . . . . . 13 29,906
Oil, Gas & Consumable Fuels — 0.0%Pioneer Energy Services Corp.(i)(j) . . . . . . . . . . . . . . . . . . . . . 0(l) 15,999Whiting Petroleum Corp.(b)(j) . . . . . . . . . . . . . . . . . . . . . . . . . . . 91 1,322,541
1,338,540
Total Common Stocks — 0.0%(Cost $5,134,689). . . . . . . . . . . . . . . . . . . . . . . . . . . . . . . . . . . . . . . . . . . . . . . . 1,368,446
WarrantsOil & Gas — 0.0%
SM Energy Co. (Expires 06/30/23)(j) . . . . . . . . . . . . . . . . . . . 128 204,840
Total Warrants — 0.0%(Cost $549,223) . . . . . . . . . . . . . . . . . . . . . . . . . . . . . . . . . . . . . . . . . . . . . . . . . 204,840
Short-Term InvestmentsMoney Market Funds — 13.6%BlackRock Cash Funds: Institutional, SL Agency Shares,
0.20%(m)(n)(o). . . . . . . . . . . . . . . . . . . . . . . . . . . . . . . . . . . . . . . . . . 736,146 736,661,674
Schedule of Investments (continued)
October 31, 2020
iShares� Broad USD High Yield Corporate Bond ETF(Percentages shown are based on Net Assets)
50 2 0 2 0 I S H A R E S A N N U A L R E P O R T T O S H A R E H O L D E R S
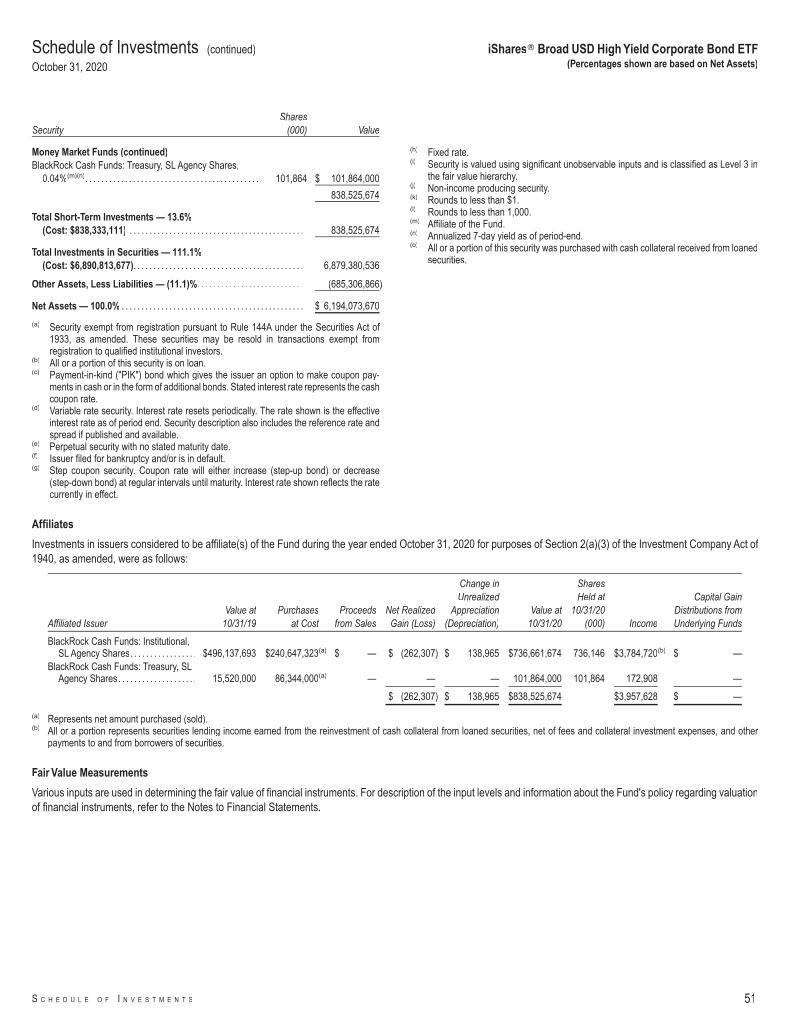
SecurityShares
(000) Value
Money Market Funds (continued)BlackRock Cash Funds: Treasury, SL Agency Shares,
0.04%(m)(n). . . . . . . . . . . . . . . . . . . . . . . . . . . . . . . . . . . . . . . . . . . . 101,864 $ 101,864,000
838,525,674
Total Short-Term Investments — 13.6%(Cost: $838,333,111) . . . . . . . . . . . . . . . . . . . . . . . . . . . . . . . . . . . . . . . . . . . . 838,525,674
Total Investments in Securities — 111.1%(Cost: $6,890,813,677). . . . . . . . . . . . . . . . . . . . . . . . . . . . . . . . . . . . . . . . . . . 6,879,380,536
Other Assets, Less Liabilities — (11.1)%. . . . . . . . . . . . . . . . . . . . . . . . . . . (685,306,866)
Net Assets — 100.0% . . . . . . . . . . . . . . . . . . . . . . . . . . . . . . . . . . . . . . . . . . . . . . $ 6,194,073,670
(a) Security exempt from registration pursuant to Rule 144A under the Securities Act of1933, as amended. These securities may be resold in transactions exempt fromregistration to qualified institutional investors.
(b) All or a portion of this security is on loan.(c) Payment-in-kind ("PIK") bond which gives the issuer an option to make coupon pay-
ments in cash or in the form of additional bonds. Stated interest rate represents the cashcoupon rate.
(d) Variable rate security. Interest rate resets periodically. The rate shown is the effectiveinterest rate as of period end. Security description also includes the reference rate andspread if published and available.
(e) Perpetual security with no stated maturity date.(f) Issuer filed for bankruptcy and/or is in default.(g) Step coupon security. Coupon rate will either increase (step-up bond) or decrease
(step-down bond) at regular intervals until maturity. Interest rate shown reflects the ratecurrently in effect.
(h) Fixed rate.(i) Security is valued using significant unobservable inputs and is classified as Level 3 in
the fair value hierarchy.(j) Non-income producing security.(k) Rounds to less than $1.(l) Rounds to less than 1,000.(m) Affiliate of the Fund.(n) Annualized 7-day yield as of period-end.(o) All or a portion of this security was purchased with cash collateral received from loaned
securities.
Affiliates
Investments in issuers considered to be affiliate(s) of the Fund during the year ended October 31, 2020 for purposes of Section 2(a)(3) of the Investment Company Act of1940, as amended, were as follows:
Affiliated IssuerValue at
10/31/19Purchases
at CostProceeds
from SalesNet Realized
Gain (Loss)
Change inUnrealized
Appreciation(Depreciation)
Value at10/31/20
SharesHeld at
10/31/20(000) Income
Capital GainDistributions fromUnderlying Funds
BlackRock Cash Funds: Institutional,SL Agency Shares. . . . . . . . . . . . . . . . . $496,137,693 $240,647,323(a) $ — $ (262,307) $ 138,965 $736,661,674 736,146 $3,784,720(b) $ —
BlackRock Cash Funds: Treasury, SLAgency Shares. . . . . . . . . . . . . . . . . . . . 15,520,000 86,344,000(a) — — — 101,864,000 101,864 172,908 —
$ (262,307) $ 138,965 $838,525,674 $3,957,628 $ —
(a) Represents net amount purchased (sold).(b) All or a portion represents securities lending income earned from the reinvestment of cash collateral from loaned securities, net of fees and collateral investment expenses, and other
payments to and from borrowers of securities.
Fair Value Measurements
Various inputs are used in determining the fair value of financial instruments. For description of the input levels and information about the Fund's policy regarding valuationof financial instruments, refer to the Notes to Financial Statements.
Schedule of Investments (continued)
October 31, 2020
iShares� Broad USD High Yield Corporate Bond ETF(Percentages shown are based on Net Assets)
S C H E D U L E O F I N V E S T M E N T S 51
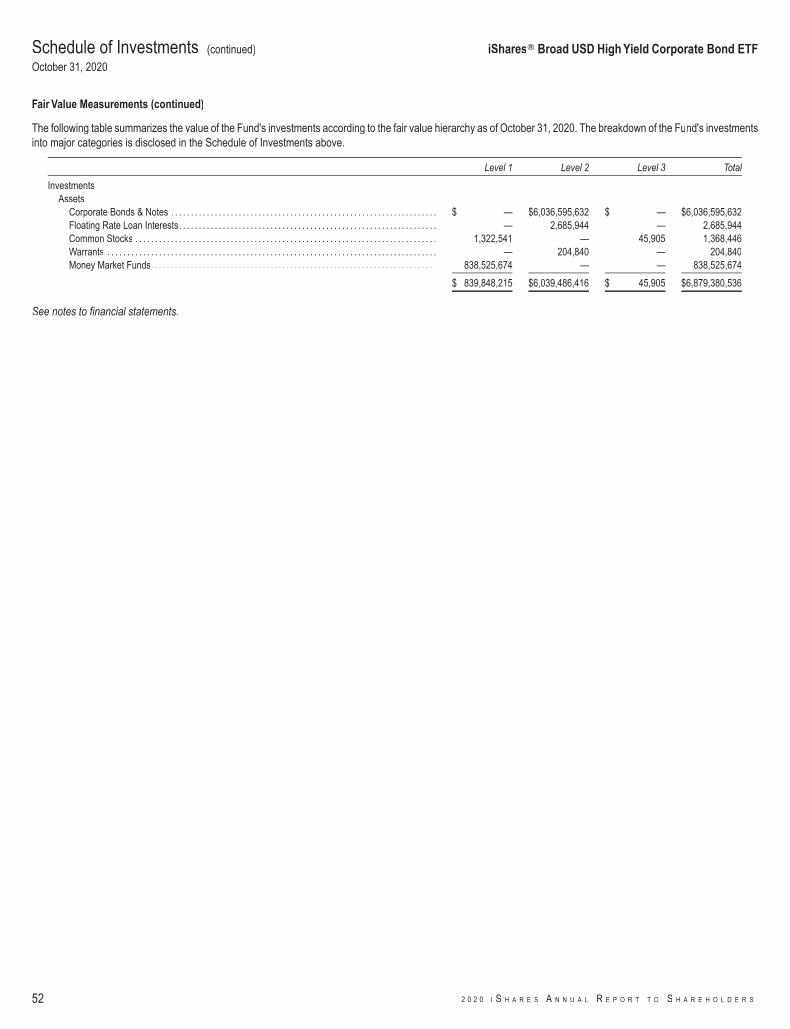
Fair Value Measurements (continued)
The following table summarizes the value of the Fund's investments according to the fair value hierarchy as of October 31, 2020. The breakdown of the Fund's investmentsinto major categories is disclosed in the Schedule of Investments above.
Level 1 Level 2 Level 3 Total
InvestmentsAssets
Corporate Bonds & Notes . . . . . . . . . . . . . . . . . . . . . . . . . . . . . . . . . . . . . . . . . . . . . . . . . . . . . . . . . . . . . . . . . . . $ — $6,036,595,632 $ — $6,036,595,632Floating Rate Loan Interests. . . . . . . . . . . . . . . . . . . . . . . . . . . . . . . . . . . . . . . . . . . . . . . . . . . . . . . . . . . . . . . . . — 2,685,944 — 2,685,944Common Stocks . . . . . . . . . . . . . . . . . . . . . . . . . . . . . . . . . . . . . . . . . . . . . . . . . . . . . . . . . . . . . . . . . . . . . . . . . . . . 1,322,541 — 45,905 1,368,446Warrants . . . . . . . . . . . . . . . . . . . . . . . . . . . . . . . . . . . . . . . . . . . . . . . . . . . . . . . . . . . . . . . . . . . . . . . . . . . . . . . . . . . — 204,840 — 204,840Money Market Funds. . . . . . . . . . . . . . . . . . . . . . . . . . . . . . . . . . . . . . . . . . . . . . . . . . . . . . . . . . . . . . . . . . . . . . . . 838,525,674 — — 838,525,674
$ 839,848,215 $6,039,486,416 $ 45,905 $6,879,380,536
See notes to financial statements.
Schedule of Investments (continued)
October 31, 2020
iShares� Broad USD High Yield Corporate Bond ETF
52 2 0 2 0 I S H A R E S A N N U A L R E P O R T T O S H A R E H O L D E R S

SecurityPar
(000) Value
Corporate Bonds & NotesAdvertising — 0.4%National CineMedia LLC, 5.88%, 04/15/28 (Call 04/15/23)(a). . . . . $ 50 $ 34,877Outfront Media Capital LLC/Outfront Media Capital Corp.
4.63%, 03/15/30 (Call 03/15/25)(a) . . . . . . . . . . . . . . . . . . . . . . . . . . . 45 41,3445.00%, 08/15/27 (Call 08/15/22)(a) . . . . . . . . . . . . . . . . . . . . . . . . . . . 110 104,2355.63%, 02/15/24 (Call 02/15/21) . . . . . . . . . . . . . . . . . . . . . . . . . . . . . 46 46,8236.25%, 06/15/25 (Call 06/15/22)(a) . . . . . . . . . . . . . . . . . . . . . . . . . . . 40 40,891
268,170Aerospace & Defense — 4.1%Howmet Aerospace Inc.
5.13%, 10/01/24 (Call 07/01/24) . . . . . . . . . . . . . . . . . . . . . . . . . . . . . 160 168,2985.90%, 02/01/27 . . . . . . . . . . . . . . . . . . . . . . . . . . . . . . . . . . . . . . . . . . . . 75 82,8325.95%, 02/01/37 . . . . . . . . . . . . . . . . . . . . . . . . . . . . . . . . . . . . . . . . . . . . 75 82,5846.88%, 05/01/25 (Call 04/01/25) . . . . . . . . . . . . . . . . . . . . . . . . . . . . . 140 155,649
Moog Inc., 4.25%, 12/15/27 (Call 12/15/22)(a). . . . . . . . . . . . . . . . . . . 75 76,893Signature Aviation U.S. Holdings Inc.
4.00%, 03/01/28 (Call 03/01/23)(a) . . . . . . . . . . . . . . . . . . . . . . . . . . . 95 91,9135.38%, 05/01/26 (Call 05/01/21)(a) . . . . . . . . . . . . . . . . . . . . . . . . . . . 50 50,640
Spirit AeroSystems Inc.4.60%, 06/15/28 (Call 03/15/28) . . . . . . . . . . . . . . . . . . . . . . . . . . . . . 90 74,8345.50%, 01/15/25 (Call 10/15/22)(a)(b) . . . . . . . . . . . . . . . . . . . . . . . . . 60 61,0227.50%, 04/15/25 (Call 04/15/22)(a) . . . . . . . . . . . . . . . . . . . . . . . . . . . 165 166,469
SSL Robotics LLC, 9.75%, 12/31/23 (Call 12/15/21)(a) . . . . . . . . . . 100 111,251TransDigm Inc.
5.50%, 11/15/27 (Call 11/15/22) . . . . . . . . . . . . . . . . . . . . . . . . . . . . . 240 234,2456.25%, 03/15/26 (Call 03/15/22)(a) . . . . . . . . . . . . . . . . . . . . . . . . . . . 430 448,4086.38%, 06/15/26 (Call 06/15/21) . . . . . . . . . . . . . . . . . . . . . . . . . . . . . 110 109,6166.50%, 07/15/24 (Call 07/15/21)(b) . . . . . . . . . . . . . . . . . . . . . . . . . . . 110 110,3326.50%, 05/15/25 (Call 05/15/21) . . . . . . . . . . . . . . . . . . . . . . . . . . . . . 85 84,9697.50%, 03/15/27 (Call 03/15/22) . . . . . . . . . . . . . . . . . . . . . . . . . . . . . 120 123,9658.00%, 12/15/25 (Call 04/08/22)(a) . . . . . . . . . . . . . . . . . . . . . . . . . . . 105 113,692
Triumph Group Inc.6.25%, 09/15/24 (Call 09/15/21)(a) . . . . . . . . . . . . . . . . . . . . . . . . . . . 70 60,5047.75%, 08/15/25 (Call 08/15/21) . . . . . . . . . . . . . . . . . . . . . . . . . . . . . 60 39,0028.88%, 06/01/24 (Call 02/01/23)(a) . . . . . . . . . . . . . . . . . . . . . . . . . . . 72 76,648
2,523,766Agriculture — 0.1%Darling Ingredients Inc., 5.25%, 04/15/27 (Call 04/15/22)(a) . . . . . . 50 53,009
Apparel — 1.1%Hanesbrands Inc.
4.63%, 05/15/24 (Call 02/15/24)(a) . . . . . . . . . . . . . . . . . . . . . . . . . . . 115 119,8134.88%, 05/15/26 (Call 02/15/26)(a)(b) . . . . . . . . . . . . . . . . . . . . . . . . . 135 145,2075.38%, 05/15/25 (Call 05/15/22)(a) . . . . . . . . . . . . . . . . . . . . . . . . . . . 30 31,571
Levi Strauss & Co., 5.00%, 05/01/25 (Call 05/01/21) . . . . . . . . . . . . 105 107,642Michael Kors USA Inc., 4.50%, 11/01/24 (Call 09/01/24)(a). . . . . . . 50 49,069Under Armour Inc., 3.25%, 06/15/26 (Call 03/15/26)(b). . . . . . . . . . . 100 96,757William Carter Co. (The)
5.50%, 05/15/25 (Call 05/15/22)(a) . . . . . . . . . . . . . . . . . . . . . . . . . . . 90 94,5215.63%, 03/15/27 (Call 03/15/22)(a) . . . . . . . . . . . . . . . . . . . . . . . . . . . 50 52,461
697,041Auto Manufacturers — 1.3%Allison Transmission Inc.
4.75%, 10/01/27 (Call 10/01/22)(a) . . . . . . . . . . . . . . . . . . . . . . . . . . . 70 72,5125.00%, 10/01/24 (Call 10/01/21)(a) . . . . . . . . . . . . . . . . . . . . . . . . . . . 95 95,8325.88%, 06/01/29 (Call 06/01/24)(a) . . . . . . . . . . . . . . . . . . . . . . . . . . . 70 76,552
Navistar International Corp.6.63%, 11/01/25 (Call 11/01/20)(a) . . . . . . . . . . . . . . . . . . . . . . . . . . . 160 165,4539.50%, 05/01/25 (Call 04/21/22)(a) . . . . . . . . . . . . . . . . . . . . . . . . . . . 110 121,842
SecurityPar
(000) Value
Auto Manufacturers (continued)Tesla Inc., 5.30%, 08/15/25 (Call 08/15/21)(a) . . . . . . . . . . . . . . . . . . . $ 225 $ 232,805
764,996Auto Parts & Equipment — 1.3%American Axle & Manufacturing Inc.
6.25%, 04/01/25 (Call 04/01/21)(b) . . . . . . . . . . . . . . . . . . . . . . . . . . . 85 86,0716.25%, 03/15/26 (Call 03/15/21) . . . . . . . . . . . . . . . . . . . . . . . . . . . . . 15 15,0366.50%, 04/01/27 (Call 04/01/22) . . . . . . . . . . . . . . . . . . . . . . . . . . . . . 70 70,5136.88%, 07/01/28 (Call 07/01/23) . . . . . . . . . . . . . . . . . . . . . . . . . . . . . 80 81,303
BorgWarner Inc., 5.00%, 10/01/25(a) . . . . . . . . . . . . . . . . . . . . . . . . . . . 100 116,094Dana Financing Luxembourg Sarl, 5.75%, 04/15/25
(Call 04/15/21)(a) . . . . . . . . . . . . . . . . . . . . . . . . . . . . . . . . . . . . . . . . . . . 45 46,574Dana Inc.
5.38%, 11/15/27 (Call 11/15/22) . . . . . . . . . . . . . . . . . . . . . . . . . . . . . 60 62,3175.50%, 12/15/24 (Call 12/15/20) . . . . . . . . . . . . . . . . . . . . . . . . . . . . . 20 20,4115.63%, 06/15/28 (Call 06/15/23) . . . . . . . . . . . . . . . . . . . . . . . . . . . . . 55 57,758
IHO Verwaltungs GmbH (5.50% PIK), 4.75%, 09/15/26(Call 09/15/21)(a)(c) . . . . . . . . . . . . . . . . . . . . . . . . . . . . . . . . . . . . . . . . . 200 201,946
Tenneco Inc., 5.00%, 07/15/26 (Call 07/15/21)(b) . . . . . . . . . . . . . . . . 50 38,813
796,836Banks — 1.5%CIT Group Inc.
3.93%, 06/19/24 (Call 06/19/23)(d) . . . . . . . . . . . . . . . . . . . . . . . . . . . 70 72,9114.75%, 02/16/24 (Call 11/16/23) . . . . . . . . . . . . . . . . . . . . . . . . . . . . . 45 48,3735.00%, 08/15/22. . . . . . . . . . . . . . . . . . . . . . . . . . . . . . . . . . . . . . . . . . . . 125 131,7495.00%, 08/01/23. . . . . . . . . . . . . . . . . . . . . . . . . . . . . . . . . . . . . . . . . . . . 130 140,0405.25%, 03/07/25 (Call 12/07/24) . . . . . . . . . . . . . . . . . . . . . . . . . . . . . 25 27,9416.13%, 03/09/28. . . . . . . . . . . . . . . . . . . . . . . . . . . . . . . . . . . . . . . . . . . . 60 73,053
Commerzbank AG, 8.13%, 09/19/23(a) . . . . . . . . . . . . . . . . . . . . . . . . . 200 229,838Dresdner Funding Trust I, 8.15%, 06/30/31 (Call 06/30/29)(a) . . . . 100 146,260Morgan Stanley, 5.88%, (Call 09/15/26)(d)(e) . . . . . . . . . . . . . . . . . . . . 50 55,079
925,244Beverages — 0.2%Primo Water Holdings Inc., 5.50%, 04/01/25 (Call 04/01/21)(a) . . . 100 103,258
Building Materials — 1.7%Boise Cascade Co., 4.88%, 07/01/30 (Call 07/01/25)(a). . . . . . . . . . 50 53,478Builders FirstSource Inc.
5.00%, 03/01/30 (Call 03/01/25)(a) . . . . . . . . . . . . . . . . . . . . . . . . . . . 55 57,9546.75%, 06/01/27 (Call 06/01/22)(a) . . . . . . . . . . . . . . . . . . . . . . . . . . . 105 112,596
Cornerstone Building Brands Inc.6.13%, 01/15/29 (Call 09/15/23)(a) . . . . . . . . . . . . . . . . . . . . . . . . . . . 60 61,3508.00%, 04/15/26 (Call 04/15/21)(a) . . . . . . . . . . . . . . . . . . . . . . . . . . . 75 77,920
Forterra Finance LLC/FRTA Finance Corp., 6.50%, 07/15/25(Call 07/15/22)(a) . . . . . . . . . . . . . . . . . . . . . . . . . . . . . . . . . . . . . . . . . . . 75 79,372
James Hardie International Finance DAC, 5.00%, 01/15/28(Call 01/15/23)(a)(b) . . . . . . . . . . . . . . . . . . . . . . . . . . . . . . . . . . . . . . . . . 200 213,972
Jeld-Wen Inc., 4.88%, 12/15/27 (Call 12/15/22)(a) . . . . . . . . . . . . . . . 100 103,499JELD-WEN Inc., 6.25%, 05/15/25 (Call 05/15/22)(a) . . . . . . . . . . . . . 20 21,515Masonite International Corp., 5.38%, 02/01/28 (Call 02/01/23)(a) . 50 53,228Summit Materials LLC/Summit Materials Finance Corp., 5.25%,
01/15/29 (Call 07/15/23)(a) . . . . . . . . . . . . . . . . . . . . . . . . . . . . . . . . . . 80 82,402US Concrete Inc., 5.13%, 03/01/29 (Call 03/01/23)(a). . . . . . . . . . . . 100 101,793
1,019,079Chemicals — 1.1%Axalta Coating Systems LLC/Axalta Coating Systems Dutch
Holding B BV, 4.75%, 06/15/27 (Call 06/15/23)(a) . . . . . . . . . . . . . 150 157,314Ingevity Corp., 3.88%, 11/01/28 (Call 11/01/23)(a) . . . . . . . . . . . . . . . 25 25,392Methanex Corp.
5.13%, 10/15/27 (Call 04/15/27) . . . . . . . . . . . . . . . . . . . . . . . . . . . . . 95 96,575
Schedule of InvestmentsOctober 31, 2020
iShares� ESG Advanced High Yield Corporate Bond ETF(Percentages shown are based on Net Assets)
S C H E D U L E O F I N V E S T M E N T S 53
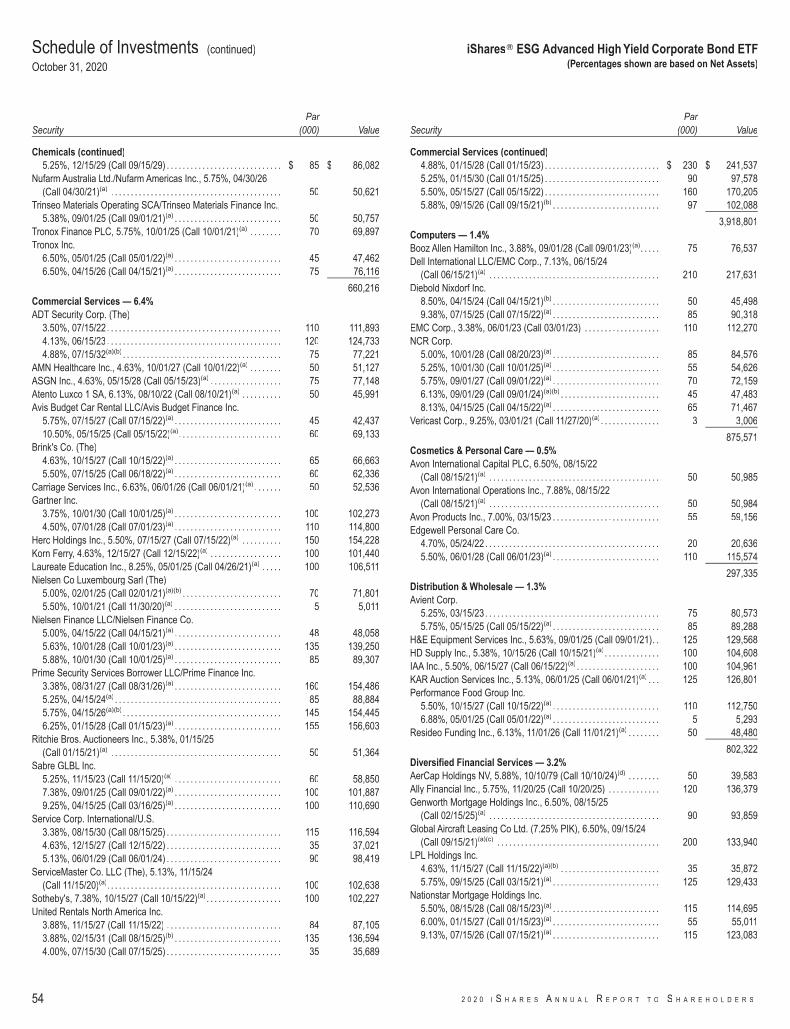
SecurityPar
(000) Value
Chemicals (continued)5.25%, 12/15/29 (Call 09/15/29) . . . . . . . . . . . . . . . . . . . . . . . . . . . . . $ 85 $ 86,082
Nufarm Australia Ltd./Nufarm Americas Inc., 5.75%, 04/30/26(Call 04/30/21)(a) . . . . . . . . . . . . . . . . . . . . . . . . . . . . . . . . . . . . . . . . . . . 50 50,621
Trinseo Materials Operating SCA/Trinseo Materials Finance Inc.,5.38%, 09/01/25 (Call 09/01/21)(a) . . . . . . . . . . . . . . . . . . . . . . . . . . . 50 50,757
Tronox Finance PLC, 5.75%, 10/01/25 (Call 10/01/21)(a) . . . . . . . . 70 69,897Tronox Inc.
6.50%, 05/01/25 (Call 05/01/22)(a) . . . . . . . . . . . . . . . . . . . . . . . . . . . 45 47,4626.50%, 04/15/26 (Call 04/15/21)(a) . . . . . . . . . . . . . . . . . . . . . . . . . . . 75 76,116
660,216Commercial Services — 6.4%ADT Security Corp. (The)
3.50%, 07/15/22 . . . . . . . . . . . . . . . . . . . . . . . . . . . . . . . . . . . . . . . . . . . . 110 111,8934.13%, 06/15/23 . . . . . . . . . . . . . . . . . . . . . . . . . . . . . . . . . . . . . . . . . . . . 120 124,7334.88%, 07/15/32(a)(b) . . . . . . . . . . . . . . . . . . . . . . . . . . . . . . . . . . . . . . . . 75 77,221
AMN Healthcare Inc., 4.63%, 10/01/27 (Call 10/01/22)(a) . . . . . . . . 50 51,127ASGN Inc., 4.63%, 05/15/28 (Call 05/15/23)(a) . . . . . . . . . . . . . . . . . . 75 77,148Atento Luxco 1 SA, 6.13%, 08/10/22 (Call 08/10/21)(a) . . . . . . . . . . 50 45,991Avis Budget Car Rental LLC/Avis Budget Finance Inc.
5.75%, 07/15/27 (Call 07/15/22)(a) . . . . . . . . . . . . . . . . . . . . . . . . . . . 45 42,43710.50%, 05/15/25 (Call 05/15/22)(a). . . . . . . . . . . . . . . . . . . . . . . . . . 60 69,133
Brink's Co. (The)4.63%, 10/15/27 (Call 10/15/22)(a) . . . . . . . . . . . . . . . . . . . . . . . . . . . 65 66,6635.50%, 07/15/25 (Call 06/18/22)(a) . . . . . . . . . . . . . . . . . . . . . . . . . . . 60 62,336
Carriage Services Inc., 6.63%, 06/01/26 (Call 06/01/21)(a) . . . . . . . 50 52,536Gartner Inc.
3.75%, 10/01/30 (Call 10/01/25)(a) . . . . . . . . . . . . . . . . . . . . . . . . . . . 100 102,2734.50%, 07/01/28 (Call 07/01/23)(a) . . . . . . . . . . . . . . . . . . . . . . . . . . . 110 114,800
Herc Holdings Inc., 5.50%, 07/15/27 (Call 07/15/22)(a) . . . . . . . . . . 150 154,228Korn Ferry, 4.63%, 12/15/27 (Call 12/15/22)(a) . . . . . . . . . . . . . . . . . . 100 101,440Laureate Education Inc., 8.25%, 05/01/25 (Call 04/26/21)(a) . . . . . 100 106,511Nielsen Co Luxembourg Sarl (The)
5.00%, 02/01/25 (Call 02/01/21)(a)(b) . . . . . . . . . . . . . . . . . . . . . . . . . 70 71,8015.50%, 10/01/21 (Call 11/30/20)(a) . . . . . . . . . . . . . . . . . . . . . . . . . . . 5 5,011
Nielsen Finance LLC/Nielsen Finance Co.5.00%, 04/15/22 (Call 04/15/21)(a) . . . . . . . . . . . . . . . . . . . . . . . . . . . 48 48,0585.63%, 10/01/28 (Call 10/01/23)(a) . . . . . . . . . . . . . . . . . . . . . . . . . . . 135 139,2505.88%, 10/01/30 (Call 10/01/25)(a) . . . . . . . . . . . . . . . . . . . . . . . . . . . 85 89,307
Prime Security Services Borrower LLC/Prime Finance Inc.3.38%, 08/31/27 (Call 08/31/26)(a) . . . . . . . . . . . . . . . . . . . . . . . . . . . 160 154,4865.25%, 04/15/24(a) . . . . . . . . . . . . . . . . . . . . . . . . . . . . . . . . . . . . . . . . . . 85 88,8845.75%, 04/15/26(a)(b) . . . . . . . . . . . . . . . . . . . . . . . . . . . . . . . . . . . . . . . . 145 154,4456.25%, 01/15/28 (Call 01/15/23)(a) . . . . . . . . . . . . . . . . . . . . . . . . . . . 155 156,603
Ritchie Bros. Auctioneers Inc., 5.38%, 01/15/25(Call 01/15/21)(a) . . . . . . . . . . . . . . . . . . . . . . . . . . . . . . . . . . . . . . . . . . . 50 51,364
Sabre GLBL Inc.5.25%, 11/15/23 (Call 11/15/20)(a) . . . . . . . . . . . . . . . . . . . . . . . . . . . 60 58,8507.38%, 09/01/25 (Call 09/01/22)(a) . . . . . . . . . . . . . . . . . . . . . . . . . . . 100 101,8879.25%, 04/15/25 (Call 03/16/25)(a) . . . . . . . . . . . . . . . . . . . . . . . . . . . 100 110,690
Service Corp. International/U.S.3.38%, 08/15/30 (Call 08/15/25) . . . . . . . . . . . . . . . . . . . . . . . . . . . . . 115 116,5944.63%, 12/15/27 (Call 12/15/22) . . . . . . . . . . . . . . . . . . . . . . . . . . . . . 35 37,0215.13%, 06/01/29 (Call 06/01/24) . . . . . . . . . . . . . . . . . . . . . . . . . . . . . 90 98,419
ServiceMaster Co. LLC (The), 5.13%, 11/15/24(Call 11/15/20)(a). . . . . . . . . . . . . . . . . . . . . . . . . . . . . . . . . . . . . . . . . . . . 100 102,638
Sotheby's, 7.38%, 10/15/27 (Call 10/15/22)(a) . . . . . . . . . . . . . . . . . . . 100 102,227United Rentals North America Inc.
3.88%, 11/15/27 (Call 11/15/22) . . . . . . . . . . . . . . . . . . . . . . . . . . . . . 84 87,1053.88%, 02/15/31 (Call 08/15/25)(b) . . . . . . . . . . . . . . . . . . . . . . . . . . . 135 136,5944.00%, 07/15/30 (Call 07/15/25) . . . . . . . . . . . . . . . . . . . . . . . . . . . . . 35 35,689
SecurityPar
(000) Value
Commercial Services (continued)4.88%, 01/15/28 (Call 01/15/23) . . . . . . . . . . . . . . . . . . . . . . . . . . . . . $ 230 $ 241,5375.25%, 01/15/30 (Call 01/15/25) . . . . . . . . . . . . . . . . . . . . . . . . . . . . . 90 97,5785.50%, 05/15/27 (Call 05/15/22) . . . . . . . . . . . . . . . . . . . . . . . . . . . . . 160 170,2055.88%, 09/15/26 (Call 09/15/21)(b) . . . . . . . . . . . . . . . . . . . . . . . . . . . 97 102,088
3,918,801Computers — 1.4%Booz Allen Hamilton Inc., 3.88%, 09/01/28 (Call 09/01/23)(a). . . . . 75 76,537Dell International LLC/EMC Corp., 7.13%, 06/15/24
(Call 06/15/21)(a) . . . . . . . . . . . . . . . . . . . . . . . . . . . . . . . . . . . . . . . . . . . 210 217,631Diebold Nixdorf Inc.
8.50%, 04/15/24 (Call 04/15/21)(b) . . . . . . . . . . . . . . . . . . . . . . . . . . . 50 45,4989.38%, 07/15/25 (Call 07/15/22)(a) . . . . . . . . . . . . . . . . . . . . . . . . . . . 85 90,318
EMC Corp., 3.38%, 06/01/23 (Call 03/01/23) . . . . . . . . . . . . . . . . . . . 110 112,270NCR Corp.
5.00%, 10/01/28 (Call 08/20/23)(a) . . . . . . . . . . . . . . . . . . . . . . . . . . . 85 84,5765.25%, 10/01/30 (Call 10/01/25)(a) . . . . . . . . . . . . . . . . . . . . . . . . . . . 55 54,6265.75%, 09/01/27 (Call 09/01/22)(a) . . . . . . . . . . . . . . . . . . . . . . . . . . . 70 72,1596.13%, 09/01/29 (Call 09/01/24)(a)(b) . . . . . . . . . . . . . . . . . . . . . . . . . 45 47,4838.13%, 04/15/25 (Call 04/15/22)(a) . . . . . . . . . . . . . . . . . . . . . . . . . . . 65 71,467
Vericast Corp., 9.25%, 03/01/21 (Call 11/27/20)(a) . . . . . . . . . . . . . . . 3 3,006
875,571Cosmetics & Personal Care — 0.5%Avon International Capital PLC, 6.50%, 08/15/22
(Call 08/15/21)(a) . . . . . . . . . . . . . . . . . . . . . . . . . . . . . . . . . . . . . . . . . . . 50 50,985Avon International Operations Inc., 7.88%, 08/15/22
(Call 08/15/21)(a) . . . . . . . . . . . . . . . . . . . . . . . . . . . . . . . . . . . . . . . . . . . 50 50,984Avon Products Inc., 7.00%, 03/15/23 . . . . . . . . . . . . . . . . . . . . . . . . . . . 55 59,156Edgewell Personal Care Co.
4.70%, 05/24/22. . . . . . . . . . . . . . . . . . . . . . . . . . . . . . . . . . . . . . . . . . . . 20 20,6365.50%, 06/01/28 (Call 06/01/23)(a) . . . . . . . . . . . . . . . . . . . . . . . . . . . 110 115,574
297,335Distribution & Wholesale — 1.3%Avient Corp.
5.25%, 03/15/23. . . . . . . . . . . . . . . . . . . . . . . . . . . . . . . . . . . . . . . . . . . . 75 80,5735.75%, 05/15/25 (Call 05/15/22)(a) . . . . . . . . . . . . . . . . . . . . . . . . . . . 85 89,288
H&E Equipment Services Inc., 5.63%, 09/01/25 (Call 09/01/21). . 125 129,568HD Supply Inc., 5.38%, 10/15/26 (Call 10/15/21)(a) . . . . . . . . . . . . . . 100 104,608IAA Inc., 5.50%, 06/15/27 (Call 06/15/22)(a) . . . . . . . . . . . . . . . . . . . . . 100 104,961KAR Auction Services Inc., 5.13%, 06/01/25 (Call 06/01/21)(a) . . . 125 126,801Performance Food Group Inc.
5.50%, 10/15/27 (Call 10/15/22)(a) . . . . . . . . . . . . . . . . . . . . . . . . . . . 110 112,7506.88%, 05/01/25 (Call 05/01/22)(a) . . . . . . . . . . . . . . . . . . . . . . . . . . . 5 5,293
Resideo Funding Inc., 6.13%, 11/01/26 (Call 11/01/21)(a) . . . . . . . . 50 48,480
802,322Diversified Financial Services — 3.2%AerCap Holdings NV, 5.88%, 10/10/79 (Call 10/10/24)(d) . . . . . . . . 50 39,583Ally Financial Inc., 5.75%, 11/20/25 (Call 10/20/25) . . . . . . . . . . . . . 120 136,379Genworth Mortgage Holdings Inc., 6.50%, 08/15/25
(Call 02/15/25)(a) . . . . . . . . . . . . . . . . . . . . . . . . . . . . . . . . . . . . . . . . . . . 90 93,859Global Aircraft Leasing Co Ltd. (7.25% PIK), 6.50%, 09/15/24
(Call 09/15/21)(a)(c) . . . . . . . . . . . . . . . . . . . . . . . . . . . . . . . . . . . . . . . . . 200 133,940LPL Holdings Inc.
4.63%, 11/15/27 (Call 11/15/22)(a)(b) . . . . . . . . . . . . . . . . . . . . . . . . . 35 35,8725.75%, 09/15/25 (Call 03/15/21)(a) . . . . . . . . . . . . . . . . . . . . . . . . . . . 125 129,433
Nationstar Mortgage Holdings Inc.5.50%, 08/15/28 (Call 08/15/23)(a) . . . . . . . . . . . . . . . . . . . . . . . . . . . 115 114,6956.00%, 01/15/27 (Call 01/15/23)(a) . . . . . . . . . . . . . . . . . . . . . . . . . . . 55 55,0119.13%, 07/15/26 (Call 07/15/21)(a) . . . . . . . . . . . . . . . . . . . . . . . . . . . 115 123,083
Schedule of Investments (continued)
October 31, 2020
iShares� ESG Advanced High Yield Corporate Bond ETF(Percentages shown are based on Net Assets)
54 2 0 2 0 I S H A R E S A N N U A L R E P O R T T O S H A R E H O L D E R S

SecurityPar
(000) Value
Diversified Financial Services (continued)OneMain Finance Corp.
5.38%, 11/15/29 (Call 05/15/29) . . . . . . . . . . . . . . . . . . . . . . . . . . . . . $ 100 $ 102,8545.63%, 03/15/23 . . . . . . . . . . . . . . . . . . . . . . . . . . . . . . . . . . . . . . . . . . . . 100 104,0876.13%, 05/15/22 . . . . . . . . . . . . . . . . . . . . . . . . . . . . . . . . . . . . . . . . . . . . 100 104,3516.13%, 03/15/24 (Call 09/15/23) . . . . . . . . . . . . . . . . . . . . . . . . . . . . . 100 105,1446.63%, 01/15/28 (Call 07/15/27) . . . . . . . . . . . . . . . . . . . . . . . . . . . . . 100 109,4466.88%, 03/15/25 . . . . . . . . . . . . . . . . . . . . . . . . . . . . . . . . . . . . . . . . . . . . 150 165,0817.13%, 03/15/26 . . . . . . . . . . . . . . . . . . . . . . . . . . . . . . . . . . . . . . . . . . . . 200 221,6688.88%, 06/01/25 (Call 06/01/22) . . . . . . . . . . . . . . . . . . . . . . . . . . . . . 75 82,430
PennyMac Financial Services Inc., 5.38%, 10/15/25(Call 10/15/22)(a) . . . . . . . . . . . . . . . . . . . . . . . . . . . . . . . . . . . . . . . . . . . 75 76,931
SLM Corp., 4.20%, 10/29/25 (Call 09/29/25) . . . . . . . . . . . . . . . . . . . . 25 25,363
1,959,210Electrical Components & Equipment — 1.0%Energizer Holdings Inc.
4.38%, 03/31/29 (Call 09/30/23)(a) . . . . . . . . . . . . . . . . . . . . . . . . . . . 95 95,9824.75%, 06/15/28 (Call 07/01/23)(a) . . . . . . . . . . . . . . . . . . . . . . . . . . . 85 87,7857.75%, 01/15/27 (Call 01/15/22)(a) . . . . . . . . . . . . . . . . . . . . . . . . . . . 30 32,489
WESCO Distribution Inc.7.13%, 06/15/25 (Call 06/15/22)(a) . . . . . . . . . . . . . . . . . . . . . . . . . . . 165 178,0297.25%, 06/15/28 (Call 06/15/23)(a) . . . . . . . . . . . . . . . . . . . . . . . . . . . 175 191,476
585,761Electronics — 0.7%Sensata Technologies BV
4.88%, 10/15/23(a) . . . . . . . . . . . . . . . . . . . . . . . . . . . . . . . . . . . . . . . . . . 45 47,7515.00%, 10/01/25(a)(b) . . . . . . . . . . . . . . . . . . . . . . . . . . . . . . . . . . . . . . . . 85 92,8575.63%, 11/01/24(a)(b) . . . . . . . . . . . . . . . . . . . . . . . . . . . . . . . . . . . . . . . . 70 76,802
Sensata Technologies Inc.3.75%, 02/15/31 (Call 02/15/26)(a) . . . . . . . . . . . . . . . . . . . . . . . . . . . 90 89,0954.38%, 02/15/30 (Call 11/15/29)(a) . . . . . . . . . . . . . . . . . . . . . . . . . . . 95 99,750
406,255Energy - Alternate Sources — 0.2%Enviva Partners LP/Enviva Partners Finance Corp., 6.50%,
01/15/26 (Call 11/15/21)(a) . . . . . . . . . . . . . . . . . . . . . . . . . . . . . . . . . . 100 105,304
Engineering & Construction — 0.6%AECOM
5.13%, 03/15/27 (Call 12/15/26) . . . . . . . . . . . . . . . . . . . . . . . . . . . . . 120 131,4445.88%, 10/15/24 (Call 07/15/24) . . . . . . . . . . . . . . . . . . . . . . . . . . . . . 85 93,610
MasTec Inc., 4.50%, 08/15/28 (Call 08/15/23)(a). . . . . . . . . . . . . . . . . 75 77,061TopBuild Corp., 5.63%, 05/01/26 (Call 05/01/21)(a) . . . . . . . . . . . . . . 50 51,511
353,626Entertainment — 2.2%Cedar Fair LP, 5.25%, 07/15/29 (Call 07/15/24)(b) . . . . . . . . . . . . . . . 70 63,407Cedar Fair LP/Canada's Wonderland Co./Magnum Management
Corp., 5.38%, 06/01/24 (Call 06/01/21)(b) . . . . . . . . . . . . . . . . . . . . 75 72,093Cedar Fair LP/Canada's Wonderland Co./Magnum Management
Corp./Millennium Op5.38%, 04/15/27 (Call 04/15/22) . . . . . . . . . . . . . . . . . . . . . . . . . . . . . 70 64,8125.50%, 05/01/25 (Call 05/01/22)(a) . . . . . . . . . . . . . . . . . . . . . . . . . . . 105 106,304
Cinemark USA Inc.4.88%, 06/01/23 (Call 06/01/21) . . . . . . . . . . . . . . . . . . . . . . . . . . . . . 112 93,7695.13%, 12/15/22 (Call 12/15/20) . . . . . . . . . . . . . . . . . . . . . . . . . . . . . 25 21,689
Lions Gate Capital Holdings LLC5.88%, 11/01/24 (Call 11/01/20)(a) . . . . . . . . . . . . . . . . . . . . . . . . . . . 85 80,2616.38%, 02/01/24 (Call 02/01/21)(a) . . . . . . . . . . . . . . . . . . . . . . . . . . . 30 28,824
Live Nation Entertainment Inc.4.75%, 10/15/27 (Call 10/15/22)(a) . . . . . . . . . . . . . . . . . . . . . . . . . . . 110 101,4564.88%, 11/01/24 (Call 11/01/20)(a) . . . . . . . . . . . . . . . . . . . . . . . . . . . 75 72,258
SecurityPar
(000) Value
Entertainment (continued)6.50%, 05/15/27 (Call 05/15/23)(a) . . . . . . . . . . . . . . . . . . . . . . . . . . . $ 155 $ 166,918
SeaWorld Parks & Entertainment Inc., 9.50%, 08/01/25(Call 02/01/22)(a) . . . . . . . . . . . . . . . . . . . . . . . . . . . . . . . . . . . . . . . . . . . 50 52,482
Six Flags Entertainment Corp.4.88%, 07/31/24 (Call 07/31/21)(a) . . . . . . . . . . . . . . . . . . . . . . . . . . . 85 78,9795.50%, 04/15/27 (Call 04/15/22)(a)(b) . . . . . . . . . . . . . . . . . . . . . . . . . 75 69,672
Six Flags Theme Parks Inc., 7.00%, 07/01/25 (Call 07/01/22)(a). . 90 95,297Vail Resorts Inc., 6.25%, 05/15/25 (Call 05/15/22)(a). . . . . . . . . . . . . 70 73,887WMG Acquisition Corp.
3.00%, 02/15/31 (Call 02/15/26)(a) . . . . . . . . . . . . . . . . . . . . . . . . . . . 65 62,1063.88%, 07/15/30 (Call 07/15/25)(a) . . . . . . . . . . . . . . . . . . . . . . . . . . . 50 50,324
1,354,538Environmental Control — 0.3%Covanta Holding Corp.
5.00%, 09/01/30 (Call 09/01/25)(b) . . . . . . . . . . . . . . . . . . . . . . . . . . . 55 55,6865.88%, 07/01/25 (Call 07/01/21)(b) . . . . . . . . . . . . . . . . . . . . . . . . . . . 50 51,8906.00%, 01/01/27 (Call 01/01/22)(b) . . . . . . . . . . . . . . . . . . . . . . . . . . . 55 57,420
164,996Food — 4.5%B&G Foods Inc.
5.25%, 04/01/25 (Call 04/01/21) . . . . . . . . . . . . . . . . . . . . . . . . . . . . . 85 87,4765.25%, 09/15/27 (Call 03/01/22) . . . . . . . . . . . . . . . . . . . . . . . . . . . . . 90 93,257
Kraft Heinz Foods Co.3.00%, 06/01/26 (Call 03/01/26) . . . . . . . . . . . . . . . . . . . . . . . . . . . . . 110 112,2513.50%, 06/06/22(b) . . . . . . . . . . . . . . . . . . . . . . . . . . . . . . . . . . . . . . . . . . 50 52,2123.88%, 05/15/27 (Call 02/15/27)(a) . . . . . . . . . . . . . . . . . . . . . . . . . . . 80 84,5983.95%, 07/15/25 (Call 04/15/25) . . . . . . . . . . . . . . . . . . . . . . . . . . . . . 100 108,2624.25%, 03/01/31 (Call 12/01/30)(a) . . . . . . . . . . . . . . . . . . . . . . . . . . . 85 92,2494.38%, 06/01/46 (Call 12/01/45) . . . . . . . . . . . . . . . . . . . . . . . . . . . . . 250 256,8554.63%, 01/30/29 (Call 10/30/28) . . . . . . . . . . . . . . . . . . . . . . . . . . . . . 85 94,4415.00%, 07/15/35 (Call 01/15/35) . . . . . . . . . . . . . . . . . . . . . . . . . . . . . 50 57,6245.00%, 06/04/42. . . . . . . . . . . . . . . . . . . . . . . . . . . . . . . . . . . . . . . . . . . . 100 109,9795.20%, 07/15/45 (Call 01/15/45) . . . . . . . . . . . . . . . . . . . . . . . . . . . . . 125 138,3347.13%, 08/01/39(a) . . . . . . . . . . . . . . . . . . . . . . . . . . . . . . . . . . . . . . . . . . 100 135,118
Lamb Weston Holdings Inc.4.63%, 11/01/24 (Call 11/01/21)(a) . . . . . . . . . . . . . . . . . . . . . . . . . . . 80 82,8354.88%, 11/01/26 (Call 11/01/21)(a)(b) . . . . . . . . . . . . . . . . . . . . . . . . . 55 57,0684.88%, 05/15/28 (Call 11/15/27)(a) . . . . . . . . . . . . . . . . . . . . . . . . . . . 80 86,753
Post Holdings Inc.4.63%, 04/15/30 (Call 04/15/25)(a) . . . . . . . . . . . . . . . . . . . . . . . . . . . 195 200,3725.00%, 08/15/26 (Call 08/15/21)(a) . . . . . . . . . . . . . . . . . . . . . . . . . . . 225 232,5515.50%, 12/15/29 (Call 12/15/24)(a)(b) . . . . . . . . . . . . . . . . . . . . . . . . . 100 108,0555.63%, 01/15/28 (Call 12/01/22)(a) . . . . . . . . . . . . . . . . . . . . . . . . . . . 102 107,4545.75%, 03/01/27 (Call 03/01/22)(a) . . . . . . . . . . . . . . . . . . . . . . . . . . . 150 157,152
TreeHouse Foods Inc., 4.00%, 09/01/28 (Call 09/01/23). . . . . . . . . 60 60,176U.S. Foods Inc.
5.88%, 06/15/24 (Call 06/15/21)(a) . . . . . . . . . . . . . . . . . . . . . . . . . . . 75 75,2146.25%, 04/15/25 (Call 04/15/22)(a) . . . . . . . . . . . . . . . . . . . . . . . . . . . 125 130,570
United Natural Foods Inc., 6.75%, 10/15/28 (Call 10/15/23)(a) . . . 50 50,533
2,771,389Forest Products & Paper — 0.1%Mercer International Inc., 7.38%, 01/15/25 (Call 01/15/21). . . . . . . 75 76,220
Health Care - Products — 1.4%Avantor Funding Inc., 4.63%, 07/15/28 (Call 07/15/23)(a) . . . . . . . . 190 196,715Avantor Inc., 6.00%, 10/01/24 (Call 10/01/21)(a). . . . . . . . . . . . . . . . . 165 172,437Hill-Rom Holdings Inc., 4.38%, 09/15/27 (Call 09/15/22)(a). . . . . . . 50 51,997
Schedule of Investments (continued)
October 31, 2020
iShares� ESG Advanced High Yield Corporate Bond ETF(Percentages shown are based on Net Assets)
S C H E D U L E O F I N V E S T M E N T S 55
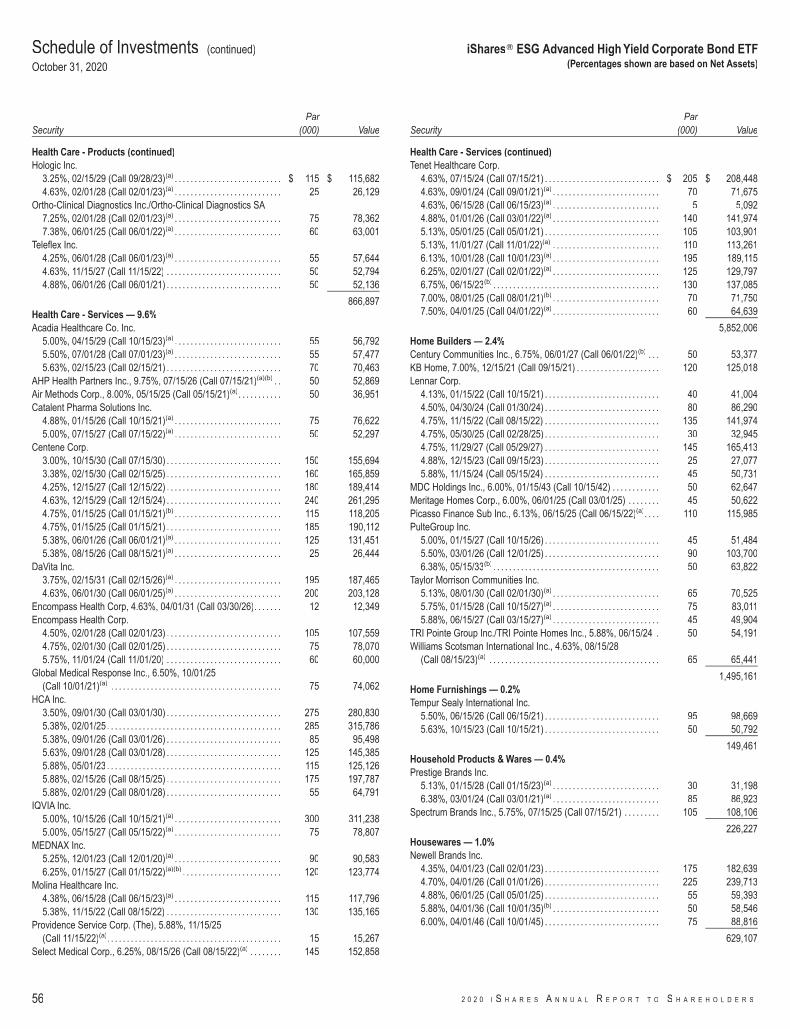
SecurityPar
(000) Value
Health Care - Products (continued)Hologic Inc.
3.25%, 02/15/29 (Call 09/28/23)(a) . . . . . . . . . . . . . . . . . . . . . . . . . . . $ 115 $ 115,6824.63%, 02/01/28 (Call 02/01/23)(a) . . . . . . . . . . . . . . . . . . . . . . . . . . . 25 26,129
Ortho-Clinical Diagnostics Inc./Ortho-Clinical Diagnostics SA7.25%, 02/01/28 (Call 02/01/23)(a) . . . . . . . . . . . . . . . . . . . . . . . . . . . 75 78,3627.38%, 06/01/25 (Call 06/01/22)(a) . . . . . . . . . . . . . . . . . . . . . . . . . . . 60 63,001
Teleflex Inc.4.25%, 06/01/28 (Call 06/01/23)(a) . . . . . . . . . . . . . . . . . . . . . . . . . . . 55 57,6444.63%, 11/15/27 (Call 11/15/22) . . . . . . . . . . . . . . . . . . . . . . . . . . . . . 50 52,7944.88%, 06/01/26 (Call 06/01/21) . . . . . . . . . . . . . . . . . . . . . . . . . . . . . 50 52,136
866,897Health Care - Services — 9.6%Acadia Healthcare Co. Inc.
5.00%, 04/15/29 (Call 10/15/23)(a) . . . . . . . . . . . . . . . . . . . . . . . . . . . 55 56,7925.50%, 07/01/28 (Call 07/01/23)(a) . . . . . . . . . . . . . . . . . . . . . . . . . . . 55 57,4775.63%, 02/15/23 (Call 02/15/21) . . . . . . . . . . . . . . . . . . . . . . . . . . . . . 70 70,463
AHP Health Partners Inc., 9.75%, 07/15/26 (Call 07/15/21)(a)(b) . . 50 52,869Air Methods Corp., 8.00%, 05/15/25 (Call 05/15/21)(a). . . . . . . . . . . 50 36,951Catalent Pharma Solutions Inc.
4.88%, 01/15/26 (Call 10/15/21)(a) . . . . . . . . . . . . . . . . . . . . . . . . . . . 75 76,6225.00%, 07/15/27 (Call 07/15/22)(a) . . . . . . . . . . . . . . . . . . . . . . . . . . . 50 52,297
Centene Corp.3.00%, 10/15/30 (Call 07/15/30) . . . . . . . . . . . . . . . . . . . . . . . . . . . . . 150 155,6943.38%, 02/15/30 (Call 02/15/25) . . . . . . . . . . . . . . . . . . . . . . . . . . . . . 160 165,8594.25%, 12/15/27 (Call 12/15/22) . . . . . . . . . . . . . . . . . . . . . . . . . . . . . 180 189,4144.63%, 12/15/29 (Call 12/15/24) . . . . . . . . . . . . . . . . . . . . . . . . . . . . . 240 261,2954.75%, 01/15/25 (Call 01/15/21)(b) . . . . . . . . . . . . . . . . . . . . . . . . . . . 115 118,2054.75%, 01/15/25 (Call 01/15/21) . . . . . . . . . . . . . . . . . . . . . . . . . . . . . 185 190,1125.38%, 06/01/26 (Call 06/01/21)(a) . . . . . . . . . . . . . . . . . . . . . . . . . . . 125 131,4515.38%, 08/15/26 (Call 08/15/21)(a) . . . . . . . . . . . . . . . . . . . . . . . . . . . 25 26,444
DaVita Inc.3.75%, 02/15/31 (Call 02/15/26)(a) . . . . . . . . . . . . . . . . . . . . . . . . . . . 195 187,4654.63%, 06/01/30 (Call 06/01/25)(a) . . . . . . . . . . . . . . . . . . . . . . . . . . . 200 203,128
Encompass Health Corp, 4.63%, 04/01/31 (Call 03/30/26). . . . . . . 12 12,349Encompass Health Corp.
4.50%, 02/01/28 (Call 02/01/23) . . . . . . . . . . . . . . . . . . . . . . . . . . . . . 105 107,5594.75%, 02/01/30 (Call 02/01/25) . . . . . . . . . . . . . . . . . . . . . . . . . . . . . 75 78,0705.75%, 11/01/24 (Call 11/01/20) . . . . . . . . . . . . . . . . . . . . . . . . . . . . . 60 60,000
Global Medical Response Inc., 6.50%, 10/01/25(Call 10/01/21)(a) . . . . . . . . . . . . . . . . . . . . . . . . . . . . . . . . . . . . . . . . . . . 75 74,062
HCA Inc.3.50%, 09/01/30 (Call 03/01/30) . . . . . . . . . . . . . . . . . . . . . . . . . . . . . 275 280,8305.38%, 02/01/25 . . . . . . . . . . . . . . . . . . . . . . . . . . . . . . . . . . . . . . . . . . . . 285 315,7865.38%, 09/01/26 (Call 03/01/26) . . . . . . . . . . . . . . . . . . . . . . . . . . . . . 85 95,4985.63%, 09/01/28 (Call 03/01/28) . . . . . . . . . . . . . . . . . . . . . . . . . . . . . 125 145,3855.88%, 05/01/23 . . . . . . . . . . . . . . . . . . . . . . . . . . . . . . . . . . . . . . . . . . . . 115 125,1265.88%, 02/15/26 (Call 08/15/25) . . . . . . . . . . . . . . . . . . . . . . . . . . . . . 175 197,7875.88%, 02/01/29 (Call 08/01/28) . . . . . . . . . . . . . . . . . . . . . . . . . . . . . 55 64,791
IQVIA Inc.5.00%, 10/15/26 (Call 10/15/21)(a) . . . . . . . . . . . . . . . . . . . . . . . . . . . 300 311,2385.00%, 05/15/27 (Call 05/15/22)(a) . . . . . . . . . . . . . . . . . . . . . . . . . . . 75 78,807
MEDNAX Inc.5.25%, 12/01/23 (Call 12/01/20)(a) . . . . . . . . . . . . . . . . . . . . . . . . . . . 90 90,5836.25%, 01/15/27 (Call 01/15/22)(a)(b) . . . . . . . . . . . . . . . . . . . . . . . . . 120 123,774
Molina Healthcare Inc.4.38%, 06/15/28 (Call 06/15/23)(a) . . . . . . . . . . . . . . . . . . . . . . . . . . . 115 117,7965.38%, 11/15/22 (Call 08/15/22) . . . . . . . . . . . . . . . . . . . . . . . . . . . . . 130 135,165
Providence Service Corp. (The), 5.88%, 11/15/25(Call 11/15/22)(a). . . . . . . . . . . . . . . . . . . . . . . . . . . . . . . . . . . . . . . . . . . . 15 15,267
Select Medical Corp., 6.25%, 08/15/26 (Call 08/15/22)(a) . . . . . . . . 145 152,858
SecurityPar
(000) Value
Health Care - Services (continued)Tenet Healthcare Corp.
4.63%, 07/15/24 (Call 07/15/21) . . . . . . . . . . . . . . . . . . . . . . . . . . . . . $ 205 $ 208,4484.63%, 09/01/24 (Call 09/01/21)(a) . . . . . . . . . . . . . . . . . . . . . . . . . . . 70 71,6754.63%, 06/15/28 (Call 06/15/23)(a) . . . . . . . . . . . . . . . . . . . . . . . . . . . 5 5,0924.88%, 01/01/26 (Call 03/01/22)(a) . . . . . . . . . . . . . . . . . . . . . . . . . . . 140 141,9745.13%, 05/01/25 (Call 05/01/21) . . . . . . . . . . . . . . . . . . . . . . . . . . . . . 105 103,9015.13%, 11/01/27 (Call 11/01/22)(a) . . . . . . . . . . . . . . . . . . . . . . . . . . . 110 113,2616.13%, 10/01/28 (Call 10/01/23)(a) . . . . . . . . . . . . . . . . . . . . . . . . . . . 195 189,1156.25%, 02/01/27 (Call 02/01/22)(a) . . . . . . . . . . . . . . . . . . . . . . . . . . . 125 129,7976.75%, 06/15/23(b) . . . . . . . . . . . . . . . . . . . . . . . . . . . . . . . . . . . . . . . . . . 130 137,0857.00%, 08/01/25 (Call 08/01/21)(b) . . . . . . . . . . . . . . . . . . . . . . . . . . . 70 71,7507.50%, 04/01/25 (Call 04/01/22)(a) . . . . . . . . . . . . . . . . . . . . . . . . . . . 60 64,639
5,852,006Home Builders — 2.4%Century Communities Inc., 6.75%, 06/01/27 (Call 06/01/22)(b) . . . 50 53,377KB Home, 7.00%, 12/15/21 (Call 09/15/21) . . . . . . . . . . . . . . . . . . . . . 120 125,018Lennar Corp.
4.13%, 01/15/22 (Call 10/15/21) . . . . . . . . . . . . . . . . . . . . . . . . . . . . . 40 41,0044.50%, 04/30/24 (Call 01/30/24) . . . . . . . . . . . . . . . . . . . . . . . . . . . . . 80 86,2904.75%, 11/15/22 (Call 08/15/22) . . . . . . . . . . . . . . . . . . . . . . . . . . . . . 135 141,9744.75%, 05/30/25 (Call 02/28/25) . . . . . . . . . . . . . . . . . . . . . . . . . . . . . 30 32,9454.75%, 11/29/27 (Call 05/29/27) . . . . . . . . . . . . . . . . . . . . . . . . . . . . . 145 165,4134.88%, 12/15/23 (Call 09/15/23) . . . . . . . . . . . . . . . . . . . . . . . . . . . . . 25 27,0775.88%, 11/15/24 (Call 05/15/24) . . . . . . . . . . . . . . . . . . . . . . . . . . . . . 45 50,731
MDC Holdings Inc., 6.00%, 01/15/43 (Call 10/15/42) . . . . . . . . . . . . 50 62,647Meritage Homes Corp., 6.00%, 06/01/25 (Call 03/01/25) . . . . . . . . 45 50,622Picasso Finance Sub Inc., 6.13%, 06/15/25 (Call 06/15/22)(a). . . . 110 115,985PulteGroup Inc.
5.00%, 01/15/27 (Call 10/15/26) . . . . . . . . . . . . . . . . . . . . . . . . . . . . . 45 51,4845.50%, 03/01/26 (Call 12/01/25) . . . . . . . . . . . . . . . . . . . . . . . . . . . . . 90 103,7006.38%, 05/15/33(b) . . . . . . . . . . . . . . . . . . . . . . . . . . . . . . . . . . . . . . . . . . 50 63,822
Taylor Morrison Communities Inc.5.13%, 08/01/30 (Call 02/01/30)(a) . . . . . . . . . . . . . . . . . . . . . . . . . . . 65 70,5255.75%, 01/15/28 (Call 10/15/27)(a) . . . . . . . . . . . . . . . . . . . . . . . . . . . 75 83,0115.88%, 06/15/27 (Call 03/15/27)(a) . . . . . . . . . . . . . . . . . . . . . . . . . . . 45 49,904
TRI Pointe Group Inc./TRI Pointe Homes Inc., 5.88%, 06/15/24 . 50 54,191Williams Scotsman International Inc., 4.63%, 08/15/28
(Call 08/15/23)(a) . . . . . . . . . . . . . . . . . . . . . . . . . . . . . . . . . . . . . . . . . . . 65 65,441
1,495,161Home Furnishings — 0.2%Tempur Sealy International Inc.
5.50%, 06/15/26 (Call 06/15/21) . . . . . . . . . . . . . . . . . . . . . . . . . . . . . 95 98,6695.63%, 10/15/23 (Call 10/15/21) . . . . . . . . . . . . . . . . . . . . . . . . . . . . . 50 50,792
149,461Household Products & Wares — 0.4%Prestige Brands Inc.
5.13%, 01/15/28 (Call 01/15/23)(a) . . . . . . . . . . . . . . . . . . . . . . . . . . . 30 31,1986.38%, 03/01/24 (Call 03/01/21)(a) . . . . . . . . . . . . . . . . . . . . . . . . . . . 85 86,923
Spectrum Brands Inc., 5.75%, 07/15/25 (Call 07/15/21) . . . . . . . . . 105 108,106
226,227Housewares — 1.0%Newell Brands Inc.
4.35%, 04/01/23 (Call 02/01/23) . . . . . . . . . . . . . . . . . . . . . . . . . . . . . 175 182,6394.70%, 04/01/26 (Call 01/01/26) . . . . . . . . . . . . . . . . . . . . . . . . . . . . . 225 239,7134.88%, 06/01/25 (Call 05/01/25) . . . . . . . . . . . . . . . . . . . . . . . . . . . . . 55 59,3935.88%, 04/01/36 (Call 10/01/35)(b) . . . . . . . . . . . . . . . . . . . . . . . . . . . 50 58,5466.00%, 04/01/46 (Call 10/01/45) . . . . . . . . . . . . . . . . . . . . . . . . . . . . . 75 88,816
629,107
Schedule of Investments (continued)
October 31, 2020
iShares� ESG Advanced High Yield Corporate Bond ETF(Percentages shown are based on Net Assets)
56 2 0 2 0 I S H A R E S A N N U A L R E P O R T T O S H A R E H O L D E R S

SecurityPar
(000) Value
Insurance — 0.3%Assurant Inc., 7.00%, 03/27/48 (Call 03/27/28)(d). . . . . . . . . . . . . . . . $ 50 $ 54,323MGIC Investment Corp., 5.25%, 08/15/28 (Call 08/15/23) . . . . . . . 100 103,247
157,570Internet — 1.5%ANGI Group LLC, 3.88%, 08/15/28 (Call 08/15/23)(a). . . . . . . . . . . . 50 49,418Cogent Communications Group Inc., 5.38%, 03/01/22
(Call 12/01/21)(a) . . . . . . . . . . . . . . . . . . . . . . . . . . . . . . . . . . . . . . . . . . . 50 51,043Go Daddy Operating Co. LLC/GD Finance Co. Inc., 5.25%,
12/01/27 (Call 06/01/22)(a) . . . . . . . . . . . . . . . . . . . . . . . . . . . . . . . . . . 100 104,885GrubHub Holdings Inc., 5.50%, 07/01/27 (Call 07/01/22)(a) . . . . . . 50 52,109NortonLifeLock Inc.
3.95%, 06/15/22 (Call 03/15/22) . . . . . . . . . . . . . . . . . . . . . . . . . . . . . 25 25,6945.00%, 04/15/25 (Call 04/15/21)(a)(b) . . . . . . . . . . . . . . . . . . . . . . . . . 155 157,885
Photo Holdings Merger Sub Inc., 8.50%, 10/01/26(Call 10/01/22)(a) . . . . . . . . . . . . . . . . . . . . . . . . . . . . . . . . . . . . . . . . . . . 95 88,350
TripAdvisor Inc., 7.00%, 07/15/25 (Call 07/15/22)(a) . . . . . . . . . . . . . 50 51,999Twitter Inc., 3.88%, 12/15/27 (Call 09/15/27)(a)(b) . . . . . . . . . . . . . . . . 100 104,950VeriSign Inc.
4.63%, 05/01/23 (Call 05/01/21) . . . . . . . . . . . . . . . . . . . . . . . . . . . . . 87 87,8334.75%, 07/15/27 (Call 07/15/22) . . . . . . . . . . . . . . . . . . . . . . . . . . . . . 120 126,9855.25%, 04/01/25 (Call 01/01/25) . . . . . . . . . . . . . . . . . . . . . . . . . . . . . 30 33,639
934,790Iron & Steel — 0.7%Cleveland-Cliffs Inc.
4.88%, 01/15/24 (Call 01/15/21)(a) . . . . . . . . . . . . . . . . . . . . . . . . . . . 20 20,0125.88%, 06/01/27 (Call 06/01/22) . . . . . . . . . . . . . . . . . . . . . . . . . . . . . 75 72,7386.75%, 03/15/26 (Call 03/04/23)(a) . . . . . . . . . . . . . . . . . . . . . . . . . . . 140 146,9489.88%, 10/17/25 (Call 10/17/22)(a) . . . . . . . . . . . . . . . . . . . . . . . . . . . 88 100,623
Mineral Resources Ltd., 8.13%, 05/01/27 (Call 05/01/22)(a) . . . . . . 100 109,143
449,464Leisure Time — 1.6%NCL Corp. Ltd.
3.63%, 12/15/24 (Call 12/15/21)(a) . . . . . . . . . . . . . . . . . . . . . . . . . . . 75 51,72510.25%, 02/01/26 (Call 08/01/23)(a). . . . . . . . . . . . . . . . . . . . . . . . . . 90 92,68612.25%, 05/15/24 (Call 02/15/24)(a). . . . . . . . . . . . . . . . . . . . . . . . . . 85 93,276
Royal Caribbean Cruises Ltd.3.70%, 03/15/28 (Call 12/15/27) . . . . . . . . . . . . . . . . . . . . . . . . . . . . . 50 36,3265.25%, 11/15/22 . . . . . . . . . . . . . . . . . . . . . . . . . . . . . . . . . . . . . . . . . . . . 50 44,6879.13%, 06/15/23 (Call 03/15/23)(a) . . . . . . . . . . . . . . . . . . . . . . . . . . . 130 135,36610.88%, 06/01/23 (Call 03/01/23)(a)(b). . . . . . . . . . . . . . . . . . . . . . . . 100 109,07811.50%, 06/01/25 (Call 06/01/22)(a) . . . . . . . . . . . . . . . . . . . . . . . . . . 250 285,980
Silversea Cruise Finance Ltd., 7.25%, 02/01/25(Call 02/01/21)(a) . . . . . . . . . . . . . . . . . . . . . . . . . . . . . . . . . . . . . . . . . . . 100 100,516
949,640Lodging — 1.8%Hilton Domestic Operating Co. Inc.
4.25%, 09/01/24 (Call 09/01/21) . . . . . . . . . . . . . . . . . . . . . . . . . . . . . 110 109,5184.88%, 01/15/30 (Call 01/15/25) . . . . . . . . . . . . . . . . . . . . . . . . . . . . . 130 133,7635.13%, 05/01/26 (Call 05/01/21) . . . . . . . . . . . . . . . . . . . . . . . . . . . . . 185 188,2375.38%, 05/01/25 (Call 05/01/22)(a) . . . . . . . . . . . . . . . . . . . . . . . . . . . 105 109,0875.75%, 05/01/28 (Call 05/01/23)(a) . . . . . . . . . . . . . . . . . . . . . . . . . . . 30 31,466
Hilton Worldwide Finance LLC/Hilton Worldwide Finance Corp.4.63%, 04/01/25 (Call 04/01/21) . . . . . . . . . . . . . . . . . . . . . . . . . . . . . 85 85,7684.88%, 04/01/27 (Call 04/01/22) . . . . . . . . . . . . . . . . . . . . . . . . . . . . . 70 70,838
Marriott Ownership Resorts Inc., 6.13%, 09/15/25(Call 05/15/22)(a) . . . . . . . . . . . . . . . . . . . . . . . . . . . . . . . . . . . . . . . . . . . 60 62,542
Marriott Ownership Resorts Inc./ILG LLC, 6.50%, 09/15/26(Call 09/15/21) . . . . . . . . . . . . . . . . . . . . . . . . . . . . . . . . . . . . . . . . . . . . . 95 97,808
SecurityPar
(000) Value
Lodging (continued)Wyndham Destinations Inc.
3.90%, 03/01/23 (Call 12/01/22) . . . . . . . . . . . . . . . . . . . . . . . . . . . . . $ 47 $ 46,4604.25%, 03/01/22 (Call 12/01/21) . . . . . . . . . . . . . . . . . . . . . . . . . . . . . 20 20,0986.00%, 04/01/27 (Call 01/01/27) . . . . . . . . . . . . . . . . . . . . . . . . . . . . . 25 25,9686.63%, 07/31/26 (Call 04/30/26)(a) . . . . . . . . . . . . . . . . . . . . . . . . . . . 105 111,745
1,093,298Machinery — 0.4%RBS Global Inc./Rexnord LLC, 4.88%, 12/15/25
(Call 12/15/20)(a) . . . . . . . . . . . . . . . . . . . . . . . . . . . . . . . . . . . . . . . . . . . 100 102,064Stevens Holding Co. Inc., 6.13%, 10/01/26 (Call 10/01/23)(a) . . . . 50 53,653Terex Corp., 5.63%, 02/01/25 (Call 02/01/21)(a)(b) . . . . . . . . . . . . . . . 50 50,790Welbilt Inc., 9.50%, 02/15/24 (Call 02/15/21)(b). . . . . . . . . . . . . . . . . . 50 50,719
257,226Manufacturing — 1.5%Bombardier Inc.
5.75%, 03/15/22(a) . . . . . . . . . . . . . . . . . . . . . . . . . . . . . . . . . . . . . . . . . . 20 19,2346.00%, 10/15/22 (Call 11/30/20)(a) . . . . . . . . . . . . . . . . . . . . . . . . . . . 160 142,7026.13%, 01/15/23(a) . . . . . . . . . . . . . . . . . . . . . . . . . . . . . . . . . . . . . . . . . . 170 146,5017.50%, 12/01/24 (Call 12/01/20)(a) . . . . . . . . . . . . . . . . . . . . . . . . . . . 110 82,5007.50%, 03/15/25 (Call 03/15/21)(a) . . . . . . . . . . . . . . . . . . . . . . . . . . . 195 141,3447.88%, 04/15/27 (Call 04/15/22)(a) . . . . . . . . . . . . . . . . . . . . . . . . . . . 235 171,1468.75%, 12/01/21(a) . . . . . . . . . . . . . . . . . . . . . . . . . . . . . . . . . . . . . . . . . . 55 54,775
Gates Global LLC/Gates Corp., 6.25%, 01/15/26(Call 01/15/22)(a)(b) . . . . . . . . . . . . . . . . . . . . . . . . . . . . . . . . . . . . . . . . . 75 77,601
Hillenbrand Inc., 5.75%, 06/15/25 (Call 06/15/22)(b) . . . . . . . . . . . . . 50 53,260Trinity Industries Inc., 4.55%, 10/01/24 (Call 07/01/24) . . . . . . . . . . 50 51,344
940,407Media — 9.4%Altice Financing SA
5.00%, 01/15/28 (Call 01/15/23)(a) . . . . . . . . . . . . . . . . . . . . . . . . . . . 150 145,5377.50%, 05/15/26 (Call 05/15/21)(a) . . . . . . . . . . . . . . . . . . . . . . . . . . . 400 417,528
Clear Channel Worldwide Holdings Inc.5.13%, 08/15/27 (Call 08/15/22)(a) . . . . . . . . . . . . . . . . . . . . . . . . . . . 155 151,7709.25%, 02/15/24 (Call 02/15/21) . . . . . . . . . . . . . . . . . . . . . . . . . . . . . 225 195,876
Diamond Sports Group LLC/Diamond Sports Finance Co.5.38%, 08/15/26 (Call 08/15/22)(a) . . . . . . . . . . . . . . . . . . . . . . . . . . . 370 216,4946.63%, 08/15/27 (Call 08/15/22)(a)(b) . . . . . . . . . . . . . . . . . . . . . . . . . 95 39,507
EW Scripps Co. (The), 5.13%, 05/15/25 (Call 05/15/21)(a) . . . . . . . 50 47,748Gray Television Inc.
4.75%, 10/15/30 (Call 10/15/25)(a) . . . . . . . . . . . . . . . . . . . . . . . . . . . 110 108,2235.88%, 07/15/26 (Call 07/15/21)(a) . . . . . . . . . . . . . . . . . . . . . . . . . . . 45 46,8357.00%, 05/15/27 (Call 05/15/22)(a)(b) . . . . . . . . . . . . . . . . . . . . . . . . . 100 107,710
iHeartCommunications Inc.4.75%, 01/15/28 (Call 01/15/23)(a) . . . . . . . . . . . . . . . . . . . . . . . . . . . 45 43,2405.25%, 08/15/27 (Call 08/15/22)(a) . . . . . . . . . . . . . . . . . . . . . . . . . . . 80 78,9986.38%, 05/01/26 (Call 05/01/22) . . . . . . . . . . . . . . . . . . . . . . . . . . . . . 105 109,3738.38%, 05/01/27 (Call 05/01/22) . . . . . . . . . . . . . . . . . . . . . . . . . . . . . 185 180,418
Nexstar Broadcasting Inc.4.75%, 11/01/28 (Call 11/01/23)(a) . . . . . . . . . . . . . . . . . . . . . . . . . . . 100 101,2165.63%, 07/15/27 (Call 07/15/22)(a)(b) . . . . . . . . . . . . . . . . . . . . . . . . . 240 250,248
Quebecor Media Inc., 5.75%, 01/15/23 . . . . . . . . . . . . . . . . . . . . . . . . . 75 80,625Scripps Escrow Inc., 5.88%, 07/15/27 (Call 07/15/22)(a) . . . . . . . . . 75 72,754Sinclair Television Group Inc.
5.13%, 02/15/27 (Call 08/15/21)(a)(b) . . . . . . . . . . . . . . . . . . . . . . . . . 75 70,6005.50%, 03/01/30 (Call 12/01/24)(a) . . . . . . . . . . . . . . . . . . . . . . . . . . . 90 84,6805.63%, 08/01/24 (Call 08/01/21)(a) . . . . . . . . . . . . . . . . . . . . . . . . . . . 75 74,944
Sirius XM Radio Inc.3.88%, 08/01/22 (Call 08/01/21)(a) . . . . . . . . . . . . . . . . . . . . . . . . . . . 120 121,0904.13%, 07/01/30 (Call 07/01/25)(a) . . . . . . . . . . . . . . . . . . . . . . . . . . . 180 185,053
Schedule of Investments (continued)
October 31, 2020
iShares� ESG Advanced High Yield Corporate Bond ETF(Percentages shown are based on Net Assets)
S C H E D U L E O F I N V E S T M E N T S 57
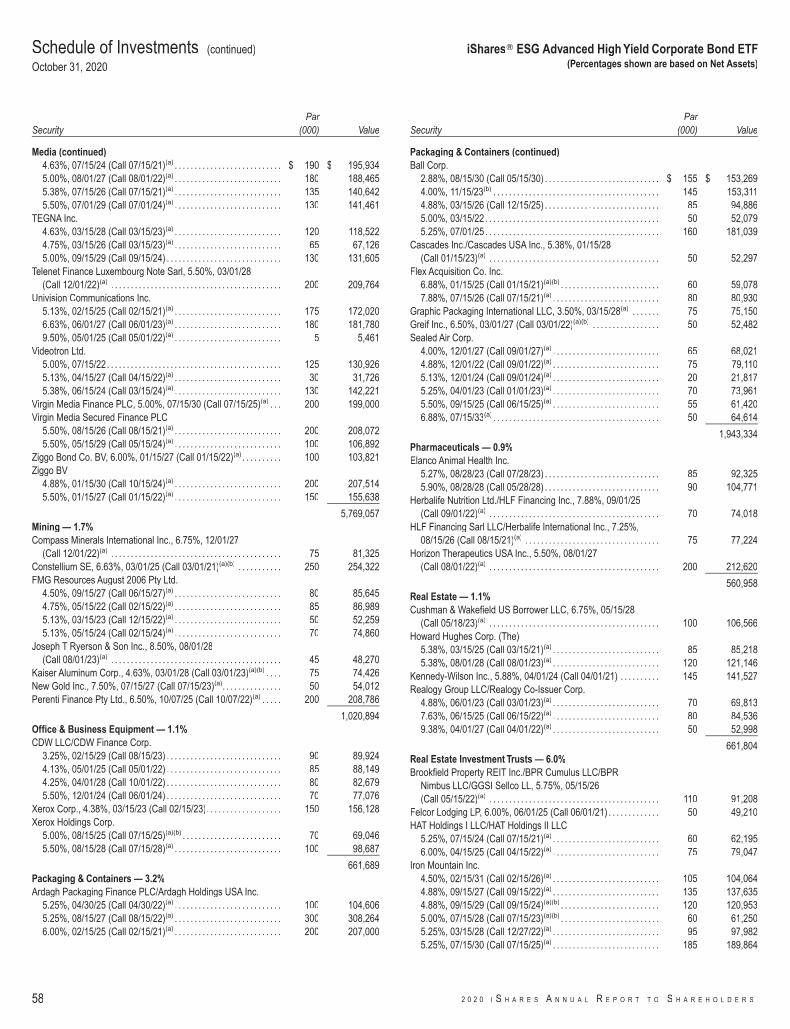
SecurityPar
(000) Value
Media (continued)4.63%, 07/15/24 (Call 07/15/21)(a) . . . . . . . . . . . . . . . . . . . . . . . . . . . $ 190 $ 195,9345.00%, 08/01/27 (Call 08/01/22)(a) . . . . . . . . . . . . . . . . . . . . . . . . . . . 180 188,4655.38%, 07/15/26 (Call 07/15/21)(a) . . . . . . . . . . . . . . . . . . . . . . . . . . . 135 140,6425.50%, 07/01/29 (Call 07/01/24)(a) . . . . . . . . . . . . . . . . . . . . . . . . . . . 130 141,461
TEGNA Inc.4.63%, 03/15/28 (Call 03/15/23)(a) . . . . . . . . . . . . . . . . . . . . . . . . . . . 120 118,5224.75%, 03/15/26 (Call 03/15/23)(a) . . . . . . . . . . . . . . . . . . . . . . . . . . . 65 67,1265.00%, 09/15/29 (Call 09/15/24) . . . . . . . . . . . . . . . . . . . . . . . . . . . . . 130 131,605
Telenet Finance Luxembourg Note Sarl, 5.50%, 03/01/28(Call 12/01/22)(a) . . . . . . . . . . . . . . . . . . . . . . . . . . . . . . . . . . . . . . . . . . . 200 209,764
Univision Communications Inc.5.13%, 02/15/25 (Call 02/15/21)(a) . . . . . . . . . . . . . . . . . . . . . . . . . . . 175 172,0206.63%, 06/01/27 (Call 06/01/23)(a) . . . . . . . . . . . . . . . . . . . . . . . . . . . 180 181,7809.50%, 05/01/25 (Call 05/01/22)(a) . . . . . . . . . . . . . . . . . . . . . . . . . . . 5 5,461
Videotron Ltd.5.00%, 07/15/22 . . . . . . . . . . . . . . . . . . . . . . . . . . . . . . . . . . . . . . . . . . . . 125 130,9265.13%, 04/15/27 (Call 04/15/22)(a) . . . . . . . . . . . . . . . . . . . . . . . . . . . 30 31,7265.38%, 06/15/24 (Call 03/15/24)(a) . . . . . . . . . . . . . . . . . . . . . . . . . . . 130 142,221
Virgin Media Finance PLC, 5.00%, 07/15/30 (Call 07/15/25)(a) . . . 200 199,000Virgin Media Secured Finance PLC
5.50%, 08/15/26 (Call 08/15/21)(a) . . . . . . . . . . . . . . . . . . . . . . . . . . . 200 208,0725.50%, 05/15/29 (Call 05/15/24)(a) . . . . . . . . . . . . . . . . . . . . . . . . . . . 100 106,892
Ziggo Bond Co. BV, 6.00%, 01/15/27 (Call 01/15/22)(a) . . . . . . . . . . 100 103,821Ziggo BV
4.88%, 01/15/30 (Call 10/15/24)(a) . . . . . . . . . . . . . . . . . . . . . . . . . . . 200 207,5145.50%, 01/15/27 (Call 01/15/22)(a) . . . . . . . . . . . . . . . . . . . . . . . . . . . 150 155,638
5,769,057Mining — 1.7%Compass Minerals International Inc., 6.75%, 12/01/27
(Call 12/01/22)(a) . . . . . . . . . . . . . . . . . . . . . . . . . . . . . . . . . . . . . . . . . . . 75 81,325Constellium SE, 6.63%, 03/01/25 (Call 03/01/21)(a)(b) . . . . . . . . . . . 250 254,322FMG Resources August 2006 Pty Ltd.
4.50%, 09/15/27 (Call 06/15/27)(a) . . . . . . . . . . . . . . . . . . . . . . . . . . . 80 85,6454.75%, 05/15/22 (Call 02/15/22)(a) . . . . . . . . . . . . . . . . . . . . . . . . . . . 85 86,9895.13%, 03/15/23 (Call 12/15/22)(a) . . . . . . . . . . . . . . . . . . . . . . . . . . . 50 52,2595.13%, 05/15/24 (Call 02/15/24)(a) . . . . . . . . . . . . . . . . . . . . . . . . . . . 70 74,860
Joseph T Ryerson & Son Inc., 8.50%, 08/01/28(Call 08/01/23)(a) . . . . . . . . . . . . . . . . . . . . . . . . . . . . . . . . . . . . . . . . . . . 45 48,270
Kaiser Aluminum Corp., 4.63%, 03/01/28 (Call 03/01/23)(a)(b) . . . . 75 74,426New Gold Inc., 7.50%, 07/15/27 (Call 07/15/23)(a). . . . . . . . . . . . . . . 50 54,012Perenti Finance Pty Ltd., 6.50%, 10/07/25 (Call 10/07/22)(a) . . . . . 200 208,786
1,020,894Office & Business Equipment — 1.1%CDW LLC/CDW Finance Corp.
3.25%, 02/15/29 (Call 08/15/23) . . . . . . . . . . . . . . . . . . . . . . . . . . . . . 90 89,9244.13%, 05/01/25 (Call 05/01/22) . . . . . . . . . . . . . . . . . . . . . . . . . . . . . 85 88,1494.25%, 04/01/28 (Call 10/01/22) . . . . . . . . . . . . . . . . . . . . . . . . . . . . . 80 82,6795.50%, 12/01/24 (Call 06/01/24) . . . . . . . . . . . . . . . . . . . . . . . . . . . . . 70 77,076
Xerox Corp., 4.38%, 03/15/23 (Call 02/15/23). . . . . . . . . . . . . . . . . . . 150 156,128Xerox Holdings Corp.
5.00%, 08/15/25 (Call 07/15/25)(a)(b) . . . . . . . . . . . . . . . . . . . . . . . . . 70 69,0465.50%, 08/15/28 (Call 07/15/28)(a) . . . . . . . . . . . . . . . . . . . . . . . . . . . 100 98,687
661,689Packaging & Containers — 3.2%Ardagh Packaging Finance PLC/Ardagh Holdings USA Inc.
5.25%, 04/30/25 (Call 04/30/22)(a) . . . . . . . . . . . . . . . . . . . . . . . . . . . 100 104,6065.25%, 08/15/27 (Call 08/15/22)(a) . . . . . . . . . . . . . . . . . . . . . . . . . . . 300 308,2646.00%, 02/15/25 (Call 02/15/21)(a) . . . . . . . . . . . . . . . . . . . . . . . . . . . 200 207,000
SecurityPar
(000) Value
Packaging & Containers (continued)Ball Corp.
2.88%, 08/15/30 (Call 05/15/30) . . . . . . . . . . . . . . . . . . . . . . . . . . . . . $ 155 $ 153,2694.00%, 11/15/23(b) . . . . . . . . . . . . . . . . . . . . . . . . . . . . . . . . . . . . . . . . . . 145 153,3114.88%, 03/15/26 (Call 12/15/25) . . . . . . . . . . . . . . . . . . . . . . . . . . . . . 85 94,8865.00%, 03/15/22. . . . . . . . . . . . . . . . . . . . . . . . . . . . . . . . . . . . . . . . . . . . 50 52,0795.25%, 07/01/25. . . . . . . . . . . . . . . . . . . . . . . . . . . . . . . . . . . . . . . . . . . . 160 181,039
Cascades Inc./Cascades USA Inc., 5.38%, 01/15/28(Call 01/15/23)(a) . . . . . . . . . . . . . . . . . . . . . . . . . . . . . . . . . . . . . . . . . . . 50 52,297
Flex Acquisition Co. Inc.6.88%, 01/15/25 (Call 01/15/21)(a)(b) . . . . . . . . . . . . . . . . . . . . . . . . . 60 59,0787.88%, 07/15/26 (Call 07/15/21)(a) . . . . . . . . . . . . . . . . . . . . . . . . . . . 80 80,930
Graphic Packaging International LLC, 3.50%, 03/15/28(a) . . . . . . . 75 75,150Greif Inc., 6.50%, 03/01/27 (Call 03/01/22)(a)(b) . . . . . . . . . . . . . . . . . 50 52,482Sealed Air Corp.
4.00%, 12/01/27 (Call 09/01/27)(a) . . . . . . . . . . . . . . . . . . . . . . . . . . . 65 68,0214.88%, 12/01/22 (Call 09/01/22)(a) . . . . . . . . . . . . . . . . . . . . . . . . . . . 75 79,1105.13%, 12/01/24 (Call 09/01/24)(a) . . . . . . . . . . . . . . . . . . . . . . . . . . . 20 21,8175.25%, 04/01/23 (Call 01/01/23)(a) . . . . . . . . . . . . . . . . . . . . . . . . . . . 70 73,9615.50%, 09/15/25 (Call 06/15/25)(a) . . . . . . . . . . . . . . . . . . . . . . . . . . . 55 61,4206.88%, 07/15/33(a) . . . . . . . . . . . . . . . . . . . . . . . . . . . . . . . . . . . . . . . . . . 50 64,614
1,943,334Pharmaceuticals — 0.9%Elanco Animal Health Inc.
5.27%, 08/28/23 (Call 07/28/23) . . . . . . . . . . . . . . . . . . . . . . . . . . . . . 85 92,3255.90%, 08/28/28 (Call 05/28/28) . . . . . . . . . . . . . . . . . . . . . . . . . . . . . 90 104,771
Herbalife Nutrition Ltd./HLF Financing Inc., 7.88%, 09/01/25(Call 09/01/22)(a) . . . . . . . . . . . . . . . . . . . . . . . . . . . . . . . . . . . . . . . . . . . 70 74,018
HLF Financing Sarl LLC/Herbalife International Inc., 7.25%,08/15/26 (Call 08/15/21)(a) . . . . . . . . . . . . . . . . . . . . . . . . . . . . . . . . . . 75 77,224
Horizon Therapeutics USA Inc., 5.50%, 08/01/27(Call 08/01/22)(a) . . . . . . . . . . . . . . . . . . . . . . . . . . . . . . . . . . . . . . . . . . . 200 212,620
560,958Real Estate — 1.1%Cushman & Wakefield US Borrower LLC, 6.75%, 05/15/28
(Call 05/18/23)(a) . . . . . . . . . . . . . . . . . . . . . . . . . . . . . . . . . . . . . . . . . . . 100 106,566Howard Hughes Corp. (The)
5.38%, 03/15/25 (Call 03/15/21)(a) . . . . . . . . . . . . . . . . . . . . . . . . . . . 85 85,2185.38%, 08/01/28 (Call 08/01/23)(a) . . . . . . . . . . . . . . . . . . . . . . . . . . . 120 121,146
Kennedy-Wilson Inc., 5.88%, 04/01/24 (Call 04/01/21) . . . . . . . . . . 145 141,527Realogy Group LLC/Realogy Co-Issuer Corp.
4.88%, 06/01/23 (Call 03/01/23)(a) . . . . . . . . . . . . . . . . . . . . . . . . . . . 70 69,8137.63%, 06/15/25 (Call 06/15/22)(a) . . . . . . . . . . . . . . . . . . . . . . . . . . . 80 84,5369.38%, 04/01/27 (Call 04/01/22)(a) . . . . . . . . . . . . . . . . . . . . . . . . . . . 50 52,998
661,804Real Estate Investment Trusts — 6.0%Brookfield Property REIT Inc./BPR Cumulus LLC/BPR
Nimbus LLC/GGSI Sellco LL, 5.75%, 05/15/26(Call 05/15/22)(a) . . . . . . . . . . . . . . . . . . . . . . . . . . . . . . . . . . . . . . . . . . . 110 91,208
Felcor Lodging LP, 6.00%, 06/01/25 (Call 06/01/21) . . . . . . . . . . . . . 50 49,210HAT Holdings I LLC/HAT Holdings II LLC
5.25%, 07/15/24 (Call 07/15/21)(a) . . . . . . . . . . . . . . . . . . . . . . . . . . . 60 62,1956.00%, 04/15/25 (Call 04/15/22)(a) . . . . . . . . . . . . . . . . . . . . . . . . . . . 75 79,047
Iron Mountain Inc.4.50%, 02/15/31 (Call 02/15/26)(a) . . . . . . . . . . . . . . . . . . . . . . . . . . . 105 104,0644.88%, 09/15/27 (Call 09/15/22)(a) . . . . . . . . . . . . . . . . . . . . . . . . . . . 135 137,6354.88%, 09/15/29 (Call 09/15/24)(a)(b) . . . . . . . . . . . . . . . . . . . . . . . . . 120 120,9535.00%, 07/15/28 (Call 07/15/23)(a)(b) . . . . . . . . . . . . . . . . . . . . . . . . . 60 61,2505.25%, 03/15/28 (Call 12/27/22)(a) . . . . . . . . . . . . . . . . . . . . . . . . . . . 95 97,9825.25%, 07/15/30 (Call 07/15/25)(a) . . . . . . . . . . . . . . . . . . . . . . . . . . . 185 189,864
Schedule of Investments (continued)
October 31, 2020
iShares� ESG Advanced High Yield Corporate Bond ETF(Percentages shown are based on Net Assets)
58 2 0 2 0 I S H A R E S A N N U A L R E P O R T T O S H A R E H O L D E R S
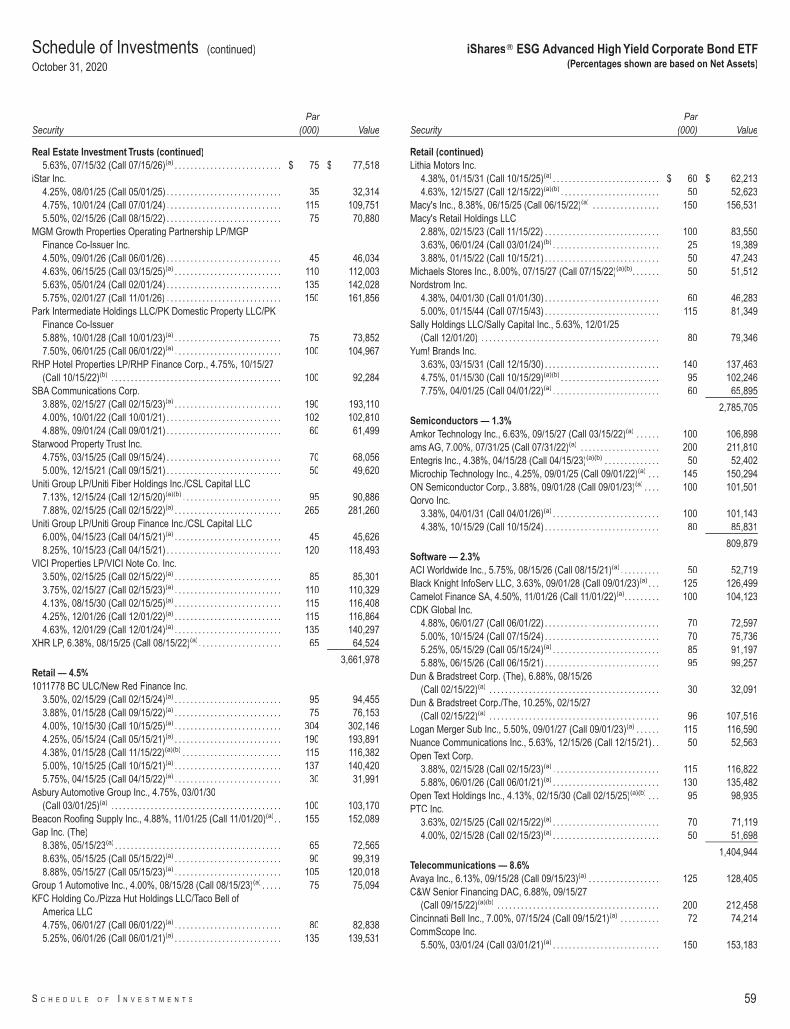
SecurityPar
(000) Value
Real Estate Investment Trusts (continued)5.63%, 07/15/32 (Call 07/15/26)(a) . . . . . . . . . . . . . . . . . . . . . . . . . . . $ 75 $ 77,518
iStar Inc.4.25%, 08/01/25 (Call 05/01/25) . . . . . . . . . . . . . . . . . . . . . . . . . . . . . 35 32,3144.75%, 10/01/24 (Call 07/01/24) . . . . . . . . . . . . . . . . . . . . . . . . . . . . . 115 109,7515.50%, 02/15/26 (Call 08/15/22) . . . . . . . . . . . . . . . . . . . . . . . . . . . . . 75 70,880
MGM Growth Properties Operating Partnership LP/MGPFinance Co-Issuer Inc.4.50%, 09/01/26 (Call 06/01/26) . . . . . . . . . . . . . . . . . . . . . . . . . . . . . 45 46,0344.63%, 06/15/25 (Call 03/15/25)(a) . . . . . . . . . . . . . . . . . . . . . . . . . . . 110 112,0035.63%, 05/01/24 (Call 02/01/24) . . . . . . . . . . . . . . . . . . . . . . . . . . . . . 135 142,0285.75%, 02/01/27 (Call 11/01/26) . . . . . . . . . . . . . . . . . . . . . . . . . . . . . 150 161,856
Park Intermediate Holdings LLC/PK Domestic Property LLC/PKFinance Co-Issuer5.88%, 10/01/28 (Call 10/01/23)(a) . . . . . . . . . . . . . . . . . . . . . . . . . . . 75 73,8527.50%, 06/01/25 (Call 06/01/22)(a) . . . . . . . . . . . . . . . . . . . . . . . . . . . 100 104,967
RHP Hotel Properties LP/RHP Finance Corp., 4.75%, 10/15/27(Call 10/15/22)(b) . . . . . . . . . . . . . . . . . . . . . . . . . . . . . . . . . . . . . . . . . . . 100 92,284
SBA Communications Corp.3.88%, 02/15/27 (Call 02/15/23)(a) . . . . . . . . . . . . . . . . . . . . . . . . . . . 190 193,1104.00%, 10/01/22 (Call 10/01/21) . . . . . . . . . . . . . . . . . . . . . . . . . . . . . 102 102,8104.88%, 09/01/24 (Call 09/01/21) . . . . . . . . . . . . . . . . . . . . . . . . . . . . . 60 61,499
Starwood Property Trust Inc.4.75%, 03/15/25 (Call 09/15/24) . . . . . . . . . . . . . . . . . . . . . . . . . . . . . 70 68,0565.00%, 12/15/21 (Call 09/15/21) . . . . . . . . . . . . . . . . . . . . . . . . . . . . . 50 49,620
Uniti Group LP/Uniti Fiber Holdings Inc./CSL Capital LLC7.13%, 12/15/24 (Call 12/15/20)(a)(b) . . . . . . . . . . . . . . . . . . . . . . . . . 95 90,8867.88%, 02/15/25 (Call 02/15/22)(a) . . . . . . . . . . . . . . . . . . . . . . . . . . . 265 281,260
Uniti Group LP/Uniti Group Finance Inc./CSL Capital LLC6.00%, 04/15/23 (Call 04/15/21)(a) . . . . . . . . . . . . . . . . . . . . . . . . . . . 45 45,6268.25%, 10/15/23 (Call 04/15/21) . . . . . . . . . . . . . . . . . . . . . . . . . . . . . 120 118,493
VICI Properties LP/VICI Note Co. Inc.3.50%, 02/15/25 (Call 02/15/22)(a) . . . . . . . . . . . . . . . . . . . . . . . . . . . 85 85,3013.75%, 02/15/27 (Call 02/15/23)(a) . . . . . . . . . . . . . . . . . . . . . . . . . . . 110 110,3294.13%, 08/15/30 (Call 02/15/25)(a) . . . . . . . . . . . . . . . . . . . . . . . . . . . 115 116,4084.25%, 12/01/26 (Call 12/01/22)(a) . . . . . . . . . . . . . . . . . . . . . . . . . . . 115 116,8644.63%, 12/01/29 (Call 12/01/24)(a) . . . . . . . . . . . . . . . . . . . . . . . . . . . 135 140,297
XHR LP, 6.38%, 08/15/25 (Call 08/15/22)(a). . . . . . . . . . . . . . . . . . . . . 65 64,524
3,661,978Retail — 4.5%1011778 BC ULC/New Red Finance Inc.
3.50%, 02/15/29 (Call 02/15/24)(a) . . . . . . . . . . . . . . . . . . . . . . . . . . . 95 94,4553.88%, 01/15/28 (Call 09/15/22)(a) . . . . . . . . . . . . . . . . . . . . . . . . . . . 75 76,1534.00%, 10/15/30 (Call 10/15/25)(a) . . . . . . . . . . . . . . . . . . . . . . . . . . . 304 302,1464.25%, 05/15/24 (Call 05/15/21)(a) . . . . . . . . . . . . . . . . . . . . . . . . . . . 190 193,8914.38%, 01/15/28 (Call 11/15/22)(a)(b) . . . . . . . . . . . . . . . . . . . . . . . . . 115 116,3825.00%, 10/15/25 (Call 10/15/21)(a) . . . . . . . . . . . . . . . . . . . . . . . . . . . 137 140,4205.75%, 04/15/25 (Call 04/15/22)(a) . . . . . . . . . . . . . . . . . . . . . . . . . . . 30 31,991
Asbury Automotive Group Inc., 4.75%, 03/01/30(Call 03/01/25)(a) . . . . . . . . . . . . . . . . . . . . . . . . . . . . . . . . . . . . . . . . . . . 100 103,170
Beacon Roofing Supply Inc., 4.88%, 11/01/25 (Call 11/01/20)(a). . 155 152,089Gap Inc. (The)
8.38%, 05/15/23(a) . . . . . . . . . . . . . . . . . . . . . . . . . . . . . . . . . . . . . . . . . . 65 72,5658.63%, 05/15/25 (Call 05/15/22)(a) . . . . . . . . . . . . . . . . . . . . . . . . . . . 90 99,3198.88%, 05/15/27 (Call 05/15/23)(a) . . . . . . . . . . . . . . . . . . . . . . . . . . . 105 120,018
Group 1 Automotive Inc., 4.00%, 08/15/28 (Call 08/15/23)(a) . . . . . 75 75,094KFC Holding Co./Pizza Hut Holdings LLC/Taco Bell of
America LLC4.75%, 06/01/27 (Call 06/01/22)(a) . . . . . . . . . . . . . . . . . . . . . . . . . . . 80 82,8385.25%, 06/01/26 (Call 06/01/21)(a) . . . . . . . . . . . . . . . . . . . . . . . . . . . 135 139,531
SecurityPar
(000) Value
Retail (continued)Lithia Motors Inc.
4.38%, 01/15/31 (Call 10/15/25)(a) . . . . . . . . . . . . . . . . . . . . . . . . . . . $ 60 $ 62,2134.63%, 12/15/27 (Call 12/15/22)(a)(b) . . . . . . . . . . . . . . . . . . . . . . . . . 50 52,623
Macy's Inc., 8.38%, 06/15/25 (Call 06/15/22)(a) . . . . . . . . . . . . . . . . . 150 156,531Macy's Retail Holdings LLC
2.88%, 02/15/23 (Call 11/15/22) . . . . . . . . . . . . . . . . . . . . . . . . . . . . . 100 83,5503.63%, 06/01/24 (Call 03/01/24)(b) . . . . . . . . . . . . . . . . . . . . . . . . . . . 25 19,3893.88%, 01/15/22 (Call 10/15/21) . . . . . . . . . . . . . . . . . . . . . . . . . . . . . 50 47,243
Michaels Stores Inc., 8.00%, 07/15/27 (Call 07/15/22)(a)(b). . . . . . . 50 51,512Nordstrom Inc.
4.38%, 04/01/30 (Call 01/01/30) . . . . . . . . . . . . . . . . . . . . . . . . . . . . . 60 46,2835.00%, 01/15/44 (Call 07/15/43) . . . . . . . . . . . . . . . . . . . . . . . . . . . . . 115 81,349
Sally Holdings LLC/Sally Capital Inc., 5.63%, 12/01/25(Call 12/01/20) . . . . . . . . . . . . . . . . . . . . . . . . . . . . . . . . . . . . . . . . . . . . . 80 79,346
Yum! Brands Inc.3.63%, 03/15/31 (Call 12/15/30) . . . . . . . . . . . . . . . . . . . . . . . . . . . . . 140 137,4634.75%, 01/15/30 (Call 10/15/29)(a)(b) . . . . . . . . . . . . . . . . . . . . . . . . . 95 102,2467.75%, 04/01/25 (Call 04/01/22)(a) . . . . . . . . . . . . . . . . . . . . . . . . . . . 60 65,895
2,785,705Semiconductors — 1.3%Amkor Technology Inc., 6.63%, 09/15/27 (Call 03/15/22)(a) . . . . . . 100 106,898ams AG, 7.00%, 07/31/25 (Call 07/31/22)(a) . . . . . . . . . . . . . . . . . . . . 200 211,810Entegris Inc., 4.38%, 04/15/28 (Call 04/15/23)(a)(b) . . . . . . . . . . . . . . 50 52,402Microchip Technology Inc., 4.25%, 09/01/25 (Call 09/01/22)(a) . . . 145 150,294ON Semiconductor Corp., 3.88%, 09/01/28 (Call 09/01/23)(a) . . . . 100 101,501Qorvo Inc.
3.38%, 04/01/31 (Call 04/01/26)(a) . . . . . . . . . . . . . . . . . . . . . . . . . . . 100 101,1434.38%, 10/15/29 (Call 10/15/24) . . . . . . . . . . . . . . . . . . . . . . . . . . . . . 80 85,831
809,879Software — 2.3%ACI Worldwide Inc., 5.75%, 08/15/26 (Call 08/15/21)(a) . . . . . . . . . . 50 52,719Black Knight InfoServ LLC, 3.63%, 09/01/28 (Call 09/01/23)(a) . . . 125 126,499Camelot Finance SA, 4.50%, 11/01/26 (Call 11/01/22)(a). . . . . . . . . 100 104,123CDK Global Inc.
4.88%, 06/01/27 (Call 06/01/22) . . . . . . . . . . . . . . . . . . . . . . . . . . . . . 70 72,5975.00%, 10/15/24 (Call 07/15/24) . . . . . . . . . . . . . . . . . . . . . . . . . . . . . 70 75,7365.25%, 05/15/29 (Call 05/15/24)(a) . . . . . . . . . . . . . . . . . . . . . . . . . . . 85 91,1975.88%, 06/15/26 (Call 06/15/21) . . . . . . . . . . . . . . . . . . . . . . . . . . . . . 95 99,257
Dun & Bradstreet Corp. (The), 6.88%, 08/15/26(Call 02/15/22)(a) . . . . . . . . . . . . . . . . . . . . . . . . . . . . . . . . . . . . . . . . . . . 30 32,091
Dun & Bradstreet Corp./The, 10.25%, 02/15/27(Call 02/15/22)(a) . . . . . . . . . . . . . . . . . . . . . . . . . . . . . . . . . . . . . . . . . . . 96 107,516
Logan Merger Sub Inc., 5.50%, 09/01/27 (Call 09/01/23)(a) . . . . . . 115 116,590Nuance Communications Inc., 5.63%, 12/15/26 (Call 12/15/21). . 50 52,563Open Text Corp.
3.88%, 02/15/28 (Call 02/15/23)(a) . . . . . . . . . . . . . . . . . . . . . . . . . . . 115 116,8225.88%, 06/01/26 (Call 06/01/21)(a) . . . . . . . . . . . . . . . . . . . . . . . . . . . 130 135,482
Open Text Holdings Inc., 4.13%, 02/15/30 (Call 02/15/25)(a)(b) . . . 95 98,935PTC Inc.
3.63%, 02/15/25 (Call 02/15/22)(a) . . . . . . . . . . . . . . . . . . . . . . . . . . . 70 71,1194.00%, 02/15/28 (Call 02/15/23)(a) . . . . . . . . . . . . . . . . . . . . . . . . . . . 50 51,698
1,404,944Telecommunications — 8.6%Avaya Inc., 6.13%, 09/15/28 (Call 09/15/23)(a) . . . . . . . . . . . . . . . . . . 125 128,405C&W Senior Financing DAC, 6.88%, 09/15/27
(Call 09/15/22)(a)(b) . . . . . . . . . . . . . . . . . . . . . . . . . . . . . . . . . . . . . . . . . 200 212,458Cincinnati Bell Inc., 7.00%, 07/15/24 (Call 09/15/21)(a) . . . . . . . . . . 72 74,214CommScope Inc.
5.50%, 03/01/24 (Call 03/01/21)(a) . . . . . . . . . . . . . . . . . . . . . . . . . . . 150 153,183
Schedule of Investments (continued)
October 31, 2020
iShares� ESG Advanced High Yield Corporate Bond ETF(Percentages shown are based on Net Assets)
S C H E D U L E O F I N V E S T M E N T S 59
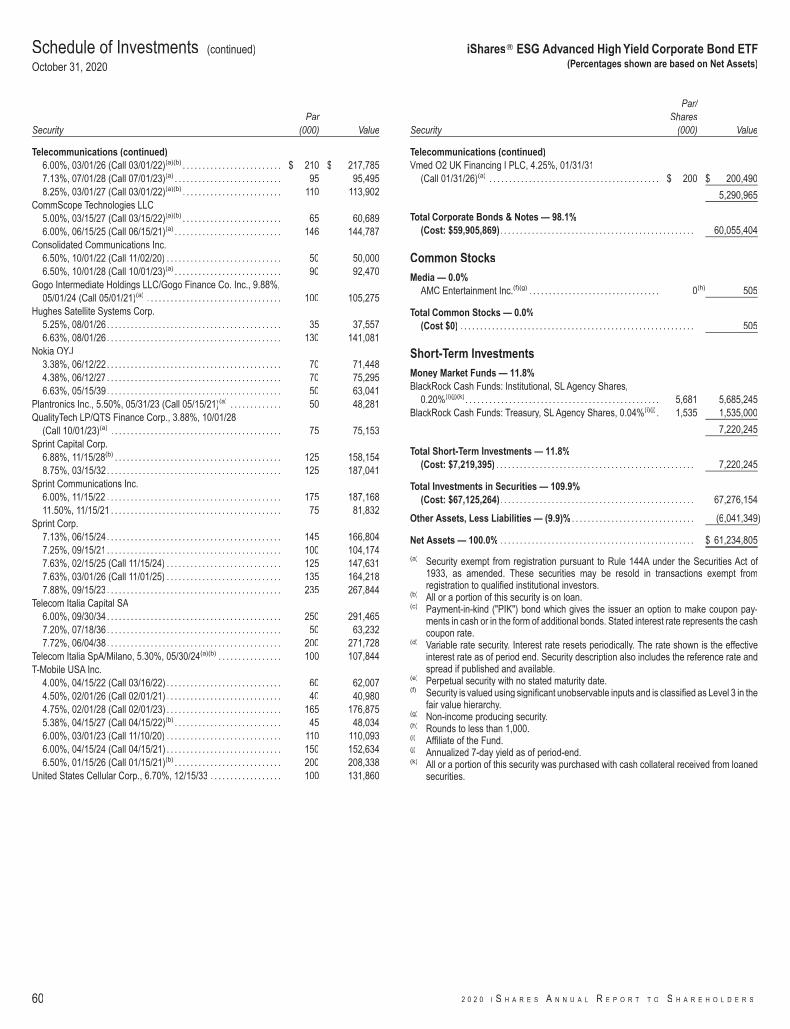
SecurityPar
(000) Value
Telecommunications (continued)6.00%, 03/01/26 (Call 03/01/22)(a)(b) . . . . . . . . . . . . . . . . . . . . . . . . . $ 210 $ 217,7857.13%, 07/01/28 (Call 07/01/23)(a) . . . . . . . . . . . . . . . . . . . . . . . . . . . 95 95,4958.25%, 03/01/27 (Call 03/01/22)(a)(b) . . . . . . . . . . . . . . . . . . . . . . . . . 110 113,902
CommScope Technologies LLC5.00%, 03/15/27 (Call 03/15/22)(a)(b) . . . . . . . . . . . . . . . . . . . . . . . . . 65 60,6896.00%, 06/15/25 (Call 06/15/21)(a) . . . . . . . . . . . . . . . . . . . . . . . . . . . 146 144,787
Consolidated Communications Inc.6.50%, 10/01/22 (Call 11/02/20) . . . . . . . . . . . . . . . . . . . . . . . . . . . . . 50 50,0006.50%, 10/01/28 (Call 10/01/23)(a) . . . . . . . . . . . . . . . . . . . . . . . . . . . 90 92,470
Gogo Intermediate Holdings LLC/Gogo Finance Co. Inc., 9.88%,05/01/24 (Call 05/01/21)(a) . . . . . . . . . . . . . . . . . . . . . . . . . . . . . . . . . . 100 105,275
Hughes Satellite Systems Corp.5.25%, 08/01/26 . . . . . . . . . . . . . . . . . . . . . . . . . . . . . . . . . . . . . . . . . . . . 35 37,5576.63%, 08/01/26 . . . . . . . . . . . . . . . . . . . . . . . . . . . . . . . . . . . . . . . . . . . . 130 141,081
Nokia OYJ3.38%, 06/12/22 . . . . . . . . . . . . . . . . . . . . . . . . . . . . . . . . . . . . . . . . . . . . 70 71,4484.38%, 06/12/27 . . . . . . . . . . . . . . . . . . . . . . . . . . . . . . . . . . . . . . . . . . . . 70 75,2956.63%, 05/15/39 . . . . . . . . . . . . . . . . . . . . . . . . . . . . . . . . . . . . . . . . . . . . 50 63,041
Plantronics Inc., 5.50%, 05/31/23 (Call 05/15/21)(a) . . . . . . . . . . . . . 50 48,281QualityTech LP/QTS Finance Corp., 3.88%, 10/01/28
(Call 10/01/23)(a) . . . . . . . . . . . . . . . . . . . . . . . . . . . . . . . . . . . . . . . . . . . 75 75,153Sprint Capital Corp.
6.88%, 11/15/28(b) . . . . . . . . . . . . . . . . . . . . . . . . . . . . . . . . . . . . . . . . . . 125 158,1548.75%, 03/15/32 . . . . . . . . . . . . . . . . . . . . . . . . . . . . . . . . . . . . . . . . . . . . 125 187,041
Sprint Communications Inc.6.00%, 11/15/22 . . . . . . . . . . . . . . . . . . . . . . . . . . . . . . . . . . . . . . . . . . . . 175 187,16811.50%, 11/15/21 . . . . . . . . . . . . . . . . . . . . . . . . . . . . . . . . . . . . . . . . . . . 75 81,832
Sprint Corp.7.13%, 06/15/24 . . . . . . . . . . . . . . . . . . . . . . . . . . . . . . . . . . . . . . . . . . . . 145 166,8047.25%, 09/15/21 . . . . . . . . . . . . . . . . . . . . . . . . . . . . . . . . . . . . . . . . . . . . 100 104,1747.63%, 02/15/25 (Call 11/15/24) . . . . . . . . . . . . . . . . . . . . . . . . . . . . . 125 147,6317.63%, 03/01/26 (Call 11/01/25) . . . . . . . . . . . . . . . . . . . . . . . . . . . . . 135 164,2187.88%, 09/15/23 . . . . . . . . . . . . . . . . . . . . . . . . . . . . . . . . . . . . . . . . . . . . 235 267,844
Telecom Italia Capital SA6.00%, 09/30/34 . . . . . . . . . . . . . . . . . . . . . . . . . . . . . . . . . . . . . . . . . . . . 250 291,4657.20%, 07/18/36 . . . . . . . . . . . . . . . . . . . . . . . . . . . . . . . . . . . . . . . . . . . . 50 63,2327.72%, 06/04/38 . . . . . . . . . . . . . . . . . . . . . . . . . . . . . . . . . . . . . . . . . . . . 200 271,728
Telecom Italia SpA/Milano, 5.30%, 05/30/24(a)(b) . . . . . . . . . . . . . . . . 100 107,844T-Mobile USA Inc.
4.00%, 04/15/22 (Call 03/16/22) . . . . . . . . . . . . . . . . . . . . . . . . . . . . . 60 62,0074.50%, 02/01/26 (Call 02/01/21) . . . . . . . . . . . . . . . . . . . . . . . . . . . . . 40 40,9804.75%, 02/01/28 (Call 02/01/23) . . . . . . . . . . . . . . . . . . . . . . . . . . . . . 165 176,8755.38%, 04/15/27 (Call 04/15/22)(b) . . . . . . . . . . . . . . . . . . . . . . . . . . . 45 48,0346.00%, 03/01/23 (Call 11/10/20) . . . . . . . . . . . . . . . . . . . . . . . . . . . . . 110 110,0936.00%, 04/15/24 (Call 04/15/21) . . . . . . . . . . . . . . . . . . . . . . . . . . . . . 150 152,6346.50%, 01/15/26 (Call 01/15/21)(b) . . . . . . . . . . . . . . . . . . . . . . . . . . . 200 208,338
United States Cellular Corp., 6.70%, 12/15/33 . . . . . . . . . . . . . . . . . . 100 131,860
Security
Par/Shares
(000) Value
Telecommunications (continued)Vmed O2 UK Financing I PLC, 4.25%, 01/31/31
(Call 01/31/26)(a) . . . . . . . . . . . . . . . . . . . . . . . . . . . . . . . . . . . . . . . . . . . $ 200 $ 200,490
5,290,965
Total Corporate Bonds & Notes — 98.1%(Cost: $59,905,869). . . . . . . . . . . . . . . . . . . . . . . . . . . . . . . . . . . . . . . . . . . . . . . . . 60,055,404
Common StocksMedia — 0.0%
AMC Entertainment Inc.(f)(g) . . . . . . . . . . . . . . . . . . . . . . . . . . . . . . . . . 0(h) 505
Total Common Stocks — 0.0%(Cost $0) . . . . . . . . . . . . . . . . . . . . . . . . . . . . . . . . . . . . . . . . . . . . . . . . . . . . . . . . . . . 505
Short-Term InvestmentsMoney Market Funds — 11.8%BlackRock Cash Funds: Institutional, SL Agency Shares,
0.20%(i)(j)(k). . . . . . . . . . . . . . . . . . . . . . . . . . . . . . . . . . . . . . . . . . . . . . . . . 5,681 5,685,245BlackRock Cash Funds: Treasury, SL Agency Shares, 0.04%(i)(j). 1,535 1,535,000
7,220,245
Total Short-Term Investments — 11.8%(Cost: $7,219,395) . . . . . . . . . . . . . . . . . . . . . . . . . . . . . . . . . . . . . . . . . . . . . . . . . . 7,220,245
Total Investments in Securities — 109.9%(Cost: $67,125,264). . . . . . . . . . . . . . . . . . . . . . . . . . . . . . . . . . . . . . . . . . . . . . . . . 67,276,154
Other Assets, Less Liabilities — (9.9)% . . . . . . . . . . . . . . . . . . . . . . . . . . . . . . . (6,041,349)
Net Assets — 100.0% . . . . . . . . . . . . . . . . . . . . . . . . . . . . . . . . . . . . . . . . . . . . . . . . . $ 61,234,805
(a) Security exempt from registration pursuant to Rule 144A under the Securities Act of1933, as amended. These securities may be resold in transactions exempt fromregistration to qualified institutional investors.
(b) All or a portion of this security is on loan.(c) Payment-in-kind ("PIK") bond which gives the issuer an option to make coupon pay-
ments in cash or in the form of additional bonds. Stated interest rate represents the cashcoupon rate.
(d) Variable rate security. Interest rate resets periodically. The rate shown is the effectiveinterest rate as of period end. Security description also includes the reference rate andspread if published and available.
(e) Perpetual security with no stated maturity date.(f) Security is valued using significant unobservable inputs and is classified as Level 3 in the
fair value hierarchy.(g) Non-income producing security.(h) Rounds to less than 1,000.(i) Affiliate of the Fund.(j) Annualized 7-day yield as of period-end.(k) All or a portion of this security was purchased with cash collateral received from loaned
securities.
Schedule of Investments (continued)
October 31, 2020
iShares� ESG Advanced High Yield Corporate Bond ETF(Percentages shown are based on Net Assets)
60 2 0 2 0 I S H A R E S A N N U A L R E P O R T T O S H A R E H O L D E R S
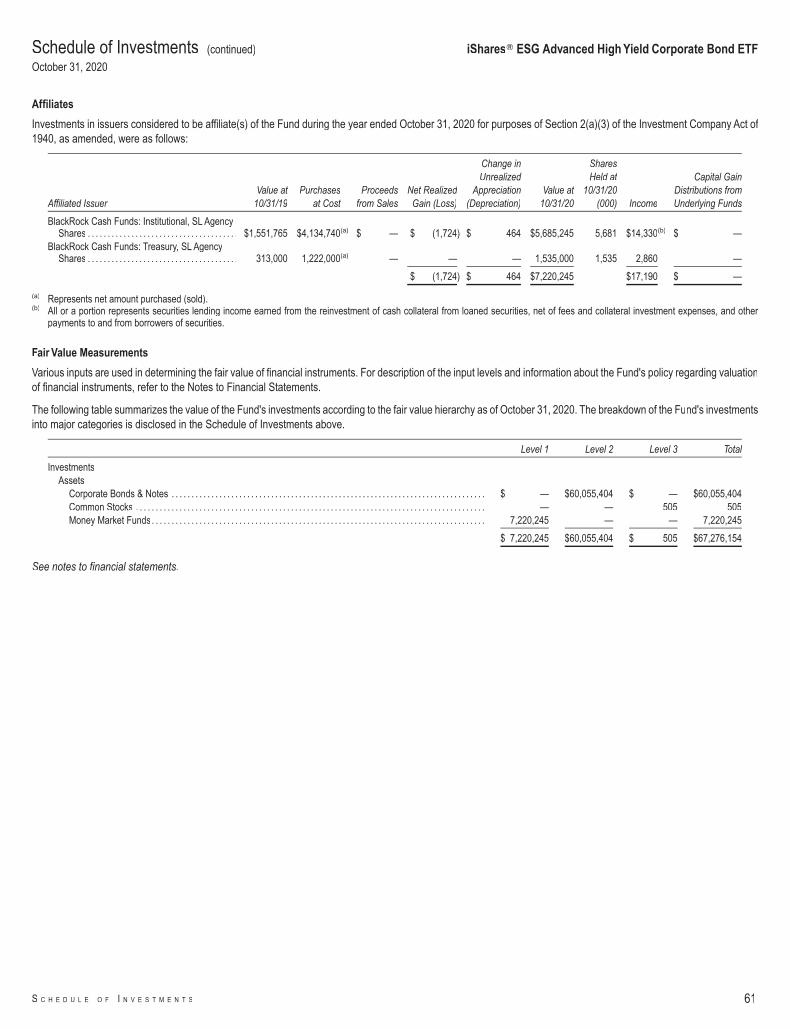
Affiliates
Investments in issuers considered to be affiliate(s) of the Fund during the year ended October 31, 2020 for purposes of Section 2(a)(3) of the Investment Company Act of1940, as amended, were as follows:
Affiliated IssuerValue at
10/31/19Purchases
at CostProceeds
from SalesNet Realized
Gain (Loss)
Change inUnrealized
Appreciation(Depreciation)
Value at10/31/20
SharesHeld at
10/31/20(000) Income
Capital GainDistributions fromUnderlying Funds
BlackRock Cash Funds: Institutional, SL AgencyShares . . . . . . . . . . . . . . . . . . . . . . . . . . . . . . . . . . . . . . $1,551,765 $4,134,740(a) $ — $ (1,724) $ 464 $5,685,245 5,681 $14,330(b) $ —
BlackRock Cash Funds: Treasury, SL AgencyShares . . . . . . . . . . . . . . . . . . . . . . . . . . . . . . . . . . . . . . 313,000 1,222,000(a) — — — 1,535,000 1,535 2,860 —
$ (1,724) $ 464 $7,220,245 $17,190 $ —
(a) Represents net amount purchased (sold).(b) All or a portion represents securities lending income earned from the reinvestment of cash collateral from loaned securities, net of fees and collateral investment expenses, and other
payments to and from borrowers of securities.
Fair Value Measurements
Various inputs are used in determining the fair value of financial instruments. For description of the input levels and information about the Fund's policy regarding valuationof financial instruments, refer to the Notes to Financial Statements.
The following table summarizes the value of the Fund's investments according to the fair value hierarchy as of October 31, 2020. The breakdown of the Fund's investmentsinto major categories is disclosed in the Schedule of Investments above.
Level 1 Level 2 Level 3 Total
InvestmentsAssets
Corporate Bonds & Notes . . . . . . . . . . . . . . . . . . . . . . . . . . . . . . . . . . . . . . . . . . . . . . . . . . . . . . . . . . . . . . . . . . . . . . . . . . . . . . . $ — $60,055,404 $ — $60,055,404Common Stocks . . . . . . . . . . . . . . . . . . . . . . . . . . . . . . . . . . . . . . . . . . . . . . . . . . . . . . . . . . . . . . . . . . . . . . . . . . . . . . . . . . . . . . . . — — 505 505Money Market Funds. . . . . . . . . . . . . . . . . . . . . . . . . . . . . . . . . . . . . . . . . . . . . . . . . . . . . . . . . . . . . . . . . . . . . . . . . . . . . . . . . . . . 7,220,245 — — 7,220,245
$ 7,220,245 $60,055,404 $ 505 $67,276,154
See notes to financial statements.
Schedule of Investments (continued)
October 31, 2020
iShares� ESG Advanced High Yield Corporate Bond ETF
S C H E D U L E O F I N V E S T M E N T S 61
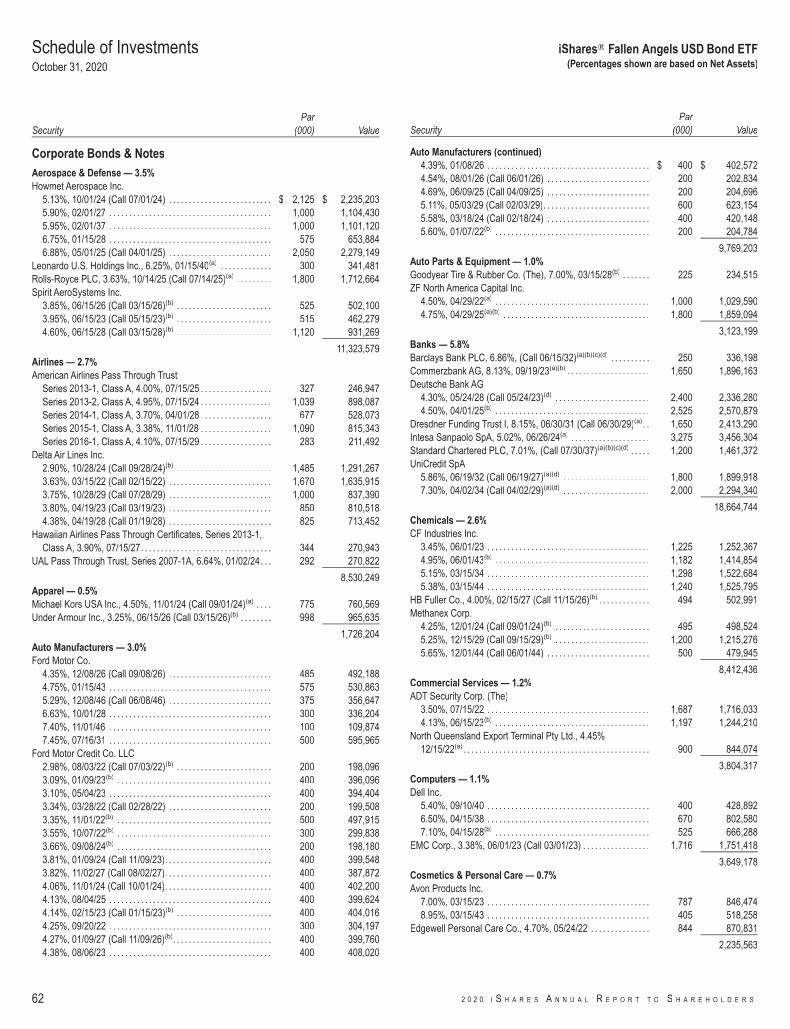
SecurityPar
(000) Value
Corporate Bonds & NotesAerospace & Defense — 3.5%Howmet Aerospace Inc.
5.13%, 10/01/24 (Call 07/01/24) . . . . . . . . . . . . . . . . . . . . . . . . . . $ 2,125 $ 2,235,2035.90%, 02/01/27 . . . . . . . . . . . . . . . . . . . . . . . . . . . . . . . . . . . . . . . . . 1,000 1,104,4305.95%, 02/01/37 . . . . . . . . . . . . . . . . . . . . . . . . . . . . . . . . . . . . . . . . . 1,000 1,101,1206.75%, 01/15/28 . . . . . . . . . . . . . . . . . . . . . . . . . . . . . . . . . . . . . . . . . 575 653,8846.88%, 05/01/25 (Call 04/01/25) . . . . . . . . . . . . . . . . . . . . . . . . . . 2,050 2,279,149
Leonardo U.S. Holdings Inc., 6.25%, 01/15/40(a) . . . . . . . . . . . . . 300 341,481Rolls-Royce PLC, 3.63%, 10/14/25 (Call 07/14/25)(a) . . . . . . . . . 1,800 1,712,664Spirit AeroSystems Inc.
3.85%, 06/15/26 (Call 03/15/26)(b) . . . . . . . . . . . . . . . . . . . . . . . . 525 502,1003.95%, 06/15/23 (Call 05/15/23)(b) . . . . . . . . . . . . . . . . . . . . . . . . 515 462,2794.60%, 06/15/28 (Call 03/15/28)(b) . . . . . . . . . . . . . . . . . . . . . . . . 1,120 931,269
11,323,579Airlines — 2.7%American Airlines Pass Through Trust
Series 2013-1, Class A, 4.00%, 07/15/25 . . . . . . . . . . . . . . . . . . 327 246,947Series 2013-2, Class A, 4.95%, 07/15/24 . . . . . . . . . . . . . . . . . . 1,039 898,087Series 2014-1, Class A, 3.70%, 04/01/28 . . . . . . . . . . . . . . . . . . 677 528,073Series 2015-1, Class A, 3.38%, 11/01/28 . . . . . . . . . . . . . . . . . . 1,090 815,343Series 2016-1, Class A, 4.10%, 07/15/29 . . . . . . . . . . . . . . . . . . 283 211,492
Delta Air Lines Inc.2.90%, 10/28/24 (Call 09/28/24)(b) . . . . . . . . . . . . . . . . . . . . . . . . 1,485 1,291,2673.63%, 03/15/22 (Call 02/15/22) . . . . . . . . . . . . . . . . . . . . . . . . . . 1,670 1,635,9153.75%, 10/28/29 (Call 07/28/29) . . . . . . . . . . . . . . . . . . . . . . . . . . 1,000 837,3903.80%, 04/19/23 (Call 03/19/23) . . . . . . . . . . . . . . . . . . . . . . . . . . 850 810,5184.38%, 04/19/28 (Call 01/19/28) . . . . . . . . . . . . . . . . . . . . . . . . . . 825 713,452
Hawaiian Airlines Pass Through Certificates, Series 2013-1,Class A, 3.90%, 07/15/27. . . . . . . . . . . . . . . . . . . . . . . . . . . . . . . . . 344 270,943
UAL Pass Through Trust, Series 2007-1A, 6.64%, 01/02/24. . . 292 270,822
8,530,249Apparel — 0.5%Michael Kors USA Inc., 4.50%, 11/01/24 (Call 09/01/24)(a) . . . . 775 760,569Under Armour Inc., 3.25%, 06/15/26 (Call 03/15/26)(b) . . . . . . . . 998 965,635
1,726,204Auto Manufacturers — 3.0%Ford Motor Co.
4.35%, 12/08/26 (Call 09/08/26) . . . . . . . . . . . . . . . . . . . . . . . . . . 485 492,1884.75%, 01/15/43 . . . . . . . . . . . . . . . . . . . . . . . . . . . . . . . . . . . . . . . . . 575 530,8635.29%, 12/08/46 (Call 06/08/46) . . . . . . . . . . . . . . . . . . . . . . . . . . 375 356,6476.63%, 10/01/28 . . . . . . . . . . . . . . . . . . . . . . . . . . . . . . . . . . . . . . . . . 300 336,2047.40%, 11/01/46 . . . . . . . . . . . . . . . . . . . . . . . . . . . . . . . . . . . . . . . . . 100 109,8747.45%, 07/16/31 . . . . . . . . . . . . . . . . . . . . . . . . . . . . . . . . . . . . . . . . . 500 595,965
Ford Motor Credit Co. LLC2.98%, 08/03/22 (Call 07/03/22)(b) . . . . . . . . . . . . . . . . . . . . . . . . 200 198,0963.09%, 01/09/23(b) . . . . . . . . . . . . . . . . . . . . . . . . . . . . . . . . . . . . . . . 400 396,0963.10%, 05/04/23 . . . . . . . . . . . . . . . . . . . . . . . . . . . . . . . . . . . . . . . . . 400 394,4043.34%, 03/28/22 (Call 02/28/22) . . . . . . . . . . . . . . . . . . . . . . . . . . 200 199,5083.35%, 11/01/22(b) . . . . . . . . . . . . . . . . . . . . . . . . . . . . . . . . . . . . . . . 500 497,9153.55%, 10/07/22(b) . . . . . . . . . . . . . . . . . . . . . . . . . . . . . . . . . . . . . . . 300 299,8383.66%, 09/08/24(b) . . . . . . . . . . . . . . . . . . . . . . . . . . . . . . . . . . . . . . . 200 198,1803.81%, 01/09/24 (Call 11/09/23). . . . . . . . . . . . . . . . . . . . . . . . . . . 400 399,5483.82%, 11/02/27 (Call 08/02/27). . . . . . . . . . . . . . . . . . . . . . . . . . . 400 387,8724.06%, 11/01/24 (Call 10/01/24). . . . . . . . . . . . . . . . . . . . . . . . . . . 400 402,2004.13%, 08/04/25 . . . . . . . . . . . . . . . . . . . . . . . . . . . . . . . . . . . . . . . . . 400 399,6244.14%, 02/15/23 (Call 01/15/23)(b) . . . . . . . . . . . . . . . . . . . . . . . . 400 404,0164.25%, 09/20/22 . . . . . . . . . . . . . . . . . . . . . . . . . . . . . . . . . . . . . . . . . 300 304,1974.27%, 01/09/27 (Call 11/09/26)(b). . . . . . . . . . . . . . . . . . . . . . . . . 400 399,7604.38%, 08/06/23 . . . . . . . . . . . . . . . . . . . . . . . . . . . . . . . . . . . . . . . . . 400 408,020
SecurityPar
(000) Value
Auto Manufacturers (continued)4.39%, 01/08/26 . . . . . . . . . . . . . . . . . . . . . . . . . . . . . . . . . . . . . . . . . $ 400 $ 402,5724.54%, 08/01/26 (Call 06/01/26) . . . . . . . . . . . . . . . . . . . . . . . . . . 200 202,8344.69%, 06/09/25 (Call 04/09/25) . . . . . . . . . . . . . . . . . . . . . . . . . . 200 204,6965.11%, 05/03/29 (Call 02/03/29). . . . . . . . . . . . . . . . . . . . . . . . . . . 600 623,1545.58%, 03/18/24 (Call 02/18/24) . . . . . . . . . . . . . . . . . . . . . . . . . . 400 420,1485.60%, 01/07/22(b) . . . . . . . . . . . . . . . . . . . . . . . . . . . . . . . . . . . . . . . 200 204,784
9,769,203Auto Parts & Equipment — 1.0%Goodyear Tire & Rubber Co. (The), 7.00%, 03/15/28(b) . . . . . . . 225 234,515ZF North America Capital Inc.
4.50%, 04/29/22(a) . . . . . . . . . . . . . . . . . . . . . . . . . . . . . . . . . . . . . . . 1,000 1,029,5904.75%, 04/29/25(a)(b) . . . . . . . . . . . . . . . . . . . . . . . . . . . . . . . . . . . . . 1,800 1,859,094
3,123,199Banks — 5.8%Barclays Bank PLC, 6.86%, (Call 06/15/32)(a)(b)(c)(d) . . . . . . . . . . 250 336,198Commerzbank AG, 8.13%, 09/19/23(a)(b) . . . . . . . . . . . . . . . . . . . . . 1,650 1,896,163Deutsche Bank AG
4.30%, 05/24/28 (Call 05/24/23)(d) . . . . . . . . . . . . . . . . . . . . . . . . 2,400 2,336,2804.50%, 04/01/25(b) . . . . . . . . . . . . . . . . . . . . . . . . . . . . . . . . . . . . . . . 2,525 2,570,879
Dresdner Funding Trust I, 8.15%, 06/30/31 (Call 06/30/29)(a). . 1,650 2,413,290Intesa Sanpaolo SpA, 5.02%, 06/26/24(a) . . . . . . . . . . . . . . . . . . . . 3,275 3,456,304Standard Chartered PLC, 7.01%, (Call 07/30/37)(a)(b)(c)(d) . . . . . 1,200 1,461,372UniCredit SpA
5.86%, 06/19/32 (Call 06/19/27)(a)(d) . . . . . . . . . . . . . . . . . . . . . . 1,800 1,899,9187.30%, 04/02/34 (Call 04/02/29)(a)(d) . . . . . . . . . . . . . . . . . . . . . . 2,000 2,294,340
18,664,744Chemicals — 2.6%CF Industries Inc.
3.45%, 06/01/23 . . . . . . . . . . . . . . . . . . . . . . . . . . . . . . . . . . . . . . . . . 1,225 1,252,3674.95%, 06/01/43(b) . . . . . . . . . . . . . . . . . . . . . . . . . . . . . . . . . . . . . . . 1,182 1,414,8545.15%, 03/15/34 . . . . . . . . . . . . . . . . . . . . . . . . . . . . . . . . . . . . . . . . . 1,298 1,522,6845.38%, 03/15/44 . . . . . . . . . . . . . . . . . . . . . . . . . . . . . . . . . . . . . . . . . 1,240 1,525,795
HB Fuller Co., 4.00%, 02/15/27 (Call 11/15/26)(b) . . . . . . . . . . . . . 494 502,991Methanex Corp.
4.25%, 12/01/24 (Call 09/01/24)(b) . . . . . . . . . . . . . . . . . . . . . . . . 495 498,5245.25%, 12/15/29 (Call 09/15/29)(b) . . . . . . . . . . . . . . . . . . . . . . . . 1,200 1,215,2765.65%, 12/01/44 (Call 06/01/44) . . . . . . . . . . . . . . . . . . . . . . . . . . 500 479,945
8,412,436Commercial Services — 1.2%ADT Security Corp. (The)
3.50%, 07/15/22 . . . . . . . . . . . . . . . . . . . . . . . . . . . . . . . . . . . . . . . . . 1,687 1,716,0334.13%, 06/15/23(b) . . . . . . . . . . . . . . . . . . . . . . . . . . . . . . . . . . . . . . . 1,197 1,244,210
North Queensland Export Terminal Pty Ltd., 4.45%,12/15/22(a) . . . . . . . . . . . . . . . . . . . . . . . . . . . . . . . . . . . . . . . . . . . . . . . 900 844,074
3,804,317Computers — 1.1%Dell Inc.
5.40%, 09/10/40 . . . . . . . . . . . . . . . . . . . . . . . . . . . . . . . . . . . . . . . . . 400 428,8926.50%, 04/15/38 . . . . . . . . . . . . . . . . . . . . . . . . . . . . . . . . . . . . . . . . . 670 802,5807.10%, 04/15/28(b) . . . . . . . . . . . . . . . . . . . . . . . . . . . . . . . . . . . . . . . 525 666,288
EMC Corp., 3.38%, 06/01/23 (Call 03/01/23) . . . . . . . . . . . . . . . . . 1,716 1,751,418
3,649,178Cosmetics & Personal Care — 0.7%Avon Products Inc.
7.00%, 03/15/23 . . . . . . . . . . . . . . . . . . . . . . . . . . . . . . . . . . . . . . . . . 787 846,4748.95%, 03/15/43 . . . . . . . . . . . . . . . . . . . . . . . . . . . . . . . . . . . . . . . . . 405 518,258
Edgewell Personal Care Co., 4.70%, 05/24/22 . . . . . . . . . . . . . . . 844 870,831
2,235,563
Schedule of InvestmentsOctober 31, 2020
iShares� Fallen Angels USD Bond ETF(Percentages shown are based on Net Assets)
62 2 0 2 0 I S H A R E S A N N U A L R E P O R T T O S H A R E H O L D E R S

SecurityPar
(000) Value
Diversified Financial Services — 1.2%Navient Corp.
5.50%, 01/25/23 . . . . . . . . . . . . . . . . . . . . . . . . . . . . . . . . . . . . . . . . . $ 1,700 $ 1,696,3455.63%, 08/01/33(b) . . . . . . . . . . . . . . . . . . . . . . . . . . . . . . . . . . . . . . . 1,000 857,1407.25%, 01/25/22 . . . . . . . . . . . . . . . . . . . . . . . . . . . . . . . . . . . . . . . . . 1,260 1,299,879
3,853,364Electric — 0.6%Midland Cogeneration Venture LP, 6.00%, 03/15/25(a)(b) . . . . . . 438 449,151Panoche Energy Center LLC, 6.89%, 07/31/29(a)(b) . . . . . . . . . . . 248 218,928TransAlta Corp.
4.50%, 11/15/22 (Call 08/15/22)(b). . . . . . . . . . . . . . . . . . . . . . . . . 685 709,1536.50%, 03/15/40(b) . . . . . . . . . . . . . . . . . . . . . . . . . . . . . . . . . . . . . . . 510 539,004
1,916,236Electronics — 0.5%Ingram Micro Inc.
5.00%, 08/10/22 (Call 02/10/22) . . . . . . . . . . . . . . . . . . . . . . . . . . 560 570,8585.45%, 12/15/24 (Call 09/15/24) . . . . . . . . . . . . . . . . . . . . . . . . . . 827 868,648
1,439,506Energy - Alternate Sources — 0.5%Topaz Solar Farms LLC, 5.75%, 09/30/39(a) . . . . . . . . . . . . . . . . . . 1,273 1,453,175
Engineering & Construction — 0.5%Fluor Corp.
3.50%, 12/15/24 (Call 09/15/24) . . . . . . . . . . . . . . . . . . . . . . . . . . 875 792,4614.25%, 09/15/28 (Call 06/15/28) . . . . . . . . . . . . . . . . . . . . . . . . . . 1,000 892,910
1,685,371Food — 3.1%Kraft Heinz Foods Co.
3.00%, 06/01/26 (Call 03/01/26) . . . . . . . . . . . . . . . . . . . . . . . . . . 950 969,4373.75%, 04/01/30 (Call 01/01/30)(a)(b) . . . . . . . . . . . . . . . . . . . . . . 550 578,4023.95%, 07/15/25 (Call 04/15/25) . . . . . . . . . . . . . . . . . . . . . . . . . . 813 880,1704.00%, 06/15/23 (Call 05/15/23) . . . . . . . . . . . . . . . . . . . . . . . . . . 125 133,7154.38%, 06/01/46 (Call 12/01/45)(b) . . . . . . . . . . . . . . . . . . . . . . . . 1,350 1,387,0174.63%, 01/30/29 (Call 10/30/28) . . . . . . . . . . . . . . . . . . . . . . . . . . 485 538,8694.63%, 10/01/39 (Call 04/01/39)(a)(b) . . . . . . . . . . . . . . . . . . . . . . 250 268,6174.88%, 10/01/49 (Call 04/01/49)(a) . . . . . . . . . . . . . . . . . . . . . . . . 600 634,0625.00%, 07/15/35 (Call 01/15/35) . . . . . . . . . . . . . . . . . . . . . . . . . . 425 489,8045.00%, 06/04/42 . . . . . . . . . . . . . . . . . . . . . . . . . . . . . . . . . . . . . . . . . 825 907,3275.20%, 07/15/45 (Call 01/15/45) . . . . . . . . . . . . . . . . . . . . . . . . . . 725 802,3366.38%, 07/15/28 . . . . . . . . . . . . . . . . . . . . . . . . . . . . . . . . . . . . . . . . . 75 91,9466.50%, 02/09/40 . . . . . . . . . . . . . . . . . . . . . . . . . . . . . . . . . . . . . . . . . 300 382,8846.75%, 03/15/32 . . . . . . . . . . . . . . . . . . . . . . . . . . . . . . . . . . . . . . . . . 200 262,3306.88%, 01/26/39 . . . . . . . . . . . . . . . . . . . . . . . . . . . . . . . . . . . . . . . . . 400 536,5447.13%, 08/01/39(a) . . . . . . . . . . . . . . . . . . . . . . . . . . . . . . . . . . . . . . . 400 540,472
Safeway Inc., 7.25%, 02/01/31 . . . . . . . . . . . . . . . . . . . . . . . . . . . . . . 408 459,518
9,863,450Forest Products & Paper — 0.2%Smurfit Kappa Treasury Funding DAC, 7.50%, 11/20/25(b) . . . . 535 642,310
Health Care - Services — 0.9%HCA Inc.
7.05%, 12/01/27(b) . . . . . . . . . . . . . . . . . . . . . . . . . . . . . . . . . . . . . . . 190 228,7137.50%, 11/15/95(b) . . . . . . . . . . . . . . . . . . . . . . . . . . . . . . . . . . . . . . . 335 423,5677.69%, 06/15/25(b) . . . . . . . . . . . . . . . . . . . . . . . . . . . . . . . . . . . . . . . 502 600,9248.36%, 04/15/24 . . . . . . . . . . . . . . . . . . . . . . . . . . . . . . . . . . . . . . . . . 295 345,575
Magellan Health Inc., 4.90%, 09/22/24 (Call 07/22/24) . . . . . . . . 655 690,311Tenet Healthcare Corp., 6.88%, 11/15/31(b) . . . . . . . . . . . . . . . . . . 560 555,654
2,844,744
SecurityPar
(000) Value
Home Builders — 1.1%MDC Holdings Inc.
5.50%, 01/15/24 (Call 10/15/23) . . . . . . . . . . . . . . . . . . . . . . . . . . $ 405 $ 439,6366.00%, 01/15/43 (Call 10/15/42) . . . . . . . . . . . . . . . . . . . . . . . . . . 841 1,053,731
PulteGroup Inc.6.00%, 02/15/35 . . . . . . . . . . . . . . . . . . . . . . . . . . . . . . . . . . . . . . . . . 523 650,8586.38%, 05/15/33(b) . . . . . . . . . . . . . . . . . . . . . . . . . . . . . . . . . . . . . . . 681 869,2567.88%, 06/15/32(b) . . . . . . . . . . . . . . . . . . . . . . . . . . . . . . . . . . . . . . . 420 595,341
3,608,822Housewares — 2.7%Newell Brands Inc.
4.00%, 06/15/22 (Call 03/15/22)(b) . . . . . . . . . . . . . . . . . . . . . . . . 350 362,0614.00%, 12/01/24 (Call 09/01/24)(b) . . . . . . . . . . . . . . . . . . . . . . . . 275 286,4404.35%, 04/01/23 (Call 02/01/23) . . . . . . . . . . . . . . . . . . . . . . . . . . 2,400 2,504,7604.70%, 04/01/26 (Call 01/01/26) . . . . . . . . . . . . . . . . . . . . . . . . . . 3,265 3,478,4995.88%, 04/01/36 (Call 10/01/35)(b) . . . . . . . . . . . . . . . . . . . . . . . . 750 878,1906.00%, 04/01/46 (Call 10/01/45)(b) . . . . . . . . . . . . . . . . . . . . . . . . 1,060 1,255,273
8,765,223Insurance — 0.6%Genworth Holdings Inc., 6.50%, 06/15/34 . . . . . . . . . . . . . . . . . . . . 530 498,454Liberty Mutual Group Inc., 7.80%, 03/15/37(a)(b) . . . . . . . . . . . . . . 625 769,406MBIA Inc., 5.70%, 12/01/34(b) . . . . . . . . . . . . . . . . . . . . . . . . . . . . . . . 375 311,888Provident Financing Trust I, 7.41%, 03/15/38(b) . . . . . . . . . . . . . . . 300 342,789
1,922,537Internet — 0.2%NortonLifeLock Inc., 3.95%, 06/15/22 (Call 03/15/22) . . . . . . . . . 725 745,126
Iron & Steel — 2.7%Allegheny Ludlum LLC, 6.95%, 12/15/25(b) . . . . . . . . . . . . . . . . . . . 245 243,653Allegheny Technologies Inc., 7.88%, 08/15/23 (Call 05/15/23) . 845 854,185ArcelorMittal SA
3.60%, 07/16/24 . . . . . . . . . . . . . . . . . . . . . . . . . . . . . . . . . . . . . . . . . 1,225 1,272,2114.25%, 07/16/29(b) . . . . . . . . . . . . . . . . . . . . . . . . . . . . . . . . . . . . . . . 870 917,5634.55%, 03/11/26 . . . . . . . . . . . . . . . . . . . . . . . . . . . . . . . . . . . . . . . . . 1,300 1,397,8256.13%, 06/01/25(b) . . . . . . . . . . . . . . . . . . . . . . . . . . . . . . . . . . . . . . . 400 463,7727.00%, 03/01/41 . . . . . . . . . . . . . . . . . . . . . . . . . . . . . . . . . . . . . . . . . 700 843,9907.25%, 10/15/39 . . . . . . . . . . . . . . . . . . . . . . . . . . . . . . . . . . . . . . . . . 1,125 1,374,289
Carpenter Technology Corp., 4.45%, 03/01/23(Call 12/01/22)(b) . . . . . . . . . . . . . . . . . . . . . . . . . . . . . . . . . . . . . . . . . 560 577,903
Cleveland-Cliffs Inc., 6.25%, 10/01/40 . . . . . . . . . . . . . . . . . . . . . . . 425 361,577U.S. Steel Corp., 6.65%, 06/01/37 . . . . . . . . . . . . . . . . . . . . . . . . . . . 565 391,771
8,698,739Leisure Time — 5.3%Carnival Corp.
6.65%, 01/15/28 . . . . . . . . . . . . . . . . . . . . . . . . . . . . . . . . . . . . . . . . . 350 278,66311.50%, 04/01/23 (Call 01/01/23)(a) . . . . . . . . . . . . . . . . . . . . . . . 6,530 7,186,918
Carnival PLC, 7.88%, 06/01/27(b) . . . . . . . . . . . . . . . . . . . . . . . . . . . . 325 329,602Royal Caribbean Cruises Ltd.
3.70%, 03/15/28 (Call 12/15/27) . . . . . . . . . . . . . . . . . . . . . . . . . . 850 617,5425.25%, 11/15/22(b) . . . . . . . . . . . . . . . . . . . . . . . . . . . . . . . . . . . . . . . 1,060 947,3547.50%, 10/15/27 . . . . . . . . . . . . . . . . . . . . . . . . . . . . . . . . . . . . . . . . . 475 412,21410.88%, 06/01/23 (Call 03/01/23)(a)(b) . . . . . . . . . . . . . . . . . . . . . 1,900 2,072,48211.50%, 06/01/25 (Call 06/01/22)(a) . . . . . . . . . . . . . . . . . . . . . . . 4,075 4,661,474
Silversea Cruise Finance Ltd., 7.25%, 02/01/25(Call 02/01/21)(a) . . . . . . . . . . . . . . . . . . . . . . . . . . . . . . . . . . . . . . . . . 500 502,580
17,008,829Lodging — 1.1%Wyndham Destinations Inc.
3.90%, 03/01/23 (Call 12/01/22) . . . . . . . . . . . . . . . . . . . . . . . . . . 650 642,5254.25%, 03/01/22 (Call 12/01/21) . . . . . . . . . . . . . . . . . . . . . . . . . . 1,075 1,080,257
Schedule of Investments (continued)
October 31, 2020
iShares� Fallen Angels USD Bond ETF(Percentages shown are based on Net Assets)
S C H E D U L E O F I N V E S T M E N T S 63
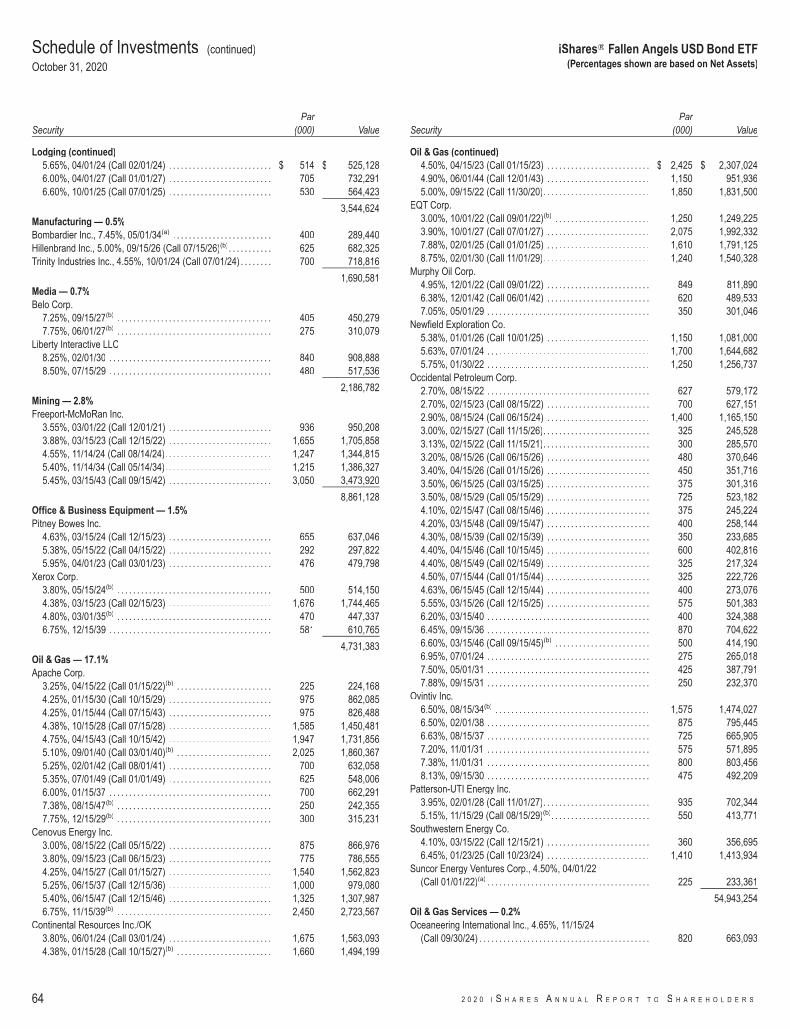
SecurityPar
(000) Value
Lodging (continued)5.65%, 04/01/24 (Call 02/01/24) . . . . . . . . . . . . . . . . . . . . . . . . . . $ 514 $ 525,1286.00%, 04/01/27 (Call 01/01/27) . . . . . . . . . . . . . . . . . . . . . . . . . . 705 732,2916.60%, 10/01/25 (Call 07/01/25) . . . . . . . . . . . . . . . . . . . . . . . . . . 530 564,423
3,544,624Manufacturing — 0.5%Bombardier Inc., 7.45%, 05/01/34(a) . . . . . . . . . . . . . . . . . . . . . . . . . 400 289,440Hillenbrand Inc., 5.00%, 09/15/26 (Call 07/15/26)(b). . . . . . . . . . . 625 682,325Trinity Industries Inc., 4.55%, 10/01/24 (Call 07/01/24) . . . . . . . . 700 718,816
1,690,581Media — 0.7%Belo Corp.
7.25%, 09/15/27(b) . . . . . . . . . . . . . . . . . . . . . . . . . . . . . . . . . . . . . . . 405 450,2797.75%, 06/01/27(b) . . . . . . . . . . . . . . . . . . . . . . . . . . . . . . . . . . . . . . . 275 310,079
Liberty Interactive LLC8.25%, 02/01/30 . . . . . . . . . . . . . . . . . . . . . . . . . . . . . . . . . . . . . . . . . 840 908,8888.50%, 07/15/29 . . . . . . . . . . . . . . . . . . . . . . . . . . . . . . . . . . . . . . . . . 480 517,536
2,186,782Mining — 2.8%Freeport-McMoRan Inc.
3.55%, 03/01/22 (Call 12/01/21) . . . . . . . . . . . . . . . . . . . . . . . . . . 936 950,2083.88%, 03/15/23 (Call 12/15/22) . . . . . . . . . . . . . . . . . . . . . . . . . . 1,655 1,705,8584.55%, 11/14/24 (Call 08/14/24). . . . . . . . . . . . . . . . . . . . . . . . . . . 1,247 1,344,8155.40%, 11/14/34 (Call 05/14/34). . . . . . . . . . . . . . . . . . . . . . . . . . . 1,215 1,386,3275.45%, 03/15/43 (Call 09/15/42) . . . . . . . . . . . . . . . . . . . . . . . . . . 3,050 3,473,920
8,861,128Office & Business Equipment — 1.5%Pitney Bowes Inc.
4.63%, 03/15/24 (Call 12/15/23) . . . . . . . . . . . . . . . . . . . . . . . . . . 655 637,0465.38%, 05/15/22 (Call 04/15/22) . . . . . . . . . . . . . . . . . . . . . . . . . . 292 297,8225.95%, 04/01/23 (Call 03/01/23) . . . . . . . . . . . . . . . . . . . . . . . . . . 476 479,798
Xerox Corp.3.80%, 05/15/24(b) . . . . . . . . . . . . . . . . . . . . . . . . . . . . . . . . . . . . . . . 500 514,1504.38%, 03/15/23 (Call 02/15/23) . . . . . . . . . . . . . . . . . . . . . . . . . . 1,676 1,744,4654.80%, 03/01/35(b) . . . . . . . . . . . . . . . . . . . . . . . . . . . . . . . . . . . . . . . 470 447,3376.75%, 12/15/39 . . . . . . . . . . . . . . . . . . . . . . . . . . . . . . . . . . . . . . . . . 581 610,765
4,731,383Oil & Gas — 17.1%Apache Corp.
3.25%, 04/15/22 (Call 01/15/22)(b) . . . . . . . . . . . . . . . . . . . . . . . . 225 224,1684.25%, 01/15/30 (Call 10/15/29) . . . . . . . . . . . . . . . . . . . . . . . . . . 975 862,0854.25%, 01/15/44 (Call 07/15/43) . . . . . . . . . . . . . . . . . . . . . . . . . . 975 826,4884.38%, 10/15/28 (Call 07/15/28) . . . . . . . . . . . . . . . . . . . . . . . . . . 1,585 1,450,4814.75%, 04/15/43 (Call 10/15/42) . . . . . . . . . . . . . . . . . . . . . . . . . . 1,947 1,731,8565.10%, 09/01/40 (Call 03/01/40)(b) . . . . . . . . . . . . . . . . . . . . . . . . 2,025 1,860,3675.25%, 02/01/42 (Call 08/01/41) . . . . . . . . . . . . . . . . . . . . . . . . . . 700 632,0585.35%, 07/01/49 (Call 01/01/49) . . . . . . . . . . . . . . . . . . . . . . . . . . 625 548,0066.00%, 01/15/37 . . . . . . . . . . . . . . . . . . . . . . . . . . . . . . . . . . . . . . . . . 700 662,2917.38%, 08/15/47(b) . . . . . . . . . . . . . . . . . . . . . . . . . . . . . . . . . . . . . . . 250 242,3557.75%, 12/15/29(b) . . . . . . . . . . . . . . . . . . . . . . . . . . . . . . . . . . . . . . . 300 315,231
Cenovus Energy Inc.3.00%, 08/15/22 (Call 05/15/22) . . . . . . . . . . . . . . . . . . . . . . . . . . 875 866,9763.80%, 09/15/23 (Call 06/15/23) . . . . . . . . . . . . . . . . . . . . . . . . . . 775 786,5554.25%, 04/15/27 (Call 01/15/27) . . . . . . . . . . . . . . . . . . . . . . . . . . 1,540 1,562,8235.25%, 06/15/37 (Call 12/15/36) . . . . . . . . . . . . . . . . . . . . . . . . . . 1,000 979,0805.40%, 06/15/47 (Call 12/15/46) . . . . . . . . . . . . . . . . . . . . . . . . . . 1,325 1,307,9876.75%, 11/15/39(b) . . . . . . . . . . . . . . . . . . . . . . . . . . . . . . . . . . . . . . . 2,450 2,723,567
Continental Resources Inc./OK3.80%, 06/01/24 (Call 03/01/24) . . . . . . . . . . . . . . . . . . . . . . . . . . 1,675 1,563,0934.38%, 01/15/28 (Call 10/15/27)(b) . . . . . . . . . . . . . . . . . . . . . . . . 1,660 1,494,199
SecurityPar
(000) Value
Oil & Gas (continued)4.50%, 04/15/23 (Call 01/15/23) . . . . . . . . . . . . . . . . . . . . . . . . . . $ 2,425 $ 2,307,0244.90%, 06/01/44 (Call 12/01/43) . . . . . . . . . . . . . . . . . . . . . . . . . . 1,150 951,9365.00%, 09/15/22 (Call 11/30/20). . . . . . . . . . . . . . . . . . . . . . . . . . . 1,850 1,831,500
EQT Corp.3.00%, 10/01/22 (Call 09/01/22)(b) . . . . . . . . . . . . . . . . . . . . . . . . 1,250 1,249,2253.90%, 10/01/27 (Call 07/01/27) . . . . . . . . . . . . . . . . . . . . . . . . . . 2,075 1,992,3327.88%, 02/01/25 (Call 01/01/25) . . . . . . . . . . . . . . . . . . . . . . . . . . 1,610 1,791,1258.75%, 02/01/30 (Call 11/01/29). . . . . . . . . . . . . . . . . . . . . . . . . . . 1,240 1,540,328
Murphy Oil Corp.4.95%, 12/01/22 (Call 09/01/22) . . . . . . . . . . . . . . . . . . . . . . . . . . 849 811,8906.38%, 12/01/42 (Call 06/01/42) . . . . . . . . . . . . . . . . . . . . . . . . . . 620 489,5337.05%, 05/01/29 . . . . . . . . . . . . . . . . . . . . . . . . . . . . . . . . . . . . . . . . . 350 301,046
Newfield Exploration Co.5.38%, 01/01/26 (Call 10/01/25) . . . . . . . . . . . . . . . . . . . . . . . . . . 1,150 1,081,0005.63%, 07/01/24 . . . . . . . . . . . . . . . . . . . . . . . . . . . . . . . . . . . . . . . . . 1,700 1,644,6825.75%, 01/30/22 . . . . . . . . . . . . . . . . . . . . . . . . . . . . . . . . . . . . . . . . . 1,250 1,256,737
Occidental Petroleum Corp.2.70%, 08/15/22 . . . . . . . . . . . . . . . . . . . . . . . . . . . . . . . . . . . . . . . . . 627 579,1722.70%, 02/15/23 (Call 08/15/22) . . . . . . . . . . . . . . . . . . . . . . . . . . 700 627,1512.90%, 08/15/24 (Call 06/15/24) . . . . . . . . . . . . . . . . . . . . . . . . . . 1,400 1,165,1503.00%, 02/15/27 (Call 11/15/26). . . . . . . . . . . . . . . . . . . . . . . . . . . 325 245,5283.13%, 02/15/22 (Call 11/15/21). . . . . . . . . . . . . . . . . . . . . . . . . . . 300 285,5703.20%, 08/15/26 (Call 06/15/26) . . . . . . . . . . . . . . . . . . . . . . . . . . 480 370,6463.40%, 04/15/26 (Call 01/15/26) . . . . . . . . . . . . . . . . . . . . . . . . . . 450 351,7163.50%, 06/15/25 (Call 03/15/25) . . . . . . . . . . . . . . . . . . . . . . . . . . 375 301,3163.50%, 08/15/29 (Call 05/15/29) . . . . . . . . . . . . . . . . . . . . . . . . . . 725 523,1824.10%, 02/15/47 (Call 08/15/46) . . . . . . . . . . . . . . . . . . . . . . . . . . 375 245,2244.20%, 03/15/48 (Call 09/15/47) . . . . . . . . . . . . . . . . . . . . . . . . . . 400 258,1444.30%, 08/15/39 (Call 02/15/39) . . . . . . . . . . . . . . . . . . . . . . . . . . 350 233,6854.40%, 04/15/46 (Call 10/15/45) . . . . . . . . . . . . . . . . . . . . . . . . . . 600 402,8164.40%, 08/15/49 (Call 02/15/49) . . . . . . . . . . . . . . . . . . . . . . . . . . 325 217,3244.50%, 07/15/44 (Call 01/15/44) . . . . . . . . . . . . . . . . . . . . . . . . . . 325 222,7264.63%, 06/15/45 (Call 12/15/44) . . . . . . . . . . . . . . . . . . . . . . . . . . 400 273,0765.55%, 03/15/26 (Call 12/15/25) . . . . . . . . . . . . . . . . . . . . . . . . . . 575 501,3836.20%, 03/15/40 . . . . . . . . . . . . . . . . . . . . . . . . . . . . . . . . . . . . . . . . . 400 324,3886.45%, 09/15/36 . . . . . . . . . . . . . . . . . . . . . . . . . . . . . . . . . . . . . . . . . 870 704,6226.60%, 03/15/46 (Call 09/15/45)(b) . . . . . . . . . . . . . . . . . . . . . . . . 500 414,1906.95%, 07/01/24 . . . . . . . . . . . . . . . . . . . . . . . . . . . . . . . . . . . . . . . . . 275 265,0187.50%, 05/01/31 . . . . . . . . . . . . . . . . . . . . . . . . . . . . . . . . . . . . . . . . . 425 387,7917.88%, 09/15/31 . . . . . . . . . . . . . . . . . . . . . . . . . . . . . . . . . . . . . . . . . 250 232,370
Ovintiv Inc.6.50%, 08/15/34(b) . . . . . . . . . . . . . . . . . . . . . . . . . . . . . . . . . . . . . . . 1,575 1,474,0276.50%, 02/01/38 . . . . . . . . . . . . . . . . . . . . . . . . . . . . . . . . . . . . . . . . . 875 795,4456.63%, 08/15/37 . . . . . . . . . . . . . . . . . . . . . . . . . . . . . . . . . . . . . . . . . 725 665,9057.20%, 11/01/31 . . . . . . . . . . . . . . . . . . . . . . . . . . . . . . . . . . . . . . . . . 575 571,8957.38%, 11/01/31 . . . . . . . . . . . . . . . . . . . . . . . . . . . . . . . . . . . . . . . . . 800 803,4568.13%, 09/15/30 . . . . . . . . . . . . . . . . . . . . . . . . . . . . . . . . . . . . . . . . . 475 492,209
Patterson-UTI Energy Inc.3.95%, 02/01/28 (Call 11/01/27). . . . . . . . . . . . . . . . . . . . . . . . . . . 935 702,3445.15%, 11/15/29 (Call 08/15/29)(b). . . . . . . . . . . . . . . . . . . . . . . . . 550 413,771
Southwestern Energy Co.4.10%, 03/15/22 (Call 12/15/21) . . . . . . . . . . . . . . . . . . . . . . . . . . 360 356,6956.45%, 01/23/25 (Call 10/23/24) . . . . . . . . . . . . . . . . . . . . . . . . . . 1,410 1,413,934
Suncor Energy Ventures Corp., 4.50%, 04/01/22(Call 01/01/22)(a) . . . . . . . . . . . . . . . . . . . . . . . . . . . . . . . . . . . . . . . . . 225 233,361
54,943,254Oil & Gas Services — 0.2%Oceaneering International Inc., 4.65%, 11/15/24
(Call 09/30/24) . . . . . . . . . . . . . . . . . . . . . . . . . . . . . . . . . . . . . . . . . . . 820 663,093
Schedule of Investments (continued)
October 31, 2020
iShares� Fallen Angels USD Bond ETF(Percentages shown are based on Net Assets)
64 2 0 2 0 I S H A R E S A N N U A L R E P O R T T O S H A R E H O L D E R S
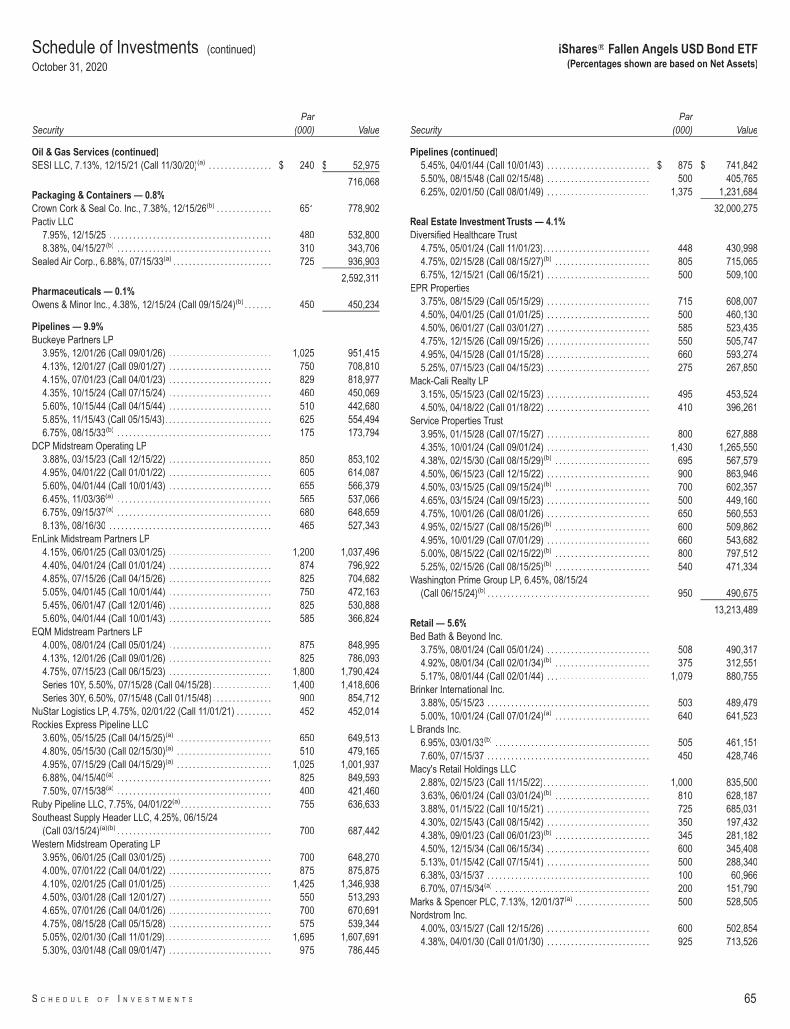
SecurityPar
(000) Value
Oil & Gas Services (continued)SESI LLC, 7.13%, 12/15/21 (Call 11/30/20)(a) . . . . . . . . . . . . . . . . $ 240 $ 52,975
716,068Packaging & Containers — 0.8%Crown Cork & Seal Co. Inc., 7.38%, 12/15/26(b) . . . . . . . . . . . . . . 651 778,902Pactiv LLC
7.95%, 12/15/25 . . . . . . . . . . . . . . . . . . . . . . . . . . . . . . . . . . . . . . . . . 480 532,8008.38%, 04/15/27(b) . . . . . . . . . . . . . . . . . . . . . . . . . . . . . . . . . . . . . . . 310 343,706
Sealed Air Corp., 6.88%, 07/15/33(a) . . . . . . . . . . . . . . . . . . . . . . . . . 725 936,903
2,592,311Pharmaceuticals — 0.1%Owens & Minor Inc., 4.38%, 12/15/24 (Call 09/15/24)(b) . . . . . . . 450 450,234
Pipelines — 9.9%Buckeye Partners LP
3.95%, 12/01/26 (Call 09/01/26) . . . . . . . . . . . . . . . . . . . . . . . . . . 1,025 951,4154.13%, 12/01/27 (Call 09/01/27) . . . . . . . . . . . . . . . . . . . . . . . . . . 750 708,8104.15%, 07/01/23 (Call 04/01/23) . . . . . . . . . . . . . . . . . . . . . . . . . . 829 818,9774.35%, 10/15/24 (Call 07/15/24) . . . . . . . . . . . . . . . . . . . . . . . . . . 460 450,0695.60%, 10/15/44 (Call 04/15/44) . . . . . . . . . . . . . . . . . . . . . . . . . . 510 442,6805.85%, 11/15/43 (Call 05/15/43). . . . . . . . . . . . . . . . . . . . . . . . . . . 625 554,4946.75%, 08/15/33(b) . . . . . . . . . . . . . . . . . . . . . . . . . . . . . . . . . . . . . . . 175 173,794
DCP Midstream Operating LP3.88%, 03/15/23 (Call 12/15/22) . . . . . . . . . . . . . . . . . . . . . . . . . . 850 853,1024.95%, 04/01/22 (Call 01/01/22) . . . . . . . . . . . . . . . . . . . . . . . . . . 605 614,0875.60%, 04/01/44 (Call 10/01/43) . . . . . . . . . . . . . . . . . . . . . . . . . . 655 566,3796.45%, 11/03/36(a) . . . . . . . . . . . . . . . . . . . . . . . . . . . . . . . . . . . . . . . 565 537,0666.75%, 09/15/37(a) . . . . . . . . . . . . . . . . . . . . . . . . . . . . . . . . . . . . . . . 680 648,6598.13%, 08/16/30 . . . . . . . . . . . . . . . . . . . . . . . . . . . . . . . . . . . . . . . . . 465 527,343
EnLink Midstream Partners LP4.15%, 06/01/25 (Call 03/01/25) . . . . . . . . . . . . . . . . . . . . . . . . . . 1,200 1,037,4964.40%, 04/01/24 (Call 01/01/24) . . . . . . . . . . . . . . . . . . . . . . . . . . 874 796,9224.85%, 07/15/26 (Call 04/15/26) . . . . . . . . . . . . . . . . . . . . . . . . . . 825 704,6825.05%, 04/01/45 (Call 10/01/44) . . . . . . . . . . . . . . . . . . . . . . . . . . 750 472,1635.45%, 06/01/47 (Call 12/01/46) . . . . . . . . . . . . . . . . . . . . . . . . . . 825 530,8885.60%, 04/01/44 (Call 10/01/43) . . . . . . . . . . . . . . . . . . . . . . . . . . 585 366,824
EQM Midstream Partners LP4.00%, 08/01/24 (Call 05/01/24) . . . . . . . . . . . . . . . . . . . . . . . . . . 875 848,9954.13%, 12/01/26 (Call 09/01/26) . . . . . . . . . . . . . . . . . . . . . . . . . . 825 786,0934.75%, 07/15/23 (Call 06/15/23) . . . . . . . . . . . . . . . . . . . . . . . . . . 1,800 1,790,424Series 10Y, 5.50%, 07/15/28 (Call 04/15/28) . . . . . . . . . . . . . . . 1,400 1,418,606Series 30Y, 6.50%, 07/15/48 (Call 01/15/48) . . . . . . . . . . . . . . . 900 854,712
NuStar Logistics LP, 4.75%, 02/01/22 (Call 11/01/21) . . . . . . . . . 452 452,014Rockies Express Pipeline LLC
3.60%, 05/15/25 (Call 04/15/25)(a) . . . . . . . . . . . . . . . . . . . . . . . . 650 649,5134.80%, 05/15/30 (Call 02/15/30)(a) . . . . . . . . . . . . . . . . . . . . . . . . 510 479,1654.95%, 07/15/29 (Call 04/15/29)(a) . . . . . . . . . . . . . . . . . . . . . . . . 1,025 1,001,9376.88%, 04/15/40(a) . . . . . . . . . . . . . . . . . . . . . . . . . . . . . . . . . . . . . . . 825 849,5937.50%, 07/15/38(a) . . . . . . . . . . . . . . . . . . . . . . . . . . . . . . . . . . . . . . . 400 421,460
Ruby Pipeline LLC, 7.75%, 04/01/22(a). . . . . . . . . . . . . . . . . . . . . . . 755 636,633Southeast Supply Header LLC, 4.25%, 06/15/24
(Call 03/15/24)(a)(b) . . . . . . . . . . . . . . . . . . . . . . . . . . . . . . . . . . . . . . . 700 687,442Western Midstream Operating LP
3.95%, 06/01/25 (Call 03/01/25) . . . . . . . . . . . . . . . . . . . . . . . . . . 700 648,2704.00%, 07/01/22 (Call 04/01/22) . . . . . . . . . . . . . . . . . . . . . . . . . . 875 875,8754.10%, 02/01/25 (Call 01/01/25) . . . . . . . . . . . . . . . . . . . . . . . . . . 1,425 1,346,9384.50%, 03/01/28 (Call 12/01/27) . . . . . . . . . . . . . . . . . . . . . . . . . . 550 513,2934.65%, 07/01/26 (Call 04/01/26) . . . . . . . . . . . . . . . . . . . . . . . . . . 700 670,6914.75%, 08/15/28 (Call 05/15/28) . . . . . . . . . . . . . . . . . . . . . . . . . . 575 539,3445.05%, 02/01/30 (Call 11/01/29). . . . . . . . . . . . . . . . . . . . . . . . . . . 1,695 1,607,6915.30%, 03/01/48 (Call 09/01/47) . . . . . . . . . . . . . . . . . . . . . . . . . . 975 786,445
SecurityPar
(000) Value
Pipelines (continued)5.45%, 04/01/44 (Call 10/01/43) . . . . . . . . . . . . . . . . . . . . . . . . . . $ 875 $ 741,8425.50%, 08/15/48 (Call 02/15/48) . . . . . . . . . . . . . . . . . . . . . . . . . . 500 405,7656.25%, 02/01/50 (Call 08/01/49) . . . . . . . . . . . . . . . . . . . . . . . . . . 1,375 1,231,684
32,000,275Real Estate Investment Trusts — 4.1%Diversified Healthcare Trust
4.75%, 05/01/24 (Call 11/01/23). . . . . . . . . . . . . . . . . . . . . . . . . . . 448 430,9984.75%, 02/15/28 (Call 08/15/27)(b) . . . . . . . . . . . . . . . . . . . . . . . . 805 715,0656.75%, 12/15/21 (Call 06/15/21) . . . . . . . . . . . . . . . . . . . . . . . . . . 500 509,100
EPR Properties3.75%, 08/15/29 (Call 05/15/29) . . . . . . . . . . . . . . . . . . . . . . . . . . 715 608,0074.50%, 04/01/25 (Call 01/01/25) . . . . . . . . . . . . . . . . . . . . . . . . . . 500 460,1304.50%, 06/01/27 (Call 03/01/27) . . . . . . . . . . . . . . . . . . . . . . . . . . 585 523,4354.75%, 12/15/26 (Call 09/15/26) . . . . . . . . . . . . . . . . . . . . . . . . . . 550 505,7474.95%, 04/15/28 (Call 01/15/28) . . . . . . . . . . . . . . . . . . . . . . . . . . 660 593,2745.25%, 07/15/23 (Call 04/15/23) . . . . . . . . . . . . . . . . . . . . . . . . . . 275 267,850
Mack-Cali Realty LP3.15%, 05/15/23 (Call 02/15/23) . . . . . . . . . . . . . . . . . . . . . . . . . . 495 453,5244.50%, 04/18/22 (Call 01/18/22) . . . . . . . . . . . . . . . . . . . . . . . . . . 410 396,261
Service Properties Trust3.95%, 01/15/28 (Call 07/15/27) . . . . . . . . . . . . . . . . . . . . . . . . . . 800 627,8884.35%, 10/01/24 (Call 09/01/24) . . . . . . . . . . . . . . . . . . . . . . . . . . 1,430 1,265,5504.38%, 02/15/30 (Call 08/15/29)(b) . . . . . . . . . . . . . . . . . . . . . . . . 695 567,5794.50%, 06/15/23 (Call 12/15/22) . . . . . . . . . . . . . . . . . . . . . . . . . . 900 863,9464.50%, 03/15/25 (Call 09/15/24)(b) . . . . . . . . . . . . . . . . . . . . . . . . 700 602,3574.65%, 03/15/24 (Call 09/15/23) . . . . . . . . . . . . . . . . . . . . . . . . . . 500 449,1604.75%, 10/01/26 (Call 08/01/26) . . . . . . . . . . . . . . . . . . . . . . . . . . 650 560,5534.95%, 02/15/27 (Call 08/15/26)(b) . . . . . . . . . . . . . . . . . . . . . . . . 600 509,8624.95%, 10/01/29 (Call 07/01/29) . . . . . . . . . . . . . . . . . . . . . . . . . . 660 543,6825.00%, 08/15/22 (Call 02/15/22)(b) . . . . . . . . . . . . . . . . . . . . . . . . 800 797,5125.25%, 02/15/26 (Call 08/15/25)(b) . . . . . . . . . . . . . . . . . . . . . . . . 540 471,334
Washington Prime Group LP, 6.45%, 08/15/24(Call 06/15/24)(b) . . . . . . . . . . . . . . . . . . . . . . . . . . . . . . . . . . . . . . . . . 950 490,675
13,213,489Retail — 5.6%Bed Bath & Beyond Inc.
3.75%, 08/01/24 (Call 05/01/24) . . . . . . . . . . . . . . . . . . . . . . . . . . 508 490,3174.92%, 08/01/34 (Call 02/01/34)(b) . . . . . . . . . . . . . . . . . . . . . . . . 375 312,5515.17%, 08/01/44 (Call 02/01/44) . . . . . . . . . . . . . . . . . . . . . . . . . . 1,079 880,755
Brinker International Inc.3.88%, 05/15/23 . . . . . . . . . . . . . . . . . . . . . . . . . . . . . . . . . . . . . . . . . 503 489,4795.00%, 10/01/24 (Call 07/01/24)(a) . . . . . . . . . . . . . . . . . . . . . . . . 640 641,523
L Brands Inc.6.95%, 03/01/33(b) . . . . . . . . . . . . . . . . . . . . . . . . . . . . . . . . . . . . . . . 505 461,1517.60%, 07/15/37 . . . . . . . . . . . . . . . . . . . . . . . . . . . . . . . . . . . . . . . . . 450 428,746
Macy's Retail Holdings LLC2.88%, 02/15/23 (Call 11/15/22). . . . . . . . . . . . . . . . . . . . . . . . . . . 1,000 835,5003.63%, 06/01/24 (Call 03/01/24)(b) . . . . . . . . . . . . . . . . . . . . . . . . 810 628,1873.88%, 01/15/22 (Call 10/15/21) . . . . . . . . . . . . . . . . . . . . . . . . . . 725 685,0314.30%, 02/15/43 (Call 08/15/42) . . . . . . . . . . . . . . . . . . . . . . . . . . 350 197,4324.38%, 09/01/23 (Call 06/01/23)(b) . . . . . . . . . . . . . . . . . . . . . . . . 345 281,1824.50%, 12/15/34 (Call 06/15/34) . . . . . . . . . . . . . . . . . . . . . . . . . . 600 345,4085.13%, 01/15/42 (Call 07/15/41) . . . . . . . . . . . . . . . . . . . . . . . . . . 500 288,3406.38%, 03/15/37 . . . . . . . . . . . . . . . . . . . . . . . . . . . . . . . . . . . . . . . . . 100 60,9666.70%, 07/15/34(a) . . . . . . . . . . . . . . . . . . . . . . . . . . . . . . . . . . . . . . . 200 151,790
Marks & Spencer PLC, 7.13%, 12/01/37(a) . . . . . . . . . . . . . . . . . . . 500 528,505Nordstrom Inc.
4.00%, 03/15/27 (Call 12/15/26) . . . . . . . . . . . . . . . . . . . . . . . . . . 600 502,8544.38%, 04/01/30 (Call 01/01/30) . . . . . . . . . . . . . . . . . . . . . . . . . . 925 713,526
Schedule of Investments (continued)
October 31, 2020
iShares� Fallen Angels USD Bond ETF(Percentages shown are based on Net Assets)
S C H E D U L E O F I N V E S T M E N T S 65

SecurityPar
(000) Value
Retail (continued)5.00%, 01/15/44 (Call 07/15/43) . . . . . . . . . . . . . . . . . . . . . . . . . . $ 1,500 $ 1,061,0706.95%, 03/15/28(b) . . . . . . . . . . . . . . . . . . . . . . . . . . . . . . . . . . . . . . . 525 493,873
QVC Inc.4.38%, 03/15/23 . . . . . . . . . . . . . . . . . . . . . . . . . . . . . . . . . . . . . . . . . 1,270 1,315,7454.45%, 02/15/25 (Call 11/15/24). . . . . . . . . . . . . . . . . . . . . . . . . . . 1,035 1,068,7004.75%, 02/15/27 (Call 11/15/26). . . . . . . . . . . . . . . . . . . . . . . . . . . 965 985,3814.85%, 04/01/24 . . . . . . . . . . . . . . . . . . . . . . . . . . . . . . . . . . . . . . . . . 950 986,5185.45%, 08/15/34 (Call 02/15/34)(b) . . . . . . . . . . . . . . . . . . . . . . . . 675 663,6335.95%, 03/15/43 . . . . . . . . . . . . . . . . . . . . . . . . . . . . . . . . . . . . . . . . . 500 483,595
Rite Aid Corp., 7.70%, 02/15/27 . . . . . . . . . . . . . . . . . . . . . . . . . . . . . 400 308,984Yum! Brands Inc.
3.88%, 11/01/23 (Call 08/01/23)(b). . . . . . . . . . . . . . . . . . . . . . . . . 600 624,4085.35%, 11/01/43 (Call 05/01/43)(b). . . . . . . . . . . . . . . . . . . . . . . . . 445 477,9306.88%, 11/15/37(b) . . . . . . . . . . . . . . . . . . . . . . . . . . . . . . . . . . . . . . . 535 647,179
18,040,259Software — 0.3%CDK Global Inc., 5.00%, 10/15/24 (Call 07/15/24) . . . . . . . . . . . . 875 946,698
Telecommunications — 11.0%CenturyLink Inc.
Series G, 6.88%, 01/15/28. . . . . . . . . . . . . . . . . . . . . . . . . . . . . . . . 745 827,814Series P, 7.60%, 09/15/39 . . . . . . . . . . . . . . . . . . . . . . . . . . . . . . . . 864 973,374Series T, 5.80%, 03/15/22 . . . . . . . . . . . . . . . . . . . . . . . . . . . . . . . . 2,260 2,350,287Series U, 7.65%, 03/15/42. . . . . . . . . . . . . . . . . . . . . . . . . . . . . . . . 815 897,845
Embarq Corp., 8.00%, 06/01/36 . . . . . . . . . . . . . . . . . . . . . . . . . . . . . 2,355 2,755,350Nokia OYJ, 6.63%, 05/15/39 . . . . . . . . . . . . . . . . . . . . . . . . . . . . . . . . 820 1,033,872Qwest Corp.
6.75%, 12/01/21 . . . . . . . . . . . . . . . . . . . . . . . . . . . . . . . . . . . . . . . . . 1,554 1,629,4007.25%, 09/15/25 . . . . . . . . . . . . . . . . . . . . . . . . . . . . . . . . . . . . . . . . . 410 470,528
Sprint Capital Corp.6.88%, 11/15/28 . . . . . . . . . . . . . . . . . . . . . . . . . . . . . . . . . . . . . . . . . 3,800 4,807,8748.75%, 03/15/32 . . . . . . . . . . . . . . . . . . . . . . . . . . . . . . . . . . . . . . . . . 3,147 4,708,951
Telecom Italia Capital SA6.00%, 09/30/34 . . . . . . . . . . . . . . . . . . . . . . . . . . . . . . . . . . . . . . . . . 1,613 1,880,5326.38%, 11/15/33 . . . . . . . . . . . . . . . . . . . . . . . . . . . . . . . . . . . . . . . . . 1,631 1,934,8397.20%, 07/18/36 . . . . . . . . . . . . . . . . . . . . . . . . . . . . . . . . . . . . . . . . . 1,813 2,292,7927.72%, 06/04/38 . . . . . . . . . . . . . . . . . . . . . . . . . . . . . . . . . . . . . . . . . 1,550 2,105,892
Telefonaktiebolaget LM Ericsson, 4.13%, 05/15/22 . . . . . . . . . . . 1,672 1,734,617United States Cellular Corp., 6.70%, 12/15/33(b) . . . . . . . . . . . . . . 914 1,205,200Vodafone Group PLC, 7.00%, 04/04/79 (Call 01/04/29)(d) . . . . . 3,300 3,913,701
35,522,868
Security
Par/Shares
(000) Value
Toys, Games & Hobbies — 0.4%Mattel Inc.
3.15%, 03/15/23 (Call 12/15/22)(b) . . . . . . . . . . . . . . . . . . . . . . . . $ 491 $ 490,7645.45%, 11/01/41 (Call 05/01/41)(b). . . . . . . . . . . . . . . . . . . . . . . . . 490 494,1016.20%, 10/01/40(b) . . . . . . . . . . . . . . . . . . . . . . . . . . . . . . . . . . . . . . . 410 428,024
1,412,889Transportation — 0.2%XPO CNW Inc., 6.70%, 05/01/34(b) . . . . . . . . . . . . . . . . . . . . . . . . . . 495 553,544
Total Corporate Bonds & Notes — 98.5%(Cost: $297,736,436) . . . . . . . . . . . . . . . . . . . . . . . . . . . . . . . . . . . . . . . . . . . . . . 317,092,491
Short-Term InvestmentsMoney Market Funds — 14.1%BlackRock Cash Funds: Institutional, SL Agency Shares,
0.20%(e)(f)(g). . . . . . . . . . . . . . . . . . . . . . . . . . . . . . . . . . . . . . . . . . . . . . 42,432 42,461,709BlackRock Cash Funds: Treasury, SL Agency Shares,
0.04%(e)(f). . . . . . . . . . . . . . . . . . . . . . . . . . . . . . . . . . . . . . . . . . . . . . . . 3,140 3,140,000
45,601,709
Total Short-Term Investments — 14.1%(Cost: $45,594,592) . . . . . . . . . . . . . . . . . . . . . . . . . . . . . . . . . . . . . . . . . . . . . . . 45,601,709
Total Investments in Securities — 112.6%(Cost: $343,331,028) . . . . . . . . . . . . . . . . . . . . . . . . . . . . . . . . . . . . . . . . . . . . . . 362,694,200
Other Assets, Less Liabilities — (12.6)% . . . . . . . . . . . . . . . . . . . . . . . . . . . . (40,722,751)
Net Assets — 100.0% . . . . . . . . . . . . . . . . . . . . . . . . . . . . . . . . . . . . . . . . . . . . . . . . $ 321,971,449
(a) Security exempt from registration pursuant to Rule 144A under the Securities Act of1933, as amended. These securities may be resold in transactions exempt fromregistration to qualified institutional investors.
(b) All or a portion of this security is on loan.(c) Perpetual security with no stated maturity date.(d) Variable rate security. Interest rate resets periodically. The rate shown is the effective
interest rate as of period end. Security description also includes the reference rate andspread if published and available.
(e) Affiliate of the Fund.(f) Annualized 7-day yield as of period-end.(g) All or a portion of this security was purchased with cash collateral received from loaned
securities.
Affiliates
Investments in issuers considered to be affiliate(s) of the Fund during the year ended October 31, 2020 for purposes of Section 2(a)(3) of the Investment Company Act of1940, as amended, were as follows:
Affiliated IssuerValue at
10/31/19Purchases
at CostProceeds
from SalesNet Realized
Gain (Loss)
Change inUnrealized
Appreciation(Depreciation)
Value at10/31/20
SharesHeld at
10/31/20(000) Income
Capital GainDistributions fromUnderlying Funds
BlackRock Cash Funds: Institutional, SLAgency Shares . . . . . . . . . . . . . . . . . . . . . . . . . $21,409,740 $21,067,841(a) $ — $ (19,183) $ 3,311 $42,461,709 42,432 $217,778(b) $ —
BlackRock Cash Funds: Treasury, SLAgency Shares . . . . . . . . . . . . . . . . . . . . . . . . . 1,554,000 1,586,000(a) — — — 3,140,000 3,140 13,779 —
$ (19,183) $ 3,311 $45,601,709 $231,557 $ —
(a) Represents net amount purchased (sold).(b) All or a portion represents securities lending income earned from the reinvestment of cash collateral from loaned securities, net of fees and collateral investment expenses, and other
payments to and from borrowers of securities.
Schedule of Investments (continued)
October 31, 2020
iShares� Fallen Angels USD Bond ETF(Percentages shown are based on Net Assets)
66 2 0 2 0 I S H A R E S A N N U A L R E P O R T T O S H A R E H O L D E R S
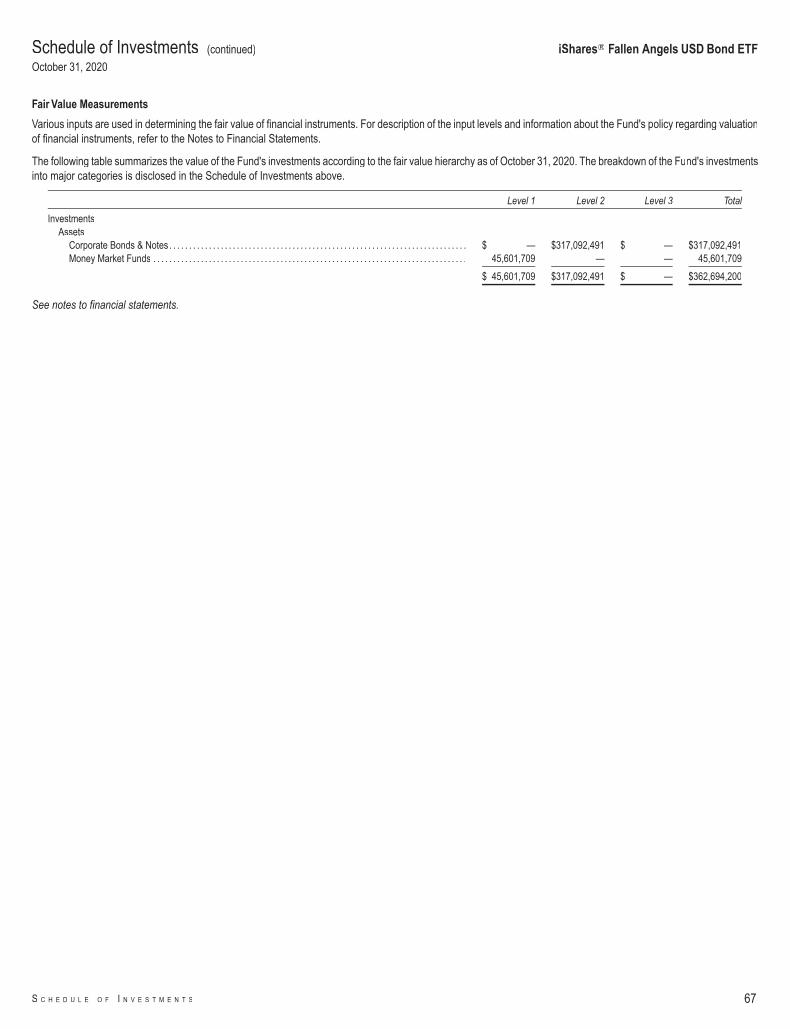
Fair Value Measurements
Various inputs are used in determining the fair value of financial instruments. For description of the input levels and information about the Fund's policy regarding valuationof financial instruments, refer to the Notes to Financial Statements.
The following table summarizes the value of the Fund's investments according to the fair value hierarchy as of October 31, 2020. The breakdown of the Fund's investmentsinto major categories is disclosed in the Schedule of Investments above.
Level 1 Level 2 Level 3 Total
InvestmentsAssets
Corporate Bonds & Notes. . . . . . . . . . . . . . . . . . . . . . . . . . . . . . . . . . . . . . . . . . . . . . . . . . . . . . . . . . . . . . . . . . . . . . . . . . . $ — $317,092,491 $ — $317,092,491Money Market Funds . . . . . . . . . . . . . . . . . . . . . . . . . . . . . . . . . . . . . . . . . . . . . . . . . . . . . . . . . . . . . . . . . . . . . . . . . . . . . . . 45,601,709 — — 45,601,709
$ 45,601,709 $317,092,491 $ — $362,694,200
See notes to financial statements.
Schedule of Investments (continued)
October 31, 2020
iShares� Fallen Angels USD Bond ETF
S C H E D U L E O F I N V E S T M E N T S 67
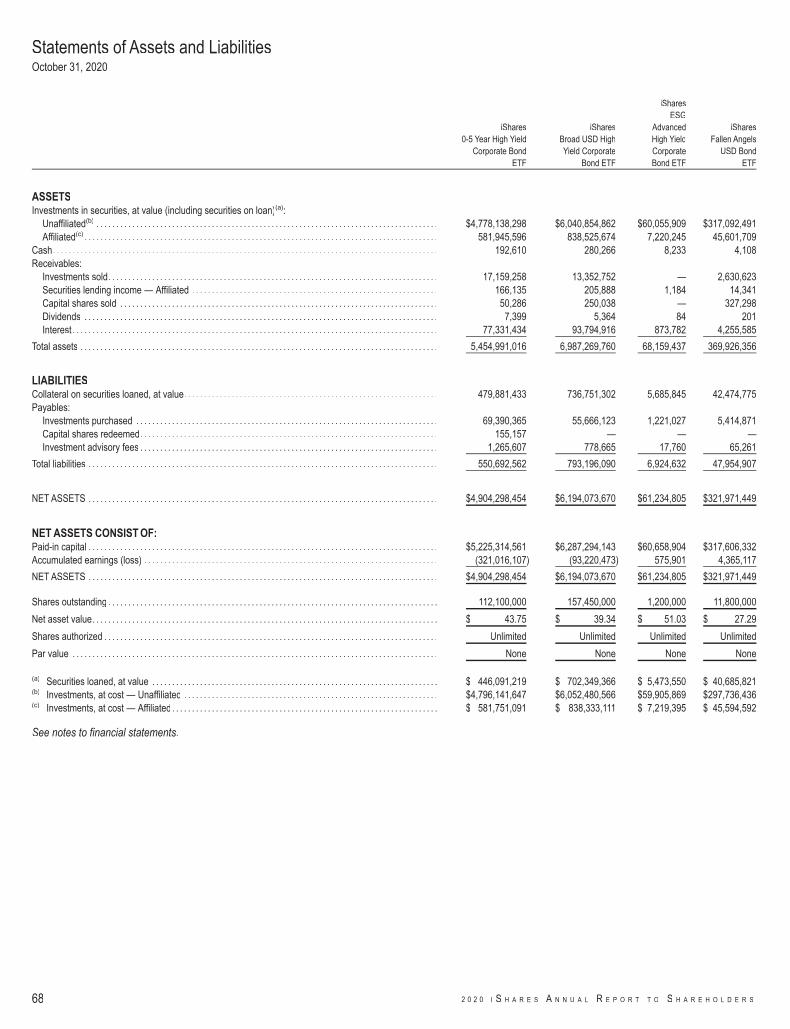
iShares0-5 Year High Yield
Corporate BondETF
iSharesBroad USD HighYield Corporate
Bond ETF
iSharesESG
AdvancedHigh YieldCorporateBond ETF
iSharesFallen Angels
USD BondETF
ASSETSInvestments in securities, at value (including securities on loan)(a):
Unaffiliated(b) . . . . . . . . . . . . . . . . . . . . . . . . . . . . . . . . . . . . . . . . . . . . . . . . . . . . . . . . . . . . . . . . . . . . . . . . . . . . . . . . . . . . . . $4,778,138,298 $6,040,854,862 $60,055,909 $317,092,491Affiliated(c) . . . . . . . . . . . . . . . . . . . . . . . . . . . . . . . . . . . . . . . . . . . . . . . . . . . . . . . . . . . . . . . . . . . . . . . . . . . . . . . . . . . . . . . . . 581,945,596 838,525,674 7,220,245 45,601,709
Cash. . . . . . . . . . . . . . . . . . . . . . . . . . . . . . . . . . . . . . . . . . . . . . . . . . . . . . . . . . . . . . . . . . . . . . . . . . . . . . . . . . . . . . . . . . . . . . . . . 192,610 280,266 8,233 4,108Receivables:
Investments sold. . . . . . . . . . . . . . . . . . . . . . . . . . . . . . . . . . . . . . . . . . . . . . . . . . . . . . . . . . . . . . . . . . . . . . . . . . . . . . . . . . . 17,159,258 13,352,752 — 2,630,623Securities lending income — Affiliated . . . . . . . . . . . . . . . . . . . . . . . . . . . . . . . . . . . . . . . . . . . . . . . . . . . . . . . . . . . . . . 166,135 205,888 1,184 14,341Capital shares sold . . . . . . . . . . . . . . . . . . . . . . . . . . . . . . . . . . . . . . . . . . . . . . . . . . . . . . . . . . . . . . . . . . . . . . . . . . . . . . . . 50,286 250,038 — 327,298Dividends . . . . . . . . . . . . . . . . . . . . . . . . . . . . . . . . . . . . . . . . . . . . . . . . . . . . . . . . . . . . . . . . . . . . . . . . . . . . . . . . . . . . . . . . . 7,399 5,364 84 201Interest . . . . . . . . . . . . . . . . . . . . . . . . . . . . . . . . . . . . . . . . . . . . . . . . . . . . . . . . . . . . . . . . . . . . . . . . . . . . . . . . . . . . . . . . . . . . 77,331,434 93,794,916 873,782 4,255,585
Total assets . . . . . . . . . . . . . . . . . . . . . . . . . . . . . . . . . . . . . . . . . . . . . . . . . . . . . . . . . . . . . . . . . . . . . . . . . . . . . . . . . . . . . . . . . . 5,454,991,016 6,987,269,760 68,159,437 369,926,356
LIABILITIESCollateral on securities loaned, at value. . . . . . . . . . . . . . . . . . . . . . . . . . . . . . . . . . . . . . . . . . . . . . . . . . . . . . . . . . . . . . . . 479,881,433 736,751,302 5,685,845 42,474,775Payables:
Investments purchased . . . . . . . . . . . . . . . . . . . . . . . . . . . . . . . . . . . . . . . . . . . . . . . . . . . . . . . . . . . . . . . . . . . . . . . . . . . . 69,390,365 55,666,123 1,221,027 5,414,871Capital shares redeemed. . . . . . . . . . . . . . . . . . . . . . . . . . . . . . . . . . . . . . . . . . . . . . . . . . . . . . . . . . . . . . . . . . . . . . . . . . . 155,157 — — —Investment advisory fees . . . . . . . . . . . . . . . . . . . . . . . . . . . . . . . . . . . . . . . . . . . . . . . . . . . . . . . . . . . . . . . . . . . . . . . . . . . 1,265,607 778,665 17,760 65,261
Total liabilities . . . . . . . . . . . . . . . . . . . . . . . . . . . . . . . . . . . . . . . . . . . . . . . . . . . . . . . . . . . . . . . . . . . . . . . . . . . . . . . . . . . . . . . . 550,692,562 793,196,090 6,924,632 47,954,907
NET ASSETS . . . . . . . . . . . . . . . . . . . . . . . . . . . . . . . . . . . . . . . . . . . . . . . . . . . . . . . . . . . . . . . . . . . . . . . . . . . . . . . . . . . . . . . . $4,904,298,454 $6,194,073,670 $61,234,805 $321,971,449
NET ASSETS CONSIST OF:Paid-in capital . . . . . . . . . . . . . . . . . . . . . . . . . . . . . . . . . . . . . . . . . . . . . . . . . . . . . . . . . . . . . . . . . . . . . . . . . . . . . . . . . . . . . . . . $5,225,314,561 $6,287,294,143 $60,658,904 $317,606,332Accumulated earnings (loss) . . . . . . . . . . . . . . . . . . . . . . . . . . . . . . . . . . . . . . . . . . . . . . . . . . . . . . . . . . . . . . . . . . . . . . . . . . (321,016,107) (93,220,473) 575,901 4,365,117
NET ASSETS . . . . . . . . . . . . . . . . . . . . . . . . . . . . . . . . . . . . . . . . . . . . . . . . . . . . . . . . . . . . . . . . . . . . . . . . . . . . . . . . . . . . . . . . $4,904,298,454 $6,194,073,670 $61,234,805 $321,971,449
Shares outstanding . . . . . . . . . . . . . . . . . . . . . . . . . . . . . . . . . . . . . . . . . . . . . . . . . . . . . . . . . . . . . . . . . . . . . . . . . . . . . . . . . . . 112,100,000 157,450,000 1,200,000 11,800,000
Net asset value. . . . . . . . . . . . . . . . . . . . . . . . . . . . . . . . . . . . . . . . . . . . . . . . . . . . . . . . . . . . . . . . . . . . . . . . . . . . . . . . . . . . . . . $ 43.75 $ 39.34 $ 51.03 $ 27.29
Shares authorized . . . . . . . . . . . . . . . . . . . . . . . . . . . . . . . . . . . . . . . . . . . . . . . . . . . . . . . . . . . . . . . . . . . . . . . . . . . . . . . . . . . . Unlimited Unlimited Unlimited Unlimited
Par value . . . . . . . . . . . . . . . . . . . . . . . . . . . . . . . . . . . . . . . . . . . . . . . . . . . . . . . . . . . . . . . . . . . . . . . . . . . . . . . . . . . . . . . . . . . . None None None None
(a) Securities loaned, at value . . . . . . . . . . . . . . . . . . . . . . . . . . . . . . . . . . . . . . . . . . . . . . . . . . . . . . . . . . . . . . . . . . . . . . . . $ 446,091,219 $ 702,349,366 $ 5,473,550 $ 40,685,821(b) Investments, at cost — Unaffiliated . . . . . . . . . . . . . . . . . . . . . . . . . . . . . . . . . . . . . . . . . . . . . . . . . . . . . . . . . . . . . . . . $4,796,141,647 $6,052,480,566 $59,905,869 $297,736,436(c) Investments, at cost — Affiliated. . . . . . . . . . . . . . . . . . . . . . . . . . . . . . . . . . . . . . . . . . . . . . . . . . . . . . . . . . . . . . . . . . . $ 581,751,091 $ 838,333,111 $ 7,219,395 $ 45,594,592
See notes to financial statements.
Statements of Assets and LiabilitiesOctober 31, 2020
68 2 0 2 0 I S H A R E S A N N U A L R E P O R T T O S H A R E H O L D E R S
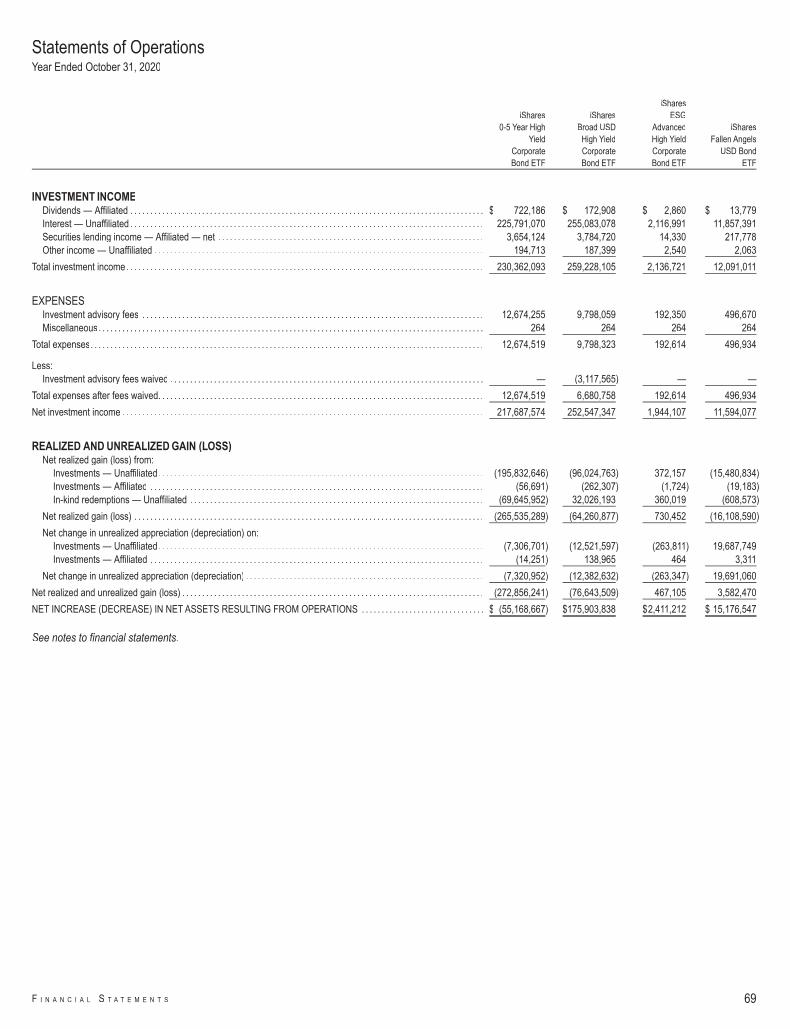
iShares0-5 Year High
YieldCorporateBond ETF
iSharesBroad USDHigh YieldCorporateBond ETF
iSharesESG
AdvancedHigh YieldCorporateBond ETF
iSharesFallen Angels
USD BondETF
INVESTMENT INCOMEDividends — Affiliated . . . . . . . . . . . . . . . . . . . . . . . . . . . . . . . . . . . . . . . . . . . . . . . . . . . . . . . . . . . . . . . . . . . . . . . . . . . . . . . . . . . . . . . . . $ 722,186 $ 172,908 $ 2,860 $ 13,779Interest — Unaffiliated . . . . . . . . . . . . . . . . . . . . . . . . . . . . . . . . . . . . . . . . . . . . . . . . . . . . . . . . . . . . . . . . . . . . . . . . . . . . . . . . . . . . . . . . . 225,791,070 255,083,078 2,116,991 11,857,391Securities lending income — Affiliated — net . . . . . . . . . . . . . . . . . . . . . . . . . . . . . . . . . . . . . . . . . . . . . . . . . . . . . . . . . . . . . . . . . . . 3,654,124 3,784,720 14,330 217,778Other income — Unaffiliated . . . . . . . . . . . . . . . . . . . . . . . . . . . . . . . . . . . . . . . . . . . . . . . . . . . . . . . . . . . . . . . . . . . . . . . . . . . . . . . . . . . 194,713 187,399 2,540 2,063
Total investment income. . . . . . . . . . . . . . . . . . . . . . . . . . . . . . . . . . . . . . . . . . . . . . . . . . . . . . . . . . . . . . . . . . . . . . . . . . . . . . . . . . . . . . . . . . 230,362,093 259,228,105 2,136,721 12,091,011
EXPENSESInvestment advisory fees . . . . . . . . . . . . . . . . . . . . . . . . . . . . . . . . . . . . . . . . . . . . . . . . . . . . . . . . . . . . . . . . . . . . . . . . . . . . . . . . . . . . . . 12,674,255 9,798,059 192,350 496,670Miscellaneous. . . . . . . . . . . . . . . . . . . . . . . . . . . . . . . . . . . . . . . . . . . . . . . . . . . . . . . . . . . . . . . . . . . . . . . . . . . . . . . . . . . . . . . . . . . . . . . . . 264 264 264 264
Total expenses. . . . . . . . . . . . . . . . . . . . . . . . . . . . . . . . . . . . . . . . . . . . . . . . . . . . . . . . . . . . . . . . . . . . . . . . . . . . . . . . . . . . . . . . . . . . . . . . . . . 12,674,519 9,798,323 192,614 496,934
Less:Investment advisory fees waived . . . . . . . . . . . . . . . . . . . . . . . . . . . . . . . . . . . . . . . . . . . . . . . . . . . . . . . . . . . . . . . . . . . . . . . . . . . . . . . — (3,117,565) — —
Total expenses after fees waived. . . . . . . . . . . . . . . . . . . . . . . . . . . . . . . . . . . . . . . . . . . . . . . . . . . . . . . . . . . . . . . . . . . . . . . . . . . . . . . . . . 12,674,519 6,680,758 192,614 496,934
Net investment income . . . . . . . . . . . . . . . . . . . . . . . . . . . . . . . . . . . . . . . . . . . . . . . . . . . . . . . . . . . . . . . . . . . . . . . . . . . . . . . . . . . . . . . . . . . 217,687,574 252,547,347 1,944,107 11,594,077
REALIZED AND UNREALIZED GAIN (LOSS)Net realized gain (loss) from:
Investments — Unaffiliated. . . . . . . . . . . . . . . . . . . . . . . . . . . . . . . . . . . . . . . . . . . . . . . . . . . . . . . . . . . . . . . . . . . . . . . . . . . . . . . . . . (195,832,646) (96,024,763) 372,157 (15,480,834)Investments — Affiliated . . . . . . . . . . . . . . . . . . . . . . . . . . . . . . . . . . . . . . . . . . . . . . . . . . . . . . . . . . . . . . . . . . . . . . . . . . . . . . . . . . . . (56,691) (262,307) (1,724) (19,183)In-kind redemptions — Unaffiliated . . . . . . . . . . . . . . . . . . . . . . . . . . . . . . . . . . . . . . . . . . . . . . . . . . . . . . . . . . . . . . . . . . . . . . . . . . (69,645,952) 32,026,193 360,019 (608,573)
Net realized gain (loss) . . . . . . . . . . . . . . . . . . . . . . . . . . . . . . . . . . . . . . . . . . . . . . . . . . . . . . . . . . . . . . . . . . . . . . . . . . . . . . . . . . . . . . . . (265,535,289) (64,260,877) 730,452 (16,108,590)
Net change in unrealized appreciation (depreciation) on:Investments — Unaffiliated. . . . . . . . . . . . . . . . . . . . . . . . . . . . . . . . . . . . . . . . . . . . . . . . . . . . . . . . . . . . . . . . . . . . . . . . . . . . . . . . . . (7,306,701) (12,521,597) (263,811) 19,687,749Investments — Affiliated . . . . . . . . . . . . . . . . . . . . . . . . . . . . . . . . . . . . . . . . . . . . . . . . . . . . . . . . . . . . . . . . . . . . . . . . . . . . . . . . . . . . (14,251) 138,965 464 3,311
Net change in unrealized appreciation (depreciation) . . . . . . . . . . . . . . . . . . . . . . . . . . . . . . . . . . . . . . . . . . . . . . . . . . . . . . . . . . . . (7,320,952) (12,382,632) (263,347) 19,691,060
Net realized and unrealized gain (loss) . . . . . . . . . . . . . . . . . . . . . . . . . . . . . . . . . . . . . . . . . . . . . . . . . . . . . . . . . . . . . . . . . . . . . . . . . . . . (272,856,241) (76,643,509) 467,105 3,582,470
NET INCREASE (DECREASE) IN NET ASSETS RESULTING FROM OPERATIONS . . . . . . . . . . . . . . . . . . . . . . . . . . . . . . . $ (55,168,667) $175,903,838 $2,411,212 $ 15,176,547
See notes to financial statements.
Statements of OperationsYear Ended October 31, 2020
F I N A N C I A L S T A T E M E N T S 69
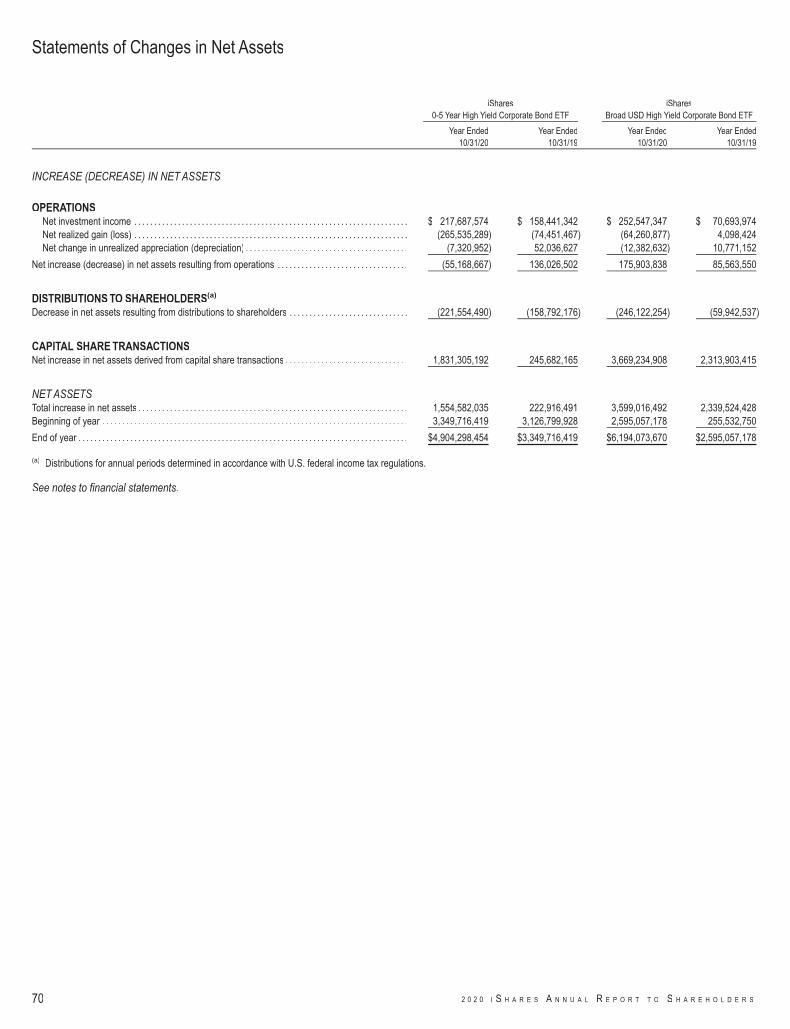
iShares0-5 Year High Yield Corporate Bond ETF
iSharesBroad USD High Yield Corporate Bond ETF
Year Ended10/31/20
Year Ended10/31/19
Year Ended10/31/20
Year Ended10/31/19
INCREASE (DECREASE) IN NET ASSETS
OPERATIONSNet investment income . . . . . . . . . . . . . . . . . . . . . . . . . . . . . . . . . . . . . . . . . . . . . . . . . . . . . . . . . . . . . . . . . . . . . $ 217,687,574 $ 158,441,342 $ 252,547,347 $ 70,693,974Net realized gain (loss) . . . . . . . . . . . . . . . . . . . . . . . . . . . . . . . . . . . . . . . . . . . . . . . . . . . . . . . . . . . . . . . . . . . . . (265,535,289) (74,451,467) (64,260,877) 4,098,424Net change in unrealized appreciation (depreciation) . . . . . . . . . . . . . . . . . . . . . . . . . . . . . . . . . . . . . . . . . (7,320,952) 52,036,627 (12,382,632) 10,771,152
Net increase (decrease) in net assets resulting from operations . . . . . . . . . . . . . . . . . . . . . . . . . . . . . . . . . (55,168,667) 136,026,502 175,903,838 85,563,550
DISTRIBUTIONS TO SHAREHOLDERS(a)
Decrease in net assets resulting from distributions to shareholders . . . . . . . . . . . . . . . . . . . . . . . . . . . . . . (221,554,490) (158,792,176) (246,122,254) (59,942,537)
CAPITAL SHARE TRANSACTIONSNet increase in net assets derived from capital share transactions . . . . . . . . . . . . . . . . . . . . . . . . . . . . . . . 1,831,305,192 245,682,165 3,669,234,908 2,313,903,415
NET ASSETSTotal increase in net assets . . . . . . . . . . . . . . . . . . . . . . . . . . . . . . . . . . . . . . . . . . . . . . . . . . . . . . . . . . . . . . . . . . . . 1,554,582,035 222,916,491 3,599,016,492 2,339,524,428Beginning of year . . . . . . . . . . . . . . . . . . . . . . . . . . . . . . . . . . . . . . . . . . . . . . . . . . . . . . . . . . . . . . . . . . . . . . . . . . . . . 3,349,716,419 3,126,799,928 2,595,057,178 255,532,750
End of year . . . . . . . . . . . . . . . . . . . . . . . . . . . . . . . . . . . . . . . . . . . . . . . . . . . . . . . . . . . . . . . . . . . . . . . . . . . . . . . . . . . $4,904,298,454 $3,349,716,419 $6,194,073,670 $2,595,057,178
(a) Distributions for annual periods determined in accordance with U.S. federal income tax regulations.
See notes to financial statements.
Statements of Changes in Net Assets
70 2 0 2 0 I S H A R E S A N N U A L R E P O R T T O S H A R E H O L D E R S
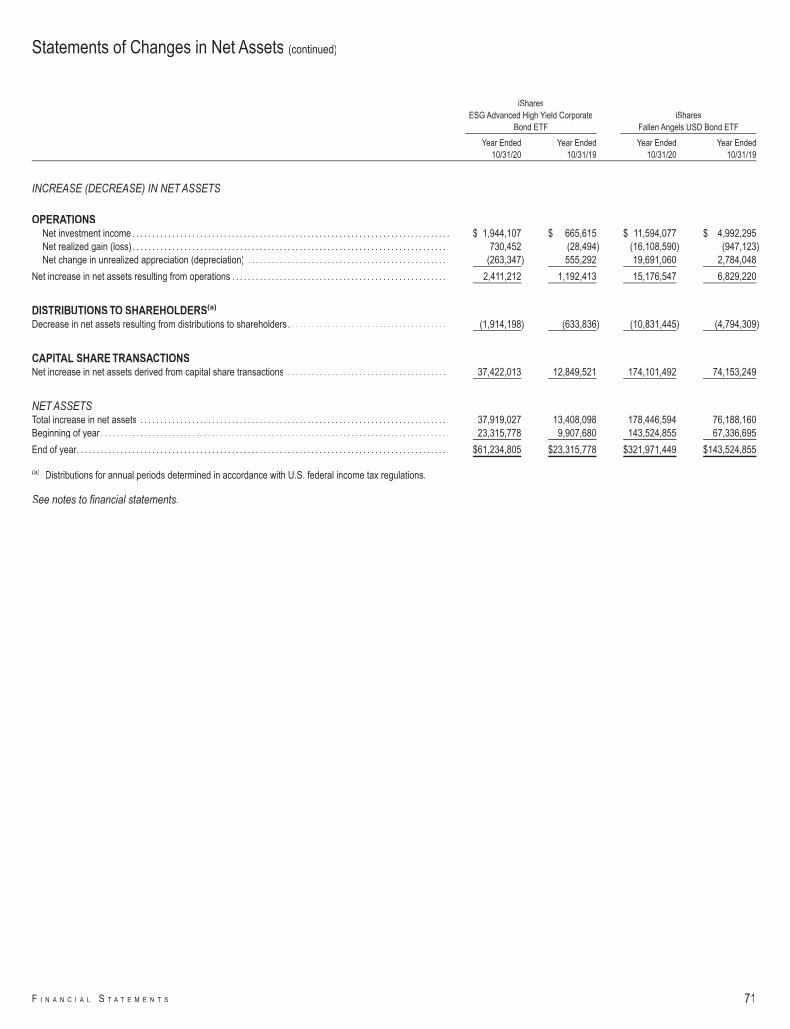
iSharesESG Advanced High Yield Corporate
Bond ETFiShares
Fallen Angels USD Bond ETF
Year Ended10/31/20
Year Ended10/31/19
Year Ended10/31/20
Year Ended10/31/19
INCREASE (DECREASE) IN NET ASSETS
OPERATIONSNet investment income . . . . . . . . . . . . . . . . . . . . . . . . . . . . . . . . . . . . . . . . . . . . . . . . . . . . . . . . . . . . . . . . . . . . . . . . . . . . . . . . $ 1,944,107 $ 665,615 $ 11,594,077 $ 4,992,295Net realized gain (loss) . . . . . . . . . . . . . . . . . . . . . . . . . . . . . . . . . . . . . . . . . . . . . . . . . . . . . . . . . . . . . . . . . . . . . . . . . . . . . . . . 730,452 (28,494) (16,108,590) (947,123)Net change in unrealized appreciation (depreciation) . . . . . . . . . . . . . . . . . . . . . . . . . . . . . . . . . . . . . . . . . . . . . . . . . . . (263,347) 555,292 19,691,060 2,784,048
Net increase in net assets resulting from operations . . . . . . . . . . . . . . . . . . . . . . . . . . . . . . . . . . . . . . . . . . . . . . . . . . . . . . . 2,411,212 1,192,413 15,176,547 6,829,220
DISTRIBUTIONS TO SHAREHOLDERS(a)
Decrease in net assets resulting from distributions to shareholders. . . . . . . . . . . . . . . . . . . . . . . . . . . . . . . . . . . . . . . . . (1,914,198) (633,836) (10,831,445) (4,794,309)
CAPITAL SHARE TRANSACTIONSNet increase in net assets derived from capital share transactions . . . . . . . . . . . . . . . . . . . . . . . . . . . . . . . . . . . . . . . . . 37,422,013 12,849,521 174,101,492 74,153,249
NET ASSETSTotal increase in net assets . . . . . . . . . . . . . . . . . . . . . . . . . . . . . . . . . . . . . . . . . . . . . . . . . . . . . . . . . . . . . . . . . . . . . . . . . . . . . . 37,919,027 13,408,098 178,446,594 76,188,160Beginning of year . . . . . . . . . . . . . . . . . . . . . . . . . . . . . . . . . . . . . . . . . . . . . . . . . . . . . . . . . . . . . . . . . . . . . . . . . . . . . . . . . . . . . . . . 23,315,778 9,907,680 143,524,855 67,336,695
End of year. . . . . . . . . . . . . . . . . . . . . . . . . . . . . . . . . . . . . . . . . . . . . . . . . . . . . . . . . . . . . . . . . . . . . . . . . . . . . . . . . . . . . . . . . . . . . . $61,234,805 $23,315,778 $321,971,449 $143,524,855
(a) Distributions for annual periods determined in accordance with U.S. federal income tax regulations.
See notes to financial statements.
Statements of Changes in Net Assets (continued)
F I N A N C I A L S T A T E M E N T S 71
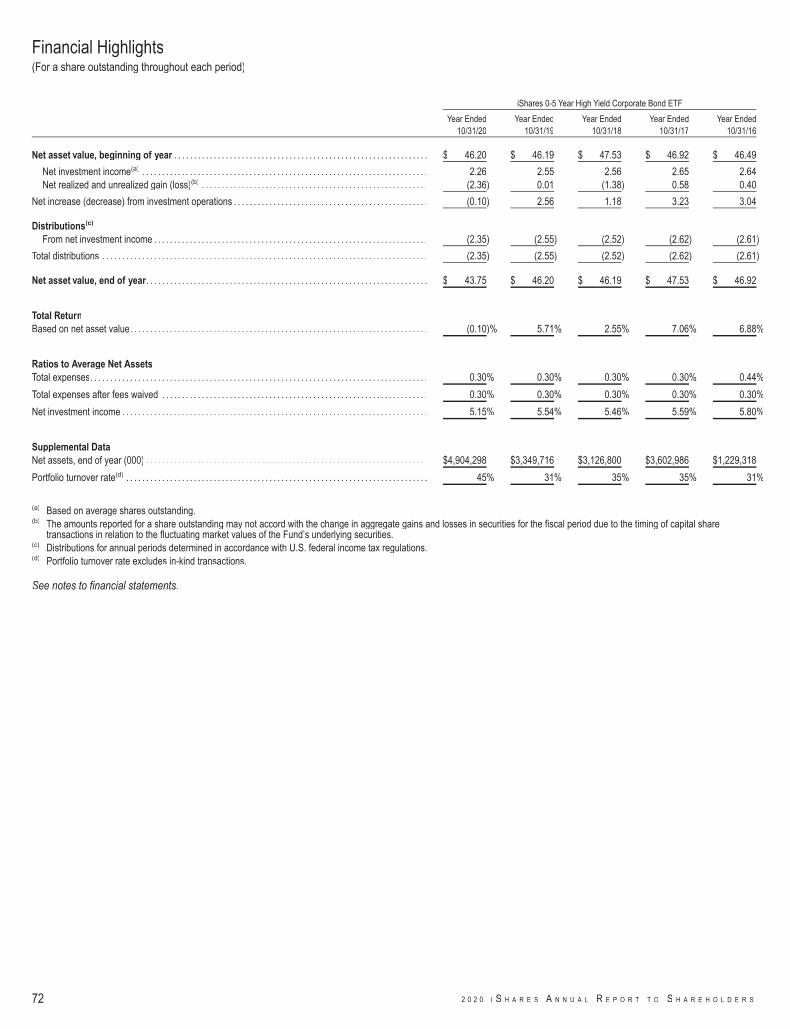
iShares 0-5 Year High Yield Corporate Bond ETF
Year Ended10/31/20
Year Ended10/31/19
Year Ended10/31/18
Year Ended10/31/17
Year Ended10/31/16
Net asset value, beginning of year . . . . . . . . . . . . . . . . . . . . . . . . . . . . . . . . . . . . . . . . . . . . . . . . . . . . . . . . . . . . . . . . $ 46.20 $ 46.19 $ 47.53 $ 46.92 $ 46.49
Net investment income(a) . . . . . . . . . . . . . . . . . . . . . . . . . . . . . . . . . . . . . . . . . . . . . . . . . . . . . . . . . . . . . . . . . . . . . . . . 2.26 2.55 2.56 2.65 2.64Net realized and unrealized gain (loss)(b) . . . . . . . . . . . . . . . . . . . . . . . . . . . . . . . . . . . . . . . . . . . . . . . . . . . . . . . . . (2.36) 0.01 (1.38) 0.58 0.40
Net increase (decrease) from investment operations . . . . . . . . . . . . . . . . . . . . . . . . . . . . . . . . . . . . . . . . . . . . . . . . . (0.10) 2.56 1.18 3.23 3.04
Distributions(c)
From net investment income . . . . . . . . . . . . . . . . . . . . . . . . . . . . . . . . . . . . . . . . . . . . . . . . . . . . . . . . . . . . . . . . . . . . . (2.35) (2.55) (2.52) (2.62) (2.61)
Total distributions . . . . . . . . . . . . . . . . . . . . . . . . . . . . . . . . . . . . . . . . . . . . . . . . . . . . . . . . . . . . . . . . . . . . . . . . . . . . . . . . . . (2.35) (2.55) (2.52) (2.62) (2.61)
Net asset value, end of year. . . . . . . . . . . . . . . . . . . . . . . . . . . . . . . . . . . . . . . . . . . . . . . . . . . . . . . . . . . . . . . . . . . . . . . $ 43.75 $ 46.20 $ 46.19 $ 47.53 $ 46.92
Total ReturnBased on net asset value. . . . . . . . . . . . . . . . . . . . . . . . . . . . . . . . . . . . . . . . . . . . . . . . . . . . . . . . . . . . . . . . . . . . . . . . . . . (0.10)% 5.71% 2.55% 7.06% 6.88%
Ratios to Average Net AssetsTotal expenses. . . . . . . . . . . . . . . . . . . . . . . . . . . . . . . . . . . . . . . . . . . . . . . . . . . . . . . . . . . . . . . . . . . . . . . . . . . . . . . . . . . . . 0.30% 0.30% 0.30% 0.30% 0.44%
Total expenses after fees waived . . . . . . . . . . . . . . . . . . . . . . . . . . . . . . . . . . . . . . . . . . . . . . . . . . . . . . . . . . . . . . . . . . . 0.30% 0.30% 0.30% 0.30% 0.30%
Net investment income . . . . . . . . . . . . . . . . . . . . . . . . . . . . . . . . . . . . . . . . . . . . . . . . . . . . . . . . . . . . . . . . . . . . . . . . . . . . . 5.15% 5.54% 5.46% 5.59% 5.80%
Supplemental DataNet assets, end of year (000) . . . . . . . . . . . . . . . . . . . . . . . . . . . . . . . . . . . . . . . . . . . . . . . . . . . . . . . . . . . . . . . . . . . . . . . $4,904,298 $3,349,716 $3,126,800 $3,602,986 $1,229,318
Portfolio turnover rate(d) . . . . . . . . . . . . . . . . . . . . . . . . . . . . . . . . . . . . . . . . . . . . . . . . . . . . . . . . . . . . . . . . . . . . . . . . . . . . 45% 31% 35% 35% 31%
(a) Based on average shares outstanding.(b) The amounts reported for a share outstanding may not accord with the change in aggregate gains and losses in securities for the fiscal period due to the timing of capital share
transactions in relation to the fluctuating market values of the Fund’s underlying securities.(c) Distributions for annual periods determined in accordance with U.S. federal income tax regulations.(d) Portfolio turnover rate excludes in-kind transactions.
See notes to financial statements.
Financial Highlights(For a share outstanding throughout each period)
72 2 0 2 0 I S H A R E S A N N U A L R E P O R T T O S H A R E H O L D E R S
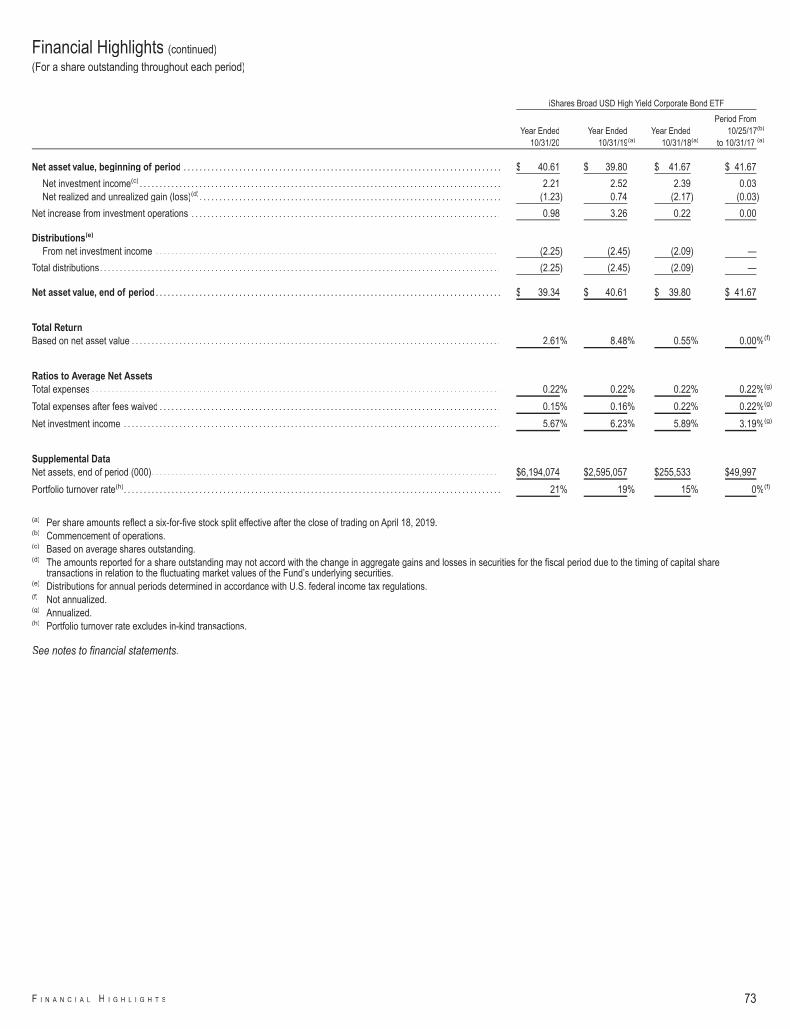
iShares Broad USD High Yield Corporate Bond ETF
Year Ended10/31/20
Year Ended10/31/19(a)
Year Ended10/31/18(a)
Period From10/25/17(b)
to 10/31/17 (a)
Net asset value, beginning of period . . . . . . . . . . . . . . . . . . . . . . . . . . . . . . . . . . . . . . . . . . . . . . . . . . . . . . . . . . . . . . . . . . . . . . . . . . . . . . . . $ 40.61 $ 39.80 $ 41.67 $ 41.67
Net investment income(c) . . . . . . . . . . . . . . . . . . . . . . . . . . . . . . . . . . . . . . . . . . . . . . . . . . . . . . . . . . . . . . . . . . . . . . . . . . . . . . . . . . . . . . . . . . . 2.21 2.52 2.39 0.03Net realized and unrealized gain (loss)(d). . . . . . . . . . . . . . . . . . . . . . . . . . . . . . . . . . . . . . . . . . . . . . . . . . . . . . . . . . . . . . . . . . . . . . . . . . . . (1.23) 0.74 (2.17) (0.03)
Net increase from investment operations . . . . . . . . . . . . . . . . . . . . . . . . . . . . . . . . . . . . . . . . . . . . . . . . . . . . . . . . . . . . . . . . . . . . . . . . . . . . . . 0.98 3.26 0.22 0.00
Distributions(e)
From net investment income . . . . . . . . . . . . . . . . . . . . . . . . . . . . . . . . . . . . . . . . . . . . . . . . . . . . . . . . . . . . . . . . . . . . . . . . . . . . . . . . . . . . . . . (2.25) (2.45) (2.09) —
Total distributions. . . . . . . . . . . . . . . . . . . . . . . . . . . . . . . . . . . . . . . . . . . . . . . . . . . . . . . . . . . . . . . . . . . . . . . . . . . . . . . . . . . . . . . . . . . . . . . . . . . . . (2.25) (2.45) (2.09) —
Net asset value, end of period . . . . . . . . . . . . . . . . . . . . . . . . . . . . . . . . . . . . . . . . . . . . . . . . . . . . . . . . . . . . . . . . . . . . . . . . . . . . . . . . . . . . . . . $ 39.34 $ 40.61 $ 39.80 $ 41.67
Total ReturnBased on net asset value . . . . . . . . . . . . . . . . . . . . . . . . . . . . . . . . . . . . . . . . . . . . . . . . . . . . . . . . . . . . . . . . . . . . . . . . . . . . . . . . . . . . . . . . . . . . . 2.61% 8.48% 0.55% 0.00%(f)
Ratios to Average Net AssetsTotal expenses . . . . . . . . . . . . . . . . . . . . . . . . . . . . . . . . . . . . . . . . . . . . . . . . . . . . . . . . . . . . . . . . . . . . . . . . . . . . . . . . . . . . . . . . . . . . . . . . . . . . . . . 0.22% 0.22% 0.22% 0.22%(g)
Total expenses after fees waived . . . . . . . . . . . . . . . . . . . . . . . . . . . . . . . . . . . . . . . . . . . . . . . . . . . . . . . . . . . . . . . . . . . . . . . . . . . . . . . . . . . . . . 0.15% 0.16% 0.22% 0.22%(g)
Net investment income . . . . . . . . . . . . . . . . . . . . . . . . . . . . . . . . . . . . . . . . . . . . . . . . . . . . . . . . . . . . . . . . . . . . . . . . . . . . . . . . . . . . . . . . . . . . . . . 5.67% 6.23% 5.89% 3.19%(g)
Supplemental DataNet assets, end of period (000). . . . . . . . . . . . . . . . . . . . . . . . . . . . . . . . . . . . . . . . . . . . . . . . . . . . . . . . . . . . . . . . . . . . . . . . . . . . . . . . . . . . . . . . $6,194,074 $2,595,057 $255,533 $49,997
Portfolio turnover rate(h). . . . . . . . . . . . . . . . . . . . . . . . . . . . . . . . . . . . . . . . . . . . . . . . . . . . . . . . . . . . . . . . . . . . . . . . . . . . . . . . . . . . . . . . . . . . . . . 21% 19% 15% 0%(f)
(a) Per share amounts reflect a six-for-five stock split effective after the close of trading on April 18, 2019.(b) Commencement of operations.(c) Based on average shares outstanding.(d) The amounts reported for a share outstanding may not accord with the change in aggregate gains and losses in securities for the fiscal period due to the timing of capital share
transactions in relation to the fluctuating market values of the Fund’s underlying securities.(e) Distributions for annual periods determined in accordance with U.S. federal income tax regulations.(f) Not annualized.(g) Annualized.(h) Portfolio turnover rate excludes in-kind transactions.
See notes to financial statements.
Financial Highlights (continued)
(For a share outstanding throughout each period)
F I N A N C I A L H I G H L I G H T S 73

iShares ESG Advanced High Yield Corporate Bond ETF
Year Ended10/31/20
Year Ended10/31/19
Year Ended10/31/18
Year Ended10/31/17
Period From06/14/16(a)
to 10/31/16
Net asset value, beginning of period . . . . . . . . . . . . . . . . . . . . . . . . . . . . . . . . . . . . . . . . . . . . . . . . . . . . . . . . . . . . . . . . . . $ 51.81 $ 49.54 $51.90 $ 51.28 $ 49.48
Net investment income(b) . . . . . . . . . . . . . . . . . . . . . . . . . . . . . . . . . . . . . . . . . . . . . . . . . . . . . . . . . . . . . . . . . . . . . . . . . . . . . 2.41 2.88 2.93 3.00 1.09Net realized and unrealized gain (loss)(c) . . . . . . . . . . . . . . . . . . . . . . . . . . . . . . . . . . . . . . . . . . . . . . . . . . . . . . . . . . . . . . (0.73) 2.34 (2.37) 0.54 1.64
Net increase from investment operations . . . . . . . . . . . . . . . . . . . . . . . . . . . . . . . . . . . . . . . . . . . . . . . . . . . . . . . . . . . . . . . . 1.68 5.22 0.56 3.54 2.73
Distributions(d)
From net investment income . . . . . . . . . . . . . . . . . . . . . . . . . . . . . . . . . . . . . . . . . . . . . . . . . . . . . . . . . . . . . . . . . . . . . . . . . (2.46) (2.95) (2.92) (2.92) (0.93)
Total distributions . . . . . . . . . . . . . . . . . . . . . . . . . . . . . . . . . . . . . . . . . . . . . . . . . . . . . . . . . . . . . . . . . . . . . . . . . . . . . . . . . . . . . . . (2.46) (2.95) (2.92) (2.92) (0.93)
Net asset value, end of period . . . . . . . . . . . . . . . . . . . . . . . . . . . . . . . . . . . . . . . . . . . . . . . . . . . . . . . . . . . . . . . . . . . . . . . . . $ 51.03 $ 51.81 $49.54 $ 51.90 $ 51.28
Total ReturnBased on net asset value . . . . . . . . . . . . . . . . . . . . . . . . . . . . . . . . . . . . . . . . . . . . . . . . . . . . . . . . . . . . . . . . . . . . . . . . . . . . . . . 3.42% 10.88% 1.13% 7.09% 5.52%(e)
Ratios to Average Net AssetsTotal expenses . . . . . . . . . . . . . . . . . . . . . . . . . . . . . . . . . . . . . . . . . . . . . . . . . . . . . . . . . . . . . . . . . . . . . . . . . . . . . . . . . . . . . . . . . 0.47% 0.50% 0.50% 0.50% 0.50%(f)
Net investment income . . . . . . . . . . . . . . . . . . . . . . . . . . . . . . . . . . . . . . . . . . . . . . . . . . . . . . . . . . . . . . . . . . . . . . . . . . . . . . . . . 4.78% 5.70% 5.80% 5.80% 5.61%(f)
Supplemental DataNet assets, end of period (000). . . . . . . . . . . . . . . . . . . . . . . . . . . . . . . . . . . . . . . . . . . . . . . . . . . . . . . . . . . . . . . . . . . . . . . . . . $61,235 $23,316 $9,908 $10,380 $10,255
Portfolio turnover rate(g) . . . . . . . . . . . . . . . . . . . . . . . . . . . . . . . . . . . . . . . . . . . . . . . . . . . . . . . . . . . . . . . . . . . . . . . . . . . . . . . . . 85% 24% 24% 18% 7%(e)
(a) Commencement of operations.(b) Based on average shares outstanding.(c) The amounts reported for a share outstanding may not accord with the change in aggregate gains and losses in securities for the fiscal period due to the timing of capital share
transactions in relation to the fluctuating market values of the Fund’s underlying securities.(d) Distributions for annual periods determined in accordance with U.S. federal income tax regulations.(e) Not annualized.(f) Annualized.(g) Portfolio turnover rate excludes in-kind transactions.
See notes to financial statements.
Financial Highlights (continued)
(For a share outstanding throughout each period)
74 2 0 2 0 I S H A R E S A N N U A L R E P O R T T O S H A R E H O L D E R S
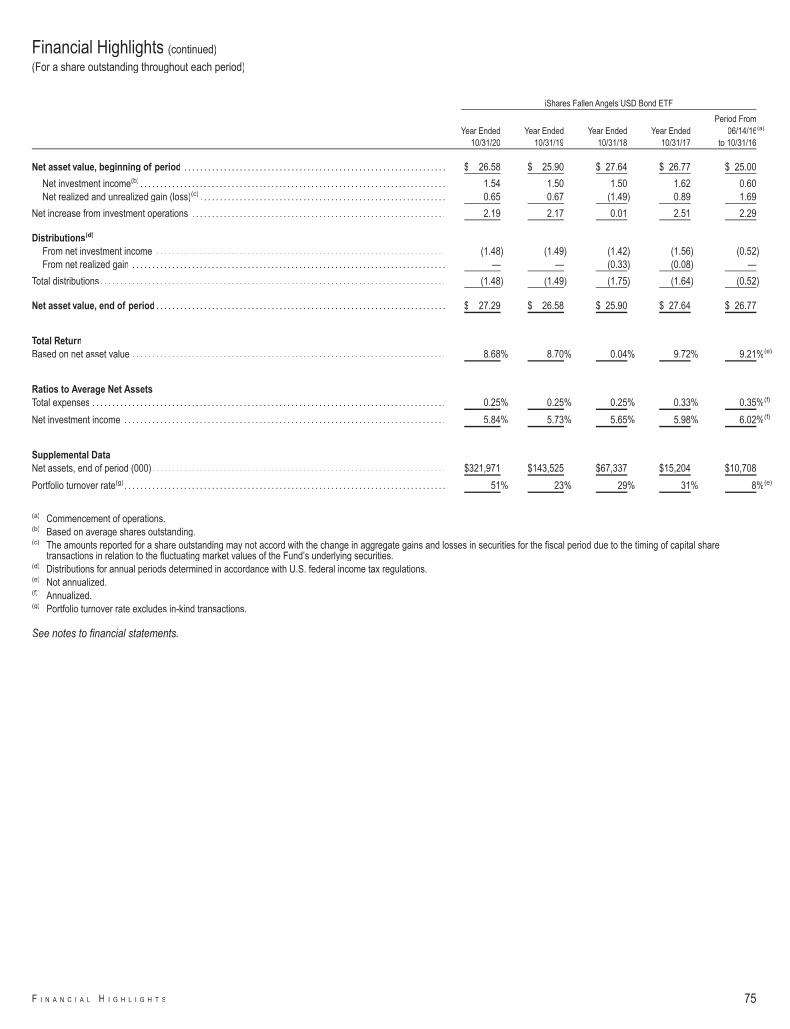
iShares Fallen Angels USD Bond ETF
Year Ended10/31/20
Year Ended10/31/19
Year Ended10/31/18
Year Ended10/31/17
Period From06/14/16(a)
to 10/31/16
Net asset value, beginning of period . . . . . . . . . . . . . . . . . . . . . . . . . . . . . . . . . . . . . . . . . . . . . . . . . . . . . . . . . . . . . . . . . . $ 26.58 $ 25.90 $ 27.64 $ 26.77 $ 25.00
Net investment income(b) . . . . . . . . . . . . . . . . . . . . . . . . . . . . . . . . . . . . . . . . . . . . . . . . . . . . . . . . . . . . . . . . . . . . . . . . . . . . . 1.54 1.50 1.50 1.62 0.60Net realized and unrealized gain (loss)(c) . . . . . . . . . . . . . . . . . . . . . . . . . . . . . . . . . . . . . . . . . . . . . . . . . . . . . . . . . . . . . . 0.65 0.67 (1.49) 0.89 1.69
Net increase from investment operations . . . . . . . . . . . . . . . . . . . . . . . . . . . . . . . . . . . . . . . . . . . . . . . . . . . . . . . . . . . . . . . . 2.19 2.17 0.01 2.51 2.29
Distributions(d)
From net investment income . . . . . . . . . . . . . . . . . . . . . . . . . . . . . . . . . . . . . . . . . . . . . . . . . . . . . . . . . . . . . . . . . . . . . . . . . (1.48) (1.49) (1.42) (1.56) (0.52)From net realized gain . . . . . . . . . . . . . . . . . . . . . . . . . . . . . . . . . . . . . . . . . . . . . . . . . . . . . . . . . . . . . . . . . . . . . . . . . . . . . . . — — (0.33) (0.08) —
Total distributions . . . . . . . . . . . . . . . . . . . . . . . . . . . . . . . . . . . . . . . . . . . . . . . . . . . . . . . . . . . . . . . . . . . . . . . . . . . . . . . . . . . . . . . (1.48) (1.49) (1.75) (1.64) (0.52)
Net asset value, end of period . . . . . . . . . . . . . . . . . . . . . . . . . . . . . . . . . . . . . . . . . . . . . . . . . . . . . . . . . . . . . . . . . . . . . . . . . $ 27.29 $ 26.58 $ 25.90 $ 27.64 $ 26.77
Total ReturnBased on net asset value . . . . . . . . . . . . . . . . . . . . . . . . . . . . . . . . . . . . . . . . . . . . . . . . . . . . . . . . . . . . . . . . . . . . . . . . . . . . . . . 8.68% 8.70% 0.04% 9.72% 9.21%(e)
Ratios to Average Net AssetsTotal expenses . . . . . . . . . . . . . . . . . . . . . . . . . . . . . . . . . . . . . . . . . . . . . . . . . . . . . . . . . . . . . . . . . . . . . . . . . . . . . . . . . . . . . . . . . 0.25% 0.25% 0.25% 0.33% 0.35%(f)
Net investment income . . . . . . . . . . . . . . . . . . . . . . . . . . . . . . . . . . . . . . . . . . . . . . . . . . . . . . . . . . . . . . . . . . . . . . . . . . . . . . . . . 5.84% 5.73% 5.65% 5.98% 6.02%(f)
Supplemental DataNet assets, end of period (000). . . . . . . . . . . . . . . . . . . . . . . . . . . . . . . . . . . . . . . . . . . . . . . . . . . . . . . . . . . . . . . . . . . . . . . . . . $321,971 $143,525 $67,337 $15,204 $10,708
Portfolio turnover rate(g) . . . . . . . . . . . . . . . . . . . . . . . . . . . . . . . . . . . . . . . . . . . . . . . . . . . . . . . . . . . . . . . . . . . . . . . . . . . . . . . . . 51% 23% 29% 31% 8%(e)
(a) Commencement of operations.(b) Based on average shares outstanding.(c) The amounts reported for a share outstanding may not accord with the change in aggregate gains and losses in securities for the fiscal period due to the timing of capital share
transactions in relation to the fluctuating market values of the Fund’s underlying securities.(d) Distributions for annual periods determined in accordance with U.S. federal income tax regulations.(e) Not annualized.(f) Annualized.(g) Portfolio turnover rate excludes in-kind transactions.
See notes to financial statements.
Financial Highlights (continued)
(For a share outstanding throughout each period)
F I N A N C I A L H I G H L I G H T S 75
1. ORGANIZATION
iShares Trust (the “Trust”) is registered under the Investment Company Act of 1940, as amended (the “1940 Act”), as an open-end management investment company. TheTrust is organized as a Delaware statutory trust and is authorized to have multiple series or portfolios.
These financial statements relate only to the following funds (each, a “Fund,” and collectively, the “Funds”):
iShares ETFDiversificationClassification
0-5 Year High Yield Corporate Bond . . . . . . . . . . . . . . . . . . . . . . . . . . . . . . . . . . . . . . . . . . . . . . . . . . . . . . . . . . . . . . . . . . . . . . . . . . . . . . . . . . . . . . . . . . . . . . . . . . . . . . . . . . . . . . . . . . . . . . . DiversifiedBroad USD High Yield Corporate Bond . . . . . . . . . . . . . . . . . . . . . . . . . . . . . . . . . . . . . . . . . . . . . . . . . . . . . . . . . . . . . . . . . . . . . . . . . . . . . . . . . . . . . . . . . . . . . . . . . . . . . . . . . . . . . . . . . . . . Diversified(a)
ESG Advanced High Yield Corporate Bond(b) . . . . . . . . . . . . . . . . . . . . . . . . . . . . . . . . . . . . . . . . . . . . . . . . . . . . . . . . . . . . . . . . . . . . . . . . . . . . . . . . . . . . . . . . . . . . . . . . . . . . . . . . . . . . . . DiversifiedFallen Angels USD Bond. . . . . . . . . . . . . . . . . . . . . . . . . . . . . . . . . . . . . . . . . . . . . . . . . . . . . . . . . . . . . . . . . . . . . . . . . . . . . . . . . . . . . . . . . . . . . . . . . . . . . . . . . . . . . . . . . . . . . . . . . . . . . . . . . . Diversified
(a) The Fund's classification changed from non-diversified to diversified during the reporting period.(b) Formerly the iShares iBoxx $ High Yield ex Oil & Gas Corporate Bond ETF.
2. SIGNIFICANT ACCOUNTING POLICIES
The financial statements are prepared in conformity with accounting principles generally accepted in the United States of America (“U.S. GAAP”), which may requiremanagement to make estimates and assumptions that affect the reported amounts of assets and liabilities in the financial statements, disclosure of contingent assets andliabilities at the date of the financial statements and the reported amounts of increases and decreases in net assets from operations during the reporting period. Actualresults could differ from those estimates. Each Fund is considered an investment company under U.S. GAAP and follows the accounting and reporting guidance applicableto investment companies. Below is a summary of significant accounting policies:
Investment Transactions and Income Recognition: For financial reporting purposes, investment transactions are recorded on the dates the transactions are executed.Realized gains and losses on investment transactions are determined using the specific identification method. Dividend income and capital gain distributions, if any, arerecorded on the ex-dividend date. Non-cash dividends, if any, are recorded on the ex-dividend date at fair value. Interest income, including amortization and accretion ofpremiums and discounts on debt securities, is recognized daily on an accrual basis.
In-kind Redemptions: For financial reporting purposes, in-kind redemptions are treated as sales of securities resulting in realized capital gains or losses to the Funds.Because such gains or losses are not taxable to the Funds and are not distributed to existing Fund shareholders, the gains or losses are reclassified from accumulated netrealized gain (loss) to paid-in capital at the end of the Funds' tax year. These reclassifications have no effect on net assets or net asset value ("NAV") per share.
Distributions: Dividends and distributions paid by each Fund are recorded on the ex-dividend dates. Distributions are determined on a tax basis and may differ from netinvestment income and net realized capital gains for financial reporting purposes. Dividends and distributions are paid in U.S. dollars and cannot be automatically reinvestedin additional shares of the Funds. The character and timing of distributions are determined in accordance with U.S. federal income tax regulations, which may differ fromU.S. GAAP.
Recent Accounting Standards: The Funds have adopted Financial Accounting Standards Board Accounting Standards Update 2017-08 to amend the amortization periodfor certain purchased callable debt securities held at a premium. Under the new standard, the Funds have changed the amortization period for the premium on certainpurchased callable debt securities with non-contingent call features to the earliest call date. In accordance with the transition provisions of the standard, the Funds appliedthe amendments on a modified retrospective basis beginning with the fiscal period ended October 31, 2020. The adjusted cost basis of securities at October 31, 2019 areas follows:
iShares ETF
0-5 Year High Yield Corporate Bond . . . . . . . . . . . . . . . . . . . . . . . . . . . . . . . . . . . . . . . . . . . . . . . . . . . . . . . . . . . . . . . . . . . . . . . . . . . . . . . . . . . . . . . . . . . . . . . . . . . . . . . . . . . . . . . . . . . . . $ 3,858,291,390Broad USD High Yield Corporate Bond. . . . . . . . . . . . . . . . . . . . . . . . . . . . . . . . . . . . . . . . . . . . . . . . . . . . . . . . . . . . . . . . . . . . . . . . . . . . . . . . . . . . . . . . . . . . . . . . . . . . . . . . . . . . . . . . . . . 3,044,939,520ESG Advanced High Yield Corporate Bond. . . . . . . . . . . . . . . . . . . . . . . . . . . . . . . . . . . . . . . . . . . . . . . . . . . . . . . . . . . . . . . . . . . . . . . . . . . . . . . . . . . . . . . . . . . . . . . . . . . . . . . . . . . . . . . 24,377,951Fallen Angels USD Bond . . . . . . . . . . . . . . . . . . . . . . . . . . . . . . . . . . . . . . . . . . . . . . . . . . . . . . . . . . . . . . . . . . . . . . . . . . . . . . . . . . . . . . . . . . . . . . . . . . . . . . . . . . . . . . . . . . . . . . . . . . . . . . . . 163,742,389
This change in accounting policy has been made to comply with the newly issued accounting standard and had no impact on accumulated earnings (loss) or the net assetvalue of the Funds.
Indemnifications: In the normal course of business, each Fund enters into contracts that contain a variety of representations that provide general indemnification. TheFunds' maximum exposure under these arrangements is unknown because it involves future potential claims against the Funds, which cannot be predicted with anycertainty.
Notes to Financial Statements
76 2 0 2 0 I S H A R E S A N N U A L R E P O R T T O S H A R E H O L D E R S
3. INVESTMENT VALUATION AND FAIR VALUE MEASUREMENTS
Investment Valuation Policies: Each Fund’s investments are valued at fair value (also referred to as “market value” within the financial statements) each day that theFund’s listing exchange is open and, for financial reporting purposes, as of the report date. U.S. GAAP defines fair value as the price a fund would receive to sell an assetor pay to transfer a liability in an orderly transaction between market participants at the measurement date. A fund determines the fair value of its financial instruments usingvarious independent dealers or pricing services under policies approved by the Board of Trustees of the Trust (the “Board”). If a security’s market price is not readily availableor does not otherwise accurately represent the fair value of the security, the security will be valued in accordance with a policy approved by the Board as reflecting fair value.The BlackRock Global Valuation Methodologies Committee (the “Global Valuation Committee”) is the committee formed by management to develop global pricing policiesand procedures and to oversee the pricing function for all financial instruments.
Fair Value Inputs and Methodologies: The following methods and inputs are used to establish the fair value of each Fund’s assets and liabilities:• Equity investments traded on a recognized securities exchange are valued at that day’s official closing price, as applicable, on the exchange where the stock is
primarily traded. Equity investments traded on a recognized exchange for which there were no sales on that day are valued at the last traded price.• Fixed-income investments for which market quotations are readily available are generally valued using the last available bid price or current market quotations
provided by independent dealers or third-party pricing services. Floating rate loan interests are valued at the mean of the bid prices from one or more independentbrokers or dealers as obtained from a third party pricing service. Pricing services generally value fixed income securities assuming orderly transactions of aninstitutional round lot size, but a fund may hold or transact in such securities in smaller, odd lot sizes. Odd lots may trade at lower prices than institutional round lots.The pricing services may use matrix pricing or valuation models that utilize certain inputs and assumptions to derive values, including transaction data (e.g., recentrepresentative bids and offers), market data, credit quality information, perceived market movements, news, and other relevant information. Certain fixed-incomesecurities, including asset-backed and mortgage related securities may be valued based on valuation models that consider the estimated cash flows of each trancheof the entity, establish a benchmark yield and develop an estimated tranche specific spread to the benchmark yield based on the unique attributes of the tranche. Theamortized cost method of valuation may be used with respect to debt obligations with sixty days or less remaining to maturity unless the Manager determines suchmethod does not represent fair value.
• Investments in open-end U.S. mutual funds (including money market funds) are valued at that day’s published NAV.
If events (e.g., a market closure, market volatility, company announcement or a natural disaster) occur that are expected to materially affect the value of such investment,or in the event that application of these methods of valuation results in a price for an investment that is deemed not to be representative of the market value of suchinvestment, or if a price is not available, the investment will be valued by the Global Valuation Committee, in accordance with a policy approved by the Board as reflectingfair value (“Fair Valued Investments”). The fair valuation approaches that may be used by the Global Valuation Committee include market approach, income approach andthe cost approach. Valuation techniques such as discounted cash flow, use of market comparables and matrix pricing are types of valuation approaches and are typicallyused in determining fair value. When determining the price for Fair Valued Investments, the Global Valuation Committee, or its delegate, seeks to determine the price thateach Fund might reasonably expect to receive or pay from the current sale or purchase of that asset or liability in an arm’s-length transaction. Fair value determinations shallbe based upon all available factors that the Global Valuation Committee, or its delegate, deems relevant and consistent with the principles of fair value measurement. Thepricing of all Fair Valued Investments is subsequently reported to the Board or a committee thereof on a quarterly basis.
Fair value pricing could result in a difference between the prices used to calculate a fund’s NAV and the prices used by the fund’s underlying index, which in turn could resultin a difference between the fund’s performance and the performance of the fund’s underlying index.
Fair Value Hierarchy: Various inputs are used in determining the fair value of financial instruments. These inputs to valuation techniques are categorized into a fair valuehierarchy consisting of three broad levels for financial reporting purposes as follows:
• Level 1 – Unadjusted price quotations in active markets/exchanges for identical assets or liabilities that each Fund has the ability to access;• Level 2 – Other observable inputs (including, but not limited to, quoted prices for similar assets or liabilities in markets that are active, quoted prices for identical or
similar assets or liabilities in markets that are not active, inputs other than quoted prices that are observable for the assets or liabilities (such as interest rates, yieldcurves, volatilities, prepayment speeds, loss severities, credit risks and default rates) or other market-corroborated inputs); and
• Level 3 – Unobservable inputs based on the best information available in the circumstances, to the extent observable inputs are not available, (including the GlobalValuation Committee’s assumptions used in determining the fair value of financial instruments).
The hierarchy gives the highest priority to unadjusted quoted prices in active markets for identical assets or liabilities (Level 1 measurements) and the lowest priority tounobservable inputs (Level 3 measurements). Accordingly, the degree of judgement exercised in determining fair value is greatest for instruments categorized in Level 3.The inputs used to measure fair value may fall into different levels of the fair value hierarchy. In such cases, for disclosure purposes, the fair value hierarchy classificationis determined based on the lowest level input that is significant to the fair value measurement in its entirety. Investments classified within Level 3 have significantunobservable inputs used by the Global Valuation Committee in determining the price for Fair Valued Investments. Level 3 investments include equity or debt issued byprivately held companies or funds that may not have a secondary market and/or may have a limited number of investors. The categorization of a value determined forfinancial instruments is based on the pricing transparency of the financial instruments and is not necessarily an indication of the risks associated with investing in thosesecurities.
4. SECURITIES AND OTHER INVESTMENTS
Floating Rate Loan Interests: Floating rate loan interests are typically issued to companies (the “borrower”) by banks, other financial institutions, or privately and publiclyoffered corporations (the “lender”). Floating rate loan interests are generally non-investment grade, often involve borrowers whose financial condition is troubled or uncertainand companies that are highly leveraged or in bankruptcy proceedings. In addition, transactions in floating rate loan interests may settle on a delayed basis, which may result
Notes to Financial Statements (continued)
N O T E S T O F I N A N C I A L S T A T E M E N T S 77
in proceeds from the sale not being readily available for a fund to make additional investments or meet its redemption obligations. Floating rate loan interests may includefully funded term loans or revolving lines of credit. Floating rate loan interests are typically senior in the corporate capital structure of the borrower. Floating rate loan interestsgenerally pay interest at rates that are periodically determined by reference to a base lending rate plus a premium. Since the rates reset only periodically, changes inprevailing interest rates (and particularly sudden and significant changes) can be expected to cause some fluctuations in the NAV of a fund to the extent that it invests infloating rate loan interests. The base lending rates are generally the lending rate offered by one or more European banks, such as the London Interbank Offered Rate(“LIBOR”), the prime rate offered by one or more U.S. banks or the certificate of deposit rate. Floating rate loan interests may involve foreign borrowers, and investmentsmay be denominated in foreign currencies. These investments are treated as investments in debt securities for purposes of a fund’s investment policies.
When a fund purchases a floating rate loan interest, it may receive a facility fee and when it sells a floating rate loan interest, it may pay a facility fee. On an ongoing basis,a fund may receive a commitment fee based on the undrawn portion of the underlying line of credit amount of a floating rate loan interest. Facility and commitment fees aretypically amortized to income over the term of the loan or term of the commitment, respectively. Consent and amendment fees are recorded to income as earned.Prepayment penalty fees, which may be received by a fund upon the prepayment of a floating rate loan interest by a borrower, are recorded as realized gains. A fund mayinvest in multiple series or tranches of a loan. A different series or tranche may have varying terms and carry different associated risks.
Floating rate loan interests are usually freely callable at the borrower’s option. A fund may invest in such loans in the form of participations in loans (“Participations”) orassignments (“Assignments”) of all or a portion of loans from third parties. Participations typically will result in a fund having a contractual relationship only with the lender,not with the borrower. A fund has the right to receive payments of principal, interest and any fees to which it is entitled only from the lender selling the Participation and onlyupon receipt by the lender of the payments from the borrower. In connection with purchasing Participations, a fund generally will have no right to enforce compliance by theborrower with the terms of the loan agreement, nor any rights of offset against the borrower. A fund may not benefit directly from any collateral supporting the loan in whichit has purchased the Participation. As a result, a fund assumes the credit risk of both the borrower and the lender that is selling the Participation. A fund’s investment in loanparticipation interests involves the risk of insolvency of the financial intermediaries who are parties to the transactions. In the event of the insolvency of the lender sellingthe Participation, a fund may be treated as a general creditor of the lender and may not benefit from any offset between the lender and the borrower. Assignments typicallyresult in a fund having a direct contractual relationship with the borrower, and a fund may enforce compliance by the borrower with the terms of the loan agreement.
Securities Lending: Each Fund may lend its securities to approved borrowers, such as brokers, dealers and other financial institutions. The borrower pledges andmaintains with the Fund collateral consisting of cash, an irrevocable letter of credit issued by an approved bank, or securities issued or guaranteed by the U.S. government.The initial collateral received by each Fund is required to have a value of at least 102% of the current market value of the loaned securities for securities traded on U.S.exchanges and a value of at least 105% for all other securities. The collateral is maintained thereafter at a value equal to at least 100% of the current value of the securitieson loan. The market value of the loaned securities is determined at the close of each business day of the Fund and any additional required collateral is delivered to the Fundor excess collateral is returned by the Fund, on the next business day. During the term of the loan, each Fund is entitled to all distributions made on or in respect of the loanedsecurities but does not receive interest income on securities received as collateral. Loans of securities are terminable at any time and the borrower, after notice, is requiredto return borrowed securities within the standard time period for settlement of securities transactions.
As of October 31, 2020, any securities on loan were collateralized by cash and/or U.S. government obligations. Cash collateral received was invested in money marketfunds managed by BlackRock Fund Advisors (“BFA”), the Funds' investment adviser, or its affiliates and is disclosed in the schedules of investments. Any non-cashcollateral received cannot be sold, re-invested or pledged by the Fund, except in the event of borrower default. The securities on loan for each Fund, if any, are also disclosedin its schedule of investments. The market value of any securities on loan as of October 31, 2020 and the value of the related cash collateral are disclosed in the statementsof assets and liabilities.
Securities lending transactions are entered into by a fund under Master Securities Lending Agreements (each, an “MSLA”) which provide the right, in the event of default(including bankruptcy or insolvency) for the non-defaulting party to liquidate the collateral and calculate a net exposure to the defaulting party or request additional collateral.In the event that a borrower defaults, the fund, as lender, would offset the market value of the collateral received against the market value of the securities loaned. The valueof the collateral is typically greater than the market value of the securities loaned, leaving the lender with a net amount payable to the defaulting party. However, bankruptcyor insolvency laws of a particular jurisdiction may impose restrictions on or prohibitions against such a right of offset in the event of an MSLA counterparty’s bankruptcy orinsolvency. Under the MSLA, absent an event of default, the borrower can resell or re-pledge the loaned securities, and the fund can reinvest cash collateral received inconnection with loaned securities.
Notes to Financial Statements (continued)
78 2 0 2 0 I S H A R E S A N N U A L R E P O R T T O S H A R E H O L D E R S
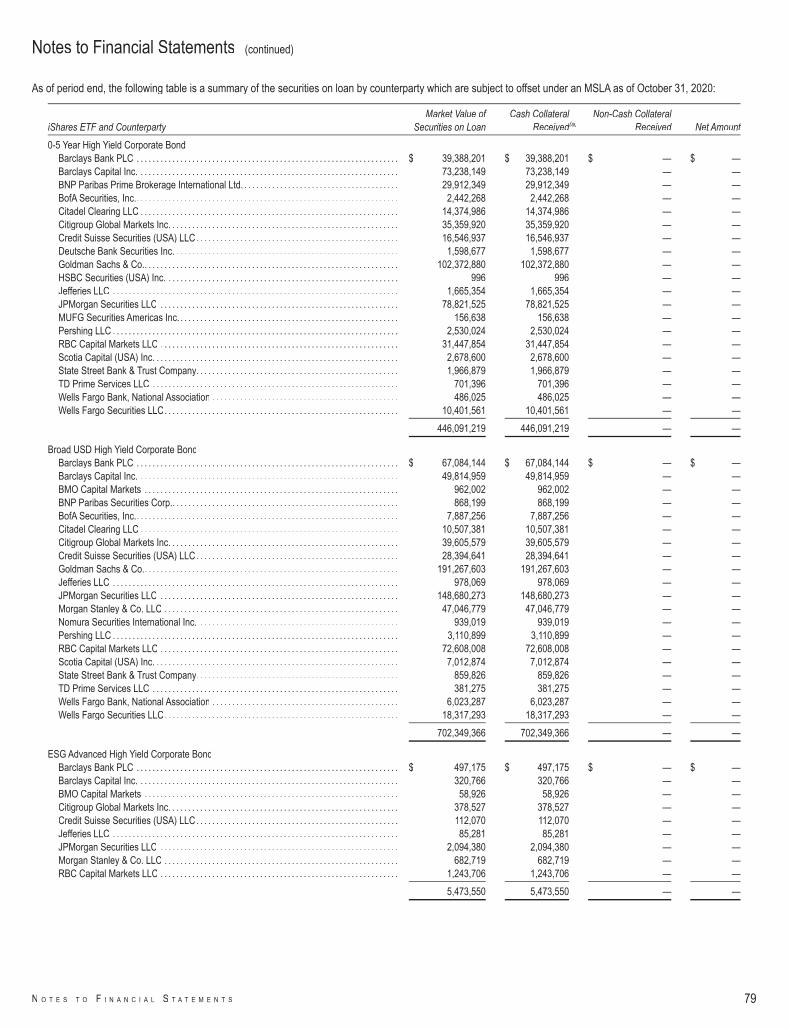
As of period end, the following table is a summary of the securities on loan by counterparty which are subject to offset under an MSLA as of October 31, 2020:
iShares ETF and CounterpartyMarket Value of
Securities on LoanCash Collateral
Received(a)Non-Cash Collateral
Received Net Amount
0-5 Year High Yield Corporate BondBarclays Bank PLC . . . . . . . . . . . . . . . . . . . . . . . . . . . . . . . . . . . . . . . . . . . . . . . . . . . . . . . . . . . . . . . . . . $ 39,388,201 $ 39,388,201 $ — $ —Barclays Capital Inc. . . . . . . . . . . . . . . . . . . . . . . . . . . . . . . . . . . . . . . . . . . . . . . . . . . . . . . . . . . . . . . . . . 73,238,149 73,238,149 — —BNP Paribas Prime Brokerage International Ltd. . . . . . . . . . . . . . . . . . . . . . . . . . . . . . . . . . . . . . . . 29,912,349 29,912,349 — —BofA Securities, Inc.. . . . . . . . . . . . . . . . . . . . . . . . . . . . . . . . . . . . . . . . . . . . . . . . . . . . . . . . . . . . . . . . . . 2,442,268 2,442,268 — —Citadel Clearing LLC . . . . . . . . . . . . . . . . . . . . . . . . . . . . . . . . . . . . . . . . . . . . . . . . . . . . . . . . . . . . . . . . . 14,374,986 14,374,986 — —Citigroup Global Markets Inc. . . . . . . . . . . . . . . . . . . . . . . . . . . . . . . . . . . . . . . . . . . . . . . . . . . . . . . . . . 35,359,920 35,359,920 — —Credit Suisse Securities (USA) LLC. . . . . . . . . . . . . . . . . . . . . . . . . . . . . . . . . . . . . . . . . . . . . . . . . . . 16,546,937 16,546,937 — —Deutsche Bank Securities Inc. . . . . . . . . . . . . . . . . . . . . . . . . . . . . . . . . . . . . . . . . . . . . . . . . . . . . . . . . 1,598,677 1,598,677 — —Goldman Sachs & Co.. . . . . . . . . . . . . . . . . . . . . . . . . . . . . . . . . . . . . . . . . . . . . . . . . . . . . . . . . . . . . . . . 102,372,880 102,372,880 — —HSBC Securities (USA) Inc. . . . . . . . . . . . . . . . . . . . . . . . . . . . . . . . . . . . . . . . . . . . . . . . . . . . . . . . . . . 996 996 — —Jefferies LLC . . . . . . . . . . . . . . . . . . . . . . . . . . . . . . . . . . . . . . . . . . . . . . . . . . . . . . . . . . . . . . . . . . . . . . . . 1,665,354 1,665,354 — —JPMorgan Securities LLC . . . . . . . . . . . . . . . . . . . . . . . . . . . . . . . . . . . . . . . . . . . . . . . . . . . . . . . . . . . . 78,821,525 78,821,525 — —MUFG Securities Americas Inc. . . . . . . . . . . . . . . . . . . . . . . . . . . . . . . . . . . . . . . . . . . . . . . . . . . . . . . . 156,638 156,638 — —Pershing LLC . . . . . . . . . . . . . . . . . . . . . . . . . . . . . . . . . . . . . . . . . . . . . . . . . . . . . . . . . . . . . . . . . . . . . . . . 2,530,024 2,530,024 — —RBC Capital Markets LLC . . . . . . . . . . . . . . . . . . . . . . . . . . . . . . . . . . . . . . . . . . . . . . . . . . . . . . . . . . . . 31,447,854 31,447,854 — —Scotia Capital (USA) Inc. . . . . . . . . . . . . . . . . . . . . . . . . . . . . . . . . . . . . . . . . . . . . . . . . . . . . . . . . . . . . . 2,678,600 2,678,600 — —State Street Bank & Trust Company. . . . . . . . . . . . . . . . . . . . . . . . . . . . . . . . . . . . . . . . . . . . . . . . . . . 1,966,879 1,966,879 — —TD Prime Services LLC . . . . . . . . . . . . . . . . . . . . . . . . . . . . . . . . . . . . . . . . . . . . . . . . . . . . . . . . . . . . . . 701,396 701,396 — —Wells Fargo Bank, National Association . . . . . . . . . . . . . . . . . . . . . . . . . . . . . . . . . . . . . . . . . . . . . . . 486,025 486,025 — —Wells Fargo Securities LLC. . . . . . . . . . . . . . . . . . . . . . . . . . . . . . . . . . . . . . . . . . . . . . . . . . . . . . . . . . . 10,401,561 10,401,561 — —
446,091,219 446,091,219 — —
Broad USD High Yield Corporate BondBarclays Bank PLC . . . . . . . . . . . . . . . . . . . . . . . . . . . . . . . . . . . . . . . . . . . . . . . . . . . . . . . . . . . . . . . . . . $ 67,084,144 $ 67,084,144 $ — $ —Barclays Capital Inc. . . . . . . . . . . . . . . . . . . . . . . . . . . . . . . . . . . . . . . . . . . . . . . . . . . . . . . . . . . . . . . . . . 49,814,959 49,814,959 — —BMO Capital Markets . . . . . . . . . . . . . . . . . . . . . . . . . . . . . . . . . . . . . . . . . . . . . . . . . . . . . . . . . . . . . . . . 962,002 962,002 — —BNP Paribas Securities Corp.. . . . . . . . . . . . . . . . . . . . . . . . . . . . . . . . . . . . . . . . . . . . . . . . . . . . . . . . . 868,199 868,199 — —BofA Securities, Inc.. . . . . . . . . . . . . . . . . . . . . . . . . . . . . . . . . . . . . . . . . . . . . . . . . . . . . . . . . . . . . . . . . . 7,887,256 7,887,256 — —Citadel Clearing LLC . . . . . . . . . . . . . . . . . . . . . . . . . . . . . . . . . . . . . . . . . . . . . . . . . . . . . . . . . . . . . . . . . 10,507,381 10,507,381 — —Citigroup Global Markets Inc. . . . . . . . . . . . . . . . . . . . . . . . . . . . . . . . . . . . . . . . . . . . . . . . . . . . . . . . . . 39,605,579 39,605,579 — —Credit Suisse Securities (USA) LLC. . . . . . . . . . . . . . . . . . . . . . . . . . . . . . . . . . . . . . . . . . . . . . . . . . . 28,394,641 28,394,641 — —Goldman Sachs & Co.. . . . . . . . . . . . . . . . . . . . . . . . . . . . . . . . . . . . . . . . . . . . . . . . . . . . . . . . . . . . . . . . 191,267,603 191,267,603 — —Jefferies LLC . . . . . . . . . . . . . . . . . . . . . . . . . . . . . . . . . . . . . . . . . . . . . . . . . . . . . . . . . . . . . . . . . . . . . . . . 978,069 978,069 — —JPMorgan Securities LLC . . . . . . . . . . . . . . . . . . . . . . . . . . . . . . . . . . . . . . . . . . . . . . . . . . . . . . . . . . . . 148,680,273 148,680,273 — —Morgan Stanley & Co. LLC . . . . . . . . . . . . . . . . . . . . . . . . . . . . . . . . . . . . . . . . . . . . . . . . . . . . . . . . . . . 47,046,779 47,046,779 — —Nomura Securities International Inc. . . . . . . . . . . . . . . . . . . . . . . . . . . . . . . . . . . . . . . . . . . . . . . . . . . 939,019 939,019 — —Pershing LLC . . . . . . . . . . . . . . . . . . . . . . . . . . . . . . . . . . . . . . . . . . . . . . . . . . . . . . . . . . . . . . . . . . . . . . . . 3,110,899 3,110,899 — —RBC Capital Markets LLC . . . . . . . . . . . . . . . . . . . . . . . . . . . . . . . . . . . . . . . . . . . . . . . . . . . . . . . . . . . . 72,608,008 72,608,008 — —Scotia Capital (USA) Inc. . . . . . . . . . . . . . . . . . . . . . . . . . . . . . . . . . . . . . . . . . . . . . . . . . . . . . . . . . . . . . 7,012,874 7,012,874 — —State Street Bank & Trust Company. . . . . . . . . . . . . . . . . . . . . . . . . . . . . . . . . . . . . . . . . . . . . . . . . . . 859,826 859,826 — —TD Prime Services LLC . . . . . . . . . . . . . . . . . . . . . . . . . . . . . . . . . . . . . . . . . . . . . . . . . . . . . . . . . . . . . . 381,275 381,275 — —Wells Fargo Bank, National Association . . . . . . . . . . . . . . . . . . . . . . . . . . . . . . . . . . . . . . . . . . . . . . . 6,023,287 6,023,287 — —Wells Fargo Securities LLC. . . . . . . . . . . . . . . . . . . . . . . . . . . . . . . . . . . . . . . . . . . . . . . . . . . . . . . . . . . 18,317,293 18,317,293 — —
702,349,366 702,349,366 — —
ESG Advanced High Yield Corporate BondBarclays Bank PLC . . . . . . . . . . . . . . . . . . . . . . . . . . . . . . . . . . . . . . . . . . . . . . . . . . . . . . . . . . . . . . . . . . $ 497,175 $ 497,175 $ — $ —Barclays Capital Inc. . . . . . . . . . . . . . . . . . . . . . . . . . . . . . . . . . . . . . . . . . . . . . . . . . . . . . . . . . . . . . . . . . 320,766 320,766 — —BMO Capital Markets . . . . . . . . . . . . . . . . . . . . . . . . . . . . . . . . . . . . . . . . . . . . . . . . . . . . . . . . . . . . . . . . 58,926 58,926 — —Citigroup Global Markets Inc. . . . . . . . . . . . . . . . . . . . . . . . . . . . . . . . . . . . . . . . . . . . . . . . . . . . . . . . . . 378,527 378,527 — —Credit Suisse Securities (USA) LLC. . . . . . . . . . . . . . . . . . . . . . . . . . . . . . . . . . . . . . . . . . . . . . . . . . . 112,070 112,070 — —Jefferies LLC . . . . . . . . . . . . . . . . . . . . . . . . . . . . . . . . . . . . . . . . . . . . . . . . . . . . . . . . . . . . . . . . . . . . . . . . 85,281 85,281 — —JPMorgan Securities LLC . . . . . . . . . . . . . . . . . . . . . . . . . . . . . . . . . . . . . . . . . . . . . . . . . . . . . . . . . . . . 2,094,380 2,094,380 — —Morgan Stanley & Co. LLC . . . . . . . . . . . . . . . . . . . . . . . . . . . . . . . . . . . . . . . . . . . . . . . . . . . . . . . . . . . 682,719 682,719 — —RBC Capital Markets LLC . . . . . . . . . . . . . . . . . . . . . . . . . . . . . . . . . . . . . . . . . . . . . . . . . . . . . . . . . . . . 1,243,706 1,243,706 — —
5,473,550 5,473,550 — —
Notes to Financial Statements (continued)
N O T E S T O F I N A N C I A L S T A T E M E N T S 79
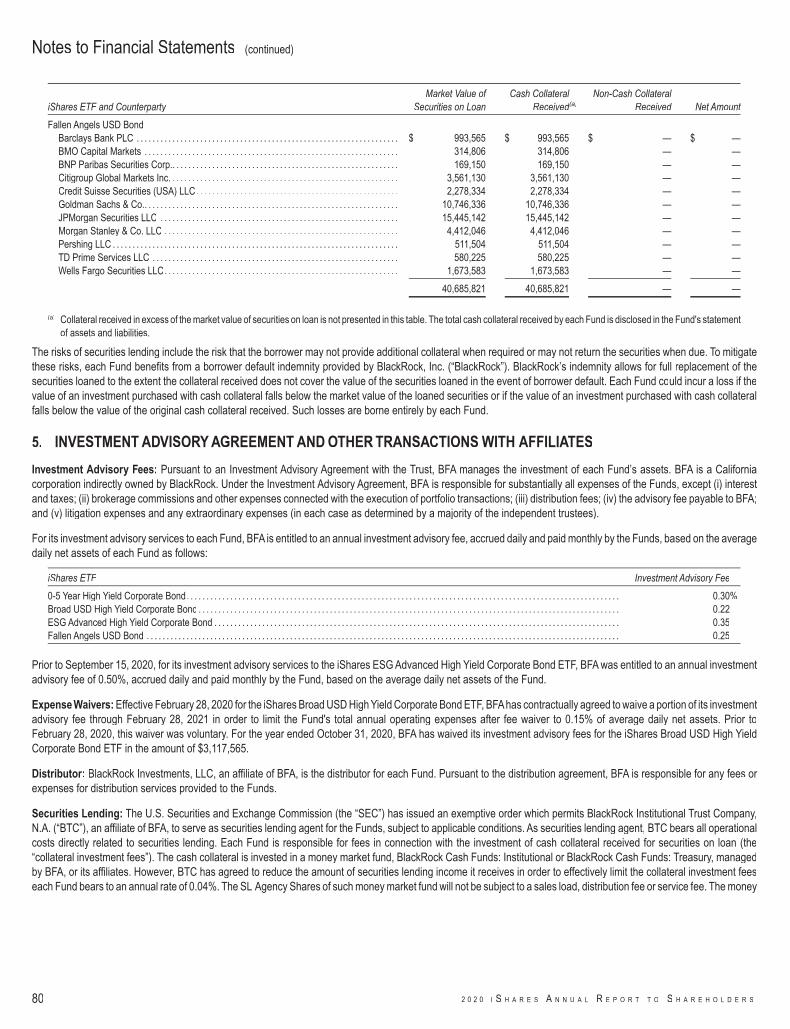
iShares ETF and CounterpartyMarket Value of
Securities on LoanCash Collateral
Received(a)Non-Cash Collateral
Received Net Amount
Fallen Angels USD BondBarclays Bank PLC . . . . . . . . . . . . . . . . . . . . . . . . . . . . . . . . . . . . . . . . . . . . . . . . . . . . . . . . . . . . . . . . . . $ 993,565 $ 993,565 $ — $ —BMO Capital Markets . . . . . . . . . . . . . . . . . . . . . . . . . . . . . . . . . . . . . . . . . . . . . . . . . . . . . . . . . . . . . . . . 314,806 314,806 — —BNP Paribas Securities Corp.. . . . . . . . . . . . . . . . . . . . . . . . . . . . . . . . . . . . . . . . . . . . . . . . . . . . . . . . . 169,150 169,150 — —Citigroup Global Markets Inc. . . . . . . . . . . . . . . . . . . . . . . . . . . . . . . . . . . . . . . . . . . . . . . . . . . . . . . . . . 3,561,130 3,561,130 — —Credit Suisse Securities (USA) LLC. . . . . . . . . . . . . . . . . . . . . . . . . . . . . . . . . . . . . . . . . . . . . . . . . . . 2,278,334 2,278,334 — —Goldman Sachs & Co.. . . . . . . . . . . . . . . . . . . . . . . . . . . . . . . . . . . . . . . . . . . . . . . . . . . . . . . . . . . . . . . . 10,746,336 10,746,336 — —JPMorgan Securities LLC . . . . . . . . . . . . . . . . . . . . . . . . . . . . . . . . . . . . . . . . . . . . . . . . . . . . . . . . . . . . 15,445,142 15,445,142 — —Morgan Stanley & Co. LLC . . . . . . . . . . . . . . . . . . . . . . . . . . . . . . . . . . . . . . . . . . . . . . . . . . . . . . . . . . . 4,412,046 4,412,046 — —Pershing LLC . . . . . . . . . . . . . . . . . . . . . . . . . . . . . . . . . . . . . . . . . . . . . . . . . . . . . . . . . . . . . . . . . . . . . . . . 511,504 511,504 — —TD Prime Services LLC . . . . . . . . . . . . . . . . . . . . . . . . . . . . . . . . . . . . . . . . . . . . . . . . . . . . . . . . . . . . . . 580,225 580,225 — —Wells Fargo Securities LLC. . . . . . . . . . . . . . . . . . . . . . . . . . . . . . . . . . . . . . . . . . . . . . . . . . . . . . . . . . . 1,673,583 1,673,583 — —
40,685,821 40,685,821 — —
(a) Collateral received in excess of the market value of securities on loan is not presented in this table. The total cash collateral received by each Fund is disclosed in the Fund's statementof assets and liabilities.
The risks of securities lending include the risk that the borrower may not provide additional collateral when required or may not return the securities when due. To mitigatethese risks, each Fund benefits from a borrower default indemnity provided by BlackRock, Inc. (“BlackRock”). BlackRock’s indemnity allows for full replacement of thesecurities loaned to the extent the collateral received does not cover the value of the securities loaned in the event of borrower default. Each Fund could incur a loss if thevalue of an investment purchased with cash collateral falls below the market value of the loaned securities or if the value of an investment purchased with cash collateralfalls below the value of the original cash collateral received. Such losses are borne entirely by each Fund.
5. INVESTMENT ADVISORY AGREEMENT AND OTHER TRANSACTIONS WITH AFFILIATES
Investment Advisory Fees: Pursuant to an Investment Advisory Agreement with the Trust, BFA manages the investment of each Fund’s assets. BFA is a Californiacorporation indirectly owned by BlackRock. Under the Investment Advisory Agreement, BFA is responsible for substantially all expenses of the Funds, except (i) interestand taxes; (ii) brokerage commissions and other expenses connected with the execution of portfolio transactions; (iii) distribution fees; (iv) the advisory fee payable to BFA;and (v) litigation expenses and any extraordinary expenses (in each case as determined by a majority of the independent trustees).
For its investment advisory services to each Fund, BFA is entitled to an annual investment advisory fee, accrued daily and paid monthly by the Funds, based on the averagedaily net assets of each Fund as follows:
iShares ETF Investment Advisory Fee
0-5 Year High Yield Corporate Bond. . . . . . . . . . . . . . . . . . . . . . . . . . . . . . . . . . . . . . . . . . . . . . . . . . . . . . . . . . . . . . . . . . . . . . . . . . . . . . . . . . . . . . . . . . . . . . . . . . . . . . . . . . . . . 0.30%Broad USD High Yield Corporate Bond . . . . . . . . . . . . . . . . . . . . . . . . . . . . . . . . . . . . . . . . . . . . . . . . . . . . . . . . . . . . . . . . . . . . . . . . . . . . . . . . . . . . . . . . . . . . . . . . . . . . . . . . . . 0.22ESG Advanced High Yield Corporate Bond . . . . . . . . . . . . . . . . . . . . . . . . . . . . . . . . . . . . . . . . . . . . . . . . . . . . . . . . . . . . . . . . . . . . . . . . . . . . . . . . . . . . . . . . . . . . . . . . . . . . . . 0.35Fallen Angels USD Bond . . . . . . . . . . . . . . . . . . . . . . . . . . . . . . . . . . . . . . . . . . . . . . . . . . . . . . . . . . . . . . . . . . . . . . . . . . . . . . . . . . . . . . . . . . . . . . . . . . . . . . . . . . . . . . . . . . . . . . . 0.25
Prior to September 15, 2020, for its investment advisory services to the iShares ESG Advanced High Yield Corporate Bond ETF, BFA was entitled to an annual investmentadvisory fee of 0.50%, accrued daily and paid monthly by the Fund, based on the average daily net assets of the Fund.
Expense Waivers: Effective February 28, 2020 for the iShares Broad USD High Yield Corporate Bond ETF, BFAhas contractually agreed to waive a portion of its investmentadvisory fee through February 28, 2021 in order to limit the Fund's total annual operating expenses after fee waiver to 0.15% of average daily net assets. Prior toFebruary 28, 2020, this waiver was voluntary. For the year ended October 31, 2020, BFA has waived its investment advisory fees for the iShares Broad USD High YieldCorporate Bond ETF in the amount of $3,117,565.
Distributor: BlackRock Investments, LLC, an affiliate of BFA, is the distributor for each Fund. Pursuant to the distribution agreement, BFA is responsible for any fees orexpenses for distribution services provided to the Funds.
Securities Lending: The U.S. Securities and Exchange Commission (the “SEC”) has issued an exemptive order which permits BlackRock Institutional Trust Company,N.A. (“BTC”), an affiliate of BFA, to serve as securities lending agent for the Funds, subject to applicable conditions. As securities lending agent, BTC bears all operationalcosts directly related to securities lending. Each Fund is responsible for fees in connection with the investment of cash collateral received for securities on loan (the“collateral investment fees”). The cash collateral is invested in a money market fund, BlackRock Cash Funds: Institutional or BlackRock Cash Funds: Treasury, managedby BFA, or its affiliates. However, BTC has agreed to reduce the amount of securities lending income it receives in order to effectively limit the collateral investment feeseach Fund bears to an annual rate of 0.04%. The SL Agency Shares of such money market fund will not be subject to a sales load, distribution fee or service fee. The money
Notes to Financial Statements (continued)
80 2 0 2 0 I S H A R E S A N N U A L R E P O R T T O S H A R E H O L D E R S
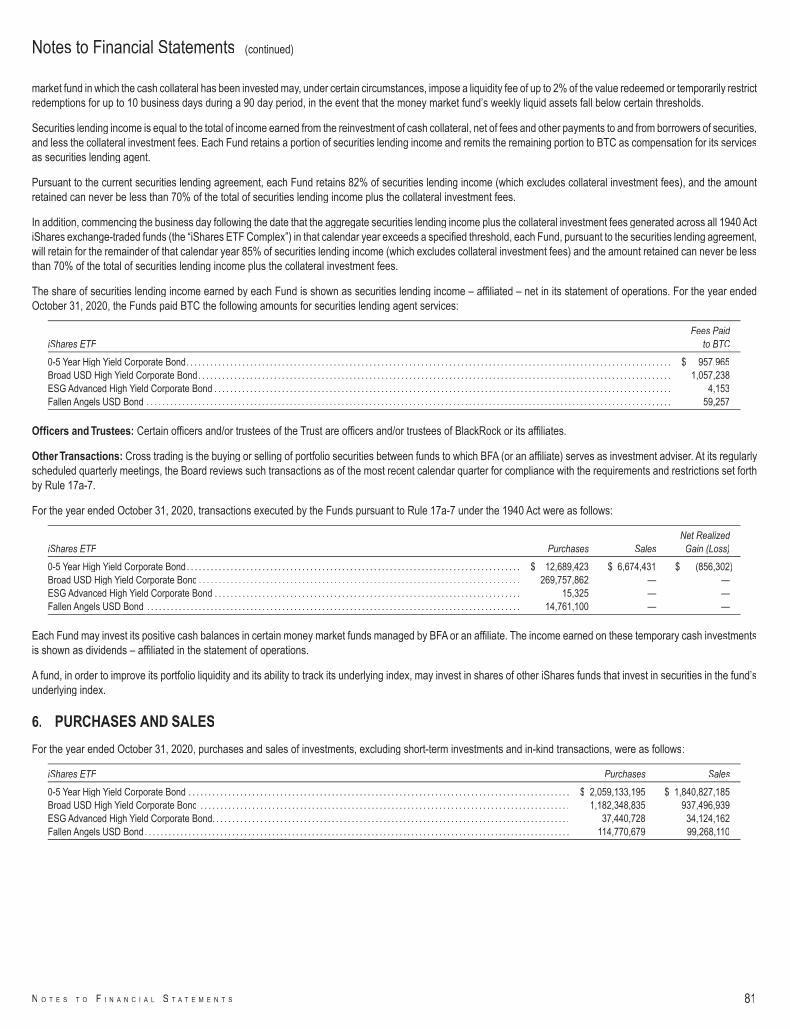
market fund in which the cash collateral has been invested may, under certain circumstances, impose a liquidity fee of up to 2% of the value redeemed or temporarily restrictredemptions for up to 10 business days during a 90 day period, in the event that the money market fund’s weekly liquid assets fall below certain thresholds.
Securities lending income is equal to the total of income earned from the reinvestment of cash collateral, net of fees and other payments to and from borrowers of securities,and less the collateral investment fees. Each Fund retains a portion of securities lending income and remits the remaining portion to BTC as compensation for its servicesas securities lending agent.
Pursuant to the current securities lending agreement, each Fund retains 82% of securities lending income (which excludes collateral investment fees), and the amountretained can never be less than 70% of the total of securities lending income plus the collateral investment fees.
In addition, commencing the business day following the date that the aggregate securities lending income plus the collateral investment fees generated across all 1940 ActiShares exchange-traded funds (the “iShares ETF Complex”) in that calendar year exceeds a specified threshold, each Fund, pursuant to the securities lending agreement,will retain for the remainder of that calendar year 85% of securities lending income (which excludes collateral investment fees) and the amount retained can never be lessthan 70% of the total of securities lending income plus the collateral investment fees.
The share of securities lending income earned by each Fund is shown as securities lending income – affiliated – net in its statement of operations. For the year endedOctober 31, 2020, the Funds paid BTC the following amounts for securities lending agent services:
iShares ETFFees Paid
to BTC
0-5 Year High Yield Corporate Bond. . . . . . . . . . . . . . . . . . . . . . . . . . . . . . . . . . . . . . . . . . . . . . . . . . . . . . . . . . . . . . . . . . . . . . . . . . . . . . . . . . . . . . . . . . . . . . . . . . . . . . . . . . . . . . . . . . . . . . . . . . $ 957,965Broad USD High Yield Corporate Bond. . . . . . . . . . . . . . . . . . . . . . . . . . . . . . . . . . . . . . . . . . . . . . . . . . . . . . . . . . . . . . . . . . . . . . . . . . . . . . . . . . . . . . . . . . . . . . . . . . . . . . . . . . . . . . . . . . . . . . . 1,057,238ESG Advanced High Yield Corporate Bond . . . . . . . . . . . . . . . . . . . . . . . . . . . . . . . . . . . . . . . . . . . . . . . . . . . . . . . . . . . . . . . . . . . . . . . . . . . . . . . . . . . . . . . . . . . . . . . . . . . . . . . . . . . . . . . . . . . 4,153Fallen Angels USD Bond . . . . . . . . . . . . . . . . . . . . . . . . . . . . . . . . . . . . . . . . . . . . . . . . . . . . . . . . . . . . . . . . . . . . . . . . . . . . . . . . . . . . . . . . . . . . . . . . . . . . . . . . . . . . . . . . . . . . . . . . . . . . . . . . . . . . 59,257
Officers and Trustees: Certain officers and/or trustees of the Trust are officers and/or trustees of BlackRock or its affiliates.
Other Transactions: Cross trading is the buying or selling of portfolio securities between funds to which BFA (or an affiliate) serves as investment adviser. At its regularlyscheduled quarterly meetings, the Board reviews such transactions as of the most recent calendar quarter for compliance with the requirements and restrictions set forthby Rule 17a-7.
For the year ended October 31, 2020, transactions executed by the Funds pursuant to Rule 17a-7 under the 1940 Act were as follows:
iShares ETF Purchases SalesNet Realized
Gain (Loss)
0-5 Year High Yield Corporate Bond . . . . . . . . . . . . . . . . . . . . . . . . . . . . . . . . . . . . . . . . . . . . . . . . . . . . . . . . . . . . . . . . . . . . . . . . . . . . . . . . . . . . $ 12,689,423 $ 6,674,431 $ (856,302)Broad USD High Yield Corporate Bond . . . . . . . . . . . . . . . . . . . . . . . . . . . . . . . . . . . . . . . . . . . . . . . . . . . . . . . . . . . . . . . . . . . . . . . . . . . . . . . . . 269,757,862 — —ESG Advanced High Yield Corporate Bond . . . . . . . . . . . . . . . . . . . . . . . . . . . . . . . . . . . . . . . . . . . . . . . . . . . . . . . . . . . . . . . . . . . . . . . . . . . . . 15,325 — —Fallen Angels USD Bond . . . . . . . . . . . . . . . . . . . . . . . . . . . . . . . . . . . . . . . . . . . . . . . . . . . . . . . . . . . . . . . . . . . . . . . . . . . . . . . . . . . . . . . . . . . . . . 14,761,100 — —
Each Fund may invest its positive cash balances in certain money market funds managed by BFA or an affiliate. The income earned on these temporary cash investmentsis shown as dividends – affiliated in the statement of operations.
A fund, in order to improve its portfolio liquidity and its ability to track its underlying index, may invest in shares of other iShares funds that invest in securities in the fund’sunderlying index.
6. PURCHASES AND SALES
For the year ended October 31, 2020, purchases and sales of investments, excluding short-term investments and in-kind transactions, were as follows:
iShares ETF Purchases Sales
0-5 Year High Yield Corporate Bond . . . . . . . . . . . . . . . . . . . . . . . . . . . . . . . . . . . . . . . . . . . . . . . . . . . . . . . . . . . . . . . . . . . . . . . . . . . . . . . . . . . . . . . . . . . . . . . . $ 2,059,133,195 $ 1,840,827,185Broad USD High Yield Corporate Bond . . . . . . . . . . . . . . . . . . . . . . . . . . . . . . . . . . . . . . . . . . . . . . . . . . . . . . . . . . . . . . . . . . . . . . . . . . . . . . . . . . . . . . . . . . . . . 1,182,348,835 937,496,939ESG Advanced High Yield Corporate Bond. . . . . . . . . . . . . . . . . . . . . . . . . . . . . . . . . . . . . . . . . . . . . . . . . . . . . . . . . . . . . . . . . . . . . . . . . . . . . . . . . . . . . . . . . . 37,440,728 34,124,162Fallen Angels USD Bond . . . . . . . . . . . . . . . . . . . . . . . . . . . . . . . . . . . . . . . . . . . . . . . . . . . . . . . . . . . . . . . . . . . . . . . . . . . . . . . . . . . . . . . . . . . . . . . . . . . . . . . . . . . 114,770,679 99,268,110
Notes to Financial Statements (continued)
N O T E S T O F I N A N C I A L S T A T E M E N T S 81
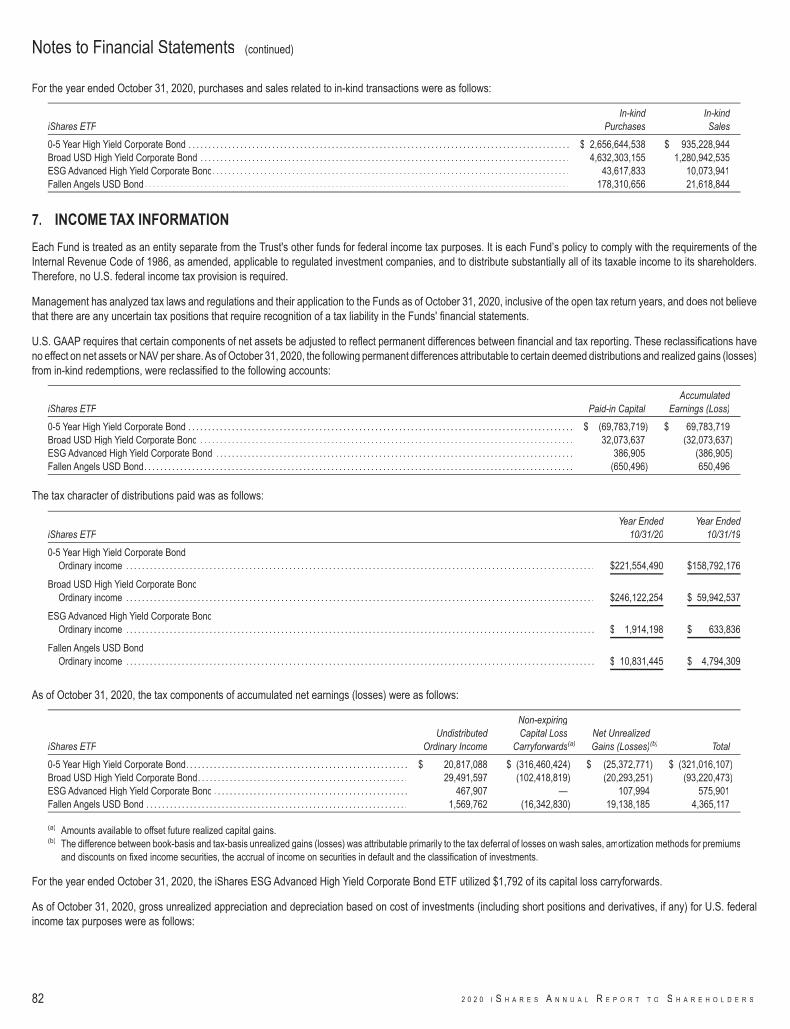
For the year ended October 31, 2020, purchases and sales related to in-kind transactions were as follows:
iShares ETFIn-kind
PurchasesIn-kindSales
0-5 Year High Yield Corporate Bond . . . . . . . . . . . . . . . . . . . . . . . . . . . . . . . . . . . . . . . . . . . . . . . . . . . . . . . . . . . . . . . . . . . . . . . . . . . . . . . . . . . . . . . . . . . . . . . . $ 2,656,644,538 $ 935,228,944Broad USD High Yield Corporate Bond . . . . . . . . . . . . . . . . . . . . . . . . . . . . . . . . . . . . . . . . . . . . . . . . . . . . . . . . . . . . . . . . . . . . . . . . . . . . . . . . . . . . . . . . . . . . . 4,632,303,155 1,280,942,535ESG Advanced High Yield Corporate Bond. . . . . . . . . . . . . . . . . . . . . . . . . . . . . . . . . . . . . . . . . . . . . . . . . . . . . . . . . . . . . . . . . . . . . . . . . . . . . . . . . . . . . . . . . . 43,617,833 10,073,941Fallen Angels USD Bond . . . . . . . . . . . . . . . . . . . . . . . . . . . . . . . . . . . . . . . . . . . . . . . . . . . . . . . . . . . . . . . . . . . . . . . . . . . . . . . . . . . . . . . . . . . . . . . . . . . . . . . . . . . 178,310,656 21,618,844
7. INCOME TAX INFORMATION
Each Fund is treated as an entity separate from the Trust's other funds for federal income tax purposes. It is each Fund’s policy to comply with the requirements of theInternal Revenue Code of 1986, as amended, applicable to regulated investment companies, and to distribute substantially all of its taxable income to its shareholders.Therefore, no U.S. federal income tax provision is required.
Management has analyzed tax laws and regulations and their application to the Funds as of October 31, 2020, inclusive of the open tax return years, and does not believethat there are any uncertain tax positions that require recognition of a tax liability in the Funds' financial statements.
U.S. GAAP requires that certain components of net assets be adjusted to reflect permanent differences between financial and tax reporting. These reclassifications haveno effect on net assets or NAV per share.As of October 31, 2020, the following permanent differences attributable to certain deemed distributions and realized gains (losses)from in-kind redemptions, were reclassified to the following accounts:
iShares ETF Paid-in CapitalAccumulated
Earnings (Loss)
0-5 Year High Yield Corporate Bond . . . . . . . . . . . . . . . . . . . . . . . . . . . . . . . . . . . . . . . . . . . . . . . . . . . . . . . . . . . . . . . . . . . . . . . . . . . . . . . . . . . . . . . . . . . . . . . . . $ (69,783,719) $ 69,783,719Broad USD High Yield Corporate Bond . . . . . . . . . . . . . . . . . . . . . . . . . . . . . . . . . . . . . . . . . . . . . . . . . . . . . . . . . . . . . . . . . . . . . . . . . . . . . . . . . . . . . . . . . . . . . . 32,073,637 (32,073,637)ESG Advanced High Yield Corporate Bond . . . . . . . . . . . . . . . . . . . . . . . . . . . . . . . . . . . . . . . . . . . . . . . . . . . . . . . . . . . . . . . . . . . . . . . . . . . . . . . . . . . . . . . . . . 386,905 (386,905)Fallen Angels USD Bond. . . . . . . . . . . . . . . . . . . . . . . . . . . . . . . . . . . . . . . . . . . . . . . . . . . . . . . . . . . . . . . . . . . . . . . . . . . . . . . . . . . . . . . . . . . . . . . . . . . . . . . . . . . . (650,496) 650,496
The tax character of distributions paid was as follows:
iShares ETFYear Ended
10/31/20Year Ended
10/31/19
0-5 Year High Yield Corporate BondOrdinary income . . . . . . . . . . . . . . . . . . . . . . . . . . . . . . . . . . . . . . . . . . . . . . . . . . . . . . . . . . . . . . . . . . . . . . . . . . . . . . . . . . . . . . . . . . . . . . . . . . . . . . . . . . . . . . . . . . . . . . $221,554,490 $158,792,176
Broad USD High Yield Corporate BondOrdinary income . . . . . . . . . . . . . . . . . . . . . . . . . . . . . . . . . . . . . . . . . . . . . . . . . . . . . . . . . . . . . . . . . . . . . . . . . . . . . . . . . . . . . . . . . . . . . . . . . . . . . . . . . . . . . . . . . . . . . . $246,122,254 $ 59,942,537
ESG Advanced High Yield Corporate BondOrdinary income . . . . . . . . . . . . . . . . . . . . . . . . . . . . . . . . . . . . . . . . . . . . . . . . . . . . . . . . . . . . . . . . . . . . . . . . . . . . . . . . . . . . . . . . . . . . . . . . . . . . . . . . . . . . . . . . . . . . . . $ 1,914,198 $ 633,836
Fallen Angels USD BondOrdinary income . . . . . . . . . . . . . . . . . . . . . . . . . . . . . . . . . . . . . . . . . . . . . . . . . . . . . . . . . . . . . . . . . . . . . . . . . . . . . . . . . . . . . . . . . . . . . . . . . . . . . . . . . . . . . . . . . . . . . . $ 10,831,445 $ 4,794,309
As of October 31, 2020, the tax components of accumulated net earnings (losses) were as follows:
iShares ETFUndistributed
Ordinary Income
Non-expiringCapital Loss
Carryforwards(a)Net UnrealizedGains (Losses)(b) Total
0-5 Year High Yield Corporate Bond. . . . . . . . . . . . . . . . . . . . . . . . . . . . . . . . . . . . . . . . . . . . . . . . . . . . . . . . $ 20,817,088 $ (316,460,424) $ (25,372,771) $ (321,016,107)Broad USD High Yield Corporate Bond. . . . . . . . . . . . . . . . . . . . . . . . . . . . . . . . . . . . . . . . . . . . . . . . . . . . . 29,491,597 (102,418,819) (20,293,251) (93,220,473)ESG Advanced High Yield Corporate Bond . . . . . . . . . . . . . . . . . . . . . . . . . . . . . . . . . . . . . . . . . . . . . . . . . 467,907 — 107,994 575,901Fallen Angels USD Bond . . . . . . . . . . . . . . . . . . . . . . . . . . . . . . . . . . . . . . . . . . . . . . . . . . . . . . . . . . . . . . . . . . 1,569,762 (16,342,830) 19,138,185 4,365,117
(a) Amounts available to offset future realized capital gains.(b) The difference between book-basis and tax-basis unrealized gains (losses) was attributable primarily to the tax deferral of losses on wash sales, amortization methods for premiums
and discounts on fixed income securities, the accrual of income on securities in default and the classification of investments.
For the year ended October 31, 2020, the iShares ESG Advanced High Yield Corporate Bond ETF utilized $1,792 of its capital loss carryforwards.
As of October 31, 2020, gross unrealized appreciation and depreciation based on cost of investments (including short positions and derivatives, if any) for U.S. federalincome tax purposes were as follows:
Notes to Financial Statements (continued)
82 2 0 2 0 I S H A R E S A N N U A L R E P O R T T O S H A R E H O L D E R S
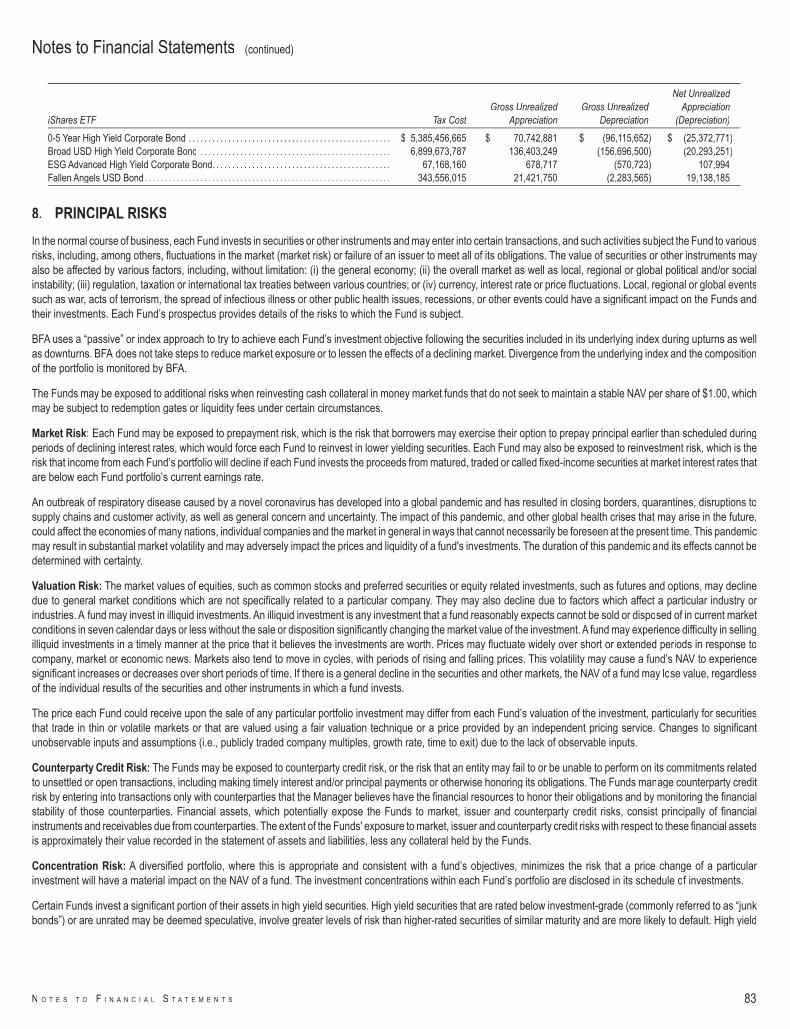
iShares ETF Tax CostGross Unrealized
AppreciationGross Unrealized
Depreciation
Net UnrealizedAppreciation
(Depreciation)
0-5 Year High Yield Corporate Bond . . . . . . . . . . . . . . . . . . . . . . . . . . . . . . . . . . . . . . . . . . . . . . . . . . . $ 5,385,456,665 $ 70,742,881 $ (96,115,652) $ (25,372,771)Broad USD High Yield Corporate Bond . . . . . . . . . . . . . . . . . . . . . . . . . . . . . . . . . . . . . . . . . . . . . . . . 6,899,673,787 136,403,249 (156,696,500) (20,293,251)ESG Advanced High Yield Corporate Bond. . . . . . . . . . . . . . . . . . . . . . . . . . . . . . . . . . . . . . . . . . . . . 67,168,160 678,717 (570,723) 107,994Fallen Angels USD Bond. . . . . . . . . . . . . . . . . . . . . . . . . . . . . . . . . . . . . . . . . . . . . . . . . . . . . . . . . . . . . . 343,556,015 21,421,750 (2,283,565) 19,138,185
8. PRINCIPAL RISKS
In the normal course of business, each Fund invests in securities or other instruments and may enter into certain transactions, and such activities subject the Fund to variousrisks, including, among others, fluctuations in the market (market risk) or failure of an issuer to meet all of its obligations. The value of securities or other instruments mayalso be affected by various factors, including, without limitation: (i) the general economy; (ii) the overall market as well as local, regional or global political and/or socialinstability; (iii) regulation, taxation or international tax treaties between various countries; or (iv) currency, interest rate or price fluctuations. Local, regional or global eventssuch as war, acts of terrorism, the spread of infectious illness or other public health issues, recessions, or other events could have a significant impact on the Funds andtheir investments. Each Fund’s prospectus provides details of the risks to which the Fund is subject.
BFA uses a “passive” or index approach to try to achieve each Fund’s investment objective following the securities included in its underlying index during upturns as wellas downturns. BFA does not take steps to reduce market exposure or to lessen the effects of a declining market. Divergence from the underlying index and the compositionof the portfolio is monitored by BFA.
The Funds may be exposed to additional risks when reinvesting cash collateral in money market funds that do not seek to maintain a stable NAV per share of $1.00, whichmay be subject to redemption gates or liquidity fees under certain circumstances.
Market Risk: Each Fund may be exposed to prepayment risk, which is the risk that borrowers may exercise their option to prepay principal earlier than scheduled duringperiods of declining interest rates, which would force each Fund to reinvest in lower yielding securities. Each Fund may also be exposed to reinvestment risk, which is therisk that income from each Fund’s portfolio will decline if each Fund invests the proceeds from matured, traded or called fixed-income securities at market interest rates thatare below each Fund portfolio’s current earnings rate.
An outbreak of respiratory disease caused by a novel coronavirus has developed into a global pandemic and has resulted in closing borders, quarantines, disruptions tosupply chains and customer activity, as well as general concern and uncertainty. The impact of this pandemic, and other global health crises that may arise in the future,could affect the economies of many nations, individual companies and the market in general in ways that cannot necessarily be foreseen at the present time. This pandemicmay result in substantial market volatility and may adversely impact the prices and liquidity of a fund's investments. The duration of this pandemic and its effects cannot bedetermined with certainty.
Valuation Risk: The market values of equities, such as common stocks and preferred securities or equity related investments, such as futures and options, may declinedue to general market conditions which are not specifically related to a particular company. They may also decline due to factors which affect a particular industry orindustries. A fund may invest in illiquid investments. An illiquid investment is any investment that a fund reasonably expects cannot be sold or disposed of in current marketconditions in seven calendar days or less without the sale or disposition significantly changing the market value of the investment. A fund may experience difficulty in sellingilliquid investments in a timely manner at the price that it believes the investments are worth. Prices may fluctuate widely over short or extended periods in response tocompany, market or economic news. Markets also tend to move in cycles, with periods of rising and falling prices. This volatility may cause a fund’s NAV to experiencesignificant increases or decreases over short periods of time. If there is a general decline in the securities and other markets, the NAV of a fund may lose value, regardlessof the individual results of the securities and other instruments in which a fund invests.
The price each Fund could receive upon the sale of any particular portfolio investment may differ from each Fund’s valuation of the investment, particularly for securitiesthat trade in thin or volatile markets or that are valued using a fair valuation technique or a price provided by an independent pricing service. Changes to significantunobservable inputs and assumptions (i.e., publicly traded company multiples, growth rate, time to exit) due to the lack of observable inputs.
Counterparty Credit Risk: The Funds may be exposed to counterparty credit risk, or the risk that an entity may fail to or be unable to perform on its commitments relatedto unsettled or open transactions, including making timely interest and/or principal payments or otherwise honoring its obligations. The Funds manage counterparty creditrisk by entering into transactions only with counterparties that the Manager believes have the financial resources to honor their obligations and by monitoring the financialstability of those counterparties. Financial assets, which potentially expose the Funds to market, issuer and counterparty credit risks, consist principally of financialinstruments and receivables due from counterparties. The extent of the Funds' exposure to market, issuer and counterparty credit risks with respect to these financial assetsis approximately their value recorded in the statement of assets and liabilities, less any collateral held by the Funds.
Concentration Risk: A diversified portfolio, where this is appropriate and consistent with a fund’s objectives, minimizes the risk that a price change of a particularinvestment will have a material impact on the NAV of a fund. The investment concentrations within each Fund’s portfolio are disclosed in its schedule of investments.
Certain Funds invest a significant portion of their assets in high yield securities. High yield securities that are rated below investment-grade (commonly referred to as “junkbonds”) or are unrated may be deemed speculative, involve greater levels of risk than higher-rated securities of similar maturity and are more likely to default. High yield
Notes to Financial Statements (continued)
N O T E S T O F I N A N C I A L S T A T E M E N T S 83
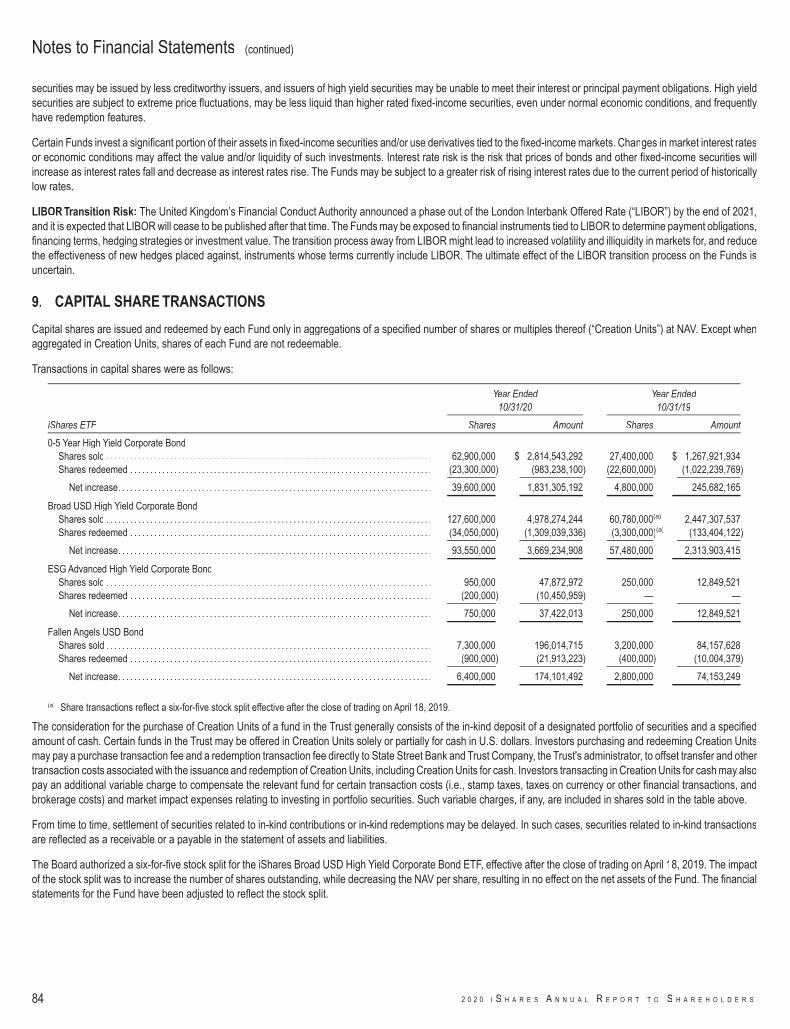
securities may be issued by less creditworthy issuers, and issuers of high yield securities may be unable to meet their interest or principal payment obligations. High yieldsecurities are subject to extreme price fluctuations, may be less liquid than higher rated fixed-income securities, even under normal economic conditions, and frequentlyhave redemption features.
Certain Funds invest a significant portion of their assets in fixed-income securities and/or use derivatives tied to the fixed-income markets. Changes in market interest ratesor economic conditions may affect the value and/or liquidity of such investments. Interest rate risk is the risk that prices of bonds and other fixed-income securities willincrease as interest rates fall and decrease as interest rates rise. The Funds may be subject to a greater risk of rising interest rates due to the current period of historicallylow rates.
LIBOR Transition Risk: The United Kingdom’s Financial Conduct Authority announced a phase out of the London Interbank Offered Rate (“LIBOR”) by the end of 2021,and it is expected that LIBOR will cease to be published after that time. The Funds may be exposed to financial instruments tied to LIBOR to determine payment obligations,financing terms, hedging strategies or investment value. The transition process away from LIBOR might lead to increased volatility and illiquidity in markets for, and reducethe effectiveness of new hedges placed against, instruments whose terms currently include LIBOR. The ultimate effect of the LIBOR transition process on the Funds isuncertain.
9. CAPITAL SHARE TRANSACTIONS
Capital shares are issued and redeemed by each Fund only in aggregations of a specified number of shares or multiples thereof (“Creation Units”) at NAV. Except whenaggregated in Creation Units, shares of each Fund are not redeemable.
Transactions in capital shares were as follows:
Year Ended10/31/20
Year Ended10/31/19
iShares ETF Shares Amount Shares Amount
0-5 Year High Yield Corporate BondShares sold . . . . . . . . . . . . . . . . . . . . . . . . . . . . . . . . . . . . . . . . . . . . . . . . . . . . . . . . . . . . . . . . . . . . . . . . . . . . . . . . . . 62,900,000 $ 2,814,543,292 27,400,000 $ 1,267,921,934Shares redeemed . . . . . . . . . . . . . . . . . . . . . . . . . . . . . . . . . . . . . . . . . . . . . . . . . . . . . . . . . . . . . . . . . . . . . . . . . . . . (23,300,000) (983,238,100) (22,600,000) (1,022,239,769)
Net increase. . . . . . . . . . . . . . . . . . . . . . . . . . . . . . . . . . . . . . . . . . . . . . . . . . . . . . . . . . . . . . . . . . . . . . . . . . . . . . . 39,600,000 1,831,305,192 4,800,000 245,682,165
Broad USD High Yield Corporate BondShares sold . . . . . . . . . . . . . . . . . . . . . . . . . . . . . . . . . . . . . . . . . . . . . . . . . . . . . . . . . . . . . . . . . . . . . . . . . . . . . . . . . . 127,600,000 4,978,274,244 60,780,000(a) 2,447,307,537Shares redeemed . . . . . . . . . . . . . . . . . . . . . . . . . . . . . . . . . . . . . . . . . . . . . . . . . . . . . . . . . . . . . . . . . . . . . . . . . . . . (34,050,000) (1,309,039,336) (3,300,000)(a) (133,404,122)
Net increase. . . . . . . . . . . . . . . . . . . . . . . . . . . . . . . . . . . . . . . . . . . . . . . . . . . . . . . . . . . . . . . . . . . . . . . . . . . . . . . 93,550,000 3,669,234,908 57,480,000 2,313,903,415
ESG Advanced High Yield Corporate BondShares sold . . . . . . . . . . . . . . . . . . . . . . . . . . . . . . . . . . . . . . . . . . . . . . . . . . . . . . . . . . . . . . . . . . . . . . . . . . . . . . . . . . 950,000 47,872,972 250,000 12,849,521Shares redeemed . . . . . . . . . . . . . . . . . . . . . . . . . . . . . . . . . . . . . . . . . . . . . . . . . . . . . . . . . . . . . . . . . . . . . . . . . . . . (200,000) (10,450,959) — —
Net increase. . . . . . . . . . . . . . . . . . . . . . . . . . . . . . . . . . . . . . . . . . . . . . . . . . . . . . . . . . . . . . . . . . . . . . . . . . . . . . . 750,000 37,422,013 250,000 12,849,521
Fallen Angels USD BondShares sold . . . . . . . . . . . . . . . . . . . . . . . . . . . . . . . . . . . . . . . . . . . . . . . . . . . . . . . . . . . . . . . . . . . . . . . . . . . . . . . . . . 7,300,000 196,014,715 3,200,000 84,157,628Shares redeemed . . . . . . . . . . . . . . . . . . . . . . . . . . . . . . . . . . . . . . . . . . . . . . . . . . . . . . . . . . . . . . . . . . . . . . . . . . . . (900,000) (21,913,223) (400,000) (10,004,379)
Net increase. . . . . . . . . . . . . . . . . . . . . . . . . . . . . . . . . . . . . . . . . . . . . . . . . . . . . . . . . . . . . . . . . . . . . . . . . . . . . . . 6,400,000 174,101,492 2,800,000 74,153,249
(a) Share transactions reflect a six-for-five stock split effective after the close of trading on April 18, 2019.
The consideration for the purchase of Creation Units of a fund in the Trust generally consists of the in-kind deposit of a designated portfolio of securities and a specifiedamount of cash. Certain funds in the Trust may be offered in Creation Units solely or partially for cash in U.S. dollars. Investors purchasing and redeeming Creation Unitsmay pay a purchase transaction fee and a redemption transaction fee directly to State Street Bank and Trust Company, the Trust's administrator, to offset transfer and othertransaction costs associated with the issuance and redemption of Creation Units, including Creation Units for cash. Investors transacting in Creation Units for cash may alsopay an additional variable charge to compensate the relevant fund for certain transaction costs (i.e., stamp taxes, taxes on currency or other financial transactions, andbrokerage costs) and market impact expenses relating to investing in portfolio securities. Such variable charges, if any, are included in shares sold in the table above.
From time to time, settlement of securities related to in-kind contributions or in-kind redemptions may be delayed. In such cases, securities related to in-kind transactionsare reflected as a receivable or a payable in the statement of assets and liabilities.
The Board authorized a six-for-five stock split for the iShares Broad USD High Yield Corporate Bond ETF, effective after the close of trading on April 18, 2019. The impactof the stock split was to increase the number of shares outstanding, while decreasing the NAV per share, resulting in no effect on the net assets of the Fund. The financialstatements for the Fund have been adjusted to reflect the stock split.
Notes to Financial Statements (continued)
84 2 0 2 0 I S H A R E S A N N U A L R E P O R T T O S H A R E H O L D E R S
10. LEGAL PROCEEDINGS
On June 16, 2016, investors in certain iShares funds (iShares Core S&P Small-Cap ETF, iShares Russell 1000 Growth ETF, iShares Core S&P 500 ETF, iShares RussellMid-Cap Growth ETF, iShares Russell Mid-Cap ETF, iShares Russell Mid-Cap Value ETF, iShares Select Dividend ETF, iShares Morningstar Mid-Cap ETF, iSharesMorningstar Large-Cap ETF, iShares U.S. Aerospace & Defense ETF and iShares Preferred and Income Securities ETF) filed a class action lawsuit against iShares Trust,BlackRock, Inc. and certain of its advisory affiliates, and certain directors/trustees and officers of the Funds (collectively, “Defendants”) in California State Court. The lawsuitalleges the Defendants violated federal securities laws by failing to adequately disclose in the prospectuses issued by the funds noted above the risks of using stop-lossorders in the event of a ‘flash crash’, such as the one that occurred on May 6, 2010. On September 18, 2017, the court issued a Statement of Decision holding that thePlaintiffs lack standing to assert their claims. On October 11, 2017, the court entered final judgment dismissing all of the Plaintiffs’ claims with prejudice. In an opinion datedJanuary 23, 2020, the California Court of Appeal affirmed the dismissal of Plaintiffs’ claims. On March 3, 2020, plaintiffs filed a petition for review by the California SupremeCourt. On May 27, 2020, the California Supreme Court denied Plaintiff’s petition for review. The case is now closed.
11. SUBSEQUENT EVENTS
Management has evaluated the impact of all subsequent events on the Funds through the date the financial statements were available to be issued and has determinedthat there were no subsequent events requiring adjustment or additional disclosure in the financial statements.
Notes to Financial Statements (continued)
N O T E S T O F I N A N C I A L S T A T E M E N T S 85

To the Board of Trustees of iShares Trust andShareholders of iShares 0-5 Year High Yield Corporate Bond ETF,iShares Broad USD High Yield Corporate Bond ETF,iShares ESG Advanced High Yield Corporate Bond ETF and iShares Fallen Angels USD Bond ETF
Opinions on the Financial Statements
We have audited the accompanying statements of assets and liabilities, including the schedules of investments, of iShares 0-5 Year High Yield Corporate Bond ETF, iSharesBroad USD High Yield Corporate Bond ETF, iShares ESG Advanced High Yield Corporate Bond ETF and iShares Fallen Angels USD Bond ETF (four of the fundsconstituting iShares Trust, hereafter collectively referred to as the "Funds") as of October 31, 2020, the related statements of operations for the year ended October 31,2020, the statements of changes in net assets for each of the two years in the period ended October 31, 2020, including the related notes, and the financial highlights foreach of the periods indicated therein (collectively referred to as the “financial statements”). In our opinion, the financial statements present fairly, in all material respects, thefinancial position of each of the Funds as of October 31, 2020, the results of each of their operations for the year then ended, the changes in each of their net assets for eachof the two years in the period ended October 31, 2020 and each of the financial highlights for each of the periods indicated therein in conformity with accounting principlesgenerally accepted in the United States of America.
Basis for Opinions
These financial statements are the responsibility of the Funds' management. Our responsibility is to express an opinion on the Funds' financial statements based on ouraudits. We are a public accounting firm registered with the Public Company Accounting Oversight Board (United States) (PCAOB) and are required to be independent withrespect to the Funds in accordance with the U.S. federal securities laws and the applicable rules and regulations of the Securities and Exchange Commission and thePCAOB.
We conducted our audits of these financial statements in accordance with the standards of the PCAOB. Those standards require that we plan and perform the audit to obtainreasonable assurance about whether the financial statements are free of material misstatement, whether due to error or fraud.
Our audits included performing procedures to assess the risks of material misstatement of the financial statements, whether due to error or fraud, and performingprocedures that respond to those risks. Such procedures included examining, on a test basis, evidence regarding the amounts and disclosures in the financial statements.Our audits also included evaluating the accounting principles used and significant estimates made by management, as well as evaluating the overall presentation of thefinancial statements. Our procedures included confirmation of securities owned as of October 31, 2020 by correspondence with the custodian, issuer, transfer agent, agentbank and brokers; when replies were not received from brokers, we performed other auditing procedures. We believe that our audits provide a reasonable basis for ouropinions.
/s/PricewaterhouseCoopers LLPPhiladelphia, PennsylvaniaDecember 22, 2020
We have served as the auditor of one or more BlackRock investment companies since 2000.
Report of Independent Registered Public Accounting Firm
86 2 0 2 0 I S H A R E S A N N U A L R E P O R T T O S H A R E H O L D E R S
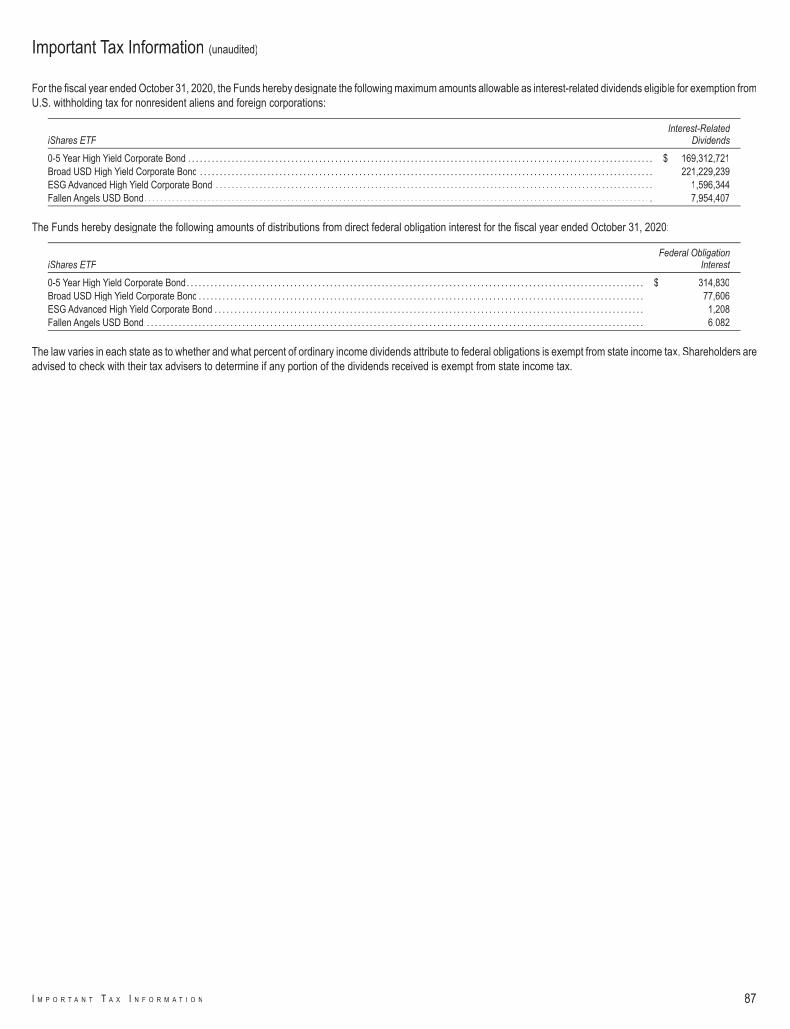
For the fiscal year ended October 31, 2020, the Funds hereby designate the following maximum amounts allowable as interest-related dividends eligible for exemption fromU.S. withholding tax for nonresident aliens and foreign corporations:
iShares ETFInterest-Related
Dividends
0-5 Year High Yield Corporate Bond . . . . . . . . . . . . . . . . . . . . . . . . . . . . . . . . . . . . . . . . . . . . . . . . . . . . . . . . . . . . . . . . . . . . . . . . . . . . . . . . . . . . . . . . . . . . . . . . . . . . . . . . . . . . . . . . . . . . . $ 169,312,721Broad USD High Yield Corporate Bond . . . . . . . . . . . . . . . . . . . . . . . . . . . . . . . . . . . . . . . . . . . . . . . . . . . . . . . . . . . . . . . . . . . . . . . . . . . . . . . . . . . . . . . . . . . . . . . . . . . . . . . . . . . . . . . . . . 221,229,239ESG Advanced High Yield Corporate Bond . . . . . . . . . . . . . . . . . . . . . . . . . . . . . . . . . . . . . . . . . . . . . . . . . . . . . . . . . . . . . . . . . . . . . . . . . . . . . . . . . . . . . . . . . . . . . . . . . . . . . . . . . . . . . . 1,596,344Fallen Angels USD Bond. . . . . . . . . . . . . . . . . . . . . . . . . . . . . . . . . . . . . . . . . . . . . . . . . . . . . . . . . . . . . . . . . . . . . . . . . . . . . . . . . . . . . . . . . . . . . . . . . . . . . . . . . . . . . . . . . . . . . . . . . . . . . . . . 7,954,407
The Funds hereby designate the following amounts of distributions from direct federal obligation interest for the fiscal year ended October 31, 2020:
iShares ETFFederal Obligation
Interest
0-5 Year High Yield Corporate Bond. . . . . . . . . . . . . . . . . . . . . . . . . . . . . . . . . . . . . . . . . . . . . . . . . . . . . . . . . . . . . . . . . . . . . . . . . . . . . . . . . . . . . . . . . . . . . . . . . . . . . . . . . . . . . . . . . . . $ 314,830Broad USD High Yield Corporate Bond . . . . . . . . . . . . . . . . . . . . . . . . . . . . . . . . . . . . . . . . . . . . . . . . . . . . . . . . . . . . . . . . . . . . . . . . . . . . . . . . . . . . . . . . . . . . . . . . . . . . . . . . . . . . . . . . 77,606ESG Advanced High Yield Corporate Bond . . . . . . . . . . . . . . . . . . . . . . . . . . . . . . . . . . . . . . . . . . . . . . . . . . . . . . . . . . . . . . . . . . . . . . . . . . . . . . . . . . . . . . . . . . . . . . . . . . . . . . . . . . . . 1,208Fallen Angels USD Bond . . . . . . . . . . . . . . . . . . . . . . . . . . . . . . . . . . . . . . . . . . . . . . . . . . . . . . . . . . . . . . . . . . . . . . . . . . . . . . . . . . . . . . . . . . . . . . . . . . . . . . . . . . . . . . . . . . . . . . . . . . . . . 6,082
The law varies in each state as to whether and what percent of ordinary income dividends attribute to federal obligations is exempt from state income tax. Shareholders areadvised to check with their tax advisers to determine if any portion of the dividends received is exempt from state income tax.
Important Tax Information (unaudited)
I M P O R T A N T T A X I N F O R M A T I O N 87

iShares 0-5 Year High Yield Corporate Bond ETF, iShares Broad USD High Yield Corporate Bond ETF, iShares Fallen Angels USD Bond ETF (each the “Fund”)
Under Section 15(c) of the Investment Company Act of 1940 (the “1940 Act”), the Trust's Board of Trustees (the “Board”), including a majority of Board Members who arenot “interested persons” of the Trust (as that term is defined in the 1940Act) (the “Independent Board Members), is required annually to consider and approve the InvestmentAdvisory Contract between the Trust and BFA (the “Advisory Contract”) whereby the Board and its committees (composed solely of Independent Board Members) assessBlackRock’s services to the Fund, including investment management; fund accounting; administrative and shareholder services; oversight of the Fund’s service providers;risk management and oversight; legal and compliance services; and ability to meet applicable legal and regulatory requirements. The Independent Board Membersrequested, and BFA provided, such information as the Independent Board Members, with advice from independent counsel, deemed reasonably necessary to evaluate theAdvisory Contract. At meetings on April 17, 2020 and May 19, 2020, a committee composed of all of the Independent Board Members (the “15(c) Committee”), withindependent counsel, met with management and reviewed and discussed information provided in response to initial requests of the 15(c) Committee and/or its independentcounsel, and requested certain additional information, which management agreed to provide. At a meeting held on June 8-10, 2020, the Board, including the IndependentBoard Members, reviewed the additional information provided by management in response to these requests.
After extensive discussions and deliberations, the Board, including all of the Independent Board Members, approved the continuance of the Advisory Contract for the Fund,based on a review of qualitative and quantitative information provided by BFA and their cumulative experience as Board Members. The Board noted its satisfaction with theextent and quality of information provided and its frequent interactions with management, as well as the detailed responses and other information provided by BFA. TheIndependent Board Members were advised by their independent counsel throughout the process, including about the legal standards applicable to their review. In approvingthe continuance of the Advisory Contract for the Fund, the Board, including the Independent Board Members, considered various factors, including: (i) the expenses andperformance of the Fund; (ii) the nature, extent and quality of the services provided by BFA; (iii) the costs of services provided to the Fund and profits realized by BFA andits affiliates; (iv) potential economies of scale and the sharing of related benefits; (v) the fees and services provided for other comparable funds/accounts managed by BFAand its affiliates; and (vi) other benefits to BFA and/or its affiliates. The material factors, none of which was controlling, and conclusions that formed the basis for the Board,including the Independent Board Members, to approve the continuance of the Advisory Contract are discussed below.
Expenses and Performance of the Fund: The Board reviewed statistical information prepared by Broadridge Financial Solutions Inc. (“Broadridge”), an independentprovider of investment company data, regarding the expense ratio components, including gross and net total expenses, fees and expenses of another fund in which theFund invests (if applicable), and waivers/reimbursements (if applicable) of the Fund in comparison with the same information for other ETFs (including, where applicable,funds sponsored by an “at cost” service provider), objectively selected by Broadridge as comprising the Fund’s applicable peer group pursuant to Broadridge’s proprietaryETF methodology (the “Peer Group”). The Board was provided with a detailed description of the proprietary ETF methodology used by Broadridge to determine the Fund’sPeer Group. The Board noted that, due to the limitations in providing comparable funds in the Peer Group, the statistical information provided in Broadridge’s report mayor may not provide meaningful direct comparisons to the Fund in all instances. The Board also noted that overall fund expenses (net of waivers and reimbursements) forthe Fund were lower than the median of the overall fund expenses (net of waivers and reimbursements ) of the funds in its Peer Group, excluding iShares funds.
In addition, to the extent that any of the comparison funds included in the Peer Group, excluding iShares funds, track the same index as the Fund, Broadridge also provided,and the Board reviewed, a comparison of the Fund’s performance for the one-year, three-year, five-year, ten-year, and since inception periods, as applicable, and for thequarter ended December 31, 2019, to that of relevant comparison fund(s) for the same periods.
The Board noted that the Fund seeks to track its specified underlying index and that, during the year, the Board received periodic reports on the Fund’s short- andlonger-term performance in comparison with its underlying index. Such periodic comparative performance information, including additional detailed information asrequested by the Board, was also considered. The Board noted that the Fund generally performed in line with its underlying index over the relevant periods.
Based on this review, the other factors considered at the meeting, and their general knowledge of ETF pricing, the Board concluded that the investment advisory fee rateand expense level and the historical performance of the Fund supported the Board’s approval of the continuance of the Advisory Contract for the coming year.
Nature, Extent and Quality of Services Provided: Based on management’s representations, including information about recent and proposed enhancements to theiShares business, including with respect to capital markets support and analysis, technology, portfolio management, product design and quality, compliance and riskmanagement, global public policy and other services, the Board expected that there would be no diminution in the scope of services required of or provided by BFA underthe Advisory Contract for the coming year as compared with the scope of services provided by BFA during prior years. In reviewing the scope of these services, the Boardconsidered BFA’s investment philosophy and experience, noting that BFA and its affiliates have committed significant resources over time, including during the past year,to support the iShares funds and their shareholders and have made significant investments into the iShares business. The Board also considered BFA’s complianceprogram and its compliance record with respect to the Fund. In that regard, the Board noted that BFA reports to the Board about portfolio management and compliancematters on a periodic basis in connection with regularly scheduled meetings of the Board, and on other occasions as necessary and appropriate, and has providedinformation and made relevant officers and other employees of BFA (and its affiliates) available as needed to provide further assistance with these matters. The Board alsoreviewed the background and experience of the persons responsible for the day-to-day management of the Fund, as well as the resources available to them in managingthe Fund. In addition to the above considerations, the Board reviewed and considered detailed presentations regarding BFA’s investment performance, investment and riskmanagement processes and strategies, which were provided at the June 8-10, 2020 meeting and throughout the year.
Based on review of this information, and the performance information discussed above, the Board concluded that the nature, extent and quality of services provided to theFund under the Advisory Contract supported the Board’s approval of the continuance of the Advisory Contract for the coming year.
Costs of Services Provided to the Fund and Profits Realized by BFA and its Affiliates: The Board reviewed information about the estimated profitability to BlackRockin managing the Fund, based on the fees payable to BFA and its affiliates (including fees under the Advisory Contract), and other sources of revenue and expense to BFAand its affiliates from the Fund’s operations for the last calendar year. The Board reviewed BlackRock’s methodology for calculating estimated profitability of the iShares
Board Review and Approval of Investment Advisory Contract
88 2 0 2 0 I S H A R E S A N N U A L R E P O R T T O S H A R E H O L D E R S
funds, noting that the 15(c) Committee and the Board had focused on the methodology and profitability presentation. The Board recognized that profitability may be affectedby numerous factors including, among other things, fee waivers by BFA, the types of funds managed, expense allocations and business mix. The Board thus recognizedthat calculating and comparing profitability at individual fund levels is challenging. The Board discussed with management the sources of direct and ancillary revenue,including the revenues to BTC, a BlackRock affiliate, from securities lending by the Fund. The Board also discussed BFA’s estimated profit margin as reflected in the Fund’sprofitability analysis and reviewed information regarding potential economies of scale (as discussed below).
Based on this review, the Board concluded that the profits realized by BFA and its affiliates under the Advisory Contract and from other relationships between the Fund andBFA and/or its affiliates, if any, were within a reasonable range in light of the factors and other information considered.
Economies of Scale: The Board reviewed information and considered the extent to which economies of scale might be realized as the assets of the Fund increase, notingthat the issue of potential economies of scale had been focused on by the 15(c) Committee and the Board during their meetings and addressed by management. The 15(c)Committee and the Board received information regarding BlackRock’s historical estimated profitability, including BFA’s and its affiliates’ estimated costs in providingservices. The estimated cost information distinguished, among other things, between fixed and variable costs, and showed how the level and nature of fixed and variablecosts may impact the existence or size of scale benefits, with the Board recognizing that potential economies of scale are difficult to measure. The 15(c) Committee andthe Board reviewed information provided by BFA regarding the sharing of scale benefits with the iShares funds through various means, including, as applicable, throughrelatively low fee rates established at inception, breakpoints, waivers, or other fee reductions, as well as through additional investment in the iShares business and theprovision of improved or additional infrastructure and services to the iShares funds and their shareholders. The Board noted that the Advisory Contract for the Fund did notprovide for breakpoints in the Fund’s investment advisory fee rate as the assets of the Fund increase. However, the Board would continue to assess the appropriatenessof adding breakpoints in the future.
The Board concluded that this review of potential economies of scale and the sharing of related benefits, as well as the other factors considered at the meeting, supportedthe Board’s approval of the continuance of the Advisory Contract for the coming year.
Fees and Services Provided for Other Comparable Funds/Accounts Managed by BFA and its Affiliates: The Board considered information regarding the investmentadvisory/management fee rates for other funds/accounts in the U.S. for which BFA (or its affiliates) provides investment advisory/management services, including open-endfunds registered under the 1940 Act (including sub-advised funds), collective trust funds, and institutional separate accounts (collectively, the “Other Accounts”). The Boardacknowledged BFA’s representation that the iShares funds are fundamentally different investment vehicles from the Other Accounts. The Board noted that BFA and itsaffiliates do not manage Other Accounts with substantially the same investment objective and strategy as the Fund and that track the same index as the Fund. The Boardfurther noted that BFA provided the Board with detailed information regarding how the Other Accounts generally differ from the Fund, including in terms of the types ofservices and generally more extensive services provided to the Fund, as well as other significant differences. In that regard, the Board considered that the pricing of servicesto institutional clients is typically based on a number of factors beyond the nature and extent of the specific services to be provided and often depends on the overallrelationship between the client and its affiliates and the adviser and its affiliates. In addition, the Board considered the relative complexity and inherent risks and challengesof managing and providing other services to the Fund, as a publicly traded investment vehicle, as compared to the Other Accounts, particularly those that are institutionalclients, in light of differing regulatory requirements and client-imposed mandates. The Board also acknowledged management’s assertion that, for certain iShares funds,and for client segmentation purposes, BlackRock has launched an iShares fund that may provide a similar investment exposure at a lower investment advisory fee rate.The Board also considered the “all-inclusive” nature of the Fund’s advisory fee structure, and the Fund’s expenses borne by BFA under this arrangement. The Board notedthat the investment advisory fee rate under the Advisory Contract for the Fund was generally higher than the investment advisory/management fee rates for certain of theOther Accounts (particularly institutional clients) and concluded that the differences appeared to be consistent with the factors discussed.
Other Benefits to BFA and/or its Affiliates: The Board reviewed other benefits or ancillary revenue received by BFA and/or its affiliates in connection with the servicesprovided to the Fund by BFA, both direct and indirect, such as payment of revenue to BTC, the Fund’s securities lending agent, for loaning portfolio securities (which wasincluded in the profit margins reviewed by the Board pursuant to BFA’s estimated profitability methodology), payment of advisory fees or other fees to BFA (or its affiliates)in connection with any investments by the Fund in other funds for which BFA (or its affiliates) provides investment advisory services or other services and BlackRock’s profilein the investment community. The Board also noted the revenue received by BFA and/or its affiliates pursuant to an agreement that permits a service provider to use certainportions of BlackRock’s technology platform to service accounts managed by BFA and/or its affiliates, including the iShares funds. The Board noted that BFA generally doesnot use soft dollars or consider the value of research or other services that may be provided to BFA (including its affiliates) in selecting brokers for portfolio transactions forthe Fund. The Board further noted that any portfolio transactions on behalf of the Fund placed through a BFA affiliate or purchased from an underwriting syndicate in whicha BFA affiliate participates (including associated commissions) are reported to the Board pursuant to Rule 17e-1 or Rule 10f-3, as applicable, under the 1940 Act. The Boardconcluded that any such ancillary benefits would not be disadvantageous to the Fund and thus would not alter the Board’s conclusion with respect to the appropriatenessof approving the continuance of the Advisory Contract for the coming year.
Conclusion: Based on a review of the factors described above, as well as such other factors as deemed appropriate by the Board, the Board, including all of theIndependent Board Members, determined that the Fund’s investment advisory fee rate under the Advisory Contract does not constitute a fee that is so disproportionatelylarge as to bear no reasonable relationship to the services rendered and that could not have been the product of arm’s-length bargaining, and concluded to approve thecontinuance of the Advisory Contract for the coming year.
iShares ESG Advanced High Yield Corporate Bond ETF (the “Fund”)
Under Section 15(c) of the Investment Company Act of 1940 (the “1940 Act”), the Trust's Board of Trustees (the “Board”), including a majority of Board Members who arenot “interested persons” of the Trust (as that term is defined in the 1940Act) (the “Independent Board Members), is required annually to consider and approve the InvestmentAdvisory Contract between the Trust and BFA (the “Advisory Contract”) whereby the Board and its committees (composed solely of Independent Board Members) assessBlackRock’s services to the Fund, including investment management; fund accounting; administrative and shareholder services; oversight of the Fund’s service providers;
Board Review and Approval of Investment Advisory Contract (continued)
B O A R D R E V I E W A N D A P P R O V A L O F I N V E S T M E N T A D V I S O R Y C O N T R A C T 89
risk management and oversight; legal and compliance services; and ability to meet applicable legal and regulatory requirements. The Independent Board Membersrequested, and BFA provided, such information as the Independent Board Members, with advice from independent counsel, deemed reasonably necessary to evaluate theAdvisory Contract. At meetings on April 17, 2020 and May 19, 2020, a committee composed of all of the Independent Board Members (the “15(c) Committee”), withindependent counsel, met with management and reviewed and discussed information provided in response to initial requests of the 15(c) Committee and/or its independentcounsel, and requested certain additional information, which management agreed to provide. At a meeting held on June 8-10, 2020, the Board, including the IndependentBoard Members, reviewed the additional information provided by management in response to these requests.
After extensive discussions and deliberations, the Board, including all of the Independent Board Members, approved the continuance of the Advisory Contract for the Fund,based on a review of qualitative and quantitative information provided by BFA and their cumulative experience as Board Members. The Board noted its satisfaction with theextent and quality of information provided and its frequent interactions with management, as well as the detailed responses and other information provided by BFA. TheIndependent Board Members were advised by their independent counsel throughout the process, including about the legal standards applicable to their review. In approvingthe continuance of the Advisory Contract for the Fund, the Board, including the Independent Board Members, considered various factors, including: (i) the expenses andperformance of the Fund; (ii) the nature, extent and quality of the services provided by BFA; (iii) the costs of services provided to the Fund and profits realized by BFA andits affiliates; (iv) potential economies of scale and the sharing of related benefits; (v) the fees and services provided for other comparable funds/accounts managed by BFAand its affiliates; and (vi) other benefits to BFA and/or its affiliates. The material factors, none of which was controlling, and conclusions that formed the basis for the Board,including the Independent Board Members, to approve the continuance of the Advisory Contract are discussed below.
Expenses and Performance of the Fund: The Board reviewed statistical information prepared by Broadridge Financial Solutions Inc. (“Broadridge”), an independentprovider of investment company data, regarding the expense ratio components, including gross and net total expenses, fees and expenses of another fund in which theFund invests (if applicable), and waivers/reimbursements (if applicable) of the Fund in comparison with the same information for other ETFs (including, where applicable,funds sponsored by an “at cost” service provider), objectively selected by Broadridge as comprising the Fund’s applicable peer group pursuant to Broadridge’s proprietaryETF methodology (the “Peer Group”). The Board was provided with a detailed description of the proprietary ETF methodology used by Broadridge to determine the Fund’sPeer Group. The Board noted that, due to the limitations in providing comparable funds in the Peer Group, the statistical information provided in Broadridge’s report mayor may not provide meaningful direct comparisons to the Fund in all instances. The Board also noted that the overall fund expenses (net of waivers and reimbursements)for the Fund were within range of the median of the overall fund expenses (net of waivers and reimbursements ) of the funds in its Peer Group, excluding iShares funds.
In addition, to the extent that any of the comparison funds included in the Peer Group, excluding iShares funds, track the same index as the Fund, Broadridge also provided,and the Board reviewed, a comparison of the Fund’s performance for the one-year, three-year, five-year, ten-year, and since inception periods, as applicable, and for thequarter ended December 31, 2019, to that of relevant comparison fund(s) for the same periods.
The Board noted that the Fund seeks to track its specified underlying index and that, during the year, the Board received periodic reports on the Fund’s short- andlonger-term performance in comparison with its underlying index. Such periodic comparative performance information, including additional detailed information asrequested by the Board, was also considered. The Board noted that the Fund generally performed in line with its underlying index over the relevant periods.
Based on this review, the other factors considered at the meeting, and their general knowledge of ETF pricing, the Board concluded that the investment advisory fee rateand expense level and the historical performance of the Fund supported the Board’s approval of the continuance of the Advisory Contract for the coming year.
Nature, Extent and Quality of Services Provided: Based on management’s representations, including information about recent and proposed enhancements to theiShares business, including with respect to capital markets support and analysis, technology, portfolio management, product design and quality, compliance and riskmanagement, global public policy and other services, the Board expected that there would be no diminution in the scope of services required of or provided by BFA underthe Advisory Contract for the coming year as compared with the scope of services provided by BFA during prior years. In reviewing the scope of these services, the Boardconsidered BFA’s investment philosophy and experience, noting that BFA and its affiliates have committed significant resources over time, including during the past year,to support the iShares funds and their shareholders and have made significant investments into the iShares business. The Board also considered BFA’s complianceprogram and its compliance record with respect to the Fund. In that regard, the Board noted that BFA reports to the Board about portfolio management and compliancematters on a periodic basis in connection with regularly scheduled meetings of the Board, and on other occasions as necessary and appropriate, and has providedinformation and made relevant officers and other employees of BFA (and its affiliates) available as needed to provide further assistance with these matters. The Board alsoreviewed the background and experience of the persons responsible for the day-to-day management of the Fund, as well as the resources available to them in managingthe Fund. In addition to the above considerations, the Board reviewed and considered detailed presentations regarding BFA’s investment performance, investment and riskmanagement processes and strategies, which were provided at the June 8-10, 2020 meeting and throughout the year.
Based on review of this information, and the performance information discussed above, the Board concluded that the nature, extent and quality of services provided to theFund under the Advisory Contract supported the Board’s approval of the continuance of the Advisory Contract for the coming year.
Costs of Services Provided to the Fund and Profits Realized by BFA and its Affiliates: The Board reviewed information about the estimated profitability to BlackRockin managing the Fund, based on the fees payable to BFA and its affiliates (including fees under the Advisory Contract), and other sources of revenue and expense to BFAand its affiliates from the Fund’s operations for the last calendar year. The Board reviewed BlackRock’s methodology for calculating estimated profitability of the iSharesfunds, noting that the 15(c) Committee and the Board had focused on the methodology and profitability presentation. The Board recognized that profitability may be affectedby numerous factors, including, among other things, fee waivers by BFA, the types of funds managed, expense allocations and business mix. The Board thus recognizedthat calculating and comparing profitability at individual fund levels is challenging. The Board discussed with management the sources of direct and ancillary revenue,
Board Review and Approval of Investment Advisory Contract (continued)
90 2 0 2 0 I S H A R E S A N N U A L R E P O R T T O S H A R E H O L D E R S
including the revenues to BTC, a BlackRock affiliate, from securities lending by the Fund. The Board also discussed BFA’s estimated profit margin as reflected in the Fund’sprofitability analysis and reviewed information regarding potential economies of scale (as discussed below).
Based on this review, the Board concluded that the profits realized by BFA and its affiliates under the Advisory Contract and from other relationships between the Fund andBFA and/or its affiliates, if any, were within a reasonable range in light of the factors and other information considered.
Economies of Scale: The Board reviewed information and considered the extent to which economies of scale might be realized as the assets of the Fund increase, notingthat the issue of potential economies of scale had been focused on by the 15(c) Committee and the Board during their meetings and addressed by management. The 15(c)Committee and the Board received information regarding BlackRock’s historical estimated profitability, including BFA’s and its affiliates’ estimated costs in providingservices. The estimated cost information distinguished, among other things, between fixed and variable costs, and showed how the level and nature of fixed and variablecosts may impact the existence or size of scale benefits, with the Board recognizing that potential economies of scale are difficult to measure. The 15(c) Committee andthe Board reviewed information provided by BFA regarding the sharing of scale benefits with the iShares funds through various means, including, as applicable, throughrelatively low fee rates established at inception, breakpoints, waivers, or other fee reductions, as well as through additional investment in the iShares business and theprovision of improved or additional infrastructure and services to the iShares funds and their shareholders. The Board noted that the Advisory Contract for the Fund did notprovide for breakpoints in the Fund’s investment advisory fee rate as the assets of the Fund increase. However, the Board would continue to assess the appropriatenessof adding breakpoints in the future.
The Board concluded that this review of potential economies of scale and the sharing of related benefits, as well as the other factors considered at the meeting, supportedthe Board’s approval of the continuance of the Advisory Contract for the coming year.
Fees and Services Provided for Other Comparable Funds/Accounts Managed by BFA and its Affiliates: The Board considered information regarding the investmentadvisory/management fee rates for other funds/accounts in the U.S. for which BFA (or its affiliates) provides investment advisory/management services, including open-endfunds registered under the 1940 Act (including sub-advised funds), collective trust funds, and institutional separate accounts (collectively, the “Other Accounts”). The Boardacknowledged BFA’s representation that the iShares funds are fundamentally different investment vehicles from the Other Accounts. The Board noted that BFA and itsaffiliates do not manage Other Accounts with substantially the same investment objective and strategy as the Fund and that track the same index as the Fund. The Boardfurther noted that BFA provided the Board with detailed information regarding how the Other Accounts generally differ from the Fund, including in terms of the types ofservices and generally more extensive services provided to the Fund, as well as other significant differences. In that regard, the Board considered that the pricing of servicesto institutional clients is typically based on a number of factors beyond the nature and extent of the specific services to be provided and often depends on the overallrelationship between the client and its affiliates and the adviser and its affiliates. In addition, the Board considered the relative complexity and inherent risks and challengesof managing and providing other services to the Fund, as a publicly traded investment vehicle, as compared to the Other Accounts, particularly those that are institutionalclients, in light of differing regulatory requirements and client-imposed mandates. The Board also acknowledged management’s assertion that, for certain iShares funds,and for client segmentation purposes, BlackRock has launched an iShares fund that may provide a similar investment exposure at a lower investment advisory fee rate.The Board also considered the “all-inclusive” nature of the Fund’s advisory fee structure, and the Fund’s expenses borne by BFA under this arrangement. The Board notedthat the investment advisory fee rate under the Advisory Contract for the Fund was generally higher than the investment advisory/management fee rates for certain of theOther Accounts (particularly institutional clients) and concluded that the differences appeared to be consistent with the factors discussed.
Other Benefits to BFA and/or its Affiliates: The Board reviewed other benefits or ancillary revenue received by BFA and/or its affiliates in connection with the servicesprovided to the Fund by BFA, both direct and indirect, such as payment of revenue to BTC, the Fund’s securities lending agent, for loaning portfolio securities (which wasincluded in the profit margins reviewed by the Board pursuant to BFA’s estimated profitability methodology), payment of advisory fees or other fees to BFA (or its affiliates)in connection with any investments by the Fund in other funds for which BFA (or its affiliates) provides investment advisory services or other services and BlackRock’s profilein the investment community. The Board also noted the revenue received by BFA and/or its affiliates pursuant to an agreement that permits a service provider to use certainportions of BlackRock’s technology platform to service accounts managed by BFA and/or its affiliates, including the iShares funds. The Board noted that BFA generally doesnot use soft dollars or consider the value of research or other services that may be provided to BFA (including its affiliates) in selecting brokers for portfolio transactions forthe Fund. The Board further noted that any portfolio transactions on behalf of the Fund placed through a BFA affiliate or purchased from an underwriting syndicate in whicha BFA affiliate participates (including associated commissions) are reported to the Board pursuant to Rule 17e-1 or Rule 10f-3, as applicable, under the 1940 Act. The Boardconcluded that any such ancillary benefits would not be disadvantageous to the Fund and thus would not alter the Board’s conclusion with respect to the appropriatenessof approving the continuance of the Advisory Contract for the coming year.
Conclusion: Based on a review of the factors described above, as well as such other factors as deemed appropriate by the Board, the Board, including all of theIndependent Board Members, determined that the Fund’s investment advisory fee rate under the Advisory Contract does not constitute a fee that is so disproportionatelylarge as to bear no reasonable relationship to the services rendered and that could not have been the product of arm’s-length bargaining, and concluded to approve thecontinuance of the Advisory Contract for the coming year.
Board Review and Approval of Investment Advisory Contract (continued)
B O A R D R E V I E W A N D A P P R O V A L O F I N V E S T M E N T A D V I S O R Y C O N T R A C T 91
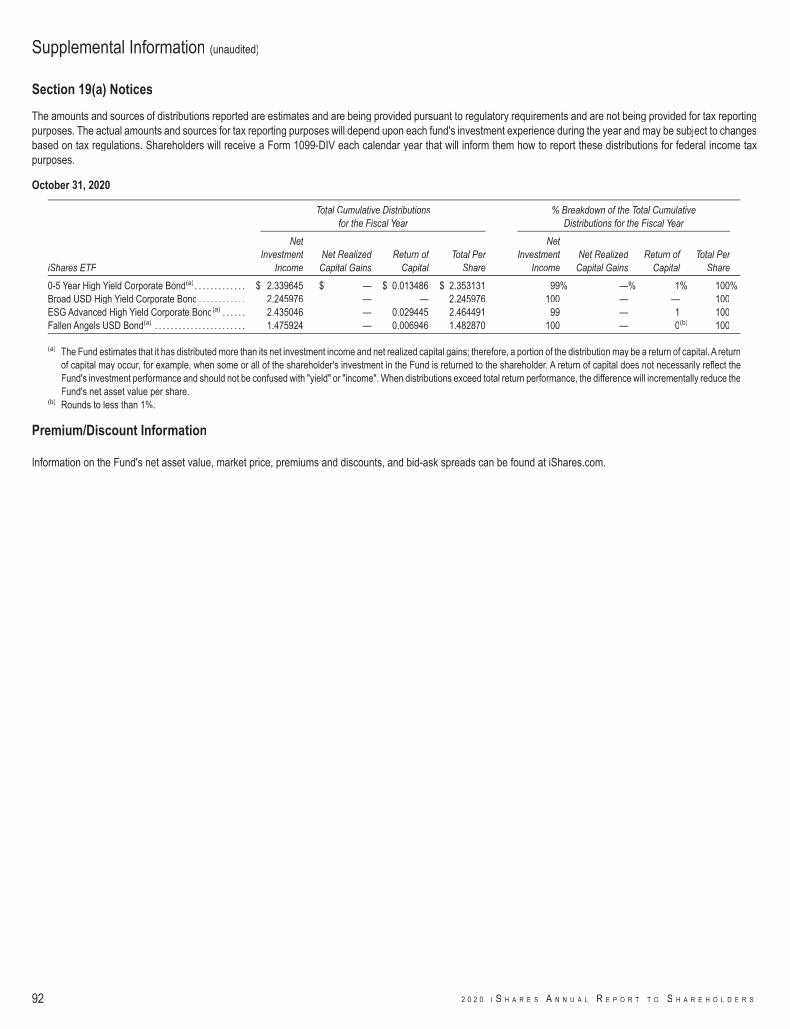
Section 19(a) Notices
The amounts and sources of distributions reported are estimates and are being provided pursuant to regulatory requirements and are not being provided for tax reportingpurposes. The actual amounts and sources for tax reporting purposes will depend upon each fund's investment experience during the year and may be subject to changesbased on tax regulations. Shareholders will receive a Form 1099-DIV each calendar year that will inform them how to report these distributions for federal income taxpurposes.
October 31, 2020
Total Cumulative Distributionsfor the Fiscal Year
% Breakdown of the Total CumulativeDistributions for the Fiscal Year
iShares ETF
NetInvestment
IncomeNet Realized
Capital GainsReturn of
CapitalTotal Per
Share
NetInvestment
IncomeNet Realized
Capital GainsReturn of
CapitalTotal Per
Share
0-5 Year High Yield Corporate Bond(a) . . . . . . . . . . . . . $ 2.339645 $ — $ 0.013486 $ 2.353131 99% —% 1% 100%Broad USD High Yield Corporate Bond . . . . . . . . . . . . 2.245976 — — 2.245976 100 — — 100ESG Advanced High Yield Corporate Bond(a) . . . . . . 2.435046 — 0.029445 2.464491 99 — 1 100Fallen Angels USD Bond(a) . . . . . . . . . . . . . . . . . . . . . . . 1.475924 — 0.006946 1.482870 100 — 0(b) 100
(a) The Fund estimates that it has distributed more than its net investment income and net realized capital gains; therefore, a portion of the distribution may be a return of capital. A returnof capital may occur, for example, when some or all of the shareholder's investment in the Fund is returned to the shareholder. A return of capital does not necessarily reflect theFund's investment performance and should not be confused with "yield" or "income". When distributions exceed total return performance, the difference will incrementally reduce theFund's net asset value per share.
(b) Rounds to less than 1%.
Premium/Discount Information
Information on the Fund's net asset value, market price, premiums and discounts, and bid-ask spreads can be found at iShares.com.
Supplemental Information (unaudited)
92 2 0 2 0 I S H A R E S A N N U A L R E P O R T T O S H A R E H O L D E R S
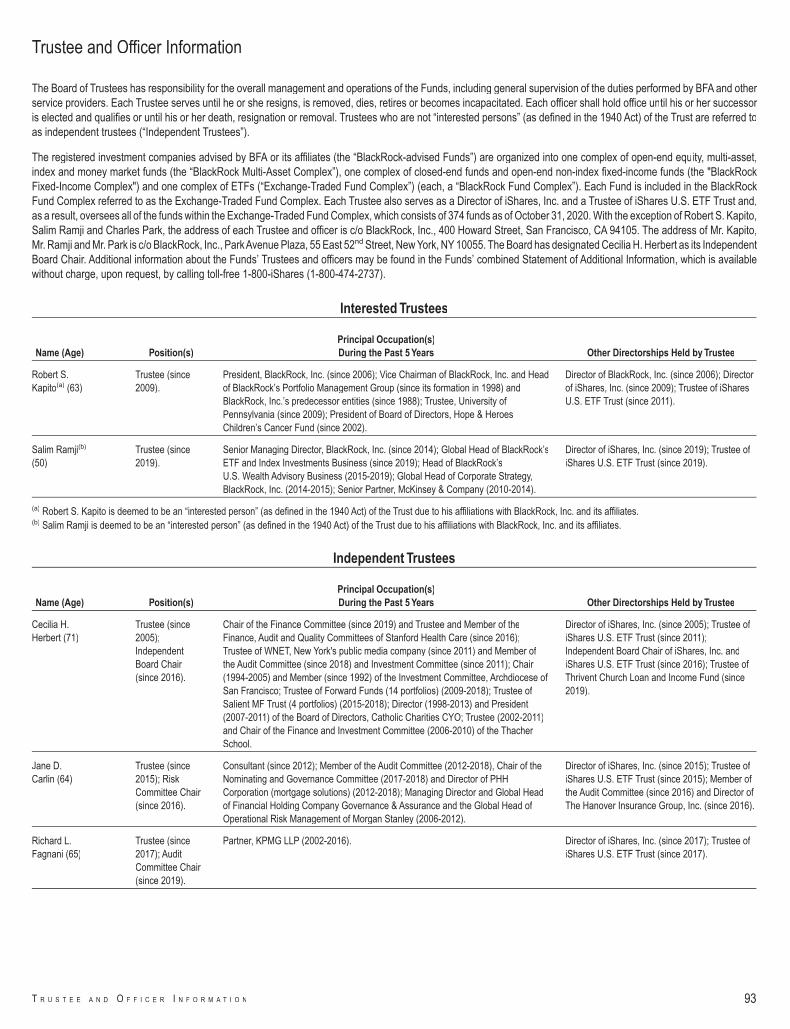
The Board of Trustees has responsibility for the overall management and operations of the Funds, including general supervision of the duties performed by BFA and otherservice providers. Each Trustee serves until he or she resigns, is removed, dies, retires or becomes incapacitated. Each officer shall hold office until his or her successoris elected and qualifies or until his or her death, resignation or removal. Trustees who are not “interested persons” (as defined in the 1940 Act) of the Trust are referred toas independent trustees (“Independent Trustees”).
The registered investment companies advised by BFA or its affiliates (the “BlackRock-advised Funds”) are organized into one complex of open-end equity, multi-asset,index and money market funds (the “BlackRock Multi-Asset Complex”), one complex of closed-end funds and open-end non-index fixed-income funds (the "BlackRockFixed-Income Complex") and one complex of ETFs (“Exchange-Traded Fund Complex”) (each, a “BlackRock Fund Complex”). Each Fund is included in the BlackRockFund Complex referred to as the Exchange-Traded Fund Complex. Each Trustee also serves as a Director of iShares, Inc. and a Trustee of iShares U.S. ETF Trust and,as a result, oversees all of the funds within the Exchange-Traded Fund Complex, which consists of 374 funds as of October 31, 2020. With the exception of Robert S. Kapito,Salim Ramji and Charles Park, the address of each Trustee and officer is c/o BlackRock, Inc., 400 Howard Street, San Francisco, CA 94105. The address of Mr. Kapito,Mr. Ramji and Mr. Park is c/o BlackRock, Inc., ParkAvenue Plaza, 55 East 52nd Street, New York, NY 10055. The Board has designated Cecilia H. Herbert as its IndependentBoard Chair. Additional information about the Funds’ Trustees and officers may be found in the Funds’ combined Statement of Additional Information, which is availablewithout charge, upon request, by calling toll-free 1-800-iShares (1-800-474-2737).
Interested Trustees
Name (Age) Position(s)Principal Occupation(s)During the Past 5 Years Other Directorships Held by Trustee
Robert S.Kapito(a) (63)
Trustee (since2009).
President, BlackRock, Inc. (since 2006); Vice Chairman of BlackRock, Inc. and Headof BlackRock’s Portfolio Management Group (since its formation in 1998) andBlackRock, Inc.’s predecessor entities (since 1988); Trustee, University ofPennsylvania (since 2009); President of Board of Directors, Hope & HeroesChildren’s Cancer Fund (since 2002).
Director of BlackRock, Inc. (since 2006); Directorof iShares, Inc. (since 2009); Trustee of iSharesU.S. ETF Trust (since 2011).
Salim Ramji(b)
(50)Trustee (since2019).
Senior Managing Director, BlackRock, Inc. (since 2014); Global Head of BlackRock’sETF and Index Investments Business (since 2019); Head of BlackRock’sU.S. Wealth Advisory Business (2015-2019); Global Head of Corporate Strategy,BlackRock, Inc. (2014-2015); Senior Partner, McKinsey & Company (2010-2014).
Director of iShares, Inc. (since 2019); Trustee ofiShares U.S. ETF Trust (since 2019).
(a) Robert S. Kapito is deemed to be an “interested person” (as defined in the 1940 Act) of the Trust due to his affiliations with BlackRock, Inc. and its affiliates.(b) Salim Ramji is deemed to be an “interested person” (as defined in the 1940 Act) of the Trust due to his affiliations with BlackRock, Inc. and its affiliates.
Independent Trustees
Name (Age) Position(s)Principal Occupation(s)During the Past 5 Years Other Directorships Held by Trustee
Cecilia H.Herbert (71)
Trustee (since2005);IndependentBoard Chair(since 2016).
Chair of the Finance Committee (since 2019) and Trustee and Member of theFinance, Audit and Quality Committees of Stanford Health Care (since 2016);Trustee of WNET, New York's public media company (since 2011) and Member ofthe Audit Committee (since 2018) and Investment Committee (since 2011); Chair(1994-2005) and Member (since 1992) of the Investment Committee, Archdiocese ofSan Francisco; Trustee of Forward Funds (14 portfolios) (2009-2018); Trustee ofSalient MF Trust (4 portfolios) (2015-2018); Director (1998-2013) and President(2007-2011) of the Board of Directors, Catholic Charities CYO; Trustee (2002-2011)and Chair of the Finance and Investment Committee (2006-2010) of the ThacherSchool.
Director of iShares, Inc. (since 2005); Trustee ofiShares U.S. ETF Trust (since 2011);Independent Board Chair of iShares, Inc. andiShares U.S. ETF Trust (since 2016); Trustee ofThrivent Church Loan and Income Fund (since2019).
Jane D.Carlin (64)
Trustee (since2015); RiskCommittee Chair(since 2016).
Consultant (since 2012); Member of the Audit Committee (2012-2018), Chair of theNominating and Governance Committee (2017-2018) and Director of PHHCorporation (mortgage solutions) (2012-2018); Managing Director and Global Headof Financial Holding Company Governance & Assurance and the Global Head ofOperational Risk Management of Morgan Stanley (2006-2012).
Director of iShares, Inc. (since 2015); Trustee ofiShares U.S. ETF Trust (since 2015); Member ofthe Audit Committee (since 2016) and Director ofThe Hanover Insurance Group, Inc. (since 2016).
Richard L.Fagnani (65)
Trustee (since2017); AuditCommittee Chair(since 2019).
Partner, KPMG LLP (2002-2016). Director of iShares, Inc. (since 2017); Trustee ofiShares U.S. ETF Trust (since 2017).
Trustee and Officer Information
T R U S T E E A N D O F F I C E R I N F O R M A T I O N 93
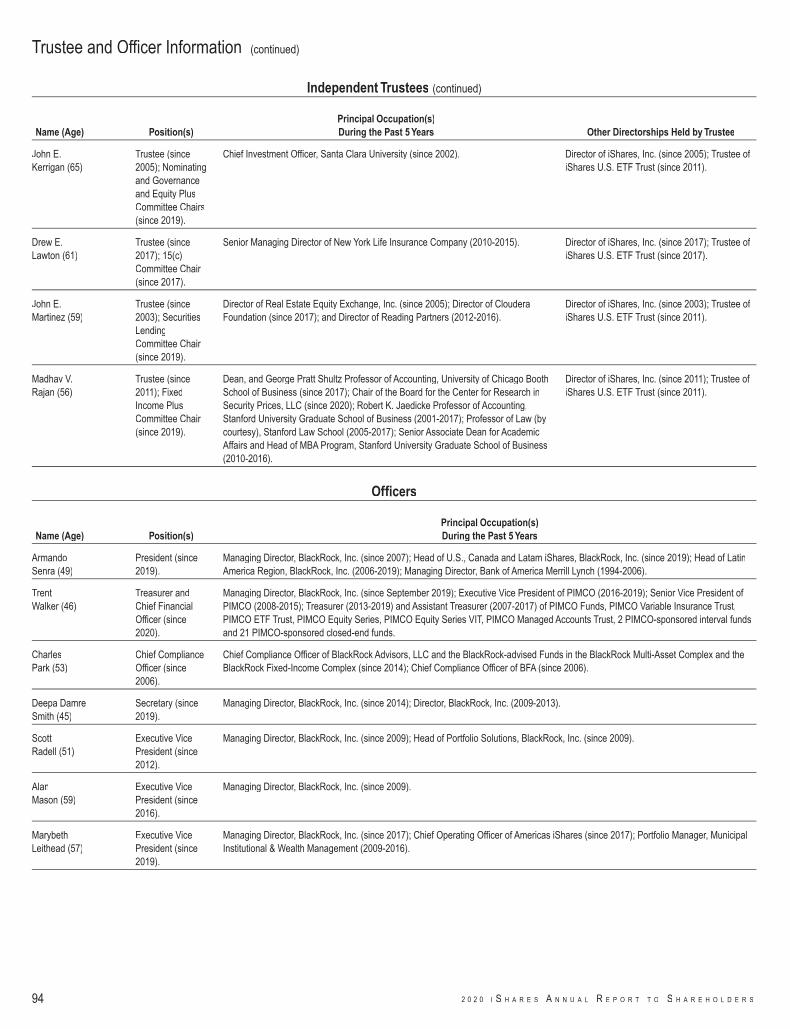
Independent Trustees (continued)
Name (Age) Position(s)Principal Occupation(s)During the Past 5 Years Other Directorships Held by Trustee
John E.Kerrigan (65)
Trustee (since2005); Nominatingand Governanceand Equity PlusCommittee Chairs(since 2019).
Chief Investment Officer, Santa Clara University (since 2002). Director of iShares, Inc. (since 2005); Trustee ofiShares U.S. ETF Trust (since 2011).
Drew E.Lawton (61)
Trustee (since2017); 15(c)Committee Chair(since 2017).
Senior Managing Director of New York Life Insurance Company (2010-2015). Director of iShares, Inc. (since 2017); Trustee ofiShares U.S. ETF Trust (since 2017).
John E.Martinez (59)
Trustee (since2003); SecuritiesLendingCommittee Chair(since 2019).
Director of Real Estate Equity Exchange, Inc. (since 2005); Director of ClouderaFoundation (since 2017); and Director of Reading Partners (2012-2016).
Director of iShares, Inc. (since 2003); Trustee ofiShares U.S. ETF Trust (since 2011).
Madhav V.Rajan (56)
Trustee (since2011); FixedIncome PlusCommittee Chair(since 2019).
Dean, and George Pratt Shultz Professor of Accounting, University of Chicago BoothSchool of Business (since 2017); Chair of the Board for the Center for Research inSecurity Prices, LLC (since 2020); Robert K. Jaedicke Professor of Accounting,Stanford University Graduate School of Business (2001-2017); Professor of Law (bycourtesy), Stanford Law School (2005-2017); Senior Associate Dean for AcademicAffairs and Head of MBA Program, Stanford University Graduate School of Business(2010-2016).
Director of iShares, Inc. (since 2011); Trustee ofiShares U.S. ETF Trust (since 2011).
Officers
Name (Age) Position(s)Principal Occupation(s)During the Past 5 Years
ArmandoSenra (49)
President (since2019).
Managing Director, BlackRock, Inc. (since 2007); Head of U.S., Canada and Latam iShares, BlackRock, Inc. (since 2019); Head of LatinAmerica Region, BlackRock, Inc. (2006-2019); Managing Director, Bank of America Merrill Lynch (1994-2006).
TrentWalker (46)
Treasurer andChief FinancialOfficer (since2020).
Managing Director, BlackRock, Inc. (since September 2019); Executive Vice President of PIMCO (2016-2019); Senior Vice President ofPIMCO (2008-2015); Treasurer (2013-2019) and Assistant Treasurer (2007-2017) of PIMCO Funds, PIMCO Variable Insurance Trust,PIMCO ETF Trust, PIMCO Equity Series, PIMCO Equity Series VIT, PIMCO Managed Accounts Trust, 2 PIMCO-sponsored interval fundsand 21 PIMCO-sponsored closed-end funds.
CharlesPark (53)
Chief ComplianceOfficer (since2006).
Chief Compliance Officer of BlackRock Advisors, LLC and the BlackRock-advised Funds in the BlackRock Multi-Asset Complex and theBlackRock Fixed-Income Complex (since 2014); Chief Compliance Officer of BFA (since 2006).
Deepa DamreSmith (45)
Secretary (since2019).
Managing Director, BlackRock, Inc. (since 2014); Director, BlackRock, Inc. (2009-2013).
ScottRadell (51)
Executive VicePresident (since2012).
Managing Director, BlackRock, Inc. (since 2009); Head of Portfolio Solutions, BlackRock, Inc. (since 2009).
AlanMason (59)
Executive VicePresident (since2016).
Managing Director, BlackRock, Inc. (since 2009).
MarybethLeithead (57)
Executive VicePresident (since2019).
Managing Director, BlackRock, Inc. (since 2017); Chief Operating Officer of Americas iShares (since 2017); Portfolio Manager, MunicipalInstitutional & Wealth Management (2009-2016).
Trustee and Officer Information (continued)
94 2 0 2 0 I S H A R E S A N N U A L R E P O R T T O S H A R E H O L D E R S
Electronic Delivery
Shareholders can sign up for email notifications announcing that the shareholder report or prospectus has been posted on the iShares website at iShares.com. Once youhave enrolled, you will no longer receive prospectuses and shareholder reports in the mail.
To enroll in electronic delivery:
• Go to icsdelivery.com.• If your brokerage firm is not listed, electronic delivery may not be available. Please contact your broker-dealer or financial advisor.
Householding
Householding is an option available to certain fund investors. Householding is a method of delivery, based on the preference of the individual investor, in which a single copyof certain shareholder documents can be delivered to investors who share the same address, even if their accounts are registered under different names. Please contactyour broker-dealer if you are interested in enrolling in householding and receiving a single copy of prospectuses and other shareholder documents, or if you are currentlyenrolled in householding and wish to change your householding status.
Availability of Quarterly Schedule of Investments
The iShares Funds file their complete schedule of portfolio holdings with the SEC for the first and third quarters of each fiscal year as an exhibit to its reports on FormN-PORT. The iShares Funds' Forms N-PORT are available on the SEC’s website at sec.gov. The iShares Funds also disclose their complete schedule of portfolio holdingson a daily basis on the iShares website at iShares.com.
Availability of Proxy Voting Policies and Proxy Voting Records
A description of the policies and procedures that the iShares Funds use to determine how to vote proxies relating to portfolio securities and information about how theiShares Funds voted proxies relating to portfolio securities during the most recent twelve-month period ending June 30 is available without charge, upon request (1) bycalling toll-free 1-800-474-2737; (2) on the iShares website at iShares.com; and (3) on the SEC website at sec.gov.
A description of the Company's policies and procedures with respect to the disclosure of the Fund's portfolio securities is available in the Fund Prospectus. The Funddiscloses its portfolio holdings daily and provides information regarding its top holdings in Fund fact sheets at iShares.com.
General Information
G E N E R A L I N F O R M A T I O N 95
Portfolio Abbreviations - Fixed Income
PIK Payment-in-kind
Glossary of Terms Used in this Report
96 2 0 2 0 I S H A R E S A N N U A L R E P O R T T O S H A R E H O L D E R S

THIS PAGE INTENTIONALLY LEFT BLANK.

THIS PAGE INTENTIONALLY LEFT BLANK.

THIS PAGE INTENTIONALLY LEFT BLANK.
Want to know more?iShares.com | 1-800-474-2737
This report is intended for the Funds' shareholders. It may not be distributed to prospective investors unless it is
preceded or accompanied by the current prospectus.
Investing involves risk, including possible loss of principal.
The iShares Funds are distributed by BlackRock Investments, LLC (together with its affiliates, “BlackRock”).
The iShares Funds are not sponsored, endorsed, issued, sold or promoted by Bloomberg Index Services Limited, ICE Data
Indices, LLC, or Markit Indices Limited, nor do these companies make any representation regarding the advisability of
investing in the iShares Funds. BlackRock is not affiliated with the companies listed above.
©2020 BlackRock, Inc. All rights reserved. iSHARES and BLACKROCK are registered trademarks of BlackRock, Inc. or its
subsidiaries. All other marks are the property of their respective owners.
iS-AR-1020-1020