ishares trust - blackrock · ishares® trust statement of additional information dated august 1,...
TRANSCRIPT

iShares® TrustStatement of Additional InformationDated August 1, 2018(as revised February 1, 2019)
This combined Statement of Additional Information (“SAI”) is not a prospectus. It should be read in conjunction with thecurrent prospectuses (each, a “Prospectus” and collectively, the “Prospectuses”) for the following series of iShares Trust (the“Trust”):
Fund Ticker Listing Exchange
iShares Core S&P 500 ETF IVV NYSE ArcaiShares Core S&P Mid-Cap ETF IJH NYSE ArcaiShares Core S&P Small-Cap ETF IJR NYSE ArcaiShares Core S&P Total U.S. Stock Market ETF ITOT NYSE ArcaiShares Core S&P U.S. Growth ETF IUSG NASDAQiShares Core S&P U.S. Value ETF IUSV NASDAQiShares Europe ETF IEV NYSE ArcaiShares Expanded Tech Sector ETF IGM NYSE ArcaiShares Expanded Tech-Software Sector ETF IGV Cboe BZXiShares Global 100 ETF IOO NYSE ArcaiShares Global Clean Energy ETF ICLN NASDAQiShares Global Comm Services ETF IXP NYSE ArcaiShares Global Consumer Discretionary ETF RXI NYSE ArcaiShares Global Consumer Staples ETF KXI NYSE ArcaiShares Global Energy ETF IXC NYSE ArcaiShares Global Financials ETF IXG NYSE ArcaiShares Global Industrials ETF EXI NYSE ArcaiShares Global Infrastructure ETF IGF NASDAQiShares Global Utilities ETF JXI NYSE ArcaiShares International Developed Property ETF WPS NYSE ArcaiShares International Preferred Stock ETF IPFF Cboe BZXiShares JPX-Nikkei 400 ETF JPXN NYSE ArcaiShares Micro-Cap ETF IWC NYSE ArcaiShares Mortgage Real Estate ETF REM Cboe BZXiShares Nasdaq Biotechnology ETF IBB NASDAQiShares North American Natural Resources ETF IGE Cboe BZXiShares North American Tech-Multimedia Networking ETF IGN NYSE ArcaiShares PHLX Semiconductor ETF SOXX NASDAQiShares Preferred and Income Securities ETF PFF NASDAQiShares Residential Real Estate ETF REZ NYSE ArcaiShares Russell 1000 ETF IWB NYSE ArcaiShares Russell 1000 Growth ETF IWF NYSE ArcaiShares Russell 1000 Pure U.S. Revenue ETF AMCA NASDAQiShares Russell 1000 Value ETF IWD NYSE ArcaiShares Russell 2000 ETF IWM NYSE ArcaiShares Russell 2000 Growth ETF IWO NYSE ArcaiShares Russell 2000 Value ETF IWN NYSE ArcaiShares Russell 3000 ETF IWV NYSE ArcaiShares Russell Mid-Cap ETF IWR NYSE ArcaiShares Russell Mid-Cap Growth ETF IWP NYSE ArcaiShares Russell Mid-Cap Value ETF IWS NYSE ArcaiShares Russell Top 200 ETF IWL NYSE Arca

Fund Ticker Listing Exchange
iShares Russell Top 200 Growth ETF IWY NYSE ArcaiShares Russell Top 200 Value ETF IWX NYSE ArcaiShares S&P 100 ETF OEF NYSE ArcaiShares S&P 500 Growth ETF IVW NYSE ArcaiShares S&P 500 Value ETF IVE NYSE ArcaiShares S&P Mid-Cap 400 Growth ETF IJK NYSE ArcaiShares S&P Mid-Cap 400 Value ETF IJJ NYSE ArcaiShares S&P Small-Cap 600 Growth ETF IJT NASDAQiShares S&P Small-Cap 600 Value ETF IJS NYSE ArcaiShares U.S. Aerospace & Defense ETF ITA Cboe BZXiShares U.S. Broker-Dealers & Securities Exchanges ETF IAI NYSE ArcaiShares U.S. Healthcare Providers ETF IHF NYSE ArcaiShares U.S. Home Construction ETF ITB Cboe BZXiShares U.S. Infrastructure ETF IFRA Cboe BZXiShares U.S. Insurance ETF IAK NYSE ArcaiShares U.S. Medical Devices ETF IHI NYSE ArcaiShares U.S. Oil & Gas Exploration & Production ETF IEO Cboe BZXiShares U.S. Oil Equipment & Services ETF IEZ NYSE ArcaiShares U.S. Pharmaceuticals ETF IHE NYSE ArcaiShares U.S. Real Estate ETF IYR NYSE ArcaiShares U.S. Regional Banks ETF IAT NYSE ArcaiShares U.S. Telecommunications ETF IYZ Cboe BZX
The Prospectuses for the above-listed funds (each, a “Fund” and collectively, the “Funds”) are dated August 1, 2018, asamended and supplemented from time to time. Capitalized terms used herein that are not defined have the same meaning asin the applicable Prospectus, unless otherwise noted. The Financial Statements and Notes contained in the applicable AnnualReport and Semi-Annual Report of the Trust for the Funds are incorporated by reference into and are deemed to be part ofthis SAI. A copy of each Fund’s Prospectus, Annual Report and Semi-Annual Report may be obtained without charge bywriting to the Trust’s distributor, BlackRock Investments, LLC (the “Distributor” or “BRIL”), 1 University Square Drive,Princeton, NJ 08540, calling 1-800-iShares (1-800-474-2737) or visiting www.iShares.com. Each Fund’s Prospectus isincorporated by reference into this SAI.
References to the Investment Company Act of 1940, as amended (the “Investment Company Act” or the “1940 Act”), orother applicable law, will include any rules promulgated thereunder and any guidance, interpretations or modifications by theSecurities and Exchange Commission (the “SEC”), SEC staff or other authority with appropriate jurisdiction, including courtinterpretations, and exemptive, no action or other relief or permission from the SEC, SEC staff or other authority.
iShares® and BlackRock® are registered trademarks of BlackRock Fund Advisors and its affiliates.

TABLE OF CONTENTS
Page
General Description of the Trust and its Funds 1
Exchange Listing and Trading 3
Investment Strategies and Risks 4
Borrowing 4
Currency Transactions 4
Diversification Status 5
Futures, Options on Futures and Securities Options 6
Illiquid Securities 8
Lending Portfolio Securities 8
Non-U.S. Securities 8
Regulation Regarding Derivatives 9
Repurchase Agreements 10
Reverse Repurchase Agreements 10
Securities of Investment Companies 10
Short-Term Instruments and Temporary Investments 11
Swap Agreements 11
Tracking Stocks 11
Future Developments 11
General Considerations and Risks 11
Borrowing Risk 12
Custody Risk 12
Dividend Risk 12
Liquidity Risk Management Rule Risk 12
National Closed Market Trading Risk 12
Operational Risk 12
Risk of Derivatives 12
Risk of Equity Securities 13
Risk of Futures and Options on Futures Transactions 13
Risk of Investing in Non-U.S. Equity Securities 14
Risk of Investing in Large-Capitalization Companies 14
Risk of Investing in Micro-Capitalization Companies 15
Risk of Investing in Mid-Capitalization Companies 15
Risk of Investing in Small-Capitalization Companies 15
Risk of Non-U.S. Preferred Stock 15
Risk of Swap Agreements 15
Risk of Investing in Asia 16
i

Page
Risk of Investing in Australasia 16
Risk of Investing in Canada 16
Risk of Investing in Central and South America 17
Risk of Investing in China 17
Risk of Investing in the Chinese Equity Markets 18
Risk of Investing in Denmark 18
Risk of Investing in Developed Countries 18
Risk of Investing in Emerging Markets 19
Risk of Investing in Europe 20
Risk of Investing in Japan 21
Risk of Investing in the Middle East 22
Risk of Investing in North America 23
U.S. Economic Trading Partners Risk 23
Risk of Investing in the Aerospace and Defense Industry 23
Risk of Investing in the Automotive Sub-Industry 23
Risk of Investing in the Biotechnology Industry 23
Risk of Investing in the Capital Goods Industry 23
Risk of Investing in the Clean Energy Sub-Industry 24
Risk of Investing in the Commercial and Professional Services Industry 24
Risk of Investing in the Communication Services Sector 24
Risk of Investing in the Consumer Discretionary Sector 24
Risk of Investing in the Consumer Goods Industry 25
Risk of Investing in the Consumer Services Industry 25
Risk of Investing in the Consumer Staples Sector 25
Risk of Investing in the Energy Sector 25
Risk of Investing in the Financials Sector 26
Risk of Investing in the Healthcare Sector 27
Risk of Investing in the Home Construction Industry 27
Risk of Investing in the Industrials Sector 27
Risk of Investing in the Information Technology Sector 28
Risk of Investing in the Infrastructure Industry 28
Risk of Investing in the Insurance Industry 29
Risk of Investing in the Materials Sector 29
Risk of Investing in the Media Sub-Industry 29
Risk of Investing in the Medical Equipment Industry 29
Risk of Investing in the Natural Resources Industry 29
Risk of Investing in the Oil and Gas Industry 30
ii

Page
Risk of Investing in the Oil Equipment and Services Sub-Industry 30
Risk of Investing in the Pharmaceuticals Industry 30
Risk of Investing in the Producer Durables Industry 30
Risk of Investing in the Real Estate Industry 31
Risk of Investing in the Retail Industry 32
Risk of Investing in the Technology Sector 32
Risk of Investing in the Telecommunications Sector 32
Risk of Investing in the Transportation Infrastructure Industry 33
Risk of Investing in the Utilities Sector 33
Proxy Voting Policy 33
Portfolio Holdings Information 34
Construction and Maintenance of the Underlying Indexes 35
The Dow Jones Indexes 35
Dow Jones U.S. Real Estate Index 36
Dow Jones U.S. Select Aerospace & Defense Index 36
Dow Jones U.S. Select Health Care Providers Index 37
Dow Jones U.S. Select Home Construction Index 37
Dow Jones U.S. Select Insurance Index 37
Dow Jones U.S. Select Investment Services Index 37
Dow Jones U.S. Select Medical Equipment Index 37
Dow Jones U.S. Select Oil Equipment & Services Index 37
Dow Jones U.S. Select Oil Exploration & Production Index 37
Dow Jones U.S. Select Pharmaceuticals Index 37
Dow Jones U.S. Select Regional Banks Index 37
Dow Jones U.S. Select Telecommunications Index 38
The FTSE Nareit Indexes 38
FTSE Nareit All Mortgage Capped Index 39
FTSE Nareit All Residential Capped Index 39
ICE Exchange-Listed Preferred & Hybrid Securities Transition Index 39
JPX-Nikkei Index 400 40
NASDAQ Biotechnology Index® 40
NYSE® FactSet U.S. Infrastructure Index 41
The PHLX Semiconductor Sector Index 42
The Russell Indexes 44
Russell 1000® Index 45
Russell 1000® Growth Index 45
Russell 1000®
Pure Domestic Exposure Index 45
iii
Page
Russell 1000® Value Index 45
Russell 2000® Index 45
Russell 2000® Growth Index 45
Russell 2000® Value Index 46
Russell 3000® Index 46
Russell Microcap® Index 46
Russell Midcap® Index 46
Russell Midcap® Growth Index 46
Russell Midcap® Value Index 46
Russell Top 200® Index 46
Russell Top 200® Growth Index 47
Russell Top 200® Value Index 47
The S&P Indexes 47
S&P 100® 49
S&P 500 Growth IndexTM 49
S&P 500® 49
S&P 500 Value IndexTM 49
S&P 900 Growth IndexTM 49
S&P 900 Value IndexTM 49
S&P Developed Ex-U.S. Property IndexTM 50
S&P Europe 350TM 50
S&P Global 100TM 50
S&P Global Clean Energy IndexTM 50
S&P Global 1200 Consumer Discretionary IndexTM 50
S&P Global 1200 Consumer Staples IndexTM 50
S&P Global 1200 Energy IndexTM 50
S&P Global 1200 Financials IndexTM 51
S&P Global 1200 Industrials IndexTM 51
S&P Global Infrastructure IndexTM 51
S&P Global 1200 Communication Services Sector IndexTM 51
S&P Global 1200 Utilities IndexTM 51
S&P International Preferred Stock IndexTM 51
S&P MidCap 400 Growth IndexTM 52
S&P MidCap 400®
52
S&P MidCap 400 Value IndexTM 52
S&P North American Expanded Technology Sector IndexTM 53
S&P North American Expanded Technology Software IndexTM 53
iv

Page
S&P North American Natural Resources IndexTM 53
S&P North American Technology Multimedia Networking IndexTM 53
S&P SmallCap 600 Growth IndexTM 53
S&P SmallCap 600®
53
S&P SmallCap 600 Value IndexTM 53
S&P Total Market Index™ 53
Investment Restrictions 54
Fundamental Investment Policies 55
Non-Fundamental Investment Policies 58
Continuous Offering 59
Management 59
Trustees and Officers 59
Committees of the Board of Trustees 67
Remuneration of Trustees and Advisory Board Members 71
Control Persons and Principal Holders of Securities 78
Potential Conflicts of Interest 106
Legal Proceedings 114
Investment Advisory, Administrative and Distribution Services 114
Investment Adviser 114
Investment Sub-Adviser 119
Portfolio Managers 119
Codes of Ethics 132
Anti-Money Laundering Requirements 132
Administrator, Custodian and Transfer Agent 132
Distributor 135
Securities Lending 135
Payments by BFA and its Affiliates 151
Determination of Net Asset Value 153
Brokerage Transactions 155
Additional Information Concerning the Trust 164
Shares 164
DTC as Securities Depository for Shares of the Funds 165
Distribution of Shares 166
Creation and Redemption of Creation Units 166
General 166
Fund Deposit 168
Cash Purchase Method 168
v

Page
Procedures for Creation of Creation Units 168
Role of the Authorized Participant 169
Purchase Orders 169
Timing of Submission of Purchase Orders 169
Acceptance of Orders for Creation Units 170
Issuance of a Creation Unit 170
Costs Associated with Creation Transactions 171
Redemption of iShares Russell 2000 ETF During Certain Market Conditions 172
Redemption of Creation Units 173
Cash Redemption Method 173
Costs Associated with Redemption Transactions 173
Placement of Redemption Orders 175
Taxation on Creations and Redemptions of Creation Units 177
Taxes 177
Regulated Investment Company Qualifications 178
Taxation of RICs 178
Excise Tax 179
Net Capital Loss Carryforwards 179
Taxation of U.S. Shareholders 180
Sales of Shares 182
Backup Withholding 182
Sections 351 and 362 182
Taxation of Certain Derivatives 182
Qualified Dividend Income 183
Corporate Dividends Received Deduction 183
Excess Inclusion Income 184
Non-U.S. Investments 184
Passive Foreign Investment Companies 184
Reporting 185
Other Taxes 185
Taxation of Non-U.S. Shareholders 185
Financial Statements 187
Miscellaneous Information 187
Counsel 187
Independent Registered Public Accounting Firm 187
Shareholder Communications to the Board 187
Regulation Under the Alternative Investment Fund Managers Directive 187
vi

Page
Investors’ Rights 188
Appendix A - Proxy Voting Policy and BlackRock Proxy Voting Guidelines A-1
Appendix B - Regular Holidays and Redemptions B-1
vii

General Description of the Trust and its FundsThe Trust currently consists of more than 280 investment series or portfolios. The Trust was organized as a Delawarestatutory trust on December 16, 1999 and is authorized to have multiple series or portfolios. The Trust is an open-endmanagement investment company registered with the SEC under the 1940 Act. The offering of the Trust’s shares isregistered under the Securities Act of 1933, as amended (the “1933 Act”). This SAI relates to the following Funds:
• iShares Core S&P 500 ETF
• iShares Core S&P Mid-Cap ETF
• iShares Core S&P Small-Cap ETF
• iShares Core S&P Total U.S. Stock Market ETF
• iShares Core S&P U.S. Growth ETF
• iShares Core S&P U.S. Value ETF
• iShares Europe ETF
• iShares Expanded Tech Sector ETF1
• iShares Expanded Tech-Software Sector ETF2
• iShares Global 100 ETF
• iShares Global Clean Energy ETF
• iShares Global Comm Services ETF3
• iShares Global Consumer Discretionary ETF
• iShares Global Consumer Staples ETF
• iShares Global Energy ETF
• iShares Global Financials ETF
• iShares Global Industrials ETF
• iShares Global Infrastructure ETF
• iShares Global Utilities ETF
• iShares International Developed Property ETF
• iShares International Preferred Stock ETF
• iShares JPX-Nikkei 400 ETF
• iShares Micro-Cap ETF
• iShares Mortgage Real Estate ETF4
• iShares Nasdaq Biotechnology ETF
• iShares North American Natural Resources ETF
• iShares North American Tech-Multimedia Networking ETF
• iShares PHLX Semiconductor ETF
• iShares Preferred and Income Securities ETF5
• iShares Residential Real Estate ETF6
• iShares Russell 1000 ETF
• iShares Russell 1000 Growth ETF
• iShares Russell 1000 Pure U.S. Revenue ETF
• iShares Russell 1000 Value ETF
• iShares Russell 2000 ETF
1

• iShares Russell 2000 Growth ETF
• iShares Russell 2000 Value ETF
• iShares Russell 3000 ETF
• iShares Russell Mid-Cap ETF
• iShares Russell Mid-Cap Growth ETF
• iShares Russell Mid-Cap Value ETF
• iShares Russell Top 200 ETF
• iShares Russell Top 200 Growth ETF
• iShares Russell Top 200 Value ETF
• iShares S&P 100 ETF
• iShares S&P 500 Growth ETF
• iShares S&P 500 Value ETF
• iShares S&P Mid-Cap 400 Growth ETF
• iShares S&P Mid-Cap 400 Value ETF
• iShares S&P Small-Cap 600 Growth ETF
• iShares S&P Small-Cap 600 Value ETF
• iShares U.S. Aerospace & Defense ETF
• iShares U.S. Broker-Dealers & Securities Exchanges ETF
• iShares U.S. Healthcare Providers ETF
• iShares U.S. Home Construction ETF
• iShares U.S. Infrastructure ETF
• iShares U.S. Insurance ETF
• iShares U.S. Medical Devices ETF
• iShares U.S. Oil & Gas Exploration & Production ETF
• iShares U.S. Oil Equipment & Services ETF
• iShares U.S. Pharmaceuticals ETF
• iShares U.S. Real Estate ETF
• iShares U.S. Regional Banks ETF
• iShares U.S. Telecommunications ETF
1 On December 24, 2018, the name of the Fund changed from iShares North American Tech ETF to iShares Expanded Tech Sector ETF and the nameof the Fund’s Underlying Index changed from the S&P North American Technology IndexTM to the S&P North American Expanded Technology SectorIndexTM.
2 On December 24, 2018, the name of the Fund changed from iShares North American Tech-Software ETF to iShares Expanded Tech-Software SectorETF and the name of the Fund’s Underlying Index changed from the S&P North American Technology Software IndexTM to the S&P North AmericanExpanded Technology Software IndexTM.
3 On September 24, 2018, the name of the Fund changed from iShares Global Telecom ETF to iShares Global Comm Services ETF and the name of theFund’s Underlying Index changed from the S&P Global 1200 Telecommunications Services Index to the S&P Global 1200 Communication ServicesSector Index.
4 On December 29, 2017, the name of the Fund changed from iShares Mortgage Real Estate Capped ETF to iShares Mortgage Real Estate ETF. OnSeptember 4, 2018, the name of the Fund’s Underlying Index changed from the FTSE NAREIT All Mortgage Capped Index to the FTSE Nareit AllMortgage Capped Index.
5 On February 1, 2019, the name of the Fund changed from iShares U.S. Preferred Stock ETF to iShares Preferred and Income Securities ETF and theFund’s Underlying Index changed from the S&P U.S. Preferred Stock Index to the ICE Exchange-Listed Preferred & Hybrid Securities Transition Index.
6 On December 29, 2017, the name of the Fund changed from iShares Residential Real Estate Capped ETF to iShares Residential Real Estate ETF. OnSeptember 4, 2018, the name of the Fund’s Underlying Index changed from the FTSE NAREIT All Residential Capped Index to the FTSE Nareit AllResidential Capped Index.
2

Each Fund is managed by BlackRock Fund Advisors (“BFA”), an indirect wholly-owned subsidiary of BlackRock, Inc., andgenerally seeks to track the investment results of the specific benchmark index identified in the applicable Prospectus for thatFund (each, an “Underlying Index”). BlackRock International Limited, an affiliate of BFA, serves as the sub-adviser (the “Sub-Adviser”) to the iShares International Preferred Stock ETF.
Each Fund offers and issues shares at their net asset value per share (“NAV”) only in aggregations of a specified number ofshares (each, a “Creation Unit”), generally in exchange for a designated portfolio of securities (including any portion of suchsecurities for which cash may be substituted) included in its Underlying Index (the “Deposit Securities”), together with thedeposit of a specified cash payment (the “Cash Component”). Shares of the Funds are listed for trading on national securitiesexchanges such as Cboe BZX Exchange, Inc. (“Cboe BZX”) (formerly known as BATS Exchange, Inc.), The Nasdaq StockMarket (“NASDAQ”) or NYSE Arca, Inc. (“NYSE Arca”) (each a “Listing Exchange”). Shares of each Fund are traded in thesecondary market and elsewhere at market prices that may be at, above or below the Fund’s NAV. Shares are redeemableonly in Creation Units by Authorized Participants (as defined in the Portfolio Holdings Information section of this SAI), and,generally, in exchange for portfolio securities and a Cash Amount (as defined in the Redemption of Creation Units section ofthis SAI). Creation Units typically are a specified number of shares, generally ranging from 50,000 to 150,000 shares ormultiples thereof.
The Trust reserves the right to permit or require that creations and redemptions of shares are effected fully or partially in cashand reserves the right to permit or require the substitution of Deposit Securities in lieu of cash. Shares may be issued inadvance of receipt of Deposit Securities, subject to various conditions, including a requirement that the AuthorizedParticipant maintain with the Trust a cash deposit equal to at least 105% and up to 115%, which percentage BFA may changefrom time to time, of the market value of the omitted Deposit Securities. The Trust may use such cash deposit at any time topurchase Deposit Securities. See the Creation and Redemption of Creation Units section of this SAI. Transaction fees andother costs associated with creations or redemptions that include a cash portion may be higher than the transaction fees andother costs associated with in-kind creations or redemptions. In all cases, conditions with respect to creations andredemptions of shares and fees will be limited in accordance with the requirements of SEC rules and regulations applicable tomanagement investment companies offering redeemable securities.
Exchange Listing and TradingA discussion of exchange listing and trading matters associated with an investment in each Fund is contained in theShareholder Information section of each Fund’s Prospectus. The discussion below supplements, and should be read inconjunction with, that section of the applicable Prospectus.
Shares of each Fund are listed for trading, and trade throughout the day, on the applicable Listing Exchange and in othersecondary markets. Shares of certain Funds may also be listed on certain non-U.S. exchanges. There can be no assurancethat the requirements of the Listing Exchange necessary to maintain the listing of shares of any Fund will continue to be met.The Listing Exchange may, but is not required to, remove the shares of a Fund from listing if, among other things: (i)following the initial 12-month period beginning upon the commencement of trading of Fund shares, there are fewer than 50record and/or beneficial owners of shares of the Fund for 30 or more consecutive trading days, (ii) the value of theUnderlying Index on which a Fund is based is no longer calculated or available, or (iii) any other event shall occur or conditionshall exist that, in the opinion of the Listing Exchange, makes further dealings on the Listing Exchange inadvisable. TheListing Exchange will also remove shares of a Fund from listing and trading upon termination of the Fund or in the event aFund does not comply with the continuous listing standards of the Listing Exchange, as described in the Fund’s Prospectus.
As in the case of other publicly-traded securities, when you buy or sell shares of a Fund through a broker, you may incur abrokerage commission determined by that broker, as well as other charges.
In order to provide additional information regarding the indicative value of shares of the Funds, the Listing Exchange or amarket data vendor disseminates information every 15 seconds through the facilities of the Consolidated Tape Association,or through other widely disseminated means, an updated indicative optimized portfolio value (“IOPV”) for the Funds ascalculated by an information provider or market data vendor. The Trust is not involved in or responsible for any aspect of thecalculation or dissemination of the IOPV and makes no representation or warranty as to the accuracy of the IOPV.
An IOPV has an equity securities component and a cash component. The equity securities values included in an IOPV are thevalues of the Deposit Securities for a Fund. While the IOPV reflects the current value of the Deposit Securities required to be
3

deposited in connection with the purchase of a Creation Unit, it does not necessarily reflect the precise composition of thecurrent portfolio of securities held by the Funds at a particular point in time because the current portfolio of the Funds mayinclude securities that are not a part of the current Deposit Securities. Therefore, a Fund’s IOPV disseminated during theListing Exchange trading hours should not be viewed as a real-time update of the Fund’s NAV, which is calculated only oncea day.
The cash component included in an IOPV consists of estimated accrued interest, dividends and other income, less expenses.If applicable, each IOPV also reflects changes in currency exchange rates between the U.S. dollar and the applicable currency.
The Trust reserves the right to adjust the share prices of the Funds in the future to maintain convenient trading ranges forinvestors. Any adjustments would be accomplished through stock splits or reverse stock splits, which would have no effecton the net assets of the Funds or an investor’s equity interest in the Funds.
Investment Strategies and RisksEach Fund seeks to achieve its objective by investing primarily in securities issued by issuers that comprise its relevantUnderlying Index and in investments that provide substantially similar exposure to securities in the Underlying Index. EachFund operates as an index fund and is not actively managed. Adverse performance of a security in a Fund’s portfolio willordinarily not result in the elimination of the security from the Fund’s portfolio.
Each Fund engages in representative sampling, which is investing in a sample of securities selected by BFA to have acollective investment profile similar to that of the Fund’s Underlying Index. Securities selected have aggregate investmentcharacteristics (based on market capitalization and industry weightings), fundamental characteristics (such as returnvariability, earnings valuation and yield) and liquidity measures similar to those of the Underlying Index. A fund that usesrepresentative sampling generally does not hold all of the securities that are in its underlying index.
Although the Funds do not seek leveraged returns, certain instruments used by the Funds may have a leveraging effect asdescribed below.
Borrowing. Each Fund may borrow for temporary or emergency purposes, including to meet payments due fromredemptions or to facilitate the settlement of securities or other transactions. Under normal market conditions, anyborrowing by a Fund will not exceed 10% of the Fund’s net assets; however, each Fund generally does not intend to borrowmoney.
The purchase of securities while borrowings are outstanding may have the effect of leveraging a Fund. The incurrence ofleverage increases a Fund’s exposure to risk, and borrowed funds are subject to interest costs that will reduce net income.Purchasing securities while borrowings are outstanding creates special risks, such as the potential for greater volatility in thenet asset value of Fund shares and in the yield on a Fund’s portfolio. In addition, the interest expenses from borrowings mayexceed the income generated by a Fund’s portfolio and, therefore, the amount available (if any) for distribution toshareholders as dividends may be reduced. BFA may determine to maintain outstanding borrowings if it expects that thebenefits to a Fund’s shareholders will outweigh the current reduced return.
Certain types of borrowings by a Fund must be made from a bank or may result in a Fund being subject to covenants incredit agreements relating to asset coverage, portfolio composition requirements and other matters. It is not anticipated thatobservance of such covenants would impede BFA’s management of a Fund’s portfolio in accordance with a Fund’sinvestment objectives and policies. However, a breach of any such covenants not cured within the specified cure period mayresult in acceleration of outstanding indebtedness and require a Fund to dispose of portfolio investments at a time when itmay be disadvantageous to do so.
Currency Transactions. A currency forward contract is an over-the-counter (“OTC”) obligation to purchase or sell a specificcurrency at a future date, which may be any fixed number of days greater than two days from the date on which the contractis agreed upon by the parties, at a price set at the time of the contract. A non-deliverable currency forward is an OTCcurrency forward settled in a specified currency, on a specified date, based on the difference between the agreed-uponexchange rate and the market exchange rate. A currency futures contract is a contract that trades on an organized futuresexchange involving an obligation to deliver or acquire a specified amount of a specific currency, at a specified price and at aspecified future time. Currency futures contracts may be settled on a net cash payment basis rather than by the sale and
4

delivery of the underlying currency. To the extent required by law, liquid assets committed to futures contracts will bemaintained. Certain of the Funds do not expect to engage in currency transactions for the purpose of hedging againstdeclines in the value of the Funds’ assets that are denominated in a non-U.S. currency. A Fund may enter into non-U.S.currency forwards, non-deliverable currency forwards and non-U.S. currency futures transactions to facilitate local securitiessettlements or to protect against currency exposure in connection with its distributions to shareholders, but may not enterinto such contracts for speculative purposes.
Foreign exchange transactions involve a significant degree of risk and the markets in which foreign exchange transactions areeffected may be highly volatile, highly specialized and highly technical. Significant changes, including changes in liquidity andprices, can occur in such markets within very short periods of time, often within minutes. Foreign exchange trading risksinclude, but are not limited to, exchange rate risk, counterparty risk, maturity gap, interest rate risk, and potential interferenceby foreign governments through regulation of local exchange markets, foreign investment or particular transactions in non-U.S. currency. If BFA utilizes foreign exchange transactions at an inappropriate time or judges market conditions, trends orcorrelations incorrectly, foreign exchange transactions may not serve their intended purpose of improving the correlation of aFund’s return with the performance of its Underlying Index and may lower the Fund’s return. Each Fund could experiencelosses if the value of its currency forwards, options or futures positions were poorly correlated with its other investments or ifit could not close out its positions because of an illiquid market or otherwise. In addition, a Fund could incur transactioncosts, including trading commissions, in connection with certain non-U.S. currency transactions.
Diversification Status. The following table sets forth the diversification status of each Fund:
Diversified Funds Non-Diversified Funds
iShares Core S&P 500 ETF iShares Expanded Tech Sector ETF
iShares Core S&P Mid-Cap ETF iShares Expanded Tech-Software Sector ETF
iShares Core S&P Small-Cap ETF iShares Global Clean Energy ETF
iShares Core S&P Total U.S. Stock Market ETF iShares Global Comm Services ETF
iShares Core S&P U.S. Growth ETF iShares Global Energy ETF
iShares Core S&P U.S. Value ETF iShares International Preferred Stock ETF
iShares Europe ETF iShares Mortgage Real Estate ETF
iShares Global 100 ETF iShares Nasdaq Biotechnology ETF
iShares Global Consumer Discretionary ETF iShares North American Tech-Multimedia Networking ETF
iShares Global Consumer Staples ETF iShares PHLX Semiconductor ETF
iShares Global Financials ETF iShares Residential Real Estate ETF
iShares Global Industrials ETF iShares Russell 1000 Pure U.S. Revenue ETF
iShares Global Infrastructure ETF iShares U.S. Aerospace & Defense ETF
iShares Global Utilities ETF iShares U.S. Broker-Dealers & Securities Exchanges ETF
iShares International Developed Property ETF iShares U.S. Healthcare Providers ETF
iShares JPX-Nikkei 400 ETF iShares U.S. Home Construction ETF
iShares Micro-Cap ETF iShares U.S. Infrastructure ETF
iShares North American Natural Resources ETF iShares U.S. Insurance ETF
iShares Preferred and Income Securities ETF iShares U.S. Medical Devices ETF
iShares Russell 1000 ETF iShares U.S. Oil & Gas Exploration & Production ETF
iShares Russell 1000 Growth ETF iShares U.S. Oil Equipment & Services ETF
iShares Russell 1000 Value ETF iShares U.S. Pharmaceuticals ETF
iShares Russell 2000 ETF iShares U.S. Regional Banks ETF
iShares Russell 2000 Growth ETF iShares U.S. Telecommunications ETF
5

Diversified Funds Non-Diversified Funds
iShares Russell 2000 Value ETF
iShares Russell 3000 ETF
iShares Russell Mid-Cap ETF
iShares Russell Mid-Cap Growth ETF
iShares Russell Mid-Cap Value ETF
iShares Russell Top 200 ETF
iShares Russell Top 200 Growth ETF
iShares Russell Top 200 Value ETF
iShares S&P 100 ETF
iShares S&P 500 Growth ETF
iShares S&P 500 Value ETF
iShares S&P Mid-Cap 400 Growth ETF
iShares S&P Mid-Cap 400 Value ETF
iShares S&P Small-Cap 600 Growth ETF
iShares S&P Small-Cap 600 Value ETF
iShares U.S. Real Estate ETF
A fund classified as “diversified” under the 1940 Act may not purchase securities of an issuer (other than (i) obligationsissued or guaranteed by the U.S. government, its agencies or instrumentalities and (ii) securities of other investmentcompanies) if, with respect to 75% of its total assets, (a) more than 5% of the fund’s total assets would be invested insecurities of that issuer or (b) the fund would hold more than 10% of the outstanding voting securities of that issuer. Withrespect to the remaining 25% of its total assets, the fund may invest more than 5% of its assets in one issuer. Under the 1940Act, a fund cannot change its classification from diversified to non-diversified without shareholder approval.
A “non-diversified” fund is a fund that is not limited by the 1940 Act with regard to the percentage of its assets that may beinvested in the securities of a single issuer. The securities of a particular issuer (or securities of issuers in particular industries)may constitute a significant percentage of the underlying index of such a fund and, consequently, the fund’s investmentportfolio. This may adversely affect a fund’s performance or subject the fund’s shares to greater price volatility than thatexperienced by more diversified investment companies.
Each Fund (whether diversified or non-diversified) intends to maintain the required level of diversification and otherwiseconduct its operations so as to qualify as a regulated investment company (“RIC”) for purposes of the U.S. Internal RevenueCode of 1986, as amended (the “Internal Revenue Code”), and to relieve the Fund of any liability for U.S. federal income tax tothe extent that its earnings are distributed to shareholders, provided that the Fund satisfies a minimum distributionrequirement. Compliance with the diversification requirements of the Internal Revenue Code may limit the investmentflexibility of the Funds and may make it less likely that the Funds will meet their respective investment objectives.
Futures, Options on Futures and Securities Options. Futures contracts, options on futures and securities options may beused by a Fund to simulate investment in its Underlying Index, to facilitate trading or to reduce transaction costs. Each Fundmay enter into futures contracts and options on futures that are traded on a U.S. or non-U.S. futures exchange. Each Fundwill not use futures, options on futures or securities options for speculative purposes. Each Fund intends to use futures andoptions on futures in accordance with Rule 4.5 of the Commodity Futures Trading Commission (the “CFTC”) promulgatedunder the Commodity Exchange Act (“CEA”). BFA, with respect to certain Funds, has claimed an exclusion from the definitionof the term “commodity pool operator” in accordance with Rule 4.5 so that BFA, with respect to such Funds, is not subject toregistration or regulation as a commodity pool operator under the CEA. See the Regulation Regarding Derivatives section ofthis SAI for more information.
Futures contracts provide for the future sale by one party and purchase by another party of a specified amount of a specificinstrument or index at a specified future time and at a specified price. Stock index contracts are based on investments that
6

reflect the market value of common stock of the firms included in the investments. Each Fund may enter into futurescontracts to purchase securities indexes when BFA anticipates purchasing the underlying securities and believes prices willrise before the purchase will be made. Upon entering into a futures contract, a Fund will be required to deposit with thebroker an amount of cash or cash equivalents known as “initial margin,” which is similar to a performance bond or good faithdeposit on the contract and is returned to the Fund upon termination of the futures contract if all contractual obligationshave been satisfied. Subsequent payments, known as “variation margin,” will be made to and from the broker daily as theprice of the instrument or index underlying the futures contract fluctuates, making the long and short positions in the futurescontract more or less valuable, a process known as “marking-to-market.” At any time prior to the expiration of a futurescontract, each Fund may elect to close the position by taking an opposite position, which will operate to terminate the Fund’sexisting position in the contract. To the extent required by law, each Fund will segregate liquid assets in an amount equal toits delivery obligations under the futures contracts. An option on a futures contract, as contrasted with a direct investment insuch a contract, gives the purchaser the right, but no obligation, in return for the premium paid, to assume a position in theunderlying futures contract at a specified exercise price at any time prior to the expiration date of the option. Upon exerciseof an option, the delivery of the futures position by the writer of the option to the holder of the option will be accompanied bydelivery of the accumulated balance in the writer’s futures margin account that represents the amount by which the marketprice of the futures contract exceeds (in the case of a call) or is less than (in the case of a put) the exercise price of the optionon the futures contract. The potential for loss related to the purchase of an option on a futures contract is limited to thepremium paid for the option plus transaction costs. Because the value of the option is fixed at the point of sale, there are nodaily cash payments by the purchaser to reflect changes in the value of the underlying contract; however, the value of theoption changes daily and that change would be reflected in the NAV of each Fund. The potential for loss related to writingcall options is unlimited. The potential for loss related to writing put options is limited to the agreed-upon price per share,also known as the “strike price,” less the premium received from writing the put. Certain of the Funds may purchase andwrite put and call options on futures contracts that are traded on an exchange as a hedge against changes in value of theirportfolio securities or in anticipation of the purchase of securities, and may enter into closing transactions with respect tosuch options to terminate existing positions. There is no guarantee that such closing transactions can be effected.
Securities options may be used by a Fund to obtain access to securities in its Underlying Index or to dispose of securities inits Underlying Index at favorable prices, to invest cash in a securities index that offers similar exposure to that provided by itsUnderlying Index or otherwise to achieve the Fund’s objective of tracking its Underlying Index. A call option gives a holder theright to purchase a specific security at a specified price (“exercise price”) within a specified period of time. A put option givesa holder the right to sell a specific security at an exercise price within a specified period of time. The initial purchaser of a calloption pays the “writer” a premium, which is paid at the time of purchase and is retained by the writer whether or not suchoption is exercised. Each Fund may purchase put options to hedge its portfolio against the risk of a decline in the marketvalue of securities held and may purchase call options to hedge against an increase in the price of securities it is committedto purchase. Each Fund may write put and call options along with a long position in options to increase its ability to hedgeagainst a change in the market value of the securities it holds or is committed to purchase. Each Fund may purchase or sellsecurities options on a U.S. or non-U.S. securities exchange or in the OTC market through a transaction with a dealer. Optionson a securities index are typically settled on a net basis based on the appreciation or depreciation of the index level over thestrike price. Options on single name securities may be cash- or physically-settled, depending upon the market in which theyare traded. Options may be structured so as to be exercisable only on certain dates or on a daily basis. Options may also bestructured to have conditions to exercise (i.e., “Knock-in Events”) or conditions that trigger termination (i.e., “Knock-outEvents”). Investments in futures contracts and other investments that contain leverage may require each Fund to maintainliquid assets in an amount equal to its delivery obligations under these contracts and other investments. Generally, each Fundmaintains an amount of liquid assets equal to its obligations relative to the position involved, adjusted daily on a marked-to-market basis. With respect to futures contracts that are contractually required to “cash-settle,” each Fund maintains liquidassets in an amount at least equal to the Fund’s daily marked-to-market obligation (i.e., each Fund’s daily net liability, if any),rather than the contracts’ notional value (i.e., the value of the underlying asset). By maintaining assets equal to its netobligation under cash-settled futures contracts, each Fund may employ leverage to a greater extent than if the Fund wererequired to set aside assets equal to the futures contracts’ full notional value. Each Fund bases its asset maintenance policieson methods permitted by the SEC and its staff and may modify these policies in the future to comply with any changes in theguidance articulated from time to time by the SEC or its staff. Changes in SEC guidance regarding the use of derivatives byregistered investment companies may adversely impact a Fund’s ability to invest in futures, options or other derivatives ormake investments in such instruments more expensive.
7

Illiquid Securities. Each Fund may invest up to an aggregate amount of 15% of its net assets in illiquid securities. An illiquidinvestment is any investment that a Fund reasonably expects cannot be sold or disposed of in current market conditions inseven calendar days or less without significantly changing the market value of the investment. The liquidity of a security willbe determined based on relevant market, trading and investment specific considerations as set out in the Fund’s liquidity riskmanagement program (the “Liquidity Program”) as required by Rule 22e-4 under the 1940 Act (the “Liquidity Rule”). Illiquidsecurities may trade at a discount to comparable, more liquid securities and a Fund may not be able to dispose of illiquidsecurities in a timely fashion or at their expected prices. If illiquid investments exceed 15% of a Fund’s net assets, theLiquidity Rule and the Liquidity Program will require that certain remedial actions be taken.
Lending Portfolio Securities. Each Fund may lend portfolio securities to certain borrowers that BFA determines to becreditworthy, including borrowers affiliated with BFA. The borrowers provide collateral that is maintained in an amount atleast equal to the current market value of the securities loaned. No securities loan shall be made on behalf of a Fund if, as aresult, the aggregate value of all securities loaned by the particular Fund exceeds one-third of the value of such Fund’s totalassets (including the value of the collateral received). A Fund may terminate a loan at any time and obtain the return of thesecurities loaned. Each Fund receives, by way of substitute payment, the value of any interest or cash or non-cashdistributions paid on the loaned securities that it would have received if the securities were not on loan.
With respect to loans that are collateralized by cash, the borrower may be entitled to receive a fee based on the amount ofcash collateral. The Funds are typically compensated by the difference between the amount earned on the reinvestment ofcash collateral and the fee paid to the borrower. In the case of collateral other than cash, a Fund is typically compensated by afee paid by the borrower equal to a percentage of the market value of the loaned securities. Any cash collateral may bereinvested in certain short-term instruments either directly on behalf of each lending Fund or through one or more jointaccounts or money market funds, including those affiliated with BFA; such investments are subject to investment risk.
Each Fund conducts its securities lending pursuant to an exemptive order from the SEC permitting it to lend portfoliosecurities to borrowers affiliated with the Fund and to retain an affiliate of the Fund to act as securities lending agent. To theextent that a Fund engages in securities lending, BlackRock Institutional Trust Company, N.A. (“BTC”) acts as securitieslending agent for the Fund, subject to the overall supervision of BFA. BTC administers the lending program in accordancewith guidelines approved by the Trust’s Board of Trustees (the “Board,” the trustees of which are the “Trustees”).
Securities lending involves exposure to certain risks, including operational risk (i.e., the risk of losses resulting from problemsin the settlement and accounting process), “gap” risk (i.e., the risk of a mismatch between the return on cash collateralreinvestments and the fees a Fund has agreed to pay a borrower), and credit, legal, counterparty and market risk. If asecurities lending counterparty were to default, a Fund would be subject to the risk of a possible delay in receiving collateralor in recovering the loaned securities, or to a possible loss of rights in the collateral. In the event a borrower does not return aFund’s securities as agreed, the Fund may experience losses if the proceeds received from liquidating the collateral do not atleast equal the value of the loaned security at the time the collateral is liquidated, plus the transaction costs incurred inpurchasing replacement securities. This event could trigger adverse tax consequences for a Fund. A Fund could lose money ifits short-term investment of the collateral declines in value over the period of the loan. Substitute payments for dividendsreceived by a Fund for securities loaned out by the Fund will not be considered qualified dividend income. BTC will take intoaccount the tax effects on shareholders caused by this difference in connection with a Fund’s securities lending program.Substitute payments received on tax-exempt securities loaned out will not be tax-exempt income.
Non-U.S. Securities. Certain Funds purchase publicly-traded common stocks of non-U.S. issuers. To the extent a Fundinvests in stocks of non-U.S. issuers, certain of the Fund’s investments in such stocks may be in the form of AmericanDepositary Receipts (“ADRs”), Global Depositary Receipts (“GDRs”) and European Depositary Receipts (“EDRs”) (collectively,“depositary receipts”). Depositary receipts are receipts, typically issued by a bank or trust issuer, which evidence ownership ofunderlying securities issued by a non-U.S. issuer. Depositary receipts may not necessarily be denominated in the samecurrency as their underlying securities. ADRs typically are issued by an American bank or trust company and evidenceownership of underlying securities issued by a foreign corporation. EDRs, which are sometimes referred to as ContinentalDepositary Receipts, are receipts issued in Europe, typically by foreign banks and trust companies, that evidence ownershipof either foreign or domestic underlying securities. GDRs are depositary receipts structured like global debt issues to facilitatetrading on an international basis. Generally, ADRs, issued in registered form, are designed for use in the U.S. securitiesmarkets, and EDRs, issued in bearer form, are designed for use in European securities markets. GDRs are tradable both in theU.S. and in Europe and are designed for use throughout the world.
8

The Funds will not invest in any unlisted depositary receipt or any depositary receipt that BFA deems illiquid at the time ofpurchase or for which pricing information is not readily available. In general, depositary receipts must be sponsored, but aFund may invest in unsponsored depositary receipts under certain limited circumstances.
Depositary receipts are generally subject to the same risks as the foreign securities that they evidence or into which they maybe converted. In addition to investment risks associated with the underlying issuer, depositary receipts expose a Fund toadditional risks associated with the non-uniform terms that apply to depositary receipt programs, credit exposure to thedepository bank and to the sponsors and other parties with whom the depository bank establishes the programs, currencyrisk and liquidity risk. Unsponsored programs, which are not sanctioned by the issuer of the underlying common stock,generally expose investors to greater risks than sponsored programs and do not provide holders with many of theshareholder benefits that come from investing in a sponsored depositary receipts.
Investing in the securities of non-U.S. issuers involves special risks and considerations not typically associated with investingin U.S. issuers. These include differences in accounting, auditing and financial reporting standards; the possibility ofexpropriation or confiscatory taxation; adverse changes in investment or exchange control regulations; political instability,which could affect U.S. investments in non-U.S. countries; and potential restrictions on the flow of international capital. Non-U.S. issuers may be subject to less governmental regulation than U.S. issuers. Moreover, individual non-U.S. economies maydiffer favorably or unfavorably from the U.S. economy in such respects as growth of gross domestic product (“GDP”), rate ofinflation, capital reinvestment, resource self-sufficiency and balance of payment positions.
Regulation Regarding Derivatives. The CFTC subjects advisers to registered investment companies to regulation by theCFTC if a fund that is advised by the adviser either (i) invests, directly or indirectly, more than a prescribed level of itsliquidation value in CFTC-regulated futures, options and swaps (“CFTC Derivatives”), or (ii) markets itself as providinginvestment exposure to such instruments. The CFTC also subjects advisers to registered investment companies to regulationby the CFTC if the registered investment company invests in one or more commodity pools. To the extent a Fund uses CFTCDerivatives, it intends to do so below such prescribed levels and intends not to market itself as a “commodity pool” or avehicle for trading such instruments.
BFA has claimed an exclusion from the definition of the term “commodity pool operator” under the CEA pursuant to Rule 4.5under the CEA with respect to each of the Funds. BFA is not, therefore, subject to registration or regulation as a “commoditypool operator” under the CEA with respect to the Funds.
The iShares Core S&P Mid-Cap ETF, iShares Core S&P Small-Cap ETF, iShares Core S&P Total U.S. Stock Market ETF, iSharesCore S&P U.S. Growth ETF, iShares Core S&P U.S. Value ETF, iShares Europe ETF, iShares Global 100 ETF, iShares InternationalDeveloped Property ETF, iShares Micro-Cap ETF, iShares Mortgage Real Estate ETF, iShares Preferred and Income SecuritiesETF, iShares Residential Real Estate ETF, iShares Russell 1000 ETF, iShares Russell 1000 Growth ETF, iShares Russell 1000Value ETF, iShares Russell 2000 ETF, iShares Russell 2000 Growth ETF, iShares Russell 2000 Value ETF, iShares Russell 3000ETF, iShares Russell Mid-Cap ETF, iShares Russell Mid-Cap Value ETF, iShares S&P Mid-Cap 400 Value ETF, iShares S&P Small-Cap 600 Value ETF, iShares U.S. Real Estate ETF and iShares U.S. Regional Banks ETF (the “No-Action Letter Funds”) may alsohave investments in “underlying funds” (and such underlying funds themselves may invest in underlying funds) not advisedby BFA (which for purposes of the no-action letter referenced below may include certain securitized vehicles, mortgage realestate investment trusts (“REITs”) and/or investment companies that may invest in CFTC Derivatives), and therefore may beviewed by the CFTC as commodity pools. BFA has no transparency into the holdings of these underlying funds because theyare not advised by BFA. To address this issue of lack of transparency, the CFTC staff issued a no-action letter on November29, 2012 permitting the adviser of a fund that invests in such underlying funds and that would otherwise have filed a claim ofexclusion pursuant to CFTC Rule 4.5 to delay registration as a “commodity pool operator” until six months from the date onwhich the CFTC issues additional guidance on the treatment of CFTC Derivatives held by underlying funds. BFA, the adviserof the No-Action Letter Funds, has filed a claim with the CFTC for such Funds to rely on this no-action relief. Accordingly, BFAis not currently subject to registration or regulation as a “commodity pool operator” under the CEA in respect of such Funds.
Derivative contracts, including, without limitation, swaps, currency forwards, and non-deliverable forwards, are subject toregulation under the Dodd-Frank Wall Street Reform and Consumer Protection Act (“Dodd-Frank Act”) in the U.S. and undercomparable regimes in Europe, Asia and other non-U.S. jurisdictions. Swaps, non-deliverable forwards and certain otherderivatives traded in the OTC market are subject to variation margin requirements, and initial margining requirements will bephased in through 2020. Implementation of the margining and other provisions of the Dodd-Frank Act regarding clearing,
9

mandatory trading, reporting and documentation of swaps and other derivatives have impacted and may continue to impactthe costs to a Fund of trading these instruments and, as a result, may affect returns to investors in a Fund.
As a result of regulatory requirements under the 1940 Act, each Fund is required to maintain an amount of liquid assets,accrued on a daily basis, having an aggregate value at least equal to the value of a Fund’s obligations under the applicablederivatives contract. To the extent that derivatives contracts are settled on a physical basis, a Fund will generally be requiredto maintain an amount of liquid assets equal to the notional value of the contract. On the other hand, in connection withderivatives contracts that are performed on a net basis, a Fund will generally be required to maintain liquid assets, accrueddaily, equal only to the accrued excess, if any, of a Fund’s obligations over those of its counterparty under the contract.Accordingly, reliance by a Fund on physically-settled derivatives contracts may adversely impact investors by requiring a Fundto set aside a greater amount of liquid assets than would generally be required if a Fund were relying on cash-settledderivatives contracts.
Repurchase Agreements. A repurchase agreement is an instrument under which the purchaser (i.e., a Fund) acquires thesecurity and the seller agrees, at the time of the sale, to repurchase the security at a mutually agreed-upon time and price,thereby determining the yield during the purchaser’s holding period. Repurchase agreements may be construed to becollateralized loans by the purchaser to the seller secured by the securities transferred to the purchaser. If a repurchaseagreement is construed to be a collateralized loan, the underlying securities will not be considered to be owned by a Fund butonly to constitute collateral for the seller’s obligation to pay the repurchase price, and, in the event of a default by the seller,the Fund may suffer time delays and incur costs or losses in connection with the disposition of the collateral.
In any repurchase transaction, the collateral for a repurchase agreement may include: (i) cash items; (ii) obligations issued bythe U.S. government or its agencies or instrumentalities; or (iii) obligations that, at the time the repurchase agreement isentered into, are determined to (A) have exceptionally strong capacity to meet their financial obligations and (B) aresufficiently liquid such that they can be sold at approximately their carrying value in the ordinary course of business withinseven days.
Repurchase agreements pose certain risks for a Fund that utilizes them. Such risks are not unique to the Funds, but areinherent in repurchase agreements. The Funds seek to minimize such risks, but because of the inherent legal uncertaintiesinvolved in repurchase agreements, such risks cannot be eliminated. Lower quality collateral and collateral with a longermaturity may be subject to greater price fluctuations than higher quality collateral and collateral with a shorter maturity. Ifthe repurchase agreement counterparty were to default, lower quality collateral may be more difficult to liquidate than higherquality collateral. Should the counterparty default and the amount of collateral not be sufficient to cover the counterparty’srepurchase obligation, a Fund would likely retain the status of an unsecured creditor of the counterparty (i.e., the position aFund would normally be in if it were to hold, pursuant to its investment policies, other unsecured debt securities of thedefaulting counterparty) with respect to the amount of the shortfall. As an unsecured creditor, a Fund would be at risk oflosing some or all of the principal and income involved in the transaction.
Reverse Repurchase Agreements. Reverse repurchase agreements involve the sale of securities with an agreement torepurchase the securities at an agreed-upon price, date and interest payment and have the characteristics of borrowing.Generally, the effect of such transactions is that a Fund can recover all or most of the cash invested in the portfolio securitiesinvolved during the term of the reverse repurchase agreement, while in many cases the Fund is able to keep some of theinterest income associated with those securities. Such transactions are advantageous only if a Fund has an opportunity toearn a rate of interest on the cash derived from these transactions that is greater than the interest cost of obtaining the sameamount of cash. Opportunities to realize earnings from the use of the proceeds equal to or greater than the interest requiredto be paid may not always be available, and a Fund intends to use the reverse repurchase technique only when BFA believes itwill be advantageous to the Fund. The use of reverse repurchase agreements may exaggerate any increase or decrease in thevalue of a Fund’s assets. A Fund’s exposure to reverse repurchase agreements will be covered by liquid assets having a valueequal to or greater than the Fund’s obligations under such commitments. The use of reverse repurchase agreements is aform of leverage, and the proceeds obtained by a Fund through reverse repurchase agreements may be invested in additionalsecurities.
Securities of Investment Companies. Each Fund may invest in the securities of other investment companies (includingmoney market funds) to the extent permitted by law. Pursuant to the 1940 Act, a Fund’s investment in registered investmentcompanies is generally limited to, subject to certain exceptions: (i) 3% of the total outstanding voting stock of any oneinvestment company; (ii) 5% of a Fund’s total assets with respect to any one investment company; and (iii) 10% of a Fund’s
10

total assets with respect to investment companies in the aggregate. To the extent allowed by law or regulation, each Fundintends from time to time to invest its assets in the securities of investment companies, including, but not limited to, moneymarket funds, including those advised by or otherwise affiliated with BFA, in excess of the general limits discussed above.Other investment companies in which a Fund may invest can be expected to incur fees and expenses for operations, such asinvestment advisory and administration fees, which would be in addition to those incurred by the Fund. Pursuant to guidanceissued by the SEC staff, fees and expenses of money market funds used for cash collateral received in connection with loansof securities are not treated as Acquired Fund Fees and Expenses, which reflect a Fund’s pro rata share of the fees andexpenses incurred by investing in other investment companies (as disclosed in the Prospectus, as applicable).
Short-Term Instruments and Temporary Investments. Each Fund may invest in short-term instruments, including moneymarket instruments, on an ongoing basis to provide liquidity or for other reasons. Money market instruments are generallyshort-term investments that may include, but are not limited to: (i) shares of money market funds (including those advisedby BFA or otherwise affiliated with BFA); (ii) obligations issued or guaranteed by the U.S. government, its agencies orinstrumentalities (including government-sponsored enterprises); (iii) negotiable certificates of deposit (“CDs”), bankers’acceptances, fixed-time deposits and other obligations of U.S. and non-U.S. banks (including non-U.S. branches) and similarinstitutions; (iv) commercial paper rated, at the date of purchase, “Prime-1” by Moody’s® Investors Service, Inc., “F-1” byFitch Ratings, Inc., or “A-1” by Standard & Poor’s® Financial Services LLC, a subsidiary of S&P Global, Inc. (S&P GlobalRatings), or if unrated, of comparable quality as determined by BFA; (v) non-convertible corporate debt securities (e.g., bondsand debentures) with remaining maturities at the date of purchase of not more than 397 days and that have beendetermined to present minimal credit risks, in accordance with the requirements set forth in Rule 2a-7 under the 1940 Act;(vi) repurchase agreements; and (vii) short-term U.S. dollar-denominated obligations of non-U.S. banks (including U.S.branches) that, in the opinion of BFA, are of comparable quality to obligations of U.S. banks that may be purchased by aFund. Any of these instruments may be purchased on a current or forward-settled basis. Time deposits are non-negotiabledeposits maintained in banking institutions for specified periods of time at stated interest rates. Bankers’ acceptances aretime drafts drawn on commercial banks by borrowers, usually in connection with international transactions.
Swap Agreements. Swap agreements are contracts between parties in which one party agrees to make periodic payments tothe other party based on the change in market value or level of a specified rate, index or asset. In return, the other partyagrees to make periodic payments to the first party based on the return of a different specified rate, index or asset. Swapagreements will usually be performed on a net basis, with a Fund receiving or paying only the net amount of the twopayments. The net amount of the excess, if any, of a Fund’s obligations over its entitlements with respect to each swap isaccrued on a daily basis, and an amount of liquid assets having an aggregate value at least equal to the accrued excess willbe maintained by the Fund.
Certain of the Funds may enter into currency, interest rate or index swaps, or, for the iShares S&P Small-Cap 600 Value ETF,total return swaps (some of which may be referred to as contracts for difference or “CFDs”). The use of currency, interest rateand index swaps is a highly specialized activity that involves investment techniques and risks different from those associatedwith ordinary portfolio security transactions. These transactions generally do not involve the delivery of securities or otherunderlying assets.
Tracking Stocks. A tracking stock is a separate class of common stock whose value is linked to a specific business unit oroperating division within a larger company and is designed to “track” the performance of such business unit or division. Thetracking stock may pay dividends to shareholders independent of the parent company. The parent company, rather than thebusiness unit or division, generally is the issuer of tracking stock. However, holders of the tracking stock may not have thesame rights as holders of the company’s common stock.
Future Developments. The Board may, in the future, authorize each Fund to invest in securities contracts and investments,other than those listed in this SAI and in the applicable Prospectus, provided they are consistent with each Fund’s investmentobjective and do not violate any of its investment restrictions or policies.
General Considerations and RisksA discussion of some of the principal risks associated with an investment in a Fund is contained in the applicable Prospectus.
11
An investment in a Fund should be made with an understanding that the value of the Fund’s portfolio securities mayfluctuate in accordance with changes in the financial condition of the issuers of the portfolio securities, the value of preferredor common stocks in general, and other factors that affect the market.
Borrowing Risk. Borrowing may exaggerate changes in the net asset value of Fund shares and in the return on a Fund’sportfolio. Borrowing will cost a Fund interest expense and other fees. The costs of borrowing may reduce a Fund’s return.Borrowing may cause a Fund to liquidate positions when it may not be advantageous to do so to satisfy its obligations.
Custody Risk. Custody risk refers to the risks inherent in the process of clearing and settling trades and to the holding ofsecurities, cash and other assets by local banks, agents and depositories. Low trading volumes and volatile prices in lessdeveloped markets make trades harder to complete and settle, and governments or trade groups may compel local agents tohold securities in designated depositories that may not be subject to independent evaluation. Local agents are held only tothe standards of care of their local markets, and thus may be subject to limited or no government oversight. Communicationsbetween the U.S. and emerging market countries may be unreliable, increasing the risk of delayed settlements or losses ofsecurity certificates. In general, the less developed a country’s securities market is, the greater the likelihood of custodyproblems. Practices in relation to the settlement of securities transactions in emerging markets involve higher risks thanthose in developed markets, in part because of the use of brokers and counterparties that are often less well capitalized, andcustody and registration of assets in some countries may be unreliable. The possibility of fraud, negligence or undueinfluence being exerted by the issuer or refusal to recognize ownership exists in some emerging markets, and, along withother factors, could result in ownership registration being lost. In addition, the laws of certain countries may put limits on aFund’s ability to recover its assets if a foreign bank or depository or issuer of a security or an agent of any of the foregoinggoes bankrupt. A Fund would absorb any loss resulting from such custody problems and may have no successful claim forcompensation.
Dividend Risk. There is no guarantee that issuers of the stocks held by a Fund will declare dividends in the future or that, ifdeclared, they will either remain at current levels or increase over time.
Liquidity Risk Management Rule Risk. In October 2016, the SEC adopted the Liquidity Rule requiring open-end funds,including exchange-traded funds (“ETFs”) such as the Funds, to establish a liquidity risk management program and enhancedisclosures regarding fund liquidity. Effective December 1, 2018, as required by the Liquidity Rule, the Funds haveimplemented the initial portions of the Funds’ Liquidity Program, and the Board, including a majority of the independenttrustees/directors of the Funds have appointed BFA as the liquidity risk program administrator of the Liquidity Program.Under the Liquidity Program, BFA, assesses, manages, and periodically reviews each Fund’s liquidity risk. Certain aspects ofthe Liquidity Program have been implemented effective December 1, 2018, while the entire Program will take effect on June 1,2019. There are exclusions from certain portions of the liquidity risk management program requirements for “in-kind” ETFs,as defined in the Liquidity Rule.
National Closed Market Trading Risk. To the extent that the underlying securities held by a Fund trade on foreign exchangesor in foreign markets that are closed when the securities exchange on which a Fund’s shares trade is open, there are likely tobe deviations between the current price of such an underlying security and the last quoted price for the underlying security(i.e., a Fund’s quote from the closed foreign market). These deviations may result in premiums or discounts to a Fund’s NAVthat may be greater than those experienced by other ETFs.
Operational Risk. BFA and a Fund’s other service providers may experience disruptions or operating errors such asprocessing errors or human errors, inadequate or failed internal or external processes, or systems or technology failures, thatcould negatively impact the Funds. While service providers are required to have appropriate operational risk managementpolicies and procedures, their methods of operational risk management may differ from a Fund’s in the setting of priorities,the personnel and resources available or the effectiveness of relevant controls. BFA, through its monitoring and oversight ofservice providers, seeks to ensure that service providers take appropriate precautions to avoid and mitigate risks that couldlead to disruptions and operating errors. However, it is not possible for BFA or the other Fund service providers to identify allof the operational risks that may affect a Fund or to develop processes and controls to completely eliminate or mitigate theiroccurrence or effects.
Risk of Derivatives. A derivative is a financial contract, the value of which depends on, or is derived from, the value of anunderlying asset, such as a security, a commodity (such as gold or silver), a currency or an index (a measure of value or rates,such as the S&P 500® or the prime lending rate). A Fund may invest in futures contracts, securities options, CFDs (for theiShares S&P Small-Cap 600 Value ETF) and other derivatives. Compared to conventional securities, derivatives can be more
12

sensitive to changes in interest rates or to sudden fluctuations in market prices and thus a Fund’s losses may be greater if itinvests in derivatives than if it invests only in conventional securities. Derivatives are also subject to counterparty risk, whichis the risk that the other party in the transaction will not fulfill its contractual obligations. Derivatives generally involve theincurrence of leverage. To address such leverage and to prevent a Fund from being deemed to have issued senior securitiesas a result of an investment in derivatives, such Fund will segregate liquid assets equal to its obligations under the derivativesthroughout the life of the investment.
When a derivative is used as a hedge against a position that a Fund holds or is committed to purchase, any loss generated bythe derivative generally should be substantially offset by gains on the hedged investment, and vice versa. While hedging canreduce or eliminate losses, it can also reduce or eliminate gains, and in some cases, hedging can cause losses that are notoffset by gains, and the Fund will recognize losses on both the investment and the hedge. Hedges are sometimes subject toimperfect matching between the derivative and the underlying security, and there can be no assurance that a Fund’s hedgingtransactions, which entail additional transaction costs, will be effective.
Risk of Equity Securities. An investment in a Fund should be made with an understanding of the risks inherent in aninvestment in equity securities, including the risk that the financial condition of issuers may become impaired or that thegeneral condition of stock markets may deteriorate (either of which may cause a decrease in the value of the portfoliosecurities and thus in the value of shares of the Fund). Common stocks are susceptible to general stock market fluctuationsand to increases and decreases in value as market confidence and perceptions of their issuers change. These investorperceptions are based on various and unpredictable factors, including expectations regarding government, economic,monetary and fiscal policies, inflation and interest rates, economic expansion or contraction, and global or regional political,economic or banking crises. Holders of common stocks incur more risks than holders of preferred stocks and debtobligations because common stockholders generally have rights to receive payments from stock issuers that are inferior tothe rights of creditors, or holders of debt obligations or preferred stocks. Further, unlike debt securities, which typically have astated principal amount payable at maturity (the value of which, however, is subject to market fluctuations prior to maturity),or preferred stocks, which typically have a liquidation preference and which may have stated optional or mandatoryredemption provisions, common stocks have neither a fixed principal amount nor a maturity date. In addition, issuers may, intimes of distress or at their own discretion, decide to reduce or eliminate dividends, which may also cause their stock price todecline.
Each of the iShares International Preferred Stock ETF and the iShares Preferred and Income Securities ETF invests asignificant portion of its assets in preferred stock, although all of the Funds may invest in preferred stock. A Fund that investsin preferred stock may be exposed to certain risks not typically encountered by investing in common stock. Many preferredstocks pay dividends at a fixed rate, therefore, a preferred stock’s market price may be sensitive to changes in interest rates ina manner similar to bonds — that is, as interest rates rise, the value of the preferred stock is likely to decline. Many preferredstocks also allow holders to convert the preferred stock into common stock of the issuer; the market price of such preferredstocks may be sensitive to changes in the value of the issuer’s common stock. In addition, the ability of an issuer of preferredstock to pay dividends may deteriorate or the issuer may default (i.e., fail to make scheduled dividend payments on thepreferred stock or scheduled interest payments on other obligations of the issuer), which would negatively affect the value ofany such holding. Dividend payments on a preferred stock typically must be declared by the issuer’s board of directors. Anissuer’s board of directors is generally not under any obligation to pay a dividend (even if such dividends have accrued), andmay suspend payment of dividends on preferred stock at any time. Preferred stock is also subject to market volatility and theprice of preferred stock will fluctuate based on market demand. Preferred stock often has a call feature which allows theissuer to redeem the security at its discretion. Therefore, preferred stocks having a higher than average yield may be called bythe issuer, which may cause a decrease in the yield of a Fund that invested in the preferred stock.
Although most of the securities in each Underlying Index are listed on a securities exchange, the principal trading market forsome of the securities may be in the OTC market. The existence of a liquid trading market for certain securities may dependon whether dealers will make a market in such securities. There can be no assurance that a market will be made ormaintained or that any such market will be or remain liquid. The price at which securities may be sold and the value of aFund’s shares will be adversely affected if trading markets for the Fund’s portfolio securities are limited or absent, or ifbid/ask spreads are wide.
Risk of Futures and Options on Futures Transactions. There are several risks accompanying the utilization of futurescontracts and options on futures contracts. A position in futures contracts and options on futures contracts may be closedonly on the exchange on which the contract was made (or a linked exchange). While each Fund plans to utilize futures
13

contracts only if an active market exists for such contracts, there is no guarantee that a liquid market will exist for thecontract at a specified time. Futures contracts, by definition, project price levels in the future and not current levels ofvaluation; therefore, market circumstances may result in a discrepancy between the price of the future and the movement ina Fund’s Underlying Index. In the event of adverse price movements, a Fund would continue to be required to make dailycash payments to maintain its required margin. In such situations, if a Fund has insufficient cash, it may have to sell portfoliosecurities to meet daily margin requirements at a time when it may be disadvantageous to do so. In addition, a Fund may berequired to deliver the instruments underlying the futures contracts it has sold.
The risk of loss in trading futures contracts or uncovered call options in some strategies (e.g., selling uncovered stock indexfutures contracts) is potentially unlimited. The Funds do not plan to use futures and options contracts in this way. The risk ofa futures position may still be large as traditionally measured due to the low margin deposits required. In many cases, arelatively small price movement in a futures contract may result in immediate and substantial loss or gain to the investorrelative to the size of a required margin deposit. The Funds, however, intend to utilize futures and options contracts in amanner designed to limit their risk exposure to levels comparable to a direct investment in the types of stocks in which theyinvest.
Utilization of futures and options on futures by a Fund involves the risk of imperfect or even negative correlation to itsUnderlying Index if the index underlying the futures contract differs from the Underlying Index. There is also the risk of loss ofmargin deposits in the event of bankruptcy of a broker with whom a Fund has an open position in the futures contract oroption. The purchase of put or call options will be based upon predictions by BFA as to anticipated trends, which predictionscould prove to be incorrect.
Because the futures market generally imposes less burdensome margin requirements than the securities market, anincreased amount of participation by speculators in the futures market could result in price fluctuations. Certain financialfutures exchanges limit the amount of fluctuation permitted in futures contract prices during a single trading day. The dailylimit establishes the maximum amount by which the price of a futures contract may vary either up or down from theprevious day’s settlement price at the end of a trading session. Once the daily limit has been reached in a particular type ofcontract, no trades may be made on that day at a price beyond that limit. It is possible that futures contract prices couldmove to the daily limit for several consecutive trading days with little or no trading, thereby preventing prompt liquidation offutures positions and subjecting each Fund to substantial losses. In the event of adverse price movements, each Fund wouldbe required to make daily cash payments of variation margin.
Risk of Investing in Non-U.S. Equity Securities. An investment in any of the Funds that invest, directly or indirectly, in non-U.S. equity securities involves risks similar to those of investing in portfolios of equity securities traded on non-U.S.exchanges. These risks include market fluctuations caused by such factors as economic and political developments in thoseforeign countries, changes in interest rates and perceived trends in stock prices. Investing in securities issued by issuersdomiciled in countries other than the domicile of the investor and denominated in currencies other than an investor’s localcurrency entails certain considerations and risks not typically encountered by the investor in making investments in its homecountry and in that country’s currency. These considerations include favorable or unfavorable changes in interest rates,currency exchange rates, exchange control regulations and the costs that may be incurred in connection with conversionsbetween various currencies. Investing in any of these Funds also involves certain risks and considerations not typicallyassociated with investing in a fund whose portfolio contains exclusively securities of U.S. issuers. These risks includegenerally less liquid and less efficient securities markets; generally greater price volatility; less publicly available informationabout issuers; the imposition of withholding or other taxes; the imposition of restrictions on the expatriation of funds orother assets of the Funds; higher transaction and custody costs; delays and risks attendant in settlement procedures;difficulties in enforcing contractual obligations; lower liquidity and significantly smaller market capitalization; differentaccounting and disclosure standards; lower levels of regulation of the securities markets; more substantial governmentinterference with the economy and businesses; higher rates of inflation; greater social, economic, and political uncertainty;the risk of nationalization or expropriation of assets; and the risk of war.
Risk of Investing in Large-Capitalization Companies. Large-capitalization companies may be less able than smallercapitalization companies to adapt to changing market conditions. Large-capitalization companies may be more mature andsubject to more limited growth potential compared with smaller capitalization companies. During different market cycles, theperformance of large-capitalization companies has trailed the overall performance of the broader securities markets.
14

Risk of Investing in Micro-Capitalization Companies. Certain of the Funds may invest in securities of micro-capitalizationcompanies. Micro-capitalization companies may have limited operational histories and new or unproven product lines, ormay have product lines that are still in development. These companies may be more vulnerable than larger companies to keypersonnel losses due to reliance on a smaller number of management personnel. Micro-capitalization companies may havelimited financial resources and little or no access to additional credit and therefore may be more susceptible to market downturns or rising credit costs than larger, more established companies. Share prices of micro-capitalization companies may bemore volatile than those of larger companies and therefore a Fund’s share price may be more volatile than the share prices offunds that invest a larger percentage of assets in shares issued by small-, mid-, or large-capitalization companies. The sharesof micro-capitalization companies may be thinly traded and may be at risk for delisting from a securities exchange, making itdifficult for a Fund to buy and sell shares of a particular micro-capitalization company. In addition, there may be less publicinformation available about these companies.
Risk of Investing in Mid-Capitalization Companies. Stock prices of mid-capitalization companies may be more volatile thanthose of large-capitalization companies, and, therefore, a Fund’s share price may be more volatile than that of funds thatinvest a larger percentage of their assets in stocks issued by large-capitalization companies. Stock prices of mid-capitalizationcompanies are also more vulnerable than those of large-capitalization companies to adverse business or economicdevelopments, and the stocks of mid-capitalization companies may be less liquid, making it more difficult for the Funds tobuy and sell them. In addition, mid-capitalization companies generally have less diverse product lines than large-capitalization companies and are more susceptible to adverse developments.
Risk of Investing in Small-Capitalization Companies. Stock prices of small-capitalization companies may be more volatilethan those of larger companies, and, therefore, a Fund’s share price may be more volatile than that of funds that invest alarger percentage of their assets in stocks issued by large-capitalization or mid-capitalization companies. Stock prices ofsmall-capitalization companies are generally more vulnerable than those of large-capitalization or mid-capitalizationcompanies to adverse business and economic developments. The stocks of small-capitalization companies may be thinlytraded, making it difficult for the Funds to buy and sell them. In addition, small-capitalization companies are typically lessfinancially stable than larger, more established companies and may depend on a small number of essential personnel,making them more vulnerable to loss of personnel. Small-capitalization companies also normally have less diverse productlines than large-capitalization companies and are more susceptible to adverse developments concerning their products.
Risk of Non-U.S. Preferred Stock. A Fund that invests in preferred stock may be exposed to certain risks not typicallyencountered by investing in common stock. Many preferred stocks pay dividends at a fixed rate, therefore, a preferred stock’smarket price may be sensitive to changes in interest rates in a manner similar to bonds — that is, as interest rates rise, thevalue of the preferred stock is likely to decline. Many preferred stocks also allow holders to convert the preferred stock intocommon stock of the issuer; the market price of such preferred stocks can be sensitive to changes in the value of the issuer’scommon stock. In addition, the ability of an issuer of preferred stock to pay dividends may deteriorate or the issuer maydefault (i.e., fail to make scheduled dividend payments on the preferred stock or scheduled interest payments on otherobligations of the issuer), which would negatively affect the value of any such holding. Dividend payments on a preferredstock typically must be declared by the issuer’s board of directors. An issuer’s board of directors is generally not under anyobligation to pay a dividend (even if such dividends have accrued), and may suspend payment of dividends on preferredstock at any time. Preferred stock is also subject to market volatility and the price of preferred stock will fluctuate based onmarket demand. Preferred stock often has a call feature which allows the issuer to redeem the security at its discretion.Therefore, preferred stocks having a higher than average yield may be called by the issuer, which may cause a decrease in theyield of a fund that invested in the preferred stock. Also, non U.S. preferred stock may have different rights or privileges thanthose commonly associated with U.S. preferred stock. In addition to the risks listed above, investors in non U.S. preferredstock may experience difficulty or uncertainty in determining and enforcing their rights related to preferred stock.
Risk of Swap Agreements. The risk of loss with respect to swaps is generally limited to the net amount of payments that aFund is contractually obligated to make. Swap agreements are subject to the risk that the swap counterparty will default onits obligations to pay a Fund and the risk that a Fund will not be able to meet its obligations to pay the other party to theagreement. If such a default occurs, the parties will have contractual remedies pursuant to the agreements related to thetransaction. However, such remedies may be subject to bankruptcy and insolvency laws, which could affect such Fund’srights as a creditor (e.g., a Fund may not receive the net amount of payments that it is contractually entitled to receive). Swapagreements may also involve the risk that there is an imperfect correlation between the return on a Fund’s obligation to itscounterparty and the return on the referenced asset. In addition, swap agreements are subject to market and liquidity risk,leverage risk and hedging risk.
15
A Fund is required to post and collect variation margin (comprised of specified liquid securities subject to haircuts) inconnection with trading of OTC swaps. Implementation of regulations requiring posting of initial margin is being phased inthrough 2020. These requirements may raise the costs for a Fund’s investment in swaps.
Risk of Investing in Asia. Investments in securities of issuers in certain Asian countries involve risks not typically associatedwith investments in securities of issuers in other regions. Such heightened risks include, among others, expropriation and/ornationalization of assets, confiscatory taxation, piracy of intellectual property, data and other security breaches (especially ofdata stored electronically), political instability, including authoritarian and/or military involvement in governmental decision-making, armed conflict and social instability as a result of religious, ethnic and/or socio-economic unrest. Certain Asianeconomies have experienced rapid rates of economic growth and industrialization in recent years, and there is no assurancethat these rates of economic growth and industrialization will be maintained.
Certain Asian countries have democracies with relatively short histories, which may increase the risk of political instability.These countries have faced political and military unrest, and further unrest could present a risk to their local economies andsecurities markets. Indonesia and the Philippines have each experienced violence and terrorism, which has negativelyimpacted their economies. North Korea and South Korea each have substantial military capabilities, and historical tensionsbetween the two countries present the risk of war. Escalated tensions involving the two countries and any outbreak ofhostilities between the two countries, or even the threat of an outbreak of hostilities, could have a severe adverse effect onthe entire Asian region. Political, religious, and border disputes persist in India. India has recently experienced and maycontinue to experience civil unrest and hostilities with certain of its neighboring countries. Increased political and socialunrest in these geographic areas could adversely affect the performance of investments in this region.
Certain governments in this region administer prices on several basic goods, including fuel and electricity, within theirrespective countries. Certain governments may exercise substantial influence over many aspects of the private sector in theirrespective countries and may own or control many companies. Future government actions could have a significant effect onthe economic conditions in this region, which in turn could have a negative impact on private sector companies. There is alsothe possibility of diplomatic developments adversely affecting investments in the region.
Corruption and the perceived lack of a rule of law in dealings with international companies in certain Asian countries maydiscourage foreign investment and could negatively impact the long-term growth of certain economies in this region. Inaddition, certain countries in the region are experiencing high unemployment and corruption, and have fragile bankingsectors.
Some economies in this region are dependent on a range of commodities, including oil, natural gas and coal. Accordingly,they are strongly affected by international commodity prices and particularly vulnerable to any weakening in global demandfor these products. The market for securities in this region may also be directly influenced by the flow of international capital,and by the economic and market conditions of neighboring countries. Adverse economic conditions or developments inneighboring countries may increase investors’ perception of the risk of investing in the region as a whole, which mayadversely impact the market value of the securities issued by companies in the region.
Risk of Investing in Australasia. The economies of Australasia, which include Australia and New Zealand, are dependent onexports from the agricultural and mining sectors. This makes Australasian economies susceptible to fluctuations in thecommodity markets. Australasian economies are also increasingly dependent on their growing service industries. Australiaand New Zealand are located in a part of the world that has historically been prone to natural disasters, such as drought andflooding. Any such event in the future could have a significant adverse impact on the economies of Australia and NewZealand and affect the value of securities held by a Fund. The economies of Australia and New Zealand are dependent ontrading with certain key trading partners, including Asia, Europe and the U.S. The Australia–U.S. Free Trade Agreement hassignificantly expanded the trading relationship between the U.S. and Australia. Economic events in the U.S., Asia, or in otherkey trading countries can have a significant economic effect on the Australian economy. The economies of Australia and NewZealand are heavily dependent on the mining sector. Passage of new regulations limiting foreign ownership of companies inthe mining sector or imposition of new taxes on profits of mining companies may dissuade foreign investment, and as aresult, have a negative impact on companies to which a Fund has exposure.
Risk of Investing in Canada. The U.S. is Canada’s largest trading and investment partner, and the Canadian economy issignificantly affected by developments in the U.S. economy. Since the implementation of the North American Free TradeAgreement (“NAFTA”) in 1994 among Canada, the U.S. and Mexico, total two-way merchandise trade between the U.S. andCanada has more than doubled. Any downturn in U.S. or Mexican economic activity is likely to have an adverse impact on the
16

Canadian economy. The U.S. government has indicated that it may drop out of NAFTA. If this were to occur, it could have amaterial adverse impact on the Canadian economy, which could impact the value of the securities whose value is linked tothe Canadian economy. The U.S. has also recently imposed tariffs on Canadian aluminum and steel and threatened that itmay impose additional tariffs. These actions may have an adverse impact on Canadian securities. The Canadian economy isalso dependent upon external trade with other key trading partners, specifically China and the United Kingdom (the “U.K.”).As a result, Canada is dependent on the economies of these other countries. In addition, Canada is a large supplier of naturalresources (e.g., oil, natural gas and agricultural products). As a result, the Canadian economy is sensitive to fluctuations incertain commodity prices.
Risk of Investing in Central and South America. The economies of certain Central and South American countries haveexperienced high interest rates, economic volatility, inflation, currency devaluations, government defaults, highunemployment rates and political instability which can adversely affect issuers in these countries. In addition, commodities(such as oil, gas and minerals) represent a significant percentage of exports for the regions and many economies in theseregions are particularly sensitive to fluctuations in commodity prices. Adverse economic events in one country may have asignificant adverse effect on other countries of these regions.
The governments of certain countries in Central and South America may exercise substantial influence over many aspects ofthe private sector and may own or control many companies. Future government actions could have a significant effect on theeconomic conditions in such countries, which could have a negative impact on the securities in which a Fund invests.Diplomatic developments may also adversely affect investments in certain countries in Central and South America. Somecountries in Central and South America may be affected by public corruption and crime, including organized crime.
Certain countries in Central and South America may be heavily dependent upon international trade and, consequently, havebeen and may continue to be negatively affected by trade barriers, exchange controls, managed adjustments in relativecurrency values and other protectionist measures imposed or negotiated by the countries with which they trade. Thesecountries also have been and may continue to be adversely affected by economic conditions in the countries with which theytrade. In addition, certain issuers located in countries in Central and South America in which a Fund invests may havedealings with countries subject to sanctions and/or embargoes imposed by the U.S. government and the United Nationsand/or countries identified by the U.S. government as state sponsors of terrorism. An issuer may sustain damage to itsreputation if it is identified as an issuer that has dealings with such countries. A Fund may be adversely affected if it invests insuch issuers.
Risk of Investing in China. Investments in securities of companies domiciled in China involve a high degree of risk andspecial considerations not typically associated with investing in the U.S. securities markets. Such heightened risks include,among others, an authoritarian government, popular unrest associated with demands for improved political, economic andsocial conditions, the impact of regional conflict on the economy and hostile relations with neighboring countries.
Military conflicts, either in response to internal social unrest or conflicts with other countries, could disrupt economicdevelopment. The Chinese economy is vulnerable to the long-running disagreements with Hong Kong related to integrationand religious and nationalist disputes with Tibet and the Xinjiang region. China has a complex territorial dispute regardingthe sovereignty of Taiwan that has included threats of invasion; Taiwan-based companies and individuals are significantinvestors in China. Military conflict between China and Taiwan may adversely affect securities of Chinese issuers. In addition,China has strained international relations with Japan, India, Russia and other neighbors due to territorial disputes, historicalanimosities and other defense concerns. China could be affected by military events on the Korean peninsula or internalinstability within North Korea. These situations may cause uncertainty in the Chinese market and may adversely affectperformance of the Chinese economy.
The Chinese government has implemented significant economic reforms in order to liberalize trade policy, promote foreigninvestment in the economy, reduce government control of the economy and develop market mechanisms. However, therecan be no assurance that these reforms will continue or that they will be effective. Despite reforms and privatizations ofcompanies in certain sectors, the Chinese government still exercises substantial influence over many aspects of the privatesector and may own or control many companies. The Chinese government continues to maintain a major role in economicpolicy making and investing in China involves risk of loss due to expropriation, nationalization, confiscation of assets andproperty or the imposition of restrictions on foreign investments and on repatriation of capital invested. In addition, there isless regulation and monitoring of Chinese securities markets and the activities of investors, brokers and other participantsthan in the U.S. Accordingly, issuers of securities in China are not subject to the same degree of regulation as are U.S. issuers
17

with respect to such matters as insider trading rules, tender offer regulation, stockholder proxy requirements and therequirements mandating timely and accurate disclosure of information. Stock markets in China are in the process of changeand further development. This may lead to trading volatility, difficulty in the settlement and recording of transactions anddifficulty in interpreting and applying the relevant regulation.
While the Chinese economy has experienced past periods of rapid growth, there is no assurance that such growth rates willrecur. China may experience substantial rates of inflation or economic recessions, causing a negative effect on the economyand securities market. China’s economy is heavily dependent on export growth. Reduction in spending on Chinese productsand services, institution of tariffs or other trade barriers or a downturn in any of the economies of China’s key tradingpartners may have an adverse impact on the securities of Chinese issuers.
The tax laws and regulations in the PRC are subject to change, including the issuance of authoritative guidance orenforcement, possibly with retroactive effect. The interpretation, applicability and enforcement of such laws by PRC taxauthorities are not as consistent and transparent as those of more developed nations, and may vary over time and fromregion to region. The application and enforcement of PRC tax rules could have a significant adverse effect on a Fund and itsinvestors, particularly in relation to capital gains withholding tax imposed upon non-residents.
Risk of Investing in the Chinese Equity Markets. The iShares Global Clean Energy ETF may invest in H-shares (securities ofcompanies incorporated in the PRC that are denominated in Hong Kong dollars and listed on the Stock Exchange of HongKong (“SEHK”)) and/or B-shares (securities of companies incorporated in the PRC that are denominated in U.S. dollars (in thecase of the Shanghai Stock Exchange (“SSE”)) or Hong Kong dollars (in the case of the Shenzhen Stock Exchange (“SZSE”))and listed on the SSE and the SZSE). The iShares Global Clean Energy ETF may also invest in certain Hong Kong listedsecurities known as Red-Chips (securities issued by companies incorporated in certain foreign jurisdictions, which arecontrolled, directly or indirectly, by entities owned by the national government or local governments in the PRC and derivesubstantial revenues from or allocate substantial assets in the PRC) and P-Chips (securities issued by companiesincorporated in certain foreign jurisdictions, which are controlled, directly or indirectly, by individuals in the PRC and derivesubstantial revenues from or allocate substantial assets in the PRC).
Securities listed on the SSE or the SZSE are divided into two classes: A-shares (securities of companies incorporated in thePRC that are denominated in renminbi and listed on the SSE and SZSE), which are mostly limited to domestic investors, andB-shares, which are allocated for both international and domestic investors. The A-shares market is generally subject togreater government restrictions, including trading suspensions, which may lead to increased liquidity risks. The B-sharesmarket is generally smaller, less liquid and has a smaller issuer base than the A-shares market, which may lead to significantprice volatility. B-shares, H-shares, P-Chips or Red-Chips of issuers that also issue A-shares may trade at significant discountsto their A-shares counterparts. The issuance of B-shares and H-shares by Chinese companies and the ability to obtain a“back-door listing” through Red-Chips or P-Chips is still regarded by the Chinese authorities as an experiment in economicreform. “Back-door listing” is a means by which a mainland Chinese company issues Red-Chips or P-Chips to obtain quickaccess to international listing and international capital. All of these share mechanisms are relatively untested and subject topolitical and economic policies in China. Market developments, adverse investor perceptions, regulatory and governmentintervention (including the possibility of widespread trading suspensions implemented by regulators) and other factors maymake it difficult to acquire, dispose of or value Chinese securities, which would lead to adverse effects to the Fund.
Risk of Investing in Denmark. Investments in Danish issuers subject the Fund to legal, regulatory, political, currency,security, and economic risks specific to Denmark. Denmark’s industrialized market economy depends on imported rawmaterials and foreign trade. As a result, Denmark is dependent on trading relationships with certain key trading partners,including other European Union (“EU”) countries and the United States. Denmark’s economy has also been characterized byslow growth and is facing demographic challenges that could lead to labor supply shortages in the near future. Secessionistmovements, such as the Catalan movement in Spain or Scotland, may have an adverse effect on the Danish economy.
Risk of Investing in Developed Countries. Many countries with developed markets have recently experienced significanteconomic pressures. These countries generally tend to rely on the services sectors (e.g., the financial services sector) as theprimary source of economic growth and may be susceptible to the risks of individual service sectors. For example, companiesin the financial services sector are subject to governmental regulation and, recently, government intervention, which mayadversely affect the scope of their activities, the prices they can charge and amount of capital they must maintain. Recentdislocations in the financial sector and perceived or actual governmental influence over certain financial companies may leadto credit rating downgrades and, as a result, impact, among other things, revenue growth for such companies. If financial
18

companies experience a prolonged decline in revenue growth, certain developed countries that rely heavily on financialcompanies as an economic driver may experience a correlative slowdown. Recently, new concerns have emerged withrespect to the economic health of certain developed countries. These concerns primarily stem from heavy indebtedness ofmany developed countries and their perceived inability to continue to service high debt loads without simultaneouslyimplementing stringent austerity measures. Such concerns have led to tremendous downward pressure on the economies ofthese countries. As a result, it is possible that interest rates on debt of certain developed countries may rise to levels thatmake it difficult for such countries to service such debt. Spending on health care and retirement pensions in most developedcountries has risen dramatically over the last few years. Medical innovation, extended life expectancy and higher publicexpectations are likely to continue the increase in health care and pension costs. Any increase in health care and pensioncosts will likely have a negative impact on the economic growth of many developed countries. Certain developed countriesrely on imports of certain key items, such as crude oil, natural gas, and other commodities. As a result, an increase in demandfor, or price fluctuations of, certain commodities may negatively affect developed country economies. Developed marketcountries generally are dependent on the economies of certain key trading partners. Changes in any one economy may causean adverse impact on several developed countries. In addition, heavy regulation of, among others, labor and product marketsmay have an adverse effect on certain issuers. Such regulations may negatively affect economic growth or cause prolongedperiods of recession. Such risks, among others, may adversely affect the value of a Fund’s investments.
Risk of Investing in Emerging Markets. Investments in emerging market countries may be subject to greater risks thaninvestments in developed countries. These risks include: (i) less social, political, and economic stability; (ii) greater illiquidityand price volatility due to smaller or limited local capital markets for such securities, or low or non-existent trading volumes;(iii) custodians, clearinghouses, foreign exchanges and broker-dealers may be subject to less scrutiny and regulation by localauthorities; (iv) local governments may decide to seize or confiscate securities held by foreign investors and/or localgovernments may decide to suspend or limit an issuer’s ability to make dividend or interest payments; (v) local governmentsmay limit or entirely restrict repatriation of invested capital, profits, and dividends; (vi) capital gains may be subject to localtaxation, including on a retroactive basis; (vii) issuers facing restrictions on dollar or euro payments imposed by localgovernments may attempt to make dividend or interest payments to foreign investors in the local currency; (viii) investorsmay experience difficulty in enforcing legal claims related to the securities and/or local judges may favor the interests of theissuer over those of foreign investors; (ix) bankruptcy judgments may only be permitted to be paid in the local currency; (x)limited public information regarding the issuer may result in greater difficulty in determining market valuations of thesecurities; and (xi) lack of financial reporting on a regular basis, substandard disclosure and differences in accountingstandards may make it difficult to ascertain the financial health of an issuer.
Emerging market securities markets are typically marked by a high concentration of market capitalization and trading volumein a small number of issuers representing a limited number of industries, as well as a high concentration of ownership ofsuch securities by a limited number of investors. In addition, brokerage and other costs associated with transactions inemerging market securities can be higher, sometimes significantly, than similar costs incurred in securities markets indeveloped countries. Although some emerging markets have become more established and tend to issue securities of highercredit quality, the markets for securities in other emerging market countries are in the earliest stages of their development,and these countries issue securities across the credit spectrum. Even the markets for relatively widely traded securities inemerging market countries may not be able to absorb, without price disruptions, a significant increase in trading volume ortrades of a size customarily undertaken by institutional investors in the securities markets of developed countries. The limitedsize of many of these securities markets can cause prices to be erratic for reasons apart from factors that affect thesoundness and competitiveness of the securities issuers. For example, prices may be unduly influenced by traders whocontrol large positions in these markets. Additionally, market making and arbitrage activities are generally less extensive insuch markets, which may contribute to increased volatility and reduced liquidity of such markets. The limited liquidity ofemerging market country securities may also affect a Fund’s ability to accurately value its portfolio securities or to acquire ordispose of securities at the price and time it wishes to do so or in order to meet redemption requests.
Many emerging market countries suffer from uncertainty and corruption in their legal frameworks. Legislation may bedifficult to interpret and laws may be too new to provide any precedential value. Laws regarding foreign investment andprivate property may be weak or non-existent. Sudden changes in governments may result in policies which are lessfavorable to investors such as policies designed to expropriate or nationalize “sovereign” assets. Certain emerging marketcountries in the past have expropriated large amounts of private property, in many cases with little or no compensation, andthere can be no assurance that such expropriation will not occur in the future.
19

Investment in the securities markets of certain emerging market countries is restricted or controlled to varying degrees.These restrictions may limit a Fund’s investment in certain emerging market countries and may increase the expenses of theFund. Certain emerging market countries require governmental approval prior to investments by foreign persons or limitinvestment by foreign persons to only a specified percentage of an issuer’s outstanding securities or a specific class ofsecurities which may have less advantageous terms (including price) than securities of the company available for purchaseby nationals.
Many emerging market countries lack the social, political, and economic stability characteristic of the U.S. Political instabilityamong emerging market countries can be common and may be caused by an uneven distribution of wealth, social unrest,labor strikes, civil wars, and religious oppression. Economic instability in emerging market countries may take the form of: (i)high interest rates; (ii) high levels of inflation, including hyperinflation; (iii) high levels of unemployment orunderemployment; (iv) changes in government economic and tax policies, including confiscatory taxation; and (v)imposition of trade barriers.
A Fund’s income and, in some cases, capital gains from foreign securities will be subject to applicable taxation in certain ofthe emerging market countries in which it invests, and treaties between the U.S. and such countries may not be available insome cases to reduce the otherwise applicable tax rates.
Emerging markets also have different clearance and settlement procedures, and in certain of these emerging markets therehave been times when settlements have been unable to keep pace with the volume of securities transactions, making itdifficult to conduct such transactions.
In the past, certain governments in emerging market countries have become overly reliant on the international capitalmarkets and other forms of foreign credit to finance large public spending programs, which in the past have caused hugebudget deficits. Often, interest payments have become too overwhelming for a government to meet, representing a largepercentage of total GDP. These foreign obligations have become the subject of political debate and served as fuel for politicalparties of the opposition, which pressure the government not to make payments to foreign creditors, but instead to use thesefunds for, among other things, social programs. Either due to an inability to pay or submission to political pressure, foreigngovernments have been forced to seek a restructuring of their loan and/or bond obligations, have declared a temporarysuspension of interest payments or have defaulted. These events have adversely affected the values of securities issued byforeign governments and corporations domiciled in those countries and have negatively affected not only their cost ofborrowing, but their ability to borrow in the future as well.
Risk of Investing in Europe. Investing in European countries may expose a Fund to the economic and political risksassociated with Europe in general and the specific European countries in which it invests. The economies and markets ofEuropean countries are often closely connected and interdependent, and events in one European country can have anadverse impact on other European countries. A Fund makes investments in securities of issuers that are domiciled in, or havesignificant operations in, member states of the Economic and Monetary Union of the EU, which requires member states tocomply with restrictions on inflation rates, deficits, interest rates, debt levels and fiscal and monetary controls, each of whichmay significantly affect every country in Europe. Changes in imports or exports, changes in governmental or EU regulationson trade, changes in the exchange rate of the euro (the common currency of certain EU countries), the default or threat ofdefault by an EU member state on its sovereign debt, and/or an economic recession in an EU member state may have asignificant adverse effect on the economies of EU member states and their trading partners. Although certain Europeancountries do not use the euro, many of these countries are obliged to meet the criteria for joining the euro zone.Consequently, these countries must comply with many of the restrictions noted above. The European financial markets haveexperienced volatility and adverse trends in recent years due to concerns about economic downturns, rising governmentdebt levels and the possible default of government debt in several European countries, including, but not limited to, Cyprus,France, Greece, Ireland, Italy, Portugal, Spain and Ukraine. In order to prevent further economic deterioration, certaincountries, without prior warning, can institute “capital controls.” Countries may use these controls to restrict volatilemovements of capital entering and exiting their country. Such controls may negatively affect a Fund’s investments. A defaultor debt restructuring by any European country would adversely impact holders of that country’s debt and sellers of creditdefault swaps linked to that country’s creditworthiness, which may be located in countries other than those listed above. Inaddition, the credit ratings of certain European countries were recently downgraded. These downgrades may result in furtherdeterioration of investor confidence. These events have adversely affected the value and exchange rate of the euro and maycontinue to significantly affect the economies of every country in Europe, including countries that do not use the euro andnon-EU member states. Responses to the financial problems by European governments, central banks and others, including
20

austerity measures and reforms, may not produce the desired results, may result in social unrest and may limit future growthand economic recovery or have other unintended consequences. Further defaults or restructurings by governments andother entities of their debt could have additional adverse effects on economies, financial markets and asset valuations aroundthe world. In addition, one or more countries may abandon the euro and/or withdraw from the EU. The impact of theseactions, especially if they occur in a disorderly fashion, is not clear but could be significant and far-reaching and couldadversely impact the value of a Fund’s investments in the region. In a referendum held on June 23, 2016, the U.K. resolved toleave the EU. The referendum may introduce significant uncertainties and instability in the financial markets as the U.K.negotiates its exit from the EU. Although the precise timeframe for the U.K.’s withdrawal is uncertain, on March 29, 2017, theU.K. initiated the withdrawal process by sending a formal notice of the country’s intention to withdraw from the EU. Anagreement has been reached between the U.K. and the EU to continue negotiations on the U.K.’s exit from the EU. Theoutcome of negotiations remains uncertain. Secessionist movements, such as in Scotland or the Catalan movement in Spain,as well as governmental or other responses to such movements, may also create instability and uncertainty in the region. Theoccurrence of terrorist incidents throughout Europe also could impact financial markets. The impact of these events is notclear but could be significant and far-reaching and could adversely affect the value and liquidity of a Fund’s investments.
Risk of Investing in Japan. Japan may be subject to political, economic, nuclear, labor and other risks. Any of these risks,individually or in the aggregate, can impact an investment made in Japan.
Economic Risk. The growth of Japan’s economy has recently lagged that of its Asian neighbors and other major developedeconomies. Since 2000, Japan’s economic growth rate has generally remained low relative to other advanced economies, andit may remain low in the future. The Japanese economy is heavily dependent on international trade and has been adverselyaffected by trade tariffs, other protectionist measures, competition from emerging economies and the economic conditionsof its trading partners. Japan is also heavily dependent on oil imports, and higher commodity prices could therefore have anegative impact on the Japanese economy.
Political Risk. Historically, Japan has had unpredictable national politics and may experience frequent political turnover. Futurepolitical developments may lead to changes in policy that might adversely affect a Fund’s investments. In addition, China hasbecome an important trading partner with Japan. Japan’s political relationship with China, however, has been strained. Shouldpolitical tension increase, it could adversely affect the Japanese economy and destabilize the region as a whole.
Large Government Debt Risk. The Japanese economy faces several concerns, including a financial system with large levels ofnonperforming loans, over-leveraged corporate balance sheets, extensive cross-ownership by major corporations, a changingcorporate governance structure, and large government deficits. These issues may cause a slowdown of the Japaneseeconomy.
Currency Risk. The Japanese yen has fluctuated widely at times and any increase in its value may cause a decline in exportsthat could weaken the Japanese economy. Japan has, in the past, intervened in the currency markets to attempt to maintainor reduce the value of the yen. Japanese intervention in the currency markets could cause the value of the yen to fluctuatesharply and unpredictably and could cause losses to investors.
Nuclear Energy Risk. The nuclear power plant catastrophe in Japan in March 2011 may have long-term effects on theJapanese economy and its nuclear energy industry, the extent of which are currently unknown.
Labor Risk. Japan has an aging workforce and has experienced a significant population decline in recent years. Japan’s labormarket appears to be undergoing fundamental structural changes, as a labor market traditionally accustomed to lifetimeemployment adjusts to meet the need for increased labor mobility, which may adversely affect Japan’s economiccompetitiveness.
Geographic Risk. Natural disasters, such as earthquakes, volcanic eruptions, typhoons and tsunamis, could occur in Japan orsurrounding areas and could negatively affect the Japanese economy, and, in turn, could negatively affect a Fund.
Security Risk. Japan’s relations with its neighbors, particularly China, North Korea, South Korea and Russia, have at times beenstrained due to territorial disputes, historical animosities and defense concerns. Most recently, the Japanese government hasshown concern over the increased nuclear and military activity by North Korea and China. Strained relations may causeuncertainty in the Japanese markets and adversely affect the overall Japanese economy, particularly in times of crisis.
21

Risk of Investing in the Middle East. Many Middle Eastern countries have little or no democratic tradition, and the politicaland legal systems in such countries may have an adverse impact on a Fund. Many economies in the Middle East are highlyreliant on income from the sale of oil or trade with countries involved in the sale of oil, and their economies are thereforevulnerable to changes in the market for oil and foreign currency values. As global demand for oil fluctuates, many MiddleEastern economies may be significantly impacted.
In addition, many Middle Eastern governments have exercised and continue to exercise substantial influence over manyaspects of the private sector. In certain cases, a Middle Eastern country’s government may own or control many companies,including some of the largest companies in the country. Accordingly, governmental actions in the future could have asignificant effect on economic conditions in Middle Eastern countries. This could affect private sector companies and a Fund,as well as the value of securities in the Fund’s portfolio.
Certain Middle Eastern markets are in the earliest stages of development. As a result, there may be a high concentration ofmarket capitalization and trading volume in a small number of issuers representing a limited number of industries, as well asa high concentration of investors and financial intermediaries. Brokers in Middle Eastern countries typically are fewer innumber and less capitalized than brokers in the U.S.
The legal systems in certain Middle Eastern countries also may have an adverse impact on a Fund. For example, the potentialliability of a shareholder in a U.S. corporation with respect to acts of the corporation generally is limited to the amount of theshareholder’s investment. However, the notion of limited liability is less clear in certain Middle Eastern countries. A Fundtherefore may be liable in certain Middle Eastern countries for the acts of a corporation in which it invests for an amountgreater than its actual investment in that corporation. Similarly, the rights of investors in Middle Eastern issuers may be morelimited than those of shareholders of a U.S. corporation. It may be difficult or impossible to obtain or enforce a legaljudgment in a Middle Eastern country. Some Middle Eastern countries prohibit or impose substantial restrictions oninvestments in their capital markets, particularly their equity markets, by foreign entities such as a Fund. For example, certaincountries may require governmental approval prior to investment by foreign persons or limit the amount of investment byforeign persons in a particular issuer. Certain Middle Eastern countries may also limit investment by foreign persons to only aspecific class of securities of an issuer that may have less advantageous terms (including price) than securities of the issueravailable for purchase by nationals of the relevant Middle Eastern country.
The manner in which foreign investors may invest in companies in certain Middle Eastern countries, as well as limitations onthose investments, may have an adverse impact on the operations of a Fund. For example, in certain of these countries, aFund may be required to invest initially through a local broker or other entity and then have the shares that were purchasedre-registered in the name of a Fund. Re-registration in some instances may not be possible on a timely basis. This may resultin a delay during which a Fund may be denied certain of its rights as an investor, including rights as to dividends or to bemade aware of certain corporate actions. There also may be instances where a Fund places a purchase order but issubsequently informed, at the time of re-registration, that the permissible allocation of the investment to foreign investorshas already been filled and, consequently, a Fund may not be able to invest in the relevant company.
Substantial limitations may exist in certain Middle Eastern countries with respect to a Fund’s ability to repatriate investmentincome or capital gains. A Fund could be adversely affected by delays in, or a refusal to grant, any required governmentalapproval for repatriation of capital, as well as by the application to a Fund of any restrictions on investment.
Certain Middle Eastern countries may be heavily dependent upon international trade and, consequently, have been and maycontinue to be negatively affected by trade barriers, exchange controls, managed adjustments in relative currency values andother protectionist measures imposed or negotiated by the countries with which they trade. These countries also have beenand may continue to be adversely impacted by economic conditions in the countries with which they trade. In addition,certain issuers located in Middle Eastern countries in which a Fund invests may operate in, or have dealings with, countriessubject to sanctions and/or embargoes imposed by the U.S. government and the United Nations, and/or countries identifiedby the U.S. government as state sponsors of terrorism. As a result, an issuer may sustain damage to its reputation if it isidentified as an issuer which operates in, or has dealings with, such countries. A Fund, as an investor in such issuers, will beindirectly subject to those risks.
Certain Middle Eastern countries have strained relations with other Middle Eastern countries due to territorial disputes,historical animosities, defense concerns or other reasons, which may adversely affect the economies of these Middle Easterncountries. Certain Middle Eastern countries experience significant unemployment, as well as widespread underemployment.There has also been a recent increase in recruitment efforts and an aggressive push for territorial control by terrorist groups
22

in the region, which has led to an outbreak of warfare and hostilities. Warfare in Syria has spread to surrounding areas,including many portions of Iraq and Turkey. Such hostilities may continue into the future or may escalate at any time due toethnic, racial, political, religious or ideological tensions between groups in the region or foreign intervention or lack ofintervention, among other factors.
Risk of Investing in North America. A decrease in imports or exports, changes in trade regulations or an economic recessionin any North American country can have a significant economic effect on the entire North American region and on some orall of the North American countries in which a Fund invests.
The U.S. is Canada’s and Mexico’s largest trading and investment partner. The Canadian and Mexican economies aresignificantly affected by developments in the U.S. economy. Since the implementation of NAFTA in 1994 among Canada, theU.S. and Mexico, total merchandise trade among the three countries has increased. However, political developments in theU.S., including possible termination of NAFTA and imposition of tariffs by the U.S. on Canadian aluminum and steel, mayhave implications for the trade arrangements among the U.S., Mexico and Canada, which could negatively affect the value ofsecurities held by a Fund. Policy and legislative changes in one country may have a significant effect on North Americanmarkets generally, as well as on the value of certain securities held by a Fund.
U.S. Economic Trading Partners Risk. The U.S. is a significant, and in some cases the most significant, trading partner of, orforeign investor in, the country or countries in which a Fund invests. As a result, economic conditions of such countries maybe particularly affected by changes in the U.S. economy. The U.S. economy has recently experienced very difficult conditionsand increased volatility, as well as significant adverse trends. While government intervention and recent legislation has beenenacted to improve the U.S. economy, the recovery has been fragile and modest. A decrease in U.S. imports, new trade andfinancial regulations, changes in the U.S. dollar exchange rate or an economic slowdown in the U.S. may have a materialadverse effect on a country’s economic conditions and, as a result, securities to which a Fund has exposure.
Risk of Investing in the Aerospace and Defense Industry. The aerospace and defense industry can be significantly affectedby government defense and aerospace regulation and spending policies. The aerospace industry in particular has recentlybeen affected by adverse economic conditions and consolidation within the industry.
Risk of Investing in the Automotive Sub-Industry. The automotive sub-industry can be highly cyclical, and companies in theautomotive sub-industry may suffer periodic losses. The automotive sub-industry is also highly competitive and there maybe, at times, excess capacity in the global and domestic automotive sub-industry. Over the last several decades, the U.S.automotive sub-industry has experienced periodic downturns; certain automotive companies required stimulus from the U.S.government, while others formed strategic industry alliances in order to weather the substantially difficult market conditions.In general, the automotive sub-industry is susceptible to labor disputes, product defect litigation, patent expiration, increasedpension liabilities, rise in material or component prices and changing consumer tastes.
Risk of Investing in the Biotechnology Industry. Biotechnology companies depend on the successful development of newand proprietary technologies. There can be no assurance that the development of new technologies will be successful or thatintellectual property rights will be obtained with respect to new technologies. The loss or impairment of intellectual propertyrights may adversely affect the profitability of biotechnology companies. In addition, companies in the biotechnologyindustry spend heavily on research and development and their products or services may not prove commercially successfulor may become obsolete quickly. The risks of high development costs may be exacerbated by the inability to raise prices as aresult of managed care pressure, government regulation or price controls. Biotechnology companies can suffer persistentlosses during the transition of new products from development to production or when products are or may be subject toregulatory approval processes or regulatory scrutiny and, as a consequence, the earnings of biotechnology companies maybe erratic. Companies in the biotechnology industry are also exposed to the risk that they will be subject to products liabilityclaims. Companies involved in the biotechnology industry may be subject to extensive government regulations by the U.S.Food and Drug Administration, the U.S. Environmental Protection Agency and the U.S. Department of Agriculture, amongother foreign and domestic regulators. Such regulation may significantly affect and limit biotechnology research, productdevelopment and approval of products.
Risk of Investing in the Capital Goods Industry. Companies in the capital goods industry may be affected by fluctuations inthe business cycle and by other factors affecting manufacturing demands. Companies in the capital goods industry dependheavily on corporate spending. Companies in the capital goods industry may perform well during times of economicexpansion, and as economic conditions worsen, the demand for capital goods may decrease due to weakening demand,worsening business cash flows, tighter credit controls and deteriorating profitability. During times of economic volatility,
23

corporate spending may fall and adversely affect the capital goods industry. This industry may also be affected by changes ininterest rates, corporate tax rates and other government policies. Many capital goods are sold internationally and suchcompanies are subject to market conditions in other countries and regions.
Risk of Investing in the Clean Energy Sub-Industry. Many clean energy companies are involved in the development andcommercialization of new technologies, which may be subject to delays resulting from budget constraints and technologicaldifficulties. Clean energy companies may be highly dependent upon government subsidies and contracts with governmententities, and may be negatively affected if such subsidies or contracts are unavailable. Clean energy companies may dependon the successful development of new and proprietary technologies. There can be no assurance that the development ofnew technologies will be successful or that intellectual property rights will be obtained with respect to new technologies. Theloss or impairment of intellectual property rights may adversely affect the profitability of clean energy companies. In addition,seasonal weather conditions, fluctuations in supply of, and demand for, clean energy products, changes in energy prices,international political events, the success of project development and change in government regulatory policies may causefluctuations in the performance of clean energy companies and the prices of their securities.
Risk of Investing in the Commercial and Professional Services Industry. The success of commercial and professionalservice providers is tied closely to the performance of domestic and international economies, interest rates, exchange rates,competition, availability of qualified personnel and corporate demand. The commercial and professional services industrydepends heavily on corporate spending. Companies in the commercial and professional services industry may be subject tosevere competition, which may also have an adverse impact on their profitability.
Risk of Investing in the Communication Services Sector. The communication services sector consists of both companies inthe telecommunication services industry as well as those in the media and entertainment industry. Examples of companies inthe telecommunication services industry group include providers of fiber-optic, fixed-line, cellular and wirelesstelecommunications networks. Companies in the media and entertainment industry group encompass a variety of servicesand products including television broadcasting, gaming products, social media, networking platforms, online classifieds,online review websites and Internet search engines.
The communication services sector of a country’s economy is often subject to extensive government regulation. The costs ofcomplying with governmental regulations, delays or failure to receive required regulatory approvals, or the enactment of newregulatory requirements may negatively affect the business of communications companies. Government actions around theworld, specifically in the area of pre-marketing clearance of products and prices, can be arbitrary and unpredictable.Companies in the communication services sector may encounter distressed cash flows due to the need to commitsubstantial capital to meet increasing competition, particularly in developing new products and services using newtechnology. Technological innovations may make the products and services of certain communications companies obsolete.
The domestic telecommunications market is characterized by increasing competition and regulation by the U.S. FederalCommunications Commission and various state regulatory authorities. Telecommunications providers are often required toobtain franchises or licenses in order to provide services in a given location. Licensing and franchise rights in thetelecommunications sector are limited, which may provide an advantage to certain participants. Limited availability of suchrights, high barriers to market entry and regulatory oversight, among other factors, have led to consolidation of companieswithin the sector, which could lead to further regulation or other negative effects in the future.
Companies in the media and entertainment industries can be significantly affected by several factors, including competition,particularly in formulation products and services using new technologies, cyclicality of revenues and earnings, a potentialdecrease in the discretionary income of targeted individuals, changing consumer tastes and interests, and the potentialincrease in state and federal government regulation. Companies in the media and entertainment industries may becomeobsolete quickly. Advertising spending can be an important revenue source for media and entertainment companies. Duringeconomic downturns advertising spending typically decreases and, as a result, media and entertainment companies tend togenerate less revenue.
Risk of Investing in the Consumer Discretionary Sector. Companies engaged in the design, production or distribution ofproducts or services for the consumer discretionary sector (including, without limitation, television and radio broadcasting,manufacturing, publishing, recording and musical instruments, motion pictures, photography, amusement and theme parks,gaming casinos, sporting goods and sports arenas, camping and recreational equipment, toys and games, apparel, travel-related services, automobiles, hotels and motels, and fast food and other restaurants) are subject to the risk that theirproducts or services may become obsolete quickly. The success of these companies can depend heavily on disposable
24

household income and consumer spending. During periods of an expanding economy, the consumer discretionary sectormay outperform the consumer staples sector, but may underperform when economic conditions worsen. Moreover, theconsumer discretionary sector can be significantly affected by several factors, including, without limitation, the performanceof domestic and international economies, exchange rates, changing consumer preferences, demographics, marketingcampaigns, cyclical revenue generation, consumer confidence, commodity price volatility, labor relations, interest rates,import and export controls, intense competition, technological developments and government regulation.
Risk of Investing in the Consumer Goods Industry. Companies in the consumer goods industry include companies involvedin the design, production or distribution of goods for consumers, including food, household, home, personal and officeproducts, clothing and textiles. The success of the consumer goods industry is tied closely to the performance of thedomestic and international economy, interest rates, exchange rates, competition, consumer confidence and consumerdisposable income. The consumer goods industry may be affected by trends, marketing campaigns and other factorsaffecting consumer demand. Governmental regulation affecting the use of various food additives may affect the profitabilityof certain companies in the consumer goods industry. Moreover, international events may affect food and beveragecompanies that derive a substantial portion of their net income from foreign countries. In addition, tobacco companies maybe adversely affected by new laws, regulations and litigation. Many consumer goods may be marketed globally, andconsumer goods companies may be affected by the demand and market conditions in other countries and regions.Companies in the consumer goods industry may be subject to severe competition, which may also have an adverse impacton their profitability. Changes in demographics and consumer preferences may affect the success of consumer products.
Risk of Investing in the Consumer Services Industry. The success of consumer product manufacturers and retailers(including food and drug retailers, general retailers, media, and travel and leisure) is tied closely to the performance of thedomestic and international economy, interest rates, exchange rates, competition and consumer confidence. The consumerservices industry depends heavily on disposable household income and consumer spending. Companies in the consumerservices industry may be subject to severe competition, which may also have an adverse impact on their profitability.Changes in demographics and consumer preferences may affect the success of consumer service providers.
Risk of Investing in the Consumer Staples Sector. Companies in the consumer staples sector may be adversely affected bychanges in the global economy, consumer spending, competition, demographics and consumer preferences, and productionspending. Companies in the consumer staples sector may also be affected by changes in global economic, environmentaland political events, economic conditions, the depletion of resources, and government regulation. For instance, governmentregulations may affect the permissibility of using various food additives and production methods of companies that makefood products, which could affect company profitability. In addition, tobacco companies may be adversely affected by theadoption of proposed legislation and/or by litigation. Companies in the consumer staples sector also may be subject to riskspertaining to the supply of, demand for and prices of raw materials. The prices of raw materials fluctuate in response to anumber of factors, including, without limitation, changes in government agricultural support programs, exchange rates,import and export controls, changes in international agricultural and trading policies, and seasonal and weather conditions.Companies in the consumer staples sector may be subject to severe competition, which may also have an adverse impact ontheir profitability.
Risk of Investing in the Energy Sector. Companies in the energy sector are strongly affected by the levels and volatility ofglobal energy prices, energy supply and demand, government regulations and policies, energy production and conservationefforts, technological change, development of alternative energy sources, and other factors that they cannot control. Thesecompanies may also lack resources and have limited business lines. Energy companies may have relatively high levels of debtand may be more likely to restructure their businesses if there are downturns in certain energy markets or in the globaleconomy. If an energy company in a Fund’s portfolio becomes distressed, a Fund could lose all or a substantial portion of itsinvestment.
The energy sector is cyclical and is highly dependent on commodity prices; prices and supplies of energy may fluctuatesignificantly over short and long periods of time due to, among other things, national and international political changes,Organization of Petroleum Exporting Countries (“OPEC”) policies, changes in relationships among OPEC members andbetween OPEC and oil-importing nations, the regulatory environment, taxation policies, and the economy of the key energy-consuming countries. Commodity prices have recently been subject to increased volatility and declines, which maynegatively affect companies in which a Fund invests.
25

Companies in the energy sector may be adversely affected by terrorism, natural disasters or other catastrophes. Companiesin the energy sector are at risk of civil liability from accidents resulting in injury, loss of life or property, pollution or otherenvironmental damage claims. Disruptions in the oil industry or shifts in fuel consumption may significantly impactcompanies in this sector. Significant oil and gas deposits are located in emerging markets countries where corruption andsecurity may raise significant risks, in addition to the other risks of investing in emerging markets. Additionally, the MiddleEast, where many companies in the energy sector may operate, has historically and recently experienced widespread socialunrest.
Companies in the energy sector may also be adversely affected by changes in exchange rates, interest rates, economicconditions, tax treatment, government regulation and intervention, negative perception, efforts at energy conservation andworld events in the regions in which the companies operate (e.g., expropriation, nationalization, confiscation of assets andproperty or the imposition of restrictions on foreign investments and repatriation of capital, military coups, social unrest,violence or labor unrest). Because a significant portion of revenues of companies in this sector is derived from a relativelysmall number of customers that are largely composed of governmental entities and utilities, governmental budgetconstraints may have a significant impact on the stock prices of companies in this sector. The energy sector is highlyregulated. Entities operating in the energy sector are subject to significant regulation of nearly every aspect of theiroperations by federal, state and local governmental agencies. Such regulation can change rapidly or over time in both scopeand intensity. Stricter laws, regulations or enforcement policies could be enacted in the future which would likely increasecompliance costs and may materially adversely affect the financial performance of companies in the energy sector.
Risk of Investing in the Financials Sector. Companies in the financials sector include regional and money center banks,securities brokerage firms, asset management companies, savings banks and thrift institutions, specialty finance companies(e.g., credit card, mortgage providers), insurance and insurance brokerage firms, consumer finance firms, financialconglomerates and foreign banking and financial companies.
Most financial companies are subject to extensive governmental regulation, which limits their activities and may affect theirability to earn a profit from a given line of business. Government regulation may change frequently and may have significantadverse consequences for companies in the financials sector, including effects not intended by the regulation. Directgovernmental intervention in the operations of financial companies and financial markets may materially and adversely affectthe companies in which a Fund invests, including legislation in many countries that may increase government regulation,repatriation and other intervention. The impact of governmental intervention and legislative changes on any individualfinancial company or on the financials sector as a whole cannot be predicted. The valuation of financial companies has beenand continues to be subject to unprecedented volatility and may be influenced by unpredictable factors, including interestrate risk and sovereign debt default. Certain financial businesses are subject to intense competitive pressures, includingmarket share and price competition. Financial companies in foreign countries are subject to market specific and generalregulatory and interest rate concerns. In particular, government regulation in certain foreign countries may include taxes andcontrols on interest rates, credit availability, minimum capital requirements, bans on short sales, limits on prices andrestrictions on currency transfers. In addition, companies in the financials sector may be the targets of hacking and potentialtheft of proprietary or customer information or disruptions in service, which could have a material adverse effect on theirbusinesses.
The profitability of banks, savings and loan associations and financial companies is largely dependent on the availability andcost of capital funds and can fluctuate significantly when interest rates change; for instance, when interest rates go up, thevalue of securities issued by many types of companies in the financials sector generally goes down. In other words, financialcompanies may be adversely affected in certain market cycles, including, without limitation, during periods of rising interestrates, which may restrict the availability and increase the cost of capital, and during periods of declining economicconditions, which may cause, among other things, credit losses due to financial difficulties of borrowers.
In addition, general economic conditions are important to the operations of these companies, and financial difficulties ofborrowers may have an adverse effect on the profitability of financial companies. Financial companies can be highlydependent upon access to capital markets, and any impediments to such access, such as adverse overall economicconditions or a negative perception in the capital markets of a financial company’s financial condition or prospects, couldadversely affect its business. Deterioration of credit markets can have an adverse impact on a broad range of financialmarkets, causing certain financial companies to incur large losses. In these conditions, companies in the financials sectormay experience significant declines in the valuation of their assets, take actions to raise capital and even cease operations.Some financial companies may also be required to accept or borrow significant amounts of capital from government sources
26

and may face future government-imposed restrictions on their businesses or increased government intervention. In addition,there is no guarantee that governments will provide any such relief in the future. These actions may cause the securities ofmany companies in the financials sector to decline in value.
Risk of Investing in the Healthcare Sector. Companies in the healthcare sector are often issuers whose profitability may beaffected by extensive government regulation, restrictions on government reimbursement for medical expenses, rising orfalling costs of medical products and services, pricing pressure, an increased emphasis on outpatient services, a limitednumber of products, industry innovation, changes in technologies and other market developments. Many healthcarecompanies are heavily dependent on patent protection and the actual or perceived safety and efficiency of their products.
Patents have a limited duration, and, upon expiration, other companies may market substantially similar “generic” productsthat are typically sold at a lower price than the patented product, which can cause the original developer of the product tolose market share and/or reduce the price charged for the product, resulting in lower profits for the original developer. As aresult, the expiration of patents may adversely affect the profitability of these companies.
In addition, because the products and services of many companies in the healthcare sector affect the health and well-beingof many individuals, these companies are especially susceptible to extensive litigation based on product liability and similarclaims. Healthcare companies are subject to competitive forces that may make it difficult to raise prices and, in fact, mayresult in price discounting. Many new products in the healthcare sector may be subject to regulatory approvals. The processof obtaining such approvals may be long and costly, which can result in increased development costs, delayed cost recoveryand loss of competitive advantage to the extent that rival companies have developed competing products or procedures,adversely affecting the company’s revenues and profitability. In other words, delays in the regulatory approval process maydiminish the opportunity for a company to profit from a new product or to bring a new product to market, which could havea material adverse effect on a company’s business. Healthcare companies may also be strongly affected by scientificbiotechnology or technological developments, and their products may quickly become obsolete. Also, many healthcarecompanies offer products and services that are subject to governmental regulation and may be adversely affected by changesin governmental policies or laws. Changes in governmental policies or laws may span a wide range of topics, including costcontrol, national health insurance, incentives for compensation in the provision of healthcare services, tax incentives andpenalties related to healthcare insurance premiums, and promotion of prepaid healthcare plans. In addition, a number oflegislative proposals concerning healthcare have been considered by the U.S. Congress in recent years. It is unclear whatproposals will ultimately be enacted, if any, and what effect they may have on companies in the healthcare sector.
Additionally, the expansion of facilities by healthcare-related providers may be subject to “determinations of need” by certaingovernment authorities. This process not only generally increases the time and costs involved in these expansions, but alsomakes expansion plans uncertain, limiting the revenue and profitability growth potential of healthcare-related facilitiesoperators and negatively affecting the prices of their securities. Moreover, in recent years, both local and nationalgovernmental budgets have come under pressure to reduce spending and control healthcare costs, which could bothadversely affect regulatory processes and public funding available for healthcare products, services and facilities.
Risk of Investing in the Home Construction Industry. The home construction industry may be significantly affected bychanges in government spending, zoning laws, economic conditions, interest rates, commodity prices, consumer confidenceand spending, taxation, demographic patterns, real estate values, overbuilding, housing starts, and new and existing homesales. Rising interest rates, reductions in mortgage availability to consumers, increasing foreclosure rates or increases in thecosts of owning a home could reduce the market for new homes and adversely affect the profitability of home constructioncompanies. Different segments of the home construction industry can be significantly affected by environmental clean-upcosts and catastrophic events such as earthquakes, hurricanes and terrorist acts. Home construction companies may lackdiversification, due to ownership of a limited number of properties and concentration in a particular geographic region orproperty type.
Risk of Investing in the Industrials Sector. The value of securities issued by companies in the industrials sector may beadversely affected by supply of and demand for both their specific products or services and for industrials sector products ingeneral. The products of manufacturing companies may face obsolescence due to rapid technological developments andfrequent new product introduction. Government regulations, world events and economic conditions may affect theperformance of companies in the industrials sector. The industrials sector may also be adversely affected by changes ortrends in commodity prices, which may be influenced by unpredictable factors. Aerospace and defense companies, acomponent of the industrials sector, can be significantly affected by government spending policies because companies
27

involved in this industry rely, to a significant extent, on government demand for their products and services. Thus, thefinancial condition of, and investor interest in, aerospace and defense companies are heavily influenced by governmentaldefense spending policies, which are typically under pressure from efforts to control government budgets. Transportationstocks, a component of the industrials sector, are cyclical and can be significantly affected by economic changes, fuel prices,labor relations and insurance costs. Transportation companies in certain countries may also be subject to significantgovernment regulation and oversight, which may adversely affect their businesses. For example, commodity price declinesand unit volume reductions resulting from an over-supply of materials used in the industrials sector can adversely affect thesector. Furthermore, companies in the industrials sector may be subject to liability for environmental damage, productliability claims, depletion of resources, and mandated expenditures for safety and pollution control.
Risk of Investing in the Information Technology Sector. Information technology companies face intense competition, bothdomestically and internationally, which may have an adverse effect on profit margins. Like other technology companies,information technology companies may have limited product lines, markets, financial resources or personnel. The productsof information technology companies may face product obsolescence due to rapid technological developments and frequentnew product introduction, unpredictable changes in growth rates and competition for the services of qualified personnel.Technology companies and companies that rely heavily on technology, especially those of smaller, less-seasoned companies,tend to be more volatile than the overall market. Companies in the information technology sector are heavily dependent onpatent and intellectual property rights. The loss or impairment of these rights may adversely affect the profitability of thesecompanies. Finally, while all companies may be susceptible to network security breaches, certain companies in theinformation technology sector may be particular targets of hacking and potential theft of proprietary or consumerinformation or disruptions in service, which could have a material adverse effect on their businesses. These risks areheightened for information technology companies in foreign markets.
Risk of Investing in the Infrastructure Industry. Companies in the infrastructure industry may be subject to a variety offactors that could adversely affect their business or operations, including high interest costs in connection with capitalconstruction programs, high degrees of leverage, costs associated with governmental, environmental and other regulations,the effects of economic slowdowns, increased competition from other providers of services, uncertainties concerning costs,the level of government spending on infrastructure projects, and other factors. Infrastructure companies may be adverselyaffected by commodity price volatility, changes in exchange rates, import controls, depletion of resources, technologicaldevelopments, and labor relations. There is also the risk that corruption may negatively affect publicly funded infrastructureprojects, especially in emerging markets, resulting in delays and cost overruns. Infrastructure issuers can be significantlyaffected by government spending policies because companies involved in this industry rely to a significant extent on U.S. andother government demand for their products.
Infrastructure companies in the oil and gas industry may be adversely affected by government regulation or world events inthe regions where the companies operate (e.g., expropriation, nationalization, confiscation of assets and property or theimposition of restrictions on foreign investments and repatriation of capital, military coups, social unrest, violence or laborunrest). Infrastructure companies may have significant capital investments in, or engage in transactions involving, emergingmarket countries, which may heighten these risks.
Operations Risk. The failure of an infrastructure company to carry adequate insurance or to operate its assets appropriatelycould lead to significant losses. Infrastructure may be adversely affected by environmental clean-up costs and catastrophicevents such as earthquakes, hurricanes and terrorist acts.
Customer Risk. Infrastructure companies can be dependent upon a narrow customer base. Additionally, if these customersfail to pay their obligations, significant revenues could be lost and may not be replaceable.
Regulatory Risk. Infrastructure companies may be subject to significant regulation by various governmental authorities andalso may be affected by regulation of rates charged to customers, service interruption due to environmental, operational orother events, the imposition of special tariffs and changes in tax laws, regulatory policies and accounting standards.
Strategic Asset Risk. Infrastructure companies may control significant strategic assets (e.g., major pipelines or highways),which are assets that have a national or regional profile, and may have monopolistic characteristics. Given their national orregional profile or irreplaceable nature, strategic assets could generate additional risk not common in other industry sectorsand they may be targeted for terrorist acts or adverse political actions.
28

Interest Rate Risk. Rising interest rates could result in higher costs of capital for infrastructure companies, which couldnegatively impact their ability to meet payment obligations.
Leverage Risk. Infrastructure companies can be highly leveraged, which increases investments risk and other risks normallyassociated with debt financing and could adversely affect an infrastructure company’s operations and market value inperiods of rising interest rates.
Inflation Risk. Many infrastructure companies may have fixed income streams. Consequently, their market values may declinein times of higher inflation. Additionally, the prices that an infrastructure company is able to charge users of its assets may belinked to inflation, whether by government regulation, contractual arrangement or other factors. In this case, changes in therate of inflation may affect the company’s profitability.
Transportation Risk. The stock prices of companies in the transportation industry group are affected by both supply anddemand for their specific product. Government regulation, world events and economic conditions may affect theperformance of companies in the transportation industry group.
Oil and Gas Risk. The profitability of oil and gas companies is related to worldwide energy prices, exploration, and productionspending.
Utilities Risk. Utilities companies face intense competition, both domestically and internationally, which may have an adverseeffect on their profit margins. The rates charged by regulated utility companies are subject to review and limitation bygovernmental regulatory commissions.
Risk of Investing in the Insurance Industry. The insurance industry is subject to extensive government regulation in somecountries and can be significantly affected by changes in interest rates, general economic conditions, price and marketingcompetition, the imposition of premium rate caps or other changes in government regulation or tax law. Different segmentsof the insurance industry can be significantly affected by changes in mortality and morbidity rates, environmental clean-upcosts and catastrophic events such as earthquakes, hurricanes and terrorist acts.
Risk of Investing in the Materials Sector. Companies in the materials sector may be adversely affected by commodity pricevolatility, exchange rates, import controls, increased competition, depletion of resources, technical progress, labor relationsand government regulations, and mandated expenditures for safety and pollution control, among other factors. Companiesin the materials sector are also at risk of liability for environmental damage and product liability claims. Production ofmaterials may exceed demand as a result of market imbalances or economic downturns, leading to poor investment returns.These risks are heightened for companies in the materials sector located in foreign markets.
Risk of Investing in the Media Sub-Industry. Companies in the media sub-industry may encounter distressed cash flowsdue to the need to commit substantial capital to meet increasing competition, particularly in formulating new products andservices using new technology. Media companies are subject to risks that include cyclicality of revenues and earnings, apotential decrease in the discretionary income of targeted individuals, changing consumer tastes and interests, competitionin the industry and the potential for increased state and federal regulation. Advertising spending is an important source ofrevenue for media companies. During economic downturns, advertising spending typically decreases and, as a result, mediacompanies tend to generate less revenue.
Risk of Investing in the Medical Equipment Industry. Many companies in the medical equipment industry are heavilydependent on patent protection, and the expiration of patents may adversely affect the profitability of these companies.Companies in the medical equipment industry may be subject to extensive litigation based on product liability and similarclaims as well as competitive forces that may make it difficult to raise prices and, in fact, may result in price discounting. Theprofitability of some medical equipment companies may be dependent on a relatively limited number of products. Inaddition, their products can become obsolete due to industry innovation, changes in technologies or other marketdevelopments. Many new products in the medical equipment industry are subject to regulatory approvals, and the process ofobtaining such approvals is long and costly.
Risk of Investing in the Natural Resources Industry. The profitability of companies in the natural resources industry can beaffected by worldwide energy prices, limits on exploration, and production spending. Companies in the natural resourcesindustry are affected by government regulation, world events and economic conditions. Companies in the natural resourcesindustry are at risk for environmental damage claims. Companies in the natural resources industry could be adversely
29

affected by commodity price volatility, changes in exchange rates, imposition of import controls and increased competition.Companies in the natural resources industry may be adversely affected by depletion of natural resources, technologicaldevelopments, and labor relations.
Risk of Investing in the Oil and Gas Industry. Companies in the oil and gas industry are strongly affected by the levels andvolatility of global energy prices, oil and gas supply and demand, government regulations and policies, oil and gas productionand conservation efforts and technological change. The oil and gas industry is cyclical and from time to time may experiencea shortage of drilling rigs, equipment, supplies or qualified personnel, or due to significant demand, such services may not beavailable on commercially reasonable terms. Prices and supplies of oil and gas may fluctuate significantly over short and longperiods of time due to national and international political changes, OPEC policies, changes in relationships among OPECmembers and between OPEC and oil-importing nations, the regulatory environment, taxation policies, and the economies ofkey energy-consuming countries. Disruptions in the oil sub-industry or shifts in energy consumption may significantlyimpact companies in this industry. For instance, significant oil and gas deposits are located in emerging market countrieswhere corruption and security may raise significant risks, in addition to the other risks of investing in emerging markets. Inaddition, the Middle East, where many companies in the oil and gas industry may operate, has recently experiencedwidespread social unrest. Oil and gas companies operate in a highly competitive industry, with intense price competition. Asignificant portion of their revenues may depend on a relatively small number of customers, including governmental entitiesand utilities.
Risk of Investing in the Oil Equipment and Services Sub-Industry. The profitability of companies in the oil equipment andservices sub-industry is related to worldwide energy prices, exploration, and production spending. Companies in the oilequipment and services sub-industry may be adversely affected by natural disasters or other catastrophes. Companies in theoil equipment and services sub-industry may be at risk for environmental damage claims and other types of litigation.Companies in the oil equipment and services sub-industry may be adversely affected by changes in exchange rates, interestrates, economic conditions, tax treatment, imposition of import controls and increased competition. Companies in the oilequipment and services sub-industry may be adversely affected by oil deposits, technological developments and laborrelations. Companies in the oil equipment and services sub-industry may be adversely affected by government regulation andintervention, negative perception and world events in the regions that the companies operate (e.g., expropriation,nationalization, confiscation of assets and property or the imposition of restrictions on foreign investments and repatriationof capital, military coups, social unrest, violence or labor unrest). Companies in the oil equipment and services sub-industrymay have significant capital investments in, or engage in transactions involving, emerging market countries, which mayheighten these risks.
Risk of Investing in the Pharmaceuticals Industry. Companies in the pharmaceuticals industry are subject to competitiveforces that may make it difficult to raise prices and, in fact, may result in price discounting. The profitability of somecompanies in the pharmaceuticals industry may be dependent on a relatively limited number of products. In addition, theirproducts can become obsolete due to industry innovation, changes in technologies or other market developments. Manynew products in the pharmaceuticals industry are subject to government approvals, regulation and reimbursement rates. Theprocess of obtaining government approvals may be long and costly. Many companies in the pharmaceuticals industry areheavily dependent on patents and intellectual property rights. The loss or impairment of these rights may adversely affect theprofitability of these companies. Companies in the pharmaceutical industry may be subject to extensive litigation based onproduct liability and similar claims.
Risk of Investing in the Producer Durables Industry. The producer durables industry includes companies involved in thedesign, manufacture or distribution of industrial durables such as electrical equipment and components, industrial products,and housing and telecommunications equipment. These companies may be affected by changes in domestic andinternational economies and politics, consolidation, and excess capacity. Companies in the producer durables industry faceintense competition, which may have an adverse effect on their profitability. The success of companies in the producerdurables industry may be strongly affected by changes in consumer demands, spending, tastes and preferences. Companiesin the producer durables industry may be dependent on outside financing, which may be difficult to obtain. Producerdurables companies may be unable to protect their intellectual property rights or may be liable for infringing the intellectualproperty rights of others. In addition, these companies may be significantly affected by other factors such as economiccycles, rapid technical obsolescence, government regulations, labor relations, delays in modernization, overall capitalspending levels and product liability lawsuits.
30

Risk of Investing in the Real Estate Industry. Companies in the real estate industry include companies that invest in realestate, such as REITs, real estate holding companies or real estate development companies (collectively, “Real EstateCompanies”). Investing in Real Estate Companies exposes investors to the risks of owning real estate directly, as well as torisks that relate specifically to the way in which Real Estate Companies are organized and operated. The real estate industry ishighly sensitive to general and local economic conditions and developments, and characterized by intense competition andperiodic overbuilding. Investing in Real Estate Companies involves various risks. Some risks that are specific to Real EstateCompanies are discussed in greater detail below.
Interest Rate Risk. Rising interest rates could result in higher costs of capital for Real Estate Companies, which couldnegatively impact a Real Estate Company’s ability to meet its payment obligations. Declining interest rates could result inincreased prepayment on loans and require redeployment of capital in less desirable investments.
Leverage Risk. Real Estate Companies may use leverage (and some may be highly leveraged), which increases investment riskand could adversely affect a Real Estate Company’s operations and market value in periods of rising interest rates. Real EstateCompanies are also exposed to the risks normally associated with debt financing. Financial covenants related to a Real EstateCompany’s leverage may affect the ability of the Real Estate Company to operate effectively. In addition, real property may besubject to the quality of credit extended and defaults by borrowers and tenants. If the properties do not generate sufficientincome to meet operating expenses, including, where applicable, debt service, ground lease payments, tenant improvements,third-party leasing commissions and other capital expenditures, the income and ability of a Real Estate Company to makepayments of any interest and principal on its debt securities will be adversely affected.
Loan Foreclosure Risk. Real Estate Companies may foreclose on loans that the Real Estate Company originated or acquired.Foreclosure may generate negative publicity for the underlying property that affects its market value. In addition to lengthand expense, foreclosure proceedings may not fully uphold the validity of all of the terms of the applicable loan. Claims anddefenses asserted by borrowers or other lenders may interfere with the enforcement of rights by a Real Estate Company.Parallel proceedings, such as bankruptcy, may also delay resolution and limit the amount of recovery on a foreclosed loan bya Real Estate Company even where the property underlying the loan is liquidated.
Property Risk. Real Estate Companies may be subject to risks relating to functional obsolescence or reduced desirability ofproperties; extended vacancies due to economic conditions and tenant bankruptcies; catastrophic events such asearthquakes, hurricanes and terrorist acts; and casualty or condemnation losses. Real estate income and values also may begreatly affected by demographic trends, such as population shifts or changing tastes and values, or increasing vacancies ordeclining rents resulting from legal, cultural, technological, global or local economic developments.
Distressed Investment Risk. Real Estate Companies may invest in distressed, defaulted or out-of-favor bank loans.Identification and implementation by a Real Estate Company of loan modification and restructure programs involves a highdegree of uncertainty. Even successful implementation may still require adverse compromises and may not preventbankruptcy. Real Estate Companies may also invest in other debt instruments that may become non-performing, includingthe securities of companies with higher credit and market risk due to financial or operational difficulties. Higher risk securitiesmay be less liquid and more volatile than the securities of companies not in distress.
Underlying Investment Risk. Real Estate Companies make investments in a variety of debt and equity instruments withvarying risk profiles. For instance, Real Estate Companies may invest in debt instruments secured by commercial propertythat have higher risks of delinquency and foreclosure than loans on single family homes due to a variety of factors associatedwith commercial property, including the tie between income available to service debt and productive use of the property. RealEstate Companies may also invest in debt instruments and preferred equity that are junior in an issuer’s capital structure andthat involve privately negotiated structures. Subordinated debt investments, such as B-Notes and mezzanine loans, involve agreater credit risk of default due to the need to service more senior debt of the issuer. Similarly, preferred equity investmentsinvolve a greater risk of loss than conventional debt financing due to their non-collateralized nature and subordinatedranking. Investments in commercial mortgage-backed securities may also be junior in priority in the event of bankruptcy orsimilar proceedings. Investments in senior loans may be effectively subordinated if the senior loan is pledged as collateral.The ability of a holder of junior claims to proceed against a defaulting issuer is circumscribed by the terms of the particularcontractual arrangement, which vary considerably from transaction to transaction.
Management Risk. Real Estate Companies are dependent upon management skills and may have limited financial resources.Real Estate Companies are generally not diversified and may be subject to heavy cash flow dependency, default by borrowersand voluntary liquidation. In addition, transactions between Real Estate Companies and their affiliates may be subject to
31

conflicts of interest, which may adversely affect a Real Estate Company’s shareholders. A Real Estate Company may also havejoint venture investments in certain of its properties, and, consequently, its ability to control decisions relating to suchproperties may be limited.
Liquidity Risk. Investing in Real Estate Companies may involve risks similar to those associated with investing in small-capitalization companies. Real Estate Company securities, like the securities of small-capitalization companies, may be morevolatile than, and perform differently from, shares of large-capitalization companies. There may be less trading in Real EstateCompany shares, which means that buy and sell transactions in those shares could have a magnified impact on share price,resulting in abrupt or erratic price fluctuations. In addition, real estate is relatively illiquid, and, therefore, a Real EstateCompany may have a limited ability to vary or liquidate properties in response to changes in economic or other conditions.
Concentration Risk. Real Estate Companies may own a limited number of properties and concentrate their investments in aparticular geographic region or property type. Economic downturns affecting a particular region, industry or property typemay lead to a high volume of defaults within a short period.
U.S. Tax Risk. Certain U.S. Real Estate Companies are subject to special U.S. federal tax requirements. A REIT that fails tocomply with such tax requirements may be subject to U.S. federal income taxation, which may affect the value of the REITand the characterization of the REIT’s distributions. The U.S. federal tax requirement that a REIT distribute substantially all ofits net income to its shareholders may result in a REIT having insufficient capital for future expenditures. A REIT thatsuccessfully maintains its qualification may still become subject to U.S. federal, state and local taxes, including excise,penalty, franchise, payroll, mortgage recording, and transfer taxes, both directly and indirectly through its subsidiaries.
Regulatory Risk. Real estate income and values may be adversely affected by such factors as applicable domestic and foreignlaws (including tax laws). Government actions, such as tax increases, zoning law changes or environmental regulations, alsomay have a major impact on real estate income and values. In addition, quarterly compliance with regulations limiting theproportion of asset types held by a U.S. REIT may force certain Real Estate Companies to liquidate or restructure otherwiseattractive investments. Some countries may not recognize REITs or comparable structures as a viable form of real estatefunds.
Risk of Investing in the Retail Industry. The retail industry may be affected by changes in domestic and internationaleconomies, consumer confidence, disposable household income and spending, and consumer tastes and preferences.Companies in the retail industry face intense competition, which may have an adverse effect on their profitability. Thesuccess of companies in the retail industry may be strongly affected by social trends, marketing campaigns and publicperceptions. Companies in the retail industry may be dependent on outside financing, which may be difficult to obtain. Manyof these companies are dependent on third party suppliers and distribution systems. Retail companies may be unable toprotect their intellectual property rights or may be liable for infringing the intellectual property rights of others.
Risk of Investing in the Technology Sector. Technology companies are characterized by periodic new product introductions,innovations and evolving industry standards, and, as a result, face intense competition, both domestically and internationally,which may have an adverse effect on profit margins. Companies in the technology sector are often smaller and lessexperienced companies and may be subject to greater risks than larger companies; these risks may be heightened fortechnology companies in foreign markets. Technology companies may have limited product lines, markets, financialresources or personnel. The products of technology companies may face product obsolescence due to rapid technologicaldevelopments and frequent new product introduction, changes in consumer and business purchasing patterns,unpredictable changes in growth rates and competition for the services of qualified personnel. In addition, a rising interestrate environment tends to negatively affect companies in the technology sector because, in such an environment, thosecompanies with high market valuations may appear less attractive to investors, which may cause sharp decreases in thecompanies’ market prices. Companies in the technology sector are heavily dependent on patent and intellectual propertyrights. The loss or impairment of these rights may adversely affect the profitability of these companies. The technologysector may also be adversely affected by changes or trends in commodity prices, which may be influenced or characterizedby unpredictable factors. Finally, while all companies may be susceptible to network security breaches, certain companies inthe technology sector may be particular targets of hacking and potential theft of proprietary or consumer information ordisruptions in service, which could have a material adverse effect on their businesses.
Risk of Investing in the Telecommunications Sector. The telecommunications sector of a country’s economy is oftensubject to extensive government regulation. The costs of complying with governmental regulations, delays or failure toreceive required regulatory approvals, or the enactment of new regulatory requirements may negatively affect the business of
32

telecommunications companies. Government actions around the world, specifically in the area of pre-marketing clearance ofproducts and prices, can be arbitrary and unpredictable. Companies in the telecommunications sector may experiencedistressed cash flows due to the need to commit substantial capital to meet increasing competition, particularly indeveloping new products and services using new technology. Technological innovations may make the products and servicesof certain telecommunications companies obsolete. Finally, while all companies may be susceptible to network securitybreaches, certain companies in the telecommunications sector may be particular targets of hacking and potential theft ofproprietary or consumer information or disruptions in service, which could have a material adverse effect on their businesses.
Risk of Investing in the Transportation Infrastructure Industry. Issuers in the transportation infrastructure industry can besignificantly affected by economic changes, fuel prices, labor relations, technology developments, exchange rates, industrycompetition, insurance costs and deteriorating public infrastructure, such as bridges, roads, rails, ports and airports.Transportation companies in certain countries may also be subject to significant government regulation and oversight, whichmay adversely affect their businesses. Other risk factors that may affect the transportation infrastructure industry include therisk of increases in fuel and other operating costs and the effects of regulatory changes or other government decisions.Companies in the transportation infrastructure industry may be adversely affected by adverse weather, acts of terrorism orcatastrophic events, such as air accidents, train crashes or tunnel fires. Companies in the transportation infrastructureindustry may also be subject to the risk of widespread disruption of technology systems and increasing equipment andoperational costs.
Risk of Investing in the Utilities Sector. The utilities sector may be adversely affected by changing commodity prices,government regulation stipulating rates charged by utilities, increased tariffs, changes in tax laws, interest rate fluctuationsand changes in the cost of providing specific utility services. The utilities industry is also subject to potential terrorist attacks,natural disasters and severe weather conditions, as well as regulatory and operational burdens associated with the operationand maintenance of nuclear facilities. Government regulators monitor and control utility revenues and costs, and thereforemay limit utility profits. In certain countries, regulatory authorities may also restrict a company’s access to new markets,thereby diminishing the company’s long-term prospects.
There are substantial differences among the regulatory practices and policies of various jurisdictions, and any regulatoryagency may make major shifts in policy from time to time. There is no assurance that regulatory authorities will, in the future,grant rate increases. Additionally, existing and possible future regulatory legislation may make it even more difficult forutilities to obtain adequate relief. Certain of the issuers of securities held in a Fund’s portfolio may own or operate nucleargenerating facilities. Governmental authorities may from time to time review existing policies and impose additionalrequirements governing the licensing, construction and operation of nuclear power plants. Prolonged changes in climateconditions can also have a significant impact on both the revenues of an electric and gas utility as well as the expenses of autility, particularly a hydro-based electric utility.
The rates that traditional regulated utility companies may charge their customers generally are subject to review andlimitation by governmental regulatory commissions. Rate changes may occur only after a prolonged approval period or maynot occur at all, which could adversely affect utility companies when costs are rising. The value of regulated utility debtsecurities (and, to a lesser extent, equity securities) tends to have an inverse relationship to the movement of interest rates.Certain utility companies have experienced full or partial deregulation in recent years. These utility companies are frequentlymore similar to industrial companies in that they are subject to greater competition and have been permitted by regulators todiversify outside of their original geographic regions and their traditional lines of business. As a result, some companies maybe forced to defend their core business and may be less profitable. Deregulation may also permit a utility company to expandoutside of its traditional lines of business and engage in riskier ventures.
Proxy Voting PolicyThe Board has delegated the voting of proxies for each Fund’s securities to BFA pursuant to BFA’s proxy voting guidelines andprocedures (the “BlackRock Proxy Voting Guidelines”). Under the BlackRock Proxy Voting Guidelines, BFA will vote proxiesrelated to Fund securities in the best interests of a Fund and its shareholders. From time to time, a vote may present a conflictbetween the interests of a Fund’s shareholders, on the one hand, and those of BFA, or any affiliated person of a Fund or BFA,on the other. BFA maintains policies and procedures that are designed to prevent undue influence on BFA’s proxy votingactivity that might stem from any relationship between the issuer of a proxy (or any dissident shareholder) and BFA, BFA’saffiliates, a Fund or a Fund’s affiliates. Most conflicts are managed through a structural separation of BFA’s Corporate
33

Governance Group from BFA’s employees with sales and client responsibilities. In addition, BFA maintains procedures toensure that all engagements with corporate issuers or dissident shareholders are managed consistently and without regardto BFA’s relationship with the issuer of the proxy or the dissident shareholder. In certain instances, BFA may determine toengage an independent fiduciary to vote proxies as a further safeguard to avoid potential conflicts of interest or as otherwiserequired by applicable law. Copies of the Funds’ Proxy Voting Policy and the BlackRock Proxy Voting Guidelines are attachedas Appendix A.
Information with respect to how BFA voted proxies relating to the Funds’ portfolio securities during the 12-month periodended June 30 is available: (i) without charge, upon request, by calling 1-800-iShares (1-800-474-2737) or through the Funds’website at www.iShares.com; and (ii) on the SEC’s website at www.sec.gov.
Portfolio Holdings InformationThe Board has adopted a policy regarding the disclosure of the Funds’ portfolio holdings information that requires that suchinformation be disclosed in a manner that: (i) is consistent with applicable legal requirements and in the best interests ofeach Fund’s respective shareholders; (ii) does not put the interests of BFA, the Distributor or any affiliated person of BFA orthe Distributor, above those of Fund shareholders; (iii) does not advantage any current or prospective Fund shareholders overany other current or prospective Fund shareholders, except to the extent that certain Entities (as described below) mayreceive portfolio holdings information not available to other current or prospective Fund shareholders in connection with thedissemination of information necessary for transactions in Creation Units, as discussed below, and certain information maybe provided to personnel of BFA and its affiliates who manage funds that invest a significant percentage of their assets inshares of the Fund for the purpose of facilitating risk management and hedging activities; and (iv) does not provide selectiveaccess to portfolio holdings information except pursuant to the procedures outlined below and to the extent appropriateconfidentiality arrangements limiting the use of such information are in effect. The “Entities” referred to in sub-section (iii)above are generally limited to National Securities Clearing Corporation (“NSCC”) members, subscribers to various fee-basedsubscription services, large institutional investors (known as “Authorized Participants”) that have been authorized by theDistributor to purchase and redeem large blocks of shares pursuant to legal requirements and market makers and otherinstitutional market participants and entities that provide information or transactional services.
Each business day, each Fund’s portfolio holdings information is provided to the Distributor or other agent for disseminationthrough the facilities of the NSCC and/or other fee-based subscription services to NSCC members and/or subscribers tothose other fee-based subscription services, including market makers and Authorized Participants, and to entities thatpublish and/or analyze such information in connection with the process of purchasing or redeeming Creation Units ortrading shares of the Funds in the secondary market or evaluating such potential transactions. This information typicallyreflects each Fund’s anticipated holdings on the following business day.
Daily access to information concerning the Funds’ portfolio holdings is permitted: (i) to certain personnel of those serviceproviders that are involved in portfolio management and providing administrative, operational, risk management, or othersupport to portfolio management; and (ii) to other personnel of the Funds’ investment adviser (and Sub-Adviser), theDistributor and their affiliates, and the administrator, custodian and fund accountant who deal directly with, or assist in,functions related to investment management, distribution, administration, custody, securities lending and fund accounting,as may be necessary to conduct business in the ordinary course in a manner consistent with federal securities laws andregulations thereunder. In addition, each Fund discloses its fixed-income and/or equity portfolio holdings daily atwww.iShares.com. More information about this disclosure is available at www.iShares.com.
Portfolio holdings information made available in connection with the creation/redemption process may be provided to otherentities that provide services to the Funds in the ordinary course of business after it has been disseminated to the NSCC.From time to time, information concerning portfolio holdings other than portfolio holdings information made available inconnection with the creation/redemption process, as discussed above, may be provided to other entities that provideservices to the Funds, including rating or ranking organizations, in the ordinary course of business, no earlier than onebusiness day following the date of the information.
Each Fund discloses its complete portfolio holdings schedule in public filings with the SEC within 70 days of the end of thesecond and fourth fiscal quarters and within 60 days of the end of the first and third fiscal quarters and will provide suchinformation to shareholders as required by federal securities laws and regulations thereunder. A Fund may, however,
34

voluntarily disclose all or part of its portfolio holdings other than in connection with the creation/redemption process, asdiscussed above, in advance of required filings with the SEC, provided that such information is made generally available to allshareholders and other interested parties in a manner that is consistent with the above policy for disclosure of portfolioholdings information. Such information may be made available through a publicly available website or other means thatmake the information available to all likely interested parties contemporaneously.
The Trust’s Chief Compliance Officer or his delegate may authorize disclosure of portfolio holdings information pursuant tothe above policy and procedures, subject to restrictions on selective disclosure imposed by applicable law.
The Board reviews the policy and procedures for disclosure of portfolio holdings information at least annually.
Construction and Maintenance of the UnderlyingIndexesDescriptions of the Underlying Indexes are provided below.
With respect to certain underlying indexes of the iShares funds, BFA or its affiliates have held discussions with the indexprovider regarding their business interest in licensing an index to track a particular market segment and conveyed investmentconcepts and strategies that could be considered for the index. The index provider designed and constituted the index usingconcepts conveyed by BFA or its affiliates. For certain of these indices, the relevant fund may be the first or sole user of theunderlying index. In its sole discretion, the index provider determines the composition of the securities and other instrumentsin such underlying index, the rebalance protocols of the underlying index, the weightings of the securities and otherinstruments in the underlying index, and any updates to the methodology. From time to time, BFA or its affiliates may alsoprovide input relating to possible methodology changes of such underlying index pursuant to the index provider’sconsultation process or pursuant to other communications with the index provider.
The Dow Jones IndexesComponent Selection Criteria. Securities of companies listed on a major U.S. exchange (such as the New York StockExchange, Inc. (“NYSE”), the NYSE MKT Equities or the NASDAQ) are considered for inclusion in the Underlying Indexes, withthe following general rules and exceptions. Foreign issues, including ADRs and GDRs, non-common equity issues such aspreferred stocks, convertible notes, warrants, rights, closed-end funds, trust receipts, limited liabilities companies, royaltytrusts, units, limited partnerships, over-the-counter bulletin boards and pink sheet stocks generally are not eligible forinclusion in the indexes.
Issue Changes. Each Underlying Index is reviewed and rebalanced quarterly to maintain accurate representation of themarket segment represented by the Underlying Index. Securities that are removed from an Index between reconstitutiondates are not replaced.
Index Maintenance. Maintaining the Underlying Indexes includes monitoring and completing the adjustments for additionsand deletions to each Underlying Index, share changes, stock splits, stock dividends, and stock price adjustments due torestructuring and spin-offs. Generally (other than with respect to the Dow Jones Select Sector and Subsector Indexes (asdefined below)) each component security in an Underlying Index is limited to a maximum market capitalization of 25% ofthe index weight, and sum of the weights of all component securities greater than 5% of the index is limited to 50% of theindex total. If components fail either rule, their market capitalization will be reduced to meet the set guidelines.
Weighting. The component stocks are weighted according to the total value of their outstanding shares. The impact of acomponent’s price change is proportional to the issue’s total market value, which is the share price multiplied by the numberof shares outstanding. Each Underlying Index is adjusted to reflect changes in capitalization resulting from mergers,acquisitions, stock rights, substitutions and other capital events. Each of the Underlying Indexes (except the Dow Jones SelectSector and Subsector Indexes) as described below, is a free-float adjusted market capitalization-weighted index, so theimpact of a component’s price change is proportional to the component’s free-float adjusted market value, which is theshare price multiplied by the number of float-adjusted shares outstanding. S&P Dow Jones Indices LLC (“SPDJI”) defines thefree-float of a security as the proportion of shares outstanding that are deemed to be available for purchase in the publicequity markets by investors. In practice, limitations on free-float available to investors include: cross ownership (shares that
35

are owned by other companies), ownership by governments (central or municipal) or their agencies, certain substantial levelsof private ownership (by individuals, families or charitable trusts and foundations), and restricted shares. Under SPDJI’s free-float adjustment methodology, a company’s outstanding shares are adjusted if, and only if, an entity in any of the fourqualified categories listed above owns 5% or more of the company. The company’s shares will not be adjusted if the blockownership is less than 5%. A constituent’s inclusion factor is equal to its estimated percentage of free-float sharesoutstanding. For example, a constituent security with a free-float of 67% will be included in the index at 67% of its marketcapitalization. However, a company’s outstanding shares are not adjusted by institutional investors’ holdings, which include,but are not limited to, the following categories: custodian nominees, trustee companies, mutual funds (open-end and closed-end funds), and other investment companies.
Index Availability. The Underlying Indexes are calculated continuously and are available from major data vendors.
Component Selection Criteria Applicable to Dow Jones Subsector Indexes. The following indexes are collectively referred toherein as the “Dow Jones Select Sectors Indexes”: Dow Jones U.S. Select Aerospace & Defense Index, Dow Jones U.S. SelectHealth Care Providers Index, Dow Jones U.S. Select Home Construction Index, Dow Jones U.S. Select Insurance Index, DowJones U.S. Select Investment Services Index, Dow Jones U.S. Select Medical Equipment Index, Dow Jones U.S. Select OilEquipment & Services Index, Dow Jones U.S. Select Oil Exploration & Production Index, Dow Jones U.S. SelectPharmaceuticals Index, Dow Jones U.S. Select Regional Banks Index and Dow Jones U.S. Select Telecommunications Indexand the “Dow Jones Subsector Index”: Dow Jones U.S. Real Estate Index. On a quarterly basis, SPDJI conducts reviews of thefloat-adjusted market capitalizations and weightings of the securities in each Dow Jones Subsector Index. Other than theDow Jones U.S. Select Home Construction Index, the Dow Jones U.S. Select Regional Banks Index and the Dow Jones U.S.Select Telecommunications Index, on the last business day of the month prior to the quarterly review, a security must have a$500 million float-adjusted market capitalization to be added to a Dow Jones Select Sector and Subsector Index; securitieswith a float-adjusted market capitalization below $250 million will be removed from the applicable Dow Jones Select Sectorand Subsector Index.
For the Dow Jones U.S. Select Home Construction Index and the Dow Jones U.S. Select Telecommunications Index, on the lastbusiness day of the month prior to the quarterly review, a security must have a $500 million float-adjusted marketcapitalization to be added to a Dow Jones Select Sectors Index; securities with a float-adjusted market capitalization below$100 million will be removed from the applicable Dow Jones Select Sectors Index.
For the Dow Jones U.S. Select Regional Banks Index, index composition is reconstituted annually as part of the Junerebalancing. However, if a constituent is deleted from the Dow Jones U.S. Banks Index (i.e. the index selection universe)during a quarterly rebalancing, it is also deleted from the Dow Jones U.S. Select Regional Banks Index at that quarter’srebalancing. A company is excluded from the Dow Jones U.S. Select Regional Banks Index if its three-year average total assetsaccount for more than 5% of the three-year average total assets of the index selection universe. Any company that failed thisasset screen during the previous annual reconstitution and that accounts for at least 4% of the selection universe’s three-year average total assets at the next review will continue to be excluded from the index.
After the close of trading on the NYSE on the second Friday in March, June, September and December, each Dow Jones SelectSector and Subsector Index’s composition is adjusted to meet the following concentration limits:
• No single Underlying Index component may have a weight greater than 25% of the Index.
• The sum of the weights of the Index components that are individually greater than 5% may not be greater than 45% ofthe Index.
• The sum of the weights of the five largest Index components may not be greater than 65% of the Index.
Dow Jones U.S. Real Estate IndexNumber of Components: approximately 124
Index Description. The Dow Jones U.S. Real Estate Index is a subset of the Dow Jones U.S. Index. The Underlying Indexincludes only companies in the real estate sector of the Dow Jones U.S. Index.
Dow Jones U.S. Select Aerospace & Defense IndexNumber of Components: approximately 38
36

Index Description. The Dow Jones U.S. Select Aerospace & Defense Index is designed to measure the performance of U.S.companies in the aerospace and defense sector.
Dow Jones U.S. Select Health Care Providers IndexNumber of Components: approximately 46
Index Description. The Dow Jones U.S. Select Health Care Providers Index is designed to measure performance of U.S.companies in the health care sector.
Dow Jones U.S. Select Home Construction IndexNumber of Components: approximately 47
Index Description. The Dow Jones U.S. Select Home Construction Index measures the performance of constructors ofresidential homes, including manufacturers of mobile and prefabricated homes intended for use in one place; manufacturersand distributors of furniture, including chairs, tables, desks, carpeting, and wallpaper; retailers and wholesalers concentratingon the sale of home improvement products, including garden equipment, carpets, wallpaper, paint, home furniture, blindsand curtains, and building materials; producers of materials used in the construction and refurbishment of buildings andstructures, including cement and other aggregates, wooden beams and frames, paint, glass, roofing and flooring materialsother than carpets. Companies classified as Building Materials & Fixtures, Furnishings, and Home Improvement Retailers are,in aggregate, capped at 35% of the index.
Dow Jones U.S. Select Insurance IndexNumber of Components: approximately 63
Index Description. The Dow Jones U.S. Select Insurance Index is designed to measure full-line insurance companies, propertyand casualty insurance companies and life insurance companies.
Dow Jones U.S. Select Investment Services IndexNumber of Components: approximately 27
Index Description. The Dow Jones U.S. Select Investment Services Index is designed to measure the performance of U.S.companies in the investment services sector.
Dow Jones U.S. Select Medical Equipment IndexNumber of Components: approximately 55
Index Description. The Dow Jones U.S. Select Medical Equipment Index is designed to measure manufacturers anddistributors of medical devices such as MRI scanners, prosthetics, pacemakers, X-ray machines and other non-disposablemedical devices.
Dow Jones U.S. Select Oil Equipment & Services IndexNumber of Components: approximately 35
Index Description. The constituents in the Dow Jones U.S. Select Oil Equipment & Services Index are classified as oilequipment and services companies within the Dow Jones U.S. Broad Stock Market Index.
Dow Jones U.S. Select Oil Exploration & Production IndexNumber of Components: approximately 63
Index Description. The Dow Jones U.S. Select Oil Exploration & Production Index is designed to measure companies engagedin the exploration for drilling, production, refining and supply of oil and gas products.
Dow Jones U.S. Select Pharmaceuticals IndexNumber of Components: approximately 43
Index Description. The constituents in the Dow Jones U.S. Select Pharmaceuticals Index are classified as pharmaceuticalcompanies within the Dow Jones U.S. Broad Stock Market Index.
Dow Jones U.S. Select Regional Banks Index
37

Number of Components: approximately 53
Index Description. The constituents in the Dow Jones U.S. Select Regional Banks Index are classified as regional bankcompanies within the Dow Jones U.S. Broad Stock Market Index.
Dow Jones U.S. Select Telecommunications IndexNumber of Components: approximately 45
Index Description. The constituents in the Dow Jones U.S. Select Telecommunications Index are classified astelecommunication companies within the Dow Jones U.S. Broad Stock Market Index.
Additional Information. The Dow Jones U.S. Real Estate Index, the Dow Jones U.S. Select Aerospace & Defense Index, theDow Jones U.S. Select Health Care Providers Index, the Dow Jones U.S. Select Home Construction Index, the Dow Jones U.S.Select Insurance Index, the Dow Jones U.S. Select Investment Services Index, the Dow Jones U.S. Select Medical EquipmentIndex, the Dow Jones U.S. Select Oil Equipment & Services Index, the Dow Jones U.S. Select Oil Exploration & ProductionIndex, the Dow Jones U.S. Select Pharmaceuticals Index, the Dow Jones U.S. Select Regional Banks Index and the Dow JonesU.S. Select Telecommunications Index (collectively, the “Dow Jones Indexes”) are products of SPDJI, and have been licensedfor use by BFA or its affiliates. S&P® is a registered trademark of Standard & Poor’s Financial Services LLC (“S&P”); DowJones® is a registered trademark of Dow Jones Trademark Holdings LLC (“Dow Jones”); and these trademarks have beenlicensed for use by SPDJI and sublicensed for certain purposes by BFA and its affiliates. The Funds are not sponsored,endorsed, sold or promoted by SPDJI, Dow Jones, S&P or their respective affiliates or third party licensors and none of suchparties make any representation regarding the advisability of investing in such product(s) nor do they have any liability forany errors, omissions, or interruptions of the Dow Jones Indexes.
The FTSE Nareit IndexesComponent Selection Criteria. The FTSE Nareit U.S. Real Estate Indexes (“FTSE Nareit Indexes”) are primarily rule-based, butare also monitored by the FTSE Nareit Index Advisory Committee. All tax-qualified REITs that are listed on the NYSE, the NYSEAmex Equities or the NASDAQ are eligible for inclusion in the FTSE Nareit Indexes. Potential constituents for the FTSE NareitAll Mortgage Capped Index and the FTSE Nareit All Residential Capped Index are determined by sector classifications ofconstituents in the FTSE Nareit Composite Index. The FTSE Nareit Indexes are reviewed for changes in free-float on aquarterly basis in March, June, September and December for companies which do not qualify for fast entry, but which meetthe criteria for eligible securities set out in the index rules. Meetings to review the constituents will be held on the Thursdayfollowing the first Friday of March, June, September and December. The review is based on data at the close of business onthe last trading day of February, May, August and November. The FTSE Nareit Index Advisory Committee meets quarterly, inMarch, June, September and December or more frequently, if required.
When calculating index component weights, component companies’ shares are adjusted for available free-float. In general,shares held by governments, corporations, strategic partners, or other control groups are excluded from a constituentcompany’s outstanding shares.
Index Maintenance. FTSE International Limited (“FTSE”) is responsible for the daily operation of the FTSE Nareit Indexes.FTSE will maintain records of the market capitalization of all constituents, and will make changes to the constituents andtheir weightings in accordance with index rules. FTSE will also carry out the periodic company reviews of the FTSE NareitIndexes and implement the resulting constituent changes as required by index rules.
Issue Changes. New issues of companies that do not qualify for “Fast Entry” but meet the criteria for eligible securities andhave been listed for over 20 business trading days will be eligible for inclusion in the FTSE Nareit Indexes. The data will becompiled as of the close of business on the last business day in February, May, August and November. The changes will beeffective after the close of business on the third Friday in March, June, September and December.
If a constituent is delisted, or ceases to have a firm quotation, or is subject to a takeover offer which has been declared whollyunconditional, it will be removed from the indexes of which it is a constituent.
Index Availability. The FTSE Nareit Indexes are calculated continuously during normal trading hours of the NASDAQ, NYSEAmex Equities and NYSE, and are closed on U.S. holidays.
38

Exchange Rates and Pricing. The prices used to calculate the FTSE Nareit Indexes are the Reuters daily closing prices orthose figures accepted as such. FTSE Nareit reserves the right to use an alternative pricing source on any given day. For end-of-day alternative currency calculations, FTSE Nareit uses the WM/Reuters Closing Spot Rates.
FTSE Nareit All Mortgage Capped IndexNumber of Components: approximately 36
Index Description. The FTSE Nareit All Mortgage Capped Index is a free float-adjusted market capitalization weighted indexthat measures the performance of the residential and commercial mortgage real estate, mortgage finance and savingsassociations sectors of the U.S. equity market. The FTSE Nareit All Mortgage Capped Index generally measures theperformance of the residential and commercial mortgage real estate sector and generally invests all of its assets in REITs. Ifthe number of constituents in the FTSE Nareit All Mortgage Capped Index would otherwise fall below 20, FTSE will considercompanies from the mortgage finance and savings associations sectors for inclusion in the FTSE Nareit All Mortgage CappedIndex and each company in the mortgage finance and savings associations sector will be capped at 3%, and in aggregate notexceed 30%. FTSE caps the weight of the constituent securities in the Underlying Index.
FTSE Nareit All Residential Capped IndexNumber of Components: approximately 20
Index Description. The FTSE Nareit All Residential Capped Index is a free float-adjusted market capitalization weighted indexthat measures the performance of the residential, healthcare and self-storage real estate sectors of the U.S. equity market.FTSE caps the weight of the constituent securities in the Underlying Index.
ICE Exchange-Listed Preferred & Hybrid Securities Transition IndexNumber of Components: approximately 464
Index Description. The ICE Exchange-Listed Preferred & Hybrid Securities Transition Index measures the performance ofexchange-listed U.S. dollar-denominated hybrid securities, preferred stock and convertible preferred stock.
Index Methodology. The Underlying Index consists of exchange-listed U.S. dollar-denominated hybrid securities, preferredstock and convertible preferred stock. Qualifying securities must be exchange listed and have either the NASDAQ or NYSE astheir primary exchange in order to be included in the Underlying Index. The Underlying Index constituents must also meetminimum price, liquidity, trading volume, maturity and other requirements relating to continuous listing standards of thelisting exchange. The Underlying Index is market capitalization-weighted subject to certain constraints, and the securities inthe Underlying Index are updated on the last business date of each month.
Component Selection Criteria. Hybrid corporate debt issued in $1,000 or greater par amounts must have a coupon deferralfeature, at least $250 million face amount outstanding and at least 18 months to final maturity at the time of issuance toqualify. Fixed-to-floating rate securities are included provided they are callable within the fixed rate period and are at leastone month from the last call prior to the date the bond transitions from a fixed to a floating rate security. Contingent capitalsecurities (“cocos”) are excluded, but capital securities where conversion can be mandated by a regulatory authority, butwhich have no specified trigger, are included. Other hybrid capital securities, such as those issues that potentially convert intopreference shares, those with both cumulative and noncumulative coupon deferral provisions, and those with alternativecoupon satisfaction mechanisms, are also included in the index. 144A securities (both with and without registration rights)and corporate pay-in-kind securities (including toggle notes) are included. Securities in legal default, securitized debt andeurodollar bonds (USD securities not issued in the U.S. domestic market) are excluded.
Preferred stock and notes issued in $25, $50, or $100 par/liquidation preference increments, must have a minimum amountoutstanding of $100 million. In addition, qualifying securities must have an investment grade rated country of risk (based onan average of Moody’s, S&P and Fitch foreign currency long-term sovereign debt ratings). Both fixed and adjustable ratepreferred stock and notes are included in the index. Preference shares (perpetual preferred securities), American DepositoryShares/Receipts (ADS/R), domestic and Yankee trust preferreds, are included. Auction market securities, purchase units,purchase contracts, securities issued by closed end funds and derivative instruments such as repackaged securities andcredit default swaps are excluded.
39
Convertible preferred stock must have at least $50 million face amount outstanding. The underlying equity of qualifyingsecurities must be publicly listed and actively trading. Convertible securities where the underlying is a basket of equities, andmandatory convertibles are included in the index. Securities in legal default, synthetic and reverse convertibles, pay-in-kindconvertibles, and convertibles with suspended or inactive underlying equities are excluded from the index.
JPX-Nikkei Index 400Number of Components: approximately 399
Index Description. The JPX-Nikkei Index 400 was jointly developed by Japan Exchange Group, Inc. and Tokyo StockExchange, Inc. (“TSE”) (collectively referred to as the “JPX Group”) and Nikkei Inc. (the “Nikkei”). The JPX-Nikkei Index 400 isconstructed based on market capitalization adjusted by free-float weight. Free-float weight is the percentage of listed sharesdeemed to be available for trading in the market. As a general matter, shares held by the top 10 major shareholders, treasuryand other similar shares, shares held by board members and other representatives, and other shares deemed by the JPXGroup and the Nikkei to be unavailable for trading in the market are considered to be non-free float shares.
Eligibility. Underlying Index eligibility is limited to (i) common stocks traded primarily on the TSE, including the First Section,Second Section, Mothers and JASDAQ Securities Exchange (“JASDAQ”) (in principle) and (ii) TSE First Section, TSE SecondSection, Mothers or JASDAQ-listed securities other than common stocks that are regarded by the JPX Group and the Nikkei asequivalent to common stocks in each case if their inclusion is deemed to be particularly necessary- as determined by the JPXGroup and the Nikkei.
Index Maintenance and Issue Changes. The constituents are reviewed annually at the end of August. Selection asparticularly necessary is based on: (i) trading value over the past three years, (ii) market value on the selection base date (theend of June), (iii) scoring by stock by three-year average returns on equity, cumulative operating profit and market value onthe selection base date using specified weightings and (iv) qualitative factors tied to corporate governance and disclosure.The JPX Group and the Nikkei have indicated that securities will be dropped from the Underlying Index during the year if theyare delisted or are the subject of a merger or bankruptcy and that new securities will not be added to replace droppedsecurities until the annual review. As a result, at different points throughout the calendar year, the Underlying Index may haveless than 400 components.
Index Availability. Information regarding adjustments to the Underlying Index and other related data is available throughTokyo Market Information service provided by TSE.
NASDAQ Biotechnology Index®
Number of Components: approximately 193
Index Description. The NASDAQ Biotechnology Index is designed to track the performance of a set of securities listed onNASDAQ that are classified as either biotechnology or pharmaceutical according to the Industry Classification Benchmark(ICB) and that also meet other eligibility criteria determined by The NASDAQ OMX Group, Inc. (“NASDAQ OMX”). TheNASDAQ Biotechnology Index is a modified market capitalization-weighted index.
Eligibility. Underlying Index eligibility is limited to common stocks, ordinary shares, ADRs, and shares of beneficial interest orlimited partnership interests that are listed on NASDAQ. Companies must also meet certain minimum market capitalization,liquidity, and other criteria to be eligible for inclusion in the Underlying Index.
Index Maintenance and Issue Changes. Index securities are evaluated annually in December. Generally, the list of additionsand deletions is publicly announced via a press release in the early part of December. Security additions and deletions aremade effective after the close of trading on the third Friday in December. Moreover, if at any time during the year other thanthe evaluation, an index security no longer meets the eligibility criteria, or is otherwise determined to have become ineligiblefor continued inclusion in the Underlying Index, the security is removed from the Underlying Index and will not be replaced.
Quarterly Index Rebalancing. The Underlying Index employs a modified market capitalization-weighting methodology. Ateach quarter, the Index is rebalanced such that the maximum weight of any index security does not exceed 8% and no morethan 5 securities are at that cap. The excess weight of any capped security is distributed proportionally across the remainingindex securities. If after redistribution, any of the 5 highest ranked index securities are weighted below 8%, these securities
40

are not capped. Next, any remaining index securities in excess of 4% are capped at 4% and the excess weight is redistributedproportionally across the remaining index securities. The process is repeated, if necessary, to derive the final weights.
The modified market capitalization-weighting methodology is applied to the capitalization of each index security using thelast sale price of the security at the close of trading on the last trading day in February, May, August and November and afterapplying quarterly changes to the total shares outstanding. The changes are effective after trading on the third Friday inMarch, June, September and December.
NASDAQ OMX may, from time to time, exercise reasonable discretion as it deems appropriate in order to ensure UnderlyingIndex integrity.
NYSE® FactSet U.S. Infrastructure IndexNumber of Components: approximately 158
Index Description. The NYSE FactSet U.S. Infrastructure Index is designed to measure the performance of equity securities ofU.S. companies involved in U.S. focused infrastructure activities (as determined by the index provider of the UnderlyingIndex).
Companies are eligible to be included in the Underlying Index if they are classified to be under one of the 95 infrastructure-related industries as defined by FactSet Revere Business Industry Classification System (“RBICS”). Each company in theUnderlying Index is classified as either Category 1 or Category 2, where Category 1 companies are infrastructure enablersand Category 2 are infrastructure asset owners and operators.
Infrastructure enablers are potential beneficiaries of infrastructure investment in the U.S. Category 1 companies in theUnderlying Index include companies in construction and engineering services, machineries and materials. Infrastructureasset owners and operators are companies associated with traditional equity infrastructure investing, which generally exhibitcharacteristics such as stable cash flows, high barrier to entry, and inflation hedge. Category 2 companies in the UnderlyingIndex include companies in energy transportation and storage, railroad transportation, and utilities.
At the time of inclusion, eligible companies must derive 50% or more of their annual revenues from the U.S. The UnderlyingIndex applies equal weighting to Category 1 and Category 2, and within each category, equal weighting is also applied to allindividual securities.
The Underlying Index will be reviewed and reconstituted annually in March each year. Constituent weights of the UnderlyingIndex are rebalanced quarterly in March, June, September and December.
Eligibility. The following rules are used for the initial constituent selection and ongoing reconstitution:
• Underlying Index eligibility is limited to common stocks traded primarily on the New York Stock Exchange (“NYSE”),NYSE American and NASDAQ, excluding master limited partnerships (MLPs), royalty trusts, business developmentcompanies (BDCs), and American depository receipts (ADRs).
• Initial Public Offering (“IPO”) securities newer than 3 month relative to reconstitution day are excluded.
• The securities must have a minimum float-adjusted market capitalization of U.S. $300 million or greater, and three-month Average Daily Trading Value (“ADTV”) of U.S. $1 million or greater on selection day.
Existing constituents may remain in the Underlying Index if they have a minimum float-adjusted market capitalization ofU.S. $225 million or greater, and a three-month ADTV of U.S. $0.75 million or greater on selection day.
• The securities must be classified as having a focus (deriving 50% or more revenues) in one of the 95 infrastructure-related industries as defined by RBICS in either Category 1 or 2, where Category 1 companies are infrastructure enablersand Category 2 companies are infrastructure asset owners and operators.
• An eligible company must derive 50% or more of its annual revenues from the U.S. to be included in the UnderlyingIndex.
Existing constituents may remain in the Underlying Index if they derive 40% or more its annual revenues from the U.S.
• If a company has multiple share classes, only the most liquid issue based on the highest three-month ADTV on selectionday will be included.
41

The PHLX Semiconductor Sector IndexNumber of Components: approximately 30
Index Description. The PHLX Semiconductor Sector Index is designed to track the performance of U.S.-traded securities of aset of companies engaged in the design, distribution, manufacture and sale of semiconductors.
Index Calculation. The Underlying Index is a modified capitalization-weighted index. The value of the Underlying Indexequals the aggregate value of the Underlying Index share weights, also known as the Index Shares, of each of the UnderlyingIndex securities multiplied by each such security’s Last Sale Price1, and divided by the divisor of the Underlying Index. Thedivisor serves the purpose of scaling such aggregate index value to a lower order of magnitude which is more desirable forreporting purposes. The Underlying Index began on December 1, 1993 at a base value of 100.00, as adjusted.
The formula for index value is as follows:
• Aggregate Adjusted Market Value/Divisor
The formula for the divisor is as follows:
• (Market Value after Adjustments/Market Value before Adjustments) X Divisor before Adjustments
Two versions of the Underlying Index are calculated – a price return index and a total return index.
The price return index (NASDAQ: SOX) is ordinarily calculated without regard to cash dividends on Underlying Indexsecurities.
The total return index (NASDAQ: XSOX) reinvests cash dividends on the ex-date.
Both Indexes reflect extraordinary cash distributions. The total return index was synchronized to the value of the price returnindex at the close on December 22, 2009.
The Underlying Index is calculated during the trading day and is disseminated once per second from 09:30:01 to 17:16:00 ET.The closing value of the Underlying Index may change up until 17:15:00 ET due to corrections to the Last Sale Price of theUnderlying Index securities. If trading in an Underlying Index security is halted on its primary listing market, the most recentLast Sale Price is used for all index computations until trading on such market resumes. Likewise, the most recent Last SalePrice is used if trading in a security is halted on its primary listing market before the market is open.
Initial Security Eligibility Criteria. Index eligibility is limited to specific security types only. The security types eligible for theUnderlying Index include common stocks, ordinary shares, ADRs, shares of beneficial interest or limited partnership interests.
To be eligible for inclusion in the Underlying Index, a security must meet the following criteria:
• a security must be listed on NASDAQ, the NYSE, or NYSE MKT;
• the issuer of the security must be classified as a company whose primary business is involved in the design,distribution, manufacture, and sale of semiconductors under the Industry Classification Benchmark2 code 9576;
• one security per issuer is permitted. If an issuer has multiple securities, the security with the largest marketcapitalization will be selected for possible inclusion in the Underlying Index;
• the security must have a minimum market capitalization of at least $100 million;
• the security must have traded at least 1.5 million shares in each of the last six months;
• the security must have listed options on a recognized options market in the U.S. or be eligible for listed-optionstrading on a recognized options market in the U.S.;
• the security may not be issued by an issuer currently in bankruptcy proceedings;
• the issuer of the security may not have entered into a definitive agreement or other arrangement which would likelyresult in the security no longer being Index eligible;
• the issuer of the security may not have annual financial statements with an audit opinion that is currentlywithdrawn;
42

• the issuer of the security must have been “seasoned” on a recognized market for at least 3 months; and
• one security per issuer is permitted. If an issuer has multiple securities, the security with the largest marketcapitalization will be selected for possible inclusion in the Index.
Index Evaluation. The Underlying Index securities are evaluated annually in September. The above Eligibility Criteria areapplied using market data as of the end of July. Securities meeting the Criteria are then ranked by market capitalization. Thetop 30 securities by market capitalization are included in the Underlying Index. Security additions and deletions are madeeffective after the close of trading on the third Friday in September.
Additionally, if at any time during the year other than during the ranking review, an Underlying Index security is determinedto have become ineligible for continued inclusion in the Underlying Index, or at the end of January, April, July or October doesnot have a Last Sale Price of at least $3.00, then the security will be replaced with the largest market capitalization securitynot currently in the Index and that both meets the Eligibility Criteria listed above and has at least a $3.00 Last Sale Price.Ordinarily, a security will be removed from the Index at its Last Sale Price. If, however, at the time of its removal a security ishalted from trading on its primary listing market and an official closing price cannot be readily determined, the security may,in NASDAQ’s discretion, be removed at a zero price. The zero price will be applied to the security after the close of the marketbut prior to the time the official closing value of the Index is disseminated, which is ordinarily 17:16:00 ET.
Index Maintenance. Changes in the price and/or Index Shares driven by corporate events such as stock dividends, stocksplits and certain spin-offs and rights issuances are adjusted on the ex-date. If the change in total shares outstanding arisingfrom other corporate actions is greater than or equal to 10.0%, the change is made as soon as practicable. (If a security is adepositary receipt, the total shares outstanding is the actual depositary shares outstanding as reported by the depositarybanks.) Otherwise, if the change in total shares outstanding is less than 10.0%, then all such changes are accumulatedthrough the end of February, May, August and November and made effective at one time on a quarterly basis after the closeof trading on the third Friday in each of March, June, September and December. The Index Shares are adjusted by the samepercentage amount by which the total shares outstanding have changed.
A special cash dividend announced by the listing exchange will result in an adjustment to the Last Sale Price of an UnderlyingIndex security prior to market open on the ex-date for the special amount distributed. A special dividend may also be referredto as extra, extraordinary, non-recurring, one-time, unusual, etc.
Ordinarily, whenever there is a change in Index Shares, a change in a security, or a change to the price of a security due tospin-offs, rights issuances or special cash dividends, the Divisor is adjusted to ensure that there is no discontinuity in thevalue of the Underlying Index which might otherwise be caused by any such change. All changes are announced in advanceand are reflected in the Underlying Index prior to market open on the Underlying Index effective date.
Index Rebalancing. The Underlying Index employs a modified market capitalization-weighting methodology. At each quarter,the Underlying Index is rebalanced such that the maximum weight of any security does not exceed 8% and no more than 5securities are at that cap. The excess weight of any capped security is distributed proportionally across the remainingsecurities in the Underlying Index. If after redistribution, any of the five highest ranked securities in the Underlying Index areweighted below 8%, these securities are not capped. Next, any remaining securities in excess of 4% are capped at 4% andthe excess weight is redistributed proportionally across the remaining securities in the Underlying Index. The process isrepeated, if necessary, to derive the final weights.
The modified market capitalization-weighting methodology is applied to the capitalization of each security, using the LastSale Price of the security at the close of trading on the last trading day in February, May, August and November. Index Sharesare then calculated by multiplying the weight of the security derived above by the new market value of the Underlying Indexand dividing the modified market capitalization for each security by its corresponding Last Sale Price. The changes areeffective after trading on the third Friday in March, June, September and December.
43

In administering the Underlying Index, NASDAQ OMX may, from time to time, exercise reasonable discretion as it deemsappropriate in order to ensure the integrity of the Underlying Index.
Index Availability. The Underlying Index is calculated continuously and widely disseminated to major data vendors.
1 For purposes of this document, “Last Sale Price” refers to the following: For a security listed on NASDAQ, it is the last sale price on NASDAQ, whichnormally would be the Nasdaq Official Closing Price (“NOCP”) when NASDAQ is closed. For any NYSE-listed or NYSE MKT-listed security, it is the lastregular way trade reported on such security’s primary U.S. listing market. If a security does not trade on its primary listing market on a given day, themost recent last sale price from the primary listing market (adjusted for corporate actions, if any) is used.2 Industry Classification Benchmark (“ICB”) is a product of FTSE and has been licensed for use.
The Russell IndexesComponent Selection Criteria. Generally, the securities in the Russell indexes (sometimes referred to as the “components”)are reviewed and reconstituted annually, typically after the close on the last Friday in June to reflect changes in themarketplace. However, the Underlying Index will be reviewed and reconstituted annually in September using data at the closeof the last business day of August. The Russell Top 200
®
Index, Russell 2000®
Index, Russell 1000®
Index and the Russell2500
TM
Index are subsets of the Russell 3000®
Index. The starting universe for the Russell 3000®
Index includes all issuerslisted on a U.S. Exchange that are either U.S. incorporated or incorporated in certain non-U.S. jurisdictions as Benefit-DrivenIncorporations (typically tax benefit incorporations), subject to the following rules and exceptions:
• stocks must trade at or above $1.00 on the last business day of August to be eligible for inclusion. If a stock in theindex has a price lower than $1, it can remain in the index if the average price for the month is greater than $1;
• for ranking and membership determination, all common share classes for a single company are combined todetermine total market capitalization;
• in cases where there are multiple common stock share classes and the share classes act independently of eachother, each class is considered for inclusion separately; and
• also excluded are preferred and convertible preferred stock, participating preferred stock, redeemable shares,warrants and rights, trust receipts, royalty trusts, limited liability issuers, OTC bulletin boards and pink sheet stocks,mutual funds, limited partnerships, and foreign stocks.
All eligible securities are sorted by decreasing total market capitalization to determine index eligibility.
For all Russell indexes, the weights of component issuers are adjusted based on available float-weighted capitalizationaccording to the market value of their available outstanding shares. The impact of a component’s price change isproportional to the issuer’s total market value, which is the share price times the number of shares available. Each Russellindex is adjusted to reflect changes in capitalization resulting from mergers, acquisitions, stock rights, substitutions andother capital events.
Frank Russell Company uses a probability measure to assign stocks to the growth and value style indexes. The probabilitymeasure is used to indicate the degree of certainty that a stock is value or growth, based on three fundamental indicators:relative price-to-book (“PB”) ratio, Institutional Brokers’ Estimate System forecast medium-term growth (2 years) and salesper share historical growth (5 years). This method allows stocks to be represented as having both growth and valuecharacteristics, while preserving the additive nature of the indexes. As a result, a stock may be a component of a Russellgrowth style index and also a component of the corresponding value style index, although the stock would likely have adifferent weight in each index.
Issue Changes. Securities that leave the Russell indexes between reconstitution dates are not replaced. Thus, the number ofsecurities in the investments over the year will fluctuate according to corporate activity. When a stock is acquired, delisted ormoves to the pink sheets or OTC bulletin boards, the stock is deleted from the relevant indexes.
When acquisitions or mergers take place, the stock’s capitalization moves to the acquiring stock, hence, mergers have noeffect on index total capitalization if the acquiring stock is part of the index. The only additions between reconstitution datesare as a result of spin-offs and initial public offerings.
Index Maintenance. Maintaining the Russell indexes includes monitoring and completing the adjustments for companyadditions and deletions, share changes, stock splits, stock dividends, and stock price adjustments due to restructuring and
44

spin-offs and quarterly initial public offerings. In addition, significant share capital changes are made at month-end. Thedivisor is adjusted for all changes in company market value to leave the value of the investments unaffected. All divisoradjustments are made after the close of trading and after the calculation of the closing value of the Russell indexes.
Index Availability. The Russell indexes are calculated continuously and are available from major data vendors.
Russell 1000® IndexNumber of Components: approximately 975
Index Description. The Russell 1000 Index measures the performance of the large-capitalization sector of the U.S. equitymarket. It is a subset of the Russell 3000 Index and serves as the underlying index for the Russell 1000 Growth and ValueIndexes, and the Russell Top 200 and MidCap series. It is a float-adjusted capitalization-weighted index consistingapproximately 1000 of the largest issuers in the Russell 3000 Index. The Underlying Index represents approximately 92% ofthe market capitalization of listed U.S. equities and is a leading benchmark of the large cap U.S. market.
Russell 1000® Growth IndexNumber of Components: approximately 553
Index Description. The Russell 1000 Growth Index measures the performance of the large-capitalization growth sector of theU.S. equity market. It is a subset of the Russell 1000 Index. It is a style factor weighted index consisting of those issuerswithin the Russell 1000 Index that have higher PB ratios and higher forecasted growth, and represents approximately 70% ofthe total market value of the Russell 1000 Index.
Russell 1000®
Pure Domestic Exposure Index
Number of Components: approximately 420
Index Description. The Russell 1000®
Pure Domestic Exposure Index is designed to reflect the performance of the commonstock of companies that earn a higher percentage of their revenues through sales in the U.S. as compared to other large- andmid-capitalization companies in the U.S. equity market. The Underlying Index is a subset of market capitalization-weightedRussell 1000 Index. All companies in the Russell 1000 Index that have a domestic sales ratio of 90% or greater will beincluded in the Underlying Index. Once included in the index, a security must maintain a domestic sales ratio of 85%.Domestic sales ratio is calculated as the percentage of a company’s latest reported domestic revenues compared to thecompany’s total revenues as of the data cut-off date.
Russell 1000® Value IndexNumber of Components: approximately 711
Index Description. The Russell 1000 Value Index measures the performance of the large-capitalization value sector of theU.S. equity market. It is a subset of the Russell 1000 Index. It is a style factor weighted index consisting of those issuerswithin the Russell 1000 Index that have lower PB ratios and lower forecasted growth, and represents approximately 62% ofthe total market value of the Russell 1000 Index.
Russell 2000® IndexNumber of Components: approximately 1,985
Index Description. The Russell 2000 Index measures the performance of the small-capitalization sector of the U.S. equitymarket. It is a subset of the Russell 3000 Index and serves as the underlying index for the Russell 2000 Growth and ValueIndexes. It is a float-adjusted capitalization-weighted index consisting approximately 2000 of the smallest issuers in theRussell 3000 Index. The Underlying Index represents approximately 8% of the market capitalization of listed U.S. equities andis a leading benchmark of the U.S. small cap equity market. The Underlying Index has a total market capitalization ofapproximately $1.6 trillion.
Russell 2000® Growth IndexNumber of Components: approximately 1,189
Index Description. The Russell 2000 Growth Index measures the performance of the small-capitalization growth sector ofthe U.S. equity market. It is a subset of the Russell 2000 Index. It is a style factor weighted index consisting of those issuers
45
within the Russell 2000 Index that have higher PB ratios and higher forecasted growth, and represents approximately 64% ofthe total market value of the Russell 2000 Index.
Russell 2000® Value IndexNumber of Components: approximately 1,400
Index Description. The Russell 2000 Value Index measures the performance of the small-capitalization value sector of theU.S. equity market. It is a subset of the Russell 2000 Index. It is a style factor weighted index consisting of those issuers withinthe Russell 2000 Index that have lower PB ratios and lower forecasted growth, and represents approximately 64% of the totalmarket value of the Russell 2000 Index.
Russell 3000® IndexNumber of Components: approximately 2,960
Index Description. The Russell 3000 Index measures the performance of the broad U.S. equity market. It serves as theunderlying index for Russell 3000 Growth and Value Indexes, and the Russell 1000 and Russell 2000 Indexes, as well as eachrespective Growth and Value Indexes. It is a float-adjusted capitalization-weighted index of the 3000 largest issuersdetermined to have the U.S. as their primary country of risk. The Russell 3000 Index represents approximately 98% of themarket capitalization of listed U.S. equities and is a leading benchmark of the broad U.S. equity market.
Russell Microcap® IndexNumber of Components: approximately 1,499
Index Description. The Russell Microcap Index measures the performance of the microcap sector of the U.S. equity market.The Russell Microcap Index consists of approximately the 1,000 smallest issuers in the Russell 3000 Index plus the nextsmallest 1,000 issuers in the equity universe as determined by Russell. The Underlying Index is a float-adjusted capitalization-weighted index and includes issuers ranging in total market capitalization from approximately $4 million to $4.6 billion,though these amounts may change from time to time. The Underlying Index included issuers representing less than 3% ofthe total market capitalization of listed U.S. equity securities.
Russell Midcap® IndexNumber of Components: approximately 777
Index Description. The Russell Midcap Index is a float-adjusted capitalization-weighted index that measures theperformance of the mid-capitalization sector of the U.S. equity market. The Russell Midcap Index consists of approximately800 of the smallest issuers in the Russell 1000 Index reflecting issuers which range in size between approximately $1.6 billionand $41.8 billion, though these amounts may change from time to time. The Russell Midcap Index represents approximately29% of the total market capitalization of the Russell 1000 companies.
Russell Midcap® Growth IndexNumber of Components: approximately 423
Index Description. The Russell Midcap Growth Index is a style factor weighted index that measures the performance of themid-capitalization growth sector of the U.S. equity market. It is a subset of the Russell Midcap Index, representingapproximately 61% of the total market value of the Russell Midcap Index. The Underlying Index measures the performance ofthose Russell Midcap Index issuers with higher PB ratios and higher forecasted growth.
Russell Midcap® Value IndexNumber of Components: approximately 582
Index Description. The Russell Midcap Value Index is a style factor weighted index that measures the performance of themid-capitalization value sector of the U.S. equity market. It is a subset of the Russell Midcap Index, representingapproximately 70% of the total market value of the Russell Midcap Index. The Underlying Index measures the performance ofthose Russell Midcap Index issuers with lower PB ratios and lower forecasted growth.
Russell Top 200® Index
Number of Components: approximately 198
46

Index Description. The Russell Top 200 Index measures the performance of the largest capitalization sector of the U.S. equitymarket. It is a float-adjusted capitalization-weighted index consisting of approximately 198 of the largest issuers in theRussell 3000 Index. The Russell Top 200 Index represents approximately 65% of the total market capitalization of all publicly-traded U.S. equity securities.
Russell Top 200® Growth Index
Number of Components: approximately 130
Index Description. The Russell Top 200 Growth Index measures the largest capitalization growth sector of the U.S. equitymarket. It is a subset of the Russell Top 200 Index, which consists of the 200 largest issues in the Russell 3000 Index. TheUnderlying Index is a style factor weighted index consisting of those issuers within the Russell Top 200 Index that havehigher PB ratios and higher forecasted growth, and represents approximately 72% of the total market value of the RussellTop 200 Index. Many issuers are represented in both the Russell Top 200 Growth Index and the Russell Top 200 Value Index.
Russell Top 200® Value Index
Number of Components: approximately 129
Index Description. The Russell Top 200 Value Index measures the largest capitalization value sector of the U.S. equitymarket. It is a subset of the Russell Top 200 Index, which consists of the 200 largest issuers in the Russell 3000 Index. TheUnderlying Index is a style factor weighted index consisting of those issuers within the Russell Top 200 Index that have lowerPB ratios and lower forecasted growth, and represents approximately 62% of the total market value of the Russell Top 200Index. Many issuers are represented in both the Russell Top 200 Growth Index and the Russell Top 200 Value Index.
The S&P IndexesComponent Selection Criteria for Domestic Indexes. S&P Dow Jones Indices LLC’s (“SPDJI”) various Index Committees areresponsible for the overall management of SPDJI’s indices (“S&P DJI Indices”). Issuers (i.e., the “components”) selected for theS&P U.S. indexes represent a broad range of industry segments within the U.S. economy. The starting universe of publiclytraded U.S. issuers classified by the Global Industry Classification Standard (GICS®) is screened to eliminate ADRs, mutualfunds, limited partnerships, royalty trusts, certain holding issuers, OTC bulletin board issues, pink sheet-listed issues, closed-end funds, ETFs and tracking stocks. REITs, except for mortgage REITs, are eligible for inclusion in the Indexes. The stock ofeach constituent must trade on either the NYSE, the NYSE Amex Equities or on NASDAQ. Additionally, only one share classper constituent will be included in an Index. The share class is selected by SPDJI and is generally defined as the largest, mostliquid share class. Issuers with multiple share classes will have the classes combined for purposes of calculation of marketcapitalization. The following criteria are then analyzed to determine an issuer’s eligibility for inclusion in the S&P Indexes: (i)ownership of an issuer’s outstanding common stock, in order to screen out closely held issuers; (ii) trading volume of anissuer’s shares, in order to ensure ample liquidity and efficient share pricing; and (iii) the financial and operating condition ofan issuer.
The S&P DJI’s Indices are capitalization-weighted, based on the following formula: number of outstanding shares of aconstituent (as determined by the float-adjusted market capitalization using SPDJI’s methodology) multiplied by theconstituent’s share price. Issuers with float-adjusted market capitalizations below certain thresholds are not eligible for theIndexes. In addition, the market capitalization of an issuer eligible for inclusion typically must be greater than the Index’sminimum market capitalization at the time it is being considered for Index inclusion. The market capitalizations of an Index’sconstituents are adjusted to reflect changes in capitalization resulting from mergers, acquisitions, stock rights, substitutionsand other capital events. The market capitalizations of an Index’s constituent are adjusted for all strategic holdings, includingprivate, corporate, and government holdings.
Component Selection Criteria for International Indexes. Stocks are eligible for the S&P Global Indices if they meet criteria forsize, liquidity, profitability, and sector and market representation. Each of the S&P Global Indices is balanced across countryand sector weights in the region/market. The S&P Global Indices begin with an eligible investable universe of stocks coveringapproximately 95% of each country’s total market capitalization. In some cases, the S&P Global Indexes may include ADRsand GDRs. Stocks with relatively small market capitalization or insufficient liquidity are excluded by SPDJI. To identify acandidate pool for index constituent selection, all stocks are carefully examined using a set of general criteria. The specificsecurities are then screened for industry sector classification; thus, the eligible securities are ranked according to GICS. Then,
47

the Index components, now determined, are weighted on the basis of SPDJI’s float-adjusted, market capitalizationmethodology. Generally, SPDJI observes a prospective constituent’s liquidity over a period of at least six months beforeconsideration for inclusion. However, there may be extraordinary situations when issuers should be added immediately (e.g.,certain privatizations). When a particular issuer dominates its home market, it may be excluded from an Index if analysis ofthe sectors reveals that its securities are not as liquid as those of similar issuers in other countries. Once a year, the floatadjustments will be reviewed and potentially changed based on such review. The values of an Index’s constituents areadjusted to reflect changes in capitalization resulting from mergers, acquisitions, stock rights, substitutions and other capitalevents. The market capitalization of index constituent issuers is adjusted for all strategic holdings, including private,corporate, and government holdings.
With respect to the non-U.S. components of the S&P Global Indexes, the eligible universe of index components that areconsidered for inclusion are from the following S&P DJI Indices: (i) the S&P/TSX 60 (Toronto Stock Exchange), whichrepresents the liquid, large-cap stocks of the publicly listed issuers in the Canadian equities market; (ii) the S&P/TOPIX 150(TSE) which represents the liquid, large-cap stocks of the publicly-listed issuers in the Japanese equities market; (iii)S&P/ASX All-Australian 50 Index (Australian Stock Exchange), which represents the liquid, large-cap stocks in the Australianequities market; (iv) the S&P Asia 50, which represents the liquid, large-cap stocks of four major equities markets in Asia(Hong Kong, South Korea, Taiwan and Singapore); (v) the S&P Latin America 40, which represents the liquid, large-cap stocksfrom major sectors of the Mexico, Brazil, Peru, Colombia and Chilé equity markets; and (vi) the S&P Europe 350, whichrepresents the liquid, large-cap stocks of the publicly listed issuers in the region, covering approximately 70% of the region’smarket capitalization.
Issue Changes. General oversight responsibility for the S&P DJI Indices, including overall policy guidelines and methodology,is handled by the S&P Global Index Committee. Maintenance of component investments, including additions and deletions tothese investments, is the responsibility of separate regional index committees composed of S&P staff specialized in thevarious regional equity markets and, in some cases, with the assistance of local stock exchanges. Public announcements ofindex changes as the result of committee decisions will generally be made two business days in advance of the anticipatedeffective date whenever possible, although for exceptional corporate events announcements may be made earlier.
Index Maintenance. Maintaining the S&P DJI Indices includes monitoring and completing the adjustments for issueradditions and deletions, share changes, stock splits, stock dividends, and stock price adjustments due to restructuring andspin-offs. An issuer will be removed from the S&P DJI Indices as a result of mergers/acquisitions, bankruptcy, orrestructuring. An issuer is removed from the relevant index as close as possible to the actual date on which the eventoccurred. An issuer can be removed from an index because it no longer meets current criteria for inclusion and/or is nolonger representative of its industry group. All replacement issuers are selected based on the above component sectioncriteria.
When calculating index weights, individual constituents’ shares held by governments, corporations, strategic partners, orother control groups are excluded from the issuer’s shares outstanding. Shares owned by other issuers are also excludedregardless of whether they are index constituents. In countries with regulated environments, where a foreign investment limitexists at the sector or issuer level, the constituent’s weight will reflect either the foreign investment limit or the percentagefloat, whichever is the more restrictive.
Each issuer’s financial statements will be used to update the major shareholders’ ownership. However, during the course ofthe year, SPDJI also monitors each issuer’s Investable Weight Factor (“IWF”) which is SPDJI’s term for the mathematical floatfactor used to calculate the float adjustment. If a change in IWF is caused by a major corporate action (i.e., privatization,merger, takeover, or share offering) and the change equal to or greater than 5%, a float adjustment will be implemented assoon as reasonably possible.
Changes in the number of shares outstanding driven by corporate events such as stock dividends, splits, and rights issueswill be adjusted on the ex-date. Share changes of 5% or greater are implemented when they occur. Share changes of lessthan 5% are only updated on a quarterly basis on the Friday near the end of the calendar quarter. Generally, index changesdue to rebalancing are announced two days before the effective date by way of a news release posted onwww.us.spindices.com.
Index Availability. The S&P Indexes are calculated continuously and are available from major data vendors.
48

Exchange Rates. SPDJI uses the World Markets/Reuters Closing Spot Rates taken at 4:00 p.m. London time for the followingfunds: iShares Expanded Tech Sector ETF, iShares Expanded Tech-Software Sector ETF, iShares Europe ETF, iShares Global100 ETF, iShares Global Clean Energy ETF, iShares Global Comm Services ETF, iShares Global Consumer Discretionary ETF,iShares Global Consumer Staples ETF, iShares Global Energy ETF, iShares Global Financials ETF, iShares Global Industrials ETF,iShares Global Utilities ETF, iShares North American Natural Resources ETF and iShares North American Tech-MultimediaNetworking ETF. Prior to January 31, 2013, SPDJI used the currency exchange (FX) rate corresponding to 5:15 p.m. Easterntime. In case World Markets/Reuters does not provide rates for specific markets on given days (for example, Christmas Dayand New Year’s Day), the previous business day’s rates are normally used. SPDJI independently monitors the exchange rateson all its indexes. SPDJI may under exceptional circumstances elect to use alternative sources of exchange rates if the WorldMarkets/Reuters rates are not available, or if SPDJI determines that the World Markets/Reuters rates are not reflective ofmarket circumstances for a given currency on a particular day.
S&P 100®
Number of Components: approximately 102
Index Description. The S&P 100® is a capitalization-weighted index representing stocks from a broad range of industries,chosen for market size, liquidity and industry group representation. It is a subset of the S&P 500® and consists of blue chipstocks from diverse industries in the S&P 500® with exchange listed options. The Underlying Index is a widely tracked indexfor blue-chip stocks. The S&P 100® serves as the basis for the S&P 100® options contract which trades on the Chicago Boardof Options Exchange.
S&P 500 Growth IndexTM
Number of Components: approximately 293
Index Description. The S&P 500 Growth IndexTM is a capitalization-weighted index representing stocks with growthcharacteristics from a broad range of industries.
S&P 500®
Number of Components: approximately 505
Index Description. The S&P 500® serves as the underlying index for the S&P 500® Growth and Value Index series and theS&P 100®. It is a capitalization-weighted index representing stocks from a broad range of industries chosen for market size,liquidity and industry group representation. The S&P 500® measures the performance of the large-capitalization sector of theU.S. equity market.
S&P 500 Value IndexTM
Number of Components: approximately 389
Index Description. The S&P 500 Value IndexTM is a capitalization-weighted index representing stocks with valuecharacteristics from a broad range of industries.
S&P 900 Growth IndexTM
Number of Components: approximately 535
Index Description. The S&P 900 Growth IndexTM is a capitalization-weighted index representing stocks with growthcharacteristics from a broad range of industries in the U.S. equity market.
The Index is rebalanced annually in December. Rebalances occur after the close on the third Friday of December and arebased on growth and value metrics after the close of the last trading date in November.
S&P 900 Value IndexTM
Number of Components: approximately 683
Index Description. The S&P 900 Value IndexTM is a capitalization-weighted index representing stocks with valuecharacteristics from a broad range of industries in the U.S. equity market.
The Index is rebalanced annually in December. Rebalances occur after the close on the third Friday of December and arebased on growth and value metrics after the close of the last trading date in November.
49

S&P Developed Ex-U.S. Property IndexTM
Number of Components: approximately 373
Index Description. The S&P Developed Ex-U.S. Property IndexTM is a free float-adjusted market capitalization weighted indexthat defines and measures the investable universe of publicly-traded real estate companies domiciled in developed countriesoutside of the U.S.
S&P Europe 350TM
Number of Components: approximately 364
Index Description. The S&P Europe 350TM is a capitalization-weighted index of approximately 364 stocks providinggeographic and economic diversity over S&P’s 11 Global Industry Classification Standard (GICS®) Sectors and 16 majordeveloped European markets, each chosen for market size, liquidity and industry group representation. The marketcapitalization of index constituent companies is adjusted for all strategic holdings, including private, corporate, andgovernment holdings. The Underlying Index is adjusted to reflect changes in capitalization resulting from mergers,acquisitions, stock rights, substitutions and other capital events. The market capitalization of constituent companies isadjusted to reflect the available float and, if necessary, any foreign investment restrictions.
S&P Global 100TM
Number of Components: approximately 102
Index Description. The S&P Global 100TM measures the performance of 100 large multi-national companies that are ofmajor importance in the global markets. A global company is defined as a corporation that has production facilities and/orother fixed assets in at least one foreign country outside the company’s home country, and makes its major managementdecisions in a global context. The degree to which sales are executed outside the home country is a factor in determining acompany’s global reach. The market capitalization of index constituent companies is adjusted for all strategic holdings,including private, corporate, and government holdings. The composition of the Underlying Index is derived from the S&PGlobal 1200TM and only includes transnational corporations under the above definition which had a minimum adjustedmarket capitalization of US $5 billion. The Underlying Index is adjusted to reflect changes in capitalization resulting frommergers, acquisitions, stock rights, substitutions and other capital events.
S&P Global Clean Energy IndexTM
Number of Components: approximately 30
Index Description. The S&P Global Clean Energy IndexTM is designed to track the performance of approximately 30 of whatare expected to be the most liquid and tradable securities of global companies involved in clean energy related businesses.The Underlying Index includes clean energy production companies, and clean energy equipment and technology providers.For these purposes, “clean energy” sources include biofuel and biomass, ethanol and fuel alcohol, geothermal energy,hydroelectricity, and solar and wind energy.
S&P Global 1200 Consumer Discretionary IndexTM
Number of Components: approximately 177
Index Description. The S&P Global 1200 Consumer Discretionary IndexTM measures the performance of companies that S&Pdeems to be part of the consumer discretionary sector of the economy and that S&P believes are important to globalmarkets. It is a subset of the S&P Global 1200TM. Component companies include consumer product manufacturing, service,media and retail companies.
S&P Global 1200 Consumer Staples IndexTM
Number of Components: approximately 91
Index Description. The S&P Global 1200 Consumer Staples IndexTM measures the performance of companies that S&Pdeems to be part of the consumer staples sector of the economy and that S&P believes are important to global markets. It isa subset of the S&P Global 1200TM. Component companies include manufacturers and distributors of food, producers ofnon-durable household goods, and food and drug retailing companies.
S&P Global 1200 Energy IndexTM
Number of Components: approximately 73
50

Index Description. The S&P Global 1200 Energy IndexTM measures the performance of companies that S&P deems to be partof the energy sector of the economy and that S&P believes are important to global markets. The market capitalization ofindex constituent companies is adjusted for all strategic holdings, including private, corporate, and government holdings. TheUnderlying Index is a subset of the S&P Global 1200TM. The Underlying Index is adjusted to reflect changes in capitalizationresulting from mergers, acquisitions, stock rights, substitutions and other capital events.
S&P Global 1200 Financials IndexTM
Number of Components: approximately 195
Index Description. The S&P Global 1200 Financials IndexTM measures the performance of companies that S&P deems to bepart of the financial sector of the economy and that S&P believes are important to global markets. The market capitalizationof index constituent companies is adjusted for all strategic holdings, including private, corporate, and government holdings.The Underlying Index is a subset of the S&P Global 1200TM. The Underlying Index is adjusted to reflect changes incapitalization resulting from mergers, acquisitions, stock rights, substitutions and other capital events.
S&P Global 1200 Industrials IndexTM
Number of Components: approximately 201
Index Description. The S&P Global 1200 Industrials IndexTM measures the performance of companies that S&P deems to bepart of the industrials sector of the economy and that S&P believes are important to global markets. It is a subset of the S&PGlobal 1200TM. Component companies include manufacturers and distributors of capital goods, providers of commercialservices and supplies, and transportation service providers.
S&P Global Infrastructure IndexTM
Number of Components: approximately 73
Index Description. The S&P Global Infrastructure IndexTM is designed to track the performance of the stocks of largeinfrastructure companies around the world. The Underlying Index includes companies involved in: utilities, energy andtransportation infrastructure, such as the management or ownership of oil and gas storage and transportation; airportservices; highways and rail tracks; marine ports and services; and electric, gas and water utilities.
S&P Global 1200 Communication Services Sector IndexTM
Number of Components: approximately 64
Index Description. The S&P Global 1200 Communication Services Sector IndexTM measures the performance of companiesthat S&P deems to be part of the communication services sector of the economy and that S&P believes are important toglobal markets. The market capitalization of index constituent companies is adjusted for all strategic holdings, includingprivate, corporate, and government holdings. The Underlying Index is a subset of the S&P Global 1200TM. The UnderlyingIndex is adjusted to reflect changes in capitalization resulting from mergers, acquisitions, stock rights, substitutions andother capital events.
S&P Global 1200 Utilities IndexTM
Number of Components: approximately 63
Index Description. The S&P Global 1200 Utilities IndexTM measures the performance of companies that S&P deems to bepart of the Utilities sector of the economy and that S&P believes are important to global markets. It is a subset of the S&PGlobal 1200TM. Component companies include providers of electric, gas or water utilities, or companies that operate asindependent producers and/or distributors of power.
S&P International Preferred Stock IndexTM
Number of Components: approximately 113
Index Description. The S&P International Preferred Stock IndexTM measures the performance of a select group of preferredstocks trading on non-U.S. developed market exchanges, as defined by S&P. The preferred stocks included in the UnderlyingIndex are selected by S&P using the methodology described below.
In general terms, the Underlying Index includes developed-market preferred stocks with a market capitalization of over $100million that meet minimum price, liquidity, maturity and other requirements determined by S&P. S&P excludes from the
51

Underlying Index: (i) preferred stocks which are structured products and brand-name products issued by financialinstitutions or are packaged securities linked to indexes, baskets of stocks or another company’s stock; (ii) preferred stocksthat are issued by special ventures such as highway, airport, or dam operators; (iii) preferred stocks that have a mandatoryconversion or scheduled maturity within the next 12 months; and (iv) trust preferred stocks. Once an issue of preferred stockis included in the Underlying Index, the removal criteria listed below are used to test its continuing eligibility as opposed tothe exclusion factors listed above.
All additions to the Underlying Index are made on a quarterly rebalancing date, and there are no intra-quarter additions madeto the Underlying Index. Inclusion in the Underlying Index is limited to issues whose indicated dividend yield is greater thanor equal to 1% and less than or equal to 20%. In addition, for initial inclusion eligibility, each individual issue must be apreferred stock which has traded an average of 250,000 shares per month over the previous six months, as of therebalancing reference date. Issues with fewer than six months of trading history are evaluated over the available period andmay be included should size and available trading history infers the issue satisfies this requirement.
Preferred stocks are removed from the Underlying Index on a quarterly rebalancing date if they: (i) have an outstandingmarket capitalization of less than $100 million; (ii) have a six-month average monthly trading volume of less than 100,000shares and have been a component of the Index for at least 12 months; or (iii) have an undetermined indicated dividend yieldor an indicated dividend yield of less than 1% or greater than 20%.
Share changes for existing Underlying Index components occur semiannually in January and July. The data reference date foradditions to and deletions from the Underlying Index is the last trading date of the month immediately preceding therebalancing month. The Underlying Index is rebalanced on a quarterly basis; and changes are effective after the close oftrading on the third Friday of January, April, July and October. The Underlying Index is calculated with a modifiedcapitalization weighted scheme, with modifications being made to Underlying Index shares to prevent single stockconcentration. There is no limit to the number of lines of a single company’s preferred stock is allowed in the UnderlyingIndex; however, a maximum weight of 10% is set per issuer. All eligible lines for an issuer are included in the Underlying Indexand capped on a pro rata basis to a maximum of 4% by issue of the Underlying Index market capitalization. For purposes ofthis limitation, S&P defines a single issuer to include companies that are under common control or are guaranteed by thesame entity which is also affiliated with such companies. In the event the market capitalization weight of an issuer wouldexceed 10% or an issue would exceed 4% of the Underlying Index, all other stock weights in the Index are increasedproportionately to account for such difference.
A constituent is removed intra-quarter if it is called or undergoes mandatory conversion or redemption. Subject to marketconditions, S&P will provide clients with five-days advance notice of a deletion. Should an existing member of the UnderlyingIndex delist during the five-day notification period, it is removed at the closing price from its last day of trading. The quarterlyrebalancing also results in deletions if constituents no longer meet continued eligibility requirements.
S&P MidCap 400 Growth IndexTM
Number of Components: approximately 241
Index Description. The S&P MidCap 400 Growth IndexTM is a capitalization-weighted index representing stocks with growthcharacteristics from a broad range of industries.
S&P MidCap 400®
Number of Components: approximately 400
Index Description. The S&P MidCap 400®
serves as the underlying index for the S&P MidCap 400® Growth and Value Indexseries. The Underlying Index measures the performance of the mid-capitalization sector of the U.S. equity market. Thesecurities added to the Underlying Index have a market capitalization between $1.4 billion and $5.9 billion (which mayfluctuate depending on the overall level of the equity markets) and are selected for liquidity and industry grouprepresentation.
S&P MidCap 400 Value IndexTM
Number of Components: approximately 295
Index Description. The S&P MidCap 400 Value IndexTM is a capitalization-weighted index representing stocks with valuecharacteristics from a broad range of industries.
52
S&P North American Expanded Technology Sector IndexTM
Number of Components: approximately 292
Index Description. The S&P North American Expanded Technology Sector IndexTM is designed to measure the performanceof U.S.-traded stocks from the technology sector and select technology-related companies from the communication servicesand consumer discretionary sectors in the U.S. and Canada.
S&P North American Expanded Technology Software IndexTM
Number of Components: approximately 64
Index Description. The S&P North American Expanded Technology Software IndexTM is designed to measure theperformance of U.S.-traded stocks from the software industry and select companies from the interactive home entertainmentand interactive media and services sub-industries in the U.S. and Canada.
S&P North American Natural Resources IndexTM
Number of Components: approximately 133
Index Description. The S&P North American Natural Resources IndexTM is designed to measure the performance of U.S.-traded stocks of natural resource-related companies in the U.S. and Canada.
S&P North American Technology Multimedia Networking IndexTM
Number of Components: approximately 25
Index Description. The S&P North American Technology Multimedia Networking IndexTM is designed to measure theperformance of U.S.-traded stocks of communication equipment companies in the U.S. and Canada.
S&P SmallCap 600 Growth IndexTM
Number of Components: approximately 333
Index Description. The S&P SmallCap 600 Growth IndexTM is a capitalization-weighted index representing stocks withgrowth characteristics from a broad range of industries.
S&P SmallCap 600®
Number of Components: approximately 601
Index Description. The S&P SmallCap 600®
serves as the underlying index for the S&P SmallCap 600® Growth and ValueIndex series. It is a capitalization-weighted index from a broad range of industries chosen for market size, liquidity andindustry group representation. The Underlying Index measures the performance of publicly-traded securities in the small-capitalization sector of the U.S. equity market. The stocks in the Underlying Index have a market capitalization between $400million and $1.8 billion (which may fluctuate depending on the overall level of the equity markets) and are selected forliquidity and industry group representation.
S&P SmallCap 600 Value IndexTM
Number of Components: approximately 455
Index Description. The S&P SmallCap 600 Value IndexTM is a capitalization-weighted index representing stocks with valuecharacteristics from a broad range of industries.
S&P Total Market Index™Number of Components: approximately 3,777
Index Description. The S&P Total Market Index™ is composed of S&P 500® members and S&P Completion Index™members, which together are designed to track the broad equity market, including large-, mid-, small- and micro-capitalization companies. The index includes all eligible common equities listed on the NYSE (including NYSE Arca and NYSEMKT), the NASDAQ Global Select Market, the NASDAQ Global Market, the NASDAQ Capital Market and BATS. The securitiesin the S&P Total Market Index™ are weighted based on the total float-adjusted market value of their outstanding shares.Securities with higher total float-adjusted market values have a larger representation in the S&P Total Market Index™. TheS&P 500® measures the performance of the large-capitalization sector of the U.S. equity market. As of March 31, 2018, the
53

S&P 500® included approximately 81% of the market capitalization of the S&P Total Market Index™. The S&P CompletionIndex™ measures the performance of the mid-, small- and micro-capitalization sector of the U.S. equity market.
S&P®, S&P North American Natural Resources Sector Index™, S&P North American Expanded Technology Sector Index™,S&P North American Technology IndexTM, S&P North American Technology Multimedia Networking Index™, S&P NorthAmerican Expanded Technology Software Index™ and S&P North American Technology Software IndexTM aretrademarks of SPDJI or its affiliates.
The iShares North American Natural Resources ETF, iShares Expanded Tech Sector ETF, iShares North American Tech-Multimedia Networking ETF and iShares Expanded Tech-Software Sector ETF (the “iShares S&P Underlying Funds”) arenot sponsored, endorsed, sold or promoted by SPDJI or its affiliates or third party licensors (together, “S&P Dow JonesIndices”). S&P Dow Jones Indices does not make any representation or warranty, express or implied, to the owners of theiShares S&P Underlying Funds or any member of the public regarding the advisability of investing in securities generallyor in the iShares S&P Underlying Funds particularly or the ability of the S&P Indexes to track general marketperformance. S&P Dow Jones Indices’ only relationship to BFA or its affiliates with respect to the S&P Indexes is thelicensing of the S&P Indexes and certain trademarks, service marks and/or trade names of S&P Dow Jones Indicesand/or its licensors. The S&P Indexes are determined, composed and calculated by SPDJI without regard to BFA or itsaffiliates or the iShares S&P Underlying Funds. S&P Dow Jones Indices has no obligation to take the needs of BFA or itsaffiliates or the owners of the iShares S&P Underlying Funds into consideration in determining, composing or calculatingthe S&P Indexes. S&P Dow Jones Indices is responsible for and has not participated in the determination of the prices,and amount of the iShares S&P Underlying Funds or the timing of the issuance or sale of the iShares S&P UnderlyingFunds or in the determination or calculation of the equation by which the iShares S&P Underlying Funds are to beconverted into cash, surrendered or redeemed, as the case may be. S&P Dow Jones Indices has no obligation or liability inconnection with the administration, marketing or trading of the iShares S&P Underlying Funds. There is no assurancethat investment products based on the S&P Indexes will accurately track index performance or provide positiveinvestment returns. SPDJI is not an investment advisor. Inclusion of a security within an index is not a recommendationby SPDJI to buy, sell, or hold such security, nor is it considered to be investment advice.
S&P DOW JONES INDICES DOES NOT GUARANTEE THE ADEQUACY, ACCURACY, TIMELINESS AND/OR THECOMPLETENESS OF THE S&P INDEXES OR ANY DATA RELATED THERETO OR ANY COMMUNICATION, INCLUDING BUTNOT LIMITED TO, ORAL OR WRITTEN COMMUNICATION (INCLUDING ELECTRONIC COMMUNICATIONS) WITH RESPECTTHERETO. S&P DOW JONES INDICES SHALL NOT BE SUBJECT TO ANY DAMAGES OR LIABILITY FOR ANY ERRORS,OMISSIONS, OR DELAYS THEREIN. S&P DOW JONES INDICES MAKES NO EXPRESS OR IMPLIED WARRANTIES, ANDEXPRESSLY DISCLAIMS ALL WARRANTIES, OF MERCHANTABILITY OR FITNESS FOR A PARTICULAR PURPOSE OR USE ORAS TO RESULTS TO BE OBTAINED BY BFA OR ITS AFFILIATES, OWNERS OF THE ISHARES S&P UNDERLYING FUNDS, ORANY OTHER PERSON OR ENTITY FROM THE USE OF THE S&P INDEXES OR WITH RESPECT TO ANY DATA RELATEDTHERETO. WITHOUT LIMITING ANY OF THE FOREGOING, IN NO EVENT WHATSOEVER SHALL S&P DOW JONES INDICESBE LIABLE FOR ANY INDIRECT, SPECIAL, INCIDENTAL, PUNITIVE, OR CONSEQUENTIAL DAMAGES INCLUDING BUT NOTLIMITED TO, LOSS OF PROFITS, TRADING LOSSES, LOST TIME OR GOODWILL, EVEN IF THEY HAVE BEEN ADVISED OFTHE POSSIBILITY OF SUCH DAMAGES, WHETHER IN CONTRACT, TORT, STRICT LIABILITY, OR OTHERWISE. THERE ARENO THIRD PARTY BENEFICIARIES OF ANY AGREEMENTS OR ARRANGEMENTS BETWEEN S&P DOW JONES INDICES ANDBFA OR ITS AFFILIATES, OTHER THAN THE LICENSORS OF S&P DOW JONES INDICES.
For more information about SPDJI, including its limited relationship with BlackRock, Inc. and its affiliates and the limitationsof the S&P DJI indices, please refer to the applicable Prospectus.
Investment RestrictionsThe Board has adopted as fundamental policies the following numbered investment restrictions, which cannot be changedwithout the approval of the holders of a majority of the applicable Fund’s outstanding voting securities. A vote of a majorityof the outstanding voting securities of a Fund is defined in the 1940 Act as the lesser of (i) 67% or more of the votingsecurities present at a shareholder meeting, if the holders of more than 50% of the outstanding voting securities of the Fundare present or represented by proxy, or (ii) more than 50% of outstanding voting securities of the Fund. Each Fund has alsoadopted certain non-fundamental investment policies, including its investment objective. Non-fundamental investment
54

policies may be changed by the Board without shareholder approval. Therefore, each Fund may change its investmentobjective and its Underlying Index without shareholder approval.
Fundamental Investment Policies
Each Fund (other than the iShares Core S&P 500 ETF, iShares Global Clean Energy ETF, iShares Global ConsumerDiscretionary ETF, iShares Global Consumer Staples ETF, iShares Global Energy ETF, iShares Global Industrials ETF,iShares Global Infrastructure ETF, iShares Global Utilities ETF, iShares International Developed Property ETF, iSharesInternational Preferred Stock, iShares North American Tech-Multimedia Networking ETF, iShares Preferred and IncomeSecurities ETF, iShares Russell Top 200 ETF, iShares Russell Top 200 Growth ETF, iShares Russell Top 200 Value ETF,iShares U.S. Aerospace & Defense ETF, iShares U.S. Broker-Dealers & Securities Exchanges ETF, iShares U.S. HealthcareProviders ETF, iShares U.S. Home Construction ETF, iShares U.S. Infrastructure ETF, iShares U.S. Insurance ETF, iSharesU.S. Medical Devices ETF, iShares U.S. Oil & Gas Exploration & Production ETF, iShares U.S. Oil Equipment & Services ETF,iShares U.S. Pharmaceuticals ETF and iShares U.S. Regional Banks ETF) will not:
1. Concentrate its investments (i.e., hold 25% or more of its total assets in the stocks of a particular industry or group ofindustries), except that each Fund will concentrate to approximately the same extent that its Underlying Indexconcentrates in the stocks of such particular industry or group of industries. For purposes of this limitation, securities ofthe U.S. government (including its agencies and instrumentalities), repurchase agreements collateralized by U.S.government securities, and securities of state or municipal governments and their political subdivisions are notconsidered to be issued by members of any industry.
2. Borrow money, except that (i) each Fund may borrow from banks for temporary or emergency (not leveraging)purposes, including the meeting of redemption requests which might otherwise require the untimely disposition ofsecurities, and (ii) each Fund may, to the extent consistent with its investment policies, enter into repurchaseagreements, reverse repurchase agreements, forward roll transactions and similar investment strategies andtechniques. To the extent that it engages in transactions described in (i) and (ii), each Fund will be limited so that nomore than 33 1/3% of the value of its total assets (including the amount borrowed) is derived from such transactions.Any borrowings which come to exceed this amount will be reduced in accordance with applicable law.
3. Issue any senior security, except as permitted under the 1940 Act, as amended, and as interpreted, modified orotherwise permitted by regulatory authority having jurisdiction, from time to time.
4. Make loans, except as permitted under the 1940 Act, as amended, and as interpreted, modified or otherwise permittedby regulatory authority having jurisdiction, from time to time.
5. Purchase or sell real estate, real estate mortgages, commodities or commodity contracts, but this restriction shall notprevent each Fund from trading in futures contracts and options on futures contracts (including options on currenciesto the extent consistent with each Fund’s investment objective and policies).
6. Engage in the business of underwriting securities issued by other persons, except to the extent that each Fund maytechnically be deemed to be an underwriter under the 1933 Act, in disposing of portfolio securities.
Each of the iShares Core S&P 500 ETF, iShares Global Energy ETF and iShares North American Tech-MultimediaNetworking ETF will not:
1. Concentrate its investments (i.e., hold 25% or more of its total assets in the stocks of a particular industry or group ofindustries), except that each Fund will concentrate to approximately the same extent that its Underlying Indexconcentrates in the stocks of such particular industry or group of industries. For purposes of this limitation, securities ofthe U.S. government (including its agencies and instrumentalities), repurchase agreements collateralized by U.S.government securities, and securities of state or municipal governments and their political subdivisions are notconsidered to be issued by members of any industry.
2. Borrow money, except that (i) each Fund may borrow from banks for temporary or emergency (not leveraging)purposes, including the meeting of redemption requests which might otherwise require the untimely disposition ofsecurities, and (ii) each Fund may, to the extent consistent with its investment policies, enter into repurchaseagreements, reverse repurchase agreements, forward roll transactions and similar investment strategies andtechniques. To the extent that it engages in transactions described in (i) and (ii), each Fund will be limited so that nomore than 33 1/3% of the value of its total assets (including the amount borrowed) is derived from such transactions.Any borrowings which come to exceed this amount will be reduced in accordance with applicable law.
55

3. Issue “senior securities” as defined in the 1940 Act and the rules, regulations and orders thereunder, except aspermitted under the 1940 Act and the rules, regulations and orders thereunder.
4. Make loans. This restriction does not apply to: (i) the purchase of debt obligations in which each Fund may investconsistent with its investment objectives and policies; (ii) repurchase agreements and reverse repurchase agreements;and (iii) loans of its portfolio securities, to the fullest extent permitted under the 1940 Act.
5. Purchase or sell real estate, real estate mortgages, commodities or commodity contracts, but this restriction shall notprevent each Fund from trading in futures contracts and options on futures contracts (including options on currenciesto the extent consistent with each Fund’s investment objective and policies).
6. Engage in the business of underwriting securities issued by other persons, except to the extent that each Fund maytechnically be deemed to be an underwriter under the 1933 Act in disposing of portfolio securities.
Each of the iShares Global Consumer Discretionary ETF, iShares Global Consumer Staples ETF, iShares Global IndustrialsETF and iShares Global Utilities ETF, iShares U.S. Aerospace & Defense ETF, iShares U.S. Broker-Dealers & SecuritiesExchanges ETF, iShares U.S. Healthcare Providers ETF, iShares U.S. Home Construction ETF, iShares U.S. Insurance ETF,iShares U.S. Medical Devices ETF, iShares U.S. Oil & Gas Exploration & Production ETF, iShares U.S. Oil Equipment &Services ETF, iShares U.S. Pharmaceuticals ETF and iShares U.S. Regional Banks ETF will not:
1. Concentrate its investments (i.e., hold 25% or more of its total assets in the stocks of a particular industry or group ofindustries), except that each Fund will concentrate to approximately the same extent that its Underlying Indexconcentrates in the stocks of such particular industry or group of industries. For purposes of this limitation, securities ofthe U.S. government (including its agencies and instrumentalities), repurchase agreements collateralized by U.S.government securities, and securities of state or municipal governments and their political subdivisions are notconsidered to be issued by members of any industry.
2. Borrow money, except that (i) each Fund may borrow from banks for temporary or emergency (not leveraging)purposes, including the meeting of redemption requests which might otherwise require the untimely disposition ofsecurities, and (ii) each Fund may, to the extent consistent with its investment policies, enter into repurchaseagreements, reverse repurchase agreements, forward roll transactions and similar investment strategies andtechniques. To the extent that it engages in transactions described in (i) and (ii), each Fund will be limited so that nomore than 33 1/3% of the value of its total assets (including the amount borrowed) is derived from such transactions.Any borrowings which come to exceed this amount will be reduced in accordance with applicable law.
3. Issue any senior security, except as permitted under the 1940 Act, as amended, and as interpreted, modified orotherwise permitted by regulatory authority having jurisdiction, from time to time.
4. Make loans, except as permitted under the 1940 Act.
5. Purchase or sell real estate, real estate mortgages, commodities or commodity contracts, but this restriction shall notprevent each Fund from trading in futures contracts and options on futures contracts (including options on currenciesto the extent consistent with each Fund’s investment objective and policies).
6. Engage in the business of underwriting securities issued by other persons, except to the extent that each Fund maytechnically be deemed to be an underwriter under the 1933 Act in disposing of portfolio securities.
Each of the iShares Global Clean Energy ETF, iShares Global Infrastructure ETF, iShares International Developed PropertyETF, iShares International Preferred Stock ETF, iShares Preferred and Income Securities ETF, iShares Russell Top 200 ETF,iShares Russell Top 200 Growth ETF and iShares Russell Top 200 Value ETF will not:
1. Concentrate its investments (i.e., invest 25% or more of its total assets in the securities of a particular industry or groupof industries), except that each Fund will concentrate to approximately the same extent that its Underlying Indexconcentrates in the securities of such particular industry or group of industries. For purposes of this limitation,securities of the U.S. government (including its agencies and instrumentalities), repurchase agreements collateralizedby U.S. government securities, and securities of state or municipal governments and their political subdivisions are notconsidered to be issued by members of any industry.
2. Borrow money, except that (i) each Fund may borrow from banks for temporary or emergency (not leveraging)purposes, including the meeting of redemption requests which might otherwise require the untimely disposition ofsecurities; and (ii) each Fund may, to the extent consistent with its investment policies, enter into repurchaseagreements, reverse repurchase agreements, forward roll transactions and similar investment strategies andtechniques. To the extent that it engages in transactions described in (i) and (ii), each Fund will be limited so that no
56

more than 33 1/3% of the value of its total assets (including the amount borrowed) is derived from such transactions.Any borrowings which come to exceed this amount will be reduced in accordance with applicable law.
3. Issue any senior security, except as permitted under the 1940 Act, as interpreted, modified or otherwise permitted byregulatory authority having jurisdiction, from time to time.
4. Make loans, except as permitted under the 1940 Act, as interpreted, modified or otherwise permitted by regulatoryauthority having jurisdiction, from time to time.
5. Purchase or sell real estate unless acquired as a result of ownership of securities or other instruments (but thisrestriction shall not prevent each Fund from investing in securities of companies engaged in the real estate business orsecurities or other instruments backed by real estate or mortgages), or commodities or commodity contracts (but thisrestriction shall not prevent each Fund from trading in futures contracts and options on futures contracts, includingoptions on currencies to the extent consistent with each Fund’s investment objective and policies).
6. Engage in the business of underwriting securities issued by other persons, except to the extent that each Fund maytechnically be deemed to be an underwriter under the 1933 Act, in disposing of portfolio securities.
Each of the iShares Russell 1000 Pure U.S. Revenue ETF and iShares U.S. Infrastructure ETF may not:
1. Concentrate its investments in a particular industry, as that term is used in the 1940 Act, except that each Fund willconcentrate to approximately the same extent that its Underlying Index concentrates in the securities of a particularindustry or group of industries.
2. Borrow money, except as permitted under the 1940 Act.
3. Issue senior securities to the extent such issuance would violate the 1940 Act.
4. Purchase or hold real estate, except each Fund may purchase and hold securities or other instruments that are securedby, or linked to, real estate or interests therein, securities of REITs, mortgage-related securities and securities of issuersengaged in the real estate business, and each Fund may purchase and hold real estate as a result of the ownership ofsecurities or other instruments.
5. Underwrite securities issued by others, except to the extent that the sale of portfolio securities by each Fund may bedeemed to be an underwriting or as otherwise permitted by applicable law.
6. Purchase or sell commodities or commodity contracts, except as permitted by the 1940 Act.
7. Make loans to the extent prohibited by the 1940 Act.
Notations Regarding the iShares Russell 1000 Pure U.S. Revenue ETF’s and iShares U.S. Infrastructure ETF’s FundamentalInvestment Policies
The following notations are not considered to be part of each Fund’s fundamental investment policies and are subject tochange without shareholder approval.
With respect to the fundamental policy relating to concentration set forth in (1) above, the Investment Company Act doesnot define what constitutes “concentration” in an industry. The SEC staff has taken the position that investment of 25% ormore of a fund’s total assets in one or more issuers conducting their principal activities in the same industry or group ofindustries constitutes concentration. It is possible that interpretations of concentration could change in the future. The policyin (1) above will be interpreted to refer to concentration as that term may be interpreted from time to time. The policy alsowill be interpreted to permit investment without limit in the following: securities of the U.S. government and its agencies orinstrumentalities; securities of state, territory, possession or municipal governments and their authorities, agencies,instrumentalities or political subdivisions; and repurchase agreements collateralized by any such obligations. Accordingly,issuers of the foregoing securities will not be considered to be members of any industry. There also will be no limit oninvestment in issuers domiciled in a single jurisdiction or country. Finance companies will be considered to be in theindustries of their parents if their activities are primarily related to financing the activities of the parents. Each foreigngovernment will be considered to be a member of a separate industry. With respect to a Fund’s industry classifications, eachFund currently utilizes any one or more of the industry sub-classifications used by one or more widely recognized marketindexes or rating group indexes, and/or as defined by Fund management. The policy also will be interpreted to give broadauthority to a Fund as to how to classify issuers within or among industries.
With respect to the fundamental policy relating to borrowing money set forth in (2) above, the Investment Company Actpermits each Fund to borrow money in amounts of up to one-third of the Fund’s total assets from banks for any purpose,
57

and to borrow up to 5% of the Fund’s total assets from banks or other lenders for temporary purposes. (The Fund’s totalassets include the amounts being borrowed.) To limit the risks attendant to borrowing, the Investment Company Act requireseach Fund to maintain at all times an “asset coverage” of at least 300% of the amount of its borrowings. Asset coveragemeans the ratio that the value of each Fund’s total assets (including amounts borrowed), minus liabilities other thanborrowings, bears to the aggregate amount of all borrowings. Borrowing money to increase portfolio holdings is known as“leveraging.” Certain trading practices and investments, such as reverse repurchase agreements, may be considered to beborrowings or involve leverage and thus are subject to the Investment Company Act restrictions. In accordance with SEC staffguidance interpretations, when a Fund engages in such transactions, the Fund instead of maintaining asset coverage of atleast 300%, may segregate or earmark liquid assets, or enter into an offsetting position, in an amount at least equal to theFund’s exposure, on a mark-to-market basis, to the transaction (as calculated pursuant to requirements of the SEC). Thepolicy in (2) above will be interpreted to permit each Fund to engage in trading practices and investments that may beconsidered to be borrowing or to involve leverage to the extent permitted by the Investment Company Act and to permiteach Fund to segregate or earmark liquid assets or enter into offsetting positions in accordance with the InvestmentCompany Act. Short-term credits necessary for the settlement of securities transactions and arrangements with respect tosecurities lending will not be considered to be borrowings under the policy. Practices and investments that may involveleverage but are not considered to be borrowings are not subject to the policy.
With respect to the fundamental policy relating to underwriting set forth in (5) above, the Investment Company Act does notprohibit each Fund from engaging in the underwriting business or from underwriting the securities of other issuers; in fact, inthe case of diversified funds, the Investment Company Act permits the Fund to have underwriting commitments of up to25% of its assets under certain circumstances. Those circumstances currently are that the amount of each Fund’sunderwriting commitments, when added to the value of the Fund’s investments in issuers where each Fund owns more than10% of the outstanding voting securities of those issuers, cannot exceed the 25% cap. A fund engaging in transactionsinvolving the acquisition or disposition of portfolio securities may be considered to be an underwriter under the 1933 Act.Although it is not believed that the application of the 1933 Act provisions described above would cause a Fund to beengaged in the business of underwriting, the policy in (5) above will be interpreted not to prevent the Fund from engaging intransactions involving the acquisition or disposition of portfolio securities, regardless of whether the Fund may be consideredto be an underwriter under the 1933 Act or is otherwise engaged in the underwriting business to the extent permitted byapplicable law.
With respect to the fundamental policy relating to lending set forth in (7) above, the Investment Company Act does notprohibit each Fund from making loans (including lending its securities); however, SEC staff interpretations currently prohibitfunds from lending more than one-third of their total assets (including lending its securities), except through the purchase ofdebt obligations or the use of repurchase agreements. In addition, collateral arrangements with respect to options, forwardcurrency and futures transactions and other derivative instruments (as applicable), as well as delays in the settlement ofsecurities transactions, will not be considered loans.
Non-Fundamental Investment Policies
iShares Russell 1000 Pure U.S. Revenue ETF and iShares U.S. Infrastructure ETF Only
Each Fund has adopted a non-fundamental policy not to make short sales of securities or maintain a short position, except tothe extent permitted by each Fund’s Prospectus and SAI, as amended from time to time, and applicable law.
Unless otherwise indicated, all limitations under each Fund’s fundamental or non-fundamental investment restrictions applyonly at the time that a transaction is undertaken. Any change in the percentage of each Fund’s assets invested in certainsecurities or other instruments resulting from market fluctuations or other changes in each Fund’s total assets will notrequire each Fund to dispose of an investment until BFA determines that it is practicable to sell or close out the investmentwithout undue market or tax consequences.
All Funds Other Than the iShares Russell 1000 Pure U.S. Revenue ETF and iShares U.S. Infrastructure ETF
Each Fund has adopted a non-fundamental policy not to invest in the securities of a company for the purpose of exercisingmanagement or control, or purchase or otherwise acquire any illiquid investment, except as permitted under the 1940 Act,which currently limits each Fund’s holdings in illiquid investments to 15% of a Fund’s net assets. BFA monitors Fund holdingsin illiquid investments pursuant to the Liquidity Program.
58

If any percentage restriction described above is complied with at the time of an investment, a later increase or decrease inpercentage resulting from a change in values of assets will not constitute a violation of such restriction, except that certainpercentage limitations will be observed continuously in accordance with applicable law.
All Funds
Each Fund has adopted a non-fundamental investment policy in accordance with Rule 35d-1 under the 1940 Act to invest,under normal circumstances, at least 80% of the value of its net assets, plus the amount of any borrowings for investmentpurposes, for all Funds other than the iShares U.S. Infrastructure ETF, in component securities of the Underlying Index or indepositary receipts representing component securities in the Underlying Index, and for the iShares U.S. Infrastructure ETF, incomponent securities of its Underlying Index. Each Fund also has adopted a policy to provide its shareholders with at least 60days’ prior written notice of any change in such policy. If, subsequent to an investment, the 80% requirement is no longermet, a Fund’s future investments will be made in a manner that will bring the Fund into compliance with this policy.
Each Fund has adopted a non-fundamental policy such that, under normal market conditions, any borrowings by the Fundwill not exceed 10% of the Fund’s net assets.
Each Fund has adopted a non-fundamental policy not to purchase securities of other investment companies, except to theextent permitted by the 1940 Act. As a matter of policy, however, a Fund will not purchase shares of any registered open-endinvestment company or registered unit investment trust, in reliance on Section 12(d)(1)(F) or (G) (the “fund of funds”provisions) of the 1940 Act, at any time the Fund has knowledge that its shares are purchased by another investmentcompany investor in reliance on the provisions of subparagraph (G) of Section 12(d)(1).
Continuous OfferingThe method by which Creation Units are created and traded may raise certain issues under applicable securities laws.Because new Creation Units are issued and sold by the Funds on an ongoing basis, at any point a “distribution,” as such termis used in the 1933 Act, may occur. Broker-dealers and other persons are cautioned that some activities on their part may,depending on the circumstances, result in their being deemed participants in a distribution in a manner that could renderthem statutory underwriters and subject them to the prospectus delivery requirement and liability provisions of the 1933 Act.
For example, a broker-dealer firm or its client may be deemed a statutory underwriter if it takes Creation Units after placingan order with the Distributor, breaks them down into constituent shares and sells such shares directly to customers or if itchooses to couple the creation of new shares with an active selling effort involving solicitation of secondary market demandfor shares. A determination of whether one is an underwriter for purposes of the 1933 Act must take into account all of thefacts and circumstances pertaining to the activities of the broker-dealer or its client in the particular case and the examplesmentioned above should not be considered a complete description of all the activities that could lead to a categorization asan underwriter.
Broker-dealer firms should also note that dealers who are not “underwriters” but are effecting transactions in shares,whether or not participating in the distribution of shares, generally are required to deliver a prospectus. This is because theprospectus delivery exemption in Section 4(a)(3) of the 1933 Act is not available in respect of such transactions as a result ofSection 24(d) of the 1940 Act. Firms that incur a prospectus delivery obligation with respect to shares of the Funds arereminded that, pursuant to Rule 153 under the 1933 Act, a prospectus delivery obligation under Section 5(b)(2) of the 1933Act owed to an exchange member in connection with a sale on the Listing Exchange generally is satisfied by the fact that theprospectus is available at the Listing Exchange upon request. The prospectus delivery mechanism provided in Rule 153 isavailable only with respect to transactions on an exchange.
ManagementTrustees and Officers. The Board has responsibility for the overall management and operations of the Funds, includinggeneral supervision of the duties performed by BFA and other service providers. Each Trustee serves until he or she resigns, isremoved, dies, retires or becomes incapacitated. Each officer shall hold office until his or her successor is elected andqualifies or until his or her death, resignation or removal. Trustees who are not “interested persons” (as defined in the 1940Act) of the Trust are referred to as independent trustees (“Independent Trustees”).
59

The registered investment companies advised by BFA or its affiliates (the “BlackRock-advised Funds”) are organized into onecomplex of closed-end funds, two complexes of open-end funds and one complex of ETFs (“Exchange-Traded FundComplex”) (each, a “BlackRock Fund Complex”). Each Fund is included in the BlackRock Fund Complex referred to as theExchange-Traded Fund Complex. Each Trustee also serves as a Director of iShares, Inc. and a Trustee of iShares U.S. ETFTrust and, as a result, oversees all of the funds within the Exchange-Traded Fund Complex, which consists of 358 funds as ofAugust 1, 2018. Drew E. Lawton, from October 2016 to June 2017, and Richard L. Fagnani, from April 2017 to June 2017,served as members of the advisory board (“Advisory Board,” members of which are “Advisory Board Members”) for the Trust,iShares, Inc. and iShares U.S. ETF Trust with respect to all funds within the Exchange-Traded Fund Complex. With theexception of Robert S. Kapito, Mark K. Wiedman, Charles Park, Martin Small and Benjamin Archibald, the address of eachTrustee and officer is c/o BlackRock, Inc., 400 Howard Street, San Francisco, CA 94105. The address of Mr. Kapito, Mr.Wiedman, Mr. Park, Mr. Small and Mr. Archibald is c/o BlackRock, Inc., Park Avenue Plaza, 55 East 52nd Street, New York, NY10055. The Board has designated Cecilia H. Herbert as its Independent Board Chair. Additional information about the Funds’Trustees and officers may be found in this SAI, which is available without charge, upon request, by calling toll-free 1-800-iShares (1-800-474-2737).
Interested Trustees
Name (Age) PositionPrincipal Occupation(s)During the Past 5 Years
Other DirectorshipsHeld by Trustee
Robert S. Kapito1
(61)Trustee(since 2009).
President, BlackRock, Inc. (since2006); Vice Chairman of BlackRock,Inc. and Head of BlackRock’sPortfolio Management Group (sinceits formation in 1998) and BlackRock,Inc.’s predecessor entities (since1988); Trustee, University ofPennsylvania (since 2009); Presidentof Board of Directors, Hope & HeroesChildren’s Cancer Fund (since 2002).
Director of BlackRock, Inc. (since2006); Director of iShares, Inc. (since2009); Trustee of iShares U.S. ETFTrust (since 2011).
Mark K. Wiedman2
(47)Trustee (since2013).
Senior Managing Director, BlackRock,Inc. (since 2014); Managing Director,BlackRock, Inc. (2007-2014); GlobalHead of BlackRock’s ETF and IndexInvestments Business (since 2016);Global Head of iShares (2011-2016);Head of Corporate Strategy,BlackRock, Inc. (2009-2011).
Director of iShares, Inc. (since 2013);Trustee of iShares U.S. ETF Trust(since 2013); Director of PennyMacFinancial Services, Inc. (since 2008).
1 Robert S. Kapito is deemed to be an “interested person” (as defined in the 1940 Act) of the Trust due to his affiliations with BlackRock, Inc. and itsaffiliates.
2 Mark K. Wiedman is deemed to be an “interested person” (as defined in the 1940 Act) of the Trust due to his affiliations with BlackRock, Inc. and itsaffiliates.
60

Independent Trustees
Name (Age) PositionPrincipal Occupation(s)During the Past 5 Years
Other DirectorshipsHeld by Trustee
Cecilia H. Herbert(69)
Trustee(since 2005);Independent BoardChair(since 2016).
Trustee and Member of the Finance,Technology and Quality Committeeof Stanford Health Care (since 2016);Trustee and Member of theInvestment Committee, WNET, a NewYork public media company (since2011); Chair (1994-2005) andMember (since 1992) of theInvestment Committee, Archdioceseof San Francisco; Director (1998-2013) and President (2007-2011) ofthe Board of Directors, CatholicCharities CYO; Trustee (2002-2011)and Chair of the Finance andInvestment Committee (2006-2010)of the Thacher School.
Director of iShares, Inc. (since 2005);Trustee of iShares U.S. ETF Trust(since 2011); Independent BoardChair of iShares, Inc. and iShares U.S.ETF Trust (since 2016); Trustee ofForward Funds (14 portfolios) (since2009); Trustee of Salient MF Trust (4portfolios) (since 2015).
Jane D. Carlin(62)
Trustee(since 2015); RiskCommittee Chair(since 2016).
Consultant (since 2012); ManagingDirector and Global Head of FinancialHolding Company Governance &Assurance and the Global Head ofOperational Risk Management ofMorgan Stanley (2006-2012).
Director of iShares, Inc. (since 2015);Trustee of iShares U.S. ETF Trust(since 2015); Director of PHHCorporation (mortgage solutions)(since 2012); Director of The HanoverInsurance Group, Inc. (since 2016).
Richard L. Fagnani(63)
Trustee(since 2017); EquityPlus CommitteeChair (since 2017).
Partner, KPMG LLP (2002-2016). Director of iShares, Inc. (since 2017);Trustee of iShares U.S. ETF Trust(since 2017).
Charles A. Hurty(74)
Trustee(since 2005);Audit CommitteeChair(since 2006).
Retired; Partner, KPMG LLP (1968-2001).
Director of iShares, Inc. (since 2005);Trustee of iShares U.S. ETF Trust(since 2011); Director of SkyBridgeAlternative Investments Multi-Adviser Hedge Fund Portfolios LLC (2portfolios) (since 2002).
John E. Kerrigan(63)
Trustee(since 2005);Securities LendingCommittee Chair(since 2016).
Chief Investment Officer, Santa ClaraUniversity (since 2002).
Director of iShares, Inc. (since 2005);Trustee of iShares U.S. ETF Trust(since 2011).
Drew E. Lawton(59)
Trustee(since 2017); 15(c)Committee Chair(since 2017).
Senior Managing Director of NewYork Life Insurance Company (2010-2015).
Director of iShares, Inc. (since 2017);Trustee of iShares U.S. ETF Trust(since 2017).
John E. Martinez(57)
Trustee(since 2003);Fixed Income PlusCommittee Chair(since 2016).
Director of Real Estate EquityExchange, Inc. (since 2005).
Director of iShares, Inc. (since 2003);Trustee of iShares U.S. ETF Trust(since 2011).
61

Name (Age) PositionPrincipal Occupation(s)During the Past 5 Years
Other DirectorshipsHeld by Trustee
Madhav V. Rajan(53)
Trustee(since 2011);Nominating andGovernanceCommittee Chair(since 2017).
Dean, and George Pratt ShultzProfessor of Accounting, Universityof Chicago Booth School of Business(since 2017); Robert K. JaedickeProfessor of Accounting, StanfordUniversity Graduate School ofBusiness (2001-2017); Professor ofLaw (by courtesy), Stanford LawSchool (2005-2017); Senior AssociateDean for Academic Affairs and Headof MBA Program, Stanford UniversityGraduate School of Business (2010-2016).
Director of iShares, Inc. (since 2011);Trustee of iShares U.S. ETF Trust(since 2011).
Officers
Name (Age) PositionPrincipal Occupation(s)During the Past 5 Years
Martin Small(43)
President (since2016).
Managing Director, BlackRock, Inc.(since 2010); Head of U.S. iShares(since 2015); Co-Head of the U.S.Financial Markets Advisory Group,BlackRock, Inc. (2008-2014).
Jack Gee(58)
Treasurer and ChiefFinancial Officer(since 2008).
Managing Director, BlackRock, Inc.(since 2009); Senior Director of FundAdministration of IntermediaryInvestor Business, BGI (2009).
Charles Park(50)
Chief ComplianceOfficer (since 2006).
Chief Compliance Officer ofBlackRock Advisors, LLC and theBlackRock-advised Funds in theEquity-Bond Complex, the Equity-Liquidity Complex and the Closed-End Complex (since 2014); ChiefCompliance Officer of BFA (since2006).
Benjamin Archibald(43)
Secretary (since2015).
Managing Director, BlackRock, Inc.(since 2014); Director, BlackRock, Inc.(2010-2013); Secretary of theBlackRock-advised mutual funds(since 2012).
Steve Messinger(56)
Executive VicePresident(since 2016).
Managing Director, BlackRock, Inc.(2007-2014 and since 2016);Managing Director, BeaconConsulting Group (2014-2016).
Scott Radell(49)
Executive VicePresident(since 2012).
Managing Director, BlackRock, Inc.(since 2009); Head of PortfolioSolutions, BlackRock, Inc. (since2009).
62
Name (Age) PositionPrincipal Occupation(s)During the Past 5 Years
Alan Mason(57)
Executive VicePresident(since 2016).
Managing Director, BlackRock, Inc.(since 2009).
The Board has concluded that, based on each Trustee’s experience, qualifications, attributes or skills on an individual basisand in combination with those of the other Trustees, each Trustee should serve as a Trustee of the Board. Among theattributes common to all Trustees are their ability to review critically, evaluate, question and discuss information provided tothem, to interact effectively with the Funds’ investment adviser, other service providers, counsel and the independentregistered public accounting firm, and to exercise effective business judgment in the performance of their duties as Trustees.A Trustee’s ability to perform his or her duties effectively may have been attained through the Trustee’s educationalbackground or professional training; business, consulting, public service or academic positions; experience from service as aBoard member of the Funds and the other funds in the Trust (and any predecessor funds), other investment funds, publiccompanies, or non-profit entities or other organizations; and/or other life experiences. Also, set forth below is a briefdiscussion of the specific experience, qualifications, attributes or skills of each Trustee that led the Board to conclude that heor she should serve (or continue to serve) as a Trustee.
Robert S. Kapito has been a Trustee of the Trust since 2009. Mr. Kapito has served as a Director of iShares, Inc. since 2009, aTrustee of iShares U.S. ETF Trust since 2011 and a Director of BlackRock, Inc. since 2006. Mr. Kapito served as a Director ofiShares MSCI Russia Capped ETF, Inc. from 2010 to 2015. In addition, he has over 20 years of experience as part of BlackRock,Inc. and BlackRock’s predecessor entities. Mr. Kapito serves as President of BlackRock, Inc., and is a member of the GlobalExecutive Committee and Chairman of the Global Operating Committee. He is responsible for day-to-day oversight ofBlackRock’s key operating units, including Investment Strategies, Client Businesses, Technology & Operations, and Risk &Quantitative Analysis. Prior to assuming his current responsibilities in 2007, Mr. Kapito served as Vice Chairman of BlackRock,Inc. and Head of BlackRock’s Portfolio Management Group. In that role, he was responsible for overseeing all portfoliomanagement within BlackRock, including the Fixed Income, Equity, Liquidity, and Alternative Investment Groups. Mr. Kapitoserves as a member of the Board of Trustees of the University of Pennsylvania and the Harvard Business School Board ofDean’s Advisors. He has also been President of the Board of Directors for the Hope & Heroes Children’s Cancer Fund since2002. Mr. Kapito earned a BS degree in economics from the Wharton School of the University of Pennsylvania in 1979, and anMBA degree from Harvard Business School in 1983.
Mark K. Wiedman has been a Trustee of the Trust since 2013. Mr. Wiedman has served as a Director of iShares, Inc. since2013 and a Trustee of iShares U.S. ETF Trust since 2013. Mr. Wiedman served as a Director of iShares MSCI Russia CappedETF, Inc. from 2013 to 2015. Mr. Wiedman is the Global Head of BlackRock’s ETF and Index Investments Business and SeniorManaging Director of BlackRock, Inc. In addition, he is a member of BlackRock’s Global Executive Committee. Prior toassuming his current responsibilities in 2016, Mr. Wiedman was the Global Head of iShares. Mr. Wiedman was previously thehead of Corporate Strategy for BlackRock. Mr. Wiedman joined BlackRock in 2004 to help start the advisory business, whichevolved into the Financial Markets Advisory Group in BlackRock Solutions. This group advises financial institutions andgovernments on managing their capital markets exposures and businesses. Prior to BlackRock, he served as senior advisorand chief of staff for the Under Secretary for Domestic Finance at the U.S. Department of the Treasury and also was amanagement consultant at McKinsey & Co., advising financial institutions in the U.S., Europe, and Japan. He has taught as anadjunct associate professor of law at Fordham University in New York and Renmin University in Beijing. Mr. Wiedman serveson the board of PennyMac Financial Services, Inc., a publicly-traded U.S. mortgage banking and investment managementfirm started in 2008, with BlackRock, Inc. as a sponsor. Mr. Wiedman earned an AB degree, Phi Beta Kappa, magna cumlaude, in social studies from Harvard College in 1992 and a JD degree from Yale Law School in 1996.
Cecilia H. Herbert has been a Trustee of the Trust since 2005 and Chair of the Trust’s Board since 2016. Ms. Herbert served asChair of the Nominating and Governance Committee of the Trust from 2012 to 2015 and from 2016 to 2017 and Chair of theEquity Plus Committee of the Trust from 2012 to 2015. Ms. Herbert has served as a Director of iShares, Inc. since 2005, Chairof the Nominating and Governance Committee of iShares, Inc. from 2012 to 2015 and from 2016 to 2017, Chair of the EquityPlus Committee of iShares, Inc. from 2012 to 2015, Chair of the iShares, Inc.’s Board since 2016, a Trustee of iShares U.S. ETFTrust since 2011, Chair of the Nominating and Governance Committee of iShares U.S. ETF Trust from 2012 to 2015 and from2016 to 2017, Chair of the Equity Plus Committee of iShares U.S. ETF Trust from 2012 to 2015 and Chair of the iShares U.S.ETF Trust’s Board since 2016. Ms. Herbert served as a Director of iShares MSCI Russia Capped ETF, Inc. from 2010 to 2015. In
63
addition, Ms. Herbert has served as Trustee of the Forward Funds since 2009, which was purchased by Salient Partners in2015, and has also served as Trustee of the Salient MF Trust since 2015. She has served since 1992 on the Investment Councilof the Archdiocese of San Francisco and was Chair from 1994 to 2005. She has served as a Trustee of Stanford Health Caresince 2016 and as a Trustee of WNET, New York’s public media station, since 2011. She was President of the Board of CatholicCharities CYO, the largest social services agency in the San Francisco Bay Area, from 2007 to 2011 and a member of thatboard from 1992 to 2013. She previously served as Trustee of the Pacific Select Funds from 2004 to 2005 and Trustee of theMontgomery Funds from 1992 to 2003. She worked from 1973 to 1990 at J.P. Morgan/Morgan Guaranty Trust doinginternational corporate finance and corporate lending, retiring as Managing Director and Head of the West Coast Office. Ms.Herbert has been on numerous non-profit boards, chairing investment and finance committees. She holds a double major ineconomics and communications from Stanford University and an MBA from Harvard Business School.
Jane D. Carlin has been a Trustee of the Trust since 2015 and Chair of the Risk Committee since 2016. Ms. Carlin has servedas a Director of iShares, Inc. since 2015, Chair of the Risk Committee of iShares, Inc. since 2016, a Trustee of iShares U.S. ETFTrust since 2015 and Chair of the Risk Committee of iShares U.S. ETF Trust since 2016. Ms. Carlin has served as a consultantsince 2012 and formerly served as Managing Director and Global Head of Financial Holding Company Governance &Assurance and the Global Head of Operational Risk Management of Morgan Stanley from 2006 to 2012. In addition, Ms.Carlin served as Managing Director and Global Head of the Bank Operational Risk Oversight Department of Credit SuisseGroup from 2003 to 2006. Prior to that, Ms. Carlin served as Managing Director and Deputy General Counsel of MorganStanley. Ms. Carlin has over 30 years of experience in the financial sector and has served in a number of legal, regulatory, andrisk management positions. Ms. Carlin has served as an Independent Director on the Board of PHH Corporation since 2012and as a Director of The Hanover Insurance Group, Inc. since 2016. She previously served as a Director on the Boards ofAstoria Financial Corporation and Astoria Bank. Ms. Carlin was appointed by the United States Treasury to the FinancialServices Sector Coordinating Council for Critical Infrastructure Protection and Homeland Security, where she served asChairperson from 2010 to 2012 and Vice Chair and Chair of the Cyber Security Committee from 2009 to 2010. Ms. Carlin hasa BA degree in political science from State University of New York at Stony Brook and a JD degree from Benjamin N. CardozoSchool of Law.
Richard L. Fagnani has been a Trustee of the Trust since 2017 and Chair of the Equity Plus Committee of the Trust since 2017.Mr. Fagnani served as an Advisory Board Member of the Trust from April 2017 to June 2017. Mr. Fagnani has served as aDirector of iShares, Inc. since 2017, Chair of the Equity Plus Committee of iShares, Inc. since 2017, an Advisory Board Memberof iShares, Inc. from April 2017 to June 2017, a Trustee of iShares U.S. ETF Trust since 2017, Chair of the Equity PlusCommittee of iShares U.S. ETF Trust since 2017 and an Advisory Board Member of iShares U.S. ETF Trust from April 2017 toJune 2017. Mr. Fagnani served as a Senior Audit Partner at KPMG LLP from 2002 to 2016, most recently as the U.S. assetmanagement audit practice leader responsible for setting strategic direction and execution of the operating plan for the assetmanagement audit practice. In addition, from 1977 to 2002, Mr. Fagnani served as an Audit Partner at Andersen LLP, wherehe developed and managed the asset management audit practice. Mr. Fagnani served as a Trustee on the Board of theWalnut Street Theater in Philadelphia from 2009 to 2014 and as a member of the School of Business Advisory Board atLaSalle University from 2006 to 2014. Mr. Fagnani has a BS degree in Accounting from LaSalle University.
Charles A. Hurty has been a Trustee of the Trust since 2005 and Chair of the Audit Committee of the Trust since 2006.Mr. Hurty has served as a Director of iShares, Inc. since 2005, Chair of the Audit Committee of iShares, Inc. since 2006 and aTrustee and Chair of the Audit Committee of iShares U.S. ETF Trust since 2011. Mr. Hurty served as a Director of iShares MSCIRussia Capped ETF, Inc. from 2010 to 2015. In addition, Mr. Hurty has served as Director of the SkyBridge AlternativeInvestments Multi-Adviser Hedge Fund Portfolios LLC (formerly, Citigroup Alternative Investments Multi-Adviser Hedge FundPortfolios LLC) since 2002. He was a Director of the GMAM Absolute Return Strategy Fund from 2002 to 2015 and was aDirector of the CSFB Alternative Investment Funds from 2005 to December 2009, when the funds were liquidated. Mr. Hurtywas formerly a Partner at KPMG, LLP from 1968 to 2001, where he held several leadership roles in KPMG, LLP’s InvestmentManagement Practice. Prior to joining KPMG, LLP, Mr. Hurty was an officer in the United States Army. Mr. Hurty has a BSdegree in accounting from the University of Kansas.
John E. Kerrigan has been a Trustee of the Trust since 2005 and Chair of the Securities Lending Committee of the Trust since2016. Mr. Kerrigan served as Chair of the Nominating and Governance Committee of the Trust from 2010 to 2012 and Chairof the Fixed Income Plus Committee of the Trust from 2012 to 2015. Mr. Kerrigan has served as a Director of iShares, Inc.since 2005, Chair of the Fixed Income Plus Committee of iShares, Inc. from 2012 to 2015, Chair of the Nominating andGovernance Committee of iShares, Inc. from 2010 to 2012, Chair of the Securities Lending Committee of iShares, Inc. since2016, a Trustee of iShares U.S. ETF Trust since 2011, Chair of the Fixed Income Plus Committee of iShares U.S. ETF Trust from
64

2012 to 2015, Chair of the Nominating and Governance Committee of iShares U.S. ETF Trust from 2011 to 2012 and Chair ofthe Securities Lending Committee of iShares U.S. ETF Trust since 2016. Mr. Kerrigan served as a Director of iShares MSCIRussia Capped ETF, Inc. from 2010 to 2015. Mr. Kerrigan has served as Chief Investment Officer of Santa Clara University since2002. Mr. Kerrigan was formerly a Managing Director at Merrill Lynch & Co., including the following responsibilities:Managing Director, Institutional Client Division, Western United States. Mr. Kerrigan has been a Director, since 1999, of TheBASIC Fund (Bay Area Scholarships for Inner City Children). Mr. Kerrigan has a BA degree from Boston College and is aChartered Financial Analyst Charterholder.
Drew E. Lawton has been a Trustee of the Trust since 2017 and Chair of the 15(c) Committee of the Trust since 2017. Mr.Lawton served as an Advisory Board Member of the Trust from 2016 to 2017. Mr. Lawton has served as a Director of iShares,Inc. since 2017, Chair of the 15(c) Committee of iShares, Inc. since 2017, an Advisory Board Member of iShares, Inc. from2016 to 2017, a Trustee of iShares U.S. ETF Trust since 2017, Chair of the 15(c) Committee of iShares U.S. ETF Trust since 2017and an Advisory Board Member of iShares U.S. ETF Trust from 2016 to 2017. Mr. Lawton served as Director of Principal Funds,Inc., Principal Variable Contracts Funds, Inc. and Principal Exchange-Traded Funds from March 2016 to October 2016. Mr.Lawton served in various capacities at New York Life Insurance Company from 2010 to 2015, most recently as a SeniorManaging Director and Chief Executive Officer of New York Life Investment Management. From 2008 to 2010, Mr. Lawtonwas the President of Fridson Investment Advisors, LLC. Mr. Lawton previously held multiple roles at Fidelity Investments from1997 to 2008. Mr. Lawton has a BA degree in Administrative Science from Yale University and an MBA from University ofNorth Texas.
John E. Martinez has been a Trustee of the Trust since 2003 and Chair of the Fixed Income Plus Committee of the Trust since2016. Mr. Martinez served as Chair of the Securities Lending Committee of the Trust from 2012 to 2015. Mr. Martinez hasserved as a Director of iShares, Inc. since 2003, Chair of the Securities Lending Committee of iShares, Inc. from 2012 to 2015,Chair of the Fixed Income Plus Committee of iShares, Inc. since 2016, a Trustee of iShares U.S. ETF Trust since 2011, Chair ofthe Securities Lending Committee of iShares U.S. ETF Trust from 2012 to 2015 and Chair of the Fixed Income Plus Committeeof iShares U.S. ETF Trust since 2016. Mr. Martinez served as a Director of iShares MSCI Russia Capped ETF, Inc. from 2010 to2015. Mr. Martinez is a Director of Real Estate Equity Exchange, Inc., providing governance oversight and consulting servicesto this privately held firm that develops products and strategies for homeowners in managing the equity in their homes. Mr.Martinez currently serves as a Board member for the Cloudera Foundation, whose mission is to apply Cloudera’s data scienceexpertise and discipline to solve global social problems. Mr. Martinez previously served as Director of Barclays GlobalInvestors (“BGI”) UK Holdings, where he provided governance oversight representing BGI’s shareholders (Barclays PLC, BGImanagement shareholders) through oversight of BGI’s worldwide activities. Mr. Martinez also previously served as Co-ChiefExecutive Officer of the Global Index and Markets Group of BGI, Chairman of Barclays Global Investor Services and ChiefExecutive Officer of the Capital Markets Group of BGI. From 2003 to 2012, he was a Director and Executive CommitteeMember for Larkin Street Youth Services, providing governance oversight and strategy development to an agency thatprovides emergency and transitional housing, healthcare, education, job and life skills training to homeless youth. He nowserves on the Larkin Street Honorary Board. From 2010 to 2016, Mr. Martinez served as a Director for Reading Partners, anorganization committed to making all children literate through one-on-one tutoring of students in grades K-4 who are notyet reading at grade level. Mr. Martinez has an AB degree in economics from The University of California, Berkeley and holdsan MBA degree in finance and statistics from The University of Chicago Booth School of Business.
Madhav V. Rajan has been a Trustee of the Trust since 2011 and Chair of the Nominating and Governance Committee of theTrust since 2017. Mr. Rajan served as Chair of the Equity Plus Committee of the Trust from 2016 to 2017, Chair of theNominating and Governance Committee of the Trust in 2016 and Chair of the 15(c) Committee of the Trust from 2012 to2015 and from 2016 to 2017. Mr. Rajan has served as a Director of iShares, Inc. since 2011, Chair of the Nominating andGovernance Committee of iShares, Inc. since 2017, Chair of the Equity Plus Committee of iShares, Inc. from 2016 to 2017,Chair of the Nominating and Governance Committee of iShares, Inc. in 2016, Chair of the 15(c) Committee of iShares, Inc.from 2012 to 2015 and from 2016 to 2017, a Trustee of iShares U.S. ETF Trust since 2011, Chair of the Nominating andGovernance Committee of iShares U.S. ETF Trust since 2017, Chair of the Equity Plus Committee of iShares U.S. ETF Trustfrom 2016 to 2017, Chair of the Nominating and Governance Committee of iShares U.S. ETF Trust in 2016 and Chair of the15(c) Committee of iShares U.S. ETF Trust from 2012 to 2015 and from 2016 to 2017. Mr. Rajan served as a Director of iSharesMSCI Russia Capped ETF, Inc. from 2011 to 2015. Mr. Rajan is the Dean and George Pratt Shultz Professor of Accounting atthe University of Chicago Booth School of Business. From 2001 to 2017, Mr. Rajan was the Robert K. Jaedicke Professor ofAccounting at the Stanford University Graduate School of Business. In April 2017, he received the school’s Robert T. DavisAward for Lifetime Achievement and Service. He has taught accounting for over 25 years to undergraduate, MBA and lawstudents, as well as to senior executives. From 2010 to 2016, Mr. Rajan served as the Senior Associate Dean for Academic
65

Affairs and head of the MBA Program at the Stanford University Graduate School of Business. Mr. Rajan served as editor of“The Accounting Review” from 2002 to 2008 and is co-author of “Cost Accounting: A Managerial Emphasis,” a leading costaccounting textbook. From 2013 to July 2018, Mr. Rajan served on the Board of Directors of Cavium Inc., a semiconductorcompany. Mr. Rajan holds MS and PhD degrees in Accounting from Carnegie Mellon University.
Board – Leadership Structure and Oversight Responsibilities
Overall responsibility for oversight of the Funds rests with the Board. The Board has engaged BFA to manage the Funds on aday-to-day basis. The Board is responsible for overseeing BFA and other service providers in the operations of the Funds inaccordance with the provisions of the 1940 Act, applicable provisions of state and other laws and the Trust’s charter. TheBoard is currently composed of ten members, eight of whom are Independent Trustees. The Board currently conducts regularin person meetings four times a year. In addition, the Board frequently holds special in person or telephonic meetings orinformal conference calls to discuss specific matters that may arise or require action between regular meetings. TheIndependent Trustees meet regularly outside the presence of management, in executive session or with other serviceproviders to the Trust.
The Board has appointed an Independent Trustee to serve in the role of Board Chair. The Board Chair’s role is to preside at allmeetings of the Board and to act as a liaison with service providers, officers, attorneys, and other Trustees generally betweenmeetings. The Board Chair may also perform such other functions as may be delegated by the Board from time to time. TheBoard has established seven standing Committees: a Nominating and Governance Committee, an Audit Committee, a 15(c)Committee, a Securities Lending Committee, a Risk Committee, an Equity Plus Committee and a Fixed Income PlusCommittee to assist the Board in the oversight and direction of the business and affairs of the Funds, and from time to timethe Board may establish ad hoc committees or informal working groups to review and address the policies and practices ofthe Funds with respect to certain specified matters. The Chair of each standing Committee is an Independent Trustee. Therole of the Chair of each Committee is to preside at all meetings of the Committee and to act as a liaison with serviceproviders, officers, attorneys and other Trustees between meetings. Each standing Committee meets regularly to conduct theoversight functions delegated to the Committee by the Board and reports its finding to the Board. The Board and eachstanding Committee conduct annual assessments of their oversight function and structure. The Board has determined thatthe Board’s leadership structure is appropriate because it allows the Board to exercise independent judgment overmanagement and it allocates areas of responsibility among committees of Independent Trustees and the full Board toenhance effective oversight.
Day-to-day risk management with respect to the Funds is the responsibility of BFA or other service providers (depending onthe nature of the risk), subject to the supervision of BFA. Each Fund is subject to a number of risks, including investment,compliance, operational, reputational, counterparty and valuation risks, among others. While there are a number of riskmanagement functions performed by BFA and other service providers, as applicable, it is not possible to identify andeliminate all of the risks applicable to the Funds. The Trustees have an oversight role in this area, satisfying themselves thatrisk management processes and controls are in place and operating effectively. Risk oversight forms part of the Board’sgeneral oversight of each Fund and is addressed as part of various Board and committee activities. In some cases, riskmanagement issues are specifically addressed in presentations and discussions. For example, BFA has an independentdedicated Risk and Quantitative Analysis Group (“RQA”) that assists BFA in managing fiduciary and corporate risks, includinginvestment, operational, counterparty credit and enterprise risk. Representatives of RQA meet with the Board to discuss theiranalysis and methodologies, as well as specific risk topics such as operational and counterparty risks relating to the Funds.The Board, directly or through a committee, also reviews reports from, among others, management and the independentregistered public accounting firm for the Trust, as appropriate, regarding risks faced by each Fund and management’s riskfunctions. The Board has appointed a Chief Compliance Officer who oversees the implementation and testing of the Trust’scompliance program, including assessments by independent third parties, and reports to the Board regarding compliancematters for the Trust and its principal service providers. In testing and maintaining the compliance program, the ChiefCompliance Officer (and his or her delegates) assesses key compliance risks affecting each Fund, and addresses them inperiodic reports to the Board. In addition, the Audit Committee meets with both the Funds’ independent registered publicaccounting firm and BFA’s internal audit group to review risk controls in place that support each Fund as well as test results.Board oversight of risk is also performed as needed between meetings through communications between BFA and the Board.The Independent Trustees have engaged independent legal counsel to assist them in performing their oversightresponsibilities. From time to time, the Board may modify the manner in which it conducts risk oversight. The Board’soversight role does not make it a guarantor of the Funds’ investment performance or other activities.
66

Committees of the Board of Trustees. The members of the Audit Committee are Charles A. Hurty (Chair), Richard L.Fagnani, John E. Kerrigan and Madhav V. Rajan, each of whom is an Independent Trustee. The purposes of the AuditCommittee are to assist the Board (i) in its oversight of the Trust’s accounting and financial reporting principles and policiesand related controls and procedures maintained by or on behalf of the Trust; (ii) in its oversight of the Trust’s financialstatements and the independent audit thereof; (iii) in selecting, evaluating and, where deemed appropriate, replacing theindependent accountants (or nominating the independent accountants to be proposed for shareholder approval in any proxystatement); (iv) in evaluating the independence of the independent accountants; (v) in complying with legal and regulatoryrequirements that relate to the Trust’s accounting and financial reporting, internal controls, compliance controls andindependent audits; and (vi) to assume such other responsibilities as may be delegated by the Board. The Audit Committeemet six times during the fiscal year ended March 31, 2018.
The members of the Nominating and Governance Committee are Madhav V. Rajan (Chair), Jane D. Carlin, Drew E. Lawtonand John E. Martinez, each of whom is an Independent Trustee. The Nominating and Governance Committee nominatesindividuals for Independent Trustee membership on the Board and recommends appointments to the Advisory Board. TheNominating and Governance Committee functions include, but are not limited to, the following: (i) reviewing thequalifications of any person properly identified or nominated to serve as an Independent Trustee; (ii) recommending to theBoard and current Independent Trustees the nominee(s) for appointment as an Independent Trustee by the Board andcurrent Independent Trustees and/or for election as Independent Trustees by shareholders to fill any vacancy for a positionof Independent Trustee(s) on the Board; (iii) recommending to the Board and current Independent Trustees the size andcomposition of the Board and Board committees and whether they comply with applicable laws and regulations; (iv)recommending a current Independent Trustee to the Board and current Independent Trustees to serve as Board Chair; (v)periodic review of the Board’s retirement policy; and (vi) recommending an appropriate level of compensation for theIndependent Trustees for their services as Trustees, members or chairpersons of committees of the Board, Board Chair andany other positions as the Nominating and Governance Committee considers appropriate. The Nominating and GovernanceCommittee does not consider Board nominations recommended by shareholders (acting solely in their capacity as ashareholder and not in any other capacity). The Nominating and Governance Committee met two times during the fiscal yearended March 31, 2018.
Each Independent Trustee serves on the 15(c) Committee. The Chair of the 15(c) Committee is Drew E. Lawton. The principalresponsibilities of the 15(c) Committee are to support, oversee and organize on behalf of the Board the process for the annualreview and renewal of the Trust’s advisory and sub-advisory agreements. These responsibilities include: (i) meeting withBlackRock, Inc. in advance of the Board meeting at which the Trust’s advisory and sub-advisory agreements are to beconsidered to discuss generally the process for providing requested information to the Board and the format in whichinformation will be provided; and (ii) considering and discussing with BlackRock, Inc. such other matters and information asmay be necessary and appropriate for the Board to evaluate the investment advisory and sub-advisory agreements of theTrust. The 15(c) Committee met two times during the fiscal year ended March 31, 2018.
The members of the Securities Lending Committee are John E. Kerrigan (Chair), Jane D. Carlin, Richard L. Fagnani andMadhav V. Rajan, each of whom is an Independent Trustee. The principal responsibilities of the Securities LendingCommittee are to support, oversee and organize on behalf of the Board the process for oversight of the Trust’s securitieslending activities. These responsibilities include: (i) requesting that certain information be provided to the Committee for itsreview and consideration prior to such information being provided to the Board; (ii) considering and discussing withBlackRock, Inc. such other matters and information as may be necessary and appropriate for the Board to oversee the Trust’ssecurities lending activities and make required findings and approvals; and (iii) providing a recommendation to the Boardregarding the annual approval of the Trust’s Securities Lending Guidelines and the required findings with respect to, andannual approval of, the Trust’s agreement with the securities lending agent. The Securities Lending Committee met fourtimes during the fiscal year ended March 31, 2018.
The members of the Equity Plus Committee are Richard L. Fagnani (Chair), Charles A. Hurty, John E. Kerrigan and Madhav V.Rajan, each of whom is an Independent Trustee. The principal responsibilities of the Equity Plus Committee are to support,oversee and organize on behalf of the Board the process for oversight of Trust performance and related matters for equityfunds. These responsibilities include: (i) reviewing quarterly reports regarding Trust performance, secondary market tradingand changes in net assets to identify any matters that should be brought to the attention of the Board; and (ii) consideringany performance or investment related matters as may be delegated to the Committee by the Board from time to time andproviding a report or recommendation to the Board as appropriate. The Equity Plus Committee met four times during thefiscal year ended March 31, 2018.
67

The members of the Fixed Income Plus Committee are John E. Martinez (Chair), Jane D. Carlin and Drew E. Lawton, each ofwhom is an Independent Trustee. The principal responsibilities of the Fixed Income Plus Committee are to support, overseeand organize on behalf of the Board the process for oversight of Trust performance and related matters for fixed-income ormulti-asset funds. These responsibilities include: (i) reviewing quarterly reports regarding Trust performance, secondarymarket trading and changes in net assets to identify any matters that should be brought to the attention of the Board; and (ii)considering any performance or investment related matters as may be delegated to the Committee by the Board from time totime and providing a report or recommendation to the Board as appropriate. The Fixed Income Plus Committee met fourtimes during the fiscal year ended March 31, 2018.
The members of the Risk Committee are Jane D. Carlin (Chair), Charles A. Hurty, Drew E. Lawton and John E. Martinez, eachof whom is an Independent Trustee. The principal responsibility of the Risk Committee is to consider and organize on behalfof the Board risk related matters of the Funds so the Board may most effectively structure itself to oversee them. The RiskCommittee commenced on January 1, 2016. The Risk Committee met five times during the fiscal year ended March 31, 2018.
As the Chair of the Board, Cecilia H. Herbert may serve as an ex-officio member of each Committee.
The following table sets forth, as of December 31, 2017, the dollar range of equity securities beneficially owned by eachTrustee in the Funds and in other registered investment companies overseen by the Trustee within the same family ofinvestment companies as the Trust. If a fund is not listed below, the Trustee did not own any securities in that fund as of thedate indicated above:
Name FundDollar Range of Equity
Securities in Named Fund
Aggregate Dollar Rangeof Equity Securities in all
Registered InvestmentCompanies Overseen by
Trusteein Family of
Investment Companies
Robert S. Kapito None None None
Mark K. Wiedman iShares Core Aggressive Allocation ETF Over $100,000 Over $100,000
iShares Core MSCI EAFE ETF Over $100,000
iShares Core MSCI Emerging Markets ETF Over $100,000
iShares Core S&P Total U.S. Stock Market ETF Over $100,000
iShares National Muni Bond ETF Over $100,000
iShares New York Muni Bond ETF Over $100,000
iShares Short Maturity Municipal Bond ETF Over $100,000
iShares Short-Term National Muni Bond ETF Over $100,000
Cecilia H. Herbert iShares California Muni Bond ETF Over $100,000 Over $100,000
iShares China Large-Cap ETF $50,001-$100,000
iShares Core Dividend Growth ETF $50,001-$100,000
iShares Core High Dividend ETF $1-$10,000
iShares Core MSCI Emerging Markets ETF $10,001-$50,000
iShares Core MSCI Total International Stock ETF $10,001-$50,000
iShares Core S&P 500 ETF Over $100,000
iShares Core S&P Small-Cap ETF $1-$10,000
iShares Core S&P Total U.S. Stock Market ETF $50,001-$100,000
iShares Core S&P U.S. Growth ETF $50,001-$100,000
68

Name FundDollar Range of Equity
Securities in Named Fund
Aggregate Dollar Rangeof Equity Securities in all
Registered InvestmentCompanies Overseen by
Trusteein Family of
Investment Companies
iShares Core S&P U.S. Value ETF $50,001-$100,000
iShares iBoxx $ High Yield Corporate Bond ETF $10,001-$50,000
iShares International Select Dividend ETF $1-$10,000
iShares MSCI EAFE ETF $1-$10,000
iShares MSCI Japan ETF $10,001-$50,000
iShares National Muni Bond ETF $10,001-$50,000
iShares Preferred and Income Securities ETF $10,001-$50,000
Jane D. Carlin iShares Core MSCI EAFE ETF Over $100,000 Over $100,000
iShares Core MSCI Emerging Markets ETF $10,001-$50,000
iShares Core S&P Mid-Cap ETF $10,001-$50,000
iShares Core S&P Small-Cap ETF $50,001-$100,000
iShares Core U.S. Aggregate Bond ETF Over $100,000
iShares Europe ETF $10,001-$50,000
iShares Global Tech ETF $50,001-$100,000
iShares MSCI ACWI ETF Over $100,000
iShares MSCI ACWI ex U.S. ETF $50,001-$100,000
iShares MSCI EAFE Small-Cap ETF $10,001-$50,000
iShares MSCI Emerging Markets Small-Cap ETF $10,001-$50,000
Richard L. Fagnani iShares Core MSCI EAFE ETF Over $100,000 Over $100,000
iShares Core MSCI Emerging Markets ETF $10,001-$50,000
iShares Core S&P 500 ETF $10,001-$50,000
iShares Global Financials ETF $10,001-$50,000
iShares iBonds Dec 2022 Term Corporate ETF $1-$10,000
iShares MSCI Emerging Markets ETF $50,001-$100,000
iShares MSCI Japan ETF $10,001-$50,000
iShares Russell 1000 Growth ETF Over $100,000
iShares Russell 1000 Value ETF Over $100,000
iShares Russell 2000 ETF Over $100,000
iShares Russell 2000 Growth ETF $10,001-$50,000
iShares Russell 2000 Value ETF $10,001-$50,000
iShares Russell Mid-Cap Growth ETF $10,001-$50,000
iShares Russell Mid-Cap Value ETF $10,001-$50,000
Charles A. Hurty iShares China Large-Cap ETF $10,001-$50,000 Over $100,000
iShares Core Dividend Growth ETF Over $100,000
69
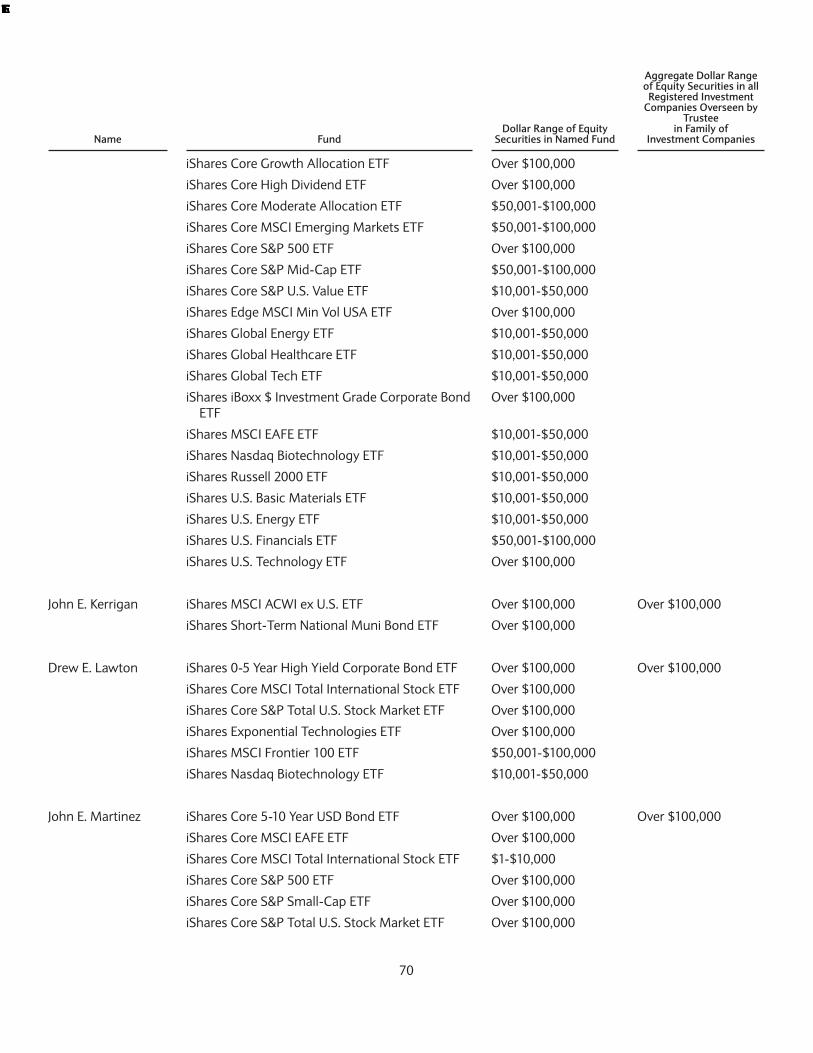
Name FundDollar Range of Equity
Securities in Named Fund
Aggregate Dollar Rangeof Equity Securities in all
Registered InvestmentCompanies Overseen by
Trusteein Family of
Investment Companies
iShares Core Growth Allocation ETF Over $100,000
iShares Core High Dividend ETF Over $100,000
iShares Core Moderate Allocation ETF $50,001-$100,000
iShares Core MSCI Emerging Markets ETF $50,001-$100,000
iShares Core S&P 500 ETF Over $100,000
iShares Core S&P Mid-Cap ETF $50,001-$100,000
iShares Core S&P U.S. Value ETF $10,001-$50,000
iShares Edge MSCI Min Vol USA ETF Over $100,000
iShares Global Energy ETF $10,001-$50,000
iShares Global Healthcare ETF $10,001-$50,000
iShares Global Tech ETF $10,001-$50,000
iShares iBoxx $ Investment Grade Corporate BondETF
Over $100,000
iShares MSCI EAFE ETF $10,001-$50,000
iShares Nasdaq Biotechnology ETF $10,001-$50,000
iShares Russell 2000 ETF $10,001-$50,000
iShares U.S. Basic Materials ETF $10,001-$50,000
iShares U.S. Energy ETF $10,001-$50,000
iShares U.S. Financials ETF $50,001-$100,000
iShares U.S. Technology ETF Over $100,000
John E. Kerrigan iShares MSCI ACWI ex U.S. ETF Over $100,000 Over $100,000
iShares Short-Term National Muni Bond ETF Over $100,000
Drew E. Lawton iShares 0-5 Year High Yield Corporate Bond ETF Over $100,000 Over $100,000
iShares Core MSCI Total International Stock ETF Over $100,000
iShares Core S&P Total U.S. Stock Market ETF Over $100,000
iShares Exponential Technologies ETF Over $100,000
iShares MSCI Frontier 100 ETF $50,001-$100,000
iShares Nasdaq Biotechnology ETF $10,001-$50,000
John E. Martinez iShares Core 5-10 Year USD Bond ETF Over $100,000 Over $100,000
iShares Core MSCI EAFE ETF Over $100,000
iShares Core MSCI Total International Stock ETF $1-$10,000
iShares Core S&P 500 ETF Over $100,000
iShares Core S&P Small-Cap ETF Over $100,000
iShares Core S&P Total U.S. Stock Market ETF Over $100,000
70

Name FundDollar Range of Equity
Securities in Named Fund
Aggregate Dollar Rangeof Equity Securities in all
Registered InvestmentCompanies Overseen by
Trusteein Family of
Investment Companies
iShares Global Consumer Staples ETF Over $100,000
iShares MSCI All Country Asia ex Japan ETF Over $100,000
iShares MSCI EAFE ETF Over $100,000
iShares National Muni Bond ETF Over $100,000
iShares Russell 1000 ETF Over $100,000
iShares Russell 1000 Value ETF Over $100,000
iShares Russell 2000 ETF Over $100,000
iShares Short Maturity Bond ETF $1-$10,000
Madhav V. Rajan iShares Broad USD High Yield Corporate Bond ETF Over $100,000 Over $100,000
iShares Core Dividend Growth ETF Over $100,000
iShares Core High Dividend ETF Over $100,000
iShares Core S&P 500 ETF Over $100,000
iShares iBoxx $ High Yield Corporate Bond ETF Over $100,000
iShares iBoxx $ Investment Grade Corporate BondETF
Over $100,000
iShares Preferred and Income Securities ETF Over $100,000
iShares Russell 2000 ETF Over $100,000
iShares Select Dividend ETF Over $100,000
As of December 31, 2017, none of the Independent Trustees or their immediate family members owned beneficially or ofrecord any securities of BFA (the Funds’ investment adviser), the Distributor or any person controlling, controlled by or undercommon control with BFA or the Distributor.
Remuneration of Trustees and Advisory Board Members. Effective January 1, 2017, each current Independent Trustee ispaid an annual retainer of $325,000 for his or her services as a Board member to the BlackRock-advised Funds in theExchange-Traded Fund Complex, together with out-of-pocket expenses in accordance with the Board’s policy on travel andother business expenses relating to attendance at meetings. The annual retainer for services as an Advisory Board Member isthe same as the annual retainer for services as a Board member. The Independent Chair of the Board is paid an additionalannual retainer of $80,000 (prior to January 1, 2018, the additional annual retainer was $50,000). The Chair of each of theEquity Plus Committee, Fixed Income Plus Committee, Securities Lending Committee, Risk Committee, Nominating andGovernance Committee and 15(c) Committee is paid an additional annual retainer of $25,000. The Chair of the AuditCommittee is paid an additional annual retainer of $40,000. Cecilia H. Herbert waived the annual retainer for her service asthe Chair of the Nominating and Governance Committee. Each Independent Trustee that served as a director of subsidiariesof the Exchange-Traded Fund Complex is paid an additional annual retainer of $10,000 (plus an additional $1,772 paidannually to compensate for taxes due in the Republic of Mauritius in connection with such Trustee’s service on the boards ofcertain Mauritius-based subsidiaries).
The table below sets forth the compensation earned by each Independent Trustee and Interested Trustee for services to eachFund for the fiscal year ended March 31, 2018 and the aggregate compensation paid to them for services to the Exchange-Traded Fund Complex for the calendar year ended December 31, 2017.
71

NameiShares CoreS&P 500 ETF
iShares Core S&PMid-Cap ETF
iShares Core S&PSmall-Cap ETF
iShares CoreS&P Total U.S.
Stock Market ETF
Independent Trustees:
Jane D. Carlin $35,555 $11,765 $ 9,681 $3,355Richard L. Fagnani1 34,920 11,555 9,508 3,295Cecilia H. Herbert 38,857 12,858 10,580 3,667Charles A. Hurty 37,079 12,269 10,096 3,499John E. Kerrigan 35,555 11,765 9,681 3,355Drew E. Lawton2 34,920 11,555 9,508 3,295John E. Martinez 35,555 11,765 9,681 3,355Madhav V. Rajan 36,190 11,975 9,854 3,415
Interested Trustees:
Robert S. Kapito $ 0 $ 0 $ 0 $ 0Mark K. Wiedman 0 0 0 0
NameiShares Core
S&P U.S. Growth ETFiShares Core
S&P U.S. Value ETFiShares
Europe ETFiShares ExpandedTech Sector ETF
Independent Trustees:
Jane D. Carlin $ 979 $910 $733 $388Richard L. Fagnani1 961 894 720 381Cecilia H. Herbert 1,070 995 801 424Charles A. Hurty 1,021 949 764 404John E. Kerrigan 979 910 733 388Drew E. Lawton2 961 894 720 381John E. Martinez 979 910 733 388Madhav V. Rajan 996 926 746 395
Interested Trustees:
Robert S. Kapito $ 0 $ 0 $ 0 $ 0Mark K. Wiedman 0 0 0 0
NameiShares Expanded
Tech-Software Sector ETF
iSharesGlobal 100
ETF
iSharesGlobal CleanEnergy ETF
iSharesGlobal Comm Services
ETF
Independent Trustees:
Jane D. Carlin $360 $472 $41 $106Richard L. Fagnani1 353 463 41 104Cecilia H. Herbert 393 516 45 116Charles A. Hurty 375 492 43 111John E. Kerrigan 360 472 41 106Drew E. Lawton2 353 463 41 104John E. Martinez 360 472 41 106Madhav V. Rajan 366 480 42 108
Interested Trustees:
Robert S. Kapito $ 0 $ 0 $ 0 $ 0
72

NameiShares Expanded
Tech-Software Sector ETF
iSharesGlobal 100
ETF
iSharesGlobal CleanEnergy ETF
iSharesGlobal Comm Services
ETF
Mark K. Wiedman 0 0 0 0
Name
iSharesGlobal ConsumerDiscretionary ETF
iSharesGlobal Consumer
Staples ETF
iSharesGlobal Energy
ETF
iSharesGlobal Financials
ETF
Independent Trustees:
Jane D. Carlin $63 $142 $306 $168Richard L. Fagnani1 62 140 301 165Cecilia H. Herbert 69 155 334 184Charles A. Hurty 66 148 319 175John E. Kerrigan 63 142 306 168Drew E. Lawton2 62 140 301 165John E. Martinez 63 142 306 168Madhav V. Rajan 64 145 311 171
Interested Trustees:
Robert S. Kapito $ 0 $ 0 $ 0 $ 0Mark K. Wiedman 0 0 0 0
Name
iSharesGlobal Industrials
ETF
iSharesGlobal Infrastructure
ETF
iSharesGlobal Utilities
ETF
iShares InternationalDevelopedProperty
ETF
Independent Trustees:
Jane D. Carlin $82 $664 $35 $41Richard L. Fagnani1 81 652 34 41Cecilia H. Herbert 90 725 38 45Charles A. Hurty 86 692 36 43John E. Kerrigan 82 664 35 41Drew E. Lawton2 81 652 34 41John E. Martinez 82 664 35 41Madhav V. Rajan 84 675 36 42
Interested Trustees:
Robert S. Kapito $ 0 $ 0 $ 0 $ 0Mark K. Wiedman 0 0 0 0
Name
iSharesInternational
Preferred StockETF
iSharesJPX-Nikkei
400 ETFiShares
Micro-Cap ETF
iShares MortgageReal Estate
ETF
Independent Trustees:
Jane D. Carlin $25 $28 $233 $257Richard L. Fagnani1 24 27 229 253Cecilia H. Herbert 27 30 255 281Charles A. Hurty 26 29 243 268
73

Name
iSharesInternational
Preferred StockETF
iSharesJPX-Nikkei
400 ETFiShares
Micro-Cap ETF
iShares MortgageReal Estate
ETF
John E. Kerrigan 25 28 233 257Drew E. Lawton2 24 27 229 253John E. Martinez 25 28 233 257Madhav V. Rajan 25 28 237 262
Interested Trustees:
Robert S. Kapito $ 0 $ 0 $ 0 $ 0Mark K. Wiedman 0 0 0 0
Name
iShares NasdaqBiotechnology
ETF
iShares NorthAmerican Natural
Resources ETF
iShares NorthAmerican
Tech-MultimediaNetworking ETF
iShares PHLXSemiconductor
ETF
Independent Trustees:
Jane D. Carlin $2,396 $246 $17 $432Richard L. Fagnani1 2,353 242 17 424Cecilia H. Herbert 2,618 269 19 472Charles A. Hurty 2,498 257 18 451John E. Kerrigan 2,396 246 17 432Drew E. Lawton2 2,353 242 17 424John E. Martinez 2,396 246 17 432Madhav V. Rajan 2,439 251 17 440
Interested Trustees:
Robert S. Kapito $ 0 $ 0 $ 0 $ 0Mark K. Wiedman 0 0 0 0
NameiShares Preferred
and Income Securities ETF
iShares ResidentialReal Estate
ETFiShares Russell
1000 ETF
iShares Russell1000 Growth
ETF
Independent Trustees:
Jane D. Carlin $4,355 $76 $5,129 $10,594Richard L. Fagnani1 4,277 74 5,037 10,405Cecilia H. Herbert 4,759 83 5,605 11,578Charles A. Hurty 4,541 79 5,349 11,048John E. Kerrigan 4,355 76 5,129 10,594Drew E. Lawton2 4,277 74 5,037 10,405John E. Martinez 4,355 76 5,129 10,594Madhav V. Rajan 4,432 77 5,221 10,783
Interested Trustees:
Robert S. Kapito $ 0 $ 0 $ 0 $ 0Mark K. Wiedman 0 0 0 0
74

Name
iShares Russell1000 Pure U.S. Revenue
ETF3
iShares Russell1000 Value
ETFiShares Russell
2000 ETF
iShares Russell2000 Growth
ETF
Independent Trustees:
Jane D. Carlin $2 $ 9,598 $11,049 $2,440Richard L. Fagnani1 2 9,427 10,852 2,396Cecilia H. Herbert 3 10,489 12,075 2,667Charles A. Hurty 3 10,009 11,523 2,545John E. Kerrigan 2 9,598 11,049 2,440Drew E. Lawton2 2 9,427 10,852 2,396John E. Martinez 2 9,598 11,049 2,440Madhav V. Rajan 2 9,769 11,246 2,484
Interested Trustees:
Robert S. Kapito $0 $ 0 $ 0 $ 0Mark K. Wiedman 0 0 0 0
Name
iShares Russell2000 Value
ETFiShares Russell
3000 ETFiShares RussellMid-Cap ETF
iShares RussellMid-Cap Growth
ETF
Independent Trustees:
Jane D. Carlin $2,342 $2,168 $4,502 $2,269Richard L. Fagnani1 2,301 2,130 4,422 2,228Cecilia H. Herbert 2,560 2,370 4,920 2,480Charles A. Hurty 2,443 2,261 4,695 2,366John E. Kerrigan 2,342 2,168 4,502 2,269Drew E. Lawton2 2,301 2,130 4,422 2,228John E. Martinez 2,342 2,168 4,502 2,269Madhav V. Rajan 2,384 2,207 4,582 2,309
Interested Trustees:
Robert S. Kapito $ 0 $ 0 $ 0 $ 0Mark K. Wiedman 0 0 0 0
Name
iShares RussellMid-Cap Value
ETF
iShares RussellTop 200
ETF
iShares RussellTop 200
Growth ETF
iShares RussellTop 200
Value ETF
Independent Trustees:
Jane D. Carlin $2,791 $36 $259 $75Richard L. Fagnani1 2,742 36 255 74Cecilia H. Herbert 3,051 40 284 82Charles A. Hurty 2,911 38 271 79John E. Kerrigan 2,791 36 259 75Drew E. Lawton2 2,742 36 255 74John E. Martinez 2,791 36 259 75Madhav V. Rajan 2,841 37 264 77
Interested Trustees:
75

Name
iShares RussellMid-Cap Value
ETF
iShares RussellTop 200
ETF
iShares RussellTop 200
Growth ETF
iShares RussellTop 200
Value ETF
Robert S. Kapito $0 $0 $0 $0Mark K. Wiedman 0 0 0 0
NameiShares S&P
100 ETFiShares S&P 500
Growth ETFiShares S&P 500
Value ETF
iShares S&PMid-Cap 400Growth ETF
Independent Trustees:
Jane D. Carlin $1,331 $5,306 $3,879 $2,122Richard L. Fagnani1 1,308 5,211 3,810 2,084Cecilia H. Herbert 1,455 5,799 4,240 2,319Charles A. Hurty 1,388 5,533 4,046 2,213John E. Kerrigan 1,331 5,306 3,879 2,122Drew E. Lawton2 1,308 5,211 3,810 2,084John E. Martinez 1,331 5,306 3,879 2,122Madhav V. Rajan 1,355 5,401 3,949 2,160
Interested Trustees:
Robert S. Kapito $ 0 $ 0 $ 0 $ 0Mark K. Wiedman 0 0 0 0
Name
iShares S&PMid-Cap 400
Value ETF
iShares S&PSmall-Cap 600
Growth ETF
iShares S&PSmall-Cap 600
Value ETF
iShares U.S.Aerospace &Defense ETF
Independent Trustees:
Jane D. Carlin $1,486 $1,359 $1,368 $1,524Richard L. Fagnani1 1,459 1,335 1,344 1,497Cecilia H. Herbert 1,624 1,485 1,495 1,665Charles A. Hurty 1,550 1,417 1,427 1,589John E. Kerrigan 1,486 1,359 1,368 1,524Drew E. Lawton2 1,459 1,335 1,344 1,497John E. Martinez 1,486 1,359 1,368 1,524Madhav V. Rajan 1,513 1,383 1,393 1,551
Interested Trustees:
Robert S. Kapito $ 0 $ 0 $ 0 $ 0Mark K. Wiedman 0 0 0 0
Name
iShares U.S.Broker-Dealers
& SecuritiesExchanges ETF
iShares U.S.Healthcare
Providers ETF
iSharesU.S. Home
Construction ETF
Independent Trustees:
Jane D. Carlin $ 92 $125 $429Richard L. Fagnani1 90 123 421Cecilia H. Herbert 101 136 469Charles A. Hurty 96 130 447
76

Name
iShares U.S.Broker-Dealers
& SecuritiesExchanges ETF
iShares U.S.Healthcare
Providers ETF
iSharesU.S. Home
Construction ETF
John E. Kerrigan 92 125 429Drew E. Lawton2 90 123 421John E. Martinez 92 125 429Madhav V. Rajan 94 127 437
Interested Trustees:
Robert S. Kapito $ 0 $ 0 $ 0Mark K. Wiedman 0 0 0
NameiShares U.S.
Infrastructure ETF4iShares U.S.
Insurance ETF
iShares U.S.Medical
Devices ETF
Independent Trustees:
Jane D. Carlin $0 $35 $456Richard L. Fagnani1 0 34 448Cecilia H. Herbert 0 38 498Charles A. Hurty 0 37 475John E. Kerrigan 0 35 456Drew E. Lawton2 0 34 448John E. Martinez 0 35 456Madhav V. Rajan 0 36 464
Interested Trustees:
Robert S. Kapito $0 $ 0 $ 0Mark K. Wiedman 0 0 0
Name
iShares U.S.Oil & Gas Exploration
& Production ETF
iShares U.S.Oil Equipment& Services ETF
iShares U.S.Pharmaceuticals
ETF
Independent Trustees:
Jane D. Carlin $ 97 $54 $103Richard L. Fagnani1 95 53 102Cecilia H. Herbert 106 59 113Charles A. Hurty 101 56 108John E. Kerrigan 97 54 103Drew E. Lawton2 95 53 102John E. Martinez 97 54 103Madhav V. Rajan 99 55 105
Interested Trustees:
Robert S. Kapito $ 0 $ 0 $ 0Mark K. Wiedman 0 0 0
77

NameiShares U.S.
Real Estate ETF
iShares U.S.Regional
Banks ETF
iShares U.S.Telecommunications
ETF
Independent Trustees:
Jane D. Carlin 953 239 84Richard L. Fagnani1 936 235 82Cecilia H. Herbert 1,042 261 92Charles A. Hurty 994 249 87John E. Kerrigan 953 239 84Drew E. Lawton2 936 235 82John E. Martinez 953 239 84Madhav V. Rajan 970 243 85
Interested Trustees:
Robert S. Kapito $0 $0 $0Mark K. Wiedman 0 0 0
Name
Pension orRetirement Benefits
Accrued AsPart of TrustExpenses5
Estimated AnnualBenefits UponRetirement3
TotalCompensationFrom the Funds
and Fund Complex6
Independent Trustees:
Jane D. Carlin Not Applicable Not Applicable 361,764Richard L. Fagnani Not Applicable Not Applicable 256,2507
Cecilia H. Herbert Not Applicable Not Applicable 375,000Charles A. Hurty Not Applicable Not Applicable 376,764John E. Kerrigan Not Applicable Not Applicable 350,000Drew E. Lawton Not Applicable Not Applicable 337,5008
John E. Martinez Not Applicable Not Applicable 350,000Madhav V. Rajan Not Applicable Not Applicable 362,500
1 Compensation from each Fund is shown for Richard L. Fagnani for his services as an Advisory Board Member for the period from April 1, 2017 toJune 18, 2017, and for his services as an Independent Trustee for the period from June 19, 2017 (date of his election to the Board of the Trust, iShares,Inc. and iShares U.S. ETF Trust) to March 31, 2018.
2 Compensation from each Fund is shown for Drew E. Lawton for his services as an Advisory Board Member for the period from April 1, 2017 to June18, 2017, and for his services as an Independent Trustee for the period from June 19, 2017 (date of his election to the Board of the Trust, iShares, Inc.and iShares U.S. ETF Trust) to March 31, 2018.
3 For the iShares Russell 1000 Pure U.S. Revenue ETF, compensation reported is from the Fund’s inception date of August 8, 2017 to March 31, 2018.4 No compensation was paid by the iShares U.S. Infrastructure ETF for the fiscal year ended March 31, 2018 because the inception date of the Fund is
April 3, 2018.5 No Trustee or officer is entitled to any pension or retirement benefits from the Trust.6 Also includes compensation for service on the Board of Trustees or the Advisory Board of iShares U.S. ETF Trust and the Board of Directors or the
Advisory Board of iShares, Inc.7 Total compensation is shown for Richard L. Fagnani for his services as an Advisory Board Member for the period from April 1, 2017 (date of his
appointment to the Advisory Board of the Trust, iShares, Inc. and iShares U.S. ETF Trust) to June 18, 2017, and for his services as an IndependentTrustee for the period from June 19, 2017 (date of his election to the Board of the Trust, iShares, Inc. and iShares U.S. ETF Trust) to December 31,2017.
8 Total compensation is shown for Drew E. Lawton for his services as an Advisory Board Member for the period from January 1, 2017 to June 18, 2017,and for his services as an Independent Trustee for the period from June 19, 2017 (date of his election to the Board of the Trust, iShares, Inc. andiShares U.S. ETF Trust) to December 31, 2017.
Control Persons and Principal Holders of Securities.
The Trustees and officers of the Trust collectively owned less than 1% of each Fund’s outstanding shares as of June 30, 2018.
78

Although the Trust does not have information concerning the beneficial ownership of shares held in the names of DepositoryTrust Company (“DTC”) participants (as defined below), as of June 29, 2018, the name and percentage ownership of eachDTC participant that owned of record 5% or more of the outstanding shares of a Fund were as follows:
Fund NamePercentage
of Ownership
iShares Core S&P 500 ETF National Financial Services LLC200 Liberty Street5th FloorNew York, NY 10281
13.42%
The Bank of New York Mellon401 Salina Street2nd FloorSyracuse, NY 13202
7.07%
Charles Schwab & Co., Inc.111 Pavonia AvenueJersey City, NJ 07310
7.05%
Pershing LLCOne Pershing PlazaJersey City, NJ 07399
5.11%
iShares Core S&P Mid-Cap ETF National Financial Services LLC200 Liberty Street5th FloorNew York, NY 10281
12.67%
Charles Schwab & Co., Inc.111 Pavonia AvenueJersey City, NJ 07310
8.47%
First Clearing, LLC901 East Byrd StreetRichmond, VA 23219
7.46%
TD Ameritrade Clearing, Inc.1005 N. Ameritrade PlaceBellevue, NE 68005
6.31%
Pershing LLCOne Pershing PlazaJersey City, NJ 07399
5.21%
iShares Core S&P Small-Cap ETF National Financial Services LLC200 Liberty Street5th FloorNew York, NY 10281
16.97%
Charles Schwab & Co., Inc.111 Pavonia AvenueJersey City, NJ 07310
12.24%
Morgan Stanley Smith Barney LLC1300 Thames Street6th FloorBaltimore, MD 21231
5.35%
79
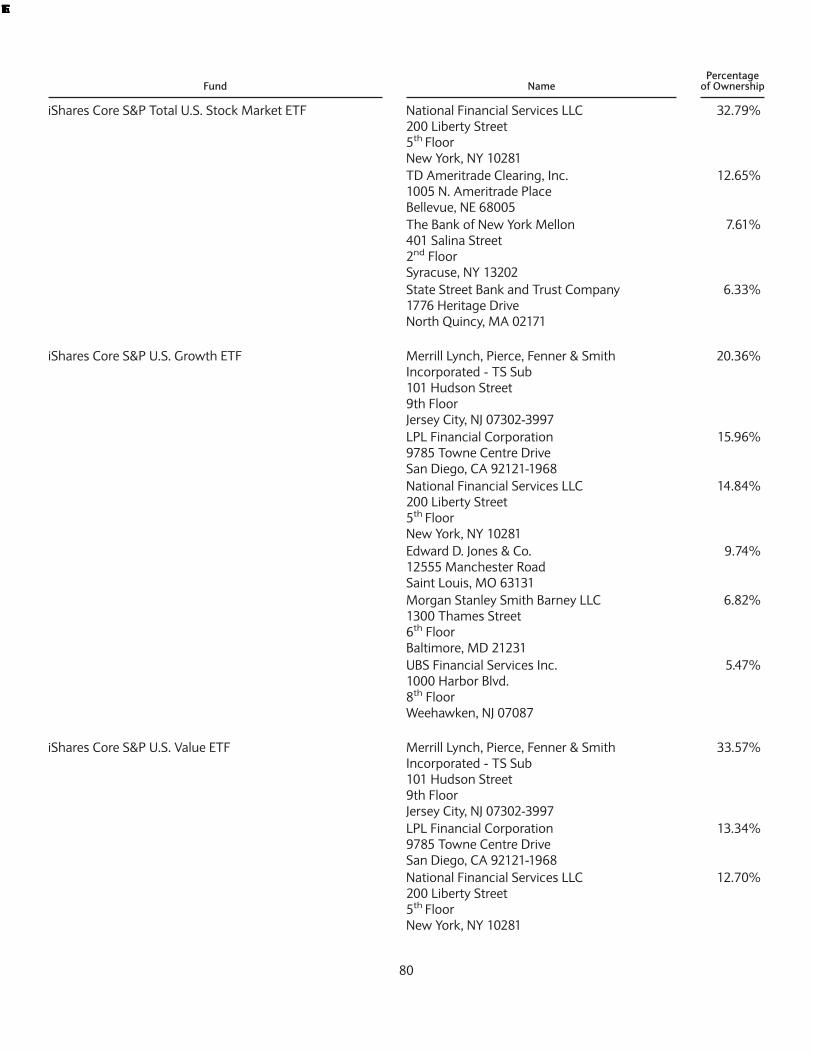
Fund NamePercentage
of Ownership
iShares Core S&P Total U.S. Stock Market ETF National Financial Services LLC200 Liberty Street5th FloorNew York, NY 10281
32.79%
TD Ameritrade Clearing, Inc.1005 N. Ameritrade PlaceBellevue, NE 68005
12.65%
The Bank of New York Mellon401 Salina Street2nd FloorSyracuse, NY 13202
7.61%
State Street Bank and Trust Company1776 Heritage DriveNorth Quincy, MA 02171
6.33%
iShares Core S&P U.S. Growth ETF Merrill Lynch, Pierce, Fenner & SmithIncorporated - TS Sub101 Hudson Street9th FloorJersey City, NJ 07302-3997
20.36%
LPL Financial Corporation9785 Towne Centre DriveSan Diego, CA 92121-1968
15.96%
National Financial Services LLC200 Liberty Street5th FloorNew York, NY 10281
14.84%
Edward D. Jones & Co.12555 Manchester RoadSaint Louis, MO 63131
9.74%
Morgan Stanley Smith Barney LLC1300 Thames Street6th FloorBaltimore, MD 21231
6.82%
UBS Financial Services Inc.1000 Harbor Blvd.8th FloorWeehawken, NJ 07087
5.47%
iShares Core S&P U.S. Value ETF Merrill Lynch, Pierce, Fenner & SmithIncorporated - TS Sub101 Hudson Street9th FloorJersey City, NJ 07302-3997
33.57%
LPL Financial Corporation9785 Towne Centre DriveSan Diego, CA 92121-1968
13.34%
National Financial Services LLC200 Liberty Street5th FloorNew York, NY 10281
12.70%
80

Fund NamePercentage
of Ownership
Edward D. Jones & Co.12555 Manchester RoadSaint Louis, MO 63131
5.90%
Morgan Stanley Smith Barney LLC1300 Thames Street6th FloorBaltimore, MD 21231
5.79%
Charles Schwab & Co., Inc.111 Pavonia AvenueJersey City, NJ 07310
5.74%
iShares Europe ETF Computershare Trust Company, N.A.250 Royall StreetCanton, MA 02021
22.87%
National Financial Services LLC200 Liberty Street5th FloorNew York, NY 10281
9.89%
Morgan Stanley Smith Barney LLC1300 Thames Street6th FloorBaltimore, MD 21231
8.95%
State Street Bank and Trust Company1776 Heritage DriveNorth Quincy, MA 02171
8.84%
Charles Schwab & Co., Inc.111 Pavonia AvenueJersey City, NJ 07310
5.50%
iShares Expanded Tech Sector ETF Charles Schwab & Co., Inc.111 Pavonia AvenueJersey City, NJ 07310
17.76%
National Financial Services LLC200 Liberty Street5th FloorNew York, NY 10281
13.12%
Citibank, N.A.3800 CitiBank Center TampaBuilding A/Floor 2Tampa, FL 33610
9.19%
JPMorgan Chase Bank, National Association14201 Dallas Pkwy12th FloorDallas, TX 75240
8.17%
Merrill Lynch, Pierce, Fenner & SmithIncorporated - TS Sub101 Hudson Street9th FloorJersey City, NJ 07302-3997
5.87%
81
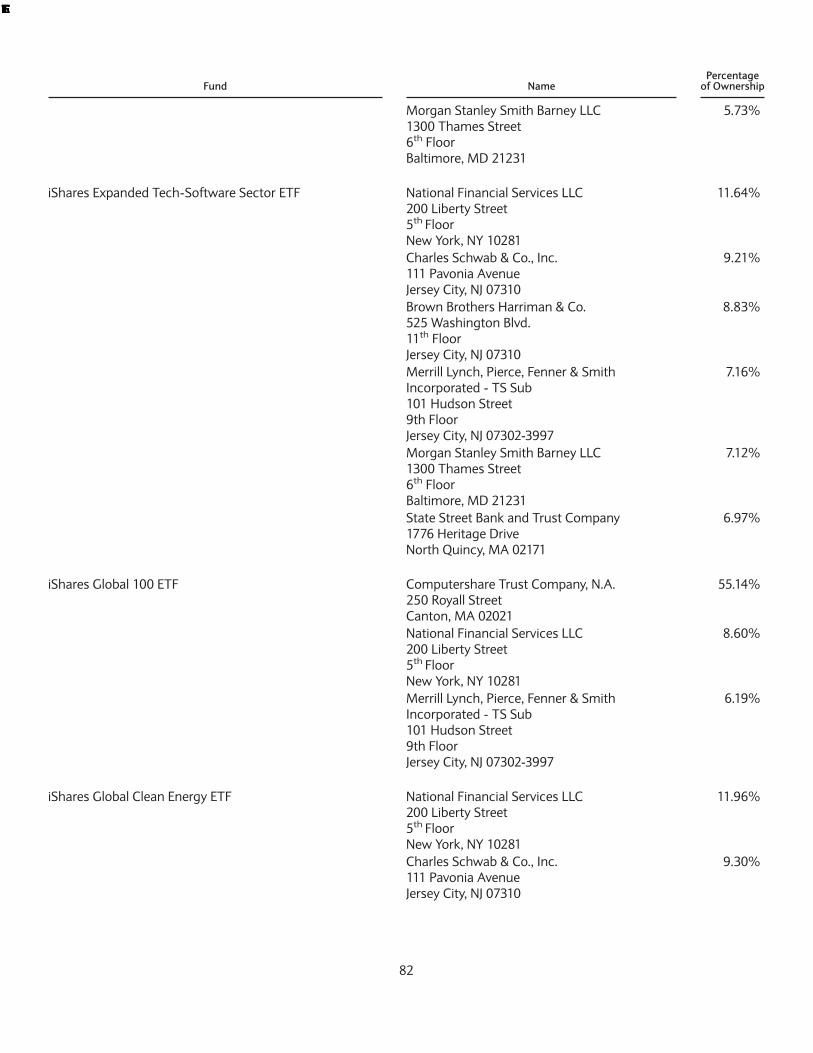
Fund NamePercentage
of Ownership
Morgan Stanley Smith Barney LLC1300 Thames Street6th FloorBaltimore, MD 21231
5.73%
iShares Expanded Tech-Software Sector ETF National Financial Services LLC200 Liberty Street5th FloorNew York, NY 10281
11.64%
Charles Schwab & Co., Inc.111 Pavonia AvenueJersey City, NJ 07310
9.21%
Brown Brothers Harriman & Co.525 Washington Blvd.11th FloorJersey City, NJ 07310
8.83%
Merrill Lynch, Pierce, Fenner & SmithIncorporated - TS Sub101 Hudson Street9th FloorJersey City, NJ 07302-3997
7.16%
Morgan Stanley Smith Barney LLC1300 Thames Street6th FloorBaltimore, MD 21231
7.12%
State Street Bank and Trust Company1776 Heritage DriveNorth Quincy, MA 02171
6.97%
iShares Global 100 ETF Computershare Trust Company, N.A.250 Royall StreetCanton, MA 02021
55.14%
National Financial Services LLC200 Liberty Street5th FloorNew York, NY 10281
8.60%
Merrill Lynch, Pierce, Fenner & SmithIncorporated - TS Sub101 Hudson Street9th FloorJersey City, NJ 07302-3997
6.19%
iShares Global Clean Energy ETF National Financial Services LLC200 Liberty Street5th FloorNew York, NY 10281
11.96%
Charles Schwab & Co., Inc.111 Pavonia AvenueJersey City, NJ 07310
9.30%
82

Fund NamePercentage
of Ownership
Brown Brothers Harriman & Co.525 Washington Blvd.11th FloorJersey City, NJ 07310
6.34%
Merrill Lynch, Pierce, Fenner & SmithIncorporated - TS Sub101 Hudson Street9th FloorJersey City, NJ 07302-3997
5.44%
Pershing LLCOne Pershing PlazaJersey City, NJ 07399
5.07%
iShares Global Comm Services ETF TD Ameritrade Clearing, Inc.1005 N. Ameritrade PlaceBellevue, NE 68005
22.01%
Charles Schwab & Co., Inc.111 Pavonia AvenueJersey City, NJ 07310
11.41%
National Financial Services LLC200 Liberty Street5th FloorNew York, NY 10281
10.19%
First Clearing, LLC901 East Byrd StreetRichmond, VA 23219
8.36%
Merrill Lynch, Pierce, Fenner & SmithIncorporated - TS Sub101 Hudson Street9th FloorJersey City, NJ 07302-3997
6.18%
Morgan Stanley Smith Barney LLC1300 Thames Street6th FloorBaltimore, MD 21231
5.27%
iShares Global Consumer Discretionary ETF The Bank of New York Mellon401 Salina Street2nd FloorSyracuse, NY 13202
27.49%
BlackRock Institutional Trust Company, N.A.400 Howard StreetSan Francisco, CA 94105
14.40%
National Financial Services LLC200 Liberty Street5th FloorNew York, NY 10281
8.12%
Charles Schwab & Co., Inc.111 Pavonia AvenueJersey City, NJ 07310
7.73%
83

Fund NamePercentage
of Ownership
iShares Global Consumer Staples ETF Computershare Trust Company, N.A.250 Royall StreetCanton, MA 02021
15.62%
Charles Schwab & Co., Inc.111 Pavonia AvenueJersey City, NJ 07310
10.67%
JPMorgan Chase Bank, National Association14201 Dallas Pkwy12th FloorDallas, TX 75240
9.57%
National Financial Services LLC200 Liberty Street5th FloorNew York, NY 10281
8.28%
Merrill Lynch, Pierce, Fenner & SmithIncorporated - TS Sub101 Hudson Street9th FloorJersey City, NJ 07302-3997
6.05%
Citibank, N.A.3800 CitiBank Center TampaBuilding A/Floor 2Tampa, FL 33610
5.53%
iShares Global Energy ETF BNP Paribas, New York Branch/CustodyServices525 Washington BLVD.Jersey City, NJ 07310
24.07%
Charles Schwab & Co., Inc.111 Pavonia AvenueJersey City, NJ 07310
10.00%
Citibank, N.A.3800 CitiBank Center TampaBuilding A/Floor 2Tampa, FL 33610
7.60%
National Financial Services LLC200 Liberty Street5th FloorNew York, NY 10281
6.06%
Brown Brothers Harriman & Co.525 Washington Blvd.11th FloorJersey City, NJ 07310
5.55%
iShares Global Financials ETF Morgan Stanley Smith Barney LLC1300 Thames Street6th FloorBaltimore, MD 21231
13.69%
Charles Schwab & Co., Inc.111 Pavonia AvenueJersey City, NJ 07310
11.31%
84

Fund NamePercentage
of Ownership
The Bank of New York Mellon401 Salina Street2nd FloorSyracuse, NY 13202
10.30%
Citibank, N.A.3800 CitiBank Center TampaBuilding A/Floor 2Tampa, FL 33610
9.21%
National Financial Services LLC200 Liberty Street5th FloorNew York, NY 10281
6.78%
State Street Bank and Trust Company1776 Heritage DriveNorth Quincy, MA 02171
5.81%
iShares Global Industrials ETF BlackRock Institutional Trust Company, N.A.400 Howard StreetSan Francisco, CA 94105
17.58%
The Bank of New York Mellon401 Salina Street2nd FloorSyracuse, NY 13202
11.98%
Charles Schwab & Co., Inc.111 Pavonia AvenueJersey City, NJ 07310
9.93%
National Financial Services LLC200 Liberty Street5th FloorNew York, NY 10281
6.84%
Merrill Lynch, Pierce, Fenner & SmithIncorporated - TS Sub101 Hudson Street9th FloorJersey City, NJ 07302-3997
5.58%
J.P. Morgan Clearing CorpOne Metrotech Center NorthBrooklyn, NY 11201
5.41%
iShares Global Infrastructure ETF Northern Trust Company (The)801 South Canal StreetChicago, IL 60612
19.73%
JPMorgan Chase Bank, National Association14201 Dallas Pkwy12th FloorDallas, TX 75240
15.89%
The Bank of New York Mellon401 Salina Street2nd FloorSyracuse, NY 13202
12.75%
85

Fund NamePercentage
of Ownership
State Street Bank and Trust Company1776 Heritage DriveNorth Quincy, MA 02171
7.94%
Fifth Third Bank (The)5001 Kingsley DriveCincinnati, OH 45263
7.72%
iShares Global Utilities ETF Morgan Stanley Smith Barney LLC1300 Thames Street6th FloorBaltimore, MD 21231
11.97%
National Financial Services LLC200 Liberty Street5th FloorNew York, NY 10281
11.18%
Charles Schwab & Co., Inc.111 Pavonia AvenueJersey City, NJ 07310
9.22%
The Bank of New York Mellon401 Salina Street2nd FloorSyracuse, NY 13202
8.38%
TD Ameritrade Clearing, Inc.1005 N. Ameritrade PlaceBellevue, NE 68005
6.04%
First Clearing, LLC901 East Byrd StreetRichmond, VA 23219
5.74%
Merrill Lynch, Pierce, Fenner & SmithIncorporated - TS Sub101 Hudson Street9th FloorJersey City, NJ 07302-3997
5.45%
Ameriprise Enterprise Investment Services, Inc.901 3rd Avenue SouthMinneapolis, MN 55474
5.13%
iShares International Developed Property ETF Charles Schwab & Co., Inc.111 Pavonia AvenueJersey City, NJ 07310
19.73%
National Financial Services LLC200 Liberty Street5th FloorNew York, NY 10281
17.92%
TD Ameritrade Clearing, Inc.1005 N. Ameritrade PlaceBellevue, NE 68005
17.16%
Morgan Stanley Smith Barney LLC1300 Thames Street6th FloorBaltimore, MD 21231
6.72%
86

Fund NamePercentage
of Ownership
Merrill Lynch, Pierce, Fenner & SmithIncorporated - TS Sub101 Hudson Street9th FloorJersey City, NJ 07302-3997
5.82%
iShares International Preferred Stock ETF Merrill Lynch, Pierce, Fenner & SmithIncorporated - TS Sub101 Hudson Street9th FloorJersey City, NJ 07302-3997
11.51%
National Financial Services LLC200 Liberty Street5th FloorNew York, NY 10281
10.33%
LPL Financial Corporation9785 Towne Centre DriveSan Diego, CA 92121-1968
8.83%
TD Ameritrade Clearing, Inc.1005 N. Ameritrade PlaceBellevue, NE 68005
7.60%
Charles Schwab & Co., Inc.111 Pavonia AvenueJersey City, NJ 07310
7.43%
Morgan Stanley Smith Barney LLC1300 Thames Street6th FloorBaltimore, MD 21231
5.62%
iShares JPX-Nikkei 400 ETF Morgan Stanley Smith Barney LLC1300 Thames Street6th FloorBaltimore, MD 21231
14.29%
Northern Trust Company (The)801 South Canal StreetChicago, IL 60612
11.64%
Merrill Lynch, Pierce, Fenner & SmithIncorporated - TS Sub101 Hudson Street9th FloorJersey City, NJ 07302-3997
8.87%
State Street Bank and Trust Company1776 Heritage DriveNorth Quincy, MA 02171
6.82%
UBS Financial Services Inc.1000 Harbor Blvd.8th FloorWeehawken, NJ 07087
5.99%
Charles Schwab & Co., Inc.111 Pavonia AvenueJersey City, NJ 07310
5.83%
87
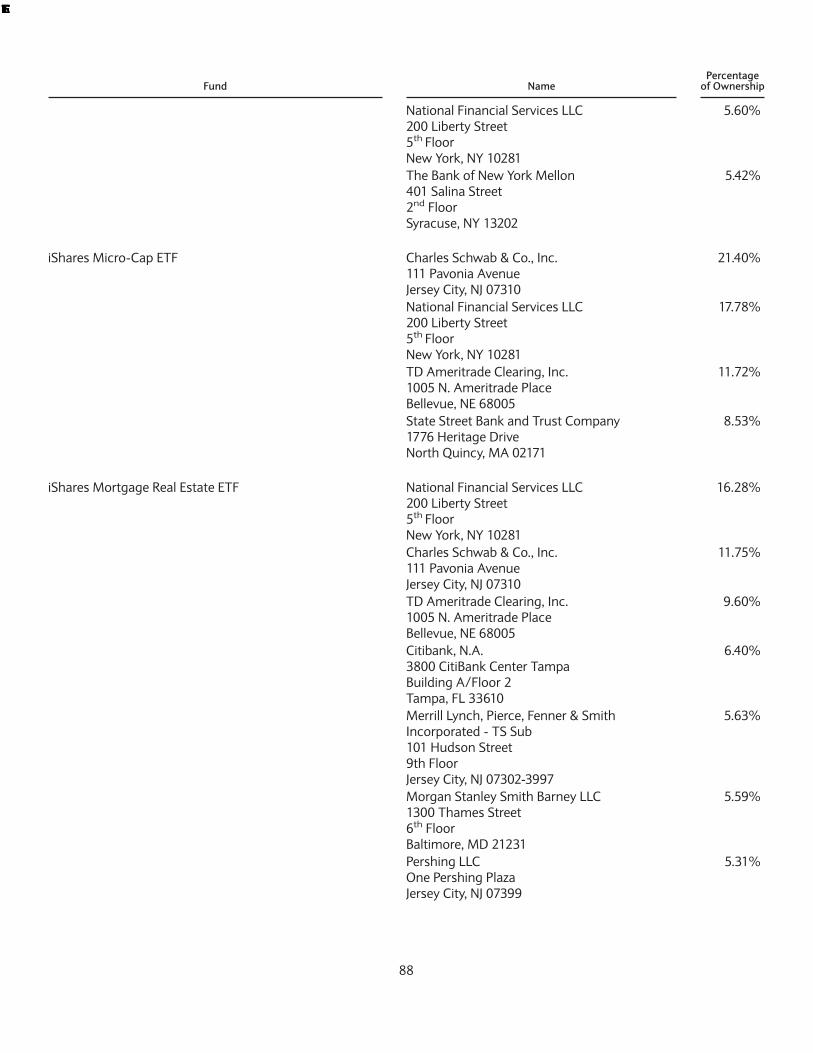
Fund NamePercentage
of Ownership
National Financial Services LLC200 Liberty Street5th FloorNew York, NY 10281
5.60%
The Bank of New York Mellon401 Salina Street2nd FloorSyracuse, NY 13202
5.42%
iShares Micro-Cap ETF Charles Schwab & Co., Inc.111 Pavonia AvenueJersey City, NJ 07310
21.40%
National Financial Services LLC200 Liberty Street5th FloorNew York, NY 10281
17.78%
TD Ameritrade Clearing, Inc.1005 N. Ameritrade PlaceBellevue, NE 68005
11.72%
State Street Bank and Trust Company1776 Heritage DriveNorth Quincy, MA 02171
8.53%
iShares Mortgage Real Estate ETF National Financial Services LLC200 Liberty Street5th FloorNew York, NY 10281
16.28%
Charles Schwab & Co., Inc.111 Pavonia AvenueJersey City, NJ 07310
11.75%
TD Ameritrade Clearing, Inc.1005 N. Ameritrade PlaceBellevue, NE 68005
9.60%
Citibank, N.A.3800 CitiBank Center TampaBuilding A/Floor 2Tampa, FL 33610
6.40%
Merrill Lynch, Pierce, Fenner & SmithIncorporated - TS Sub101 Hudson Street9th FloorJersey City, NJ 07302-3997
5.63%
Morgan Stanley Smith Barney LLC1300 Thames Street6th FloorBaltimore, MD 21231
5.59%
Pershing LLCOne Pershing PlazaJersey City, NJ 07399
5.31%
88
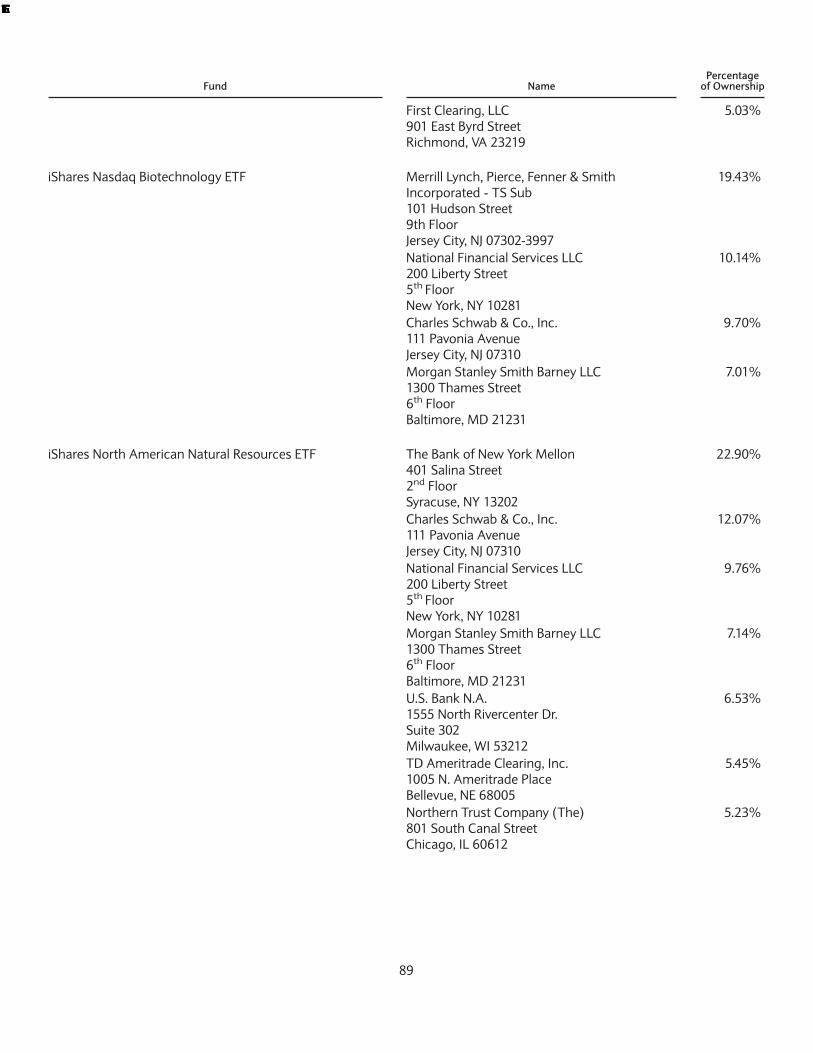
Fund NamePercentage
of Ownership
First Clearing, LLC901 East Byrd StreetRichmond, VA 23219
5.03%
iShares Nasdaq Biotechnology ETF Merrill Lynch, Pierce, Fenner & SmithIncorporated - TS Sub101 Hudson Street9th FloorJersey City, NJ 07302-3997
19.43%
National Financial Services LLC200 Liberty Street5th FloorNew York, NY 10281
10.14%
Charles Schwab & Co., Inc.111 Pavonia AvenueJersey City, NJ 07310
9.70%
Morgan Stanley Smith Barney LLC1300 Thames Street6th FloorBaltimore, MD 21231
7.01%
iShares North American Natural Resources ETF The Bank of New York Mellon401 Salina Street2nd FloorSyracuse, NY 13202
22.90%
Charles Schwab & Co., Inc.111 Pavonia AvenueJersey City, NJ 07310
12.07%
National Financial Services LLC200 Liberty Street5th FloorNew York, NY 10281
9.76%
Morgan Stanley Smith Barney LLC1300 Thames Street6th FloorBaltimore, MD 21231
7.14%
U.S. Bank N.A.1555 North Rivercenter Dr.Suite 302Milwaukee, WI 53212
6.53%
TD Ameritrade Clearing, Inc.1005 N. Ameritrade PlaceBellevue, NE 68005
5.45%
Northern Trust Company (The)801 South Canal StreetChicago, IL 60612
5.23%
89

Fund NamePercentage
of Ownership
iShares North American Tech-Multimedia Networking ETF Merrill Lynch, Pierce, Fenner & SmithIncorporated - TS Sub101 Hudson Street9th FloorJersey City, NJ 07302-3997
13.70%
National Financial Services LLC200 Liberty Street5th FloorNew York, NY 10281
13.63%
First Clearing, LLC901 East Byrd StreetRichmond, VA 23219
9.81%
Morgan Stanley Smith Barney LLC1300 Thames Street6th FloorBaltimore, MD 21231
8.66%
Charles Schwab & Co., Inc.111 Pavonia AvenueJersey City, NJ 07310
8.27%
TD Ameritrade Clearing, Inc.1005 N. Ameritrade PlaceBellevue, NE 68005
6.89%
Merrill Lynch, Pierce, Fenner & SmithIncorporated101 Hudson Street9th FloorJersey City, NJ 07302-3997
6.11%
iShares PHLX Semiconductor ETF National Financial Services LLC200 Liberty Street5th FloorNew York, NY 10281
17.55%
Morgan Stanley & Co. IncorporatedOne Pierrepont Plaza8th FloorBrooklyn, NY 11201
13.17%
Merrill Lynch, Pierce, Fenner & SmithIncorporated - TS Sub101 Hudson Street9th FloorJersey City, NJ 07302-3997
9.44%
Charles Schwab & Co., Inc.111 Pavonia AvenueJersey City, NJ 07310
9.08%
iShares Preferred and Income Securities ETF National Financial Services LLC200 Liberty Street5th FloorNew York, NY 10281
17.01%
90

Fund NamePercentage
of Ownership
Charles Schwab & Co., Inc.111 Pavonia AvenueJersey City, NJ 07310
11.26%
TD Ameritrade Clearing, Inc.1005 N. Ameritrade PlaceBellevue, NE 68005
6.41%
First Clearing, LLC901 East Byrd StreetRichmond, VA 23219
6.09%
Merrill Lynch, Pierce, Fenner & SmithIncorporated - TS Sub101 Hudson Street9th FloorJersey City, NJ 07302-3997
5.89%
iShares Residential Real Estate ETF National Financial Services LLC200 Liberty Street5th FloorNew York, NY 10281
22.32%
Charles Schwab & Co., Inc.111 Pavonia AvenueJersey City, NJ 07310
14.59%
TD Ameritrade Clearing, Inc.1005 N. Ameritrade PlaceBellevue, NE 68005
9.35%
Pershing LLCOne Pershing PlazaJersey City, NJ 07399
7.17%
Merrill Lynch, Pierce, Fenner & SmithIncorporated - TS Sub101 Hudson Street9th FloorJersey City, NJ 07302-3997
5.80%
First Clearing, LLC901 East Byrd StreetRichmond, VA 23219
5.67%
Stifel, Nicolaus & Company Incorporated501 N. BroadwaySt. Louis, MO 63102
5.10%
iShares Russell 1000 ETF State Street Bank and Trust Company1776 Heritage DriveNorth Quincy, MA 02171
20.56%
National Financial Services LLC200 Liberty Street5th FloorNew York, NY 10281
13.09%
Charles Schwab & Co., Inc.111 Pavonia AvenueJersey City, NJ 07310
12.02%
91

Fund NamePercentage
of Ownership
The Bank of New York Mellon401 Salina Street2nd FloorSyracuse, NY 13202
6.21%
Pershing LLCOne Pershing PlazaJersey City, NJ 07399
5.22%
iShares Russell 1000 Growth ETF National Financial Services LLC200 Liberty Street5th FloorNew York, NY 10281
13.26%
Morgan Stanley Smith Barney LLC1300 Thames Street6th FloorBaltimore, MD 21231
12.80%
Merrill Lynch, Pierce, Fenner & SmithIncorporated - TS Sub101 Hudson Street9th FloorJersey City, NJ 07302-3997
11.46%
Charles Schwab & Co., Inc.111 Pavonia AvenueJersey City, NJ 07310
7.86%
Pershing LLCOne Pershing PlazaJersey City, NJ 07399
5.92%
iShares Russell 1000 Pure U.S. Revenue ETF The Bank of New York Mellon401 Salina Street2nd FloorSyracuse, NY 13202
57.23%
National Financial Services LLC200 Liberty Street5th FloorNew York, NY 10281
8.83%
Citibank, N.A.3800 CitiBank Center TampaBuilding A/Floor 2Tampa, FL 33610
7.62%
TD Ameritrade Clearing, Inc.1005 N. Ameritrade PlaceBellevue, NE 68005
6.20%
Charles Schwab & Co., Inc.111 Pavonia AvenueJersey City, NJ 07310
6.09%
Merrill Lynch, Pierce, Fenner & SmithIncorporated101 Hudson Street9th FloorJersey City, NJ 07302-3997
5.08%
92

Fund NamePercentage
of Ownership
iShares Russell 1000 Value ETF Merrill Lynch, Pierce, Fenner & SmithIncorporated - TS Sub101 Hudson Street9th FloorJersey City, NJ 07302-3997
13.80%
National Financial Services LLC200 Liberty Street5th FloorNew York, NY 10281
11.47%
Morgan Stanley Smith Barney LLC1300 Thames Street6th FloorBaltimore, MD 21231
10.97%
TD Ameritrade Clearing, Inc.1005 N. Ameritrade PlaceBellevue, NE 68005
7.73%
Charles Schwab & Co., Inc.111 Pavonia AvenueJersey City, NJ 07310
5.64%
Pershing LLCOne Pershing PlazaJersey City, NJ 07399
5.61%
Edward D. Jones & Co.12555 Manchester RoadSaint Louis, MO 63131
5.08%
iShares Russell 2000 ETF Charles Schwab & Co., Inc.111 Pavonia AvenueJersey City, NJ 07310
10.96%
National Financial Services LLC200 Liberty Street5th FloorNew York, NY 10281
8.34%
First Clearing, LLC901 East Byrd StreetRichmond, VA 23219
7.98%
Bank of America, National AssociationGWIM TRUST OPERATIONS414 N. Akard Street5th FloorDallas, TX 75201
6.89%
iShares Russell 2000 Growth ETF National Financial Services LLC200 Liberty Street5th FloorNew York, NY 10281
12.71%
Morgan Stanley Smith Barney LLC1300 Thames Street6th FloorBaltimore, MD 21231
10.89%
93
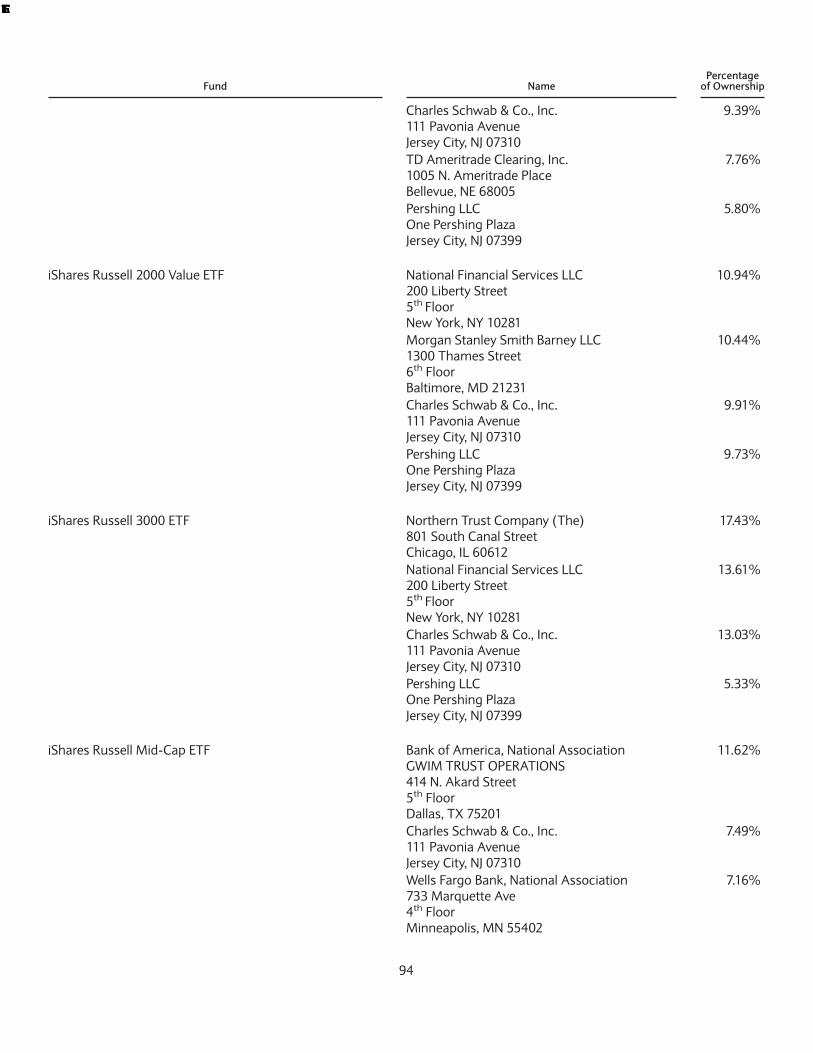
Fund NamePercentage
of Ownership
Charles Schwab & Co., Inc.111 Pavonia AvenueJersey City, NJ 07310
9.39%
TD Ameritrade Clearing, Inc.1005 N. Ameritrade PlaceBellevue, NE 68005
7.76%
Pershing LLCOne Pershing PlazaJersey City, NJ 07399
5.80%
iShares Russell 2000 Value ETF National Financial Services LLC200 Liberty Street5th FloorNew York, NY 10281
10.94%
Morgan Stanley Smith Barney LLC1300 Thames Street6th FloorBaltimore, MD 21231
10.44%
Charles Schwab & Co., Inc.111 Pavonia AvenueJersey City, NJ 07310
9.91%
Pershing LLCOne Pershing PlazaJersey City, NJ 07399
9.73%
iShares Russell 3000 ETF Northern Trust Company (The)801 South Canal StreetChicago, IL 60612
17.43%
National Financial Services LLC200 Liberty Street5th FloorNew York, NY 10281
13.61%
Charles Schwab & Co., Inc.111 Pavonia AvenueJersey City, NJ 07310
13.03%
Pershing LLCOne Pershing PlazaJersey City, NJ 07399
5.33%
iShares Russell Mid-Cap ETF Bank of America, National AssociationGWIM TRUST OPERATIONS414 N. Akard Street5th FloorDallas, TX 75201
11.62%
Charles Schwab & Co., Inc.111 Pavonia AvenueJersey City, NJ 07310
7.49%
Wells Fargo Bank, National Association733 Marquette Ave4th FloorMinneapolis, MN 55402
7.16%
94

Fund NamePercentage
of Ownership
National Financial Services LLC200 Liberty Street5th FloorNew York, NY 10281
7.00%
JPMorgan Chase Bank, National Association14201 Dallas Pkwy12th FloorDallas, TX 75240
5.50%
PNC Bank, National AssociationInstitutional Service Group8800 Tinicum Blvd.Attn: Trade Sett. DeptPhiladelphia, PA 19153
5.17%
iShares Russell Mid-Cap Growth ETF National Financial Services LLC200 Liberty Street5th FloorNew York, NY 10281
11.79%
Morgan Stanley Smith Barney LLC1300 Thames Street6th FloorBaltimore, MD 21231
11.67%
Charles Schwab & Co., Inc.111 Pavonia AvenueJersey City, NJ 07310
9.79%
Pershing LLCOne Pershing PlazaJersey City, NJ 07399
8.40%
iShares Russell Mid-Cap Value ETF Pershing LLCOne Pershing PlazaJersey City, NJ 07399
17.80%
National Financial Services LLC200 Liberty Street5th FloorNew York, NY 10281
11.88%
Morgan Stanley Smith Barney LLC1300 Thames Street6th FloorBaltimore, MD 21231
9.66%
Charles Schwab & Co., Inc.111 Pavonia AvenueJersey City, NJ 07310
7.13%
Edward D. Jones & Co.12555 Manchester RoadSaint Louis, MO 63131
6.52%
iShares Russell Top 200 ETF National Financial Services LLC200 Liberty Street5th FloorNew York, NY 10281
30.30%
95

Fund NamePercentage
of Ownership
TD Ameritrade Clearing, Inc.1005 N. Ameritrade PlaceBellevue, NE 68005
16.66%
Charles Schwab & Co., Inc.111 Pavonia AvenueJersey City, NJ 07310
13.66%
Merrill Lynch, Pierce, Fenner & SmithIncorporated - TS Sub101 Hudson Street9th FloorJersey City, NJ 07302-3997
9.32%
The Bank of New York Mellon401 Salina Street2nd FloorSyracuse, NY 13202
5.91%
iShares Russell Top 200 Growth ETF National Financial Services LLC200 Liberty Street5th FloorNew York, NY 10281
24.23%
Charles Schwab & Co., Inc.111 Pavonia AvenueJersey City, NJ 07310
8.78%
Ameriprise Enterprise Investment Services, Inc.901 3rd Avenue SouthMinneapolis, MN 55474
8.62%
Morgan Stanley Smith Barney LLC1300 Thames Street6th FloorBaltimore, MD 21231
8.21%
UBS Financial Services Inc.1000 Harbor Blvd.8th FloorWeehawken, NJ 07087
7.47%
TD Ameritrade Clearing, Inc.1005 N. Ameritrade PlaceBellevue, NE 68005
5.66%
First Clearing, LLC901 East Byrd StreetRichmond, VA 23219
5.15%
iShares Russell Top 200 Value ETF UBS Financial Services Inc.1000 Harbor Blvd.8th FloorWeehawken, NJ 07087
22.86%
National Financial Services LLC200 Liberty Street5th FloorNew York, NY 10281
15.95%
96

Fund NamePercentage
of Ownership
Merrill Lynch, Pierce, Fenner & SmithIncorporated - TS Sub101 Hudson Street9th FloorJersey City, NJ 07302-3997
8.66%
The Bank of New York Mellon401 Salina Street2nd FloorSyracuse, NY 13202
7.28%
First Clearing, LLC901 East Byrd StreetRichmond, VA 23219
6.29%
TD Ameritrade Clearing, Inc.1005 N. Ameritrade PlaceBellevue, NE 68005
6.29%
Wells Fargo Bank, National Association733 Marquette Ave4th FloorMinneapolis, MN 55402
6.00%
iShares S&P 100 ETF National Financial Services LLC200 Liberty Street5th FloorNew York, NY 10281
12.50%
Charles Schwab & Co., Inc.111 Pavonia AvenueJersey City, NJ 07310
11.47%
Edward D. Jones & Co.12555 Manchester RoadSaint Louis, MO 63131
10.97%
Merrill Lynch, Pierce, Fenner & SmithIncorporated - TS Sub101 Hudson Street9th FloorJersey City, NJ 07302-3997
8.52%
Bank of America, National AssociationGWIM TRUST OPERATIONS414 N. Akard Street5th FloorDallas, TX 75201
8.32%
iShares S&P 500 Growth ETF National Financial Services LLC200 Liberty Street5th FloorNew York, NY 10281
19.74%
Morgan Stanley Smith Barney LLC1300 Thames Street6th FloorBaltimore, MD 21231
11.44%
97

Fund NamePercentage
of Ownership
Charles Schwab & Co., Inc.111 Pavonia AvenueJersey City, NJ 07310
8.49%
TD Ameritrade Clearing, Inc.1005 N. Ameritrade PlaceBellevue, NE 68005
7.35%
Merrill Lynch, Pierce, Fenner & SmithIncorporated - TS Sub101 Hudson Street9th FloorJersey City, NJ 07302-3997
6.14%
First Clearing, LLC901 East Byrd StreetRichmond, VA 23219
5.63%
iShares S&P 500 Value ETF National Financial Services LLC200 Liberty Street5th FloorNew York, NY 10281
18.97%
Morgan Stanley Smith Barney LLC1300 Thames Street6th FloorBaltimore, MD 21231
10.65%
Charles Schwab & Co., Inc.111 Pavonia AvenueJersey City, NJ 07310
7.04%
TD Ameritrade Clearing, Inc.1005 N. Ameritrade PlaceBellevue, NE 68005
7.03%
Merrill Lynch, Pierce, Fenner & SmithIncorporated - TS Sub101 Hudson Street9th FloorJersey City, NJ 07302-3997
6.63%
First Clearing, LLC901 East Byrd StreetRichmond, VA 23219
5.69%
Edward D. Jones & Co.12555 Manchester RoadSaint Louis, MO 63131
5.16%
iShares S&P Mid-Cap 400 Growth ETF National Financial Services LLC200 Liberty Street5th FloorNew York, NY 10281
12.51%
Wells Fargo Bank, National Association733 Marquette Ave4th FloorMinneapolis, MN 55402
12.44%
98

Fund NamePercentage
of Ownership
Morgan Stanley Smith Barney LLC1300 Thames Street6th FloorBaltimore, MD 21231
8.72%
First Clearing, LLC901 East Byrd StreetRichmond, VA 23219
7.73%
Charles Schwab & Co., Inc.111 Pavonia AvenueJersey City, NJ 07310
7.02%
State Street Bank and Trust Company1776 Heritage DriveNorth Quincy, MA 02171
5.76%
iShares S&P Mid-Cap 400 Value ETF Wells Fargo Bank, National Association733 Marquette Ave4th FloorMinneapolis, MN 55402
14.40%
National Financial Services LLC200 Liberty Street5th FloorNew York, NY 10281
13.29%
First Clearing, LLC901 East Byrd StreetRichmond, VA 23219
9.08%
Charles Schwab & Co., Inc.111 Pavonia AvenueJersey City, NJ 07310
8.75%
Morgan Stanley Smith Barney LLC1300 Thames Street6th FloorBaltimore, MD 21231
8.65%
TD Ameritrade Clearing, Inc.1005 N. Ameritrade PlaceBellevue, NE 68005
6.15%
iShares S&P Small-Cap 600 Growth ETF National Financial Services LLC200 Liberty Street5th FloorNew York, NY 10281
21.64%
Morgan Stanley Smith Barney LLC1300 Thames Street6th FloorBaltimore, MD 21231
10.20%
Charles Schwab & Co., Inc.111 Pavonia AvenueJersey City, NJ 07310
10.03%
First Clearing, LLC901 East Byrd StreetRichmond, VA 23219
6.72%
99
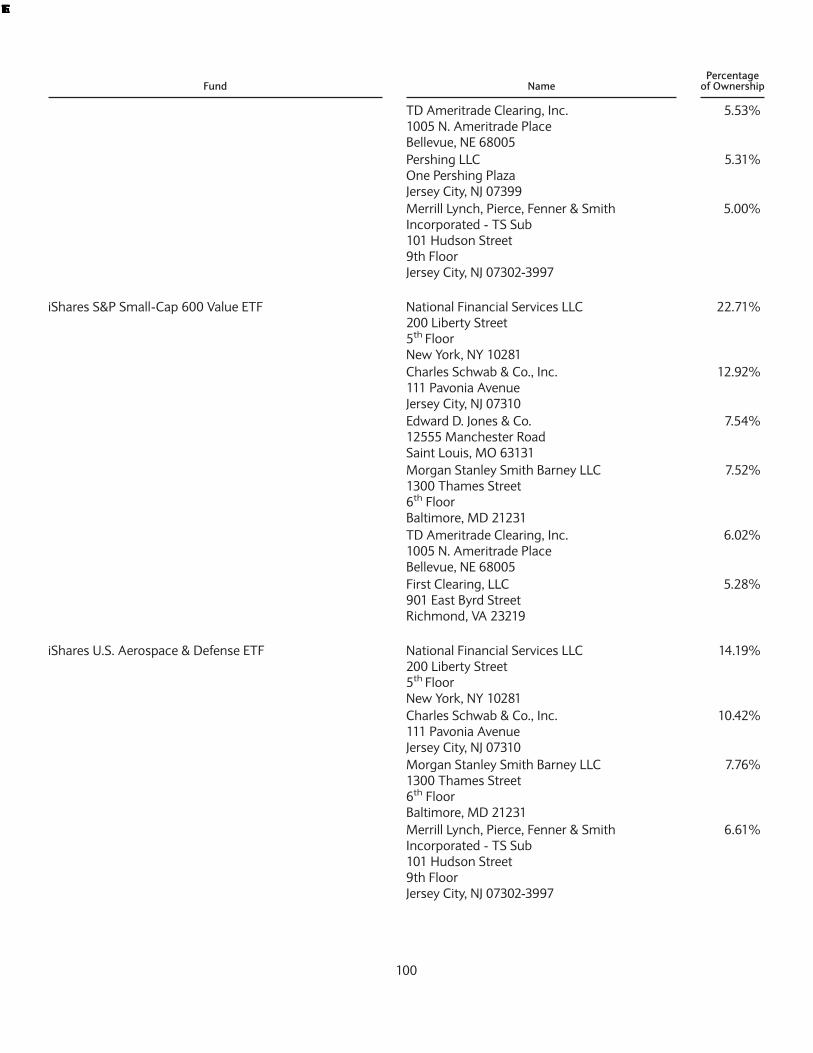
Fund NamePercentage
of Ownership
TD Ameritrade Clearing, Inc.1005 N. Ameritrade PlaceBellevue, NE 68005
5.53%
Pershing LLCOne Pershing PlazaJersey City, NJ 07399
5.31%
Merrill Lynch, Pierce, Fenner & SmithIncorporated - TS Sub101 Hudson Street9th FloorJersey City, NJ 07302-3997
5.00%
iShares S&P Small-Cap 600 Value ETF National Financial Services LLC200 Liberty Street5th FloorNew York, NY 10281
22.71%
Charles Schwab & Co., Inc.111 Pavonia AvenueJersey City, NJ 07310
12.92%
Edward D. Jones & Co.12555 Manchester RoadSaint Louis, MO 63131
7.54%
Morgan Stanley Smith Barney LLC1300 Thames Street6th FloorBaltimore, MD 21231
7.52%
TD Ameritrade Clearing, Inc.1005 N. Ameritrade PlaceBellevue, NE 68005
6.02%
First Clearing, LLC901 East Byrd StreetRichmond, VA 23219
5.28%
iShares U.S. Aerospace & Defense ETF National Financial Services LLC200 Liberty Street5th FloorNew York, NY 10281
14.19%
Charles Schwab & Co., Inc.111 Pavonia AvenueJersey City, NJ 07310
10.42%
Morgan Stanley Smith Barney LLC1300 Thames Street6th FloorBaltimore, MD 21231
7.76%
Merrill Lynch, Pierce, Fenner & SmithIncorporated - TS Sub101 Hudson Street9th FloorJersey City, NJ 07302-3997
6.61%
100

Fund NamePercentage
of Ownership
TD Ameritrade Clearing, Inc.1005 N. Ameritrade PlaceBellevue, NE 68005
6.15%
Pershing LLCOne Pershing PlazaJersey City, NJ 07399
5.89%
First Clearing, LLC901 East Byrd StreetRichmond, VA 23219
5.35%
Ameriprise Enterprise Investment Services, Inc.901 3rd Avenue SouthMinneapolis, MN 55474
5.24%
iShares U.S. Broker-Dealers & Securities Exchanges ETF National Financial Services LLC200 Liberty Street5th FloorNew York, NY 10281
10.87%
Morgan Stanley Smith Barney LLC1300 Thames Street6th FloorBaltimore, MD 21231
10.07%
The Bank of New York Mellon401 Salina Street2nd FloorSyracuse, NY 13202
8.97%
Charles Schwab & Co., Inc.111 Pavonia AvenueJersey City, NJ 07310
8.61%
Janney Montgomery Scott LLC26 BroadwayNew York, NY 10004
7.12%
The Bank of New York Mellon/Mellon Trust ofNew England, National AssociationOne Boston Place8th FloorBoston, MA 02108
6.44%
First Clearing, LLC901 East Byrd StreetRichmond, VA 23219
6.40%
TD Ameritrade Clearing, Inc.1005 N. Ameritrade PlaceBellevue, NE 68005
5.06%
iShares U.S. Healthcare Providers ETF BMO Nesbitt Burns Inc. /CDS250 Yonge Street7th FloorToronto, ON M5B 2M8
21.83%
Charles Schwab & Co., Inc.111 Pavonia AvenueJersey City, NJ 07310
15.55%
101

Fund NamePercentage
of Ownership
National Financial Services LLC200 Liberty Street5th FloorNew York, NY 10281
12.30%
Morgan Stanley Smith Barney LLC1300 Thames Street6th FloorBaltimore, MD 21231
5.44%
iShares U.S. Home Construction ETF National Financial Services LLC200 Liberty Street5th FloorNew York, NY 10281
11.67%
The Bank of New York Mellon401 Salina Street2nd FloorSyracuse, NY 13202
10.30%
Charles Schwab & Co., Inc.111 Pavonia AvenueJersey City, NJ 07310
10.10%
Merrill Lynch, Pierce, Fenner & SmithIncorporated - TS Sub101 Hudson Street9th FloorJersey City, NJ 07302-3997
6.86%
JPMorgan Chase Bank, National Association14201 Dallas Pkwy12th FloorDallas, TX 75240
6.36%
TD Ameritrade Clearing, Inc.1005 N. Ameritrade PlaceBellevue, NE 68005
5.89%
iShares U.S. Insurance ETF National Financial Services LLC200 Liberty Street5th FloorNew York, NY 10281
14.75%
Charles Schwab & Co., Inc.111 Pavonia AvenueJersey City, NJ 07310
9.48%
TD Ameritrade Clearing, Inc.1005 N. Ameritrade PlaceBellevue, NE 68005
8.99%
Morgan Stanley Smith Barney LLC1300 Thames Street6th FloorBaltimore, MD 21231
8.65%
102

Fund NamePercentage
of Ownership
Merrill Lynch, Pierce, Fenner & SmithIncorporated - TS Sub101 Hudson Street9th FloorJersey City, NJ 07302-3997
7.30%
First Clearing, LLC901 East Byrd StreetRichmond, VA 23219
6.44%
Fifth Third Bank (The)5001 Kingsley DriveCincinnati, OH 45263
6.07%
Pershing LLCOne Pershing PlazaJersey City, NJ 07399
5.38%
iShares U.S. Medical Devices ETF National Financial Services LLC200 Liberty Street5th FloorNew York, NY 10281
17.30%
Charles Schwab & Co., Inc.111 Pavonia AvenueJersey City, NJ 07310
8.43%
Citibank, N.A.3800 CitiBank Center TampaBuilding A/Floor 2Tampa, FL 33610
8.07%
Morgan Stanley Smith Barney LLC1300 Thames Street6th FloorBaltimore, MD 21231
6.52%
TD Ameritrade Clearing, Inc.1005 N. Ameritrade PlaceBellevue, NE 68005
6.06%
BMO Nesbitt Burns Inc. /CDS250 Yonge Street7th FloorToronto, ON M5B 2M8
6.02%
iShares U.S. Oil & Gas Exploration & Production ETF National Financial Services LLC200 Liberty Street5th FloorNew York, NY 10281
14.72%
JPMorgan Chase Bank, National Association14201 Dallas Pkwy12th FloorDallas, TX 75240
12.34%
Charles Schwab & Co., Inc.111 Pavonia AvenueJersey City, NJ 07310
8.48%
103

Fund NamePercentage
of Ownership
Merrill Lynch, Pierce, Fenner & SmithIncorporated - TS Sub101 Hudson Street9th FloorJersey City, NJ 07302-3997
7.78%
TD Ameritrade Clearing, Inc.1005 N. Ameritrade PlaceBellevue, NE 68005
5.81%
iShares U.S. Oil Equipment & Services ETF Morgan Stanley Smith Barney LLC1300 Thames Street6th FloorBaltimore, MD 21231
14.43%
National Financial Services LLC200 Liberty Street5th FloorNew York, NY 10281
11.58%
Citibank, N.A.3800 CitiBank Center TampaBuilding A/Floor 2Tampa, FL 33610
10.37%
Robert W. Baird & Co., Incorporated777 E. Wisconsin Ave9th FloorMilwaukee, WI 53202
8.88%
Raymond, James & Associates, Inc.880 Carillon ParkwayP.O. Box 12749St. Petersburg, FL 33733
6.70%
Charles Schwab & Co., Inc.111 Pavonia AvenueJersey City, NJ 07310
6.36%
iShares U.S. Pharmaceuticals ETF National Financial Services LLC200 Liberty Street5th FloorNew York, NY 10281
14.98%
Charles Schwab & Co., Inc.111 Pavonia AvenueJersey City, NJ 07310
10.92%
TD Ameritrade Clearing, Inc.1005 N. Ameritrade PlaceBellevue, NE 68005
9.69%
Morgan Stanley Smith Barney LLC1300 Thames Street6th FloorBaltimore, MD 21231
8.33%
104
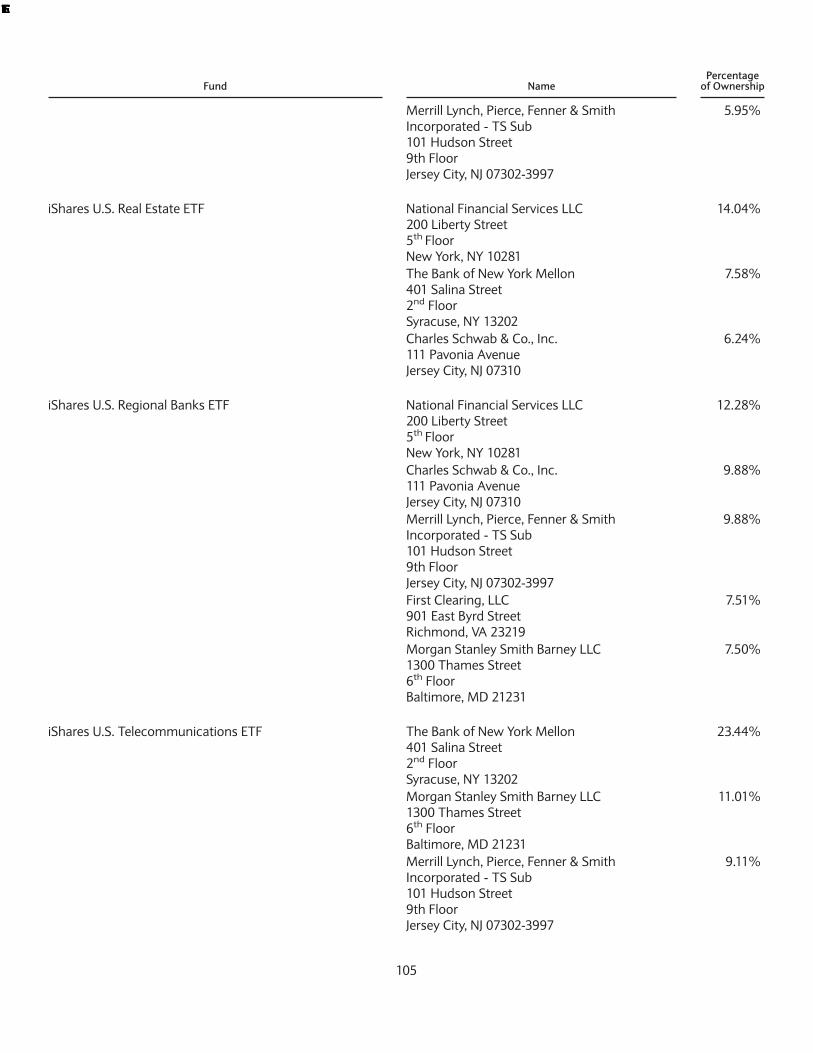
Fund NamePercentage
of Ownership
Merrill Lynch, Pierce, Fenner & SmithIncorporated - TS Sub101 Hudson Street9th FloorJersey City, NJ 07302-3997
5.95%
iShares U.S. Real Estate ETF National Financial Services LLC200 Liberty Street5th FloorNew York, NY 10281
14.04%
The Bank of New York Mellon401 Salina Street2nd FloorSyracuse, NY 13202
7.58%
Charles Schwab & Co., Inc.111 Pavonia AvenueJersey City, NJ 07310
6.24%
iShares U.S. Regional Banks ETF National Financial Services LLC200 Liberty Street5th FloorNew York, NY 10281
12.28%
Charles Schwab & Co., Inc.111 Pavonia AvenueJersey City, NJ 07310
9.88%
Merrill Lynch, Pierce, Fenner & SmithIncorporated - TS Sub101 Hudson Street9th FloorJersey City, NJ 07302-3997
9.88%
First Clearing, LLC901 East Byrd StreetRichmond, VA 23219
7.51%
Morgan Stanley Smith Barney LLC1300 Thames Street6th FloorBaltimore, MD 21231
7.50%
iShares U.S. Telecommunications ETF The Bank of New York Mellon401 Salina Street2nd FloorSyracuse, NY 13202
23.44%
Morgan Stanley Smith Barney LLC1300 Thames Street6th FloorBaltimore, MD 21231
11.01%
Merrill Lynch, Pierce, Fenner & SmithIncorporated - TS Sub101 Hudson Street9th FloorJersey City, NJ 07302-3997
9.11%
105

Fund NamePercentage
of Ownership
Charles Schwab & Co., Inc.111 Pavonia AvenueJersey City, NJ 07310
6.58%
First Clearing, LLC901 East Byrd StreetRichmond, VA 23219
5.90%
Potential Conflicts of Interest. The PNC Financial Services Group, Inc. (“PNC”), through a subsidiary, has a significanteconomic interest in BlackRock, Inc., the parent of BFA, the Funds’ investment adviser. Certain activities of BFA, BlackRock,Inc. and the other subsidiaries of BlackRock, Inc. (collectively referred to in this section as “BlackRock”) and PNC and itssubsidiaries (collectively referred to in this section as the “Entities”), and their respective directors, officers and employees,with respect to the Funds and/or other accounts managed by BlackRock or Entities, may give rise to actual or perceivedconflicts of interest such as those described below.
BlackRock is one of the world’s largest asset management firms. PNC is a diversified financial services organization spanningthe retail, business and corporate markets. BlackRock, PNC and their respective subsidiaries and each of their respectivedirectors, officers and employees, including, in the case of BlackRock, the business units or entities and personnel who maybe involved in the investment activities and business operations of a Fund, are engaged worldwide in businesses, includingmanaging equities, fixed-income securities, cash and alternative investments, and banking and other financial services, andhave interests other than that of managing the Funds. These are considerations of which investors in a Fund should beaware, and which may cause conflicts of interest that could disadvantage a Fund and its shareholders. These businesses andinterests include potential multiple advisory, transactional, financial and other relationships with, or interests in, companiesand interests in securities or other instruments that may be purchased or sold by a Fund.
BlackRock and the Entities have proprietary interests in, and may manage or advise with respect to, accounts or funds(including separate accounts and other funds and collective investment vehicles) that have investment objectives similar tothose of a Fund and/or that engage in transactions in the same types of securities, currencies and instruments as the Fund.BlackRock and Entities are also major participants in the global currency, equities, swap and fixed income markets, in eachcase, for the accounts of clients and, in some cases, on a proprietary basis. As such, BlackRock and Entities are or may beactively engaged in transactions in the same securities, currencies, and instruments in which a Fund invests. Such activitiescould affect the prices and availability of the securities, currencies, and instruments in which a Fund invests, which couldhave an adverse impact on a Fund’s performance. Such transactions, particularly in respect of most proprietary accounts orclient accounts, will be executed independently of a Fund’s transactions and thus at prices or rates that may be more or lessfavorable than those obtained by the Fund.
When BlackRock seeks to purchase or sell the same assets for managed accounts, including a Fund, the assets actuallypurchased or sold may be allocated among the accounts on a basis determined in its good faith discretion to be equitable. Insome cases, this system may adversely affect the size or price of the assets purchased or sold for a Fund. In addition,transactions in investments by one or more other accounts managed by BlackRock or Entities may have the effect of dilutingor otherwise disadvantaging the values, prices or investment strategies of a Fund, particularly, but not limited to, with respectto small-capitalization, emerging market or less liquid strategies. This may occur with respect to BlackRock-advised accountswhen investment decisions regarding a Fund are based on research or other information that is also used to supportdecisions for other accounts. When BlackRock implements a portfolio decision or strategy on behalf of another accountahead of, or contemporaneously with, similar decisions or strategies for a Fund, market impact, liquidity constraints, or otherfactors could result in the Fund receiving less favorable trading results and the costs of implementing such decisions orstrategies could be increased or the Fund could otherwise be disadvantaged. BlackRock may, in certain cases, elect toimplement internal policies and procedures designed to limit such consequences, which may cause a Fund to be unable toengage in certain activities, including purchasing or disposing of securities, when it might otherwise be desirable for it to doso.
Conflicts may also arise because portfolio decisions regarding a Fund may benefit other accounts managed by BlackRock. Forexample, the sale of a long position or establishment of a short position by a Fund may impair the price of the same securitysold short by (and therefore benefit) BlackRock or its other accounts or funds, and the purchase of a security or covering of ashort position in a security by a Fund may increase the price of the same security held by (and therefore benefit) BlackRock or
106

its other accounts or funds. In addition, to the extent permitted by applicable law, certain Funds may invest their assets inother funds advised by BlackRock, including funds that are managed by one or more of the same portfolio managers, whichcould result in conflicts of interest relating to asset allocation, timing of Fund purchases and redemptions, and increasedremuneration and profitability for BlackRock, and/or its personnel, including portfolio managers.
In certain circumstances, BlackRock, on behalf of the Funds, may seek to buy from or sell securities to another fund oraccount advised by BlackRock. BlackRock may (but is not required to) effect purchases and sales between BlackRock clients(“cross trades”), including the Funds, if BlackRock believes such transactions are appropriate based on each party’sinvestment objectives and guidelines, subject to applicable law and regulation. There may be potential conflicts of interest orregulatory issues relating to these transactions which could limit BlackRock’s decision to engage in these transactions for theFunds. BlackRock may have a potentially conflicting division of loyalties and responsibilities to the parties in suchtransactions. On any occasion when a Fund participates in a cross trade, BlackRock will comply with procedures adoptedunder applicable rules and SEC guidance.
BlackRock and the Entities and their respective clients may pursue or enforce rights with respect to an issuer in which a Fundhas invested, and those activities may have an adverse effect on the Fund. As a result, prices, availability, liquidity and termsof the Fund’s investments may be negatively impacted by the activities of BlackRock or the Entities or their respective clients,and transactions for the Fund may be impaired or effected at prices or terms that may be less favorable than would otherwisehave been the case.
The results of a Fund’s investment activities may differ significantly from the results achieved by BlackRock for its proprietaryaccounts or other accounts (including investment companies or collective investment vehicles) which it manages or advises.It is possible that one or more accounts managed or advised by BlackRock and such other accounts will achieve investmentresults that are substantially more or less favorable than the results achieved by a Fund. Moreover, it is possible that a Fundwill sustain losses during periods in which one or more proprietary or other accounts managed or advised by BlackRockachieve significant profits. The opposite result is also possible.
From time to time, a Fund may be restricted from purchasing or selling securities, or from engaging in other investmentactivities because of regulatory, legal or contractual requirements applicable to BlackRock or one or more Entities or otheraccounts managed or advised by BlackRock or an Entity for clients worldwide, and/or the internal policies of BlackRock andthe Entities designed to comply with such requirements. As a result, there may be periods, for example, when BlackRock willnot initiate or recommend certain types of transactions in certain securities or instruments with respect to which BlackRockand/or one or more Entities are performing services or when position limits have been reached. For example, the investmentactivities of BlackRock or one or more Entities for their proprietary accounts and accounts under their management may limitthe investment opportunities for a Fund in certain emerging and other markets in which limitations are imposed upon theamount of investment, in the aggregate or in individual issuers, by affiliated foreign investors.
In connection with its management of a Fund, BlackRock may have access to certain fundamental analysis and proprietarytechnical models developed by BlackRock. BlackRock will not be under any obligation, however, to effect transactions onbehalf of a Fund in accordance with such analysis and models. In addition, BlackRock will not have any obligation to makeavailable any information regarding their proprietary activities or strategies, or the activities or strategies used for otheraccounts managed by them, for the benefit of the management of a Fund and it is not anticipated that BlackRock will haveaccess to such information for the purpose of managing the Fund. The proprietary activities or portfolio strategies ofBlackRock, or the activities or strategies used for accounts managed by BlackRock or other client accounts could conflictwith the transactions and strategies employed by BlackRock in managing a Fund.
The Funds may be included in investment models developed by BlackRock for use by clients and financial advisors. To theextent clients invest in these investment models and increase the assets under management of the Funds, the investmentmanagement fee amounts paid by the Funds to BlackRock may also increase. The price, availability and liquidity of a Fundmay be impacted by purchases and redemptions of the Fund by model-driven investment portfolios.
In addition, certain principals and certain employees of a Fund’s investment adviser are also principals or employees of otherbusiness units or entities within BlackRock. As a result, these principals and employees may have obligations to such otherbusiness units or entities or their clients and such obligations to other business units or entities or their clients may be aconsideration of which investors in a Fund should be aware.
107

BlackRock may enter into transactions and invest in securities, instruments and currencies on behalf of a Fund in whichclients of BlackRock or an Entity, or, to the extent permitted by the SEC and applicable law, BlackRock or an Entity, serves asthe counterparty, principal or issuer. In such cases, such party’s interests in the transaction will be adverse to the interests ofthe Fund, and such party may have no incentive to assure that the Fund obtains the best possible prices or terms inconnection with the transactions. In addition, the purchase, holding and sale of such investments by a Fund may enhancethe profitability of BlackRock or an Entity.
BlackRock or one or more Entities may also create, write or issue derivatives for their clients, the underlying securities,currencies or instruments in which a Fund may invest or which may be based on the performance of the Fund. BlackRock hasentered into an arrangement with Markit Indices Limited, the index provider for underlying fixed-income indexes used bycertain iShares funds, related to derivative fixed-income products that are based on such iShares funds. BlackRock willreceive certain payments for licensing intellectual property belonging to BlackRock and for facilitating the provision of data inconnection with such derivative products, which may include payments based on the trading volumes of, or revenuesgenerated by, the derivative products. Other funds and accounts managed by BlackRock may from time to time transact insuch derivative products, which could contribute to the viability of such derivative products by making them more appealingto funds and accounts managed by third parties, and in turn lead to increased payments to BlackRock. Trading activity insuch derivative products could also potentially lead to increased purchase activity with respect to these iShares funds andincreased assets under management for BlackRock.
A Fund may, subject to applicable law, purchase investments that are the subject of an underwriting or other distribution byBlackRock or one or more Entities and may also enter into transactions with other clients of BlackRock or an Entity wheresuch other clients have interests adverse to those of the Fund.
At times, these activities may cause business units or entities within BlackRock or an Entity to give advice to clients that maycause these clients to take actions adverse to the interests of a Fund. To the extent such transactions are permitted, a Fundwill deal with BlackRock and/or Entities on an arm’s-length basis.
To the extent authorized by applicable law, BlackRock or one or more Entities may act as broker, dealer, agent, lender oradviser or in other commercial capacities for a Fund. It is anticipated that the commissions, mark-ups, mark-downs, financialadvisory fees, underwriting and placement fees, sales fees, financing and commitment fees, brokerage fees, other fees,compensation or profits, rates, terms and conditions charged by BlackRock or an Entity will be in its view commerciallyreasonable, although BlackRock and each Entity, including its sales personnel, will have an interest in obtaining fees and otheramounts that are favorable to BlackRock or the Entity and such sales personnel, which may have an adverse effect on theFunds. Index based funds also may use an index provider that is affiliated with another service provider of the Fund orBlackRock that acts as a broker, dealer, agent, lender or in other commercial capacities for a Fund or BlackRock.
Subject to applicable law, BlackRock and the Entities (and their personnel and other distributors) will be entitled to retain feesand other amounts that they receive in connection with their service to the Funds as broker, dealer, agent, lender, adviser orin other commercial capacities. No accounting to the Funds or their shareholders will be required, and no fees or othercompensation payable by the Funds or their shareholders will be reduced by reason of receipt by BlackRock or an Entity ofany such fees or other amounts.
When BlackRock or an Entity acts as broker, dealer, agent, adviser or in other commercial capacities in relation to the Funds,BlackRock or the Entity may take commercial steps in its own interests, which may have an adverse effect on the Funds. AFund will be required to establish business relationships with its counterparties based on the Fund’s own credit standing.BlackRock will not have any obligation to allow its credit to be used in connection with a Fund’s establishment of its businessrelationships, nor is it expected that the Fund’s counterparties will rely on the credit of BlackRock in evaluating the Fund’screditworthiness.
BTC, an affiliate of BFA pursuant to SEC exemptive relief, acts as securities lending agent to, and receives a share of securitieslending revenues from, the Funds. BlackRock will also receive compensation for managing the reinvestment of the cashcollateral from securities lending. There are potential conflicts of interests in managing a securities lending program,including but not limited to: (i) BlackRock as securities lending agent may have an incentive to increase or decrease theamount of securities on loan or to lend particular securities in order to generate additional risk-adjusted revenue forBlackRock and its affiliates; and (ii) BlackRock as securities lending agent may have an incentive to allocate loans to clientsthat would provide more revenue to BlackRock. As described further below, BlackRock seeks to mitigate this conflict byproviding its securities lending clients with equal lending opportunities over time in order to approximate pro-rata allocation.
108

As part of its securities lending program, BlackRock indemnifies certain clients and/or funds against a shortfall in collateral inthe event of borrower default. BlackRock’s RQA calculates, on a regular basis, BlackRock’s potential dollar exposure to the riskof collateral shortfall upon counterparty default (“shortfall risk”) under the securities lending program for both indemnifiedand non-indemnified clients. On a periodic basis, RQA also determines the maximum amount of potential indemnifiedshortfall risk arising from securities lending activities (“indemnification exposure limit”) and the maximum amount ofcounterparty-specific credit exposure (“credit limits”) BlackRock is willing to assume as well as the program’s operationalcomplexity. RQA oversees the risk model that calculates projected shortfall values using loan-level factors such as loan andcollateral type and market value as well as specific borrower counterparty credit characteristics. When necessary, RQA mayfurther adjust other securities lending program attributes by restricting eligible collateral or reducing counterparty creditlimits. As a result, the management of the indemnification exposure limit may affect the amount of securities lending activityBlackRock may conduct at any given point in time and impact indemnified and non-indemnified clients by reducing thevolume of lending opportunities for certain loans (including by asset type, collateral type and/or revenue profile).
BlackRock uses a predetermined systematic process in order to approximate pro-rata allocation over time. In order to allocatea loan to a portfolio: (i) BlackRock as a whole must have sufficient lending capacity pursuant to the various program limits(i.e., indemnification exposure limit and counterparty credit limits); (ii) the lending portfolio must hold the asset at the time aloan opportunity arrives; and (iii) the lending portfolio must also have enough inventory, either on its own or whenaggregated with other portfolios into one single market delivery, to satisfy the loan request. In doing so, BlackRock seeks toprovide equal lending opportunities for all portfolios, independent of whether BlackRock indemnifies the portfolio. Equalopportunities for lending portfolios does not guarantee equal outcomes. Specifically, short and long-term outcomes forindividual clients may vary due to asset mix, asset/liability spreads on different securities, and the overall limits imposed bythe firm.
Purchases and sales of securities and other assets for a Fund may be bunched or aggregated with orders for other BlackRockclient accounts, including with accounts that pay different transaction costs solely due to the fact that they have differentresearch payment arrangements. BlackRock, however, is not required to bunch or aggregate orders if portfolio managementdecisions for different accounts are made separately, or if they determine that bunching or aggregating is not practicable orrequired, or in cases involving client direction.
Prevailing trading activity frequently may make impossible the receipt of the same price or execution on the entire volume ofsecurities purchased or sold. When this occurs, the various prices may be averaged, and the Funds will be charged orcredited with the average price. Thus, the effect of the aggregation may operate on some occasions to the disadvantage ofthe Funds. In addition, under certain circumstances, the Funds will not be charged the same commission or commissionequivalent rates in connection with a bunched or aggregated order.
Subject to applicable law, BlackRock may select brokers (including, without limitation, certain Entities) that furnishBlackRock, the Funds, other BlackRock client accounts or personnel, directly or through correspondent relationships, withresearch or other appropriate services which provide, in BlackRock’s view, appropriate assistance to BlackRock in theinvestment decision-making process (including with respect to futures, fixed-price offerings and OTC transactions). Suchresearch or other services may include, to the extent permitted by law, research reports on companies, industries andsecurities; economic and financial data; financial publications; proxy analysis; trade industry seminars; computer data bases;research-oriented software and other services and products. Research or other services obtained in this manner may be usedin servicing any or all of the Funds and other BlackRock client accounts, including in connection with BlackRock clientaccounts other than those that pay commissions to the broker relating to the research or other service arrangements. Suchproducts and services may disproportionately benefit other BlackRock client accounts relative to the Funds based on theamount of brokerage commissions paid by the Funds and such other BlackRock client accounts. For example, research orother services that are paid for through one client’s commissions may not be used in managing that client’s account. Inaddition, other BlackRock client accounts may receive the benefit, including disproportionate benefits, of economies of scaleor price discounts in connection with products and services that may be provided to the Funds and to such other BlackRockclient accounts. To the extent that BlackRock uses soft dollars, it will not have to pay for those products and services itself.
BlackRock does not currently enter into arrangements to use the Funds’ assets for, or participate in, soft dollars, althoughBlackRock may receive research that is bundled with the trade execution, clearing, and/or settlement services provided by aparticular broker-dealer. To the extent that BlackRock receives research on this basis, many of the same conflicts related totraditional soft dollars may exist. For example, the research effectively will be paid by client commissions that also will beused to pay for the execution, clearing, and settlement services provided by the broker-dealer and will not be paid by
109

BlackRock. BlackRock, unless prohibited by applicable law, may endeavor to execute trades through brokers who, pursuant tosuch arrangements, provide research or other services in order to ensure the continued receipt of research or other servicesBlackRock believes are useful in its investment decision-making process. BlackRock may from time to time choose not toengage in the above described arrangements to varying degrees. BlackRock, unless prohibited by applicable law, may alsoenter into commission sharing arrangements under which BlackRock may execute transactions through a broker-dealer,including, where permitted, an Entity, and request that the broker-dealer allocate a portion of the commissions orcommission credits to another firm that provides research to BlackRock. To the extent that BlackRock engages incommission sharing arrangements, many of the same conflicts related to traditional soft dollars may exist.
BlackRock may utilize certain electronic crossing networks (“ECNs”) (including, without limitation, ECNs in which BlackRockor an Entity has an investment or other interest, to the extent permitted by applicable law) in executing client securitiestransactions for certain types of securities. These ECNs may charge fees for their services, including access fees andtransaction fees. The transaction fees, which are similar to commissions or markups/markdowns, will generally be chargedto clients and, like commissions and markups/markdowns, would generally be included in the cost of the securitiespurchased. Access fees may be paid by BlackRock even though incurred in connection with executing transactions on behalfof clients, including the Funds. In certain circumstances, ECNs may offer volume discounts that will reduce the access feestypically paid by BlackRock. BlackRock will only utilize ECNs consistent with its obligation to seek to obtain best execution inclient transactions.
BlackRock has adopted policies and procedures designed to prevent conflicts of interest from influencing proxy votingdecisions that it makes on behalf of advisory clients, including the Funds, and to help ensure that such decisions are made inaccordance with BlackRock’s fiduciary obligations to its clients. Nevertheless, notwithstanding such proxy voting policies andprocedures, actual proxy voting decisions of BlackRock may have the effect of favoring the interests of other clients orbusinesses of other divisions or units of BlackRock and/or an Entity, provided that BlackRock believes such voting decisionsto be in accordance with its fiduciary obligations. For a more detailed discussion of these policies and procedures, see theProxy Voting Policy section of this SAI.
It is also possible that, from time to time, BlackRock or an Entity may, subject to compliance with applicable law, purchaseand hold shares of a Fund. Increasing a Fund’s assets may enhance liquidity, investment flexibility and diversification and maycontribute to economies of scale that tend to reduce the Fund’s expense ratio. BlackRock and the Entities reserve the right,subject to compliance with applicable law, to sell into the market or redeem in Creation Units through an AuthorizedParticipant at any time some or all of the shares of a Fund acquired for their own accounts. A large sale or redemption ofshares of a Fund by BlackRock or an Entity could significantly reduce the asset size of the Fund, which might have an adverseeffect on the Fund’s liquidity, investment flexibility, portfolio diversification, expense ratio or ability to comply with the listingrequirements for the Fund. BlackRock seeks to consider the effect of redemptions on a Fund and other shareholders indeciding whether to redeem its shares but is not obligated to do so and may elect not to do so.
It is possible that a Fund may invest in securities of, or engage in transactions with, companies with which an Entity hasdeveloped or is trying to develop investment banking relationships as well as securities of entities in which BlackRock or anEntity has significant debt or equity investments or other interests or in which an Entity makes a market. A Fund may alsoinvest in issuances (such as structured notes) by entities for which BlackRock provides and is compensated for cashmanagement services relating to the proceeds from the sale of such issuances. A Fund also may invest in securities of, orengage in transactions with, companies to which an Entity provides or may in the future provide research coverage. Suchinvestments or transactions could cause conflicts between the interests of a Fund and the interests of BlackRock, otherclients of BlackRock or an Entity. In making investment decisions for a Fund, BlackRock is not permitted to obtain or usematerial non-public information acquired by any unit of BlackRock in the course of these activities. In addition, from time totime, the activities of BlackRock or an Entity may limit a Fund’s flexibility in purchases and sales of securities. When an Entityis engaged in an underwriting or other distribution of securities of an entity, BlackRock may be prohibited from purchasing orrecommending the purchase of certain securities of that entity for a Fund. As indicated below, BlackRock or an Entity mayengage in transactions with companies in which BlackRock-advised funds or other clients of BlackRock or of an Entity havean investment.
BlackRock and Chubb Limited (“Chubb”), a public company whose securities are held by BlackRock-advised funds and otheraccounts, partially funded the creation of a re-insurance company (“Re Co”) pursuant to which each has approximately a9.9% ownership interest and each has representation on the board of directors. Certain employees and executives ofBlackRock have a less than ½ of 1% ownership interest in Re Co. BlackRock manages the investment portfolio of Re Co,
110

which is held in a wholly-owned subsidiary. Re Co participates as a reinsurer with reinsurance contracts underwritten bysubsidiaries of Chubb. An independent director of certain BlackRock-advised funds also serves as an independent director ofChubb and has no interest or involvement in the Re Co transaction.
BlackRock and the Entities, their personnel and other financial service providers may have interests in promoting sales of theFunds. With respect to BlackRock and the Entities and their personnel, the remuneration and profitability relating to servicesto and sales of the Funds or other products may be greater than remuneration and profitability relating to services to andsales of certain funds or other products that might be provided or offered. BlackRock and the Entities and their salespersonnel may directly or indirectly receive a portion of the fees and commissions charged to the Funds or theirshareholders. BlackRock and its advisory or other personnel may also benefit from increased amounts of assets undermanagement. Fees and commissions may also be higher than for other products or services, and the remuneration andprofitability to BlackRock or the Entities and such personnel resulting from transactions on behalf of or management of theFunds may be greater than the remuneration and profitability resulting from other funds or products.
Third parties, including service providers to BlackRock or a Fund, may sponsor events (including, but not limited to,marketing and promotional activities and presentations, educational training programs and conferences) for registeredrepresentatives, other professionals and individual investors. There is a potential conflict of interest as such sponsorshipsmay defray the costs of such activities to BlackRock, and may provide an incentive to BlackRock to retain such third parties toprovide services to a Fund.
BlackRock may provide valuation assistance to certain clients with respect to certain securities or other investments and thevaluation recommendations made for such clients’ accounts may differ from the valuations for the same securities orinvestments assigned by a Fund’s pricing vendors, especially if such valuations are based on broker-dealer quotes or otherdata sources unavailable to the Fund’s pricing vendors. While BlackRock will generally communicate its valuation informationor determinations to a Fund’s pricing vendors and/or fund accountants, there may be instances where the Fund’s pricingvendors or fund accountants assign a different valuation to a security or other investment than the valuation for suchsecurity or investment determined or recommended by BlackRock.
As disclosed in more detail in the Determination of Net Asset Value section of each Fund’s Prospectus and this SAI, whenmarket quotations are not readily available or are believed by BlackRock to be unreliable, a Fund’s investments are valued atfair value by BlackRock in accordance with procedures adopted by the Board. When determining “fair value price,” BlackRockseeks to determine the price that a Fund might reasonably expect to receive from the current sale of that asset or liability inan arm’s-length transaction. The price generally may not be determined based on what a Fund might reasonably expect toreceive for selling an asset or liability at a later time or if it holds the asset or liability to maturity. While fair valuedeterminations will be based upon all available factors that BlackRock deems relevant at the time of the determination, andmay be based on analytical values determined by BlackRock using proprietary or third-party valuation models, fair valuerepresents only a good faith approximation of the value of an asset or liability. The fair value of one or more assets orliabilities may not, in retrospect, be the price at which those assets or liabilities could have been sold during the period inwhich the particular fair values were used in determining a Fund’s net asset value. As a result, a Fund’s sale or redemption ofits shares at net asset value, at a time when a holding or holdings are valued by BlackRock (pursuant to Board-adoptedprocedures) at fair value, may have the effect of diluting or increasing the economic interest of existing shareholders and mayaffect the amount of revenue received by BlackRock with respect to services for which it receives an asset-based fee.
To the extent permitted by applicable law, a Fund may invest all or some of its short-term cash investments in any moneymarket fund or similarly-managed private fund advised or managed by BlackRock. In connection with any such investments,a Fund, to the extent permitted by the 1940 Act, may pay its share of expenses of a money market fund or other similarly-managed private fund in which it invests, which may result in a Fund bearing some additional expenses.
BlackRock and its directors, officers and employees, may buy and sell securities or other investments for their own accountsand may have conflicts of interest with respect to investments made on behalf of a Fund. As a result of differing trading andinvestment strategies or constraints, positions may be taken by directors, officers and employees that are the same, differentfrom or made at different times than positions taken for the Fund. To lessen the possibility that a Fund will be adverselyaffected by this personal trading, each Fund, BFA and BlackRock have each adopted a code of ethics in compliance withSection 17(j) of the 1940 Act that restricts securities trading in the personal accounts of investment professionals and otherswho normally come into possession of information regarding a Fund’s portfolio transactions. Each code of ethics is available
111
by contacting BlackRock or by accessing the EDGAR Database on the SEC’s Internet site at http://www.sec.gov, and copiesmay be obtained, after paying a duplicating fee, by e-mail at [email protected].
BlackRock will not purchase securities or other property from, or sell securities or other property to, a Fund, except that aFund may in accordance with rules or guidance adopted under the 1940 Act engage in transactions with accounts that areaffiliated with a Fund as a result of common officers, directors, or investment advisers or pursuant to exemptive ordersgranted to the Funds and/or BlackRock by the SEC. These transactions would be effected in circumstances in whichBlackRock determined that it would be appropriate for a Fund to purchase and another client of BlackRock to sell, or a Fundto sell and another client of BlackRock to purchase, the same security or instrument on the same day. From time to time, theactivities of a Fund may be restricted because of regulatory requirements applicable to BlackRock and/or BlackRock’s internalpolicies designed to comply with, limit the applicability of, or otherwise relate to such requirements. A client not advised byBlackRock would not be subject to some of those considerations. There may be periods when BlackRock may not initiate orrecommend certain types of transactions, or may otherwise restrict or limit their advice in certain securities or instrumentsissued by or related to companies for which BlackRock or an Entity is performing investment banking, market making,advisory or other services or has proprietary positions. For example, when BlackRock is engaged to provide advisory or riskmanagement services for a company, BlackRock may be prohibited from or limited in purchasing or selling securities of thatcompany on behalf of a Fund, particularly where such services result in BlackRock obtaining material non-public informationabout the company (e.g., in connection with participation in a creditors’ committee). Similar situations could arise ifpersonnel of BlackRock serve as directors of companies the securities of which a Fund wishes to purchase or sell. However, ifpermitted by applicable law, and where consistent with BlackRock’s policies and procedures (including the necessaryimplementation of appropriate information barriers), the Funds may purchase securities or instruments that are issued bysuch companies, are the subject of an underwriting, distribution or advisory assignment by an Entity, or are the subject of anadvisory or risk management assignment by BlackRock, or where personnel of BlackRock are directors or officers of theissuer.
The investment activities of BlackRock for their proprietary accounts and for client accounts may also limit the investmentstrategies and rights of the Funds. For example, in certain circumstances where the Funds invest in securities issued bycompanies that operate in certain regulated industries or in certain emerging or international markets, or are subject tocorporate or regulatory ownership restrictions, or invest in certain futures or other derivative transactions, there may be limitson the aggregate amount invested by BlackRock for their proprietary accounts and for client accounts (including the Funds)that may not be exceeded without the grant of a license or other regulatory or corporate consent or, if exceeded, may causeBlackRock, the Funds or other client accounts to suffer disadvantages or business restrictions.
If certain aggregate ownership thresholds are reached either through the actions of BlackRock or a Fund or as a result ofthird-party transactions, the ability of BlackRock, on behalf of clients (including the Funds), to purchase or dispose ofinvestments, or exercise rights or undertake business transactions, may be restricted by regulation or otherwise impaired. Asa result, BlackRock, on behalf of its clients (including the Funds), may limit purchases, sell existing investments, or otherwiserestrict, forgo or limit the exercise of rights (including transferring, outsourcing or limiting voting rights or forgoing the rightto receive dividends) when BlackRock, in its sole discretion, deems it appropriate in light of potential regulatory or otherrestrictions on ownership or other consequences resulting from reaching investment thresholds.
In those circumstances where ownership thresholds or limitations must be observed, BlackRock seeks to allocate limitedinvestment opportunities equitably among clients (including the Funds), taking into consideration benchmark weight andinvestment strategy. BlackRock has adopted certain controls designed to prevent the occurrence of a breach of anyapplicable ownership threshold or limits, including, for example, when ownership in certain securities nears an applicablethreshold, BlackRock may remove such securities from the list of Deposit Securities to be delivered to the Fund in connectionwith purchases of Creation Units of such Fund and may limit purchases in such securities to the issuer’s weighting in theapplicable benchmark used by BlackRock to manage such Fund. If client (including Fund) holdings of an issuer exceed anapplicable threshold and BlackRock is unable to obtain relief to enable the continued holding of such investments, it may benecessary to sell down these positions to meet the applicable limitations. In these cases, benchmark overweight positionswill be sold prior to benchmark positions being reduced to meet applicable limitations.
In addition to the foregoing, other ownership thresholds may trigger reporting requirements to governmental and regulatoryauthorities, and such reports may entail the disclosure of the identity of a client or BlackRock’s intended strategy with respectto such security or asset.
112

BlackRock may not serve as an Authorized Participant in the creation and redemption of iShares ETFs.
BlackRock may maintain securities indices. To the extent permitted by applicable laws, the Funds may seek to license and usesuch indices as part of their investment strategy. Index based funds that seek to track the performance of securities indicesalso may use the name of the index or index provider in the fund name. Index providers, including BlackRock (to the extentpermitted by applicable law), may be paid licensing fees for use of their index or index name. BlackRock may benefit from theFunds using BlackRock indices by creating increasing acceptance in the marketplace for such indices. BlackRock is notobligated to license its indices to any Fund and the Funds are under no obligation to use BlackRock indices. Any Fund thatenters into a license for a BlackRock index cannot be assured that the terms of any index licensing agreement with BlackRockwill be as favorable as those terms offered to other licensees.
The custody arrangement described in “Investment Advisory, Administrative and Distribution Services” may lead to potentialconflicts of interest with BlackRock where BlackRock has agreed to waive fees and/or reimburse ordinary operating expensesin order to cap expenses of the Funds (or where BlackRock charges a unitary management fee). This is because the custodyarrangements with certain Funds’ custodian may have the effect of reducing custody fees when the Funds leave cashbalances uninvested. This could be viewed as having the potential to provide BlackRock an incentive to keep high positivecash balances for the Funds in order to offset fund custody fees that BlackRock might otherwise reimburse or pay. However,BlackRock’s portfolio managers do not intentionally keep uninvested balances high, but rather make investment decisionsthat they anticipate will be beneficial to fund performance. For funds without a unitary management fee, when a fund’sactual operating expense ratio exceeds a stated cap, a reduction in custody fees reduces the amount of waivers and/orreimbursements BlackRock would be required to make to the fund.
BlackRock may enter into contractual arrangements with third-party service providers to a Fund (e.g., custodians,administrators and index providers) pursuant to which BlackRock receives fee discounts or concessions in recognition ofBlackRock’s overall relationship with such service providers. To the extent that BlackRock is responsible for paying theseservice providers out of its management fee, the benefits of any such fee discounts or concessions may accrue, in whole or inpart, to BlackRock.
BlackRock owns or has an ownership interest in certain trading, portfolio management, operations and/or informationsystems used by Fund service providers. These systems are, or will be, used by a Fund service provider in connection with theprovision of services to accounts managed by BlackRock and funds managed and sponsored by BlackRock, including theFunds, that engage the service provider (typically the custodian). A Fund’s service provider remunerates BlackRock for theuse of the systems. A Fund service provider’s payments to BlackRock for the use of these systems may enhance theprofitability of BlackRock.
BlackRock has entered into an arrangement with Intercontinental Exchange, Inc. (“ICE”) to be one of ICE’s developmentpartners in connection with ICE’s intention to launch a new open-architecture, centralized industry platform to facilitatecreation and redemption orders for ETFs (the “ICE Platform”). As a development partner, BlackRock has licensed certain of itsintellectual property to ICE. Once the ICE Platform is launched, BlackRock intends to use the ICE Platform to facilitatecreations and redemptions in the Funds and certain other services provided by the ICE Platform. BlackRock may have anincentive to promote the broad adoption of the ICE Platform by the ETF marketplace because BlackRock will earn a fee, basedon the total revenues earned by the ICE Platform, for licensing BlackRock’s intellectual property to ICE and for BlackRock’srole as development partner. ICE Data Services, the underlying index provider for certain of the Funds, is a wholly ownedsubsidiary of ICE.
BlackRock’s receipt of fees from a service provider in connection with the use of systems provided by BlackRock may createan incentive for BlackRock to recommend that a Fund enter into or renew an arrangement with the service provider.
A Fund from time to time may purchase in the secondary market (i) certain mortgage pass-through securities packaged andmaster serviced by PNC Mortgage Securities Corp. (“PNC Mortgage”) or Midland Loan Services, Inc. (“Midland”), or (ii)mortgage-related securities containing loans or mortgages originated by PNC Bank, National Association (“PNC Bank”) or itsaffiliates. It is possible that under some circumstances, PNC Mortgage, Midland or other affiliates could have interests thatare in conflict with the holders of these mortgage-backed securities, and such holders could have rights against PNCMortgage, Midland or their affiliates. For example, if PNC Mortgage, Midland or their affiliates engaged in negligence orwillful misconduct in carrying out its duties as a master servicer, then any holder of the mortgage-backed security could seekrecourse against PNC Mortgage, Midland or their affiliates, as applicable. Also, as a master servicer, PNC Mortgage, Midlandor their affiliates may make certain representations and warranties regarding the quality of the mortgages and properties
113

underlying a mortgage-backed security. If one or more of those representations or warranties is false, then the holders of themortgage backed securities could trigger an obligation of PNC Mortgage, Midland or their affiliates, as applicable, torepurchase the mortgages from the issuing trust. Finally, PNC Mortgage, Midland or their affiliates may own securities thatare subordinate to the senior mortgage-backed securities owned by a Fund.
Present and future activities of BlackRock (including BFA) and the Entities and their respective directors, officers andemployees, in addition to those described in this section, may give rise to additional conflicts of interest.
Legal Proceedings. On June 16, 2016, investors (the “Plaintiffs”) in certain iShares funds (iShares Core S&P Small-Cap ETF,iShares Russell 1000 Growth ETF, iShares Core S&P 500 ETF, iShares Preferred and Income Securities ETF, iShares RussellMid-Cap Growth ETF, iShares Russell Mid-Cap ETF, iShares Russell Mid-Cap Value ETF, iShares Select Dividend ETF, iSharesMorningstar Mid-Cap ETF, iShares Morningstar Large-Cap ETF and iShares U.S. Aerospace & Defense ETF) filed a putativeclass action lawsuit against the Trust, BlackRock, Inc. and certain of its advisory affiliates, and certain directors/trustees andofficers of the Trust (collectively, “Defendants”) in California State Court. The lawsuit alleges the Defendants violated federalsecurities laws by failing to adequately disclose in the prospectuses issued by the funds noted above the risks of using stop-loss orders in the event of a “flash crash,” such as the one that occurred on May 6, 2010. On September 18, 2017, the courtissued a Statement of Decision holding that the Plaintiffs lack standing to assert their claims. On October 11, 2017, the courtentered final judgment dismissing all of Plaintiffs’ claims with prejudice. Plaintiffs have appealed the court’s decision.
Investment Advisory, Administrative andDistribution ServicesInvestment Adviser. BFA serves as investment adviser to each Fund pursuant to an investment advisory agreement betweenthe Trust, on behalf of each Fund, and BFA. BFA is a California corporation indirectly owned by BlackRock, Inc. and isregistered as an investment adviser under the Investment Advisers Act of 1940, as amended. Under the investment advisoryagreement, BFA, subject to the supervision of the Board and in conformity with the stated investment policies of each Fund,manages and administers the Trust and the investment of each Fund’s assets. BFA is responsible for placing purchase andsale orders and providing continuous supervision of the investment portfolio of each Fund.
Pursuant to the investment advisory agreement, BFA may, from time to time, in its sole discretion and to the extent permittedby applicable law, appoint one or more sub-advisers, including, without limitation, affiliates of BFA, to perform investmentadvisory or other services with respect to a Fund. In addition, BFA may delegate certain of its investment advisory functionsunder the investment advisory agreement to one or more of its affiliates to the extent permitted by applicable law. BFA mayterminate any or all sub-advisers or such delegation arrangements in its sole discretion upon appropriate notice at any timeto the extent permitted by applicable law.
BFA is responsible, under the investment advisory agreement, for substantially all expenses of the Funds, including the costof transfer agency, custody, fund administration, legal, audit and other services. BFA is not responsible for, and the Funds willbear, the management fees, interest expenses, taxes, expenses incurred with respect to the acquisition and disposition ofportfolio securities and the execution of portfolio transactions, including brokerage commissions, distribution fees orexpenses, litigation expenses and any extraordinary expenses (as determined by a majority of the Independent Trustees).
The following describes the calculation of the management fee for each Fund whose management fee is subject tobreakpoints. The management fee for all Funds is set forth in the table that follows the description of breakpoints.
For its investment advisory services to the iShares U.S. Aerospace & Defense ETF, iShares U.S. Broker-Dealers & SecuritiesExchanges ETF, iShares U.S. Healthcare Providers ETF, iShares U.S. Home Construction ETF, iShares U.S. Insurance ETF,iShares U.S. Medical Devices ETF, iShares U.S. Oil & Gas Exploration & Production ETF, iShares U.S. Oil Equipment & ServicesETF, iShares U.S. Pharmaceuticals ETF, iShares U.S. Real Estate ETF, iShares U.S. Regional Banks ETF and iShares U.S.Telecommunications ETF, BFA is paid a management fee from each Fund corresponding to the Fund’s allocable portion ofthe aggregate management fee calculated based on the aggregate average daily net assets of the following iShares funds:iShares Transportation Average ETF, iShares U.S. Aerospace & Defense ETF, iShares U.S. Basic Materials ETF, iShares U.S.Broker-Dealers & Securities Exchanges ETF, iShares U.S. Consumer Goods ETF, iShares U.S. Consumer Services ETF, iSharesU.S. Energy ETF, iShares U.S. Financial Services ETF, iShares U.S. Financials ETF, iShares U.S. Healthcare ETF, iShares U.S.Healthcare Providers ETF, iShares U.S. Home Construction ETF, iShares U.S. Industrials ETF, iShares U.S. Insurance ETF,
114

iShares U.S. Medical Devices ETF, iShares U.S. Oil & Gas Exploration & Production ETF, iShares U.S. Oil Equipment & ServicesETF, iShares U.S. Pharmaceuticals ETF, iShares U.S. Real Estate ETF, iShares U.S. Regional Banks ETF, iShares U.S. TechnologyETF, iShares U.S. Telecommunications ETF and iShares U.S. Utilities ETF. The aggregate management fee is calculated asfollows: 0.48% per annum of the aggregate net assets less than or equal to $10.0 billion, plus 0.43% per annum of theaggregate net assets over $10.0 billion, up to and including $20.0 billion, plus 0.38% per annum of the aggregate net assetsover $20.0 billion, up to and including $30.0 billion, plus 0.34% per annum of the aggregate net assets over $30.0 billion, upto and including $40.0 billion, plus 0.33% per annum of the aggregate net assets over $40.0 billion, up to and including$50.0 billion, plus 0.31% per annum of the aggregate net assets in excess of $50.0 billion.
Effective June 29, 2018, for its investment advisory services to the iShares Europe ETF, BFA is paid a management fee from theFund calculated based on the aggregate average daily net assets of the following iShares funds: iShares Europe ETF, iSharesInternational Select Dividend ETF and iShares MSCI EAFE Small-Cap ETF. The management fee for the Fund equals the ratioof the Fund’s net assets over the aggregate net assets of the above iShares funds multiplied by the amount calculated asfollows: 0.6000% per annum of the aggregate net assets less than or equal to $12.0 billion, plus 0.5700% per annum of theaggregate net assets over $12.0 billion, up to and including $18.0 billion, plus 0.5415% per annum of the aggregate netassets over $18.0 billion, up to an including $24.0 billion, plus 0.5145% per annum of the aggregate net assets over $24.0billion, up to and including $30.0 billion, plus 0.4888% per annum of the aggregate net assets in excess of $30.0 billion.
For its investment advisory services to the iShares Expanded Tech Sector ETF, iShares Expanded Tech-Software Sector ETF,iShares Global Clean Energy ETF, iShares Global Comm Services ETF, iShares Global Consumer Discretionary ETF, iSharesGlobal Consumer Staples ETF, iShares Global Energy ETF, iShares Global Financials ETF, iShares Global Industrials ETF, iSharesGlobal Infrastructure ETF, iShares Global Utilities ETF, iShares North American Natural Resources ETF, iShares North AmericanTech-Multimedia Networking ETF and iShares PHLX Semiconductor ETF, BFA is paid a management fee from each Fundcorresponding to the Fund’s allocable portion of an aggregate management fee calculated based on the aggregate averagedaily net assets of the following iShares funds: iShares Expanded Tech Sector ETF, iShares Expanded Tech-Software SectorETF, iShares Global Clean Energy ETF, iShares Global Comm Services ETF, iShares Global Consumer Discretionary ETF, iSharesGlobal Consumer Staples ETF, iShares Global Energy ETF, iShares Global Financials ETF, iShares Global Healthcare ETF, iSharesGlobal Industrials ETF, iShares Global Infrastructure ETF, iShares Global Materials ETF, iShares Global Tech ETF, iShares GlobalTimber & Forestry ETF, iShares Global Utilities ETF, iShares North American Natural Resources ETF, iShares North AmericanTech-Multimedia Networking ETF and iShares PHLX Semiconductor ETF. The aggregate management fee for the iSharesfunds listed above is calculated as follows: 0.48% per annum of the aggregate net assets of those Funds less than or equal to$10.0 billion, plus 0.43% per annum of the aggregate net assets over $10.0 billion, up to and including $20.0 billion, plus0.38% per annum of the aggregate net assets in excess of $20.0 billion.
For its investment advisory services to the iShares Preferred and Income Securities ETF, iShares Russell 2000 ETF, iSharesRussell 2000 Growth ETF and iShares Russell 2000 Value ETF, BFA is paid a management fee from each Fund calculatedbased on the aggregate average daily net assets of the following iShares funds: iShares Latin America 40 ETF, iShares MSCIPacific ex Japan ETF, iShares Preferred and Income Securities ETF, iShares Russell 2000 ETF, iShares Russell 2000 Growth ETF,iShares Russell 2000 Value ETF and iShares Select Dividend ETF. The management fee for the iShares Russell 2000 ETF equalsthe ratio of the Fund’s net assets over the aggregate net assets of the above iShares funds multiplied by the amountcalculated as follows: 0.2000% per annum of the aggregate net assets less than or equal to $46.0 billion, plus 0.1900% perannum of the aggregate net assets over $46.0 billion, up to and including $81.0 billion, plus 0.1805% per annum of theaggregate net assets over $81.0 billion, up to and including $111.0 billion, plus 0.1715% per annum of the aggregate netassets over $111.0 billion, up to and including $141.0 billion, plus 0.1630% of the per annum of the aggregate net assets inexcess of $141.0 billion. The management fee for each of the iShares Russell 2000 Growth ETF and iShares Russell 2000Value ETF equals the ratio of the Fund’s net assets over the aggregate net assets of the above iShares funds multiplied by theamount calculated as follows: 0.2500% per annum of the aggregate net assets less than or equal to $46.0 billion, plus0.2375% per annum of the aggregate net assets over $46.0 billion, up to and including $81.0 billion, plus 0.2257% perannum of the aggregate net assets over $81.0 billion, up to and including $111.0 billion, plus 0.2144% per annum of theaggregate net assets over $111.0 billion, up to and including $141.0 billion, plus 0.2037% per annum of the aggregate netassets in excess of $141.0 billion. The management fee for the iShares Preferred and Income Securities ETF equals the ratio ofthe Fund’s net assets over the aggregate net assets of the above iShares funds multiplied by the amount calculated asfollows: 0.4800% per annum of the aggregate net assets less than or equal to $46.0 billion, plus 0.4560% per annum of theaggregate net assets over $46.0 billion, up to and including $81.0 billion, plus 0.4332% per annum of the aggregate netassets over $81.0 billion, up to and including $111.0 billion, plus 0.4116% per annum of the aggregate net assets over $111.0billion, up to and including $141.0 billion, plus 0.3910% per annum of the aggregate net assets in excess of $141.0 billion.
115

For its investment advisory services to the iShares S&P Mid-Cap 400 Value ETF, BFA is paid a management fee from the Fundcalculated based on the average daily net assets of the Fund. The management fee is calculated as follows: 0.25% per annumof the net assets less than or equal to $5.0 billion, plus 0.24% per annum of the net assets over $5.0 billion, up to andincluding $7.5 billion, plus 0.23% per annum of the net assets over $7.5 billion, up to and including $10.0 billion, plus 0.21%per annum of the net assets in excess of $10.0 billion.
Effective June 26, 2018, for its investment advisory services to the iShares Nasdaq Biotechnology ETF, iShares Russell 1000Growth ETF, iShares Russell 1000 Value ETF, iShares Russell Mid-Cap ETF, iShares Russell Mid-Cap Growth ETF, iSharesRussell Mid-Cap Value ETF and iShares S&P Mid-Cap 400 Growth ETF, BFA is paid a management fee from each Fundcalculated based on the aggregate average daily net assets of the following iShares funds: iShares Cohen & Steers REIT ETF,iShares iBoxx $ Investment Grade Corporate Bond ETF, iShares Intermediate-Term Corporate Bond ETF, iShares Long-TermCorporate Bond ETF, iShares MBS ETF, iShares Nasdaq Biotechnology ETF, iShares Russell 1000 Growth ETF, iShares Russell1000 Value ETF, iShares Russell Mid-Cap ETF, iShares Russell Mid-Cap Growth ETF, iShares Russell Mid-Cap Value ETF,iShares S&P Mid-Cap 400 Growth ETF, iShares Short-Term Corporate Bond ETF, and the iShares TIPS Bond ETF. Themanagement fee for the iShares Nasdaq Biotechnology ETF equals the ratio of the Fund’s net assets over the aggregate netassets of the above iShares funds multiplied by the amount calculated as follows: 0.4800% per annum of the aggregate netassets less than or equal to $121.0 billion, plus 0.4560% per annum of the aggregate net assets over $121.0 billion, up to andincluding $181.0 billion, plus 0.4332% per annum of the aggregate net assets over $181.0 billion, up to and including $231.0billion, plus 0.4116% per annum of the aggregate net assets over $231.0 billion, up to and including $281.0 billion, plus0.3910% of the per annum of the aggregate net assets in excess of $281.0 billion. The management fee for each of theiShares Russell 1000 Growth ETF, iShares Russell 1000 Value ETF and iShares Russell Mid-Cap ETF equals the ratio of theFund’s net assets over the aggregate net assets of the above iShares funds multiplied by the amount calculated as follows:0.2000% per annum of the aggregate net assets less than or equal to $121.0 billion, plus 0.1900% per annum of theaggregate net assets over $121.0 billion, up to and including $181.0 billion, plus 0.1805% per annum of the aggregate netassets over $181.0 billion, up to and including $231.0 billion, plus 0.1715% per annum of the aggregate net assets over $231.0billion, up to and including $281.0 billion, plus 0.1630% per annum of the aggregate net assets in excess of $281.0 billion.The management fee for each of the iShares Russell Mid-Cap Growth ETF, iShares Russell Mid-Cap Value ETF and iSharesS&P Mid-Cap 400 Growth ETF equals the ratio of the Fund’s net assets over the aggregate net assets of the above iSharesfunds multiplied by the amount calculated as follows: 0.2500% per annum of the aggregate net assets less than or equal to$121.0 billion, plus 0.2375% per annum of the aggregate net assets over $121.0 billion, up to and including $181.0 billion,plus 0.2257% per annum of the aggregate net assets over $181.0 billion, up to and including $231.0 billion, plus 0.2144% perannum of the aggregate net assets over $231.0 billion, up to and including $281.0 billion, plus 0.2037% per annum of theaggregate net assets in excess of $281.0 billion.
The following table sets forth the management fee at the annual rate (as a percentage of each Fund’s average daily netassets) BFA received from each Fund for the fiscal year ended March 31, 2018 and the management fees (net of waivers)each Fund paid BFA for the fiscal years noted:
Fund
ManagementFee for the
FiscalYear Ended
March 31, 2018
FundInception
Date
ManagementFees Paid
Net of Waiversfor Fiscal
Year EndedMarch 31, 2018
ManagementFees Paid
Net of Waiversfor Fiscal
Year EndedMarch 31, 2017
ManagementFees Paid
Net of Waiversfor Fiscal
Year EndedMarch 31, 2016
iShares Core S&P 500 ETF1 0.04% 05/15/00 $51,925,165 $ 44,510,327 $47,872,522iShares Core S&P Mid-Cap ETF2 0.07% 05/22/00 29,103,281 29,202,155 31,013,766iShares Core S&P Small-Cap ETF3 0.07% 05/22/00 23,194,395 20,478,580 19,723,851iShares Core S&P Total U.S. Stock Market ETF4 0.03% 01/20/04 3,314,642 1,579,185 1,382,882iShares Core S&P U.S. Growth ETF5,6 0.05% 07/24/00 1,420,625 654,065 655,059iShares Core S&P U.S. Value ETF7,8 0.05% 07/24/00 1,302,383 599,929 674,417iShares Europe ETF 0.59% 07/25/00 17,904,743 14,500,097 16,743,347iShares Global 100 ETF 0.40% 12/05/00 6,896,201 6,376,225 6,796,461iShares Global Clean Energy ETF 0.47% 06/24/08 534,573 374,844 377,847iShares Global Comm Services ETF 0.47% 11/12/01 1,671,496 1,702,715 2,005,128iShares Global Consumer Discretionary ETF 0.47% 09/12/06 1,119,775 1,351,369 1,738,699iShares Global Consumer Staples ETF 0.47% 09/12/06 2,853,798 2,948,622 3,004,333
116

Fund
ManagementFee for the
FiscalYear Ended
March 31, 2018
FundInception
Date
ManagementFees Paid
Net of Waiversfor Fiscal
Year EndedMarch 31, 2018
ManagementFees Paid
Net of Waiversfor Fiscal
Year EndedMarch 31, 2017
ManagementFees Paid
Net of Waiversfor Fiscal
Year EndedMarch 31, 2016
iShares Global Energy ETF 0.47% 11/12/01 4,478,505 5,170,944 4,586,860iShares Global Financials ETF 0.47% 11/12/01 2,307,119 1,388,979 1,338,107iShares Global Industrials ETF 0.47% 09/12/06 1,221,906 915,658 1,007,334iShares Global Infrastructure ETF 0.47% 12/10/07 8,965,841 5,363,805 5,250,582iShares Global Utilities ETF 0.47% 09/12/06 702,217 808,924 778,567iShares International Developed Property ETF 0.48% 07/30/07 762,521 688,827 744,658iShares International Preferred Stock ETF 0.55% 11/15/11 473,119 419,651 248,174iShares JPX-Nikkei 400 ETF9 0.48% 10/23/01 451,025 477,518 550,741iShares Micro-Cap ETF 0.60% 08/12/05 5,138,410 4,631,157 5,039,570iShares Nasdaq Biotechnology ETF 0.47% 02/05/01 43,746,610 35,045,726 38,233,119iShares Preferred and Income Securities ETF 0.46% 03/26/07 82,622,370 78,253,631 64,387,725iShares Russell 1000 ETF 0.15% 05/15/00 28,792,969 24,265,847 19,223,590iShares Russell 1000 Growth ETF 0.19% 05/22/00 73,498,356 60,583,259 58,393,829iShares Russell 1000 Pure U.S. Revenue ETF 0.15% 08/08/17 5,528 N/A N/AiShares Russell 1000 Value ETF 0.19% 05/22/00 72,979,335 61,546,992 50,619,861iShares Russell 2000 ETF 0.19% 05/22/00 77,149,262 60,330,342 53,109,938iShares Russell 2000 Growth ETF 0.24% 07/24/00 20,593,602 16,245,686 16,464,609iShares Russell 2000 Value ETF 0.24% 07/24/00 21,455,988 17,504,928 14,347,406iShares Russell 3000 ETF 0.20% 05/22/00 15,997,885 12,949,613 12,272,386iShares Russell Mid-Cap ETF 0.19% 07/17/01 31,429,300 26,410,760 24,745,022iShares Russell Mid-Cap Growth ETF 0.24% 07/17/01 19,357,093 15,949,076 15,072,538iShares Russell Mid-Cap Value ETF 0.24% 07/17/01 24,642,865 20,141,771 16,645,481iShares Russell Top 200 ETF 0.15% 09/22/09 184,654 154,511 142,646iShares Russell Top 200 Growth ETF 0.20% 09/22/09 1,955,608 1,333,021 1,162,113iShares Russell Top 200 Value ETF 0.20% 09/22/09 516,159 360,030 332,347iShares S&P 100 ETF 0.20% 10/23/00 9,819,296 8,897,340 8,679,231iShares S&P 500 Growth ETF 0.18% 05/22/00 34,449,906 25,824,365 23,605,956iShares S&P 500 Value ETF 0.18% 05/22/00 25,612,646 20,379,782 15,311,872iShares S&P Mid-Cap 400 Growth ETF 0.24% 07/24/00 17,303,275 13,666,860 13,241,203iShares S&P Mid-Cap 400 Value ETF 0.25% 07/24/00 14,264,078 12,856,484 10,106,075iShares S&P Small-Cap 600 Growth ETF 0.25% 07/24/00 11,567,629 9,025,460 8,317,107iShares S&P Small-Cap 600 Value ETF 0.25% 07/24/00 12,329,979 10,404,841 8,160,305iShares U.S. Infrastructure ETF 0.40% 04/03/18 N/A N/A N/A
1 Effective October 5, 2016, the management fee for the iShares Core S&P 500 ETF is 0.04%. Prior to October 5, 2016, the management fee for theiShares Core S&P 500 ETF was 0.07%.
2 Effective October 5, 2016, the management fee for the iShares Core S&P Mid-Cap ETF is 0.07%. Prior to October 5, 2016, the management fee for theiShares Core S&P Mid-Cap ETF was 0.12%.
3 Effective October 5, 2016, the management fee for the iShares Core S&P Small-Cap ETF is 0.07%. Prior to October 5, 2016, the management fee forthe iShares Core S&P Small-Cap ETF was 0.12%.
4 Effective November 10, 2015, the management fee for the iShares Core S&P Total U.S. Stock Market ETF is 0.03%. Prior to November 10, 2015, themanagement fee for the iShares Core S&P Total U.S. Stock Market ETF was 0.07%.
5 Effective June 26, 2018, the management fee for the iShares Core S&P U.S. Growth ETF is 0.04%. From December 16, 2016 to June 25, 2018, themanagement fee for the iShares Core S&P U.S. Growth ETF was 0.05%. Prior to December 15, 2016, the management fee for the iShares Core S&PU.S. Growth ETF was 0.07%. Prior to November 10, 2016, the management fee for the iShares Core S&P U.S. Growth ETF was 0.09%.
6 For the iShares Core S&P U.S. Growth ETF, BFA contractually agreed to waive a portion of its management fee such that the Fund’s total annual fundoperating expenses after fee waiver will not exceed 0.04% effective June 1, 2018 through May 30, 2023. The contractual waiver was discontinuedbeginning on June 26, 2018.
7 Effective June 26, 2018, the management fee for the iShares Core S&P U.S. Value ETF is 0.04%. From December 16, 2016 to June 25, 2018, themanagement fee for the iShares Core S&P U.S. Value ETF was 0.05%. Prior to December 15, 2016, the management fee for the iShares Core S&P U.S.Value ETF was 0.07%. Prior to November 10, 2016, the management fee for the iShares Core S&P U.S. Value ETF was 0.09%.
117

8 For the iShares Core S&P U.S. Value ETF, BFA contractually agreed to waive a portion of its management fee such that the Fund’s total annual fundoperating expenses after fee waiver will not exceed 0.04% effective June 1, 2018 through May 30, 2023. The contractual waiver was discontinuedbeginning on June 26, 2018.
9 Effective September 4, 2015, the management fee for the iShares JPX-Nikkei 400 ETF is 0.48%. Prior to September 4, 2015, the management fee forthe iShares JPX-Nikkei 400 ETF was 0.50%.
Fund1
ManagementFee for the
FiscalYear Ended
March 31, 2018Fund Inception
Date
ManagementFees Paid
Net of Waiversfor Fiscal
Year EndedMarch 31, 2018
ManagementFees Paid
Net of Waiversfor Fiscal
Year EndedMarch 31, 2017
ManagementFees Paid
Net of Waiversfor Period from
May 1,2015 to
March 31, 20161
ManagementFees Paid
Net of Waiversfor Fiscal
Year EndedApril 30, 2015
iShares Mortgage Real EstateETF 0.48% 05/01/07 $ 5,962,548 $ 5,404,011 $ 4,261,006 $ 6,074,132
iShares Residential Real EstateETF 0.48% 05/01/07 1,812,129 2,018,992 1,349,752 1,336,215
iShares U.S. Aerospace &Defense ETF 0.43% 05/01/06 18,067,188 5,587,725 2,342,812 1,801,712
iShares U.S. Broker-Dealers &Securities Exchanges ETF 0.43% 05/01/06 784,511 601,006 1,116,015 1,034,095
iShares U.S. HealthcareProviders ETF 0.43% 05/01/06 2,240,970 2,674,248 3,369,276 2,609,352
iShares U.S. Home ConstructionETF 0.43% 05/01/06 7,925,427 5,863,422 7,954,185 7,358,349
iShares U.S. Insurance ETF 0.43% 05/01/06 738,482 497,974 499,298 570,527iShares U.S. Medical Devices
ETF 0.43% 05/01/06 6,282,424 5,122,496 3,074,815 3,282,790iShares U.S. Oil & Gas
Exploration & ProductionETF 0.43% 05/01/06 1,633,437 1,645,398 1,667,098 2,225,358
iShares U.S. Oil Equipment &Services ETF 0.43% 05/01/06 897,110 1,056,132 1,148,658 2,052,484
iShares U.S. PharmaceuticalsETF 0.43% 05/01/06 2,622,487 2,881,083 3,939,434 3,642,512
iShares U.S. Real Estate ETF 0.43% 06/12/00 18,107,904 19,498,607 17,728,029 23,278,654iShares U.S. Regional Banks ETF 0.43% 05/01/06 3,183,852 2,012,427 2,109,030 2,307,362iShares U.S.
Telecommunications ETF 0.43% 05/22/00 1,773,050 2,710,372 2,052,844 2,528,356
1 Each Fund’s fiscal year-end was changed from April 30 to March 31.
Fund1
ManagementFee for the
FiscalYear Ended
March 31, 2018
FundInception
Date
ManagementFees Paid
Net of Waiversfor Fiscal
Year EndedMarch 31, 2018
ManagementFees Paid
Net of Waiversfor Fiscal
Year EndedMarch 31, 2017
ManagementFees Paid
Net of Waiversfor Period from
August 1,2015 to
March 31, 20161
ManagementFees Paid
Net of Waiversfor Fiscal
Year EndedJuly 31, 2015
iShares Expanded Tech Sector ETF 0.47% 03/13/01 5,958,021 4,486,273 2,744,592 3,596,732iShares Expanded Tech-Software
Sector ETF 0.47% 07/10/01 5,157,877 3,565,713 2,906,250 5,468,110iShares North American Natural
Resources ETF 0.47% 10/22/01 $4,533,669 $5,261,735 $ 4,765,652 $10,390,576iShares North American Tech-
Multimedia Networking ETF 0.47% 07/10/01 300,944 337,234 366,588 977,906
118

Fund1
ManagementFee for the
FiscalYear Ended
March 31, 2018
FundInception
Date
ManagementFees Paid
Net of Waiversfor Fiscal
Year EndedMarch 31, 2018
ManagementFees Paid
Net of Waiversfor Fiscal
Year EndedMarch 31, 2017
ManagementFees Paid
Net of Waiversfor Period from
August 1,2015 to
March 31, 20161
ManagementFees Paid
Net of Waiversfor Fiscal
Year EndedJuly 31, 2015
iShares PHLX Semiconductor ETF 0.47% 07/10/01 5,894,938 2,680,109 1,149,822 2,532,073
1 Each Fund’s fiscal year-end was changed from July 31 to March 31.
Investment Sub-Adviser. Pursuant to the Investment Advisory Agreement between BFA and the Trust entered into on behalfof the iShares International Preferred Stock ETF, BFA may from time to time, in its sole discretion, to the extent permitted byapplicable law, appoint one or more sub-advisers, including, without limitation, affiliates of BFA, to perform investmentadvisory services with respect to the Fund. In addition, BFA may delegate certain of its investment advisory functions underthe Investment Advisory Agreement to one or more of its affiliates to the extent permitted by applicable law. BFA mayterminate any or all sub-advisers or such delegation arrangements in its sole discretion at any time to the extent permitted byapplicable law.
BFA has entered into an investment sub-advisory agreement (the “Sub-Advisory Agreement” and together with theInvestment Advisory Agreement, the “Advisory Agreements”) with the Sub-Adviser. The Sub-Adviser is an investment adviserlocated in the U.K. The Sub-Adviser is an affiliate of BFA and is a registered investment adviser and a commodity pooloperator organized in 1999. As of June 30, 2018, the Sub-Adviser’s total assets under management were approximately$16.40 billion.
Under the Sub-Advisory Agreement, subject to the supervision and oversight of the Board and BFA, the Sub-Adviser will beprimarily responsible for execution of securities transactions outside the U.S. and Canada and may, from time to time,participate in the management of specified assets in the Fund’s portfolio.
Pursuant to the Sub-Advisory Agreement, BFA pays the Sub-Adviser for services it provides either: (i) a fee equal to apercentage of the management fee paid to BFA under the Investment Advisory Agreement, or (ii) an amount based on thecost of the services provided. If the Sub-Adviser provides services related to both portfolio management and trading it isentitled to receive, from BFA, an amount equal to 20% of BFA’s management fee, and if the Sub-Adviser provides servicesrelated solely to trading then it is entitled to receive, from BFA, an amount equal to 110% of the actual pre-tax costs incurredby the Sub-Adviser. The Sub-Adviser may be responsible for the day-to-day management of the Fund or portions of theFund.
Unless earlier terminated as described below, each Advisory Agreement will remain in effect for an initial two year period andfrom year to year if approved annually (i) by the Board or by a vote of a majority of the outstanding voting securities of theFund, and (ii) by a majority of the Trustees who are not parties to such agreement or interested persons (as defined in the1940 Act) of any such party.
Each Advisory Agreement with respect to each Fund is terminable without penalty, on 60 days’ notice, by the Board or by avote of the holders of a majority of the applicable Fund’s outstanding voting securities (as defined in the 1940 Act). TheInvestment Advisory Agreement is also terminable upon 60 days’ notice by BFA. The Sub-Advisory Agreement is alsoterminable on 60 days’ written notice at the option of either BFA or the Sub-Adviser. Each Advisory Agreement will terminateautomatically in the event of its assignment (as defined in the 1940 Act).
Portfolio Managers. As of March 31, 2018, the individuals named as Portfolio Managers in the Funds’ Prospectuses werealso primarily responsible for the day-to-day management of other iShares funds and certain other types of portfolios and/oraccounts as follows:
Rachel AguirreTypes of Accounts Number Total Assets
Registered Investment Companies 87 $110,639,000,000Other Pooled Investment Vehicles 2 1,537,000,000Other Accounts 0 N/A
119

Diane HsiungTypes of Accounts Number Total Assets
Registered Investment Companies 194 $515,551,000,000Other Pooled Investment Vehicles 0 N/AOther Accounts 0 N/A
Jennifer HsuiTypes of Accounts Number Total Assets
Registered Investment Companies 220 $572,550,000,000Other Pooled Investment Vehicles 2 1,537,000,000Other Accounts 0 N/A
Alan MasonTypes of Accounts Number Total Assets
Registered Investment Companies 291 $647,258,000,000Other Pooled Investment Vehicles 2 1,537,000,000Other Accounts 1 81,000,000
Greg SavageTypes of Accounts Number Total Assets
Registered Investment Companies 298 $637,903,000,000Other Pooled Investment Vehicles 17 2,353,000,000Other Accounts 0 N/A
Amy WhitelawTypes of Accounts Number Total Assets
Registered Investment Companies 32 $35,476,000,000Other Pooled Investment Vehicles 0 N/AOther Accounts 1 81,000,000
Each of the portfolios or accounts for which the Portfolio Managers are primarily responsible for the day-to-day managementseeks to track the rate of return, risk profile and other characteristics of independent third-party indexes by either replicatingthe same combination of securities and other financial instruments that constitute those indexes or through a representativesampling of the securities and other financial instruments that constitute those indexes based on objective criteria and data.Pursuant to BFA’s policy, investment opportunities are allocated equitably among the Funds and other portfolios andaccounts. For example, under certain circumstances, an investment opportunity may be restricted due to limited supply inthe market, legal constraints or other factors, in which event the investment opportunity will be allocated equitably amongthose portfolios and accounts, including the Funds, seeking such investment opportunity. As a consequence, from time totime each Fund may receive a smaller allocation of an investment opportunity than they would have if the Portfolio Managersand BFA and its affiliates did not manage other portfolios or accounts.
Like the Funds, the other portfolios or accounts for which the Portfolio Managers are primarily responsible for the day-to-dayportfolio management generally pay an asset-based fee to BFA or its affiliates, as applicable, for its advisory services. One ormore of those other portfolios or accounts, however, may pay BFA or its affiliates a performance-based fee in lieu of, or inaddition to, an asset-based fee for its advisory services. A portfolio or account with a performance-based fee would pay BFAor its affiliates a portion of that portfolio’s or account’s gains, or would pay BFA or its affiliates more for its services thanwould otherwise be the case if BFA or any of its affiliates meets or exceeds specified performance targets. Performance-basedfee arrangements could present an incentive for BFA or its affiliates to devote greater resources, and allocate moreinvestment opportunities, to the portfolios or accounts that have those fee arrangements, relative to other portfolios oraccounts, in order to earn larger fees. Although BFA and each of its affiliates have an obligation to allocate resources and
120

opportunities equitably among portfolios and accounts and intend to do so, shareholders of the Funds should be aware that,as with any group of portfolios and accounts managed by an investment adviser and/or its affiliates pursuant to varying feearrangements, including performance-based fee arrangements, there is the potential for a conflict of interest, which mayresult in the Portfolio Managers favoring those portfolios or accounts with performance-based fee arrangements.
The tables below show, for each Portfolio Manager, the number of portfolios or accounts of the types set forth in the abovetables and the aggregate of total assets in those portfolios or accounts with respect to which the investment managementfees are based on the performance of those portfolios or accounts as of March 31, 2018:
Rachel Aguirre
Types of Accounts
Number of OtherAccounts with
Performance Fees Managed by Portfolio ManagerAggregate
of Total Assets
Registered Investment Companies 0 N/AOther Pooled Investment Vehicles 0 N/AOther Accounts 0 N/A
Diane Hsiung
Types of Accounts
Number of OtherAccounts with
Performance Fees Managed by Portfolio ManagerAggregate
of Total Assets
Registered Investment Companies 0 N/AOther Pooled Investment Vehicles 0 N/AOther Accounts 0 N/A
Jennifer Hsui
Types of Accounts
Number of OtherAccounts with
Performance Fees Managed by Portfolio ManagerAggregate
of Total Assets
Registered Investment Companies 0 N/AOther Pooled Investment Vehicles 0 N/AOther Accounts 0 N/A
Alan Mason
Types of Accounts
Number of OtherAccounts with
Performance Fees Managed by Portfolio ManagerAggregate
of Total Assets
Registered Investment Companies 0 N/AOther Pooled Investment Vehicles 0 N/AOther Accounts 0 N/A
Greg Savage
Types of Accounts
Number of OtherAccounts with
Performance Fees Managed by Portfolio ManagerAggregate
of Total Assets
Registered Investment Companies 0 N/AOther Pooled Investment Vehicles 0 N/AOther Accounts 0 N/A
Amy Whitelaw
Types of Accounts
Number of OtherAccounts with
Performance Fees Managed by Portfolio ManagerAggregate
of Total Assets
Registered Investment Companies 0 N/A
121

Amy Whitelaw
Types of Accounts
Number of OtherAccounts with
Performance Fees Managed by Portfolio ManagerAggregate
of Total Assets
Other Pooled Investment Vehicles 0 N/AOther Accounts 0 N/A
The discussion below describes the Portfolio Managers’ compensation as of March 31, 2018.
Portfolio Manager Compensation Overview
BlackRock, Inc.’s financial arrangements with its portfolio managers, its competitive compensation and its career pathemphasis at all levels reflect the value senior management places on key resources. Compensation may include a variety ofcomponents and may vary from year to year based on a number of factors. The principal components of compensationinclude a base salary, a performance-based discretionary bonus, participation in various benefits programs and one or moreof the incentive compensation programs established by BlackRock, Inc.
Base compensation. Generally, portfolio managers receive base compensation based on their position with the firm.
Discretionary Incentive Compensation. Discretionary incentive compensation is a function of several components: theperformance of BlackRock, Inc., the performance of the portfolio manager’s group within BlackRock, Inc. and the individual’sperformance and contribution to the overall performance of these portfolios and BlackRock, Inc.
Distribution of Discretionary Incentive Compensation. Discretionary incentive compensation is distributed to portfoliomanagers in a combination of cash and BlackRock, Inc. restricted stock units which vest ratably over a number of years. TheBlackRock, Inc. restricted stock units, if properly vested, will be settled in BlackRock, Inc. common stock. Typically, the cashbonus, when combined with base salary, represents more than 60% of total compensation for the portfolio managers. Payinga portion of annual bonuses in stock puts compensation earned by a portfolio manager for a given year “at risk” based onBlackRock, Inc.’s ability to sustain and improve its performance over future periods.
Long-Term Incentive Plan Awards — From time to time, long-term incentive equity awards are granted to certain keyemployees to aid in retention, align their interests with long-term shareholder interests and motivate performance. Equityawards are generally granted in the form of BlackRock, Inc. restricted stock units that, once vested, settle in BlackRock, Inc.common stock.
Other Compensation Benefits. In addition to base compensation and discretionary incentive compensation, portfoliomanagers may be eligible to receive or participate in one or more of the following:
Incentive Savings Plans — BlackRock, Inc. has created a variety of incentive savings plans in which BlackRock, Inc. employeesare eligible to participate, including a 401(k) plan, the BlackRock Retirement Savings Plan (“RSP”), and the BlackRockEmployee Stock Purchase Plan (“ESPP”). The employer contribution components of the RSP include a company match equalto 50% of the first 8% of eligible pay contributed to the plan capped at $5,000 per year, and a company retirementcontribution equal to 3-5% of eligible compensation up to the U.S. Internal Revenue Service (the “IRS”) limit ($275,000 for2018). The RSP offers a range of investment options, including registered investment companies and collective investmentfunds managed by the firm. BlackRock, Inc. contributions follow the investment direction set by participants for their owncontributions or, absent participant investment direction, are invested into an index target date fund that corresponds to, or isclosest to, the year in which the participant attains age 65. The ESPP allows for investment in BlackRock, Inc. common stockat a 5% discount on the fair market value of the stock on the purchase date. Annual participation in the ESPP is limited to thepurchase of 1,000 shares of common stock or a dollar value of $25,000 based on its fair market value on the Purchase Date.Rachel Aguirre, Diane Hsiung, Jennifer Hsui, Alan Mason, Greg Savage and Amy Whitelaw are each eligible to participate inthese plans.
As of March 31, 2018, the Portfolio Managers beneficially owned shares of the Funds, for which they are primarily responsiblefor the day-to-day management, in the amounts reflected in the following tables:
122

Rachel AguirreDollar Range
Fund None $1 to $10k$10,001to $50k
$50,001to $100k
$100,001to $500k
$500,001to $1m
over$1m
iShares Core S&P 500 ETF XiShares Core S&P Mid-Cap ETF XiShares Core S&P Small-Cap ETF XiShares Core S&P Total U.S. Stock Market ETF XiShares Core S&P U.S. Growth ETF XiShares Core S&P U.S. Value ETF XiShares Europe ETF XiShares Expanded Tech Sector ETF XiShares Expanded Tech-Software Sector ETF XiShares Global 100 ETF XiShares Global Clean Energy ETF XiShares Global Comm Services ETF XiShares Global Consumer Discretionary ETF XiShares Global Consumer Staples ETF XiShares Global Energy ETF XiShares Global Financials ETF XiShares Global Industrials ETF XiShares Global Infrastructure ETF XiShares Global Utilities ETF XiShares International Developed Property ETF XiShares International Preferred Stock ETF XiShares JPX-Nikkei 400 ETF XiShares Micro-Cap ETF XiShares Mortgage Real Estate ETF XiShares Nasdaq Biotechnology ETF XiShares North American Natural Resources ETF XiShares North American Tech-Multimedia
Networking ETFX
iShares PHLX Semiconductor ETF XiShares Preferred and Income Securities ETF XiShares Residential Real Estate ETF XiShares Russell 1000 ETF XiShares Russell 1000 Growth ETF XiShares Russell 1000 Pure U.S. Revenue ETF XiShares Russell 1000 Value ETF XiShares Russell 2000 ETF XiShares Russell 2000 Growth ETF XiShares Russell 2000 Value ETF XiShares Russell 3000 ETF XiShares Russell Mid-Cap ETF XiShares Russell Mid-Cap Growth ETF XiShares Russell Mid-Cap Value ETF XiShares Russell Top 200 ETF XiShares Russell Top 200 Growth ETF XiShares Russell Top 200 Value ETF XiShares S&P 100 ETF X
123

Rachel AguirreDollar Range
Fund None $1 to $10k$10,001to $50k
$50,001to $100k
$100,001to $500k
$500,001to $1m
over$1m
iShares S&P 500 Growth ETF XiShares S&P 500 Value ETF XiShares S&P Mid-Cap 400 Growth ETF XiShares S&P Mid-Cap 400 Value ETF XiShares S&P Small-Cap 600 Growth ETF XiShares S&P Small-Cap 600 Value ETF XiShares U.S. Aerospace & Defense ETF XiShares U.S. Broker-Dealers & Securities
Exchanges ETFX
iShares U.S. Healthcare Providers ETF XiShares U.S. Home Construction ETF XiShares U.S. Infrastructure ETF XiShares U.S. Insurance ETF XiShares U.S. Medical Devices ETF XiShares U.S. Oil & Gas Exploration & Production
ETFX
iShares U.S. Oil Equipment & Services ETF XiShares U.S. Pharmaceuticals ETF XiShares U.S. Real Estate ETF XiShares U.S. Regional Banks ETF XiShares U.S. Telecommunications ETF X
Diane HsiungDollar Range
Fund None $1 to $10k$10,001to $50k
$50,001to $100k
$100,001to $500k
$500,001to $1m
over$1m
iShares Core S&P 500 ETF XiShares Core S&P Mid-Cap ETF XiShares Core S&P Small-Cap ETF XiShares Core S&P Total U.S. Stock Market ETF XiShares Core S&P U.S. Growth ETF XiShares Core S&P U.S. Value ETF XiShares Europe ETF XiShares Expanded Tech Sector ETF XiShares Expanded Tech-Software Sector ETF XiShares Global 100 ETF XiShares Global Clean Energy ETF XiShares Global Comm Services ETF XiShares Global Consumer Discretionary ETF XiShares Global Consumer Staples ETF XiShares Global Energy ETF XiShares Global Financials ETF XiShares Global Industrials ETF XiShares Global Infrastructure ETF XiShares Global Utilities ETF X
124

Diane HsiungDollar Range
Fund None $1 to $10k$10,001to $50k
$50,001to $100k
$100,001to $500k
$500,001to $1m
over$1m
iShares International Developed Property ETF XiShares International Preferred Stock ETF XiShares JPX-Nikkei 400 ETF XiShares Micro-Cap ETF XiShares Mortgage Real Estate ETF XiShares Nasdaq Biotechnology ETF XiShares North American Natural Resources ETF XiShares North American Tech-Multimedia
Networking ETFX
iShares PHLX Semiconductor ETF XiShares Preferred and Income Securities ETF XiShares Residential Real Estate ETF XiShares Russell 1000 ETF XiShares Russell 1000 Growth ETF XiShares Russell 1000 Pure U.S. Revenue ETF XiShares Russell 1000 Value ETF XiShares Russell 2000 ETF XiShares Russell 2000 Growth ETF XiShares Russell 2000 Value ETF XiShares Russell 3000 ETF XiShares Russell Mid-Cap ETF XiShares Russell Mid-Cap Growth ETF XiShares Russell Mid-Cap Value ETF XiShares Russell Top 200 ETF XiShares Russell Top 200 Growth ETF XiShares Russell Top 200 Value ETF XiShares S&P 100 ETF XiShares S&P 500 Growth ETF XiShares S&P 500 Value ETF XiShares S&P Mid-Cap 400 Growth ETF XiShares S&P Mid-Cap 400 Value ETF XiShares S&P Small-Cap 600 Growth ETF XiShares S&P Small-Cap 600 Value ETF XiShares U.S. Aerospace & Defense ETF XiShares U.S. Broker-Dealers & Securities
Exchanges ETFX
iShares U.S. Healthcare Providers ETF XiShares U.S. Home Construction ETF XiShares U.S. Infrastructure ETF XiShares U.S. Insurance ETF XiShares U.S. Medical Devices ETF XiShares U.S. Oil & Gas Exploration & Production
ETFX
iShares U.S. Oil Equipment & Services ETF XiShares U.S. Pharmaceuticals ETF XiShares U.S. Real Estate ETF X
125

Diane HsiungDollar Range
Fund None $1 to $10k$10,001to $50k
$50,001to $100k
$100,001to $500k
$500,001to $1m
over$1m
iShares U.S. Regional Banks ETF XiShares U.S. Telecommunications ETF X
Jennifer HsuiDollar Range
Fund None $1 to $10k$10,001to $50k
$50,001to $100k
$100,001to $500k
$500,001to $1m
over$1m
iShares Core S&P 500 ETF XiShares Core S&P Mid-Cap ETF XiShares Core S&P Small-Cap ETF XiShares Core S&P Total U.S. Stock Market ETF XiShares Core S&P U.S. Growth ETF XiShares Core S&P U.S. Value ETF XiShares Europe ETF XiShares Expanded Tech Sector ETF XiShares Expanded Tech-Software Sector ETF XiShares Global 100 ETF XiShares Global Clean Energy ETF XiShares Global Comm Services ETF XiShares Global Consumer Discretionary ETF XiShares Global Consumer Staples ETF XiShares Global Energy ETF XiShares Global Financials ETF XiShares Global Industrials ETF XiShares Global Infrastructure ETF XiShares Global Utilities ETF XiShares International Developed Property ETF XiShares International Preferred Stock ETF XiShares JPX-Nikkei 400 ETF XiShares Micro-Cap ETF XiShares Mortgage Real Estate ETF XiShares Nasdaq Biotechnology ETF XiShares North American Natural Resources ETF XiShares North American Tech-Multimedia
Networking ETFX
iShares PHLX Semiconductor ETF XiShares Preferred and Income Securities ETF XiShares Residential Real Estate ETF XiShares Russell 1000 ETF XiShares Russell 1000 Growth ETF XiShares Russell 1000 Pure U.S. Revenue ETF XiShares Russell 1000 Value ETF XiShares Russell 2000 ETF XiShares Russell 2000 Growth ETF XiShares Russell 2000 Value ETF X
126

Jennifer HsuiDollar Range
Fund None $1 to $10k$10,001to $50k
$50,001to $100k
$100,001to $500k
$500,001to $1m
over$1m
iShares Russell 3000 ETF XiShares Russell Mid-Cap ETF XiShares Russell Mid-Cap Growth ETF XiShares Russell Mid-Cap Value ETF XiShares Russell Top 200 ETF XiShares Russell Top 200 Growth ETF XiShares Russell Top 200 Value ETF XiShares S&P 100 ETF XiShares S&P 500 Growth ETF XiShares S&P 500 Value ETF XiShares S&P Mid-Cap 400 Growth ETF XiShares S&P Mid-Cap 400 Value ETF XiShares S&P Small-Cap 600 Growth ETF XiShares S&P Small-Cap 600 Value ETF XiShares U.S. Aerospace & Defense ETF XiShares U.S. Broker-Dealers & Securities
Exchanges ETFX
iShares U.S. Healthcare Providers ETF XiShares U.S. Home Construction ETF XiShares U.S. Infrastructure ETF XiShares U.S. Insurance ETF XiShares U.S. Medical Devices ETF XiShares U.S. Oil & Gas Exploration & Production
ETFX
iShares U.S. Oil Equipment & Services ETF XiShares U.S. Pharmaceuticals ETF XiShares U.S. Real Estate ETF XiShares U.S. Regional Banks ETF XiShares U.S. Telecommunications ETF X
Alan MasonDollar Range
Fund None $1 to $10k$10,001to $50k
$50,001to $100k
$100,001to $500k
$500,001to $1m
over$1m
iShares Core S&P 500 ETF XiShares Core S&P Mid-Cap ETF XiShares Core S&P Small-Cap ETF XiShares Core S&P Total U.S. Stock Market ETF XiShares Core S&P U.S. Growth ETF XiShares Core S&P U.S. Value ETF XiShares Europe ETF XiShares Expanded Tech Sector ETF XiShares Expanded Tech-Software Sector ETF XiShares Global 100 ETF XiShares Global Clean Energy ETF X
127
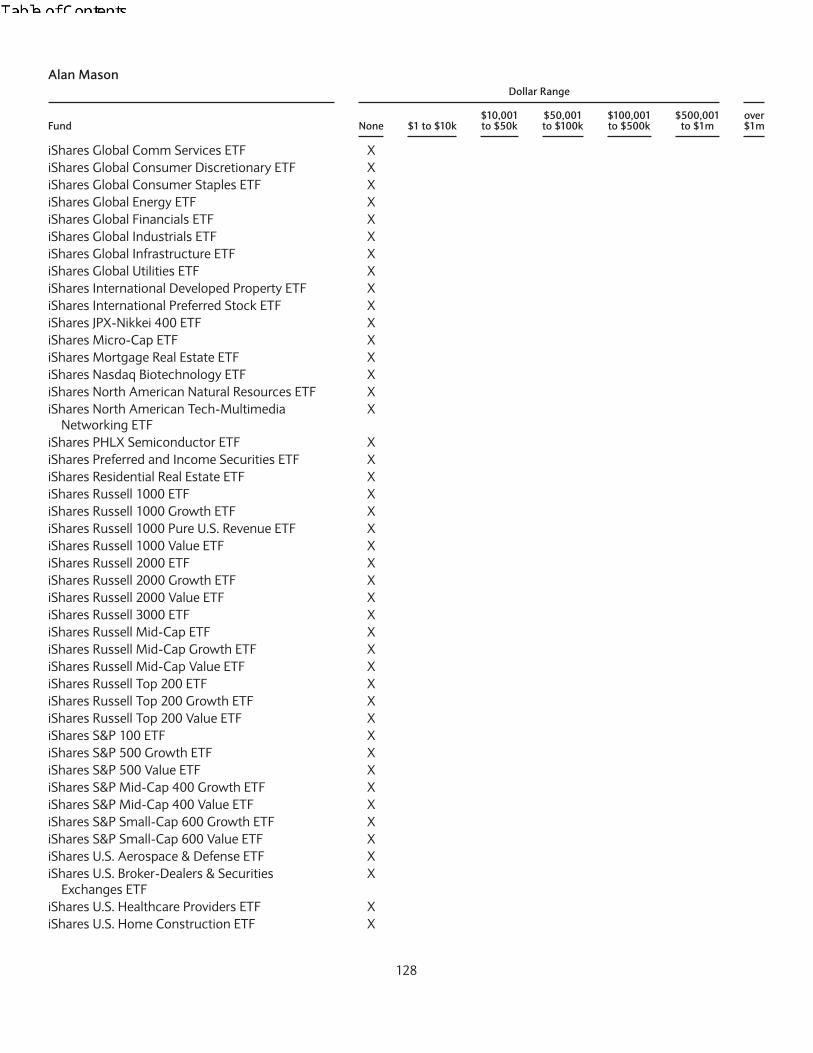
Alan MasonDollar Range
Fund None $1 to $10k$10,001to $50k
$50,001to $100k
$100,001to $500k
$500,001to $1m
over$1m
iShares Global Comm Services ETF XiShares Global Consumer Discretionary ETF XiShares Global Consumer Staples ETF XiShares Global Energy ETF XiShares Global Financials ETF XiShares Global Industrials ETF XiShares Global Infrastructure ETF XiShares Global Utilities ETF XiShares International Developed Property ETF XiShares International Preferred Stock ETF XiShares JPX-Nikkei 400 ETF XiShares Micro-Cap ETF XiShares Mortgage Real Estate ETF XiShares Nasdaq Biotechnology ETF XiShares North American Natural Resources ETF XiShares North American Tech-Multimedia
Networking ETFX
iShares PHLX Semiconductor ETF XiShares Preferred and Income Securities ETF XiShares Residential Real Estate ETF XiShares Russell 1000 ETF XiShares Russell 1000 Growth ETF XiShares Russell 1000 Pure U.S. Revenue ETF XiShares Russell 1000 Value ETF XiShares Russell 2000 ETF XiShares Russell 2000 Growth ETF XiShares Russell 2000 Value ETF XiShares Russell 3000 ETF XiShares Russell Mid-Cap ETF XiShares Russell Mid-Cap Growth ETF XiShares Russell Mid-Cap Value ETF XiShares Russell Top 200 ETF XiShares Russell Top 200 Growth ETF XiShares Russell Top 200 Value ETF XiShares S&P 100 ETF XiShares S&P 500 Growth ETF XiShares S&P 500 Value ETF XiShares S&P Mid-Cap 400 Growth ETF XiShares S&P Mid-Cap 400 Value ETF XiShares S&P Small-Cap 600 Growth ETF XiShares S&P Small-Cap 600 Value ETF XiShares U.S. Aerospace & Defense ETF XiShares U.S. Broker-Dealers & Securities
Exchanges ETFX
iShares U.S. Healthcare Providers ETF XiShares U.S. Home Construction ETF X
128

Alan MasonDollar Range
Fund None $1 to $10k$10,001to $50k
$50,001to $100k
$100,001to $500k
$500,001to $1m
over$1m
iShares U.S. Infrastructure ETF XiShares U.S. Insurance ETF XiShares U.S. Medical Devices ETF XiShares U.S. Oil & Gas Exploration & Production
ETFX
iShares U.S. Oil Equipment & Services ETF XiShares U.S. Pharmaceuticals ETF XiShares U.S. Real Estate ETF XiShares U.S. Regional Banks ETF XiShares U.S. Telecommunications ETF X
Greg SavageDollar Range
Fund None $1 to $10k$10,001to $50k
$50,001to $100k
$100,001to $500k
$500,001to $1m
over$1m
iShares Core S&P 500 ETF XiShares Core S&P Mid-Cap ETF XiShares Core S&P Small-Cap ETF XiShares Core S&P Total U.S. Stock Market ETF XiShares Core S&P U.S. Growth ETF XiShares Core S&P U.S. Value ETF XiShares Europe ETF XiShares Expanded Tech Sector ETF XiShares Expanded Tech-Software Sector ETF XiShares Global 100 ETF XiShares Global Clean Energy ETF XiShares Global Comm Services ETF XiShares Global Consumer Discretionary ETF XiShares Global Consumer Staples ETF XiShares Global Energy ETF XiShares Global Financials ETF XiShares Global Industrials ETF XiShares Global Infrastructure ETF XiShares Global Utilities ETF XiShares International Developed Property ETF XiShares International Preferred Stock ETF XiShares JPX-Nikkei 400 ETF XiShares Micro-Cap ETF XiShares Mortgage Real Estate ETF XiShares Nasdaq Biotechnology ETF XiShares North American Natural Resources ETF XiShares North American Tech-Multimedia
Networking ETFX
iShares PHLX Semiconductor ETF XiShares Preferred and Income Securities ETF X
129

Greg SavageDollar Range
Fund None $1 to $10k$10,001to $50k
$50,001to $100k
$100,001to $500k
$500,001to $1m
over$1m
iShares Residential Real Estate ETF XiShares Russell 1000 ETF XiShares Russell 1000 Growth ETF XiShares Russell 1000 Pure U.S. Revenue ETF XiShares Russell 1000 Value ETF XiShares Russell 2000 ETF XiShares Russell 2000 Growth ETF XiShares Russell 2000 Value ETF XiShares Russell 3000 ETF XiShares Russell Mid-Cap ETF XiShares Russell Mid-Cap Growth ETF XiShares Russell Mid-Cap Value ETF XiShares Russell Top 200 ETF XiShares Russell Top 200 Growth ETF XiShares Russell Top 200 Value ETF XiShares S&P 100 ETF XiShares S&P 500 Growth ETF XiShares S&P 500 Value ETF XiShares S&P Mid-Cap 400 Growth ETF XiShares S&P Mid-Cap 400 Value ETF XiShares S&P Small-Cap 600 Growth ETF XiShares S&P Small-Cap 600 Value ETF XiShares U.S. Aerospace & Defense ETF XiShares U.S. Broker-Dealers & Securities
Exchanges ETFX
iShares U.S. Healthcare Providers ETF XiShares U.S. Home Construction ETF XiShares U.S. Infrastructure ETF XiShares U.S. Insurance ETF XiShares U.S. Medical Devices ETF XiShares U.S. Oil & Gas Exploration & Production
ETFX
iShares U.S. Oil Equipment & Services ETF XiShares U.S. Pharmaceuticals ETF XiShares U.S. Real Estate ETF XiShares U.S. Regional Banks ETF XiShares U.S. Telecommunications ETF X
Amy WhitelawDollar Range
Fund None $1 to $10k$10,001to $50k
$50,001to $100k
$100,001to $500k
$500,001to $1m
over$1m
iShares Core S&P 500 ETF XiShares Core S&P Mid-Cap ETF XiShares Core S&P Small-Cap ETF X
130

Amy WhitelawDollar Range
Fund None $1 to $10k$10,001to $50k
$50,001to $100k
$100,001to $500k
$500,001to $1m
over$1m
iShares Core S&P Total U.S. Stock Market ETF XiShares Core S&P U.S. Growth ETF XiShares Core S&P U.S. Value ETF XiShares Europe ETF XiShares Expanded Tech Sector ETF XiShares Expanded Tech-Software Sector ETF XiShares Global 100 ETF XiShares Global Clean Energy ETF XiShares Global Comm Services ETF XiShares Global Consumer Discretionary ETF XiShares Global Consumer Staples ETF XiShares Global Energy ETF XiShares Global Financials ETF XiShares Global Industrials ETF XiShares Global Infrastructure ETF XiShares Global Utilities ETF XiShares International Developed Property ETF XiShares International Preferred Stock ETF XiShares JPX-Nikkei 400 ETF XiShares Micro-Cap ETF XiShares Mortgage Real Estate ETF XiShares Nasdaq Biotechnology ETF XiShares North American Natural Resources ETF XiShares North American Tech-Multimedia
Networking ETFX
iShares PHLX Semiconductor ETF XiShares Preferred and Income Securities ETF XiShares Residential Real Estate ETF XiShares Russell 1000 ETF XiShares Russell 1000 Growth ETF XiShares Russell 1000 Pure U.S. Revenue ETF XiShares Russell 1000 Value ETF XiShares Russell 2000 ETF XiShares Russell 2000 Growth ETF XiShares Russell 2000 Value ETF XiShares Russell 3000 ETF XiShares Russell Mid-Cap ETF XiShares Russell Mid-Cap Growth ETF XiShares Russell Mid-Cap Value ETF XiShares Russell Top 200 ETF XiShares Russell Top 200 Growth ETF XiShares Russell Top 200 Value ETF XiShares S&P 100 ETF XiShares S&P 500 Growth ETF XiShares S&P 500 Value ETF XiShares S&P Mid-Cap 400 Growth ETF X
131

Amy WhitelawDollar Range
Fund None $1 to $10k$10,001to $50k
$50,001to $100k
$100,001to $500k
$500,001to $1m
over$1m
iShares S&P Mid-Cap 400 Value ETF XiShares S&P Small-Cap 600 Growth ETF XiShares S&P Small-Cap 600 Value ETF XiShares U.S. Aerospace & Defense ETF XiShares U.S. Broker-Dealers & Securities
Exchanges ETFX
iShares U.S. Healthcare Providers ETF XiShares U.S. Home Construction ETF XiShares U.S. Infrastructure ETF XiShares U.S. Insurance ETF XiShares U.S. Medical Devices ETF XiShares U.S. Oil & Gas Exploration & Production
ETFX
iShares U.S. Oil Equipment & Services ETF XiShares U.S. Pharmaceuticals ETF XiShares U.S. Real Estate ETF XiShares U.S. Regional Banks ETF XiShares U.S. Telecommunications ETF X
Codes of Ethics. The Trust, BFA, the Sub-Adviser and the Distributor have adopted codes of ethics pursuant to Rule 17j-1under the 1940 Act. The codes of ethics permit personnel subject to the codes of ethics to invest in securities, subject tocertain limitations, including securities that may be purchased or held by the Funds. The codes of ethics are on public filewith, and are available from, the SEC.
Anti-Money Laundering Requirements. The Funds are subject to the USA PATRIOT Act (the “Patriot Act”). The Patriot Act isintended to prevent the use of the U.S. financial system in furtherance of money laundering, terrorism or other illicit activities.Pursuant to requirements under the Patriot Act, a Fund may request information from Authorized Participants to enable it toform a reasonable belief that it knows the true identity of its Authorized Participants. This information will be used to verifythe identity of Authorized Participants or, in some cases, the status of financial professionals; it will be used only forcompliance with the requirements of the Patriot Act.
The Funds reserve the right to reject purchase orders from persons who have not submitted information sufficient to allowthe Fund to verify their identity. Each Fund also reserves the right to redeem any amounts in a Fund from persons whoseidentity it is unable to verify on a timely basis. It is the Funds’ policy to cooperate fully with appropriate regulators in anyinvestigations conducted with respect to potential money laundering, terrorism or other illicit activities.
Administrator, Custodian and Transfer Agent. State Street Bank and Trust Company (“State Street”) serves asadministrator, custodian and transfer agent for the Funds under the Master Services Agreement and related Service Schedule(the “Service Module”). State Street’s principal address is 1 Lincoln Street, Boston, MA 02111. Pursuant to the Service Modulefor Fund Administration and Accounting Services with the Trust, State Street provides necessary administrative, legal, tax andaccounting and financial reporting services for the maintenance and operations of the Trust and each Fund. In addition, StateStreet makes available the office space, equipment, personnel and facilities required to provide such services. Pursuant to theService Module for Custodial Services with the Trust, State Street maintains, in separate accounts, cash, securities and otherassets of the Trust and each Fund, keeps all necessary accounts and records and provides other services. State Street isrequired, upon the order of the Trust, to deliver securities held by State Street and to make payments for securities purchasedby the Trust for each Fund. State Street is authorized to appoint certain foreign custodians or foreign custody managers forFund investments outside the U.S. Pursuant to the Service Module for Transfer Agency Services with the Trust, State Streetacts as a transfer agent for each Fund’s authorized and issued shares of beneficial interest, and as dividend disbursing agentof the Trust. As compensation for these services, State Street receives certain out-of-pocket costs, transaction fees andasset-based fees which are accrued daily and paid monthly by BFA from its management fee.
132

The following table sets forth the administration, custodian and transfer agency expenses of each Fund paid by BFA to StateStreet for the fiscal years noted:
Fund
FundInception
Date
Administration,Custodian,
Transfer AgencyExpenses
Paid DuringFiscal Year
Ended March 31, 2018
Administration,Custodian,
Transfer AgencyExpenses
Paid DuringFiscal Year
Ended March 31, 2017
Administration,Custodian,
Transfer AgencyExpenses
Paid DuringFiscal Year
Ended March 31, 2016
iShares Core S&P 500 ETF 05/15/00 $2,135,822 $1,677,972 $1,506,326iShares Core S&P Mid-Cap ETF 05/22/00 675,859 654,390 590,904iShares Core S&P Small-Cap ETF 05/22/00 578,034 459,177 395,846iShares Core S&P Total U.S. Stock Market ETF 01/20/04 211,030 143,607 104,847iShares Core S&P U.S. Growth ETF 07/24/00 57,231 46,726 36,355iShares Core S&P U.S. Value ETF 07/24/00 63,742 47,998 38,765iShares Europe ETF 07/25/00 174,548 173,674 154,922iShares Global 100 ETF 12/05/00 58,134 58,685 62,642iShares Global Clean Energy ETF 06/24/08 15,702 13,108 13,777iShares Global Comm Services ETF 11/12/01 23,263 27,275 26,797iShares Global Consumer Discretionary ETF 09/12/06 18,692 18,959 18,107iShares Global Consumer Staples ETF 09/12/06 30,254 29,998 27,392iShares Global Energy ETF 11/12/01 35,001 37,845 41,264iShares Global Financials ETF 11/12/01 38,619 25,477 28,516iShares Global Industrials ETF 09/12/06 20,567 18,728 22,393iShares Global Infrastructure ETF 12/10/07 93,001 62,619 59,233iShares Global Utilities ETF 09/12/06 17,339 18,418 13,346iShares International Developed Property ETF 07/30/07 59,459 37,219 47,141iShares International Preferred Stock ETF 11/15/11 17,956 29,866 30,394iShares JPX-Nikkei 400 ETF 10/23/01 9,276 10,213 16,077iShares Micro-Cap ETF 08/12/05 35,832 27,500 28,883iShares Nasdaq Biotechnology ETF 02/05/01 184,703 188,016 209,356iShares Preferred and Income Securities ETF 03/26/07 293,151 333,180 301,556iShares Russell 1000 ETF 05/15/00 338,373 350,106 305,692iShares Russell 1000 Growth ETF 05/22/00 647,807 641,650 665,053iShares Russell 1000 Pure U.S. Revenue ETF 08/08/17 7,647 N/A N/AiShares Russell 1000 Value ETF 05/22/00 657,465 650,527 580,147iShares Russell 2000 ETF 05/22/00 772,445 935,805 1,042,820iShares Russell 2000 Growth ETF 07/24/00 172,278 165,103 173,325iShares Russell 2000 Value ETF 07/24/00 178,267 179,168 154,475iShares Russell 3000 ETF 05/22/00 156,384 149,825 150,816iShares Russell Mid-Cap ETF 07/17/01 279,101 303,441 309,897iShares Russell Mid-Cap Growth ETF 07/17/01 140,304 146,251 158,782iShares Russell Mid-Cap Value ETF 07/17/01 188,969 189,267 182,865iShares Russell Top 200 ETF 09/22/09 11,009 10,257 9,273iShares Russell Top 200 Growth ETF 09/22/09 23,882 19,894 19,382iShares Russell Top 200 Value ETF 09/22/09 13,037 10,429 10,879iShares S&P 100 ETF 10/23/00 90,940 96,784 103,496iShares S&P 500 Growth ETF 05/22/00 334,873 297,964 300,155iShares S&P 500 Value ETF 05/22/00 258,470 242,244 199,387iShares S&P Mid-Cap 400 Growth ETF 07/24/00 138,094 139,458 143,871iShares S&P Mid-Cap 400 Value ETF 07/24/00 113,892 127,341 111,682iShares S&P Small-Cap 600 Growth ETF 07/24/00 105,812 100,433 97,394iShares S&P Small-Cap 600 Value ETF 07/24/00 105,908 111,271 102,274iShares U.S. Infrastructure ETF 04/03/18 N/A N/A N/A
133

Fund1Fund Inception
Date
Administration,Custodian,
Transfer AgencyExpenses
Paid DuringFiscal Year
Ended March 31, 2018
Administration,Custodian,
Transfer AgencyExpenses
Paid DuringFiscal Year
Ended March 31, 2017
Administration,Custodian,
Transfer AgencyExpenses
Paid DuringPeriod from
May 1, 2015 toMarch 31, 20161
Administration,Custodian,
Transfer AgencyExpenses
Paid DuringFiscal Year
Ended April 30, 2015
iShares Mortgage Real EstateETF 05/01/07 $ 28,294 $ 29,241 $ 24,876 $ 34,815
iShares Residential Real EstateETF 05/01/07 12,649 13,569 11,992 11,693
iShares U.S. Aerospace &Defense ETF 05/01/06 71,052 28,256 14,419 12,490
iShares U.S. Broker-Dealers &Securities Exchanges ETF 05/01/06 6,830 5,721 8,497 7,481
iShares U.S. HealthcareProviders ETF 05/01/06 12,396 15,037 20,537 17,605
iShares U.S. HomeConstruction ETF 05/01/06 33,596 29,859 41,978 42,271
iShares U.S. Insurance ETF 05/01/06 7,986 7,112 5,931 6,195iShares U.S. Medical Devices
ETF 05/01/06 26,518 26,720 19,529 20,664iShares U.S. Oil & Gas
Exploration & ProductionETF 05/01/06 11,941 11,996 12,418 16,193
iShares U.S. Oil Equipment &Services ETF 05/01/06 7,625 8,365 8,934 14,398
iShares U.S. PharmaceuticalsETF 05/01/06 15,492 18,320 25,293 24,541
iShares U.S. Real Estate ETF 06/12/00 104,153 153,739 142,575 206,468iShares U.S. Regional Banks
ETF 05/01/06 16,680 14,167 14,876 15,926iShares U.S.
Telecommunications ETF 05/22/00 19,114 16,736 13,653 17,000
1 Each Fund’s fiscal year-end was changed from April 30 to March 31.
Fund1
FundInception
Date
Administration,Custodian,
Transfer AgencyExpenses
Paid DuringFiscal Year
Ended March 31, 2018
Administration,Custodian,
Transfer AgencyExpenses
Paid DuringFiscal Year
Ended March 31, 2017
Administration,Custodian,
Transfer AgencyExpenses
Paid DuringPeriod from
August 1, 2015 toMarch 31, 20161
Administration,Custodian,
Transfer AgencyExpenses
Paid DuringFiscal Year
Ended July 31, 2015
iShares Expanded Tech SectorETF 03/13/01 27,577 26,143 17,265 22,117
iShares Expanded Tech-SoftwareSector ETF 07/10/01 21,746 20,826 15,404 29,725
iShares North American NaturalResources ETF 10/22/01 $22,928 $29,390 $ 27,191 $55,654
iShares North American Tech-Multimedia Networking ETF 07/10/01 4,469 3,814 3,584 6,670
iShares PHLX Semiconductor ETF 07/10/01 23,662 21,247 9,796 15,653
1 Each Fund’s fiscal year-end was changed from July 31 to March 31.
134
Distributor. The Distributor’s principal address is 1 University Square Drive, Princeton, NJ 08540. Shares are continuouslyoffered for sale by the Funds through the Distributor or its agent only in Creation Units, as described in the applicableProspectus and below in the Creation and Redemption of Creation Units section of this SAI. Fund shares in amounts less thanCreation Units are generally not distributed by the Distributor or its agent. The Distributor or its agent will arrange for thedelivery of the applicable Prospectus and, upon request, this SAI to persons purchasing Creation Units and will maintainrecords of both orders placed with it or its agents and confirmations of acceptance furnished by it or its agents. TheDistributor is a broker-dealer registered under the Securities Exchange Act of 1934, as amended (the “1934 Act”), and amember of the Financial Industry Regulatory Authority, Inc. (“FINRA”). The Distributor is also licensed as a broker-dealer in all50 U.S. states, as well as in Puerto Rico, the U.S. Virgin Islands and the District of Columbia.
The Distribution Agreement for each Fund provides that it may be terminated at any time, without the payment of anypenalty, on at least 60 days’ prior written notice to the other party following (i) the vote of a majority of the IndependentTrustees, or (ii) the vote of a majority of the outstanding voting securities (as defined in the 1940 Act) of the relevant Fund.The Distribution Agreement will terminate automatically in the event of its assignment (as defined in the 1940 Act).
The Distributor may also enter into agreements with securities dealers (“Soliciting Dealers”) who will solicit purchases ofCreation Units of Fund shares. Such Soliciting Dealers may also be Authorized Participants (as described below), DTCparticipants and/or investor services organizations.
BFA or its affiliates may, from time to time and from its own resources, pay, defray or absorb costs relating to distribution,including payments out of its own resources to the Distributor, or to otherwise promote the sale of shares.
Securities Lending. To the extent that a Fund engages in securities lending, each Fund conducts its securities lendingpursuant to SEC exemptive relief, and BTC acts as securities lending agent for the Funds, subject to the overall supervision ofBFA, pursuant to a written agreement (the “Securities Lending Agency Agreement”).
Each Fund retains a portion of the securities lending income and remits the remaining portion to BTC as compensation for itsservices as securities lending agent. Securities lending income is generally equal to the total of income earned from thereinvestment of cash collateral (and excludes collateral investment fees as defined below), and any fees or other payments toand from borrowers of securities. As securities lending agent, BTC bears all operational costs directly related to securitieslending. Each Fund is responsible for fees in connection with the investment of cash collateral received for securities on loanin a money market fund managed by BFA (the “collateral investment fees”); however, BTC has agreed to reduce the amountof securities lending income it receives in order to effectively limit the collateral investment fees a Fund bears to an annualrate of 0.04%. Such money market fund shares will not be subject to a sales load, redemption fee, distribution fee or servicefee.
Pursuant to the Securities Lending Agency Agreement:
(i) All Funds except for the iShares Europe ETF, iShares Global 100 ETF, iShares Global Clean Energy ETF, iShares GlobalComm Services ETF, iShares Global Consumer Discretionary ETF, iShares Global Consumer Staples ETF, iShares Global EnergyETF, iShares Global Financials ETF, iShares Global Healthcare ETF, iShares Global Industrials ETF, iShares Global InfrastructureETF, iShares Global Utilities ETF, iShares International Developed Property ETF, iShares International Preferred Stock ETF andiShares JPX-Nikkei 400 ETF (“Domestic Equity Funds”) retain 71.5% of securities lending income (which excludes collateralinvestment fees) and (ii) this amount can never be less than 65% of the sum of securities lending income plus collateralinvestment fees.
(i) The iShares Europe ETF, iShares Global 100 ETF, iShares Global Clean Energy ETF, iShares Global Comm Services ETF,iShares Global Consumer Discretionary ETF, iShares Global Consumer Staples ETF, iShares Global Energy ETF, iShares GlobalFinancials ETF, iShares Global Healthcare ETF, iShares Global Industrials ETF, iShares Global Infrastructure ETF, iShares GlobalUtilities ETF, iShares International Developed Property ETF, iShares International Preferred Stock ETF and iShares JPX-Nikkei400 ETF (“International Equity Funds”) retain 80% of securities lending income (which excludes collateral investment fees)and (ii) this amount can never be less than 70% of the sum of securities lending income plus collateral investment fees.
Under the securities lending program, the Funds are categorized into one of several specific asset classes. The determinationof a Fund’s asset class category (fixed-income, domestic equity, international equity or fund-of-funds), each of which may besubject to a different fee arrangement, is based on a methodology agreed to by the Trust and BTC.
135

In addition, commencing the business day following the date that the aggregate securities lending income (which includes,for this purpose, collateral investment fees) earned across the Exchange-Traded Fund Complex (as defined under“Management — Trustees and Officers”) in a calendar year exceeds the aggregate securities lending income earned acrossthe Exchange-Traded Fund Complex in calendar year 2013 (the Hurdle Date), each applicable Fund, pursuant to thesecurities lending agreement, will receive for the remainder of that calendar year securities lending income as follows:
Domestic Equity Funds
(i) 75% of securities lending income (which excludes collateral investment fees) and (ii) this amount can never be less than65% of the sum of securities lending income plus collateral investment fees.
International Equity Funds
(i) 85% of securities lending income (which excludes collateral investment fees) and (ii) this amount can never be less than70% of the sum of securities lending income plus collateral investment fees.
The services provided to the Funds by BTC in the most recent fiscal year ended March 31, 2018 primarily included thefollowing:
(1) selecting borrowers from an approved list of borrowers and executing a securities lending agreement as agent onbehalf of the Funds with each such borrower;
(2) negotiating the terms of securities loans, including the amount of fees;
(3) directing the delivery of loaned securities;
(4) monitoring the daily value of the loaned securities and directing the payment of additional collateral or the return ofexcess collateral, as necessary;
(5) investing cash collateral received in connection with any loaned securities;
(6) monitoring distributions on loaned securities (for example, interest and dividend activity);
(7) in the event of default by a borrower with respect to any securities loan, using the collateral or the proceeds of theliquidation of collateral to purchase replacement securities of the same issue, type, class and series as that of the loanedsecurities; and
(8) terminating securities loans and arranging for the return of loaned securities to the Funds at loan termination.
The following tables show the dollar amounts of income and fees/compensation related to the securities lending activities ofeach Fund during its most recent fiscal year ended March 31, 2018.
FundiShares CoreS&P 500 ETF
iShares Core S&PMid-Cap ETF
iShares Core S&PSmall-Cap ETF
iShares Core S&PTotal U.S. Stock
Market ETF
Gross income fromsecuritieslending activities
$13,130,543 $45,793,843 $72,393,315 $7,744,236
Fees and/or compensationfor securities lendingactivities andrelated services
Securities lendingincome paid toBTC for services assecuritieslending agent
1,287,668 5,849,985 12,773,349 1,238,018
136

FundiShares CoreS&P 500 ETF
iShares Core S&PMid-Cap ETF
iShares Core S&PSmall-Cap ETF
iShares Core S&PTotal U.S. Stock
Market ETF
Cash collateralmanagementexpenses not included insecurities lendingincome paid to BTC
315,440 998,642 1,121,528 133,388
Administrative fees notincluded in securitieslending income paidto BTC
0 0 0 0
Indemnification fees notincludedin securities lendingincome paidto BTC
0 0 0 0
Rebates (paid toborrowers)
8,052,715 23,340,109 24,467,671 3,077,089
Other fees notincluded insecurities lendingincome paid to BTC
0 0 0 0
Aggregatefees/compensation forsecurities lendingactivities
9,655,823 30,188,736 38,362,548 4,448,495
Net income from securitieslending activities
3,474,720 15,605,107 34,030,767 3,295,741
FundiShares Core S&PU.S. Growth ETF
iShares Core S&PU.S. Value ETF iShares Europe ETF
iShares ExpandedTech Sector ETF
Gross income fromsecuritieslending activities
$425,957 $411,203 $375,702 $551,715
Fees and/or compensationfor securities lendingactivities andrelated services
Securities lendingincome paid toBTC for services assecuritieslending agent
49,677 51,454 55,691 63,372
Cash collateralmanagementexpenses not included insecurities lendingincome paid to BTC
9,213 9,035 4,317 12,479
Administrative fees notincluded in securitieslending income paidto BTC
0 0 0 0
137

FundiShares Core S&PU.S. Growth ETF
iShares Core S&PU.S. Value ETF iShares Europe ETF
iShares ExpandedTech Sector ETF
Indemnification fees notincludedin securities lendingincome paidto BTC
0 0 0 0
Rebates (paid toborrowers)
229,922 213,949 74,209 308,030
Other fees notincluded insecurities lendingincome paid to BTC
0 0 0 0
Aggregatefees/compensation forsecurities lendingactivities
288,812 274,438 134,217 383,881
Net income from securitieslending activities
137,145 136,765 241,485 167,834
FundiShares Expanded Tech-Software
Sector ETF iShares Global 100 ETFiShares Global
Clean Energy ETFiShares Global
Comm Services ETF
Gross income fromsecuritieslending activities
$1,320,213 $76,482 $1,282,977 $587
Fees and/orcompensationfor securitieslendingactivities andrelated services
Securitieslendingincome paid toBTC for servicesassecuritieslending agent
104,542 10,170 219,815 103
Cash collateralmanagementexpenses notincluded insecuritieslendingincome paid toBTC
35,407 1,135 8,919 9
Administrativefees notincluded insecuritieslending incomepaidto BTC
0 0 0 0
138

FundiShares Expanded Tech-Software
Sector ETF iShares Global 100 ETFiShares Global
Clean Energy ETFiShares Global
Comm Services ETF
Indemnificationfees notincludedin securitieslendingincome paidto BTC
0 0 0 0
Rebates (paid toborrowers)
902,064 20,532 74,892 60
Other fees notincluded insecuritieslendingincome paid toBTC
0 0 0 0
Aggregatefees/compensationforsecurities lendingactivities
1,042,013 31,837 303,626 172
Net income fromsecuritieslending activities
278,200 44,645 979,351 415
FundiShares Global Consumer
Discretionary ETFiShares Global
Consumer Staples ETFiShares Global
Energy ETFiShares GlobalFinancials ETF
Gross income fromsecuritieslending activities
$105,985 $17,453 $202,512 $24,427
Fees and/or compensationfor securities lendingactivities andrelated services
Securities lendingincome paid toBTC for services assecuritieslending agent
12,849 3,388 19,668 3,418
Cash collateralmanagementexpenses not included insecurities lendingincome paid to BTC
1,839 47 3,850 359
Administrative fees notincluded in securitieslending income paidto BTC
0 0 0 0
Indemnification fees notincludedin securities lendingincome paidto BTC
0 0 0 0
139

FundiShares Global Consumer
Discretionary ETFiShares Global
Consumer Staples ETFiShares Global
Energy ETFiShares GlobalFinancials ETF
Rebates (paid toborrowers)
35,438 67 87,710 6,365
Other fees notincluded insecurities lendingincome paid to BTC
0 0 0 0
Aggregatefees/compensation forsecurities lendingactivities
50,126 3,502 111,228 10,142
Net income from securitieslending activities
55,859 13,951 91,284 14,285
FundiShares GlobalIndustrials ETF
iShares GlobalInfrastructure ETF
iShares GlobalUtilities ETF
iShares InternationalDeveloped Property ETF
Gross income fromsecuritieslending activities
$15,770 $394,734 $14,485 $79,116
Fees and/or compensationfor securities lendingactivities andrelated services
Securities lendingincome paid toBTC for services assecuritieslending agent
1,058 38,143 2,553 12,511
Cash collateralmanagementexpenses not included insecurities lendingincome paid to BTC
405 9,827 59 931
Administrative fees notincluded in securitieslending income paidto BTC
0 0 0 0
Indemnification fees notincludedin securities lendingincome paidto BTC
0 0 0 0
Rebates (paid toborrowers)
9,715 175,106 122 10,684
Other fees notincluded insecurities lendingincome paid to BTC
0 0 0 0
Aggregatefees/compensation forsecurities lendingactivities
11,178 223,076 2,734 24,126
140
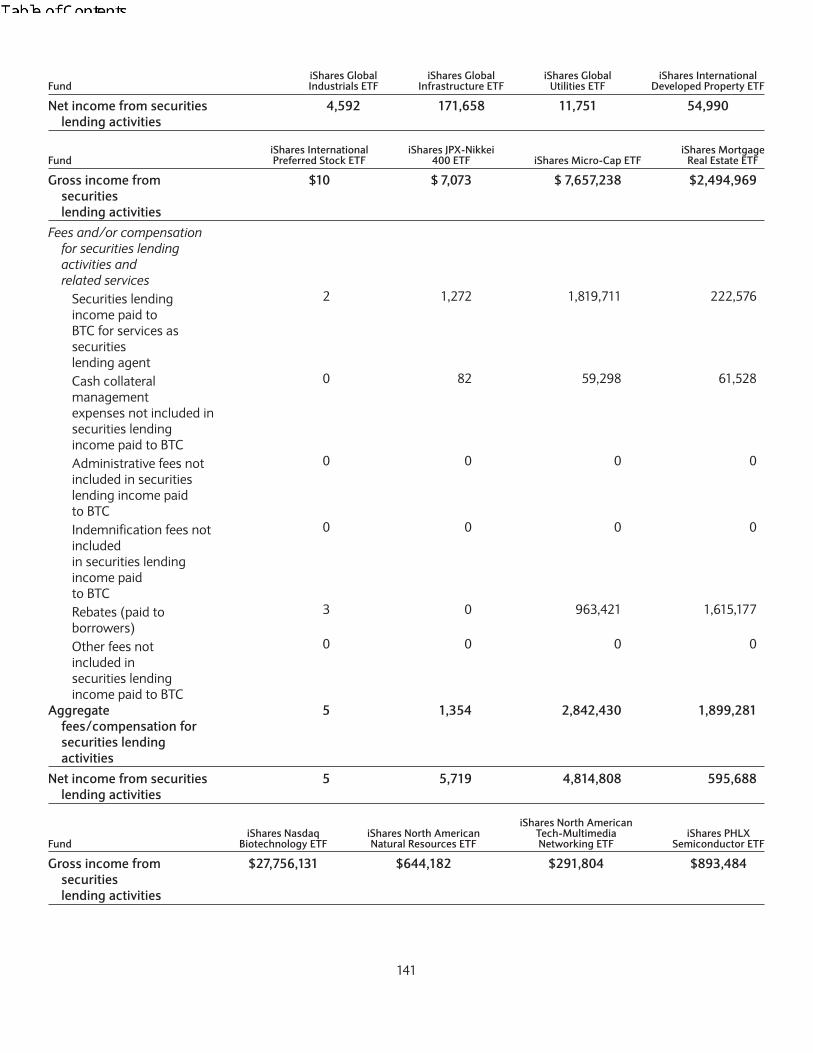
FundiShares GlobalIndustrials ETF
iShares GlobalInfrastructure ETF
iShares GlobalUtilities ETF
iShares InternationalDeveloped Property ETF
Net income from securitieslending activities
4,592 171,658 11,751 54,990
FundiShares InternationalPreferred Stock ETF
iShares JPX-Nikkei400 ETF iShares Micro-Cap ETF
iShares MortgageReal Estate ETF
Gross income fromsecuritieslending activities
$10 $ 7,073 $ 7,657,238 $2,494,969
Fees and/or compensationfor securities lendingactivities andrelated services
Securities lendingincome paid toBTC for services assecuritieslending agent
2 1,272 1,819,711 222,576
Cash collateralmanagementexpenses not included insecurities lendingincome paid to BTC
0 82 59,298 61,528
Administrative fees notincluded in securitieslending income paidto BTC
0 0 0 0
Indemnification fees notincludedin securities lendingincome paidto BTC
0 0 0 0
Rebates (paid toborrowers)
3 0 963,421 1,615,177
Other fees notincluded insecurities lendingincome paid to BTC
0 0 0 0
Aggregatefees/compensation forsecurities lendingactivities
5 1,354 2,842,430 1,899,281
Net income from securitieslending activities
5 5,719 4,814,808 595,688
FundiShares Nasdaq
Biotechnology ETFiShares North AmericanNatural Resources ETF
iShares North AmericanTech-MultimediaNetworking ETF
iShares PHLXSemiconductor ETF
Gross income fromsecuritieslending activities
$27,756,131 $644,182 $291,804 $893,484
141

FundiShares Nasdaq
Biotechnology ETFiShares North AmericanNatural Resources ETF
iShares North AmericanTech-MultimediaNetworking ETF
iShares PHLXSemiconductor ETF
Fees and/orcompensationfor securities lendingactivities andrelated services
Securities lendingincome paid toBTC for services assecuritieslending agent
4,442,442 59,839 47,576 69,053
Cash collateralmanagementexpenses notincluded insecurities lendingincome paid to BTC
522,333 16,283 4,861 24,310
Administrative feesnotincluded in securitieslending income paidto BTC
0 0 0 0
Indemnification feesnotincludedin securities lendingincome paidto BTC
0 0 0 0
Rebates (paid toborrowers)
11,136,961 406,108 112,949 615,656
Other fees notincluded insecurities lendingincome paid to BTC
0 0 0 0
Aggregatefees/compensation forsecurities lendingactivities
16,101,736 482,230 165,386 709,019
Net income fromsecuritieslending activities
11,654,395 161,952 126,418 184,465
FundiShares Preferred and Income
Securities ETFiShares Residential
Real Estate ETFiShares Russell
1000 ETFiShares Russell 1000
Growth ETF
Gross income fromsecuritieslending activities
$2,680,057 $363,818 $5,932,272 $14,826,600
Fees and/or compensationfor securities lendingactivities andrelated services
142

FundiShares Preferred and Income
Securities ETFiShares Residential
Real Estate ETFiShares Russell
1000 ETFiShares Russell 1000
Growth ETF
Securities lendingincome paid toBTC for services assecuritieslending agent
730,377 34,335 644,653 1,735,526
Cash collateralmanagementexpenses not includedinsecurities lendingincome paid to BTC
15,089 9,961 146,790 360,682
Administrative fees notincluded in securitieslending income paidto BTC
0 0 0 0
Indemnification feesnotincludedin securities lendingincome paidto BTC
0 0 0 0
Rebates (paid toborrowers)
6,351 228,407 3,434,065 8,131,851
Other fees notincluded insecurities lendingincome paid to BTC
0 0 0 0
Aggregatefees/compensation forsecurities lendingactivities
751,817 272,703 4,225,508 10,228,059
Net income from securitieslending activities
1,928,240 91,115 1,706,764 4,598,541
FundiShares Russell 1000 Pure
U.S. Revenue ETFiShares Russell 1000
Value ETFiShares Russell
2000 ETFiShares Russell 2000
Growth ETF
Gross income fromsecuritieslending activities
N/A $6,998,235 $156,402,663 $43,597,685
Fees and/or compensationfor securities lendingactivities andrelated services
Securities lendingincome paid toBTC for services assecuritieslending agent
0 677,619 29,911,974 8,288,330
143

FundiShares Russell 1000 Pure
U.S. Revenue ETFiShares Russell 1000
Value ETFiShares Russell
2000 ETFiShares Russell 2000
Growth ETF
Cash collateralmanagementexpenses not includedinsecurities lendingincome paid to BTC
0 175,733 2,167,588 613,362
Administrative fees notincluded in securitieslending income paidto BTC
0 0 0 0
Indemnification feesnotincludedin securities lendingincome paidto BTC
0 0 0 0
Rebates (paid toborrowers)
0 4,343,616 44,744,256 12,730,108
Other fees notincluded insecurities lendingincome paid to BTC
0 0 0 0
Aggregatefees/compensation forsecurities lendingactivities
0 5,196,968 76,823,818 21,631,800
Net income from securitieslending activities
N/A 1,801,267 79,578,845 21,965,885
FundiShares Russell 2000
Value ETFiShares Russell
3000 ETFiShares Russell Mid
Cap ETFiShares Russell
Mid-Cap Growth ETF
Gross income fromsecuritieslending activities
$25,598,102 $4,708,937 $13,620,211 $9,079,169
Fees and/or compensationfor securities lendingactivities andrelated services
Securities lendingincome paid toBTC for services assecuritieslending agent
4,776,653 717,580 1,441,291 1,009,001
Cash collateralmanagementexpenses not included insecurities lendingincome paid to BTC
365,216 89,663 334,186 219,342
144

FundiShares Russell 2000
Value ETFiShares Russell
3000 ETFiShares Russell Mid
Cap ETFiShares Russell
Mid-Cap Growth ETF
Administrative fees notincluded in securitieslending income paidto BTC
0 0 0 0
Indemnification fees notincludedin securities lendingincome paidto BTC
0 0 0 0
Rebates (paid toborrowers)
7,712,993 2,000,867 8,042,322 5,198,876
Other fees notincluded insecurities lendingincome paid to BTC
0 0 0 0
Aggregatefees/compensation forsecurities lendingactivities
12,854,862 2,808,110 9,817,799 6,427,219
Net income from securitieslending activities
12,743,240 1,900,827 3,802,412 2,651,950
FundiShares Russell
Mid-Cap Value ETFiShares Russell
Top 200 ETFiShares Russell Top 200
Growth ETFiShares Russell Top 200
Value ETF
Gross income fromsecuritieslending activities
$5,739,192 $6,570 $112,790 $4,588
Fees and/or compensationfor securities lendingactivities andrelated services
Securities lendingincome paid toBTC for services assecuritieslending agent
559,378 986 16,191 450
Cash collateralmanagementexpenses not included insecurities lendingincome paid to BTC
144,099 159 2,821 126
Administrative fees notincluded in securitieslending income paidto BTC
0 0 0 0
Indemnification fees notincludedin securities lendingincome paidto BTC
0 0 0 0
145
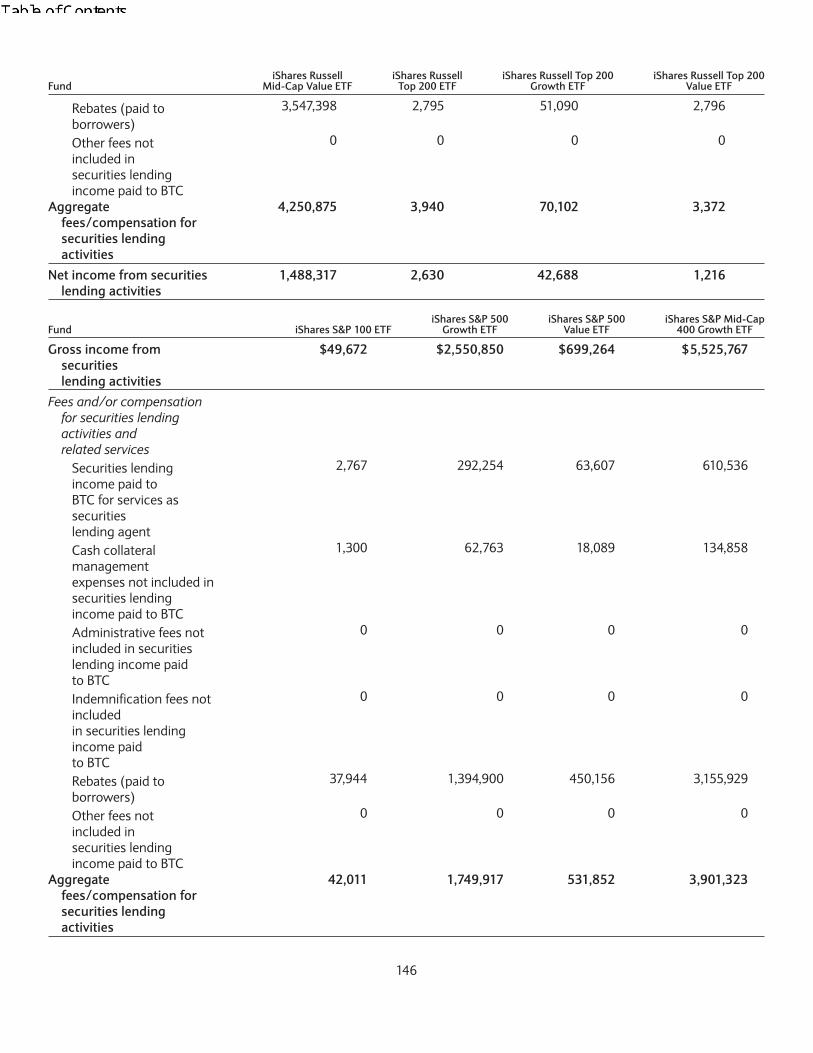
FundiShares Russell
Mid-Cap Value ETFiShares Russell
Top 200 ETFiShares Russell Top 200
Growth ETFiShares Russell Top 200
Value ETF
Rebates (paid toborrowers)
3,547,398 2,795 51,090 2,796
Other fees notincluded insecurities lendingincome paid to BTC
0 0 0 0
Aggregatefees/compensation forsecurities lendingactivities
4,250,875 3,940 70,102 3,372
Net income from securitieslending activities
1,488,317 2,630 42,688 1,216
Fund iShares S&P 100 ETFiShares S&P 500
Growth ETFiShares S&P 500
Value ETFiShares S&P Mid-Cap
400 Growth ETF
Gross income fromsecuritieslending activities
$49,672 $2,550,850 $699,264 $5,525,767
Fees and/or compensationfor securities lendingactivities andrelated services
Securities lendingincome paid toBTC for services assecuritieslending agent
2,767 292,254 63,607 610,536
Cash collateralmanagementexpenses not included insecurities lendingincome paid to BTC
1,300 62,763 18,089 134,858
Administrative fees notincluded in securitieslending income paidto BTC
0 0 0 0
Indemnification fees notincludedin securities lendingincome paidto BTC
0 0 0 0
Rebates (paid toborrowers)
37,944 1,394,900 450,156 3,155,929
Other fees notincluded insecurities lendingincome paid to BTC
0 0 0 0
Aggregatefees/compensation forsecurities lendingactivities
42,011 1,749,917 531,852 3,901,323
146

Fund iShares S&P 100 ETFiShares S&P 500
Growth ETFiShares S&P 500
Value ETFiShares S&P Mid-Cap
400 Growth ETF
Net income from securitieslending activities
7,661 800,933 167,412 1,624,444
FundiShares S&P Mid-Cap
400 Value ETFiShares S&P Small-Cap
600 Growth ETFiShares S&P Small-Cap
600 Value ETFiShares U.S. Aerospace &
Defense ETF
Gross income fromsecuritieslending activities
$8,633,427 $9,152,602 $13,010,084 $3,398,883
Fees and/orcompensationfor securitieslendingactivities andrelated services
Securities lendingincome paid toBTC for servicesassecuritieslending agent
1,184,508 1,273,510 2,592,349 631,208
Cash collateralmanagementexpenses notincluded insecurities lendingincome paid toBTC
184,667 188,260 168,092 55,975
Administrativefees notincluded insecuritieslending incomepaidto BTC
0 0 0 0
Indemnificationfees notincludedin securitieslendingincome paidto BTC
0 0 0 0
Rebates (paid toborrowers)
4,117,642 4,284,685 3,377,730 1,048,528
Other fees notincluded insecurities lendingincome paid toBTC
0 0 0 0
147

FundiShares S&P Mid-Cap
400 Value ETFiShares S&P Small-Cap
600 Growth ETFiShares S&P Small-Cap
600 Value ETFiShares U.S. Aerospace &
Defense ETF
Aggregatefees/compensationforsecurities lendingactivities
5,486,817 5,746,455 6,138,171 1,735,711
Net income fromsecuritieslending activities
3,146,610 3,406,147 6,871,913 1,663,172
FundiShares U.S. Broker-Dealers &
Securities Exchanges ETFiShares U.S. Healthcare
Providers ETFiShares U.S. HomeConstruction ETF
Gross income fromsecuritieslending activities
$33,605 $570,837 $1,465,085
Fees and/or compensationfor securities lendingactivities andrelated services
Securities lendingincome paid toBTC for services assecuritieslending agent
2,716 57,411 155,238
Cash collateralmanagementexpenses not included insecurities lendingincome paid to BTC
870 14,956 39,195
Administrative fees notincluded in securitieslending income paidto BTC
0 0 0
Indemnification fees notincludedin securities lendingincome paidto BTC
0 0 0
Rebates (paid toborrowers)
22,758 346,956 862,068
Other fees notincluded insecurities lendingincome paid to BTC
0 0 0
Aggregatefees/compensation forsecurities lendingactivities
26,344 419,323 1,056,501
Net income from securitieslending activities
7,261 151,514 408,584
148

FundiShares U.S.
Infrastructure ETF1iShares U.S.
Insurance ETFiShares U.S. Medical
Devices ETF
Gross income fromsecuritieslending activities
N/A $27,268 $876,207
Fees and/or compensationfor securities lendingactivities andrelated services
Securities lendingincome paid toBTC for services assecuritieslending agent
N/A 5,832 55,611
Cash collateralmanagementexpenses not included insecurities lendingincome paid to BTC
N/A 256 23,832
Administrative fees notincluded in securitieslending income paidto BTC
N/A 0 0
Indemnification fees notincludedin securities lendingincome paidto BTC
N/A 0 0
Rebates (paid toborrowers)
N/A 5,279 645,432
Other fees notincluded insecurities lendingincome paid to BTC
N/A 0 0
Aggregatefees/compensation forsecurities lendingactivities
N/A 11,367 724,875
Net income from securitieslending activities
N/A 15,901 151,332
FundiShares U.S. Oil & Gas
Exploration & Production ETFIShares U.S. Oil Equipment
& Services ETFiShares U.S.
Pharmaceuticals ETF
Gross income fromsecuritieslending activities
$394,955 $694,923 $3,119,269
Fees and/or compensationfor securities lendingactivities andrelated services
149
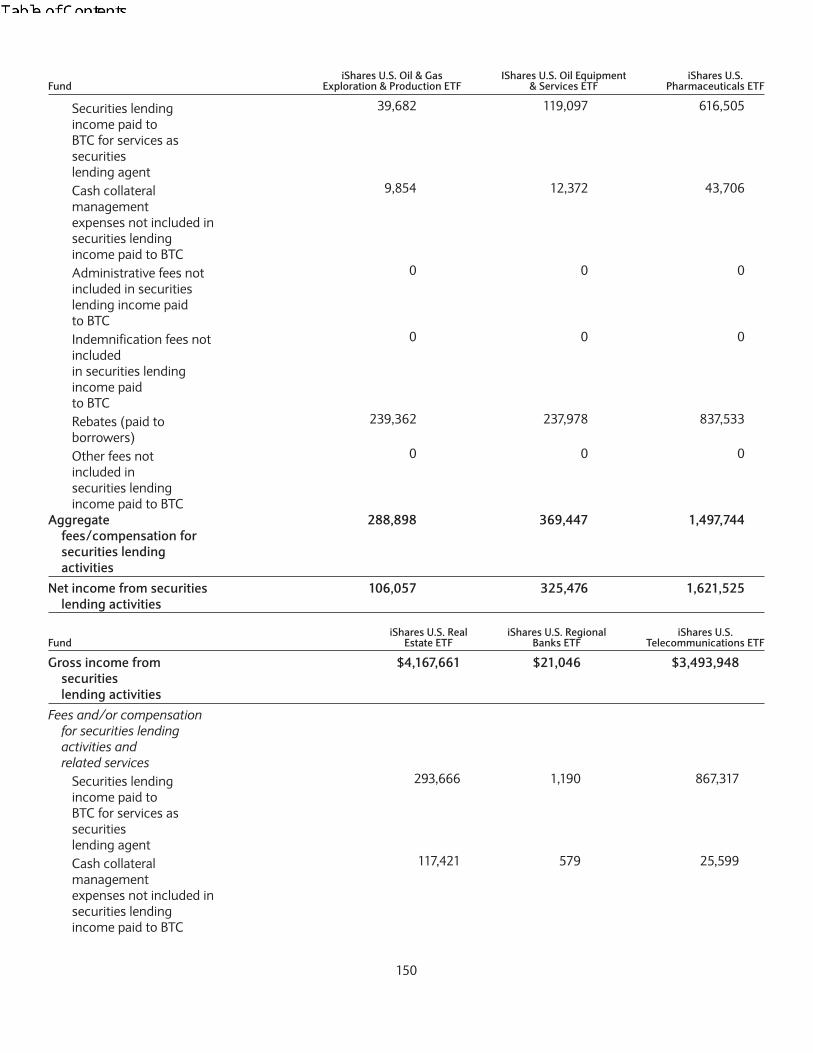
FundiShares U.S. Oil & Gas
Exploration & Production ETFIShares U.S. Oil Equipment
& Services ETFiShares U.S.
Pharmaceuticals ETF
Securities lendingincome paid toBTC for services assecuritieslending agent
39,682 119,097 616,505
Cash collateralmanagementexpenses not included insecurities lendingincome paid to BTC
9,854 12,372 43,706
Administrative fees notincluded in securitieslending income paidto BTC
0 0 0
Indemnification fees notincludedin securities lendingincome paidto BTC
0 0 0
Rebates (paid toborrowers)
239,362 237,978 837,533
Other fees notincluded insecurities lendingincome paid to BTC
0 0 0
Aggregatefees/compensation forsecurities lendingactivities
288,898 369,447 1,497,744
Net income from securitieslending activities
106,057 325,476 1,621,525
FundiShares U.S. Real
Estate ETFiShares U.S. Regional
Banks ETFiShares U.S.
Telecommunications ETF
Gross income fromsecuritieslending activities
$4,167,661 $21,046 $3,493,948
Fees and/or compensationfor securities lendingactivities andrelated services
Securities lendingincome paid toBTC for services assecuritieslending agent
293,666 1,190 867,317
Cash collateralmanagementexpenses not included insecurities lendingincome paid to BTC
117,421 579 25,599
150

FundiShares U.S. Real
Estate ETFiShares U.S. Regional
Banks ETFiShares U.S.
Telecommunications ETF
Administrative fees notincluded in securitieslending income paidto BTC
0 0 0
Indemnification fees notincludedin securities lendingincome paidto BTC
0 0 0
Rebates (paid toborrowers)
2,964,637 15,924 335,454
Other fees notincluded insecurities lendingincome paid to BTC
0 0 0
Aggregatefees/compensation forsecurities lendingactivities
3,375,724 17,693 1,228,370
Net income from securitieslending activities
791,937 3,353 2,265,578
1 For the iShares U.S. Infrastructure ETF, because the inception date of the Fund is April 3, 2018, no services have been provided by BTC as the Fund’ssecurities lending agent, and the Fund had no income and fees/compensation related to its securities lending activities for the fiscal year endedMarch 31, 2018.
Payments by BFA and its Affiliates. BFA and/or its affiliates (“BFA Entities”) may pay certain broker-dealers, registeredinvestment advisers, banks and other financial intermediaries (“Intermediaries”) for certain activities related to the Funds,other iShares funds or exchange-traded products in general. BFA Entities make these payments from their own assets andnot from the assets of the Funds. Although a portion of BFA Entities’ revenue comes directly or indirectly in part from feespaid by the Funds, other iShares funds or exchange-traded products, these payments do not increase the price paid byinvestors for the purchase of shares of, or the cost of owning, the Funds, other iShares funds or exchange-traded products.BFA Entities make payments for Intermediaries’ participation in activities that are designed to make registeredrepresentatives, other professionals and individual investors more knowledgeable about exchange-traded products, includingthe Funds and other iShares funds, or for other activities, such as participation in marketing activities and presentations,educational training programs, conferences, the development of technology platforms and reporting systems (“EducationCosts”). BFA Entities also make payments to Intermediaries for certain printing, publishing and mailing costs or materialsrelating to the Funds, other iShares funds or exchange-traded products (“Publishing Costs”). In addition, BFA Entities makepayments to Intermediaries that make shares of the Funds, other iShares funds or exchange-traded products available totheir clients, develop new products that feature iShares or otherwise promote the Funds, other iShares funds and exchange-traded products. BFA Entities may also reimburse expenses or make payments from their own assets to Intermediaries orother persons in consideration of services or other activities that the BFA Entities believe may benefit the iShares business orfacilitate investment in the Funds, other iShares funds or exchange-traded products. Payments of the type described aboveare sometimes referred to as revenue-sharing payments.
Payments to an Intermediary may be significant to the Intermediary, and amounts that Intermediaries pay to yoursalesperson or other investment professional may also be significant for your salesperson or other investment professional.Because an Intermediary may make decisions about which investment options it will recommend or make available to itsclients or what services to provide for various products based on payments it receives or is eligible to receive, such paymentsmay create conflicts of interest between the Intermediary and its clients and these financial incentives may cause theIntermediary to recommend the Funds, other iShares funds or exchange-traded products over other investments. The same
151

conflicts of interest and financial incentives exist with respect to your salesperson or other investment professional if he orshe receives similar payments from his or her Intermediary firm.
In addition to the payments described above, BFA Entities have developed proprietary tools, calculators and relatedinteractive or digital content that is made available through the www.BlackRock.com website at no additional cost toIntermediaries. BlackRock may configure these tools and calculators and localizes the content for Intermediaries as part of itscustomary digital marketing support and promotion of the Funds, other iShares funds, exchange-traded products andBlackRock mutual funds.
As of March 1, 2013, BFA Entities have contractual arrangements to make payments (in addition to payments for EducationCosts or Publishing Costs) to one Intermediary, Fidelity Brokerage Services LLC (“FBS”). Effective June 4, 2016, thisrelationship was expanded to include National Financial Services, LLC (“NFS”), an affiliate of FBS. Pursuant to this special,long-term and significant arrangement (the “Marketing Program”), FBS, NFS and certain of their affiliates (collectively“Fidelity”) have agreed, among other things, to actively promote iShares funds to customers, investment professionals andother intermediaries and in advertising campaigns as the preferred exchange-traded product, to offer certain iShares funds incertain Fidelity platforms and investment programs, in some cases at a waived or reduced commission rate or ticket charge,and to provide marketing data to BFA Entities. BFA Entities have agreed to facilitate the Marketing Program by, among otherthings, making certain payments to FBS and NFS for marketing and implementing certain brokerage and investmentprograms. Upon termination of the arrangement, the BFA Entities will make additional payments to FBS and/or NFS basedupon a number of criteria, including the overall success of the Marketing Program and the level of services provided by FBSand NFS during the wind-down period.
In addition, BFA Entities may enter into other contractual arrangements with Intermediaries and certain other third partiesthat the BFA Entities believe may benefit the iShares business or facilitate investment in iShares funds. Such agreements mayinclude payments by BFA Entities to such Intermediaries and third parties for data collection and provision, technologysupport, platform enhancement, or co-marketing and cross-promotional efforts. Payments made pursuant to sucharrangements may vary in any year and may be different for different Intermediaries and third parties. In certain cases, thepayments described in the preceding sentence may be subject to certain minimum payment levels. Such payments will notbe asset- or revenue-based. As of the date of this SAI, the Intermediaries and other third parties receiving such contractualpayments include: Commonwealth Equity Services, Inc., Dorsey Wright and Associates, LLC, E*Trade Securities LLC, FDxAdvisors, Inc., Ladenburg Thalmann Advisor Network LLC, LPL Financial LLC, Merrill Lynch, Pierce, Fenner & SmithIncorporated, Morgan Stanley Smith Barney LLC, Orion Advisors Services, LLC, Pershing LLC, Raymond James FinancialServices, Inc., TD Ameritrade, Inc. and UBS Financial Services Inc. Any additions, modifications, or deletions to Intermediariesand other third parties listed above that have occurred since the date of this SAI are not included in the list.
Further, BFA Entities make Education Costs and Publishing Costs payments to other Intermediaries that are not listed above.BFA Entities may determine to make such payments based on any number of metrics. For example, BFA Entities may makepayments at year-end or other intervals in a fixed amount, an amount based upon an Intermediary’s services at defined levelsor an amount based on the Intermediary’s net sales of one or more iShares funds in a year or other period, any of whicharrangements may include an agreed-upon minimum or maximum payment, or any combination of the foregoing. As of thedate of this SAI, BFA anticipates that the payments paid by BFA Entities in connection with the Funds, iShares funds andexchange-traded products in general will be immaterial to BFA Entities in the aggregate for the next year. Please contact yoursalesperson or other investment professional for more information regarding any such payments or financial incentiveshis or her Intermediary firm may receive. Any payments made, or financial incentives offered, by the BFA Entities to anIntermediary may create the incentive for the Intermediary to encourage customers to buy shares of the Funds, otheriShares funds or other exchange-traded products.
The Funds may participate in certain market maker incentive programs of a national securities exchange in which an affiliateof the Funds would pay a fee to the exchange used for the purpose of incentivizing one or more market makers in thesecurities of a Fund to enhance the liquidity and quality of the secondary market of securities of a Fund. The fee would thenbe credited by the exchange to one or more market makers that meet or exceed liquidity and market quality standards withrespect to the securities of a Fund. Each market maker incentive program is subject to approval from the SEC. Any such feepayments made to an exchange will be made by an affiliate of a Fund solely for the benefit of a Fund and will not be paidfrom any Fund assets. Other funds managed by BFA may also participate in such programs.
152

Determination of Net Asset ValueValuation of Shares. The NAV for each Fund is generally calculated as of the close of business on the NYSE (normally 4:00p.m., Eastern time) on each business day the NYSE is open. Valuation of securities held by a Fund is as follows:
Equity Investments. Equity securities traded on a recognized securities exchange (e.g., NYSE), on separate trading boards of asecurities exchange or through a market system that provides contemporaneous transaction pricing information (each, an“Exchange”) are valued using information obtained via independent pricing services, generally at the closing price on theExchange on which the security is primarily traded, or if an Exchange closing price is not available, the last traded price onthat Exchange prior to the time as of which a Fund’s assets or liabilities are valued. However, under certain circumstances,other means of determining current market value may be used. If an equity security is traded on more than one Exchange,the current market value of the security where it is primarily traded generally will be used. In the event that there are no salesinvolving an equity security held by a Fund on a day on which a Fund values such security, the prior day’s price will be used,unless, in accordance with valuation procedures approved by the Board (the “Valuation Procedures”), BlackRock determinesin good faith that such prior day’s price no longer reflects the fair value of the security, in which case such asset would betreated as a Fair Value Asset (as defined below).
Fixed-Income Investments. Fixed-income securities for which market quotations are readily available are generally valuedusing such securities’ current market value. A Fund values fixed-income portfolio securities using the last available bid pricesor current market quotations provided by dealers or prices (including evaluated prices) supplied by a Fund’s approvedindependent third-party pricing services, each in accordance with the Valuation Procedures. The pricing services may usematrix pricing or valuation models that utilize certain inputs and assumptions to derive values, including transaction data(e.g., recent representative bids and offers), credit quality information, perceived market movements, news, and otherrelevant information and by other methods, which may include consideration of: yields or prices of securities of comparablequality, coupon, maturity and type; indications as to values from dealers; general market conditions; and/or other factors andassumptions. Pricing services generally value fixed-income securities assuming orderly transactions of an institutional roundlot size, but a Fund may hold or transact in such securities in smaller, odd lot sizes. Odd lots may trade at lower prices thaninstitutional round lots. The amortized cost method of valuation may be used with respect to debt obligations with sixty daysor less remaining to maturity unless BlackRock determines in good faith that such method does not represent fair value. Loanparticipation notes are generally valued at the mean of the last available bid prices from one or more brokers or dealers asobtained from independent third-party pricing services. Certain fixed-income investments, including asset-backed andmortgage-related securities, may be valued based on valuation models that consider the estimated cash flows of eachtranche of the entity, establish a benchmark yield and develop an estimated tranche-specific spread to the benchmark yieldbased on the unique attributes of the tranche.
Options, Futures, Swaps and Other Derivatives. Exchange-traded equity options for which market quotations are readilyavailable are valued at the mean of the last bid and ask prices as quoted on the Exchange or the board of trade on which suchoptions are traded. In the event that there is no mean price available for an exchange traded equity option held by a Fund ona day on which a Fund values such option, the last bid (long positions) or ask (short positions) price, if available, will be usedas the value of such option. If no such bid or ask price is available on a day on which a Fund values such option, the priorday’s price will be used, unless BlackRock determines in good faith that such prior day’s price no longer reflects the fair valueof the option, in which case such option will be treated as a Fair Value Asset (as defined below). OTC derivatives are valuedusing the last available bid prices or current market quotations provided by dealers or prices (including evaluated prices)supplied by a Fund’s approved independent third-party pricing services, each in accordance with the Valuation Procedures.OTC derivatives may be valued using a mathematical model which may incorporate a number of market data factors.Financial futures contracts and options thereon, which are traded on exchanges, are valued at their settle price as of the closeof such exchanges. Swap agreements and other derivatives are generally valued daily based upon quotations from marketmakers or by a pricing service in accordance with the Valuation Procedures.
Underlying Funds. Shares of underlying ETFs will be valued at their most recent closing price on an Exchange. Shares ofunderlying money market funds will be valued at their NAV.
General Valuation Information. The price a Fund could receive upon the sale of any particular portfolio investment may differfrom a Fund’s valuation of the investment, particularly for securities that trade in thin or volatile markets or that are valuedusing a fair valuation methodology or a price provided by an independent pricing service. As a result, the price received upon
153

the sale of an investment may be less than the value ascribed by a Fund, and a Fund could realize a greater than expectedloss or lesser than expected gain upon the sale of the investment. A Fund’s ability to value its investment may also beimpacted by technological issues and/or errors by pricing services or other third-party service providers.
All cash, receivables and current payables are carried on a Fund’s books at their face value.
Prices obtained from independent third-party pricing services, broker-dealers or market makers to value a Fund’s securitiesand other assets and liabilities are based on information available at the time a Fund values its assets and liabilities. In theevent that a pricing service quotation is revised or updated subsequent to the day on which a Fund valued such security orother asset or liability, the revised pricing service quotation generally will be applied prospectively. Such determination will bemade considering pertinent facts and circumstances surrounding the revision.
In the event that application of the methods of valuation discussed above result in a price for a security which is deemed notto be representative of the fair market value of such security, the security will be valued by, under the direction of or inaccordance with a method approved by the Board as reflecting fair value. All other assets and liabilities (including securitiesfor which market quotations are not readily available) held by a Fund (including restricted securities) are valued at fair valueas determined in good faith by the Board or by BlackRock (its delegate) pursuant to the Valuation Procedures. Any assets andliabilities that are denominated in a foreign currency are converted into U.S. dollars using prevailing market rates on the dateof valuation as quoted by one or more data service providers.
Certain of the securities acquired by a Fund may be traded on foreign exchanges or OTC markets on days on which a Fund’sNAV is not calculated. In such cases, the NAV of a Fund’s shares may be significantly affected on days when AuthorizedParticipants can neither purchase nor redeem shares of a Fund.
Generally, trading in non-U.S. securities, U.S. government securities, money market instruments and certain fixed-incomesecurities is substantially completed each day at various times prior to the close of business on the NYSE. The values of suchsecurities used in computing the NAV of a Fund are determined as of such times.
Use of fair value prices and certain current market valuations could result in a difference between the prices used to calculatea Fund’s NAV and the prices used in the Underlying Index, which, in turn, could result in a difference between a Fund’sperformance and the performance of the Underlying Index.
Fair Value. When market quotations are not readily available or are believed in good faith by BlackRock to be unreliable, aFund’s investments are valued at fair value (“Fair Value Assets”). Fair Value Assets are valued by BlackRock in accordancewith the Valuation Procedures. BlackRock may reasonably conclude that a market quotation is not readily available or isunreliable if, among other things, a security or other asset or liability does not have a price source due to its complete lack oftrading, if BlackRock believes in good faith that a market quotation from a broker-dealer or other source is unreliable (e.g.,where it varies significantly from a recent trade, or no longer reflects the fair value of the security or other asset or liabilitysubsequent to the most recent market quotation), or where the security or other asset or liability is only thinly traded or dueto the occurrence of a significant event subsequent to the most recent market quotation. For this purpose, a “significantevent” is deemed to occur if BlackRock determines, in its reasonable business judgment, that an event has occurred after theclose of trading for an asset or liability but prior to or at the time of pricing a Fund’s assets or liabilities, and that the event islikely to cause a material change to the closing market price of the assets or liabilities held by a Fund. Non-U.S. securitieswhose values are affected by volatility that occurs in the markets or in related or highly correlated assets (e.g., ADRs, GDRs orETFs that invest in components of the Underlying Index) on a trading day after the close of non-U.S. securities markets maybe fair valued. On any day the NYSE is open and a foreign market or the primary exchange on which a foreign asset or liabilityis traded is closed, such asset or liability will be valued using the prior day’s price, provided that BlackRock is not aware of anysignificant event or other information that would cause such price to no longer reflect the fair value of the asset or liability, inwhich case such asset or liability would be treated as a Fair Value Asset.
BlackRock, with input from the BlackRock Investment Strategy Group, will submit its recommendations regarding thevaluation and/or valuation methodologies for Fair Value Assets to BlackRock’s Valuation Committee. The BlackRockValuation Committee may accept, modify or reject any recommendations. In addition, a Fund’s accounting agent periodicallyendeavors to confirm the prices it receives from all third-party pricing services, index providers and broker-dealers, and, withthe assistance of BlackRock, to regularly evaluate the values assigned to the securities and other assets and liabilities of aFund. The pricing of all Fair Value Assets is subsequently reported to and, where appropriate, ratified by the Board.
154

When determining the price for a Fair Value Asset, the BlackRock Valuation Committee (or BlackRock’s Pricing Group) willseek to determine the price that a Fund might reasonably expect to receive upon the current sale of that asset or liability inan arm’s-length transaction on the date on which the assets or liabilities are being valued, and does not seek to determinethe price that a Fund might expect to receive for selling the asset, or the cost of extinguishing a liability, at a later time or if itholds the asset or liability to maturity. Fair value determinations will be based upon all available factors that the BlackRockValuation Committee (or BlackRock’s Pricing Group) deems relevant at the time of the determination, and may be based onanalytical values determined by BlackRock using proprietary or third-party valuation models.
Fair value represents a good faith approximation of the value of an asset or liability. When determining the fair value of anasset, one or more of a variety of fair valuation methodologies may be used (depending on certain factors, including theasset type). For example, the asset may be priced on the basis of the original cost of the investment or, alternatively, usingproprietary or third-party models (including models that rely upon direct portfolio management pricing inputs and whichreflect the significance attributed to the various factors and assumptions being considered). Prices of actual, executed orhistorical transactions in the relevant asset and/or liability (or related or comparable assets and/or liabilities) or, whereappropriate, an appraisal by a third-party experienced in the valuation of similar assets and/or liabilities, may also be used asa basis for establishing the fair value of an asset or liability. The fair value of one or more assets or liabilities may not, inretrospect, be the price at which those assets or liabilities could have been sold during the period in which the particular fairvalues were used in determining a Fund’s NAV. As a result, a Fund’s sale or redemption of its shares at NAV, at a time when aholding or holdings are valued at fair value, may have the effect of diluting or increasing the economic interest of existingshareholders.
Each Fund’s annual audited financial statements, which are prepared in accordance with accounting principles generallyaccepted in the United States of America (“US GAAP”), follow the requirements for valuation set forth in FinancialAccounting Standards Board Accounting Standards Codification Topic 820, “Fair Value Measurements and Disclosures”(“ASC 820”), which defines and establishes a framework for measuring fair value under US GAAP and expands financialstatement disclosure requirements relating to fair value measurements. Generally, ASC 820 and other accounting rulesapplicable to funds and various assets in which they invest are evolving. Such changes may adversely affect a Fund. Forexample, the evolution of rules governing the determination of the fair market value of assets or liabilities to the extent suchrules become more stringent would tend to increase the cost and/or reduce the availability of third-party determinations offair market value. This may in turn increase the costs associated with selling assets or affect their liquidity due to a Fund’sinability to obtain a third-party determination of fair market value.
Brokerage TransactionsSubject to policies established by the Board, BFA is primarily responsible for the execution of a Fund’s portfolio transactionsand the allocation of brokerage. BFA does not execute transactions through any particular broker or dealer, but seeks toobtain the best net results for the Funds, taking into account such factors as price (including the applicable brokeragecommission or dealer spread), size of order, difficulty of execution, operational facilities of the firm and the firm’s risk and skillin positioning blocks of securities. While BFA generally seeks reasonable trade execution costs, a Fund does not necessarilypay the lowest spread or commission available, and payment of the lowest commission or spread is not necessarilyconsistent with obtaining the best price and execution in particular transactions. Subject to applicable legal requirements,BFA may select a broker based partly upon brokerage or research services provided to BFA and its clients, including a Fund. Inreturn for such services, BFA may cause a Fund to pay a higher commission than other brokers would charge if BFAdetermines in good faith that the commission is reasonable in relation to the services provided.
In selecting brokers or dealers to execute portfolio transactions, BFA seeks to obtain the best price and most favorableexecution for a Fund and may take into account a variety of factors including: (i) the size, nature and character of the securityor instrument being traded and the markets in which it is purchased or sold; (ii) the desired timing of the transaction; (iii)BFA’s knowledge of the expected commission rates and spreads currently available; (iv) the activity existing and expected inthe market for the particular security or instrument, including any anticipated execution difficulties; (v) the full range ofbrokerage services provided; (vi) the broker’s or dealer’s capital; (vii) the quality of research and research services provided;(viii) the reasonableness of the commission, dealer spread or its equivalent for the specific transaction; and (ix) BFA’sknowledge of any actual or apparent operational problems of a broker or dealer. Brokers may also be selected because oftheir ability to handle special or difficult executions, such as may be involved in large block trades, less liquid securities, orother circumstances.
155

Section 28(e) of the 1934 Act (“Section 28(e)”) permits a U.S. investment adviser, under certain circumstances, to cause anaccount to pay a broker or dealer a commission for effecting a transaction in securities that exceeds the amount anotherbroker or dealer would have charged for effecting the same transaction in recognition of the value of brokerage and researchservices provided by that broker or dealer. This includes commissions paid on riskless principal transactions in securitiesunder certain conditions.
From time to time, a Fund may purchase new issues of securities in a fixed price offering. In these situations, the broker maybe a member of the selling group that will, in addition to selling securities, provide BFA with research services. FINRA hasadopted rules expressly permitting these types of arrangements under certain circumstances. Generally, the broker willprovide research “credits” in these situations at a rate that is higher than that available for typical secondary markettransactions. These arrangements may not fall within the safe harbor of Section 28(e).
The Funds anticipate that brokerage transactions involving foreign equity securities generally will be conducted primarily onthe principal stock exchanges of the applicable country. Foreign equity securities may be held by the Funds in the form ofdepositary receipts, or other securities convertible into foreign equity securities. Depositary receipts may be listed on stockexchanges, or traded in OTC markets in the U.S. or Europe, as the case may be. ADRs, like other securities traded in the U.S.,will be subject to negotiated commission rates.
OTC issues, including most fixed-income securities such as corporate debt and U.S. Government securities, are normallytraded on a “net” basis without a stated commission, through dealers acting for their own account and not as brokers. TheFunds will primarily engage in transactions with these dealers or deal directly with the issuer unless a better price orexecution could be obtained by using a broker. Prices paid to a dealer with respect to both foreign and domestic securitieswill generally include a “spread,” which is the difference between the prices at which the dealer is willing to purchase and sellthe specific security at the time, and includes the dealer’s normal profit.
Under the 1940 Act, persons affiliated with a Fund and persons who are affiliated with such affiliated persons are prohibitedfrom dealing with the Fund as principal in the purchase and sale of securities unless a permissive order allowing suchtransactions is obtained from the SEC. Since transactions in the OTC market usually involve transactions with the dealersacting as principal for their own accounts, the Funds will not deal with affiliated persons and affiliated persons of suchaffiliated persons, including PNC and its affiliates, in connection with such transactions. The Funds will not purchasesecurities during the existence of any underwriting or selling group relating to such securities of which BFA, PNC, BRIL or anyaffiliated person (as defined in the 1940 Act) thereof is a member except pursuant to procedures adopted by the Board inaccordance with Rule 10f-3 under the 1940 Act.
Purchases of money market instruments by the Funds are made from dealers, underwriters and issuers. The Funds do notcurrently expect to incur any brokerage commission expense on such transactions because money market instruments aregenerally traded on a “net” basis with dealers acting as principal for their own accounts without a stated commission. Theprice of the security, however, usually includes a profit to the dealer.
BFA may, from time to time, effect trades on behalf of and for the account of the Funds with brokers or dealers that areaffiliated with BFA, in conformity with Rule 17e-1 under the 1940 Act and SEC rules and regulations. Under these provisions,any commissions paid to affiliated brokers or dealers must be reasonable and fair compared to the commissions charged byother brokers or dealers in comparable transactions.
Securities purchased in underwritten offerings include a fixed amount of compensation to the underwriter, generally referredto as the underwriter’s concession or discount. When securities are purchased or sold directly from or to an issuer, nocommissions or discounts are paid.
Investment decisions for the Funds and for other investment accounts managed by BFA and the other Affiliates are madeindependently of each other in light of differing conditions. A variety of factors will be considered in making investmentallocations. These factors include: (i) investment objectives or strategies for particular accounts, including sector, industry,country or region and capitalization weightings; (ii) tax considerations of an account; (iii) risk or investment concentrationparameters for an account; (iv) supply or demand for a security at a given price level; (v) size of available investment; (vi)cash availability and liquidity requirements for accounts; (vii) regulatory restrictions; (viii) minimum investment size of anaccount; (ix) relative size of account; and (x) such other factors as may be approved by BlackRock’s general counsel.Moreover, investments may not be allocated to one client account over another based on any of the following considerations:(i) to favor one client account at the expense of another; (ii) to generate higher fees paid by one client account over another
156

or to produce greater performance compensation to BlackRock; (iii) to develop or enhance a relationship with a client orprospective client; (iv) to compensate a client for past services or benefits rendered to BlackRock or to induce future servicesor benefits to be rendered to BlackRock; or (v) to manage or equalize investment performance among different clientaccounts. BFA and the other Affiliates may deal, trade and invest for their own respective accounts in the types of securitiesin which the Funds may invest.
Initial public offerings (“IPOs”) of securities may be over-subscribed and subsequently trade at a premium in the secondarymarket. When BFA is given an opportunity to invest in such an initial offering or “new” or “hot” issue, the supply of securitiesavailable for client accounts is often less than the amount of securities the accounts would otherwise take. In order toallocate these investments fairly and equitably among client accounts over time, each portfolio manager or a member of hisor her respective investment team will indicate to BFA’s trading desk their level of interest in a particular offering with respectto eligible clients’ accounts for which that team is responsible. IPOs of U.S. equity securities will be identified as eligible forparticular client accounts that are managed by portfolio teams who have indicated interest in the offering based on marketcapitalization of the issuer of the security and the investment mandate of the client account and in the case of internationalequity securities, the country where the offering is taking place and the investment mandate of the client account. Generally,shares received during the IPO will be allocated among participating client accounts within each investment mandate on apro rata basis. This pro rata allocation may result in a Fund receiving less of a particular security than if pro-rating had notoccurred. All allocations of securities will be subject, where relevant, to share minimums established for accounts andcompliance constraints. In situations where supply is too limited to be allocated among all accounts for which theinvestment is eligible, portfolio managers may rotate such investment opportunities among one or more accounts so long asthe rotation system provides for fair access for all client accounts over time. Other allocation methodologies that areconsidered by BFA to be fair and equitable to clients may be used as well.
Because different accounts may have differing investment objectives and policies, BFA may buy and sell the same securitiesat the same time for different clients based on the particular investment objective, guidelines and strategies of thoseaccounts. For example, BFA may decide that it may be entirely appropriate for a growth fund to sell a security at the sametime a value fund is buying that security. To the extent that transactions on behalf of more than one client of BFA or the otherAffiliates during the same period may increase the demand for securities being purchased or the supply of securities beingsold, there may be an adverse effect on price. For example, sales of a security by BlackRock on behalf of one or more of itsclients may decrease the market price of such security, adversely impacting other BlackRock clients that still hold the security.If purchases or sales of securities arise for consideration at or about the same time that would involve the Funds or otherclients or funds for which BFA or another Affiliate act as investment manager, transactions in such securities will be made,insofar as feasible, for the respective funds and clients in a manner deemed equitable to all.
In certain instances, BFA may find it efficient for purposes of seeking to obtain best execution, to aggregate or “bunch”certain contemporaneous purchases or sale orders of its advisory accounts and advisory accounts of affiliates. In general, allcontemporaneous trades for client accounts under management by the same portfolio manager or investment team will bebunched in a single order if the trader believes the bunched trade would provide each client with an opportunity to achieve amore favorable execution at a potentially lower execution cost. The costs associated with a bunched order will be shared prorata among the clients in the bunched order. Generally, if an order for a particular portfolio manager or management team isfilled at several different prices through multiple trades, all accounts participating in the order will receive the average price(except in the case of certain international markets where average pricing is not permitted). While in some cases this practicecould have a detrimental effect upon the price or value of the security as far as the Funds are concerned, in other cases itcould be beneficial to the Funds. Transactions effected by BFA or the other Affiliates on behalf of more than one of its clientsduring the same period may increase the demand for securities being purchased or the supply of securities being sold,causing an adverse effect on price. The trader will give the bunched order to the broker-dealer that the trader has identifiedas being able to provide the best execution of the order. Orders for purchase or sale of securities will be placed within areasonable amount of time of the order receipt and bunched orders will be kept bunched only long enough to execute theorder.
The table below sets forth the brokerage commissions paid by each Fund for the fiscal years noted. Any differences inbrokerage commissions paid by a Fund from year to year are principally due to increases or decreases in that Fund’s assetsover those periods or the magnitude of changes to the components of a Fund’s Underlying Index:
157
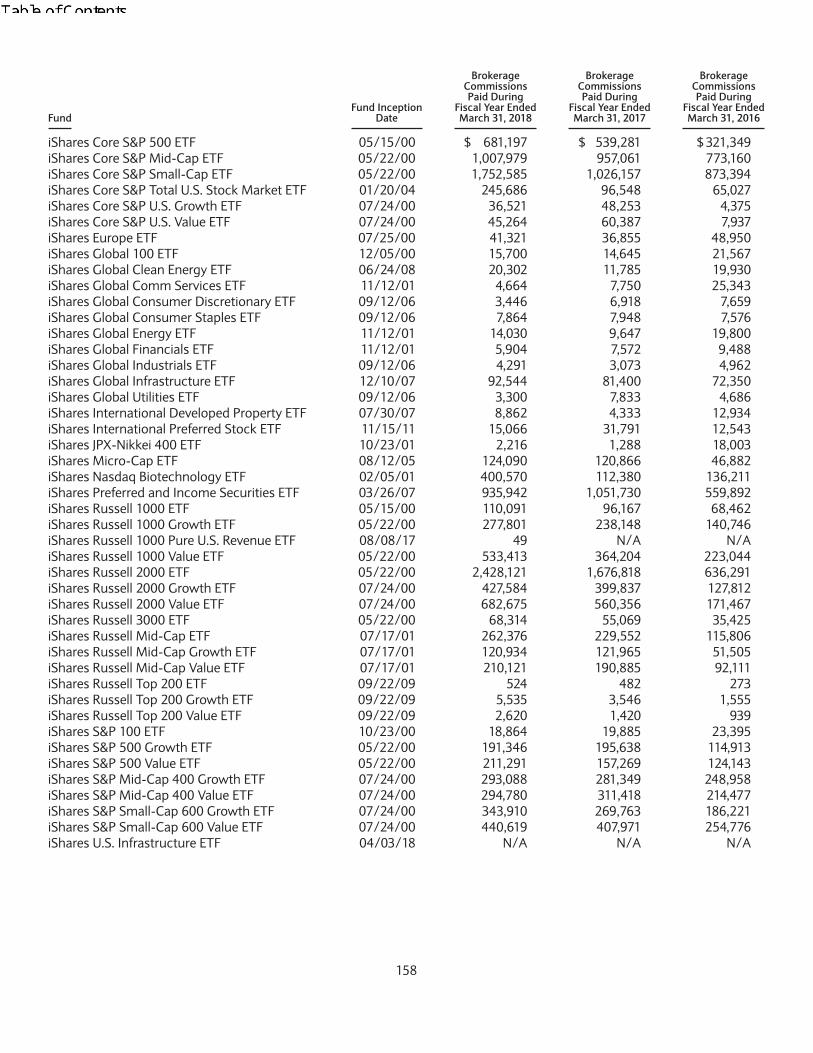
FundFund Inception
Date
BrokerageCommissionsPaid During
Fiscal Year EndedMarch 31, 2018
BrokerageCommissionsPaid During
Fiscal Year EndedMarch 31, 2017
BrokerageCommissionsPaid During
Fiscal Year EndedMarch 31, 2016
iShares Core S&P 500 ETF 05/15/00 $ 681,197 $ 539,281 $ 321,349iShares Core S&P Mid-Cap ETF 05/22/00 1,007,979 957,061 773,160iShares Core S&P Small-Cap ETF 05/22/00 1,752,585 1,026,157 873,394iShares Core S&P Total U.S. Stock Market ETF 01/20/04 245,686 96,548 65,027iShares Core S&P U.S. Growth ETF 07/24/00 36,521 48,253 4,375iShares Core S&P U.S. Value ETF 07/24/00 45,264 60,387 7,937iShares Europe ETF 07/25/00 41,321 36,855 48,950iShares Global 100 ETF 12/05/00 15,700 14,645 21,567iShares Global Clean Energy ETF 06/24/08 20,302 11,785 19,930iShares Global Comm Services ETF 11/12/01 4,664 7,750 25,343iShares Global Consumer Discretionary ETF 09/12/06 3,446 6,918 7,659iShares Global Consumer Staples ETF 09/12/06 7,864 7,948 7,576iShares Global Energy ETF 11/12/01 14,030 9,647 19,800iShares Global Financials ETF 11/12/01 5,904 7,572 9,488iShares Global Industrials ETF 09/12/06 4,291 3,073 4,962iShares Global Infrastructure ETF 12/10/07 92,544 81,400 72,350iShares Global Utilities ETF 09/12/06 3,300 7,833 4,686iShares International Developed Property ETF 07/30/07 8,862 4,333 12,934iShares International Preferred Stock ETF 11/15/11 15,066 31,791 12,543iShares JPX-Nikkei 400 ETF 10/23/01 2,216 1,288 18,003iShares Micro-Cap ETF 08/12/05 124,090 120,866 46,882iShares Nasdaq Biotechnology ETF 02/05/01 400,570 112,380 136,211iShares Preferred and Income Securities ETF 03/26/07 935,942 1,051,730 559,892iShares Russell 1000 ETF 05/15/00 110,091 96,167 68,462iShares Russell 1000 Growth ETF 05/22/00 277,801 238,148 140,746iShares Russell 1000 Pure U.S. Revenue ETF 08/08/17 49 N/A N/AiShares Russell 1000 Value ETF 05/22/00 533,413 364,204 223,044iShares Russell 2000 ETF 05/22/00 2,428,121 1,676,818 636,291iShares Russell 2000 Growth ETF 07/24/00 427,584 399,837 127,812iShares Russell 2000 Value ETF 07/24/00 682,675 560,356 171,467iShares Russell 3000 ETF 05/22/00 68,314 55,069 35,425iShares Russell Mid-Cap ETF 07/17/01 262,376 229,552 115,806iShares Russell Mid-Cap Growth ETF 07/17/01 120,934 121,965 51,505iShares Russell Mid-Cap Value ETF 07/17/01 210,121 190,885 92,111iShares Russell Top 200 ETF 09/22/09 524 482 273iShares Russell Top 200 Growth ETF 09/22/09 5,535 3,546 1,555iShares Russell Top 200 Value ETF 09/22/09 2,620 1,420 939iShares S&P 100 ETF 10/23/00 18,864 19,885 23,395iShares S&P 500 Growth ETF 05/22/00 191,346 195,638 114,913iShares S&P 500 Value ETF 05/22/00 211,291 157,269 124,143iShares S&P Mid-Cap 400 Growth ETF 07/24/00 293,088 281,349 248,958iShares S&P Mid-Cap 400 Value ETF 07/24/00 294,780 311,418 214,477iShares S&P Small-Cap 600 Growth ETF 07/24/00 343,910 269,763 186,221iShares S&P Small-Cap 600 Value ETF 07/24/00 440,619 407,971 254,776iShares U.S. Infrastructure ETF 04/03/18 N/A N/A N/A
158

Fund1
FundInception
Date
BrokerageCommissionsPaid During
Fiscal Year EndedMarch 31, 2018
BrokerageCommissionsPaid During
Fiscal Year EndedMarch 31, 2017
BrokerageCommissionsPaid DuringPeriod from
May 1, 2015 toMarch 31, 20161
BrokerageCommissionsPaid During
Fiscal Year EndedApril 30, 2015
iShares Mortgage Real Estate ETF 05/01/07 $195,892 $162,227 $ 84,596 $345,224iShares Residential Real Estate ETF 05/01/07 14,721 13,727 4,541 8,152iShares U.S. Aerospace & Defense ETF 05/01/06 71,847 3,788 4,690 2,357iShares U.S. Broker-Dealers & Securities
Exchanges ETF 05/01/06 3,119 1,429 4,264 1,399iShares U.S. Healthcare Providers ETF 05/01/06 10,777 3,604 12,684 5,387iShares U.S. Home Construction ETF 05/01/06 54,674 7,371 14,874 5,510iShares U.S. Insurance ETF 05/01/06 2,680 1,346 952 615iShares U.S. Medical Devices ETF 05/01/06 27,291 6,138 16,118 5,792iShares U.S. Oil & Gas Exploration &
Production ETF 05/01/06 10,484 4,553 7,304 4,241iShares U.S. Oil Equipment & Services ETF 05/01/06 18,151 9,265 7,722 6,374iShares U.S. Pharmaceuticals ETF 05/01/06 27,005 20,020 116,208 159,083iShares U.S. Real Estate ETF 06/12/00 174,094 171,782 136,016 312,923iShares U.S. Regional Banks ETF 05/01/06 5,401 3,384 5,592 3,714iShares U.S. Telecommunications ETF 05/22/00 204,138 61,182 29,183 31,974
1 Each Fund’s fiscal year-end was changed from April 30 to March 31.
Fund1
FundInception
Date
BrokerageCommissionsPaid During
Fiscal Year EndedMarch 31, 2018
BrokerageCommissionsPaid During
Fiscal Year EndedMarch 31, 2017
BrokerageCommissionsPaid DuringPeriod from
August 1, 2015 toMarch 31, 20161
BrokerageCommissionsPaid During
Fiscal Year EndedJuly 31, 2015
iShares Expanded Tech Sector ETF 03/13/01 5,041 4,762 2,193 1,768iShares Expanded Tech-Software Sector
ETF 07/10/01 10,746 7,945 4,919 7,472iShares North American Natural Resources
ETF 10/22/01 $ 16,110 $19,445 $14,930 $11,493iShares North American Tech-Multimedia
Networking ETF 07/10/01 1,785 2,592 2,080 2,443iShares PHLX Semiconductor ETF 07/10/01 21,370 36,762 8,718 9,073
1 Each Fund’s fiscal year-end was changed from July 31 to March 31.
None of the Funds paid any brokerage commissions to BRIL, an affiliate of BFA, or to any other broker-dealer that is part ofthe BlackRock group of companies, during the fiscal year ended March 31, 2018.
The following table sets forth the names of the Funds’ “regular” broker-dealers, as defined under Rule 10b-1 of the 1940 Act,which derive more than 15% of their gross revenues from securities-related activities and in which the Funds invest, togetherwith the market value of each investment as of the fiscal year ended March 31, 2018:
Fund IssuerMarket Value of
Investment
iShares Core S&P 500 ETF JPMorgan Chase & Co. $ 2,350,010,183Bank of America Corp. 1,786,539,778Wells Fargo & Co. 1,432,609,635Citigroup Inc. 1,080,192,510Goldman Sachs Group Inc. (The) 554,037,598
159

Fund IssuerMarket Value of
Investment
Morgan Stanley 463,565,612Bank of New York Mellon Corp. (The) 324,826,775
iShares Core S&P Total U.S. Stock Market ETF JPMorgan Chase & Co. $178,259,830Bank of America Corp. 135,841,564Wells Fargo & Co. 108,881,094Citigroup Inc. 82,104,030Goldman Sachs Group Inc. (The) 42,057,094Morgan Stanley 35,624,392Bank of New York Mellon Corp. (The) 24,872,913Hilltop Holdings Inc. 822,977
iShares Core S&P U.S. Growth ETF Bank of America Corp. $ 39,776,067
iShares Core S&P U.S. Value ETF JPMorgan Chase & Co. $112,760,379Wells Fargo & Co. 68,741,899Citigroup Inc. 51,830,820Bank of America Corp. 44,576,806Goldman Sachs Group Inc. (The) 26,587,097Morgan Stanley 22,243,985Bank of New York Mellon Corp. (The) 15,545,673
iShares Europe ETF UBS Group AG $ 20,287,399Barclays PLC 14,081,726Societe Generale SA 12,534,902Credit Suisse Group AG 12,357,986Deutsche Bank AG 8,806,694
iShares Global 100 ETF JPMorgan Chase & Co. $ 56,813,141Citigroup Inc. 26,101,440Goldman Sachs Group Inc. (The) 13,362,432Morgan Stanley 11,316,383UBS Group AG 10,106,640Barclays PLC 6,911,881Societe Generale SA 6,203,202Credit Suisse Group AG 6,107,526Deutsche Bank AG 4,298,801
iShares Global Financials ETF JPMorgan Chase & Co. $ 32,577,513Bank of America Corp. 24,759,984Wells Fargo & Co. 19,894,417Citigroup Inc. 14,953,680Goldman Sachs Group Inc. (The) 7,692,812Morgan Stanley 6,497,647UBS Group AG 5,857,204Bank of New York Mellon Corp. (The) 4,567,207Barclays PLC 3,967,181Societe Generale SA 3,547,542
160

Fund IssuerMarket Value of
Investment
Credit Suisse Group AG 3,496,427Deutsche Bank AG 2,479,218
iShares Preferred and Income Securities ETF Wells Fargo & Co. $1,109,510,887JPMorgan Chase & Co. 774,224,944Morgan Stanley 620,016,830Citigroup Inc. 544,744,593Goldman Sachs Group Inc. (The) 537,309,114Bank of America Corp. 497,869,537Bank of New York Mellon Corp. (The) 64,585,912
iShares Russell 1000 ETF JPMorgan Chase & Co. $ 293,415,356Bank of America Corp. 221,556,853Wells Fargo & Co. 179,197,704Citigroup Inc. 134,082,067Goldman Sachs Group Inc. (The) 68,411,976Morgan Stanley 53,169,432Bank of New York Mellon Corp. (The) 39,092,513
iShares Russell 1000 Pure U.S. Revenue ETF Bank of America Corp. $ 357,121Wells Fargo & Co. 288,098
iShares Russell 1000 Value ETF JPMorgan Chase & Co. $1,135,485,448Bank of America Corp. 857,400,365Wells Fargo & Co. 693,475,703Citigroup Inc. 518,881,275Goldman Sachs Group Inc. (The) 264,760,521Morgan Stanley 205,760,164Bank of New York Mellon Corp. (The) 151,284,144
iShares Russell 2000 ETF Hilltop Holdings Inc. $ 33,896,721
iShares Russell 2000 Value ETF Hilltop Holdings Inc. $ 15,534,719
iShares Russell 3000 ETF JPMorgan Chase & Co. $ 114,514,070Bank of America Corp. 86,468,907Wells Fargo & Co. 69,937,267Citigroup Inc. 52,328,970Goldman Sachs Group Inc. (The) 26,700,686Morgan Stanley 20,750,048Bank of New York Mellon Corp. (The) 15,234,844Hilltop Holding Inc. 541,199
iShares Russell Top 200 ETF JPMorgan Chase & Co. $ 2,876,705Bank of America Corp. 2,172,056Wells Fargo & Co. 1,756,836Citigroup Inc. 1,314,427Goldman Sachs Group Inc. (The) 670,955
161

Fund IssuerMarket Value of
Investment
Morgan Stanley 520,552Bank of New York Mellon Corp. (The) 383,796
iShares Russell Top 200 Value ETF JPMorgan Chase & Co. $ 13,132,287Bank of America Corp. 9,916,134Wells Fargo & Co. 8,020,302Citigroup Inc. 6,001,020Goldman Sachs Group Inc. (The) 3,062,114Morgan Stanley 2,379,690Bank of New York Mellon Corp. (The) 1,749,650
iShares S&P 100 ETF JPMorgan Chase & Co. $ 134,708,191Bank of America Corp. 102,409,102Wells Fargo & Co. 82,120,757Citigroup Inc. 61,919,168Goldman Sachs Group Inc. (The) 31,758,287Morgan Stanley 26,572,980Bank of New York Mellon Corp. (The) 18,571,824
iShares S&P 500 Growth ETF Bank of America Corp. $231,905,322
iShares S&P 500 Value ETF JPMorgan Chase & Co. $ 518,445,867Wells Fargo & Co. 316,056,723Citigroup Inc. 238,305,982Bank of America Corp. 204,952,110Goldman Sachs Group Inc. (The) 122,230,177Morgan Stanley 102,271,035Bank of New York Mellon Corp. (The) 71,476,181
iShares U.S. Broker-Dealers & Securities Exchanges ETF Goldman Sachs Group Inc. (The) $ 35,083,343Morgan Stanley 32,426,884
The Funds’ purchase and sale orders for securities may be combined with those of other investment companies, clients oraccounts that BlackRock manages or advises. If purchases or sales of portfolio securities of the Funds and one or more otheraccounts managed or advised by BlackRock are considered at or about the same time, transactions in such securities areallocated among the Funds and the other accounts in a manner deemed equitable to all by BlackRock. In some cases, thisprocedure could have a detrimental effect on the price or volume of the security as far as the Funds are concerned. However,in other cases, it is possible that the ability to participate in volume transactions and to negotiate lower transaction costs willbe beneficial to the Funds. BlackRock may deal, trade and invest for its own account in the types of securities in which theFunds may invest. BlackRock may, from time to time, effect trades on behalf of and for the account of the Funds with brokersor dealers that are affiliated with BFA, in conformity with the 1940 Act and SEC rules and regulations. Under these provisions,any commissions paid to affiliated brokers or dealers must be reasonable and fair compared to the commissions charged byother brokers or dealers in comparable transactions. The Funds will not deal with affiliates in principal transactions unlesspermitted by applicable SEC rules or regulations, or by SEC exemptive order.
Portfolio turnover may vary from year to year, as well as within a year. High turnover rates may result in comparatively greaterbrokerage expenses.
The table below sets forth the portfolio turnover rates of each Fund for the fiscal years noted:
162

FundFiscal Year EndedMarch 31, 2018
Fiscal Year EndedMarch 31, 2017
iShares Core S&P 500 ETF 4% 5%iShares Core S&P Mid-Cap ETF 10% 14%iShares Core S&P Small-Cap ETF 12% 13%iShares Core S&P Total U.S. Stock Market ETF 8% 8%iShares Core S&P U.S. Growth ETF 24% 43%iShares Core S&P U.S. Value ETF 27% 49%iShares Europe ETF 3% 5%iShares Expanded Tech Sector ETF 6% 7%iShares Expanded Tech-Software Sector ETF 12% 12%iShares Global 100 ETF 8% 5%iShares Global Clean Energy ETF 29% 35%iShares Global Comm Services ETF 3% 5%iShares Global Consumer Discretionary ETF 6% 13%iShares Global Consumer Staples ETF 5% 4%iShares Global Energy ETF 4% 4%iShares Global Financials ETF 4% 16%iShares Global Industrials ETF 6% 9%iShares Global Infrastructure ETF 11% 23%iShares Global Utilities ETF 4% 15%iShares International Developed Property ETF 11% 8%iShares International Preferred Stock ETF 15% 40%iShares JPX-Nikkei 400 ETF 8% 7%iShares Micro-Cap ETF 22% 21%iShares Mortgage Real Estate ETF 31% 34%iShares Nasdaq Biotechnology ETF 26% 18%iShares North American Natural Resources ETF 7% 12%iShares North American Tech-Multimedia Networking ETF 23% 27%iShares PHLX Semiconductor ETF 20% 38%iShares Preferred and Income Securities ETF 22% 23%iShares Residential Real Estate ETF 19% 15%iShares Russell 1000 ETF 4% 4%iShares Russell 1000 Growth ETF 13% 14%iShares Russell 1000 Pure U.S. Revenue ETF 4%1,2 N/AiShares Russell 1000 Value ETF 15% 13%iShares Russell 2000 ETF 16% 15%iShares Russell 2000 Growth ETF 26% 28%iShares Russell 2000 Value ETF 23% 24%iShares Russell 3000 ETF 4% 4%iShares Russell Mid-Cap ETF 10% 11%iShares Russell Mid-Cap Growth ETF 24% 27%iShares Russell Mid-Cap Value ETF 20% 21%iShares Russell Top 200 ETF 5% 7%iShares Russell Top 200 Growth ETF 11% 15%iShares Russell Top 200 Value ETF 13% 14%iShares S&P 100 ETF 4% 4%iShares S&P 500 Growth ETF 21% 24%iShares S&P 500 Value ETF 23% 21%iShares S&P Mid-Cap 400 Growth ETF 40% 54%iShares S&P Mid-Cap 400 Value ETF 37% 38%iShares S&P Small-Cap 600 Growth ETF 47% 52%iShares S&P Small-Cap 600 Value ETF 39% 48%iShares U.S. Aerospace & Defense ETF 14% 14%
163

FundFiscal Year EndedMarch 31, 2018
Fiscal Year EndedMarch 31, 2017
iShares U.S. Broker-Dealers & Securities Exchanges ETF 13% 17%iShares U.S. Healthcare Providers ETF 20% 12%iShares U.S. Home Construction ETF 18% 12%iShares U.S. Infrastructure ETF N/A N/AiShares U.S. Insurance ETF 12% 14%iShares U.S. Medical Devices ETF 15% 20%iShares U.S. Oil & Gas Exploration & Production ETF 17% 8%iShares U.S. Oil Equipment & Services ETF 25% 27%iShares U.S. Pharmaceuticals ETF 23% 33%iShares U.S. Real Estate ETF 13% 18%iShares U.S. Regional Banks ETF 4% 6%iShares U.S. Telecommunications ETF 86% 47%
1 The inception date for the iShares Russell 1000 Pure U.S. Revenue ETF was August 8, 2017.2 The portfolio turnover for the iShares Russell 1000 Pure U.S. Revenue ETF relates to the period of August 8, 2017 to March 31, 2018 and is not
annualized.
Additional Information Concerning the TrustShares. The Trust currently consists of more than 280 separate investment series or portfolios called funds. The Trust issuesshares of beneficial interests in the funds with no par value. The Board may designate additional iShares funds.
Each share issued by a fund has a pro rata interest in the assets of that fund. Shares have no preemptive, exchange,subscription or conversion rights and are freely transferable. Each share is entitled to participate equally in dividends anddistributions declared by the Board with respect to the relevant fund, and in the net distributable assets of such fund onliquidation.
Each share has one vote with respect to matters upon which the shareholder is entitled to vote. In any matter submitted toshareholders for a vote, each fund shall hold a separate vote, provided that shareholders of all affected funds will votetogether when: (i) required by the 1940 Act, or (ii) the Trustees determine that the matter affects the interests of more thanone fund.
Under Delaware law, the Trust is not required to hold an annual meeting of shareholders unless required to do so under the1940 Act. The policy of the Trust is not to hold an annual meeting of shareholders unless required to do so under the 1940Act. All shares (regardless of the fund) have noncumulative voting rights in the election of members of the Board. UnderDelaware law, Trustees of the Trust may be removed by vote of the shareholders.
Following the creation of the initial Creation Unit(s) of shares of a fund and immediately prior to the commencement oftrading in such fund’s shares, a holder of shares may be a “control person” of the fund, as defined in Rule 0-1 under the 1940Act. A fund cannot predict the length of time for which one or more shareholders may remain a control person of the fund.
Shareholders may make inquiries by writing to iShares Trust, c/o BlackRock Investments, LLC, 1 University Square Drive,Princeton, NJ 08540.
Absent an applicable exemption or other relief from the SEC or its staff, beneficial owners of more than 5% of the shares of afund may be subject to the reporting provisions of Section 13 of the 1934 Act and the SEC’s rules promulgated thereunder. Inaddition, absent an applicable exemption or other relief from the SEC or its staff, officers and trustees of a fund and beneficialowners of 10% of the shares of a fund (“Insiders”) may be subject to the insider reporting, short-swing profit and short saleprovisions of Section 16 of the 1934 Act and the SEC’s rules promulgated thereunder. Beneficial owners and Insiders shouldconsult with their own legal counsel concerning their obligations under Sections 13 and 16 of the 1934 Act and existingguidance provided by the SEC staff.
164

In accordance with the Trust’s current Agreement and Declaration of Trust (the “Declaration of Trust”), the Board may,without shareholder approval (unless such shareholder approval is required by the Declaration of Trust or applicable law,including the 1940 Act), authorize certain funds to merge, reorganize, consolidate, sell all or substantially all of their assets, ortake other similar actions with, to or into another fund. The Trust or a Fund may be terminated by a majority vote of theBoard, subject to the affirmative vote of a majority of the shareholders of the Trust or such Fund entitled to vote ontermination; however, in certain circumstances described in the Declaration of Trust, only a majority vote of the Board isrequired. Although the shares are not automatically redeemable upon the occurrence of any specific event, the Declaration ofTrust provides that the Board will have the unrestricted power to alter the number of shares in a Creation Unit. Therefore, inthe event of a termination of the Trust or a Fund, the Board, in its sole discretion, could determine to permit the shares to beredeemable in aggregations smaller than Creation Units or to be individually redeemable. In such circumstance, the Trust or aFund may make redemptions in-kind, for cash or for a combination of cash or securities. Further, in the event of atermination of the Trust or a Fund, the Trust or a Fund might elect to pay cash redemptions to all shareholders, with an in-kind election for shareholders owning in excess of a certain stated minimum amount.
DTC as Securities Depository for Shares of the Funds. Shares of each Fund are represented by securities registered in thename of DTC or its nominee and deposited with, or on behalf of, DTC.
DTC was created in 1973 to enable electronic movement of securities between its participants (“DTC Participants”), andNSCC was established in 1976 to provide a single settlement system for securities clearing and to serve as centralcounterparty for securities trades among DTC Participants. In 1999, DTC and NSCC were consolidated within The DepositoryTrust & Clearing Corporation (“DTCC”) and became wholly-owned subsidiaries of DTCC. The common stock of DTCC isowned by the DTC Participants, but NYSE and FINRA, through subsidiaries, hold preferred shares in DTCC that provide themwith the right to elect one member each to the DTCC board of directors. Access to the DTC system is available to entities,such as banks, brokers, dealers and trust companies, that clear through or maintain a custodial relationship with a DTCParticipant, either directly or indirectly (“Indirect Participants”).
Beneficial ownership of shares is limited to DTC Participants, Indirect Participants and persons holding interests through DTCParticipants and Indirect Participants. Ownership of beneficial interests in shares (owners of such beneficial interests arereferred to herein as “Beneficial Owners”) is shown on, and the transfer of ownership is effected only through, recordsmaintained by DTC (with respect to DTC Participants) and on the records of DTC Participants (with respect to IndirectParticipants and Beneficial Owners that are not DTC Participants). Beneficial Owners will receive from or through the DTCParticipant a written confirmation relating to their purchase of shares. The laws of some jurisdictions may require that certainpurchasers of securities take physical delivery of such securities in definitive form. Such laws may impair the ability of certaininvestors to acquire beneficial interests in shares of the Fund.
Conveyance of all notices, statements and other communications to Beneficial Owners is effected as follows. Pursuant to theDepositary Agreement between the Trust and DTC, DTC is required to make available to the Trust upon request and for a feeto be charged to the Trust a listing of the shares of each Fund held by each DTC Participant. The Trust shall inquire of eachsuch DTC Participant as to the number of Beneficial Owners holding shares, directly or indirectly, through such DTCParticipant. The Trust shall provide each such DTC Participant with copies of such notice, statement or other communication,in such form, number and at such place as such DTC Participant may reasonably request, in order that such notice,statement or communication may be transmitted by such DTC Participant, directly or indirectly, to such Beneficial Owners. Inaddition, the Trust shall pay to each such DTC Participant a fair and reasonable amount as reimbursement for the expensesattendant to such transmittal, all subject to applicable statutory and regulatory requirements.
Share distributions shall be made to DTC or its nominee, Cede & Co., as the registered holder of all shares of the Trust. DTC orits nominee, upon receipt of any such distributions, shall credit immediately DTC Participants’ accounts with payments inamounts proportionate to their respective beneficial interests in shares of each Fund as shown on the records of DTC or itsnominee. Payments by DTC Participants to Indirect Participants and Beneficial Owners of shares held through such DTCParticipants will be governed by standing instructions and customary practices, as is now the case with securities held for theaccounts of customers in bearer form or registered in a “street name,” and will be the responsibility of such DTC Participants.
The Trust has no responsibility or liability for any aspect of the records relating to or notices to Beneficial Owners, orpayments made on account of beneficial ownership interests in such shares, or for maintaining, supervising or reviewing anyrecords relating to such beneficial ownership interests, or for any other aspect of the relationship between DTC and the DTCParticipants or the relationship between such DTC Participants and the Indirect Participants and Beneficial Owners owning
165
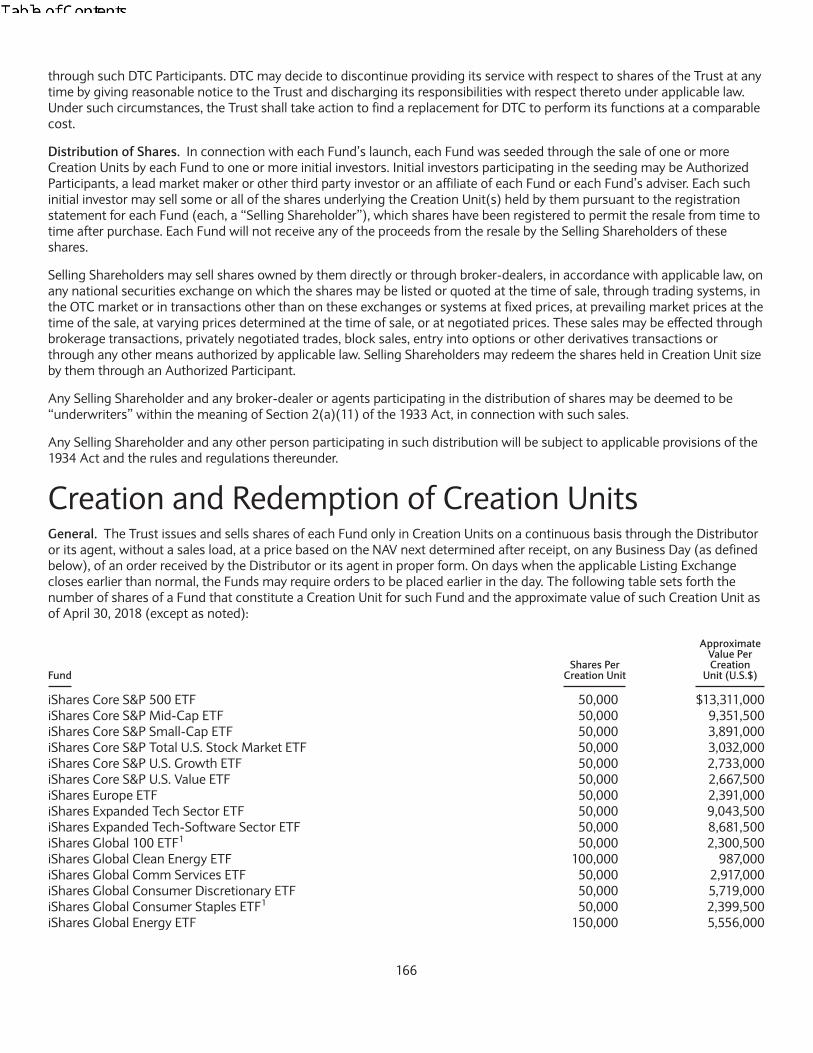
through such DTC Participants. DTC may decide to discontinue providing its service with respect to shares of the Trust at anytime by giving reasonable notice to the Trust and discharging its responsibilities with respect thereto under applicable law.Under such circumstances, the Trust shall take action to find a replacement for DTC to perform its functions at a comparablecost.
Distribution of Shares. In connection with each Fund’s launch, each Fund was seeded through the sale of one or moreCreation Units by each Fund to one or more initial investors. Initial investors participating in the seeding may be AuthorizedParticipants, a lead market maker or other third party investor or an affiliate of each Fund or each Fund’s adviser. Each suchinitial investor may sell some or all of the shares underlying the Creation Unit(s) held by them pursuant to the registrationstatement for each Fund (each, a “Selling Shareholder”), which shares have been registered to permit the resale from time totime after purchase. Each Fund will not receive any of the proceeds from the resale by the Selling Shareholders of theseshares.
Selling Shareholders may sell shares owned by them directly or through broker-dealers, in accordance with applicable law, onany national securities exchange on which the shares may be listed or quoted at the time of sale, through trading systems, inthe OTC market or in transactions other than on these exchanges or systems at fixed prices, at prevailing market prices at thetime of the sale, at varying prices determined at the time of sale, or at negotiated prices. These sales may be effected throughbrokerage transactions, privately negotiated trades, block sales, entry into options or other derivatives transactions orthrough any other means authorized by applicable law. Selling Shareholders may redeem the shares held in Creation Unit sizeby them through an Authorized Participant.
Any Selling Shareholder and any broker-dealer or agents participating in the distribution of shares may be deemed to be“underwriters” within the meaning of Section 2(a)(11) of the 1933 Act, in connection with such sales.
Any Selling Shareholder and any other person participating in such distribution will be subject to applicable provisions of the1934 Act and the rules and regulations thereunder.
Creation and Redemption of Creation UnitsGeneral. The Trust issues and sells shares of each Fund only in Creation Units on a continuous basis through the Distributoror its agent, without a sales load, at a price based on the NAV next determined after receipt, on any Business Day (as definedbelow), of an order received by the Distributor or its agent in proper form. On days when the applicable Listing Exchangecloses earlier than normal, the Funds may require orders to be placed earlier in the day. The following table sets forth thenumber of shares of a Fund that constitute a Creation Unit for such Fund and the approximate value of such Creation Unit asof April 30, 2018 (except as noted):
FundShares Per
Creation Unit
ApproximateValue PerCreation
Unit (U.S.$)
iShares Core S&P 500 ETF 50,000 $13,311,000iShares Core S&P Mid-Cap ETF 50,000 9,351,500iShares Core S&P Small-Cap ETF 50,000 3,891,000iShares Core S&P Total U.S. Stock Market ETF 50,000 3,032,000iShares Core S&P U.S. Growth ETF 50,000 2,733,000iShares Core S&P U.S. Value ETF 50,000 2,667,500iShares Europe ETF 50,000 2,391,000iShares Expanded Tech Sector ETF 50,000 9,043,500iShares Expanded Tech-Software Sector ETF 50,000 8,681,500iShares Global 100 ETF1 50,000 2,300,500iShares Global Clean Energy ETF 100,000 987,000iShares Global Comm Services ETF 50,000 2,917,000iShares Global Consumer Discretionary ETF 50,000 5,719,000iShares Global Consumer Staples ETF1 50,000 2,399,500iShares Global Energy ETF 150,000 5,556,000
166

FundShares Per
Creation Unit
ApproximateValue PerCreation
Unit (U.S.$)
iShares Global Financials ETF 50,000 3,474,000iShares Global Industrials ETF 50,000 4,520,000iShares Global Infrastructure ETF 100,000 4,376,000iShares Global Utilities ETF 50,000 2,501,000iShares International Developed Property ETF 100,000 3,975,000iShares International Preferred Stock ETF 50,000 903,500iShares JPX-Nikkei 400 ETF 150,000 9,867,000iShares Micro-Cap ETF 50,000 4,866,500iShares Mortgage Real Estate ETF 50,000 2,131,000iShares Nasdaq Biotechnology ETF 50,000 5,177,000iShares North American Natural Resources ETF 50,000 1,782,500iShares North American Tech-Multimedia Networking ETF 50,000 2,582,500iShares PHLX Semiconductor ETF 50,000 8,433,000iShares Preferred and Income Securities ETF 50,000 1,856,500iShares Residential Real Estate ETF 50,000 2,904,000iShares Russell 1000 ETF 50,000 7,363,500iShares Russell 1000 Growth ETF 50,000 6,823,500iShares Russell 1000 Pure U.S. Revenue ETF 50,000 1,313,500iShares Russell 1000 Value ETF 50,000 6,016,000iShares Russell 2000 ETF 50,000 7,664,000iShares Russell 2000 Growth ETF 50,000 9,540,500iShares Russell 2000 Value ETF 50,000 6,204,500iShares Russell 3000 ETF 50,000 7,843,500iShares Russell Mid-Cap ETF2 50,000 2,499,699iShares Russell Mid-Cap Growth ETF 50,000 6,087,000iShares Russell Mid-Cap Value ETF 50,000 4,343,000iShares Russell Top 200 ETF 50,000 3,047,000iShares Russell Top 200 Growth ETF 50,000 3,704,500iShares Russell Top 200 Value ETF 50,000 2,525,500iShares S&P 100 ETF 50,000 5,819,000iShares S&P 500 Growth ETF 50,000 7,771,500iShares S&P 500 Value ETF 50,000 5,493,000iShares S&P Mid-Cap 400 Growth ETF 50,000 10,787,500iShares S&P Mid-Cap 400 Value ETF 50,000 7,772,500iShares S&P Small-Cap 600 Growth ETF 50,000 8,721,500iShares S&P Small-Cap 600 Value ETF 50,000 7,673,500iShares U.S. Aerospace & Defense ETF 50,000 9,619,500iShares U.S. Broker-Dealers & Securities Exchanges ETF 50,000 3,289,500iShares U.S. Healthcare Providers ETF 50,000 8,198,000iShares U.S. Home Construction ETF 50,000 1,923,000iShares U.S. Infrastructure ETF 50,000 1,294,000iShares U.S. Insurance ETF 50,000 3,247,500iShares U.S. Medical Devices ETF 50,000 9,414,500iShares U.S. Oil & Gas Exploration & Production ETF 50,000 3,545,500iShares U.S. Oil Equipment & Services ETF 50,000 1,857,500iShares U.S. Pharmaceuticals ETF 50,000 7,214,500iShares U.S. Real Estate ETF 50,000 3,783,000iShares U.S. Regional Banks ETF 50,000 2,537,000iShares U.S. Telecommunications ETF 50,000 1,386,500
1 The approximate value per creation unit for the iShares Global 100 ETF and iShares Global Consumer Staples ETF is as of May 2, 2018.
167

2 The approximate value per creation unit for the iShares Russell Mid-Cap ETF is as of October 26, 2018.
In its discretion, the Trust reserves the right to increase or decrease the number of a Fund’s shares that constitute a CreationUnit. The Board reserves the right to declare a split or a consolidation in the number of shares outstanding of any Fund, andto make a corresponding change in the number of shares constituting a Creation Unit, in the event that the per share price inthe secondary market rises (or declines) to an amount that falls outside the range deemed desirable by the Board.
A “Business Day” with respect to each Fund is any day on which the Listing Exchange on which the Fund is listed for tradingis open for business. As of the date of this SAI, each Listing Exchange observes the following holidays, as observed: NewYear’s Day, Martin Luther King, Jr. Day, Presidents’ Day, Good Friday, Memorial Day, Independence Day, Labor Day,Thanksgiving Day and Christmas Day.
Fund Deposit. The consideration for purchase of Creation Units of a Fund generally consists of the Deposit Securities andthe Cash Component computed as described below. Together, the Deposit Securities and the Cash Component constitute the“Fund Deposit,” which, when combined with the Fund’s portfolio securities, is designed to generate performance that has acollective investment profile similar to that of the Underlying Index. The Fund Deposit represents the minimum initial andsubsequent investment amount for a Creation Unit of any Fund.
The “Cash Component” is an amount equal to the difference between the NAV of the shares (per Creation Unit) and the“Deposit Amount,” which is an amount equal to the market value of the Deposit Securities, and serves to compensate for anydifferences between the NAV per Creation Unit and the Deposit Amount. Payment of any stamp duty or other similar fees andexpenses payable upon transfer of beneficial ownership of the Deposit Securities are the sole responsibility of the AuthorizedParticipant purchasing the Creation Unit.
BFA makes available through the NSCC on each Business Day prior to the opening of business on the Listing Exchange, thelist of names and the required number of shares of each Deposit Security and the amount of the Cash Component to beincluded in the current Fund Deposit (based on information as of the end of the previous Business Day for each Fund). SuchFund Deposit is applicable, subject to any adjustments as described below, to purchases of Creation Units of shares of a givenFund until such time as the next-announced Fund Deposit is made available.
The identity and number of shares of the Deposit Securities change pursuant to changes in the composition of a Fund’sportfolio and as rebalancing adjustments and corporate action events are reflected from time to time by BFA with a view tothe investment objective of the Fund. The composition of the Deposit Securities may also change in response to adjustmentsto the weighting or composition of the component securities constituting the relevant Underlying Index.
The Funds reserve the right to permit or require the substitution of a “cash in lieu” amount to be added to the CashComponent to replace any Deposit Security that may not be available in sufficient quantity for delivery or that may not beeligible for transfer through DTC or the clearing process (as discussed below) or that the Authorized Participant is not able totrade due to a trading restriction. The Funds also reserve the right to permit or require a “cash in lieu” amount in certaincircumstances, including circumstances in which the delivery of the Deposit Security by the Authorized Participant would berestricted under applicable securities or other local laws or in certain other situations. The Funds also reserve the right topermit or require the substitution of Deposit Securities in lieu of cash.
Cash Purchase Method. Although the Trust does not generally permit partial or full cash purchases of Creation Units of itsfunds, when partial or full cash purchases of Creation Units are available or specified for a Fund, they will be effected inessentially the same manner as in-kind purchases thereof. In the case of a partial or full cash purchase, the AuthorizedParticipant must pay the cash equivalent of the Deposit Securities it would otherwise be required to provide through an in-kind purchase, plus the same Cash Component required to be paid by an in-kind purchaser.
Procedures for Creation of Creation Units. To be eligible to place orders with the Distributor and to create a Creation Unit ofthe Fund, an entity must be: (i) a “Participating Party,” i.e., a broker-dealer or other participant in the clearing process throughthe Continuous Net Settlement System of the NSCC (the “Clearing Process”), a clearing agency that is registered with theSEC, or (ii) a DTC Participant, and must have executed an agreement with the Distributor, with respect to creations andredemptions of Creation Units (“Authorized Participant Agreement”) (discussed below). A Participating Party or DTCParticipant who has executed an Authorized Participant Agreement is referred to as an “Authorized Participant.” All shares ofthe Fund, however created, will be entered on the records of DTC in the name of Cede & Co. for the account of a DTCParticipant.
168

Role of the Authorized Participant. Creation Units may be purchased only by or through a DTC Participant that has enteredinto an Authorized Participant Agreement with the Distributor (an “Authorized Participant”). Such Authorized Participant willagree, pursuant to the terms of such Authorized Participant Agreement and on behalf of itself or any investor on whosebehalf it will act, to certain conditions, including that such Authorized Participant will make available in advance of eachpurchase of shares an amount of cash sufficient to pay the Cash Component, once the net asset value of a Creation Unit isnext determined after receipt of the purchase order in proper form, together with the transaction fees described below. AnAuthorized Participant, acting on behalf of an investor, may require the investor to enter into an agreement with suchAuthorized Participant with respect to certain matters, including payment of the Cash Component. Investors who are notAuthorized Participants must make appropriate arrangements with an Authorized Participant. Investors should be aware thattheir particular broker may not be a DTC Participant or may not have executed an Authorized Participant Agreement and thatorders to purchase Creation Units may have to be placed by the investor’s broker through an Authorized Participant. As aresult, purchase orders placed through an Authorized Participant may result in additional charges to such investor. The Trustdoes not expect to enter into an Authorized Participant Agreement with more than a small number of DTC Participants. A listof current Authorized Participants may be obtained from the Distributor. The Distributor has adopted guidelines regardingAuthorized Participants’ transactions in Creation Units that are made available to all Authorized Participants. These guidelinesset forth the processes and standards for Authorized Participants to transact with the Distributor and its agents in connectionwith creation and redemption transactions. In addition, the Distributor may be appointed as the proxy of the AuthorizedParticipant and may be granted a power of attorney under its Authorized Participant Agreement.
Purchase Orders. To initiate an order for a Creation Unit, an Authorized Participant must submit to the Distributor or itsagent an irrevocable order to purchase shares of a Fund, in proper form, generally before 4:00 p.m., Eastern time on anyBusiness Day to receive that day’s NAV. The Distributor or its agent will notify BFA and the custodian of such order. Thecustodian will then provide such information to any appropriate sub-custodian. Procedures and requirements governing thedelivery of the Fund Deposit are set forth in the procedures handbook for Authorized Participants and may change from timeto time. Investors, other than Authorized Participants, are responsible for making arrangements for a creation request to bemade through an Authorized Participant. The Distributor or its agent will provide a list of current Authorized Participantsupon request. Those placing orders to purchase Creation Units through an Authorized Participant should allow sufficient timeto permit proper submission of the purchase order to the Distributor or its agent by the Cutoff Time (as defined below) onsuch Business Day.
The Authorized Participant must also make available on or before the contractual settlement date, by means satisfactory tothe Funds, immediately available or same day funds estimated by the Funds to be sufficient to pay the Cash Component nextdetermined after acceptance of the purchase order, together with the applicable purchase transaction fees. Those placingorders should ascertain the applicable deadline for cash transfers by contacting the operations department of the broker ordepositary institution effectuating the transfer of the Cash Component. This deadline is likely to be significantly earlier thanthe Cutoff Time of the Funds. Investors should be aware that an Authorized Participant may require orders for purchases ofshares placed with it to be in the particular form required by the individual Authorized Participant.
The Authorized Participant is responsible for any and all expenses and costs incurred by a Fund, including any applicable cashamounts, in connection with any purchase order.
Timing of Submission of Purchase Orders. An Authorized Participant must submit an irrevocable order to purchase sharesof a Fund generally before 4:00 p.m., Eastern time on any Business Day in order to receive that day’s NAV. Creation Ordersmust be transmitted by an Authorized Participant in the form required by the Funds to the Distributor or its agent pursuant toprocedures set forth in the Authorized Participant Agreement. Economic or market disruptions or changes, or telephone orother communication failure, may impede the ability to reach the Distributor or its agent or an Authorized Participant. Ordersto create shares of a Fund that are submitted on the Business Day immediately preceding a holiday or a day (other than aweekend) when the equity markets in the relevant non-U.S. market are closed may not be accepted. Each Fund’s deadlinespecified above for the submission of purchase orders is referred to as that Fund’s “Cutoff Time.” The Distributor or its agent,in their discretion, may permit the submission of such orders and requests by or through an Authorized Participant at anytime (including on days on which the Listing Exchange is not open for business) via communication through the facilities ofthe Distributor’s or its agent’s proprietary website maintained for this purpose. Purchase orders and redemption requests, ifaccepted by the Trust, will be processed based on the NAV next determined after such acceptance in accordance with aFund’s Cutoff Times as provided in the Authorized Participant Agreement and disclosed in this SAI.
169

Acceptance of Orders for Creation Units. Subject to the conditions that (i) an irrevocable purchase order has beensubmitted by the Authorized Participant (either on its own or another investor’s behalf ) and (ii) arrangements satisfactory tothe Funds are in place for payment of the Cash Component and any other cash amounts which may be due, the Funds willaccept the order, subject to each Fund’s right (and the right of the Distributor and BFA) to reject any order until acceptance,as set forth below.
Once a Fund has accepted an order, upon the next determination of the net asset value of the shares, the Fund will confirmthe issuance of a Creation Unit, against receipt of payment, at such net asset value. The Distributor or its agent will thentransmit a confirmation of acceptance to the Authorized Participant that placed the order.
Each Fund reserves the absolute right to reject or revoke a creation order transmitted to it by the Distributor or its agent if (i)the order is not in proper form; (ii) the investor(s), upon obtaining the shares ordered, would own 80% or more of thecurrently outstanding shares of the Fund; (iii) the Deposit Securities delivered do not conform to the identity and number ofshares specified, as described above; (iv) acceptance of the Deposit Securities would have certain adverse tax consequencesto the Fund; (v) acceptance of the Fund Deposit would, in the opinion of counsel, be unlawful; (vi) acceptance of the FundDeposit would, in the discretion of the Fund or BFA, have an adverse effect on the Fund or the rights of beneficial owners; or(vii) circumstances outside the control of the Fund, the Distributor or its agent and BFA make it impracticable to processpurchase orders. The Distributor or its agent shall notify a prospective purchaser of a Creation Unit and/or the AuthorizedParticipant acting on behalf of such purchaser of its rejection of such order. The Funds, State Street, the sub-custodian andthe Distributor or its agent are under no duty, however, to give notification of any defects or irregularities in the delivery ofFund Deposits nor shall any of them incur any liability for failure to give such notification.
Issuance of a Creation Unit. Except as provided herein, a Creation Unit will not be issued until the transfer of good title tothe applicable Fund of the Deposit Securities and the payment of the Cash Component have been completed. When the sub-custodian has confirmed to the custodian that the securities included in the Fund Deposit (or the cash value thereof) havebeen delivered to the account of the relevant sub-custodian or sub-custodians, the Distributor or its agent and BFA shall benotified of such delivery and the applicable Fund will issue and cause the delivery of the Creation Unit. For the iShares CoreS&P 500 ETF, iShares Core S&P Mid-Cap ETF, iShares Core S&P Small-Cap ETF, iShares Core S&P Total U.S. Stock Market ETF,iShares Core S&P U.S. Growth ETF, iShares Core S&P U.S. Value ETF, iShares Europe ETF, iShares Expanded Tech Sector ETF,iShares Expanded Tech-Software Sector ETF, iShares Global 100 ETF, iShares Global Clean Energy ETF, iShares GlobalConsumer Staples ETF, iShares Global Energy ETF, iShares Global Financials ETF, iShares Global Infrastructure ETF, iSharesGlobal Utilities ETF, iShares International Preferred Stock ETF, iShares Micro-Cap ETF, iShares Mortgage Real Estate ETF,iShares Nasdaq Biotechnology ETF, iShares North American Natural Resources ETF, iShares North American Tech-MultimediaNetworking ETF, iShares PHLX Semiconductor ETF, iShares Preferred and Income Securities ETF, iShares Residential RealEstate ETF, iShares Russell 1000 ETF, iShares Russell 1000 Growth ETF, iShares Russell 1000 Pure U.S. Revenue ETF, iSharesRussell 1000 Value ETF, iShares Russell 2000 ETF, iShares Russell 2000 Growth ETF, iShares Russell 2000 Value ETF, iSharesRussell 3000 ETF, iShares Russell Mid-Cap ETF, iShares Russell Mid-Cap Growth ETF, iShares Russell Mid-Cap Value ETF,iShares Russell Top 200 ETF, iShares Russell Top 200 Growth ETF, iShares Russell Top 200 Value ETF, iShares S&P 100 ETF,iShares S&P 500 Growth ETF, iShares S&P 500 Value ETF, iShares S&P Mid-Cap 400 Growth ETF, iShares S&P Mid-Cap 400Value ETF, iShares S&P Small-Cap 600 Growth ETF, iShares S&P Small-Cap 600 Value ETF, iShares U.S. Aerospace & DefenseETF, iShares U.S. Broker-Dealers & Securities Exchanges ETF, iShares U.S. Healthcare Providers ETF, iShares U.S. HomeConstruction ETF, iShares U.S. Infrastructure ETF, iShares U.S. Insurance ETF, iShares U.S. Medical Devices ETF, iShares U.S. Oil& Gas Exploration & Production ETF, iShares U.S. Oil Equipment & Services ETF, iShares U.S. Pharmaceuticals ETF, iShares U.S.Real Estate ETF, iShares U.S. Regional Banks ETF and iShares U.S. Telecommunications ETF, Creation Units are generallyissued on a “T+2 basis” (i.e., two Business Days after trade date). For the iShares Global Comm Services ETF, iShares GlobalConsumer Discretionary ETF, iShares Global Industrials ETF, iShares International Developed Property ETF and iShares JPX-Nikkei 400 ETF, Creation Units are generally issued on a “T+3 basis” (i.e., three Business Days after trade date). However, eachFund reserves the right to settle Creation Unit transactions on a basis other than T+2 or T+3, including a shorter settlementperiod, if necessary or appropriate under the circumstances and compliant with applicable law. For example, certain Fundsreserve the right to settle Creation Unit transactions on a basis other than T+2 or T+3, in order to accommodate non-U.S.market holiday schedules (as discussed in Appendix B of this SAI), to account for different treatment among non-U.S. andU.S. markets of dividend record dates and ex-dividend dates (i.e., the last day the holder of a security can sell the security andstill receive dividends payable on the security) and in certain other circumstances.
To the extent contemplated by an Authorized Participant Agreement with the Distributor, each Fund will issue Creation Unitsto such Authorized Participant, notwithstanding the fact that the corresponding Fund Deposits have not been received in
170

part or in whole, in reliance on the undertaking of the Authorized Participant to deliver the missing Deposit Securities as soonas possible, which undertaking shall be secured by such Authorized Participant’s delivery and maintenance of collateralhaving a value at least equal to 105% and up to 115%, which percentage BFA may change at any time, in its sole discretion,of the value of the missing Deposit Securities in accordance with the Funds’ then-effective procedures. The Trust may usesuch cash deposit at any time to buy Deposit Securities for the Funds. The only collateral that is acceptable to the Funds iscash in U.S. dollars. Such cash collateral must be delivered no later than the time specified by a Fund or its custodian on thecontractual settlement date. The cash collateral posted by the Authorized Participant may be invested at the risk of theAuthorized Participant, and income, if any, on invested cash collateral will be paid to that Authorized Participant. Informationconcerning the Funds’ current procedures for collateralization of missing Deposit Securities is available from the Distributoror its agent. The Authorized Participant Agreement will permit the Funds to buy the missing Deposit Securities at any timeand will subject the Authorized Participant to liability for any shortfall between the cost to the Funds of purchasing suchsecurities and the cash collateral including, without limitation, liability for related brokerage, borrowings and other charges.
In certain cases, Authorized Participants may create and redeem Creation Units on the same trade date and in theseinstances, the Funds reserve the right to settle these transactions on a net basis or require a representation from theAuthorized Participants that the creation and redemption transactions are for separate beneficial owners. All questions as tothe number of shares of each security in the Deposit Securities and the validity, form, eligibility and acceptance for deposit ofany securities to be delivered shall be determined by each Fund and the Fund’s determination shall be final and binding.
Costs Associated with Creation Transactions. A standard creation transaction fee is imposed to offset the transfer andother transaction costs associated with the issuance of Creation Units. The standard creation transaction fee is charged tothe Authorized Participant on the day such Authorized Participant creates a Creation Unit, and is the same, regardless of thenumber of Creation Units purchased by the Authorized Participant on the applicable Business Day. If a purchase consistssolely or partially of cash, the Authorized Participant may also be required to cover (up to the maximum amount shownbelow) certain brokerage, tax, foreign exchange, execution, price movement and other costs and expenses related to theexecution of trades resulting from such transaction (which may, in certain instances, be based on a good faith estimate oftransaction costs). Authorized Participants will also bear the costs of transferring the Deposit Securities to the Funds. Certainfees/costs associated with creation transactions may be waived in certain circumstances. Investors who use the services of abroker or other financial intermediary to acquire Fund shares may be charged a fee for such services.
The following table sets forth each Fund’s standard creation transaction fees and maximum additional charge (as describedabove):
FundStandard Creation
Transaction FeeMaximum AdditionalCharge for Creations1
iShares Core S&P 500 ETF $ 1,250 3.0%iShares Core S&P Mid-Cap ETF 1,000 3.0%iShares Core S&P Small-Cap ETF 1,500 3.0%iShares Core S&P Total U.S. Stock Market ETF 3,000 3.0%iShares Core S&P U.S. Growth ETF 3,000 3.0%iShares Core S&P U.S. Value ETF 3,000 3.0%iShares Europe ETF 10,000 3.0%iShares Expanded Tech Sector ETF 650 3.0%iShares Expanded Tech-Software Sector ETF 250 3.0%iShares Global 100 ETF 2,000 3.0%iShares Global Clean Energy ETF 300 7.0%iShares Global Comm Services ETF 900 7.0%iShares Global Consumer Discretionary ETF 2,200 7.0%iShares Global Consumer Staples ETF 1,800 3.0%iShares Global Energy ETF 600 7.0%iShares Global Financials ETF 4,000 7.0%iShares Global Industrials ETF 2,200 7.0%iShares Global Infrastructure ETF 1,600 7.0%iShares Global Utilities ETF 1,600 7.0%iShares International Developed Property ETF 4,500 7.0%
171
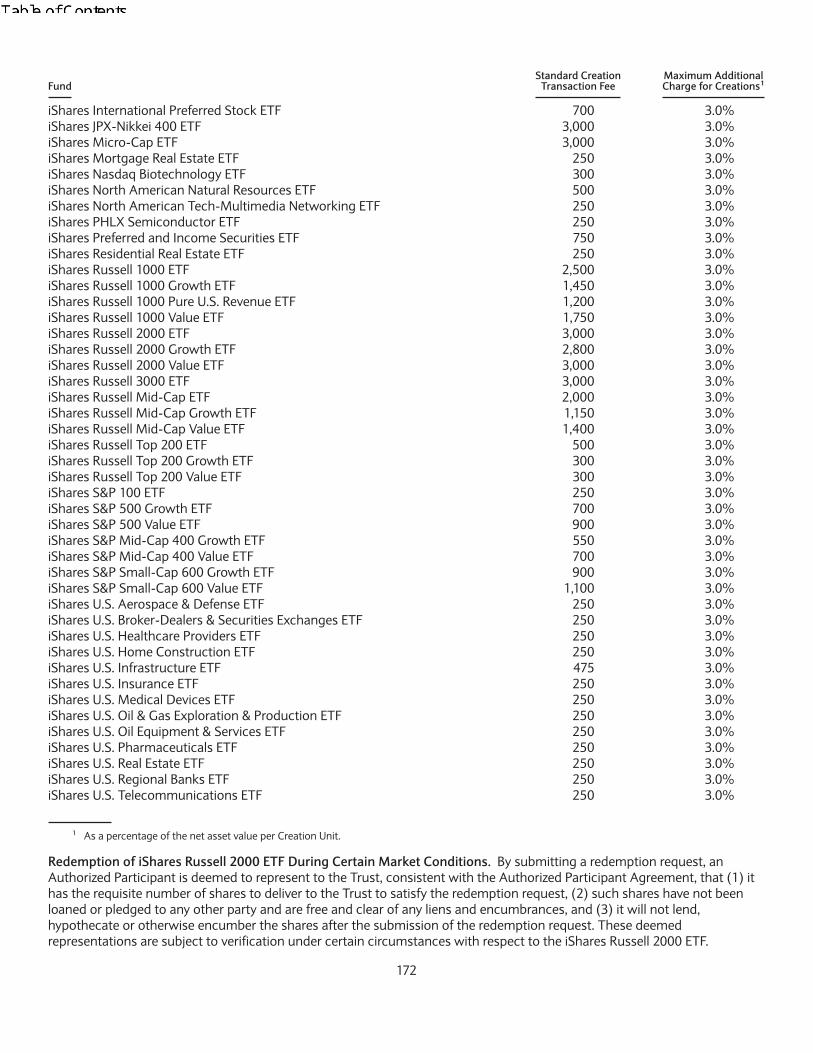
FundStandard Creation
Transaction FeeMaximum AdditionalCharge for Creations1
iShares International Preferred Stock ETF 700 3.0%iShares JPX-Nikkei 400 ETF 3,000 3.0%iShares Micro-Cap ETF 3,000 3.0%iShares Mortgage Real Estate ETF 250 3.0%iShares Nasdaq Biotechnology ETF 300 3.0%iShares North American Natural Resources ETF 500 3.0%iShares North American Tech-Multimedia Networking ETF 250 3.0%iShares PHLX Semiconductor ETF 250 3.0%iShares Preferred and Income Securities ETF 750 3.0%iShares Residential Real Estate ETF 250 3.0%iShares Russell 1000 ETF 2,500 3.0%iShares Russell 1000 Growth ETF 1,450 3.0%iShares Russell 1000 Pure U.S. Revenue ETF 1,200 3.0%iShares Russell 1000 Value ETF 1,750 3.0%iShares Russell 2000 ETF 3,000 3.0%iShares Russell 2000 Growth ETF 2,800 3.0%iShares Russell 2000 Value ETF 3,000 3.0%iShares Russell 3000 ETF 3,000 3.0%iShares Russell Mid-Cap ETF 2,000 3.0%iShares Russell Mid-Cap Growth ETF 1,150 3.0%iShares Russell Mid-Cap Value ETF 1,400 3.0%iShares Russell Top 200 ETF 500 3.0%iShares Russell Top 200 Growth ETF 300 3.0%iShares Russell Top 200 Value ETF 300 3.0%iShares S&P 100 ETF 250 3.0%iShares S&P 500 Growth ETF 700 3.0%iShares S&P 500 Value ETF 900 3.0%iShares S&P Mid-Cap 400 Growth ETF 550 3.0%iShares S&P Mid-Cap 400 Value ETF 700 3.0%iShares S&P Small-Cap 600 Growth ETF 900 3.0%iShares S&P Small-Cap 600 Value ETF 1,100 3.0%iShares U.S. Aerospace & Defense ETF 250 3.0%iShares U.S. Broker-Dealers & Securities Exchanges ETF 250 3.0%iShares U.S. Healthcare Providers ETF 250 3.0%iShares U.S. Home Construction ETF 250 3.0%iShares U.S. Infrastructure ETF 475 3.0%iShares U.S. Insurance ETF 250 3.0%iShares U.S. Medical Devices ETF 250 3.0%iShares U.S. Oil & Gas Exploration & Production ETF 250 3.0%iShares U.S. Oil Equipment & Services ETF 250 3.0%iShares U.S. Pharmaceuticals ETF 250 3.0%iShares U.S. Real Estate ETF 250 3.0%iShares U.S. Regional Banks ETF 250 3.0%iShares U.S. Telecommunications ETF 250 3.0%
1 As a percentage of the net asset value per Creation Unit.
Redemption of iShares Russell 2000 ETF During Certain Market Conditions. By submitting a redemption request, anAuthorized Participant is deemed to represent to the Trust, consistent with the Authorized Participant Agreement, that (1) ithas the requisite number of shares to deliver to the Trust to satisfy the redemption request, (2) such shares have not beenloaned or pledged to any other party and are free and clear of any liens and encumbrances, and (3) it will not lend,hypothecate or otherwise encumber the shares after the submission of the redemption request. These deemedrepresentations are subject to verification under certain circumstances with respect to the iShares Russell 2000 ETF.
172
Specifically, if an Authorized Participant submits a redemption request with respect to the iShares Russell 2000 ETF on aBusiness Day on which the Trust determines, based on information available to the Trust on such Business Day, that (i) theshort interest of the Fund in the marketplace is greater than or equal to 150% and (ii) the orders in the aggregate from allAuthorized Participants redeeming Fund shares on such Business Day represent 25% or more of the shares outstanding ofthe Fund, such Authorized Participant will be required to verify to the Trust (in a form specified by the Trust) the accuracy ofits deemed representations. If, after receiving notice of the verification requirement, the Authorized Participant does not verifythe accuracy of its deemed representations in accordance with this requirement, its redemption request will be considerednot to have been timely received in proper form.
Redemption of Creation Units. Shares of a Fund may be redeemed by Authorized Participants only in Creation Units at theirNAV next determined after receipt of a redemption request in proper form by the Distributor or its agent and only on aBusiness Day. The Funds will not redeem shares in amounts less than Creation Units. There can be no assurance, however,that there will be sufficient liquidity in the secondary market at any time to permit assembly of a Creation Unit. Investorsshould expect to incur brokerage and other costs in connection with assembling a sufficient number of shares to constitute aCreation Unit that could be redeemed by an Authorized Participant. Beneficial owners also may sell shares in the secondarymarket.
Each Fund generally redeems Creation Units for Fund Securities (as defined below). Please see the Cash Redemption Methodsection below and the following discussion summarizing the in-kind method for further information on redeeming CreationUnits of the Funds.
BFA makes available through the NSCC, prior to the opening of business on the Listing Exchange on each Business Day, thedesignated portfolio of securities (including any portion of such securities for which cash may be substituted) that will beapplicable (subject to possible amendment or correction) to redemption requests received in proper form (as defined below)on that day (“Fund Securities”), and an amount of cash (the “Cash Amount,” as described below). Such Fund Securities andthe corresponding Cash Amount (each subject to possible amendment or correction) are applicable, in order to effectredemptions of Creation Units of a Fund until such time as the next announced composition of the Fund Securities and CashAmount is made available. Fund Securities received on redemption may not be identical to Deposit Securities that areapplicable to creations of Creation Units. Procedures and requirements governing redemption transactions are set forth in thehandbook for Authorized Participants and may change from time to time.
Unless cash redemptions are available or specified for a Fund, the redemption proceeds for a Creation Unit generally consistof Fund Securities, plus the Cash Amount, which is an amount equal to the difference between the net asset value of theshares being redeemed, as next determined after the receipt of a redemption request in proper form, and the value of FundSecurities, less a redemption transaction fee (as described below).
The Trust may, in its sole discretion, substitute a “cash in lieu” amount to replace any Fund Security. The Trust also reservesthe right to permit or require a “cash in lieu” amount in certain circumstances, including circumstances in which: (i) thedelivery of a Fund Security to the Authorized Participant would be restricted under applicable securities or other local laws; or(ii) the delivery of a Fund Security to the Authorized Participant would result in the disposition of the Fund Security by theAuthorized Participant due to restrictions under applicable securities or other local laws, or in certain other situations. Theamount of cash paid out in such cases will be equivalent to the value of the substituted security listed as a Fund Security. Inthe event that the Fund Securities have a value greater than the NAV of the shares, a compensating cash payment equal tothe difference is required to be made by or through an Authorized Participant by the redeeming shareholder. Each Fundgenerally redeems Creation Units for Fund Securities, but each Fund reserves the right to utilize a cash option for redemptionof Creation Units. Each Fund may, in its sole discretion, provide such redeeming Authorized Participant a portfolio ofsecurities that differs from the exact composition of the Fund Securities, but does not differ in NAV.
Cash Redemption Method. Although the Trust does not generally permit partial or full cash redemptions of Creation Unitsof its funds, when partial or full cash redemptions of Creation Units are available or specified for a Fund, they will be effectedin essentially the same manner as in-kind redemptions thereof. In the case of partial or full cash redemption, the AuthorizedParticipant receives the cash equivalent of the Fund Securities it would otherwise receive through an in-kind redemption, plusthe same Cash Amount to be paid to an in-kind redeemer.
Costs Associated with Redemption Transactions. A standard redemption transaction fee is imposed to offset transfer andother transaction costs that may be incurred by the relevant Fund. The standard redemption transaction fee is charged to theAuthorized Participant on the day such Authorized Participant redeems a Creation Unit, and is the same regardless of the
173

number of Creation Units redeemed by an Authorized Participant on the applicable Business Day. If a redemption consistssolely or partially of cash, the Authorized Participant may also be required to cover (up to the maximum amount shownbelow) certain brokerage, tax, foreign exchange, execution, price movement and other costs and expenses related to theexecution of trades resulting from such transaction (which may, in certain instances, be based on a good faith estimate oftransaction costs). Authorized Participants will also bear the costs of transferring the Fund Securities from a Fund to theiraccount on their order. Certain fees/costs associated with redemption transactions may be waived in certain circumstances.Investors who use the services of a broker or other financial intermediary to dispose of Fund shares may be charged a fee forsuch services.
The following table sets forth each Fund’s standard redemption transaction fees and maximum additional charge (asdescribed above):
FundStandard Redemption
Transaction FeeMaximum Additional
Charge for Redemptions*
iShares Core S&P 500 ETF $ 1,250 2.0%iShares Core S&P Mid-Cap ETF 1,000 2.0%iShares Core S&P Small-Cap ETF 1,500 2.0%iShares Core S&P Total U.S. Stock Market ETF 3,000 2.0%iShares Core S&P U.S. Growth ETF 3,000 2.0%iShares Core S&P U.S. Value ETF 3,000 2.0%iShares Europe ETF 10,000 2.0%iShares Expanded Tech Sector ETF 650 2.0%iShares Expanded Tech-Software Sector ETF 250 2.0%iShares Global 100 ETF 2,000 2.0%iShares Global Clean Energy ETF 300 2.0%iShares Global Comm Services ETF 900 2.0%iShares Global Consumer Discretionary ETF 2,200 2.0%iShares Global Consumer Staples ETF 1,800 2.0%iShares Global Energy ETF 600 2.0%iShares Global Financials ETF 4,000 2.0%iShares Global Industrials ETF 2,200 2.0%iShares Global Infrastructure ETF 1,600 2.0%iShares Global Utilities ETF 1,600 2.0%iShares International Developed Property ETF 4,500 2.0%iShares International Preferred Stock ETF 700 2.0%iShares JPX-Nikkei 400 ETF 3,000 2.0%iShares Micro-Cap ETF 3,000 2.0%iShares Mortgage Real Estate ETF 250 2.0%iShares Nasdaq Biotechnology ETF 300 2.0%iShares North American Natural Resources ETF 500 2.0%iShares North American Tech-Multimedia Networking ETF 250 2.0%iShares PHLX Semiconductor ETF 250 2.0%iShares Preferred and Income Securities ETF 750 2.0%iShares Residential Real Estate ETF 250 2.0%iShares Russell 1000 ETF 2,500 2.0%iShares Russell 1000 Growth ETF 1,450 2.0%iShares Russell 1000 Pure U.S. Revenue ETF 1,200 2.0%iShares Russell 1000 Value ETF 1,750 2.0%iShares Russell 2000 ETF 3,000 2.0%iShares Russell 2000 Growth ETF 2,800 2.0%iShares Russell 2000 Value ETF 3,000 2.0%iShares Russell 3000 ETF 3,000 2.0%iShares Russell Mid-Cap ETF 2,000 2.0%iShares Russell Mid-Cap Growth ETF 1,150 2.0%
174

FundStandard Redemption
Transaction FeeMaximum Additional
Charge for Redemptions*
iShares Russell Mid-Cap Value ETF 1,400 2.0%iShares Russell Top 200 ETF 500 2.0%iShares Russell Top 200 Growth ETF 300 2.0%iShares Russell Top 200 Value ETF 300 2.0%iShares S&P 100 ETF 250 2.0%iShares S&P 500 Growth ETF 700 2.0%iShares S&P 500 Value ETF 900 2.0%iShares S&P Mid-Cap 400 Growth ETF 550 2.0%iShares S&P Mid-Cap 400 Value ETF 700 2.0%iShares S&P Small-Cap 600 Growth ETF 900 2.0%iShares S&P Small-Cap 600 Value ETF 1,100 2.0%iShares U.S. Aerospace & Defense ETF 250 2.0%iShares U.S. Broker-Dealers & Securities Exchanges ETF 250 2.0%iShares U.S. Healthcare Providers ETF 250 2.0%iShares U.S. Home Construction ETF 250 2.0%iShares U.S. Infrastructure ETF 475 2.0%iShares U.S. Insurance ETF 250 2.0%iShares U.S. Medical Devices ETF 250 2.0%iShares U.S. Oil & Gas Exploration & Production ETF 250 2.0%iShares U.S. Oil Equipment & Services ETF 250 2.0%iShares U.S. Pharmaceuticals ETF 250 2.0%iShares U.S. Real Estate ETF 250 2.0%iShares U.S. Regional Banks ETF 250 2.0%iShares U.S. Telecommunications ETF 250 2.0%
* As a percentage of the net asset value per Creation Unit, inclusive of the standard redemption transaction fee.
Placement of Redemption Orders. Redemption requests for Creation Units of the Funds must be submitted to theDistributor or its agent by or through an Authorized Participant. An Authorized Participant must submit an irrevocablerequest to redeem shares of a Fund generally before 4:00 p.m., Eastern time on any Business Day in order to receive thatday’s NAV. On days when the Listing Exchange closes earlier than normal, a Fund may require orders to redeem CreationUnits to be placed earlier that day. Investors, other than Authorized Participants, are responsible for making arrangements fora redemption request to be made through an Authorized Participant. The Distributor or its agent will provide a list of currentAuthorized Participants upon request.
The Authorized Participant must transmit the request for redemption in the form required by the Funds to the Distributor orits agent in accordance with procedures set forth in the Authorized Participant Agreement. Investors should be aware thattheir particular broker may not have executed an Authorized Participant Agreement and that, therefore, requests to redeemCreation Units may have to be placed by the investor’s broker through an Authorized Participant who has executed anAuthorized Participant Agreement. At any time, only a limited number of broker-dealers will have an Authorized ParticipantAgreement in effect. Investors making a redemption request should be aware that such request must be in the form specifiedby such Authorized Participant. Investors making a request to redeem Creation Units should allow sufficient time to permitproper submission of the request by an Authorized Participant and transfer of the shares to the Funds’ transfer agent; suchinvestors should allow for the additional time that may be required to effect redemptions through their banks, brokers orother financial intermediaries if such intermediaries are not Authorized Participants.
A redemption request is considered to be in “proper form” if: (i) an Authorized Participant has transferred or caused to betransferred to the Funds’ transfer agent the Creation Unit redeemed through the book-entry system of DTC so as to beeffective by the Listing Exchange closing time on any Business Day on which the redemption request is submitted; (ii) arequest in form satisfactory to the applicable Fund is received by the Distributor or its agent from the Authorized Participanton behalf of itself or another redeeming investor within the time periods specified above; and (iii) all other procedures setforth in the Authorized Participant Agreement are properly followed.
175

Upon receiving a redemption request, the Distributor or its agent shall notify the applicable Fund and the Fund’s transferagent of such redemption request. The tender of an investor’s shares for redemption and the distribution of the securitiesand/or cash included in the redemption payment made in respect of Creation Units redeemed will be made through DTC andthe relevant Authorized Participant to the Beneficial Owner thereof as recorded on the book-entry system of DTC or the DTCParticipant through which such investor holds, as the case may be, or by such other means specified by the AuthorizedParticipant submitting the redemption request.
A redeeming Authorized Participant, whether on its own account or acting on behalf of a Beneficial Owner, must maintainappropriate security arrangements with a qualified broker-dealer, bank or other custody providers in each jurisdiction inwhich any of the portfolio securities are customarily traded, to which account such portfolio securities will be delivered.
For the iShares Core S&P 500 ETF, iShares Core S&P Mid-Cap ETF, iShares Core S&P Small-Cap ETF, iShares Core S&P TotalU.S. Stock Market ETF, iShares Core S&P U.S. Growth ETF, iShares Core S&P U.S. Value ETF, iShares Europe ETF, iSharesExpanded Tech Sector ETF, iShares Expanded Tech-Software Sector ETF, iShares Global 100 ETF, iShares Global Clean EnergyETF, iShares Global Consumer Staples ETF, iShares Global Energy ETF, iShares Global Financials ETF, iShares GlobalInfrastructure ETF, iShares Global Utilities ETF, iShares International Preferred Stock ETF, iShares Micro-Cap ETF, iSharesMortgage Real Estate ETF, iShares Nasdaq Biotechnology ETF, iShares North American Natural Resources ETF, iShares NorthAmerican Tech-Multimedia Networking ETF, iShares PHLX Semiconductor ETF, iShares Preferred and Income Securities ETF,iShares Residential Real Estate ETF, iShares Russell 1000 ETF, iShares Russell 1000 Growth ETF, iShares Russell 1000 Pure U.S.Revenue ETF, iShares Russell 1000 Value ETF, iShares Russell 2000 ETF, iShares Russell 2000 Growth ETF, iShares Russell2000 Value ETF, iShares Russell 3000 ETF, iShares Russell Mid-Cap ETF, iShares Russell Mid-Cap Growth ETF, iShares RussellMid-Cap Value ETF, iShares Russell Top 200 ETF, iShares Russell Top 200 Growth ETF, iShares Russell Top 200 Value ETF,iShares S&P 100 ETF, iShares S&P 500 Growth ETF, iShares S&P 500 Value ETF, iShares S&P Mid-Cap 400 Growth ETF, iSharesS&P Mid-Cap 400 Value ETF, iShares S&P Small-Cap 600 Growth ETF, iShares S&P Small-Cap 600 Value ETF, iShares U.S.Aerospace & Defense ETF, iShares U.S. Broker-Dealers & Securities Exchanges ETF, iShares U.S. Healthcare Providers ETF,iShares U.S. Home Construction ETF, iShares U.S. Infrastructure ETF, iShares U.S. Insurance ETF, iShares U.S. Medical DevicesETF, iShares U.S. Oil & Gas Exploration & Production ETF, iShares U.S. Oil Equipment & Services ETF, iShares U.S.Pharmaceuticals ETF, iShares U.S. Real Estate ETF, iShares U.S. Regional Banks ETF and iShares U.S. Telecommunications ETF,deliveries of redemption proceeds are generally made within two Business Days (i.e., “T+2”). For the iShares Global CommServices ETF, iShares Global Consumer Discretionary ETF, iShares Global Industrials ETF, iShares International DevelopedProperty ETF and iShares JPX-Nikkei 400 ETF, deliveries of redemption proceeds are generally made within three BusinessDays (i.e., “T+3”). However, each Fund reserves the right to settle deliveries of redemption proceeds on a basis other than T+2or T+3, including a shorter settlement period, if necessary or appropriate under the circumstances and compliance withapplicable law. For example, certain Funds reserve the right to settle redemption transactions on a basis other than T+2 orT+3 to accommodate non-U.S. market holiday schedules (as discussed in Appendix B of this SAI), to account for differenttreatment among non-U.S. and U.S. markets of dividend record dates and dividend ex-dates (i.e., the last date the holder of asecurity can sell the security and still receive dividends payable on the security sold) and in certain other circumstances.Appendix B of this SAI identifies the instances, if any, where more than seven days would be needed to deliver redemptionproceeds for such Funds. Pursuant to an order of the SEC, for such Funds, the Trust will make delivery of redemptionproceeds within the number of days stated in Appendix B of this SAI to be the maximum number of days necessary to deliverredemption proceeds.
If neither the redeeming Beneficial Owner nor the Authorized Participant acting on behalf of such redeeming BeneficialOwner has appropriate arrangements to take delivery of Fund Securities in the applicable non-U.S. jurisdiction and it is notpossible to make other such arrangements, or if it is not possible to effect deliveries of Fund Securities in such jurisdiction, aFund may in its discretion exercise its option to redeem such shares in cash, and the redeeming Beneficial Owner will berequired to receive its redemption proceeds in cash. In such case, the investor will receive a cash payment equal to the netasset value of its shares based on the NAV of the relevant Fund next determined after the redemption request is received inproper form (minus a redemption transaction fee and additional charges specified above to offset the Fund’s brokerage andother transaction costs associated with the disposition of Fund Securities). Redemptions of shares for Fund Securities will besubject to compliance with applicable U.S. federal and state securities laws and each Fund (whether or not it otherwisepermits cash redemptions) reserves the right to redeem Creation Units for cash to the extent that the Fund cannot lawfullydeliver specific Fund Securities upon redemptions or cannot do so without first registering the Fund Securities under suchlaws.
176

Although the Trust does not ordinarily permit cash redemptions of Creation Units, in the event that cash redemptions arepermitted or required by the Trust, proceeds will be paid to the Authorized Participant redeeming shares as soon aspracticable after the date of redemption (within seven calendar days thereafter, except for the instances listed in Appendix Bto this SAI in which more than seven calendar days would be needed).
To the extent contemplated by an Authorized Participant’s agreement with the Distributor or its agent, in the event anAuthorized Participant has submitted a redemption request in proper form but is unable to transfer all or part of the CreationUnit to be redeemed to a Fund, at or prior to 10:00 a.m., Eastern time on the Listing Exchange business day after the date ofsubmission of such redemption request, the Distributor or its agent will accept the redemption request in reliance on theundertaking by the Authorized Participant to deliver the missing shares as soon as possible. Such undertaking shall besecured by the Authorized Participant’s delivery and maintenance of collateral consisting of cash, in U.S. dollars inimmediately available funds, having a value at least equal to 105% and up to 115%, which percentage BFA may change atany time, in its sole discretion, of the value of the missing shares. Such cash collateral must be delivered no later than thetime specified by a Fund or its Custodian on the day after the date of submission of such redemption request and shall beheld by State Street and marked-to-market daily. The fees of State Street and any sub-custodians in respect of the delivery,maintenance and redelivery of the cash collateral shall be payable by the Authorized Participant. The cash collateral posted bythe Authorized Participant may be invested at the risk of the Authorized Participant, and income, if any, on invested cashcollateral will be paid to that Authorized Participant. The Authorized Participant Agreement permits the Funds to acquireshares of the Funds at any time and subjects the Authorized Participant to liability for any shortfall between the aggregate ofthe cost to the Funds of purchasing such shares, plus the value of the Cash Amount, and the value of the cash collateraltogether with liability for related brokerage and other charges.
Because the portfolio securities of a Fund may trade on exchange(s) on days that the Listing Exchange is closed or areotherwise not Business Days for such Fund, shareholders may not be able to redeem their shares of such Fund, or purchaseor sell shares of such Fund on the Listing Exchange on days when the NAV of such a Fund could be significantly affected byevents in the relevant non-U.S. markets.
The right of redemption may be suspended or the date of payment postponed with respect to any Fund: (i) for any periodduring which the applicable Listing Exchange is closed (other than customary weekend and holiday closings); (ii) for anyperiod during which trading on the applicable Listing Exchange is suspended or restricted; (iii) for any period during which anemergency exists as a result of which disposal of the shares of the Fund’s portfolio securities or determination of its net assetvalue is not reasonably practicable; or (iv) in such other circumstance as is permitted by the SEC.
Taxation on Creations and Redemptions of Creation Units. An Authorized Participant generally will recognize either gain orloss upon the exchange of Deposit Securities for Creation Units. This gain or loss is calculated by taking the market value ofthe Creation Units purchased over the Authorized Participant’s aggregate basis in the Deposit Securities exchanged therefor.However, the IRS may apply the wash sales rules to determine that any loss realized upon the exchange of Deposit Securitiesfor Creation Units is not currently deductible. Authorized Participants should consult their own tax advisors.
Current U.S. federal income tax laws dictate that capital gain or loss realized from the redemption of Creation Units willgenerally create long-term capital gain or loss if the Authorized Participant holds the Creation Units for more than one year,or short-term capital gain or loss if the Creation Units were held for one year or less, if the Creation Units are held as capitalassets.
TaxesThe following is a summary of certain material U.S. federal income tax considerations regarding the purchase, ownership anddisposition of shares of a Fund. This summary does not address all of the potential U.S. federal income tax consequencesthat may be applicable to a Fund or to all categories of investors, some of which may be subject to special tax rules. Currentand prospective shareholders are urged to consult their own tax advisors with respect to the specific U.S. federal, state, localand non-U.S. tax consequences of investing in a Fund. The summary is based on the laws and judicial and administrativeinterpretations thereof in effect on the date of this SAI, all of which are subject to change, possibly with retroactive effect.
Tax reform legislation commonly known as the Tax Cuts and Jobs Act (the “Tax Act”) was enacted on December 22, 2017.The Tax Act makes significant changes to the U.S. federal income tax rules for individuals and corporations, generallyeffective for taxable years beginning after December 31, 2017. Most of the changes applicable to individuals are temporary
177

and, without further legislation, will not apply after 2025. The application of certain provisions of the Tax Act is uncertain,and the changes in the act may have indirect effects on a Fund, its investments and its shareholders that cannot be predicted.In addition, legislative, regulatory or administrative changes could be enacted or promulgated at any time, eitherprospectively or with retroactive effect. Prospective investors should consult their tax advisors regarding the implications ofthe Tax Act on their investment in a Fund.
Regulated Investment Company Qualifications. Each Fund intends to continue to qualify for treatment as a separate RICunder Subchapter M of the Internal Revenue Code. To qualify for treatment as a RIC, each Fund must annually distribute atleast 90% of its investment company taxable income (which includes dividends, interest and net short-term capital gains)and meet several other requirements. Among such other requirements are the following: (i) at least 90% of each Fund’sannual gross income must be derived from dividends, interest, payments with respect to securities loans, gains from the saleor other disposition of stock or securities or non-U.S. currencies, other income (including, but not limited to, gains fromoptions, futures or forward contracts) derived with respect to its business of investing in such stock, securities or currencies,and net income derived from interests in qualified publicly-traded partnerships (i.e., partnerships that are traded on anestablished securities market or tradable on a secondary market, other than partnerships that derive at least 90% of theirincome from interest, dividends, capital gains and other traditionally permitted RIC income); and (ii) at the close of eachquarter of each Fund’s taxable year, (a) at least 50% of the market value of each Fund’s total assets must be represented bycash and cash items, U.S. government securities, securities of other RICs and other securities, with such other securitieslimited for purposes of this calculation in respect of any one issuer to an amount not greater than 5% of the value of theFund’s assets and not greater than 10% of the outstanding voting securities of such issuer, and (b) not more than 25% of thevalue of each Fund’s total assets may be invested in the securities (other than U.S. government securities or the securities ofother RICs) of any one issuer, of two or more issuers of which 20% or more of the voting stock is held by the Fund and thatare engaged in the same or similar trades or businesses or related trades or businesses, or the securities of one or morequalified publicly-traded partnerships.
A Fund may be able to cure a failure to derive at least 90% of its income from the sources specified above or a failure todiversify its holdings in the manner described above by paying a tax and/or by disposing of certain assets. If, in any taxableyear, a Fund fails one of these tests and does not timely cure the failure, that Fund will be taxed in the same manner as anordinary corporation and distributions to its shareholders will not be deductible by that Fund in computing its taxableincome.
Although, in general, the passive loss rules of the Internal Revenue Code do not apply to RICs, such rules do apply to a RICwith respect to items attributable to interests in qualified publicly-traded partnerships. A Fund’s investments in partnerships,including in qualified publicly-traded partnerships, may result in the Fund being subject to state, local, or non-U.S. income,franchise or withholding tax liabilities.
Taxation of RICs. As a RIC, a Fund will not be subject to U.S. federal income tax on the portion of its taxable investmentincome and capital gains that it distributes to its shareholders, provided that it satisfies a minimum distribution requirement.To satisfy the minimum distribution requirement, a Fund must distribute to its shareholders at least the sum of (i) 90% of its“investment company taxable income” (i.e., income other than its net realized long-term capital gain over its net realizedshort-term capital loss), plus or minus certain adjustments, and (ii) 90% of its net tax-exempt income for the taxable year. AFund will be subject to income tax at regular corporate rates on any taxable income or gains that it does not distribute to itsshareholders. If a Fund fails to qualify for any taxable year as a RIC or fails to meet the distribution requirement, all of itstaxable income will be subject to tax at regular corporate income tax rates without any deduction for distributions toshareholders, and such distributions generally will be taxable to shareholders as ordinary dividends to the extent of theFund’s current and accumulated earnings and profits. In such event, distributions to individuals should be eligible to betreated as qualified dividend income and distributions to corporate shareholders generally should be eligible for the dividendsreceived deduction. Although each Fund intends to distribute substantially all of its net investment income and its capitalgains for each taxable year, each Fund will be subject to U.S. federal income taxation to the extent any such income or gainsare not distributed. If a Fund fails to qualify as a RIC in any year, it must pay out its earnings and profits accumulated in thatyear in order to qualify again as a RIC. If a Fund fails to qualify as a RIC for a period greater than two taxable years, the Fundmay be required to recognize any net built-in gains with respect to certain of its assets (i.e., the excess of the aggregate gains,including items of income, over aggregate losses that would have been realized with respect to such assets if the Fund hadbeen liquidated) if it qualifies as a RIC in a subsequent year.
178
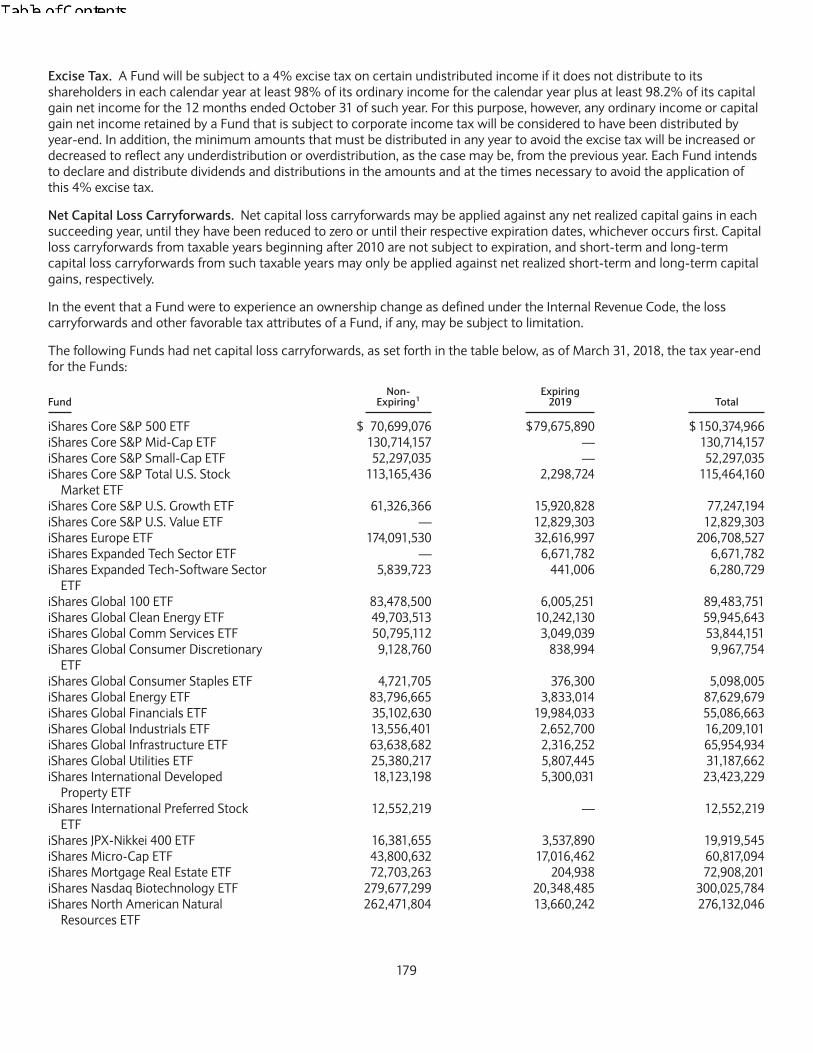
Excise Tax. A Fund will be subject to a 4% excise tax on certain undistributed income if it does not distribute to itsshareholders in each calendar year at least 98% of its ordinary income for the calendar year plus at least 98.2% of its capitalgain net income for the 12 months ended October 31 of such year. For this purpose, however, any ordinary income or capitalgain net income retained by a Fund that is subject to corporate income tax will be considered to have been distributed byyear-end. In addition, the minimum amounts that must be distributed in any year to avoid the excise tax will be increased ordecreased to reflect any underdistribution or overdistribution, as the case may be, from the previous year. Each Fund intendsto declare and distribute dividends and distributions in the amounts and at the times necessary to avoid the application ofthis 4% excise tax.
Net Capital Loss Carryforwards. Net capital loss carryforwards may be applied against any net realized capital gains in eachsucceeding year, until they have been reduced to zero or until their respective expiration dates, whichever occurs first. Capitalloss carryforwards from taxable years beginning after 2010 are not subject to expiration, and short-term and long-termcapital loss carryforwards from such taxable years may only be applied against net realized short-term and long-term capitalgains, respectively.
In the event that a Fund were to experience an ownership change as defined under the Internal Revenue Code, the losscarryforwards and other favorable tax attributes of a Fund, if any, may be subject to limitation.
The following Funds had net capital loss carryforwards, as set forth in the table below, as of March 31, 2018, the tax year-endfor the Funds:
FundNon-
Expiring1Expiring
2019 Total
iShares Core S&P 500 ETF $ 70,699,076 $79,675,890 $ 150,374,966iShares Core S&P Mid-Cap ETF 130,714,157 — 130,714,157iShares Core S&P Small-Cap ETF 52,297,035 — 52,297,035iShares Core S&P Total U.S. Stock
Market ETF113,165,436 2,298,724 115,464,160
iShares Core S&P U.S. Growth ETF 61,326,366 15,920,828 77,247,194iShares Core S&P U.S. Value ETF — 12,829,303 12,829,303iShares Europe ETF 174,091,530 32,616,997 206,708,527iShares Expanded Tech Sector ETF — 6,671,782 6,671,782iShares Expanded Tech-Software Sector
ETF5,839,723 441,006 6,280,729
iShares Global 100 ETF 83,478,500 6,005,251 89,483,751iShares Global Clean Energy ETF 49,703,513 10,242,130 59,945,643iShares Global Comm Services ETF 50,795,112 3,049,039 53,844,151iShares Global Consumer Discretionary
ETF9,128,760 838,994 9,967,754
iShares Global Consumer Staples ETF 4,721,705 376,300 5,098,005iShares Global Energy ETF 83,796,665 3,833,014 87,629,679iShares Global Financials ETF 35,102,630 19,984,033 55,086,663iShares Global Industrials ETF 13,556,401 2,652,700 16,209,101iShares Global Infrastructure ETF 63,638,682 2,316,252 65,954,934iShares Global Utilities ETF 25,380,217 5,807,445 31,187,662iShares International Developed
Property ETF18,123,198 5,300,031 23,423,229
iShares International Preferred StockETF
12,552,219 — 12,552,219
iShares JPX-Nikkei 400 ETF 16,381,655 3,537,890 19,919,545iShares Micro-Cap ETF 43,800,632 17,016,462 60,817,094iShares Mortgage Real Estate ETF 72,703,263 204,938 72,908,201iShares Nasdaq Biotechnology ETF 279,677,299 20,348,485 300,025,784iShares North American Natural
Resources ETF262,471,804 13,660,242 276,132,046
179

FundNon-
Expiring1Expiring
2019 Total
iShares North American Tech-Multimedia Networking ETF
61,833,338 14,653,934 76,487,272
iShares PHLX Semiconductor ETF 30,858,329 12,256,265 43,114,594iShares Preferred and Income Securities
ETF781,772,549 — 781,772,549
iShares Russell 1000 ETF 29,448,389 9,763,988 39,212,377iShares Russell 1000 Growth ETF 176,529,082 398,954,951 575,484,033iShares Russell 1000 Pure U.S. Revenue
ETF14,057 — 14,057
iShares Russell 1000 Value ETF 185,214,971 147,982,939 333,197,910iShares Russell 2000 ETF 4,094,616,145 369,305,656 4,463,921,801iShares Russell 2000 Growth ETF 578,557,260 276,373,290 854,930,550iShares Russell 2000 Value ETF 87,131,665 113,368,565 200,500,230iShares Russell 3000 ETF 1,106,039 31,991,900 33,097,939iShares Russell Mid-Cap ETF 128,855,004 27,732,055 156,587,059iShares Russell Mid-Cap Growth ETF 122,861,357 137,522,509 260,383,866iShares Russell Mid-Cap Value ETF 19,651,322 4,032,186 23,683,508iShares Russell Top 200 ETF 1,770,484 6,757 1,777,241iShares Russell Top 200 Growth ETF 16,956,012 3,894,801 20,850,813iShares Russell Top 200 Value ETF 1,324,031 3,410,225 4,734,256iShares S&P 100 ETF 105,454,696 3,268,822 108,723,518iShares S&P 500 Growth ETF 214,847,551 370,536,779 585,384,330iShares S&P 500 Value ETF 93,911,541 55,268,179 149,179,720iShares S&P Mid-Cap 400 Growth ETF — — —iShares S&P Mid-Cap 400 Value ETF 71,776,652 13,207,083 84,983,735iShares S&P Small-Cap 600 Growth ETF 131,680,725 10,658,983 142,339,708iShares S&P Small-Cap 600 Value ETF 40,082,373 — 40,082,373iShares U.S. Aerospace & Defense ETF — 1,447,425 1,447,425iShares U.S. Broker-Dealers & Securities
Exchanges ETF18,749,452 2,266,806 21,016,258
iShares U.S. Healthcare Providers ETF 26,395,151 — 26,395,151iShares U.S. Home Construction ETF 12,525,142 7,844,464 20,369,606iShares U.S. Infrastructure ETF — — —iShares U.S. Insurance ETF 266,501 2,460,926 2,727,427iShares U.S. Medical Devices ETF — 5,415,460 5,415,460iShares U.S. Oil & Gas Exploration &
Production ETF73,582,602 7,967,383 81,549,985
iShares U.S. Oil Equipment & ServicesETF
108,674,639 23,866,864 132,541,503
iShares U.S. Pharmaceuticals ETF 72,598,070 — 72,598,070iShares U.S. Real Estate ETF 40,684,341 — 40,684,341iShares U.S. Regional Banks ETF 8,253,803 1,225,053 9,478,856iShares U.S. Telecommunications ETF 171,456,185 30,701,158 202,157,343
1 Must be utilized prior to losses subject to expiration.
Taxation of U.S. Shareholders. Dividends and other distributions by a Fund are generally treated under the Internal RevenueCode as received by the shareholders at the time the dividend or distribution is made. However, any dividend or distributiondeclared by a Fund in October, November or December of any calendar year and payable to shareholders of record on aspecified date in such a month shall be deemed to have been received by each shareholder on December 31 of such calendaryear and to have been paid by the Fund not later than such December 31, provided such dividend is actually paid by the Fundduring January of the following calendar year.
180

Each Fund intends to distribute annually to its shareholders substantially all of its investment company taxable income andany net realized long-term capital gains in excess of net realized short-term capital losses (including any capital losscarryovers). However, if a Fund retains for investment an amount equal to all or a portion of its net long-term capital gains inexcess of its net short-term capital losses (including any capital loss carryovers), it will be subject to a corporate tax (at a flatrate of 21%) on the amount retained. In that event, the Fund will designate such retained amounts as undistributed capitalgains in a notice to its shareholders who (a) will be required to include in income for U.S. federal income tax purposes, aslong-term capital gains, their proportionate shares of the undistributed amount, (b) will be entitled to credit theirproportionate shares of the tax paid by the Fund on the undistributed amount against their U.S. federal income tax liabilities,if any, and to claim refunds to the extent their credits exceed their liabilities, if any, and (c) will be entitled to increase their taxbasis, for U.S. federal income tax purposes, in their shares by an amount equal to the excess of the amount in clause (a) overthe amount in clause (b). Organizations or persons not subject to U.S. federal income tax on such capital gains will beentitled to a refund of their pro rata share of such taxes paid by the Fund upon filing appropriate returns or claims for refundwith the IRS.
Distributions of net realized long-term capital gains, if any, that a Fund reports as capital gains dividends are taxable as long-term capital gains, whether paid in cash or in shares and regardless of how long a shareholder has held shares of the Fund.All other dividends of a Fund (including dividends from short-term capital gains) from its current and accumulated earningsand profits (“regular dividends”) are generally subject to tax as ordinary income, subject to the discussion of qualifieddividend income below. Long-term capital gains are eligible for taxation at a maximum rate of 15% or 20% for non-corporateshareholders, depending on whether their income exceeds certain threshold amounts.
If an individual receives a regular dividend qualifying for the long-term capital gains rates and such dividend constitutes an“extraordinary dividend,” and the individual subsequently recognizes a loss on the sale or exchange of stock in respect ofwhich the extraordinary dividend was paid, then the loss will be long-term capital loss to the extent of such extraordinarydividend. An “extraordinary dividend” on common stock for this purpose is generally a dividend (i) in an amount greater thanor equal to 10% of the taxpayer’s tax basis (or trading value) in a share of stock, aggregating dividends with ex-dividenddates within an 85-day period, or (ii) in an amount greater than 20% of the taxpayer’s tax basis (or trading value) in a shareof stock, aggregating dividends with ex-dividend dates within a 365-day period.
Distributions in excess of a Fund’s current and accumulated earnings and profits will, as to each shareholder, be treated as atax-free return of capital to the extent of a shareholder’s basis in shares of the Fund, and as a capital gain thereafter (if theshareholder holds shares of the Fund as capital assets). Distributions in excess of the Fund’s minimum distributionrequirements, but not in excess of the Fund’s earnings and profits, will be taxable to shareholders and will not constitutenontaxable returns of capital. Shareholders receiving dividends or distributions in the form of additional shares should betreated for U.S. federal income tax purposes as receiving a distribution in an amount equal to the amount of money that theshareholders receiving cash dividends or distributions will receive and should have a cost basis in the shares received equal tosuch amount.
A 3.8% U.S. federal Medicare contribution tax is imposed on net investment income, including, but not limited to, interest,dividends, and net gain from investments, of U.S. individuals with income exceeding $200,000 (or $250,000 if married andfiling jointly) and of estates and trusts.
Investors considering buying shares just prior to a dividend or capital gain distribution should be aware that, although theprice of shares purchased at that time may reflect the amount of the forthcoming distribution, such dividend or distributionmay nevertheless be taxable to them. If a Fund is the holder of record of any security on the record date for any dividendspayable with respect to such security, such dividends will be included in the Fund’s gross income not as of the date receivedbut as of the later of (a) the date such security became ex-dividend with respect to such dividends (i.e., the date on which abuyer of the security would not be entitled to receive the declared, but unpaid, dividends); or (b) the date the Fund acquiredsuch security. Accordingly, in order to satisfy its income distribution requirements, a Fund may be required to pay dividendsbased on anticipated earnings, and shareholders may receive dividends in an earlier year than would otherwise be the case.
In certain situations, a Fund may, for a taxable year, defer all or a portion of its net capital loss (or if there is no net capitalloss, then any net long-term or short-term capital loss) realized after October and its late-year ordinary loss (defined as thesum of (i) the excess of post-October foreign currency and passive foreign investment company (“PFIC”) losses over post-October foreign currency and PFIC gains and (ii) the excess of post-December ordinary losses over post-December ordinaryincome) until the next taxable year in computing its investment company taxable income and net capital gain, which will
181

defer the recognition of such realized losses. Such deferrals and other rules regarding gains and losses realized after October(or December) may affect the tax character of shareholder distributions.
Sales of Shares. Upon the sale or exchange of shares of a Fund, a shareholder will realize a taxable gain or loss equal to thedifference between the amount realized and the shareholder’s basis in shares of the Fund. A redemption of shares by a Fundwill be treated as a sale for this purpose. Such gain or loss will be treated as capital gain or loss if the shares are capital assetsin the shareholder’s hands and will be long-term capital gain or loss if the shares are held for more than one year and short-term capital gain or loss if the shares are held for one year or less. Any loss realized on a sale or exchange will be disallowedto the extent the shares disposed of are replaced, including replacement through the reinvesting of dividends or capital gainsdistributions, or by an option or contract to acquire substantially identical shares, within a 61-day period beginning 30 daysbefore and ending 30 days after the disposition of the shares. In such a case, the basis of the shares acquired will beincreased to reflect the disallowed loss. Any loss realized by a shareholder on the sale of Fund shares held by the shareholderfor six months or less will be treated for U.S. federal income tax purposes as a long-term capital loss to the extent of anydistributions or deemed distributions of long-term capital gains received by the shareholder with respect to such share. TheMedicare contribution tax described above will apply to the sale of Fund shares.
If a shareholder incurs a sales charge in acquiring shares of a Fund, disposes of those shares within 90 days and then, on orbefore January 31 of the following calendar year, acquires shares in a mutual fund for which the otherwise applicable salescharge is reduced by reason of a reinvestment right (e.g., an exchange privilege), the original sales charge will not be takeninto account in computing gain/loss on the original shares to the extent the subsequent sales charge is reduced. Instead, thedisregarded portion of the original sales charge will be added to the tax basis of the newly acquired shares. Furthermore, thesame rule also applies to a disposition of the newly acquired shares made within 90 days of the second acquisition. Thisprovision prevents shareholders from immediately deducting the sales charge by shifting their investments within a family ofmutual funds.
Backup Withholding. In certain cases, a Fund will be required to withhold at a 24% rate and remit to the U.S. Treasury suchamounts withheld from any distributions paid to a shareholder who: (i) has failed to provide a correct taxpayer identificationnumber; (ii) is subject to backup withholding by the IRS; (iii) has failed to certify to a Fund that such shareholder is notsubject to backup withholding; or (iv) has not certified that such shareholder is a U.S. person (including a U.S. resident alien).Backup withholding is not an additional tax and any amount withheld may be credited against a shareholder’s U.S. federalincome tax liability.
Sections 351 and 362. The Trust, on behalf of each Fund, has the right to reject an order for a purchase of shares of theFund if the purchaser (or group of purchasers) would, upon obtaining the shares so ordered, own 80% or more of theoutstanding shares of a given Fund and if, pursuant to Sections 351 and 362 of the Internal Revenue Code, that Fund wouldhave a basis in the securities different from the market value of such securities on the date of deposit. If a Fund’s basis insuch securities on the date of deposit was less than market value on such date, the Fund, upon disposition of the securities,would recognize more taxable gain or less taxable loss than if its basis in the securities had been equal to market value. It isnot anticipated that the Trust will exercise the right of rejection except in a case where the Trust determines that acceptingthe order could result in material adverse tax consequences to a Fund or its shareholders. The Trust also has the right torequire information necessary to determine beneficial share ownership for purposes of the 80% determination.
Taxation of Certain Derivatives. A Fund’s transactions in zero coupon securities, non-U.S. currencies, forward contracts,options and futures contracts (including options and futures contracts on non-U.S. currencies), to the extent permitted, willbe subject to special provisions of the Internal Revenue Code (including provisions relating to “hedging transactions” and“straddles”) that, among other consequences, may affect the character of gains and losses realized by the Fund (i.e., mayaffect whether gains or losses are ordinary or capital), accelerate recognition of income to the Fund and defer Fund losses.These rules could therefore affect the character, amount and timing of distributions to shareholders. These provisions also(a) will require a Fund to mark-to-market certain types of the positions in its portfolio (i.e., treat them as if they were closedout at the end of each year) and (b) may cause a Fund to recognize income without receiving cash with which to paydividends or make distributions in amounts necessary to satisfy the distribution requirements for avoiding income and excisetaxes. Each Fund will monitor its transactions, will make the appropriate tax elections and will make the appropriate entries inits books and records when it acquires any zero coupon security, non-U.S. currency, forward contract, option, futurescontract or hedged investment in order to mitigate the effect of these rules and prevent disqualification of a Fund as a RIC.
182

A Fund’s investments in so-called “Section 1256 contracts,” such as regulated futures contracts, most non-U.S. currencyforward contracts traded in the interbank market and options on most security indexes, are subject to special tax rules. AllSection 1256 contracts held by a Fund at the end of its taxable year are required to be marked to their market value, and anyunrealized gain or loss on those positions will be included in a Fund’s income as if each position had been sold for its fairmarket value at the end of the taxable year. The resulting gain or loss will be combined with any gain or loss realized by aFund from positions in Section 1256 contracts closed during the taxable year. Provided such positions were held as capitalassets and were not part of a “hedging transaction” nor part of a “straddle,” 60% of the resulting net gain or loss will betreated as long-term capital gain or loss, and 40% of such net gain or loss will be treated as short-term capital gain or loss,regardless of the period of time the positions were actually held by a Fund.
As a result of entering into swap contracts, a Fund may make or receive periodic net payments. A Fund may also make orreceive a payment when a swap is terminated prior to maturity through an assignment of the swap or other closingtransaction. Periodic net payments will generally constitute ordinary income or deductions, while termination of a swap willgenerally result in capital gain or loss (which will be a long-term capital gain or loss if a Fund has been a party to the swap formore than one year). With respect to certain types of swaps, a Fund may be required to currently recognize income or losswith respect to future payments on such swaps or may elect under certain circumstances to mark such swaps to marketannually for tax purposes as ordinary income or loss.
Qualified Dividend Income. Distributions by a Fund of investment company taxable income (including any short-termcapital gains), whether received in cash or shares, will be taxable either as ordinary income or as qualified dividend income,which is eligible to be taxed at long-term capital gain rates to the extent a Fund receives qualified dividend income on thesecurities it holds and a Fund reports the distribution as qualified dividend income. Qualified dividend income is, in general,dividend income from taxable U.S. corporations (but generally not from U.S. REITs) and certain non-U.S. corporations (e.g.,non-U.S. corporations that are not PFICs and which are incorporated in a possession of the U.S. or in certain countries with acomprehensive tax treaty with the U.S., or the stock of which is readily tradable on an established securities market in theU.S. (where the dividends are paid with respect to such stock)). Under current IRS guidance, the U.S. has appropriatecomprehensive income tax treaties with the following countries: Australia, Austria, Bangladesh, Barbados, Belgium, Bulgaria,Canada, China (but not with Hong Kong, which is treated as a separate jurisdiction for U.S. tax purposes), Cyprus, the CzechRepublic, Denmark, Egypt, Estonia, Finland, France, Germany, Greece, Hungary, Iceland, India, Indonesia, Ireland, Israel, Italy,Jamaica, Japan, Kazakhstan, Latvia, Lithuania, Luxembourg, Malta, Mexico, Morocco, the Netherlands, New Zealand, Norway,Pakistan, the Philippines, Poland, Portugal, Romania, Russia, the Slovak Republic, Slovenia, South Africa, South Korea, Spain,Sri Lanka, Sweden, Switzerland, Thailand, Trinidad and Tobago, Tunisia, Turkey, Ukraine, the U.K. and Venezuela. Substitutepayments received by a Fund for securities lent out by a Fund will not be qualified dividend income.
A dividend from a Fund will not be treated as qualified dividend income to the extent that: (i) the shareholder has not heldthe shares on which the dividend was paid for 61 days during the 121-day period that begins on the date that is 60 daysbefore the date on which the shares become ex-dividend with respect to such dividend or a Fund fails to satisfy thoseholding period requirements with respect to the securities it holds that paid the dividends distributed to the shareholder (or,in the case of certain preferred stocks, the holding requirement of 91 days during the 181-day period beginning on the datethat is 90 days before the date on which the stock becomes ex-dividend with respect to such dividend); (ii) a Fund or theshareholder is under an obligation (whether pursuant to a short sale or otherwise) to make related payments with respect tosubstantially similar or related property; or (iii) the shareholder elects to treat such dividend as investment income underSection 163(d)(4)(B) of the Internal Revenue Code. Dividends received by a Fund from a REIT or another RIC may be treatedas qualified dividend income only to the extent the dividend distributions are attributable to qualified dividend incomereceived by such REIT or other RIC. In addition, the Tax Act permits a direct REIT shareholder to claim a 20% “qualifiedbusiness income” deduction for ordinary REIT dividends, but does not permit a RIC paying dividends attributable to suchincome to pass through this special treatment to its shareholders. Unless future legislation or regulations provide for a pass-through, investors in such a RIC will treat such distributions as ordinary dividend income, as under prior law, whereas a directREIT investor would benefit from the special treatment. It is expected that dividends received by a Fund from a REIT anddistributed to a shareholder generally will be taxable to the shareholder as ordinary income. Distributions by a Fund of its netshort-term capital gains will be taxable as ordinary income.
Corporate Dividends Received Deduction. Dividends paid by a Fund that are attributable to dividends received by the Fundfrom U.S. corporations may qualify for the U.S. federal dividends received deduction for corporations. A 46-day minimumholding period during the 90-day period that begins 45 days prior to ex-dividend date (or 91-day minimum holding period
183

during the 180 period beginning 90 days prior to ex-dividend date for certain preference dividends) during which risk of lossmay not be diminished is required for the applicable shares, at both the Fund and shareholder level, for a dividend to beeligible for the dividends received deduction. Restrictions may apply if indebtedness, including a short sale, is attributable tothe investment.
Excess Inclusion Income. Under current law, the Funds serve to block unrelated business taxable income (“UBTI”) frombeing realized by their respective tax-exempt shareholders. Notwithstanding the foregoing, a tax-exempt shareholder couldrealize UBTI by virtue of its investment in a Fund if shares in the Fund constitute debt-financed property in the hands of thetax-exempt shareholder within the meaning of Section 514(b) of the Internal Revenue Code. Certain types of income receivedby a Fund from REITs, real estate mortgage investment conduits, taxable mortgage pools or other investments may cause theFund to report some or all of its distributions as “excess inclusion income.” To Fund shareholders, such excess inclusionincome may: (i) constitute taxable income, as UBTI for those shareholders who would otherwise be tax-exempt such asindividual retirement accounts, 401(k) accounts, Keogh plans, pension plans and certain charitable entities; (ii) not be offsetby otherwise allowable deductions for tax purposes; (iii) not be eligible for reduced U.S. withholding for non-U.S.shareholders even from tax treaty countries; and (iv) cause the Fund to be subject to tax if certain “disqualifiedorganizations,” as defined by the Internal Revenue Code, are Fund shareholders. If a charitable remainder annuity trust or acharitable remainder unitrust (each as defined in Section 664 of the Internal Revenue Code) has UBTI for a taxable year, a100% excise tax on the UBTI is imposed on the trust.
Non-U.S. Investments. Under Section 988 of the Internal Revenue Code, gains or losses attributable to fluctuations inexchange rates between the time a Fund accrues income or receivables or expenses or other liabilities denominated in a non-U.S. currency and the time a Fund actually collects such income or pays such liabilities are generally treated as ordinaryincome or ordinary loss. In general, gains (and losses) realized on debt instruments will be treated as Section 988 gain (orloss) to the extent attributable to changes in exchange rates between the U.S. dollar and the currencies in which theinstruments are denominated. Similarly, gains or losses on non-U.S. currency, non-U.S. currency forward contracts andcertain non-U.S. currency options or futures contracts denominated in non-U.S. currency, to the extent attributable tofluctuations in exchange rates between the acquisition and disposition dates, are also treated as ordinary income or lossunless a Fund was to elect otherwise.
Each Fund may be subject to non-U.S. income taxes withheld at the source. Each Fund, if permitted to do so, may elect to“pass through” to its investors the amount of non-U.S. income taxes paid by the Fund provided that the Fund held thesecurity on the dividend settlement date and for at least 15 additional days immediately before and/or thereafter, with theresult that each investor with respect to shares of the Fund held for a minimum 16-day holding period at the time of deemeddistribution will (i) include in gross income, even though not actually received, the investor’s pro rata share of the Fund’snon-U.S. income taxes, and (ii) either deduct (in calculating U.S. taxable income, but only for investors who itemize theirdeductions on their personal tax returns) or credit (in calculating U.S. federal income tax) the investor’s pro rata share of theFund’s non-U.S. income taxes. Withholding taxes on dividends on non-U.S. securities while such securities are lent out by theFund are not eligible for non-U.S. tax credit pass through. Taxes not “passed through” for tax purposes will not be available toshareholders for foreign tax credit purposes. A non-U.S. person invested in a Fund in a year that the Fund elects to “passthrough” its non-U.S. taxes may be treated as receiving additional dividend income subject to U.S. withholding tax. A non-U.S. tax credit may not exceed the investor’s U.S. federal income tax otherwise payable with respect to the investor’s non-U.S.source income. For this purpose, shareholders must treat as non-U.S. source gross income (i) their proportionate shares ofnon-U.S. taxes paid by a Fund and (ii) the portion of any dividend paid by the Fund that represents income derived from non-U.S. sources; the Fund’s gain from the sale of securities will generally be treated as U.S.-source income. Certain limitationswill be imposed to the extent to which the non-U.S. tax credit may be claimed. If your Fund shares are loaned pursuant tosecurities lending arrangements, you may lose the ability to use any non-U.S. tax credits passed through by a Fund or to treatFund dividends (paid while the shares are held by the borrower) as qualified dividends. Regarding a short sale with respect toshares of a Fund, substitute payments made to the lender of such shares may not be deductible under certain circumstances.Consult your financial intermediary or tax advisor.
Passive Foreign Investment Companies. If a Fund purchases shares in PFICs, it may be subject to U.S. federal income tax ona portion of any “excess distribution” or gain from the disposition of such shares even if such income is distributed as ataxable dividend by the Fund to its shareholders. Additional charges in the nature of interest may be imposed on a Fund inrespect of deferred taxes arising from such distributions or gains.
184

If a Fund were to invest in a PFIC and elect to treat the PFIC as a “qualified electing fund” under the Internal Revenue Code, inlieu of the foregoing requirements, a Fund might be required to include in income each year a portion of the ordinaryearnings and net capital gains of the qualified electing fund, even if not distributed to a Fund, and such amounts would besubject to the 90% and excise tax distribution requirements described above. In order to make this election, a Fund would berequired to obtain certain annual information from the PFICs in which it invests, which may be difficult or impossible toobtain. Currently proposed IRS regulations, if adopted, would treat such included amounts as nonqualifying RIC income to aFund unless such amounts were also distributed to the Fund.
Alternatively, a Fund may make a mark-to-market election that would result in a Fund being treated as if it had sold andrepurchased its PFIC stock at the end of each year. In such case, a Fund would report any such gains as ordinary income andwould deduct any such losses as ordinary losses to the extent of previously recognized gains. The election must be madeseparately for each PFIC owned by a Fund and, once made, would be effective for all subsequent taxable years, unlessrevoked with the consent of the IRS. By making the election, a Fund could potentially ameliorate the adverse taxconsequences with respect to its ownership of shares in a PFIC, but in any particular year may be required to recognizeincome in excess of the distributions it receives from PFICs and its proceeds from dispositions of PFIC stock. A Fund mayhave to distribute this “phantom” income and gain to satisfy the 90% distribution requirement and to avoid imposition of the4% excise tax.
A Fund will make the appropriate tax elections, if possible, and take any additional steps that are necessary to mitigate theeffects of these rules.
Reporting. If a shareholder recognizes a loss with respect to a Fund’s shares of $2 million or more for an individualshareholder or $10 million or more for a corporate shareholder, the shareholder must file with the IRS a disclosure statementon IRS Form 8886. Direct shareholders of portfolio securities are in many cases exempted from this reporting requirement,but under current guidance, shareholders of a RIC are not exempted. The fact that a loss is reportable under theseregulations does not affect the legal determination of whether the taxpayer’s treatment of the loss is proper. Shareholdersshould consult their tax advisors to determine the applicability of these regulations in light of their individual circumstances.
Other Taxes. Dividends, distributions and redemption proceeds may also be subject to additional state, local and non-U.S.taxes depending on each shareholder’s particular situation.
Taxation of Non-U.S. Shareholders. Dividends paid by a Fund to non-U.S. shareholders are generally subject to withholdingtax at a 30% rate or a reduced rate specified by an applicable income tax treaty to the extent derived from investment incomeand short-term capital gains. Dividends paid by a Fund from net tax-exempt income or long-term capital gains are generallynot subject to such withholding tax. In order to obtain a reduced rate of withholding, a non-U.S. shareholder will be requiredto provide an IRS Form W-8BEN or IRS Form W-8BEN-E certifying its entitlement to benefits under a treaty. The withholdingtax does not apply to regular dividends paid to a non-U.S. shareholder who provides an IRS Form W-8ECI, certifying that thedividends are effectively connected with the non-U.S. shareholder’s conduct of a trade or business within the U.S. Instead,the effectively connected dividends will be subject to regular U.S. income tax as if the non-U.S. shareholder were a U.S.shareholder. A non-U.S. corporation receiving effectively connected dividends may also be subject to additional “branchprofits tax” imposed at a rate of 30% (or lower treaty rate). A non-U.S. shareholder who fails to provide an IRS Form W-8BEN,IRS Form W-8BEN-E or other applicable form may be subject to backup withholding at the appropriate rate.
Properly-reported dividends are generally exempt from U.S. federal withholding tax where they (i) are paid in respect of aFund’s “qualified net interest income” (generally, the Fund’s U.S. source interest income, other than certain contingentinterest and interest from obligations of a corporation or partnership in which the Fund is at least a 10% shareholder orpartner, reduced by expenses that are allocable to such income) or (ii) are paid in respect of a Fund’s “qualified short-termcapital gains” (generally, the excess of the Fund’s net short-term capital gain over the Fund’s long-term capital loss for suchtaxable year). However, depending on its circumstances, a Fund may report all, some or none of its potentially eligibledividends as such qualified net interest income or as qualified short-term capital gains and/or treat such dividends, in wholeor in part, as ineligible for this exemption from withholding. In order to qualify for this exemption from withholding, a non-U.S. shareholder will need to comply with applicable certification requirements relating to its non-U.S. status (including, ingeneral, furnishing an IRS Form W-8BEN, IRS Form W-8BEN-E or substitute Form). In the case of shares held through anintermediary, the intermediary may withhold even if a Fund reports the payment as qualified net interest income or qualifiedshort-term capital gain. Non-U.S. shareholders should contact their intermediaries with respect to the application of theserules to their accounts.
185
Distributions that a Fund reports as “short-term capital gain dividends” or “long-term capital gain dividends” will not betreated as such to a recipient foreign shareholder if the distribution is attributable to gain received from the sale or exchangeof U.S. real property or an interest in a U.S. real property holding corporation and the Fund’s direct or indirect interests in U.S.real property exceeded certain levels. Instead, if the foreign shareholder has not owned more than 5% of the outstandingshares of the Fund at any time during the one year period ending on the date of distribution, such distributions will besubject to 30% withholding by the Fund and will be treated as ordinary dividends to the foreign shareholder; if the foreignshareholder owned more than 5% of the outstanding shares of a Fund at any time during the one year period ending on thedate of the distribution, such distribution will be treated as real property gain subject to 21% withholding tax and couldsubject the foreign shareholder to U.S. filing requirements. Additionally, if a Fund’s direct or indirect interests in U.S. realproperty were to exceed certain levels, a foreign shareholder realizing gains upon redemption from the Fund could be subjectto the 21% withholding tax and U.S. filing requirements unless more than 50% of the Fund’s shares were owned by U.S.persons at such time or unless the foreign person had not held more than 5% of the Fund’s outstanding shares throughouteither such person’s holding period for the redeemed shares or, if shorter, the previous five years.
The rules laid out in the previous paragraph, other than the withholding rules, will apply notwithstanding the Fund’sparticipation in a wash sale transaction or its payment of a substitute dividend.
Distributions to certain foreign shareholders by a Fund at least 50% of the assets of which are “U.S. real property interests”(as defined in the Internal Revenue Code and U.S. Treasury regulations) at any time during the five-year period ending on thedate of the distributions, to the extent the distributions are attributable to gains from sales or exchanges of U.S. real propertyinterests (including shares in certain “U.S. real property holding corporations” such as certain REITs, although exceptionsmay apply if any class of stock of such a corporation is regularly traded on an established securities market and the Fund hasheld no more than 5% of such class of stock at any time during the five-year period ending on the date of the distributions),generally must be treated by such foreign shareholders as income effectively connected to a trade or business within the U.S.,which is generally subject to tax at the graduated rates applicable to U.S. shareholders, except for distributions to foreignshareholders that held no more than 5% of any class of stock of the Fund at any time during the previous one-year periodending on the date of the distributions. Such distributions may be subject to U.S. withholding tax and may require a foreignshareholder to file a U.S. federal income tax return. In addition, sales or redemptions of shares held by certain foreignshareholders in such a Fund generally will be subject to U.S. withholding tax and generally will require the foreignshareholder to file a U.S. federal income tax return, although exceptions may apply if more than 50% of the value of theFund’s shares are held by U.S. shareholders or the foreign shareholder selling or redeeming the shares has held no more than5% of any class of stock of the Fund at any time during the five-year period ending on the date of the sale or redemption.
Provided that more than 50% of the value of a Fund’s stock is held by U.S. shareholders, redemptions and other distributionsmade in the form of U.S. real property interests (including shares in certain “U.S. real property holding corporations”,although exceptions may apply if any class of stock of such a corporation is regularly traded on an established securitiesmarket and the Fund has held no more than 5% of such class of stock at any time during the five-year period ending on thedate of the distribution) generally will cause the Fund to recognize a portion of any unrecognized gain in the U.S. realproperty interests equal to the product of (i) the excess of fair market value of such U.S. real property interests over theFund’s adjusted bases in such interests and (ii) the greatest foreign ownership percentage of the Fund during the five-yearperiod ending on the date of distribution.
Separately, a 30% withholding tax is currently imposed on U.S.-source dividends, interest and other income items, and will beimposed on proceeds from the sale, redemption or other disposition of property producing U.S.-source dividends andinterest paid after December 31, 2018, to: (i) foreign financial institutions, including non-U.S. investment funds, unless theyagree to collect and disclose to the IRS information regarding their direct and indirect U.S. account holders; and (ii) certainother foreign entities, unless they certify certain information regarding their direct and indirect U.S. owners. To avoidwithholding, foreign financial institutions will need to: (i) enter into agreements with the IRS that state that they will providethe IRS information, including the names, addresses and taxpayer identification numbers of direct and indirect U.S. accountholders; comply with due diligence procedures with respect to the identification of U.S. accounts; report to the IRS certaininformation with respect to U.S. accounts maintained; agree to withhold tax on certain payments made to non-compliantforeign financial institutions or to account holders who fail to provide the required information; and determine certain otherinformation concerning their account holders, or (ii) in the event an intergovernmental agreement and implementinglegislation are adopted, provide local revenue authorities with similar account holder information. Other foreign entities mayneed to report the name, address, and taxpayer identification number of each substantial U.S. owner or provide certificationsof no substantial U.S. ownership unless certain exceptions apply.
186

Shares of a Fund held by a non-U.S. shareholder at death will be considered situated within the U.S. and subject to the U.S.estate tax.
The foregoing discussion is a summary of certain material U.S. federal income tax considerations only and is not intended asa substitute for careful tax planning. Purchasers of shares should consult their own tax advisors as to the tax consequencesof investing in such shares, including consequences under state, local and non-U.S. tax laws. Finally, the foregoing discussionis based on applicable provisions of the Internal Revenue Code, regulations, judicial authority and administrativeinterpretations in effect on the date of this SAI. Changes in applicable authority could materially affect the conclusionsdiscussed above, and such changes often occur.
Financial StatementsEach Fund’s (except for the iShares U.S. Infrastructure ETF) audited Financial Statements, including the Financial Highlights,appearing in the applicable Annual Report to Shareholders and the report therein of PricewaterhouseCoopers LLP, anindependent registered public accounting firm, are hereby incorporated by reference in this SAI. The applicable AnnualReport to Shareholders, which contains the referenced audited financial statements, is available upon request and withoutcharge. Financial statements for the iShares U.S. Infrastructure ETF are not available because, as of the date of this SAI, theiShares U.S. Infrastructure ETF has no financial information to report.
Miscellaneous InformationCounsel. Willkie Farr & Gallagher LLP, located at 787 Seventh Avenue, New York, NY 10019, is counsel to the Trust.
Independent Registered Public Accounting Firm. PricewaterhouseCoopers LLP, located at Three Embarcadero Center, SanFrancisco, CA 94111, serves as the Trust’s independent registered public accounting firm, audits the Funds’ financialstatements, and may perform other services.
Shareholder Communications to the Board. The Board has established a process for shareholders to communicate with theBoard. Shareholders may contact the Board by mail. Correspondence should be addressed to iShares Board of Trustees, c/oBlackRock Fund Advisors, iShares Fund Administration, 400 Howard Street, San Francisco, CA 94105. Shareholdercommunications to the Board should include the following information: (i) the name and address of the shareholder; (ii) thenumber of shares owned by the shareholder; (iii) the Fund(s) of which the shareholder owns shares; and (iv) if these sharesare owned indirectly through a broker, financial intermediary or other record owner, the name of the broker, financialintermediary or other record owner. All correspondence received as set forth above shall be reviewed by the Secretary of theTrust and reported to the Board.
Regulation Under the Alternative Investment Fund Managers Directive. The Alternative Investment Fund ManagersDirective (“AIFMD”) imposes detailed and prescriptive obligations on fund managers established in the EU (“EU OperativeProvisions”). These do not currently apply to managers established outside of the EU, such as BFA. Rather, non-EU managersare only required to comply with certain disclosure, reporting and transparency obligations of AIFMD (“AIFMD DisclosureProvisions”) if such managers market a fund to EU investors.
Where the AIFMD Disclosure Provisions relate to EU Operative Provisions that do not apply to BFA, no meaningful disclosurecan be made. These EU Operative Provisions include prescriptive rules on: measuring and capping leverage in line withknown European standards; the treatment of investors; the use of “depositaries”; and coverage for professional liability risks.
AIFMD imposes certain conditions on the marketing of funds, such as the Funds, to EU investors. AIFMD requires that an‘alternative investment fund manager’ (“AIFM”) be identified to meet such conditions where such marketing is sought. Forthese purposes BFA, as the legal entity responsible for performing the portfolio and risk management of the Funds, shall bethe AIFM.
AIFMD requires disclosure on an ongoing basis of certain information relating to the use of special arrangements, leverage,rights of reuse of collateral, guarantees granted under leverage arrangements and the use of gates, side pockets and similarliquidity management tools. Given that the Funds do not use any special arrangements or allow for collateral reuse, it is notintended that such disclosures will need to be made by the Funds. Each Fund will, however, to the extent relevant and
187

appropriate, disclose in its annual report information on the Fund’s leverage, risk profile and risk management systemsemployed by BFA. Each Fund will also disclose material changes, if any, to the liquidity management systems and proceduresemployed in respect of the Fund.
BFA has registered the following Funds for marketing to investors in Finland, Luxembourg, the Netherlands, Sweden, and theU.K.
iShares Core S&P 500 ETFiShares Core S&P Mid-Cap ETFiShares Core S&P Small-Cap ETFiShares Global Consumer Staples ETFiShares Global Energy ETFiShares Nasdaq Biotechnology ETFiShares Preferred and Income Securities ETFiShares Russell 1000 Value ETFiShares Russell 2000 ETFiShares Russell 3000 ETFiShares U.S. Real Estate ETFiShares U.S. Regional Banks ETF
Investors’ Rights. Each Fund relies on the services of BFA and its other service providers, including the Distributor,administrator, custodian and transfer agent. Further information about the duties and roles of these service providers is setout in this SAI. Investors who acquire shares of a Fund are not parties to the relevant agreement with these service providersand do not have express contractual rights against the Fund or its service providers, except certain institutional investors thatare Authorized Participants may have certain express contractual rights with respect to the Distributor under the terms of therelevant Authorized Participant Agreement. Investors may have certain legal rights under federal or state law against a Fundor its service providers. In the event that an investor considers that it may have a claim against a Fund, or against any serviceprovider in connection with its investment in a Fund, such investor should consult its own legal advisor.
By contract, Authorized Participants irrevocably submit to the non-exclusive jurisdiction of any New York State or U.S. federalcourt sitting in New York City over any suit, action or proceeding arising out of or relating to the Authorized ParticipantAgreement. Jurisdiction over other claims, whether by investors or Authorized Participants, will turn on the facts of theparticular case and the law of the jurisdiction in which the proceeding is brought.
188

Appendix A - Proxy Voting Policy and BlackRockProxy Voting Guidelines
BlackRock U.S. Registered Funds
Open-End Fund and iShares ETF1 Proxy Voting Policy
Procedures Governing Delegation of Proxy Voting to Fund Adviser
July 1, 2017
The Boards of Trustees/Directors (“Directors”) of open-end funds advised by BlackRock Fund Advisors or BlackRockAdvisors, LLC (“BlackRock”) (the “Funds”), have the responsibility for the oversight of voting proxies relating to portfoliosecurities of the Funds, and have determined that it is in the best interests of the Funds and their shareholders to delegatethat responsibility to BlackRock as part of BlackRock’s authority to manage, acquire and dispose of account assets, all ascontemplated by the Funds’ respective investment management agreements.
BlackRock has adopted guidelines and procedures (together and as from time to time amended, the “BlackRock Proxy VotingGuidelines”) governing proxy voting by accounts managed by BlackRock.
BlackRock will cast votes on behalf of each of the Funds on specific proxy issues in respect of securities held by each suchFund in accordance with the BlackRock Proxy Voting Guidelines.1
BlackRock will report on an annual basis to the Directors on (1) all proxy votes that BlackRock has made on behalf of theFunds in the preceding year together with a certification from the Funds’ Chief Compliance Officer that all votes were inaccordance with the BlackRock Proxy Voting Guidelines, and (2) any changes to the BlackRock Proxy Voting Guidelines thathave not previously been reported.
©2017 BlackRock
1 iShares ESG 1-5 Year USD Corporate Bond ETF, iShares ESG USD Corporate Bond ETF, iShares MSCI ACWI Low Carbon Target ETF, iShares MSCI EAFEESG Optimized ETF, iShares MSCI EM ESG Optimized ETF, iShares MSCI Global Impact ETF, iShares MSCI KLD 400 Social ETF, iShares MSCI Peru ETF,iShares MSCI USA ESG Optimized ETF, iShares MSCI USA ESG Select ETF and iShares MSCI USA Small-Cap ESG Optimized ETF have separate FundProxy Voting Policies.
A-1

BlackRock
Global corporate governance & engagement principles
June 2014
ContentsIntroduction to BlackRock A-3Philosophy on corporate governance A-3Corporate governance, engagement and voting A-3- Boards and directors A-4- Auditors and audit-related issues A-5- Capital structure, mergers, asset sales and other special transactions A-5- Remuneration and benefits A-6- Social, ethical, and environmental issues A-6- General corporate governance matters A-7BlackRock’s oversight of its corporate governance activities A-7- Oversight A-7- Vote execution A-7- Conflicts management A-8- Voting guidelines A-9- Reporting A-9
A-2

INTRODUCTION TO BLACKROCK
BlackRock is the world’s preeminent asset management firm and a premier provider of global investment management, riskmanagement and advisory services to institutional and individual clients around the world. BlackRock offers a wide range ofinvestment strategies and product structures to meet clients’ needs, including individual and institutional separate accounts,mutual funds, closed-end funds, and other pooled investment vehicles and the industry-leading iShares exchange tradedfunds. Through BlackRock Solutions
®
, we offer risk management, strategic advisory and enterprise investment systemservices to a broad base of clients.
PHILOSOPHY ON CORPORATE GOVERNANCE
BlackRock’s corporate governance program is focused on protecting and enhancing the economic value of the companies inwhich it invests on behalf of clients. We do this through engagement with boards and management of investee companiesand, for those clients who have given us authority, through voting at shareholder meetings.
We believe that there are certain fundamental rights attached to share ownership. Companies and their boards should beaccountable to shareholders and structured with appropriate checks and balances to ensure that they operate inshareholders’ interests. Effective voting rights are central to the rights of ownership and there should be one vote for oneshare. Shareholders should have the right to elect, remove and nominate directors, approve the appointment of the auditorand to amend the corporate charter or by-laws. Shareholders should be able to vote on matters that are material to theprotection of their investment including but not limited to changes to the purpose of the business, dilution levels and pre-emptive rights, the distribution of income and the capital structure. In order to exercise these rights effectively, we believeshareholders have the right to sufficient and timely information to be able to take an informed view of the proposals, and ofthe performance of the company and management.
Our focus is on the board of directors, as the agent of shareholders, which should set the company’s strategic aims within aframework of prudent and effective controls which enables risk to be assessed and managed. The board should providedirection and leadership to the management and oversee management’s performance. Our starting position is to besupportive of boards in their oversight efforts on our behalf and we would generally expect to support the items of businessthey put to a vote at shareholder meetings. Votes cast against or withheld from resolutions proposed by the board are asignal that we are concerned that the directors or management have either not acted in the interests of shareholders or havenot responded adequately to shareholder concerns regarding strategy or performance.
These principles set out our approach to engaging with companies, provide guidance on our position on corporategovernance and outline how our views might be reflected in our voting decisions. Corporate governance practices varyinternationally and our expectations in relation to individual companies are based on the legal and regulatory framework ofeach market. However, as noted above, we do believe that there are some overarching principles of corporate governancethat apply globally. We assess voting matters on a case-by-case basis and in light of each company’s unique circumstances.We are interested to understand from the company’s reporting its approach to corporate governance, particularly where it isdifferent from the usual market practice, and how it benefits shareholders.
BlackRock also believes that shareholders have responsibilities in relation to monitoring and providing feedback tocompanies, sometimes known as stewardship. These ownership responsibilities include, in our view, engaging withmanagement or board members on corporate governance matters, voting proxies in the best long-term economic interestsof shareholders and engaging with regulatory bodies to ensure a sound policy framework consistent with promoting long-term shareholder value creation. Institutional shareholders also have responsibilities to their clients to have appropriateresources and oversight structures. Our own approach to oversight in relation to our corporate governance activities is setout in the section below titled “BlackRock’s oversight of its corporate governance activities”.
CORPORATE GOVERNANCE, ENGAGEMENT AND VOTING
We recognize that accepted standards of corporate governance differ between markets but we believe that there aresufficient common threads globally to identify an overarching set of principles. The primary objective of our corporategovernance activities is the protection and enhancement of the value of our clients’ investments in public corporations. Thus,these principles focus on practices and structures that we consider to be supportive of long-term value creation. We discussbelow the principles under six key themes. In our regional and market-specific voting guidelines we explain how these
A-3

principles inform our voting decisions in relation to specific resolutions that may appear on the agenda of a shareholdermeeting in the relevant market.
The six key themes are:
• Boards and directors
• Auditors and audit-related issues
• Capital structure, mergers, asset sales and other special transactions
• Remuneration and benefits
• Social, ethical and environmental issues
• General corporate governance matters
At a minimum we would expect companies to observe the accepted corporate governance standard in their domestic marketor to explain why doing so is not in the interests of shareholders. Where company reporting and disclosure is inadequate orthe approach taken is inconsistent with our view of what is in the best interests of shareholders, we typically will engage withthe company and/or use our vote to encourage a change in practice. In making voting decisions, we take into accountresearch from proxy advisors, other internal and external research, information published by the company or providedthrough engagement and the views of our equity portfolio managers.
BlackRock views engagement as an important activity; engagement provides BlackRock with the opportunity to improve ourunderstanding of investee companies and their governance structures, so that our voting decisions may be better informed.Engagement also allows us to share our philosophy and approach to investment and corporate governance with companiesto enhance their understanding of our objectives. There are a range of approaches we may take in engaging companiesdepending on the nature of the issue under consideration, the company and the market.
Boards and directors
The performance of the board is critical to the economic success of the company and to the protection of shareholders’interests. Board members serve as agents of shareholders in overseeing the strategic direction and operation of the company.For this reason, BlackRock focuses on directors in many of its engagements and sees the election of directors as one of itsmost important responsibilities in the proxy voting context.
We expect the board of directors to promote and protect shareholder interests by:
• establishing an appropriate corporate governance structure;
• supporting and overseeing management in setting strategy;
• ensuring the integrity of financial statements;
• making decisions regarding mergers, acquisitions and disposals;
• establishing appropriate executive compensation structures; and
• addressing business issues including social, ethical and environmental issues when they have the potential to materiallyimpact company reputation and performance.
There should be clear definitions of the role of the board, the sub-committees of the board and the senior management suchthat the responsibilities of each are well understood and accepted. Companies should report publicly the approach taken togovernance (including in relation to board structure) and why this approach is in the interest of shareholders. We will engagewith the appropriate directors where we have concerns about the performance of the board or the company, the broadstrategy of the company or the performance of individual board members. Concerns about directors may include their roleon the board of a different company where that board has performed poorly and failed to protect shareholder interests.
BlackRock believes that directors should stand for re-election on a regular basis. We assess directors nominated for electionor re-election in the context of the composition of the board as a whole. There should be detailed disclosure of the relevantcredentials of the individual directors in order that shareholders can assess the caliber of an individual nominee. We expectthere to be a sufficient number of independent directors on the board to ensure the protection of the interests of allshareholders. Common impediments to independence may include but are not limited to:
• current employment at the company or a subsidiary;
A-4

• former employment within the past several years as an executive of the company;
• providing substantial professional services to the company and/or members of the company’s management;
• having had a substantial business relationship in the past three years;
• having, or representing a shareholder with, a substantial shareholding in the company;
• being an immediate family member of any of the aforementioned; and
• interlocking directorships.
BlackRock believes that the operation of the board is enhanced when there is a clearly independent, senior non-executivedirector to lead it. Where the chairman is also the CEO or is otherwise not independent the company should have anindependent lead director. The role of this director is to enhance the effectiveness of the independent members of the boardthrough shaping the agenda, ensuring adequate information is provided to the board and encouraging independentparticipation in board deliberations. The lead independent board director should be available to shareholders if they haveconcerns that they wish to discuss.
To ensure that the board remains effective, regular reviews of board performance should be carried out and assessmentsmade of gaps in skills or experience amongst the members. BlackRock believes it is beneficial for new directors to be broughtonto the board periodically to refresh the group’s thinking and to ensure both continuity and adequate succession planning.In identifying potential candidates, boards should take into consideration the diversity of experience and expertise of thecurrent directors and how that might be augmented by incoming directors. We believe that directors are in the best positionto assess the optimal size for the board, but we would be concerned if a board seemed too small to have an appropriatebalance of directors or too large to be effective.
There are matters for which the board has responsibility that may involve a conflict of interest for executives or for affiliateddirectors. BlackRock believes that shareholders’ interests are best served when the independent members of the board form asub-committee to deal with such matters. In many markets, these sub-committees of the board specialize in audit, directornominations and compensation matters. An ad hoc committee might also be formed to decide on a special transaction,particularly one with a related party.
Auditors and audit-related issues
BlackRock recognizes the critical importance of financial statements which should provide a complete and accurate pictureof a company’s financial condition. We will hold the members of the audit committee or equivalent responsible for overseeingthe management of the audit function. We take particular note of cases involving significant financial restatements or ad hocnotifications of material financial weakness.
The integrity of financial statements depends on the auditor being free of any impediments to being an effective check onmanagement. To that end, we believe it is important that auditors are, and are seen to be, independent. Where the audit firmprovides services to the company in addition to the audit, the fees earned should be disclosed and explained. Auditcommittees should also have in place a procedure for assuring annually the independence of the auditor.
Capital structure, mergers, asset sales and other special transactions
The capital structure of a company is critical to its owners, the shareholders, as it impacts the value of their investment andthe priority of their interest in the company relative to that of other equity or debt investors. Pre-emption rights are a keyprotection for shareholders against the dilution of their interests.
In assessing mergers, asset sales or other special transactions, BlackRock’s primary consideration is the long-term economicinterests of shareholders. Boards proposing a transaction need to clearly explain the economic and strategic rationale behindit. We will review a proposed transaction to determine the degree to which it enhances long-term shareholder value. Wewould prefer that proposed transactions have the unanimous support of the board and have been negotiated at arm’s length.We may seek reassurance from the board that executive and/or board members’ financial interests in a given transactionhave not affected their ability to place shareholders’ interests before their own. Where the transaction involves related parties,we would expect the recommendation to support it to come from the independent directors and would prefer only non-conflicted shareholders to vote on the proposal.
A-5

BlackRock believes that shareholders have a right to dispose of company shares in the open market without unnecessaryrestriction. In our view, corporate mechanisms designed to limit shareholders’ ability to sell their shares are contrary to basicproperty rights. Such mechanisms can serve to protect and entrench interests other than those of the shareholders. Webelieve that shareholders are broadly capable of making decisions in their own best interests. We would expect any so-called‘shareholder rights plans’ being proposed by a board to be subject to shareholder approval on introduction and periodicallythereafter for continuation.
Remuneration and benefits
BlackRock expects a company’s board of directors to put in place a compensation structure that incentivizes and rewardsexecutives appropriately and is aligned with shareholder interests, particularly long-term shareholder returns. We wouldexpect the compensation committee to take into account the specific circumstances of the company and the key individualsthe board is trying to incentivize. We encourage companies to ensure that their compensation packages incorporateappropriate and challenging performance conditions consistent with corporate strategy and market practice. We use thirdparty research, in addition to our own analysis, to evaluate existing and proposed compensation structures. We holdmembers of the compensation committee or equivalent accountable for poor compensation practices or structures.
BlackRock believes that there should be a clear link between variable pay and company performance as reflected in returns toshareholders. We are not supportive of one-off or special bonuses unrelated to company or individual performance. Wesupport incentive plans that pay out rewards earned over multiple and extended time periods. We believe considerationshould be given to building claw back provisions into incentive plans such that executives would be required to repay rewardswhere they were not justified by actual performance. Compensation committees should guard against contractualarrangements that would entitle executives to material compensation for early termination of their contract. Finally, pensioncontributions should be reasonable in light of market practice.
Outside directors should be compensated in a manner that does not risk compromising their independence or aligning theirinterests too closely with those of the management, whom they are charged with overseeing.
Social, ethical, and environmental issues
Our fiduciary duty to clients is to protect and enhance their economic interest in the companies in which we invest on theirbehalf. It is within this context that we undertake our corporate governance activities. We believe that well-managedcompanies will deal effectively with the social, ethical and environmental (“SEE”) aspects of their businesses.
BlackRock expects companies to identify and report on the material, business-specific SEE risks and opportunities and toexplain how these are managed. This explanation should make clear how the approach taken by the company best serves theinterests of shareholders and protects and enhances the long-term economic value of the company. The key performanceindicators in relation to SEE matters should also be disclosed and performance against them discussed, along with any peergroup benchmarking and verification processes in place. This helps shareholders assess how well management is dealingwith the SEE aspects of the business. Any global standards adopted should also be disclosed and discussed in this context.
We may vote against the election of directors where we have concerns that a company might not be dealing with SEE issuesappropriately. Sometimes we may reflect such concerns by supporting a shareholder proposal on the issue, where thereseems to be either a significant potential threat or realized harm to shareholders’ interests caused by poor management ofSEE matters. In deciding our course of action, we will assess whether the company has already taken sufficient steps toaddress the concern and whether there is a clear and material economic disadvantage to the company if the issue is notaddressed.
More commonly, given that these are often not voting issues, we will engage directly with the board or management. Thetrigger for engagement on a particular SEE concern is our assessment that there is potential for material economicramifications for shareholders.
We do not see it as our role to make social, ethical or political judgments on behalf of clients. We expect investee companiesto comply, at a minimum, with the laws and regulations of the jurisdictions in which they operate. They should explain howthey manage situations where such laws or regulations are contradictory or ambiguous.
A-6

General corporate governance matters
BlackRock believes that shareholders have a right to timely and detailed information on the financial performance andviability of the companies in which they invest. In addition, companies should also publish information on the governancestructures in place and the rights of shareholders to influence these. The reporting and disclosure provided by companieshelps shareholders assess whether the economic interests of shareholders have been protected and the quality of the board’soversight of management. BlackRock believes shareholders should have the right to vote on key corporate governancematters, including on changes to governance mechanisms, to submit proposals to the shareholders’ meeting and to callspecial meetings of shareholders.
BLACKROCK’S OVERSIGHT OF ITS CORPORATE GOVERNANCE ACTIVITIES
Oversight
BlackRock holds itself to a very high standard in its corporate governance activities, including in relation to executing proxyvotes. This function is executed by a team of dedicated BlackRock employees without sales responsibilities (the “CorporateGovernance Group”), and which is considered an investment function. BlackRock maintains three regional oversightcommittees (“Corporate Governance Committees”) for the Americas, Europe, the Middle East and Africa (EMEA) and Asia-Pacific, consisting of senior BlackRock investment professionals. All of the regional Corporate Governance Committees reportto a Global Corporate Governance Oversight Committee, which is a risk-focused committee composed of seniorrepresentatives of the active and index equity investment businesses, the Deputy General Counsel, the Global ExecutiveCommittee member to whom the Corporate Governance Group reports and the head of the Corporate Governance Group.The Corporate Governance Committees review and approve amendments to their respective proxy voting guidelines(“Guidelines”) and grant authority to the Global Head of Corporate Governance (“Global Head”), a dedicated BlackRockemployee without sales responsibilities, to vote in accordance with the Guidelines. The Global Head leads the CorporateGovernance Group to carry out engagement, voting and vote operations in a manner consistent with the relevant CorporateGovernance Committee’s mandate. The Corporate Governance Group engages companies in conjunction with the portfoliomanagers in discussions of significant governance issues, conducts research on corporate governance issues andparticipates in industry discussions to keep abreast of the field of corporate governance. The Corporate Governance Group,or vendors overseen by the Corporate Governance Group, also monitor upcoming proxy votes, execute proxy votes andmaintain records of votes cast. The Corporate Governance Group may refer complicated or particularly controversial mattersor discussions to the appropriate investors and/or regional Corporate Governance Committees for their review, discussionand guidance prior to making a voting decision.
BlackRock’s Equity Policy Oversight Committee (EPOC) is informed of certain aspects of the work of the Global CorporateGovernance Oversight Committee and the Corporate Governance Group.
Vote execution
BlackRock carefully considers proxies submitted to funds and other fiduciary accounts (“Funds”) for which it has votingauthority. BlackRock votes (or refrains from voting) proxies for each Fund for which it has voting authority based onBlackRock’s evaluation of the best long-term economic interests of shareholders, in the exercise of its independent businessjudgment, and without regard to the relationship of the issuer of the proxy (or any dissident shareholder) to the Fund, theFund’s affiliates (if any), BlackRock or BlackRock’s affiliates.
When exercising voting rights, BlackRock will normally vote on specific proxy issues in accordance with its Guidelines for therelevant market. The Guidelines are reviewed regularly and are amended consistent with changes in the local marketpractice, as developments in corporate governance occur, or as otherwise deemed advisable by BlackRock’s CorporateGovernance Committees. The Corporate Governance Committees may, in the exercise of their business judgment, concludethat the Guidelines do not cover the specific matter upon which a proxy vote is requested or that an exception to theGuidelines would be in the best long-term economic interests of BlackRock’s clients.
In the uncommon circumstance of there being a vote with respect to fixed-income securities or the securities of privatelyheld issuers the decision generally will be made by a Fund’s portfolio managers and/or the Corporate Governance Groupbased on their assessment of the particular transactions or other matters at issue.
In certain markets, proxy voting involves logistical issues which can affect BlackRock’s ability to vote such proxies, as well asthe desirability of voting such proxies. These issues include but are not limited to: (i) untimely notice of shareholder
A-7

meetings; (ii) restrictions on a foreigner’s ability to exercise votes; (iii) requirements to vote proxies in person; (iv) “share-blocking” (requirements that investors who exercise their voting rights surrender the right to dispose of their holdings forsome specified period in proximity to the shareholder meeting); (v) potential difficulties in translating the proxy; and (vi)requirements to provide local agents with unrestricted powers of attorney to facilitate voting instructions. We are notsupportive of impediments to the exercise of voting rights such as shareblocking or overly burdensome administrativerequirements.
As a consequence, BlackRock votes proxies in these markets only on a “best-efforts” basis. In addition, the CorporateGovernance Committees may determine that it is generally in the best interests of BlackRock clients not to vote proxies ofcompanies in certain countries if the committee determines that the costs (including but not limited to opportunity costsassociated with shareblocking constraints) associated with exercising a vote are expected to outweigh the benefit the clientwould derive by voting on the issuer’s proposal.
While it is expected that BlackRock, as a fiduciary, will generally seek to vote proxies over which BlackRock exercises votingauthority in a uniform manner for all BlackRock clients, the relevant Corporate Governance Committee, in conjunction withthe portfolio manager of an account, may determine that the specific circumstances of such an account require that suchaccount’s proxies be voted differently due to such account’s investment objective or other factors that differentiate it fromother accounts. In addition, BlackRock believes portfolio managers may from time to time legitimately reach differing butequally valid views, as fiduciaries for their funds and the client assets in those Funds, on how best to maximize economicvalue in respect of a particular investment. Accordingly, portfolio managers retain full discretion to vote the shares in theFunds they manage based on their analysis of the economic impact of a particular ballot item.
Conflicts management
BlackRock maintains policies and procedures that are designed to prevent undue influence on BlackRock’s proxy votingactivity that might stem from any relationship between the issuer of a proxy (or any dissident shareholder) and BlackRock,BlackRock’s affiliates, a Fund or a Fund’s affiliates. Some of the steps BlackRock has taken to prevent conflicts include, but arenot limited to:
• BlackRock has adopted a proxy voting oversight structure whereby the Corporate Governance Committees oversee thevoting decisions and other activities of the Corporate Governance Group, and particularly its activities with respect tovoting in the relevant region of each Corporate Governance Committee’s jurisdiction.
• The Corporate Governance Committees have adopted Guidelines for each region, which set forth the firm’s views withrespect to certain corporate governance and other issues that typically arise in the proxy voting context. The CorporateGovernance Committees receive periodic reports regarding the specific votes cast by the Corporate Governance Groupand regular updates on material process issues, procedural changes and other matters of concern to the CorporateGovernance Committees.
• BlackRock’s Global Corporate Governance Oversight Committee oversees the Global Head, the Corporate GovernanceGroup and the Corporate Governance Committees. The Global Corporate Governance Oversight Committee conducts areview, at least annually, of the proxy voting process to ensure compliance with BlackRock’s risk policies and procedures.
• BlackRock maintains a reporting structure that separates the Global Head and Corporate Governance Group fromemployees with sales responsibilities. In addition, BlackRock maintains procedures intended to ensure that allengagements with corporate issuers or dissident shareholders are managed consistently and without regard toBlackRock’s relationship with the issuer of the proxy or dissident shareholder. Within the normal course of business, theGlobal Head or Corporate Governance Group may engage directly with BlackRock clients, and with employees with salesresponsibilities, in discussions regarding general corporate governance policy matters, and to otherwise ensure thatproxy-related client service levels are met. The Global Head or Corporate Governance Group does not discuss anyspecific voting matter with a client prior to the disclosure of the vote decision to all applicable clients after theshareholder meeting has taken place, except if the client is acting in the capacity as issuer of the proxy or dissidentshareholder and is engaging through the established procedures independent of the client relationship.
• In certain instances, BlackRock may determine to engage an independent fiduciary to vote proxies as a further safeguardto avoid potential conflicts of interest or as otherwise required by applicable law. The independent fiduciary may eithervote such proxies or provide BlackRock with instructions as to how to vote such proxies. In the latter case, BlackRockvotes the proxy in accordance with the independent fiduciary’s determination. Use of an independent fiduciary has been
A-8

adopted for voting the proxies related to any company that is affiliated with BlackRock or any company that includesBlackRock employees on its board of directors.
With regard to the relationship between securities lending and proxy voting, BlackRock’s approach is driven by our clients’economic interests. The evaluation of the economic desirability of recalling loans involves balancing the revenue producingvalue of loans against the likely economic value of casting votes. Based on our evaluation of this relationship, we believe thatgenerally the likely economic value of casting most votes is less than the securities lending income, either because the voteswill not have significant economic consequences or because the outcome of the vote would not be affected by BlackRockrecalling loaned securities in order to ensure they are voted. Periodically, BlackRock analyzes the process and benefits ofvoting proxies for securities on loan, and will consider whether any modification of its proxy voting policies or procedures isnecessary in light of future conditions. In addition, BlackRock may in its discretion determine that the value of votingoutweighs the cost of recalling shares, and thus recall shares to vote in that instance.
Voting guidelines
The issue-specific voting Guidelines published for each region/country in which we vote are intended to summarizeBlackRock’s general philosophy and approach to issues that may commonly arise in the proxy voting context in each marketwhere we invest. These Guidelines are not intended to be exhaustive. BlackRock applies the Guidelines on a case-by-casebasis, in the context of the individual circumstances of each company and the specific issue under review.
As such, these Guidelines do not provide a guide to how BlackRock will vote in every instance. Rather, they share our viewabout corporate governance issues generally, and provide insight into how we typically approach issues that commonly ariseon corporate ballots.
Reporting
We report our proxy voting activity directly to clients and publicly as required. In addition, we publish for clients a moredetailed discussion of our corporate governance activities, including engagement with companies and with other relevantparties.
A-9

Appendix B - Regular Holidays and RedemptionsRegular Holidays. For every occurrence of one or more intervening holidays in the applicable non-U.S. market that are notholidays observed in the U.S. equity market, the redemption settlement cycle may be extended by the number of suchintervening holidays. In addition to holidays, other unforeseeable closings in a non-U.S. market due to emergencies anddelivery cycles for transferring securities to redeeming investors may also prevent the Trust from delivering securities withinthe normal settlement period.
The securities delivery cycles currently practicable for transferring portfolio securities to redeeming investors, coupledwith non-U.S. market holiday schedules, will require a delivery process longer than seven calendar days, in certaincircumstances. The holidays applicable to each Fund during such periods are listed below, as are instances where more thanseven days will be needed to deliver redemption proceeds. Although certain holidays may occur on different dates insubsequent years, the number of days required to deliver redemption proceeds in any given year is not expected to exceedthe maximum number of days listed below for each Fund. The proclamation of new holidays, the treatment by marketparticipants of certain days as “informal holidays” (e.g., days on which no or limited securities transactions occur, as a resultof substantially shortened trading hours), the elimination of existing holidays, or changes in local securities delivery practices,could affect the information set forth herein in the future.
In calendar year 2018 (the only year for which holidays are known at the time of filing of this SAI), the dates of regularholidays affecting the relevant securities markets in which a Fund invests are as follows (please note that these holidayschedules are subject to potential changes in the relevant securities markets):
2018
Albania
January 1 April 9 November 28January 2 May 1 November 29March 14 June 14 December 10March 22 August 21 December 25April 2 October 19
Argentina
January 1 April 2 August 20February 12 May1 October 15February 13 May 25 November 6March 29 June 20 November 19March 30 July 9 December 25
Australia
January 1 April 25 October 1January 26 May 7 October 8March 5 June 4 November 6March 12 June 11 December 24March 30 August 6 December 25April 2 August 15 December 26April 3 September 24 December 31
Austria
January 1 May 21 December 24March 30 May 31 December 25April 2 August 15 December 26May 1 October 26 December 31May 10 November 1
Bahrain
January 1 August 23 November 20May 1 September 11 December 16June 17 September 19 December 17August 22 September 20
The Bahraini market is closed every Friday.
B-1

Bangladesh
February 21 June 17 September 2March 26 July 1 November 21April 29 August 15 December 16May 1 August 21 December 25May 2 August 22 December 31June 12 August 23
The Bangladeshi market is closed every Friday.
Belgium
January 1 May 1 December 26March 30 December 24 December 31April 2 December 25
Benin
January 1 June 11 November 1April 2 June 15 November 15May 1 August 7 November 21May 10 August 15 December 25May 21 August 22
Bermuda
January 1 August 2 November 12March 30 August 3 December 25May 25 September 3 December 26June 18
Bosnia and Herzegovina
January 1 April 30 August 20January 2 May 1 August 21March 1 May 2 November 26March 2 June 14 December 25April 2 June 15
Botswana
January 1 May 10 October 2January 2 July 2 December 25March 30 July 16 December 26April 2 July 17May 1 October 1
Brazil
January 1 May 1 November 15January 25 May 31 November 20February 12 July 9 December 24February 13 September 7 December 25February 14 October 12 December 31March 30 November 2
Bulgaria
January 1 May 1 September 24March 5 May 7 December 24April 6 May 24 December 25April 9 September 6 December 26
Burkina Faso
January 1 June 11 November 1April 2 June 15 November 15May 1 August 7 November 21May 10 August 15 December 25May 21 August 22
Canada
January 1 May 21 October 8January 2 June 25 November 12February 12 July 2 December 25February 19 August 6 December 26March 30 September 3
Chile
January 1 July 16 October 15March 30 August 15 November 1May 1 September 17 November 2May 21 September 18 December 25July 2 September 19 December 31
B-2

China
January 1 April 5 October 1February 15 April 6 October 2February 16 April 30 October 3February 19 May 1 October 4February 20 June 18 October 5February 21 September 24
Colombia
January 1 May 14 August 20January 8 June 4 October 15March 19 June 11 November 5March 29 July 2 November 12March 30 July 20 December 25May 1 August 7
Costa Rica
January 1 May 1 October 15March 29 July 25 December 25March 30 August 2April 11 August 15
Croatia
January 1 June 22 December 24March 30 June 25 December 25April 2 August 15 December 26May 1 October 8 December 31May 31 November 1
Cyprus
January 1 April 9 October 1February 19 April 10 December 24March 30 May 1 December 25April 2 May 28 December 26April 6 August 15
Czechia
January 1 May 8 December 24March 30 July 5 December 25April 2 July 6 December 26May 1 September 28 December 31
Denmark
January 1 May 10 December 25March 29 May 11 December 26March 30 May 21 December 31April 2 June 5April 27 December 24
Egypt
January 1 April 25 August 20January 7 May 1 August 21January 25 June 17 August 22April 8 July 1 September 11April 9 July 23 November 20
The Egyptian market is closed every Friday.
Estonia
January 1 May 10 December 26March 30 August 20 December 31April 2 December 24May 1 December 25
Finland
January 1 May 10 December 25March 30 June 22 December 26April 2 December 6 December 31May 1 December 24
France
January 1 May 1 December 26March 30 December 24 December 31April 2 December 25
Georgia
January 1 March 8 May 9January 2 April 6 August 28January 19 April 9 November 23
B-3

Germany
January 1 May 21 December 26March 30 October 3 December 31April 2 December 24May 1 December 25
Ghana
January 1 May 25 December 7March 6 June 15 December 25March 30 July 2 December 26April 2 August 22May 1 September 21
Greece
January 1 April 6 August 15February 19 April 9 December 24March 30 May 1 December 25April 2 May 28 December 26
Guinea-Bissau
January 1 June 11 November 1April 2 June 15 November 15May 1 August 7 November 21May 10 August 15 December 25May 21 August 22
Hong Kong
January 1 April 5 October 17January 27 May 1 December 24February 15 May 22 December 25February 16 June 18 December 26February 19 July 2 December 31March 30 September 25April 2 October 1
Hungary
January 1 May 1 November 2March 15 May 21 December 24March 16 August 20 December 25March 30 October 22 December 26April 2 October 23 December 31April 30 November 1
Iceland
January 1 May 1 December 25March 29 May 10 December 26March 30 May 21 December 31April 2 August 6April 19 December 24
India
January 26 May 1 October 18February 13 August 15 November 7February 19 August 17 November 8March 2 August 22 November 21March 29 September 13 November 23March 30 September 20 December 25April 30 October 2
Indonesia
January 1 June 13 September 11February 16 June 14 November 20March 30 June 15 December 24May 1 June 18 December 25May 10 June 19 December 31May 29 August 17June 1 August 22
Ireland
January 1 May 28 December 24March 19 June 4 December 25March 30 August 6 December 26April 2 August 27 December 31May 7 October 29
Israel
March 1 May 20 September 24April 1 July 22 September 25April 2 September 9 September 26April 3 September 10 September 27April 4 September 11 September 30April 5 September 18 October 1April 18 September 19April 19 September 23
The Israeli market is closed every Friday.
B-4

Italy
January 1 May 1 December 25March 30 August 15 December 26April 2 December 24 December 31
Ivory Coast
January 1 June 11 November 1April 2 June 15 November 15May 1 August 7 November 21May 10 August 15 December 25May 21 August 22
Jamaica
January 1 May 23 December 25February 14 August 1 December 26March 30 August 6April 2 October 15
Japan
January 1 April 30 October 8January 2 May 3 November 23January 3 May 4 December 24January 8 July 16 December 31February 12 September 17March 21 September 24
Jordan
January 1 August 21 November 21May 1 August 22 December 25May 25 August 23June 17 September 12
The Jordanian market is closed every Friday.
Kazakhstan
January 1 April 30 August 30January 2 May 1 August 31March 8 May 7 December 3March 9 May 8 December 17March 21 May 9 December 18March 22 July 6 December 31March 23 August 21
Kenya
January 1 June 1 December 25March 30 June 15 December 26April 2 October 10May 1 December 12
Kuwait
January 1 June 17 August 23February 25 August 20 September 11February 26 August 21 November 22April 15 August 22
The Kuwaiti market is closed every Friday.
Latvia
January 1 May 4 December 26March 30 May 10 December 31April 2 November 19April 30 December 24May 1 December 25
Lithuania
January 1 May 1 November 1February 16 May 10 December 24March 30 July 6 December 25April 2 August 15 December 26
Luxembourg
January 1 May 1 December 26March 30 December 24 December 31April 2 December 25
Malawi
January 1 April 2 July 6January 15 May 1 October 15March 5 May 14 December 25March 30 June 15 December 26
B-5

Malaysia
January 1 May 29 September 11January 31 June 14 September 17February 1 June 15 November 6February 15 August 22 November 20February 16 August 31 December 25May 1 September 10
Mali
January 1 June 11 November 1April 2 June 15 November 15May 1 August 7 November 21May 10 August 15 December 25May 21 August 22
Mauritius
January 1 February 16 November 2January 2 March 12 November 7January 31 May 1 December 25February 1 August 15February 13 September 14
Mexico
January 1 March 30 November 2February 5 April 2 November 19March 19 April 30 December 12March 29 May 1 December 25
Morocco
January 1 July 30 August 22January 11 August 14 September 11May 1 August 20 November 6June 14 August 21 November 20
Namibia
January 1 May 1 September 24March 21 May 4 December 10March 30 May 25 December 17April 2 August 9 December 25April 27 August 27 December 26
The Netherlands
January 1 May 1 December 26March 30 December 24 December 31April 2 December 25
New Zealand
January 1 April 2 December 25January 2 April 25 December 26February 6 June 4March 30 October 22
Niger
January 1 June 11 November 1April 2 June 15 November 15May 1 August 7 November 21May 10 August 15 December 25May 21 August 22
Nigeria
January 1 June 15 November 19March 30 June 18 December 25April 2 August 22 December 26May 1 August 23May 29 October 1
Norway
January 1 May 1 December 25March 28 May 10 December 26March 29 May 17 December 31March 30 May 21April 2 December 24
Oman
January 1 August 22 November 19June 17 August 23 November 20June 18 September 11July 23 November 18
The Omani market is closed every Friday.
B-6

Pakistan
January 1 June 18 September 20February 5 July 2 September 21March 23 August 22 November 20May 1 August 23 December 25June 15 August 24
Panama
January 1 March 30 November 26January 8 May 1 December 25February 13 November 5 December 31
Peru
January 1 May 1 October 8March 29 June 29 November 1March 30 August 30 December 25
The Philippines
January 1 May 1 November 30January 2 June 12 December 24February 16 August 21 December 25March 29 August 27 December 31March 30 November 1April 9 November 2
Poland
January 1 May 3 December 25January 2 May 31 December 26March 30 August 15 December 31April 2 November 1May 1 December 24
Portugal
January 1 May 1 December 26March 30 December 24 December 31April 2 December 25
Puerto Rico
January 1 July 4 November 23January 15 September 3 December 24February 19 October 8 December 25March 30 November 12May 28 November 22
Qatar
January 1 June 18 August 22February 13 June 19 December 18March 4 August 20June 17 August 21
The Qatari market is closed every Friday.
Romania
January 1 May 1 November 30January 2 May 28 December 25January 24 June 1 December 26April 9 August 15
Russia
January 1 March 8 November 5January 2 May 1 December 31January 8 May 9February 23 June 12
Saudi Arabia
June 17 June 21 August 22June 18 August 19 August 23June 19 August 20 September 23June 20 August 21
The Saudi Arabian market is closed every Friday.
Senegal
January 1 June 11 November 1April 2 June 15 November 15May 1 August 7 November 21May 10 August 15 December 25May 21 August 22
Serbia
January 1 April 6 November 12January 2 April 9 December 31February 15 May 1February 16 May 2
B-7

Singapore
January 1 May 29 November 6February 16 June 15 December 25March 30 August 9May 1 August 22
The Slovak Republic
January 1 May 8 December 24March 30 July 5 December 25April 2 August 29 December 26May 1 November 1
Slovenia
January 1 May 1 December 24January 2 May 2 December 25February 8 June 25 December 26March 30 August 15 December 31April 2 October 31April 27 November 1
South Africa
January 1 April 27 December 17March 21 May 1 December 25March 30 August 9 December 26April 2 September 24
South Korea
January 1 May 22 September 26February 15 June 6 October 3February 16 June 13 October 9March 1 August 15 December 25May 1 September 24 December 31May 7 September 25
Spain
January 1 May 1 December 26March 30 December 24 December 31April 2 December 25
Sri Lanka
January 1 April 20 September 24January 15 April 30 October 24January 31 May 1 November 6February 5 May 29 November 20February 13 June 15 November 22March 1 June 27 December 25March 30 July 27April 13 August 22
Srpska
January 1 April 6 May 2January 2 April 9 May 9January 9 May 1 November 21
Swaziland
January 1 April 25 September 6January 5 May 1 December 25March 30 May 10 December 26April 2 July 23April 19 August 27
Sweden
January 1 May 1 November 2January 5 May 9 December 24March 29 May 10 December 25March 30 June 6 December 26April 2 June 22 December 31
B-8

Switzerland
January 1 May 1 December 25January 2 May 10 December 26March 30 May 21April 2 August 1
Taiwan
January 1 February 20 June 18February 13 February 28 September 24February 14 April 4 October 10February 15 April 5 December 31February 16 April 6February 19 May 1
Tanzania
January 1 May 1 December 20January 12 June 15 December 25March 30 August 8 December 26April 2 August 22April 26 November 21
Thailand
January 1 May 1 October 23January 2 May 29 December 5March 1 July 27 December 10April 6 July 30 December 31April 13 August 13April 16 October 15
Togo
January 1 June 11 November 1April 2 June 15 November 15May 1 August 7 November 21May 10 August 15 December 25May 21 August 22
Tunisia
January 1 June 15 September 12March 20 July 25 October 15April 9 August 13 November 20May 1 August 21
Turkey
January 1 June 15 August 23April 23 August 20 August 24May 1 August 21 August 30June 14 August 22 October 29
Uganda
January 1 April 2 November 30January 26 May 1 December 25February 16 June 15 December 26March 8 August 21March 30 October 9
Ukraine
January 1 May 1 June 28January 8 May 2 August 24March 8 May 9 October 15April 9 May 28 December 25
The United Arab Emirates
January 1 August 21 November 20June 14 August 22 December 2August 20 September 11 December 3
The United Arab Emirates market is closed every Friday.
The United Kingdom
January 1 May 28 December 26March 30 August 27 December 31April 2 December 24May 7 December 25
The United States Bond Market
January 1 May 25* October 8 December 25January 15 May 28 November 12 December 31*February 19 July 3* November 22March 29* July 4 November 23*March 30 September 3 December 24*
* The U.S. bond market has recommended early close.
B-9

Uruguay
January 1 April 23 October 15February 12 May 1 November 2February 13 May 21 December 25March 29 June 19March 30 July 18
Venezuela
January 1 May 1 September 10February 12 May 14 October 12February 13 June 4 November 5March 19 July 2 December 24March 29 July 5 December 25March 30 July 24 December 31April 19 August 20
Vietnam
January 1 February 19 May 1February 14 February 20 September 3February 15 April 25February 16 April 30
Zambia
January 1 May 1 October 18March 8 May 25 October 24March 12 July 2 December 25March 30 July 3April 2 August 6
Zimbabwe
January 1 April 18 August 14February 21 May 1 December 25March 30 May 25 December 26April 2 August 13
B-10
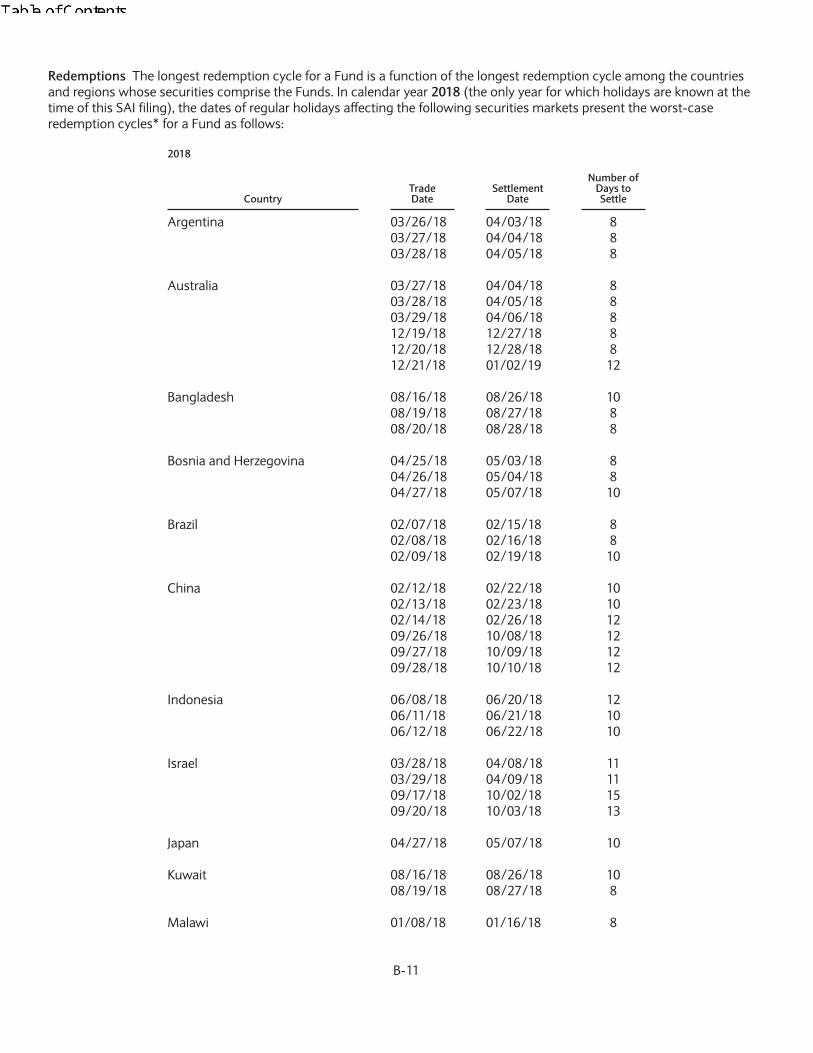
Redemptions The longest redemption cycle for a Fund is a function of the longest redemption cycle among the countriesand regions whose securities comprise the Funds. In calendar year 2018 (the only year for which holidays are known at thetime of this SAI filing), the dates of regular holidays affecting the following securities markets present the worst-caseredemption cycles* for a Fund as follows:
2018
CountryTradeDate
SettlementDate
Number ofDays toSettle
Argentina 03/26/18 04/03/18 803/27/18 04/04/18 803/28/18 04/05/18 8
Australia 03/27/18 04/04/18 803/28/18 04/05/18 803/29/18 04/06/18 812/19/18 12/27/18 812/20/18 12/28/18 812/21/18 01/02/19 12
Bangladesh 08/16/18 08/26/18 1008/19/18 08/27/18 808/20/18 08/28/18 8
Bosnia and Herzegovina 04/25/18 05/03/18 804/26/18 05/04/18 804/27/18 05/07/18 10
Brazil 02/07/18 02/15/18 802/08/18 02/16/18 802/09/18 02/19/18 10
China 02/12/18 02/22/18 1002/13/18 02/23/18 1002/14/18 02/26/18 1209/26/18 10/08/18 1209/27/18 10/09/18 1209/28/18 10/10/18 12
Indonesia 06/08/18 06/20/18 1206/11/18 06/21/18 1006/12/18 06/22/18 10
Israel 03/28/18 04/08/18 1103/29/18 04/09/18 1109/17/18 10/02/18 1509/20/18 10/03/18 13
Japan 04/27/18 05/07/18 10
Kuwait 08/16/18 08/26/18 1008/19/18 08/27/18 8
Malawi 01/08/18 01/16/18 8
B-11

2018
CountryTradeDate
SettlementDate
Number ofDays toSettle
01/09/18 01/17/18 801/10/18 01/18/18 801/11/18 01/19/18 801/12/18 01/22/18 1002/26/18 03/06/18 802/27/18 03/07/17 802/28/18 03/08/18 803/01/18 03/09/18 803/02/18 03/12/18 1003/23/18 04/03/18 1103/26/18 04/04/18 903/27/18 04/05/18 903/28/18 04/06/18 903/29/18 04/09/18 1104/24/18 05/02/18 804/25/18 05/03/18 804/26/18 05/04/18 804/27/18 05/07/18 1004/30/18 05/08/18 805/07/18 05/15/18 805/08/18 05/16/18 805/09/18 05/17/18 805/10/18 05/18/18 805/11/18 05/21/18 1006/08/18 06/18/18 1006/11/18 06/19/18 806/12/18 06/20/18 806/13/18 06/21/18 806/14/18 06/22/18 806/29/18 07/09/18 1007/02/18 07/10/18 807/03/18 07/11/18 807/04/18 07/12/18 807/05/18 07/13/18 810/08/18 10/16/18 810/09/18 10/17/18 810/10/18 10/18/18 810/11/18 10/19/18 810/12/18 10/22/18 1012/18/18 12/27/18 912/19/18 12/28/18 912/20/18 12/31/18 1112/21/18 01/02/19 1212/24/18 01/03/19 10
Mexico 03/26/18 04/03/18 803/27/18 04/04/18 803/28/18 04/05/18 8
Morocco 08/15/18 08/23/18 8
B-12

2018
CountryTradeDate
SettlementDate
Number ofDays toSettle
08/16/18 08/24/18 808/17/18 08/27/18 10
Namibia 03/14/18 03/22/18 803/15/18 03/23/18 803/16/18 03/26/18 1003/19/18 03/27/18 803/20/18 03/28/18 803/23/18 04/03/18 1103/26/18 04/04/18 903/27/18 04/05/18 903/28/18 04/06/18 903/29/18 04/09/18 1104/20/18 04/30/18 1004/23/18 05/02/18 904/24/18 05/03/18 904/25/18 05/07/18 1204/26/18 05/08/18 1204/30/18 05/09/18 905/02/18 05/10/18 805/03/18 05/11/18 805/18/18 05/28/18 1005/21/18 05/29/18 805/22/18 05/30/18 805/23/18 05/31/18 805/24/18 06/01/18 808/02/18 08/10/18 808/03/18 08/13/18 1008/06/18 08/14/18 808/07/18 08/15/18 808/08/18 08/16/18 808/20/18 08/28/18 808/21/18 08/29/18 808/22/18 08/30/18 808/23/18 08/31/18 808/24/18 09/03/18 1009/17/18 09/25/18 809/18/18 09/26/18 809/19/18 09/27/18 809/20/18 09/28/18 809/21/18 10/01/18 1012/03/18 12/11/18 812/04/18 12/12/18 812/05/18 12/13/18 812/06/18 12/14/18 812/07/18 12/18/18 1112/11/18 12/19/18 812/12/18 12/20/18 812/13/18 12/21/18 812/14/18 12/24/18 10
B-13

2018
CountryTradeDate
SettlementDate
Number ofDays toSettle
12/18/18 12/27/18 912/19/18 12/28/18 912/20/18 12/31/18 1112/21/18 01/02/19 1212/24/18 01/03/19 10
Norway 03/26/18 04/03/18 803/27/18 04/04/18 8
Oman 11/13/18 11/21/18 811/14/18 11/22/18 811/15/18 11/25/18 10
Qatar 06/12/18 06/20/18 806/13/18 06/21/18 806/14/18 06/24/18 1008/15/18 08/23/18 808/16/18 08/26/18 1008/19/18 08/27/18 8
Saudi Arabia 06/13/18 06/24/18 1106/14/18 06/25/18 1108/15/18 08/26/18 1108/16/18 08/27/18 11
Serbia 12/26/18 01/03/19 812/27/18 01/04/19 812/28/18 01/07/19 10
South Africa 03/14/18 03/22/18 803/15/18 03/23/18 803/16/18 03/26/18 1003/19/18 03/27/18 803/20/18 03/28/18 803/23/18 04/03/18 1103/26/18 04/04/18 903/27/18 04/05/18 903/28/18 04/06/18 903/29/18 04/09/18 1104/20/18 04/30/18 1004/23/18 05/02/18 904/24/18 05/03/18 904/25/18 05/04/18 904/26/18 05/07/18 1104/30/18 05/08/18 808/02/18 08/10/18 808/03/18 08/13/18 1008/06/18 08/14/18 808/07/18 08/15/18 808/08/18 08/16/18 8
B-14
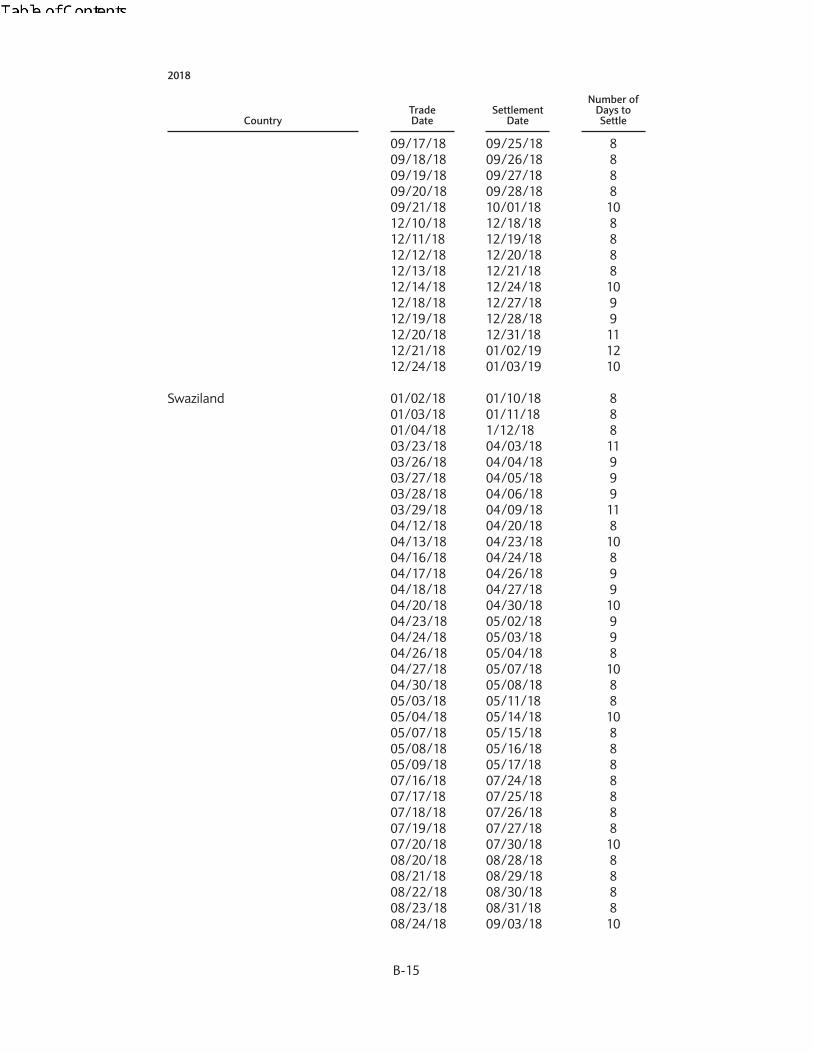
2018
CountryTradeDate
SettlementDate
Number ofDays toSettle
09/17/18 09/25/18 809/18/18 09/26/18 809/19/18 09/27/18 809/20/18 09/28/18 809/21/18 10/01/18 1012/10/18 12/18/18 812/11/18 12/19/18 812/12/18 12/20/18 812/13/18 12/21/18 812/14/18 12/24/18 1012/18/18 12/27/18 912/19/18 12/28/18 912/20/18 12/31/18 1112/21/18 01/02/19 1212/24/18 01/03/19 10
Swaziland 01/02/18 01/10/18 801/03/18 01/11/18 801/04/18 1/12/18 803/23/18 04/03/18 1103/26/18 04/04/18 903/27/18 04/05/18 903/28/18 04/06/18 903/29/18 04/09/18 1104/12/18 04/20/18 804/13/18 04/23/18 1004/16/18 04/24/18 804/17/18 04/26/18 904/18/18 04/27/18 904/20/18 04/30/18 1004/23/18 05/02/18 904/24/18 05/03/18 904/26/18 05/04/18 804/27/18 05/07/18 1004/30/18 05/08/18 805/03/18 05/11/18 805/04/18 05/14/18 1005/07/18 05/15/18 805/08/18 05/16/18 805/09/18 05/17/18 807/16/18 07/24/18 807/17/18 07/25/18 807/18/18 07/26/18 807/19/18 07/27/18 807/20/18 07/30/18 1008/20/18 08/28/18 808/21/18 08/29/18 808/22/18 08/30/18 808/23/18 08/31/18 808/24/18 09/03/18 10
B-15

2018
CountryTradeDate
SettlementDate
Number ofDays toSettle
08/30/18 09/07/18 808/31/18 09/10/18 1009/03/18 09/11/18 809/04/18 09/12/18 809/05/18 09/13/18 812/18/18 12/27/18 912/19/18 12/28/18 912/20/18 12/31/18 1112/21/18 01/02/19 1212/24/18 01/03/19 10
Taiwan 02/09/18 02/21/18 1202/12/18 02/22/18 10
Tanzania 12/19/18 12/27/18 8
Thailand 12/26/18 01/03/19 812/27/18 01/04/19 812/28/18 01/07/19 10
Turkey 08/16/18 08/27/18 1108/17/18 08/28/18 11
Uganda 01/19/18 01/29/18 1001/22/18 01/30/18 801/23/18 01/31/18 801/24/18 02/01/18 801/25/18 02/02/18 802/09/18 02/19/18 1002/12/18 02/20/18 802/13/18 02/21/18 802/14/18 02/22/18 802/15/18 02/23/18 803/01/18 03/09/18 803/02/18 03/12/18 1003/05/18 03/13/18 803/06/18 03/14/18 803/07/18 03/15/18 803/23/18 04/03/18 1103/26/18 04/04/18 903/27/18 04/05/18 903/28/18 04/06/18 903/29/18 04/09/18 1104/24/18 05/02/18 804/25/18 05/03/18 804/26/18 05/04/18 804/27/18 05/07/18 1004/30/18 05/08/18 806/08/18 06/18/18 1006/11/18 06/19/18 8
B-16

2018
CountryTradeDate
SettlementDate
Number ofDays toSettle
06/12/18 06/20/18 806/13/18 06/21/18 806/14/18 06/22/18 808/14/18 08/22/18 808/15/18 08/23/18 808/16/18 08/24/18 808/17/18 08/27/18 1008/20/18 08/28/18 810/02/18 10/10/18 810/03/18 10/11/18 810/04/18 10/12/18 810/05/18 10/15/18 1010/08/18 10/16/18 811/23/18 12/03/18 1011/26/18 12/04/18 811/27/18 12/05/18 811/28/18 12/06/18 811/29/18 12/07/18 812/18/18 12/27/18 912/19/18 12/28/18 912/20/18 12/31/18 1112/21/18 01/02/19 1212/24/18 01/03/19 10
Vietnam 02/09/18 02/21/18 1202/12/18 02/22/18 1002/13/18 02/23/18 10
Zimbabwe 02/14/18 02/22/18 802/15/18 02/23/18 802/16/18 02/26/18 1002/19/18 02/27/18 802/20/18 02/28/18 803/23/18 04/03/18 1103/26/18 04/04/18 903/27/18 04/05/18 903/28/18 04/06/18 903/29/18 04/09/18 1104/11/18 04/19/18 804/12/18 04/20/18 804/13/18 04/23/18 1004/16/18 04/24/18 804/17/18 04/25/18 804/24/18 05/02/18 804/25/18 05/03/18 804/26/18 05/04/18 804/27/18 05/07/18 1004/30/18 05/08/18 805/18/18 05/28/18 1005/21/18 05/29/18 8
B-17

2018
CountryTradeDate
SettlementDate
Number ofDays toSettle
05/22/18 05/30/18 805/23/18 05/31/18 805/24/18 06/01/18 808/06/18 08/15/18 908/07/18 08/16/18 908/08/18 08/17/18 908/09/18 08/20/18 1108/10/18 08/21/18 1112/18/18 12/27/18 912/19/18 12/28/18 912/20/18 12/31/18 1112/21/18 01/02/19 1212/24/18 01/03/19 10
* These worst-case redemption cycles are based on information regarding regular holidays, which may be out of date. Based on changes in holidays,longer (worse) redemption cycles are possible.
B-18

IS-SAI-03-0219