2019report annual - amazon web services
TRANSCRIPT

AnnuAlRepoRt2019

Contents
CHAIRMAN’S MESSAGE TO SHAREHOLDERS
Pg16
PERFORMING SUSTAINABLY. SUSTAINABLE PERFORMANCE.
Pg24
Corporate Overview
04 We Are Varun Beverages Limited
06 An Increasing Geographical Footprint
10 Our Incredible Journey of 28 Years
12 A Winning and Diversified Portfolio
14 Business Model. Model Business.
16 Chairman's Message to Shareholders
18 Proven Expertise. Promising Prospects.
19 Optimized to Grow. Customized to Succeed.
20 Board of Directors
24 Performing Sustainably. Sustainable Performance.
25 Corporate Information
01-25
Statutory Reports
26 Board's Report
46 Corporate Governance Report
80 Management Discussion & Analysis
89 Business Responsibility Report
26-95
Financial Statements
96 Consolidated Financial Statements
198 Standalone Financial Statements
96-295
Satiating our consumers' refreshment needs through our Well-loved Beverages and Iconic Brands
Forward-Looking StatementsThis report may contain some statements on the Company’s business or financials which may be construed as forward-looking based on the management’s plans and assumptions. The actual results may be materially different from these forward-looking statements, although we believe we have been cautious.
Read or download the report at www.varunpepsi.com
BUSINESS MODEL. MODEL BUSINESS.
Pg14
AnnuAlRepoRt2019

STATUTORY REPORTSCORPORATE OVERVIEW FINANCIAL STATEMENTS
Key numbers defining Varun Beverages
~1.35 BILLION CUSTOMERS
We Cover...
~2 Million Retail Outlets
38 Manufacturing Units
493 Million Unit Cases* Sold
11,000+ People Employed
Through our expansive international operations of…
25 years of Adding Taste to Thirst.
I;kl dks Lokfn"V cukus osQ 25 o"kZ A
Note: * A unit case is equal to 5.678 liters of beverage divided in 24 bottles of ~237ml each.

is purely a matter of subjeCtive ChoiCe.
while quenChing it
thirstis an objeCtive phenomena,

Varun Beverages has been catering to this subjective choice by offering a wide variety of carbonated and non-carbonated soft drinks that add taste to thirst. In doing so, we have emerged as the second-largest PepsiCo franchisee in the world outside of USA.
growth for 28* years.
adding taste to thirst has powered our
*Including pre-merger period

Varun Beverages Limited04
we are varun beverages limited
We are...Second-largest franchisee in the world (outside the United States) of carbonated soft drinks and non-carbonated beverages sold under trademarks owned by PepsiCo.
We are...Driving synergies of scale, operational productivity and efficiency across PepsiCo’s beverage business.
We produce and distribute...A wide range of carbonated soft drinks, a large section of non-carbonated beverages, and packaged drinking water.
We demonstrate our customer focus...By satisfying evolving consumer preferences and shifting market conditions, and creating sustainable value for the long term.
We have a national bottling, sales and distribution footprint (except Jammu & Kashmir, Ladakh and Andhra Pradesh) for…Pepsi, Mountain Dew, Pepsi Black, Mirinda, 7up, Tropicana Slice, Tropicana (100%, Delight & Essentials), Sting, Evervess, Gatorade, Lipton Ice Tea, Duke's, 7up Nimbooz, 7up Nimbooz Masala Soda.
2 Continents
6 Countries
27 Indian States
7 Union Territories
~2 Million Retail Outlets
~1.35 Billion Population Coverage
Solid organic volume growth of
17.2% in CY19* driven by healthy off-take in the domestic market
19.8% CAGR of sales volume in Indian market during CY15-19
22.1% CAGR of sales volume in International market during CY15-19
A growing proportion of PepsiCo’s India sales volume
2016 45%
2015 45%
2017 45%
2018 51%
2019 80%+
* Company follows Calendar Year (CY) for financial reporting

STATUTORY REPORTSCORPORATE OVERVIEW FINANCIAL STATEMENTS
Annual Report 2019 05
*Including pre-merger period
Associated with PepsiCo since 1991; over 28* years of our journey, we have consolidated our business association
Introduced various SKUs in the portfolio and expanded the distribution network
Presence across India (except Jammu & Kashmir, Ladakh and Andhra Pradesh)
Increased number of licensed territories and sub-territories, producing and distributing a wider range of PepsiCo beverages
Company has also been granted franchise for PepsiCo products for territories of Nepal, Sri Lanka, Morocco, Zambia and Zimbabwe
Company has been granted franchisees for various PepsiCo products spread across 27 States and 7 Union Territories

Varun Beverages Limited06
an inCreasing geographiCal footprint
We have established our presence in 27 States and 7 Union Territories in India, and across 5 developing economies – Nepal and Sri Lanka in South Asia, and Morocco, Zambia and Zimbabwe in Africa. We continue to leverage our distribution network to expand volumes in new segments.
90+ depots
2,500+ owned vehicles
1,500+ primary distributors
Our two-pronged growth strategy includes…Geographical area expansion and portfolio enrichment.
We are expanding our reach across India by…Constantly adding new territories (domestic and international) and simultaneously building capacity around them.
We are also enriching our product portfolio by…Introducing new product categories such as fruit juice/pulp based drinks and energy drinks.
1 Punjab2 Himachal Pradesh3 Uttarakhand4 Delhi5 Haryana6 Rajasthan7 Arunachal Pradesh8 Assam9 Meghalaya
25 Gujarat26 Karnataka27 Kerala28 Tamil Nadu
2019 India existing sub-territories
2019 India new sub-territories29 Telangana30 Maharashtra (remaining parts)31 Daman & Diu32 Dadra and Nagar Haveli
Maps not to scale
2019 International existing sub-territories
Nepal
Sri Lanka
Morocco
Zambia
Zimbabwe
17 Goa18 Chandigarh19 Madhya Pradesh20 Odisha21 Chhattisgarh22 Jharkhand23 Bihar 24 Sikkim
33 Puducherry (except Yanam)34 Andaman & Nicobar Islands35 Lakshadweep
10 Manipur11 Mizoram12 Nagaland13 Tripura14 Uttar Pradesh15 West Bengal16 Certain designated
parts in Maharashtra

STATUTORY REPORTSCORPORATE OVERVIEW FINANCIAL STATEMENTS
Annual Report 2019 07
3
4
5
3
1
2
1
14
2
4
16
7
12
15
5
13
68
112219
20
25
23
26
27 28
29
9
10
17
18
21
24
30
31
32
33
34
35
Map not to scale
2019 Existing VBL India Sub-Territories
2019 New VBL India Sub-Territories
2019 Others' Franchised Sub-Territories
2019 Existing VBL International Territories
VBL Manufacturing Plants
#For land & building, company has short term leasehold rights
Manufacturing Plants
Overseas
India
PhillaurGreater Noida IGreater Noida IIJainpurJodhpurBhiwadiNuhPanipatBazpurSathariyaSathariya IIKosiHardoiMandideepJamshedpurBargarhCuttack
KolkataGuwahati Unit I & IIGoaPathankotTirunelveliDharwadBharuchRohaAurangabadMahul#
NelamangalaPalakkadMamandurSangareddySri City
Nepal INepal IISri Lanka
MoroccoZambiaZimbabwe
Adding capacity to manufacturingOur new facility at Pathankot, Punjab, is the first fully integrated facility in India, manufacturing a complete range of PepsiCo products at a single location. Spread over 41 acres, this is set to create capacity for the production of Tropicana fruit juices, value-added ambient temperature dairy beverages, carbonated soft drinks and packaged drinking water. We expect this to become a hub to address the growing demand for beverages among consumers in the State and beyond.
We follow a strategy of increasing the number of licensed territories and sub-territories.
Our Manufacturing CapabilitiesThe manufacturing facilities of Varun Beverages are strategically located close to target markets, helping us reduce the time to market, enabling optimization of freight and logistics cost, and aiding in margin expansion.
Number of Visi-Coolers
775,000+
Manufacturing facilities in International
geographies
6
Manufacturing facilities in India
32

28* +years
Win-win partnership of
Varun Beverages Limited08
We are an important and trusted business partner to PepsiCo. We combine their insights and resources with our expertise in manufacturing, packaging, distribution, and understanding of market dynamics to consistently increase sales volume and strengthen PepsiCo’s brand equity. PepsiCo reciprocates this confidence by regularly granting us additional territories and product licenses.
We have a symbiotic relation with PepsiCo.
* Including pre-merger period
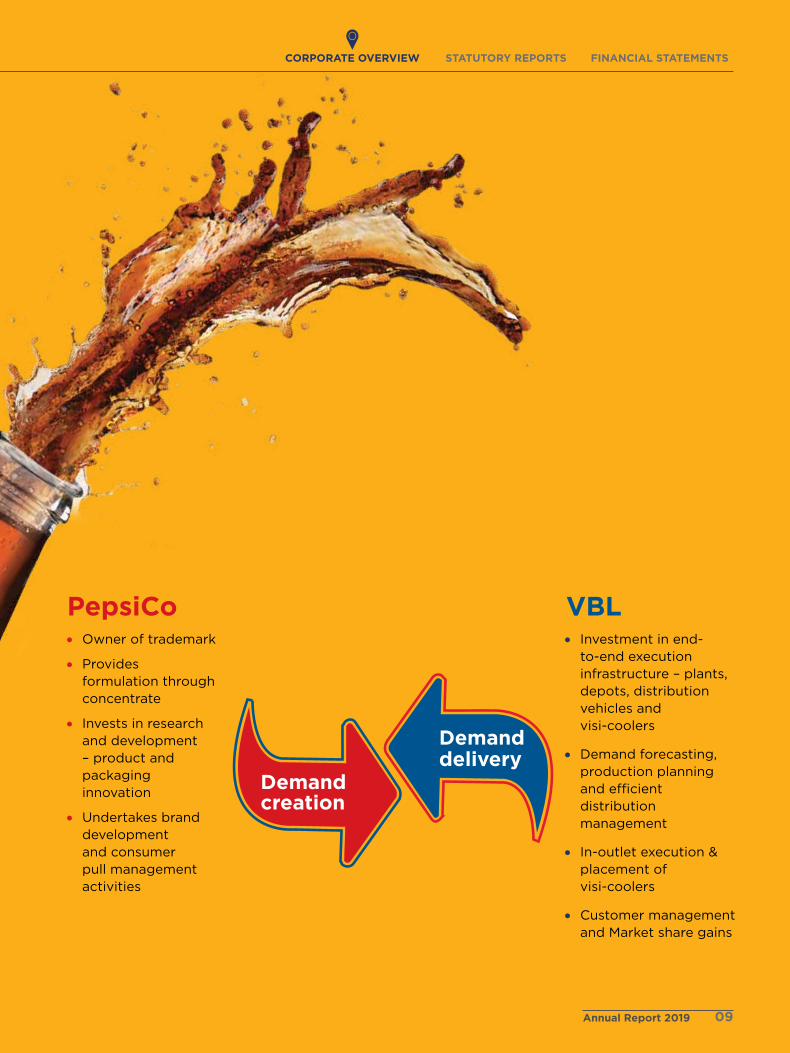
Owner of trademark
Provides formulation through concentrate
Invests in research and development – product and packaging innovation
Undertakes brand development and consumer pull management activities
PepsiCo Investment in end-
to-end execution infrastructure – plants, depots, distribution vehicles and visi-coolers
Demand forecasting, production planning and efficient distribution management
In-outlet execution & placement of visi-coolers
Customer management and Market share gains
VBL
Demand creation
Demand delivery
Annual Report 2019 09
STATUTORy REPORTSCORPORATE OVERVIEW FINANCIAL STATEMENTS

our inCredible journey of 28# yearsDuring our 28#-year journey, we continued to widen our portfolio mix and strengthen our leadership position in the Indian beverage market. Our constant endeavor has been to expand our presence in fast-growing markets, add solid infrastructure and set up a well-entrenched distribution network across territories.
Our journey began with a vision to add taste to thirst in some of the world’s most populous markets; what we have achieved so far is the appetizer, and much of the feast is still ahead of us. Not only do we refresh our customers but we also work to sustain, educate, and empower communities alongside ensuring our own business growth. This we shall do still more innovatively and across a wider region in the coming decades.
1991 1996 1999 2012
•Bottling and Trademark License Agreement with PepsiCo through a Group Company in 1991
•Commenced operations in Jaipur
•Started operations at Alwar, Jodhpur, and Kosi
•Subsequent to a merger of a group company, sub-territories of Goa, three districts of Maharashtra and Northeastern India got consolidated and three companies having the territories of Nepal, Sri Lanka and Morocco became subsidiaries
*Merged with VBL in 2004#Including pre-merger period *Merged with VBL in 2012
19982011
& 2012
•PepsiCo acquired 26% stake in Devyani Beverages Limited*
1995
•Varun Beverages Limited incorporated as a Public Limited Company
•Operations started under Devyani Beverages Limited in Greater Noida
• Investment by Standard Chartered PE in Varun Beverages (International) Limited (VBIL)*
•PepsiCo sold 26% stake in VBL to VBIL*
Varun Beverages Limited10
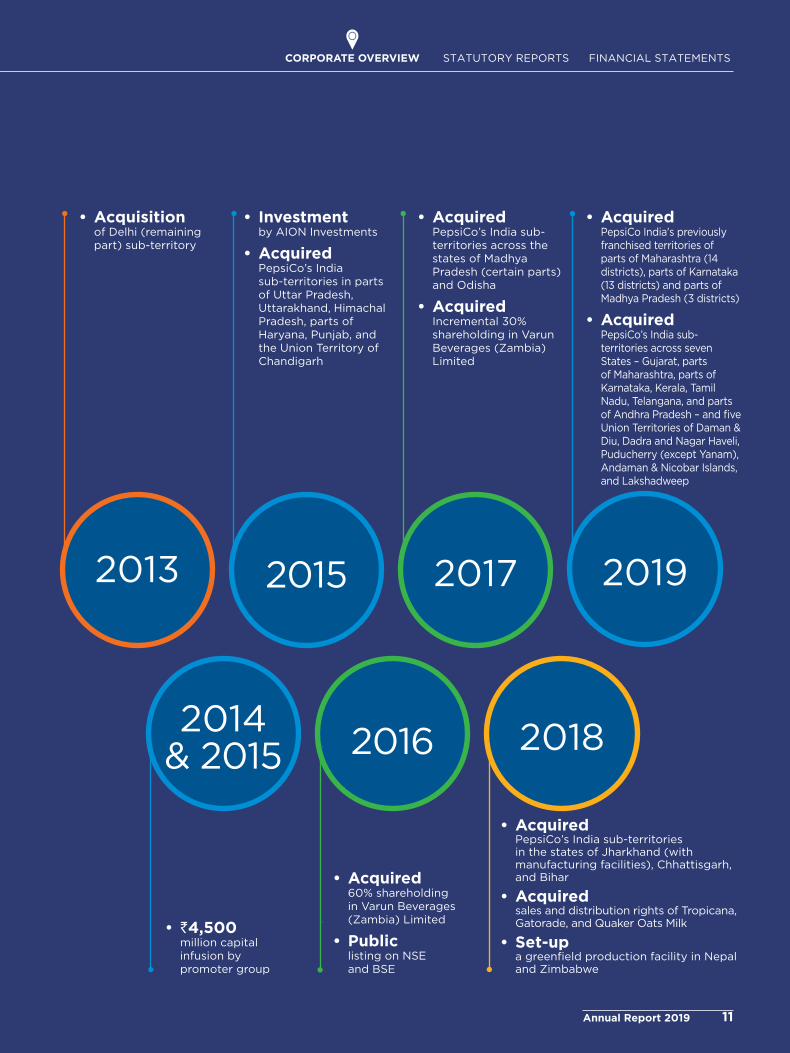
2019
•Acquired PepsiCo India's previously franchised territories of parts of Maharashtra (14 districts), parts of Karnataka (13 districts) and parts of Madhya Pradesh (3 districts)
•Acquired PepsiCo’s India sub-territories across seven States – Gujarat, parts of Maharashtra, parts of Karnataka, Kerala, Tamil Nadu, Telangana, and parts of Andhra Pradesh – and five Union Territories of Daman & Diu, Dadra and Nagar Haveli, Puducherry (except Yanam), Andaman & Nicobar Islands, and Lakshadweep
•Acquisition of Delhi (remaining part) sub-territory
• Investment by AION Investments
•Acquired PepsiCo’s India sub-territories in parts of Uttar Pradesh, Uttarakhand, Himachal Pradesh, parts of Haryana, Punjab, and the Union Territory of Chandigarh
2015 20172013
•Acquired PepsiCo’s India sub-territories across the states of Madhya Pradesh (certain parts) and Odisha
•Acquired Incremental 30% shareholding in Varun Beverages (Zambia) Limited
2016
•Acquired 60% shareholding in Varun Beverages (Zambia) Limited
•Public listing on NSE and BSE
2014 & 2015
• `4,500 million capital infusion by promoter group
2018
•Acquired PepsiCo’s India sub-territories in the states of Jharkhand (with manufacturing facilities), Chhattisgarh, and Bihar
•Acquired sales and distribution rights of Tropicana, Gatorade, and Quaker Oats Milk
•Set-up a greenfield production facility in Nepal and Zimbabwe
Annual Report 2019 11
STATUTORY REPORTSCORPORATE OVERVIEW FINANCIAL STATEMENTS

Varun Beverages Limited12
a winning and diversified portfolio
We have a diverse and multi-product portfolio, which we innovate and upgrade to tap varied consumer preferences, unlocking new opportunities for growth. We are constantly working to strengthen our market share across categories and drive volumes to sustain the growth momentum.
Portfolio Break-up*
Our Carbonated drinks Portfolio:
Carbonated soft drinks
Packaged drinking water
22.7%Fruit pulp/Juice-based drinks
6.7%
*In terms of sales volumes
70.6%
7up Nimbooz Masala Soda
Diet Pepsi
Pepsi Black
7up
MirindaPepsiMountain
Dew
Carbonated Soft drinks
Evervess

STATUTORY REPORTSCORPORATE OVERVIEW FINANCIAL STATEMENTS
Annual Report 2019 13
Our Portfolio of Nutritious Choices:
Fruit pulp / Juice-based drinks
Tropicana Slice 7up Nimbooz Tropicana Frutz
Ambient Temperature Value-added dairy Beverages
Cold Coffee Belgian Choco ShakeMango Shake
Sting Gatorade Lipton Ice Tea Aquafina & Aquavess
Energy drink Sports drink Ice TeaPackaged
drinking Water
Tropicana (100%, Delight & Essentials)

business model. model business.
We have an agile business model and are focused on generating steady cash flows over the coming years, leveraging on existing and new investments.
Committed to long-term value creation
Manufacturing
distribution & Warehousing
Customer Management
In-market Execution
Cost Efficiencies
Cash Management
Solid infrastructure
Robust supply chain management
RoE expansion /Future growth
Market share gains
Margin expansion
Demand delivery
Varun Beverages Limited14

STATUTORY REPORTSCORPORATE OVERVIEW FINANCIAL STATEMENTS
Annual Report 2019 15
We manufacture high-quality beverages across 38 state-of-the-art facilities, which have the advantage of backward integration.
We ensure deep penetration with an extensive supply chain network of 90+ owned depots, 2,500+ owned vehicles and 1,500+ primary distributors.
Apart from brand development and consumer marketing by PepsiCo, we undertake local level promotion and in-store activation. We have installed 775,000+ visi-coolers across stores to ensure consumers easily notice and enjoy our beverages.
We have an experienced region-specific sales team and a strong marketing team. These teams ensure both category and volume growth to boost sales.
Our expanding operations provide us the benefit of economies of scale. Additionally, we have invested in latest technologies to achieve production and logistics efficiency. Backward integration in some of our plants further reduces cost of production.
We practice disciplined capex investment for RoE expansion. Besides, we undertake initiatives to achieve better working capital efficiency.

Varun Beverages Limited16
Chairman’s message to shareholders
We continued our focus on strengthening the execution capabilities, and widening the portfolio mix with new product additions.
Dear Shareholders,It gives me immense pleasure to place before you the 25th Annual Report of the Company.
Overview
We are delighted to share that CY19 has been a year of solid operational and financial consolidation. We delivered a topline growth of 39.7%, EBITDA growth of 43.8%, and PAT growth of 57.5% in CY19. Our performance was primarily driven by robust volumes reported in the Indian and International markets. Improved performance in under-penetrated territories acquired in CY17 and early CY18 resulted in healthy organic volume growth of 13.1% in the domestic business. The international business also registered solid growth of 34.0%, driven by double digit growth in the key markets of Morocco, Zimbabwe and Sri Lanka.
The full year performance also includes the impact of sub-territories acquisition in South and West India from May 2019. I am pleased to share that our team has done a tremendous job in seamlessly consolidating such a large region in a short timeframe, demonstrating our exceptional execution capabilities and the dedication of employees.
We continued our focus on strengthening the execution capabilities, and widening the portfolio mix with new product additions. We also catered to varied demands of the fast-growing India beverages market and expanded our distribution reach and scope. These strategic building blocks should continue to hold us in good stead in the medium-to-long term. We continue to focus towards building presence across fast-growing categories to better cater to new trends and shifts in consumer preferences.
Acquisition of new territories
In May 2019, the Company concluded the acquisition of franchise rights in South and West regions from PepsiCo for a national bottling, sales and distribution footprint in 7 States and 5 Union Territories of India. The Company acquired franchise rights in the states of Gujarat, Telangana, Kerala, Tamil Nadu and parts of Maharashtra, Karnataka, Andhra Pradesh and in Union Territories of Daman & Diu, Dadra & Nagar Haveli, Andaman & Nicobar Islands, and Lakshadweep and Puducherry, except Yanam. With this, we have significantly reinforced our partnership with PepsiCo, and now account for over 80% of their India’s beverage sales volumes – from 51% earlier. In Feb 2019, we also concluded the acquisition of territorial

STATUTORY REPORTSCORPORATE OVERVIEW FINANCIAL STATEMENTS
Annual Report 2019 17
rights from SMV Group for parts of Maharashtra (14 districts), Karnataka (13 districts) and Madhya Pradesh (3 districts).
With this, we will be consolidating and expanding deeper into these regions to garner a bigger foothold and improve our market penetration. We are confident that this will help us obtain greater scale, operational productivity and efficiency, leading to higher revenues and profitable growth. It will also help generate better asset usage as the seasonality in these regions is relatively lower. On the whole, development of new markets and increasing presence in high-potential territories will be our key growth driver.
Furthermore, the Company acquired an additional 20% stake in Lunarmech Technologies Private Limited during the year, which makes and sells PET bottle caps and crown caps, increasing our shareholding to 55% of the effective equity share capital. Subsequently, Company acquired control of Angelica Technologies Private Limited (Angelica) by appointment of majority of Directors on the Board of Angelica. Additionally, we also concluded the acquisition of two production facilities, one at Dharwad, Karnataka for a total consideration of ` 747.25 million; and the second at Tirunelveli, Tamil Nadu for a total consideration of `200 million. We are confident that these acquisitions will help us gain greater scale, operational productivity and efficiency, resulting in higher revenues and sustainable growth.
New product launches
We are constantly working towards building a winning multi-category product portfolio, accelerating our quest for leadership across each segment and category. During the year, we introduced three new variants of ambient temperature value-added dairy beverages – Belgian Choco Shake, Cold Coffee and Mango Shake in 200ml PET bottle, with a 180-day shelf life. I am happy to share that these products have been very well received in the market. Our existing distribution network and chilling infrastructure will be leveraged to expand volumes in this segment.
Dividend & Bonus Issue
With the Company’s listing in November 2016, the Board has formalized a dividend strategy. At the beginning of our Silver Jubilee Year and in appreciation of the continued support of our shareholders, the Board proposed and approved a Bonus Issue of equity shares in the proportion of 1 equity share for each of the 2 equity shares held for eligible shareholders. It also approved an interim dividend of ` 2.50 per share in Q3 CY19, in accordance with the dividend policy guidelines. Total cash outflow towards this stands at `776.69 million (including payable net statutory taxes).
QIP Issue
During the year, the Company raised ~ `9,000 million through a fresh issue of 14,705,882 equity shares of `10
each. The entire proceeds of the QIP issue, net of issue expenses of ̀ 164.36 million, were utilized for repayment of debt during CY19. We are glad about the confidence reposed by marquee domestic and foreign investors in our business in a challenging market environment. This capital raise considerably strengthens our balance sheet and provides room for sustainable future growth.
Sustainability initiatives
The Company undertakes several initiatives towards embedding sustainability in operations and reducing the environmental footprint across manufacturing. It uses high quality food grade virgin PET chips as packaging material for the finished products. An external agency has been engaged to achieve 100% recycling of used PET bottles by collecting them from dustbins, reverse vending machines, Hotels, Banquet Halls, Exhibitions, and spreading awareness through workshops. Implemented in H2 CY19, over 24,000 MT of PET waste has been recycled – which is ~36% of our annual requirement. We hope to increase this to over 100% in the next 2 years.
We also engaged TUV India Pvt. Ltd. to verify our initiative towards water conservation and water recharge across 20 plants. These water conservation projects include rainwater harvesting, pond adoption, and waste water management and are based on the principles of reduce, reuse and recycle, for optimal water consumption across manufacturing operations.
Message to stakeholders
During the year, we focused on enhancing our operational efficiencies, expanding business with value-accretive acquisitions and increasing the product mix. Looking ahead, we continue to build upon our key industry position with presence in fastest growing markets, solid infrastructure and a well-entrenched distribution network. In the coming year, we remain focused on enhancing our market presence in the recently acquired territories, and remain confident of generating strong free cash flows by leveraging existing investments. Furthermore, we will be constantly innovating and upgrading our products and processes to strengthen market share across categories and enable sustained volumes in the longer term.
On behalf of the Board, I would like to thank all our stakeholders including shareholders, investors, bankers and creditors for their continued support. I would also like to thank our employees for their dedication, energy and irrepressible desire to always strengthen our Company. I also express my sincere gratitude to all our Board members for their continued insights and invaluable guidance as we explore new opportunities and move ahead with confidence.
Warm regards,
Ravi JaipuriaChairman

Varun Beverages Limited18
proven eXpertise. promising prospeCts.
We delivered an encouraging performance during the year, and remain confident of strengthening our market share and driving volumes. We remain confident of delivering a healthy and sustained operational and financial performance.
Financial highlights, CY19
43.8%39.7%Revenue growth over 2018 EBITdA growth over 2018
67.4%57.5%PAT growth over 2018 Net worth growth over 2018
Mix of sales volumes in CY19, segment-wise
Carbonated Soft Drink
Non-Carbonated Beverages
Packaged Drinking Water
70.6%
22.7%
6.7%

STATUTORY REPORTSCORPORATE OVERVIEW FINANCIAL STATEMENTS
Annual Report 2019 19
optimized to grow. Customized to suCCeed.
Note:• Historically, till 2015, in debt-equity ratio calculation, CCD's issued to Private Equity Investors were considered as Equity
and deferred acquisition consideration to PepsiCo was excluded from the debt. From the year 2016, CCDs of private equity investors are converted into equity and interest-free deferred acquisition consideration to PepsiCo has been considered in total debt.
• 2017 onward, financials are as per Ind AS and previous year numbers are as per IGAAP.
Net Revenue from Operations
EBITDA and EBITDA Margin
PAT and PAT Margin
Net Worth and Net Debt-Equity Ratio
20.8%CAGR
2015-19
22.9%CAGR
2015-19
52.6%CAGR
2015-19
55.5%CAGR
2015-19
(` in mn) (` in mn) (%) (` in mn) (%) (` in mn) (Ratio)
20
153
3,4
91
38
,52
0
40
,03
4 51,
05
3
71,
29
6
20
17
20
16
20
18
20
19
20
156
,34
1 7,9
52
8,3
58 10
,06
6
14,4
77
20
17
20
16
20
18
20
19
20
158
70
1,5
13
2,1
41
2,9
99
4,7
22
20
17
20
16
20
18
20
19
20
156
,72
3
18,9
39
19,7
85
20
,06
3
33
,59
1
20
17
20
16
20
18
20
19
2.6
%
3.9
%
5.3
%
5.9
%
1.5
x
1.2
x
1.3
x
1.3
x6.6
%
1.0
x
20
.3%
18.7
%
20
.6%
20
.9%
19.7
%

board of direCtors
Varun Beverages Limited20
Awards & Accolades
• PepsiCo’s International Bottler of the Year honor
1997
• Chairman’s Club – PepsiCo SAMEA region
2008
• BU Best Quality Plant Team Awards for Kosi production facility
2009
• PepsiCo AMEA Food Safety – Bronze for Greater Noida 1 production facility
2010
• PepsiCo AMEA Food Safety Award – Gold for Greater Noida 1 production facility
2012
• PepsiCo’s Bottler of the Year – Beverages
• PepsiCo’s AMEA Food Safety Award – Silver for Greater Noida 1 production facility
• PepsiCo Quality Excellence Bronze Award for Kosi production facility
2011
• CII National Award for Food Safety for Nuh production facility
• PepsiCo Bottler of the Year
2014
Mr. Ravi Jaipuria, the only Indian to have received PepsiCo’s International Bottler of the Year Award in 1997.

STATUTORY REPORTSCORPORATE OVERVIEW FINANCIAL STATEMENTS
Annual Report 2019 21
• Varun Beverages Limited – Bottler of the Year 2019 by PepsiCo in South Asia region
• Varun Beverages Limited – Winner of Best FMCG Corporate Governance India 2019 awarded by Capital Finance International London (UK)
• Varun Beverages Limited – Global Best Employer Brands 2020 (Best HR Strategy in Line with Business) presented by ET Now / National Best Employer Brands Award for 2019, presented by Employer Branding Institute India (second successive year)
2019• VB Sri Lanka – FOBO Unit of
the Year
2015
• VBL India – FOBO Unit of the Year
• VB Sri Lanka – FOBO Country of the Year
2016
• VB Nepal – Best Unit of the Year
• VB Sri Lanka – Donald M Kendall Award by PepsiCo for Small Developed Markets
• VBL Sonarpur Plant – Best Plant of the Year
• VBL Sonarpur Plant – CII Award for Food Safety
2017
• National Best Employer Award by ET Now in collaboration with World HRD Congress
• Distinguished Entrepreneurship Award in the PHD Annual Awards for Excellence 2018 to Mr. Ravi Jaipuria
2018
Varun Beverages Limited22
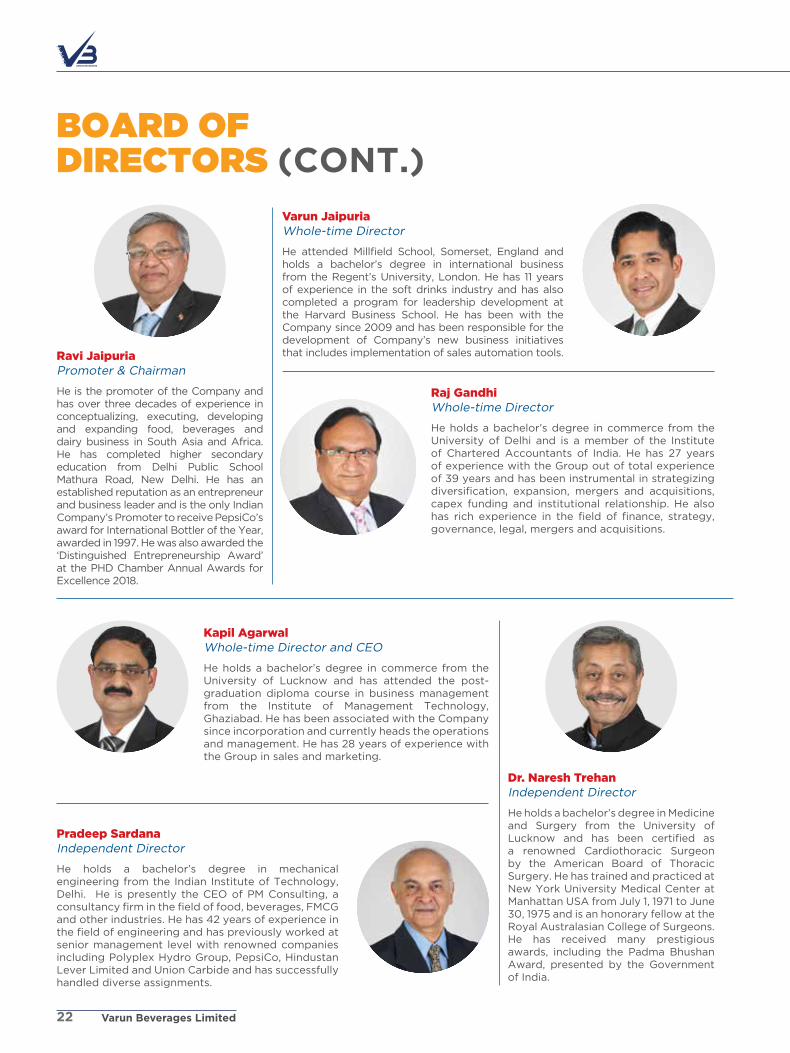
Ravi JaipuriaPromoter & Chairman
He is the promoter of the Company and has over three decades of experience in conceptualizing, executing, developing and expanding food, beverages and dairy business in South Asia and Africa. He has completed higher secondary education from Delhi Public School Mathura Road, New Delhi. He has an established reputation as an entrepreneur and business leader and is the only Indian Company’s Promoter to receive PepsiCo’s award for International Bottler of the Year, awarded in 1997. He was also awarded the ‘Distinguished Entrepreneurship Award’ at the PHD Chamber Annual Awards for Excellence 2018.
Raj GandhiWhole-time Director
He holds a bachelor’s degree in commerce from the University of Delhi and is a member of the Institute of Chartered Accountants of India. He has 27 years of experience with the Group out of total experience of 39 years and has been instrumental in strategizing diversification, expansion, mergers and acquisitions, capex funding and institutional relationship. He also has rich experience in the field of finance, strategy, governance, legal, mergers and acquisitions.
Dr. Naresh TrehanIndependent Director
He holds a bachelor’s degree in Medicine and Surgery from the University of Lucknow and has been certified as a renowned Cardiothoracic Surgeon by the American Board of Thoracic Surgery. He has trained and practiced at New York University Medical Center at Manhattan USA from July 1, 1971 to June 30, 1975 and is an honorary fellow at the Royal Australasian College of Surgeons. He has received many prestigious awards, including the Padma Bhushan Award, presented by the Government of India.
Pradeep SardanaIndependent Director
He holds a bachelor’s degree in mechanical engineering from the Indian Institute of Technology, Delhi. He is presently the CEO of PM Consulting, a consultancy firm in the field of food, beverages, FMCG and other industries. He has 42 years of experience in the field of engineering and has previously worked at senior management level with renowned companies including Polyplex Hydro Group, PepsiCo, Hindustan Lever Limited and Union Carbide and has successfully handled diverse assignments.
Varun JaipuriaWhole-time Director
He attended Millfield School, Somerset, England and holds a bachelor’s degree in international business from the Regent’s University, London. He has 11 years of experience in the soft drinks industry and has also completed a program for leadership development at the Harvard Business School. He has been with the Company since 2009 and has been responsible for the development of Company’s new business initiatives that includes implementation of sales automation tools.
Kapil AgarwalWhole-time Director and CEO
He holds a bachelor’s degree in commerce from the University of Lucknow and has attended the post-graduation diploma course in business management from the Institute of Management Technology, Ghaziabad. He has been associated with the Company since incorporation and currently heads the operations and management. He has 28 years of experience with the Group in sales and marketing.
board of direCtors (CONT.)

STATUTORY REPORTSCORPORATE OVERVIEW FINANCIAL STATEMENTS
Annual Report 2019 23
Sita KhoslaIndependent Director
She holds a bachelor’s degree in law from the University of Delhi and is enrolled with the Bar Council of Delhi since 1987. She practices in the areas of corporate, contract and commercial laws since 1992. She has been involved in providing advice on a wide range of issues from company formation, corporate governance and regulatory compliance to mergers and acquisitions, corporate restructuring, joint ventures, foreign investments, exchange control regulations and securities laws.
Rashmi DhariwalIndependent Director
She holds a bachelor’s degree in Arts from the University of Delhi and is a practicing advocate at the Calcutta High Court since 1978. She is also the chairperson of a non-profit organization called Prayatn which provides education to underprivileged children. She has also worked in several leading firms in India including Khaitan & Co, Calcutta and Delhi, Mulla & Mulla, Mumbai and also in the Philippines.
Rajinder Jeet Singh BaggaWhole-time Director
He holds a master’s degree in mechanical engineering from the Indian Institute of Technology, Kanpur. He has been associated with the Company since 1996 and is currently heading technical operations since 2003. He has an experience of 23 years with the Company in managing technical operations and execution of projects. Prior to this, he was associated with Eveready Industries India Limited for approximately 10 years and was last working in the capacity of their production manager.
Dr. Ravi GuptaIndependent Director
He holds a bachelor’s degree and a master’s degree in commerce from the University of Delhi. He also holds a bachelor’s degree in law and a doctorate in philosophy for his thesis on ‘Country Risk Analysis in Investment Financing Decision Making’ from the University of Delhi. Till recently, he was employed as an Associate Professor in the commerce department of Shri Ram College of Commerce, University of Delhi.

Varun Beverages Limited24
performing sustainably. sustainable performanCe.
Embracing Sustainability
Concerns about climate change and pollution have risen dramatically with increase in plastic waste, mounting carbon emissions and weather-related disasters. At Varun Beverages, we are conscious of our responsibility towards the environment. Therefore, we have integrated sustainability into our business to minimize the environmental impact of our products and operations.
Waste Management
Water Stewardship
Managing packaging waste requires concerted efforts by the governments, civil society and private entities. We are committed to reduce and reuse our packaging waste and lower our environmental footprint of packaging. During the year, we partnered with GEM Enviro Management Private Limited, a recognized Producer Responsible Organization (PRO). Our fundamental objectives include:
Collection of used PET bottles by placing dustbins/reverse vending machines
Ensuring 100% recycling of our packaging
Spreading awareness on packaging waste through workshops
With water scarcity increasingly becoming a matter of concern, we are strongly focusing on sustainable water management. To ensure the same, we have collaborated with TUV India Private Limited, one of India’s first certification organizations and a part of the German TUV NORD Group. Our key water conservation initiatives include rainwater harvesting, wastewater management based on the principles of reduce, reuse and recycle, among others. During the period from April 2018 to March 2019, audit of 20 manufacturing units of VBL was conducted to monitor water footprint across all the plants.
PET waste recycled in the second half of CY19
24,000+ mt
Key findings of the report:
4.96 MN KL Water recharged
2.91 MN KL Water consumption
26,000+ Trees planted
0.9 MN SQ M Area of adopted ponds

STATUTORY REPORTS FINANCIAL STATEMENTS
Annual Report 2019 25
CORPORATE OVERVIEW
Corporate information(As at December 31, 2019)
Board of Directors
Category
Non-Executive Chairman Mr. Ravi Jaipuria
Executive / Whole-time directors
Mr. Varun Jaipuria
Mr. Raj Gandhi
Mr. Kapil Agarwal
Mr. Rajinder Jeet Singh Bagga
Non-Executive, Independent directors
Dr. Naresh Trehan
Dr. Ravi Gupta
Mr. Pradeep Sardana
Ms. Rashmi Dhariwal
Ms. Sita Khosla
Name of Director
Chief Executive OfficerMr. Kapil Agarwal
Registered OfficeF-2/7, Okhla Industrial Area, Phase-I
New Delhi - 110 020
Registrar and Transfer AgentKFin Technologies Private Limited
(Formerly Karvy Fintech Private Limited)
Selenium Tower B, Plot No. 31 and 32,
Gachibowli Financial District, Nanakramguda
Hyderabad - 500 032
Tel: +91 40 6716 2222 | Fax: +91 40 2342 0814
Email: [email protected] | Website: www.kfintech.com
SEBI Registration No. INR000000221
BankersAxis Bank Limited
DBS Bank Limited
HDFC Bank Limited
ICICI Bank Limited
IDFC Bank Limited
Induslnd Bank Limited
Kotak Mahindra Bank Limited
RBL Bank Limited
The Federal Bank Limited
Yes Bank Limited
Chief Financial OfficerMr. Vikas Bhatia
Corporate OfficeRJ Corp House, Plot No. 31,
Institutional Area, Sector - 44,
Gurugram - 122 002
Chief Risk Officer & Group Company SecretaryMr. Ravi Batra
Joint Statutory Auditors
M/s. Walker Chandiok & Co. LLP
Chartered Accountants,
New Delhi
M/s. APAS & Co.
Chartered Accountants,
New Delhi

Board’s Report
Dear Members,
Your Directors have pleasure in presenting the 25th (Twenty Fifth) Annual Report on the business and operations of
your Company along with the Audited Financial Statements for the Financial Year ended December 31, 2019.
Financial Performance
The financial performance of your Company for the Financial Year ended December 31, 2019 is summarized below:
(` in million)
Particulars Standalone Consolidated
FinancialYear ended
December 31, 2019
FinancialYear ended
December 31, 2018
FinancialYear ended
December 31, 2019
FinancialYear ended
December 31, 2018Total Revenue 57,136.71 39,539.15 72,909.86 52,499.51
Total Expenses 50,793.80 34,909.57 65,990.75 48,191.73
Profit before tax after prior
period items
6,342.91 4,629.58 6,962.72 4,337.98
Less: Tax Expenses 1,857.44 1,305.99 2,240.67 1,339.35
Profit after tax 4,485.47 3,323.59 4,689.75* 2,928.41*
Balance brought forward from
last year
4,972.54 2,268.84 1,720.41 (594.12)
Balance carried over to Balance Sheet 8,619.78 4,972.54 5,560.11 1,720.41
General Reserve 444.26 444.26 444.26 444.26
Other Reserves 26,720.24 18,646.17 24,392.96 15,993.95
Reserves & Surplus carried to
Balance Sheet
35,784.28 24,062.97 30,397.33 18,158.62
*After adjustment on account of non-controlling interest and share profit of associate Companies.
Consolidated Financial Statements
The Consolidated Financial Statements of your Company
for the Financial Year 2019 are prepared in compliance
with the applicable provisions of the Companies Act,
2013 (‘the Act’), Indian Accounting Standards (‘Ind AS’)
and the Securities and Exchange Board of India (Listing
Obligations and Disclosure Requirements) Regulations,
2015 [‘SEBI (LODR) Regulations’] which shall be placed
before the Members in their forthcoming Annual General
Meeting (‘AGM’).
State of the Company’s affairs
Your Company has presence in 27 States and 7 Union
Territories in India and across 5 developing economies
(Nepal and Sri Lanka in South Asia, and Morocco, Zambia,
& Zimbabwe in Africa) and continue to leverage its
distribution network to expand volumes in new segments.
Deposits
Your Company has not accepted any deposits during the
year under review, falling within the ambit of Section 73
of the Act and the Companies (Acceptance of Deposits)
Rules, 2014.
Transfer to General Reserve
During the year under review, your Company has not
transferred any amount to General Reserve.
Change in the Nature of Business, if any
During the year under review, there was no change in the
nature of business of the Company.
Dividend Distribution Policy
The Board of Directors of the Company in their meeting
held on August 9, 2017 approved and adopted a Policy on
Distribution of Dividend to comply with Regulation 43A
of SEBI (LODR) Regulations and the same is uploaded on
website of the Company at https://varunpepsi.com/wp-
content/uploads/2019/03/Dividend-Distribution-Policy.pdf.
Dividend
During the year under review, the Board of Directors in
their meeting held on August 1, 2019 declared an interim
dividend of ` 2.50 per Equity Share (face value of ` 10/-
per Equity Share) to the eligible equity shareholders of the
Company. The Board of Directors do not recommend any
final dividend for the Financial Year 2019.
Varun Beverages Limited26

STATUTORY REPORTS
Your Company has transferred the unpaid or unclaimed
Interim Dividend to the Unclaimed Dividend Account –
Varun Beverages Limited and the details of unpaid and
unclaimed dividend amount lying in the said Accounts
(maintained with HDFC Bank Limited for the dividend
declared in 2017, Yes Bank Limited for the dividend
declared in 2018 and IndusInd Bank Limited for the dividend
declared in 2019) are uploaded on website of the Company
at https://varunpepsi.com/corporate-governance/.
acquisition Guidelines
Your Company applies stringent strategic and financial
criteria to any potential acquisition or partnership
and to enhance transparency, the Board of Directors
of the Company in their meeting held on August 9,
2017 approved and adopted Acquisition Guidelines for
Company’s M&A activities for viable acquisitions and the
same is uploaded on website of the Company at http://
varunpepsi.com/wp-content/uploads/2017/08/VBL-
Guidelines-for-Acquisition-in-India.pdf.
acquisitions
During the year under review, your Company concluded
the acquisition of franchise rights in South and West
regions from PepsiCo for a national bottling, sales and
distribution footprint in 7 States and 5 Union Territories
of India. The Company acquired franchise rights in
States of Gujarat, Telangana, Kerala, Tamil Nadu and
parts of Maharashtra, Karnataka, Andhra Pradesh and
in Union Territories of Daman & Diu, Dadra & Nagar
Haveli, Andaman & Nicobar Islands, Lakshadweep and
Puducherry except Yanam. With these acquisitions, your
Company has significantly reinforced its partnership
with PepsiCo and now account for over 80% of their
India’s beverage sales volumes from 51% earlier. The
Company also concluded the acquisition of territorial
rights from SMV Group for parts of Maharashtra (14
districts), Karnataka (13 districts) and Madhya Pradesh
(3 districts) in Feb, 2019. Additionally, the Company also
concluded the acquisition of two production facilities,
one at Dharwad, Karnataka for a total consideration of
`747.25 million and second at Tirunelveli, Tamil Nadu for
a total consideration of `200 million.
Furthermore, your Company acquired 2,00,000 Equity
Shares equivalent to 20% of the issued and paid-up
share capital of Lunarmech Technologies Private Limited
(‘Lunarmech’) during the year, which makes and sells PET
bottles caps and crown caps. Post-acquisition, your Company
holds 55% of the effective equity share capital of Lunarmech.
Your Company also acquired control of Angelica
Technologies Private Limited (‘Angelica’) by appointment
of majority of Directors on the Board of Angelica. Post-
acquisition of control, both Angelica and Lunarmech (in
which Angelica holds 74% equity share capital) became
subsidiaries of the Company.
The acquisitions have been made in line with the guidelines
laid out by the Board and will enable to gain greater scale,
operational productivity and efficiency, resulting in higher
revenues and sustainable growth, going forward.
Bonus Issue
During the year under review, your Company has issued
and allotted 91,327,613 Bonus Equity Shares in the
proportion of 1:2 (i.e. one equity share for every two
equity shares) to the eligible Members whose names
appeared in the Register of Members / list of beneficial
owners as on the record date fixed for this purpose.
As part of the aforesaid allotment, 10,083 Bonus Equity
Shares representing fractional entitlement(s) of eligible
20,166 Members were consolidated and allotted to
“Varun Beverages Limited – Bonus Issue Fractional
Shares Trust” (‘Trust’) created for this purpose for selling
and distributing the net sale proceeds among the eligible
Members in proportion to their respective fractional
entitlement. The aforesaid 10,083 Equity Shares were sold
by the Trust @ ` 766.55 per Equity Share on November 7,
2019 aggregating to ` 7,729,139.77 through Karvy Stock
Broking Limited (‘Karvy’) and the sale proceeds of the
same are still outstanding with Karvy.
Qualified Institutions Placement (QIP)
During the year under review, in compliance with the
provisions of SEBI (Issue of Capital and Disclosure
Requirements) Regulations, 2018, SEBI (LODR)
Regulations and Sections 42 & 62 of the Act and Rules
made thereunder, your Company has issued and allotted
14,705,882 Equity Shares of face value of ` 10/- each to
the eligible Qualified Institutional Buyers at issue price of
`612/- per Equity Share i.e. at a premium of ` 602/- per
Equity Share aggregating to ̀ 8,999,999,784/-. The funds
raised through QIP have been fully utilized in line with the
objects stated in the placement document.
Share Capital
The Authorized Share Capital of the Company is
` 10,000,000,000/- (Rupees Ten Thousand Million only)
divided into 500,000,000 (Five Hundred Million) Equity
Shares of ` 10/- (Rupees Ten only) each and 50,000,000
(Fifty Million) Preference Shares of ̀ 100/- (Rupees Hundred
only) each. During the year under review, there was no
change in the Authorized Share Capital of the Company.
During the year under review, the paid-up equity
share capital of your Company was increased from
` 1,826,419,400/- (Rupees One Billion Eight Hundred
Twenty Six Million Four Hundred Nineteen Thousand and
Four Hundred only) to ` 2,886,887,200/- (Rupees Two
Billion Eight Hundred Eighty Six Million Eight Hundred
Eighty Seven Thousand and Two Hundred only) due to
(i) exercise of 13,285 Stock Options (equivalent to 13,285
CORPORATE OVERVIEW FINANCIAL STATEMENTS
Annual Report 2019 27

equity shares having face value of ` 10/- each) under
the Varun Beverages Limited Employee Stock Option
Scheme 2013; (ii) allotment of 91,327,613 Bonus Equity
Shares of face value of ` 10/- each; and (iii) allotment
of 14,705,882 Equity Shares of face value of ` 10/- each
pursuant to Qualified Institutions Placement.
Employee Stock Option Schemes
Your Company has two Employee Stock Option Schemes
viz. Varun Beverages Limited Employee Stock Option
Scheme 2013 (‘ESOP Scheme 2013’) and Varun Beverages
Limited Employee Stock Option Scheme 2016 (‘ESOP
Scheme 2016’). During the year under review, there was
no change / material change in the said Scheme(s).
Your Company has received a certificate from the
Statutory Auditors of the Company that ESOP Scheme
2016 has been implemented in accordance with the SEBI
(Share Based Employee Benefits) Regulations, 2014 and
the resolution(s) passed by the Members of the Company.
The certificate will be placed at the ensuing AGM for
inspection by Members of the Company.
Relevant disclosures pursuant to Rule 12 (9) of the Companies
(Share Capital and Debentures) Rules, 2014 and Regulation
14 of SEBI (Share Based Employee Benefits) Regulations,
2014 are attached to this report as annexure – a.
Credit Rating
During the year under review, CRISIL has upgraded your
Company’s credit ratings as below:
Long Term Rating CRISIL AA/Stable (Upgraded from 'CRISIL AA-/Positive')
Short Term Rating CRISIL A1+ (Reaffirmed)
Related Party Transactions
To comply with the provisions of Section 188 of the
Act and Rules made thereunder read with Regulation
23 of SEBI (LODR) Regulations, your Company took
necessary prior approval of the Audit, Risk Management
and Ethics Committee before entering into related party
transactions. All contracts / arrangements / transactions
entered into by the Company during the Financial Year
2019 with related parties, as defined under the Act and
SEBI (LODR) Regulations were in the ordinary course of
business and on arm’s length basis.
During the year under review, your Company had not
entered into any contract/ arrangement/ transaction
with related parties which could be considered material
in accordance with the Policy of the Company for Related
Party Transactions.
None of the transactions with any of the related parties
were in conflict with the interest of the Company
rather, these were synchronised and synergised with
the Company’s operations. Attention of Members is
drawn to the disclosure of transactions with the related
parties set out in Note No. 44 of the Standalone Financial
Statements, forming part of the Annual Report.
Your Company has framed a Policy on Related Party
Transactions in accordance with SEBI (LODR) Regulations.
The Policy intends to ensure that proper reporting,
approval and disclosure processes are in place for all
transactions between the Company and related parties.
The policy is uploaded on website of the Company at
http://varunpepsi.com/wp-content/uploads/2016/09/
Policy-On-Related-Party-Transactions.pdf
Since all transactions which were entered into during the
Financial Year 2019 were on arm’s length basis and in the
ordinary course of business and there was no material
related party transaction entered by the Company during
the Financial Year 2019 as per Policy on Related Party
Transactions, hence no detail is required to be provided
in Form AOC-2 prescribed under Clause (h) of Sub-
section (3) of Section 134 of the Act and Rule 8(2) of the
Companies (Accounts) Rules, 2014.
Particulars of Loans, Guarantees or Investments
Details of Loans, Guarantees, Securities and Investments
covered under the provisions of Section 186 of the Act are
given in the Notes to the Standalone Financial Statements.
Subsidiaries, associates and Joint Ventures
Your Company has following subsidiaries / associate Companies:
Subsidiaries
Varun Beverages (Nepal) Private Limited;
Varun Beverages Lanka (Private) Limited;
- Ole Springs Bottlers (Private) Limited
(step-down subsidiary);
Varun Beverages Morocco SA;
Varun Beverages (Zambia) Limited;
- Varun Beverages (Botswana) (Proprietary) Limited
(step-down subsidiary w.e.f. February 21, 2019);
Varun Beverages (Zimbabwe) (Private) Limited;
Angelica Technologies Private Limited
(w.e.f. November 4, 2019); and
- Lunarmech Technologies Private Limited
(w.e.f. November 4, 2019).
associate
Angelica Technologies Private Limited
(till November 3, 2019)
Lunarmech Technologies Private Limited
(w.e.f. September 9, 2019 till November 3, 2019)
To comply with the provisions of Section 129 of the
Act, a separate statement containing salient features
of Financial Statements of Subsidiaries and Associates
Varun Beverages Limited28

STATUTORY REPORTS
of your Company (including their performance and
financial position) in prescribed Form AOC-1 forms part
of Consolidated Financial Statements and therefore not
repeated here to avoid duplication. Further, contribution
of subsidiary and associate companies to the overall
performance of your Company is outlined in Note No. 60
of the Consolidated Financial Statements.
Financial Statements of the aforesaid subsidiary and
associate companies are kept open for inspection by the
Members at the Registered Office of your Company on all
days except Saturday, Sunday and Public Holidays up to
the date of AGM i.e. April 10, 2020 between 11:00 a.m. to
5:00 p.m. as required under Section 136 of the Act. Any
Member desirous of obtaining a copy of the said Financial
Statements may write to the Company at its Registered
Office or Corporate Office. The Financial Statements
including the Consolidated Financial Statements and
all other documents required to be attached with this
Report have been uploaded on website of the Company at
https://varunpepsi.com/annual-reports.
To comply with the provisions of Regulation 16(c) of
SEBI (LODR) Regulations, the Board of Directors of
the Company have approved and adopted a Policy for
determining Material Subsidiary and as on December 31,
2019, none of the subsidiary was a material subsidiary of the
Company in terms of the said Policy. The Policy on Material
Subsidiary is uploaded on website of the Company at
http://varunpepsi.com/wp-content/uploads/2016/09/
Policy-For-Determination-Of-Material-Subsidiary-And-
Governance-Of-Subsidiaries.pdf
Directors and Key Managerial Personnel
DirectorsDuring the year under review, the Board of Directors, on
the recommendation of Nomination and Remuneration
Committee, accorded its approval to the following:
(i) Re-appointment of Mr. Varun Jaipuria (DIN: 02465412)
as Whole-time Director of the Company for a further
period of up to 5 (Five) years w.e.f. November 1, 2019,
subject to approval of Members of the Company;
(ii) Re-appointment of Mr. Raj Gandhi (DIN: 00003649)
as Whole-time Director of the Company for a further
period of up to 5 (Five) years w.e.f. November 1, 2019,
subject to approval of Members of the Company; and
(iii) Appointment of Mr. Rajinder Jeet Singh Bagga
(DIN: 08440479) as an Additional Director to hold
office up to the date of ensuing AGM and as Whole-
time Director of the Company for a period of up to
5 (Five) years w.e.f. May 2, 2019, subject to approval
of Members of the Company.
Your Company has received requisite notice in writing from
a Member of the Company in terms of Section 160 of the Act,
proposing the candidature of Mr. Rajinder Jeet Singh Bagga
as Director of the Company.
Further, the above-mentioned Directors have affirmed
that they are not debarred from holding the office of
Whole-time Director by virtue of any SEBI order or any
other such Authority.
To comply with the provisions of Section 152 of the
Act and in terms of the Articles of Association of the
Company, Mr. Kapil Agarwal (DIN: 02079161), Whole-
time Director and Chief Executive Officer is liable to
retire by rotation at the ensuing AGM and being eligible,
seeks re-appointment. The Board of Directors, on the
recommendation of Nomination and Remuneration
Committee, recommended his re-appointment.
Further, at the 24th AGM of the Company held on
April 17, 2019, Mr. Kapil Agarwal (DIN: 02079161) was
re-appointed as Whole-time Director of the Company
(designated as Whole-time Director and Chief Executive
Officer) for a period of up to 5 (Five) years w.e.f.
January 1, 2019 and Dr. Naresh Trehan was re-appointed
as an Independent Director of the Company for a second
term of up to 5 (Five) years w.e.f. December 1, 2018.
The Company has received declarations from all the
Independent Directors of the Company confirming that
they meet the criteria of independence as prescribed
both under sub-section (6) of Section 149 of the Act and
SEBI (LODR) Regulations.
Brief resume and other details of the Directors being
appointed/re-appointed at the ensuing AGM as stipulated
under Secretarial Standard-2 issued by the Institute of
Company Secretaries of India and Regulation 36 of the
SEBI (LODR) Regulations, is separately disclosed in the
Notice of the ensuing AGM.
Due to role enhancement, Mr. Kamlesh Kumar Jain (DIN:
01822576) was appointed as Executive Director & COO
(International) (Non-Board Member) of the Company.
Accordingly, he resigned from the position of Whole-
time Director and Chief Financial Officer (Key Managerial
Personnel) of the Company w.e.f. August 1, 2019.
Key Managerial Personnel
Consequent to the resignation of Mr. Kamlesh Kumar
Jain, Mr. Vikas Bhatia was appointed as Chief Financial
Officer (Key Managerial Personnel) of the Company w.e.f.
August 1, 2019 in accordance with the provisions of Section
203 of the Act read with the Companies (Appointment
and Remuneration of Managerial Personnel) Rules, 2014.
Further, Mr. Kapil Agarwal, Whole-time Director and Chief
Executive Officer and Mr. Ravi Batra, Chief Risk Officer
& Group Company Secretary, continued to be the Key
Managerial Personnel of your Company in accordance
with the provisions of Section 203 of the Act read with
the Companies (Appointment and Remuneration of
Managerial Personnel) Rules, 2014.
CORPORATE OVERVIEW FINANCIAL STATEMENTS
Annual Report 2019 29
Board Evaluation
To comply with the provisions of Section 134(3)(p) of
the Act and Rules made thereunder and Regulation
17(10) of SEBI (LODR) Regulations, the Board has carried
out the annual performance evaluation of the Directors
individually including the Independent Directors
(wherein the concerned Director being evaluated
did not participate), Board as a whole and following
Committees of the Board of Directors:
(i) Audit, Risk Management and Ethics Committee;
(ii) Nomination and Remuneration Committee;
(iii) Stakeholders’ Relationship Committee; and
(iv) Corporate Social Responsibility Committee.
The manner in which the annual performance evaluation has
been carried out is explained in the Corporate Governance
Report which forms part of this report. Board is responsible
to monitor and review the evaluation framework.
Further, to comply with Regulation 25(4) of SEBI (LODR)
Regulations, Independent Directors also evaluated the
performance of Non-Independent Directors, Chairman
and Board as a whole at a separate meeting of
Independent Directors.
Board and Committees of the Board
The number of meetings of the Board and various
Committees of the Board including composition are set
out in the Corporate Governance Report which forms part
of this report. The intervening gap between the meetings
was within the period prescribed under the provisions of
Section 173 of the Act and SEBI (LODR) Regulations.
Remuneration Policy
To comply with the provisions of Section 178 of the
Act and Rules made thereunder and Regulation 19 of
SEBI (LODR) Regulations, the Company’s updated
Remuneration Policy for Directors, Key Managerial
Personnel, Senior Management and other Employees of
the Company is uploaded on website of the Company at
https://varunpepsi.com/wp-content/uploads/2020/03/
Remuneration-Policy.pdf. The Policy includes, inter-
alia, the criteria for appointment and remuneration of
Directors, KMPs, Senior Management Personnel and other
employees of the Company.
Remuneration of Directors, Key Managerial Personnel and Particulars of Employees
The information required to be disclosed in the Board’s
Report pursuant to Section 197 of the Act read with Rule
5 of the Companies (Appointment and Remuneration
of Managerial Personnel) Rules, 2014 is attached to this
report as annexure – B.
Statutory auditors
Members of the Company in their 22nd AGM held on April 17,
2017 appointed M/s. APAS & Co., Chartered Accountants
(Firm Registration Number 000340C) as Joint Statutory
Auditors of the Company to hold office for a period of up
to 5 (Five) years i.e. till the conclusion of 27th AGM of the
Company to be held in the Financial Year 2022.
Further, Members in their 23rd AGM held on April 17, 2018
appointed M/s. Walker Chandiok & Co. LLP, Chartered
Accountants (Firm Registration Number 001076N/
N500013) as Joint Statutory Auditors of the Company to
hold office for a period of up to 5 (Five) years i.e. till the
conclusion of 28th AGM of the Company to be held in the
Financial Year 2023.
The Statutory Auditors’ Report for the Financial Year 2019
does not contain any qualification, reservation or adverse
remark. The Statutory Auditors have not reported any
frauds under Section 143(12) of the Act.
Cost audit
In terms of Section 148 of the Act and the Companies
(Cost Records and Audit) Rules, 2014, Cost Audit is
not applicable to the Company for the Financial Year
ended 2019.
Disclosure under Sexual Harassment of Women at Workplace (Prevention, Prohibition and Redressal) act, 2013
To comply with the provisions of Section 134 of the Act
and Rules made thereunder, your Company has complied
with the provisions relating to constitution of Internal
Complaints Committee under the Sexual Harassment
of Women at Workplace (Prevention, Prohibition and
Redressal) Act, 2013.
During the year under review, no complaint was filed
under the Sexual Harassment of Women at Workplace
(Prevention, Prohibition and Redressal) Act, 2013 and
no complaint was pending at the beginning and end of
Financial Year 2019.
Vigil Mechanism / Whistle Blower Policy
Pursuant to the provisions of Section 177 of the Act and
Regulation 22 of SEBI (LODR) Regulations, the Company
has adopted a Vigil Mechanism / Whistle Blower Policy to
provide a platform to the Directors and employees of the
Company to raise concerns regarding any irregularity,
misconduct or unethical matters / dealings within
the Company. The same is detailed in the Corporate
Governance Report which forms part of this report.
Secretarial auditors
The Board of Directors on the recommendation of the
Audit, Risk Management and Ethics Committee, has
Varun Beverages Limited30

STATUTORY REPORTS
appointed M/s. Sanjay Grover & Associates, Company
Secretaries to conduct Secretarial Audit of your Company.
The Secretarial Audit Report for the Financial Year 2019
is attached to this report as annexure - C.
Risk Management
Pursuant to the provisions of Regulation 21(5) of
SEBI (LODR) Regulations, the top 500 listed entities,
determined on the basis of market capitalization, as at
the end of the immediate previous financial year shall
constitute a Risk Management Committee. Accordingly,
the Board of Directors in their meeting held on August
9, 2018 renamed its Audit Committee as Audit and Risk
Management Committee and also updated the terms of
reference of this Committee to cover provisions related to
risk management review.
Further, during the year under review, the Audit and Risk
Management Committee was renamed as Audit, Risk
Management and Ethics Committee.
Your Company has a robust Risk Management Policy
which identifies and evaluates business risks and
opportunities. The Company recognize that these risks
need to be managed and mitigated to protect the
interest of the stakeholders and to achieve business
objectives. The risk management framework is aimed at
effectively mitigating the Company’s various business
and operational risks, through strategic actions.
Internal Financial Controls
Your Company has in place adequate Internal Financial
Controls. The report on Internal Financial Controls issued
by M/s. Walker Chandiok & Co. LLP, Chartered Accountants
and M/s. APAS & Co., Chartered Accountants, the Joint
Statutory Auditors of the Company is annexed to the Audit
Report on the Financial Statements of the Company and
does not contain any reportable weakness of the Company.
Corporate Social Responsibility (CSR)
Your Company has a Corporate Social Responsibility
Policy which is uploaded on website of the Company at
http://varunpepsi.com/wp-content/uploads/2016/09/
Corporate-Social-Responsibility-Policy.pdf.
Annual Report on CSR activities for the Financial Year
2019 as required under Sections 134 and 135 of the Act
read with Rule 8 of the Companies (Corporate Social
Responsibility Policy) Rules, 2014 and Rule 9 of the
Companies (Accounts) Rules, 2014 is attached to this
report as annexure - D.
Directors’ Responsibility Statement
Pursuant to Section 134(3)(c) read with Section 134(5) of
the Act, the Directors state that:
(a) in the preparation of the annual accounts for the
Financial Year ended December 31, 2019, the applicable
accounting standards have been followed along with
proper explanation relating to material departures;
(b) they have selected such accounting policies and
applied them consistently and made judgments and
estimates that are reasonable and prudent so as to
give a true and fair view of the state of affairs of your
Company as at December 31, 2019 and of the profits of
the Company for the period ended on that date;
(c) proper and sufficient care has been taken for the
maintenance of adequate accounting records in
accordance with the provisions of Act for safeguarding
the assets of your Company and for preventing and
detecting fraud and other irregularities;
(d) the annual accounts have been prepared on a going
concern basis;
(e) proper internal financial controls laid down by the
Directors were followed by the Company and that
such internal financial controls are adequate and
were operating effectively; and
(f) proper systems to ensure compliance with the
provisions of all applicable laws were in place and that
such systems were adequate and operating effectively.
Other Information
Management Discussion & analysis Report
Management Discussion & Analysis Report for the year
under review, as stipulated under Regulation 34(2)(e)
of SEBI (LODR) Regulations, forms part of the Annual
Report.
Business Responsibility Report
Business Responsibility Report for the year under review,
as stipulated under Regulation 34(2)(f) of SEBI (LODR)
Regulations, forms part of the Annual Report.
Conservation of Energy, Technology absorption and Foreign Exchange Earnings and Outgo
The information on conservation of energy, technology
absorption and foreign exchange earnings and outgo as
stipulated under Section 134(3)(m) read with Rule 8 of
the Companies (Accounts) Rules, 2014 is attached to this
report as annexure – E.
Corporate Governance Report
Your Company is committed to maintain the highest
standards of Corporate Governance and adhere to the
Corporate Governance requirements set out by Securities
and Exchange Board of India. The report on Corporate
Governance as stipulated under the SEBI (LODR)
Regulations is attached to this report as annexure – F.
The certificate from M/s. Sanjay Grover & Associates,
CORPORATE OVERVIEW FINANCIAL STATEMENTS
Annual Report 2019 31

Company Secretaries confirming compliance with the
conditions of Corporate Governance is also attached to
the Corporate Governance Report.
Corporate Governance award
Your Company has been awarded with Corporate
Governance Awards 2019 - Best FMCG Corporate
Governance – India 2019 by Capital Finance International,
London(UK). The award is recognition of Company’s efforts
in following the best Corporate Governance Standards.
Listing
The Equity Shares of the Company are listed on the
National Stock Exchange of India Limited and BSE
Limited. Both these stock exchanges have nation-wide
trading terminals. Annual listing fee for the Financial Year
2019-20 has been paid to the National Stock Exchange of
India Limited and BSE Limited.
Extract of the annual Return
Extract of the Annual Return in Form No. MGT – 9 in
accordance with the provisions of Section 92 of the Act read
with the Companies (Management and Administration)
Rules, 2014, is attached to this report as annexure – G.
Annual Return of the Company for the Financial Year
2018 is uploaded on website of the Company at https://
varunpepsi.com/wp-content/uploads/2020/02/Annual-
Return-for-FY-2018.pdf.
Research and Development
During the year under review, no Research and
Development was carried out.
Cautionary Statement
Statements in the Board’s Report and the Management
Discussion and Analysis Report describing the
Company’s objectives, expectations or forecasts may be
forward looking within the meaning of applicable laws
and regulations. Actual results may differ from those
expressed in the statements.
General
Your Directors confirm that no disclosure or reporting is
required in respect of the following items as there was no
transaction on these items during the year under review:
1. Issue of equity shares with differential voting rights
as to dividend, voting or otherwise.
2. The Whole-time Directors of the Company does not
receive any remuneration or commission from any of
its subsidiaries.
3. No significant or material orders were passed
by the Regulators or Courts or Tribunals which
impact the going concern status and Company’s
operations in future.
4. Issue of Sweat Equity Shares.
The Company is in regular compliance of the applicable
provisions of Secretarial Standards issued by the Institute
of Company Secretaries of India.
No material changes and commitments have occurred
after the closure of the Financial Year 2019 till the date
of this Report, which would affect the financial position
of your Company.
acknowledgement
Your Company’s organizational culture upholds
professionalism, integrity and continuous improvement
across all functions, as well as efficient utilization of the
Company’s resources for sustainable and profitable growth.
Your Directors wish to place on record their appreciation
for the sincere services rendered by employees of
the Company at all levels. Your Directors also wish
to place on record their appreciation for the valuable
co-operation and support received from various
Government Authorities, Banks / Financial Institutions
and other stakeholders such as members, customers
and suppliers, among others. Your Directors also
commend the continuing commitment and dedication
of employees at all levels, which has been vital for the
Company’s success. Your Directors look forward to
their continued support in future.
For and on behalf of the Board of Directors
For Varun Beverages Limited
Ravi Jaipuria
Date: February 7, 2020 Chairman
Place: Gurugram DIN: 00003668
Varun Beverages Limited32

STATUTORY REPORTS
The Company has two Employee Stock Option Schemes viz. Employee Stock Option Scheme - 2013 (ESOS-2013) and
Employee Stock Option Scheme - 2016 (ESOS-2016). All the relevant details of these schemes are provided below and
are also available on website of the Company at www.varunpepsi.com.
a. Relevant disclosures in terms of the ‘Guidance note on accounting for employee share-based payments’ issued by
ICAI or any other relevant accounting standards as prescribed from time to time.
Please refer Note No. 50 of Notes to the Standalone Financial Statements forming part of the Annual Report.
B. Diluted EPS on issue of shares pursuant to all the schemes covered under the Regulations in accordance with
‘Indian Accounting Standard (Ind AS) - 33 - Earnings Per Share’ or any other relevant accounting standards as
prescribed from time to time:
Disclosure on diluted EPS
Fully diluted EPS pursuant to issue of Equity Shares on exercise of options calculated in accordance with Ind AS -33 ‘Earnings Per Share’
ESOS - 2013 ESOS - 2016
` 16.10 on a standalone basis Not Applicable
C. Details Relating to ESOS – 2013
Sl. No.
Particulars Details
(i) (a) Date of shareholders’ approval May 13, 2013
(b) Total number of options approved / granted 26,75,400
(c) Vesting requirements 25% - On the date of Grant of options (First Vesting);25% - On the 1st day of January in the calendar year succeeding the calendar year of First Vest (Second Vesting);25% - On the 1st day of January in the calendar year succeeding the calendar year of Second Vest (Third Vesting); and25% - On the 1st day of January in the calendar year succeeding the calendar year of Third Vest (Fourth Vesting)All the options granted under this scheme have been vested on or before January, 2016.
(d) Exercise price or pricing formula ` 149.51 per equity share
(e) Maximum term of options granted 5 years for exercising the options from the date of vesting
(f) Source of shares (primary, secondary or combination)
Primary
annexure–a
Disclosure pursuant to Rule 12(9) of the Companies (Share Capital and Debentures) Rules, 2014 and Regulation 14 of Securities and Exchange Board of India (Share Based Employee Benefits) Regulations, 2014 as at December 31, 2019
CORPORATE OVERVIEW FINANCIAL STATEMENTS
Annual Report 2019 33

Sl. No.
Particulars Details
(g) Variation in terms of options Under the erstwhile ESOS-2013, the vesting was to occur at the time of filing of the Red Herring Prospectus by the Company for the purpose of IPO and the exercise period was to commence only after the IPO. The vesting period got amended by the Board of Directors on December 1, 2015 in such a way that the 1st, 2nd and 3rd vesting occurred on December 1, 2015 and the restriction on exercise of the option after IPO was removed. Thereafter, the ESOS - 2013 was amended on November 2, 2016 removing the restriction to exercise the Options in full in respect of the shares vested on a Vesting Date.
During the year under review, there was no variation in terms of options.
(ii) Method used to account for ESOS - 2013 Fair value
(iii) Difference between the employee compensation cost using the intrinsic value of stock options and the employee compensation cost that shall have been recognized if it had used the fair value of the options.
The impact of this difference on profits and on EPS of the Company.
During the Financial Year 2019, the Company followed Fair Value accounting of stock options. All the options have been vested & there were no accounting charge to Statement of Profit & Loss for the year.
(iv) Option movement during Financial Year – 2019
Number of options outstanding at the beginning of the year
23,285
Number of options granted during the year Nil
Number of options forfeited / lapsed during the year
10,000
Number of options vested during the year Nil
Number of options exercised during the year 13,285
Number of shares arising as a result of exercise of options
13,285
Money realized by exercise of options, if scheme is implemented directly by the Company
` 1,986,240.35
Loan repaid by the Trust during the year from exercise price received
Not Applicable
Number of options outstanding at the end of the year Nil
Number of options exercisable at the end of the year
Nil
(v) Weighted-average exercise prices and weighted average fair values of options shall be disclosed separately for options whose exercise price either equals or exceeds or is less than the market price of the stock
Please refer Note No. 50 of Notes to the Standalone Financial Statements forming part of the Annual Report.
(vi) Employee wise details of the shares issued during the year to:
Name Designation No. of Options granted
Exercise Price (`)
(a) Senior Managerial Personnel / Key Managerial Personnel
Nil
(b) any other employee who receives a grant in any one year of option amounting to 5% or more of option granted during that year
Nil
(c) identified employees who were granted option during any one year equal to or exceeding 1% of the issued capital of the Company (excluding outstanding warrants and conversions) at the time of grant.
Nil
Varun Beverages Limited34

STATUTORY REPORTS
Sl. No.
Particulars Details
(vii) Description of the method and significant assumptions used during the year to estimate the fair value of options including the following information:
Kindly refer Note No. 50 to Standalone Financial Statements forming part of the Annual Report
(a) the weighted-average values of share price; Not Applicable
(b) exercise price; Kindly refer Note No. 50 to Standalone Financial Statements forming part of the Annual Report
(c) expected volatility; -do-
(d) expected option life; -do-
(e) expected dividends; -do-
(f) risk-free interest rate and any other inputs to the model;
-do-
(g) the method used and the assumptions made to incorporate the effects of expected early exercise;
-do-
(h) how expected volatility was determined, including an explanation of the extent to which expected volatility was based on historical volatility; and
-do-
(i) whether and how any other features of the option grant were incorporated into the measurement of fair value, such as a market condition.
-do-
D. Details Relating to ESOS – 2016*
Sl. No.
Particulars Details
(i) (a) Date of shareholders’ approval April 27, 2016
(b) Total number of options approved / granted Nil
(c) Vesting requirements Unless otherwise specified in ESOS-2016, the continuation of the Grantee in the services of the Company shall be primary requirement of the Vesting25% - One year from the date of Grant (First Vesting)25% - On the 1st day of January in the calendar year succeeding the calendar year of First Vest (Second Vesting)25% - On the 1st day of January in the calendar year succeeding the calendar year of Second Vest (Third Vesting)25% - On the 1st day of January in the calendar year succeeding the calendar year of Third Vest (Fourth Vesting)
(d) Exercise price or pricing formula Not Applicable
(e) Maximum term of options granted Not Applicable
(f) Source of shares (primary, secondary or combination)
Not Applicable
(g) Variation in terms of options Not Applicable
(ii) Method used to account for ESOS - 2016 Not Applicable
(iii) Difference between the employee compensation cost using the intrinsic value of stock options and the employee compensation cost that shall have been recognized if it had used the fair value of the options.The impact of this difference on profits and on EPS of the Company.
Not Applicable
CORPORATE OVERVIEW FINANCIAL STATEMENTS
Annual Report 2019 35

Sl. No.
Particulars Details
(iv) Option movement during Financial Year – 2019
Number of options outstanding at the beginning of the year
Not Applicable
Number of options granted during the year Not Applicable
Number of options forfeited / lapsed during the year Not Applicable
Number of options vested during the year Not Applicable
Number of options exercised during the year Not Applicable
Number of shares arising as a result of exercise of options
Not Applicable
Money realized by exercise of options, if scheme is implemented directly by the Company
Not Applicable
Loan repaid by the Trust during the year from exercise price received
Not Applicable
Number of options outstanding at the end of the year Not Applicable
Number of options exercisable at the end of the year Not Applicable
(v) Weighted-average exercise prices and weighted-average fair values of options whose exercise price either equals or exceeds or is less than the market price of the stock
Not Applicable
(vi) Employee wise details of the shares issued to:
Name Designation No. of Options granted
Exercise Price (`)
(a) Senior Managerial Personnel / Key Managerial Personnel
Not Applicable
(b) any other employee who receives a grant in any one year of option amounting to 5% or more of option granted during that year
Not Applicable
(c) identified employees who were granted option during any one year equal to or exceeding 1% of the issued capital of the Company (excluding outstanding warrants and conversions) at the time of grant.
Not Applicable
(vii) Description of the method and significant assumptions used during the year to estimate the fair value of options including the following information:(a) the weighted-average values of share price,
exercise price, expected volatility, expected option life, expected dividends, the risk-free interest rate and any other inputs to the model;
(b) the method used and the assumptions made to incorporate the effects of expected early exercise;
(c) how expected volatility was determined, including an explanation of the extent to which expected volatility was based on historical volatility; and
(d) whether and how any other features of the option grant were incorporated into the measurement of fair value, such as a market condition.
Not Applicable
*The Company has not granted any stock options under ESOS - 2016 till date.
For and on behalf of the Board of Directors
For Varun Beverages Limited
Ravi JaipuriaDate: February 7, 2020 ChairmanPlace: Gurugram DIN: 00003668
Varun Beverages Limited36

STATUTORY REPORTS
(i) Ratio of the remuneration of each Director to the median remuneration of employees of the Company for
the Financial Year 2019, the percentage increase in remuneration of each Director, Chief Financial Officer and
Company Secretary during the Financial Year 2019:
(` in million)
Sl. No.
Name of Director/KMP and Designation
Remuneration of Director/KMP for
Financial Year 2019
% increase in Remuneration in
Financial Year 2019
Ratio of Remuneration of Director to Median
Remuneration of employees in Financial Year 2019
1. Mr. Varun Jaipuria,Whole-time Director^
31.45 0.74 101.45
2. Mr. Raj Gandhi,Whole-time Director@
48.51 -0.35 156.48
3. Mr. Kapil Agarwal,Whole-time Director & Chief Executive Officer
57.12 20.30 184.26
4. Mr. Rajinder Jeet Singh Bagga,Whole-time Director*
18.44 Not Comparable Not Applicable
5. Mr. Kamlesh Kumar Jain, Whole-time Director & Chief Financial Officer**
9.89 Not Comparable Not Applicable
6. Mr. Vikas Bhatia,Chief Financial Officer^^
7.72 Not Comparable Not Applicable
7. Mr. Ravi Batra,Chief Risk Officer &Group Company Secretary
8.23 10.32 26.55
^ There was no increase in remuneration of Mr. Varun Jaipuria during the Financial Year 2019. However, the percentage increase in remuneration is due to payment of incentive of ` 0.23 million during the Financial Year 2019.
@ Despite increase in remuneration and payment of performance bonus of ` 10.00 million in Financial Year 2019 as compared to performance bonus of ` 14.70 million in Financial Year 2018, there is percentage decrease in remuneration.
* Appointed with effect from May 2, 2019.
** Resigned from the position of Whole-time Director & Chief Financial Officer with effect from August 1, 2019.
^^ Appointed with effect from August 1, 2019.
(ii) The number of permanent employees as on December 31, 2019 were 8,570 and the median remuneration was
` 0.31 million annually. The median remuneration of employees (excluding above Directors and KMPs) in Financial
Year 2019 has increased by 10.71% as the Company had set aggressive business targets for the year ahead.
(iii) It is hereby affirmed that the above-mentioned remuneration is in accordance with the Remuneration Policy
of the Company which is uploaded on website of the Company at https://varunpepsi.com/wp-content/
uploads/2020/03/Remuneration-Policy.pdf.
(iv) The average percentile increase already made in the salaries of employees other than Managerial Personnel was
10.77% and the average percentile increase in the remuneration of Managerial Personnel was 12.00% during the
last Financial Year. The higher percentage in the increase of Managerial Personnel was based on growth plans of
the Company and individual performance of the Managerial Personnel.
annexure–B
Details pertaining to remuneration as required under Section 197(12) of the Companies act, 2013 read with Rule 5(1) of the Companies (appointment and Remuneration of Managerial Personnel) Rules, 2014
CORPORATE OVERVIEW FINANCIAL STATEMENTS
Annual Report 2019 37

Statement of particulars under Section 197(12) of the Companies act, 2013 read with Rule 5(2) of the Companies (appointment and Remuneration of Managerial Personnel) Rules, 2014 for the year ended December 31, 2019 (also includes the details of top ten employees of the Company)
Sl. No.
Name Designation Remuneration Received
(` in million)
age Qualification Experience in years
Last Employment
Date of Commencement of
Employment
1. Mr. Varun Jaipuria
Whole-time Director
31.45 32 Bachelor’s degree in International Business from the Regent’s University, London
11 - July 1, 2009
2. Mr. Raj Gandhi
Whole-time Director
48.51 62 FCA 39 Devyani Beverages Limited
November 1, 2004
3. Mr. Kapil Agarwal
Whole-time Director & Chief Executive Officer
57.12 55 PGDM 28 Devyani Beverages Limited
November 1, 2004
4. Mr. Vivek Gupta^
Executive Director
35.73 56 PGDM 32 Lunarmech Technologies Private Limited
April 1, 2015
5. Mr. Rajinder Jeet Singh Bagga*
Whole-time Director
27.77 56 M. Tech. 33 Eveready Industries India Limited
December 11, 1995
6. Mr. Vikas Bhatia**
Chief Financial Officer
17.82 55 FCA and ICWA 30 Carlsberg Group
January 15, 2019
7. Mr. Kamlesh Kumar Jain^
Executive Director and COO (International)
16.95 57 FCA 30 Devyani Beverages Limited
November 1, 2004
8. Mr. Sudin Kumar Gaunker
Chief Operating Officer
13.83 48 B.Com. 20 Goa Bottling Company Limited
June 21, 2000
9. Mr. Bhupinder Singh
Sr. Vice President
13.69 55 MBA 29 ABInbev India Private Limited
May 1, 2015
10. Mr. Saurabh Gupta#
Chief Operating Officer (Sales)
11.98 57 MBA 33 HT Learning Centers
April 1, 2019
11. Mr. Manmohan Rupal Paul
ChiefOperating Officer (Sales)
11.83 46 MBA 23 - June 3, 1996
12. Mr. Kamal Karnatak
Sr. Vice President
11.25 47 MBA 24 Unitech Limited
October 1, 2008
13. Mr. Saurabh Agrawal
Chief Strategy Officer
10.99 41 MBA 14 Accenture Solutions
September 18, 2018
14. Mr. Sugato Palit
Chief HR Officer
10.69 48 MBA 24 Accumen March 31, 2017
^ Not a member of the Board of Directors of the Company.* Appointed as Whole-time Director with effect from May 2, 2019.** Appointed as Chief Financial Officer with effect from August 1, 2019.# Employed for part of the year and in receipt of remuneration exceeding the prescribed limits.
Varun Beverages Limited38

STATUTORY REPORTS
Notes:1. Mr. Varun Jaipuria is the son of Mr. Ravi Jaipuria, Non-executive Chairman of the Company and holds 50,663,250
(17.55%) equity shares of the Company. None of the other employees hold by himself or along with his/her spouse
and dependent children, 2% or more of equity shares of the Company. Except above, none of the other employee
is a relative of any Director of the Company.
2. None of the employee receive remuneration during 2019 in excess of the remuneration of any of the Directors
except the details of employees forming part of this annexure.
3. Nature of employment for all these employees are permanent.
For and on behalf of the Board of Directors
For Varun Beverages Limited
Ravi JaipuriaDate: February 7, 2020 ChairmanPlace: Gurugram DIN: 00003668
CORPORATE OVERVIEW FINANCIAL STATEMENTS
Annual Report 2019 39

annexure–C
Secretarial audit ReportFor the Financial Year ended December 31, 2019
[Pursuant to Section 204(1) of the Companies Act, 2013 and Rule No. 9 of the Companies
(Appointment and Remuneration of Managerial Personnel) Rules, 2014]
To,
The Members,
Varun Beverages Limited
(CIN: L74899DL1995PLC069839)
F-2/7, Okhla Industrial Area, Phase-I,
New Delhi-110 020
We have conducted the secretarial audit of the
compliance of applicable statutory provisions and
the adherence to good corporate practices by Varun
Beverages Limited (the Company). Secretarial Audit was
conducted in a manner that provided us a reasonable
basis for evaluating the corporate conducts/statutory
compliances and expressing our opinion thereon.
We report that-
(a) Maintenance of secretarial records is the
responsibility of the management of the Company.
Our responsibility is to express an opinion on these
secretarial records based on our audit.
(b) We have followed the audit practices and processes
as were appropriate to obtain reasonable assurance
about the correctness of the contents of the secretarial
records. The verification was done on test basis to
ensure that correct facts are reflected in secretarial
records. We believe that the processes and practices,
we followed provide a reasonable basis for our opinion.
(c) We have not verified the correctness and
appropriateness of the financial statements of the
Company.
(d) Wherever required, we have obtained the
management representation about the compliances
of laws, rules and regulations and happening of
events etc.
(e) The compliance of the provisions of the corporate and
other applicable laws, rules, regulations, standards
etc. is the responsibility of the management. Our
examination was limited to the verification of
procedures on test basis.
(f) The Secretarial Audit report is neither an assurance
as to the future viability of the Company nor of the
efficacy or effectiveness with which the management
has conducted the affairs of the Company.
Based on our verification of the Company’s books,
papers, minute books, forms and returns filed and
other records maintained by the Company and also the
information provided by the Company, its officers, agents
and authorized representatives during the conduct of
Secretarial Audit, we hereby report that in our opinion,
the Company has, during the audit period covering the
financial year started from January 1, 2019 ended on
December 31, 2019 (“audit period”) complied with the
statutory provisions listed hereunder and also that the
Company has proper Board processes and compliance
mechanism in place to the extent, in the manner and
subject to the reporting made hereinafter.
We have examined the books, papers, minute books,
forms and returns filed and other records maintained by
the Company for the financial year ended on December 31,
2019 according to the provisions of:
(i) The Companies Act, 2013 (the Act) and the rules
made thereunder;
(ii) The Securities Contracts (Regulation) Act, 1956
(‘SCRA’) and the rules made thereunder;
(iii) The Depositories Act, 1996 and the Regulations and
Bye-laws framed thereunder;
(iv) Foreign Exchange Management Act, 1999 and the
rules and regulations made thereunder to the extent
of Foreign Direct Investment, Overseas Direct
Investment and External Commercial Borrowings,
wherever applicable;
(v) The following Regulations prescribed under the
Securities and Exchange Board of India Act, 1992
(‘SEBI Act’):-
(a) The Securities and Exchange Board of
India (Substantial Acquisition of Shares and
Takeovers) Regulations, 2011;
(b) The Securities and Exchange Board of India
(Prohibition of Insider Trading) Regulations, 2015;
(c) The Securities and Exchange Board of India
(Issue of Capital and Disclosure Requirements)
Regulations, 2018;
(d) The Securities and Exchange Board of India (Share
Based Employee Benefits) Regulations, 2014;
Varun Beverages Limited40

STATUTORY REPORTS
(e) *The Securities and Exchange Board of
India (Issue and Listing of Debt Securities)
Regulations, 2008;
(f) The Securities and Exchange Board of India
(Registrars to an Issue and Share Transfer
Agents) Regulations, 1993;
(g) *The Securities and Exchange Board of India
(Delisting of Equity Shares) Regulations, 2009;
(h) *The Securities and Exchange Board of India
(Buy-back of Securities) Regulations, 2018; and
(i) The Securities and Exchange Board of
India (Listing Obligations and Disclosure
Requirements) Regulations, 2015;
*No event took place under these regulations during the
audit period.
We have also examined compliance with the applicable
clauses of the Secretarial Standard on Meetings of the
Board of Directors (SS-1) and Secretarial Standard
on General Meetings (SS-2) issued by the Institute of
Company Secretaries of India, with which the Company
has generally complied with.
During the audit period, the Company has complied,
except otherwise reported elsewhere in this report,
with the provisions of the Act, Rules, Regulations and
Guidelines to the extent applicable, as mentioned above.
We further report that the Company was also generally
regular in filing of requisite e-forms with Registrar of
Companies, NCT of Delhi & Haryana.
The Company is PepsiCo’s second largest carbonated
soft drinks(CSDs) and non –carbonated beverages(NCBs)
global franchisee (outside US) possessing rights to
manufacture, distribute and sell CSDs, fruit juice based
drinks, packaged drinking water, sports drinks and energy
drinks. As informed by the Management, Food Safety
& Standards Act, 2006, Rules and Regulations made
thereunder, are specifically applicable to the Company.
In our opinion and to the best of our information and
according to explanations given to us, we believe that
the Company is having systems in place to check the
compliance of laws specifically applicable to the Company.
We further report that the Board of the Company is duly
constituted with proper balance of Executive Directors,
Non-Executive Directors and Independent Directors. The
changes in the composition of the Board of Directors that
took place during the audit period were carried out in
compliance with the provisions of the Act except that
Composition of Board was not compliant of Regulation 17
of SEBI (Listing Obligations and Disclosure Requirements)
Regulations, 2015 from May 2, 2019 to July 31, 2019 as
half of the Directors were not Independent Directors
and in this respect penalty as imposed by National Stock
Exchange of India Limited (NSE) and BSE Limited (BSE)
was deposited by the Company.
Advance notice is given to all Directors to schedule the
Board Meetings, agenda and detailed notes on agenda
were sent at least seven days in advance, and a system
exists for seeking and obtaining further information and
clarifications on the agenda items before the meeting
and for meaningful participation at the meeting.
Board decisions are carried out with unanimous consent
and therefore, no dissenting views were required to be
captured and recorded as part of the minutes.
We further report that there are systems and processes in
the Company commensurate with the size and operations
of the Company to monitor and ensure compliance with
applicable laws, rules, regulations and guidelines.
We further report that during the audit period:
the Shareholders of the Company at their 24th Annual
General Meeting held on April 17, 2019 approved
raising of capital through Qualified Institutional
Placement for an aggregate amount not exceeding
` 1,500/- crores
the Shareholders of the Company approved by
way of postal ballot on July 19, 2019, issue of bonus
shares in the proportion of 1 new fully paid-up equity
share of ` 10/- each for every 2 existing fully paid-up
equity share of ` 10/- each.
For Sanjay Grover & associatesCompany Secretaries
Firm Registration No.: P2001DE052900
Devesh Kumar Vasisht PartnerDate: February 7, 2020 CP No.: 13700Place: New Delhi UDIN: F008488B000131512
CORPORATE OVERVIEW FINANCIAL STATEMENTS
Annual Report 2019 41

1. A brief outline of the Company’s CSR policy, including overview of projects or programs proposed to be undertaken and a reference to the web-link to the CSR policy and projects or programs.
Refer Section on Corporate Social Responsibility in Board’s Report. Further, overview of projects or programs undertaken during the year under review, is provided in the table at item 5(c) below.
2. The composition of the CSR Committee 1) Mr. Ravi Jaipuria- Chairman2) Mr. Varun Jaipuria- Member3) Mr. Raj Gandhi- Member4) Dr. Naresh Trehan- Member5) Ms. Rashmi Dhariwal-
Member
3. Average net profit of the Company for last three Financial Years ` 2,861.15 million
4. Prescribed CSR Expenditure (two per cent of the amount as in item 3 above) ` 57.22 million
5. Details of CSR spent during the Financial Year 2019:
(a) Total amount to be spent for the Financial Year; ` 57.22 million
(b) Amount unspent, if any; Nil
(c) Manner in which the amount spent during the Financial Year Details given below
(` in million)
(1) (2) (3) (4) (5) (6) (7) (8)
Sl. No.
CSR project or activity identified
Sector in which the project is covered
Projects or Programs(1) Local area or
other(2) Specify
the State and district where projects or programs was undertaken
Amount outlay
(budget) project or
program wise
Amount spent on the projects
or programsSub-Heads;
(1) Direct expenditure on projects
or programs(2) Overheads
Cumulative expenditure
up to the reporting
period
Amount spent direct or through implementing agency
(a) Promoting education to poor and underprivileged children
Promoting education
Gurugram and Jaipur
50.00 50.00 50.00 Through Implementing Agency- Champa Devi Jaipuria Charitable Trust
(b) Promoting employment enhancing vocational skills
Promoting vocational skills
Gurugram and Jaipur
5.00 5.00 5.00 Through Implementing Agency- Mala Jaipuria Foundation
(c) Training to promote nationally recognized sports
Promoting sports
New Delhi 2.50 2.50 2.50 Through Implementing Agency- National Rifle Association of India
annexure–D
annual Report on Corporate Social Responsibility (CSR) activities for the Financial Year 2019
Varun Beverages Limited42

STATUTORY REPORTS
6. In case the Company has failed to spend the two percent of the average net profit of last three financial years
or any part thereof, the Company shall provide the reasons for not spending the amount in its Board report.
Not applicable.
7. A responsibility statement of the CSR Committee that the implementation and monitoring of CSR Policy, is in
compliance with CSR objectives and Policy of the Company.
“The implementation and monitoring of CSR Policy, is in compliance with CSR objectives and Policy of the
Company.”
For and on behalf of the Board of Directors
For Varun Beverages Limited
Place: GurugramDate: February 7, 2020
Raj GandhiWhole-time Director
DIN: 00003649
Ravi JaipuriaChairman - CSR Committee
DIN: 00003668
CORPORATE OVERVIEW FINANCIAL STATEMENTS
Annual Report 2019 43

The details of conservation of energy, technology absorption, foreign exchange earnings and outgo are as follows:
(a) Conservation of energy
(i) Steps taken or impact on conservation of energy
A multi-pronged approach is deployed in plants as well as products to infuse the concept of energy conservation. Some of the energy conservation measures adopted across the manufacturing units were:1. Use of frequency drive in ammonia and air compressor which saves
electric energy.2. Heat recovery from hot compressed gases and used for heating water.3. Recovery of treated hot water from three stage syrup transfer PHE.4. Beverage filling at ambient temperature leading to huge power savings in
refrigeration.5. Replacement of CFL/FTL lamps with LED lamps.6. Replacement of low efficiency pump with high energy efficient pump.7. Improving efficiency on critical resources like water and energy by doing
water recoveries and optimizing energy consumption.8. Optimizing the resource consumptions and minimizing wastages by
automations and controls.
(ii) Steps taken by the Company for utilizing alternate sources of energy
The Company has successfully utilized the environment friendly fuels like biomass for steam generation and installed solar panels in the plant for generating clean energy.
(iii) Capital investment on energy conservation equipments
1. Installation and commissioning of Solar Plant at Nuh and Greater Noida Plants.
2. Air recovery system in Blow Moulding Machine.3. Filling machines which are capable of filling beverage at ambient
temperature with high speed running.4. Green Oven for Bottle Blowing machine which consumes less energy as
compare to the traditional ones.5. High energy efficient pumps.6. Steam condensate recovery system in all the units.
(b) Technology absorption
(i) Efforts made towards technology absorption
The Company has been continuously improving on resource use efficiencies, especially that of common resources such as water, fuel and energy. The Company follows series of environment performance indicators for monitoring natural resources consumption on per case basis and continual improvement is being achieved and sustained.
(ii) Benefits derived like product improvement, cost reduction, product development or import substitution
Over the past ten years, Company has reduced water usage around 10% on per case basis and significant reduction of energy consumption on per case basis. Some of the factories have also received the Green Factory certification from Indian Green Building Council (IGBC), Gold rating. Our Company also achieved significant reduction in weight of closure (from 1880 long height closure to 1881 short height closure) and preforms over years. This is implemented across all units resulting in to saving of resin consumption. Usage of nitrogen in packaged drinking water enables unit to reduce 10% of package weight.
annexure–E
Conservation of Energy, Technology absorption and Foreign Exchange Earnings and Outgo required under the Companies (accounts) Rules, 2014
Varun Beverages Limited44

STATUTORY REPORTS
(iii) In case of imported technology (imported during the last three years reckoned from the beginning of the financial year)-
There is no imported technology involved in the operation of the Company.
(a) Details of technology imported
N.A.
(b) The year of import N.A.
(c) Whether the technology been fully absorbed
N.A.
(d) If not fully absorbed, areas where absorption has not taken place, and the reasons thereof
N.A.
(iv) Expenditure incurred on Research and Development
Due to the nature of its business, the Company need not to initiate specific research and development activities.
(c) Foreign Exchange Earnings & Outgo
(` in million)
Sl. No. Particulars as at December 31, 2019 as at December 31, 2018
(i) Earnings in Foreign Currency 926.33 1,607.09
(ii) Expenditure in Foreign Currency 4,110.66 3,171.75
For and on behalf of the Board of Directors
For Varun Beverages Limited
Ravi JaipuriaDate: February 7, 2020 ChairmanPlace: Gurugram DIN: 00003668
CORPORATE OVERVIEW FINANCIAL STATEMENTS
Annual Report 2019 45

To comply with Regulation 34 read with Schedule V
of the Securities and Exchange Board of India (Listing
Obligations and Disclosure Requirements) Regulations,
2015 [‘SEBI (LODR) Regulations’], the report containing
the details of Corporate Governance of Varun Beverages
Limited (‘the Company’/ ‘VBL’) is as follows:
Company’s Philosophy on Corporate Governance
Corporate Governance is creation and enhancing long
term sustainable value for the stakeholders through
ethically driven business process. At VBL, it is imperative
that your Company affairs are being managed in a fair
and transparent manner.
Corporate Governance is all about maintaining a valuable
relationship and trust with all stakeholders. We consider
stakeholders as partners in our success and we remain
committed towards maximizing stakeholders’ value, be it
shareholders, employees, suppliers, customers, investors,
communities or policy makers. This approach to value
creation emanates from our belief that sound governance
system, based on relationship and trust, is integral to
creating enduring value for all. We have a code of conduct
for ethical conduct of business.
We believe, Corporate Governance is not just a
destination, but a journey to constantly improve
sustainable value creation. It is an upward-moving target
that we collectively strive towards achieving. Our multiple
initiatives towards maintaining the highest standards of
governance are detailed in the following pages.
The Corporate Governance framework of the Company is
based on the following broad practices:
(a) Engaging a diverse and highly professional,
experienced and competent Board of Directors, with
versatile expertise in industry, finance, management
and law.
(b) Deploying well defined governance structures that
establishes checks and balances and delegates
decision making to appropriate levels in the
organization.
(c) Adoption and implementation of fair, transparent and
robust systems, processes, policies and procedures.
(d) Making high levels of disclosures for dissemination
of corporate, financial and operational information
to all its stakeholders.
(e) Having strong systems and processes to ensure full
and timely compliance with all legal and regulatory
requirements and zero tolerance for non-compliance.
Best Corporate Governance practices
VBL maintains the highest standards of Corporate
Governance. It is the Company’s constant endeavour to
adopt the best Corporate Governance practices keeping
in view the international codes of Corporate Governance
and practices of well-known global companies. Some of
the best implemented global governance norms include
the following:
All securities related filings with Stock Exchanges
and SEBI are reviewed by the Company’s Board of
Directors.
The Company has following Board Committees:
Audit, Risk Management and Ethics Committee,
Stakeholders’ Relationship Committee, Nomination
and Remuneration Committee, Corporate Social
Responsibility Committee, Share Allotment
Committee, QIP Committee and Investment and
Borrowing Committee.
The Company also undergoes secretarial audit
conducted by an independent firm of Practicing
Company Secretaries. The Secretarial Audit Report
is placed before the Board and forms part of the
Annual Report.
Observance and adherence of all applicable Laws
including Secretarial Standards issued by the
Institute of Company Secretaries of India.
Governance Policies
At VBL, we strive to conduct our business and strengthen
our relationships in a manner that is dignified, distinctive
and responsible. We adhere to ethical standards to
ensure integrity, transparency, independence and
accountability in dealing with all stakeholders. Therefore,
we have adopted various codes and policies to carry out
our duties in an ethical manner. Some of the codes and
policies are as follows:
Code of Conduct for Board of Directors and Senior
Management;
Code of Conduct for Prohibition of Insider Trading;
Code of practices and procedures for fair disclosure
of Unpublished Price Sensitive Information;
Policy on Related Party Transactions;
Corporate Social Responsibility Policy;
Policy for Determination of Material Subsidiary and
Governance of Subsidiaries;
Policy for Determination of Materiality of Events /
Information;
Annexure - F
Corporate Governance Report
Varun Beverages Limited46

STATUTORY REPORTS
Remuneration Policy for Directors, Key Managerial
Personnel, Members of Senior Management and
other Employees of the Company;
Familiarization Programme for Independent
Directors;
Vigil Mechanism/Whistle Blower Policy;
Policy for Preservation of Documents;
Policy on Diversity of the Board of Directors;
Risk Management Policy;
Dividend Distribution Policy;
Archival Policy;
Guidelines for Acquisition in India;
EHS (Environment, Health and Safety) Policy;
Anti-bribery Policy; and
Policy on Prevention, Prohibition and Redressal of
Sexual Harassment at Workplace
Board of Directors
As at December 31, 2019, 5 (Five) out of 10 (Ten) Directors
on the Board were Independent Directors. At VBL, it is
our belief that an enlightened Board consciously creates
a culture of leadership to provide a long-term vision and
policy approach to improve the quality of governance.
The Board’s actions and decisions are aligned with the
Company’s best interests. The Board critically evaluates
the Company’s strategic direction, management policies
and their effectiveness.
Size and composition of the Board of Directors as at
December 31, 2019 is given below:
Category Name of Directors
Non-executive
Chairman
Mr. Ravi Jaipuria*
Executive / Whole-
time Directors
Mr. Varun Jaipuria*
Mr. Raj Gandhi
Mr. Kapil Agarwal
Mr. Rajinder Jeet Singh Bagga
Non-executive,
Independent
Directors
Dr. Naresh Trehan
Dr. Ravi Gupta
Mr. Pradeep Sardana
Ms. Rashmi Dhariwal
Ms. Sita Khosla*Mr. Ravi Jaipuria and Mr. Varun Jaipuria are Promoters of the Company
Inter-se Relationship among DirectorsExcept Mr. Ravi Jaipuria and Mr. Varun Jaipuria, none of
the Director is a relative of other Director(s). Mr. Varun
Jaipuria is the son of Mr. Ravi Jaipuria, Non-executive
Chairman of the Company.
Core Skills / Expertise / Competencies available with the BoardThe Board comprises qualified Members who possess
required skills, expertise and competencies that allow
them to make effective contributions to the Board and
its Committees.
The following skills / expertise / competencies have been
identified for the effective functioning of the Company
and are currently available with the Board:
Leadership / Operations
Strategic Planning
Industry Experience, Technical, Research &
Development and Innovation
Global Business
Finance & Legal
Corporate Governance, Compliance & Risk
Management
Selection of Independent Directors
Considering the requirement of skill sets on the Board,
eminent people having an independent standing
in their respective field / profession and who can
effectively contribute to the Company’s business and
policy decisions are considered by the Nomination
and Remuneration Committee, for appointment, as an
Independent Director on the Board. The Committee,
inter-alia, considers criteria as prescribed under the
Companies Act, 2013 (‘the Act’) and SEBI (LODR)
Regulations, positive attributes, area of expertise,
number of Directorships and memberships held in
various committees of other companies by such persons
in accordance with the Company’s Policy. The Board
considers the Committee’s recommendation and takes
appropriate decision.
A statement, in connection with fulfilling the criteria
of Independence and directorships as required under
the provisions of the Act and SEBI (LODR) Regulations
received from each of Independent Directors, is disclosed
in the Board’s Report. Your Company had also issued
formal appointment letters to all the Independent
Directors in the manner provided under the Act. Terms
and Conditions for appointment of Independent Directors
are available on website of the Company at http://
varunpepsi.com/wp-content/uploads/2018/05/Terms-
and-conditions-of-appointment-of-the-Independent-
Directors-Revised-March-19-2018.pdf.
In the opinion of the Board, the Independent Directors
fulfill the conditions as specified in SEBI (LODR)
Regulations and are Independent of the management.
Independent Directors’ Induction and Familiarization
The provision of an appropriate induction programme for
new Directors and ongoing training for existing Directors
is a major contributor in maintaining the high Corporate
CORPORATE OVERVIEW FINANCIAL STATEMENTS
Annual Report 2019 47

Governance standards of the Company. The Whole-time
Directors and the Company Secretary are jointly responsible
for ensuring such induction and training programmes are
provided to the Directors. The management provides such
information and training either at the meeting of Board of
Directors or otherwise. The details of such familiarization
programme for Independent Directors are posted on
website of the Company at http://varunpepsi.com/wp-
content/uploads/2016/12/Familiarisation-Programme-
For-Independent-Directors.pdf.
Board Evaluation
The Board of Directors of the Company ensures formation
and monitoring of robust evaluation framework of the
Individual Directors including Chairman of the Board,
Board as a whole and various Committees thereof and
carries out the evaluation of the Board, the Committees
of the Board and Individual Directors, including the
Chairman of the Board on annual basis.
Board Evaluation for the Financial Year ended December
31, 2019 has been completed by the Company internally
which included the evaluation of the performance of the
Board as a whole, Board Committees and Directors and
results of the same were shared with the Board.
Internal Audit
As recommended by the Audit, Risk Management and
Ethics Committee, the Board of Directors in their meeting
held on February 20, 2019 re-appointed M/s O. P. Bagla
& Co., LLP, Chartered Accountants as an Internal Auditor
of the Company for the Financial Year 2019 to conduct
internal audit of the Company and their report on findings
is submitted to the Audit, Risk Management and Ethics
Committee on a quarterly basis.
Separate Meeting of Independent Directors
To comply with the provisions of Schedule IV of the Act
read with Regulation 25 of SEBI (LODR) Regulations, the
Independent Directors met once during the Financial
Year 2019, without the presence of Non-Independent
Directors and members of the management team and
inter-alia reviewed:
The performance of Non-Independent Directors and
the Board as a whole;
The performance of the Chairman of the Company,
taking into account the views of Executive Directors
and Non-executive Directors; and
The quality, quantity and timeliness of flow of
information between the Company management
and the Board that is necessary for the Board to
effectively and reasonably perform their duties.
In addition to formal meetings, interactions also took
place between the Chairman and Independent Directors.
Board Meetings, Board Committee Meetings and Procedure
The Board is the apex body constituted by shareholders
for overseeing the Company’s overall functioning. The
Board provides and evaluates the Company’s strategic
direction, management policies and their effectiveness
and ensures that shareholders’ long term interests are
being served.
As at the end of the year under review, the Board has
7 (Seven) Committees, namely Audit, Risk Management
and Ethics Committee, Stakeholders’ Relationship
Committee, Nomination and Remuneration Committee,
Corporate Social Responsibility Committee, Share
Allotment Committee, QIP Committee and Investment
and Borrowing Committee.
The Company’s internal guidelines for Board/Board
Committee meetings facilitate the decision making
process at its meetings in an informed and efficient
manner.
Board Meetings
The Board meets at regular intervals to discuss and
decide on Company / business policies and strategies
apart from other regular business matters. The Board/
Committee Meetings are pre-scheduled and a tentative
annual calendar of the Board and Committee Meetings
is circulated to all Directors well in advance to facilitate
them to plan their schedule and to ensure meaningful
participation in the meetings. The Board is updated on
the discussions held at the Committee meetings and the
recommendations made by various Committees.
The agenda of the Board/Committee Meetings is set
by the Chief Risk Officer & Group Company Secretary
in consultation with the Whole-time Director and the
Chairman of the Company. The agenda is generally
circulated a week prior to the date of the meeting and
includes detailed notes on items to be discussed at the
meeting to enable the Directors to take an informed
decision. However, in case of urgency, the agenda
is circulated along with shorter notice as per the
provisions of the Secretarial Standard on Meetings of
the Board of Directors. Usually meetings of the Board
are held at the Corporate Office of the Company at
Gurugram.
Board meets at least once in a quarter to review inter-alia
the quarterly results, compliances and performance of the
Company. Additional meetings are held on a need basis.
Varun Beverages Limited48

STATUTORY REPORTS
The Company also provides facility to the Directors to
attend meetings of the Board and its Committees through
Video/Tele Conferencing mode.
9 (Nine) Board meetings were held during the Financial
Year 2019 on February 7, 2019, February 18, 2019,
February 20, 2019, February 26, 2019, May 2, 2019, May
9, 2019, June 17, 2019, August 1, 2019 and November 4,
2019. The gap between two Board meetings was within
the limit prescribed under Section 173(1) of the Act and
Regulation 17(2) of the SEBI (LODR) Regulations.
Board Business
The business of the Board inter-alia includes:
Framing and overseeing progress of the Company’s
annual plan and operating framework.
Framing strategies for direction of the Company and
for corporate resource allocation.
Reviewing financial plans of the Company.
Reviewing the quarterly and annual financial results
of the Company.
Reviewing the Annual Report including Audited
Annual Financial Statements for adoption by the
Members.
Reviewing progress of various functions and
business of the Company.
Reviewing the functioning of the Board and its
Committees.
Reviewing the functioning of subsidiary companies.
Considering/approving the declaration/recommendation
of dividend.
Reviewing and resolving fatal or serious accidents
or dangerous occurrences, any material significant
effluent or pollution problems or significant labour
issues, if any.
Reviewing the details of significant development in
human resources and industrial relations front.
Reviewing details of foreign exchange exposure and
steps taken by the management to limit the risks of
adverse exchange rate movement.
Reviewing compliance with all relevant legislations
and regulations and litigation status, including
materiality, important show cause, demand,
prosecution and penalty notices, if any.
Advising on corporate restructuring such as merger,
acquisition, joint venture or disposals, if any.
Appointing Directors on the Board and Key
Managerial Personnel, if any.
Reviewing various policies of the Company and
monitoring implementation thereof.
Reviewing details of risk evaluation and internal
controls.
Reviewing reports on progress made on the ongoing
projects.
Monitoring and reviewing Board evaluation
framework.
Board Support
The Chief Risk Officer & Group Company Secretary is
responsible for collation, review and distribution of all
papers submitted to the Board and Committees thereof
for consideration. He is also responsible for preparation
of Agenda in consultation with the Whole-time Director
and the Chairman of the Company and convening of
Board and Committee Meetings. The Chief Risk Officer &
Group Company Secretary attend all the meetings of the
Board and its Committees, advises and assures the Board
on Compliance and Governance principles.
Recording Minutes of proceedings of Board and Committee meetings
The Chief Risk Officer & Group Company Secretary ensures
appropriate recording of minutes of proceedings of each
Board and Committee meeting. The minutes are entered in
the Minutes Book within 30 (Thirty) days from the date of
conclusion of the meetings as per the Secretarial Standards
issued by the Institute of Company Secretaries of India.
Post meeting follow-up mechanism
The guidelines for Board and Committee meetings
facilitate an effective post meeting follow-up, review and
reporting process for decisions taken by the Board and
Committees thereof. Important decisions taken at Board/
Committee meetings are communicated promptly to the
concerned departments/divisions. Action-taken report
(if any) on decisions/minutes of the previous meeting(s)
is placed at the succeeding meeting of the Board/
Committees for noting.
CORPORATE OVERVIEW FINANCIAL STATEMENTS
Annual Report 2019 49

Attendance of Directors at Board Meetings, last Annual General Meeting (AGM) and number of other Directorships and Chairmanships / Memberships of Committees and Shareholdings of each Director in the Company:
Name and DIN Category &
Designation
Attendance in
Financial Year 2019
Number of
Directorships in
other Companies
as on December 31,
2019
Committee
Membership and
Chairmanship in other
Companies## as on
December 31, 2019
Shareholding
in the
Company as
on December
31, 2019
Board
Meetings
AGM Private $ Public Chairman-
ship
Member-
ship
Mr. Ravi Jaipuria
(00003668)
Promoter
(Non-executive
Chairman)
9/9 Yes 4 9 Nil Nil Nil
Mr. Varun Jaipuria
(02465412)
Promoter &
Whole-time
Director
(Executive
Director)
8/9 Yes 2 4 Nil Nil 50,663,250
Mr. Raj Gandhi
(00003649)
Whole-time
Director (Executive
Director)
9/9 Yes 1 8 Nil 3 611,250
Mr. Kapil Agarwal
(02079161)
Whole-time
Director & Chief
Executive Officer
(Executive
Director)
8/9 Yes Nil Nil Nil Nil 410,464
Mr. Rajinder Jeet
Singh Bagga
(08440479)*
Whole-time
Director (Executive
Director)
3/4 NA Nil Nil Nil Nil 129,750
Dr. Naresh Trehan
(00012148)
Non-executive
& Independent
Director
7/9 No 9 1 Nil Nil Nil
Dr. Ravi Gupta
(00023487)
Non-executive
& Independent
Director
8/9 Yes 12 3 Nil 1 Nil
Mr. Pradeep
Sardana
(00682961)
Non-executive
& Independent
Director
8/9 Yes Nil Nil Nil Nil 1,287
Ms. Rashmi
Dhariwal
(00337814)
Non-executive
& Independent
Director
8/9 Yes 5 4 1 3 Nil
Ms. Sita Khosla
(01001803)
Non-executive
& Independent
Director
9/9 Yes Nil Nil Nil Nil Nil
Mr. Kamlesh
Kumar Jain#
(01822576)
Whole-time Director
& Chief Financial
Officer (Executive
Director)
8/8 Yes 6 2 Nil Nil 25,635
* Appointed with effect from May 2, 2019.# Resigned from the position of Whole-time Director & Chief Financial Officer with effect from August 1, 2019.## Includes only Audit Committee and Stakeholders’ Relationship Committee in all public limited companies (whether listed or not)
and excludes private limited companies, foreign companies and Section 8 companies.$ Does not include Directorship in foreign companies.
Note: Video/Tele-conferencing facility is offered to facilitate Directors to participate in the meetings.
Varun Beverages Limited50

STATUTORY REPORTS
Pursuant to Part C of Schedule V of the SEBI (LODR)
Regulations, details of Directorship in other listed entity
and category of Directorship as on December 31, 2019,
are mentioned below:
Sl.
No.
Name of
Director
Company Category of
Directorship
1. Mr. Ravi
Jaipuria
Lemon Tree
Hotels Limited
Non-executive
Director
Committees of the Board
The Board Committees play a vital role in strengthening
the Corporate Governance practices. The Board
Committees are set up under formal approval of the Board
to carry out clearly defined roles which are considered
to be performed by Members of the Board as a part of
good governance practice. The Board supervise the
execution of responsibilities by the Committee. Minutes
of the proceedings of all the Committee meetings are
placed before the Board to take note of the same. The
Board Committees may request special invitees to join
the meeting, as appropriate.
As required under Schedule V (Annual Report) of the SEBI
(LODR) Regulations, mandatory disclosure(s) related
to the Audit, Risk Management and Ethics Committee,
Stakeholders’ Relationship Committee and Nomination
and Remuneration Committee are as follows:
(i) Audit, Risk Management and Ethics Committee
During the year under review, your Company
has renamed its Audit and Risk Management
Committee as Audit, Risk Management and Ethics
Committee.
The terms of reference and composition of the Audit,
Risk Management and Ethics Committee satisfy the
requirements of Section 177 of the Act read with
the Companies (Meetings of Board and its Powers)
Rules, 2014 and Regulations 18 and 21 of the SEBI
(LODR) Regulations.
The brief terms of reference of Audit, Risk
Management and Ethics Committee are as under:
Oversight of the Company’s financial reporting
process, examination of the financial statement
and the auditors’ report thereon and the
disclosure of its financial information to ensure
that its financial statements are correct,
sufficient and credible.
Recommendation for appointment, reappointment
and replacement, remuneration and terms of
appointment of auditors of the Company and
approval of payment for any other services
rendered by the statutory auditors of the Company.
Reviewing with the Management the quarterly
/ annual results and annual financial statements
and Auditors’ Report thereon before submission
to the Board for approval. This would, inter-alia,
include reviewing changes in the accounting
policies and reasons for the same, major
accounting entries involving estimates based on
exercise of judgment by Management, significant
adjustments made in the financial statements.
Review the Management’s Discussion and
Analysis of financial condition and results of
operations.
Scrutiny of inter-corporate loans and
investments.
Evaluation of internal financial controls and risk
management systems.
Reviewing the functioning of the whistle blower
/ vigil mechanism.
Evaluate and review the risk management
plan, the risk management system, including
risk policy, risk process (risk identification,
assessment, mitigation and monitoring), cyber
security processes and risk registers laid down
by the Management.
The Audit, Risk Management and Ethics Committee
met 8 (Eight) times during the Financial Year 2019
on February 7, 2019, February 18, 2019, February 20,
2019, May 9, 2019, August 1, 2019, August 26, 2019,
September 9, 2019 and November 4, 2019.
Composition of the Committee and attendance
of the Members at the meetings held during the
Financial Year 2019:
Sl.
No.
Name Category Designation No. of
Meetings
Attended
1. Dr. Ravi
Gupta
Independent
Director
Chairman 8/8
2. Ms.
Rashmi
Dhariwal
Independent
Director
Member 8/8
3. Mr. Raj
Gandhi
Executive
Director
Member 8/8
4. Ms. Sita
Khosla*
Independent
Director
Member 1/1
*Appointed as member of the Committee with effect from October 30, 2019.
Note: Video/Tele-conferencing facility is offered to facilitate Directors to participate in the meetings.
CORPORATE OVERVIEW FINANCIAL STATEMENTS
Annual Report 2019 51

The Chief Risk Officer & Group Company Secretary
acts as the Secretary to the Committee.
The Chairman of the Audit, Risk Management and
Ethics Committee was present at the last AGM held
on April 17, 2019.
(ii) Stakeholders’ Relationship Committee
The terms of reference and composition of the
Stakeholders’ Relationship Committee satisfy the
requirements of Section 178 of the Act and Regulation
20 of SEBI (LODR) Regulations.
The objective of the Stakeholders’ Relationship
Committee is to consider and resolve the grievances
of security holders of the Company including but
not limited to complaints related to transfer of
shares, non-receipt of annual report, non-receipt of
declared dividends and review of services rendered
by the Registrar and Share Transfer Agent.
The Stakeholders’ Relationship Committee met
4 (Four) times during the Financial Year 2019 on
January 18, 2019, January 31, 2019, February 7, 2019
and May 14, 2019.
Composition of the Committee and attendance
of the Members at the meetings held during the
Financial Year 2019:
Sl.
No.
Name Category Designation No. of
Meetings
Attended
1. Ms. Sita
Khosla
Independent
Director
Chairperson 3/4
2. Mr. Raj
Gandhi
Executive
Director
Member 4/4
3. Mr.
Kamlesh
Kumar
Jain*
Executive
Director
Member 4/4
4. Ms.
Rashmi
Dhariwal**
Independent
Director
Member 1/1
* Resigned from the position of Whole-time Director & Chief Financial Officer and accordingly ceased to be member of the committee with effect from August 1, 2019.
**Appointed with effect from February 7, 2019.
Note: Video/Tele-conferencing facility is offered to facilitate Directors to participate in the meetings.
The Chief Risk Officer & Group Company Secretary
acts as the Secretary to the Committee and also
designated as a Compliance Officer of the Company.
The Chairperson of the Stakeholders’ Relationship
Committee was present at the last AGM held on April
17, 2019.
Investor Grievances / Complaints
The details of the Investor Complaints received and
resolved during the Financial Year ended December 31,
2019 are as follows:
Opening
Balance
Received Resolved Closing
0 209 209 0
All the complaints received during the Financial Year 2019
were resolved to the satisfaction of shareholders.
To enable investors to share their grievance or
concern, Company has set up a dedicated e-mail ID-
(iii) Nomination and Remuneration Committee
The terms of reference and composition of the
Nomination and Remuneration Committee satisfy the
requirements of Section 178 of the Act and Regulation
19 of SEBI (LODR) Regulations and SEBI (Share Based
Employee Benefits) Regulations, 2014 as amended
from time to time.
The brief terms of reference of Nomination and
Remuneration Committee are as under:
Formulating the criteria for determining
qualifications, positive attributes and
independence of a director and recommending
to the Board of Directors a policy relating to the
remuneration of the directors, key managerial
personnel and other employees, and for evaluation
of the performance of independent directors and
the Board of Directors;
Devising a policy on diversity of the Board of
Directors;
Identifying persons who are qualified to become
directors and who may be appointed in senior
management in accordance with the criteria laid
down, recommending to the Board of Directors
their appointment and removal, and carrying out
evaluation of every director’s performance;
Determine whether to extend or continue the term
of appointment of the independent directors on
the basis of the report of performance evaluation
of independent directors; and
Framing suitable policies and systems to ensure
that there is no violation by an employee as well
as by the Company of any applicable laws in India
or overseas, including:
(i) The Securities and Exchange Board of India
(Prohibition of Insider Trading) Regulations,
2015; and
(ii) The Securities and Exchange Board of India
(Prohibition of Fraudulent and Unfair Trade
Practices relating to the Securities Market)
Regulations, 2003.
Varun Beverages Limited52

STATUTORY REPORTS
The Nomination and Remuneration Committee met 3
(Three) times during the Financial Year 2019 on February
20, 2019, May 2, 2019 and August 1, 2019.
Composition of the Committee and attendance of the
Members at the meetings held during the Financial
Year 2019:
Sl.
No.
Name Category Designation No. of
Meetings
Attended
1. Ms. Rashmi
Dhariwal
Independent
Director
Chairperson 3/3
2. Mr. Ravi
Jaipuria
Non-
Executive
Chairman
Member 3/3
3. Dr. Ravi
Gupta
Independent
Director
Member 3/3
Note: Video/Tele-conferencing facility is offered to facilitate
Directors to participate in the meetings.
The Chief Risk Officer & Group Company Secretary acts
as the Secretary to the Committee.
The Chairperson of the Nomination and Remuneration
Committee was present at the last AGM held on April
17, 2019.
Performance evaluation criteria for Independent Directors
The Nomination and Remuneration policy of the Company
lays down the criteria of appointment and remuneration
of Directors/Key Managerial Personnel including
criteria for determining qualification, positive attributes,
independence of Directors, criteria for performance
evaluation of Executive and Non-executive Directors
(including Independent Directors) and other matters as
prescribed under the provisions of the Act and the SEBI
(LODR) Regulations. An indicative list of factors that may
be evaluated including but not limited to participation
and contribution by a Director, commitment, effective
deployment of knowledge and expertise, effective
management of relationship with stakeholders, integrity
and maintenance of confidentiality and independence of
behaviour and judgment.
Remuneration of Directors
Details of remuneration paid to Directors of the Company for the Financial Year ended December 31, 2019 are
as follows:
(` in million)
Sl.
No.
Name Sitting Fee Salary Perquisite Bonus /
Incentive
Total
1. Mr. Varun Jaipuria - 31.22 0.04 0.23 31.49
2. Mr. Raj Gandhi - 38.51 0.04 10.00 48.55
3. Mr. Kapil Agarwal - 57.12 0.03 - 57.15
4. Mr. Rajinder Jeet Singh Bagga# - 18.44 0.04 - 18.48
5. Dr. Ravi Gupta 1.90 - - - 1.90
6. Mr. Pradeep Sardana 0.80 - - - 0.80
7. Ms. Rashmi Dhariwal 3.00 - - - 3.00
8. Ms. Sita Khosla 1.90 - - - 1.90
9. Mr. Kamlesh Kumar Jain* - 9.89 - - 9.89
# Appointed with effect from May 2, 2019.
* Resigned from the position of Whole-time Director & Chief Financial Officer with effect from August 1, 2019.
Since all the stock options have been vested and
exercised accordingly during the year under review,
no options have been exercised by any Director of the
Company under Employee Stock Option Scheme – 2013.
The details of specific service contracts, notice period
and severance fees etc. are governed by the appointment
letter issued to respective Director at the time of his / her
appointment.
Criteria of making payments to Non-executive Directors including all pecuniary relationship or transactions of Non-executive Directors
The Independent Directors are not paid any remuneration
other than the sitting fee for attending meetings of the Board
and the Committees thereof as approved by the Board.
There has been no pecuniary relationship or transactions of
the Non-executive Directors vis-à-vis the Company during
the year except the sitting fee paid to them as detailed above.
CORPORATE OVERVIEW FINANCIAL STATEMENTS
Annual Report 2019 53
Prohibition of Insider Trading
To comply with the provisions of Regulation 9 of the
Securities and Exchange Board of India (Prohibition of
Insider Trading) Regulations, 2015, the Company has
adopted a Code of Conduct for Prohibition of Insider Trading
and the same is uploaded on website of the Company at
https://varunpepsi.com/wp-content/uploads/2020/01/
Code-of-Conduct-for-Prohibition-of-Insider-Trading.pdf.
Vigil Mechanism / Whistle Blower Policy
To comply with the provisions of Section 177 of the
Act and Regulation 22 of SEBI (LODR) Regulations, the
Company has adopted a Vigil Mechanism / Whistle Blower
Policy for Directors and employees of the Company.
Under the Vigil Mechanism Policy, the protected
disclosures can be made by a victim through an e-mail
or a letter to the Chief Risk Officer & Group Company
Secretary (Vigilance Officer) or to the Chairperson of the
Audit, Risk Management and Ethics Committee.
The Policy provides for adequate safeguards against
victimization of employees and Directors who avail of
the vigil mechanism and also provides a direct access to
the Vigilance Officer or the Chairperson of the Audit, Risk
Management and Ethics Committee, in exceptional cases.
No personnel of the Company has been denied access to
the Audit, Risk Management and Ethics Committee.
The main objective of this policy is to provide a platform
to Directors and employees to raise concerns regarding
any irregularity, misconduct or unethical matters / dealings
within the Company which may have a negative bearing on
the organization either financially or otherwise.
This policy provides an additional channel to the normal
management hierarchy for employees to raise concerns
about any breach of the Company’s values or instances of
violations of the Company’s Code of Conduct. Therefore,
it is in line with the Company’s commitment to open
communication and to highlight any such matters which
may not be getting addressed in a proper manner. During
the year under review, 6 (Six) complaints were received
and disposed off under the Whistle Blower Policy.
Compliance with the Code of Conduct
To comply with the provisions of Regulation 17(5) of SEBI
(LODR) Regulations, the Company has adopted “Code of
Conduct for Board of Directors and Senior Management”
(Code). Code is available on website of the Company at
https://varunpepsi.com/wp-content/uploads/2019/03/
Code-Of-Conduct-For-Board-Of-Directors-and-Senior-
Management-Revised.pdf.
On the basis of declarations received from Board Members
and Senior Management Personnel, the Whole-time Director
& Chief Executive Officer has given a declaration that the
Members of the Board of Directors and Senior Management
Personnel have affirmed compliance with the Code during
the Financial Year 2019. A copy of such declaration is also
attached with this report.
General Body Meetings
Annual General MeetingThe Annual General Meetings (‘AGM’) of the Company during the preceding three years were held at the following
venues, dates and times, wherein the following special resolutions were passed:
AGM Financial Year
Day, Date & Time
Venue Brief description of Special Resolutions
24th 2018 Wednesday, April 17, 2019 at 11:00 a.m.
PHD Chamber of Commerce and Industry, 4/2, Siri Institutional Area, August Kranti Marg, New Delhi - 110 016
Re-appointment of Dr. Naresh Trehan as an Independent Director.
Raising of Capital through Qualified Institutions Placement (QIP).
23rd 2017 Tuesday, April 17, 2018 at 11:00 a.m.
PHD Chamber of Commerce and Industry, 4/2, Siri Institutional Area, August Kranti Marg, New Delhi - 110 016
Re-appointment of Mr. Pradeep Sardana as an Independent Director.
Ratification of Re-appointment of Ms. Geeta Kapoor as an Independent Director.
Ratification of Re-appointment of Mr. Sanjoy Mukerji as an Independent Director.
Alteration of Memorandum of Association of the Company for aligning the same as per Table- A of the Companies Act, 2013.
Alteration of Articles of Association of the Company for aligning the same as per the provisions of the Companies Act, 2013.
22nd 2016 Monday, April 17, 2017 at 11.00 a.m.
Sri Sathya Sai International Center, Pragati Vihar, Bhishm Pitamah Marg, Lodhi Road, New Delhi -110 003
Ratification of Employee Stock Option Scheme (ESOS) 2013 & ESOS 2016.
Approval for issuance of Non-Convertible Debentures of ` 10,000,000,000 on Private Placement Basis.
Varun Beverages Limited54

STATUTORY REPORTS
Extra-ordinary General Meeting
Apart from the Annual General Meeting, no other General
Meeting was held during the Financial Year 2019.
Postal Ballot
Pursuant to Regulation 44 of SEBI (LODR) Regulations
and Sections 108, 110 and other applicable provisions of
the Act read with Rules made thereunder, during the year
under review, Members of the Company approved the
issue of Bonus Shares by way of postal ballot.
Procedure followed for postal ballot
1. In compliance with Regulation 44 of the SEBI (LODR)
Regulations and Sections 108, 110 and other applicable
provisions of the Act read with the Rules made
thereunder, the Company provided electronic voting
facility to all its Members, to enable them to cast their
votes electronically. Company engaged the services
of KFin Technologies Private Limited (formerly Karvy
Fintech Private Limited) (‘KFin’) for the purpose of
providing e-voting facility. The Members had the
option to vote either by physical ballot or e-voting.
2. Company dispatched the postal ballot notice dated
June 17, 2019 on June 19, 2019 containing draft
resolution together with the explanatory statement,
the postal ballot form and self-addressed envelope to
the Members whose names appeared in the register
of Members / list of beneficiaries as on cut-off date
i.e. Friday, June 14, 2019. The Company also published
notice in the newspapers declaring the details of
completion of dispatch on Thursday, June 20, 2019 as
mandated under the Act and applicable rules.
3. Members desiring to exercise their votes by physical
postal ballot forms were requested to return the forms
duly completed and signed to the Scrutinizer on or
before the close of business hours on Friday, July 19,
2019. Members who opted for e-voting, voted from
09:00 a.m. on Thursday, June 20, 2019 to 05:00 p.m.
on Friday, July 19, 2019.
4. The Scrutinizer Mr. Sanjay Grover, Partner of
M/s. Sanjay Grover & Associates, Company Secretaries,
New Delhi submitted his report on July 20, 2019, after
the completion of scrutiny.
5. The results of the postal ballot were announced by
Mr. Ravi Batra, Chief Risk Officer & Group Company
Secretary on July 20, 2019. The last date specified for
receipt of duly completed Postal Ballot Forms and
closure of e-voting i.e. July 19, 2019, was taken as the
date of passing the resolution.
6. The result of the postal ballot along with the
scrutinizer’s report was displayed at the registered
office of the Company, hosted at the Company’s
website at www.varunpepsi.com and on the website
of KFin at https://evoting.karvy.com and was also
communicated to the Stock Exchanges.
7. The consolidated summary of the result of postal
ballot / e-voting is as under:
Item Net Valid Votes Polled
(No. of Equity Shares)
Votes with assent for
the Resolution (No. of
Equity Shares and % of
Net Valid Votes)
Votes with dissent for
the Resolution (No. of
Equity Shares and % of
Net Valid Votes)
Ordinary Resolution for issuance
of Bonus Shares
169,903,013 169,902,910 (99.9999%) 103 (0.0001%)
There is no special resolution proposed to be conducted through postal ballot.
Means of Communication
Information like Quarterly / Half Yearly / Annual Financial
Results and press releases on significant developments in
the Company that have been made available from time
to time have been submitted to the Stock Exchanges to
enable them to put on their websites and communicate
to their Members. The same is also made available to
Institutional Investors or to the Analysts, if any and are also
hosted on the Company’s website at www.varunpepsi.com.
The Quarterly / Half Yearly / Annual Financial Results
are published in English and Hindi language newspapers
normally in Business Standard. Moreover, a report on
Management Discussion & Analysis as well as Business
Responsibility Report also forms part of the Annual
Report. The Company is electronically filing all reports
/ information including Quarterly Financial Results,
Shareholding Pattern, and Corporate Governance Report
etc., on NSE website viz. www.nseindia.com and on BSE
website viz. www.bseindia.com.
CORPORATE OVERVIEW FINANCIAL STATEMENTS
Annual Report 2019 55

General Shareholders Information
A) Annual General Meeting
Date: April 10, 2020
Time: 11:00 a.m.
Venue: PHD Chamber of Commerce and Industry, 4/2, Siri Institutional Area, August Kranti Marg,
New Delhi- 110 016
B) Financial Year
The Financial Year of the Company starts from January 1 and ends on December 31 every year.
C) Financial Calendar 2020 (tentative)
First Quarter Results : On or before May 15, 2020
Second Quarter Results : On or before August 14, 2020
Third Quarter Results : On or before November 14, 2020
Audited Annual Results for the year
ending on December 31, 2020 : On or before March 1, 2021
Annual Book Closure : April 3, 2020 to April 10, 2020 (both days inclusive)
D) Dividend and its Payment
During the year under review, the Board of Directors in their meeting held on August 1, 2019 declared an interim
dividend of ` 2.50 per equity share (face value of ` 10/- per equity share) to the eligible equity shareholders of the
Company.
The Company has transferred the unpaid or unclaimed Interim Dividend to the Unclaimed Dividend Account –
Varun Beverages Limited and the details of unpaid and unclaimed dividend amount lying in the said Accounts
(maintained with HDFC Bank Limited for the dividend declared in 2017, Yes Bank Limited for the dividend declared
in 2018 and IndusInd Bank Limited for the dividend declared in 2019) are uploaded on website of the Company at
https://varunpepsi.com/corporate-governance/.
E) Listing of Shares on Stock Exchanges and Stock Code
Sl.
No.
Name and Address of the Stock Exchange Stock code
1.National Stock Exchange of India Limited, Exchange Plaza, Block G, C/1, Bandra Kurla
Complex, Bandra (E), Mumbai – 400 051
VBL
2. BSE Limited, Phiroze Jeejeebhoy Towers, Dalal Street, Mumbai – 400 001 540180
Annual listing fee for the Financial Year 2019-20 has been paid to the BSE Limited and the National Stock Exchange
of India Limited.
F) Listing of Debt Instruments on Stock Exchanges and Codes: N.A.
G) Market Price Data for the period January 1, 2019 to December 31, 2019
Month BSE NSE
High Low Volume (Nos.) High Low Volume (Nos.)
Jan-19 834.95 757.00 71,683 840.00 756.10 1,727,131
Feb-19 848.05 744.95 96,690 848.00 735.05 2,119,211
Varun Beverages Limited56

STATUTORY REPORTS
Month BSE NSE
High Low Volume (Nos.) High Low Volume (Nos.)
Mar-19 878.50 790.10 845,968 877.00 794.50 3,122,848
Apr-19 948.00 815.25 81,324 954.45 812.55 2,695,044
May-19 963.00 878.95 64,613 961.95 875.90 3,247,167
June-19 954.00 796.00 75,307 954.95 792.15 2,089,895
July-19 975.00 601.00 63,318 974.90 592.00 2,135,654
Aug-19 661.00 586.00 79,811 659.95 585.00 3,145,491
Sep-19 660.00 576.25 4,972,428 663.05 575.10 2,760,100
Oct-19 648.00 591.55 64,949 647.85 589.20 4,574,211
Nov-19 788.75 615.00 644,846 789.00 615.00 11,359,634
Dec-19 754.00 682.05 72,393 754.90 681.10 3,225,867 Note: Share prices not adjusted before Bonus Issue allotment on July 29, 2019 in the proportion of 1:2.
Performance in comparison to broad - based indices
Performance on BSE
Comparison of share price of VBL has been made with BSE Sensex.
BSE Sensex VBL BSE
Performance on BSE (Indexed)
160.00
140.00
120.00
100.00
80.00
60.00
40.00
20.00
-
Jan-
19
Feb-
19
Mar
-19
Apr
-19
May
-19
June
-19
July
-19
Aug
-19
Sep-
19
Oct
-19
Nov
-19
Dec
-19
Jan'19 Feb'19 Mar'19 Apr'19 May'19 June'19 July'19 Aug'19 Sep'19 Oct'19 Nov'19 Dec'19
VBL
BSE
104.07 102.17 109.91 111.25 118.66 120.09 122.08 122.18 119.15 118.10 138.97 134.91
BSE
Sensex
100.52 99.44 107.22 108.22 110.11 109.22 103.92 103.51 107.21 111.26 113.10 114.38
CORPORATE OVERVIEW FINANCIAL STATEMENTS
Annual Report 2019 57

Performance on NSE
Comparison of share price of VBL has been made with NSE Nifty.
Performance on NSE (Indexed)
160.00
140.00
120.00
100.00
80.00
60.00
40.00
20.00
-
NSE Nifty VBL NSE
Jan-
19
Feb-
19
Mar
-19
Apr
-19
May
-19
June
-19
July
-19
Aug
-19
Sep-
19
Oct
-19
Nov
-19
Dec
-19
Jan'19 Feb'19 Mar'19 Apr'19 May'19 June'19 July'19 Aug'19 Sep'19 Oct'19 Nov'19 Dec'19
VBL
NSE
104.63 103.15 110.49 111.65 118.94 120.70 122.18 123.58 119.35 118.59 138.30 135.50
NSE
Nifty
99.71 99.36 107.01 108.15 109.76 108.53 102.35 101.48 105.63 109.34 110.99 112.02
H) Registrar and Share Transfer Agent
All the work relating to the shares held in the physical form as well as the shares held in the electronic (demat)
form is being done at one single point and for this purpose SEBI Registered Category 1 Registrar and Share
Transfer Agent (RTA) has been appointed, whose details are given below:
KFin Technologies Private Limited
(formerly Karvy Fintech Private Limited)
Selenium Tower B,
Plot No. 31 and 32, Gachibowli
Financial District, Nanakramguda, Hyderabad 500 032
Tel: +91 40 6716 2222
Fax: +91 40 2342 0814
Email: [email protected]
Website: www.kfintech.com
SEBI Registration No. INR000000221
I) Share Transfer System
As on December 31, 2019 - 288,688,429 (Two Hundred Eighty Eight Million Six Hundred Eighty Eight Thousand
Four Hundred Twenty Nine) equity shares of the Company were in dematerialized form and 291 (Two Hundred
Ninety One) equity shares were held in physical form.
Transfer of Equity Shares in dematerialized form are done through depositories with no involvement of the
Company. With regard to transfer of equity shares in physical form, the Share transfer instruments, received
in physical form, are processed by our RTA, KFin Technologies Private Limited and the share certificates are
dispatched within a period of 15 (Fifteen) days from the date of receipt thereafter subject to the documents
being complete and valid in all respects. Company obtains a half-yearly certificate from a Company Secretary in
Practice in respect of the share transfers as required under Regulation 40(9) of SEBI (LODR) Regulations and files
a copy of the said certificate with the Stock Exchanges.
Varun Beverages Limited58
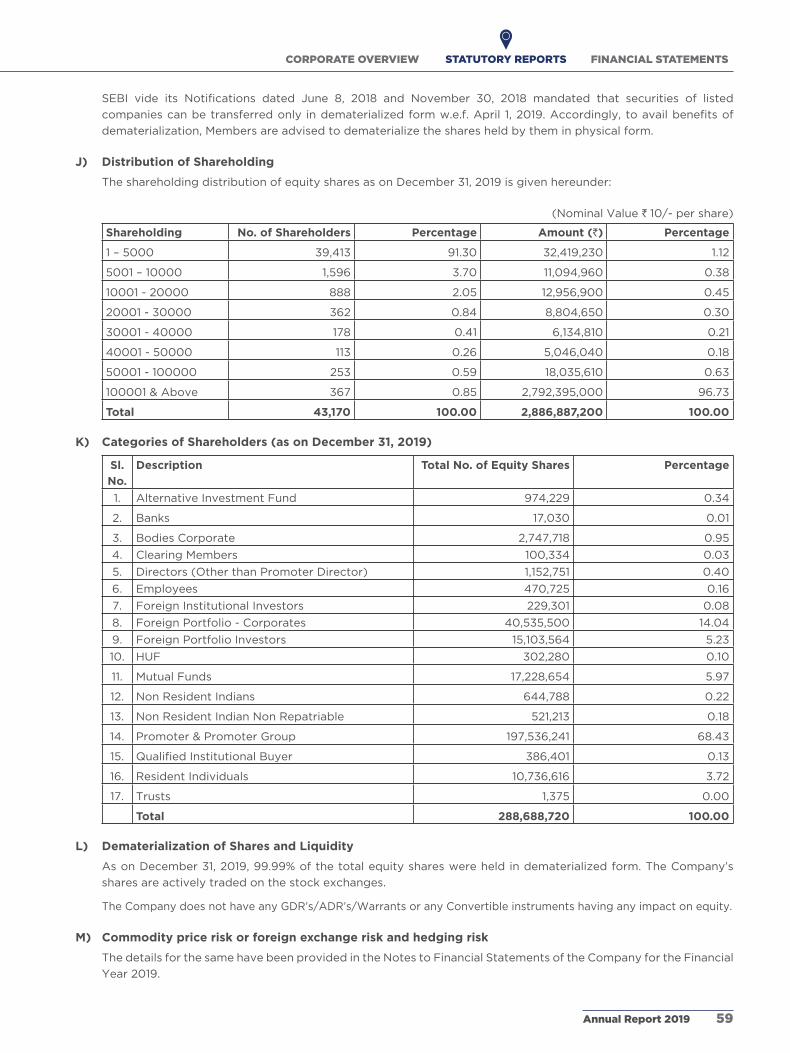
STATUTORY REPORTS
SEBI vide its Notifications dated June 8, 2018 and November 30, 2018 mandated that securities of listed
companies can be transferred only in dematerialized form w.e.f. April 1, 2019. Accordingly, to avail benefits of
dematerialization, Members are advised to dematerialize the shares held by them in physical form.
J) Distribution of Shareholding
The shareholding distribution of equity shares as on December 31, 2019 is given hereunder:
(Nominal Value ` 10/- per share)
Shareholding No. of Shareholders Percentage Amount (`) Percentage
1 – 5000 39,413 91.30 32,419,230 1.12
5001 – 10000 1,596 3.70 11,094,960 0.38
10001 - 20000 888 2.05 12,956,900 0.45
20001 - 30000 362 0.84 8,804,650 0.30
30001 - 40000 178 0.41 6,134,810 0.21
40001 - 50000 113 0.26 5,046,040 0.18
50001 - 100000 253 0.59 18,035,610 0.63
100001 & Above 367 0.85 2,792,395,000 96.73
Total 43,170 100.00 2,886,887,200 100.00
K) Categories of Shareholders (as on December 31, 2019)
Sl.
No.
Description Total No. of Equity Shares Percentage
1. Alternative Investment Fund 974,229 0.34
2. Banks 17,030 0.01
3. Bodies Corporate 2,747,718 0.95
4. Clearing Members 100,334 0.03
5. Directors (Other than Promoter Director) 1,152,751 0.40
6. Employees 470,725 0.16
7. Foreign Institutional Investors 229,301 0.08
8. Foreign Portfolio - Corporates 40,535,500 14.04
9. Foreign Portfolio Investors 15,103,564 5.23
10. HUF 302,280 0.10
11. Mutual Funds 17,228,654 5.97
12. Non Resident Indians 644,788 0.22
13. Non Resident Indian Non Repatriable 521,213 0.18
14. Promoter & Promoter Group 197,536,241 68.43
15. Qualified Institutional Buyer 386,401 0.13
16. Resident Individuals 10,736,616 3.72
17. Trusts 1,375 0.00
Total 288,688,720 100.00
L) Dematerialization of Shares and Liquidity
As on December 31, 2019, 99.99% of the total equity shares were held in dematerialized form. The Company’s
shares are actively traded on the stock exchanges.
The Company does not have any GDR’s/ADR’s/Warrants or any Convertible instruments having any impact on equity.
M) Commodity price risk or foreign exchange risk and hedging risk
The details for the same have been provided in the Notes to Financial Statements of the Company for the Financial
Year 2019.
CORPORATE OVERVIEW FINANCIAL STATEMENTS
Annual Report 2019 59

N) Credit Rating
During the year under review, CRISIL has upgraded
your Company’s credit rating as below:
Long Term Rating CRISIL AA/Stable (Upgraded
from 'CRISIL AA-/Positive')
Short Term Rating CRISIL A1+ (Reaffirmed)
O) Plant locations
The Plant locations have been provided at page no.
7 of the Annual Report.
P) Reconciliation of Share Capital Audit
The Reconciliation of Share Capital Audit is
conducted by a Company Secretary in practice to
reconcile the total admitted capital with National
Securities Depository Limited and Central Depository
Services (India) Limited (‘Depositories’) and the total
issued and listed capital. The audit confirms that the
total issued/paid-up capital is in agreement with the
aggregate of the total number of shares in physical
form and the total number of shares in dematerialized
form (held with Depositories) and that the requests
for dematerialization of shares are processed by the
Registrar and Share Transfer Agent within statutory
period and uploaded with the concerned depositories.
Q) Equity Shares in the Suspense Account
The Company has, in accordance with the
procedure laid down in Schedule VI of SEBI (LODR)
Regulations, opened a dematerialization account
namely, ‘UNCLAIMED SUSPENSE SHARES DEMAT
ACCOUNT – VARUN BEVERAGES LIMITED’. The
details of shares transferred to shareholders out of
this account are given below:
Particulars Number of
shareholders
Number of
equity shares
Aggregate number of shareholders and the outstanding shares in the suspense account lying as on January 1, 2019
Nil Nil
Number of shareholders who approached the Company for transfer of shares from suspense account during the year
Nil Nil
Number of shareholders to whom shares were transferred from suspense account during the year
Nil Nil
Aggregate number of shareholders and the outstanding shares in the suspense account lying as on December 31, 2019
Nil Nil
R) Compliances under SEBI (LODR) Regulations
The Company is regularly complying with the
SEBI (LODR) Regulations as stipulated therein.
Information, certificates and returns as required under
the provisions of SEBI (LODR) Regulations are sent to
the stock exchanges within the prescribed time.
S) CEO and CFO Certification
To comply with Regulation 17(8) of SEBI (LODR)
Regulations, the Whole-time Director & Chief
Executive Officer (CEO) and the Chief Financial
Officer (CFO) of the Company have given Compliance
Certificate stating therein matters prescribed under
Part B of Schedule II of the said regulations which
forms part of this Corporate Governance Report.
To comply with Regulation 33(2)(a) of SEBI (LODR)
Regulations, while placing the Quarterly Financial
Results before the Board of Directors, the CEO
and CFO certifies that the Financial Results do not
contain any false or misleading statement or figures
or do not omit any material fact which may make the
statements or figures contained therein misleading.
T) Certificate from Company Secretory in Practice
regarding Non-disqualification of Directors
None of the Directors on the Board of the
Company have been debarred or disqualified
from appointment or continuing as Directors of
companies by the Securities and Exchange Board of
India, Ministry of Corporate Affairs or any such other
Statutory Authority, as stipulated under Regulation
34 of the SEBI (LODR) Regulations and certificate in
this respect received from an Independent Firm of
Practising Company Secretaries is enclosed.
U) Fees paid to the Statutory Auditors
Total fees for all services paid by the Company and
its subsidiaries, on a consolidated basis, to Statutory
Auditors of the Company and their other associated
firms during the Financial Year ended December 31,
2019, is as follows:
(` in million)
Particulars M/s. Walker
Chandiok & Co. LLP
M/s. APAS
& Co.
Audit Fee 6.80 4.60
Other Services 3.25 2.69
Reimbursement of
expenses
0.70 0.01
Total 10.75 7.30
Varun Beverages Limited60

STATUTORY REPORTS
V) Information on Deviation from Accounting Standards, if any
The Company has adopted Indian Accounting
Standards (Ind AS) in preparation of annual accounts
for the Financial Year 2019.
W) Investor Correspondence
Mr. Ravi Batra
Chief Risk Officer & Group Company Secretary
Plot No. 31, Institutional Area, Sector - 44,
Gurugram 122 002 (Haryana)
Tel: +91 124 4643100
Fax: +91 124 4643303
Email: [email protected]
X) Disclosure of Compliance with Corporate Governance requirements specified in Regulation 17 to 27 and Regulation 46 of SEBI (LODR) Regulations
The Company has complied with the applicable
provisions of SEBI (LODR) Regulations including
Regulation 17 to 27 and Regulation 46 of SEBI
(LODR) Regulations except as mentioned below in
point no. (ii) of Disclosures.
The Company submits a quarterly compliance report
on Corporate Governance signed by Compliance
Officer to the Stock Exchange within 15 (Fifteen)
days from the close of every quarter. Such quarterly
compliance reports on Corporate Governance are
also posted on website of the Company.
Compliance of the conditions of Corporate
Governance have also been audited by an
Independent Firm of Practising Company Secretaries.
After being satisfied of the above compliances, they
have issued a compliance certificate in this respect.
The said certificate is annexed with this report and
the same will be forwarded to the Stock Exchanges
along with the Annual Report of the Company.
DISCLOSURES
(i) The Company has not entered into any materially
significant related party transactions which have
potential conflict with the interests of the Company
at large. The Board of Directors had approved
a Policy on Related Party Transactions and the
same is uploaded at http://varunpepsi.com/wp-
content/uploads/2016/09/Policy-On-Related-Party-
Transactions.pdf.
(ii) The Company has complied with the requirements
of Stock Exchanges, SEBI and other statutory
authorities on all matters relating to capital markets
and there was no instances of non-compliance during
the last three years except that during the Financial
Year 2019, composition of Board was not compliant
of Regulation 17 of SEBI (LODR) Regulations from
May 2, 2019 to July 31, 2019 as half of the Directors
were not Independent Directors and in this respect
penalty as imposed by the National Stock Exchange
of India Limited and BSE Limited was deposited by
the Company. Presently, the Company is compliant of
all the provisions of SEBI (LODR) Regulations.
(iii) Policy for Determination of Material Subsidiary and
Governance of Subsidiaries can be accessed at
http://varunpepsi.com/wp-content/uploads/2016/09/
Policy-For-Determination-Of-Material-Subsidiary-And-
Governance-Of-Subsidiaries.pdf.
(iv) During the Financial Year 2019, the Company has
raised ` 8,999,999,784 through Qualified Institutions
Placement which have been fully utilized in line with
the objects stated in the placement document.
(v) Disclosure in relation to the Sexual Harassment
of Women at Workplace (Prevention, Prohibition
and Redressal) Act, 2013 forms part of the Board’s
Report.
Green Initiative
Pursuant to Sections 101 and 136 of the Act read with the
Companies (Management and Administration) Rules, 2014
and Companies (Accounts) Rules, 2014, the Company
can send Notice of Annual General Meeting, Financial
Statements and other communication in electronic form.
Your Company is sending the Annual Report including
the Notice of Annual General Meeting, Audited Financial
Statements, Board’s Report along with their annexure
etc. for the Financial Year 2019 in electronic mode to the
shareholders who have registered their e-mail address
with the Company and/or their respective Depository
Participants (DPs).
Shareholders who have not registered their e-mail
addresses so far are requested to register their e-mail
addresses. Those holding shares in demat form can
register their e-mail addresses with their concerned
DPs. Shareholders who hold shares in physical form are
requested to register their e-mail addresses with the
Company / RTA, by sending a letter, duly signed by the
first/sole holder quoting details of Folio Number.
For and on behalf of the Board of Directors
For Varun Beverages Limited
Place: Gurugram
Date: February 7, 2020
Ravi Jaipuria
Chairman
DIN: 00003668
CORPORATE OVERVIEW FINANCIAL STATEMENTS
Annual Report 2019 61

CODE OF CONDUCT
This is to certify that the Company has laid down a Code of Conduct (the Code) for all Board Members and
Senior Management Personnel of the Company and a copy of the Code is put on the website of the Company viz.
www.varunpepsi.com.
It is further confirmed that all the Directors and Senior Management have affirmed their compliance with the Code for
the year ended December 31, 2019.
Place: Gurugram
Date: February 7, 2020
Kapil Agarwal
Whole-time Director & Chief Executive Officer
DIN: 02079161
Varun Beverages Limited62

STATUTORY REPORTS
CHIEF EXECUTIVE OFFICER AND CHIEF FINANCIAL OFFICER CERTIFICATION UNDER REGULATION 17(8) OF SEBI (LISTING OBLIGATIONS AND DISCLOSURE REQUIREMENTS) REGULATIONS, 2015
To
The Board of Directors,
Varun Beverages Limited
We, Kapil Agarwal, Whole-time Director & Chief Executive Officer and Vikas Bhatia, Chief Financial Officer of Varun
Beverages Limited, pursuant to the requirement of Regulation 17(8) of the Securities and Exchange Board of India
(Listing Obligations and Disclosure Requirements) Regulations, 2015 and to the best of our knowledge and belief,
hereby certify that:-
A) We have reviewed Financial Statements and the Cash Flow Statement for the Financial Year ended December 31,
2019 and that to the best of our knowledge and belief:
(i) these statements do not contain any materially untrue statement or omit any material fact or contain
statements that might be misleading;
(ii) these statements together present a true and fair view of the Company’s affairs and are in compliance with
existing accounting standards, applicable laws and regulations.
B) There are, to the best of our knowledge and belief, no transactions entered into by the Company during the
Financial Year ended December 31, 2019 which are fraudulent, illegal or violative of the Company’s Code of
Conduct.
C) We accept the responsibility for establishing and maintaining internal controls for financial reporting and that
we have evaluated the effectiveness of internal control systems of the Company pertaining to financial reporting
and that we have disclosed to the Auditors and the Audit, Risk Management and Ethics Committee, deficiencies
in the design or operation of such internal controls, if any, of which we are aware and the steps we have taken or
propose to take to rectify these deficiencies.
D) We have indicated to the Auditors and the Audit, Risk Management and Ethics Committee:
(i) significant changes in internal control over financial reporting during the Financial Year ended December 31,
2019;
(ii) significant changes in accounting policies during the said Financial Year and that the same have been
disclosed in the notes to the Financial Statements; and
(iii) instances of significant fraud of which we have become aware and the involvement therein, if any, of the
management or an employee having a significant role in the Company’s internal control system over financial
reporting.
Place: Gurugram
Date: February 7, 2020
Kapil Agarwal
Whole-time Director &
Chief Executive Officer
DIN: 02079161
Vikas Bhatia
Chief Financial Officer
CORPORATE OVERVIEW FINANCIAL STATEMENTS
Annual Report 2019 63
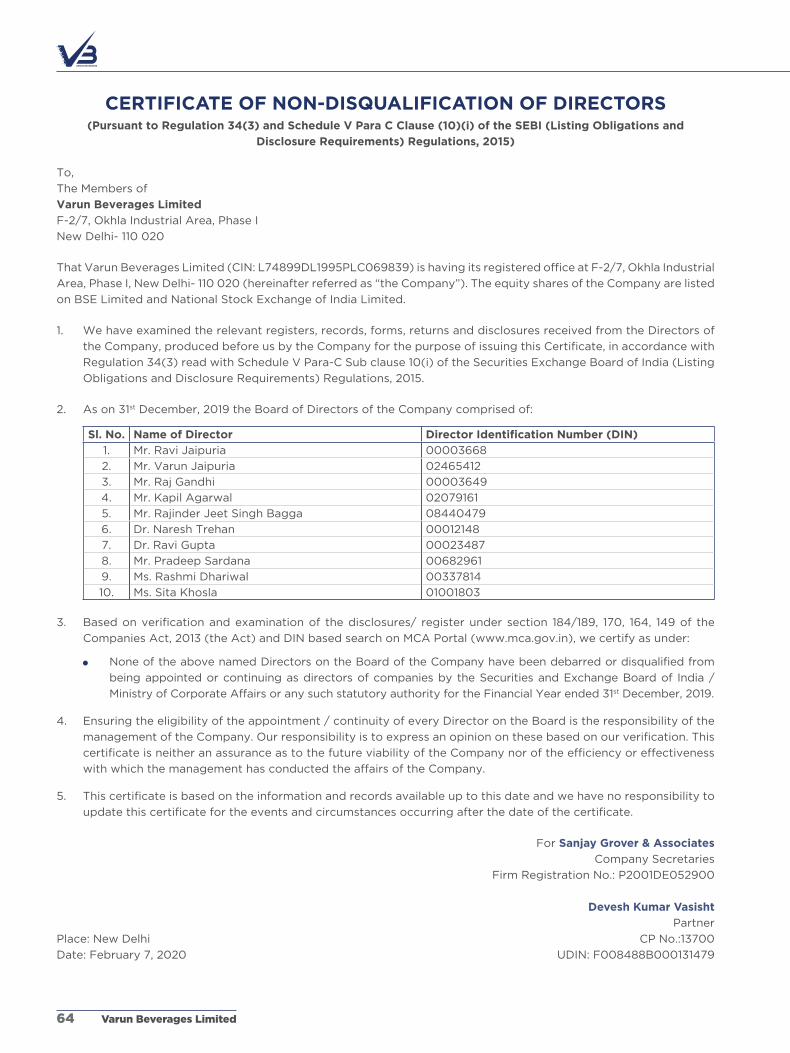
CERTIFICATE OF NON-DISQUALIFICATION OF DIRECTORS(Pursuant to Regulation 34(3) and Schedule V Para C Clause (10)(i) of the SEBI (Listing Obligations and
Disclosure Requirements) Regulations, 2015)
To,
The Members of
Varun Beverages Limited
F-2/7, Okhla Industrial Area, Phase I
New Delhi- 110 020
That Varun Beverages Limited (CIN: L74899DL1995PLC069839) is having its registered office at F-2/7, Okhla Industrial
Area, Phase I, New Delhi- 110 020 (hereinafter referred as “the Company”). The equity shares of the Company are listed
on BSE Limited and National Stock Exchange of India Limited.
1. We have examined the relevant registers, records, forms, returns and disclosures received from the Directors of
the Company, produced before us by the Company for the purpose of issuing this Certificate, in accordance with
Regulation 34(3) read with Schedule V Para-C Sub clause 10(i) of the Securities Exchange Board of India (Listing
Obligations and Disclosure Requirements) Regulations, 2015.
2. As on 31st December, 2019 the Board of Directors of the Company comprised of:
Sl. No. Name of Director Director Identification Number (DIN)
1. Mr. Ravi Jaipuria 00003668
2. Mr. Varun Jaipuria 02465412
3. Mr. Raj Gandhi 00003649
4. Mr. Kapil Agarwal 02079161
5. Mr. Rajinder Jeet Singh Bagga 08440479
6. Dr. Naresh Trehan 00012148
7. Dr. Ravi Gupta 00023487
8. Mr. Pradeep Sardana 00682961
9. Ms. Rashmi Dhariwal 00337814
10. Ms. Sita Khosla 01001803
3. Based on verification and examination of the disclosures/ register under section 184/189, 170, 164, 149 of the
Companies Act, 2013 (the Act) and DIN based search on MCA Portal (www.mca.gov.in), we certify as under:
None of the above named Directors on the Board of the Company have been debarred or disqualified from
being appointed or continuing as directors of companies by the Securities and Exchange Board of India /
Ministry of Corporate Affairs or any such statutory authority for the Financial Year ended 31st December, 2019.
4. Ensuring the eligibility of the appointment / continuity of every Director on the Board is the responsibility of the
management of the Company. Our responsibility is to express an opinion on these based on our verification. This
certificate is neither an assurance as to the future viability of the Company nor of the efficiency or effectiveness
with which the management has conducted the affairs of the Company.
5. This certificate is based on the information and records available up to this date and we have no responsibility to
update this certificate for the events and circumstances occurring after the date of the certificate.
For Sanjay Grover & Associates
Company Secretaries
Firm Registration No.: P2001DE052900
Devesh Kumar Vasisht
Partner
Place: New Delhi CP No.:13700
Date: February 7, 2020 UDIN: F008488B000131479
Varun Beverages Limited64
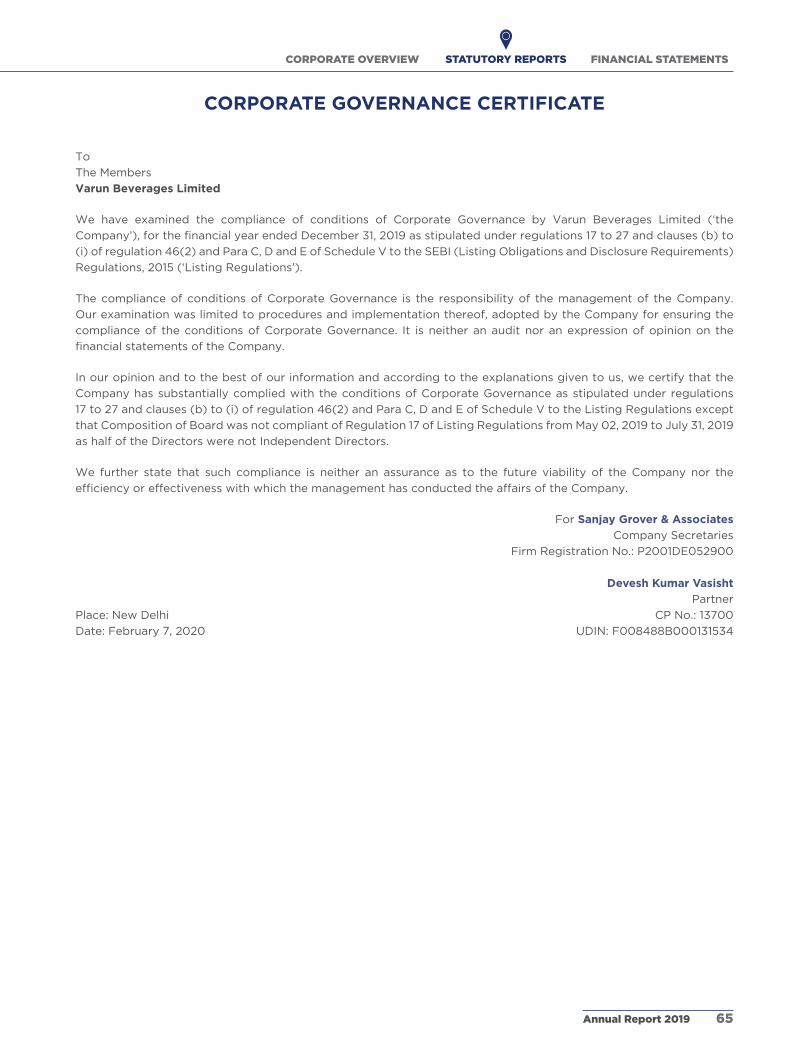
STATUTORY REPORTS
CORPORATE GOVERNANCE CERTIFICATE
To
The Members
Varun Beverages Limited
We have examined the compliance of conditions of Corporate Governance by Varun Beverages Limited (‘the
Company’), for the financial year ended December 31, 2019 as stipulated under regulations 17 to 27 and clauses (b) to
(i) of regulation 46(2) and Para C, D and E of Schedule V to the SEBI (Listing Obligations and Disclosure Requirements)
Regulations, 2015 (‘Listing Regulations’).
The compliance of conditions of Corporate Governance is the responsibility of the management of the Company.
Our examination was limited to procedures and implementation thereof, adopted by the Company for ensuring the
compliance of the conditions of Corporate Governance. It is neither an audit nor an expression of opinion on the
financial statements of the Company.
In our opinion and to the best of our information and according to the explanations given to us, we certify that the
Company has substantially complied with the conditions of Corporate Governance as stipulated under regulations
17 to 27 and clauses (b) to (i) of regulation 46(2) and Para C, D and E of Schedule V to the Listing Regulations except
that Composition of Board was not compliant of Regulation 17 of Listing Regulations from May 02, 2019 to July 31, 2019
as half of the Directors were not Independent Directors.
We further state that such compliance is neither an assurance as to the future viability of the Company nor the
efficiency or effectiveness with which the management has conducted the affairs of the Company.
For Sanjay Grover & Associates
Company Secretaries
Firm Registration No.: P2001DE052900
Devesh Kumar Vasisht
Partner
Place: New Delhi CP No.: 13700
Date: February 7, 2020 UDIN: F008488B000131534
CORPORATE OVERVIEW FINANCIAL STATEMENTS
Annual Report 2019 65

Annexure – G
Form No. MGT-9
Extract of Annual Return
As on the Financial Year ended on December 31, 2019
[Pursuant to Section 92(3) of the Companies Act, 2013 and Rule 12(1) of the Companies
(Management and Administration) Rules, 2014]
I. Registration and Other Details:
(i) Corporate Identity Number - L74899DL1995PLC069839
(ii) Registration Date - 16.06.1995
(iii) Name of the Company - Varun Beverages Limited
(iv) Category/Sub-Category of the Company - Public Company / Limited by Shares
(v) Address of the Registered Office and Contact Details - F-2/7, Okhla Industrial Area, Phase – I, New Delhi –
110 020; Tel: +91 11 41706720; E-mail: [email protected]
(vi) Whether Listed Company - Yes. Equity shares are listed on the National Stock Exchange of India Limited and
the BSE Limited
(vii) Name, Address and Contact Details of Registrar and Transfer Agent - KFin Technologies Private Limited
(formerly Karvy Fintech Private Limited), Selenium Tower B, Plot No. 31 and 32, Gachibowli, Financial District,
Nanakramguda, Hyderabad-500 032; Tel: +91 40 6716 2222; Fax: +91 40 2342 0814; Email: [email protected];
Website: www.kfintech.com
II. Principal Business Activities of the Company
All the business activities contributing 10% or more of the total turnover of the Company shall be stated:
Sl. No. Name and Description of main products/ services NIC Code of the Product/ service
% to total turnover of the Company
1. Manufacturing of Beverages 1104 95.39%
III. Particulars of Holding, Subsidiary and Associate Companies
Sl. No.
Name and Address of the Company CIN/GLN Holding/ Subsidiary/ Associate
% of shares held
Applicable Section
1. Varun Beverages (Nepal) Private Limited Sinamangal - 32, Koteshwar, Kathmandu, Nepal
NA Subsidiary 100.00 2(87)
2. Varun Beverages Morocco SAZ. I. Bouskoura, 27182, B.P.408,Casablanca, Morocco
NA Subsidiary 100.00 2(87)
3. Varun Beverages Lanka (Private) Limited No. 140, Low Level Road, Embulgama, Ranala, Sri Lanka
NA Subsidiary 100.00 2(87)
4. Ole Springs Bottlers (Private) Limited*No. 140, Low Level Road, Embulgama, Ranala, Sri Lanka
NA Subsidiary 99.99 2(87)
5. Varun Beverages (Zambia) LimitedPlot number 37426, Mungwi Road,P.O. Box 30007, Lusaka, Zambia
NA Subsidiary 90.00 2(87)
6. Varun Beverages (Botswana) (Proprietary) Limited**Plot 163/164, Unit 20, Gaborone International Commerce Park, Gaborone
NA Subsidiary 90.00 2(87)
Varun Beverages Limited66

STATUTORY REPORTS
Sl. No.
Name and Address of the Company CIN/GLN Holding/ Subsidiary/ Associate
% of shares held
Applicable Section
7. Varun Beverages (Zimbabwe)(Private) Limited 7 Normandy Road, Alexandra Park, Harare, Zimbabwe
NA Subsidiary 85.00 2(87)
8. Angelica Technologies Private LimitedF-2/7, Okhla Industrial Area,Phase – I, New Delhi – 110 020
U30005DL2006PTC147252 Subsidiary 47.30 2(87)
9. Lunarmech Technologies Private Limited*** Flat No. 3089, Pocket -C3, Vasant Kunj, New Delhi -110 070
U72900DL2009PTC190619 Subsidiary 55.00 2(87)
* Subsidiary of Varun Beverages Lanka (Private) Limited.
** Subsidiary of Varun Beverages (Zambia) Limited.
*** Subsidiary of Angelica Technologies Private Limited.
IV. Shareholding Pattern (Equity Share Capital Break up as percentage of Total Equity)
(i) Category-wise Shareholding:
Category of Shareholders No. of Shares held at the beginning of the year No. of Shares held at the end of the year % Change during
the year
Demat Physical Total % of Total
Shares
Demat Physical Total % of Total
Shares
A. Promoter & Promoter Group
(1) Indian
(a) Individual / HUF 78,535,150 0 78,535,150 43.00 116,502,724 0 116,502,724 40.36 (2.64)
(b) Central Govt. 0 0 0 0.00 0 0 0 0.00 0.00
(c) State Govt(s). 0 0 0 0.00 0 0 0 0.00 0.00
(d) Bodies Corporate 55,822,345 0 55,822,345 30.56 81,033,517 0 81,033,517 28.07 (2.49)
(e) Banks/FI 0 0 0 0.00 0 0 0 0.00 0.00
(f) Any Other 0 0 0 0.00 0 0 0 0.00 0.00
Sub-Total (A)(1):- 134,357,495 0 134,357,495 73.56 197,536,241 0 197,536,241 68.43 (5.13)
(2) Foreign
(a) NRIs - Individuals 0 0 0 0.00 0 0 0 0.00 0.00
(b) Other - Individuals
0 0 0 0.00 0 0 0 0.00 0.00
(c) Bodies Corporate 0 0 0 0.00 0 0 0 0.00 0.00
(d) Banks/ FI 0 0 0 0.00 0 0 0 0.00 0.00
(e) Any Other 0 0 0 0.00 0 0 0 0.00 0.00
Sub-Total (A)(2):- 0 0 0 0.00 0 0 0 0.00 0.00
Total shareholding of Promoter (A) = (A)(1) + (A)(2)
134,357,495 0 134,357,495 73.56 197,536,241 0 197,536,241 68.43 (5.13)
B. Public Shareholding
(1) Institutions
(a) Mutual Funds 10,450,747 0 10,450,747 5.72 17,228,654 0 17,228,654 5.97 0.25
(b) Banks/FI 18,402 0 18,402 0.01 17,030 0 17,030 0.01 0.00
(c) Central Govt. 0 0 0 0.00 0 0 0 0.00 0.00
(d) State Govt(s). 0 0 0 0.00 0 0 0 0.00 0.00
(e) Venture Capital Funds
0 0 0 0.00 0 0 0 0.00 0.00
(f) Insurance Companies
0 0 0 0.00 0 0 0 0.00 0.00
CORPORATE OVERVIEW FINANCIAL STATEMENTS
Annual Report 2019 67

Category of Shareholders No. of Shares held at the beginning of the year No. of Shares held at the end of the year % Change during
the year
Demat Physical Total % of Total
Shares
Demat Physical Total % of Total
Shares
(g) FIIs 897,259 0 897,259 0.50 0 0 0 0.00 (0.50)
(h) Foreign Venture Capital Funds
0 0 0 0.00 0 0 0 0.00 0.00
i) Others (specify) - (i) Foreign Portfolio Investorss
22,900,177 0 22,900,177 12.54 55,868,365 0 55,868,365 19.35 6.81
(ii) Alternate Investment Fund
26,197 0 26,197 0.01 974,229 0 974,229 0.34 0.33
Sub-total (B)(1):- 34,292,782 0 34,292,782 18.78 74,088,278 0 74,088,278 25.67 6.89
(2) Non- Institutions
(a) Bodies Corporate
i) Indian 937,852 0 937,852 0.51 2,747,718 0 2,747,718 0.95 0.44
(ii) Overseas 0 0 0 0.00 0 0 0 0.00 0.00
(b) Individuals
i) Individual shareholders holding nominal share capital upto ` 1 Lakh
3,827,216 30 3,827,246 2.10 7,489,734 291 7,490,025 2.59 0.49
(ii) Individual shareholders holding nominal share capital in excess of ` 1 Lakh
1,966,691 0 1,966,691 1.08 4,870,067 0 4,870,067 1.69 0.61
(c) Others (specify)
i) Trusts 2,168 0 2,168 0.00 1,375 0 1,375 0.00 0.00
(ii) NRIs 188,693 0 188,693 0.10 644,788 0 644,788 0.22 0.12
(iii) NRIs (Non-Repatriation)
86,897 0 86,897 0.05 521,213 0 521,213 0.18 0.13
(iv) Clearing Members
36,484 0 36,484 0.02 100,334 0 100,334 0.04 0.02
(v) HUF 131,648 0 131,648 0.07 302,280 0 302,280 0.10 0.03
(vi) Foreign Bodies
6,813,916 0 6,813,916 3.73 0 0 0 0.00 (3.73)
(vii) NBFC 68 0 68 0.00 0 0 0 0.00 0.00
(viii) Qualified Institutional Buyers
0 0 0 0.00 386,401 0 386,401 0.13 0.13
Sub-total (B)(2):- 13,991,633 30 13,991,663 7.66 17,063,910 291 17,064,201 5.90 (1.76)
Total Public Shareholding (B) = (B)(1) + (B)(2)
48,284,415 30 48,284,445 26.44 91,152,188 291 91,152,479 31.57 5.13
C. Shares held by Custodian for GDRs & ADRs
0 0 0 0.00 0 0 0 0.00 0.00
Grand Total (A+B+C) 182,641,910 30 182,641,940 100.00 288,688,429 291 288,688,720 100.00 0.00
Varun Beverages Limited68

STATUTORY REPORTS
(ii) Shareholding of Promoter & Promoter Group
Sl. No.
Shareholder’s Name
Shareholding at the beginning of the year Shareholding at the end of the year % change in shareholding
during the year
No. of Shares % of total Shares of the
Company
% of Shares Pledged/
encumbered to total shares
No. of Shares % of total Shares of the
Company
% of Shares Pledged/
encumbered to total shares
Promoters
1. Ravi Kant Jaipuria & Sons (HUF)
39,187,870 21.46 0.00 57,481,805 19.91 0.00 (1.55)
2. Varun Jaipuria
39,175,500 21.45 0.00 50,663,250 17.55 0.00 (3.90)
3. RJ Corp Limited
55,822,345 30.56 0.00 81,033,517 28.07 0.00 (2.49)
Promoter Group
4. Devyani Jaipuria
1,765 0.00 0.00 8,102,647 2.81 0.00 2.81
5. Dhara Jaipuria
2,015 0.00 0.00 3,022 0.00 0.00 0.00
6. Vivek Gupta 168,000 0.09 0.09 252,000 0.09 0.09 0.00
Total 134,357,495 73.56 0.09 197,536,241 68.43 0.09 (5.13)
(iii) Change in Promoter and Promoter Group’s Shareholding
Shareholder’s Name Shareholding at the beginning of the year
Cumulative Shareholding during the year
No. of shares % of total shares of the
Company
No. of shares % of total shares of the
Company
Ravi Kant Jaipuria & Sons (HUF)
At the beginning of the year 39,187,870 21.46
Increase / (Decrease) in Shareholding during the year:
09/08/2019 (Bonus Shares) 19,593,935 7.15 58,781,805 21.45
27/09/2019 (Transfer) (1,300,000) (0.45) 57,481,805 19.91
At the end of the year 57,481,805 19.91
Dhara Jaipuria
At the beginning of the year 2,015 0.00
Increase / Decrease in Shareholding during the year:
09/08/2019 (Bonus Shares) 1,007 0.00 3,022 0.00
At the end of the year 3,022 0.00
Varun Jaipuria
At the beginning of the year 39,175,500 21.45
Increase / Decrease in Shareholding during the year:
28/06/2019 (Transfer) (5,400,000) (2.96) 33,775,500 18.49
09/08/2019 (Bonus Shares) 16,887,750 6.16 50,663,250 18.49
At the end of the year 50,663,250 17.55
Devyani Jaipuria
At the beginning of the year 1,765 0.00
Increase / Decrease in Shareholding during the year:
28/06/2019 (Transfer) 5,400,000 2.96 5,401,765 2.96
09/08/2019 (Bonus Shares) 2,700,882 0.99 8,102,647 2.96
At the end of the year 8,102,647 2.81
CORPORATE OVERVIEW FINANCIAL STATEMENTS
Annual Report 2019 69

Shareholder’s Name Shareholding at the beginning of the year
Cumulative Shareholding during the year
No. of shares % of total shares of the
Company
No. of shares % of total shares of the
Company
RJ Corp Limited
At the beginning of the year 55,822,345 30.56
Increase / Decrease in Shareholding during the year:
09/08/2019 (Bonus Shares) 27,911,172 10.19 83,733,517 30.56
27/09/2019 (Transfer) (2,700,000) (0.94) 81,033,517 28.06
At the end of the year 81,033,517 28.07
Vivek Gupta
At the beginning of the year 168,000 0.09
Increase / Decrease in Shareholding during the year:
09/08/2019 (Bonus Shares) 84,000 0.03 252,000 0.09
At the end of the year 252,000 0.09Note: Figures under () denotes sale while other denotes purchase.
(iv) Shareholding Pattern of top ten Shareholders (other than Directors, Promoters and Holders of GDRs and ADRs):
For Each of the Top 10 Shareholders Shareholding at the beginning of the year
Cumulative Shareholding during the year
No. of shares % of total shares of the Company
No. of shares % of total shares of the
Company
1. SMALLCAP WORLD FUND, INC
At the beginning of the year 7,249,988 3.97
Increase / Decrease in Shareholding during the year:
11/01/2019 (Transfer) (65,984) (0.04) 7,184,004 3.93
18/01/2019 (Transfer) (69,436) (0.04) 7,114,568 3.90
19/04/2019(Transfer) (27,531) (0.02) 7,087,037 3.88
26/04/2019 (Transfer) (247,377) (0.14) 6,839,660 3.74
03/05/2019 (Transfer) (54,372) (0.03) 6,785,288 3.71
09/08/2019 (Transfer) 3,392,644 1.24 10,177,932 3.71
22/11/2019 (Transfer) (36,838) (0.01) 10,141,094 3.51
29/11/2019 (Transfer) (336,347) (0.12) 9,804,747 3.40
06/12/2019 (Transfer) (189,254) (0.07) 9,615,493 3.33
13/12/2019 (Transfer) (68,373) (0.02) 9,547,120 3.31
20/12/2019 (Transfer) (181,350) (0.06) 9,365,770 3.24
27/12/2019 (Transfer) (52,739) (0.02) 9,313,031 3.23
31/12/2019 (Transfer) (23,902) (0.01) 9,289,129 3.22
At the end of the year 9,289,129 3.22
2. RELIANCE CAPITAL TRUSTEE CO LTD-A/C NIPPON INDIA
At the beginning of the year 6,043,433 3.31
Increase / Decrease in Shareholding during the year:
11/01/2019 (Transfer) (228,583) (0.13) 5,814,850 3.18
01/02/2019 (Transfer) 20,777 0.01 5,835,627 3.20
01/02/2019 (Transfer) (99,253) (0.05) 5,736,374 3.14
08/02/2019 (Transfer) 9 0.00 5,736,383 3.14
08/02/2019 (Transfer) (128,649) (0.07) 5,607,734 3.07
15/02/2019 (Transfer) 2,100 0.00 5,609,834 3.07
15/02/2019 (Transfer) (72,098) (0.04) 5,537,736 3.03
Varun Beverages Limited70

STATUTORY REPORTS
For Each of the Top 10 Shareholders Shareholding at the beginning of the year
Cumulative Shareholding during the year
No. of shares % of total shares of the Company
No. of shares % of total shares of the
Company
22/02/2019 (Transfer) 37,900 0.02 5,575,636 3.05
01/03/2019 (Transfer) 12 0.00 5,575,648 3.05
08/03/2019 (Transfer) 3,012 0.00 5,578,660 3.05
15/03/2019 (Transfer) 396 0.00 5,579,056 3.05
22/03/2019 (Transfer) 120 0.00 5,579,176 3.05
29/03/2019 (Transfer) 403 0.00 5,579,579 3.05
05/04/2019 (Transfer) 372 0.00 5,579,951 3.05
12/04/2019 (Transfer) 864 0.00 5,580,815 3.06
19/04/2019 (Transfer) 336 0.00 5,581,151 3.06
26/04/2019 (Transfer) 96 0.00 5,581,247 3.06
03/05/2019 (Transfer) 20,070 0.01 5,601,317 3.07
10/05/2019 (Transfer) (2,330) 0.00 5,598,987 3.07
17/05/2019 (Transfer) 240 0.00 5,599,227 3.07
17/05/2019 (Transfer) (299,300) (0.16) 5,299,927 2.90
24/05/2019 (Transfer) 104 0.00 5,300,031 2.90
24/05/2019 (Transfer) (93,939) (0.05) 5,206,092 2.85
31/05/2019 (Transfer) 1,332 0.00 5,207,424 2.85
31/05/2019 (Transfer) (90,000) (0.05) 5,117,424 2.80
07/06/2019 (Transfer) 288 0.00 5,117,712 2.80
14/06/2019 (Transfer) (60) 0.00 5,117,652 2.80
21/06/2019 (Transfer) 132 0.00 5,117,784 2.80
21/06/2019 (Transfer) (60,000) (0.03) 5,057,784 2.77
28/06/2019 (Transfer) (3) 0.00 5,057,781 2.77
05/07/2019 (Transfer) 190,360 0.10 5,248,141 2.87
05/07/2019 (Transfer) (189,123) (0.10) 5,059,018 2.77
12/07/2019 (Transfer) 156 0.00 5,059,174 2.77
12/07/2019 (Transfer) (244,100) (0.13) 4,815,074 2.64
19/07/2019 (Transfer) 315 0.00 4,815,389 2.64
19/07/2019 (Transfer) (2,884) 0.00 4,812,505 2.63
26/07/2019 (Transfer) 120 0.00 4,812,625 2.63
26/07/2019 (Transfer) (150,000) (0.08) 4,662,625 2.55
02/08/2019 (Transfer) 6 0.00 4,662,631 2.55
02/08/2019 (Transfer) (98,456) (0.05) 4,564,175 2.50
09/08/2019 (Transfer) 2,335,346 0.85 6,899,521 2.52
09/08/2019 (Transfer) (3,531) 0.00 6,895,990 2.52
16/08/2019 (Transfer) 90 0.00 6,896,080 2.52
23/08/2019 (Transfer) 108 0.00 6,896,188 2.52
30/08/2019 (Transfer) 242 0.00 6,896,430 2.52
06/09/2019 (Transfer) 54 0.00 6,896,484 2.52
13/09/2019 (Transfer) 164,282 0.06 7,060,766 2.45
20/09/2019 (Transfer) 126 0.00 7,060,892 2.45
27/09/2019 (Transfer) 4,464 0.00 7,065,356 2.45
30/09/2019 (Transfer) 3,329 0.00 7,068,685 2.45
04/10/2019 (Transfer) 27,039 0.01 7,095,724 2.46
11/10/2019 (Transfer) 504 0.00 7,096,228 2.46
18/10/2019 (Transfer) 126 0.00 7,096,354 2.46
01/11/2019 (Transfer) 189 0.00 7,096,543 2.46
08/11/2019 (Transfer) 63 0.00 7,096,606 2.46
08/11/2019 (Transfer) (438,608) (0.15) 6,657,998 2.31
15/11/2019 (Transfer) (250,637) (0.09) 6,407,361 2.22
22/11/2019 (Transfer) (259) 0.00 6,407,102 2.22
CORPORATE OVERVIEW FINANCIAL STATEMENTS
Annual Report 2019 71

For Each of the Top 10 Shareholders Shareholding at the beginning of the year
Cumulative Shareholding during the year
No. of shares % of total shares of the Company
No. of shares % of total shares of the
Company
29/11/2019 (Transfer) (55,549) (0.02) 6,351,553 2.20
06/12/2019 (Transfer) (1,006) 0.00 6,350,547 2.20
13/12/2019 (Transfer) 85 0.00 6,350,632 2.20
20/12/2019 (Transfer) 15 0.00 6,350,647 2.20
27/12/2019 (Transfer) 1,050 0.00 6,351,697 2.20
31/12/2019 (Transfer) 910 0.00 6,352,607 2.20
At the end of the year 6,352,607 2.20
3. SUNDARAM MUTUAL FUND A/C SUNDARAM MID CAP FUND
At the beginning of the year 2,078,386 1.14
Increase / Decrease in Shareholding during the year:
15/02/2019 (Transfer) 14,000 0.01 2,092,386 1.15
22/02/2019 (Transfer) 5,000 0.00 2,097,386 1.15
01/03/2019 (Transfer) 43,755 0.02 2,141,141 1.17
15/03/2019 (Transfer) 44,547 0.02 2,185,688 1.20
22/03/2019 (Transfer) 261,802 0.14 2,447,490 1.34
29/03/2019 (Transfer) 473,921 0.26 2,921,411 1.60
05/04/2019 (Transfer) (915) 0.00 2,920,496 1.60
12/04/2019 (Transfer) 4,974 0.00 2,925,470 1.60
12/04/2019 (Transfer) (556) 0.00 2,924,914 1.60
19/04/2019 (Transfer) 543,631 0.30 3,468,545 1.90
26/04/2019 (Transfer) 103,010 0.06 3,571,555 1.96
03/05/2019 (Transfer) 22,106 0.01 3,593,661 1.97
10/05/2019 (Transfer) (154,148) (0.08) 3,439,513 1.88
17/05/2019 (Transfer) (1,244) 0.00 3,438,269 1.88
31/05/2019 (Transfer) 30,404 0.02 3,468,673 1.90
14/06/2019 (Transfer) 53,129 0.03 3,521,802 1.93
21/06/2019 (Transfer) 13,405 0.01 3,535,207 1.94
19/07/2019 (Transfer) (4,700) 0.00 3,530,507 1.93
09/08/2019 (Transfer) 1,178,935 0.43 4,709,442 1.72
09/08/2019 (Transfer) (932) 0.00 4,708,510 1.72
16/08/2019 (Transfer) (89,889) (0.03) 4,618,621 1.69
06/09/2019 (Transfer) (240,954) (0.09) 4,377,667 1.60
13/09/2019 (Transfer) 1,341,395 0.46 5,719,062 1.98
11/10/2019 (Transfer) (600) 0.00 5,718,462 1.98
08/11/2019 (Transfer) (8,529) 0.00 5,709,933 1.98
06/12/2019 (Transfer) (105,000) (0.04) 5,604,933 1.94
13/12/2019 (Transfer) (21,442) (0.01) 5,583,491 1.93
20/12/2019 (Transfer) (79,539) (0.03) 5,503,952 1.91
At the end of the year 5,503,952 1.91
4. STICHTING DEPOSITARY APG EMERGING MARKETS EQUITY POOL
At the beginning of the year 3,270,669 1.79
Increase / Decrease in Shareholding during the year:
15/02/2019 (Transfer) (31,851) (0.02) 3,238,818 1.77
22/02/2019 (Transfer) (122,825) (0.07) 3,115,993 1.71
01/03/2019 (Transfer) (20,903) (0.01) 3,095,090 1.69
08/03/2019 (Transfer) 520,682 0.29 3,615,772 1.98
26/04/2019 (Transfer) 13,777 0.01 3,629,549 1.99
10/05/2019 (Transfer) 7,282 0.00 3,636,831 1.99
Varun Beverages Limited72

STATUTORY REPORTS
For Each of the Top 10 Shareholders Shareholding at the beginning of the year
Cumulative Shareholding during the year
No. of shares % of total shares of the Company
No. of shares % of total shares of the
Company
07/06/2019 (Transfer) (6,804) 0.00 3,630,027 1.99
02/08/2019 (Transfer) (10,936) (0.01) 3,619,091 1.98
09/08/2019 (Transfer) 1,815,013 0.66 5,434,104 1.98
23/08/2019 (Transfer) 16,646 0.01 5,450,750 1.99
30/08/2019 (Transfer) (13,515) 0.00 5,437,235 1.98
06/09/2019 (Transfer) (2,739) 0.00 5,434,496 1.98
13/09/2019 (Transfer) (15,175) (0.01) 5,419,321 1.88
27/09/2019 (Transfer) (9,320) 0.00 5,410,001 1.87
18/10/2019 (Transfer) 5,847 0.00 5,415,848 1.88
08/11/2019 (Transfer) (90,000) (0.03) 5,325,848 1.84
22/11/2019 (Transfer) (4,027) 0.00 5,321,821 1.84
29/11/2019 (Transfer) (14,167) 0.00 5,307,654 1.84
At the end of the year 5,307,654 1.84
5. TATA OFFSHORE INDIA OPPORTUNITIES SCHEME
At the beginning of the year 1,960,246 1.07
Increase / Decrease in Shareholding during the year:
01/03/2019 (Transfer) 103,972 0.06 2,064,218 1.13
08/03/2019 (Transfer) 10,000 0.01 2,074,218 1.14
15/03/2019 (Transfer) 20,000 0.01 2,094,218 1.15
22/03/2019 (Transfer) 20,000 0.01 2,114,218 1.16
29/03/2019 (Transfer) 500,000 0.27 2,614,218 1.43
05/04/2019 (Transfer) 10,000 0.01 2,624,218 1.44
21/06/2019 (Transfer) 2,000 0.00 2,626,218 1.44
19/07/2019 (Transfer) (2,200) 0.00 2,624,018 1.44
26/07/2019 (Transfer) (1,500) 0.00 2,622,518 1.44
02/08/2019 (Transfer) (31,700) (0.02) 2,590,818 1.42
09/08/2019 (Transfer) 1,311,259 0.48 3,902,077 1.42
27/09/2019 (Transfer) 33,000 0.01 3,935,077 1.36
25/10/2019 (Transfer) 112,000 0.04 4,047,077 1.40
01/11/2019 (Transfer) 260,000 0.09 4,307,077 1.49
08/11/2019 (Transfer) 16,750 0.01 4,323,827 1.50
At the end of the year 4,323,827 1.50
6. NORDEA 1 SICAV - EMERGING CONSUMER FUND
At the beginning of the year 2,927,613 1.60
Increase / Decrease in Shareholding during the year:
11/01/2019 (Transfer) (6,434) 0.00 2,921,179 1.60
18/01/2019 (Transfer) (68,181) (0.04) 2,852,998 1.56
25/01/2019 (Transfer) (13,187) (0.01) 2,839,811 1.55
01/02/2019 (Transfer) (98,502) (0.05) 2,741,309 1.50
08/02/2019 (Transfer) (69,348) (0.04) 2,671,961 1.46
15/02/2019 (Transfer) (137,562) (0.08) 2,534,399 1.39
22/02/2019 (Transfer) (28,547) (0.02) 2,505,852 1.37
22/03/2019 (Transfer) 1,462 0.00 2,507,314 1.37
29/03/2019 (Transfer) (97,818) (0.05) 2,409,496 1.32
19/04/2019 (Transfer) (3,918) 0.00 2,405,578 1.32
03/05/2019 (Transfer) (5,915) 0.00 2,399,663 1.31
17/05/2019 (Transfer) (16,972) (0.01) 2,382,691 1.30
24/05/2019 (Transfer) (29,939) (0.02) 2,352,752 1.29
CORPORATE OVERVIEW FINANCIAL STATEMENTS
Annual Report 2019 73

For Each of the Top 10 Shareholders Shareholding at the beginning of the year
Cumulative Shareholding during the year
No. of shares % of total shares of the Company
No. of shares % of total shares of the
Company
31/05/2019 (Transfer) (37,602) (0.02) 2,315,150 1.27
05/07/2019 (Transfer) 6,553 0.00 2,321,703 1.27
05/07/2019 (Transfer) (2,638) 0.00 2,319,065 1.27
09/08/2019 (Transfer) 1,159,531 0.42 3,478,596 1.27
04/10/2019 (Transfer) (13,432) 0.00 3,465,164 1.20
11/10/2019 (Transfer) (5,248) 0.00 3,459,916 1.20
25/10/2019 (Transfer) 7,471 0.00 3,467,387 1.20
01/11/2019 (Transfer) (162,208) (0.06) 3,305,179 1.14
15/11/2019 (Transfer) (58,265) (0.02) 3,246,914 1.12
22/11/2019 (Transfer) (158,901) (0.06) 3,088,013 1.07
13/12/2019 (Transfer) (5,815) 0.00 3,082,198 1.07
At the end of the year 3,082,198 1.07
7. AMERICAN FUNDS INSURANCE SERIES GLOBAL SMALL CAPITALIZATION FUND
At the beginning of the year 1,544,987 0.85
Increase / Decrease in Shareholding during the year:
14/06/2019 (Transfer) (54,987) (0.03) 1,490,000 0.82
09/08/2019 (Transfer) 745,000 0.27 2,235,000 0.82
15/11/2019 (Transfer) (150,000) (0.05) 2,085,000 0.72
22/11/2019 (Transfer) (100,000) (0.03) 1,985,000 0.69
13/12/2019 (Transfer) (4,503) 0.00 1,980,497 0.69
20/12/2019 (Transfer) (22,112) (0.01) 1,958,385 0.68
27/12/2019 (Transfer) (6,430) 0.00 1,951,955 0.68
31/12/2019 (Transfer) (2,914) 0.00 1,949,041 0.68
At the end of the year 1,949,041 0.68
8. STEINBERG INDIA EMERGING OPPORTUNITIES FUND LIMITED
At the beginning of the year 500,000 0.27
Increase / Decrease in Shareholding during the year:
15/03/2019 (Transfer) 305,000 0.17 805,000 0.44
09/08/2019 (Transfer) 402,500 0.15 1,207,500 0.44
04/10/2019 (Transfer) 11,155 0.00 1,218,655 0.42
At the end of the year 1,218,655 0.42
9. VANGUARD TOTAL INTERNATIONAL STOCK INDEX FUND
At the beginning of the year 646,546 0.35
Increase / Decrease in Shareholding during the year:
26/04/2019 (Transfer) (17,448) (0.01) 629,098 0.34
14/06/2019 (Transfer) 20,725 0.01 649,823 0.36
21/06/2019 (Transfer) 11,200 0.01 661,023 0.36
05/07/2019 (Transfer) 4,769 0.00 665,792 0.36
12/07/2019 (Transfer) 2,982 0.00 668,774 0.37
09/08/2019 (Transfer) 334,387 0.12 1,003,161 0.37
13/09/2019 (Transfer) 1,543 0.00 1,004,704 0.35
11/10/2019 (Transfer) 7,400 0.00 1,012,104 0.35
15/11/2019 (Transfer) 25,180 0.01 1,037,284 0.36
13/12/2019 (Transfer) 15,031 0.01 1,052,315 0.36
At the end of the year 1,052,315 0.36
Varun Beverages Limited74
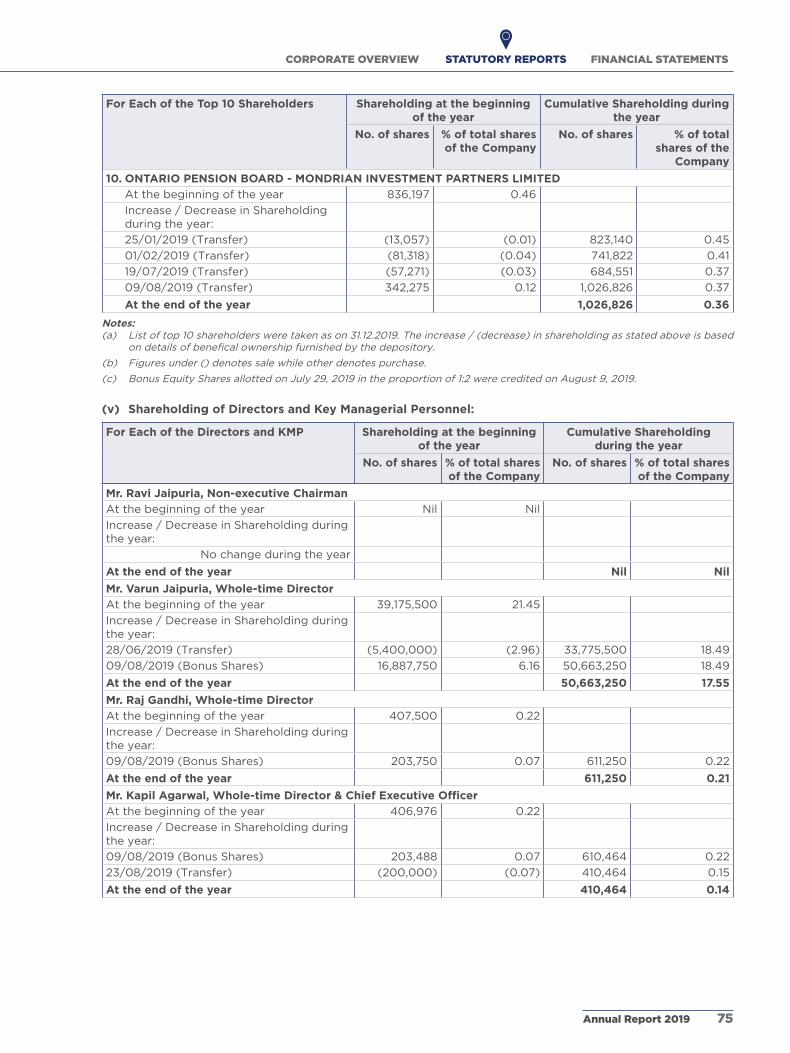
STATUTORY REPORTS
For Each of the Top 10 Shareholders Shareholding at the beginning of the year
Cumulative Shareholding during the year
No. of shares % of total shares of the Company
No. of shares % of total shares of the
Company
10. ONTARIO PENSION BOARD - MONDRIAN INVESTMENT PARTNERS LIMITED
At the beginning of the year 836,197 0.46
Increase / Decrease in Shareholding during the year:
25/01/2019 (Transfer) (13,057) (0.01) 823,140 0.45
01/02/2019 (Transfer) (81,318) (0.04) 741,822 0.41
19/07/2019 (Transfer) (57,271) (0.03) 684,551 0.37
09/08/2019 (Transfer) 342,275 0.12 1,026,826 0.37
At the end of the year 1,026,826 0.36
Notes: (a) List of top 10 shareholders were taken as on 31.12.2019. The increase / (decrease) in shareholding as stated above is based
on details of benefical ownership furnished by the depository.
(b) Figures under () denotes sale while other denotes purchase.
(c) Bonus Equity Shares allotted on July 29, 2019 in the proportion of 1:2 were credited on August 9, 2019.
(v) Shareholding of Directors and Key Managerial Personnel:
For Each of the Directors and KMP Shareholding at the beginning of the year
Cumulative Shareholding during the year
No. of shares % of total shares of the Company
No. of shares % of total shares of the Company
Mr. Ravi Jaipuria, Non-executive Chairman
At the beginning of the year Nil Nil
Increase / Decrease in Shareholding during the year:
No change during the year
At the end of the year Nil Nil
Mr. Varun Jaipuria, Whole-time Director
At the beginning of the year 39,175,500 21.45
Increase / Decrease in Shareholding during the year:
28/06/2019 (Transfer) (5,400,000) (2.96) 33,775,500 18.49
09/08/2019 (Bonus Shares) 16,887,750 6.16 50,663,250 18.49
At the end of the year 50,663,250 17.55
Mr. Raj Gandhi, Whole-time Director
At the beginning of the year 407,500 0.22
Increase / Decrease in Shareholding during the year:
09/08/2019 (Bonus Shares) 203,750 0.07 611,250 0.22
At the end of the year 611,250 0.21
Mr. Kapil Agarwal, Whole-time Director & Chief Executive Officer
At the beginning of the year 406,976 0.22
Increase / Decrease in Shareholding during the year:
09/08/2019 (Bonus Shares) 203,488 0.07 610,464 0.22
23/08/2019 (Transfer) (200,000) (0.07) 410,464 0.15
At the end of the year 410,464 0.14
CORPORATE OVERVIEW FINANCIAL STATEMENTS
Annual Report 2019 75

For Each of the Directors and KMP Shareholding at the beginning of the year
Cumulative Shareholding during the year
No. of shares % of total shares of the Company
No. of shares % of total shares of the Company
Mr. Rajinder Jeet Singh Bagga*, Whole-time Director
At the beginning of the year 87,500 0.05
Increase / Decrease in Shareholding during the year:
08/02/2019 (Transfer) (1,000) 0.00 86,500 0.05
09/08/2019 (Bonus Shares) 43,250 0.02 129,750 0.04
At the end of the year 129,750 0.04
Dr. Naresh Trehan, Independent Director
At the beginning of the year Nil Nil
Increase / Decrease in Shareholding during the year:
No change during the year
At the end of the year Nil Nil
Dr. Ravi Gupta, Independent Director
At the beginning of the year Nil Nil
Increase / Decrease in Shareholding during the year:
No change during the year
At the end of the year Nil Nil
Mr. Pradeep Sardana, Independent Director
At the beginning of the year 858 0.00
Increase / Decrease in Shareholding during the year:
09/08/2019 (Bonus Shares) 429 0.00 1,287 0.00
At the end of the year 1,287 0.00
Ms. Rashmi Dhariwal, Independent Director
At the beginning of the year Nil Nil
Increase / Decrease in Shareholding during the year:
No change during the year
At the end of the year Nil Nil
Ms. Sita Khosla, Independent Director
At the beginning of the year Nil Nil
Increase / Decrease in Shareholding during the year:
No change during the year
At the end of the year Nil Nil
Mr. Kamlesh Kumar Jain**, Whole-time Director & Chief Financial Officer
At the beginning of the year 17,090 0.01
Increase / Decrease in Shareholding during the year:
09/08/2019 (Bonus Shares) 8,545 0.00 25,635 0.01
At the end of the year 25,635 0.01
Mr. Ravi Batra, Chief Risk Officer & Group Company Secretary
At the beginning of the year Nil Nil
Increase / Decrease in Shareholding during the year:
No change during the period
At the end of the year Nil Nil
Varun Beverages Limited76

STATUTORY REPORTS
For Each of the Directors and KMP Shareholding at the beginning of the year
Cumulative Shareholding during the year
No. of shares % of total shares of the Company
No. of shares % of total shares of the Company
Mr. Vikas Bhatia***, Chief Financial Officer
At the beginning of the year Nil Nil
Increase / Decrease in Shareholding during the year:
14/03/2019 (Transfer) 500 0.00 500 0.00
29/03/2019 (Transfer) 2,723 0.00 3,223 0.00
05/04/2019 (Transfer) 1,377 0.00 4,600 0.00
12/04/2019 (Transfer) 454 0.00 5,054 0.00
09/08/2019 (Bonus Shares) 2,527 0.00 7,581 0.00
15/11/2019 (Transfer) 919 0.00 8,500 0.00
22/11/2019 (Transfer) 100 0.00 8,600 0.00
13/12/2019 (Transfer) 200 0.00 8,800 0.00
At the end of the year 8,800 0.00
*Appointed with effect from May 2, 2019. **Resigned from the position of Whole-time Director & Chief Financial Officer with effect from August 1, 2019.
***Appointed with effect from August 1, 2019.
Note: Figures under () denotes sale while other denotes purchase.
V. Indebtedness
Indebtedness of the Company including interest outstanding /accrued but not due for payment
(` in million)
Particulars Secured Loans excluding deposits
Unsecured Loans Deposits Total Indebtedness
Indebtedness at the beginning of the financial year
(i) Principal Amount 24,805.78 548.61 - 25,354.39
(ii) Interest due but not paid - - - -
(iii) Interest accrued but not due 100.58 - - 100.58
Total (i+ii+iii) 24,906.36 548.61 - 25,454.97
Change in Indebtedness during the financial year
Addition 18,501.32 2,000.00 - 20,501.32
Reduction (13,328.49) (548.61) - (13,877.10)
Others* 56.79 - - 56.79
Net Change 5,229.62 1,451.39 - 6,681.01
Indebtedness at the end of the financial year
(i) Principal Amount 30,008.37 2,000.00 - 32,008.37
(ii) Interest due but not paid - - - -
(iii) Interest accrued but not due 127.61 - - 127.61
Total (i+ii+iii) 30,135.98 2,000.00 - 32,135.98
*Includes impact of fair value changes and exchange fluctuation.
Notes: 1. Indebtedness includes deferred payment liabilities.
2. Working capital facilities are taken on net basis.
CORPORATE OVERVIEW FINANCIAL STATEMENTS
Annual Report 2019 77

VI. Remuneration of Directors and Key Managerial Personnel
A. Remuneration to Managing Director, Whole-time Directors and/or Manager:
(` in million)
Sl. No.
Particulars of Remuneration
Mr. Varun Jaipuria,
Whole-time Director
Mr. Raj Gandhi,
Whole-time Director
Mr. Kapil Agarwal,
Whole-time Director & Chief
Executive Officer
Mr. Kamlesh Kumar Jain*,
Whole-time Director & Chief
Financial Officer
Mr. Rajinder Jeet Singh
Bagga**, Whole-time
Director
Total Amount
1. Gross Salary
(a) Salary as per provisions contained in section 17(1) of the Income Tax Act, 1961
31.45 48.51 57.12 9.89 18.44 165.41
(b) Value of perquisites under section 17(2) of the Income Tax Act, 1961
0.04 0.04 0.03 0.00 0.04 0.15
(c) Profits in lieu of salary under section 17(3) of the Income Tax Act, 1961
0.00 0.00 0.00 0.00 0.00 0.00
2. Stock Option 0.00 0.00 0.00 0.00 0.00 0.00
3. Sweat Equity 0.00 0.00 0.00 0.00 0.00 0.00
4. Commission
- as % of profit 0.00 0.00 0.00 0.00 0.00 0.00
- others, specify 0.00 0.00 0.00 0.00 0.00 0.00
5. Others, please specify 0.00 0.00 0.00 0.00 0.00 0.00
Total (A) 31.49 48.55 57.15 9.89 18.48 165.56
Ceiling as per the Act 630.87 (being 10% of the Net Profit of the Company calculated as per Section 198 of the Companies Act, 2013)
*Resigned from the position of Whole-time Director & Chief Financial Officer with effect from August 1, 2019.**Appointed with effect from May 2, 2019.
Note: Remuneration of Mr. Varun Jaipuria and Mr. Raj Gandhi includes incentive of ` 0.23 million and ` 10.00 million respectively during the Financial Year 2019.
B. Remuneration to other Directors (Non-executive Directors including Independent Directors):
(` in million)
Sl. No.
Particulars of Remuneration Dr. Ravi Gupta
Mr. Pradeep Sardana
Ms. Rashmi Dhariwal
Ms. Sita Khosla
Total Amount
1. Fee for attending Board/Committee Meetings 1.90 0.80 3.00 1.90 7.60
2. Commission 0.00 0.00 0.00 0.00 0.00
3. Others, please specify 0.00 0.00 0.00 0.00 0.00
Total (B) 1.90 0.80 3.00 1.90 7.60
Total Managerial Remuneration (A+B) 173.16
Overall Ceiling as per the Act 693.96 (being 11% of the Net Profit of the Company calculated as per Section 198 of the Companies Act, 2013)
Varun Beverages Limited78

STATUTORY REPORTS
C. Remuneration to Key Managerial Personnel other than MD/ Manager/ WTD
(` in million)
Sl. No.
Particulars of Remuneration Mr. Ravi Batra, Chief Risk Officer & Group Company Secretary
Mr. Vikas Bhatia, Chief Financial Officer*
Total
1. Gross Salary
(a) Salary as per provisions contained in section 17(1) of the Income Tax Act, 1961
8.23 7.72 15.95
(b) Value of perquisites under section 17(2) of the Income Tax Act, 1961
0.00 0.00 0.00
(c) Profits in lieu of salary under section 17(3) of the Income Tax Act, 1961
0.00 0.00 0.00
2. Stock Option 0.00 0.00 0.00
3. Sweat Equity 0.00 0.00 0.00
4. Commission
- as % of profit 0.00 0.00 0.00
- others, specify 0.00 0.00 0.00
5. Others, please specify 0.00 0.00 0.00
Total 8.23 7.72 15.95
*Appointed with effect from August 1, 2019.
VII. Penalties / Punishment / Compounding of offences:
Type Section of the Companies Act
Brief Description
Details of Penalty/ Punishment /
Compounding fees imposed
Authority [RD/ NCLT/ COURT]
Appeal made, if any (give
details)
A. Company
Penalty
Punishment
Compounding
B. Directors
Penalty
Punishment
Compounding
C. Other Officers in Default
Penalty
Punishment
Compounding
For and on behalf of the Board of Directors
For Varun Beverages Limited
Ravi JaipuriaDate: February 7, 2020 ChairmanPlace: Gurugram DIN: 00003668
None
CORPORATE OVERVIEW FINANCIAL STATEMENTS
Annual Report 2019 79

Management Discussion & Analysis
Economic overview & outlook
Global Economy
The global economy witnessed moderate growth in the
year 2019, following a slowdown across most advanced
and developing nations. Increasing trade barriers, rising
geo-political tensions, and lower industrial output have
cumulatively affected global growth during the year. IMF
estimates that global GDP grew by 2.9% in 2019. However,
in 2020, the world economy is expected to show a steady
rebound. With the stabilization of economic conditions,
recovery in investments, and easing trade tensions, IMF
expects global growth to edge up to 3.3% in 2020 and
3.4% in 2021.
Indian Economy
In fiscal 2019, India clocked a GDP growth rate of 6.8%,
thus maintaining the tag of the fastest-growing major
economy in the world. Although economic growth during
the second half of fiscal 2019 slowed down, given the
deceleration in investments and private consumption
following lower income growth, rural stress, and NBFC
liquidity issues, the Government of India has announced
a series of structural reforms to boost sustainable
economic growth. Among these are liberalization of FDI
flows and corporate tax reforms, including a massive
reduction in the corporate tax rate. These measures
are expected to increase capital inflows, to stabilize the
financial structure, improve investments, and strengthen
the overall business environment in the country.
The Indian economy is expected to pick up momentum
from the second half of fiscal 2020, on the back of
accommodative fiscal and monetary policy and reform
implementations. According to IMF, the growth in India is
projected at 6.1% in fiscal 2020 and is then expected to
rebound to 7.0% in fiscal 2021. The GDP rise would have a
cascading effect on consumer spending, which would in
turn further drive growth.
Source: IMF, World Bank
Soft Drinks Market Overview & Outlook
The soft drinks industry in India is expected to report
a broad-based growth across categories. While soft
drinks consumption is on the rise in India, the sector
is still notably underpenetrated as compared to global
averages as well as other emerging markets. The
main segments of the soft drinks market in India are
carbonates, juices, and bottled water. In value terms,
carbonates are the largest category, while bottled water
is the largest in volume terms.
Key Growth Drivers of Soft Drinks and Opportunities
With a population of 1.3 billion and an average age of 29,
as well as a rapidly growing middle-class that spends a
high proportion of its disposable income on food and
beverages, India boasts a large consumer base. The
Indian soft drinks industry has huge potential and there
are a number of key drivers, which include:
Demographic profile: India is a young country with
individuals in the 15-64 age group accounting for the
majority of the overall population, thus providing the
country with a large workforce to support economic
growth. The demographics, higher spending capacity of
young consumers, rapid urbanization, and growing rural
consumption are expected to drive consumption of soft
drinks in India.
Rising affordability and urbanization: With more than
50% of India’s population falling under the working age
category, there has been a rise in disposable income,
leading to a substantial change in spending patterns.
Also, the trend of more and more women coming into the
Indian workforce has led to an increase in the disposable
income of families, thus resulting in higher average
household consumption, including the consumption of
quality soft drinks.
Much room for market penetration: In India, the soft drinks
industry is relatively underdeveloped, with low penetration
of the potential consumer base. Per capita consumption
here is far lower than global averages, despite high
industry growth rates witnessed in the country.
Innovative offerings: A large young population is driving
demand for new and innovative flavors in India. In sync
with these trends, the industry is focused on continuously
expanding and innovating its product offerings.
Growing middle-class: India is home to one of the largest
and fastest growing middle-class populations anywhere
in the world. The rising aspirations of this segment
will boost consumption across categories, including
beverages.
Electrification in India: The target of 100% electrification
of all villages in India, along with improving overall
electricity supply, will help enhance cooling infrastructure
in these regions, thereby supporting growth of the soft
drinks industry.
Varun Beverages Limited80

STATUTORY REPORTS
Hyper-localization: Higher spending on packaged
products and continuous innovations towards specific
requirements, especially in rural India, in terms of pack
sizes and glass bottles is likely to enhance product
affordability and strengthen growth rates.
Location: The majority of the Indian population live in
hot and dry regions. This is expected to steadily drive
consumption of soft drinks for the foreseeable future.
Novel packaging solutions: Manufacturers are
increasingly innovating the packaging and labeling of
products to suit the end consumers’ needs and to drive
consumption.
Business Overview – A Key Player in the Beverage Industry
VBL Presence
Varun Beverages Limited (VBL) is a key player in the
beverage industry. The Company’s operations span 6
countries – 3 in the Indian Subcontinent (India, Sri Lanka,
Nepal), which contributed 85% to total revenues, and 3 in
Africa (Morocco, Zambia, Zimbabwe), which contributed
15% of revenues in CY19.
Symbiotic Relationship with PepsiCo
The Company enjoys a strategic, symbiotic, and
longstanding association with PepsiCo spanning 28
years, since the latter’s entry into India, accounting for
80%+ of its sales volumes in India. VBL manufactures,
markets, and distributes PepsiCo-owned products, which
include carbonated soft drinks (CSDs), carbonated
juices, juice-based beverages, energy drinks, and non-
carbonated beverages (NCBs) such as packaged bottled
water, through its vast manufacturing facilities and well-
established distribution network. The various PepsiCo
brands manufactured and distributed by VBL include
Pepsi, Pepsi Black, Diet Pepsi, Pepsi Max, Mirinda Lemon,
Mirinda Orange, Mountain Dew, Slice Fizzy, 7up, 7up
Nimbooz Masala Soda, Teem, Sting, Evervess, Tropicana
Slice, Tropicana Frutz (Lychee, Apple and Mango),
Tropicana Juices (100%, Delight and Essentials), 7up
Nimbooz, Gatorade, Ole, as well as packaged drinking
water under the brand Aquafina and Aquavess.
The Company has strong sales teams that work closely with
PepsiCo to develop and implement local advertising and
marketing strategies. Franchise rights have also been given
to the Company for various PepsiCo products across 27
States and 7 Union Territories in India as well as territories
of Nepal, Sri Lanka, Morocco, Zambia, and Zimbabwe.
Business Model
The Company produces and distributes a wide range of
CSDs and a large selection of NCBs, including packaged
drinking water. It has a unique business model with
end-to-end execution capabilities from manufacturing,
distribution and warehousing, customer management
and in-market execution, to managing cash flows and
future growth. PepsiCo offers brands, concentrates, and
marketing support to VBL, which then takes complete
control over the manufacturing and supply chain
processes, driving market share gains, enhancing cost
efficiencies, and managing capital allocation strategies.
VBL has vast experience in managing the distribution of
soft drinks, involving complex logistics and packaging
of products. While business operations in each market
are similar, each territory and sub-territory presents
specific operational challenges, varying from electricity
supply, cooling equipment, and logistics infrastructure
to the demographic profile and general socio-economic
conditions in that particular market.
Trademarks
Formulation through Concentrate
Product & Packaging innovation
through investment in R&D
Consumer Pull Management (ATL) -
Brand Development
PepsiCo – Demand Creation
Production Facilities
Sales & Distribution - GTM & Logistics
In-outlet Management - Visi-Coolers
Consumer Push Management (BTL) -
Market Share Gain
VBL – Demand Delivery
~80% of PepsiCo
India Sales
Volume
28 Years + Association
CORPORATE OVERVIEW FINANCIAL STATEMENTS
Annual Report 2019 81
The Company’s solid and well-entrenched distribution
network covers urban, semi-urban, and rural markets,
addressing demands of a wide range of consumers. The
distribution network is strategically located to maximize
market penetration across licensed sub-territories in India,
with an increased focus on higher growth markets such
as semi-urban and rural sub-territories. The Company’s
production capabilities and distribution network enable
it to effectively respond to competitive pressures and
evolving consumer preferences. As of December 31, 2019,
the Company has 32 state-of-the-art manufacturing
facilities in India, 6 internationally. It has a robust supply
chain with 90+ owned depots, 2,500+ owned vehicles,
1,500+ primary distributors, and currently installed
775,000+ visi-coolers.
VBL regularly undertakes strategic initiatives for
improving operational excellence. These include
backward integration of its production processes and
centralized sourcing of raw materials. The Company has
established backward integration facilities for production
of preforms, crowns, plastic closures, corrugated boxes,
corrugated pads, plastic crates, and shrink-wrap films in
certain facilities to ensure operational efficiencies and
high quality standards.
With its committed and knowledgeable sales staff, the
organization focuses on driving growth and expanding
market share across categories through various customer
push strategies. It undertakes local level promotion,
in-store activations, customer relation management,
merchandizing, individual account management,
and evaluation of high-demand regions for strategic
placement of vending machines and visi-coolers.
Over the years, VBL has expanded its operations in
India through the acquisition of additional territories
from PepsiCo as well as previously franchised territories.
In CY19, the Company concluded the acquisition of
franchise rights in South and West regions from PepsiCo
for a national bottling, sales, and distribution footprint
in 7 States and 5 Union Territories of India. With this
acquisition, VBL now accounts for 80%+ of PepsiCo
India’s beverage sales volumes in India, up from 51%
earlier, and has expanded its presence to 27 States and 7
Union Territories across India.
Key Business Developments – 2019
Acquisition of sub-territories:
Concluded the acquisition of PepsiCo India’s
previously franchised territories of parts of
Maharashtra (14 districts), parts of Karnataka (13
districts), and parts of Madhya Pradesh (3 districts).
These territories have significant potential to further
drive market share gains and margins.
Concluded the acquisition of franchise rights in
South and West regions from PepsiCo for a national
bottling, sales, and distribution footprint in 7 States
and 5 Union Territories of India w.e.f. May 1, 2019. This
enables improved cost and operational efficiencies
as well as economies of scale.
Bottling Appointment and Trademark License
Agreement for India
Particular Existing Revised
Franchise Rights (up to)
October 2, 2022 April 30, 2039
QIP Issue:
Raised ~` 9,000 million through fresh issue of
14,705,882 equity shares of ` 10. The entire proceeds
of the qualified institutions placement (QIP), net of
issue expenses of ` 164.36 million, were utilized for
repayment of debts during CY19. The capital raised
considerably strengthens VBL’s balance sheet and
provides room for sustained future growth.
Credit Rating Upgrade:
CRISIL (an S&P Global Company) has upgraded the
Company’s credit rating for long-term debt as CRISIL
AA (previously AA-) and reaffirmed for short-term
debt as CRISIL A1+.
New Product Launches:
Introduced three variants of ambient temperature
value-added dairy beverages – Belgian Chocolate,
Cold Coffee, and Mango Shake – at a price of ` 30
for 200ml PET bottle with a long shelf life of 180
days. These products have been well received in the
market.
Awards & Accolades:
Best FMCG Corporate Governance India during
Corporate Governance Awards 2019, organized by
Capital Finance International, London (UK).
Bottler of the Year 2019 by PepsiCo in South Asia
region.
Global Best Employer Brands 2020 (Best HR
Strategy), presented by ET Now.
Varun Beverages Limited82

STATUTORY REPORTS
National Best Employer Brands for 2019, presented
by Employer Branding Institute India. The Company
received this award for the second successive year.
Bonus Issue of Equity Shares / Dividend payout:
The Company’s Board of Directors agreed to
formalize a dividend strategy in line with good
corporate governance practices, with the Company’s
listing in November 2016. For a detailed perspective,
please refer to the Company’s website at
www.varunpepsi.com.
At the beginning of the Company’s Silver Jubilee
Year and in appreciation of the continued support of
the Company’s shareholders, the Board of Directors
proposed and declared Bonus Issue of equity shares
in the proportion of 1 equity share for each of the 2
equity shares held. These were allocated to eligible
shareholders.
The Board of Directors has approved an interim
dividend of ̀ 2.50 per share in Q3 CY19 in accordance
with the dividend policy guidelines. Total cash
outflow was ` 776.69 million (including payable net
statutory taxes).
Sustainability Initiatives
PET Recycling:
The Company uses ~ 66,000 MT PET resin as
packaging material for its finished products annually.
These are high-quality food grade virgin PET chips,
which can be easily recycled to make various
products for diverse industries and end uses.
During the year, the Company has engaged with
GEM Enviro Management Pvt. Ltd. for phased
implementation of 100% recycling of used PET
bottles through collection from end users by
placing dustbins / reverse vending machines, direct
collection from institutions (hotels, banquet halls,
exhibitions, etc.) and spreading awareness through
workshops.
o GEM Enviro Management Pvt. Ltd., a Delhi-
based Central Pollution Control Board (CPCB)-
recognized PRO (Producer Responsible
Organization) company, specializes in:
Collection and recycling of packaging
waste.
Promotion of recycled green products like
T-shirts, bags etc. made from recycling of
waste material such as used PET bottles.
In the first year of engagement, during the second
half of CY19, 24,000+ MT of PET waste has been
recycled.
Water Positive Balance:
The Company engaged TUV India Pvt. Ltd. for its
water footprint assurance, wherein water mass
balance and its various initiatives towards water
conservation and water recharge were verified.
o About TÜV NORD Group: Founded in 1869,
during the Industrial Revolution, it was
established as an industrial self-control
organization for providing independent,
neutral, third-party services. With a current
workforce of over 14,000 employees across 70
countries globally, the TÜV NORD Group is one
of the world’s largest inspection, certification &
testing organizations.
o About TUV India: TUV India Private Ltd. was
established in 1989 as part of the German
RWTÜV group’s Indian operations. Being one of
the first certification bodies to start operations
in India, TUV India has been closely associated
with the quality revolution in India.
The scope of audit covered 20 manufacturing plants
of VBL in India, which the Company operated from
April 2018 to March 2019. Key water conservation
initiatives included rainwater harvesting; ponds
adoption, development & maintenance; and waste
water management on the principles of reduce,
reuse and recycle.
The key findings from the report, are as follows:
Parameter Amount
Water consumption 2.91 mn KL
Water recharge 4.96 mn KL
Number of ponds adopted 64
Total area of adopted ponds 0.9 mn sq. m.
Number of trees planted 26,000+
CORPORATE OVERVIEW FINANCIAL STATEMENTS
Annual Report 2019 83

Profit & Loss
Particulars (` million) CY19 CY18 YoY (%)1. Income
(a) Revenue from operations 72,484.6 52,281.3 38.6%
(b) Excise duty 1,188.8 1,228.7 -3.2%
Net revenues 71,295.8 51,052.5 39.7%
(c) Other income 425.3 218.2 94.9%
2. Expenses
(a) Cost of materials consumed 29,395.6 21,122.8 39.2%
(b) Purchase of stock-in-trade 4,237.3 1,942.2 118.2%
(c) Changes in inventories of FG, WIP and stock-in-trade (1,438.6) (624.0) 130.6%
(d) Employeebenefitsexpense 8,108.2 5,829.5 39.1%
(e) Finance costs 3,096.4 2,125.6 45.7%
(f) Depreciation and amortization expense 4,886.3 3,850.7 26.9%
(g) Other expenses 16,516.8 12,716.2 29.9%
Total expenses 64,802.0 46,963.0 38.0%
EBITDA 14,476.5 10,065.9 43.8%
3. Profitbeforetaxandshareofprofitinassociate(1-2) 6,919.1 4,307.8 60.6%
4. Shareofprofitinassociate 43.6 30.2 44.4%
5. Profit before tax (3+4) 6,962.7 4,338.0 60.5%
6. Tax expense 2,240.7 1,339.3 67.3%
7. Net profit for the period (5-6) 4,722.1 2,998.6 57.5%
Balance Sheet
Particulars (` million) 31-Dec-19 31-Dec-18
Equity and liabilities
Equity
(a) Equity share capital 2,886.9 1,826.4
(b) Other equity 30,397.3 18,158.6
(c) Non-controlling interest 306.8 77.7
Total equity 33,591.0 20,062.7
Liabilities
Non-current liabilities
(a) Financial liabilities
(i) Borrowings 23,553.8 19,800.7
(b) Provisions 1,703.4 1,052.6
(c) Deferred tax liabilities (Net) 2,825.1 1,921.7
(d) Other non-current liabilities 8.2 67.8
Total non-current liabilities 28,090.4 22,842.7
Current liabilities
(a) Financial liabilities
(i) Borrowings 4,671.5 3,776.6
(ii) Trade payables 4,776.6 3,168.0
(iii)Otherfinancialliabilities 10,258.1 8,512.4
(b) Other current liabilities 2,044.9 1,466.6
(c) Provisions 299.8 160.2
(d) Current tax liability 152.0 325.0
Total current liabilities 22,202.9 17,408.7
Total liabilities 50,293.3 40,251.4
Total equity and liabilities 83,884.3 60,314.1
Particulars (` million) 31-Dec-19 31-Dec-18
Assets
Non-current assets
(a) Property, plant and equipment
58,925.0 38,601.8
(b) Capital work-in-progress 638.2 3,523.6
(c) Goodwill 242.3 19.4
(d) Other intangible assets 5,623.1 5,248.6
(e) Investment in associates - 112.4
(f) Financial assets 454.4 209.3
(g) Deferred tax assets (Net) 128.5 334.0
(h) Other non-current assets 1,154.0 857.6
Total non-current assets 67,165.5 48,906.6
Current assets
(a) Inventories 8,815.1 5,784.0
(b) Financial assets
(i) Trade receivables 1,725.6 1,280.3
(ii) Cash and cash equivalents
1,379.7 429.4
(iii) Other bank balances 331.1 505.4
(iv) Loans 69.4 15.5
(v) Others 2,189.8 1,404.8
(c) Current tax assets (Net) 10.2 4.1
(d) Other current assets 2,198.0 1,984.0
Total current assets 16,718.8 11,407.5
Total assets 83,884.3 60,314.1
Varun Beverages Limited84

STATUTORY REPORTS
Depreciation has increased by 26.9% in CY19 owing to
capitalization of the Pathankot plant and consolidation
of South and West India sub-territories w.e.f. May 1, 2019.
Finance cost has increased by 45.7% in CY19, as the
purchase consideration for acquisition of South and West
India sub-territories has been funded through debt. The
entire proceeds of the QIP amounting to ~ ` 9,000 million
were utilized for repayment of debts during Q3 CY19. In
2019, PAT increased by 57.5% to ` 4,722.2 million in CY19
on the back of robust volume growth.
On September 20, 2019, vide the Taxation Laws
(Amendment) Ordinance 2019, the Government of India
inserted Section 115BAB in the Income Tax Act 1961, that
provides domestic companies a non-reversible option
to pay corporate tax at reduced rates effective April
1, 2019, subject to certain conditions. As VBL carries
unutilized minimum alternative tax credit and has other
tax benefits/holidays available, the management plans
to conclude its evaluation of this option in conjunction
with its tax year end of March 31, 2020. The Company has
availed the benefit of lower MAT, resulting in a net saving
in cash flow of ` 194.3 million.
On the balance sheet front, net debt stood at ` 32,461
million as on December 31, 2019, as against ̀ 26,715 million
as on December 31, 2018. Debt-to-equity ratio stood at
0.97x as on December 31, 2019. Working capital days have
remained stable at ~ 26 days as on December 31, 2019, on
account of efficient working capital management even
after consolidation of new sub-territories in India during
the period. Inventory, creditor, and debtor days have
remained stable even with increase in net revenues and
number of production facilities.
20
15
20
9
31
20
16
22
4
52
20
17
22
4
55
20
18
27
4
66
20
19
40
4
89
Sales Volume
The Company follows a calendar year for reporting.
Owing to the seasonality aspect of the soft drinks
business, whereby the majority of sales happen in the
summer months, it is best to monitor the Company’s
performance on an annual basis. Revenues and profits
follow a bell-curve with a significant portion accruing in
the April-June quarter.
The Company has delivered a solid operational and
financial performance in CY19. Revenue growth stood at
39.7% YoY to ` 71,295.8 million. Total sales volumes were
up 45% YoY at 492.7 million unit cases in CY19, compared
to 340 million unit cases in CY18. The performance was
primarily driven by robust volumes reported in both the
Indian and International markets.
Improved performance in under-penetrated territories
acquired in CY17 and early CY18 resulted in a healthy
organic volume growth of 13% in the domestic business.
The international business also registered a solid growth
of 34%, driven by double-digit growth in the key markets
of Morocco, Zimbabwe, and Sri Lanka. In addition to
this, the full year performance also includes the impact
of South and West India sub-territories acquisition from
May 2019 onwards. CSD constituted 70.6%, juice 6.7%,
and packaged drinking water 22.7% of total sales volumes
in CY19.
For CY19, EBITDA increased by 43.8% to ` 14,476.5
million. Even though gross margins declined by 120 bps
during CY19 due to change in product mix and higher PET
prices, EBITDA margins expanded by 59 bps in CY19 to
20.3% on account of operating leverage in the business.
Total Sales Volumes (MN Cases*)
CAGR 2015-19 ~ 19.7%India International
*A unit case is equal to 5.678 liters of beverage divided in 24 bottles of ~ 237 ml each
CORPORATE OVERVIEW FINANCIAL STATEMENTS
Annual Report 2019 85

Growth Outlook
To periodically launch innovative products in select markets in line with changing consumer preferences.
Focus on non-cola carbonated beverages and NCB’s.
Bottled water provides significant growth opportunity.
Contiguous territories/markets offer better operating leverage and asset utilization - economies of scale
Production and logistics optimization
Packaging synchronization and innovations
Technology use to improve sales and operations processes
Repayment of debt through strong cash generation
To enable significant interest cost savings
Penetrate newer geographies - to complement existing operations in India
Identify strategic consolidation opportunities in South Asia / Africa
Well-positioned to leverage PepsiCo brand to increase market penetration in licensed territories.
Consolidating existing distributors and increasing distribution in under-penetrated regions. Market Share
Gains
Diversified
Portfolio
Operating
LeverageAcquisitions
Strengthen
Balance Sheet
VBL’s comprehensive infrastructure, diversified product
portfolio, well-established distribution network, unique
business model, and seasoned management team with a
strong understanding of business dynamics have enabled
it to deliver high growth over the years.
With consumer demands and preferences continuously
changing, VBL strongly values flexibility to adapt its
proposition to remain relevant. It will remain agile
by changing its portfolio and processes, powered by
creativity and flexibility, in response to macroeconomic
conditions and shifts in consumer preferences.
Going forward, the Company aims to continue expanding
its product portfolio and distribution reach, focus on
increasing volumes, particularly in markets with lower
penetration. Currently, VBL is focused on leveraging the
newly acquired territories in West and South, which are
highly underpenetrated. The Company believes that the
new territories offer tremendous opportunity to grow
and will help achieve scale and business efficiency in the
coming years.
Threats, risks and concerns
The risks and opportunities of all corporations are inherent
and inseparable elements. Directors and management of
the Company take constructive decisions to protect the
interests of stakeholders. The Company has in place a Risk
Management Policy, which is monitored and reviewed
under the guidance of the Audit, Risk Management and
Ethics Committee. The Committee comprises various
departmental heads who meet regularly to identify
processes exposed to risks, determine risk mitigation
strategies, and monitor their implementation.
Varun Beverages Limited86

STATUTORY REPORTS
Risk Description Mitigation
1. Demand Risk A cyclical downturn can lead to a slowdown in the Company’s target markets and impact its sales velocity.
Over the years, the Company has demonstrated its ability to drive significantgrowthinsalesvolumesbyaimingtoprovidetherightbrand, the right price, the right product, and the right channel. In addition, the business is present in relatively under-penetrated markets with favorable demographics, climatic conditions, and rising populations that should witness steady demand growth. Further, its wide range of product portfolio enables it to cater to diverse consumer segments.
2. Business Agreement Risk
The Company relies on strategic relationships and agreements with PepsiCo. Termination of agreements or less favorable renewal terms could adversely affectprofitability.
Over the past two decades, the Company has been in partnership with PepsiCo, consolidating its market relationship with them, increasing the number of licensed territories and sub-territories, producing and distributing a wider range of PepsiCo drinks, adding multiple SKUs into the portfolio, and expanding distribution network. The proven ability of the business to substantially strengthen the market share of PepsiCo enables it to be a reliable partner. The business maintains a symbiotic relationship with PepsiCo, working closely as active development partners, investing in joint projects and business planning with a focus on strategic issues. In 2019, bottling appointment and trademark license agreement for India with PepsiCo India has been extended till April 30, 2039, from October 2, 2022, earlier.
3. Regulatory Risk Regulations on consumer health and the risk of the Company’s products being targeted for discriminatory tax and packaging waste recovery may adversely impact business.
The Company proactively works with PepsiCo, governments and regulatory authorities to ensure that the facts are clearly understood and that its products are not singled out unfairly. VBL adheres to the sustainable manufacturing practices and takes very seriously the environmental issues related to packaging and waste recovery. The Company consistently works together with stakeholders to establish sustainability solutions that focus on protecting the environment, including NGOs and the communities in which it operates. PepsiCo’s strategy of introducing healthier and zero sugar variant of products also augurs well for the Company’s future.
4. Business Viability Risk
An inability to integrate the operations of, or leverage potential operating and cost efficienciesfrom,thenewly acquired territories and sub-territories may adversely affect the Company’s business andfuturefinancialperformance.
Theclearstrategyandfinancial requirementsofVBLensurethatall future acquisitions or collaborations are value-added and in compliance with the acquisition guidelines of the Board. The Companyalsospendsconsiderablemanagementtimeandfinancialresources to ensure the performance of the newly acquired activities, develop local market strategies (including for possible cultural and language barriers), and assimilate business practices to ensure business viability.
5. Consumer Preference Risk
Failure to adapt to changing consumer health trends and address misconceptions about the health effects of soft drink consumption may adversely affect demand.
In order to remain relevant, VBL's sales team works closely with PepsiCo to assess evolving consumer habits and continually concentrate on product innovation and increasing product range. In addition, the new product plan of PepsiCo lays more emphasis on healthy products with zero / limited calorie content and sugar content.
6. Raw Material Risk
An interruption in the supplyorsignificantincrease in the price of raw materials or packaging materials may adversely affect the Company’s business prospects, results ofoperationsandfinancialcondition.
AnintegralpartofVBL'sstrategyistomaximizecostefficiencies,focusing on actively reducing the cost of goods sold, minimizing operatingexpensesefficientlyandincreasingcashflows.Hence,thebusiness has pursued many programs for this purpose, including backward integration and consolidated sourcing of materials. It also leverages on its scale of operations to achieve better bargaining power with suppliers resulting in better working capital management. The Company is focused on optimally utilizing its assets to help achieve higher operating efficiency and to amortize overheadscosts on a wider case. In addition, the Company continues to invest in innovativesolutionstoboostoperationalefficienciesandworkprocesses in its activities, ensuring consolidated operational data from production, scheduled sourcing, and superior monitoring of the supply of goods from manufacturers to the retail point of sale.
CORPORATE OVERVIEW FINANCIAL STATEMENTS
Annual Report 2019 87

Human Resources
As of December 31, 2019, VBL employed 11,000+
fulltime employees globally (8,500+ in India and
2,500+ in international subsidiaries). The Company
recognizes the need for talent management throughout
the business and its criticality to future growth and
success like any other element of its commercial
strategy. A significant emphasis is placed on training
personnel, increasing their skill levels, and fostering
ongoing employee engagement. VBL organizes in-
house training for employees through skill-building
programs and professional development programs at
all levels and across all functions. Key employees also
attend management and staff development programs
organized by PepsiCo as well as at leading management
institutions of India.
Risk Management, Audit and Internal Control System
The Company has well-equipped and effective internal
control systems in place that match the scale of its sector
and the complexity of the market it works in. Such stringent
and detailed controls ensure the effective and productive
use of resources, to the degree that the Company’s assets
and interests are safeguarded, transactions are approved,
registered and properly reported, and checks and balances
guarantee reliability and consistency of accounting data.
The Audit, Risk Management and Ethics Committee is
undertaking a comprehensive system of internal audits
and periodic assessments to ensure compliance with best
practices. The Company has appointed Walker Chandiok
& Co. LLP, Chartered Accountants, and M/s APAS & Co.,
Chartered Accountants, the Joint Statutory Auditors
of the Company to report on the Financial Controls of
the Company.
Varun Beverages Limited88

STATUTORY REPORTS
Business Responsibility Report
Section A: General information about the Company
Sl. No.
Particulars Details
1. Corporate Identity Number (CIN) of the Company L74899DL1995PLC069839
2. Name of the Company Varun Beverages Limited
3. Registered address F-2/7, Okhla Industrial Area, Phase – I, New Delhi - 110 020
4. Website www.varunpepsi.com
5. E-mail id [email protected]
6. Financial Year reported January 1, 2019 to December 31, 2019
7. Sector(s) that the Company is engaged in(industrial activity code wise)
ITC Code - 220600Manufacturing and Distribution of Carbonated, Non-carbonated beverages and packaged drinking water
8. List three key products / services that the Company manufactures / provides (as in balance sheet)
Pepsi, Mountain Dew and Tropicana Juices
9. Total number of locations where business activity is undertaken by the Company
(i) Number of International Locations (Provide details of major 5)
Nepal, Sri Lanka, Morocco, Zambia and Zimbabwe
(ii) Number of National Locations Presence in 27 States and 7 Union Territories
10. Markets served by the Company – Local / State / National / International
India, Nepal, Sri Lanka, Morocco, Zambia and Zimbabwe
Section B: Financial details of the Company
Sl. No.
Particulars Details
1. Paid-up Capital ` 2,886.89 million
2. Total Turnover ` 56,156.64 million
3. Total profit after taxes ` 4,485.47 million
4. Total Spending on Corporate Social Responsibility (CSR) as percentage of profit after tax (%)
1.28% of profit after tax of Financial Years 2019
5. List of activities in which expenditure in 4 above has been incurred
Please refer Annexure – D to the Board’s Report
Section C: Other details
Sl. No.
Particulars Details
1. Does the Company have any Subsidiary Company/ Companies? Yes
2. Do the Subsidiary Company/ Companies participate in the BR Initiatives of the parent company? If yes, then indicate the number of such subsidiary company(s)
No
3. Do any other entity/entities (e.g. suppliers, distributors, etc.) that the Company does business with participate in the BR initiatives of the Company? If yes, then indicate the percentage of such entity/entities? [Less than 30%, 30-60%, More than 60%]
No
CORPORATE OVERVIEW FINANCIAL STATEMENTS
Annual Report 2019 89

Section D: Business Responsibility information
1. Details of Director/Directors responsible for BR
Sl. No.
Particulars Details
1. Details of the Director/Directors responsible for implementation of the BR policy/policies
DIN 02079161
Name Mr. Kapil Agarwal
Designation Whole-time Director & Chief Executive Officer
2. Details of the BR head DIN 08440479
Name Mr. Rajinder Jeet Singh Bagga
Designation Whole-time Director
Telephone Number +91-124-4643100
E-mail id [email protected]
2. Principle wise (as per NVGs) BR Policy/Policies
The National Voluntary Guidelines on Social, Environmental and Economic Responsibilities of Business (NVGs)
released by the Ministry of Corporate Affairs has adopted nine principles of Business Responsibility. These briefly
are as follows:
P1 Business should conduct and govern themselves with Ethics, Transparency and Accountability
P2 Businesses should provide goods and services that are safe and contribute to sustainability throughout their life cycle
P3 Businesses should promote the wellbeing of all employees
P4 Businesses should respect the interests of, and be responsive towards all stakeholders, especially those who are disadvantaged, vulnerable and marginalized
P5 Businesses should respect and promote human rights
P6 Business should respect, protect and make efforts to restore the environment
P7 Businesses when engaged in influencing public and regulatory policy, should do so in a responsible manner
P8 Businesses should support inclusive growth and equitable development
P9 Businesses should engage with and provide value to their customers and consumers in a responsible manner
3. Details of Compliance (Reply in Y/N)
Sl. No.
Questions P1 P2 P3 P4 P5 P6 P7 P8 P9
1. Do you have a policy / policies for.... Y Y Y Y Y Y Y Y Y
2. Has the policy been formulated in consultation with the relevant stakeholders?
Y Y Y Y Y Y Y Y Y
3. Does the policy conform to any national/international standards? If yes, specify?#
Y Y Y Y Y Y Y Y Y
4. Has the policy been approved by the Board? If yes, has it been signed by MD/owner/CEO/appropriate Board Director?
Y Y Y Y Y Y Y Y Y
5. Does the company have a specified committee of the Board/Director/Official to oversee the implementation of the policy?
Y Y Y Y Y Y Y Y Y
6. Indicate the link for the policy to be viewed online * ** & ***
* & ****
** & *****
* & ****
*** *** ** & *****
***
7. Has the policy been formally communicated to all relevant internal and external stakeholders?
Y Y Y Y Y Y Y Y Y
8. Does the company have in-house structure to implement the policy/policies?
Y Y Y Y Y Y Y Y Y
9. Does the Company have a grievance redressal mechanism related to the policy/policies to address stakeholders' grievances related to the policy/policies?
Y Y Y Y Y Y Y Y Y
10. Has the company carried out independent audit/evaluation of the working of this policy by an internal or external agency?
Y Y Y Y Y Y Y Y Y
Varun Beverages Limited90

STATUTORY REPORTS
#Policies of the Company are compliant of the applicable laws in India and uploaded on website of the Company at www.varunpepsi.com
*VBL Code of Conduct for Board of Directors and Senior Management at https://varunpepsi.com/wp-content/uploads/2019/03/Code-Of-Conduct-For-Board-Of-Directors-and-Senior-Management-Revised.pdf
** VBL Philosophy at https://varunpepsi.com/philosophy/
***VBL Environment, Health and Safety Policy at https://varunpepsi.com/wp-content/uploads/2019/03/Varun-Beverages-Limited-EHS-POLICY.pdf
****VBL Policy for Prevention, Prohibition and Redressal of Sexual Harassment at Workplace at https://varunpepsi.com/wp-content/uploads/2019/12/Policy-against-Sexual-Harassment_Release-version-10122019-1.pdf
*****VBL Corporate Social Responsibility Policy at http://varunpepsi.com/wp-content/uploads/2016/09/Corporate-Social-Responsibility-Policy.pdf
4. Governance related to BR
Sl. No.
Particulars Details
1. Indicate the frequency with which the Board of Directors, Committee of the Board or CEO meet to assess the BR performance of the Company. Within 3 months, 3-6 months, Annually, More than 1 year
Annually
2. Does the Company publish a BR or Sustainability Report? What is the hyperlink for viewing this report? How frequently it is published?
Yes, it is published annually. The same may be accessed at www.varunpepsi.com as part of Annual Report 2019
Section E: Principle-wise performance
Principle 1:
Sl. No.
Particulars Details
1. Does the policy relating to ethics, bribery and corruption cover only the company? Yes/No
Yes
2. Does it extend to the Group/Joint Ventures/ Suppliers/Contractors/NGOs/Others?
No
3. How many stakeholder complaints have been received in the past Financial Year and what percentage was satisfactorily resolved by the management? If so, provide details thereof, in about 50 words or so.
For details on investor complaints, refer to “Investor Grievances/ Complaints” section of Corporate Governance Report in the Annual Report.
Principle 2:
1. List up to 3 of your products or services whose design has incorporated social or environmental concerns, risks and/or opportunities:
Varun Beverages Limited (VBL) is in the business of providing high quality products to consumers such as
carbonated, non-carbonated sweetened beverages and packaged drinking water with endeavor to make its
business and ecosystem sustainable. The Company tries to embed the principles of sustainability into various
stages of product, procurement of raw material, manufacturing of products, transportation of raw materials and
supply of finished goods. In order to continuously reduce the Company environmental footprint, the Company
is improving efficiencies, especially on critical resources such as water, fuel and energy, optimizing the resource
consumption and minimizing wastages, increasing green cover in manufacturing plants and also developing
outside establishments. Our company has significantly reduced weight of the closure and preforms over the period
of time to contribute towards environment sustainability. Usage of nitrogen in packaged drinking water enables
unit to reduce 10% of package weight. The Company has implemented the guidelines provided by international
standards such as Environment Management System ISO 14001, OHSAS 18001 and all our units are AIB and FSSC
certified which is the world’s most advanced food safety management system accepted globally.
CORPORATE OVERVIEW FINANCIAL STATEMENTS
Annual Report 2019 91

2. For each such product, provide the following details in respect of resource use (energy, water, raw material etc.) per unit of product (optional):
(a) Reduction during sourcing/production/ distribution achieved since the previous year throughout the value chain?
The Company follows number of key Environmental Indicators to monitor the efficiency and consumption
of natural resources in manufacturing such as water consumption and recycling, fuel consumption, energy
consumption, raw materials yield and waste generation. The Company regularly track these consumption
patterns of critical nature resources.
(b) Reduction during usage by consumers (energy, water) has been achieved since the previous year?
Reduction in Greenhouse Gases emission which is measured in units of carbon dioxide. Number of initiatives have already been implemented across various units. Some of the key improvements done are use of fuels like biomass for steam generation, usage of Solar energy and Optimizing the water requirements at manufacturing plants.
3. Does the Company have procedures in place for sustainable sourcing (including transportation)? Yes
(a) If yes, what percentage of your inputs was sourced sustainably? Also, provide details thereof, in about 50 words or so.
With a responsible supply chain, the Company has developed a comprehensive and dynamic model, to engage with its suppliers and transporters on material aspects. Regular capacity building and assessments are carried out for key suppliers. However, currently it is not feasible to measure the same in percentage.
4. Has the Company taken any steps to procure goods and services from local and small producers, including communities surrounding their place of work? Yes
(a) If yes, what steps have been taken to improve the capacity and capability of local and small vendors?
The Company has tried to create new paths and provide opportunities to the entrepreneurs and establish
local vendors by uplifting their skills in effective manner. The Company also strive to provide opportunities
in distressed areas and has devised unique models for empowerment of people in such areas. These sort of
interventions not only improve the efficiency and enhance productivity but also contribute to substantial
employment creation in communities surrounding the workplaces.
5. Does the Company have a mechanism to recycle products and waste? If yes, what is the percentage of recycling of products and waste (separately as <5%, 5-10%, >10%). Also, provide details thereof, in about 50 words or so.
Yes. The Company is committed towards reduction of environmental footprint of its products, waste and
packaging materials. The Company focuses on the 3R’s: REDUCE, RECYCLE and RECOVER. Such practices
include segregation of different types of waste material so as to regulate the recyclability, anti-litter and
recyclable marks on products to remind consumers to dispose in a safe and environment friendly way. The
company engaged a NGO who is collecting and recycling of post consumed plastic waste as part of the
producers extended responsibility. The Company also supports initiatives to recycle materials and has installed
small machineries for shredding the waste which helps to minimize the volume and also ease the transportation
to the recycling agencies. Majority of the waste generated at plant levels are recyclable i.e. plastic bottles, metal
scrap, broken glass, empty bags, cartons etc. One of the major product segment consists of returnable glass
bottle which after consumption of its product is returned and reused after taking care of thorough food safety.
Recycling of waste is approximate 8-10%.
Principle 3:
Sl. No.
Particulars Details
1. Please indicate the total number of employees 8,570 employees as on December 31, 2019 (only for India)
2. Please indicate the total number of employees hired on temporary/ contractual/casual basis
10,100 employees as on December 31, 2019
3. Please indicate the number of permanent women employees 228 employees as on December 31, 2019
4. Please indicate the number of permanent employees with disabilities 31
Varun Beverages Limited92
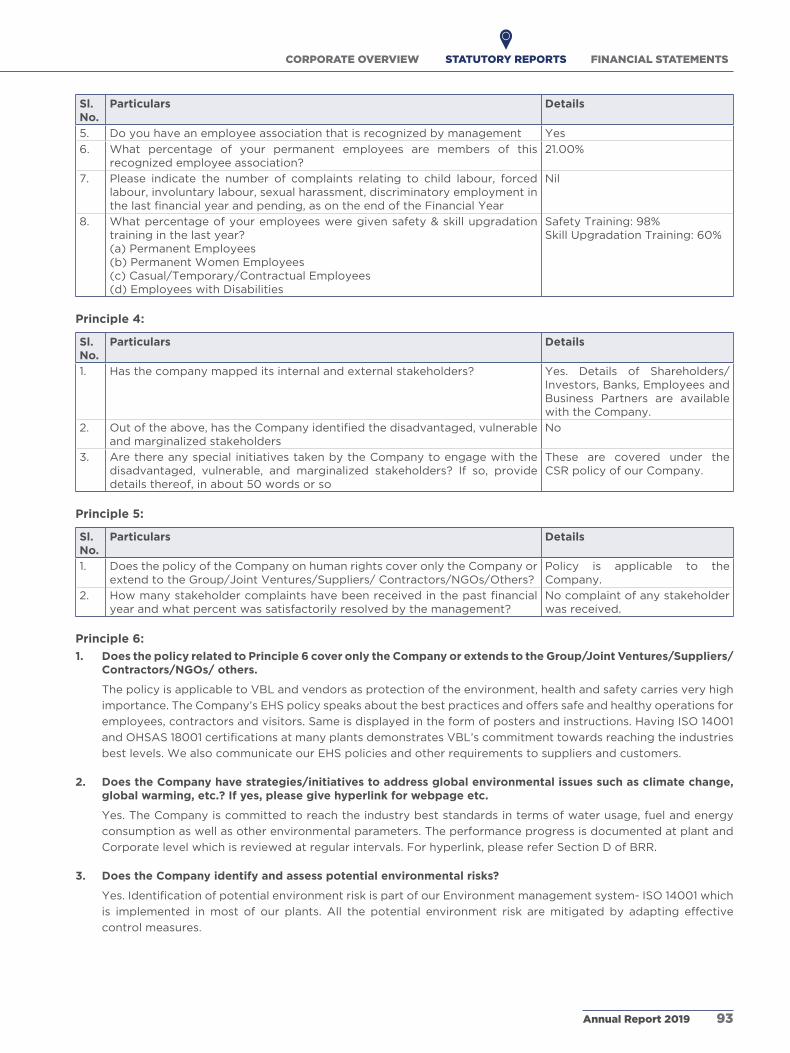
STATUTORY REPORTS
Sl. No.
Particulars Details
5. Do you have an employee association that is recognized by management Yes
6. What percentage of your permanent employees are members of this recognized employee association?
21.00%
7. Please indicate the number of complaints relating to child labour, forced labour, involuntary labour, sexual harassment, discriminatory employment in the last financial year and pending, as on the end of the Financial Year
Nil
8. What percentage of your employees were given safety & skill upgradation training in the last year?(a) Permanent Employees(b) Permanent Women Employees(c) Casual/Temporary/Contractual Employees(d) Employees with Disabilities
Safety Training: 98%Skill Upgradation Training: 60%
Principle 4:
Sl. No.
Particulars Details
1. Has the company mapped its internal and external stakeholders? Yes. Details of Shareholders/ Investors, Banks, Employees and Business Partners are available with the Company.
2. Out of the above, has the Company identified the disadvantaged, vulnerable and marginalized stakeholders
No
3. Are there any special initiatives taken by the Company to engage with the disadvantaged, vulnerable, and marginalized stakeholders? If so, provide details thereof, in about 50 words or so
These are covered under the CSR policy of our Company.
Principle 5:
Sl. No.
Particulars Details
1. Does the policy of the Company on human rights cover only the Company or extend to the Group/Joint Ventures/Suppliers/ Contractors/NGOs/Others?
Policy is applicable to the Company.
2. How many stakeholder complaints have been received in the past financial year and what percent was satisfactorily resolved by the management?
No complaint of any stakeholder was received.
Principle 6:
1. Does the policy related to Principle 6 cover only the Company or extends to the Group/Joint Ventures/Suppliers/Contractors/NGOs/ others.
The policy is applicable to VBL and vendors as protection of the environment, health and safety carries very high
importance. The Company’s EHS policy speaks about the best practices and offers safe and healthy operations for
employees, contractors and visitors. Same is displayed in the form of posters and instructions. Having ISO 14001
and OHSAS 18001 certifications at many plants demonstrates VBL’s commitment towards reaching the industries
best levels. We also communicate our EHS policies and other requirements to suppliers and customers.
2. Does the Company have strategies/initiatives to address global environmental issues such as climate change, global warming, etc.? If yes, please give hyperlink for webpage etc.
Yes. The Company is committed to reach the industry best standards in terms of water usage, fuel and energy
consumption as well as other environmental parameters. The performance progress is documented at plant and
Corporate level which is reviewed at regular intervals. For hyperlink, please refer Section D of BRR.
3. Does the Company identify and assess potential environmental risks?
Yes. Identification of potential environment risk is part of our Environment management system- ISO 14001 which
is implemented in most of our plants. All the potential environment risk are mitigated by adapting effective
control measures.
CORPORATE OVERVIEW FINANCIAL STATEMENTS
Annual Report 2019 93

4. Does the Company have any project related to Clean Development Mechanism? If so, provide details thereof, in about 50 words or so. Also, if Yes, whether any environmental compliance report is filed?
Yes. The Company has undertaken initiatives to reduce Carbon footprint through reduction in the amount of
Greenhouse Gases emissions. Some of the key renewable energy projects contributing to GHG savings include
installation and commissioning solar plant at the Company’s Nuh and Greater Noida plant and other energy
saving projects. Use of fuels like biomass for steam generation at number of plants. The Company files annual and
other environment compliance reports as per Pollution Control Board requirements.
5. Has the Company undertaken any other initiatives on – clean technology, energy efficiency, renewable energy, etc. If yes, please give hyperlink for web page etc.
Yes. The Company is proactive in adopting new technologies that use cleaner fuels and forms energy. Having
commissioned a solar power at its manufacturing set up at Nuh and Greater Noida and redesigned the power
generation units at many locations, to use the Bio Mass instead of the non-renewable natural resources.
Manufacturing units also use latest automations, heat recoveries and use modern technologies to be energy and
cost efficient. For hyperlink, please refer Section D of BRR.
6. Are the Emissions/Waste generated by the Company within the permissible limits given by CPCB/SPCB for the financial year being reported?
Yes. Our most of the Plants have installed online monitoring systems in Effluent Treatment Plant as well as Boiler
emissions for all time compliance which is being monitored by CPCB. All the hazardous waste goes to PCB
approved land fill site on periodic basis.
7. Number of show cause/legal notices received from CPCB/SPCB which are pending (i.e. not resolved to
satisfaction) as on end of Financial Year.
Nil
Principle 7:
Sl. No.
Particulars Details
1. Is your Company a member of any trade and chamber or association? If Yes, Name only those major ones that your business deals with
Yes. The Company is a member of Federation of Indian Chambers of Commerce and Industry, PHD Chamber of Commerce and Industry, PET Packaging Association for Clean Environment, The Associated Chambers of Commerce and Industry of India and Action Alliance for Recycling Beverage Cartons.
2. Have you advocated/lobbied through above associations for the advancement or improvement of public good? Yes/ No; if yes, specify the broad areas (drop box: Governance and Administration, Economic Reforms, Inclusive Development Policies, Energy security, Water, Food Security, Sustainable Business Principles, Others)
No.
Principle 8:
1. Does the Company have specified programmes/initiatives/ projects in pursuit of the policy related to Principle 8? If yes, details thereof?
Yes. The Company do have various initiatives and programmes for community development and their wellbeing.
Some of them are giving scholarship to school children especially for girls, providing reading material and stationery
to poor children, providing fund for safe drinking water facility and wash rooms facilities, providing basic food safety
and hygiene training and awareness to school children, pond cleaning in different villages, creating awareness for
water conservation and prevention of water pollution along with rural and slum area development etc.
2. Are the programmes/projects undertaken through in-house team/own foundation/external NGO/government structures/any other organization?
All the community development initiatives were undertaken by in-house team of professionals and often with the
help of external agencies/ organizations.
Varun Beverages Limited94

STATUTORY REPORTS
3. Have you done any impact assessment of your initiative?
Yes. Informal feedback is being taken and frequent visits were carried out to establish impact of the initiatives and
to re-establish that such initiatives are worth and effective.
4. What is your Company’s direct contribution to community development projects - Amount in ` and the details of the projects undertaken?
The Company has spent `57.50 million towards various development projects under environment protection,
cleaning, availability of resources and community safety and wellbeing. The Company has significantly contributed
to environment and community development by taking various initiatives like rain water harvesting via ponds
development for effective recharging of rain water, creating awareness for water harvesting and water pollution,
celebration of Sandi Bird festival, solar lights installation at villages, tree plantations in villages, Nukkad naatak
for environment protection, providing clean water facility by installation of hand pumps and water coolers at
schools and villages, driving Swachh Bharat Abhiyaan by involving villagers, promoting sports, blood donation
and health checkup camps, driving food safety and personal hygiene sessions at schools and institutes, road
safety awareness in community, books distribution and drawing competition in schools.
5. Have you taken steps to ensure that this community development initiative is successfully adopted by the community? Please explain in 50 words or so.
Yes. The Company ensures the community development initiative through internal tracking mechanisms and field
visits. Informal feedbacks are also obtained from the community on such initiatives for example, before cleaning
of pond for rain water harvesting, community training and awareness sessions were executed on the topic of
water conservation and water pollution prevention, not to dump trash in ponds so that ponds remain cleaned
throughout year. It was noted that there was significant reduction in dumping trash in to ponds post training was
imparted to villagers.
Principle 9:
Sl. No.
Particulars Details
1. What percentage of customer complaints/consumer cases are pending as on the end of financial year?
81.33 % of consumer complaints are pending before various consumer forums.
2. Does the Company display product information on the product label, over and above what is mandated as per local laws?
Yes. The Company give information relating to storage conditions and consumption days.
3. Is there any case filed by any stakeholder against the Company regarding unfair trade practices, irresponsible advertising and/or anti-competitive behavior during the last five years and pending as on end of financial year? If so, provide details thereof, in about 50 words or so.
There are no cases alleging unfair trade practice, irresponsible advertising and/ or anti-competitive behavior.
4. Did your Company carry out any consumer survey/ consumer satisfaction trends?
No
For and on behalf of the Board of DirectorsFor Varun Beverages Limited
Ravi JaipuriaPlace: Gurugram ChairmanDate: February 7, 2020 DIN: 00003668
CORPORATE OVERVIEW FINANCIAL STATEMENTS
Annual Report 2019 95

Consolidated

independent auditor’s Report
to the Members of Varun Beverages limited
Report on the audit of the Consolidated Financial
statements
opinion
1. We have audited the accompanying consolidated
financial statements of Varun Beverages Limited
(‘the Holding Company’), its subsidiaries (the Holding
Company and its subsidiaries together referred to
as ‘the Group’) and its erstwhile associates, which
comprise the Consolidated Balance Sheet as at
31 December 2019, the Consolidated Statement of
Profit and Loss (including Other Comprehensive
Income), the Consolidated Cash Flow Statement
and the Consolidated Statement of Changes in
Equity for the year then ended, and a summary
of the significant accounting policies and other
explanatory information.
2. In our opinion and to the best of our information
and according to the explanations given to us
and based on the consideration of the reports of
one of the joint auditors, APAS & Co. and other
auditors on separate financial statements and on
the other financial information of the subsidiaries
and erstwhile associates, the aforesaid consolidated
financial statements give the information required
by the Companies Act, 2013 (‘Act’) in the manner so
required and give a true and fair view in conformity
with the accounting principles generally accepted
in India including Indian Accounting Standards (‘Ind
AS’) specified under section 133 of the Act, of the
consolidated state of affairs (consolidated financial
position) of the Group as at 31 December 2019,
and its consolidated profit (consolidated financial
performance including other comprehensive
income), its consolidated cash flows and the
consolidated changes in equity for the year ended
on that date.
Basis for opinion
3. We conducted our audit in accordance with the
Standards on Auditing specified under section
143(10) of the Act. Our responsibilities under those
standards are further described in the Auditor’s
Responsibilities for the Audit of the Consolidated
Financial Statements section of our report. We are
independent of the Company in accordance with the
Code of Ethics issued by the Institute of Chartered
Accountants of India (‘ICAI’) together with the
ethical requirements that are relevant to our audit of
the financial statements under the provisions of the
Act and the rules thereunder, and we have fulfilled
our other ethical responsibilities in accordance with
these requirements and the Code of Ethics. We
believe that the audit evidence we have obtained
and the audit evidence obtained by one of the joint
auditors, APAS & Co. and other auditors in terms of
their reports referred to in paragraph 15 of the Other
Matter section below, is sufficient and appropriate to
provide a basis for our opinion.
Key audit Matters
4. Key audit matters are those matters that, in our
professional judgment and based on the consideration
of the reports of one of the joint auditors, APAS & Co.
and other auditors on separate financial statements
and on the other financial information of the
subsidiaries and erstwhile associates, were of most
significance in our audit of the consolidated financial
statements of the current period. These matters
were addressed in the context of our audit of the
consolidated financial statements as a whole, and in
forming our opinion thereon, and we do not provide a
separate opinion on these matters.
5. We have determined the matters described below
to be the key audit matters to be communicated in
our report.
Key audit matter How our audit addressed the key audit matter
Impairment assessment of intangibles including
Goodwill
(Refer note 3(e) and 3(k) for accounting policies on
intangibles assets and note 5 to the consolidated financial
statements)
Our audit procedures included, but were not limited, to
the following:
Obtained an understanding of the management’s
process for identification of cash generating unit and
impairment indicators for intangible assets, if any and
processes performed by the management for their
impairment testing;
STATUTORY REPORTSCORPORATE OVERVIEW FINANCIAL STATEMENTS
Annual Report 2019 97

Key audit matter How our audit addressed the key audit matter
The Group carries goodwill and franchise rights as
intangible assets having indefinite life amounting to INR
242.30 million and INR 5,386.39 million respectively,
that are required to be tested for impairment by the
management on an annual basis in accordance with Ind
AS 36, Impairment of Assets.
The aforesaid assessment of the impairment testing
involves significant judgement around the determination
of the recoverable amount, being the higher of value in use
and fair value less costs of disposal. Recoverable amounts
are based on the management’s view of the future cash
flows and prospects of the business, the appropriate
discount rates and other industry specific risk factors.
The key judgements in determining the recoverable
amount of these intangibles relates to the forecast of
future cash flows based on strategy using macroeconomic
assumptions like industry growth, inflation and expected
growth in market share, capital expenditure and working
capital requirements, among others.
Changes in the management forecasts or assumptions
can impact the assessment of the discounted cash flows
and consequently the valuation of such intangible assets.
Considering the materiality of the amount involved and
significant degree of judgement and subjectivity involved
in the estimates and key assumptions used in determining
the forecasted cash flows used in the impairment
evaluation, which are dependent on current and future
economic factors and trading conditions varying
for different economic and geographical territories,
impairment assessment of such intangibles assets was
determined as a key audit matter.
Assessed the process by which the management
prepared its cash flow forecasts and held discussions
with the management to understand the assumptions
used and estimates made by them for determining such
projections;
Tested the design and operating effectiveness of
internal controls over such identification and impairment
measurement through fair valuation of identified assets;
Assessed the appropriateness of the Group’s accounting
policies, including those relating to recognition,
measurement and impairment of intangibles by
comparing with the applicable Ind AS;
Reviewed the valuation report obtained by the
management from an independent valuer and assessed
the professional competence, skills and objectivity for
performing the required valuations;
Assessed the appropriateness of the significant
assumptions as well as the Group’s valuation model
with the support of auditor’s valuation experts, who
assessed the reasonableness of assumptions used and
valuation methodology applied relating to discount rate,
risk premium, industry growth rate etc. This included a
discussion of the expected development of the business
and results as well as of the underlying assumptions
used with those responsible for the planning process;
Assessed the robustness of financial projections
prepared by the management by comparing projections
for previous financial years with actual results realized
and discussed significant deviations, if any, with the
management;
Tested mathematical accuracy of the projections and
performed a sensitivity analysis for reasonably possible
changes in the sales growth, discount rate applied and
the long-term growth rate; and
Evaluated the adequacy and appropriateness of
disclosures made by the Group in the consolidated
financial statements, as required by the applicable
provisions of the Act and Ind AS.
Litigation and claims – provisions and contingent
liabilities
(Refer note 44 to the consolidated financial statements
for the amounts of contingent liabilities)
The Group is involved in various direct, indirect tax and
other litigations (‘litigations’) that are pending with
different statutory authorities. The management exercises
significant judgement for determining the need for and
the amount of provisions for any liabilities arising from
these litigations.
Our key procedures included, but were not limited to, the
following:
Assessed the appropriateness of the Group’s
accounting policies relating to provisions and
contingent liabilities by comparing with the
applicable accounting standards;
Assessed the Group’s process and the underlying
controls for identification of the pending litigations
and completeness for financial reporting and also for
monitoring of significant developments in relation to
such pending litigations;
Varun Beverages Limited98

Key audit matter How our audit addressed the key audit matter
This judgement is dependent on a number of significant
assumptions and evaluations which involves interpreting
the various applicable rules, regulations, practices and
considering precedents in the various jurisdictions
including the opinions received from various legal
counsels.
This matter is considered as a key audit matter, in view
of the uncertainty regarding the outcome of these
litigations, the significance of the amounts involved and
the subjectivity involved in management’s judgement
as to whether the amount should be recognized as a
provision or only disclosed as contingent liability in the
consolidated financial statements.
Assessed the management’s assumptions and
estimates in respect of litigations, including the
liabilities or provisions recognized or contingent
liabilities disclosed in the consolidated financial
statements. This involved assessing the probability of
an unfavorable outcome of a given proceeding and
the reliability of estimates of related amounts based
on the various legal counsel’s opinions received by
the Group;
Recomputed the arithmetical accuracy of the
underlying calculations supporting the provisions
recorded from the supporting evidences including
the correspondence with various authorities;
Assessed the management’s conclusions through
understanding relevant judicial precedents in similar
cases and the applicable rules and regulations;
Obtained legal opinions and confirmation on
completeness from the Group’s external legal
counsel, where appropriate;
Engaged auditor’s experts to gain an understanding
of the current status of litigations and monitored
changes in the disputes, if any, through discussions
with the management and by reading external advice
received by the Group, where relevant, to validate
the management’s conclusions; and
Assessed the appropriateness of the Group’s
description of the accounting policy, disclosures
related to litigations and whether these are adequately
presented in the consolidated financial statements.
Accounting for business combinations
As detailed in note 52A to the consolidated financial
statements, during the year, the Holding Company has
executed a business transfer agreement with a third party
to acquire franchisee rights and bottling operations of
South and West India regions for a purchase consideration
of INR 18,025 million.
Management has accounted for this acquisition as per
the requirements of Ind AS 103 “Business combinations”
which involves exercise of significant management
assumptions/ estimates such as discount rate, growth rate,
earning margins, etc for valuation of business acquired,
allocation of purchase price paid and identification and
valuation of acquired intangible assets.
Considering the materiality of the amounts involved and
significant degree of judgement and subjectivity involved
in the estimates and key assumptions used, this business
combination was determined to be a key audit matter.
Our audit key procedures included, but were not limited,
to the following:
Assessed the appropriateness of the Group’s
accounting policies and the related processes for
implementing Ind AS 103 for accounting for such
business combination;
Obtained and reviewed the key supporting
documentation including business transfer
agreement;
Reviewed the valuation reports obtained by the
management from independent valuers and assessed
the independence, professional competence,
skills and objectivity for performing the required
valuations;
Assessed the appropriateness of the significant
assumptions as well as the Company’s valuation
model with the support of auditor’s valuation expert,
who reviewed the reasonableness of assumptions
used and valuation methodology applied. This
included a discussion of the expected development
of the business and results as well as of the underlying
assumptions used with those responsible for the
planning process;
STATUTORY REPORTSCORPORATE OVERVIEW FINANCIAL STATEMENTS
Annual Report 2019 99
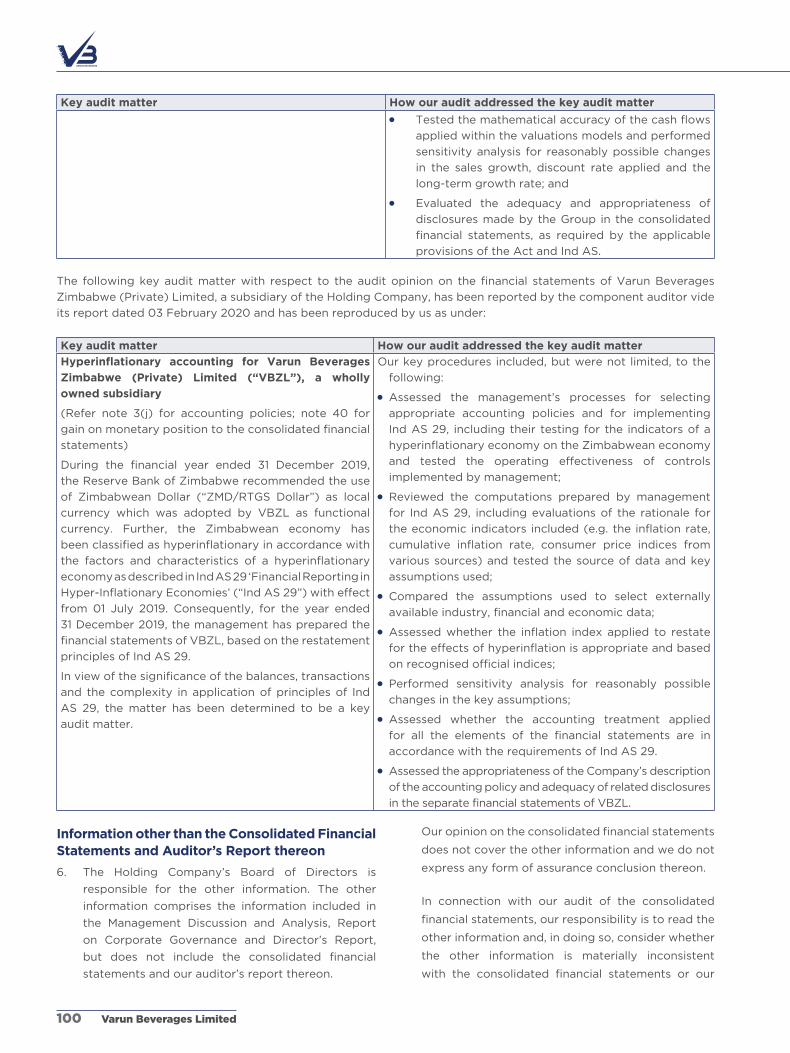
Key audit matter How our audit addressed the key audit matter
Tested the mathematical accuracy of the cash flows
applied within the valuations models and performed
sensitivity analysis for reasonably possible changes
in the sales growth, discount rate applied and the
long-term growth rate; and
Evaluated the adequacy and appropriateness of
disclosures made by the Group in the consolidated
financial statements, as required by the applicable
provisions of the Act and Ind AS.
The following key audit matter with respect to the audit opinion on the financial statements of Varun Beverages
Zimbabwe (Private) Limited, a subsidiary of the Holding Company, has been reported by the component auditor vide
its report dated 03 February 2020 and has been reproduced by us as under:
Key audit matter How our audit addressed the key audit matter
Hyperinflationary accounting for Varun Beverages
Zimbabwe (Private) Limited (“VBZL”), a wholly
owned subsidiary
(Refer note 3(j) for accounting policies; note 40 for
gain on monetary position to the consolidated financial
statements)
During the financial year ended 31 December 2019,
the Reserve Bank of Zimbabwe recommended the use
of Zimbabwean Dollar (“ZMD/RTGS Dollar”) as local
currency which was adopted by VBZL as functional
currency. Further, the Zimbabwean economy has
been classified as hyperinflationary in accordance with
the factors and characteristics of a hyperinflationary
economy as described in Ind AS 29 ‘Financial Reporting in
Hyper-Inflationary Economies’ (“Ind AS 29”) with effect
from 01 July 2019. Consequently, for the year ended
31 December 2019, the management has prepared the
financial statements of VBZL, based on the restatement
principles of Ind AS 29.
In view of the significance of the balances, transactions
and the complexity in application of principles of Ind
AS 29, the matter has been determined to be a key
audit matter.
Our key procedures included, but were not limited, to the
following:
Assessed the management’s processes for selecting
appropriate accounting policies and for implementing
Ind AS 29, including their testing for the indicators of a
hyperinflationary economy on the Zimbabwean economy
and tested the operating effectiveness of controls
implemented by management;
Reviewed the computations prepared by management
for Ind AS 29, including evaluations of the rationale for
the economic indicators included (e.g. the inflation rate,
cumulative inflation rate, consumer price indices from
various sources) and tested the source of data and key
assumptions used;
Compared the assumptions used to select externally
available industry, financial and economic data;
Assessed whether the inflation index applied to restate
for the effects of hyperinflation is appropriate and based
on recognised official indices;
Performed sensitivity analysis for reasonably possible
changes in the key assumptions;
Assessed whether the accounting treatment applied
for all the elements of the financial statements are in
accordance with the requirements of Ind AS 29.
Assessed the appropriateness of the Company’s description
of the accounting policy and adequacy of related disclosures
in the separate financial statements of VBZL.
information other than the Consolidated Financial statements and auditor’s Report thereon
6. The Holding Company’s Board of Directors is
responsible for the other information. The other
information comprises the information included in
the Management Discussion and Analysis, Report
on Corporate Governance and Director’s Report,
but does not include the consolidated financial
statements and our auditor’s report thereon.
Our opinion on the consolidated financial statements
does not cover the other information and we do not
express any form of assurance conclusion thereon.
In connection with our audit of the consolidated
financial statements, our responsibility is to read the
other information and, in doing so, consider whether
the other information is materially inconsistent
with the consolidated financial statements or our
Varun Beverages Limited100

knowledge obtained in the audit or otherwise
appears to be materially misstated. If, based on the
work we have performed, we conclude that there is
a material misstatement of this other information,
we are required to report that fact. We have nothing
to report in this regard.
Responsibilities of Management and those Charged with Governance for the Consolidated Financial statements
7. The Holding Company’s Board of Directors is
responsible for the matters stated in section 134(5)
of the Act with respect to the preparation of these
consolidated financial statements that give a true
and fair view of the consolidated state of affairs
(consolidated financial position), consolidated profit
or loss (consolidated financial performance including
other comprehensive income), consolidated changes
in equity and consolidated cash flows of the Group
including its erstwhile associates in accordance with
the accounting principles generally accepted in
India, including the Ind AS specified under section
133 of the Act. The Holding Company’s Board of
Directors is also responsible for ensuring accuracy
of records including financial information considered
necessary for the preparation of consolidated
Ind AS financial statements. Further, in terms of
the provisions of the Act, the respective Board of
Directors of the companies included in the Group
and its erstwhile associate companies covered
under the Act are responsible for maintenance of
adequate accounting records in accordance with
the provisions of the Act for safeguarding the
assets and for preventing and detecting frauds and
other irregularities; selection and application of
appropriate accounting policies; making judgments
and estimates that are reasonable and prudent;
and design, implementation and maintenance of
adequate internal financial controls, that were
operating effectively for ensuring the accuracy and
completeness of the accounting records, relevant
to the preparation and presentation of the financial
statements that give a true and fair view and are free
from material misstatement, whether due to fraud
or error. These financial statements have been used
for the purpose of preparation of the consolidated
financial statements by the Directors of the Holding
Company, as aforesaid.
8. In preparing the consolidated financial statements,
the respective Board of Directors of the companies
included in the Group are responsible for assessing
the ability of the Group, to continue as a going
concern, disclosing, as applicable, matters related
to going concern and using the going concern basis
of accounting, unless the Board of Directors either
intends to liquidate the Group or to cease operations,
or has no realistic alternative but to do so.
9. Those Board of Directors are also responsible for
overseeing the financial reporting process of the
companies included in the Group and of its erstwhile
associates.
auditor’s Responsibilities for the audit of the Consolidated Financial statements
10. Our objectives are to obtain reasonable assurance
about whether the consolidated financial statements
as a whole are free from material misstatement,
whether due to fraud or error, and to issue an auditor’s
report that includes our opinion. Reasonable assurance
is a high level of assurance, but is not a guarantee that
an audit conducted in accordance with Standards on
Auditing will always detect a material misstatement
when it exists. Misstatements can arise from fraud or
error and are considered material if, individually or in
the aggregate, they could reasonably be expected to
influence the economic decisions of users taken on
the basis of these consolidated financial statements.
11. As part of an audit in accordance with Standards
on Auditing, we exercise professional judgment and
maintain professional skepticism throughout the
audit. We also:
Identify and assess the risks of material
misstatement of the consolidated financial
statements, whether due to fraud or error,
design and perform audit procedures
responsive to those risks, and obtain audit
evidence that is sufficient and appropriate to
provide a basis for our opinion. The risk of not
detecting a material misstatement resulting
from fraud is higher than for one resulting from
error, as fraud may involve collusion, forgery,
intentional omissions, misrepresentations, or
the override of internal control.
Obtain an understanding of internal control
relevant to the audit in order to design
audit procedures that are appropriate in the
circumstances. Under section 143(3)(i) of the Act,
we are also responsible for expressing our opinion
on whether the Group and its erstwhile associates
(covered under the Act) have adequate internal
financial controls system in place and the
operating effectiveness of such controls.
Evaluate the appropriateness of accounting
policies used and the reasonableness of
accounting estimates and related disclosures
made by management.
STATUTORY REPORTSCORPORATE OVERVIEW FINANCIAL STATEMENTS
Annual Report 2019 101
Conclude on the appropriateness of
management’s use of the going concern basis
of accounting and, based on the audit evidence
obtained, whether a material uncertainty exists
related to events or conditions that may cast
significant doubt on the ability of the Group, to
continue as a going concern. If we conclude that
a material uncertainty exists, we are required
to draw attention in our auditor’s report to the
related disclosures in the consolidated financial
statements or, if such disclosures are inadequate,
to modify our opinion. Our conclusions are
based on the audit evidence obtained up to the
date of our auditor’s report. However, future
events or conditions may cause the Group to
cease to continue as a going concern.
Evaluate the overall presentation, structure and
content of the consolidated financial statements,
including the disclosures, and whether the
consolidated financial statements represent the
underlying transactions and events in a manner
that achieves fair presentation.
12. We communicate with those charged with
governance regarding, among other matters, the
planned scope and timing of the audit and significant
audit findings, including any significant deficiencies
in internal control that we identify during our audit.
13. We also provide those charged with governance with
a statement that we have complied with relevant
ethical requirements regarding independence, and
to communicate with them all relationships and
other matters that may reasonably be thought to
bear on our independence, and where applicable,
related safeguards.
14. From the matters communicated with those charged
with governance, we determine those matters
that were of most significance in the audit of the
consolidated financial statements of the current
period and are therefore the key audit matters.
We describe these matters in our auditor’s report
unless law or regulation precludes public disclosure
about the matter or when, in extremely rare
circumstances, we determine that a matter should
not be communicated in our report because the
adverse consequences of doing so would reasonably
be expected to outweigh the public interest benefits
of such communication.
other Matter
15. We did not audit the financial statements of nine
subsidiaries, whose financial statements reflect
total assets of ` 17,020.88 million and net assets
of ` 4,415.94 million as at 31 December 2019, total
revenues of ` 17,551.47 million and net cash inflows
amounting to ` 577.55 million for the year ended on
that date, as considered in the consolidated financial
statements. Out of the above, the financial statements
of two subsidiaries included in the consolidated
financial statements whose financial information
reflect total assets of ` 577.29 million and net assets
of ` 452.77 million as at 31 December 2019, total
revenues of ` 106.70 million and net cash inflows of
` 60.45 million for the period 04 November 2019 to
31 December 2019, as considered in the consolidated
financial statements have been audited by one of the
joint auditors, APAS & Co. The consolidated financial
statements also include the Group’s share of net
profit (including other comprehensive income) of
` 43.61 million for the period 01 January 2019 to 03
November 2019, as considered in the consolidated
financial statements, in respect of two erstwhile
associates, whose financial statements have been
audited by APAS & Co. These financial statements
have been audited by APAS & Co. and other auditors
whose reports have been furnished to us by the
management and our opinion on the consolidated
financial statements, in so far as it relates to the
amounts and disclosures included in respect of these
subsidiaries and erstwhile associates, and our report
in terms of sub-section (3) of Section 143 of the Act,
in so far as it relates to the aforesaid subsidiaries and
erstwhile associates, is based solely on the reports of
APAS & Co. and other auditors.
Our opinion above on the consolidated financial
statements, and our report on other legal and
regulatory requirements below, are not modified
in respect of the above matters with respect to our
reliance on the work done by and the reports of
APAS & Co. and other auditors.
Report on other legal and Regulatory Requirements
16. As required by section 197(16) of the Act, based on
our audit and on the consideration of the reports
of APAS & Co., referred to in paragraph 15, on
separate financial statements of the subsidiaries,
we report that the Holding Company and two
subsidiary companies covered under the Act paid
remuneration to their respective directors during the
year in accordance with the provisions of and limits
laid down under section 197 read with Schedule V
to the Act. Further, we report that the provisions
of section 197 read with Schedule V to the Act are
not applicable to seven subsidiary companies, since
none of such companies is a public company as
defined under section 2(71) of the Act.
Varun Beverages Limited102

17. As required by Section 143 (3) of the Act, based on
our audit and on the consideration of the reports of
APAS & Co. and other auditors on separate financial
statements and other financial information of the
subsidiaries and erstwhile associates, we report, to
the extent applicable, that:
(a) we have sought and obtained all the
information and explanations which to the best
of our knowledge and belief were necessary
for the purpose of our audit of the aforesaid
consolidated financial statements;
(b) In our opinion, proper books of account as
required by law relating to preparation of the
aforesaid consolidated financial statements
have been kept so far as it appears from our
examination of those books and the reports of
APAS & Co. and other auditors;
(c) the consolidated financial statements dealt
with by this report are in agreement with the
relevant books of account maintained for the
purpose of preparation of the consolidated
financial statements;
(d) in our opinion, the aforesaid consolidated
financial statements comply with Ind AS
specified under section 133 of the Act;
(e) on the basis of the written representations
received from the directors of the Holding
Company and taken on record by the Board
of Directors of the Holding Company and the
report of APAS & Co., statutory auditor of its
subsidiary companies covered under the Act,
none of the directors of the Group companies
covered under the Act, are disqualified as on
31 December 2019 from being appointed as a
director in terms of Section 164(2) of the Act.
(f) With respect to the adequacy of the internal
financial controls over financial reporting of the
Holding Company and its subsidiary companies
covered under the Act, and the operating
effectiveness of such controls, refer to our
separate report in ‘Annexure I’;
(g) With respect to the other matters to be included
in the Auditor’s Report in accordance with
rule 11 of the Companies (Audit and Auditors)
Rules, 2014 (as amended), in our opinion and
to the best of our information and according to
the explanations given to us and based on the
consideration of the report of APAS & Co. and
other auditors on separate financial statements
as also the other financial information of the
subsidiaries and erstwhile associates:
(i) the consolidated financial statements
disclose the impact of pending litigations
on the consolidated financial position of
the Group as detailed in Note 44 to the
consolidated financial statements;
(ii) provision has been made in these
consolidated financial statements, as
required under the applicable law or Ind
AS, for material foreseeable losses, on
long-term contracts including derivative
contracts, as detailed in note 26 to the
consolidated financial statements;
(iii) there were no amounts which were required
to be transferred to the Investor Education
and Protection Fund by the Holding
Company, its subsidiary companies and
erstwhile associate companies covered
under the Act, during the year ended 31
December 2019; and
(iv) the disclosure requirements relating to
holdings as well as dealings in specified
bank notes were applicable for the period
from 8 November 2016 to 30 December
2016, which are not relevant to these
consolidated financial statements. Hence,
reporting under this clause is not applicable.
For Walker Chandiok & Co llP For aPas & Co.
Chartered Accountants Chartered Accountants
Firm’s Registration No.: Firm’s Registration No:
001076N/N500013 000340C
anupam Kumar sumit Kathuria
Partner Partner
Membership No.: 501531 Membership No: 520078
UDIN: UDIN:
20501531AAAABJ9679 20520078AAAABJ9078
Place: Gurugram Place: Gurugram
Date: 07 February 2020 Date: 07 February 2020
L-41 606, 6th Floor,
Connaught Place, PP City Centre, Road No. 44,
New Delhi 110 001 Pitampura, New Delhi 110 034
STATUTORY REPORTSCORPORATE OVERVIEW FINANCIAL STATEMENTS
Annual Report 2019 103

1. In conjunction with our audit of the consolidated
financial statements of Varun Beverages Limited (‘the
Holding Company’) and its subsidiaries (the Holding
Company and its subsidiaries together referred to as
‘the Group’) as at and for the year ended 31 December
2019, we have audited the internal financial controls
over financial reporting (‘IFCoFR’) of the Holding
Company and its subsidiary companies, which are
companies covered under the Act, as at that date.
Responsibilities of Management and those Charged with Governance for internal Financial Controls
2. The respective Board of Directors of the Holding
Company and its subsidiary companies, which are
companies covered under the Act, are responsible
for establishing and maintaining internal financial
controls based on the internal control over financial
reporting criteria established by the respective
company considering the essential components of
internal control stated in the Guidance Note on Audit
of Internal Financial Controls over Financial Reporting
(‘the Guidance Note’) issued by the Institute of
Chartered Accountants of India (‘ICAI’). These
responsibilities include the design, implementation
and maintenance of adequate internal financial
controls that were operating effectively for ensuring
the orderly and efficient conduct of the Company’s
business, including adherence to the Company’s
policies, the safeguarding of its assets, the prevention
and detection of frauds and errors, the accuracy and
completeness of the accounting records, and the
timely preparation of reliable financial information,
as required under the Act.
auditor’s Responsibility for the audit of the internal Financial Controls
3. Our responsibility is to express an opinion on the
IFCoFR of the Holding Company and its subsidiary
companies, as aforesaid, based on our audit. We
conducted our audit in accordance with the Standards
on Auditing issued by the ICAI prescribed under
Section 143(10) of the Act, to the extent applicable
to an audit of IFCoFR, and the Guidance Note issued
by the ICAI. Those Standards and the Guidance Note
require that we comply with ethical requirements
and plan and perform the audit to obtain reasonable
assurance about whether adequate IFCoFR were
established and maintained and if such controls
operated effectively in all material respects.
4. Our audit involves performing procedures to obtain
audit evidence about the adequacy of the IFCoFR
and their operating effectiveness. Our audit of
IFCoFR includes obtaining an understanding of
IFCoFR, assessing the risk that a material weakness
exists, and testing and evaluating the design and
operating effectiveness of internal control based on
the assessed risk. The procedures selected depend
on the auditor’s judgement, including the assessment
of the risks of material misstatement of the financial
statements, whether due to fraud or error.
5. We believe that the audit evidence we have obtained
and the audit evidence obtained by one of the
joint auditors, APAS & Co. in terms of their reports
referred to in the Other Matter paragraph below, is
sufficient and appropriate to provide a basis for our
audit opinion on the IFCoFR of the Holding Company
and its subsidiary companies as aforesaid.
Meaning of internal Financial Controls over Financial Reporting
6. A company's IFCoFR is a process designed to
provide reasonable assurance regarding the
reliability of financial reporting and the preparation
of financial statements for external purposes in
accordance with generally accepted accounting
principles. A company's IFCoFR include those
policies and procedures that (1) pertain to the
maintenance of records that, in reasonable detail,
accurately and fairly reflect the transactions and
dispositions of the assets of the company; (2)
provide reasonable assurance that transactions are
recorded as necessary to permit preparation of
financial statements in accordance with generally
accepted accounting principles, and that receipts
and expenditures of the company are being
made only in accordance with authorisations of
management and directors of the company; and (3)
provide reasonable assurance regarding prevention
or timely detection of unauthorised acquisition, use,
or disposition of the company's assets that could
have a material effect on the financial statements.
inherent limitations of internal Financial Controls over Financial Reporting
7. Because of the inherent limitations of IFCoFR,
including the possibility of collusion or improper
management override of controls, material
misstatements due to error or fraud may occur and
annexure iIndependent Auditor’s Report on the Internal Financial Controls under Clause (i) of Sub-section 3 of Section 143 of
the Companies Act, 2013 (‘the Act’)
Varun Beverages Limited104

not be detected. Also, projections of any evaluation
of the IFCoFR to future periods are subject to the
risk that the IFCoFR may become inadequate
because of changes in conditions, or that the degree
of compliance with the policies or procedures may
deteriorate.
opinion
8. In our opinion and based on the consideration
of the reports of APAS & Co. on IFCoFR of the
subsidiary companies, the Holding Company and its
subsidiary companies, which are companies covered
under the Act, have in all material respects, adequate
internal financial controls over financial reporting
and such controls were operating effectively as at
31 December 2019, based on the internal control
over financial reporting criteria established by the
Company considering the essential components of
internal control stated in the Guidance Note issued
by the ICAI.
other Matter
9. We did not jointly audit IFCoFR in so far as it relates
to two subsidiary companies, which are companies
covered under the Act, whose financial statements
reflect total assets of ` 577.29 million and net assets
of ` 452.77 million as at 31 December 2019, total
revenues of ` 106.70 million and net cash inflows
amounting to ` 60.45 million for the period 04
November 2019 to 31 December 2019, as considered
in the consolidated financial statements. The IFCoFR
in so far as it relates to such subsidiary companies
have been audited by one of the joint auditors, APAS
& Co. whose reports have been furnished to us by
the management and our report on the adequacy
and operating effectiveness of the IFCoFR for the
Holding Company and its two subsidiary companies,
as aforesaid, under Section 143(3)(i) of the Act in so
far as it relates to such subsidiary companies is based
solely on the report of APAS & Co. Our opinion is not
modified in respect of this matter with respect to our
reliance on the work done by and on the report of
APAS & Co.
For Walker Chandiok & Co llP For aPas & Co.
Chartered Accountants Chartered Accountants
Firm’s Registration No.: Firm’s Registration No:
001076N/N500013 000340C
anupam Kumar sumit Kathuria
Partner Partner
Membership No.: 501531 Membership No: 520078
UDIN: UDIN:
20501531AAAABJ9679 20520078AAAABJ9078
Place: Gurugram Place: Gurugram
Date: 07 February 2020 Date: 07 February 2020
L-41 606, 6th Floor,
Connaught Place, PP City Centre, Road No. 44,
New Delhi 110 001 Pitampura, New Delhi 110 034
STATUTORY REPORTSCORPORATE OVERVIEW FINANCIAL STATEMENTS
Annual Report 2019 105

Consolidated Balance Sheetas at 31 December 2019
(` in million)Notes As at
31 December 2019As at
31 December 2018AssetsNon-current assets(a) Property, plant and equipment 4 58,925.02 38,601.77 (b) Capital work-in-progress 4 638.24 3,523.57 (c) Goodwill 5a 242.30 19.40 (d) Other intangible assets 5B 5,623.11 5,248.57 (e) Investment in associates 6 - 112.43 (f) Financial assets (i) Investments 7 0.01 0.01 (ii) Loans 8 445.48 200.92 (iii) Others 9 8.90 8.34 (g) Deferred tax assets (Net) 10 128.48 334.00 (h) Other non-current assets 11 1,153.96 857.60
Total non-current assets 67,165.50 48,906.61 Current assets(a) Inventories 12 8,815.13 5,783.97 (b) Financial assets (i) Trade receivables 13 1,725.55 1,280.25 (ii) Cash and cash equivalents 14 1,379.68 429.36 (iii) Bank balances other than (ii) above 15 331.09 505.44 (iv) Loans 16 69.37 15.53 (v) Others 17 2,189.83 1,404.78 (c) Current tax assets (Net) 18 10.23 4.10 (d) Other current assets 19 2,197.96 1,984.04
Total current assets 16,718.84 11,407.47 Total assets 83,884.34 60,314.08
Equity and liabilitiesEquity(a) Equity share capital 20 2,886.89 1,826.42 (b) Other equity 21 30,397.33 18,158.62 Equity attributable to owners of the Holding Company 33,284.22 19,985.04 Non-controlling interest 306.79 77.68
Total equity 33,591.01 20,062.72 LiabilitiesNon-current liabilities(a) Financial liabilities (i) Borrowings 22a 23,553.76 19,800.69 (b) Provisions 23 1,703.35 1,052.55 (c) Deferred tax liabilities (Net) 10 2,825.07 1,921.66 (d) Other non-current liabilities 24 8.23 67.75
Total non-current liabilities 28,090.41 22,842.65 Current liabilities(a) Financial liabilities (i) Borrowings 22B 4,671.54 3,776.55 (ii) Trade payables (a) Total outstanding dues of micro enterprises and small enterprises 25 26.14 2.47 (b) Total outstanding dues of creditors other than micro
enterprises and small enterprises25 4,750.47 3,165.50
(iii)Otherfinancialliabilities 26 10,258.13 8,512.43 (b) Other current liabilities 27 2,044.85 1,466.55 (c) Provisions 23 299.79 160.19 (d) Current tax liabilities (Net) 28 152.00 325.02
Total current liabilities 22,202.92 17,408.71 Total liabilities 50,293.33 40,251.36
Total equity and liabilities 83,884.34 60,314.08
Significantaccountingpolicies 3
Theaccompanyingnotesareanintegralpartoftheconsolidatedfinancialstatements. For and on behalf of the Board of Directors ofas per our report of even date attached. Varun Beverages Limited
For Walker Chandiok & Co LLP For APAS & Co. Varun Jaipuria Raj Pal GandhiChartered accountants Chartered accountants Whole Time Director Whole Time DirectorFirm’s Registration No.: 001076N/N500013 Firm’s Registration No.: 000340C DIN 02465412 DIN 00003649
Anupam Kumar Sumit Kathuria Vikas Bhatia Kapil AgarwalPartner Partner ChiefFinancialOfficer ChiefExecutiveOfficer Membership No.: 501531 Membership No.: 520078 and Whole Time Director DIN 02079161
Ravi Batra ChiefRiskOfficerand Place : Gurugram Group Company Secretary Dated : 07 February 2020 Membership No. F-5746
Varun Beverages Limited106
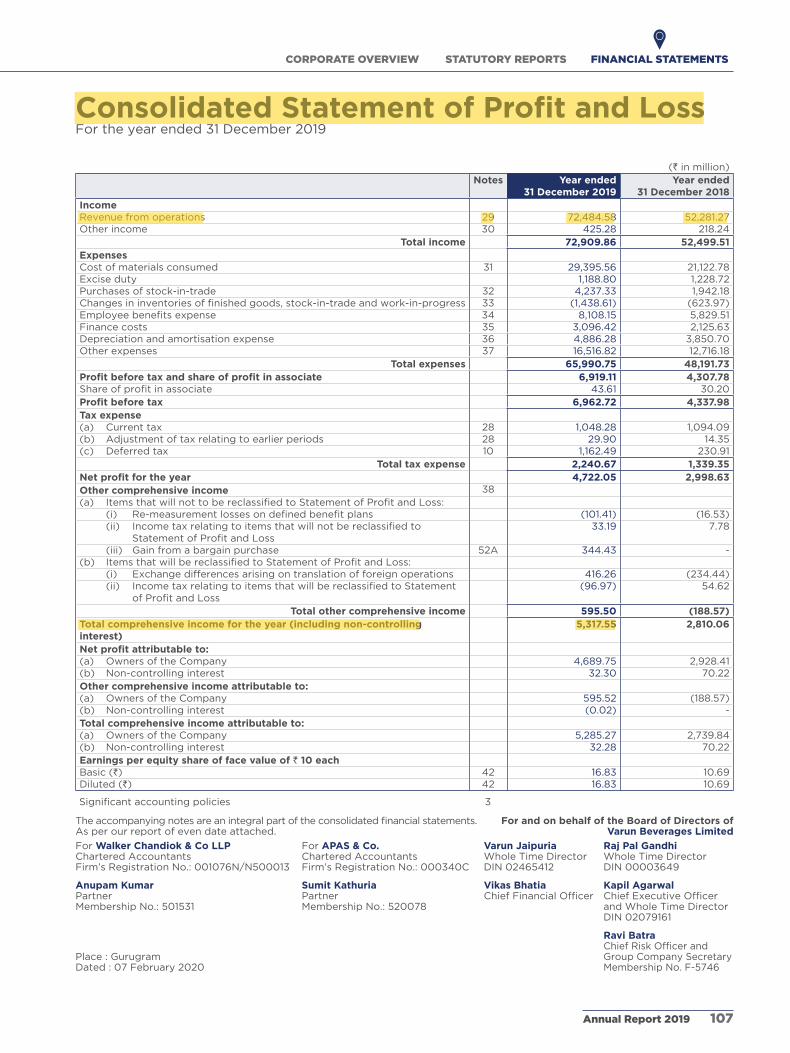
Consolidated Statement of Profit and LossFor the year ended 31 December 2019
(` in million)Notes Year ended
31 December 2019Year ended
31 December 2018IncomeRevenue from operations 29 72,484.58 52,281.27 Other income 30 425.28 218.24
Total income 72,909.86 52,499.51 ExpensesCost of materials consumed 31 29,395.56 21,122.78 Excise duty 1,188.80 1,228.72 Purchases of stock-in-trade 32 4,237.33 1,942.18 Changesininventoriesoffinishedgoods,stock-in-tradeandwork-in-progress 33 (1,438.61) (623.97)Employeebenefitsexpense 34 8,108.15 5,829.51 Finance costs 35 3,096.42 2,125.63 Depreciation and amortisation expense 36 4,886.28 3,850.70 Other expenses 37 16,516.82 12,716.18
Total expenses 65,990.75 48,191.73 Profit before tax and share of profit in associate 6,919.11 4,307.78 Shareofprofitinassociate 43.61 30.20 Profit before tax 6,962.72 4,337.98 Tax expense(a) Current tax 28 1,048.28 1,094.09 (b) adjustment of tax relating to earlier periods 28 29.90 14.35 (c) Deferred tax 10 1,162.49 230.91
Total tax expense 2,240.67 1,339.35 Net profit for the year 4,722.05 2,998.63 Other comprehensive income 38(a) ItemsthatwillnottobereclassifiedtoStatementofProfitandLoss: (i) Re-measurementlossesondefinedbenefitplans (101.41) (16.53) (ii) Incometaxrelatingtoitemsthatwillnotbereclassifiedto
StatementofProfitandLoss 33.19 7.78
(iii) Gain from a bargain purchase 52a 344.43 - (b) ItemsthatwillbereclassifiedtoStatementofProfitandLoss: (i) Exchange differences arising on translation of foreign operations 416.26 (234.44) (ii) IncometaxrelatingtoitemsthatwillbereclassifiedtoStatement
ofProfitandLoss (96.97) 54.62
Total other comprehensive income 595.50 (188.57)Total comprehensive income for the year (including non-controlling interest)
5,317.55 2,810.06
Net profit attributable to:(a) Owners of the Company 4,689.75 2,928.41 (b) Non-controlling interest 32.30 70.22 Other comprehensive income attributable to:(a) Owners of the Company 595.52 (188.57)(b) Non-controlling interest (0.02) - Total comprehensive income attributable to:(a) Owners of the Company 5,285.27 2,739.84 (b) Non-controlling interest 32.28 70.22 Earnings per equity share of face value of ` 10 eachBasic (`) 42 16.83 10.69 Diluted (`) 42 16.83 10.69
Significantaccountingpolicies 3
Theaccompanyingnotesareanintegralpartoftheconsolidatedfinancialstatements. For and on behalf of the Board of Directors ofas per our report of even date attached. Varun Beverages Limited
For Walker Chandiok & Co LLP For APAS & Co. Varun Jaipuria Raj Pal GandhiChartered accountants Chartered accountants Whole Time Director Whole Time DirectorFirm’s Registration No.: 001076N/N500013 Firm’s Registration No.: 000340C DIN 02465412 DIN 00003649
Anupam Kumar Sumit Kathuria Vikas Bhatia Kapil AgarwalPartner Partner ChiefFinancialOfficer ChiefExecutiveOfficer Membership No.: 501531 Membership No.: 520078 and Whole Time Director DIN 02079161
Ravi Batra ChiefRiskOfficerand Place : Gurugram Group Company Secretary Dated : 07 February 2020 Membership No. F-5746
STATUTORY REPORTSCORPORATE OVERVIEW FINANCIAL STATEMENTS
Annual Report 2019 107

Consolidated Cash Flow StatementFor the year ended 31 December 2019
(Indirect Method) (` in million)
Particulars Year ended 31 December 2019
Year ended 31 December 2018
A. Operating activities
Profitbeforetaxandshareofprofitinassociate 6,919.11 4,307.78
Adjustments to reconcile profit before tax to net cash flows:
Depreciation on property, plant and equipment 4,826.45 3,807.56
amortisation of intangible assets 59.83 43.14
Interest expense at amortised cost 3,007.53 2,043.57
Interest income at amortised cost (59.56) (57.67)
Dividend income from current investment (0.20) -
Gain on acquisition of control over existing associate (Refer note 52C) (158.11) -
Profitonsaleofcurrentinvestments (1.38) -
Excess provisions written back (151.83) (58.21)
(Gain)/Loss on disposal of property, plant and equipment (Net) (16.05) 189.65
Bad debts and advances written off 4.23 66.86
allowance for expected credit loss 188.09 257.40
Unrealisedforeignexchangefluctuation 486.22 631.08
Operatingprofitbeforeworkingcapitalchanges 15,104.33 11,231.16
Working capital adjustments
Increase in inventories (1,845.53) (1,514.67)
Increase in trade receivables (322.11) (129.95)
Increaseincurrentandnon-currentfinancialassetsandothercurrentandnon-current assets
(1,024.96) (1,135.34)
Increaseincurrentfinancialliabilitiesandothercurrentandnon-currentliabilities and provisions
2,341.41 2,279.46
Total cash from operations 14,253.14 10,730.66
Income tax paid (1,201.15) (732.88)
Net cash flows from operating activities (A) 13,051.99 9,997.78
B. Investing activities
Purchase of property, plant and equipment and intangible assets (including adjustment on account of capital work-in-progress, capital advances and capital creditors)
(7,536.27) (8,586.45)
Proceeds from disposal of property, plant and equipment and intangible assets
205.50 498.81
acquisition under business combination (Refer note 52) (16,251.55) (491.80)
Purchase of investment in associate (Net of cash acquired) (83.37) -
Government grant related to assets received 251.05 -
Interest received 46.22 55.50
Dividend income from current investment 0.20 -
Purchase of current investments (730.00) -
Proceeds from sale of current investments 731.38 0.03
Decrease/(Increase) in other bank balances 174.35 (210.30)
Net cash used in investing activities (B) (23,192.49) (8,734.21)
C. Financing activities
Proceeds from borrowings 18,695.79 13,758.54
Repayments of borrowings (13,097.79) (6,435.10)
Repayment of deferred payment liabilities (433.87) (3,020.71)
Proceeds from short term borrowings (Net) 888.62 242.90
Redemption of non-convertible debentures - (3,000.00)
Proceeds from issue of share capital (including share premium thereon) 9,001.80 7.15
Varun Beverages Limited108

(Indirect Method) (` in million)
Particulars Year ended 31 December 2019
Year ended 31 December 2018
Interest paid (3,010.98) (1,886.00)
Share issue expenses paid (164.36) -
Dividends paid (690.12) (455.98)
Dividend distribution tax paid (91.73) (54.71)
Net cash flows from /(used in) financing activities (C) 11,097.36 (843.91)
Net change in cash and cash equivalents (D=A+B+C) 956.86 419.66
Cash and cash equivalents at the beginning of year (E) 429.36 649.46
Unrealised exchange loss on translation of cash and cash equivalent in subsidiaries (F)
(6.54) (639.76)
Cash and cash equivalents at the end of year (G= D+E+F) (Refer note 14) 1,379.68 429.36
Notes:
(a) Reconciliation between the opening and closing balances in the balance sheet for liabilities arising from financing
activities, including both changes arising from cash flows and non-cash changes pursuant to Ind aS 7:
(` in million)
Non-current borrowings*
Current borrowings
Balance as at 01 January 2019 24,302.12 3,776.55 Cashflows(Net) 5,164.13 888.62 Non-cash changes: Impact of fair value changes 8.44 - Impactofexchangefluctuations 25.50 - Impact on acquisition of control over exisiting associate - 6.37 Balance as at 31 December 2019 29,500.19 4,671.54
Balance as at 01 January 2018 23,003.37 3,533.65 Cashflows(Net) 1,302.73 242.90 Non-cash changes: Impact of fair value changes (105.56) - Impactofexchangefluctuations 101.58 - Balance as at 31 December 2018 24,302.12 3,776.55
*includes current maturity of long-term debts and current portion of deferred payment liabilities amounting to ` 5,946.43 (31 December 2018: ` 4,501.43)
Theaccompanyingnotesareanintegralpartoftheconsolidatedfinancialstatements. For and on behalf of the Board of Directors ofas per our report of even date attached. Varun Beverages Limited
For Walker Chandiok & Co LLP For APAS & Co. Varun Jaipuria Raj Pal GandhiChartered accountants Chartered accountants Whole Time Director Whole Time DirectorFirm’s Registration No.: 001076N/N500013 Firm’s Registration No.: 000340C DIN 02465412 DIN 00003649
Anupam Kumar Sumit Kathuria Vikas Bhatia Kapil AgarwalPartner Partner ChiefFinancialOfficer ChiefExecutiveOfficer Membership No.: 501531 Membership No.: 520078 and Whole Time Director DIN 02079161
Ravi Batra ChiefRiskOfficerand Place : Gurugram Group Company Secretary Dated : 07 February 2020 Membership No. F-5746
STATUTORY REPORTSCORPORATE OVERVIEW FINANCIAL STATEMENTS
Annual Report 2019 109

Co
nso
lid
ate
d S
tate
me
nt
of
Ch
an
ge
s in
Eq
uit
yF
or
the y
ear
en
ded
31
Decem
ber
20
19
A.
Eq
uit
y s
hare
cap
ital
(` in
mill
ion
)
Part
icu
lars
No
tes
Nu
mb
er
of
share
sA
mo
un
t
Bala
nce
as
at
01
Jan
uary
20
18 1
82,5
86
,94
0
1,8
25
.87
Ch
an
ges
in e
qu
ity s
hare
cap
ital d
uri
ng
th
e y
ear
20
1820
55
,00
0
0.5
5
Bala
nce
as
at
31
De
ce
mb
er
20
18 1
82
,64
1,9
40
1
,82
6.4
2
Ch
an
ges
in e
qu
ity s
hare
cap
ital d
uri
ng
th
e y
ear
20
1920
10
6,0
46
,78
0
1,0
60
.47
Bala
nce
as
at
31
De
ce
mb
er
20
19 2
88
,68
8,7
20
2
,88
6.8
9
B.
Oth
er
Eq
uit
y
(` in
mill
ion
)
Par
ticu
lars
No
teA
ttri
bu
tab
le t
o O
wn
ers
of
the
Co
mp
any
No
n-
con
tro
llin
g
inte
rest
s
Tota
l
Res
erve
an
d s
urp
lus
Sh
are
app
licat
ion
m
on
ey
pen
din
g
allo
tmen
t
Exc
han
ge
dif
fere
nce
s o
n
tran
slat
ing
th
e fi
nan
cial
st
atem
ents
o
f fo
reig
n
op
erat
ion
s*
Tota
l at
trib
uta
ble
to
ow
ner
s o
f th
e C
om
pan
y
Cap
ital
re
serv
e o
n
con
solid
atio
n
Cap
ital
re
serv
eD
eben
ture
re
dem
pti
on
re
serv
e
Sec
uri
ties
p
rem
ium
Sh
are
op
tio
n
ou
tsta
nd
ing
ac
cou
nt
Gen
eral
re
serv
eR
etai
ned
ea
rnin
gs
Fo
reig
n
curr
ency
m
on
etar
y it
em
tran
slat
ion
d
iffe
ren
ce
acco
un
t (F
CM
ITD
A)
Bal
ance
as
at 0
1 Ja
nu
ary
20
1821
(2,2
79.7
8)
189
.50
159
.17
18,3
92
.22
1.3
019
1.2
5(5
94
.12
)(2
5.5
1)1.
08
(16
6.7
0)
15,8
68
.41
(14
.32
)15
,85
4.0
9
Profitfortheyear
--
--
--
2,9
28
.41
--
-2,9
28
.41
70.2
22,9
98
.63
Oth
er c
om
pre
hen
sive
inco
me
for
the
year
Re-measurementlossesondefined
benefitplans(Netofdeferredtaxes)
--
--
--
(8.7
5)
--
-(8
.75
)-
(8.7
5)
Exc
han
ge
dif
fere
nce
s ar
isin
g o
n
tran
slat
ion
of
fore
ign
op
erat
ion
s (N
et o
f d
efer
red
tax
es)
--
--
--
--
-(1
79.8
2)
(179
.82)
-(1
79.8
2)
Div
iden
d p
aid
**-
--
--
-(4
56
.58
)-
--
(45
6.5
8)
-(4
56
.58
)
Div
iden
d d
istr
ibu
tio
n t
ax-
--
--
-(5
4.7
1)-
--
(54
.71)
-(5
4.7
1)
Sh
are
issu
ed o
n e
xerc
ise
of
emp
loye
e st
ock
op
tio
ns
--
--
--
--
(1.0
8)
-(1
.08
)-
(1.0
8)
Tra
nsf
er t
o d
eben
ture
red
emp
tio
n
rese
rve
--
93
.84
--
-(9
3.8
4)
--
--
--
Tra
nsf
er t
o g
ener
al r
eser
ve o
n
red
emp
tio
n o
f n
on
-co
nve
rtib
le
deb
entu
res
--
(25
3.0
1)-
-25
3.0
1-
--
--
--
Varun Beverages Limited110

(` in
mill
ion
)
Par
ticu
lars
No
teA
ttri
bu
tab
le t
o O
wn
ers
of
the
Co
mp
any
No
n-
con
tro
llin
g
inte
rest
s
Tota
l
Res
erve
an
d s
urp
lus
Sh
are
app
licat
ion
m
on
ey
pen
din
g
allo
tmen
t
Exc
han
ge
dif
fere
nce
s o
n
tran
slat
ing
th
e fi
nan
cial
st
atem
ents
o
f fo
reig
n
op
erat
ion
s*
Tota
l at
trib
uta
ble
to
ow
ner
s o
f th
e C
om
pan
y
Cap
ital
re
serv
e o
n
con
solid
atio
n
Cap
ital
re
serv
eD
eben
ture
re
dem
pti
on
re
serv
e
Sec
uri
ties
p
rem
ium
Sh
are
op
tio
n
ou
tsta
nd
ing
ac
cou
nt
Gen
eral
re
serv
eR
etai
ned
ea
rnin
gs
Fo
reig
n
curr
ency
m
on
etar
y it
em
tran
slat
ion
d
iffe
ren
ce
acco
un
t (F
CM
ITD
A)
ad
dit
ion
mad
e in
FC
MIT
Da
fo
r th
e ye
ar-
--
--
--
79.4
4-
-79
.44
-79
.44
FC
MIT
Da
ch
arg
ed t
o S
tate
men
t o
f ProfitandLoss
--
--
--
-(2
4.3
8)
--
(24
.38
)-
(24
.38
)
Cre
ated
on
su
bse
qu
ent
incr
ease
in
min
ori
ty in
tere
st-
--
--
--
--
--
21.
7821.
78
ad
dit
ion
s m
ade
pu
rsu
ant
to e
xerc
ise
of
emp
loye
e st
ock
op
tio
ns
--
-7.
68
--
--
--
7.6
8-
7.6
8
Tra
nsf
er t
o s
ecu
rity
pre
miu
m o
n
exer
cise
of
emp
loye
e st
ock
op
tio
ns
--
-0
.91
(0.9
1)-
--
--
--
-
Bal
ance
as
at 3
1 D
ecem
ber
20
18(2
,279
.78
)18
9.5
0-
18,4
00
.81
0.3
94
44
.26
1,72
0.4
12
9.5
5-
(34
6.5
2)
18,1
58
.62
77.
68
18,2
36
.30
Profitfortheyear
--
--
--
4,6
89
.75
--
-4
,68
9.7
53
2.3
04
,722.0
5
Oth
er c
om
pre
hen
sive
inco
me
for
the
year Re-measurementlossesondefined
benefitplans(Netofdeferredtaxes)
--
--
--
(68
.20
)-
--
(68
.20
)(0
.02)
(68
.22)
Gai
n f
rom
a b
arg
ain
pu
rch
ase
(ref
er
no
te 5
2a
)-
34
4.4
3-
--
--
--
-3
44
.43
-3
44
.43
Exc
han
ge
dif
fere
nce
s ar
isin
g o
n
tran
slat
ion
of
fore
ign
op
erat
ion
s (N
et
of
def
erre
d t
axes
)
--
--
--
--
-3
19.2
93
19.2
9-
319
.29
Div
iden
d p
aid
**-
--
--
-(6
90
.12)
--
-(6
90
.12)
-(6
90
.12)
Div
iden
d d
istr
ibu
tio
n t
ax-
--
--
-(9
1.73
)-
--
(91.
73)
-(9
1.73
)
ad
dit
ion
mad
e in
FC
MIT
Da
fo
r th
e ye
ar-
--
--
--
(47.
92)
--
(47.
92)
-(4
7.9
2)
FC
MIT
Da
ch
arg
ed t
o S
tate
men
t o
f ProfitandLoss
--
--
--
-6
.24
--
6.2
4-
6.2
4
acq
uis
itio
n o
f co
ntr
ol o
ver
exis
tin
g
asso
ciat
e (R
efer
no
te 5
2C
)-
--
--
--
--
--
196
.83
196
.83
ad
dit
ion
s m
ade
pu
rsu
ant
to e
xerc
ise
of
emp
loye
e st
ock
op
tio
ns
--
-1.
85
--
--
--
1.8
5-
1.8
5
ad
dit
ion
s m
ade
on
issu
e o
f eq
uit
y sharespursuanttoQualifiedinstitutions
pla
cem
ent
(Ref
er n
ote
20
(h))
--
-8
,85
2.9
3-
--
--
-8
,85
2.9
3-
8,8
52.9
3
ad
just
men
t o
n a
cco
un
t o
f em
plo
yee
sto
ck o
pti
on
s la
pse
d-
--
-(0
.17)
--
--
-(0
.17)
-(0
.17)
STATUTORY REPORTSCORPORATE OVERVIEW FINANCIAL STATEMENTS
Annual Report 2019 111

Theaccompanyingnotesareanintegralpartoftheconsolidatedfinancialstatements.
Fo
r an
d o
n b
eh
alf
of
the
Bo
ard
of
Dir
ecto
rs o
fa
s p
er
ou
r re
po
rt o
f even
date
att
ach
ed
. V
aru
n B
eve
rag
es
Lim
ite
d
Fo
r W
alk
er
Ch
an
dio
k &
Co
LL
P
Fo
r A
PA
S &
Co
. V
aru
n J
aip
uri
a
Raj
Pal
Gan
dh
iC
hart
ere
d a
cco
un
tan
ts
Ch
art
ere
d a
cco
un
tan
ts
Wh
ole
Tim
e D
irecto
r W
ho
le T
ime D
irecto
rF
irm
’s R
eg
istr
ati
on
No
.: 0
010
76
N/N
50
00
13
Fir
m’s
Reg
istr
ati
on
No
.: 0
00
34
0C
D
IN 0
24
65
412
D
IN 0
00
03
64
9
An
up
am
Ku
mar
Su
mit
Kath
uri
a
Vik
as
Bh
ati
a
Kap
il A
garw
al
Partner
Partner
ChiefFinancialOfficer
ChiefExecutiveOfficer
Mem
bers
hip
no
.: 5
015
31
Mem
bers
hip
no
.: 5
20
078
an
d W
ho
le T
ime D
irecto
r
DIN
020
79
161
R
avi
Batr
a
ChiefRiskOfficerand
Pla
ce : G
uru
gra
m
Gro
up
Co
mp
an
y S
ecre
tary
D
ate
d : 0
7 F
eb
ruary
20
20
M
em
bers
hip
No
. F-5
74
6
Co
nso
lid
ate
d S
tate
me
nt
of
Ch
an
ge
s in
Eq
uit
y (
Co
ntd
.)F
or
the y
ear
en
ded
31
Decem
ber
20
19
(` in
mill
ion
)
Par
ticu
lars
No
teA
ttri
bu
tab
le t
o O
wn
ers
of
the
Co
mp
any
No
n-
con
tro
llin
g
inte
rest
s
Tota
l
Res
erve
an
d s
urp
lus
Sh
are
app
licat
ion
m
on
ey
pen
din
g
allo
tmen
t
Exc
han
ge
dif
fere
nce
s o
n
tran
slat
ing
th
e fi
nan
cial
st
atem
ents
o
f fo
reig
n
op
erat
ion
s*
Tota
l at
trib
uta
ble
to
ow
ner
s o
f th
e C
om
pan
y
Cap
ital
re
serv
e o
n
con
solid
atio
n
Cap
ital
re
serv
eD
eben
ture
re
dem
pti
on
re
serv
e
Sec
uri
ties
p
rem
ium
Sh
are
op
tio
n
ou
tsta
nd
ing
ac
cou
nt
Gen
eral
re
serv
eR
etai
ned
ea
rnin
gs
Fo
reig
n
curr
ency
m
on
etar
y it
em
tran
slat
ion
d
iffe
ren
ce
acco
un
t (F
CM
ITD
A)
Tra
nsf
er t
o s
ecu
rity
pre
miu
m o
n
exer
cise
of
emp
loye
e st
ock
op
tio
ns
--
-0
.22
(0.2
2)
--
--
--
--
am
ou
nt
uti
lised
fo
r b
on
us
issu
e-
--
(913
.28
)-
--
--
-(9
13.2
8)
-(9
13.2
8)
am
ou
nt
uti
lised
fo
r sh
are
issu
e ex
pen
ses
(Ref
er n
ote
62)
--
-(1
64
.36
)-
--
--
-(1
64
.36
)-
(16
4.3
6)
Bal
ance
as
at 3
1 D
ecem
ber
20
19(2
,279
.78
)5
33
.93
-2
6,1
78.1
7-
44
4.2
65
,56
0.1
1(1
2.1
3)
-(2
7.2
3)
30
,39
7.3
33
06
.79
30
,70
4.1
2
*Exch
an
ge d
iffe
ren
ces
ari
sin
g o
n t
ran
slati
on
of
fore
ign
op
era
tio
ns
**T
ran
sacti
on
wit
h o
wn
ers
in
th
eir
cap
acit
y a
s o
wn
ers
.
Varun Beverages Limited112

Summary of significant accounting policies and other explanatory information on the Consolidated Financial Statements for the year ended 31 December 2019
1. Corporate information
Varun Beverages Limited (“VBL” or “the Company’’
or “Holding Company” or “Parent Company”) is
a public limited Company domiciled in India. Its
registered office is at F-2/7, Okhla Industrial area,
Phase-I, New Delhi- 110 020. The Company’s equity
shares are listed on Bombay Stock Exchange Limited
(BSE) and National Stock Exchange of India (NSE).
The Company was incorporated on 16 June 1995
under the provisions of the Companies act, 1956.
The Company together with its subsidiaries and
erstwhile associate (hereinafter, “the Group”) is
primarily engaged in manufacturing, selling, bottling
and distribution of beverages of PepsiCo’s brand
in geographically pre-defined territories of India,
Sri Lanka, Nepal, Zambia, Morocco and Zimbabwe
as per franchisee agreement with PepsiCo India
Holdings Private Limited and its affiliates. The sale of
Group’s products is seasonal.
2. Basis of preparation
These Consolidated Financial Statements (“the CFS”)
of the Group have been prepared in accordance
with the Indian accounting Standards (‘‘Ind aS’’)
and comply with requirements of Ind aS, notified
under section 133 of the Companies act 2013, (“the
act”) read together with the Companies (Indian
accounting Standards) Rules, 2015 as amended
from time to time, stipulation contained in Schedule
III (Revised) and other pronouncements/ provisions
of applicable laws.
These CFS of the Group are authorised for issue on 07
February 2020 in accordance with a resolution of the
Board of Directors. The Board of Directors can permit
the revision to the consolidated financial statements
after obtaining necessary approvals or at the instance
of regulatory authorities as per provisions of the act.
These CFS have been prepared using the significant
accounting policies and measurement basis
summarised below. These accounting policies have
been used consistently throughout all periods
presented in these consolidated financial statements
except as mentioned in note 3(b) below.
The CFS have been prepared on a historical cost
basis, except for the following assets and liabilities
which have been measured at fair value:
(i) Derivative financial instruments;
(ii) Certain financial assets and liabilities measured
at fair value (refer accounting policy regarding
financial instruments);
(iii) Defined benefit plans- plan assets measured at
fair value; and
(iv) Share based payments.
The Group presents assets and liabilities in the
balance sheet based on current/non-current
classification. an asset is treated as current if it
satisfies any of the following conditions:
(i) Expected to be realised or intended to sold or
consumed in normal operating cycle;
(ii) Held primarily for the purpose of trading;
(iii) Expected to be realised within twelve months
after the reporting period, or
(iv) Cash or cash equivalent unless restricted from
being exchanged or used to settle a liability
for at least twelve months after the reporting
period.
all other assets are classified as non-current.
a liability is current if it satisfies any of the following
conditions:
(i) It is expected to be settled in normal operating
cycle;
(ii) It is held primarily for the purpose of trading;
(iii) It is due to be settled within twelve months
after the reporting period; or
(iv) There is no unconditional right to defer the
settlement of the liability for at least twelve
months after the reporting period.
The Group classifies all other liabilities as non-
current.
Deferred tax assets and liabilities are classified as
non-current assets and liabilities.
The operating cycle is the time between the
acquisition of assets for processing and its
realisation in cash and cash equivalents. The Group
has identified twelve months as its operating cycle.
all amounts disclosed in the CFS and notes have
been rounded off to the nearest million as per
STATUTORY REPORTSCORPORATE OVERVIEW FINANCIAL STATEMENTS
Annual Report 2019 113

Summary of significant accounting policies and other explanatory information on the Consolidated Financial Statements for the year ended 31 December 2019
the requirement of Schedule III to the act, unless
otherwise stated.
2.1. Basis of consolidation
The consolidated financial statements comprise
the financial statements of the Company, its
subsidiaries and erstwhile associate. Control is
achieved when the Group is exposed, or has rights,
to variable returns from its involvement with the
investee and has the ability to affect those returns
through its power over the investee. Specifically,
the Group controls an investee if and only if the
Group has:
Power over the investee (i.e., existing rights that
give it the current ability to direct the relevant
activities of the investee);
Exposure, or rights, to variable returns from its
involvement with the investee, and
The ability to use its power over the investee to
affect its returns.
Generally, there is a presumption that a majority
of voting rights result in control. To support this
presumption and when the Group has less than
a majority of the voting or similar rights of an
investee, the Group considers all relevant facts and
circumstances in assessing whether it has power
over an investee, including:
(a) The contractual arrangement with the other
vote holders of the investee;
(b) The rights arising from other contractual
arrangements;
(c) The Group’s voting rights and potential voting
rights; and
(d) The size of the Group’s holding of voting
rights relative to the size and dispersion of the
holdings of the other voting rights holders.
The Group re-assesses whether or not it controls
an investee if facts and circumstances indicate
that there are changes to one or more of the three
elements of control. Consolidation of a subsidiary
begins when the Group obtains control over the
subsidiary and ceases when the Group loses control
of the subsidiary. assets, liabilities, income and
expenses of a subsidiary acquired or disposed of
during the year are included in the consolidated
financial statements from the date the Group gains
control until the date the Group ceases to control
the subsidiary.
Consolidated financial statements are prepared using
uniform accounting policies for like transactions and
other events in similar circumstances. If a member of
the Group uses accounting policies other than those
adopted in the consolidated financial statements for
like transactions and events in similar circumstances,
appropriate adjustments are made to that member’s
financial statements in preparing the consolidated
financial statements to ensure conformity with the
Group’s accounting policies.
an associate is an entity over which the Group has
significant influence, i.e., the power to participate in
the financial and operating policy decisions of the
investee but not control or joint control over those
policies.
The financial statements of all entities used for the
purpose of consolidation are drawn up to same
reporting date as that of the parent company, i.e.,
year ended 31 December. When the end of the
reporting period of the parent is different from that
of a subsidiary/ associate, the subsidiary/ associate
prepares, for consolidation purposes, additional
financial information as of the same date as the
financial statements of the parent to enable the
parent to consolidate the financial information of the
subsidiary, unless it is impracticable to do so.
The following consolidation procedures are adopted:
Subsidiary:
(a) Combine like items of assets, liabilities, equity,
income, expenses and cash flows of the parent
with those of its subsidiaries. For this purpose,
income and expenses of the subsidiary are
based on the amounts of the assets and
liabilities recognised in the consolidated
financial statements at the acquisition date;
(b) Offset (eliminate) the carrying amount of the
parent’s investment in each subsidiary and the
parent’s portion of equity of each subsidiary.
Business combinations policy explains how to
account for any related goodwill; and
(c) Eliminate in full intragroup assets and liabilities,
equity, income, expenses and cash flows
relating to transactions between entities of
Varun Beverages Limited114

Summary of significant accounting policies and other explanatory information on the Consolidated Financial Statements for the year ended 31 December 2019
the group (profits or losses resulting from
intragroup transactions that are recognised in
assets, such as inventory and fixed assets, are
eliminated in full). Ind aS 12 ‘Income Taxes’
applies to temporary differences that arise from
the elimination of profits and losses resulting
from intragroup transactions.
Profit or loss and each component of Other
Comprehensive Income (“OCI”) are attributed to the
equity holders of the parent of the Group and to the
non-controlling interests, even if this results in the
non-controlling interests having a deficit balance.
a change in the ownership interest of a subsidiary,
without a loss of control, is accounted for as an
equity transaction. If the Group loses control over a
subsidiary, it:
Derecognises the assets (including goodwill)
and liabilities of the subsidiary;
Derecognises the carrying amount of any non-
controlling interests;
Derecognises the cumulative translation
differences recorded in equity;
Recognises the fair value of the consideration
received;
Recognises the fair value of any investment
retained;
Recognises any surplus or deficit in Consolidated
Statement of Profit and Loss;
Reclassifies the parent’s share of components
previously recognised in OCI to profit or loss or
retained earnings, as appropriate, as would be
required if the Group had directly disposed of
the related assets or liabilities
Associates:
Interests in associates are accounted for using the
equity method, after initially being recognised at
cost in the consolidated balance sheet. When a
member of the Group transacts with an associate
of the Group, profits and losses from transactions
with the associate are recognised in the CFS only to
the extent of interests in the associate that are not
related to the Group.
The carrying amount of the investment is adjusted to
recognise changes in the Group’s share of net assets
of the associate since the acquisition date. Goodwill
relating to the associate is included in the carrying
amount of the investment.
The Consolidated Statement of Profit and Loss
reflects the Group’s share of the results of operations
of the associate. any change in OCI of those investees
is presented as part of the Group’s OCI. In addition,
when there has been a change recognised directly
in the equity of the associate, the Group recognises
its share of any changes, when applicable, in the
statement of changes in equity. Unrealised gains
and losses resulting from transactions between the
Group and the associate are eliminated to the extent
of the interest in the associate. The aggregate of
the Group’s share of profit or loss of an associate is
shown on the face of the Consolidated Statement of
Profit and Loss.
after application of the equity method, the Group
determines whether it is necessary to recognise an
impairment loss on its investment in its associate. at
each reporting date, the Group determines whether
there is objective evidence that the investment in the
associate is impaired. If there is such evidence, the
Group calculates the amount of impairment as the
difference between the recoverable amount of the
associate and its carrying value, and then recognises
the loss as ‘Share of profit of an associate’ in the
Consolidated Statement of Profit and Loss.
Upon loss of significant influence over the associate,
the Group measures and recognises any retained
investment at its fair value. any difference between
the carrying amount of the associate upon loss
of significant and the fair value of the retained
investment and proceeds from disposal is recognised
in the Consolidated Statement of Profit and Loss.
On acquisition of control over previously owned
associates, the Group re-measures its previously held
equity interest in the associates at the acquisition
date fair value and the difference, if any, between
the carrying amount and the fair value is recognised
in the Consolidated Statement of Profit and Loss.
Goodwill is generally computed as the difference
between the sum of consideration transferred
(measured at fair value) the non-controlling interest
(“NCI”) in the acquiree and the net of the acquisition
STATUTORY REPORTSCORPORATE OVERVIEW FINANCIAL STATEMENTS
Annual Report 2019 115

Summary of significant accounting policies and other explanatory information on the Consolidated Financial Statements for the year ended 31 December 2019
date amounts of the identifiable assets acquired and
the liabilities assumed.
3. Summary of significant accounting policies
a) Fair value measurements
The Group measures financial instruments at fair
value which is the price that would be received to
sell an asset or paid to transfer a liability in an orderly
transaction between market participants at the
measurement date. The fair value measurement
is based on the presumption that the transaction
to sell the asset or transfer the liability takes
place either:
In the principal market for the asset or
liability, or
In the absence of a principal market, in the
most advantageous market for the asset or
liability.
all assets and liabilities for which fair value is
measured or disclosed in the consolidated
financial statements are categorised within the
fair value hierarchy, described as follows, based
on the lowest level input that is significant to
the fair value measurement as a whole:
Level 1 - Quoted (unadjusted) market
prices in active markets for identical assets
or liabilities;
Level 2 - Valuation techniques for which
the lowest level input that is significant to
the fair value measurement is directly or
indirectly observable; and
Level 3 - Valuation techniques for which the
lowest level input that is significant to the
fair value measurement is unobservable.
The Group uses valuation techniques that are
appropriate in the circumstances and for which
sufficient data are available to measure fair value,
maximising the use of relevant observable inputs
and minimising the use of unobservable inputs.
For assets and liabilities that are recognised in the
consolidated financial statements on a recurring
basis, the Group determines whether transfers
have occurred between levels in the hierarchy
by re-assessing categorisation (based on the
lowest level input that is significant to the fair
value measurement as a whole) at the end of each
reporting period.
For the purpose of fair value disclosures, the Group
has determined classes of assets and liabilities on
the basis of the nature, characteristics and risks of
the asset or liability and the level of the fair value
hierarchy as explained above.
b) Revenue recognition
Application of New Accounting Pronouncement:
With effect from 01 January 2019, the Group has
adopted Ind aS 115, ‘Revenue from Contracts
with Customers’ using cumulative effect
approach which does not require comparative
information to be restated in the consolidated
financial statements. The standard is applied
retrospectively only to contracts that were not
completed as at the date of initial application
(i.e., 01 January 2019). There was no material
impact of above in the opening balance sheet
as at 01 January 2019 and on the Statement of
Profit and Loss for the year ended 31 December
2019.
Under Ind aS 115, revenue is recognised
upon transfer of control of promised goods
or services to customers at an amount that
reflects the consideration to which the Group
is expected to be entitled to in exchange for
those goods or services. Revenue towards
satisfaction of a performance obligation is
measured at the amount of transaction price
allocated to that performance obligation as per
contractually agreed terms with the customers.
The transaction price of goods sold and
services rendered is net of various discounts
and schemes offered by the Group as part of
the contract. Revenue is recorded provided
the recovery of consideration is probable and
determinable. Revenue from sale of goods
and services transferred to distributors/
intermediaries are recognised at a point in time.
Sale of goods
Revenue from the sale of manufactured and traded
goods products is recognised upon transfer of
control of products to the customers which coincides
with their delivery to customer and is measured at
fair value of consideration received/receivable, net
of discounts, amount collected on behalf of third
parties and applicable taxes.
Varun Beverages Limited116

Summary of significant accounting policies and other explanatory information on the Consolidated Financial Statements for the year ended 31 December 2019
Interest income
Interest income is recognised on time proportion
basis taking into account the amount outstanding
and rate applicable. For all debt instruments
measured at amortised cost, interest income is
recorded using the effective interest rate (“EIR”).
EIR is the rate that exactly discounts the estimated
future cash payments or receipts over the expected
life of the financial instrument or a shorter period,
where appropriate, to the gross carrying amount
of the financial assets. Interest income is included
in other income in the Consolidated Statement of
Profit and Loss.
Dividends
Dividend is recognised when the Group’s right to
receive the payment is established, which is generally
when shareholders approve the dividend.
Services rendered
Revenue from service related activities is recognised
as and when services are rendered and on the basis
of contractual terms with the parties.
c) Inventories
Inventories are valued as follows:
(i) Raw materials, components and stores and
spares: at lower of cost and net realisable
value. Cost of inventory comprises all costs
of purchases, duties, taxes (other than
those subsequently recoverable from tax
authorities) and all other costs incurred
in bringing the inventory to their present
location and condition and is determined
on a moving weighted average cost basis.
However, materials and other items held
for use in the production of inventories are
not written down below cost if the finished
products in which they will be incorporated
are expected to be sold at or above cost.
(ii) Work-in-progress: at lower of cost and
net realisable value. Cost for this purpose
includes material, labour and appropriate
allocation of overheads including
depreciation. Cost is determined on a
weighted average basis.
(iii) Intermediate goods/ Finished goods:
(a) Self manufactured - at lower of cost
and net realisable value. Cost for this
purpose includes material, labour and
appropriate allocation of overheads.
Cost is determined on a weighted
average basis.
(b) Traded - at lower of cost and net
realisable value. Cost of inventory
comprises all costs of purchases,
duties, taxes (other than those
subsequently recoverable from
tax authorities) and all other costs
incurred in bringing the inventory to
their present location and condition
and is determined on a weighted
average cost basis.
Net realisable value is the estimated selling
price in the ordinary course of business,
less estimated costs of completion and
estimated costs necessary to make the sale.
Provision for obsolescence is determined
based on management’s assessment and is
charged to the Consolidated Statement of
Profit and Loss.
d) Property, plant and equipment
Measurement at recognition:
Property, plant and equipment and capital work
in progress is stated at cost, net of accumulated
depreciation and accumulated impairment
losses, if any.
Cost comprises the purchase price, borrowing
costs if capitalization criteria are met and any
directly attributable cost of bringing the asset
to its working condition for the intended use.
any trade discounts and rebates are deducted
in arriving at the purchase price. The cost of
an item of property, plant and equipment is
recognised as an asset if, and only if:
(a) it is probable that future economic benefits
associated with the item will flow to the
entity; and
(b) the cost of the item can be measured
reliably.
STATUTORY REPORTSCORPORATE OVERVIEW FINANCIAL STATEMENTS
Annual Report 2019 117

Summary of significant accounting policies and other explanatory information on the Consolidated Financial Statements for the year ended 31 December 2019
Subsequent expenditure related to an item
of property, plant and equipment is added to
its book value only if it increased the future
benefits from the existing asset beyond its
previously assessed standard of performance.
all other expenses on existing assets,
including day- to- day repair and maintenance
expenditure and cost of replacing parts, are
charged to the Consolidated Statement of
Profit and Loss for the period during which
such expenses are incurred. Expenditure
directly relating to construction activity is
capitalized. Indirect expenditure incurred
during construction period is capitalized as a
part of indirect construction cost to the extent
the expenditure is related to construction
or is incidental thereto. Other indirect costs
incurred during-the construction periods
which are not related to construction activity
nor are incidental thereto are charged to the
Consolidated Statement of Profit and Loss.
Value for individual assets acquired for a
consolidated price, the consideration is
apportioned to the various assets on a fair value
basis as determined by competent valuers.
Depreciation:
The management has estimated, supported by
technical assessment, the useful lives of property,
plant and equipment. The management believes
that these estimated useful lives are realistic
and reflect fair approximation of the period
over which the assets are likely to be used.
Depreciation is calculated on a straight-line
basis over the estimated useful lives of the
assets as follows:
Description Useful lives (upto)
Leasehold land Over lease period
Buildings - factory 20-50 years
Buildings - others 59-60 years
Plant and equipment 4-20 years
Furniture and fixtures 5-10 years
Delivery vehicles 4-10 years
Vehicles (other than
delivery vehicles)
4-7 years
Office equipment 4-10 years
Computer equipment 3-5 years
Containers 4-10 years
Description Useful lives (upto)
Post-mix vending
machines and
refrigerators (Visi-
Coolers)
7-10 years
Power generating
assets
22 years
Freehold land is not depreciated.
Depreciation on property, plant and equipment
is provided over the useful life of assets as
specified in Schedule II to the act except
where the management, based on independent
technical assessment, depreciates certain
assets are over estimated useful lives which are
different from the useful life prescribed in the
Schedule II to the act.
The Group has used the remaining useful lives
to compute depreciation on its property, plant
and equipment, acquired under the business
transfer agreement based on external technical
evaluation.
Depreciation on property, plant and equipment
which are added/disposed off during the year is
provided on a pro-rata basis with reference to
the month of addition/deletion.
The Company has technically evaluated all the
property, plant and equipment for determining
the separate identifiable assets having different
useful lives under the component approach. On
technical evaluation of all separate identifiable
components, the management is of the opinion
that they do not have any different useful life
from that of the principal asset.
In case of revaluation of leasehold land, the
resulting amortisation of the total revalued
amount is expensed off to the Consolidated
Statement of Profit and Loss.
Derecognition:
an item of property, plant and equipment
and any significant part initially recognised
is de-recognised upon disposal or when no
future economic benefits are expected from
its use or disposal. any gain or loss arising on
Varun Beverages Limited118

Summary of significant accounting policies and other explanatory information on the Consolidated Financial Statements for the year ended 31 December 2019
de-recognition of the asset (calculated as the
difference between the net disposal proceeds
or amount of security deposit adjusted and the
carrying amount of the asset) is included in
the Consolidated Statement of Profit and Loss
when the asset is de-recognised.
Breakages of containers are adjusted on ‘first
bought first broken’ basis, since it is not feasible
to specifically identify the broken containers in
the fixed assets records.
e) Intangible assets
Intangible assets are initially recognised at:
(a) In case the assets are acquired separately
then at cost,
(b) In case the assets are acquired in a business
combination or under any asset purchase
agreement at fair value.
Following initial recognition, intangible assets
are carried at cost less any accumulated
amortisation and accumulated impairment loss.
Intangible assets with finite useful life are
assessed for impairment whenever there is an
indication that the intangible assets may be
impaired.
amortisation of other intangible assets are
amortised on a straight-line basis using the
estimated useful life as follows:
Intangible assets Useful lives (years)
Software 3-5 Years
Market infrastructure 5 Years
Distribution network 8 Years
The franchise rights and trademarks acquired as
part of business combinations normally have a
remaining legal life of not exceeding ten years
but is renewable every ten years at little cost
and is well established. The Group intends to
renew these rights continuously and evidence
supports its ability to do so.
an analysis of product life cycle studies, market
and competitive trends provides evidence that
the product will generate net cash inflows for
the Group for an indefinite period. Therefore,
these rights have been carried at cost without
amortisation, but is tested for impairment
annually, at the cash-generating unit level.
The assessment of indefinite life is reviewed
annually to determine whether the indefinite life
continues to be supportable. If not, the change
in useful life from indefinite to finite is made on
a prospective basis.
f) Borrowing costs
Borrowing costs include interest, amortisation
of ancillary costs incurred in connection
with the arrangement of borrowings and
exchange differences arising from foreign
currency borrowings to the extent they are
regarded as an adjustment to the interest
cost. Borrowing costs, if any, directly
attributable to the acquisition, construction or
production of an asset that necessarily takes
a substantial period of time to get ready for
its intended use or sale are capitalized, if any.
all other borrowing costs are expensed to the
Consolidated Statement of Profit and Loss in
the period in which they occur.
g) Leases
The determination of whether an arrangement is
(or contains) a lease is based on the substance
of the arrangement at the inception of the
lease. The arrangement is, or contains, a lease
if fulfilment of the arrangement is dependent
on the use of a specific asset or assets and the
arrangement conveys a right to use the asset
or assets, even if that right is not explicitly
specified in an arrangement.
Group as a lessee
a lease is classified at the inception date as a
finance lease or an operating lease. a lease that
transfers substantially all the risks and rewards
incidental to ownership to the Group is classified
as a finance lease.
Finance leases are capitalised at the
commencement of the lease at the inception
date fair value of the leased property or, if
lower, at the present value of the minimum lease
payments. Lease payments are apportioned
between finance charges and reduction of the
lease liability so as to achieve a constant rate of
interest on the remaining balance of the liability.
STATUTORY REPORTSCORPORATE OVERVIEW FINANCIAL STATEMENTS
Annual Report 2019 119

Summary of significant accounting policies and other explanatory information on the Consolidated Financial Statements for the year ended 31 December 2019
Finance charges are recognised in finance
costs in the Consolidated Statement of Profit
and Loss, unless they are directly attributable
to qualifying assets, in which case they are
capitalized in accordance with the Group’s
general policy on the borrowing costs.
a leased asset is depreciated over the useful life
of the asset. However, if there is no reasonable
certainty that the Group will obtain ownership
by the end of the lease term, the asset is
depreciated over the shorter of the estimated
useful life of the asset and the lease term.
Operating lease payments are recognised as an
expense in the Consolidated Statement of Profit
and Loss on a straight-line basis over the lease term.
Group as a lessor
Leases are classified as finance leases when
substantially all of the risks and rewards of
ownership transfer from the Group to the lessee.
amounts due from lessees under finance leases
are recorded as receivables at the Group’s net
investment in the leases. Finance lease income
is allocated to accounting periods so as to
reflect a constant periodic rate of return on the
net investment outstanding in respect of the
lease.
Leases in which the Group does not transfer
substantially all the risks and rewards of
ownership of an asset are classified as operating
leases. Rental income from operating lease is
recognised on straight line basis over the term
of the relevant lease.
h) Employee benefits
Contribution to provident and other funds
Retirement benefit in the form of provident
fund is a defined contribution scheme. The
Group has no obligation, other than the
contribution payable to the provident fund.
The Group recognises contribution payable
to the provident fund scheme as an expense,
when an employee renders the related service.
If the contribution payable to the scheme for
service received before the balance sheet date
exceeds the contribution already paid, the
deficit payable to the scheme is recognised
as a liability after deducting the contribution
already paid. If the contribution already paid
exceeds the contribution due for services
received before the balance sheet date, then
excess is recognised as an asset to the extent
that the pre-payment will lead to, for example,
a reduction in future payment or a cash refund.
Gratuity
Gratuity is a defined benefit scheme. The
cost of providing benefits under the defined
benefit plan is determined using the projected
unit credit method. The Group recognises
termination benefit as a liability and an expense
when the Group has a present obligation as a
result of past event, it is probable that an outflow
of resources embodying economic benefits
will be required to settle the obligation and a
reliable estimate can be made of the amount
of the obligation. If the termination benefits fall
due more than twelve months after the balance
sheet date, they are measured at present value
of future cash flows using the discount rate
determined by reference to market yields at the
balance sheet date on government bonds.
Gratuity liability is accrued on the basis of
an actuarial valuation made at the end of the
year. The actuarial valuation is performed
by an independent actuary as per projected
unit credit method, except for few subsidiary
companies where gratuity liability is provided
on full cost basis.
Re-measurements, comprising actuarial gains
and losses, the effect of the asset ceiling,
excluding amounts included in net interest on
the net defined benefit liability and the return
on plan assets (excluding amounts included in
net interest on the net defined benefit liability),
are recognised immediately in the balance sheet
with a corresponding debit or credit to retained
earnings through OCI in the period in which they
occur. Re-measurements are not reclassified to
profit or loss in subsequent periods.
Past service costs are recognised in Consolidated
Statement of Profit and Loss on the earlier of:
The date of the plan amendment or
curtailment, and
Varun Beverages Limited120

Summary of significant accounting policies and other explanatory information on the Consolidated Financial Statements for the year ended 31 December 2019
The date that the Group recognises related
restructuring cost
Net interest is calculated by applying the discount
rate to the net defined benefit liability or asset.
The Group recognises the following changes in
the net defined benefit obligation as an expense
in the Consolidated Statement of Profit and
Loss:
Service costs comprising current service
costs, past-service costs, gains and
losses on curtailments and non-routine
settlements; and
Net interest expense or income
Compensated absences
The Group treats accumulated leave expected
to be carried forward beyond twelve months,
as long-term employee benefit which are
computed based on the actuarial valuation
using the projected unit credit method at the
year end except for few subsidiary companies
where accumulated leave liability is provided
on full cost basis. actuarial gains/losses
are immediately taken to the Consolidated
Statement of Profit and Loss and are not
deferred. The Group presents the leave as a
current liability in the balance sheet to the
extent it does not have an unconditional right
to defer its settlement for twelve months
after the reporting date. Where Group has
the unconditional legal and contractual right
to defer the settlement for a period beyond
twelve months, the balance is presented as a
non-current liability.
accumulated leave, which is expected to be
utilized within the next twelve months, is treated
as short term employee benefit. The Group
measures the expected cost of such absences
as the additional amount that it expects to pay
as a result of the unused entitlement that has
accumulated at the reporting date.
all other employee benefits payable/available
within twelve months of rendering the service
are classified as short-term employee benefits.
Benefits such as salaries, wages, bonus, etc.
are recognised in the Consolidated Statement
of Profit and Loss in the period in which the
employee renders the related service.
i) Share-based payments
Employees (including senior executives) of
the Group receive remuneration in the form of
share-based payments, whereby employees
render services as consideration for equity
instruments, which are classified as equity-
settled transactions.
The cost of equity-settled transactions is
determined by the fair value at the date
when the grant is made using an appropriate
valuation model. That cost is recognised as an
employee benefit expense with a corresponding
increase in ‘Share option outstanding account’
in other equity, over the period in which the
performance and/or service conditions are
fulfilled. The cumulative expense recognised for
equity-settled transactions at each reporting
date until the vesting date reflects the extent
to which the vesting period has expired and the
Group’s best estimate of the number of equity
instruments that will ultimately vest.
Service and non-market performance
conditions are not taken into account when
determining the grant date fair value of awards,
but the likelihood of the conditions being met
is assessed as part of the Group’s best estimate
of the number of equity instruments that will
ultimately vest. Market performance conditions
are reflected within the grant date fair value.
any other conditions attached to an award, but
without an associated service requirement, are
considered to be non-vesting conditions. Non-
vesting conditions are reflected in the fair value
of an award and lead to an immediate expensing
of an award unless there are also service and/or
performance conditions.
No expense is recognised for awards that
do not ultimately vest because non-market
performance and/or service conditions have
not been met. Where awards include a market
or non-vesting condition, the transactions are
treated as vested irrespective of whether the
market or non-vesting condition is satisfied,
provided that all other performance and/or
service conditions are satisfied.
STATUTORY REPORTSCORPORATE OVERVIEW FINANCIAL STATEMENTS
Annual Report 2019 121

Summary of significant accounting policies and other explanatory information on the Consolidated Financial Statements for the year ended 31 December 2019
When the terms of an equity-settled award are
modified, the minimum expense recognised is the
expense had the terms had not been modified, if the
original terms of the award are met. an additional
expense is recognised for any modification that
increases the total fair value of the share-based
payment transaction, or is otherwise beneficial
to the employee as measured at the date of
modification. Where an award is cancelled by
the entity or by the counterparty, any remaining
element of the fair value of the award is expensed
immediately through Consolidated Statement of
Profit and Loss.
j) Foreign currency transactions and translations
The Group’s consolidated financial statements
are presented in INR, which is also the parent
company’s functional currency. Transactions in
foreign currencies are initially recorded by the
Group’s entities at their respective functional
currency spot rates at the date the transaction
first qualifies for recognition.
Monetary assets and liabilities denominated
in foreign currencies are translated at the
functional currency spot rates of exchange
at the reporting date. Non-monetary items
which are carried in terms of historical cost
denominated in a foreign currency are reported
using the exchange rate at the date of the
transaction.
Exchange differences arising on the settlement
of monetary items or on restatement of the
Company’s monetary items at rates different
from those at which they were initially recorded
during the year, or reported in previous financial
statements, are recognised as income or as
expenses in the year in which they arise.
Exchange differences pertaining to long-term
foreign currency monetary items obtained
or given on or before 31 December 2016:
Exchange differences arising on conversion
of long term foreign currency monetary items
used for acquisition of depreciable fixed
assets are added to the cost of fixed assets
and is depreciated over the remaining life of
the respective fixed asset and in other cases,
is recorded under the head ‘Foreign Currency
Monetary Item Translation Difference account’
and is amortised over the period of maturity of
underlying long term foreign currency monetary
items, in accordance with the option available
under Ind aS 101.
Exchange differences pertaining to long-term
foreign currency monetary items obtained or
given on or after 01 January 2017: Exchange
differences arising on conversion of long term
foreign currency monetary items obtained or
given is recorded in the Consolidated Statement
of Profit and Loss.
Group companies
On consolidation, the assets and liabilities of
foreign operations, whose functional currency
is not the currency of a hyperinflationary
economy, are translated into INR at the rate
of exchange prevailing at the reporting date
and their statements of profit and loss are
translated at exchange rates prevailing at the
dates of the transactions. For practical reasons,
the group uses an average rate to translate
income and expense items, if the average rate
approximates the exchange rates at the dates
of the transactions.
However all amounts (i.e. assets, liabilities,
equity items, income and expenses) of foreign
operation, whose functional currency is the
currency of a hyperinflationary economy, are
translated into INR at the rate of exchange
prevailing at the reporting date and the
comparative figures shall be those that were
presented as current year amounts in the
relevant prior year financial statement (i.e. not
adjusted for subsequent changes in the price
level or subsequent changes in exchange rates).
The exchange differences arising on translation
for consolidation are recognised in OCI. On
disposal of a foreign operation, the component
of OCI relating to that particular foreign
operation is recognised in profit or loss.
Varun Beverages Limited122

Summary of significant accounting policies and other explanatory information on the Consolidated Financial Statements for the year ended 31 December 2019
Financial statements of entity whose functional currency is the currency of a hyperinflationary economy
The financial statements of an entity whose
functional currency is the currency of a
hyperinflationary economy is stated in terms
of the measuring unit current at the end of the
reporting period.
Monetary items are not restated because they
are already expressed in terms of the monetary
unit current at the end of the reporting period.
Non-monetary items which are carried at amounts
current at the end of the reporting period, such
as net realisable value and fair value, they are
not restated. all other nonmonetary assets and
liabilities which are carried at cost or cost less
depreciation are restated by applying to its
historical cost and accumulated depreciation the
change in a general price index from the date of
acquisition to the end of the reporting period.
However, where detailed records of the acquisition
dates are not available or capable of estimation,
in those cases, restatement is done based on
independent professional assessment or by using
the best estimate i.e by capturing the movements
in the exchange rate between the functional
currency and a relatively stable foreign currency.
Statement of profit and loss are expressed in
terms of the measuring unit current at the end of
the reporting period. Therefore all amounts are
restated by applying the change in the general
price index from the dates when the items of
income and expenses were initially recorded in
the financial statements.
at the beginning of the first period of application,
the components of shareholder’s equity, excluding
retained earnings and any revaluation surplus, are
restated by applying a general price index from
the dates on which the items were contributed or
otherwise arose. Restated retained earnings are
derived from all the other amounts in the restated
statement of financial position.
The gain or loss on the net monetary position,
being the difference resulting from the
restatement of non-monetary assets, owners’
equity and items in the statement of profit and
loss and the adjustment of index linked assets
and liabilities, is recognised in statement of
profit and loss.
k) Business combinations and goodwill
Business combinations are accounted for
using the acquisition method. The cost of an
acquisition is measured as the aggregate of
the consideration transferred measured at
acquisition date fair value and the amount of
any non-controlling interests in the acquiree.
For each business combination, the Group
elects whether to measure the non-controlling
interests in the acquiree at fair value or at
the proportionate share of the acquiree’s
identifiable net assets. acquisition-related costs
are expensed as incurred.
at the acquisition date, the identifiable assets
acquired and the liabilities assumed are
recognised at their acquisition date fair values.
For this purpose, the liabilities assumed include
contingent liabilities representing present
obligation and they are measured at their
acquisition fair values irrespective of the fact
that outflow of resources embodying economic
benefits is not probable. However, deferred tax
assets or liabilities, and the assets or liabilities
related to employee benefit arrangements are
recognised and measured in accordance with
Ind aS 12 ‘Income Taxes’ and Ind aS 19 ‘Employee
Benefits’ respectively. When a liability assumed
is recognised at the acquisition date but the
related costs are not deducted in determining
taxable profits until a later period, a deductible
temporary difference arises which results in a
deferred tax asset. a deferred tax asset also
arises when the fair value of an identifiable
asset acquired is less than its tax base.
When the Group acquires a business, it
assesses the financial assets and liabilities
assumed for appropriate classification and
designation in accordance with the contractual
terms, economic circumstances and pertinent
conditions as at the acquisition date.
If the business combination is achieved in
stages, any previously held equity interest is
STATUTORY REPORTSCORPORATE OVERVIEW FINANCIAL STATEMENTS
Annual Report 2019 123

Summary of significant accounting policies and other explanatory information on the Consolidated Financial Statements for the year ended 31 December 2019
re-measured at its acquisition date fair value
and any resulting gain or loss is recognised in
profit or loss or OCI, as appropriate.
any contingent consideration to be transferred
by the acquirer is recognised at fair value at
the acquisition date. Contingent consideration
classified as an asset or liability that is a
financial instrument and within the scope of Ind
aS 109 ‘Financial Instruments’ (“Ind aS 109”), is
measured at fair value with changes in fair value
recognised in Consolidated Statement of Profit
and Loss. If the contingent consideration is not
within the scope of Ind aS 109, it is measured
in accordance with the appropriate Ind aS.
Contingent consideration that is classified
as equity is not re-measured at subsequent
reporting dates and subsequent its settlement
is accounted for within equity.
Goodwill is initially measured at cost, being the
excess of the aggregate of the consideration
transferred and the amount recognised for
non-controlling interests, and any previous
interest held, over the net identifiable assets
acquired and liabilities assumed. If the fair value
of the net assets acquired is in excess of the
aggregate consideration transferred, the Group
re-assesses whether it has correctly identified
all of the assets acquired and all of the liabilities
assumed and reviews the procedures used to
measure the amounts to be recognised at the
acquisition date. If the reassessment still results
in an excess of the fair value of net assets
acquired over the aggregate consideration
transferred, then the gain is recognised in OCI
and accumulated in equity as capital reserve.
after initial recognition, goodwill is measured
at cost less any accumulated impairment
losses. For the purpose of impairment testing,
goodwill acquired in a business combination
is, from the acquisition date, allocated to each
of the Group’s cash-generating units that are
expected to benefit from the combination,
irrespective of whether other assets or liabilities
of the acquiree are assigned to those units.
a cash generating unit to which goodwill has
been allocated is tested for impairment annually,
or more frequently when there is an indication
that the unit may be impaired. If the recoverable
amount of the cash generating unit is less than
its carrying amount, the impairment loss is
allocated first to reduce the carrying amount of
any goodwill allocated to the unit and then to
the other assets of the unit pro rata based on the
carrying amount of each asset in the unit.
any impairment loss for goodwill is recognised
in Consolidated Statement of Profit and Loss.
an impairment loss recognised for goodwill is
not reversed in subsequent periods.
Where goodwill has been allocated to a cash-
generating unit and part of the operation within
that unit is disposed of, the goodwill associated
with the disposed operation is included in
the carrying amount of the operation when
determining the gain or loss on disposal.
Goodwill disposed in these circumstances is
measured based on the relative values of the
disposed operation and the portion of the cash-
generating unit retained.
If the initial accounting for a business
combination is incomplete by the end of the
reporting period in which the combination
occurs, the Group reports provisional amounts
for the items for which the accounting is
incomplete. Those provisional amounts
are adjusted through goodwill during the
measurement period, or additional assets
or liabilities are recognised, to reflect new
information obtained about facts and
circumstances that existed at the acquisition
date that, if known, would have affected
the amounts recognised at that date. These
adjustments are called as measurement period
adjustments. The measurement period does
not exceed one year from the acquisition date.
Business combinations involving entities that
are controlled by the Group are accounted
for using the ‘pooling of interests’ method as
follows:
The assets and liabilities of the combining
entities are reflected at their carrying
amounts;
Except for adjustments made to harmonise
accounting policies, no adjustments are
Varun Beverages Limited124

Summary of significant accounting policies and other explanatory information on the Consolidated Financial Statements for the year ended 31 December 2019
made to reflect fair values, or recognise
any new assets or liabilities;
The balance of the retained earnings
appearing in the financial statements
of the transferor is aggregated with the
corresponding balance appearing in the
financial statements of the transferee or is
adjusted against general reserve;
The identity of the reserves is preserved
and the reserves of the transferor become
the reserves of the transferee; and
The difference, if any, between the amounts
recorded as share capital issued plus any
additional consideration in the form of cash
or other assets and the amount of share
capital of the transferor is transferred to
capital reserve and is presented separately
from other capital reserves.
l) Government grants
Grants from the Government are recognised
when there is reasonable assurance that all
underlying conditions will be complied with and
that the grant will be received.
When loans or similar assistance are provided
by Government or related institutions, with
an interest rate below the current applicable
market rate, the effect of this favorable interest
is regarded as a government grant. The
loan or assistance is initially recognised and
measured at fair value and the government
grant is measured as the difference between
the initial carrying value of the loan and the
proceeds received. That grant is recognised in
the Consolidated Statement of Profit and Loss
under ‘other operating revenue’. The loan is
subsequently measured as per the accounting
policy applicable to financial liabilities.
Government grants related to assets are
presented in the Consolidated balance sheet by
deducting the grant from the carrying value of
the asset and non-monetary grant is recognised
at a nominal value.
Grants related to income are recognised as
income on a systematic basis in the Consolidated
Statement of Profit and Loss over the periods
necessary to match them with the related costs,
which they are intended to compensate and are
presented as ‘other operating revenues’.
Total government grant recognised in the
Statement of Profit and Loss under the head
‘Other operating revenue’ amounts to ` 1,186.62
(31 December 2018: ` 966.62) under different
industrial promotion tax exemption schemes.
m) Taxes
Tax expense is the aggregate amount included
in the determination of profit or loss for the
period in respect of current and deferred tax.
Current income tax
Current income tax is measured at the amount
expected to be paid to the tax authorities in
accordance with the Income-tax act, 1961 and
respective local jurisdictions of members of the
Group.
Current income tax assets and liabilities
are measured at the amount expected to
be recovered from or paid to the taxation
authorities. The tax rates and tax laws used to
compute the amount are those that are enacted
or substantively enacted, at the reporting date
in the countries where the Group operates and
generates taxable income. Current income tax
relating to items recognised outside profit or
loss is recognised outside profit or loss (either
in OCI or in equity).
Current tax items are recognised in correlation
to the underlying transaction either in OCI or
directly in equity. Management periodically
evaluates positions taken in the tax returns with
respect to situations in which applicable tax
regulations are subject to interpretation and
establishes provisions where appropriate.
Deferred tax
Deferred tax is provided using the liability
method on temporary differences between
the tax bases of assets and liabilities and their
book bases. Deferred tax assets and liabilities
are measured at the tax rates that are expected
to apply in the year when the asset is realised
or the liability is settled, based on tax rates
STATUTORY REPORTSCORPORATE OVERVIEW FINANCIAL STATEMENTS
Annual Report 2019 125

Summary of significant accounting policies and other explanatory information on the Consolidated Financial Statements for the year ended 31 December 2019
(and tax laws) that have been enacted or
substantively enacted at the reporting date.
Deferred tax relating to items recognised
outside profit or loss is recognised outside
profit or loss. Deferred tax items are recognised
in correlation to the underlying transaction
either in OCI or directly in equity. Deferred tax
assets and deferred tax liabilities are offset if a
legally enforceable right exists to set off current
tax assets against current tax liabilities and the
deferred taxes relate to the same taxable entity
and the same taxation authority.
Deferred tax liabilities are recognised for all
taxable temporary differences except:
When the deferred tax liability arises
from the initial recognition of goodwill or
an asset or liability in a transaction that
is not a business combination and, at the
time of the transaction, affects neither the
accounting profit nor taxable profit or loss;
In respect of taxable temporary differences
associated with investments in subsidiaries
and associate, when the timing of the
reversal of the temporary differences can
be controlled and it is probable that the
temporary differences will not reverse in
the foreseeable future.
Deferred tax assets are recognised for all
deductible temporary differences, the carry
forward of unused tax credits and any unused
tax losses. Deferred tax assets are recognised to
the extent that it is probable that taxable profit
will be available against which the deductible
temporary differences, and the carry forward of
unused tax credits and unused tax losses can be
utilised, except:
When the deferred tax asset relating
to the deductible temporary difference
arises from the initial recognition of an
asset or liability in a transaction that is
not a business combination and, at the
time of the transaction, affects neither the
accounting profit nor taxable profit or loss;
In respect of deductible temporary
differences associated with investments
in subsidiaries and associate, deferred tax
assets are recognised only to the extent
that it is probable that the temporary
differences will reverse in the foreseeable
future and taxable profit will be available
against which the temporary differences
can be utilised.
Deferred income taxes are not provided on the
undistributed earnings of subsidiaries where it
is expected that the earnings of the subsidiary
will not be distributed in the foreseeable future.
The carrying amount of deferred tax assets is
reviewed at each reporting date and reduced
to the extent that it is no longer probable that
sufficient taxable profit will be available to
allow all or part of the deferred tax asset to
be utilised. Unrecognised deferred tax assets
are re-assessed at each reporting date and are
recognised to the extent that it has become
probable that future taxable profits will allow
the deferred tax asset to be recovered.
Minimum alternate Tax (“MaT”) credit is
recognised as an asset only when and to the
extent there is convincing evidence that the
relevant members of the Group will pay normal
income tax during the specified period. Such
asset is reviewed at each reporting period end
and the adjusted based on circumstances then
prevailing.
Deferred tax assets are recognised on the
unrealized profit for all the inter-company sale/
purchase eliminations of property, plant and
equipment and inventories.
Deferred tax on business combination
When a liability assumed is recognized at the
acquisition date but the related costs are not
deducted in determining taxable profits until a
later period, a deductible temporary difference
arises which results in a deferred tax asset. a
deferred tax asset also arises when the fair value
of an identifiable asset acquired is less than its
tax base. In both cases, the resulting deferred
tax asset affects goodwill.
n) Segment reporting
Operating segments are reported in a manner
consistent with the internal reporting provided
Varun Beverages Limited126

Summary of significant accounting policies and other explanatory information on the Consolidated Financial Statements for the year ended 31 December 2019
to the chief operating decision maker, who is
responsible for allocating resources and assessing
performance of the operating segments. The
business activities of the Group predominantly
fall within a single operating segment, i.e.,
manufacturing and sale of beverages. The
Group operates in two principal geographical
areas, namely, India and other countries or
‘outside India’. The Group prepares its segment
information in conformity with the accounting
policiesadoptedforpreparingthe CFS.
o) Discontinued operations
a discontinued operation is a component of the
Group that either has been disposed of, or is
classified as held for sale, and:
Represents a separate major line of business
or geographical area of operations;
Is part of a single co-ordinated plan to
dispose of a separate major line of business
or geographical area of operations; or
Is a subsidiary acquired exclusively with a
view to resale.
Discontinued operations are excluded from
the results of continuing operations and are
presented as a single amount as profit or loss
after tax from discontinued operations in the
Consolidated Statement of Profit and Loss.
p) Impairment of non-financial assets
The Group assesses, at each reporting date,
whether there is an indication that an asset
may be impaired. If any indication exists, or
when annual impairment testing for an asset
is required, the Group estimates the asset’s
recoverable amount. an asset’s recoverable
amount is the higher of an asset’s or cash-
generating unit’s (“CGU”) fair value less costs of
disposal and its value in use. Recoverable amount
is determined for an individual asset, unless the
asset does not generate cash inflows that are
largely independent of those from other assets
or groups of assets. When the carrying amount
of an asset or CGU exceeds its recoverable
amount, the asset is considered impaired and is
writtendowntoitsrecoverable amount.
In assessing value in use, the estimated future
cash flows are discounted to their present
value using a pre-tax discount rate that reflects
current market assessments of the time value
of money and the risks specific to the asset. In
determining fair value less costs of disposal,
recent market transactions are taken into
account.
If no such transactions can be identified, an
appropriate valuation model is used. These
calculations are corroborated by valuation
multiples, quoted share prices for publicly
traded company’s or other available fair value
indicators.
The Group bases its impairment calculation
on detailed budgets and forecast calculations,
which are prepared separately for each of the
Group’s CGUs to which the individual assets
are allocated. These budgets and forecast
calculations generally cover a period of five
years. For longer periods, a long-term growth
rate is calculated and applied to project future
cash flows after the fifth year. To estimate
cash flow projections beyond periods covered
by the most recent budgets/forecasts, the
Group extrapolates cash flow projections in the
budget using a steady or declining growth rate
for subsequent years, unless an increasing rate
can be justified. In any case, this growth rate
does not exceed the long-term average growth
rate for the products, industries, or country or
countries in which the entity operates, or for the
market in which the asset is used.
Impairment losses of continuing operations,
including impairment on inventories, are
recognised in the Consolidated Statement of
Profit and Loss.
an assessment is made at each reporting date
to determine whether there is an indication that
previously recognised impairment losses no
longer exist or have decreased. If such indication
exists, the Group estimates the asset’s or CGU’s
recoverable amount. a previously recognised
impairment loss is reversed only if there has been
a change in the assumptions used to determine
the asset’s recoverable amount since the last
impairment loss was recognised. The reversal
is limited so that the carrying amount of the
STATUTORY REPORTSCORPORATE OVERVIEW FINANCIAL STATEMENTS
Annual Report 2019 127

Summary of significant accounting policies and other explanatory information on the Consolidated Financial Statements for the year ended 31 December 2019
asset does not exceed its recoverable amount,
nor exceed the carrying amount that would
have been determined, net of depreciation, had
no impairment loss been recognised for the
asset in prior years. Such reversal is recognised
in the Consolidated Statement of Profit and
Loss unless the asset is carried at a revalued
amount, in which case, the reversal is treated as
a revaluation increase.
q) Financial instruments
a financial instrument is any contract that gives
rise to a financial asset of one entity and a financial
liability or equity instrument of another entity.
Financial assets
Initial recognition and measurement
all financial assets are recognised initially at
fair value plus, in the case of financial assets
not recorded at fair value through profit or loss,
transaction costs that are attributable to the
acquisition of the financial asset.
For purposes of subsequent measurement,
financial assets are classified as follows:
(a) Debt instruments at amortised cost
a ‘debt instrument’ is measured at the
amortised cost where the asset is held
within a business model whose objective
is to hold assets for collecting contractual
cash flows; and contractual terms of the
asset give rise to cash flows on specified
dates that are solely payments of principal
and interest.
after initial measurement, such financial
assets are subsequently measured at
amortised cost using the EIR method.
amortised cost is calculated by taking
into account any discount or premium on
acquisition and fees or costs that are an
integral part of the EIR. The interest income
from these financial assets is included in
other income in the profit or loss. The losses
arising from impairment are recognised in
the profit or loss. This category generally
applies to trade and other receivables.
(b) Debt instruments at Fair Value Through
Other Comprehensive Income
assets that are held for collection of
contractual cashflows and for selling
the financial assets, where the cash flow
represent solely payments of principal and
interest, are measured at fair value through
other comprehensive income (“FVOCI”).
The Group has not designated any debt
instrument in this category.
(c) Debt instruments at Fair Value Through
Profit or Loss
Fair Value Through Profit or Loss (“FVTPL”)
is a residual category for debt instruments.
any debt instrument, which does not
meet the criteria for categorization as at
amortized cost or as FVTOCI, is classified
as at FVTPL.
In addition, the Group may elect to designate
a debt instrument which otherwise meets
amortized cost or FVTOCI criteria, as at
FVTPL. However, such election is allowed
only if doing so reduces or eliminates a
measurement or recognition inconsistency
(referred to as ‘accounting mismatch’).
Debt instruments included within the
FVTPL category are measured at fair
value with all changes recognised in the
Consolidated Statement of Profit and Loss.
The Group has not designated any debt
instrument in this category.
(d) Equity instruments
all equity investments in scope of Ind
aS 109 are measured at fair value. Equity
instruments which are held for trading and
contingent consideration recognised by an
acquirer in a business combination to which
Ind aS 103 ‘Business Combinations’ applies
are Ind aS classified as at FVTPL. Equity
instruments included within the FVTPL
category are measured at fair value with
all changes recognised in the Consolidated
Profit and Loss.
Varun Beverages Limited128

Summary of significant accounting policies and other explanatory information on the Consolidated Financial Statements for the year ended 31 December 2019
For all other equity instruments, the Group
may make an irrevocable election to
present in other comprehensive income
subsequent changes in the fair values.
The Group makes such election on an
instrument-by-instrument basis. The
classification is made on initial recognition
and is irrevocable.
If the Group decides to classify an equity
instrument as at FVTOCI, then all fair value
changes on the instrument, excluding
dividends, are recognised in the OCI. There
is no recycling of the amounts from OCI to
profit or loss, even on sale of investment.
However, the Group may transfer the
cumulative gain or loss within equity.
De-recognition
a financial asset is derecognised when the
contractual rights to receive cash flows from
the asset have expired or the Group has
transferred its rights to receive the contractual
cash flows from the asset in a transaction in
which substantially all the risks and rewards of
ownership of the asset are transferred.
Impairment of financial assets
The Group measures the Expected Credit
Loss (“ECL”) associated with its assets based
on historical trends, industry practices and
the general business environment in which it
operates. The impairment methodology applied
depends on whether there has been a significant
increase in credit risk. ECL impairment loss
allowance (or reversal) recognised during the
period is recognised as income/ expense in
the Consolidated Statement of Profit and Loss
under the head ‘other expenses’.
Financial liabilities
Initial recognition and measurement
Financial liabilities are classified, at initial
recognition, as financial liabilities at fair value
through profit or loss, loans and borrowings,
payables, or as derivatives designated as hedging
instruments in an effective hedge, as appropriate.
all financial liabilities are recognised initially
at fair value and, in the case of loans and
borrowings and payables, net of directly
attributable transaction costs.
The Group’s financial liabilities include trade and
other payables, loans and borrowings including
bank overdrafts and derivative financial instruments.
Subsequent measurement
The measurement of financial liabilities depends
on their classification, as described below:
(a) Financial liabilities at FVTPL
Financial liabilities at FVTPL include financial
liabilities held for trading and financial liabilities
designated upon initial recognition as at fair
value through profit or loss. Financial liabilities
are classified as held for trading if they are
incurred for the purpose of repurchasing
in the near term. This category includes
derivative financial instruments entered into
by the Group that are not designated as
hedging instruments in hedge relationships
as defined by Ind aS 109.
Financial liabilities designated upon initial
recognition at fair value through profit or
loss are designated as such at the initial
date of recognition, and only if the criteria
in Ind aS 109 are satisfied. For liabilities
designated as FVTPL, fair value gains/
losses are recognised in the Consolidated
Statement of Profit or Loss, except for
those attributable to changes in own
credit risk, which are recognised in OCI.
These gains/ loss are not subsequently
transferred to the profit or loss.
(b) Financial liabilities at amortised cost
after initial recognition, financial liabilities
designated at amortised costs are
subsequently measured at amortised cost
using the EIR method. Gains and losses
are recognised in profit or loss when the
liabilities are derecognised as well as
through the EIR amortisation process.
amortised cost is calculated by taking
into account any discount or premium on
acquisition and fees or costs that are an
integral part of the EIR. The amortisation
is included as finance costs in the
Consolidated Statement of Profit and Loss.
STATUTORY REPORTSCORPORATE OVERVIEW FINANCIAL STATEMENTS
Annual Report 2019 129

Summary of significant accounting policies and other explanatory information on the Consolidated Financial Statements for the year ended 31 December 2019
De-recognition
a financial liability is derecognised when the
obligation under the liability is discharged or
cancelled or expires. When an existing financial
liability is replaced by another from the same
lender on substantially different terms, or the
terms of an existing liability are substantially
modified, such an exchange or modification is
treated as the de-recognition of the original
liability and the recognition of a new liability. The
difference in the respective carrying amounts is
recognised in the Consolidated Statement of
Profit and Loss.
Offsetting of financial instruments
Financial assets and financial liabilities are offset
and the net amount is reported in the balance
sheet if there is a currently enforceable legal right
to offset the recognised amounts and there is an
intention to settle on a net basis, to realise the
assets and settle the liabilities simultaneously.
Derivative financial instruments
Derivatives are initially recognised at fair value
on the date of executing a derivative contract
and are subsequently remeasured to their
fair value at the end of each reporting period.
Derivatives are carried as financial assets when
the fair value is positive and as financial liabilities
when the fair value is negative. Changes in the
fair value of derivatives that are designated and
qualify as fair value hedges are recognised in
the profit or loss immediately, together with any
changes in the fair value of the hedged asset or
liability that are attributable to the hedged risk.
r) Non-current assets and liabilities classified as held for sale
Non-current assets classified as held for sale are
presented separately in the Consolidated Balance
Sheet and measured at the lower of their carrying
amounts immediately prior to their classification as
held for sale and their fair value less costs to sell.
Once classified as held for sale, the assets are not
subject to depreciation or amortisation. any gain
or loss arises on remeasurement or sale is included
in Consolidated Statement of Profit and Loss.
If the Group has classified an asset (or disposal
group) as held for sale, but the held-for-sale
criteria as specified in Ind aS 105 are no longer
met, the Group ceases to classify the asset (or
disposal group) as held for sale.
The Group measures a non-current asset that
ceases to be classified as held for sale (or ceases
to be included in a disposal group classified as
held for sale) at the lower of:
(a) its carrying amount before the asset (or
disposal group) was classified as held
for sale, adjusted for any depreciation,
amortisation or revaluations that would
have been recognised had the asset (or
disposal group) not been classified as held
for sale, and
(b) its recoverable amount at the date of the
subsequent decision not to sell.
s) Cash and cash equivalents
Cash and cash equivalent in the balance sheet
comprise cash at banks and on hand and short-
term deposits with an original maturity of
three months or less, which are subject to an
insignificant risk of changes in value.
For the purpose of the consolidated statement
of cash flows, cash and cash equivalents consist
of cash and short-term deposits, as defined
above, net of outstanding bank overdrafts
as they are considered an integral part of the
Group’s cash management.
t) Dividend distribution to equity holders of the parent
The Group recognises a liability to make cash or
non-cash distributions to equity holders of the
parent when the distribution is authorised and
the distribution is no longer at the discretion of
the Group. as per the corporate laws in India,
a distribution is authorised when it is approved
by the shareholders. a corresponding amount is
recognised directly in equity.
u) Provisions
Provisions are recognised when the Group has
a present obligation (legal or constructive)
as a result of a past event, it is probable
that an outflow of resources embodying
economic benefits will be required to settle
the obligation and a reliable estimate can be
Varun Beverages Limited130

Summary of significant accounting policies and other explanatory information on the Consolidated Financial Statements for the year ended 31 December 2019
made of the amount of the obligation. When
the Group expects some or all of a provision
to be reimbursed, for example, under an
insurance contract, the reimbursement is
recognised as a separate asset, but only when
the reimbursement is virtually certain. The
expense relating to a provision is presented in
the Consolidated Statement of Profit and Loss
net of any reimbursement.
If the effect of the time value of money is material,
provisions are discounted using a current pre-
tax rate that reflects, when appropriate, the
risks specific to the liability. When discounting
is used, the increase in the provision due to the
passage of time is recognised as a finance cost.
v) Contingent liabilities
a contingent liability is a possible obligation that
arises from past events whose existence will be
confirmed by the occurrence or non–occurrence
of one or more uncertain future events beyond
the control of the Group or a present obligation
that is not recognised because it is not probable
that an outflow of resources will be required to
settle the obligation. a contingent liability also
arises in extremely rare cases where there is a
liability that cannot be recognised because it
cannot be measured reliably. The Group does not
recognize a contingent liability but discloses its
existence in the financial statements. Contingent
assets are only disclosed when it is probable that
the economic benefits will flow to the entity.
w) Earnings per share
Basic earnings/ (loss) per share are calculated
by dividing the net profit or loss for the year
attributable to equity shareholders by the
weighted average number of equity shares
outstanding during the year. The weighted
average number of equity shares outstanding
during the year is adjusted for events, other than
conversion of potential equity shares, that have
changed the number of equity shares outstanding
without a corresponding change in resources.
In case of a bonus issue, the number of ordinary
shares outstanding is increased by number of
shares issued as bonus shares in current year
and comparative period presented as if the
event had occurred at the beginning of the
earliest year presented.
For the purpose of calculating diluted earnings/
(loss) per share, the net profit or loss for the
period attributable to equity shareholders
and the weighted average number of shares
outstanding during the period are adjusted for
the effects of all dilutive potential equity shares.
3.1. Significant accounting judgements, estimates and assumptions
The preparation of the Group’s financial statements
requires management to make judgements, estimates
and assumptions that affect the reported amounts
of revenues, expenses, assets and liabilities, and
the accompanying disclosures, and the disclosure
of contingent liabilities. Estimates and assumptions
are continuously evaluated and are based on
management’s experience and other factors,
including expectations of future events that are
believed to be reasonable under the circumstances.
Uncertainty about these assumptions and estimates
could result in outcomes that require a material
adjustment to the carrying amount of assets or
liabilities affected in future periods.
In particular, the Group has identified the following
areas where significant judgements, estimates and
assumptions are required. Further information on
each of these areas and how they impact the various
accounting policies are described below and also
in the relevant notes to the consolidated financial
statements. Changes in estimates are accounted for
prospectively.
i) Judgements
In the process of applying the Group’s
accounting policies, management has made
the following judgements, which have the most
significant effect on the amounts recognised in
the consolidated financial statements:
(a) Contingencies
Contingent liabilities may arise from the
ordinary course of business in relation to
claims against the Group, including legal,
contractor, land access and other claims.
By their nature, contingencies will be
resolved only when one or more uncertain
future events occur or fail to occur. The
STATUTORY REPORTSCORPORATE OVERVIEW FINANCIAL STATEMENTS
Annual Report 2019 131

Summary of significant accounting policies and other explanatory information on the Consolidated Financial Statements for the year ended 31 December 2019
assessment of the existence, and potential
quantum, of contingencies inherently
involves the exercise of significant
judgments and the use of estimates
regarding the outcome of future events.
b) Recognition of deferred tax assets
The extent to which deferred tax assets can
be recognised is based on an assessment
of the probability that future taxable
income will be available against which
the deductible temporary differences and
tax loss carry-forward can be utilised. In
addition, significant judgement is required
in assessing the impact of any legal or
economic limits or uncertainties in various
tax jurisdictions.
ii) Estimates and assumptions
The key assumptions concerning the future and
other key sources of estimation uncertainty at
the reporting date that have a significant risk of
causing a material adjustment to the carrying
amounts of assets and liabilities within the
next financial year, are described below. The
Group bases its assumptions and estimates on
parameters available when the consolidated
financial statements were prepared. Existing
circumstances and assumptions about future
developments, however, may change due to
market change or circumstances arising beyond
the control of the Group. Such changes are
reflected in the assumptions when they occur.
(a) Useful lives of tangible/intangible assets
The Group reviews its estimate of the useful
lives of tangible/intangible assets at each
reporting date, based on the expected
utility of the assets.
(b) Defined benefit obligation
The cost of the defined benefit plan and
other post-employment benefits and
the present value of such obligation are
determined using actuarial valuations.
an actuarial valuation involves making
various assumptions that may differ from
actual developments in the future. These
include the determination of the discount
rate, future salary increases, mortality rates
and future pension increases. In view of
the complexities involved in the valuation
and its long-term nature, a defined benefit
obligation is highly sensitive to changes
in these assumptions. all assumptions are
reviewed at each reporting date.
(c) Inventories
The Group estimates the net realisable
values of inventories, taking into account
the most reliable evidence available at each
reporting date. The future realisation of
these inventories may be affected by future
technology or other market-driven changes
that may reduce future selling prices.
(d) Business combinations
The Group uses valuation techniques when
determining the fair values of certain assets and
liabilities acquired in a business combination.
(e) Impairment of non-financial assets and goodwill
In assessing impairment, Group estimates
the recoverable amount of each asset or
cash-generating units based on expected
future cash flows and uses an interest rate
to discount them. Estimation uncertainty
relates to assumptions about future
operating results and the determination of
a suitable discount rate.
(f) Fair value measurement of financial instruments
When the fair values of financial assets
and financial liabilities recorded in the
Balance Sheet cannot be measured based
on quoted prices in active markets, their
fair value is measured using valuation
techniques including the DCF model. The
inputs to these models are taken from
observable markets where possible, but
where this is not feasible, a degree of
judgment is required in establishing fair
values. Judgements include considerations
of inputs such as liquidity risk, credit risk
and volatility. Changes in assumptions
about these factors could affect the
reported fair value of financial instruments.
Varun Beverages Limited132
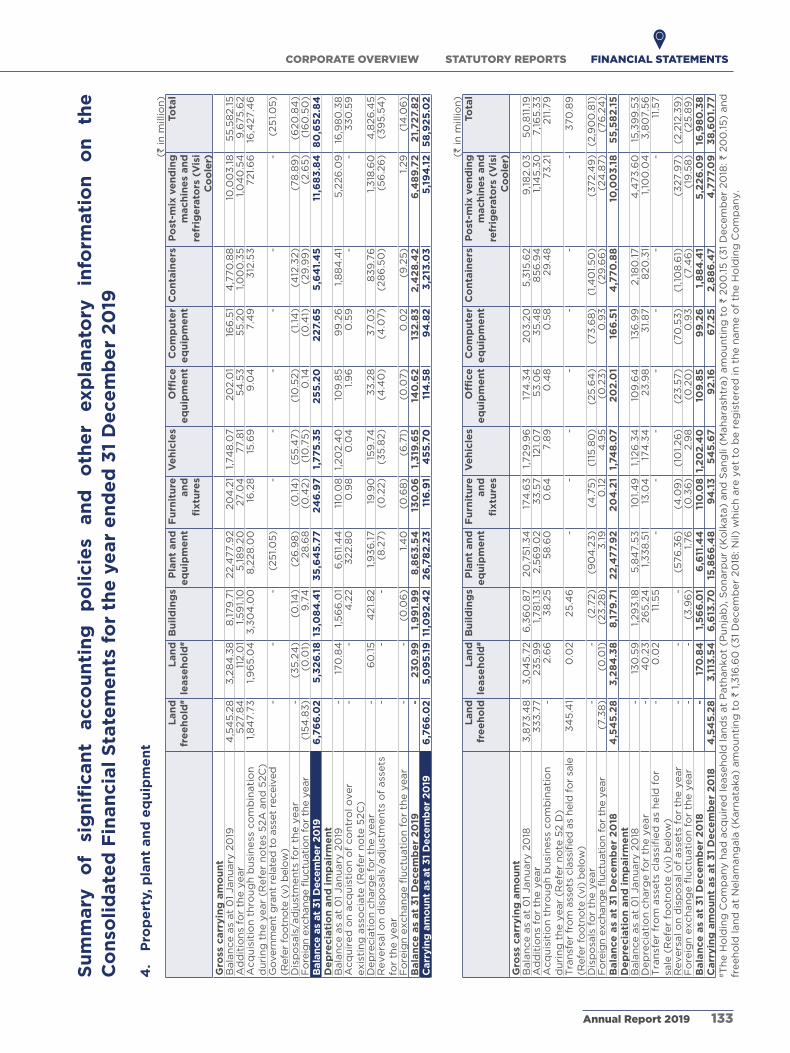
Su
mm
ary
o
f si
gn
ific
an
t acco
un
tin
g
po
licie
s an
d
oth
er
exp
lan
ato
ry
info
rmati
on
o
n
the
C
on
soli
date
d F
inan
cia
l S
tate
me
nts
fo
r th
e y
ear
en
de
d 3
1 D
ece
mb
er
20
19
4.
Pro
pe
rty,
pla
nt
an
d e
qu
ipm
en
t(`
in
mill
ion
) L
an
d
fre
eh
old
#
Lan
d
lease
ho
ld# B
uil
din
gs
Pla
nt
an
d
eq
uip
me
nt
Fu
rnit
ure
an
d
fixtu
res
Ve
hic
les
Off
ice
e
qu
ipm
en
t C
om
pu
ter
eq
uip
me
nt
Co
nta
ine
rs
Po
st-m
ix v
en
din
g
mach
ine
s an
d
refr
ige
rato
rs (
Vis
i C
oo
ler)
To
tal
Gro
ss c
arr
yin
g a
mo
un
tB
ala
nce a
s at
01
Jan
uary
20
194
,54
5.2
83
,28
4.3
88
,179
.71
22,4
77.9
220
4.2
11,
74
8.0
720
2.0
116
6.5
14
,770
.88
10,0
03
.18
55
,58
2.1
5a
dd
itio
ns
for
the y
ear
527.8
411
2.0
11,
59
1.10
5,1
89
.20
27.0
477.8
15
4.5
35
5.2
01,
00
0.3
51,
04
0.5
49
,675
.62
acq
uis
itio
n t
hro
ug
h b
usi
ness
co
mb
inati
on
d
uri
ng
th
e y
ear
(Refe
r n
ote
s 5
2a
an
d 5
2C
)1,
84
7.7
31,
96
5.0
43
,30
4.0
08
,228
.00
16.2
815
.69
9.0
47.4
93
12.5
3721.
66
16,4
27.4
6
Go
vern
ment
gra
nt
rela
ted
to
ass
et
receiv
ed
(R
efe
r fo
otn
ote
(v)
belo
w)
--
-(2
51.
05
)-
--
--
-(2
51.
05
)
Dis
po
sals
/ad
just
men
ts f
or
the y
ear
-(3
5.2
4)
(0.1
4)
(26
.98
)(0
.14
)(5
5.4
7)
(10
.52)
(1.1
4)
(412
.32)
(78
.89
)(6
20
.84
)Foreignexchangefluctuationfortheyear
(15
4.8
3)
(0.0
1)9
.74
28
.68
(0.4
2)
(10
.75
)0
.14
(0.4
1)(2
9.9
9)
(2.6
5)
(16
0.5
0)
Bala
nce
as
at
31
Dece
mb
er
20
196
,76
6.0
25
,32
6.1
813
,08
4.4
13
5,6
45
.77
24
6.9
71,
775
.35
25
5.2
02
27.
65
5,6
41.
45
11,6
83
.84
80
,65
2.8
4D
ep
recia
tio
n a
nd
im
pair
me
nt
Bala
nce a
s at
01
Jan
uary
20
19-
170
.84
1,5
66
.01
6,6
11.4
411
0.0
81,
20
2.4
010
9.8
59
9.2
61,
88
4.4
15
,226
.09
16,9
80
.38
acq
uir
ed
on
acq
uis
tio
n o
f co
ntr
ol o
ver
exis
tin
g a
sso
cia
te (
Refe
r n
ote
52C
)-
-4
.22
322.8
00
.98
0.0
41.
96
0.5
9-
-3
30
.59
Dep
recia
tio
n c
harg
e f
or
the y
ear
-6
0.1
54
21.
82
1,9
36
.17
19.9
015
9.7
43
3.2
83
7.0
38
39
.76
1,3
18.6
04
,826
.45
Revers
al o
n d
isp
osa
ls/a
dju
stm
en
ts o
f ass
ets
fo
r th
e y
ear
--
-(8
.27)
(0.2
2)
(35
.82)
(4.4
0)
(4.0
7)
(28
6.5
0)
(56
.26
)(3
95
.54
)
Foreignexchangefluctuationfortheyear
--
(0.0
6)
1.4
0(0
.68
)(6
.71)
(0.0
7)
0.0
2(9
.25
)1.
29
(14
.06
)B
ala
nce
as
at
31
De
ce
mb
er
20
19-
23
0.9
91,
99
1.9
98
,86
3.5
413
0.0
61,
319
.65
140
.62
132
.83
2,4
28
.42
6,4
89
.72
21,
72
7.8
2C
arr
yin
g a
mo
un
t as
at
31
Dece
mb
er
20
196
,76
6.0
25
,09
5.1
911
,09
2.4
22
6,7
82
.23
116
.91
45
5.7
011
4.5
89
4.8
23
,213
.03
5,1
94
.12
58
,92
5.0
2
(` in
mill
ion
) L
an
d
fre
eh
old
Lan
d
lease
ho
ld# B
uil
din
gs
Pla
nt
an
d
eq
uip
me
nt
Fu
rnit
ure
an
d
fixtu
res
Ve
hic
les
Off
ice
e
qu
ipm
en
t C
om
pu
ter
eq
uip
me
nt
Co
nta
ine
rs
Po
st-m
ix v
en
din
g
mach
ine
s an
d
refr
ige
rato
rs (
Vis
i C
oo
ler)
To
tal
Gro
ss c
arr
yin
g a
mo
un
tB
ala
nce a
s at
01
Jan
uary
20
183
,873
.48
3,0
45
.72
6,3
60
.87
20
,75
1.3
417
4.6
31,
729
.96
174
.34
20
3.2
05
,315
.62
9,1
82.0
35
0,8
11.1
9a
dd
itio
ns
for
the y
ear
33
3.7
723
5.9
91,
78
1.13
2,5
69
.02
33
.57
121.
07
53
.06
35
.48
85
6.9
41,
145
.30
7,1
65
.33
acq
uis
itio
n t
hro
ug
h b
usi
ness
co
mb
inati
on
d
uri
ng
th
e y
ear
(Refe
r n
ote
52 D
)-
2.6
63
8.2
55
8.6
00
.64
7.8
90
.48
0.5
829
.48
73
.21
211
.79
Transferfromassetsclassifiedasheldforsale
(Refe
r fo
otn
ote
(vi)
belo
w)
34
5.4
10
.02
25
.46
--
--
--
-3
70
.89
Dis
po
sals
fo
r th
e y
ear
--
(2.7
2)
(90
4.2
3)
(4.7
5)
(115
.80
)(2
5.6
4)
(73
.68
)(1
,40
1.5
0)
(372.4
9)
(2,9
00
.81)
Foreignexchangefluctuationfortheyear
(7.3
8)
(0.0
1)(2
3.2
8)
3.1
90
.12
4.9
5(0
.23
)0
.93
(29
.66
)(2
4.8
7)
(76
.24
)B
ala
nce
as
at
31
De
ce
mb
er
20
184
,54
5.2
83
,28
4.3
88
,17
9.7
12
2,4
77.
92
20
4.2
11,
748
.07
20
2.0
116
6.5
14
,770
.88
10,0
03
.18
55
,58
2.1
5D
ep
recia
tio
n a
nd
im
pair
me
nt
Bala
nce a
s at
01
Jan
uary
20
18-
130
.59
1,29
3.1
85
,84
7.5
310
1.4
91,
126
.34
109
.64
136
.99
2,1
80
.17
4,4
73
.60
15,3
99
.53
Dep
recia
tio
n c
harg
e f
or
the y
ear
-4
0.2
326
5.2
41,
33
8.5
113
.04
174
.34
23
.98
31.
87
820
.31
1,10
0.0
43
,80
7.5
6Transferfromassetsclassifiedasheldfor
sale
(R
efe
r fo
otn
ote
(vi)
belo
w)
-0
.02
11.5
5-
--
--
--
11.5
7
Revers
al o
n d
isp
osa
l o
f ass
ets
fo
r th
e y
ear
--
-(5
76
.36
)(4
.09
)(1
01.
26
)(2
3.5
7)
(70
.53
)(1
,10
8.6
1)(3
27.9
7)
(2,2
12.3
9)
Foreignexchangefluctuationfortheyear
--
(3.9
6)
1.76
(0.3
6)
2.9
8(0
.20
)0
.93
(7.4
6)
(19
.58
)(2
5.8
9)
Bala
nce
as
at
31
De
ce
mb
er
20
18-
170
.84
1,5
66
.01
6,6
11.4
411
0.0
81,
20
2.4
010
9.8
59
9.2
61,
88
4.4
15
,22
6.0
916
,98
0.3
8C
arr
yin
g a
mo
un
t as
at
31
De
ce
mb
er
20
184
,54
5.2
83
,113
.54
6,6
13.7
015
,86
6.4
89
4.1
35
45
.67
92
.16
67.
25
2,8
86
.47
4,7
77.
09
38
,60
1.7
7#T
he H
old
ing
Co
mp
an
y h
ad
acq
uir
ed
lease
ho
ld lan
ds
at
Path
an
ko
t (P
un
jab
), S
on
arp
ur
(Ko
lkata
) an
d S
an
gli
(Mah
ara
shtr
a)
am
ou
nti
ng
to
` 2
00
.15
(3
1 D
ecem
ber
20
18:
` 20
0.1
5)
an
d
freeh
old
lan
d a
t N
ela
man
gala
(K
arn
ata
ka)
am
ou
nti
ng
to
` 1
,316
.60
(3
1 D
ecem
ber
20
18: N
il) w
hic
h a
re y
et
to b
e r
eg
iste
red
in
th
e n
am
e o
f th
e H
old
ing
Co
mp
an
y.
STATUTORY REPORTSCORPORATE OVERVIEW FINANCIAL STATEMENTS
Annual Report 2019 133

Summary of significant accounting policies and other explanatory information on the Consolidated Financial Statements for the year ended 31 December 2019
Footnotes to Note 4:
(i) Asset under construction/ Capital work in progress
(` in million)
Net Book Value 31 December 2019 31 December 2018
Capital work-in-progress* 638.24 3,523.57
Total 638.24 3,523.57 *Capital work in progress as at 31 December 2018 comprised capital expenditure mainly for the set up of new plant at Pathankot (Punjab) which was capitalised during the year on 26 March 2019.
(ii) Refer note 58 for information on property, plant and equipment pledged as security by the Group.
(iii) The above schedule includes assets taken on finance lease in one of the subsidiaries, details of which are as under:
(` in million)
Plant and equipment
Vehicles Post-mix vending machines and
refrigerators (Visi Cooler)
Total
Gross carrying amountBalance as at 01 January 2019 13.77 237.58 58.63 309.98
addition for the year - - - -
Foreignexchangefluctuationfortheyear 0.22 3.80 0.94 4.96
Balance as at 31 December 2019 13.99 241.38 59.57 314.94
Depreciation and impairmentBalance as at 01 January 2019 5.25 207.19 33.83 246.27
Depreciation for the year 0.69 17.36 5.88 23.93
Foreignexchangefluctuationfortheyear 0.09 3.52 0.61 4.22
Balance as at 31 December 2019 6.03 228.07 40.32 274.42
Carrying amount as at 31 December 2019 7.96 13.31 19.25 40.52
Gross carrying amountBalance as at 01 January 2018 12.96 223.61 55.18 291.75
addition for the year - - - -
Foreignexchangefluctuationfortheyear 0.81 13.97 3.45 18.23
Balance as at 31 December 2018 13.77 237.58 58.63 309.98
Depreciation and impairmentBalance as at 01 January 2018 4.29 172.19 26.33 202.81
Depreciation for the year 0.69 24.29 5.87 30.85
Foreignexchangefluctuationfortheyear 0.27 10.71 1.63 12.61
Balance as at 31 December 2018 5.25 207.19 33.83 246.27
Carrying amount as at 31 December 2018 8.52 30.39 24.80 63.71
(iv) Pre-operative expenses incurred and capitalised during the year are as under:
(` in million)
Net Book Value 31 December 2019 31 December 2018Balance at the beginning of the year 149.30 197.96
Add: Incurred during the yearNet loss/(gain) on foreign currency transactions - 13.40 Finance costs 131.93 89.58 Other expenses 130.17 281.85
Less: Capitalised during the year (408.94) (433.49)
Amount carried over 2.46 149.30
Varun Beverages Limited134

Summary of significant accounting policies and other explanatory information on the Consolidated Financial Statements for the year ended 31 December 2019
(v) During the year, the Holding Company has received government grant related to assets under the Central Capital
Investment Subsidy NEIIPP, 2007 amounting to ` 251.05 (31 December 2018: Nil). The grant received has been
deducted against the carrying value of the asset.
(vi) In June 2017, in view of set-up of new production unit at Goa, the Holding Company decided to sell certain land
and building situated at Goa which was originally acquired with acquisition of Goa territory and land situated at
Gonda (Uttar Pradesh). During the year ended on 31 December 2018, these assets have been re-classified back
to Property, plant and equipment on account of conditions mentioned in Ind aS 105 “Non- current assets Held
for Sale and Discontinued Operations”. Given the nature of assets, such reclassification or change in plan has no
effect on result of operations for this year or prior period.
(vii) The amount of contractual commitments for the acquisitions of property, plant and equipment are disclosed in
Note 45.
5A. Goodwill(` in million)
Amount
Gross carrying amount
Balance as at 01 January 2019 19.40
acquired on acquisition of control over existing associate (Refer Note 52C) 222.90
Balance as at 31 December 2019 242.30
Amortisation and impairment
Balance as at 01 January 2019 -
amortisation charge for the year -
Balance as at 31 December 2019 -
Carrying amount as at 31 December 2019 242.30
(` in million)
Amount
Gross carrying amount
Balance as at 01 January 2018 19.40
acquired during the year -
Balance as at 31 December 2018 19.40
Amortization and impairment
Balance as at 01 January 2018 -
amortization charge for the year -
Balance as at 31 December 2018 -
Carrying amount as at 31 December 2018 19.40
STATUTORY REPORTSCORPORATE OVERVIEW FINANCIAL STATEMENTS
Annual Report 2019 135

Summary of significant accounting policies and other explanatory information on the Consolidated Financial Statements for the year ended 31 December 2019
5B. Other intangible assets(` in million)
Market infrastructure
Distribution network
Franchise rights/
trademarks
Computer software
Total
Gross carrying amount
Balance as at 01 January 2019 73.53 157.64 5,658.61 225.11 6,114.89
additions for the year - - 150.00 48.93 198.93
acquired on business acquisition during the year (Refer note 52a)
- - 235.10 - 235.10
Disposals/adjustments for the year - - - 0.20 0.20
Foreignexchangefluctuationfortheyear 1.17 - (0.09) 0.01 1.09
Balance as at 31 December 2019 74.70 157.64 6,043.62 274.25 6,550.21
Amortization and impairment
Balance as at 01 January 2019 41.40 1.08 657.19 166.65 866.32
amortisation charge for the year 8.42 19.70 - 31.71 59.83
Reversal on disposals/adjustments on assets for the year
- - - 0.20 0.20
Foreignexchangefluctuationfortheyear 0.76 - (0.03) 0.02 0.75
Balance as at 31 December 2019 50.58 20.78 657.16 198.58 927.10
Carrying amount as at 31 December 2019 24.12 136.86 5,386.46 75.67 5,623.11
(` in million)
Market infrastructure
Distribution network
Franchise rights/
trademarks
Computer software
Total
Gross carrying amount
Balance as at 01 January 2018 345.50 - 4,946.45 222.88 5,514.83
additions for the year 23.05 157.64 287.50 23.14 491.33
Disposals for the year (317.90) - - (17.97) (335.87)
acquired on business acquisition during the year (Refer note 52 D)
- - 424.73 - 424.73
Foreignexchangefluctuationfortheyear 22.88 - (0.07) (2.94) 19.87
Balance as at 31 December 2018 73.53 157.64 5,658.61 225.11 6,114.89
Amortisation and impairment
Balance as at 01 January 2018 328.17 - 657.22 155.29 1,140.68
amortisation charge for the year 10.00 1.08 - 32.06 43.14
Reversal on disposal of assets for the year (317.90) - - (17.93) (335.83)
Foreignexchangefluctuationfortheyear 21.13 - (0.03) (2.77) 18.33
Balance as at 31 December 2018 41.40 1.08 657.19 166.65 866.32
Carrying amount as at 31 December 2018 32.13 156.56 5,001.42 58.46 5,248.57
Footnotes to Note 5A and 5B:
(i) The Group has considered the related provisions of Ind aS 38 on ‘Intangibles assets’ which permit certain
intangible assets to have an indefinite life and accordingly the carrying value of these franchisee rights have
been considered to have an indefinite life. These franchisee rights meet the prescribed criteria of renewal at
nominal cost, renewal with no specific conditions attached and is supported by evidences of being renewed.
Management is of the opinion that, based on an analysis of all of the relevant factors, there is no foreseeable
limit to the period over which the franchisee rights are expected to generate net cash inflows for the Group.
Varun Beverages Limited136

Summary of significant accounting policies and other explanatory information on the Consolidated Financial Statements for the year ended 31 December 2019
Goodwill and franchise rights with indefinite useful lives are tested for impairment annually, or more
frequently if the events and circumstances indicate that the carrying value may be impaired. The useful life
of an intangible asset with an indefinite useful life is reviewed annually to determine whether the useful life
assessment continues to be supportable.
The assumptions used in this impairment assessment are most sensitive to following:
(a) Weighted average cost of capital ‘’WaCC’’ of 12.14% for the explicit period and 12.42% for the terminal
year.
(b) For arriving at the terminal value, approximate growth rate of 5% is considered.
(c) Number of years for which cash flows were considered are 5 years.
No impairment loss was identified on the above assessment.
(ii) The amount of contractual commitments for the acquisitions of intangible assets are disclosed in Note 45.
(iii) Refer Note 58 for information on other intangible assets pledged as security by the Group.
6. Investments in associate(` in million)
As at31 December 2019
As at31 December 2018
Investment in equity shares in associate (at cost, unquoted)
Nil (31 December 2018: 35,474) fully paid equity shares of ` 10 each in angelica Technologies Private Limited
- 12.56
Add:Shareinprofitofassociate(Referfootnotesbelow) - 99.87
- 112.43
aggregate amount of unquoted investments - 112.43
The above investment is for business purposes
(i) The Holding Company, on 09 September 2019 has acquired 20% shareholding in Lunarmech Technologies
Private Limited (subsidiary of angelica Technologies Private Limited) for a purchase consideration of
` 150.38.
(ii) The Holding Company, on 04 November 2019 has acquired board control in its associate, angelica
Technologies Private Limited. Consequently, both angelica Technologies Private Limited and Lunarmech
Technologies Private Limited have become subsidiaries of the Group w.e.f. 04 November 2019.
(iii) The Holding Company has 47.30% interest in angelica Technologies Private Limited which in turn holds 74%
ownership stake in Lunarmech Technologies Private Limited, and holds 20% direct interest in Lunarmech
Technologies Private Limited. Such interest has been accounted for using the equity method till 03 November
2019 and the following is its summarised financial information:
(` in million)
Year ended 31 December 2019
Year ended 31 December 2018
Profitfortheyear(Refernote61) 43.61 30.20
add/(less): Other comprehensive income - -
Total comprehensive income 43.61 30.20
STATUTORY REPORTSCORPORATE OVERVIEW FINANCIAL STATEMENTS
Annual Report 2019 137

Summary of significant accounting policies and other explanatory information on the Consolidated Financial Statements for the year ended 31 December 2019
7. Investments(` in million)
As at 31 December 2019
As at 31 December 2018
Fair value through Profit or Loss
Investment in equity shares (unquoted)
200 (31 December 2018: 200) shares of ` 50 each in The Margao Urban Co-operative Bank Limited
0.01 0.01
250 (31 December 2018: 250) shares of ` 10 each in The Goa Urban Co-operative Bank Limited**
0.00 0.00
0.01 0.01
**Rounded off to Nil.
aggregate amount of unquoted investments 0.01 0.01
8. Loans(` in million)
As at 31 December 2019
As at 31 December 2018
Loans carried at amortized cost
Security deposits 445.48 200.92
445.48 200.92
9. Other non-current financial assets(` in million)
As at 31 December 2019
As at 31 December 2018
Financial assets at amortized cost
Balance in deposit accounts with more than 12 months maturity# 8.90 8.34
8.90 8.34 # Pledged as security with electricity department/banks.
10. Deferred tax assets and liabilities Deferred taxes arising from temporary differences and unused tax losses are summarised as follows:
(` in million)
Deferred tax liabilities/(assets) As at 01 January
2019
Acquired on business
combination (Refer note 52A and 52C)
Recognised in other
comprehensive income
Recognised in Statement of Profit and
Loss
As at 31 December
2019
accelerated depreciation for tax purposes
3,695.70 15.93 - 1,152.21 4,863.84
Benefitaccruedongovernmentgrants
272.62 - - 1.41 274.03
Minimum alternate tax (MaT) credit*
(1,047.74)
- - (121.20) (1,168.94)
Carry forward of unused tax losses (176.52) - - (1.38) (177.90)
allowance for doubtful debts (151.90) - - (6.95) (158.85)
Provision for bonus (18.65) (11.47) - (3.29) (33.41)
Foreign currency monetary item translation difference account
(19.38) - - 16.54 (2.84)
Provisionforretirementbenefits (408.95) (119.34) (33.19) (114.84) (676.32)
Fairvaluationoffinancialinstruments
(194.33) - - (36.20) (230.53)
Varun Beverages Limited138

Summary of significant accounting policies and other explanatory information on the Consolidated Financial Statements for the year ended 31 December 2019
(` in million)
Deferred tax liabilities/(assets) As at 01 January
2019
Acquired on business
combination (Refer note 52A and 52C)
Recognised in other
comprehensive income
Recognised in Statement of Profit and
Loss
As at 31 December
2019
Borrowings (0.16) - - (0.81) (0.97)
Exchange differences arising on translation of foreign operations
(104.62) - 96.97 0.01 (7.64)
Gain on acquisition of control over existing associate
- - - 55.25 55.25
Foreign currency loss on restatement of balances in subsidiary
(168.47) - - 168.47 -
Others (89.94) - - 50.81 (39.13)
1,587.66 (114.88) 63.78 1,160.03 2,696.59Exchange difference on re-statement of deferred tax balances
- - - 2.46 -
1,587.66 (114.88) 63.78 1,162.49 2,696.59
Classified as:Deferred tax assets (Net) 334.00 128.48
Deferred tax liabilities (Net) 1,921.66 2,825.07
(` in million)
Deferred tax liabilities/ (assets) As at 01 January
2018
Acquired on business
combination (Refer note 52D)
Recognised in other
comprehensive income
Recognised in Statement of Profit and
Loss
As at 31 December
2018
accelerated depreciation for tax purposes
3,309.92 - - 385.78 3,695.70
Benefitaccruedongovernmentgrants
244.08 - - 28.54 272.62
Minimum alternate tax (MaT) credit*
(1,407.94) - - 360.20 (1,047.74)
Carry forward of unused tax losses (49.37) - - (127.15) (176.52)
allowance for doubtful debts (99.00) - - (52.90) (151.90)
Provision for bonus (16.38) - - (2.27) (18.65)
Foreign currency monetary item translation difference account
21.19 - - (40.57) (19.38)
Provisionforretirementbenefits (290.35) (11.20) (7.78) (99.62) (408.95)
Fairvaluationoffinancialinstruments
(230.72) - - 36.39 (194.33)
Borrowings (0.40) - - 0.24 (0.16)
Exchange differences arising on translation of foreign operations
(50.00) - (54.62) - (104.62)
Foreign currency loss on restatement of balances in subsidiary
- - - (168.47) (168.47)
Others (9.56) - - (80.38) (89.94)
1,421.47 (11.20) (62.40) 239.79 1,587.66 Exchange difference on re-statement of deferred tax balances
- - - (8.88) -
1,421.47 (11.20) (62.40) 230.91 1,587.66
Classified as:Deferred tax assets (Net) 80.04 334.00
Deferred tax liabilities (Net) 1,501.51 1,921.66
STATUTORY REPORTSCORPORATE OVERVIEW FINANCIAL STATEMENTS
Annual Report 2019 139

Summary of significant accounting policies and other explanatory information on the Consolidated Financial Statements for the year ended 31 December 2019
*MAT credit (recognised in Holding Company): (` in million)
Recognized Utilised
31 December 2019 170.76 (49.56)
31 December 2018 - (360.20)
MaT credit recognised in a year adjustable against income taxes payable under normal tax provisions over a
period of 15 years.
MaT credit recognised on balance sheet date is accumulation of credit recognised (net of utilisation) as per below
table:
(` in million)
Financial year Credit available for carry forward (net of utilisation)
Expiry date
2015-16 394.80 31 March 2031
2016-17 385.62 31 March 2032
2017-18 217.76 31 March 2033
2019-20 170.76 31 March 2035
Total 1,168.94Notes:
(i) The amounts recognised in other comprehensive income relates to the re-measurement of net defined retirement benefit liability and exchange differences arising on translation of foreign operations. Refer note 38 for the amount of the income tax relating to these components of other comprehensive income.
(ii) On 20 September 2019, vide the Taxation Laws (amendment) Ordinance 2019, the Government of India inserted Section 115BaB in the Income Tax act, 1961 which provides Indian domestic companies a non-reversible option to pay corporate tax at reduced rates effective 01 april 2019 subject to certain conditions. The Holding Company carries unutilized minimum alternative tax credit and has other tax benefits/holidays available. The management plans to conclude its evaluation of this option in conjunction with its tax year end of 31 March 2020.
11. Other non-current assets(` in million)
As at 31 December 2019
As at 31 December 2018
(Unsecured, considered good)
Capital advances 1,155.40 918.61
Less: allowance for expected credit loss on advances (402.34) (301.76)
753.06 616.85
advances other than capital advances
- Security deposits 2.73 4.58
- Income tax paid (includes amount paid under protest) 193.98 171.08
- Balance with statutory authorities (paid under protest) 166.03 34.41
- Prepaid expenses 38.16 30.68
1,153.96 857.60
Varun Beverages Limited140

Summary of significant accounting policies and other explanatory information on the Consolidated Financial Statements for the year ended 31 December 2019
12. Inventories(` in million)
As at 31 December 2019
As at 31 December 2018
(Valued at lower of cost or net realisable value)
Raw materials (including raw material in transit of ` 176.91 (31 December 2018: ` 332.19)
3,925.27 2,595.55
Work in progress 64.72 76.59
Intermediate goods 1,855.05 1,269.79
Finished goods (including goods in transit of ` 61.89 (31 December 2018: ` 70.06))*
1,480.89 807.49
Stores and spares 1,489.20 1,034.55
8,815.13 5,783.97 *NetofexchangefluctuationimpactinoneofthesubsidiariesofGroupin31December2018.
The Group manufactures as well as purchases the same product from market for sale. In the absence of demarcation
between manufactured and purchased goods, which are not significant, stock in trade values are not separately
ascertainable.
The cost of inventories recognised as an expense during the year are disclosed in Note 31, Note 32 and Note 33.
13. Trade receivables(` in million)
As at31 December 2019
As at31 December 2018
Trade receivables considered good - Unsecured 1,562.06 1,213.79
Trade receivables considered good - Secured 163.49 66.46
Trade receivables - Credit impaired 393.04 352.19
2,118.59 1,632.44
Less : allowance for expected credit losses (393.04) (352.19)
1,725.55 1,280.25
Includes amounts due, in the ordinary course of business, from companies in which directors of the Holding Company are also directors:
i. Devyani airport Services (Mumbai) Private Limited 0.57 -
ii. alisha Retail Private Limited - 3.29
iii. alisha Torrent Closures (India) Private Limited 3.20 0.89
Trade receivables are non-interest bearing and credit period generally falls in the range of 0 to 120 days terms.
14. Cash and cash equivalents (also for the purpose of Consolidated Cash Flow Statement)
(` in million)
As at 31 December 2019
As at 31 December 2018
Balance with banks in current accounts 726.34 383.75
Balance in deposits with original maturity of less than three months 544.09 -
Cheques/drafts on hand 67.82 4.77
Cash on hand 41.43 40.84
1,379.68 429.36
STATUTORY REPORTSCORPORATE OVERVIEW FINANCIAL STATEMENTS
Annual Report 2019 141

Summary of significant accounting policies and other explanatory information on the Consolidated Financial Statements for the year ended 31 December 2019
15. Bank balances other than cash and cash equivalents(` in million)
As at 31 December 2019
As at 31 December 2018
Deposits with original maturity more than 3 months but less than 12 months *
62.93 140.55
Deposits with bank held as margin money 267.51 364.24 Unpaid dividend account** 0.65 0.65
331.09 505.44 *Pledged as security with statutory authorities/banks
**These balances are not available for use by the Group and corresponding balance is disclosed as unclaimed dividend in Note 26.
16. Loans(` in million)
As at 31 December 2019
As at 31 December 2018
Loans carried at amortized costSecurity deposits 69.37 15.53
69.37 15.53
17. Other current financial assets(` in million)
As at 31 December 2019
As at 31 December 2018
(Unsecured, considered good)Interest accrued on:- Term deposits 10.06 4.37 - Others 18.93 11.28 Government grant receivable 1,840.78 1,143.92 Claims receivable 286.10 203.57 Other receivables 33.96 41.64
2,189.83 1,404.78
18. Current tax assets (Net)(` in million)
As at 31 December 2019
As at 31 December 2018
advance tax (Net of provision) 10.23 4.10
10.23 4.10
19. Other current assets(` in million)
As at 31 December 2019
As at 31 December 2018
(Unsecured, considered good)Security deposits 9.52 8.32 Other advances :- Employees 87.86 64.67 - Contractors and suppliers 1,029.11 873.20 - Prepaid expenses 149.04 87.89 - Balance with statutory/government authorities 824.98 822.79 - Other advances 97.45 127.17
2,197.96 1,984.04
Varun Beverages Limited142

Summary of significant accounting policies and other explanatory information on the Consolidated Financial Statements for the year ended 31 December 2019
20. Equity share capital(` in million)
As at 31 December 2019
As at 31 December 2018
Authorised share capital:
500,000,000 (31 December 2018: 500,000,000) equity shares of ` 10each
5,000.00 5,000.00
5,000.00 5,000.00
Issued, subscribed and fully paid up:
288,688,720 (31 December 2018: 182,641,940) equity shares of ` 10each
2,886.89 1,826.42
2,886.89 1,826.42
(a) Reconciliation of share capital
(` in million)
Particulars No. of shares Amount
Balance as at 01 January 2019 182,641,940 1,826.42
add: Shares issued on exercise of employee stock options during the year
13,285 0.13
add: Bonus shares issued during the year (Refer note (d) below) 91,327,613 913.28
Add:SharesissuedpursuanttoQualifiedinstitutionsplacement("QIP") (Refer note (h) below)
14,705,882 147.06
Balance as at 31 December 2019 288,688,720 2,886.89
(` in million)
Particulars No. of shares Amount
Balance as at 01 January 2018 182,586,940 1,825.87
add: Shares issued on exercise of employee stock options during the year
55,000 0.55
Balance as at 31 December 2018 182,641,940 1,826.42
(b) Terms/rights attached to shares
The Holding Company has only one class of equity shares having a par value of ` 10 each. Each holder of
equity share is entitled to one vote per share. In the event of liquidation of the Holding Company, holders of
equity shares will be entitled to receive any of the remaining assets of the Holding Company, after distribution
of all preferential amounts. The distribution will be in proportion to the number of equity shares held by the
shareholders. The dividend, if any, proposed by the Board of Directors is subject to the approval of the
shareholders in the ensuing annual General Meeting.
(c) List of shareholders holding more than 5% of the equity share capital of the Holding Company at the beginning and at the end of the year :
Shareholders as at 31 December 2019 No. of shares %
R J Corp Limited 81,033,517 28.07%
Ravi Kant Jaipuria & Sons (HUF) 57,481,805 19.91%
Mr. Varun Jaipuria 50,663,250 17.55%
Shareholders as at 31 December 2018 No. of shares %
R J Corp Limited 55,822,345 30.56%
Ravi Kant Jaipuria & Sons (HUF) 39,187,870 21.46%
Mr. Varun Jaipuria 39,175,500 21.45%
STATUTORY REPORTSCORPORATE OVERVIEW FINANCIAL STATEMENTS
Annual Report 2019 143

Summary of significant accounting policies and other explanatory information on the Consolidated Financial Statements for the year ended 31 December 2019
as per records of the Holding Company, including its register of shareholders/members and other declaration
received from the shareholders regarding beneficial interest, the above shareholding represents both legal
and beneficial ownerships of shares.
(d) Aggregate number of equity shares issued as bonus, shares issued for consideration other than cash and shares bought back during the period of five years immediately preceding the reporting date:
During the year ended 31 December 2019, the Holding Company has issued 91,327,613 equity shares of
` 10eachasfullypaid-upbonussharesintheratioof1(One)equityshareforevery2(Two)equityshare
outstanding on the record date.
(e) Shares reserved for issue under options (Refer note 54)
Under Employee Stock Option Scheme, 2013:
As at 31 December 2019
As at 31 December 2018
No. of equity shares of ` 10 each at an exercise price of ` 149.51 per share
Options outstanding at the beginning of the year 23,285 78,285
Less: Options lapsed during the year 10,000 -
Less: Shares issued on exercise of employee stock options 13,285 55,000
- 23,285
(f) Shares held by holding and ultimate holding company
(` in million)
As at 31 December 2019
As at 31 December 2018
RJ Corp Limited, Parent* company 810.34 558.22
81,033,517 (31 December 2018: 55,822,345) fully paid equity shares of ` 10 each
Ravi Kant Jaipuria & Sons (HUF), Parent* of RJ Corp Limited 574.82 391.88
57,481,805 (31 December 2018: 39,187,870) fully paid equity shares of ` 10 each
1,385.16 950.10 * as defined under Ind aS 24 Related Party Disclosures (“Ind aS 24”)
(g) Preference share capital
The Holding Company also has authorised preference share capital of 50,000,000 (31 December 2018:
50,000,000) preference shares of ` 100 each. The Holding Company does not have any outstanding issued
preference shares.
(h) Pursuant to QIP, 14,705,882 equity shares of the Holding Company of ` 10 each were allotted at ` 612 per equity share: (Refer note 62)
(` in million)
Date of allotment Share capital Securities premium
07 September 2019 147.06 8,852.93
Varun Beverages Limited144
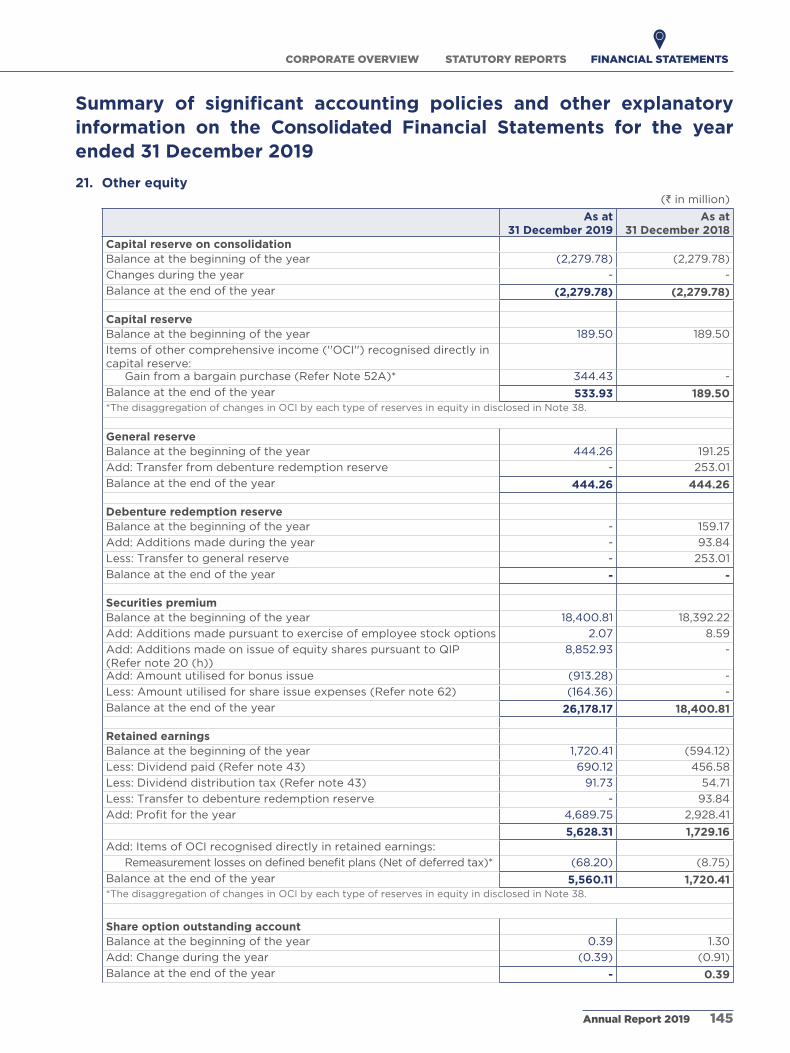
Summary of significant accounting policies and other explanatory information on the Consolidated Financial Statements for the year ended 31 December 2019
21. Other equity(` in million)
As at 31 December 2019
As at31 December 2018
Capital reserve on consolidationBalance at the beginning of the year (2,279.78) (2,279.78)
Changes during the year - -
Balance at the end of the year (2,279.78) (2,279.78)
Capital reserveBalance at the beginning of the year 189.50 189.50
Items of other comprehensive income (''OCI'') recognised directly in capital reserve:
Gain from a bargain purchase (Refer Note 52a)* 344.43 -
Balance at the end of the year 533.93 189.50 *The disaggregation of changes in OCI by each type of reserves in equity in disclosed in Note 38.
General reserveBalance at the beginning of the year 444.26 191.25
add: Transfer from debenture redemption reserve - 253.01
Balance at the end of the year 444.26 444.26
Debenture redemption reserveBalance at the beginning of the year - 159.17
add: additions made during the year - 93.84
Less: Transfer to general reserve - 253.01
Balance at the end of the year - -
Securities premiumBalance at the beginning of the year 18,400.81 18,392.22
add: additions made pursuant to exercise of employee stock options 2.07 8.59
add: additions made on issue of equity shares pursuant to QIP (Refer note 20 (h))
8,852.93 -
add: amount utilised for bonus issue (913.28) -
Less: amount utilised for share issue expenses (Refer note 62) (164.36) -
Balance at the end of the year 26,178.17 18,400.81
Retained earningsBalance at the beginning of the year 1,720.41 (594.12)
Less: Dividend paid (Refer note 43) 690.12 456.58
Less: Dividend distribution tax (Refer note 43) 91.73 54.71
Less: Transfer to debenture redemption reserve - 93.84
Add:Profitfortheyear 4,689.75 2,928.41
5,628.31 1,729.16 add: Items of OCI recognised directly in retained earnings:
Remeasurementlossesondefinedbenefitplans(Netofdeferredtax)* (68.20) (8.75)
Balance at the end of the year 5,560.11 1,720.41 *The disaggregation of changes in OCI by each type of reserves in equity in disclosed in Note 38.
Share option outstanding accountBalance at the beginning of the year 0.39 1.30
add: Change during the year (0.39) (0.91)
Balance at the end of the year - 0.39
STATUTORY REPORTSCORPORATE OVERVIEW FINANCIAL STATEMENTS
Annual Report 2019 145

Summary of significant accounting policies and other explanatory information on the Consolidated Financial Statements for the year ended 31 December 2019
(` in million)
As at 31 December 2019
As at31 December 2018
Exchange differences on translating the financial statements of foreign operationsBalance at the beginning of the year (346.52) (166.70)
add: Exchange differences arising on translation of foreign operations (Net of deferred tax of ` (96.97) (31 December 2018: ` 54.62))
319.29 (179.82)
Balance at the end of the year (27.23) (346.52)
Share application money pending allotmentBalance at the beginning of the year - 1.08
add: Change during the year - (1.08)
Balance at the end of the year - -
Foreign currency monetary item translation difference accountBalance at the beginning of the year 29.55 (25.51)
add: additions made during the year (47.92) 79.44
Less: amortised during the year (6.24) 24.38
Balance at the end of the year (12.13) 29.55
30,397.33 18,158.62
Description of nature and purpose of each reserve:
Capital reserve on consolidation - Created on additional consideration paid in form of cash on business
combinations involving entities including businesses/entities under common control.
Capital reserve - Created on merger of Varun Beverages (International) Limited with the Holding Company
pursuant to and in accordance with the Court approved scheme of amalgamation. Includes gain from bargain
purchases.
General reserve - Created by way of transfer from debenture redemption reserve on redemption of debentures
and is not an item of other comprehensive income.
Debenture redemption reserve - Created as per provisions of the act (as applicable to Holding Company) out of
the distributable profits and can only be utilised for redemption of debentures.
Securities premium - Created to record the premium on issue of shares. The reserve is utilised in accordance with
the provisions of the act.
Retained earnings - Created from the profit of the Group, as adjusted for distributions to owners, transfers to
other reserves, etc.
Exchange differences on translating the financial statements of foreign operations - Exchange differences
arising on translation of the foreign operations of the Group, recognised in other comprehensive income as
described in accounting policy and accumulated in a separate reserve within other equity. The cumulative amount
is reclassified to Consolidated Statement of Profit and Loss when the net investment is disposed.
Share option outstanding account - Created for recording the grant date fair value of options issued to employees
under employee stock option schemes and is adjusted on exercise/ forfeiture of options.
Foreign currency monetary item translation difference account - Created for recording exchange differences
arising on restatement of long term foreign currency monetary items, other than for acquisition of fixed assets,
and is being amortised over the maturity period of such monetary items.
Varun Beverages Limited146

Summary of significant accounting policies and other explanatory information on the Consolidated Financial Statements for the year ended 31 December 2019
22. Borrowings A. Non-current borrowings:
(` in million, except otherwise stated)
As at31 December 2019
As at 31 December 2018
Term loans (secured) (Refer note 22C)
- Loans from banks 22,753.47 19,104.95
-Loansfromfinancialinstitutions 800.29 626.76
- Loans from others - 4.88
Deferred value added tax/excise (unsecured) (Refer note 22C) - 64.10
23,553.76 19,800.69
Loans and borrowing above are recognised at amortised cost/ fair value taking into account any discount or
premium on acquisition and fee or costs that are part of effective interest rate, accordingly the outstanding
balances above may not necessarily reconcile with repayment amounts.
B. Current borrowings:
(` in million)
As at31 December 2019
As at 31 December 2018
Working capital facilities
- from banks (secured) (Refer footnote (a)) 2,603.90 3,068.52
- from a bank (secured) (Refer footnote (b)) - 500.00
- from a bank (unsecured) (Refer footnote (c)) 2,000.00 -
- from bodies corporate (unsecured) (Refer footnote (e)) - 117.15
Letter of credit (LC) payable to a bank (unsecured) (Refer footnote (d))
- 48.61
Loans repayable on demand from:
- bodies corporate (unsecured) (Refer footnote (e)) 60.56 41.57
- others (unsecured) (Refer footnote (e)) 7.08 0.70
4,671.54 3,776.55
(a) In case of the Holding Company, the working capital facilities from banks amounting to ` 2,110.44
(31 December 2018: ` 2,640.14) are secured by first charge on entire current assets of the Holding
Company ranking pari-passu amongst the banks and second charge on the movable and immovable
assets of the Holding Company pertaining to specific manufacturing units. In previous year, one facility
was secured by subservient charge over entire current assets and movable fixed assets (both present
and future) of the Holding Company and were repaid during the year. These facilities carry interest rates
ranging between 8.35 to 9.65% (31 December 2018: 8.50 to 9.70%).
Working capital facilities in case of subsidiaries amounting to ̀ 493.46 (31 December 2018: ̀ 428.38), are
secured mainly by charge on trade receivables, inventories and other current assets of the respective
subsidiary company, ranking pari passu and charge on certain movable and immovable assets of the
respective subsidiary. Some of the facilities of subsidiaries are guaranteed by respective subsidiary
company, as per the terms of respective agreements. The working capital facilities carries interest rates
ranging between 5.50 to 16.09% (31 December 2018: 5.50 to 15.40%).
(b) Working capital facility from a bank are secured by first charge on entire current assets of the Holding
Company ranking pari-passu amongst the banks. The facility carries interest rates ranging between 8.55
to 8.60%. The outstanding amount of ` 500 were repaid during the year.
STATUTORY REPORTSCORPORATE OVERVIEW FINANCIAL STATEMENTS
Annual Report 2019 147

Summary of significant accounting policies and other explanatory information on the Consolidated Financial Statements for the year ended 31 December 2019
(c) Working capital facility from a bank carries rate of interest of 7.15% per annum for period of 6 months.
(d) LC payable to a bank carried rate of interest of 8.65 % per annum for 120 days. The outstanding amount
of ` 48.61 was repaid during the year.
(e) These loans are interest free.
There are no defaults in repayment of principal borrowing or interest thereon. (Refer note 57)
C. Terms and conditions/details of securities for loans:
(` in million)
Particulars Loan outstanding
31 December 2019 31 December 2018
Non-current
Current Non-current
Current
Term loans
Loans from banks (secured)
(i) Foreign currency loan from banks in Holding Company
Loan carrying rate of interest of LIBOR+1.60% (31 December 2018: LIBOR+1.60%) and is repayable in two equal installments of SGD 16.56 million each in May 2021 and May 2022. The Company has executed a cross currency swap to hedge total loan of SGD 33.13 million to USD 25 million and interest rate swap to hedge its exposure.
1,752.25 - 1,686.78 -
Loanissecuredonfirstpari-passuchargeontheentire movable and immovable property, plant and equipment of the Company including the territory/franchisee rights acquired under the acquisition under slump sale basis except vehicles.
(ii) Indian rupee loan from banks
Loans carrying weighted average rate of interest 8.92% (31 December 2018: 8.77%) depending upon tenure of the loans.For repayment terms refer note 22E.
20,283.65 4,942.71 16,028.61 3,332.66
Theseloanaresecuredonfirstpari-passuchargeon the entire movable and immovable property, plant and equipment of the Company including the territory /franchisee rights acquired under the business acquisition except vehicles.
(iii) Vehicle rupee term loan in Holding Company
Loans carrying rate of interest in range of 7.90-10.15% (31 December 2018: 7.90-10.33%). They are repayablegenerallyoveraperiodofthreetofiveyears in equal monthly installments as per the terms of the respective agreements. Vehicle loans are securedagainstrespectivevehiclesfinanced.
80.89 38.15 16.96 44.27
(iv) Term Loan at Varun Beverages (Zimbabwe) (Private) Limited
Loan of Varun Beverages (Zimbabwe) (Private) Limited, carry rate of interest of LIBOR + 2.50% (31 December 2018: 5.50% to 7%).For repayment terms refer note 22E.
354.10 285.10 626.18 281.96
Varun Beverages Limited148

Summary of significant accounting policies and other explanatory information on the Consolidated Financial Statements for the year ended 31 December 2019
(` in million)
Particulars Loan outstanding
31 December 2019 31 December 2018
Non-current
Current Non-current
Current
above loan is secured by corporate guarantee of the Holding Company.
Loans of Varun Beverages (Zimbabwe) (Private) Limited, carry rate of interest of LIBOR + 3.00% (31 December 2018: LIBOR + 3.00%)For repayment terms refer note 22E.
282.58 370.84 613.15 222.97
above loan is secured by corporate guarantee of the Holding Company.
Loans of Varun Beverages (Zimbabwe) (Private) Limited, carry rate of interest of 25% (31 December 2018: Nil) repayable in three months.
- 212.50 - -
above loan is secured by corporate guarantee of the Holding Company.
(v) Term Loan at Varun Beverages Lanka (Private) Limited
Loans from banks at Varun Beverages Lanka (Private) Limited carried rate of interest of Nil (31 December 2018: 13%) which were repaid during the year.
- - 1.01 0.61
These vehicle loans were secured by charge over respectivevehiclesfinanced.
(vi) Term Loan at Varun Beverages Nepal (Private) Limited
Loans from banks at Varun Beverages Nepal (Private) Limited carried rate of interest of Nil (31 December 2018: 9.39%) which were repaid during the year.
- - 132.26 117.08
These term loans were secured by mortgage of moveable and immovable assets & current assets of the subsidiary company and corporate guarantee of the Holding Company.
Total loans from banks (secured) 22,753.47 5,849.30 19,104.95 3,999.55
Loans from financial institutions (secured)
Interest free loan from The Pradeshiya Industrial & Investment Corporation of U.P. Limited are repayable in one installment after expiry of seven years from the date of disbursement. Loan is secured against bank guarantee equivalent to 100% of loan amount valid upto the repayment date of loan plus six months grace period.The loans are recognised at amortised cost basis using weighted average rate of borrowing on date of receipt, i.e., 8.52%-9.72%.The repayments are due as following:Date of repayment Amount25 December 2023 155.7930 November 2024 177.8301 November 2025 211.98
356.42 - 326.25 -
STATUTORY REPORTSCORPORATE OVERVIEW FINANCIAL STATEMENTS
Annual Report 2019 149
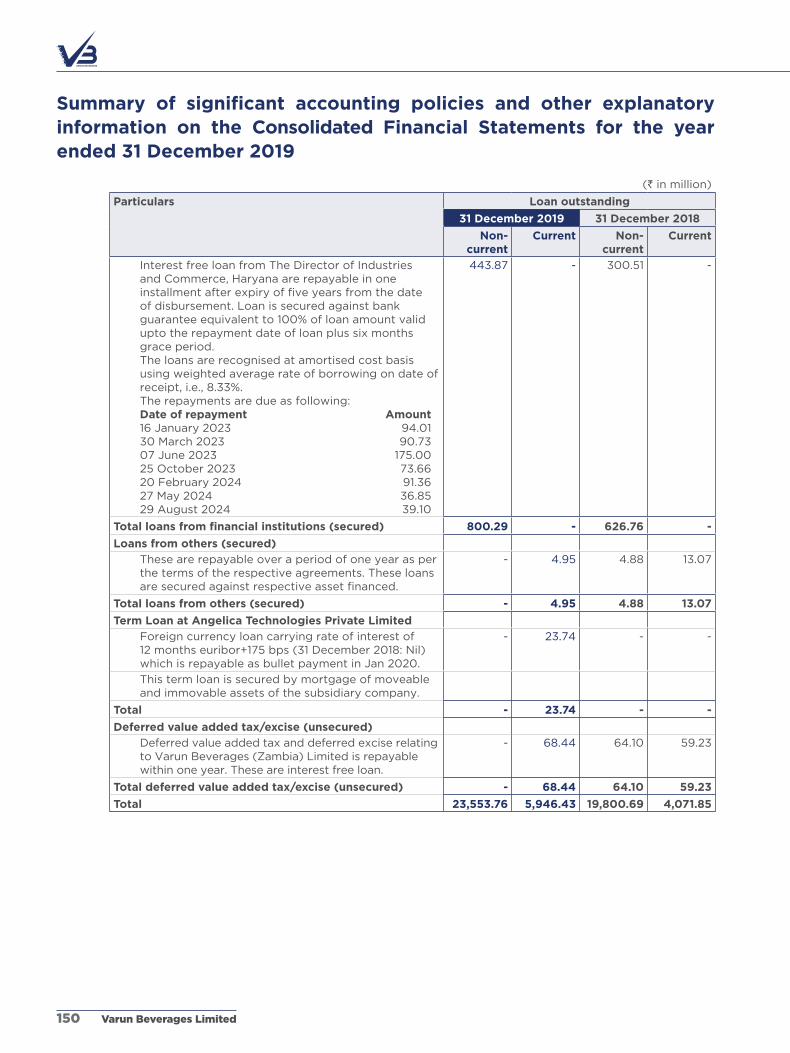
Summary of significant accounting policies and other explanatory information on the Consolidated Financial Statements for the year ended 31 December 2019
(` in million)
Particulars Loan outstanding
31 December 2019 31 December 2018
Non-current
Current Non-current
Current
Interest free loan from The Director of Industries and Commerce, Haryana are repayable in one installmentafterexpiryoffiveyearsfromthedateof disbursement. Loan is secured against bank guarantee equivalent to 100% of loan amount valid upto the repayment date of loan plus six months grace period.The loans are recognised at amortised cost basis using weighted average rate of borrowing on date of receipt, i.e., 8.33%.The repayments are due as following:Date of repayment Amount16 January 2023 94.0130 March 2023 90.7307 June 2023 175.0025 October 2023 73.6620 February 2024 91.36 27 May 2024 36.85 29 august 2024 39.10
443.87 - 300.51 -
Total loans from financial institutions (secured) 800.29 - 626.76 -
Loans from others (secured)
These are repayable over a period of one year as per the terms of the respective agreements. These loans aresecuredagainstrespectiveassetfinanced.
- 4.95 4.88 13.07
Total loans from others (secured) - 4.95 4.88 13.07
Term Loan at Angelica Technologies Private Limited
Foreign currency loan carrying rate of interest of 12 months euribor+175 bps (31 December 2018: Nil) which is repayable as bullet payment in Jan 2020.
- 23.74 - -
This term loan is secured by mortgage of moveable and immovable assets of the subsidiary company.
Total - 23.74 - -
Deferred value added tax/excise (unsecured)
Deferred value added tax and deferred excise relating to Varun Beverages (Zambia) Limited is repayable within one year. These are interest free loan.
- 68.44 64.10 59.23
Total deferred value added tax/excise (unsecured) - 68.44 64.10 59.23
Total 23,553.76 5,946.43 19,800.69 4,071.85
Varun Beverages Limited150

Summary of significant accounting policies and other explanatory information on the Consolidated Financial Statements for the year ended 31 December 2019
D. Deferred payment liabilities
(` in million)
Description Loan outstanding
31 December 2019 31 December 2018
Non-current
Current Non-current
Current
i) Plant and equipment acquired under deferred payment terms (secured)
The payments were secured against a letter of credit issued by the Company’s banker. The outstanding amount of ` 429.58 was repaid during the year.
- - - 429.58
Total - - - 429.58
E. Repayment terms:
(` in million, unless stated otherwise)
Sl. No.
Description 31 December 2019 31 December 2018 Repayment terms
Non-current Current Non-current Current
(i) Indian rupee loan from banks
1. Term loan - 1 57.67 114.60 372.00 85.95 Two installments of ` 57.30 each due in May 2020 and June 2020 and one installment of ` 57.84 due in May 2021.
2. Term loan - 2 700.00 350.00 1,050.00 350.00 Two installments of ` 175 each due in May 2020 and June 2020, two installments of ` 175 each due in May 2021 and June 2021, two installments of ̀ 175 each due in May 2022 and June 2022.
3. Term loan - 3 996.56 - 995.11 - Two installments of ` 150 due in May 2021 and ` 250 due in June 2021 and two installments of ` 300 each due in May 2022 and June 2022.
4. Term loan - 4 499.23 50.00 548.87 - One installments of ` 50 due in June 2020, two installments of ` 125 each due in May 2021 and June 2021 and two installments of ` 125 each due in May 2022 and June 2022.
5. Term loan - 5 300.00 300.00 600.00 260.00 Two installments of ` 150 each due in May 2020 and June 2020 and two installments of ` 150 each due in May 2021 and June 2021.
6. Term loan - 6 1,178.45 392.83 1,259.42 157.43 Two installments of ` 196.41 each due in May 2020 and June 2020, two installments of ` 294.63 each due in May 2021 and June 2021 and two installments of ` 294.63 each due in May 2022 and June 2022.
7. Term loan - 7 581.36 - 581.36 - Two installments of ` 76.96 millions due in May 2021 and of ` 183.31 millions due in June 2021 installment of ` 183.31 due in May 2022 and ` 137.78 due in June 2022.
STATUTORY REPORTSCORPORATE OVERVIEW FINANCIAL STATEMENTS
Annual Report 2019 151
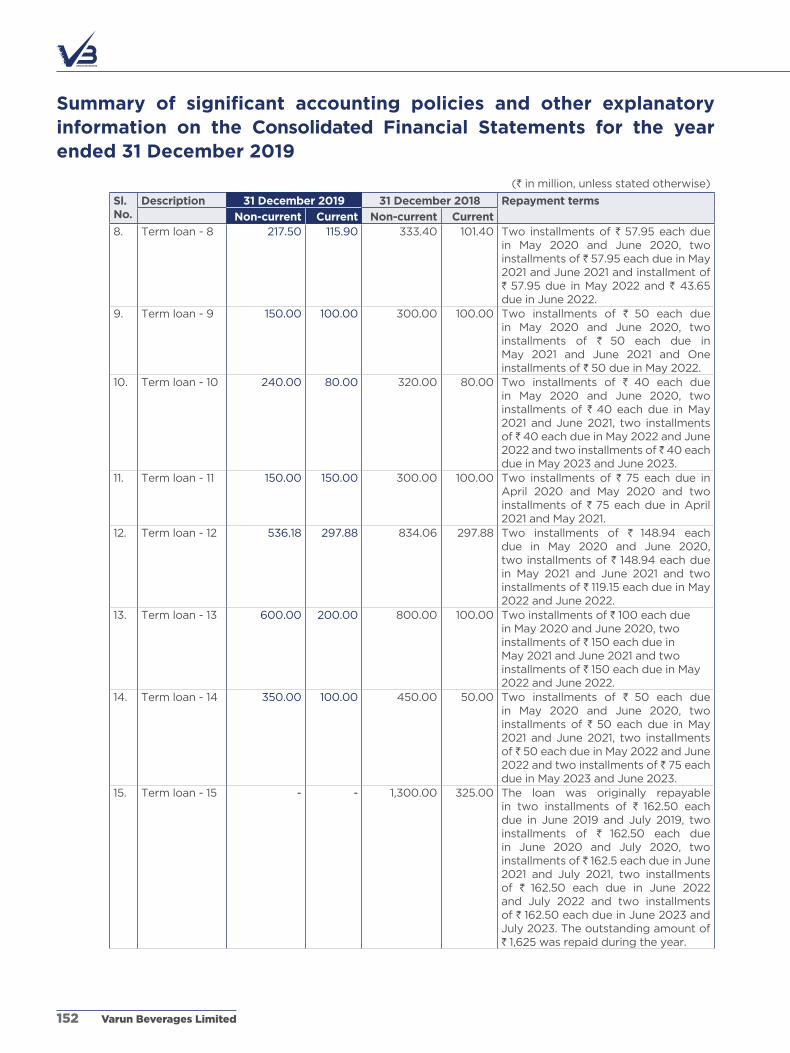
Summary of significant accounting policies and other explanatory information on the Consolidated Financial Statements for the year ended 31 December 2019
(` in million, unless stated otherwise)
Sl. No.
Description 31 December 2019 31 December 2018 Repayment terms
Non-current Current Non-current Current8. Term loan - 8 217.50 115.90 333.40 101.40 Two installments of ` 57.95 each due
in May 2020 and June 2020, two installments of ` 57.95 each due in May 2021 and June 2021 and installment of ` 57.95 due in May 2022 and ` 43.65 due in June 2022.
9. Term loan - 9 150.00 100.00 300.00 100.00 Two installments of ` 50 each due in May 2020 and June 2020, two installments of ` 50 each due in May 2021 and June 2021 and One installments of ` 50 due in May 2022.
10. Term loan - 10 240.00 80.00 320.00 80.00 Two installments of ` 40 each due in May 2020 and June 2020, two installments of ` 40 each due in May 2021 and June 2021, two installments of ̀ 40 each due in May 2022 and June 2022 and two installments of ̀ 40 each due in May 2023 and June 2023.
11. Term loan - 11 150.00 150.00 300.00 100.00 Two installments of ` 75 each due in april 2020 and May 2020 and two installments of ` 75 each due in april 2021 and May 2021.
12. Term loan - 12 536.18 297.88 834.06 297.88 Two installments of ` 148.94 each due in May 2020 and June 2020, two installments of ` 148.94 each due in May 2021 and June 2021 and two installments of ` 119.15 each due in May 2022 and June 2022.
13. Term loan - 13 600.00 200.00 800.00 100.00 Two installments of ` 100 each due in May 2020 and June 2020, two installments of ` 150 each due in May 2021 and June 2021 and two installments of ` 150 each due in May 2022 and June 2022.
14. Term loan - 14 350.00 100.00 450.00 50.00 Two installments of ` 50 each due in May 2020 and June 2020, two installments of ` 50 each due in May 2021 and June 2021, two installments of ` 50 each due in May 2022 and June 2022 and two installments of ` 75 each due in May 2023 and June 2023.
15. Term loan - 15 - - 1,300.00 325.00 The loan was originally repayable in two installments of ` 162.50 each due in June 2019 and July 2019, two installments of ` 162.50 each due in June 2020 and July 2020, two installments of ̀ 162.5 each due in June 2021 and July 2021, two installments of ` 162.50 each due in June 2022 and July 2022 and two installments of ` 162.50 each due in June 2023 and July 2023. The outstanding amount of ` 1,625 was repaid during the year.
Varun Beverages Limited152

Summary of significant accounting policies and other explanatory information on the Consolidated Financial Statements for the year ended 31 December 2019
(` in million, unless stated otherwise)
Sl. No.
Description 31 December 2019 31 December 2018 Repayment terms
Non-current Current Non-current Current
16. Term loan - 16 1,499.74 500.00 1,999.51 500.00 Two installments of ` 250.00 each due in May 2020 and June 2020, two installments of ` 250.00 each due in May 2021 and June 2021, two installments of ` 250.00 each due in May 2022 and June 2022 and two installments of ` 250.00 each due in May 2023 and June 2023.
17. Term loan - 17 750.00 240.00 990.00 210.00 Three installments of ` 80.00 each due in May 2020, June 2020 and July 2020, three installments of ` 80.00 each due in May 2021, June 2021 and July 2021, three installments of ` 90.00 each due in May 2022, June 2022 and July 2022 and an installment of ` 90.00 due in May 2023 and of ` 150.00 due in June 2023.
18. Term loan - 18 395.00 150.00 545.00 140.00 Two installments of ` 75.00 each due in June 2020 and July 2020, two installments of ̀ 75.00 each due in May 2021 and June 2021, two installments of ` 80.00 each due in June 2020 and July 2022 and one installment of ` 85.00 due in May 2023.
19. Term loan - 19 628.21 193.30 816.48 150.00 One installment of ` 193.30 due in May 2020,one installments of ` 193.30 due in May 2021, one installment of ̀ 193.30 due in May 2022 and one installment of ` 241.62 due in May 2023.
20. Term loan - 20 666.80 166.60 833.40 125.00 Two installments of ` 83.30 each due in May 2020 and June 2020, two installments of ` 111.10 each due in May 2021 and June 2021, two installments of ` 111.10 each due in May 2022 and June 2022 and two installments of ` 111.10 due in May 2023 and ` 111.30 in June 2023
21. Term loan - 21 - - 800.00 200.00 The loan was originally repayable in two installments of ` 100.00 each due in June 2019 and July 2019, two installments of ` 100.00 each due in June 2020 and July 2020, two installments of ` 100.00 each due in June 2021 and July 2021, two installments of ` 100.00 each due in June 2022 and July 2022 and two installments of ` 100.00 due in June 2023 and July 2023. The outstanding amount of ` 1,000 was repaid during the year.
STATUTORY REPORTSCORPORATE OVERVIEW FINANCIAL STATEMENTS
Annual Report 2019 153

Summary of significant accounting policies and other explanatory information on the Consolidated Financial Statements for the year ended 31 December 2019
(` in million, unless stated otherwise)
Sl. No.
Description 31 December 2019 31 December 2018 Repayment terms
Non-current Current Non-current Current
22. Term loan - 22 1,457.55 291.60 - - Two installments of ` 145.80 each due in June 2020 and July 2020, two installments of ̀ 145.80 each due in June 2021 and July 2021, two installments of ` 145.80 each due in June 2022 and July 2022, two installments of ` 145.80 each due in June 2023 and July 2023, two installments of ` 145.90 each due in June 2024 and July 2024 and two installments of ` 145.90 each due in June 2025 and July 2025.
23. Term loan - 23 1,495.36 - - - Two installments of ` 375.00 each due in May 2022 and June 2022 and two installments of ` 375.00 each due in May 2023 and June 2023.
24. Term loan - 24 2,494.90 500.00 - - Two installments of ` 250.00 each due in May 2020 and June 2020, two installments of ` 250.00 each due in May 2021 and June 2021, two installments of ` 250.00 each due in May 2022 and June 2022, two installments of ` 250.00 each due in May 2023 and June 2023,two installments of ` 250.00 each due in May 2024 and June 2024 and two installments of ` 250.00 each due in May 2025 and June 2025.
25. Term loan - 25 1,594.35 400.00 - - Two installments of ` 200.00 each due in May 2020 and June 2020, two installments of ` 200.00 each due in May 2021 and June 2021, two installments of ` 300.00 each due in May 2022 and June 2022 and two installments of ` 300.00 each due in May 2023 and June 2023.
26. Term loan - 26 850.00 150.00 - - Two installments of ` 75.00 each due in May 2020 and June 2020, two installments of ̀ 75.00 each due in May 2021 and June 2021, two installments of ` 75.00 each due in May 2022 and June 2022, two installments of ` 75.00 each due in May 2023 and June 2023, two installments of ` 100.00 each due in May 2024 and June 2024 and two installments of ` 100.00 each due in May 2025 and June 2025.
Varun Beverages Limited154

Summary of significant accounting policies and other explanatory information on the Consolidated Financial Statements for the year ended 31 December 2019
(` in million, unless stated otherwise)
Sl. No.
Description 31 December 2019 31 December 2018 Repayment terms
Non-current Current Non-current Current27. Term loan - 27 894.79 100.00 - - Two installments of ` 50.00 each
due in May 2020 and June 2020, two installments of ̀ 50.00 each due in May 2021 and June 2021, two installments of ` 100.00 each due in May 2022 and June 2022, two installments of ̀ 100.00 each due in May 2023 and June 2023, two installments of ` 100.00 each due in May 2024 and June 2024 and two installments of ` 100.00 each due in May 2025 and June 2025.
28. Term loan - 28 1,000.00 - - - One installment of ̀ 200.00 due in July 2022, two installments of ` 200.00 each due in June 2023 and July 2023 and two installments of ` 200.00 each due in June 2024 and July 2024.
Total (A) 20,283.65 4,942.71 16,028.61 3,332.66
(ii) Term Loan at Varun Beverages (Zimbabwe) (Private) Limited
29. Term loan - 29 354.10 285.10 618.08 279.17 Balance amount as at 31 December 2019 is repayable in 9 quarterly installments of Zimbabwe Dollar (“ZWL”) 16.71 million each (equivalent installment of USD 1 million each).
30. Term loan - 30 - - 8.10 2.79 The outstanding amount of ` 10.90 were repaid during the year.
31. Term loan - 31 282.58 370.84 613.15 222.97 Balance amount as at 31 December 2019 is repayable in 7 quarterly installments of ZWL 21.43 million each (equivalent installment of USD 1.3 million each).
Total (B) 636.68 655.94 1,239.33 504.93
(iii) Term Loan at Varun Beverages Lanka (Private) Limited
32. Term loan - 32 - - 0.70 0.42 The outstanding amount of ` 1.12 were repaid during the year.
33. Term loan - 33 - - 0.31 0.19 The outstanding amount of ` 0.50 were repaid during the year.
Total (C) - - 1.01 0.61
(iv) Term Loan at Varun Beverages Nepal (Private) Limited
34. Term loan - 34 - - 132.26 117.08 The loan was originally repayable in six installments of NPR 62.50 million each during april-June 2019 and april-June 2020 and one installment of NPR 25.00 million in april 2021. The outstanding amount of ̀ 249.34 were repaid during the year.
Total (D) - - 132.26 117.08
Total (A+B+C+D)
20,920.33 5,598.65 17,401.21 3,955.27
STATUTORY REPORTSCORPORATE OVERVIEW FINANCIAL STATEMENTS
Annual Report 2019 155

Summary of significant accounting policies and other explanatory information on the Consolidated Financial Statements for the year ended 31 December 2019
23. Provisions (Refer note 41)
(` in million)
As at31 December 2019
As at 31 December 2018
Non-current
Definedbenefitliability(net) 1,276.09 761.80
Other long term employee obligations 427.26 290.75
1,703.35 1,052.55
Current
Definedbenefitliability(net) 116.83 34.47
Other short term employee obligations 182.96 125.72
299.79 160.19
24. Other non-current liabilities
(` in million)
As at31 December 2019
As at 31 December 2018
Statutory liability payable (Net of amount paid under protest) - 23.42
Deferred revenue on government grant 8.23 44.33
8.23 67.75
25. Trade payables
(` in million)
As at31 December 2019
As at 31 December 2018
Total outstanding dues of-
Micro enterprises and small enterprises (Refer note 50) 26.14 2.47
Creditors other than micro enterprises and small enterprises 4,750.47 3,165.50
4,776.61 3,167.97
26. Other current financial liabilities
(` in million)
As at31 December 2019
As at 31 December 2018
Current maturities of long-term debts (Refer note 22C) 5,946.43 4,071.85
Interest accrued but not due on borrowings 154.07 119.76
Current portion of deferred payment liabilities (Refer note 22D) - 429.58
Payable for capital expenditures 865.01 1,075.29
Employee related payables 440.60 282.58
Unclaimed dividends# 4.19 0.65
Security deposits 2,779.38 2,454.75
Liability for foreign currency derivative contract 68.45 77.97
10,258.13 8,512.43 #Includes unclaimed dividend of ` 3.54 (31 December 2018: Nil) related to non controlling shareholders of a subsidiary. Further,
unclaimed dividend of ` 0.65 (31 December 2018: ` 0.65) related to Holding Company is not due for deposit to the Investor Education and Protection Fund.
Varun Beverages Limited156
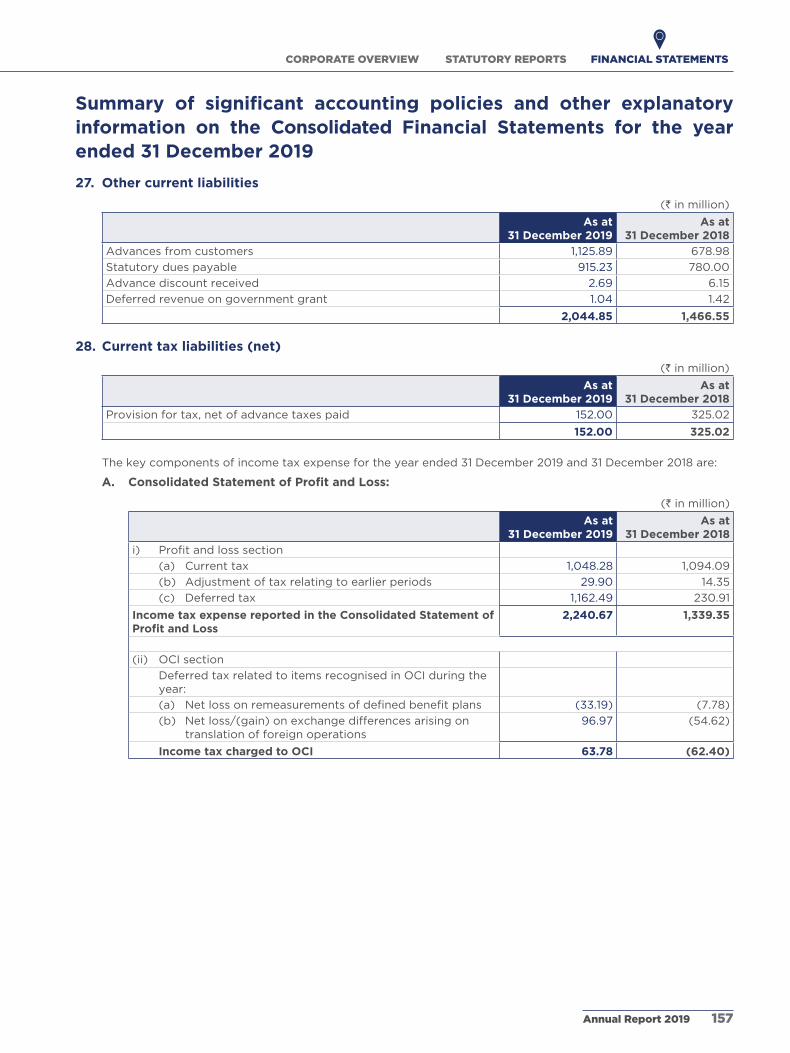
Summary of significant accounting policies and other explanatory information on the Consolidated Financial Statements for the year ended 31 December 2019
27. Other current liabilities
(` in million)
As at31 December 2019
As at 31 December 2018
advances from customers 1,125.89 678.98
Statutory dues payable 915.23 780.00
advance discount received 2.69 6.15
Deferred revenue on government grant 1.04 1.42
2,044.85 1,466.55
28. Current tax liabilities (net)
(` in million)
As at31 December 2019
As at 31 December 2018
Provision for tax, net of advance taxes paid 152.00 325.02
152.00 325.02
The key components of income tax expense for the year ended 31 December 2019 and 31 December 2018 are:
A. Consolidated Statement of Profit and Loss:
(` in million)
As at31 December 2019
As at 31 December 2018
i) Profitandlosssection
(a) Current tax 1,048.28 1,094.09
(b) adjustment of tax relating to earlier periods 29.90 14.35
(c) Deferred tax 1,162.49 230.91
Income tax expense reported in the Consolidated Statement of Profit and Loss
2,240.67 1,339.35
(ii) OCI section
Deferred tax related to items recognised in OCI during the year:
(a) Netlossonremeasurementsofdefinedbenefitplans (33.19) (7.78)
(b) Net loss/(gain) on exchange differences arising on translation of foreign operations
96.97 (54.62)
Income tax charged to OCI 63.78 (62.40)
STATUTORY REPORTSCORPORATE OVERVIEW FINANCIAL STATEMENTS
Annual Report 2019 157
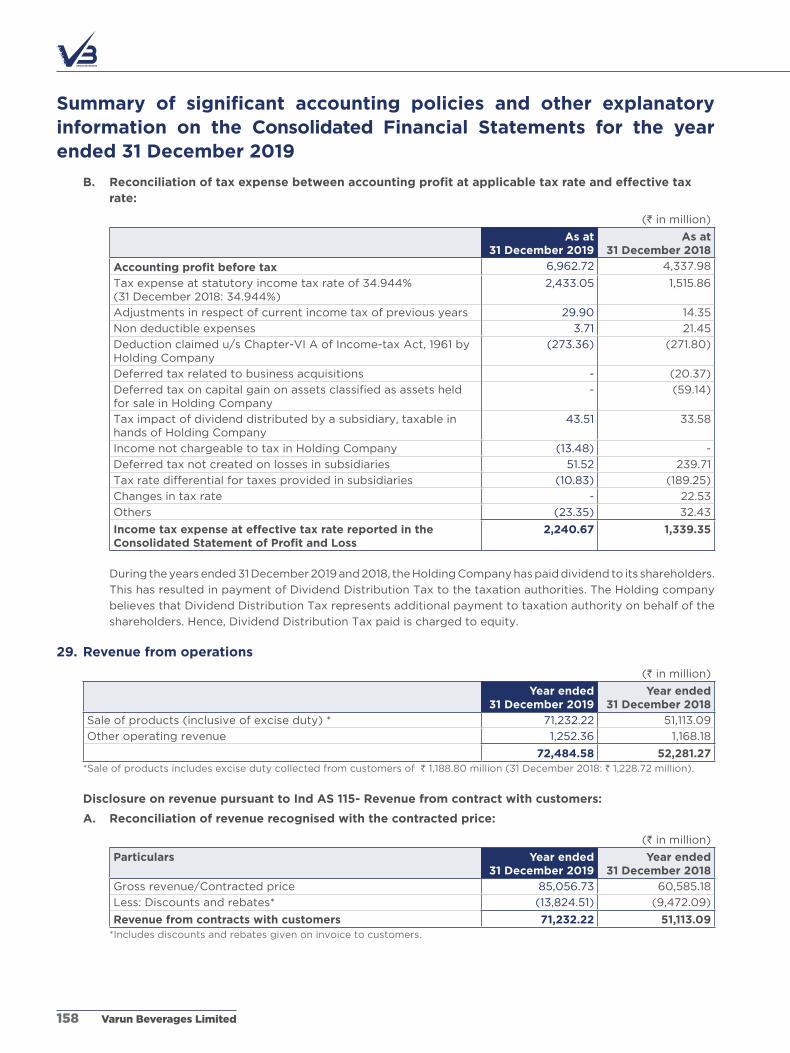
Summary of significant accounting policies and other explanatory information on the Consolidated Financial Statements for the year ended 31 December 2019
B. Reconciliation of tax expense between accounting profit at applicable tax rate and effective tax rate:
(` in million)
As at31 December 2019
As at 31 December 2018
Accounting profit before tax 6,962.72 4,337.98
Tax expense at statutory income tax rate of 34.944% (31 December 2018: 34.944%)
2,433.05 1,515.86
adjustments in respect of current income tax of previous years 29.90 14.35
Non deductible expenses 3.71 21.45
Deduction claimed u/s Chapter-VI a of Income-tax act, 1961 by Holding Company
(273.36) (271.80)
Deferred tax related to business acquisitions - (20.37)
Deferredtaxoncapitalgainonassetsclassifiedasassetsheldfor sale in Holding Company
- (59.14)
Tax impact of dividend distributed by a subsidiary, taxable in hands of Holding Company
43.51 33.58
Income not chargeable to tax in Holding Company (13.48) -
Deferred tax not created on losses in subsidiaries 51.52 239.71
Tax rate differential for taxes provided in subsidiaries (10.83) (189.25)
Changes in tax rate - 22.53
Others (23.35) 32.43
Income tax expense at effective tax rate reported in the Consolidated Statement of Profit and Loss
2,240.67 1,339.35
During the years ended 31 December 2019 and 2018, the Holding Company has paid dividend to its shareholders.
This has resulted in payment of Dividend Distribution Tax to the taxation authorities. The Holding company
believes that Dividend Distribution Tax represents additional payment to taxation authority on behalf of the
shareholders. Hence, Dividend Distribution Tax paid is charged to equity.
29. Revenue from operations
(` in million)
Year ended 31 December 2019
Year ended 31 December 2018
Sale of products (inclusive of excise duty) * 71,232.22 51,113.09
Other operating revenue 1,252.36 1,168.18
72,484.58 52,281.27 *Sale of products includes excise duty collected from customers of ` 1,188.80 million (31 December 2018: ` 1,228.72 million).
Disclosure on revenue pursuant to Ind AS 115- Revenue from contract with customers:
A. Reconciliation of revenue recognised with the contracted price:
(` in million)
Particulars Year ended 31 December 2019
Year ended 31 December 2018
Gross revenue/Contracted price 85,056.73 60,585.18
Less: Discounts and rebates* (13,824.51) (9,472.09)
Revenue from contracts with customers 71,232.22 51,113.09 *Includes discounts and rebates given on invoice to customers.
Varun Beverages Limited158

Summary of significant accounting policies and other explanatory information on the Consolidated Financial Statements for the year ended 31 December 2019
B. Contract balances:
The following table provides information about receivables and contract liabilities from contract with
customers:
Receivables
(` in million)
Particulars Year ended 31 December 2019
Year ended 31 December 2018
Trade receivables 2,118.59 1,632.44
Less: allowances for expected credit loss (393.04) (352.19)
Net receivables 1,725.55 1,280.25
Contract liabilities
(` in million)
Particulars Year ended 31 December 2019
Year ended 31 December 2018
advance from customers 1,125.89 678.98
1,125.89 678.98
C. Contract asset is the right to consideration in exchange for goods or services transferred to the customer.
Contract liabilities are on account of the advance payment received from customer for which performance
obligation has not yet been completed.
The performance obligation is satisfied when control of the goods or services are transferred to the customers
based on the contractual terms. The Group does not have any remaining performance obligation as contracts
entered for sale of goods are for a shorter duration. Further, there are no contracts for sale of services
wherein, performance obligation is unsatisfied to which transaction price has been allocated.
Payment terms with customers vary depending upon the contractual terms of each contract and generally
falls in the range of 0 to 120 days from the completion of performance obligation.
There is no significant financing component in any transaction with the customers.
D. Changes in the contract liabilities balances during the year are as follows:
(` in million)
Particulars Year ended 31 December 2019
Year ended 31 December 2018
Balance at the beginning of the year 678.98 709.67
addition during the year 1,125.89 678.98
Revenue recognised during the year (678.98) (709.67)
Balance at the closing of the year 1,125.89 678.98
STATUTORY REPORTSCORPORATE OVERVIEW FINANCIAL STATEMENTS
Annual Report 2019 159

Summary of significant accounting policies and other explanatory information on the Consolidated Financial Statements for the year ended 31 December 2019
30. Other income
(` in million)
Year ended 31 December 2019
Year ended 31 December 2018
Interest income on items at amortised cost:
- term deposits 25.06 25.32
- others 34.50 32.35
Gain on sale of current investments 1.38 -
Excess provisions written back 151.83 58.21
Gain on acquisition of control over existing associate (Refer note 52C) 158.11 -
Dividend income from current investments 0.20 -
Gain on sale of property, plant and equipment (Net) 16.05 -
Miscellaneous 38.15 102.36
425.28 218.24
31. Cost of materials consumed
(` in million)
Year ended 31 December 2019
Year ended 31 December 2018
Raw material and packing material consumed
Inventories at beginning of the year 2,595.55 1,788.55
acquired on acquisition of control over existing associate 50.58 -
Purchases during the year (Net) 32,713.89 22,860.84
35,360.02 24,649.39
Sold during the year 2,039.19 931.06
Inventories at end of the year 3,925.27 2,595.55
29,395.56 21,122.78
32. Purchases of stock-in-trade
(` in million)
Year ended 31 December 2019
Year ended 31 December 2018
Beverages 4,036.59 1,807.07
Others 200.74 135.11
4,237.33 1,942.18
Varun Beverages Limited160

Summary of significant accounting policies and other explanatory information on the Consolidated Financial Statements for the year ended 31 December 2019
33. Changes in inventories of finished goods, work-in-progress and traded goods
(` in million)
Year ended 31 December 2019
Year ended 31 December 2018
As at the beginning of the year
- Finished goods 818.64 648.25
- Intermediate goods 1,269.79 1,098.34
- Work in progress 76.59 72.73
2,165.02 1,819.32
Acquired on acquisition of control over existing associate
- Finished goods 16.46 -
- Work in progress 7.35 -
23.81 -
As at the closing of the year
- Finished goods 1,480.89 818.64
- Intermediate goods 1,855.05 1,269.79
- Work in progress 64.72 76.59
3,400.66 2,165.02
Finished goods used as fixed assets* (226.78) (278.27)
(1,438.61) (623.97)*The Holding Company and a subsidiary manufactures plastic shells at some of their manufacturing facilities. The shells manufactured are used for beverages operations of the Group as property, plant and equipment (under the head ‘Containers’). These containers are also sold to third parties. The cost of manufacturing of plastic shells is being shown here separately with a corresponding debit to property, plant and equipment.
34. Employee benefit expense
(` in million)
Year ended 31 December 2019
Year ended 31 December 2018
Salaries, wages and bonus 7,429.61 5,294.74
Contribution to provident fund and other funds 386.82 301.30
Staff welfare expenses 291.72 233.47
8,108.15 5,829.51
35. Finance costs
(` in million)
Year ended 31 December 2019
Year ended 31 December 2018
Interest on items at amortised cost:
- Term loans 2,610.08 1,445.61
- Working capital facilities 307.71 295.46
- Non-convertible debentures - 113.92
- Financial liabilities 77.18 140.76
- Others 12.56 47.82
Exchange differences regarded as an adjustments to borrowings 64.93 52.68
Other ancillary borrowing costs 23.96 29.38
3,096.42 2,125.63
STATUTORY REPORTSCORPORATE OVERVIEW FINANCIAL STATEMENTS
Annual Report 2019 161

Summary of significant accounting policies and other explanatory information on the Consolidated Financial Statements for the year ended 31 December 2019
36. Depreciation and amortisation expense
(` in million)
Year ended 31 December 2019
Year ended 31 December 2018
Depreciation on property, plant and equipment 4,826.45 3,807.56
amortisation of intangible assets 59.83 43.14
4,886.28 3,850.70
37. Other expenses
(` in million)
Year ended 31 December 2019
Year ended 31 December 2018
Power and fuel 2,790.62 1,947.96
Repairs to plant and equipment 1,195.08 950.44
Repairs to buildings 113.03 85.36
Other repairs 440.94 392.93
Consumption of stores and spares 704.97 487.05
Rent 559.14 315.04
Rates and taxes 92.22 69.99
Insurance 72.26 38.54
Printing and stationery 55.97 42.45
Communication 81.17 75.73
Travelling and conveyance 840.45 603.02
Directors' sitting fee 7.60 3.20
Payment to auditors* 26.53 21.20
Vehicle running and maintenance 190.80 155.97
Lease and hire 178.50 113.15
Security and service charges 341.12 244.69
Legal, professional and consultancy 332.75 161.93
Bank charges 146.67 102.40
advertisement and sales promotion 1,220.77 1,126.51
Meeting and conferences 12.06 18.48
Royalty 105.85 354.95
Freight, octroi and insurance paid (Net) 4,554.66 3,150.87
Delivery vehicle running and maintenance 756.81 553.25
Distribution expenses 116.14 135.18
Loading and unloading charges 338.15 274.75
Donations 0.92 1.73
Loss on disposal of property, plant and equipment (Net) - 189.65
Bad debts and advances written off 4.23 66.86
allowance for expected credit loss and advances 188.09 257.40
Corporate social responsibility expenditure (Refer note 51) 57.50 41.42
Net loss on foreign currency transactions and translations 823.98 600.91
Generalofficeandothermiscellaneous 167.84 133.17
16,516.82 12,716.18
Varun Beverages Limited162

Summary of significant accounting policies and other explanatory information on the Consolidated Financial Statements for the year ended 31 December 2019
*Payment to statutory auditors of the Holding Company
(` in million)
Year ended 31 December 2019
Year ended 31 December 2018
Services rendered for:- audit and reviews 11.40 11.20 - taxation matters 1.24 - - other matters** 0.45 0.46 - reimbursement of expenses 0.71 0.75
13.80 12.41 **Excludes expense of ` 4.25 (31 December 2018: Nil) towards fee related to QIP of equity shares, which has been adjusted with the securities premium as share issue expense.
38. Other comprehensive income (OCI)
The disaggregation of changes to OCI by each type of reserves in equity is shown below:
(` in million)Year ended
31 December 2019Year ended
31 December 2018Retained earningsRe-measurementlossesondefinedbenefitplans (101.41) (16.53)Taximpactonre-measurementlossesondefinedbenefitplans 33.19 7.78 Exchange differences arising on translation of foreign operations 416.26 (234.44)Tax impact on exchange differences arising on translation of foreign operations
(96.97) 54.62
251.07 (188.57)Capital reserveGain from a bargain purchase (Refer note 52a) 344.43 -
344.43 -
39. Composition of the Group
These consolidated financial statements include the respective financial statements of Varun Beverages Limited
(the “Parent Company” or the “Holding Company”), its subsidiaries and the results of operations of its erstwhile
associate as listed below. The principal activity of the Parent Company, subsidiaries and erstwhile associate,
predominantly comprise manufacturing and sale of beverages including its packing material.
Name of the company/entity Country of incorporation and principal place of business
Proportion of ownership interests held by the Group at year end
As at 31 December 2019
As at 31 December 2018
Varun Beverages (Nepal) Private Limited ("VBL Nepal")
Nepal 100% 100%
Varun Beverages Lanka (Private) Limited ("VBL Lanka")
Sri Lanka 100% 100%
Varun Beverages Morocco Sa ("VBL Morocco") Morocco 100% 100%
Ole Spring Bottlers Private Limited ("Ole")* Sri Lanka 100% 100%
Varun Beverages (Zambia) Limited ("VBL Zambia")
Zambia 90% 90%
Varun Beverages (Botswana) (Proprietary) Limited ^
Botswana 90% -
Varun Beverages (Zimbabwe) (Private) Limited ("VBL Zimbabwe")
Zimbabwe 85% 85%
angelica Technologies Private Limited India 47.30% 47.30%
Lunarmech Technologies Private Limited** India 55.00% 35.00%
* subsidiary of VBL Lanka ^subsidiary of VBL Zambia ** subsidiary of angelica Technologies Private Limited
STATUTORY REPORTSCORPORATE OVERVIEW FINANCIAL STATEMENTS
Annual Report 2019 163

Summary of significant accounting policies and other explanatory information on the Consolidated Financial Statements for the year ended 31 December 2019
(all amounts in ` in million, unless otherwise stated)
40. The Group conducts business operations in the Republic of Zimbabwe through its subsidiary VBL Zimbabwe.
During the current year, the Reserve Bank of Zimbabwe (“RBZ”) recomended use of Zimbabwe Dollar (“ZWL” or
“RTGS”) as a local currency for domestic transactions in Zimbabwe w.e.f. February 22, 2019 which was till then
interchangeable with USD at the rate of 1:1 and subsequently vide its notification dated June 25, 2019, banned the
usage of any other currency for domestic transactions other than ZWL. This resulted in a change in the primary
economic environment in which VBL Zimbabwe was operating and accordingly, the functional and presentational
currency was changed from USD to ZWL.
During the quarter ended 31 December 2019, the Zimbabwean economy was classified as hyperinflationary
in accordance with the factors and characteristics of a hyperinflationary economy as described in Ind aS 29
‘Financial Reporting in Hyper-Inflationary Economies’ (“Ind aS 29”). In accordance with Ind aS 29, the historical
cost financial statements of VBL Zimbabwe have been restated for the changes in the general purchasing power
of the functional currency and consequently are stated in terms of the measuring unit current at the year end.
For the purposes of restatement, the management has applied the Consumer Price Index (“CPI”) published by the
Reserve Bank of Zimbabwe. The CPI (in units) was 62.7, 88.8 and 551.6 on January 01, 2018, December 31, 2018
and December 31, 2019 respectively.
The gain on net monetary position calculated in accordance with Ind aS 29 amounted to ` 924.10 which has been
included in ‘Net loss on foreign currency transactions and translations’ under note 37. Further, due to foreign
exchange loss on restatement of monetary assets and liabilities denominated in foreign currency, VBL Zimbabwe
has recorded a net loss on foreign currency transactions and translations of ̀ 834.90 which has also been included
in the said note.
41. Gratuity and other post-employment benefit plans
Parent Company and other components of the Group provide its employees gratuity and compensated absences
benefits in accordance with the respective local statutory requirements and entity’s policies. The following tables
summaries the changes in their present values over the reporting periods, components of expense recognised in
the Consolidated Statement of Profit and Loss, their funded status and amounts recognised in the consolidated
balance sheet:
Gratuity Compensated Absences31 December
201931 December
201831 December
201931 December
2018Changes in present values are as follows: Balance at the beginning of the year 845.43 647.08 416.46 291.72 acquired on business combination (Refer note 52a and 52C)
291.32 63.36 53.13 20.36
Current service cost 157.00 110.93 136.77 120.08 Interest cost 75.00 55.22 34.58 26.81 Benefitssettled (47.20) (44.41) (28.49) (25.54)actuarial (gain)/loss 101.23 16.27 (1.74) (16.99)Foreign exchange translation reserve 0.07 (3.02) (0.49) 0.02 Balance at the end of the year 1,422.85 845.43 610.22 416.46
Varun Beverages Limited164

Summary of significant accounting policies and other explanatory information on the Consolidated Financial Statements for the year ended 31 December 2019
(all amounts in ` in million, unless otherwise stated)
Gratuity Compensated Absences
31 December 2019
31 December 2018
31 December 2019
31 December 2018
Changes in fair value of plan assets are as follows:
Plan assets at the beginning of the year, at fair value
49.16 38.64 - -
Expected income on plan assets 2.89 3.94 - -
actuarial gain/(loss) (0.18) (0.26) - -
Contributions by employer 2.06 31.84 - -
Benefitssettled (24.00) (25.00) - -
Plan assets at the end of the year, at fair value 29.93 49.16 - -
The Holding Company has taken an insurance policy against its liability towards gratuity, the same has been
disclosed as plan assets above.
Gratuity Compensated Absences
31 December 2019
31 December 2018
31 December 2019
31 December 2018
Reconciliation of present value of the obligation and the fair value of the plan assets:
Present value of obligation at the end of the respective year
1,422.85 845.43 610.22 416.46
Plan assets at the end of the respective year (29.93) (49.16) - -
Net liability recognised in the consolidated balance sheet
1,392.92 796.27 610.22 416.46
Gratuity Compensated Absences
31 December 2019
31 December 2018
31 December 2019
31 December 2018
Amount recognised in consolidated statement of profit and loss:
Current service cost 157.00 110.93 136.77 120.08
Interest cost 75.00 55.22 34.58 26.81
Expected income on plan assets (2.89) (3.94) - -
actuarial loss/(gain) - - (1.74) (16.99)
Net cost recognized 229.11 162.21 169.61 129.90
Gratuity Compensated Absences
31 December 2019
31 December 2018
31 December 2019
31 December 2018
Amount recognised in Other Comprehensive Income:
actuarial changes arising from changes in financialassumptions
48.92 (0.47) - -
actuarial changes arising from changes in demographic assumptions
(85.59) - - -
Experience adjustments 137.90 16.74 - -
Return on plan assets 0.18 0.26 - -
Amount recognised (gain)/loss 101.41 16.53 - -
STATUTORY REPORTSCORPORATE OVERVIEW FINANCIAL STATEMENTS
Annual Report 2019 165
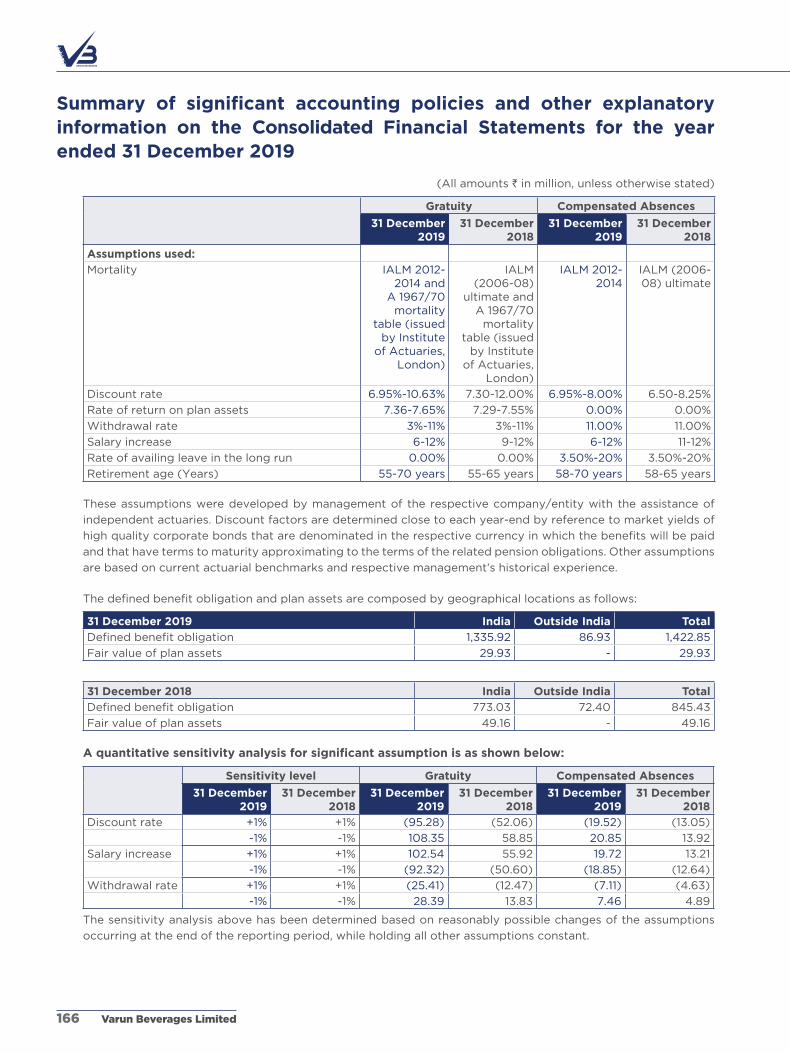
Summary of significant accounting policies and other explanatory information on the Consolidated Financial Statements for the year ended 31 December 2019
(all amounts ` in million, unless otherwise stated)
Gratuity Compensated Absences
31 December 2019
31 December 2018
31 December 2019
31 December 2018
Assumptions used:
Mortality IaLM 2012-2014 and
a 1967/70 mortality
table (issued by Institute
of actuaries, London)
IaLM (2006-08)
ultimate and a 1967/70
mortality table (issued
by Institute of actuaries,
London)
IaLM 2012-2014
IaLM (2006-08) ultimate
Discount rate 6.95%-10.63% 7.30-12.00% 6.95%-8.00% 6.50-8.25%
Rate of return on plan assets 7.36-7.65% 7.29-7.55% 0.00% 0.00%
Withdrawal rate 3%-11% 3%-11% 11.00% 11.00%
Salary increase 6-12% 9-12% 6-12% 11-12%
Rate of availing leave in the long run 0.00% 0.00% 3.50%-20% 3.50%-20%
Retirement age (Years) 55-70 years 55-65 years 58-70 years 58-65 years
These assumptions were developed by management of the respective company/entity with the assistance of
independent actuaries. Discount factors are determined close to each year-end by reference to market yields of
high quality corporate bonds that are denominated in the respective currency in which the benefits will be paid
and that have terms to maturity approximating to the terms of the related pension obligations. Other assumptions
are based on current actuarial benchmarks and respective management’s historical experience.
The defined benefit obligation and plan assets are composed by geographical locations as follows:
31 December 2019 India Outside India Total
Definedbenefitobligation 1,335.92 86.93 1,422.85
Fair value of plan assets 29.93 - 29.93
31 December 2018 India Outside India Total
Definedbenefitobligation 773.03 72.40 845.43
Fair value of plan assets 49.16 - 49.16
A quantitative sensitivity analysis for significant assumption is as shown below:
Sensitivity level Gratuity Compensated Absences
31 December 2019
31 December 2018
31 December 2019
31 December 2018
31 December 2019
31 December 2018
Discount rate +1% +1% (95.28) (52.06) (19.52) (13.05)
-1% -1% 108.35 58.85 20.85 13.92
Salary increase +1% +1% 102.54 55.92 19.72 13.21
-1% -1% (92.32) (50.60) (18.85) (12.64)
Withdrawal rate +1% +1% (25.41) (12.47) (7.11) (4.63)
-1% -1% 28.39 13.83 7.46 4.89
The sensitivity analysis above has been determined based on reasonably possible changes of the assumptions
occurring at the end of the reporting period, while holding all other assumptions constant.
Varun Beverages Limited166
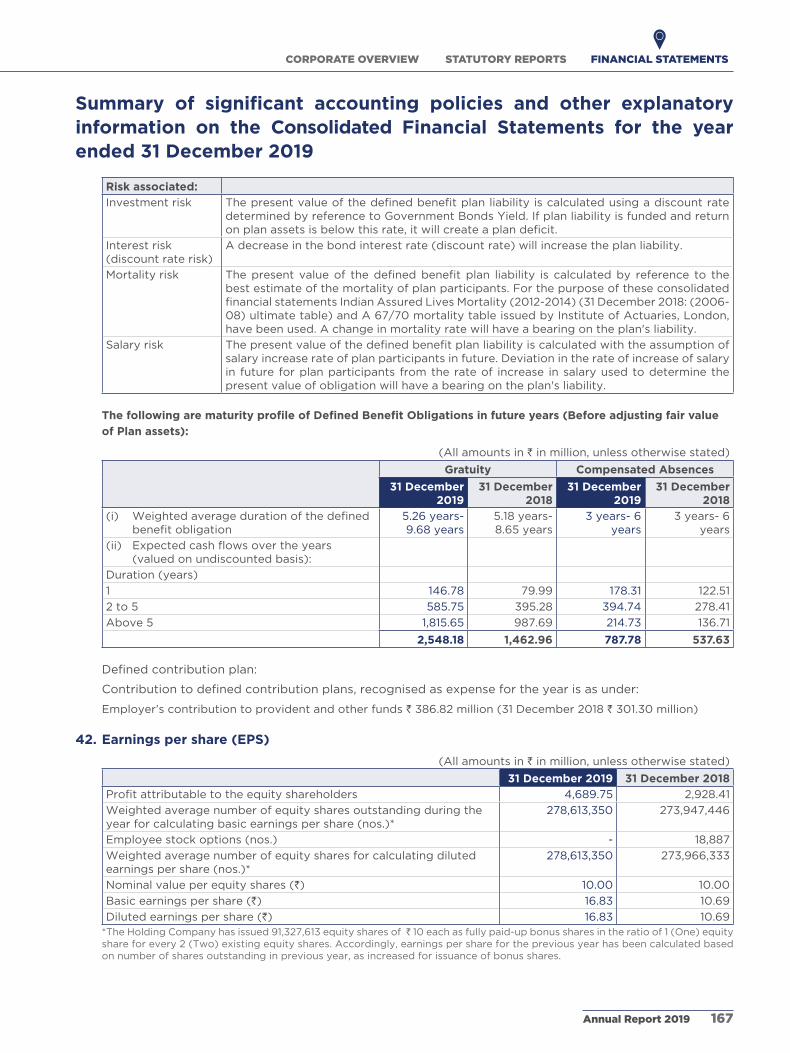
Summary of significant accounting policies and other explanatory information on the Consolidated Financial Statements for the year ended 31 December 2019
Risk associated:
Investment risk Thepresentvalueofthedefinedbenefitplanliabilityiscalculatedusingadiscountratedetermined by reference to Government Bonds Yield. If plan liability is funded and return onplanassetsisbelowthisrate,itwillcreateaplandeficit.
Interest risk (discount rate risk)
a decrease in the bond interest rate (discount rate) will increase the plan liability.
Mortality risk Thepresentvalueof thedefinedbenefitplan liability is calculatedby reference to thebest estimate of the mortality of plan participants. For the purpose of these consolidated financialstatementsIndianAssuredLivesMortality(2012-2014)(31December2018:(2006-08) ultimate table) and a 67/70 mortality table issued by Institute of actuaries, London, have been used. a change in mortality rate will have a bearing on the plan's liability.
Salary risk Thepresentvalueofthedefinedbenefitplanliabilityiscalculatedwiththeassumptionofsalary increase rate of plan participants in future. Deviation in the rate of increase of salary in future for plan participants from the rate of increase in salary used to determine the present value of obligation will have a bearing on the plan's liability.
The following are maturity profile of Defined Benefit Obligations in future years (Before adjusting fair value
of Plan assets):
(all amounts in ` in million, unless otherwise stated)
Gratuity Compensated Absences
31 December 2019
31 December 2018
31 December 2019
31 December 2018
(i) Weightedaveragedurationofthedefinedbenefitobligation
5.26 years- 9.68 years
5.18 years- 8.65 years
3 years- 6 years
3 years- 6 years
(ii) Expectedcashflowsovertheyears(valued on undiscounted basis):
Duration (years)
1 146.78 79.99 178.31 122.51
2 to 5 585.75 395.28 394.74 278.41
above 5 1,815.65 987.69 214.73 136.71
2,548.18 1,462.96 787.78 537.63
Defined contribution plan:
Contribution to defined contribution plans, recognised as expense for the year is as under:
Employer’s contribution to provident and other funds ` 386.82 million (31 December 2018 ` 301.30 million)
42. Earnings per share (EPS)
(all amounts in ` in million, unless otherwise stated)
31 December 2019 31 December 2018
Profitattributabletotheequityshareholders 4,689.75 2,928.41
Weighted average number of equity shares outstanding during the year for calculating basic earnings per share (nos.)*
278,613,350 273,947,446
Employee stock options (nos.) - 18,887
Weighted average number of equity shares for calculating diluted earnings per share (nos.)*
278,613,350 273,966,333
Nominal value per equity shares (`) 10.00 10.00
Basic earnings per share (`) 16.83 10.69
Diluted earnings per share (`) 16.83 10.69 *The Holding Company has issued 91,327,613 equity shares of ̀ 10 each as fully paid-up bonus shares in the ratio of 1 (One) equity share for every 2 (Two) existing equity shares. accordingly, earnings per share for the previous year has been calculated based on number of shares outstanding in previous year, as increased for issuance of bonus shares.
STATUTORY REPORTSCORPORATE OVERVIEW FINANCIAL STATEMENTS
Annual Report 2019 167

Summary of significant accounting policies and other explanatory information on the Consolidated Financial Statements for the year ended 31 December 2019
43. Dividend
(` in million)
31 December 2019 31 December 2018
Interim dividend ` 2.50 per share (31 December 2018: ` 2.50 per share) by Holding company
684.96 456.58
Dividend distribution tax on interim dividend paid by Holding company
91.73 54.71
Final dividend ZMW 2.50 per share (31 December 2018: Nil) by Varun Beverages (Zambia) Limited to its minority shareholders
5.16 -
44. Contingent liabilities and commitments
(` in million)
As at 31 December 2019
As at 31 December 2018
(a) Guarantee issued to third party by subsidiaries for business purposes
73.45 72.30
(b) Claims against the Group not acknowledged as debts (being contested):
(i) Goods and Service Tax 2.16 1.28
(ii) For excise and service tax 211.49 312.51
(iii) For Customs 45.37 45.37
(iv) For sales tax (VaT)/entry tax 1,600.67 1,012.90
(v) For income tax 695.96 361.84
(vi) Others* 410.22 256.88 *excludes pending matters where amount of liability is not ascertainable.
45. Capital commitments
(` in million)
As at 31 December 2019
As at 31 December 2018
Estimated amount of contracts remaining to be executed on capital account and not provided for (net of advances ` 1,155.40 (31 December 2018 ` 918.61)
3,812.87 1,334.85
46. Pursuant to transfer pricing legislations under the Income-tax act, 1961, the Holding Company is required to use
specified methods for computing arm’s length price in relation to specified international and domestic transactions
with its associated enterprises. Further, the Holding Company is required to maintain prescribed information and
documents in relation to such transactions. The appropriate method to be adopted will depend on the nature of
transactions/ class of transactions, class of associated persons, functions performed and other factors, which have
been prescribed. The Holding Company is in the process of updating its transfer pricing documentation for the
current financial year. Based on the preliminary assessment, the management is of the view that the update would
not have a material impact on the tax expense recorded in these consolidated financial statements. accordingly,
these consolidated financial statements do not include any adjustments for the transfer pricing implications, if any.
Varun Beverages Limited168
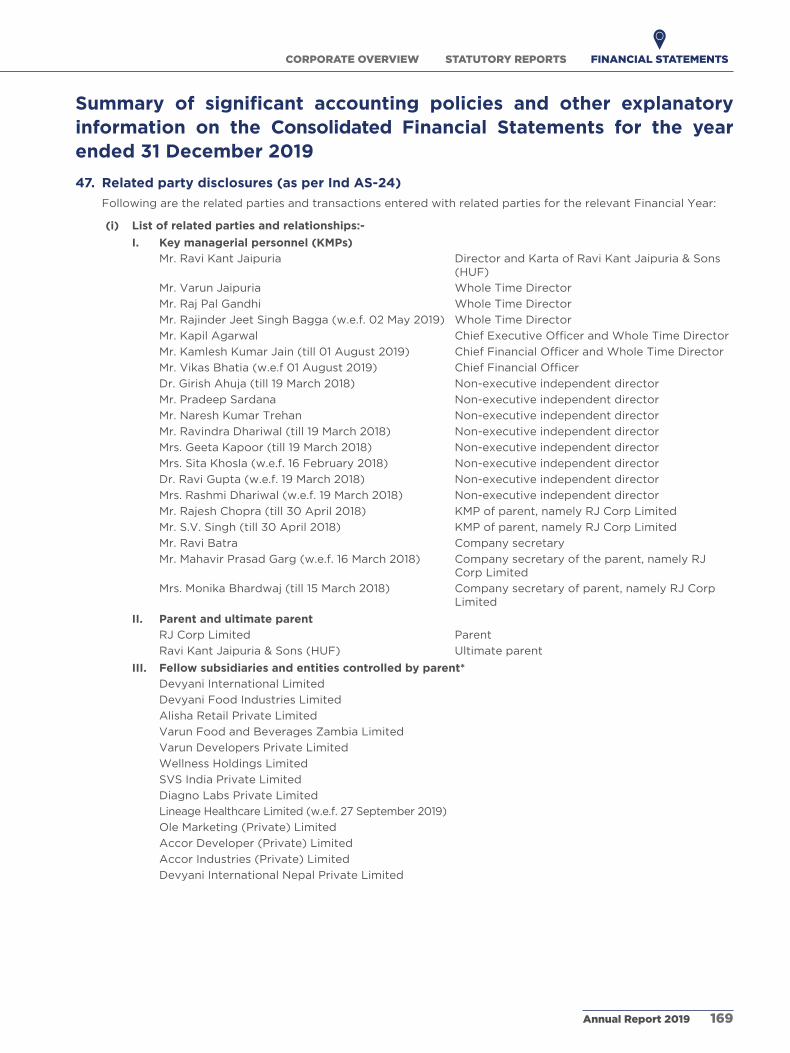
Summary of significant accounting policies and other explanatory information on the Consolidated Financial Statements for the year ended 31 December 2019
47. Related party disclosures (as per Ind AS-24)
Following are the related parties and transactions entered with related parties for the relevant Financial Year:
(i) List of related parties and relationships:-
I. Key managerial personnel (KMPs)
Mr. Ravi Kant Jaipuria Director and Karta of Ravi Kant Jaipuria & Sons (HUF)
Mr. Varun Jaipuria Whole Time Director
Mr. Raj Pal Gandhi Whole Time Director
Mr. Rajinder Jeet Singh Bagga (w.e.f. 02 May 2019) Whole Time Director
Mr. Kapil agarwal ChiefExecutiveOfficerandWholeTimeDirector
Mr. Kamlesh Kumar Jain (till 01 august 2019) ChiefFinancialOfficerandWholeTimeDirector
Mr. Vikas Bhatia (w.e.f 01 august 2019) ChiefFinancialOfficer
Dr. Girish ahuja (till 19 March 2018) Non-executive independent director
Mr. Pradeep Sardana Non-executive independent director
Mr. Naresh Kumar Trehan Non-executive independent director
Mr. Ravindra Dhariwal (till 19 March 2018) Non-executive independent director
Mrs. Geeta Kapoor (till 19 March 2018) Non-executive independent director
Mrs. Sita Khosla (w.e.f. 16 February 2018) Non-executive independent director
Dr. Ravi Gupta (w.e.f. 19 March 2018) Non-executive independent director
Mrs. Rashmi Dhariwal (w.e.f. 19 March 2018) Non-executive independent director
Mr. Rajesh Chopra (till 30 april 2018) KMP of parent, namely RJ Corp Limited
Mr. S.V. Singh (till 30 april 2018) KMP of parent, namely RJ Corp Limited
Mr. Ravi Batra Company secretary
Mr. Mahavir Prasad Garg (w.e.f. 16 March 2018) Company secretary of the parent, namely RJ Corp Limited
Mrs. Monika Bhardwaj (till 15 March 2018) Company secretary of parent, namely RJ Corp Limited
II. Parent and ultimate parent
RJ Corp Limited Parent
Ravi Kant Jaipuria & Sons (HUF) Ultimate parent
III. Fellow subsidiaries and entities controlled by parent*
Devyani International Limited
Devyani Food Industries Limited
alisha Retail Private Limited
Varun Food and Beverages Zambia Limited
Varun Developers Private Limited
Wellness Holdings Limited
SVS India Private Limited
Diagno Labs Private Limited
Lineage Healthcare Limited (w.e.f. 27 September 2019)
Ole Marketing (Private) Limited
accor Developer (Private) Limited
accor Industries (Private) Limited
Devyani International Nepal Private Limited
STATUTORY REPORTSCORPORATE OVERVIEW FINANCIAL STATEMENTS
Annual Report 2019 169

Summary of significant accounting policies and other explanatory information on the Consolidated Financial Statements for the year ended 31 December 2019
IV. Associate (or an associate of any member of the Group)*
Lunarmech Technologies Private Limited (till 03 November 2019)
angelica Technologies Private Limited (till 03 November 2019)
Empire Stock Private Limited
Lineage Healthcare Limited (till 26 September 2019)
V. Relatives of KMPs*
Mrs. Dhara Jaipuria
Mrs. Devyani Jaipuria
Mrs. Shashi Jain (till 01 august 2019)
Mr. Kanishk Jain (till 01 august 2019)
Mrs. Srishti Jain (till 01 august 2019)
Mrs. aastha agarwal
Mr. Ravindra Dhariwal (w.e.f. 19 March 2018)
Mr. Kaustubh agarwal
VI. Entities in which a director or his/her relative is a member/director/Trustee*
Champa Devi Jaipuria Charitable Trust
Mala Jaipuria Foundation (Trust)
SMV Beverages Private Limited
SMV agencies Private Limited
alisha Torrent Closures (India) Private Limited
Nectar Beverages Private Limited
Steel City Beverages Private Limited
Jai Beverages Private Limited
Sagacito Technology Private Limited
Devyani airport Services (Mumbai) Private Limited
VII. Entities which are post employment benefits plans
VBL Employees Gratuity Trust
* With whom the Group had transactions during the current year and previous year.
(ii) Terms and conditions of transactions with related parties
The transactions with related parties are made in the ordinary course of business and on terms equivalent to those that prevail in arm's length transactions. Outstanding balances at the year-end are unsecured and settlementoccursincash.Thisassessmentisundertakeneachfinancialyearthroughexaminingthefinan-cial position of the related party and the market in which the related party operates.
(iii) Transactions with KMPs (Refer note 47a)
(iv) Transactions with other related parties (Refer note 47B)
Varun Beverages Limited170

Summary of significant accounting policies and other explanatory information on the Consolidated Financial Statements for the year ended 31 December 2019
47A. Transactions with KMPs
(` in million)
For year ended 2019 For year ended 2018
I. Remuneration paid
Mr. Varun Jaipuria 31.45 31.22
Mr. Raj Pal Gandhi 48.51 48.68
Mr. Kapil agarwal 57.12 47.48
Mr. Kamlesh Kumar Jain 9.89 12.27
Mr. Rajesh Chopra - 1.61
Mr. Ravi Batra 8.23 7.46
Mr. Rajinder Jeet Singh Bagga 18.44 -
Mr. Mahavir Prasad Garg 3.60 2.85
Mr. Vikas Bhatia 7.72 -
Mrs. Monika Bhardwaj - 0.35
II. Director sitting fees paid
Dr. Girish ahuja - 0.50
Mr. Pradeep Sardana 0.80 0.30
Mr. Ravindra Dhariwal - 0.40
Mrs. Geeta Kapoor - 0.20
Mrs. Sita Khosla 1.90 0.30
Dr. Ravi Gupta 1.90 0.70
Mrs. Rashmi Dhariwal 3.00 0.80
III. Professional charges paid
Mr. Rajesh Chopra - 0.76
IV. Dividend paid
Mr. Varun Jaipuria 126.66 97.94
Mr. Raj Pal Gandhi 1.53 1.02
Mr. Kapil agarwal 1.02 1.02
Mr. Kamlesh Kumar Jain 0.06 0.04
Mr. Rajinder Jeet Singh Bagga 0.32 -
Mr. Vikas Bhatia 0.02 -
Mr. Pradeep Sardana 0.00* 0.00*
V. Defined benefit obligation for KMP
(i) Gratuity
Mr. Varun Jaipuria 25.88 22.55
Mr. Raj Pal Gandhi 40.01 31.07
Mr. Kapil agarwal 48.79 39.83
Mr. Kamlesh Kumar Jain - 8.57
Mr. Ravi Batra 0.73 0.40
Mr. Mahavir Prasad Garg 0.16 0.07
Mr. Rajinder Jeet Singh Bagga 19.56 -
Mr. Vikas Bhatia 0.01 -
(ii) Compensated absences
Mr. Varun Jaipuria 8.22 6.06
Mr. Raj Pal Gandhi 13.02 10.61
STATUTORY REPORTSCORPORATE OVERVIEW FINANCIAL STATEMENTS
Annual Report 2019 171

Summary of significant accounting policies and other explanatory information on the Consolidated Financial Statements for the year ended 31 December 2019
(` in million)
For year ended 2019 For year ended 2018
Mr. Kapil agarwal 15.84 13.78
Mr. Kamlesh Kumar Jain - 2.92
Mr. Ravi Batra 1.16 0.63
Mr. Vikas Bhatia 0.54 -
Mr. Mahavir Prasad Garg 0.35 0.15
Mr. Rajinder Jeet Singh Bagga 7.09 -
VI. Bonus Share issued (Face value of ` 10 each)
Mr. Varun Jaipuria 16.89 -
Mr. Raj Pal Gandhi 2.04 -
Mr. Kapil agarwal 2.03 -
Mr. Kamlesh Kumar Jain 0.09 -
Mr. Pradeep Sardana 0.00* -
Mr. Rajinder Jeet Singh Bagga 0.43 -
VII. Balances (payable)/ receivable outstanding at the end of the year, net
Mr. Varun Jaipuria (1.56) (1.69)
Mr. Raj Pal Gandhi (1.60) (1.58)
Mr. Kapil agarwal (2.12) (2.13)
Mr. Kamlesh Kumar Jain - (1.09)
Mr. Rajinder Jeet Singh Bagga 0.24 -
Mr. Ravi Batra (0.45) (0.94)
Mr. Mahavir Prasad Garg (0.14) (0.21)
Mrs. Sita Khosla (0.09) -
Mr. Vikas Bhatia (0.75) - *Rounded off to Nil.
Varun Beverages Limited172

Su
mm
ary
o
f si
gn
ific
an
t acco
un
tin
g
po
licie
s an
d
oth
er
exp
lan
ato
ry
info
rmati
on
o
n
the
C
on
soli
date
d F
inan
cia
l S
tate
me
nts
fo
r th
e y
ear
en
de
d 3
1 D
ece
mb
er
20
19
(` in
mill
ion
)
De
scri
pti
on
Pare
nt
an
d
ult
imate
pare
nt
Fe
llo
w
sub
sid
iari
es
an
d e
nti
tie
s co
ntr
oll
ed
by
p
are
nt
Ass
ocia
te (
or
an
ass
ocia
te o
f an
y m
em
be
r o
f a
Gro
up
)
Re
lati
ve
s o
f K
MP
En
titi
es
in w
hic
h
a d
ire
cto
r o
r h
is/h
er
rela
tive
is
a m
em
be
r/d
ire
cto
r/tr
ust
ee
En
titi
es
wh
ich
are
po
st
em
plo
ym
en
t b
en
efi
ts p
lan
s
Tota
l
Fo
r ye
ar
en
de
d
Fo
r ye
ar
en
de
d
Fo
r ye
ar
en
de
d
Fo
r ye
ar
en
de
d
Fo
r ye
ar
en
de
d
Fo
r ye
ar
en
de
d
Fo
r ye
ar
en
de
d
20
192
018
20
192
018
20
192
018
20
192
018
20
192
018
20
192
018
20
192
018
Sale
of
go
od
s
- S
MV
Bevera
ges
Pri
vate
Lim
ited
--
--
--
--
75
.48
--
-75
.48
-
- L
un
arm
ech
Tech
no
log
ies
Pri
vate
Lim
ited
--
--
12.1
714
.79
--
--
--
12.1
714
.79
- a
lish
a T
orr
en
t C
losu
res
(In
dia
) P
rivate
Lim
ited
--
--
--
--
5.1
54
.14
--
5.1
54
.14
- N
ecta
r B
evera
ges
Pri
vate
Lim
ited
--
--
--
--
27.0
56
.82
--
27.
05
6.8
2
- Jai B
evera
ges
Pri
vate
Lim
ited
--
--
--
--
49
.53
52.6
4-
-4
9.5
35
2.6
4
- D
evyan
i In
tern
ati
on
al L
imit
ed
--
56
.52
83
.62
--
--
--
--
56
.52
83
.62
- D
evyan
i F
oo
d In
du
stri
es
Lim
ited
--
16.6
225
.73
--
--
--
--
16.6
22
5.7
3
- a
lish
a R
eta
il P
rivate
Lim
ited
--
(0.2
9)
15.9
3-
--
--
--
-(0
.29
)15
.93
- L
ineag
e H
ealt
hcare
Lim
ited
--
0.0
5-
-0
.06
--
--
--
0.0
50
.06
- D
evyan
i a
irp
ort
Serv
ices
(Mu
mb
ai)
Pri
vate
Lim
ited
--
--
--
--
2.6
3-
--
2.6
3-
- D
evyan
i In
tern
ati
on
al N
ep
al P
rivate
Lim
ited
--
6.1
45
.81
--
--
--
--
6.1
45
.81
Sale
of
raw
mate
rials
an
d s
tore
s
- J
ai B
evera
ges
Pri
vate
Lim
ited
-
--
--
--
-1.
50
3.0
3-
-1.
50
3.0
3
- N
ecta
r B
evera
ges
Pri
vate
Lim
ited
-
--
--
--
-11
0.3
60
.12
--
110
.36
0.1
2
- D
evyan
i F
oo
d In
du
stri
es
Lim
ited
-
-3
3.5
40
.19
--
--
--
--
33
.54
0.1
9
- S
MV
Bevera
ges
Pri
vate
Lim
ited
-
--
--
--
-14
4.3
2-
--
144
.32
-
Pu
rch
ase
of
go
od
s
- N
ecta
r B
evera
ges
Pri
vate
Lim
ited
--
--
--
--
48
4.1
51.
25
--
48
4.1
51.
25
- V
aru
n F
oo
d a
nd
Bevera
ges
Zam
bia
Lim
ited
--
0.0
80
.16
--
--
--
--
0.0
80
.16
- S
MV
Bevera
ges
Pri
vate
Lim
ited
-
--
--
--
-278
.63
--
-2
78
.63
-
- D
evyan
i F
oo
d In
du
stri
es
Lim
ited
--
142.0
0-
--
--
--
--
142
.00
-
Pu
rch
ase
of
raw
mate
rials
an
d s
tore
s
- L
un
arm
ech
Tech
no
log
ies
Pri
vate
Lim
ited
--
--
624
.48
75
7.9
3-
--
--
-6
24
.48
75
7.9
3
- D
evyan
i F
oo
d In
du
stri
es
Lim
ited
--
-3
.99
--
--
--
--
-3
.99
- Jai B
evera
ges
Pri
vate
Lim
ited
--
--
--
--
-0
.26
--
-0
.26
- a
lish
a R
eta
il P
rivate
Lim
ited
--
0.0
50
.77
--
--
--
--
0.0
50
.77
Ho
use
ke
ep
ing
an
d c
lean
ing
ch
arg
es
paid
- V
aru
n D
evelo
pers
Pri
vate
Lim
ited
--
12.7
012
.70
--
--
--
--
12.7
012
.70
Pro
mo
tio
nal
ch
arg
es
paid
- a
lish
a R
eta
il P
rivate
Lim
ited
--
1.9
57.4
1-
--
--
--
-1.
95
7.4
1
STATUTORY REPORTSCORPORATE OVERVIEW FINANCIAL STATEMENTS
Annual Report 2019 173

Su
mm
ary
o
f si
gn
ific
an
t acco
un
tin
g
po
licie
s an
d
oth
er
exp
lan
ato
ry
info
rmati
on
o
n
the
C
on
soli
date
d F
inan
cia
l S
tate
me
nts
fo
r th
e y
ear
en
de
d 3
1 D
ece
mb
er
20
19(`
in
mill
ion
)
De
scri
pti
on
Pare
nt
an
d
ult
imate
pare
nt
Fe
llo
w
sub
sid
iari
es
an
d e
nti
tie
s co
ntr
oll
ed
by
p
are
nt
Ass
ocia
te (
or
an
ass
ocia
te o
f an
y m
em
be
r o
f a
Gro
up
)
Re
lati
ve
s o
f K
MP
En
titi
es
in w
hic
h
a d
ire
cto
r o
r h
is/h
er
rela
tive
is
a m
em
be
r/d
ire
cto
r/tr
ust
ee
En
titi
es
wh
ich
are
po
st
em
plo
ym
en
t b
en
efi
ts p
lan
s
Tota
l
Fo
r ye
ar
en
de
d
Fo
r ye
ar
en
de
d
Fo
r ye
ar
en
de
d
Fo
r ye
ar
en
de
d
Fo
r ye
ar
en
de
d
Fo
r ye
ar
en
de
d
Fo
r ye
ar
en
de
d
20
192
018
20
192
018
20
192
018
20
192
018
20
192
018
20
192
018
20
192
018
Inte
rest
re
ce
ive
d/(
paid
)
- V
aru
n D
evelo
pers
Pri
vate
Lim
ited
--
-1.
64
--
--
--
--
-1.
64
- S
MV
Bevera
ges
Pri
vate
Lim
ited
--
--
--
--
(4.0
0)
(3.0
0)
--
(4.0
0)
(3.0
0)
- E
mp
ire S
tock P
rivate
lim
ited
--
--
0.0
0*
--
--
--
-0
.00
*-
Lo
an
re
ce
ive
d
- E
mp
ire S
tock P
rivate
Lim
ited
--
--
2.8
6-
--
--
--
2.8
6-
Lo
an
re
paid
- a
cco
r D
evelo
per
(Pri
vate
) L
imit
ed
--
121.
26
--
--
--
--
-12
1.2
6-
Co
ntr
ibu
tio
n t
o c
orp
ora
te s
ocia
l re
spo
nsi
bil
ity
acti
vit
ies
- M
ala
Jaip
uri
a F
ou
nd
ati
on
--
--
--
--
5.0
0-
--
5.0
0-
- C
ham
pa D
evi Jaip
uri
a C
hari
tab
le T
rust
--
--
--
--
50
.00
36
.50
--
50
.00
36
.50
Pro
fess
ion
al
ch
arg
es
paid
- M
r. R
avin
dra
Dh
ari
wal
--
--
--
5.2
03
.20
--
--
5.2
03
.20
- S
ag
acit
o T
ech
no
log
y P
rivate
Lim
ited
--
--
--
--
4.0
06
.00
--
4.0
06
.00
Tra
ve
llin
g e
xp
en
ses
paid
- W
elln
ess
Ho
ldin
gs
Lim
ited
--
217
.30
116
.43
--
--
--
--
217
.30
116
.43
Co
ntr
ibu
tio
n t
o g
ratu
ity t
rust
- V
BL
Em
plo
yees
Gra
tuit
y T
rust
--
--
--
--
--
2.0
63
1.8
42
.06
31.
84
Div
ide
nd
paid
- R
J C
orp
Lim
ited
20
9.3
313
9.5
6-
--
--
--
--
-2
09
.33
139
.56
- R
avi K
an
t Jaip
uri
a &
So
ns
(HU
F)
146
.95
97.9
7-
--
--
--
--
-14
6.9
59
7.9
7
- M
rs. a
ast
ha a
garw
al
--
--
--
0.2
5-
--
--
0.2
5-
- M
r. K
au
stu
bh
ag
arw
al
--
--
--
0.2
5-
--
--
0.2
5-
- M
r. K
an
ish
k J
ain
--
--
--
0.0
0*
--
--
-0
.00
*-
- M
rs. S
hash
i Jain
--
--
--
0.0
0*
--
--
-0
.00
*-
- M
s. S
rish
ti J
ain
--
--
--
0.0
0*
--
--
-0
.00
*-
- M
rs. D
hara
Jaip
uri
a-
--
--
-0
.01
0.0
1-
--
-0
.01
0.0
1
- M
rs. D
evyan
i Jaip
uri
a-
--
--
-20
.26
0.0
0*
--
--
20
.26
0.0
0*
Varun Beverages Limited174
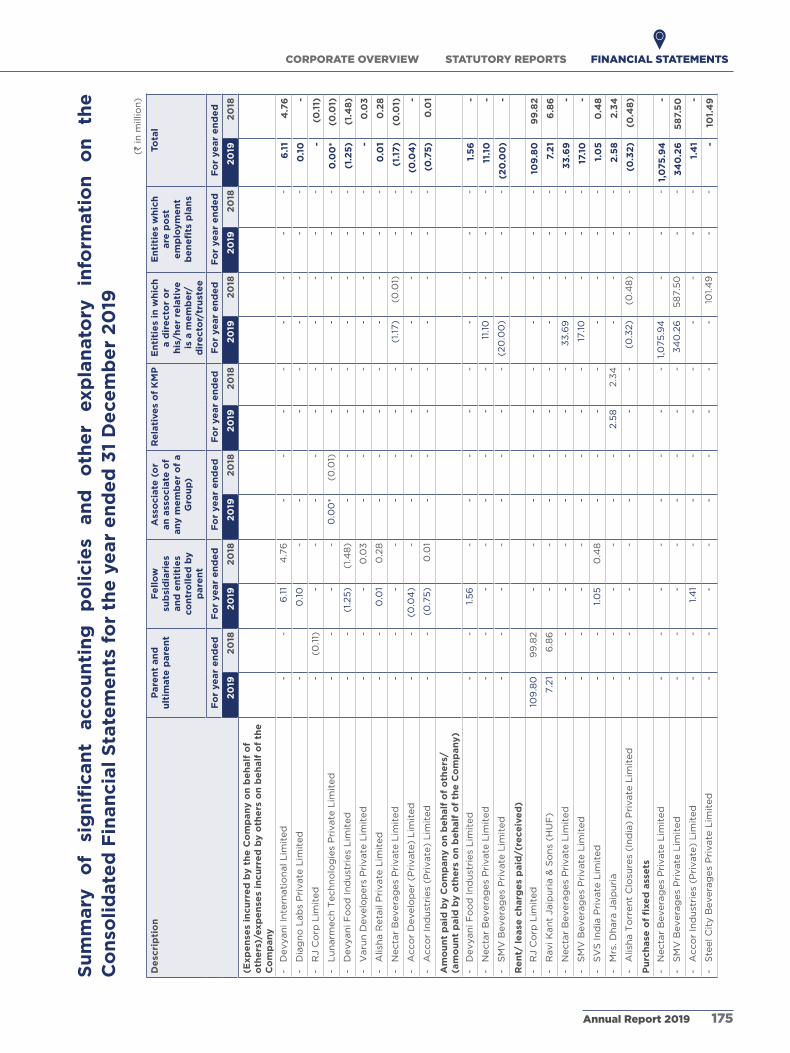
Su
mm
ary
o
f si
gn
ific
an
t acco
un
tin
g
po
licie
s an
d
oth
er
exp
lan
ato
ry
info
rmati
on
o
n
the
C
on
soli
date
d F
inan
cia
l S
tate
me
nts
fo
r th
e y
ear
en
de
d 3
1 D
ece
mb
er
20
19(`
in
mill
ion
)
De
scri
pti
on
Pare
nt
an
d
ult
imate
pare
nt
Fe
llo
w
sub
sid
iari
es
an
d e
nti
tie
s co
ntr
oll
ed
by
p
are
nt
Ass
ocia
te (
or
an
ass
ocia
te o
f an
y m
em
be
r o
f a
Gro
up
)
Re
lati
ve
s o
f K
MP
En
titi
es
in w
hic
h
a d
ire
cto
r o
r h
is/h
er
rela
tive
is
a m
em
be
r/d
ire
cto
r/tr
ust
ee
En
titi
es
wh
ich
are
po
st
em
plo
ym
en
t b
en
efi
ts p
lan
s
Tota
l
Fo
r ye
ar
en
de
d
Fo
r ye
ar
en
de
d
Fo
r ye
ar
en
de
d
Fo
r ye
ar
en
de
d
Fo
r ye
ar
en
de
d
Fo
r ye
ar
en
de
d
Fo
r ye
ar
en
de
d
20
192
018
20
192
018
20
192
018
20
192
018
20
192
018
20
192
018
20
192
018
(Exp
en
ses
incu
rre
d b
y t
he
Co
mp
an
y o
n b
eh
alf
of
oth
ers
)/exp
en
ses
incu
rre
d b
y o
the
rs o
n b
eh
alf
of
the
C
om
pan
y
- D
evyan
i In
tern
ati
on
al L
imit
ed
--
6.1
14
.76
--
--
--
--
6.1
14
.76
- D
iag
no
Lab
s P
rivate
Lim
ited
-0
.10
--
--
--
--
0.1
0-
- R
J C
orp
Lim
ited
-(0
.11)
--
--
--
--
--
-(0
.11)
- L
un
arm
ech
Tech
no
log
ies
Pri
vate
Lim
ited
--
--
0.0
0*
(0.0
1)-
--
--
-0
.00
*(0
.01)
- D
evyan
i F
oo
d In
du
stri
es
Lim
ited
--
(1.2
5)
(1.4
8)
--
--
--
--
(1.2
5)
(1.4
8)
- V
aru
n D
evelo
pers
Pri
vate
Lim
ited
--
-0
.03
--
--
--
--
-0
.03
- a
lish
a R
eta
il P
rivate
Lim
ited
--
0.0
10
.28
--
--
--
--
0.0
10
.28
- N
ecta
r B
evera
ges
Pri
vate
Lim
ited
--
--
--
--
(1.1
7)
(0.0
1)-
-(1
.17
)(0
.01)
- a
cco
r D
evelo
per
(Pri
vate
) L
imit
ed
--
(0.0
4)
--
--
--
--
-(0
.04
)-
- a
cco
r In
du
stri
es
(Pri
vate
) L
imit
ed
--
(0.7
5)
0.0
1-
--
--
--
-(0
.75
)0
.01
Am
ou
nt
paid
by C
om
pan
y o
n b
eh
alf
of
oth
ers
/(a
mo
un
t p
aid
by o
the
rs o
n b
eh
alf
of
the
Co
mp
an
y)
- D
evyan
i F
oo
d In
du
stri
es
Lim
ited
--
1.5
6-
--
--
--
--
1.5
6-
- N
ecta
r B
evera
ges
Pri
vate
Lim
ited
--
--
--
--
11.1
0-
--
11.1
0-
- S
MV
Bevera
ges
Pri
vate
Lim
ited
--
--
--
--
(20
.00
)-
--
(20
.00
)-
Re
nt/
le
ase
ch
arg
es
paid
/(re
ce
ive
d)
- R
J C
orp
Lim
ited
109
.80
99
.82
--
--
--
--
--
109
.80
99
.82
- R
avi K
an
t Jaip
uri
a &
So
ns
(HU
F)
7.2
16
.86
--
--
--
--
--
7.2
16
.86
- N
ecta
r B
evera
ges
Pri
vate
Lim
ited
--
--
--
--
33
.69
--
-3
3.6
9-
- S
MV
Bevera
ges
Pri
vate
Lim
ited
--
--
--
--
17.1
0-
--
17.1
0-
- S
VS
In
dia
Pri
vate
Lim
ited
--
1.0
50
.48
--
--
--
--
1.0
50
.48
- M
rs. D
hara
Jaip
uri
a-
--
--
-2.5
82.3
4-
--
-2
.58
2.3
4
- a
lish
a T
orr
en
t C
losu
res
(In
dia
) P
rivate
Lim
ited
--
--
--
--
(0.3
2)
(0.4
8)
--
(0.3
2)
(0.4
8)
Pu
rch
ase
of
fixe
d a
sse
ts
- N
ecta
r B
evera
ges
Pri
vate
Lim
ited
--
--
--
--
1,0
75
.94
--
-1,
075
.94
-
- S
MV
Bevera
ges
Pri
vate
Lim
ited
--
--
--
--
34
0.2
65
87.5
0-
-3
40
.26
58
7.5
0
- a
cco
r In
du
stri
es
(Pri
vate
) L
imit
ed
--
1.4
1-
--
--
--
--
1.4
1-
- S
teel C
ity B
evera
ges
Pri
vate
Lim
ited
--
--
--
--
-10
1.4
9-
--
101.
49
STATUTORY REPORTSCORPORATE OVERVIEW FINANCIAL STATEMENTS
Annual Report 2019 175

Su
mm
ary
o
f si
gn
ific
an
t acco
un
tin
g
po
licie
s an
d
oth
er
exp
lan
ato
ry
info
rmati
on
o
n
the
C
on
soli
date
d F
inan
cia
l S
tate
me
nts
fo
r th
e y
ear
en
de
d 3
1 D
ece
mb
er
20
19
(` in
mill
ion
)
De
scri
pti
on
Pare
nt
an
d
ult
imate
pare
nt
Fe
llo
w
sub
sid
iari
es
an
d e
nti
tie
s co
ntr
oll
ed
by
p
are
nt
Ass
ocia
te (
or
an
ass
ocia
te o
f an
y m
em
be
r o
f a
Gro
up
)
Re
lati
ve
s o
f K
MP
En
titi
es
in w
hic
h
a d
ire
cto
r o
r h
is/h
er
rela
tive
is
a m
em
be
r/d
ire
cto
r/tr
ust
ee
En
titi
es
wh
ich
are
po
st
em
plo
ym
en
t b
en
efi
ts p
lan
s
Tota
l
Fo
r ye
ar
en
de
d
Fo
r ye
ar
en
de
d
Fo
r ye
ar
en
de
d
Fo
r ye
ar
en
de
d
Fo
r ye
ar
en
de
d
Fo
r ye
ar
en
de
d
Fo
r ye
ar
en
de
d
20
192
018
20
192
018
20
192
018
20
192
018
20
192
018
20
192
018
20
192
018
- V
aru
n D
evelo
pers
Pri
vate
Lim
ited
--
-0
.22
--
--
--
--
-0
.22
Mark
eti
ng
Su
pp
ort
Fe
e
- N
ecta
r B
evera
ges
Pri
vate
Lim
ited
--
--
--
--
98
.90
--
-9
8.9
0-
- S
MV
Bevera
ges
Pri
vate
Lim
ited
--
--
--
--
43
.38
--
-4
3.3
8-
Pu
rch
ase
un
de
r b
usi
ne
ss c
om
bin
ati
on
- S
MV
ag
en
cie
s P
rivate
Lim
ited
--
--
--
--
-5
52.1
3-
--
55
2.1
3
IT i
nfr
ast
ructu
re s
up
po
rt f
ee
- D
evyan
i F
oo
d In
du
stri
es
Lim
ited
--
7.4
15
.94
--
--
--
--
7.4
15
.94
- V
aru
n F
oo
d a
nd
Bevera
ges
Zam
bia
Lim
ited
--
0.6
3-
--
--
--
--
0.6
3-
- D
evyan
i In
tern
ati
on
al L
imit
ed
--
2.8
3-
--
--
--
--
2.8
3-
Ad
van
ce
paid
fo
r acq
uis
itio
n o
f n
ew
te
rrit
ori
es
- S
MV
Bevera
ges
Pri
vate
Lim
ited
--
--
--
--
4.0
0-
--
4.0
0-
Cap
ital
co
mm
itm
en
ts
- S
MV
Bevera
ges
Pri
vate
Lim
ited
--
--
--
--
28
2.0
0-
--
28
2.0
0-
Bo
nu
s S
hare
iss
ue
d (
Face
valu
e o
f `
10 e
ach
)
- R
J C
orp
Lim
ited
279
.11
--
--
--
--
--
-2
79
.11
-
- R
avi K
an
t Jaip
uri
a &
So
ns
(HU
F)
195
.94
--
--
--
--
--
-19
5.9
4-
- M
r. K
an
ish
k J
ain
--
--
--
0.0
1-
--
--
0.0
1-
- M
rs. S
hash
i Jain
--
--
--
0.0
0*
--
--
-0
.00
*-
- M
s. S
rish
ti J
ain
--
--
--
0.0
0*
--
--
-0
.00
*-
- M
rs. D
hara
Jaip
uri
a-
--
--
-0
.01
--
--
-0
.01
-
- M
rs. D
evyan
i Jaip
uri
a-
--
--
-27.0
1-
--
--
27.
01
-
Bala
nce
s o
uts
tan
din
g a
t th
e e
nd
of
the
ye
ar,
ne
t
Re
ce
ivab
le/(
payab
le),
ne
t
- D
evyan
i In
tern
ati
on
al L
imit
ed
--
1.4
2(1
.92)
--
--
--
--
1.4
2(1
.92
)
- R
J C
orp
Lim
ited
34
.82
32.2
7-
--
--
--
--
-3
4.8
23
2.2
7
- M
rs. D
hara
Jaip
uri
a-
--
--
-1.
21
1.12
--
--
1.2
11.
12
- W
elln
ess
Ho
ldin
gs
Lim
ited
--
(31.
00
)(3
.94
)-
--
--
--
-(3
1.0
0)
(3.9
4)
- D
evyan
i In
tern
ati
on
al N
ep
al P
rivate
Lim
ited
--
0.8
00
.57
--
--
--
--
0.8
00
.57
- V
aru
n D
evelo
pers
Pri
vate
Lim
ited
--
40
2.3
94
02.3
4-
--
--
--
-4
02
.39
40
2.3
4
Varun Beverages Limited176

Su
mm
ary
o
f si
gn
ific
an
t acco
un
tin
g
po
licie
s an
d
oth
er
exp
lan
ato
ry
info
rmati
on
o
n
the
C
on
soli
date
d F
inan
cia
l S
tate
me
nts
fo
r th
e y
ear
en
de
d 3
1 D
ece
mb
er
20
19(`
in
mill
ion
)
De
scri
pti
on
Pare
nt
an
d
ult
imate
pare
nt
Fe
llo
w
sub
sid
iari
es
an
d e
nti
tie
s co
ntr
oll
ed
by
p
are
nt
Ass
ocia
te (
or
an
ass
ocia
te o
f an
y m
em
be
r o
f a
Gro
up
)
Re
lati
ve
s o
f K
MP
En
titi
es
in w
hic
h
a d
ire
cto
r o
r h
is/h
er
rela
tive
is
a m
em
be
r/d
ire
cto
r/tr
ust
ee
En
titi
es
wh
ich
are
po
st
em
plo
ym
en
t b
en
efi
ts p
lan
s
Tota
l
Fo
r ye
ar
en
de
d
Fo
r ye
ar
en
de
d
Fo
r ye
ar
en
de
d
Fo
r ye
ar
en
de
d
Fo
r ye
ar
en
de
d
Fo
r ye
ar
en
de
d
Fo
r ye
ar
en
de
d
20
192
018
20
192
018
20
192
018
20
192
018
20
192
018
20
192
018
20
192
018
- a
lish
a R
eta
il P
rivate
Lim
ited
--
-3
.28
--
--
--
--
-3
.28
- L
un
arm
ech
Tech
no
log
ies
Pri
vate
Lim
ited
--
--
-(9
9.7
8)
--
--
--
-(9
9.7
8)
- O
le M
ark
eti
ng
(P
rivate
) L
imit
ed
--
13.9
16
4.4
5-
--
--
--
-13
.91
64
.45
- a
cco
r D
evelo
per
(Pri
vate
) L
imit
ed
--
0.0
6(1
17.1
5)
--
--
--
--
0.0
6(1
17.1
5)
- a
cco
r In
du
stri
es
(Pri
vate
) L
imit
ed
--
-0
.01
--
--
--
--
-0
.01
- S
MV
Bevera
ges
Pri
vate
Lim
ited
--
--
--
--
(12.2
7)
(51.
25
)-
-(1
2.2
7)
(51.
25
)
- a
lish
a T
orr
en
t C
losu
res
(In
dia
) P
rivate
Lim
ited
--
--
--
--
3.2
00
.89
--
3.2
00
.89
- N
ecta
r B
evera
ges
Pri
vate
Lim
ited
--
--
--
--
0.3
00
.36
--
0.3
00
.36
- Jai B
evera
ges
Pri
vate
Lim
ited
--
--
--
--
3.7
50
.63
--
3.7
50
.63
- D
evyan
i a
irp
ort
Serv
ices
(Mu
mb
ai)
Pri
vate
Lim
ited
--
--
--
--
0.5
7-
--
0.5
7-
- D
evyan
i F
oo
d In
du
stri
es
Lim
ited
--
0.0
0*
(0.0
3)
--
--
--
--
0.0
0*
(0.0
3)
- E
mp
ire S
tock P
rivate
Lim
ited
--
--
(2.8
6)
--
--
--
-(2
.86
)-
- V
aru
n F
oo
d a
nd
Bevera
ges
Zam
bia
Lim
ited
--
(56
.10
)(0
.15
)-
--
--
--
-(5
6.1
0)
(0.1
5)
*Ro
un
ded
off
to
Nil.
STATUTORY REPORTSCORPORATE OVERVIEW FINANCIAL STATEMENTS
Annual Report 2019 177

Summary of significant accounting policies and other explanatory information on the Consolidated Financial Statements for the year ended 31 December 2019
48. Leases
A. Operating lease:
The Group has taken various premises and other fixed assets on operating leases. The lease agreements
generally have lock-in-period of 1-9 years and are cancellable at the option of the lessee or lessor thereafter.
Majority of the leases have escalation terms after certain years and are extendable by mutual consent on
expiry of the lease. There are no sub-leases or contingent rents. During the year, lease payments under
operating leases amounting to ` 737.64 million (31 December 2018 ` 428.19 million) have been recognised as
an expense in the Consolidated Statement of Profit and Loss.
Non-cancellable operating lease rentals payable (minimum lease payments) for these leases are as follows:
(` in million)
As at 31 December 2019
As at 31 December 2018
Payable within one year 76.76 37.82
Payablebetweenoneandfiveyears 111.87 53.71
Payableafterfiveyears - -
Total 188.63 91.53
B. Financial lease:
The minimum lease payments and the present value of minimum lease payments in respect of arrangements
classified as finance leases are as below:
(` in million)
As at 31 December 2019 As at 31 December 2018
Minimum lease payment
Future finance charges
Minimum lease payment
Future finance charges
Payable within one year 5.06 0.11 13.78 0.71
Payablebetweenoneandfiveyears - - 4.98 0.11
Payableafterfiveyears - - - -
Total 5.06 0.11 18.76 0.82
Present value of minimum lease payment
4.95 17.94
49. Segment reporting
The business activity of the Group predominantly fall within a single reportable business segment viz manufacturing
and sale of beverages. There are no separate reportable business segments. as part of reporting for geographical
segments, the Group operates in two principal geographical areas of the world, i.e., within India and other countries
(outside India). The aforesaid is in line with review of operating results by the chief operating decision maker.
The following table presents segment non-current assets, revenue from external customers regarding geographical
segments:
(` in million)
As at 31 December 2019
As at 31 December 2018
Non-current assets*
- Within India 55,805.92 37,047.93
- Outside India 10,776.71 11,202.98 * excluding financial instruments, deferred tax assets and post-employment benefit assets.
Varun Beverages Limited178

Summary of significant accounting policies and other explanatory information on the Consolidated Financial Statements for the year ended 31 December 2019
(` in million)
As at 31 December 2019
As at 31 December 2018
Revenue from external customers
- Within India 55,458.22 37,483.45
- Outside India 17,026.36 14,797.82
50. Dues to Micro and Small Enterprises
The dues to micro and small enterprises as required under the Micro, Small and Medium Enterprises Development
act, 2006 to the extent information available with the Holding Company is given below:
(` in million)
Particulars 31 December 2019 31 December 2018
The principal amount and the interest due thereon remaining unpaid to any supplier as at the end of each accounting year
Principal amount due to micro and small enterprises 26.14 2.47
Interest due on above 0.04 0.01
The amount of interest paid by the buyer in terms of section 16 of the MSMED act, 2006 along with the amounts of the payment made to the supplier beyond the appointed day during each accounting year*
128.57 9.23
The amount of interest due and payable for the period of delay in making payment (which have been paid but beyond the appointed dayduringtheyear)butwithoutaddingtheinterestspecifiedunderthe MSMED act, 2006.
- -
The amount of interest accrued and remaining unpaid at the end of each accounting year
1.60 0.91
The amount of further interest remaining due and payable even in the succeeding years, until such date when the interest dues as above are actually paid to the small enterprise for the purpose of disallowance as a deductible expenditure under section 23 of the MSMED act, 2006
1.60 0.91
‘*includes principal amounting to ` 128.57 (31 December 2018: ` 9.23).
51. Details of Corporate Social Responsibility (CSR) expenditure
In accordance with the provisions of section 135 of the Companies act, 2013, the Board of Directors of the Holding
Company had constituted CSR Committee. The details for CSR activities is as follows:
(` in million)
For the year ended 31 December 2019
For the year ended 31 December 2018
(a) Gross amount required to be spent by the Holding Company during the year
57.22 41.42
(b) amount spent during the year on the following
1. Construction / acquisition of any asset - -
2. On purpose other than 1 above 57.50 41.42 1. Refer note 47B for amounts paid to Champa Devi Jaipuria Charitable Trust towards contribution for ‘’Shiksha Kendra’’ for
the education of underpriviledged and to Mala Jaipuria Foundation for the vocational training to underpriviledged and destitute to enhance their skills and talents to secure livelihood.
2. The Group does not carry any provisions for CSR expenses for current year and previous year.
STATUTORY REPORTSCORPORATE OVERVIEW FINANCIAL STATEMENTS
Annual Report 2019 179

Summary of significant accounting policies and other explanatory information on the Consolidated Financial Statements for the year ended 31 December 2019
52. Acquisitions and disposals
Acquisitions during the year ended 31 December 2019:
A. Acquisitions under business combination
The Holding Company acquired franchise rights in South and West regions from PepsiCo India Holdings
Private Limited (“PepsiCo”) for a national bottling, sales and distribution footprint in 7 states and 5 Union
Territories of India along with manufacturing units in Bharuch (Gujarat), Mahul (Maharashtra), Paithan
(Maharashtra), Roha (Maharashtra), Mamandur (Tamil Nadu), Nelamangala (Karnataka), Palakkad (Kerala),
Sangareddy (Telangana) and Sricity (andhra Pradesh) for a total transaction value of ` 18,025onslump
sale basis. The aforesaid transaction value excludes the consideration paid for working capital taken over
amounting to ` 321.64andinvestmentfundamountingto` 2,095.09receivedonacquisitionfromPepsiCo.
The details of the business combination are as follows:
Name of seller PepsiCo India Holdings Private Limited
acquisition date 01 May 2019
Recognised amounts of identifiable net assets
(` in million)Particulars Amount Property, plant and equipment 15,908.42
Other intangible assets (Franchise rights) 235.10
Deferred tax assets 130.81
Total non-current assets (a) 16,274.33
Non-current liabilities recognised
Employeebenefitspayable(includedundertheheadprovisions) (341.53)
Total non-current liabilities (b) (341.53)
Net current assets acquired
Othercurrentfinancialliabilities
- Security deposits from distributors (252.05)
- Employee related payables (32.82)
Other current liabilities (399.59)
Other current assets
- Inventories 1,076.68
- Security deposits 213.93
- Others 57.03
Net current assets (c) 663.18
Identifiable net assets (d = a+b+c) 16,595.98
amount paid (e) 16,251.55
Goodwill/(Gain from a bargain purchase) (e-d) (344.43)
Gain from a bargain purchase
The above business combination has resulted in a bargain purchase due to the Company’s manufacturing
capabilities/distribution network and PepsiCo’s focus on its core activities of research, brand building and
market penetration.
Varun Beverages Limited180

Summary of significant accounting policies and other explanatory information on the Consolidated Financial Statements for the year ended 31 December 2019
B. Asset acquisitions
(i) On 14 February 2019, the Holding Company has acquired PepsiCo’s previously franchised rights for a
total purchase consideration of ` 150.00 from SMV Beverages Private Limited and Nectar Beverages
Private Limited (together referred as ‘SMV Group’ to sell and distribute PepsiCo’s beverage brands in
13 districts in State of Karnataka, 14 districts in State of Maharashtra and 3 districts in State of Madhya
Pradesh.
(ii) On 03 October 2019, the Holding Company has acquired a manufacturing unit at Dharwad, Karnataka
along with certain assets for a total purchase consideration of ` 747.27 from Nectar Beverages Private
Limited.
(iii) On 30 October 2019, the Holding Company has acquired a manufacturing unit at Tirunelveli, Tamil
Nadu along with certain assets for a total purchase consideration of ` 200.00 from Prathishta Business
Solutions Private Limited.
C. Acquisition on control over existing associate
The Holding Company, on 04 November 2019 has acquired board control in its associate, angelica
Technologies Private Limited. Consequently, both angelica Technologies Private Limited and Lunarmech
Technologies Private Limited (subsidiary of angelica Technologies Private Limited) have become subsidiaries
of the Group w.e.f. 04 November 2019.
(` in million)
Particulars Amount
Carrying amount of investment in associates as on 31 December 2018 112.43
Add:Shareofprofitinassociatestill03November2019(Refernote61) 43.61
Carrying amount of investment in associates as on 03 November 2019 (a) 156.04
Fair value of investment in associates as on 03 November 2019 (B) 314.15
Gain on acquisition of control over existing associate, recognised in Consolidated Statement of Profit and Loss (C= (B-A))
158.11
Recognisedamountsofidentifiablenetassetsason03November2019:
Property, plant and equipment* 188.45
Othernon-currentfinancialassets 8.35
Other non-current assets 19.56
Total non-current assets (a) 216.36
Non-current liabilities recognised
Deferred tax liabilities (15.93)
Employeebenefitspayable(includedunderheadprovisions) (3.15)
Total non-current liabilities (b) (19.08)
Net current assets acquired
Othercurrentfinancialliabilities (79.83)
Other current liabilities (43.84)
Other current assets
- Inventories 108.95
- Trade Receivable 174.78
- Others 81.12
Net current assets (c) 241.18
Identifiable net assets (d = a+b+c) 438.46
STATUTORY REPORTSCORPORATE OVERVIEW FINANCIAL STATEMENTS
Annual Report 2019 181

Summary of significant accounting policies and other explanatory information on the Consolidated Financial Statements for the year ended 31 December 2019
(` in million)
Particulars Amount
Calculation of Goodwill:-
Shareofidentifiablenetassetsattributabletonon-controllinginterest 196.83
Fair value of previously held interest in existing associate on 03 November 2019 314.15
Consideration transferred in acquisition of 20% shareholding in Lunarmech Technologies Private Limited
150.38
661.36
Less:Netidentifiableassetsacquiredandliablitiesassumed (438.46)
Goodwill on acquisition of control over existing associate 222.90 *Gross carrying amount of Property, plant and equipment acquired and its accumulated depreciation and impairment amounted to ` 519.04 and ` 330.59 respectively
Acquititions and disposals during the year ended 31 December 2018:
D. Acquisitions under business combination
The Holding Company acquired PepsiCo’s previously franchised territory in the of State of Jharkhand in India
along with manufacturing unit at Jamshedpur for a total purchase consideration of ` 552.13 on a slump sale basis,
excluding net payable of ` 60.33 on account of net working capital adjustment taken over as part of business.
The details of the business combination are as follows:
(` in million)
Particulars Jharkhand
Name of acquiree SMV agencies Private Limited
acquisition date 23 March 2018
Non-current assets recognised
Property, plant and equipment 211.79
Other intangible assets (Franchise rights) 424.73
Deferred tax assets 11.20
Total non-current assets (a) 647.72
Non-current liabilities recognised
Employeebenefitspayable (32.87)
Security deposits from distributors (62.72)
Total non-current liabilities (b) (95.59)
Net current liabilities acquired
Other current liabilities (78.88)
Other current assets 18.55
Net current liabilities (c) (60.33)
Identifiable net assets (d = a+b+c) 491.80
E. Assets acquisitions
(i) On 11 January 2018, the Holding Company has acquired PepsiCo’s previously franchised territory in the
State of Chhattisgarh along with certain property, plant and equipment and other intangible assets for
a total purchase consideration of ` 150.00 from SMV Beverages Private Limited.
(ii) On 17 January 2018, PepsiCo has transferred franchise territory in the State of Bihar to the Holding
Company. Subsequently on 12 December 2018, the Holding Company has paid an amount of ` 450.00
to Lumbini Beverages Private Limited for acquiring certain property, plant and equipment and other
intangible assets for the State of Bihar.
(iii) On 18 January 2018, the Holding Company has acquired a manufacturing unit at Cuttack, Odisha along
with certain assets for a total purchase consideration of ` 437.50 from SMV Beverages Private Limited.
Varun Beverages Limited182

Summary of significant accounting policies and other explanatory information on the Consolidated Financial Statements for the year ended 31 December 2019
(iv) On 05 april 2018, the Holding Company has acquired a manufacturing unit at Jamshedpur, Jharkhand
along with certain assets for a total purchase consideration of ` 101.49 from Steel City Beverages Private
Limited.
F. Disposal of 41% stake in Varun Beverages Mozambique Limitada
During the year ended 31 December 2018, the Company sold its 10% stake in Varun Beverages Mozambique
Limitada to other shareholder for a consideration of ` 0.03.
53. The Holding Company follows calendar year as its financial year as approved by the Company Law Board, New Delhi.
54. Share-based payments
Description of share based payments arrangements
During the year ended 31 December 2013, the Holding Company granted stock options to certain employees
of the Holding Company and its subsidiaries. The Holding Company has the following share-based payment
arrangements for employees.
A. Employee Stock Option Plan 2013 (ESOP 2013)
The ESOP 2013 (‘the Plan’) was approved by the Board of Directors and the shareholders on 13 May 2013 and
further amended by Board of Directors on 01 December 2015. The plan entitles key managerial personnel
and employees of the Holding Company and its subsidiaries to purchase shares in the Holding Company at
the stipulated exercise price, subject to compliance with vesting conditions. Stock options can be settled by
issue of equity shares. as per the Plan, holders of vested options are entitled to purchase one equity share
for every option at an exercise price of ` 149.51, which is 1.14 % above the stock price at the date of grant, i.e.,
13 May 2013.
The expense recognised for employee services received during the respective years is ` Nil.
Movements during the year
The following table illustrates the number and weighted average exercise prices (WaEP) of, and changes in,
share options during the year:
Particulars 31 December 2019 31 December 2018
Number WAEP Number WAEP
Outstanding at the beginning of the year 23,285 149.51 78,285 149.51
Options exercised during the year (13,285) 149.51 (55,000) 149.51
Options lapsed during the year (10,000) 149.51 - -
Outstanding at the end of the year - 23,285
Exercisable at the end of the year - - 23,285 -
The fair values of options granted under new plan were determined using a variation of the binomial option
pricing model that takes into account factors specific to the share incentive plans, such as the vesting period.
The following principal assumptions were used in the valuation:
STATUTORY REPORTSCORPORATE OVERVIEW FINANCIAL STATEMENTS
Annual Report 2019 183

Summary of significant accounting policies and other explanatory information on the Consolidated Financial Statements for the year ended 31 December 2019
Options vested and exercised
Options vested and unexercised
Number of options 2,006,550 668,850
Fair value on grant date (`) 65.92 66.44
Share price at grant date (`) 147.83 147.83
Exercise price (`) 149.51 149.51
Expected volatility* 16.63% 16.63%
Expected life 7.56 years 7.64 years
Expected dividends 0% 0%
Risk-free interest rate (based on government bonds) 7.53% 7.53%*The measure of volatility has been calculated based on the average volatility of closing market price of the BSE 500 during the period 01 January 2013 to 31 December 2013.
Particulars of Scheme
Name of scheme Employee Stock Option Plan 2013
Vesting conditions 668,850 options on the date of grant (‘First vesting’)
668,850optionsonfirstdayofJanuaryofthecalendaryearfollowingthefirstvesting (‘Second vesting’)
668,850optionsonfirstdayofJanuaryofthecalendaryearfollowingthesecond vesting (‘Third vesting’)
668,850optionsonfirstdayofJanuaryofthecalendaryearfollowingthethirdvesting (‘Fourth vesting’)
Notwithstanding any other clause of this Plan, no vesting shall occur until 01 December 2015 or fourth vesting, whichever is earlier
Exercise period Stock options can be exercised within a period of 5 years from the date of vesting.
Number of share options
2,675,400
Exercise price 149.51
Method of settlement Equity
Fair value on the grant date
Options vested: ` 65.92Options to be vested : ` 66.44
Remaining life as on 31 December 2019
-
Remaining life as on 31 December 2018
1.94 years
The following share options were exercised during the current year:
Options series Number exercised
Share price at exercise date
Exercise date
Granted on 13 May 2013 ESOP 2013 9,585 ` 515.47 18 February 2019
Granted on 13 May 2013 ESOP 2013 3,700 ` 630.40 03 June 2019
The following share options were exercised during the previous year:
Options series Number exercised
Share price at exercise date
Exercise date
Granted on 13 May 2013 ESOP 2013 12,700 ` 717.10 24 January 2018
Granted on 13 May 2013 ESOP 2013 15,000 ` 608.15 20 March 2018
Granted on 13 May 2013 ESOP 2013 19,500 ` 688.25 26 July 2018
Granted on 13 May 2013 ESOP 2013 7,800 ` 765.80 22 November 2018
Varun Beverages Limited184
Summary of significant accounting policies and other explanatory information on the Consolidated Financial Statements for the year ended 31 December 2019
B. Employee Stock Option Plan 2016 (“ESOP 2016”)
The ESOS 2016 (“the Scheme”) was approved by the Board of Directors and the shareholders on 27 april 2016.
The Scheme entitles key managerial personnel and employees of the Holding Company and its subsidiaries
to purchase shares in the Holding Company at the stipulated exercise price, subject to compliance with
vesting conditions. Stock options can be settled by issue of equity shares. No options under this Scheme
have been granted in the current or previous years.
55. Financial instruments risk
Financials risk management objectives and policies
The Group is exposed to various risks in relation to financial instruments. The main types of financial risks are
market risk, credit risk and liquidity risk.
The respective management of the Holding Company and other companies/entities comprising the Group
monitors and manages the financial risks relating to the operations of the respective entity/company on a
continuous basis. The Group’s risk management is coordinated at head office, in close cooperation with the
management of respective entity/company, and focuses on actively securing the short to medium-term cash
flows and simultaneously minimising the exposure to volatile financial markets. Long-term financial investments
are managed to generate lasting returns.
The Group does not engage in the trading of financial assets for speculative purposes. The most significant
financial risks to which the Group is exposed are described below.
55.1 Market risk analysis
Market risk is the risk that the fair value of future cash flows of a financial instrument will fluctuate because
of changes in market prices. The Group is exposed to market risk through its use of financial instruments
and specifically to currency risk and interest rate risk, which result from its operating, investing and financing
activities. Contracts to hedge exposures in foreign currencies, interest rates etc. are entered into wherever
considered necessary by the management.
Foreign currency risk
Foreign currency risk is the risk that the fair value or future cash flows of an exposure will fluctuate because
of changes in foreign exchange rates. The functional currency of the Holding Company is Indian Rupees
(‘INR’ or ‘`’). Most of the transactions of the Holding Company and other entities/companies are carried
out in the respective local currency. Exposures to currency exchange rates mainly arise from the overseas
operations and external commercial borrowings etc., which are primarily denominated in US Dollar (“USD”),
Euro, Singapore Dollar (“SGD”), Pound Sterling (“GBP”), Sri Lanka Rupee (“LKR”), Moroccan Dirham (“MaD”),
Nepalese Rupee (“NPR”), Zambian Kwacha (“ZMW”) and Zimbabwe Dollar (“ZWL”).
To mitigate its exposure to foreign currency risk, the Group continuously monitors non-INR cash flows and
hedging contracts are entered into wherever considered necessary.
The carrying amounts of the Group’s foreign currency denominated monetary items are restated at the end
of each reporting period. Foreign currency denominated financial assets and liabilities which expose the
Group to currency risk are as follows:
STATUTORY REPORTSCORPORATE OVERVIEW FINANCIAL STATEMENTS
Annual Report 2019 185

Summary of significant accounting policies and other explanatory information on the Consolidated Financial Statements for the year ended 31 December 2019
(in million)
USD GBP Euro SGD LKR MAD NPR ZMW ZML*
31 December 2019
Financial assets
(i) Trade receivables 0.28 - - - 549.85 69.61 96.81 10.55 21.66
(ii) Loans - - - - - 1.92 - 0.26 -
(iii) Others 2.05 - 2.24 - 2.14 0.01 27.09 0.86 0.09
(iv) Cash and cash equivalents 0.74 - - - 123.76 2.99 779.10 10.54 75.03
(v) Other bank balances - - - - 6.41 - 96.79 - 62.94
Total financial assets 3.07 - 2.24 - 682.16 74.53 999.79 22.21 159.72
Financial liabilities
(i) Borrowings - - - 33.13 569.49 22.75 167.88 12.13 149.81
(ii) Trade payables 6.73 - 0.12 - 208.37 101.77 338.64 48.66 84.75
(iii) Otherfinancialliabilities - - 0.30 0.11 203.06 13.44 748.51 36.50 216.28
Total financial liabilities 6.73 - 0.42 33.24 980.92 137.96 1,255.03 97.29 450.84
31 December 2018
Financial assets
(i) Trade receivables 2.63 - - - 889.75 43.07 70.04 13.44 -
(ii) Loans - - - - - 1.91 - 0.27 -
(iii) Others 1.06 - 0.36 - - 0.01 20.82 5.25 -
(iv) Cash and cash equivalents 18.50 - - - 109.30 3.34 26.77 7.36 -
(v) Other bank balances - - - - 4.01 - 222.67 - -
Total financial assets 22.19 - 0.36 - 1,003.06 48.33 340.30 26.32 -
Financial liabilities
(i) Borrowings 18.07 - 5.35 33.13 647.61 39.24 248.39 18.42 -
(ii) Trade payables 13.73 0.01 1.13 - 273.32 70.79 334.05 58.64 -
(iii) Otherfinancialliabilities 7.98 - - 0.15 188.27 28.91 890.78 31.91 -
Total financial liabilities 39.78 0.01 6.48 33.28 1,109.20 138.94 1,473.22 108.97 -* Refer note 40 for change in functional currency in Varun Beverages (Zimbabwe) (Private) Limited.
The foreign currency sensitivity of profit and equity in regards to the Group’s financial assets and financial
liabilities considering ‘all other things being equal’ and ignoring the impact of taxation. It assumes a +/- 1%
change of the respective countries exchange rates (i.e. local currency to foreign currency) for the year ended
at 31 December 2019 (31 December 2018: +/-1%). These are the sensitivity rates used when reporting foreign
currency exposures internally to the key management personnel and represents respective management’s
assessment of the reasonably possible changes in the foreign exchange rates. The sensitivity analysis includes
only outstanding foreign currency denominated monetary items at end of each period reported upon. a
positive number indicates an increase in profit or equity and vice-versa.
If the INR had strengthened/weakened against respective foreign currency by 1% (31 December 2018: 1%),
then impact of such change on profit for the year and equity as at 31 December 2019 and 31 December 2018
will be as below:
Profit for the year Equity
+1% -1% +1% -1%
31 December 2019 42.32 (42.32) 42.32 (42.32)
31 December 2018 52.87 (52.87) 52.87 (52.87)
Varun Beverages Limited186

Summary of significant accounting policies and other explanatory information on the Consolidated Financial Statements for the year ended 31 December 2019
Exposures to foreign exchange rates vary during the year depending on the volume of the overseas
transactions. Nonetheless, the analysis above is considered to be representative of the Group’s exposure to
currency risk.
Interest rate risk
Interest rate risk is the risk that the fair value or future cash flows of a financial instrument will fluctuate
because of changes in market interest rates. The Group’s policy is to minimise interest rate cash flow risk
exposures on long-term financing. The Group is exposed to changes in market interest rates as some of the
bank and other borrowings are at variable interest rates.
The following table illustrates the sensitivity of profit and equity to a reasonably possible change in interest
rates of +/- 1% (31 December 2018: +/- 1%). These changes are considered to be reasonably possible based
on management’s assessment. The calculations are based on a change in the average market interest rate for
each period, and the financial instruments held at each reporting date that are sensitive to changes in interest
rates. all other variables are held constant.
Profit for the year Equity
+1% -1% +1% -1%
31 December 2019 (231.87) 231.87 (231.87) 231.87
31 December 2018 (213.84) 213.84 (213.84) 213.84
Commodity price risk
The Group is affected by the price volatility of certain commodities. Its operating activities require the
ongoing purchase of sugar and pet chips and therefore require a continuous supply. In view of volatility of
price of sugar and pet chips, the Group also executes various advance purchase contracts.
Commodity price sensitivity
The following tables shows the effect of price change in sugar and pet chips
(` in million)
Particulars Change in yearly average price
Effect on profit before tax
Effect on equity
31 December 2019
Sugar +1% -1% (82.56) 82.56 (82.56) 82.56
Pet chips +1% -1% (46.67) 46.67 (46.67) 46.67
(` in million)
Particulars Change in yearly average price
Effect on profit before tax
Effect on equity
31 December 2018
Sugar +1% -1% (62.74) 62.74 (62.74) 62.74
Pet chips +1% -1% (32.87) 32.87 (32.87) 32.87
Other price sensitivity
The Group is not exposed to any listed equity or listed debt price risk as it does not hold any investments in
listed entities.
STATUTORY REPORTSCORPORATE OVERVIEW FINANCIAL STATEMENTS
Annual Report 2019 187

Summary of significant accounting policies and other explanatory information on the Consolidated Financial Statements for the year ended 31 December 2019
55.2 Credit risk analysis
Credit risk is the risk that a counterparty fails to discharge an obligation to the Group. The Group is operating
through a network of distributors and other distribution partners based at different locations. The Group is
exposed to this risk for various financial instruments, for example loans granted, receivables from customers,
deposits placed etc. The Group’s maximum exposure to credit risk is limited to the carrying amount of
financial assets recognised at end of each reporting period, as summarised below:
(` in million)
As at 31 December 2019
As at 31 December 2018
Classesoffinancialassets-carryingamounts:
Investments (non-current) 0.01 0.01
Loans (non-current and current) 514.85 216.45
Othersnon-currentfinancialassets 8.90 8.34
Trade receivables 1,725.55 1,280.25
Cash and cash equivalents 1,379.68 429.36
Bankbalances(otherthanthoseclassifiedascashandcashequivalents above)
331.09 505.44
Otherscurrentfinancialassets 2,189.83 1,404.78
6,149.91 3,844.63
The Group continuously monitors receivables and defaults of customers and other counterparties, and
incorporates this information into its credit risk controls. appropriate security deposits are kept against the
supplies to customers and balances are reconciled at regular intervals. The Group’s policy is to deal only with
creditworthy counterparties.
In respect of trade and other receivables, the Group is not exposed to any significant credit risk exposure
to any single counterparty. Trade receivables consist of a large number of customers of various scales and
in different geographical areas. Based on historical information about customer default rates, management
considers the credit quality of trade receivables. In case the receivables are not recovered even after regular
follow up, measures are taken to stop further supplies to the concerned customer. The expected credit loss
is based on the five years historically observed default rates over the expected life of the trade receivables
and is adjusted for forward looking estimates.
Movement in expected credit loss allowance on trade receivables and capital advances:-
(` in million)
As at 31 December 2019
As at 31 December 2018
Balance as at beginning of the year 653.95 400.14
Loss allowance measured at lifetime expected credit loss 148.42 257.40
Foreign currency translation reserve (6.99) (3.59)
Balance at the end of the year 795.38 653.95
The credit risk for cash and cash equivalents, bank deposits including interest accrued thereon and
Government grant receivables is considered negligible, since the counterparties are reputable banks with
high quality external credit ratings and State Government bodies.
In respect of financial guarantees provided by the Group, the maximum exposure to which the Group is
exposed to is the maximum amount which it would have to pay if the guarantee is called upon. Based on the
expectation at the end of each reporting period, the Group considers that it is more likely than not that such
an amount will not be payable under the guarantees provided.
Varun Beverages Limited188
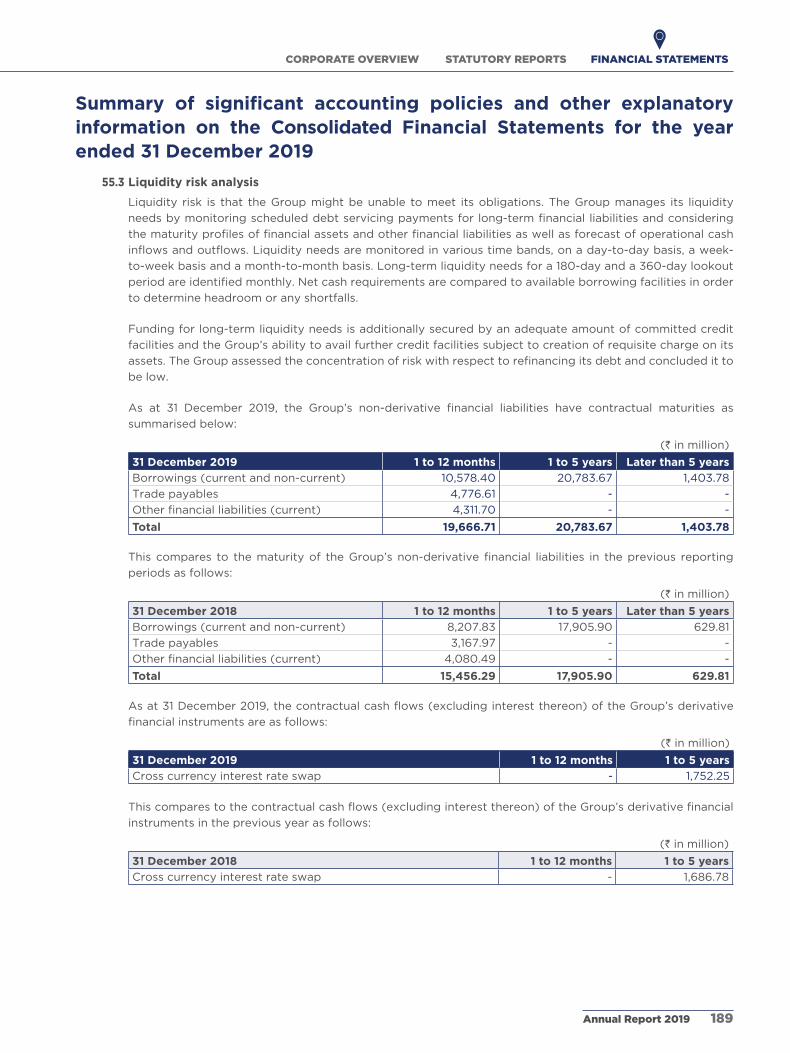
Summary of significant accounting policies and other explanatory information on the Consolidated Financial Statements for the year ended 31 December 2019
55.3 Liquidity risk analysis
Liquidity risk is that the Group might be unable to meet its obligations. The Group manages its liquidity
needs by monitoring scheduled debt servicing payments for long-term financial liabilities and considering
the maturity profiles of financial assets and other financial liabilities as well as forecast of operational cash
inflows and outflows. Liquidity needs are monitored in various time bands, on a day-to-day basis, a week-
to-week basis and a month-to-month basis. Long-term liquidity needs for a 180-day and a 360-day lookout
period are identified monthly. Net cash requirements are compared to available borrowing facilities in order
to determine headroom or any shortfalls.
Funding for long-term liquidity needs is additionally secured by an adequate amount of committed credit
facilities and the Group’s ability to avail further credit facilities subject to creation of requisite charge on its
assets. The Group assessed the concentration of risk with respect to refinancing its debt and concluded it to
be low.
as at 31 December 2019, the Group’s non-derivative financial liabilities have contractual maturities as
summarised below:
(` in million)
31 December 2019 1 to 12 months 1 to 5 years Later than 5 years
Borrowings (current and non-current) 10,578.40 20,783.67 1,403.78
Trade payables 4,776.61 - -
Otherfinancialliabilities(current) 4,311.70 - -
Total 19,666.71 20,783.67 1,403.78
This compares to the maturity of the Group’s non-derivative financial liabilities in the previous reporting
periods as follows:
(` in million)
31 December 2018 1 to 12 months 1 to 5 years Later than 5 years
Borrowings (current and non-current) 8,207.83 17,905.90 629.81
Trade payables 3,167.97 - -
Otherfinancialliabilities(current) 4,080.49 - -
Total 15,456.29 17,905.90 629.81
as at 31 December 2019, the contractual cash flows (excluding interest thereon) of the Group’s derivative
financial instruments are as follows:
(` in million)
31 December 2019 1 to 12 months 1 to 5 years
Cross currency interest rate swap - 1,752.25
This compares to the contractual cash flows (excluding interest thereon) of the Group’s derivative financial
instruments in the previous year as follows:
(` in million)
31 December 2018 1 to 12 months 1 to 5 years
Cross currency interest rate swap - 1,686.78
STATUTORY REPORTSCORPORATE OVERVIEW FINANCIAL STATEMENTS
Annual Report 2019 189

Summary of significant accounting policies and other explanatory information on the Consolidated Financial Statements for the year ended 31 December 2019
56. Fair value measurements
Financial instruments by categories
The carrying values and fair values of financial instruments by categories are as follows:
(` in million)
Particulars Carrying value Fair value
31 December 2019
31 December 2018
31 December 2019
31 December 2018
Financial assets
Fair value through profit and loss ('FVTPL')(i) Non-currentfinancialassets
(i) Investment (non-current) 0.01 0.01 0.01 0.01
Amortised cost (i) Non-currentfinancialassets
(a) Loans 445.48 200.92 445.48 200.92
(b) Others 8.90 8.34 8.90 8.34
(ii) Currentfinancialassets
(a) Trade receivables 1,725.55 1,280.25 1,725.55 1,280.25
(b) Cash and cash equivalents 1,379.68 429.36 1,379.68 429.36
(c) Bank balances other than above 331.09 505.44 331.09 505.44
(d) Loans 69.37 15.53 69.37 15.53
(e) Others 2,189.83 1,404.78 2,189.83 1,404.78
Total 6,149.91 3,844.63 6,149.91 3,844.63
Financial liabilities
FVTPL(i) Currentfinancialliability
(a) Liability for derivative contract 68.45 77.97 68.45 77.97
Amortised cost (i) Non-current borrowings (excluding
those disclosed under FVTPL category above)
23,553.76 19,800.69 23,553.76 19,800.69
(ii) Currentfinancialliabilities
(a) Borrowings 4,671.54 3,776.55 4,671.54 3,776.55
(b) Trade payables 4,776.61 3,167.97 4,776.61 3,167.97
(c) Others 10,189.68 8,434.46 10,189.68 8,434.46
Total 43,260.04 35,257.64 43,260.04 35,257.64
Valuation technique to determine fair value
Cash and cash equivalents, other bank balances, trade receivables, other current financial assets, trade payables,
current borrowings and other current financial liabilities approximate their carrying amounts largely due to the
short-term maturities of these instruments. The fair value of the financial assets and liabilities is the amount at
which the instrument could be exchanged in a current transaction between willing parties, other than in a forced
or liquidation sale.
The following methods and assumptions were used to estimate the fair values:
- The fair values of the long term borrowings, loans and other deferred payments are determined by using
discounted cash flow method using the appropriate discount rate. The discount rate is determined using
other similar instruments incorporating the risk associated.
- The Group executed derivative financial instruments such as cross currency interest rate swap being valued
using valuation techniques, which employs use of market observable inputs. The Group uses mark to market
valuation provided by bank for its valuation.
Varun Beverages Limited190

Summary of significant accounting policies and other explanatory information on the Consolidated Financial Statements for the year ended 31 December 2019
Fair value hierarchy
The financial assets measured at fair value are grouped into the fair value hierarchy as on 31 December 2019 and
31 December 2018 as follows: (also refer note 3(a))
(` in million)
31 December 2019 Date of valuation
Total Fair value measurement using
Quoted prices in active markets
(Level 1)
Significant observable inputs
(Level 2)
Significant unobservable
inputs(Level 3)
Assets measured at fair value:
Investment (non-current) 31 December 2019
0.01 - - 0.01
Liabilities measured at fair value:
(a) Liability for derivative contract
31 December 2019
68.45 - 68.45 -
There have been no transfers of financial assets and financial liabilities between the levels during the year 2019.
(` in million)
31 December 2018 Date of valuation
Total Fair value measurement using
Quoted prices in active markets
(Level 1)
Significant observable inputs
(Level 2)
Significant unobservable
inputs(Level 3)
Assets measured at fair value:
Investment (non-current) 31 December 2018
0.01 - - 0.01
Liabilities measured at fair value:
(a) Liability for derivative contract
31 December 2018
77.97 - 77.97 -
57. Capital management
For the purpose of the Group’s capital management, capital includes issued equity share capital, securities
premium and all other equity reserves attributable to the equity shareholders of the Group.
The Group’s capital management objectives are:
- to ensure the Group’s ability to continue as a going concern
- to provide an adequate return to shareholders
by pricing products and services commensurately with the level of risk.
The Group manages its capital structure and makes adjustments in light of changes in economic conditions and
the requirements of the financial covenants. To maintain or adjust the capital structure, the Group may adjust
the dividend payment to shareholders, return capital to shareholders or issue new shares. The Group monitors
capital using a gearing ratio, which is net debt divided by total capital plus net debt. The Group includes within net
debt, non-current and current borrowings, deferred payment liabilities, less cash and cash equivalents, excluding
discontinued operations, if any.
STATUTORY REPORTSCORPORATE OVERVIEW FINANCIAL STATEMENTS
Annual Report 2019 191

Summary of significant accounting policies and other explanatory information on the Consolidated Financial Statements for the year ended 31 December 2019
The amounts managed as capital by the Group for the reporting periods are summarised as follows:
(` in million)
Particulars As at31 December 2019
As at31 December 2018
Non-current borrowings (Refer note 22a) 23,553.76 19,800.69
Current borrowings (Refer note 22B) 4,671.54 3,776.55
Current portion of deferred payment liabilities (Refer note 22D) - 429.58
Current maturities of long-term debts (Refer note 22C) 5,946.43 4,071.85
34,171.73 28,078.67
Less: Cash and cash equivalents (Refer note 14) (1,379.68) (429.36)
Net debt (A) 32,792.05 27,649.31
Equity share capital (Refer note 20) 2,886.89 1,826.42
Other equity (Refer note 21) 30,397.33 18,158.62
Total capital (B) 33,284.22 19,985.04
Capital and net debt (C=A+B) 66,076.27 47,634.35
Gearing ratio (A/C) 49.63% 58.04%
In order to achieve this overall objective, the Group’s capital management, amongst other things, aims to ensure
that it meets financial covenants attached to the interest-bearing loans and borrowings that define capital
structure requirements.
No changes were made in the objectives, policies or processes for managing capital during the years ended 31
December 2019 and 31 December 2018.
Breaches in meeting the financial covenants would permit the bank to immediately call loans and borrowings.
There have been no breaches in the financial covenants of any borrowing in the reporting periods.
58. Assets pledged as security
The carrying amount of assets pledged as security are:
(` in million)
Particulars As at31 December 2019
As at31 December 2018
Inventories and trade receivable 9,382.31 6,952.38
Other bank deposits 328.60 1,430.60
Current loans 351.71 104.68
Othercurrentfinancialassets 2,820.09 1,783.80
Other current assets 1,554.83 1,581.41
Other intangible assets 5,617.87 5,235.20
Property, plant and equipment (including capital work-in-progress) 54,852.67 37,725.97
59. Recent accounting pronouncements (Ind AS issued but not yet effective)
The Ministry of Corporate affairs (“MCa”) issued the Companies (Indian accounting Standards) amendments
Rules, 2019 and Companies (Indian accounting Standards) Second amendments Rules, 2019, notifying new
standards and amendments to certain issued standards. These pronouncements are applicable to the Group from
accounting periods beginning on or after 01 January 2020.
Varun Beverages Limited192

Summary of significant accounting policies and other explanatory information on the Consolidated Financial Statements for the year ended 31 December 2019
(a) Ind AS 116, Leases:
Ind aS 116 supersedes Ind aS 17, Leases including appendencies thereto. Ind aS 116 sets out the principles for
the recognition, measurement, presentation and disclosure of leases and requires lessees to record all leases on
the balance sheet with exemptions available for low value and short term leases. at the commencement of a
lease, a lessee will recognise lease liability and an asset representing the right to use the underlying asset during
the lease term (i.e., the right-of-use asset). Lessees will subsequently reduce the lease liability when paid and
recognise depreciation on the right of-use asset. Lessees will be required to separately recognise the interest
expense on the lease liability and the depreciation expense on the right-of-use asset. The standard has no impact
on the actual cash flows of the Group. However, operating lease payments currently expensed as operating cash
outflows will instead be capitalised and presented as financing cash outflows in the statement of cash flows.
The Group is evaluating the requirements of the standard and the effect on the financial statements.
(b) Appendix C, Uncertainty over Income Tax Treatment to Ind AS 12, Income Taxes:
The appendix clarifies how to apply the recognition and measurement principles while recognizing current tax,
deferred tax, taxable profits (losses), tax bases, unused tax losses, unused tax credits and tax rates when there
is uncertainty over tax treatments under Ind aS 12. as per the appendix, the Group needs to assess whether it is
probable that a tax authority will accept an uncertain tax treatment used or a treatment which is being proposed
to be used in its income tax filings.
‘The Group is evaluating the requirements of the amendments and their impact on the consolidated financial
statements.
(c) Amendment to Ind AS 12, Income Taxes:
The amendment clarifies that an entity shall recognize income tax consequences of dividends in profit or loss,
other comprehensive income or equity according to where the entity originally recognised those past transactions
or events.
The Group will apply this amendment for annual reporting periods beginning on or after 01 January, 2020. The
impact on the consolidated financial statements is being evaluated.
(d) Amendment to Ind AS 23, Borrowing Costs:
The amendment clarifies that an entity shall consider specific borrowings as general borrowing while calculating
capitalization rate, once substantial activities necessary to prepare a qualifying asset for which specific borrowing
was obtained is completed for its intended use or sale.
In view of the management, the impact of this amendment on the consolidated financial statements, as assessed
by the Group, is expected to be insignificant.
STATUTORY REPORTSCORPORATE OVERVIEW FINANCIAL STATEMENTS
Annual Report 2019 193
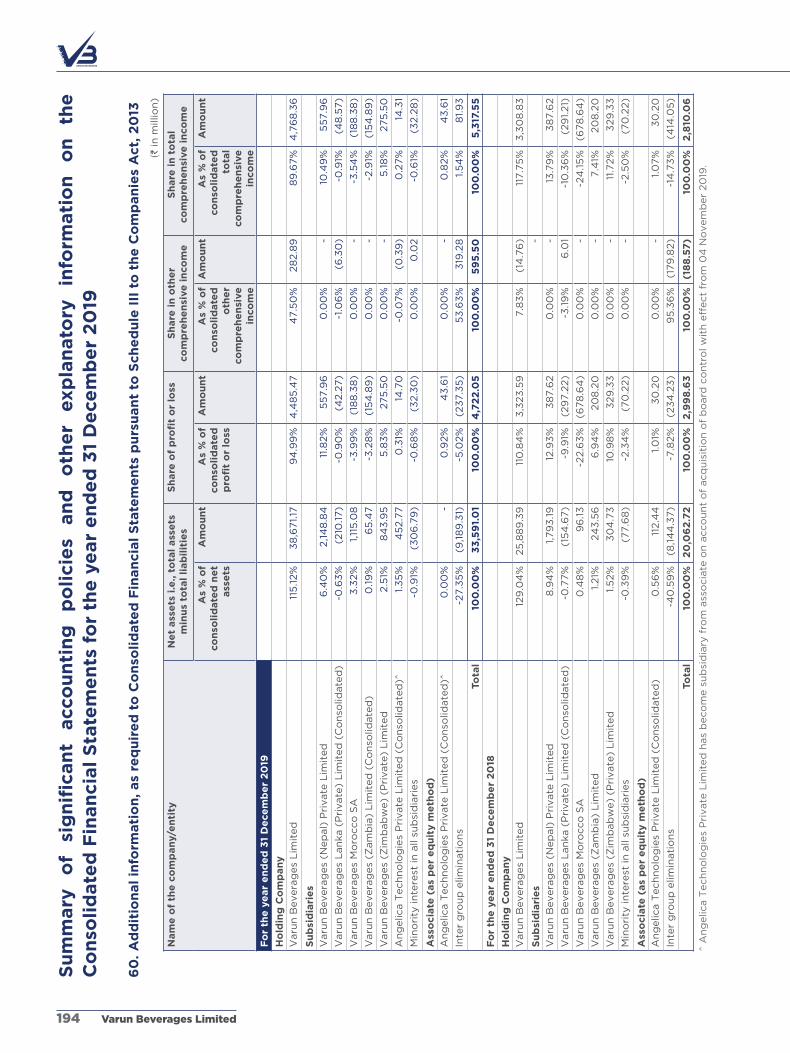
Su
mm
ary
o
f si
gn
ific
an
t acco
un
tin
g
po
licie
s an
d
oth
er
exp
lan
ato
ry
info
rmati
on
o
n
the
C
on
soli
date
d F
inan
cia
l S
tate
me
nts
fo
r th
e y
ear
en
de
d 3
1 D
ece
mb
er
20
19
60
. A
dd
itio
nal
info
rmati
on
, as
req
uir
ed
to
Co
nso
lid
ate
d F
inan
cia
l S
tate
me
nts
pu
rsu
an
t to
Sch
ed
ule
III
to
th
e C
om
pan
ies
Act,
20
13
(` in
mill
ion
)
Nam
e o
f th
e c
om
pan
y/e
nti
tyN
et
ass
ets
i.e
., t
ota
l ass
ets
m
inu
s to
tal
liab
ilit
ies
Sh
are
of
pro
fit
or
loss
Sh
are
in
oth
er
co
mp
reh
en
sive
in
co
me
Sh
are
in
to
tal
co
mp
reh
en
sive
in
co
me
As
% o
f co
nso
lid
ate
d n
et
ass
ets
Am
ou
nt
As
% o
f co
nso
lid
ate
d
pro
fit
or
loss
Am
ou
nt
As
% o
f co
nso
lid
ate
d
oth
er
co
mp
reh
en
sive
in
co
me
Am
ou
nt
As
% o
f co
nso
lid
ate
d
tota
l co
mp
reh
en
sive
in
co
me
Am
ou
nt
Fo
r th
e y
ear
en
de
d 3
1 D
ece
mb
er
20
19
Ho
ldin
g C
om
pan
y
Varu
n B
evera
ges
Lim
ited
115
.12%
38
,671.
179
4.9
9%
4,4
85
.47
47.5
0%
28
2.8
98
9.6
7%
4,7
68
.36
Su
bsi
dia
rie
s
Varu
n B
evera
ges
(Nep
al)
Pri
vate
Lim
ited
6.4
0%
2,1
48
.84
11.8
2%
55
7.9
60
.00
%-
10.4
9%
55
7.9
6
Varu
n B
evera
ges
Lan
ka (
Pri
vate
) L
imit
ed
(C
on
solid
ate
d)
-0.6
3%
(210
.17)
-0.9
0%
(42.2
7)
-1.0
6%
(6.3
0)
-0.9
1%(4
8.5
7)
Varu
n B
evera
ges
Mo
rocco
Sa
3.3
2%
1,11
5.0
8-3
.99
%(1
88
.38
)0
.00
%-
-3.5
4%
(18
8.3
8)
Varu
n B
evera
ges
(Zam
bia
) L
imit
ed
(C
on
solid
ate
d)
0.1
9%
65
.47
-3.2
8%
(15
4.8
9)
0.0
0%
--2
.91%
(15
4.8
9)
Varu
n B
evera
ges
(Zim
bab
we)
(Pri
vate
) L
imit
ed
2.5
1%8
43
.95
5.8
3%
275
.50
0.0
0%
-5
.18
%275
.50
an
gelic
a T
ech
no
log
ies
Pri
vate
Lim
ited
(C
on
solid
ate
d)^
1.3
5%
45
2.7
70
.31%
14.7
0-0
.07%
(0.3
9)
0.2
7%
14.3
1
Min
ori
ty in
tere
st in
all
sub
sid
iari
es
-0.9
1%(3
06
.79
)-0
.68
%(3
2.3
0)
0.0
0%
0.0
2-0
.61%
(32.2
8)
Ass
ocia
te (
as
pe
r e
qu
ity m
eth
od
)
an
gelic
a T
ech
no
log
ies
Pri
vate
Lim
ited
(C
on
solid
ate
d)^
0.0
0%
-0
.92%
43
.61
0.0
0%
-0
.82%
43
.61
Inte
r g
rou
p e
limin
ati
on
s-2
7.3
5%
(9,1
89
.31)
-5.0
2%
(23
7.3
5)
53
.63
%3
19.2
81.
54
%8
1.9
3
Tota
l10
0.0
0%
33
,59
1.0
110
0.0
0%
4,7
22
.05
100
.00
%5
95
.50
100
.00
%5
,317
.55
Fo
r th
e y
ear
en
de
d 3
1 D
ece
mb
er
20
18
Ho
ldin
g C
om
pan
y
Varu
n B
evera
ges
Lim
ited
129
.04
%25
,88
9.3
911
0.8
4%
3,3
23
.59
7.8
3%
(14
.76
)11
7.7
5%
3,3
08
.83
Su
bsi
dia
rie
s-
Varu
n B
evera
ges
(Nep
al)
Pri
vate
Lim
ited
8.9
4%
1,79
3.1
912
.93
%3
87.6
20
.00
%-
13.7
9%
38
7.6
2
Varu
n B
evera
ges
Lan
ka (
Pri
vate
) L
imit
ed
(C
on
solid
ate
d)
-0.7
7%
(15
4.6
7)
-9.9
1%(2
97.2
2)
-3.1
9%
6.0
1-1
0.3
6%
(29
1.21)
Varu
n B
evera
ges
Mo
rocco
Sa
0.4
8%
96
.13
-22.6
3%
(678
.64
)0
.00
%-
-24
.15
%(6
78
.64
)
Varu
n B
evera
ges
(Zam
bia
) L
imit
ed
1.21%
24
3.5
66
.94
%20
8.2
00
.00
%-
7.4
1%20
8.2
0
Varu
n B
evera
ges
(Zim
bab
we)
(Pri
vate
) L
imit
ed
1.5
2%
30
4.7
310
.98
%3
29
.33
0.0
0%
-11
.72%
329
.33
Min
ori
ty in
tere
st in
all
sub
sid
iari
es
-0.3
9%
(77.6
8)
-2.3
4%
(70
.22)
0.0
0%
--2
.50
%(7
0.2
2)
Ass
ocia
te (
as
pe
r e
qu
ity m
eth
od
)
an
gelic
a T
ech
no
log
ies
Pri
vate
Lim
ited
(C
on
solid
ate
d)
0.5
6%
112.4
41.
01%
30
.20
0.0
0%
-1.
07%
30
.20
Inte
r g
rou
p e
limin
ati
on
s-4
0.5
9%
(8,1
44
.37)
-7.8
2%
(23
4.2
3)
95
.36
%(1
79
.82)
-14
.73
%(4
14.0
5)
Tota
l10
0.0
0%
20
,06
2.7
210
0.0
0%
2,9
98
.63
100
.00
%(1
88
.57
)10
0.0
0%
2,8
10.0
6
^
an
gelic
a T
ech
no
log
ies
Pri
vate
Lim
ited
has
beco
me s
ub
sid
iary
fro
m a
sso
cia
te o
n a
cco
un
t o
f acq
uis
itio
n o
f b
oard
co
ntr
ol w
ith
eff
ect
fro
m 0
4 N
ovem
ber
20
19.
Varun Beverages Limited194
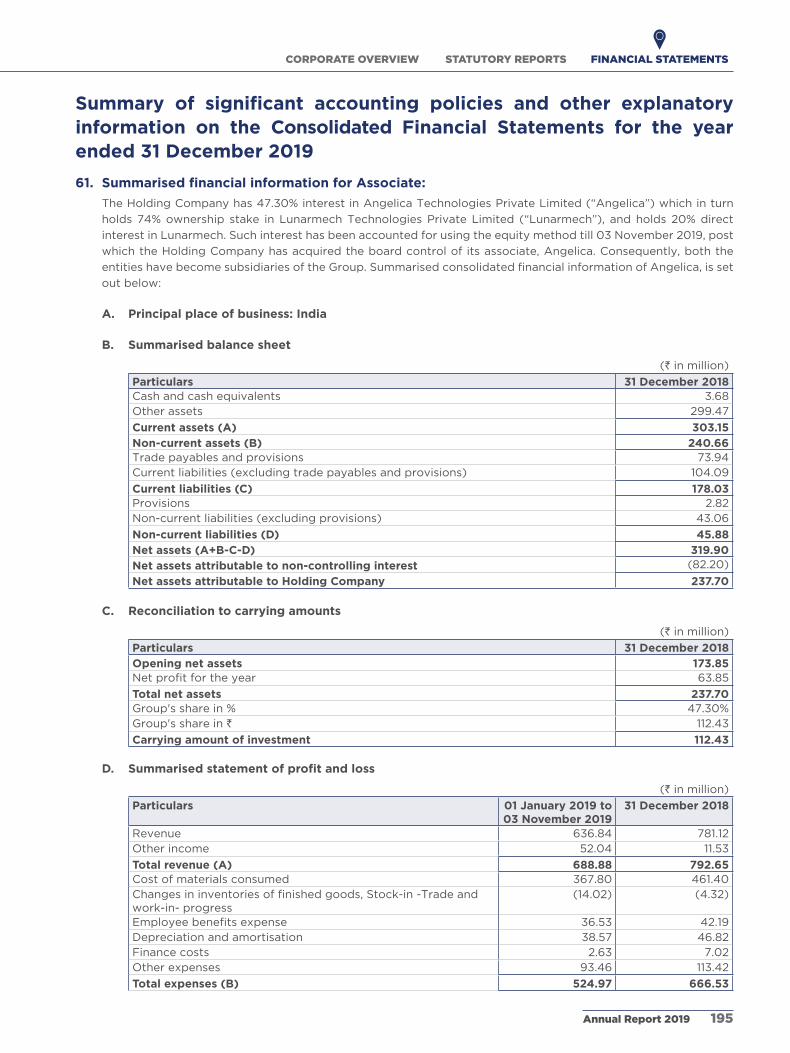
Summary of significant accounting policies and other explanatory information on the Consolidated Financial Statements for the year ended 31 December 2019
61. Summarised financial information for Associate:
The Holding Company has 47.30% interest in angelica Technologies Private Limited (“angelica”) which in turn
holds 74% ownership stake in Lunarmech Technologies Private Limited (“Lunarmech”), and holds 20% direct
interest in Lunarmech. Such interest has been accounted for using the equity method till 03 November 2019, post
which the Holding Company has acquired the board control of its associate, angelica. Consequently, both the
entities have become subsidiaries of the Group. Summarised consolidated financial information of angelica, is set
out below:
A. Principal place of business: India
B. Summarised balance sheet
(` in million)
Particulars 31 December 2018Cash and cash equivalents 3.68 Other assets 299.47
Current assets (A) 303.15 Non-current assets (B) 240.66 Trade payables and provisions 73.94 Current liabilities (excluding trade payables and provisions) 104.09
Current liabilities (C) 178.03 Provisions 2.82 Non-current liabilities (excluding provisions) 43.06
Non-current liabilities (D) 45.88 Net assets (A+B-C-D) 319.90 Net assets attributable to non-controlling interest (82.20)
Net assets attributable to Holding Company 237.70
C. Reconciliation to carrying amounts
(` in million)
Particulars 31 December 2018Opening net assets 173.85 Netprofitfortheyear 63.85
Total net assets 237.70 Group's share in % 47.30%Group's share in ` 112.43
Carrying amount of investment 112.43
D. Summarised statement of profit and loss
(` in million)
Particulars 01 January 2019 to 03 November 2019
31 December 2018
Revenue 636.84 781.12 Other income 52.04 11.53
Total revenue (A) 688.88 792.65 Cost of materials consumed 367.80 461.40 Changesininventoriesoffinishedgoods,Stock-in-Tradeandwork-in- progress
(14.02) (4.32)
Employeebenefitsexpense 36.53 42.19 Depreciation and amortisation 38.57 46.82 Finance costs 2.63 7.02 Other expenses 93.46 113.42
Total expenses (B) 524.97 666.53
STATUTORY REPORTSCORPORATE OVERVIEW FINANCIAL STATEMENTS
Annual Report 2019 195

Summary of significant accounting policies and other explanatory information on the Consolidated Financial Statements for the year ended 31 December 2019
(` in million)
Particulars 01 January 2019 to 03 November 2019
31 December 2018
Profit before tax (C=A-B) 163.91 126.12 Tax expense (D) 45.35 40.28
Profit after tax (E=C-D) 118.56 85.84 Other comprehensive income (F) - 0.44
Total comprehensive income (G=E+F) 118.56 86.28 Net profit attributable to:(a) Owners 87.77 63.52 (b) Non-controlling interest 30.79 22.32
Other comprehensive income attributable to:(a) Owners - 0.33 (b) Non-controlling interest - 0.11
Total comprehensive income attributable to:(a) Owners 87.77 63.85 (b) Non-controlling interest 30.79 22.43 Group's share in % 47.30% 47.30%
Group's share of profit after tax (H) 41.52 30.20 Add: Share of profit after tax on acquisition of additional 20% direct interest in Lunarmech (I)
2.09 -
Profit recognised in the Consolidated Statement of Profit and Loss (J=H+I)
43.61 30.20
62. During the year ended 31 December 2019, pursuant to Qualified institutions placement (QIP), the Holding Company
has raised ` 8,999.99 through fresh issue of 14,705,882 equity shares of ` 10 each at a premium of ` 602 per share. The
audit committee and the Board of Directors noted the utilisation of funds raised through such fresh issue of equity
shares to be in line with the object of the issue, the details of which are as follows:
(` in million)
Particulars Amount
Gross proceeds received from QIP 8,999.99
Less: Share issue expenses 164.36
Net proceeds received from QIP 8,835.63
Amount utilised for:
Repayment of debts (8,835.63)
Unutilised amount -
63. No adjusting or significant non-adjusting events have occurred between 31 December 2019 and the date of authorisation
of these consolidated financial statements.
Theaccompanyingnotesareanintegralpartoftheconsolidatedfinancialstatements. For and on behalf of the Board of Directors ofas per our report of even date attached. Varun Beverages Limited
For Walker Chandiok & Co LLP For APAS & Co. Varun Jaipuria Raj Pal GandhiChartered accountants Chartered accountants Whole Time Director Whole Time DirectorFirm’s Registration No.: 001076N/N500013 Firm’s Registration No.: 000340C DIN 02465412 DIN 00003649
Anupam Kumar Sumit Kathuria Vikas Bhatia Kapil AgarwalPartner Partner ChiefFinancialOfficer ChiefExecutiveOfficer Membership No.: 501531 Membership No.: 520078 and Whole Time Director DIN 02079161
Ravi Batra ChiefRiskOfficerand Place : Gurugram Group Company Secretary Dated : 07 February 2020 Membership No. F-5746
Varun Beverages Limited196

Part “B”: Associates - Nil
(` in million, except as stated otherwise)
Sl. No.
S. No 1 2 3 4 5 6
Particulars Varun Beverages (Nepal) Private
Limited
Varun Beverages Lanka (Private)
Limited*
Varun Beverages Morocco SA
Varun Beverages (Zambia) Limited*
Varun Beverages (Zimbabwe)
(Private) Limited
Angelica Technologies
Private Limited*
Date of acquisition
01 January 2012 01 January 2012 01 January 2012 01 January 2016 01 January 2016 04 November 2019
Financial year ending on
31 December 2019
31 December 2019
31 December 2019
31 December 2019
31 December 2019
31 December 2019
Currency NPR LKR MAD ZMW RTGS INR
Exchange rate on the last day of financial year
0.62441 0.38903 7.34544 5.05203 4.25009 1.00000
Average exchange rate during the financial year
0.62441 0.39134 7.25741 5.44210 4.25009 1.00000
1. Share capital 674.36 220.87 5,246.20 176.82 0.03 0.75
2. Reserve and surplus
1,474.48 (431.05) (4,108.94) (121.87) 827.16 452.02
3. Total assets 3,715.45 2,493.09 4,203.08 1,730.73 4,301.26 577.29
4. Total liabilities 1,566.60 2,703.26 3,065.81 1,675.78 3,474.08 124.51
5. Turnover 4,754.65 1,680.71 3,507.21 1,723.47 5,669.01 104.57
6. Profit before taxation
650.49 (22.55) (172.33) (130.73) (178.65) 20.05
7. Provision for taxation
92.53 22.49 22.18 - - 5.35
8. Profit after taxation
557.96 (45.04) (194.52) (130.73) (178.65) 14.70
9. Proposed dividend
202.31 - - - - -
10. % of shareholding
100.00% 100.00% 100.00% 90.00% 85.00% 47.30%
*Consolidatedfigures.
For and on behalf of the Board of Directors ofVarun Beverages Limited
Varun JaipuriaWhole Time DirectorDIN 02465412
Raj Pal GandhiWhole Time DirectorDIN 00003649
Vikas BhatiaChief Financial Officer
Kapil AgarwalChief Executive Officer and WholeDIN 02079161
Place: GurugramDated: 07 February 2020
Ravi BatraChief Risk Officer and Group Company SecretaryMembership No. F- 5746
Form AOC-1(Pursuant to first proviso to sub-section (3) of Section 129 read with Rule 5 of Companies (accounts) Rules, 2014)
Statement containing salient features of the financial statements of Subsidiaries/associate companies:
Part”A”: Subsidiaries
STATUTORY REPORTSCORPORATE OVERVIEW FINANCIAL STATEMENTS
Annual Report 2019 197

standalone

Independent auditor’s Report
to the Members of Varun Beverages limited
Report on the audit of the standalone Financial statements
opinion
1. We have audited the accompanying standalone
financial statements of Varun Beverages Limited
(‘the Company’), which comprise the Balance Sheet
as at 31 December 2019, the Statement of Profit and
Loss (including Other Comprehensive Income), the
Cash Flow Statement and the Statement of Changes
in Equity for the year then ended, and a summary
of the significant accounting policies and other
explanatory information.
2. In our opinion and to the best of our information
and according to the explanations given to us, the
aforesaid standalone financial statements give the
information required by the Companies Act, 2013
(‘Act’) in the manner so required and give a true and
fair view in conformity with the accounting principles
generally accepted in India including Indian
Accounting Standards (‘Ind AS’) specified under
section 133 of the Act, of the state of affairs (financial
position) of the Company as at 31 December 2019,
and its profit (financial performance including other
comprehensive income), its cash flows and the
changes in equity for the year ended on that date.
Basis for opinion
3. We conducted our audit in accordance with the
Standards on Auditing specified under section
143(10) of the Act. Our responsibilities under
those standards are further described in the
Auditor’s Responsibilities for the Audit of the
Financial Statements section of our report. We are
independent of the Company in accordance with the
Code of Ethics issued by the Institute of Chartered
Accountants of India (‘ICAI’) together with the
ethical requirements that are relevant to our audit of
the financial statements under the provisions of the
Act and the rules thereunder, and we have fulfilled
our other ethical responsibilities in accordance with
these requirements and the Code of Ethics. We
believe that the audit evidence we have obtained is
sufficient and appropriate to provide a basis for our
opinion.
Key audit Matters
4. Key audit matters are those matters that, in our
professional judgment, were of most significance in
our audit of the standalone financial statements of
the current period. These matters were addressed in
the context of our audit of the standalone financial
statements as a whole, and in forming our opinion
thereon, and we do not provide a separate opinion
on these matters.
5. We have determined the matters described below to
be the key audit matters to be communicated in our
report.
Key audit matter How our audit addressed the key audit matter
Impairment assessment of non-current investments
in and loans recoverable from certain wholly owned
subsidiaries
As described in Note 6, 8 and 15 to the standalone
financial statements, the Company has investments
of INR 5,445.53 million and has outstanding loans
recoverable amounting to INR 4,225.01 million from
certain subsidiaries as at 31 December 2019, which have
been incurring losses in the current and previous years
and have had negative cash flows from operations during
the previous years, that are impairment indicators and
triggered a need for impairment assessment.
Our audit procedures included, but were not limited, to the
following:
Obtained understanding of the management process for
identification of possible impairment indicators for the
relevant subsidiaries and conducted detailed discussions
with the management through the year to understand
the impairment assessment process, assumptions used
and estimates made by management to the assess the
reasonableness of the recoverable amounts and tested
the operating effectiveness of controls implemented by
management;
STATUTORY REPORTSCORPORATE OVERVIEW FINANCIAL STATEMENTS
Annual Report 2019 199

Key audit matter How our audit addressed the key audit matter
In view of the above, management, during the year
ended 31 December 2019, has carried out impairment
assessment of such investments and loans granted,
whereby the carrying amount of the investments was
compared with the value in use of the business of
respective subsidiary. Determination of value in use for
impairment assessment using the discounted cash flow
model involved significant judgments and estimates
including the expected growth rate, discount rates and
other market related factors.
Considering the materiality of the amounts involved
and significant degree of judgement and subjectivity
involved in the estimates and key assumptions used
in determining the cash flows used in the impairment
evaluation, impairment of such investments/ loans was
determined to be a key audit matter.
Obtained from the management of the Company, the
detailed financial projections of the relevant subsidiaries
as approved by their respective board of directors
and held detailed discussions with the management to
understand the assumptions used and estimates made by
them for determining the cash flow projections;
Evaluated the historical accuracy of the plans and
forecasts, by comparing the forecasts used in the prior
year models to the actual performance of the business
in the current year and discussed the results with the
management;
Read the auditors’ reports of the relevant subsidiaries,
noting no adverse remarks pertaining to impairment of
any assets;
Involved auditor’s experts to assess the reasonableness
of assumptions used and valuation methodology applied;
Tested mathematical accuracy of the projections and
performed sensitivity analysis for reasonably possible
changes in the long-term growth rates and discount rates
used to ensure that there is no significant impact on the
valuation; and
Evaluated the adequacy and appropriateness of
disclosures made by the Company in the standalone
financial statements, as required by the applicable
provisions of the Act and the Indian Accounting Standards
(“Ind AS”).
Impairment assessment of intangible assets including
Goodwill
(Refer note 3.5 for accounting policies on intangibles
assets and note 5 to the standalone financial statements)
The Company carries goodwill and franchise rights as
intangible assets having indefinite life amounting to
INR 19.4 million and INR 5,385.99 million respectively,
that are required to be tested for impairment by the
management on an annual basis in accordance with Ind
AS 36, Impairment of Assets.
The aforesaid assessment of the impairment testing
involves significant judgement around the determination
of the recoverable amount, being the higher of value in
use and fair value less costs of disposal. Recoverable
amounts are based on management’s view of the
future cash flows and prospects of the business, the
appropriate discount rates and other industry specific
risk factors.
The key judgements in determining the recoverable
amount of these intangibles relates to the forecast of
future cash flows based on strategy using macroeconomic
assumptions like industry growth, inflation and expected
growth in market share, capital expenditure and working
capital requirements, among others.
Our audit procedures included, but were not limited, to the
following:
Obtained an understanding of the management’s process
for identification of cash generating unit and impairment
indicators for intangible assets, if any and processes
performed by the management for their impairment
testing;
Assessed the process by which management prepared
its cash flow forecasts and held discussions with
management to understand the assumptions used and
estimates made by them for determining such projections;
Tested the design and operating effectiveness of
internal controls over such identification and impairment
measurement through fair valuation of identified assets.
Assessed the appropriateness of the Company’s
accounting policies, including those relating to
recognition, measurement and impairment of intangibles
by comparing with the applicable Ind AS;
Reviewed the valuation report obtained by management
from an independent valuer and assessed the professional
competence, skills and objectivity for performing the
required valuations;
Varun Beverages Limited200

Key audit matter How our audit addressed the key audit matter
Changes in the management forecasts or assumptions
can impact the assessment of the discounted
cash flows and consequently the valuation of such
intangible assets.
Considering the materiality of the amount involved
and significant degree of judgement and subjectivity
involved in the estimates and key assumptions used
in determining the forecasted cash flows used in the
impairment evaluation, which are dependent on current
and future economic factors and trading conditions
varying for different economic and geographical
territories, impairment assessment of such intangibles
assets was determined as a key audit matter.
Assessed the appropriateness of the significant
assumptions as well as the Company’s valuation model
with the support of auditor’s valuation experts, who
assess the reasonableness of assumptions used and
valuation methodology applied relating to discount rate,
risk premium, industry growth rate etc. This included a
discussion of the expected development of the business
and results as well as of the underlying assumptions used
with those responsible for the planning process.
Assessed the robustness of financial projections prepared
by management by comparing projections for previous
financial years with actual results realized and discussed
significant deviations, if any, with the management;
Tested mathematical accuracy of the projections and
performed a sensitivity analysis for reasonably possible
changes in the sales growth, discount rate applied and
the long-term growth rate; and
Evaluated the adequacy and appropriateness of
disclosures made by the Company in the standalone
financial statements, as required by the applicable
provisions of the Act and Ind AS.
litigation and claims – provisions and contingent
liabilities
(Refer notes 41 to the standalone financial statements
for the amounts of contingent liabilities)
The Company is involved in various direct, indirect
tax and other litigations (‘litigations’) that are pending
with different statutory authorities. The management
exercises significant judgement for determining the
need for and the amount of provisions for any liabilities
arising from these litigations.
This judgement is dependent on a number of significant
assumptions and evaluations which involves interpreting
the various applicable rules, regulations, practices and
considering precedents in the various jurisdictions
including the opinions received from various legal
counsels.
This matter is considered as a key audit matter, in view
of the uncertainty regarding the outcome of these
litigations, the significance of the amounts involved and
the subjectivity involved in management’s judgement
as to whether the amount should be recognized as a
provision or only disclosed as contingent liability in the
standalone financial statements.
Our audit procedures included, but were not limited to, the
following:
Assessed the appropriateness of the Company’s
accounting policies relating to provisions and contingent
liabilities by comparing with the applicable accounting
standards;
Assessed the Company’s process and the underlying
controls for identification of the pending litigations
and completeness for financial reporting and also for
monitoring of significant developments in relation to
such pending litigations;
Assessed the management’s assumptions and estimates
in respect of litigations, including the liabilities or
provisions recognized or contingent liabilities disclosed
in the standalone financial statements. This involved
assessing the probability of an unfavorable outcome of
a given proceeding and the reliability of estimates of
related amounts based on the various legal counsel’s
opinions received by the Company;
Recomputed the arithmetical accuracy of the underlying
calculations supporting the provisions recorded from the
supporting evidences including the correspondence with
various authorities;
Assessed the management’s conclusions through
understanding relevant judicial precedents in similar
cases and the applicable rules and regulations;
Obtained legal opinions and confirmation on
completeness from the Company’s external legal counsel,
where appropriate;
STATUTORY REPORTSCORPORATE OVERVIEW FINANCIAL STATEMENTS
Annual Report 2019 201

Key audit matter How our audit addressed the key audit matter
Engaged auditor’s experts to gain an understanding of
the current status of litigations and monitored changes
in the disputes, if any, through discussions with the
management and by reading external advice received by
the Company, where relevant, to validate management’s
conclusions; and
Assessed the appropriateness of the Company’s
description of the accounting policy, disclosures related
to litigations and whether these are adequately presented
in the standalone financial statements.
accounting for business combination
As detailed in note 49A to the standalone financial
statements, during the year, the Company has executed
a business transfer agreement with a third party to
acquire franchisee rights and bottling operations
of South and West India regions for a purchase
consideration of INR 18,025 million.
Management has accounted for this acquisition
as per the requirements of Ind AS 103 “Business
combinations” which involves exercise of significant
management assumptions/ estimates such as
discount rate, growth rate, earning margins, etc for
valuation of business acquired, allocation of purchase
price paid and identification and valuation of acquired
intangible assets.
Considering the materiality of the amounts involved
and significant degree of judgement and subjectivity
involved in the estimates and key assumptions used,
this business combination was determined to be a key
audit matter.
Our audit procedures included, but were not limited, to the
following:
Assessed the appropriateness of the Company’s
accounting policies and the related processes for
implementing Ind AS 103 for accounting for such business
combination;
Obtained and reviewed the key supporting documentation
including business transfer agreement;
Reviewed the valuation reports obtained by
management from independent valuers and assessed
the independence, professional competence, skills and
objectivity for performing the required valuations;
Assessed the appropriateness of the significant
assumptions as well as the Company’s valuation model
with the support of auditor’s valuation expert, who
reviewed the reasonableness of assumptions used
and valuation methodology applied. This included a
discussion of the expected development of the business
and results as well as of the underlying assumptions used
with those responsible for the planning process;
Tested the mathematical accuracy of the cash flows applied
within the valuations models and performed sensitivity
analysis for reasonably possible changes in the sales growth,
discount rate applied and the long-term growth rate; and
Evaluated the adequacy and appropriateness of
disclosures made by the Company in the standalone
financial statements, as required by the applicable
provisions of the Act and Ind AS.
Information other than the Financial statements and auditor’s Report thereon
6. The Company’s Board of Directors is responsible
for the other information. The other information
comprises the information included in the
Management Discussion and Analysis, Report on
Corporate Governance and Director’s Report, but
does not include the standalone financial statements
and our auditor’s report thereon.
Our opinion on the standalone financial statements
does not cover the other information and we do not
express any form of assurance conclusion thereon.
In connection with our audit of the standalone
financial statements, our responsibility is to read the
other information and, in doing so, consider whether
the other information is materially inconsistent with
the financial statements or our knowledge obtained
in the audit or otherwise appears to be materially
misstated. If, based on the work we have performed,
we conclude that there is a material misstatement of
this other information, we are required to report that
fact. We have nothing to report in this regard.
Varun Beverages Limited202

Responsibilities of Management and those Charged with Governance for the standalone Financial statements
7. The Company’s Board of Directors is responsible for
the matters stated in section 134(5) of the Act with
respect to the preparation of these standalone financial
statements that give a true and fair view of the state
of affairs (financial position), profit or loss (financial
performance including other comprehensive income),
changes in equity and cash flows of the Company in
accordance with the accounting principles generally
accepted in India, including the Ind AS specified
under section 133 of the Act. This responsibility
also includes maintenance of adequate accounting
records in accordance with the provisions of the
Act for safeguarding of the assets of the Company
and for preventing and detecting frauds and other
irregularities; selection and application of appropriate
accounting policies; making judgments and estimates
that are reasonable and prudent; and design,
implementation and maintenance of adequate internal
financial controls, that were operating effectively
for ensuring the accuracy and completeness of the
accounting records, relevant to the preparation and
presentation of the standalone financial statements
that give a true and fair view and are free from material
misstatement, whether due to fraud or error.
8. In preparing the standalone financial statements,
management is responsible for assessing the
Company’s ability to continue as a going concern,
disclosing, as applicable, matters related to going
concern and using the going concern basis of
accounting unless management either intends to
liquidate the Company or to cease operations, or has
no realistic alternative but to do so.
9. Those Board of Directors are also responsible for
overseeing the Company’s financial reporting process.
auditor’s Responsibilities for the audit of the standalone Financial statements
10. Our objectives are to obtain reasonable assurance
about whether the standalone financial statements as
a whole are free from material misstatement, whether
due to fraud or error, and to issue an auditor’s report
that includes our opinion. Reasonable assurance is a
high level of assurance, but is not a guarantee that
an audit conducted in accordance with Standards on
Auditing will always detect a material misstatement
when it exists. Misstatements can arise from fraud or
error and are considered material if, individually or in
the aggregate, they could reasonably be expected to
influence the economic decisions of users taken on
the basis of these standalone financial statements.
11. As part of an audit in accordance with Standards
on Auditing, we exercise professional judgment and
maintain professional skepticism throughout the
audit. We also:
Identify and assess the risks of material
misstatement of the standalone financial
statements, whether due to fraud or error, design
and perform audit procedures responsive to those
risks, and obtain audit evidence that is sufficient
and appropriate to provide a basis for our opinion.
The risk of not detecting a material misstatement
resulting from fraud is higher than for one resulting
from error, as fraud may involve collusion, forgery,
intentional omissions, misrepresentations, or the
override of internal control;
Obtain an understanding of internal control
relevant to the audit in order to design
audit procedures that are appropriate in the
circumstances. Under section 143(3)(i) of the
Act, we are also responsible for expressing our
opinion on whether the Company has adequate
internal financial controls system in place and
the operating effectiveness of such controls;
Evaluate the appropriateness of accounting
policies used and the reasonableness of
accounting estimates and related disclosures
made by management;
Conclude on the appropriateness of
management’s use of the going concern basis
of accounting and, based on the audit evidence
obtained, whether a material uncertainty exists
related to events or conditions that may cast
significant doubt on the Company’s ability to
continue as a going concern. If we conclude that
a material uncertainty exists, we are required
to draw attention in our auditor’s report to the
related disclosures in the standalone financial
statements or, if such disclosures are inadequate,
to modify our opinion. Our conclusions are
based on the audit evidence obtained up to the
date of our auditor’s report. However, future
events or conditions may cause the Company
to cease to continue as a going concern; and
Evaluate the overall presentation, structure and
content of the standalone financial statements,
including the disclosures, and whether the
standalone financial statements represent the
underlying transactions and events in a manner
that achieves fair presentation.
12. We communicate with those charged with
governance regarding, among other matters, the
planned scope and timing of the audit and significant
audit findings, including any significant deficiencies
in internal control that we identify during our audit.
STATUTORY REPORTSCORPORATE OVERVIEW FINANCIAL STATEMENTS
Annual Report 2019 203

13. We also provide those charged with governance with
a statement that we have complied with relevant
ethical requirements regarding independence, and
to communicate with them all relationships and
other matters that may reasonably be thought to
bear on our independence, and where applicable,
related safeguards.
14. From the matters communicated with those charged
with governance, we determine those matters
that were of most significance in the audit of the
standalone financial statements of the current period
and are therefore the key audit matters. We describe
these matters in our auditor’s report unless law or
regulation precludes public disclosure about the
matter or when, in extremely rare circumstances, we
determine that a matter should not be communicated
in our report because the adverse consequences of
doing so would reasonably be expected to outweigh
the public interest benefits of such communication.
Report on other legal and Regulatory Requirements
15. As required by section 197(16) of the Act, we report
that the Company has paid remuneration to its
directors during the year in accordance with the
provisions of and limits laid down under section 197
read with Schedule V to the Act.
16. As required by the Companies (Auditor’s Report)
Order, 2016 (‘the Order’) issued by the Central
Government of India in terms of section 143(11) of
the Act, we give in the Annexure I a statement on the
matters specified in paragraphs 3 and 4 of the Order.
17. Further to our comments in Annexure I, as required
by section 143(3) of the Act, we report that:
(a) we have sought and obtained all the information
and explanations which to the best of our
knowledge and belief were necessary for the
purpose of our audit;
(b) in our opinion, proper books of account as
required by law have been kept by the Company
so far as it appears from our examination of
those books;
(c) the standalone financial statements dealt with
by this report are in agreement with the books
of account;
(d) in our opinion, the aforesaid standalone financial
statements comply with Ind AS specified under
section 133 of the Act;
(e) on the basis of the written representations
received from the directors and taken on
record by the Board of Directors, none of the
directors is disqualified as on 31 December 2019
from being appointed as a director in terms of
section 164(2) of the Act;
(f) we have also audited the internal financial
controls over financial reporting (IFCoFR)
of the Company as on 31 December 2019 in
conjunction with our audit of the standalone
financial statements of the Company for the
year ended on that date and our report dated
07 February 2020 as per Annexure II expressed
unmodified opinion; and
(g) with respect to the other matters to be included
in the Auditor’s Report in accordance with rule
11 of the Companies (Audit and Auditors) Rules,
2014 (as amended), in our opinion and to the
best of our information and according to the
explanations given to us:
(i) the Company, as detailed in note 41 to
the standalone financial statements, has
disclosed the impact of pending litigations on
its financial position as at 31 December 2019;
(ii) the Company, as detailed in note 25 to the
standalone financial statements, has made
provision as at 31 December 2019, as required
under the applicable law or Ind AS, for
material foreseeable losses, if any, on long-
term contracts including derivative contracts;
(iii) there were no amounts which were required
to be transferred to the Investor Education
and Protection Fund by the Company
during the year ended 31 December 2019;
and
(iv) the disclosure requirements relating to
holdings as well as dealings in specified
bank notes were applicable for the period
from 8 November 2016 to 30 December
2016, which are not relevant to these
standalone financial statements. Hence,
reporting under this clause is not applicable.
For Walker Chandiok & Co llP For aPas & Co.
Chartered Accountants Chartered Accountants
Firm’s Registration No.: Firm’s Registration No:
001076N/N500013 000340C
anupam Kumar sumit Kathuria
Partner Partner
Membership No.: 501531 Membership No: 520078
UDIN: UDIN:
20501531AAAABI4629 20520078AAAABI9327
Place: Gurugram Place: Gurugram
Date: 07 February 2020 Date: 07 February 2020
L-41 606, 6th Floor,
Connaught Place, PP City Centre, Road No. 44,
New Delhi 110 001 Pitampura, New Delhi 110 034
Varun Beverages Limited204

Based on the audit procedures performed for the
purpose of reporting a true and fair view on the financial
statements of the Company and taking into consideration
the information and explanations given to us and the
books of account and other records examined by us in the
normal course of audit, and to the best of our knowledge
and belief, we report that:
(i) (a) The Company has maintained proper records
showing full particulars, including quantitative
details and situation of fixed assets.
(b) The fixed assets, other than refrigerators
(visi coolers) and containers lying with third
parties, have been physically verified by the
management during the year and no material
discrepancies were noticed on such verification.
The Company has a regular program of physical
annexure I to the Independent auditor’s Report of even date to the members of Varun Beverages limited (“the Company”), on the standalone financial statements for the year ended 31 december 2019
verification of refrigerators (visi coolers) under
which such fixed assets are verified in a phased
manner over a period of three years and no
material discrepancies were noticed on such
verification. According to the information
and explanations given to us, the existence
of containers lying with active third parties is
considered on the basis of the confirmations
obtained from such third parties. In our opinion,
the frequency of verification of the fixed assets
is reasonable having regard to the size of the
Company and the nature of its assets.
(c) The title deeds of all the immovable properties
(which are included under the head ‘Property,
plant and equipment’) are held in the name
of the Company except for the following
properties:
nature of
property
total
number
of Cases
Whether
leasehold /
freehold
Gross block as on
31 december 2019
net block on
31 december 2019
Remarks (as per the
information and explanation
given to us by the
management)
Land (at
Nelamagala,
Karnataka)
1 Freehold ` 1,316.60 million ` 1,316.60 million Acquired in a business
combination; registration
will be done on completion
of transfer formalities by the
transferor.
Land (at
Pathankot,
Punjab)
1 Leasehold ` 197.10 million ` 189.69 million Will be registered on expiry
of 3 years from the date
of commencement of
commercial production
Land (at
Sonarpur,
Kolkata)
1 Leasehold ` 1.50 million ` 1.48 million On implementation of project
Land (at
Sangli,
Maharashtra)
1 Leasehold ` 1.55 million ` 1.55 million On completion of total
payment
(ii) In our opinion, the management has conducted
physical verification of inventory at reasonable
intervals during the year, except for goods-in-
transit and stocks lying with third parties. For
stocks lying with third parties at the year-end,
written confirmations have been obtained by the
management. No material discrepancies were
noticed on the aforesaid verification.
(iii) The Company has not granted any loan, secured
or unsecured to companies, firms, Limited Liability
Partnerships (LLPs) or other parties covered in the
register maintained under Section 189 of the Act.
Accordingly, the provisions of clauses 3(iii)(a), 3(iii)
(b) and 3(iii)(c) of the Order are not applicable.
(iv) In our opinion, the Company has complied with the
provisions of Section 186 in respect of investments,
loans and guarantees. Further, in our opinion, the
Company has not entered into any transaction
covered under Section 185 and Section 186 of the
Act in respect of security.
STATUTORY REPORTSCORPORATE OVERVIEW FINANCIAL STATEMENTS
Annual Report 2019 205
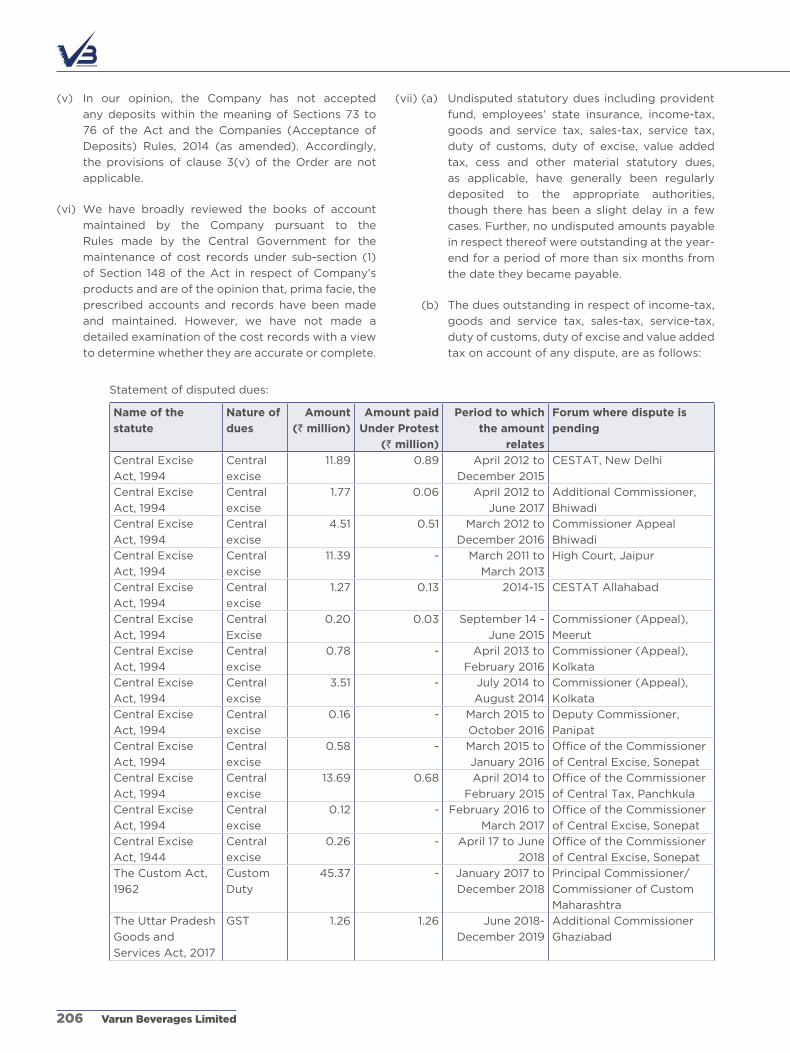
(v) In our opinion, the Company has not accepted
any deposits within the meaning of Sections 73 to
76 of the Act and the Companies (Acceptance of
Deposits) Rules, 2014 (as amended). Accordingly,
the provisions of clause 3(v) of the Order are not
applicable.
(vi) We have broadly reviewed the books of account
maintained by the Company pursuant to the
Rules made by the Central Government for the
maintenance of cost records under sub-section (1)
of Section 148 of the Act in respect of Company’s
products and are of the opinion that, prima facie, the
prescribed accounts and records have been made
and maintained. However, we have not made a
detailed examination of the cost records with a view
to determine whether they are accurate or complete.
(vii) (a) Undisputed statutory dues including provident
fund, employees’ state insurance, income-tax,
goods and service tax, sales-tax, service tax,
duty of customs, duty of excise, value added
tax, cess and other material statutory dues,
as applicable, have generally been regularly
deposited to the appropriate authorities,
though there has been a slight delay in a few
cases. Further, no undisputed amounts payable
in respect thereof were outstanding at the year-
end for a period of more than six months from
the date they became payable.
(b) The dues outstanding in respect of income-tax,
goods and service tax, sales-tax, service-tax,
duty of customs, duty of excise and value added
tax on account of any dispute, are as follows:
Statement of disputed dues:
name of the
statute
nature of
dues
amount
(` million)
amount paid
Under Protest
(` million)
Period to which
the amount
relates
Forum where dispute is
pending
Central Excise
Act, 1994
Central
excise
11.89 0.89 April 2012 to
December 2015
CESTAT, New Delhi
Central Excise
Act, 1994
Central
excise
1.77 0.06 April 2012 to
June 2017
Additional Commissioner,
Bhiwadi
Central Excise
Act, 1994
Central
excise
4.51 0.51 March 2012 to
December 2016
Commissioner Appeal
Bhiwadi
Central Excise
Act, 1994
Central
excise
11.39 - March 2011 to
March 2013
High Court, Jaipur
Central Excise
Act, 1994
Central
excise
1.27 0.13 2014-15 CESTAT Allahabad
Central Excise
Act, 1994
Central
Excise
0.20 0.03 September 14 -
June 2015
Commissioner (Appeal),
Meerut
Central Excise
Act, 1994
Central
excise
0.78 - April 2013 to
February 2016
Commissioner (Appeal),
Kolkata
Central Excise
Act, 1994
Central
excise
3.51 - July 2014 to
August 2014
Commissioner (Appeal),
Kolkata
Central Excise
Act, 1994
Central
excise
0.16 - March 2015 to
October 2016
Deputy Commissioner,
Panipat
Central Excise
Act, 1994
Central
excise
0.58 - March 2015 to
January 2016
Office of the Commissioner
of Central Excise, Sonepat
Central Excise
Act, 1994
Central
excise
13.69 0.68 April 2014 to
February 2015
Office of the Commissioner
of Central Tax, Panchkula
Central Excise
Act, 1994
Central
excise
0.12 - February 2016 to
March 2017
Office of the Commissioner
of Central Excise, Sonepat
Central Excise
Act, 1944
Central
excise
0.26 - April 17 to June
2018
Office of the Commissioner
of Central Excise, Sonepat
The Custom Act,
1962
Custom
Duty
45.37 - January 2017 to
December 2018
Principal Commissioner/
Commissioner of Custom
Maharashtra
The Uttar Pradesh
Goods and
Services Act, 2017
GST 1.26 1.26 June 2018-
December 2019
Additional Commissioner
Ghaziabad
Varun Beverages Limited206

name of the
statute
nature of
dues
amount
(` million)
amount paid
Under Protest
(` million)
Period to which
the amount
relates
Forum where dispute is
pending
The Uttar Pradesh
Goods and
Services Act, 2017
GST 0.04 0.04 March 2019 Assistant Commissioner,
Agra
The Haryana
Goods and
Services Act, 2017
GST 0.05 0.05 March 2019 Assistant Commissioner,
Panchkula
The Haryana
Goods and
Services Act, 2017
GST 0.20 0.20 July 2019 Assistant Commissioner,
Faridabad
The Haryana
Goods and
Services Act, 2017
GST 0.35 0.35 September 2019 Assistant Commissioner,
Panipat
The Kerela Goods
and Services Act,
2017
GST 0.23 0.23 November 2019 Assisstant Commissioner,
Palakkad
The Telangana
Goods and
Services Act, 2017
GST 0.04 0.04 December 2019 Assisstant Commissioner,
Sangareddy
The Uttar Pradesh
Value Added Tax
Act, 2008
Value
added tax
1.52 0.11 2001-2002 Additional Commissioner
(Appeals), Ghaziabad
The Uttar Pradesh
Value Added Tax
Act, 2008
Value
added tax
0.31 0.31 2016-17 and
2017-18
Additional Commissioner,
Ghaziabad
The Uttar Pradesh
Value Added Tax
Act, 2008
Value
added tax
10.36 2.72 January 2008 to
March 2010 and
2011-12
Joint Commissioner
Ghaziabad and Appellate
Tribunal
The Uttar Pradesh
Value Added Tax
Act, 2008
Value
added tax
16.38 7.09 2010-2012 Joint Commissioner,
Ghaziabad and Add.
Commissioner Ghaziabad
The Uttar Pradesh
Value Added Tax
Act, 2008
Value
added tax
0.10 0.10 2010-2011 Joint Commissioner, Kanpur
The Uttar Pradesh
Value Added Tax
Act, 2008
Value
added tax
0.38 0.38 2009-10, May
2015 and June
2016
Deputy Commissioner,
(Appeal) Jaipur
Haryana Value
Added Tax Act,
2003
Value
added tax
95.68 0.40 April 2015 to
March 2016
Excise and Taxation officer
/ Assessing Authority,
Mewat
Haryana Value
Added Tax Act,
2003
Value
added tax
35.53 0.49 April 2016 to
March 2017
Excise and Taxation Officer
/ Assessing Authority,
Mewat
Punjab Value
Added Tax Act,
2005
Value
added tax
0.18 - April 2015 to
March 2016
Assessing officer, Mohali
Punjab Value
Added Tax Act,
2005
Value
added tax
0.33 0.08 April 2015 to
March 2016
Value added tax tribunal,
Punjab and Chandigarh
Punjab Value
Added Tax Act,
2005
Value
added tax
0.19 0.14 April 2016 to
March 2017
The Deputy Excise and
Taxation Commissioner
(Appeals) / Joint Director
(Investigation), Bathinda
STATUTORY REPORTSCORPORATE OVERVIEW FINANCIAL STATEMENTS
Annual Report 2019 207
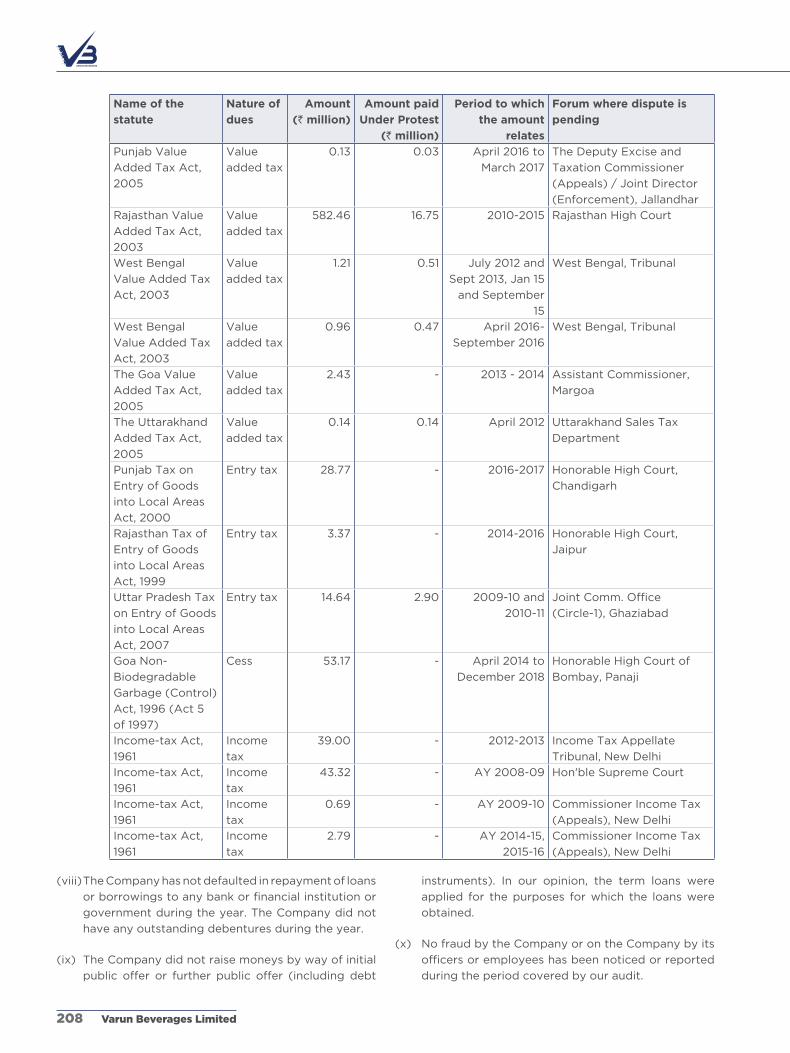
name of the
statute
nature of
dues
amount
(` million)
amount paid
Under Protest
(` million)
Period to which
the amount
relates
Forum where dispute is
pending
Punjab Value
Added Tax Act,
2005
Value
added tax
0.13 0.03 April 2016 to
March 2017
The Deputy Excise and
Taxation Commissioner
(Appeals) / Joint Director
(Enforcement), Jallandhar
Rajasthan Value
Added Tax Act,
2003
Value
added tax
582.46 16.75 2010-2015 Rajasthan High Court
West Bengal
Value Added Tax
Act, 2003
Value
added tax
1.21 0.51 July 2012 and
Sept 2013, Jan 15
and September
15
West Bengal, Tribunal
West Bengal
Value Added Tax
Act, 2003
Value
added tax
0.96 0.47 April 2016-
September 2016
West Bengal, Tribunal
The Goa Value
Added Tax Act,
2005
Value
added tax
2.43 - 2013 - 2014 Assistant Commissioner,
Margoa
The Uttarakhand
Added Tax Act,
2005
Value
added tax
0.14 0.14 April 2012 Uttarakhand Sales Tax
Department
Punjab Tax on
Entry of Goods
into Local Areas
Act, 2000
Entry tax 28.77 - 2016-2017 Honorable High Court,
Chandigarh
Rajasthan Tax of
Entry of Goods
into Local Areas
Act, 1999
Entry tax 3.37 - 2014-2016 Honorable High Court,
Jaipur
Uttar Pradesh Tax
on Entry of Goods
into Local Areas
Act, 2007
Entry tax 14.64 2.90 2009-10 and
2010-11
Joint Comm. Office
(Circle-1), Ghaziabad
Goa Non-
Biodegradable
Garbage (Control)
Act, 1996 (Act 5
of 1997)
Cess 53.17 - April 2014 to
December 2018
Honorable High Court of
Bombay, Panaji
Income-tax Act,
1961
Income
tax
39.00 - 2012-2013 Income Tax Appellate
Tribunal, New Delhi
Income-tax Act,
1961
Income
tax
43.32 - AY 2008-09 Hon'ble Supreme Court
Income-tax Act,
1961
Income
tax
0.69 - AY 2009-10 Commissioner Income Tax
(Appeals), New Delhi
Income-tax Act,
1961
Income
tax
2.79 - AY 2014-15,
2015-16
Commissioner Income Tax
(Appeals), New Delhi
(viii) The Company has not defaulted in repayment of loans
or borrowings to any bank or financial institution or
government during the year. The Company did not
have any outstanding debentures during the year.
(ix) The Company did not raise moneys by way of initial
public offer or further public offer (including debt
instruments). In our opinion, the term loans were
applied for the purposes for which the loans were
obtained.
(x) No fraud by the Company or on the Company by its
officers or employees has been noticed or reported
during the period covered by our audit.
Varun Beverages Limited208
(xi) Managerial remuneration has been paid and provided by the Company in accordance with the requisite approvals
mandated by the provisions of Section 197 of the Act read with Schedule V to the Act.
(xii) In our opinion, the Company is not a Nidhi company. Accordingly, provisions of clause 3(xii) of the Order are not
applicable.
(xiii) In our opinion all transactions with the related parties are in compliance with Sections 177 and 188 of Act, where
applicable, and the requisite details have been disclosed in the financial statements etc., as required by the
applicable Ind AS.
(xiv) During the year, the Company has made private placement of shares. In respect of the same, in our opinion, the
Company has complied with the requirement of Section 42 of the Act and the Rules framed thereunder. Further,
in our opinion, the amounts so raised have been used for the purposes for which the funds were raised. During the
year, the Company did not make preferential allotment of shares and preferential allotment/ private placement of
fully/partly convertible debentures.
(xv) In our opinion, the Company has not entered into any non-cash transactions with the directors or persons
connected with them covered under Section 192 of the Act.
(xvi) The Company is not required to be registered under Section 45-IA of the Reserve Bank of India Act, 1934.
For Walker Chandiok & Co llP For aPas & Co.
Chartered Accountants Chartered Accountants
Firm’s Registration No.: 001076N/N500013 Firm’s Registration No.: 000340C
anupam Kumar sumit Kathuria
Partner Partner
Membership No.: 501531 Membership No.: 520078
UDIN: 20501531AAAABI4629 UDIN: 20520078AAAABI9327
Place: Gurugram Place: Gurugram
Date: 07 February 2020 Date: 07 February 2020
L-41 Connaught Place, 606, 6th Floor, PP City Centre,
New Delhi 110 001 Road No. 44,
Pitampura, New Delhi 110 034
STATUTORY REPORTSCORPORATE OVERVIEW FINANCIAL STATEMENTS
Annual Report 2019 209

Independent auditor’s Report on the Internal Financial Controls under Clause (i) of sub-section 3 of section 143 of the Companies act, 2013 (‘the act’)
1. In conjunction with our audit of the standalone
financial statements of Varun Beverages Limited
(‘the Company’) as at and for the year ended 31
December 2019, we have audited the internal
financial controls over financial reporting (‘IFCoFR’)
of the Company as at that date.
Responsibilities of Management and those Charged with Governance for Internal Financial Controls
2. The Company’s Board of Directors is responsible
for establishing and maintaining internal financial
controls based on the internal control over financial
reporting criteria established by the Company
considering the essential components of internal
control stated in the Guidance Note on Audit of
Internal Financial Controls over Financial Reporting
(‘the Guidance Note’) issued by the Institute of
Chartered Accountants of India (‘ICAI’). These
responsibilities include the design, implementation
and maintenance of adequate internal financial
controls that were operating effectively for ensuring
the orderly and efficient conduct of the Company’s
business, including adherence to the Company’s
policies, the safeguarding of its assets, the prevention
and detection of frauds and errors, the accuracy and
completeness of the accounting records, and the
timely preparation of reliable financial information,
as required under the Act.
auditor’s Responsibility for the audit of the Internal Financial Controls
3. Our responsibility is to express an opinion on the
Company’s IFCoFR based on our audit. We conducted
our audit in accordance with the Standards on
Auditing issued by the ICAI prescribed under
Section 143(10) of the Act, to the extent applicable
to an audit of IFCoFR, and the Guidance Note issued
by the ICAI. Those Standards and the Guidance Note
require that we comply with ethical requirements
and plan and perform the audit to obtain reasonable
assurance about whether adequate IFCoFR were
established and maintained and if such controls
operated effectively in all material respects.
annexure II to the Independent auditor’s Report of even date to the members of Varun Beverages limited on the standalone financial statements for the year ended31 december 2019
4. Our audit involves performing procedures to obtain
audit evidence about the adequacy of the IFCoFR
and their operating effectiveness. Our audit of
IFCoFR includes obtaining an understanding of
IFCoFR, assessing the risk that a material weakness
exists, and testing and evaluating the design and
operating effectiveness of internal control based on
the assessed risk. The procedures selected depend
on the auditor’s judgement, including the assessment
of the risks of material misstatement of the financial
statements, whether due to fraud or error.
5. We believe that the audit evidence we have obtained
is sufficient and appropriate to provide a basis for
our audit opinion on the Company’s IFCoFR.
Meaning of Internal Financial Controls over Financial Reporting
6. A company’s IFCoFR is a process designed to
provide reasonable assurance regarding the
reliability of financial reporting and the preparation
of financial statements for external purposes in
accordance with generally accepted accounting
principles. A company’s IFCoFR include those
policies and procedures that (1) pertain to the
maintenance of records that, in reasonable detail,
accurately and fairly reflect the transactions and
dispositions of the assets of the company; (2)
provide reasonable assurance that transactions are
recorded as necessary to permit preparation of
financial statements in accordance with generally
accepted accounting principles, and that receipts
and expenditures of the company are being
made only in accordance with authorisations of
management and directors of the company; and (3)
provide reasonable assurance regarding prevention
or timely detection of unauthorised acquisition, use,
or disposition of the company’s assets that could
have a material effect on the financial statements.
Inherent limitations of Internal Financial Controls over Financial Reporting
7. Because of the inherent limitations of IFCoFR,
including the possibility of collusion or improper
management override of controls, material
misstatements due to error or fraud may occur and
not be detected. Also, projections of any evaluation
of the IFCoFR to future periods are subject to the
Varun Beverages Limited210

risk that the IFCoFR may become inadequate because of changes in conditions, or that the degree of compliance
with the policies or procedures may deteriorate.
opinion
8. In our opinion, the Company has, in all material respects, adequate internal financial controls over financial
reporting and such controls were operating effectively as at 31 December 2019, based on the internal control over
financial reporting criteria established by the Company considering the essential components of internal control
stated in the Guidance Note issued by the ICAI.
For Walker Chandiok & Co llP For aPas & Co.
Chartered Accountants Chartered Accountants
Firm’s Registration No.: 001076N/N500013 Firm’s Registration No.: 000340C
anupam Kumar sumit Kathuria
Partner Partner
Membership No.: 501531 Membership No.: 520078
UDIN: 20501531AAAABI4629 UDIN: 20520078AAAABI9327
Place: Gurugram Place: Gurugram
Date: 07 February 2020 Date: 07 February 2020
L-41 Connaught Place, 606, 6th Floor, PP City Centre,
New Delhi 110 001 Road No. 44,
Pitampura, New Delhi 110 034
STATUTORY REPORTSCORPORATE OVERVIEW FINANCIAL STATEMENTS
Annual Report 2019 211

Standalone Balance Sheetas at 31 December 2019
(` in million)Notes As at
31 December 2019As at
31 December 2018AssetsNon-current assets(a) Property, plant and equipment 4 48,399.67 27,983.04 (b) Capital work-in-progress 4 585.75 3,392.26 (c) Goodwill 5a 19.40 19.40 (d) Other intangible assets 5B 5,598.47 5,215.80 (e) Investment in subsidiaries and associates 6 9,077.83 7,744.99 (f) Financial assets (i) Investments 7 0.01 0.01 (ii) Loans 8 6,042.77 6,959.06 (iii) Others 9 8.90 8.34 (g) Other non-current assets 10 916.91 523.47
Total non-current assets 70,649.71 51,846.37 Current assets(a) Inventories 11 6,729.83 4,183.25 (b) Financial assets (i) Trade receivables 12 1,305.31 1,344.74 (ii) Cash and cash equivalents 13 323.51 17.75 (iii) Bank balances other than (ii) above 14 0.65 0.65 (iv) Loans 15 351.71 104.68 (v) Others 16 2,820.09 1,783.80 (c) Other current assets 17 1,554.83 1,581.41
Total current assets 13,085.93 9,016.28 Total assets 83,735.64 60,862.65
Equity and liabilitiesEquity(a) Equity share capital 18 2,886.89 1,826.42 (b) Other equity 19 35,784.28 24,062.97
Total equity 38,671.17 25,889.39 LiabilitiesNon-current liabilities(a) Financial liabilities (i) Borrowings 20a 22,917.07 18,359.13 (b) Provisions 21 1,606.73 976.50 (c) Deferred tax liabilities (Net) 22 2,761.29 2,026.27 (d) Other non-current liabilities 23 8.23 44.33
Total non-current liabilities 27,293.32 21,406.23 Current liabilities(a) Financial liabilities (i) Borrowings 20B 4,110.44 3,188.75 (ii) Trade payables (a) Total outstanding dues of micro enterprises and small
enterprises24 17.79 2.47
(b) Total outstanding dues of creditors other than micro enterprises and small enterprises
24 3,160.99 1,780.71
(iii) Otherfinancialliabilities 25 8,485.19 6,943.00 (b) Other current liabilities 26 1,593.72 1,224.09 (c) Provisions 21 288.79 152.28 (d) Current tax liabilities (Net) 27 114.23 275.73
Total current liabilities 17,771.15 13,567.03 Total liabilities 45,064.47 34,973.26
Total equity and liabilities 83,735.64 60,862.65
Significantaccountingpolicies 3
Theaccompanyingnotesareanintegralpartofthestandalonefinancialstatements. For and on behalf of the Board of Directors ofas per our report of even date attached. Varun Beverages Limited
For Walker Chandiok & Co LLP For APAS & Co. Varun Jaipuria Raj Pal GandhiChartered accountants Chartered accountants Whole Time Director Whole Time DirectorFirm’s Registration No.: 001076N/N500013 Firm’s Registration No.: 000340C DIN 02465412 DIN 00003649
Anupam Kumar Sumit Kathuria Vikas Bhatia Kapil AgarwalPartner Partner ChiefFinancialOfficer ChiefExecutiveOfficer Membership No.: 501531 Membership No.: 520078 and Whole Time Director DIN 02079161
Ravi Batra ChiefRiskOfficerand Place : Gurugram Group Company Secretary Dated : 07 February 2020 Membership No. F-5746
Varun Beverages Limited212

Standalone Statement of Profit and LossFor the year ended 31 December 2019
(` in million)
Notes Year ended 31 December 2019
Year ended 31 December 2018
Income
Revenue from operations 28 56,156.64 38,622.76
Other income 29 980.07 916.39
Total income 57,136.71 39,539.15
Expenses
Cost of materials consumed 30 23,480.22 16,603.01
Purchases of stock-in-trade 31 3,963.29 1,829.00
Changesininventoriesoffinishedgoods,stock-in-tradeandwork-in-progress
32 (1,324.13) (687.86)
Employeebenefitsexpense 33 6,308.13 4,114.72
Finance costs 34 2,802.48 1,943.98
Depreciation and amortization expense 35 3,872.02 2,955.50
Other expenses 36 11,691.79 8,151.22
Total expenses 50,793.80 34,909.57
Profit before tax 6,342.91 4,629.58
Tax expense
(a) Current tax 27 948.70 797.90
(b) adjustment of tax relating to earlier periods 27 9.86 14.35
(c) Deferred tax 22 898.88 493.74
Total tax expense 1,857.44 1,305.99
Net profit for the year 4,485.47 3,323.59
Other comprehensive income 37
(a) ItemsthatwillnottobereclassifiedtoStatementofProfitand Loss:
(i) Re-measurementlossesondefinedbenefitplans (94.59) (22.54)
(ii) IncometaxrelatingtoitemsthatwillnotbereclassifiedtoStatementofProfitandLoss
33.05 7.78
(iii) Gain from a bargain purchase 49a 344.43 -
Total other comprehensive income 282.89 (14.76)
Total comprehensive income for the year 4,768.36 3,308.83
Earnings per equity share of face value of ` 10 each
Basic (`) 40 16.10 12.13
Diluted (`) 40 16.10 12.13
Significantaccountingpolicies 3
Theaccompanyingnotesareanintegralpartofthestandalonefinancialstatements. For and on behalf of the Board of Directors ofas per our report of even date attached. Varun Beverages Limited
For Walker Chandiok & Co LLP For APAS & Co. Varun Jaipuria Raj Pal GandhiChartered accountants Chartered accountants Whole Time Director Whole Time DirectorFirm’s Registration No.: 001076N/N500013 Firm’s Registration No.: 000340C DIN 02465412 DIN 00003649
Anupam Kumar Sumit Kathuria Vikas Bhatia Kapil AgarwalPartner Partner ChiefFinancialOfficer ChiefExecutiveOfficer Membership No.: 501531 Membership No.: 520078 and Whole Time Director DIN 02079161
Ravi Batra ChiefRiskOfficerand Place : Gurugram Group Company Secretary Dated : 07 February 2020 Membership No. F-5746
STATUTORY REPORTSCORPORATE OVERVIEW FINANCIAL STATEMENTS
Annual Report 2019 213

Standalone Cash Flow StatementFor the year ended 31 December 2019
(Indirect Method) (` in million)
Particulars Year ended 31 December 2019
Year ended 31 December 2018
A. Operating activities
Profitbeforetax 6,342.91 4,629.58
Adjustments to reconcile profit before tax to net cash flows:
Depreciation on property, plant and equipment 3,820.72 2,922.50
amortization of intangible assets 51.30 33.00
Interest expense at amortized cost 2,715.81 1,864.04
Interest income at amortized cost (276.93) (297.66)
Dividend income from non-current investment in subsidiary (248.80) (192.19)
Dividend income from current investments (0.20) -
(Gain)/loss on disposal of property, plant and equipment (Net) (45.06) 34.91
Bad debts and advances written off 1.97 64.73
Excess provisions written back (150.18) (6.54)
Profitonsaleofcurrentinvestments (1.38) -
Guarantee commission income (41.80) (29.55)
Unrealizedforeignexchangefluctuation (48.60) (107.94)
allowance for expected credit loss - 33.52
Operatingprofitbeforeworkingcapitalchanges 12,119.76 8,948.40
Working capital adjustments:
Increase in inventories (1,469.90) (1,026.55)
Decrease/(increase) in trade receivables 77.61 (496.09)
Increaseincurrentandnon-currentfinancialassetsandothercurrentand non-current assets
(930.45) (1,367.20)
Increaseincurrentfinancialliabilitiesandothercurrentandnon-current liabilities and provisions
1,951.31 1,951.16
Total cash from operations 11,748.33 8,009.72
Income tax paid (1,101.39) (589.26)
Net cash flows from operating activities (A) 10,646.94 7,420.46
B. Investing activities
Purchase of property, plant and equipment and intangible assets (including adjustment on account of capital work-in-progress, capital advances and capital creditors)
(6,516.70) (5,663.59)
Proceeds from disposal of property, plant and equipment and intangible assets
216.43 672.00
Loan given to subsidiaries (211.23) (1,557.91)
Redemptionofpreferenceshares(classifiedasloangiventosubsidiary)
89.15 94.05
acquisition under business combination (Refer note 49) (16,251.55) (491.80)
Purchase of investments in subsidiaries (150.38) (627.35)
Government grant related to assets received 251.05 -
Proceeds from sale of current investments 731.38 0.03
Purchase of current investments (730.00) -
Guarantee commission received 19.83 12.19
Interest received 35.14 336.92
Dividend income from current investments 0.20 -
Dividend income from non-current investment in subsidiary 223.27 180.92
Net cash used in investing activities (B) (22,293.41) (7,044.54)
Varun Beverages Limited214

(Indirect Method) (` in million)
Particulars Year ended 31 December 2019
Year ended 31 December 2018
C. Financing activities
Proceeds from borrowings 18,373.71 12,131.83
Repayment of borrowings (12,264.34) (5,870.24)
Repayment of deferred payment liabilities (433.87) (3,020.71)
Proceeds from short-term borrowings (Net) 921.69 1,262.87
Proceeds from issue of share capital (including share premium thereon)
9,001.80 7.15
Redemption of non-convertible debentures - (3,000.00)
Interest paid (2,705.71) (1,671.02)
Share issue expenses paid (164.36) -
Dividends paid (684.96) (455.98)
Dividend distribution tax paid (91.73) (54.71)
Net cash flows from /(used in) financing activities (C) 11,952.23 (670.81)
Net change in cash and cash equivalents (D=A+B+C) 305.76 (294.89)
Cash and cash equivalents at the beginning of year (E) 17.75 312.64
Cash and cash equivalents at the end of year (D+E) (Refer note 13) 323.51 17.75
Notes:
(a) Reconciliation between the opening and closing balances in the balance sheet for liabilities arising from financing
activities, including both changes arising from cash flows and non-cash changes pursuant to Ind aS 7:
(` in million)
Non-current borrowings*
Current borrowings
Balance as at 01 January 2019 22,165.64 3,188.75 Cashflows(Net) 5,675.50 921.69 Non-cash changes:Impact of fair value changes (10.70) - Impactofexchangefluctuation 67.49 - Balance as at 31 December 2019 27,897.93 4,110.44
Balance as at 01 January 2018 21,921.78 1,925.88 Cashflows(Net) 240.88 1,262.87 Non-cash changes:Impact of fair value changes (103.55) - Impactofexchangefluctuation 106.53 - Balance as at 31 December 2018 22,165.64 3,188.75
*includes current maturity of long-term debts and current portion of deferred payment liabilities amounts to ` 4,980.86 (31 December 2018: ` 3,806.51).
(b) Excludes non-cash transaction of conversion of loans into equity investments. (Refer note 6)
Theaccompanyingnotesareanintegralpartofthestandalonefinancialstatements. For and on behalf of the Board of Directors ofas per our report of even date attached. Varun Beverages Limited
For Walker Chandiok & Co LLP For APAS & Co. Varun Jaipuria Raj Pal GandhiChartered accountants Chartered accountants Whole Time Director Whole Time DirectorFirm’s Registration No.: 001076N/N500013 Firm’s Registration No.: 000340C DIN 02465412 DIN 00003649
Anupam Kumar Sumit Kathuria Vikas Bhatia Kapil AgarwalPartner Partner ChiefFinancialOfficer ChiefExecutiveOfficer Membership No.: 501531 Membership No.: 520078 and Whole Time Director DIN 02079161
Ravi Batra ChiefRiskOfficerand Place : Gurugram Group Company Secretary Dated : 07 February 2020 Membership No. F-5746
STATUTORY REPORTSCORPORATE OVERVIEW FINANCIAL STATEMENTS
Annual Report 2019 215
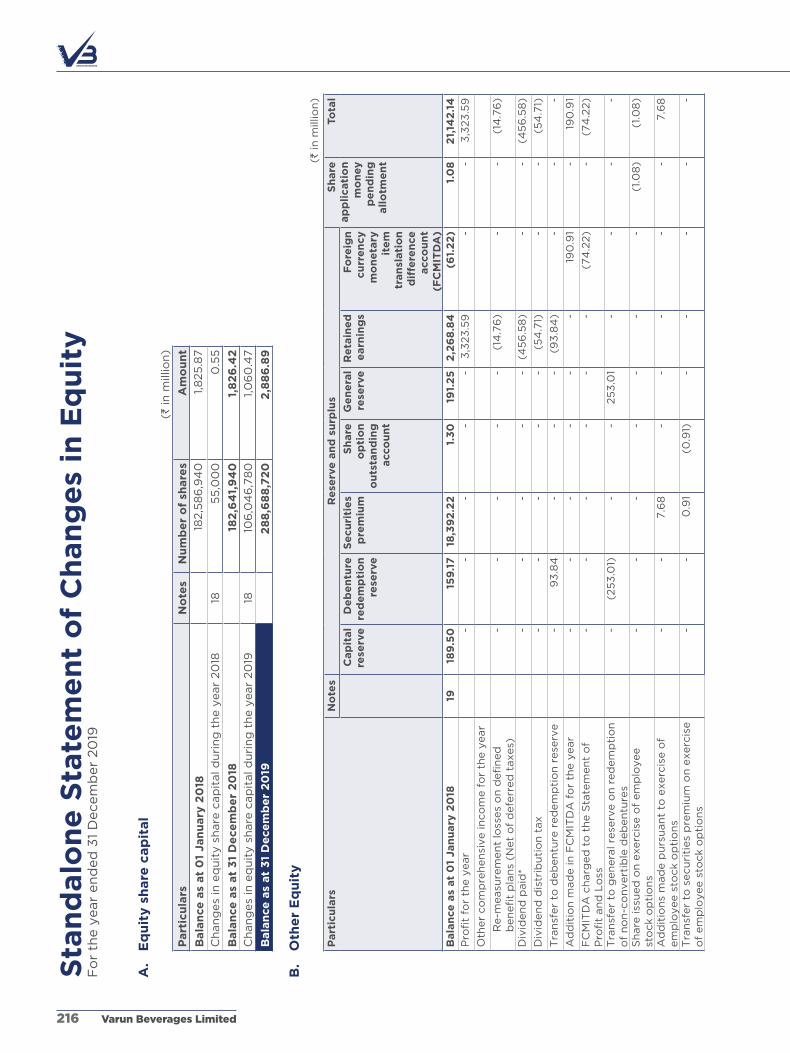
Sta
nd
alo
ne
Sta
tem
en
t o
f C
han
ge
s in
Eq
uit
yF
or
the y
ear
en
ded
31
Decem
ber
20
19
A.
Eq
uit
y s
hare
cap
ital
(` in
mill
ion
)
Part
icu
lars
No
tes
Nu
mb
er
of
share
sA
mo
un
t
Bala
nce
as
at
01
Jan
uary
20
18 1
82,5
86
,94
0
1,8
25
.87
Ch
an
ges
in e
qu
ity s
hare
cap
ital d
uri
ng
th
e y
ear
20
1818
55
,00
0
0.5
5
Bala
nce
as
at
31
De
ce
mb
er
20
18 1
82
,64
1,9
40
1
,82
6.4
2
Ch
an
ges
in e
qu
ity s
hare
cap
ital d
uri
ng
th
e y
ear
20
1918
10
6,0
46
,78
0
1,0
60
.47
Bala
nce
as
at
31
De
ce
mb
er
20
19 2
88
,68
8,7
20
2
,88
6.8
9
B.
Oth
er
Eq
uit
y
(` in
mill
ion
)
Part
icu
lars
No
tes
Re
serv
e a
nd
su
rplu
sS
hare
ap
pli
cati
on
m
on
ey
pe
nd
ing
all
otm
en
t
Tota
l
Cap
ital
rese
rve
D
eb
en
ture
re
de
mp
tio
n
rese
rve
Se
cu
riti
es
pre
miu
mS
hare
o
pti
on
o
uts
tan
din
g
acco
un
t
Ge
ne
ral
rese
rve
R
eta
ine
d
earn
ing
sF
ore
ign
cu
rre
ncy
mo
ne
tary
it
em
tr
an
slati
on
d
iffe
ren
ce
acco
un
t (F
CM
ITD
A)
Bala
nce
as
at
01
Jan
uary
20
1819
18
9.5
0
15
9.1
7
18
,39
2.2
2
1.3
0
19
1.2
5
2,2
68
.84
(
61.
22
) 1
.08
2
1,14
2.1
4
Profitfortheyear
-
-
-
-
-
3,3
23
.59
-
-
3
,323
.59
Oth
er
co
mp
reh
en
sive in
co
me f
or
the y
ear
Re-m
easurementlossesondefined
benefitplans(Netofdeferredtaxes)
-
-
-
-
-
(14
.76
) -
-
(
14.7
6)
Div
iden
d p
aid
* -
-
-
-
-
(
45
6.5
8)
-
-
(4
56
.58
)
Div
iden
d d
istr
ibu
tio
n t
ax
-
-
-
-
-
(5
4.7
1) -
-
(
54
.71)
Tra
nsf
er
to d
eb
en
ture
red
em
pti
on
rese
rve
-
93
.84
-
-
-
(
93
.84
) -
-
-
ad
dit
ion
mad
e in
FC
MIT
Da
fo
r th
e y
ear
-
-
-
-
-
-
19
0.9
1 -
1
90
.91
FC
MIT
Da
ch
arg
ed
to
th
e S
tate
men
t o
f ProfitandLoss
-
-
-
-
-
-
(74
.22)
-
(74
.22)
Tra
nsf
er
to g
en
era
l re
serv
e o
n r
ed
em
pti
on
o
f n
on
-co
nvert
ible
deb
en
ture
s -
(
25
3.0
1) -
-
2
53
.01
-
-
-
-
Sh
are
iss
ued
on
exerc
ise o
f em
plo
yee
sto
ck o
pti
on
s -
-
-
-
-
-
-
(
1.0
8)
(1.
08
)
ad
dit
ion
s m
ad
e p
urs
uan
t to
exerc
ise o
f em
plo
yee s
tock o
pti
on
s -
-
7
.68
-
-
-
-
-
7
.68
Tra
nsf
er
to s
ecu
riti
es
pre
miu
m o
n e
xerc
ise
of
em
plo
yee s
tock o
pti
on
s -
-
0
.91
(0
.91)
-
-
-
-
-
Varun Beverages Limited216

(` in
mill
ion
)
Part
icu
lars
No
tes
Re
serv
e a
nd
su
rplu
sS
hare
ap
pli
cati
on
m
on
ey
pe
nd
ing
all
otm
en
t
Tota
l
Cap
ital
rese
rve
D
eb
en
ture
re
de
mp
tio
n
rese
rve
Se
cu
riti
es
pre
miu
mS
hare
o
pti
on
o
uts
tan
din
g
acco
un
t
Ge
ne
ral
rese
rve
R
eta
ine
d
earn
ing
sF
ore
ign
cu
rre
ncy
mo
ne
tary
it
em
tr
an
slati
on
d
iffe
ren
ce
acco
un
t (F
CM
ITD
A)
Bala
nce
as
at
31
De
ce
mb
er
20
1819
18
9.5
0
-
18,4
00
.81
0.3
9
44
4.2
6
4,9
72
.54
5
5.4
7
-
24
,06
2.9
7
Profitfortheyear
-
-
-
-
-
4,4
85
.47
-
-
4,4
85
.47
Oth
er
co
mp
reh
en
sive in
co
me f
or
the y
ear
Re-m
easurementlossesondefined
benefitplans(Netofdeferredtaxes)
-
-
-
-
-
(6
1.5
4)
-
-
(6
1.5
4)
Gain
fro
m a
barg
ain
pu
rch
ase
(re
fer
no
te 4
9a
) 3
44
.43
-
-
-
-
-
-
-
3
44
.43
Div
iden
d p
aid
* -
-
-
-
-
(
68
4.9
6)
-
-
(6
84
.96
)
Div
iden
d d
istr
ibu
tio
n t
ax
-
-
-
-
-
(9
1.73
) -
-
(
91.
73
)
ad
dit
ion
mad
e in
FC
MIT
Da
fo
r th
e y
ear
-
-
-
-
-
-
(2.2
2)
-
(2.2
2)
FC
MIT
Da
ch
arg
ed
to
th
e S
tate
men
t o
f ProfitandLoss
-
-
-
-
-
-
(4
5.1
1) -
(
45
.11)
ad
dit
ion
s m
ad
e p
urs
uan
t to
exerc
ise o
f em
plo
yee s
tock o
pti
on
s -
-
1
.85
-
-
-
-
-
1
.85
Tra
nsf
er
to s
ecu
riti
es
pre
miu
m o
n e
xerc
ise
of
em
plo
yee s
tock o
pti
on
s -
-
0
.22
(0
.22)
-
-
-
-
-
ad
just
men
t o
n a
cco
un
t o
f em
plo
yee s
tock
op
tio
ns
lap
sed
-
-
-
(0
.17)
-
-
-
-
(0
.17)
am
ou
nt
uti
lized
fo
r b
on
us
issu
e -
-
(
913
.28
) -
-
-
-
-
(
913
.28
)
ad
dit
ion
s m
ad
e o
n iss
ue o
f eq
uit
y
sharespursuanttoQualifiedinstitutions
pla
cem
en
t (R
efe
r n
ote
18
(h))
-
-
8,8
52.9
3
-
-
-
-
-
8,8
52.9
3
am
ou
nt
uti
lized
fo
r sh
are
iss
ue e
xp
en
ses
(Refe
r n
ote
58
) -
-
(
164
.36
) -
-
-
-
-
(
164
.36
)
Bala
nce
as
at
31
De
ce
mb
er
20
1919
53
3.9
3
-
26
,17
8.1
7
-
44
4.2
6
8,6
19.7
8
8.1
4
-
35
,78
4.2
8
*Tra
nsa
cti
on
wit
h o
wn
ers
in
th
eir
cap
acit
y a
s o
wn
er
Theaccompanyingnotesareanintegralpartofthestandalonefinancialstatements.
Fo
r an
d o
n b
eh
alf
of
the
Bo
ard
of
Dir
ecto
rs o
fa
s p
er
ou
r re
po
rt o
f even
date
att
ach
ed
. V
aru
n B
eve
rag
es
Lim
ite
d
Fo
r W
alk
er
Ch
an
dio
k &
Co
LL
P
Fo
r A
PA
S &
Co
. V
aru
n J
aip
uri
a
Raj
Pal
Gan
dh
iC
hart
ere
d a
cco
un
tan
ts
Ch
art
ere
d a
cco
un
tan
ts
Wh
ole
Tim
e D
irecto
r W
ho
le T
ime D
irecto
rF
irm
’s R
eg
istr
ati
on
No
.: 0
010
76
N/N
50
00
13
Fir
m’s
Reg
istr
ati
on
No
.: 0
00
34
0C
D
IN 0
24
65
412
D
IN 0
00
03
64
9
An
up
am
Ku
mar
Su
mit
Kath
uri
a
Vik
as
Bh
ati
a
Kap
il A
garw
al
Partner
Partner
ChiefFinancialOfficer
ChiefExecutiveOfficer
Mem
bers
hip
No
.: 5
015
31
Mem
bers
hip
No
.: 5
20
078
an
d W
ho
le T
ime D
irecto
r
DIN
020
79
161
R
avi
Batr
a
ChiefRiskOfficerand
Pla
ce : G
uru
gra
m
Gro
up
Co
mp
an
y S
ecre
tary
D
ate
d : 0
7 F
eb
ruary
20
20
M
em
bers
hip
No
. F-5
74
6
STATUTORY REPORTSCORPORATE OVERVIEW FINANCIAL STATEMENTS
Annual Report 2019 217

Summary of significant accounting policies and other explanatory information on the Standalone Financial Statements for the year ended 31 December 2019
1. Corporate information
Varun Beverages Limited (the “Company”) is a public
limited Company domiciled in India. Its registered
office is at F-2/7, Okhla Industrial area, Phase-I, New
Delhi- 110 020. The Company’s equity shares are
listed on Bombay Stock Exchange Limited (“BSE”)
and National Stock Exchange of India (“NSE”). The
Company was incorporated on 16 June 1995 under
the provision of the Companies act, 1956. The
Company is primarily engaged in manufacturing,
selling, bottling and distribution of beverages of
PepsiCo’s brand in geographically pre-defined
territories as per franchisee agreement with PepsiCo
India Holdings Private Limited.
2. Basis for preparation
These standalone financial statements (“financial
statements”) of the Company have been prepared
in accordance with Indian accounting Standard
(“Ind aS”) and comply with requirements of Ind aS
notified under section 133 of the Companies act,
2013 (“the act”), read together with the Companies
(Indian accounting Standards) Rules, 2015 as
amended from time to time, stipulation contained in
Schedule III (Revised) and other pronouncements/
provisions of applicable laws. These financial
statements are authorized for issue on 07 February
2020 in accordance with a resolution of the Board
of Directors. The Board of Directors can permit the
revision to the financial statements after obtaining
necessary approvals or at the instance of regulatory
authorities as per provisions of the act.
These financial statements have been prepared
using the significant accounting policies and
measurement basis summarized below. These
accounting policies have been used consistently
throughout all periods presented in these standalone
financial statements except as mentioned in
note 3.2 below.
The financial statements have been prepared on
a historical cost basis, except for the following
assets and liabilities which have been measured at
fair value:
(i) Derivative financial instruments;
(ii) Certain financial assets and liabilities measured
at fair value (refer accounting policy regarding
financial instruments);
(iii) Defined benefit plans- plan assets measured at
fair value; and
(iv) Share based payments.
The Company presents assets and liabilities in
the balance sheet based on current/non-current
classification. an asset is treated as current if it
satisfies any of the following conditions:
(i) Expected to be realized or intended to sold or
consumed in normal operating cycle;
(ii) Held primarily for the purpose of trading;
(iii) Expected to be realized within twelve months
after the reporting period;
(iv) Cash or cash equivalent unless restricted from
being exchanged or used to settle a liability
for at least twelve months after the reporting
period.
all other assets are classified as non-current.
a liability is current if it satisfies any of the following
conditions:
(i) It is expected to be settled in normal operating
cycle;
(ii) It is held primarily for the purpose of trading;
(iii) It is due to be settled within twelve months
after the reporting period; or
(iv) There is no unconditional right to defer the
settlement of the liability for at least twelve
months after the reporting period
all other liabilities are classified as non-current.
Deferred tax assets and liabilities are classified as
non-current assets and liabilities.
The operating cycle is the time between the
acquisition of assets for processing and its realization
in cash and cash equivalents. The Company has
identified twelve months as its operating cycle.
The Company follows calendar year as its financial
year as approved by the Company Law Board, New
Delhi.
The financial statements of the Company are
presented in Indian Rupees (`), which is also its
functional currency and all amounts disclosed in the
Varun Beverages Limited218

Summary of significant accounting policies and other explanatory information on the Standalone Financial Statements for the year ended 31 December 2019
financial statements and notes have been rounded
off to the nearest million as per the requirement of
Schedule III to the act, unless otherwise stated.
3. Significant accounting policies
3.1 Fair value measurements
The Company measures financial instruments
at fair value which is the price that would be
received to sell an asset or paid to transfer a
liability in an orderly transaction between
independent market participants at the
measurement date. The fair value measurement
is based on the presumption that the transaction
to sell the asset or transfer the liability takes
place either:
In the principal market for the asset or
liability, or
In the absence of a principal market, in the
most advantageous market for the asset or
liability.
all assets and liabilities for which fair value
is measured or disclosed in the financial
statements are categorized within the fair value
hierarchy, described as follows, based on the
lowest level input that is significant to the fair
value measurement as a whole:
Level 1 - Quoted (unadjusted) market prices in
active markets for identical assets or liabilities;
Level 2 - Valuation techniques for which the
lowest level input that is significant to the fair
value measurement is directly or indirectly
observable; and
Level 3 - Valuation techniques for which the
lowest level input that is significant to the fair
value measurement is unobservable.
The Company uses valuation techniques that
are appropriate in the circumstances and for
which sufficient data are available to measure
fair value, maximising the use of relevant
observable inputs and minimising the use of
unobservable inputs. For assets and liabilities
that are recognized in the balance sheet at
fair value on a recurring basis, the Company
determines whether transfers have occurred
between levels in the hierarchy by re-assessing
categorization (based on the lowest level input
that is significant to the fair value measurement
as a whole) at the end of each reporting period.
For the purpose of fair value disclosures, the
Company has determined classes of assets
and liabilities on the basis of the nature,
characteristics and risks of the asset or liability
and the level of the fair value hierarchy as
explained above.
3.2 Revenue recognition
Application of New Accounting Pronouncement:
With effect from 01 January 2019, the Company
has adopted Ind aS 115, 'Revenue from Contracts
with Customers' using cumulative effect
approach which does not require comparative
information to be restated in the standalone
financial statements. The standard is applied
retrospectively only to contracts that were not
completed as at the date of initial application (i.e.,
01 January 2019). There was no material impact
of above in the opening balance sheet as at 01
January 2019 and on the Statement of Profit and
Loss for the year ended 31 December 2019.
Under Ind aS 115, revenue is recognized upon
transfer of control of promised goods or
services to customers at an amount that reflects
the consideration to which the Company is
expected to be entitled to in exchange for
those goods or services. Revenue towards
satisfaction of a performance obligation is
measured at the amount of transaction price
allocated to that performance obligation as per
contractually agreed terms with the customers.
The transaction price of goods sold and
services rendered is net of various discounts
and schemes offered by the Company as part
of the contract. Revenue is recorded provided
the recovery of consideration is probable and
determinable. Revenue from sale of goods
and services transferred to distributors/
intermediaries are recognized at a point in time.
a) Sale of goods:
Revenue from the sale of manufactured
and traded goods products is recognized
upon transfer of control of products to
STATUTORY REPORTSCORPORATE OVERVIEW FINANCIAL STATEMENTS
Annual Report 2019 219

Summary of significant accounting policies and other explanatory information on the Standalone Financial Statements for the year ended 31 December 2019
the customers which coincides with their
delivery to customer and is measured at fair
value of consideration received/receivable,
net of discounts, amount collected on
behalf of third parties and applicable taxes.
b) Interest:
Interest income is recognized on time
proportion basis taking into account the
amount outstanding and rate applicable.
For all debt instruments measured at
amortized cost, interest income is recorded
using the effective interest rate (“EIR”).
EIR is the rate that exactly discounts the
estimated future cash payments or receipts
over the expected life of the financial
instrument or a shorter period, where
appropriate, to the gross carrying amount
of the financial assets. Interest income is
included in other income in the Statement
of Profit and Loss.
c) Dividends:
Dividend is recognized when the
Company’s right to receive the payment
is established, which is generally when
shareholders approve the dividend.
d) Commission:
Commission income is recognized rateably
over the contract period as per the agreed
contractual terms.
e) Services rendered:
Revenue from service related activities
including management and technical
know-how service is recognized as and
when services are rendered and on the
basis of contractual terms with the parties.
3.3 Inventories
Inventories are valued as follows:
(a) Raw materials, components, stores and
spares: at lower of cost and net realisable
value. Cost of inventory comprises all costs
of purchases, duties, taxes (other than
those subsequently recoverable from tax
authorities) and all other costs incurred
in bringing the inventory to their present
location and condition and is determined
on a moving weighted average cost basis.
(b) However, materials and other items held
for use in the production of inventories
are not written down below cost if the
finished products in which they will be
incorporated are expected to be sold at
or above cost.
(c) Work-in-progress: at lower of cost and
net realisable value. Cost for this purpose
includes material, labour and appropriate
allocation of overheads including
depreciation. Cost is determined on a
weighted average basis.
(d) Intermediate goods/ Finished goods:
(i) Self manufactured - at lower of cost
and net realisable value. Cost for this
purpose includes material, labour and
appropriate allocation of overheads.
Cost is determined on a weighted
average basis.
(ii) Traded - at lower of cost and net
realisable value. Cost of inventory
comprises all costs of purchases,
duties, taxes (other than those
subsequently recoverable from
tax authorities) and all other costs
incurred in bringing the inventory to
their present location and condition
and is determined on a weighted
average cost basis.
Net realisable value is the estimated selling
price in the ordinary course of business,
less estimated costs of completion and
estimated costs necessary to make the sale.
Provision for obsolescence is determined
based on management’s assessment and
is charged to the Statement of Profit and
Loss.
3.4 Property, plant and equipment
Measurement at recognition:
Property, plant and equipment and capital
work-in progress are stated at cost, net of
accumulated depreciation and accumulated
impairment losses, if any.
Varun Beverages Limited220

Summary of significant accounting policies and other explanatory information on the Standalone Financial Statements for the year ended 31 December 2019
Cost comprises the purchase price, borrowing
costs if capitalization criteria are met and any
directly attributable cost of bringing the asset
to its working condition for the intended use.
any trade discounts and rebates are deducted
in arriving at the purchase price. The cost of an
item of property, plant and equipment shall be
recognized as an asset if, and only if:
(a) it is probable that future economic benefits
associated with the item will flow to the
entity; and
(b) the cost of the item can be measured
reliably.
Subsequent expenditure related to an item
of property, plant and equipment is added to
its book value only if it increased the future
benefits from the existing asset beyond its
previously assessed standard of performance.
all other expenses on existing assets, including
day-to-day repair and maintenance expenditure
and cost of replacing parts, are charged to the
Statement of Profit and Loss for the period
during which such expenses are incurred.
Expenditure directly relating to construction
activity is capitalized. Indirect expenditure
incurred during construction period is
capitalized as a part of indirect construction
cost to the extent the expenditure is related
to construction or is incidental thereto. Other
indirect costs incurred during the construction
periods which are not related to construction
activity nor are incidental thereto are charged
to the Statement of Profit and Loss.
Value for individual assets acquired for a
consolidated price, the cost is apportioned to
the various assets on their relative fair values
basis as determined by competent valuers.
Depreciation:
The management has estimated, supported
by technical assessment, the useful lives of
property, plant and equipment. The management
believes that these estimated useful lives are
realistic and reflect fair approximation of the
period over which the assets are likely to be
used. Depreciation is calculated on a straight-
line basis over the estimated useful lives of the
assets as follows:
Description Useful lives (upto)
Leasehold land Over lease period
Buildings-factory 30 years
Buildings-others 60 years
Plant and equipment 20 years
Furnitureandfixtures 10 years
Delivery vehicles 10 years
Vehicles (other than delivery vehicles)
7 years
Officeequipment 4 years
Computer equipment 4 years
Containers 6 years
Post-mix vending machines and refrigerators (Visi - Cooler)
8 years
Power generating assets 22 years
Freehold land is not depreciated.
Depreciation on property, plant and
equipment is provided over the useful lives
of assets as specified in Schedule II to the
act except where the management, based
on independent technical assessment,
depreciates certain assets are over estimated
useful lives which are different from the useful
lives prescribed in the Schedule II to the act.
The Company has used the remaining useful
lives to compute depreciation on its property,
plant and equipment, acquired under the
business transfer agreement based on external
technical evaluation.
Depreciation on property, plant and equipment
which are added/disposed off during the year is
provided on pro-rata basis with reference to the
month of addition/deletion.
The Company has technically evaluated all the
property, plant and equipment for determining
the separate identifiable assets having different
useful lives under the component approach. On
technical evaluation of all separate identifiable
components, the management is of the opinion
that they do not have any different useful life
from that of the principal asset.
In case of revaluation of leasehold land, the
resulting amortization of the total revalued
amount is expensed off to the Statement of
Profit and Loss.
STATUTORY REPORTSCORPORATE OVERVIEW FINANCIAL STATEMENTS
Annual Report 2019 221

Summary of significant accounting policies and other explanatory information on the Standalone Financial Statements for the year ended 31 December 2019
Derecognition:
an item of property, plant and equipment
and any significant part initially recognized
is de-recognized upon disposal or when no
future economic benefits are expected from
its use or disposal. any gain or loss arising on
de-recognition of the asset (calculated as the
difference between the net disposal proceeds
or amount of security deposit adjusted and the
carrying amount of the asset) is included in the
Statement of Profit and Loss when the asset is
de-recognized.
Breakages of containers are adjusted on ‘first
bought first broken’ basis, since it is not feasible
to specifically identify the broken containers in
the fixed assets records.
3.5 Intangible assets
Intangible assets are initially recognized at:
(a) In case the assets are acquired separately
then at cost,
(b) In case the assets are acquired in a business
combination or under any asset purchase
agreement at fair value.
Following initial recognition, intangible assets
are carried at cost less any accumulated
amortization and accumulated impairment
loss. Intangible assets with finite useful life
are assessed for impairment whenever there
is an indication that the intangible assets may
be impaired. amortization of intangible assets
such as softwares and distribution network is
computed on a straight-line basis, at the rates
representing estimated useful life of 4 years and
8 years respectively.
The franchise rights and trademarks acquired
as part of business combinations normally have
a remaining legal life of not exceeding twenty
years but is renewable every twenty years and
is well established. The Company intends to
renew these rights continuously and evidence
supports its ability to do so. an analysis
of product life cycle studies, market and
competitive trends provides evidence that the
product will generate net cash inflows for the
Company for an indefinite period. Therefore,
these rights have been carried at cost without
amortization, but is tested for impairment
annually, at the cash-generating unit level.
The assessment of indefinite life is reviewed
annually to determine whether the indefinite life
continues to be supportable. If not, the change
in useful life from indefinite to finite is made on
a prospective basis.
3.6 Borrowing costs
Borrowing costs include interest, amortization
of ancillary costs incurred in connection with
the arrangement of borrowings and exchange
differences arising from foreign currency
borrowings to the extent they are regarded as
an adjustment to the interest cost. Borrowing
costs, if any, directly attributable to the
acquisition, construction or production of an
asset that necessarily takes a substantial period
of time to get ready for its intended use or sale
are capitalized, if any. all other borrowing costs
are expensed to the Statement of Profit and
Loss in the period in which they occur.
3.7 Leases
The determination of whether an arrangement is
(or contains) a lease is based on the substance
of the arrangement at the inception of the
lease. The arrangement is, or contains, a lease
if fulfilment of the arrangement is dependent
on the use of a specific asset or assets and the
arrangement conveys a right to use the asset
or assets, even if that right is not explicitly
specified in an arrangement.
Company as a lessee
a lease is classified at the inception date as a
finance lease or an operating lease. a lease that
transfers substantially all the risks and rewards
incidental to ownership to the Company is
classified as a finance lease.
Finance leases are capitalized at the
commencement of the lease at the inception
date fair value of the leased property or, if
lower, at the present value of the minimum lease
payments. Lease payments are apportioned
between finance charges and reduction of the
lease liability so as to achieve a constant rate of
interest on the remaining balance of the liability.
Varun Beverages Limited222

Summary of significant accounting policies and other explanatory information on the Standalone Financial Statements for the year ended 31 December 2019
Finance charges are recognized in finance costs
in the Statement of Profit and Loss, unless they
are directly attributable to qualifying assets, in
which case they are capitalized in accordance
with the Company’s general policy on the
borrowing costs.
a leased asset is depreciated over the useful
life of the asset. However, if there is no
reasonable certainty that the Company will
obtain ownership by the end of the lease term,
the asset is depreciated over the shorter of
the estimated useful life of the asset and the
lease term.
Operating lease payments are recognized as an
expense in the Statement of Profit and Loss on
a straight-line basis over the lease term.
Company as a lessor
Leases are classified as finance leases when
substantially all of the risks and rewards of
ownership transfer from the Company to
the lessee. amounts due from lessees under
finance leases are recorded as receivables at
the Company’s net investment in the leases.
Finance lease income is allocated to accounting
periods so as to reflect a constant periodic rate
of return on the net investment outstanding in
respect of the lease.
Leases in which the Company does not transfer
substantially all the risks and rewards of
ownership of an asset are classified as operating
leases. Rental income from operating lease is
recognized on straight line basis over the term
of the relevant lease.
3.8 Employee benefits
Contribution to provident and other funds
Retirement benefit in the form of provident
fund is a defined contribution scheme. The
Company has no obligation, other than the
contribution payable to the provident fund.
The Company recognises contribution payable
to the provident fund scheme as an expense,
when an employee renders the related service.
If the contribution payable to the scheme for
service received before the balance sheet date
exceeds the contribution already paid, the
deficit payable to the scheme is recognized
as a liability after deducting the contribution
already paid. If the contribution already paid
exceeds the contribution due for services
received before the balance sheet date, then
excess is recognized as an asset to the extent
that the pre-payment will lead to, for example,
a reduction in future payment or a cash refund.
Gratuity
Gratuity is a defined benefit scheme. The cost
of providing benefits under the defined benefit
plan is determined using the projected unit credit
method. The Company recognises termination
benefit as a liability and an expense when the
Company has a present obligation as a result
of past event, it is probable that an outflow of
resources embodying economic benefits will be
required to settle the obligation and a reliable
estimate can be made of the amount of the
obligation. If the termination benefits fall due
more than twelve months after the balance
sheet date, they are measured at present value
of future cash flows using the discount rate
determined by reference to market yields at the
balance sheet date on government bonds.
Re-measurements, comprising actuarial gains
and losses, the effect of the asset ceiling,
excluding amounts included in net interest on
the net defined benefit liability and the return
on plan assets (excluding amounts included in
net interest on the net defined benefit liability),
are recognized immediately in the balance sheet
with a corresponding debit or credit to retained
earnings through Other Comprehensive Income
(“OCI”) in the period in which they occur. Re-
measurements are not reclassified to profit or
loss in subsequent periods.
Past service costs are recognized in Statement
of Profit and Loss on the earlier of:
The date of the plan amendment or
curtailment, and
The date that the Company recognises
related restructuring cost
Net interest is calculated by applying the
discount rate to the net defined benefit liability
or asset.
STATUTORY REPORTSCORPORATE OVERVIEW FINANCIAL STATEMENTS
Annual Report 2019 223

Summary of significant accounting policies and other explanatory information on the Standalone Financial Statements for the year ended 31 December 2019
The Company recognises the following changes
in the net defined benefit obligation as an
expense in the Statement of Profit and Loss:
Service costs comprising current service
costs, past-service costs, gains and
losses on curtailments and non-routine
settlements; and
Net interest expense or income
Compensated absences
The Company treats accumulated leave
expected to be carried forward beyond twelve
months, as long-term employee benefit which
are computed based on the actuarial valuation
using the projected unit credit method at
the period end. actuarial gains/losses are
immediately taken to the Statement of Profit
and Loss and are not deferred. The Company
presents the leave as a current liability in the
balance sheet to the extent it does not have an
unconditional right to defer its settlement for
twelve months after the reporting date. Where
Company has the unconditional legal and
contractual right to defer the settlement for a
period beyond twelve months, the balance is
presented as a non-current liability.
accumulated leave, which is expected to be
utilized within the next twelve months, is treated
as short term employee benefit. The Company
measures the expected cost of such absences
as the additional amount that it expects to pay
as a result of the unused entitlement that has
accumulated at the reporting date.
all other employee benefits payable/available
within twelve months of rendering the service
are classified as short-term employee benefits.
Benefits such as salaries, wages, bonus, etc. are
recognized in the Statement of Profit and Loss
in the period in which the employee renders the
related service.
3.9 Share-based payments
Employees (including senior executives) of the
Company receive remuneration in the form of
share-based payments, whereby employees
render services as consideration for equity
instruments which are classified as equity-
settled transactions.
The cost of equity-settled transactions is
determined by the fair value at the date of grant
using an appropriate valuation model. That cost
is recognized as an employee benefit expense
with a corresponding increase in ‘Share option
outstanding account’ in other equity, over the
period in which the performance and/or service
conditions are fulfilled. The cumulative expense
recognized for equity-settled transactions
at each reporting date until the vesting date
reflects the extent to which the vesting period
has expired and the Company’s best estimate
of the number of equity instruments that will
ultimately vest.
Service and non-market performance
conditions are not taken into account when
determining the grant date fair value of awards,
but the likelihood of the conditions being met is
assessed as part of the Company’s best estimate
of the number of equity instruments that will
ultimately vest. Market performance conditions
are reflected within the grant date fair value.
any other conditions attached to an award, but
without an associated service requirement, are
considered to be non-vesting conditions.
Non-vesting conditions are reflected in the fair
value of an award and lead to an immediate
expensing of an award unless there are also
service and/or performance conditions.
No expense is recognized for awards that
do not ultimately vest because non-market
performance and/or service conditions have
not been met. Where awards include a market
or non-vesting condition, the transactions are
treated as vested irrespective of whether the
market or non-vesting condition is satisfied,
provided that all other performance and/or
service conditions are satisfied.
When the terms of an equity-settled award are
modified, the minimum expense recognized
is the expense had the terms had not been
modified, if the original terms of the award are
met. an additional expense is recognized for
any modification that increases the total fair
value of the share-based payment transaction,
or is otherwise beneficial to the employee as
measured at the date of modification. Where
Varun Beverages Limited224

Summary of significant accounting policies and other explanatory information on the Standalone Financial Statements for the year ended 31 December 2019
an award is cancelled by the entity or by the
counterparty, any remaining element of the fair
value of the award is expensed immediately
through the Statement of Profit and Loss.
3.10 Foreign currency transactions and translations
Transactions in foreign currencies are initially
recorded in the reporting currency, by applying
to the foreign currency amount the exchange
rate between the reporting currency and the
foreign currency at the date of the transaction.
Foreign currency monetary items are reported
using the closing rate. Non-monetary items which
are carried in terms of historical cost denominated
in a foreign currency are reported using the
exchange rate at the date of the transaction.
Exchange differences arising on the settlement
of monetary items or on restatement of the
Company's monetary items at rates different
from those at which they were initially recorded
during the year, or reported in previous financial
statements, are recognized as income or as
expenses in the year in which they arise.
Exchange differences pertaining to long-term
foreign currency monetary items obtained
or given on or before 31 December 2016:
Exchange differences arising on conversion
of long term foreign currency monetary items
used for acquisition of depreciable fixed
assets are added to the cost of fixed assets
and is depreciated over the remaining life of
the respective fixed asset and in other cases,
is recorded under the head ‘Foreign Currency
Monetary Item Translation Difference account’
and is amortized over the period of maturity of
underlying long term foreign currency monetary
items, in accordance with the option available
under Ind aS 101.
Exchange differences pertaining to long-term
foreign currency monetary items obtained or
given on or after 01 January 2017: Exchange
differences arising on restatement of long term
foreign currency monetary items obtained or
given is recorded in the Statement of Profit
and Loss.
3.11 Business combination and goodwill
Business combinations are accounted for
using the acquisition method. The cost of an
acquisition is measured as the aggregate of
the consideration transferred measured at
acquisition date fair value and the amount of
any non-controlling interests in the acquiree.
at the acquisition date, the identifiable assets
acquired and the liabilities assumed are
recognized at their acquisition date fair values.
For this purpose, the liabilities assumed include
contingent liabilities representing present
obligation and they are measured at their
acquisition fair values irrespective of the fact
that outflow of resources embodying economic
benefits is not probable. However, deferred tax
assets or liabilities, and the assets or liabilities
related to employee benefit arrangements
are recognized and measured in accordance
with Ind aS 12 ‘Income Taxes’ and Ind aS 19
‘Employee Benefits’ respectively.
When the Company acquires a business, it
assesses the financial assets and liabilities
assumed for appropriate classification and
designation in accordance with the contractual
terms, economic circumstances and pertinent
conditions as at the acquisition date.
any contingent consideration to be transferred
by the Company is recognized at fair value at
the acquisition date. Contingent consideration
classified as an asset or liability that is a
financial instrument and within the scope of
Ind aS 109 ‘Financial Instruments’ (‘Ind aS
109’), is measured at fair value with changes
in fair value recognized in Statement of Profit
and Loss. If the contingent consideration is not
within the scope of Ind aS 109, it is measured in
accordance with the appropriate Ind aS.
Goodwill is initially measured at cost, being the
excess of the aggregate of the consideration
transferred over the net identifiable assets
acquired and liabilities assumed. If the fair
value of the net assets acquired is in excess of
the aggregate consideration transferred, the
Company re-assesses whether it has correctly
identified all of the assets acquired and all of the
STATUTORY REPORTSCORPORATE OVERVIEW FINANCIAL STATEMENTS
Annual Report 2019 225

Summary of significant accounting policies and other explanatory information on the Standalone Financial Statements for the year ended 31 December 2019
liabilities assumed and reviews the procedures
used to measure the amounts to be recognized
at the acquisition date. If the reassessment still
results in an excess of the fair value of net assets
acquired over the aggregate consideration
transferred, then the gain is recognized in OCI
and accumulated in equity as capital reserve.
However, if there is no clear evidence of bargain
purchase, the entity recognises the gain directly
in equity as capital reserve, without routing the
same through OCI.
after initial recognition, goodwill is measured
at cost less any accumulated impairment
losses. For the purpose of impairment testing,
goodwill acquired in a business combination
is, from the acquisition date, allocated to each
of the Company’s cash-generating units that
are expected to benefit from the combination,
irrespective of whether other assets or liabilities
of the acquiree are assigned to those units.
a cash generating unit to which goodwill has
been allocated is tested for impairment annually,
or more frequently when there is an indication
that the unit may be impaired. If the recoverable
amount of the cash generating unit is less than
its carrying amount, the impairment loss is
allocated first to reduce the carrying amount of
any goodwill allocated to the unit and then to
the other assets of the unit pro rata based on the
carrying amount of each asset in the unit.
any impairment loss for goodwill is recognized
in Statement of Profit and Loss. an impairment
loss recognized for goodwill is not reversed in
subsequent periods.
Where goodwill has been allocated to a cash-
generating unit and part of the operation within
that unit is disposed of, the goodwill associated
with the disposed operation is included in
the carrying amount of the operation when
determining the gain or loss on disposal.
Goodwill disposed in these circumstances is
measured based on the relative values of the
disposed operation and the portion of the cash-
generating unit retained.
If the initial accounting for a business combination
is incomplete by the end of the reporting period
in which the combination occurs, the Company
reports provisional amounts for the items for
which the accounting is incomplete. Those
provisional amounts are adjusted through
goodwill during the measurement period, or
additional assets or liabilities are recognized,
to reflect new information obtained about
facts and circumstances that existed at the
acquisition date that, if known, would have
affected the amounts recognized at that date.
These adjustments are called as measurement
period adjustments. The measurement period
does not exceed one year from the acquisition
date.
3.12 Government grants
Grants from the Government are recognized
when there is reasonable assurance that all
underlying conditions will be complied with and
that the grant will be received.
When loans or similar assistance are provided
by Government or related institutions, with
an interest rate below the current applicable
market rate, the effect of this favorable interest
is regarded as a government grant. The
loan or assistance is initially recognized and
measured at fair value and the government
grant is measured as the difference between
the initial carrying value of the loan and the
proceeds received. That grant is recognized in
the Statement of Profit and Loss under ‘other
operating revenue’. The loan is subsequently
measured as per the accounting policy
applicable to financial liabilities.
Government grants related to assets are
presented in the balance sheet by deducting
the grant from the carrying value of the asset
and non-monetary grant is recognized at a
nominal value.
Grants related to income are recognized as
income on a systematic basis in the Statement
of Profit and Loss over the periods necessary to
match them with the related costs, which they
are intended to compensate and are presented
as ‘other operating revenues’.
Total government grant recognized in the
Statement of Profit and Loss under the head
Varun Beverages Limited226

Summary of significant accounting policies and other explanatory information on the Standalone Financial Statements for the year ended 31 December 2019
‘Other operating revenue’ amounts to ` 1,186.62
(31 December 2018: ` 966.62) under different
industrial promotion tax exemption schemes.
3.13 Income taxes
Tax expense is the aggregate amount
included in the determination of profit or loss
for the period in respect of current tax and
deferred tax.
Current income tax
Current income tax is measured at the amount
expected to be paid to the tax authorities in
accordance with the Income-tax act, 1961 and
rules thereunder. Current income tax assets and
liabilities are measured at the amount expected
to be recovered from or paid to the taxation
authorities. The tax rates and tax laws used to
compute the amount are those that are enacted
or substantively enacted, at the reporting date.
Current income tax relating to items recognized
outside profit or loss is recognized outside
profit or loss (either in OCI or in equity).
Current tax items are recognized in correlation
to the underlying transaction either in OCI or
directly in equity. Management periodically
evaluates positions taken in the tax returns with
respect to situations in which applicable tax
regulations are subject to interpretation and
establishes provisions where appropriate.
Deferred tax
Deferred tax is provided using the liability
method on temporary differences between the
tax bases of assets and liabilities and their book
bases. Deferred tax liabilities are recognized for
all temporary differences, the carry forward of
unused tax credits and any unused tax losses.
Deferred tax assets are recognized to the
extent that it is probable that taxable profit
will be available against which the deductible
temporary differences, and the carry forward of
unused tax credits and unused tax losses can
be utilized. Deferred tax assets and liabilities are
measured at the tax rates that are expected to
apply in the year when the asset is realized or
the liability is settled, based on tax rates (and tax
laws) that have been enacted or substantively
enacted at the reporting date.
Deferred tax relating to items recognized
outside profit or loss is recognized outside
profit or loss. Deferred tax items are recognized
in correlation to the underlying transaction
either in OCI or directly in equity.
The carrying amount of deferred tax assets is
reviewed at each reporting date and reduced
to the extent that it is no longer probable that
sufficient taxable profit will be available to
allow all or part of the deferred tax asset to
be utilized. Unrecognized deferred tax assets
are re-assessed at each reporting date and are
recognized to the extent that it has become
probable that future taxable profits will allow
the deferred tax asset to be recovered.
Deferred tax assets and deferred tax liabilities
are offset if a legally enforceable right exists
to set off current tax assets against current
tax liabilities and the deferred taxes relate to
the same taxable entity and the same taxation
authority.
Minimum alternate Tax (“MaT”) credit is
recognized as an asset only when and to the
extent there is convincing evidence that the
relevant members of the Company will pay
normal income tax during the specified period.
Such asset is reviewed at each reporting period
end and the adjusted based on circumstances
then prevailing.
Deferred tax on business combination
When a liability assumed is recognized at the
acquisition date but the related costs are not
deducted in determining taxable profits until a
later period, a deductible temporary difference
arises which results in a deferred tax asset. a
deferred tax asset also arises when the fair value
of an identifiable asset acquired is less than its
tax base. In both cases, the resulting deferred
tax asset affects goodwill.
3.14 Segment reporting
Operating segments are reported in a manner
consistent with the internal reporting provided
to the chief operating decision maker, who
is responsible for allocating resources and
assessing performance of the operating
STATUTORY REPORTSCORPORATE OVERVIEW FINANCIAL STATEMENTS
Annual Report 2019 227

Summary of significant accounting policies and other explanatory information on the Standalone Financial Statements for the year ended 31 December 2019
segments. The business activities of the
Company predominantly fall within a single
operating segment, i.e., manufacturing and sale
of beverages within India.
3.15 Impairment of non-financial assets
The Company assesses, at each reporting date,
whether there is an indication that an asset
may be impaired. If any indication exists, or
when annual impairment testing for an asset
is required, the Company estimates the asset’s
recoverable amount. an asset’s recoverable
amount is the higher of an asset’s or cash-
generating unit’s (“CGU”) fair value less costs of
disposal and its value in use.
Recoverable amount is determined for an
individual asset, unless the asset does not generate
cash inflows that are largely independent of those
from other assets or groups of assets.
When the carrying amount of an asset or CGU
exceeds its recoverable amount, the asset is
considered impaired and is written down to its
recoverable amount.
In assessing value in use, the estimated future
cash flows are discounted to their present value
using a pre-tax discount rate that reflects current
market assessments of the time value of money
and the risks specific to the asset. In determining
fair value less costs of disposal, recent market
transactions are taken into account. If no such
transactions can be identified, an appropriate
valuation model is used. These calculations are
corroborated by valuation multiples, quoted
share prices for publicly traded Company’s or
other available fair value indicators.
The Company bases its impairment calculation
on detailed budgets and forecast calculations,
which are prepared separately for each of the
Company’s CGUs to which the individual assets
are allocated. These budgets and forecast
calculations generally cover a period of five
years. For longer periods, a long-term growth
rate is calculated and applied to project future
cash flows after the fifth year. To estimate cash
flow projections beyond periods covered by the
most recent budgets/forecasts, the Company
extrapolates cash flow projections in the
budget using a steady or declining growth rate
for subsequent years, unless an increasing rate
can be justified. In any case, this growth rate
does not exceed the long-term average growth
rate for the products, industries, or country or
countries in which the entity operates, or for the
market in which the asset is used.
Impairment losses of continuing operations,
including impairment on inventories, are
recognized in the Statement of Profit and Loss.
an assessment is made at each reporting date
to determine whether there is an indication that
previously recognized impairment losses no
longer exist or have decreased. If such indication
exists, the Company estimates the asset's
or CGU's recoverable amount. a previously
recognized impairment loss is reversed only
if there has been a change in the assumptions
used to determine the asset's recoverable
amount since the last impairment loss was
recognized. The reversal is limited so that the
carrying amount of the asset does not exceed
its recoverable amount, nor exceed the carrying
amount that would have been determined, net
of depreciation, had no impairment loss been
recognized for the asset in prior years. Such
reversal is recognized in the Statement of Profit
and Loss unless the asset is carried at a revalued
amount, in which case, the reversal is treated as
a revaluation increase.
3.16 Financial instruments
a financial instrument is any contract that
gives rise to a financial asset of one entity
and a financial liability or equity instrument of
another entity.
Financial assets
Initial recognition and measurement
all financial assets are recognized initially
at fair value plus, in the case of financial
assets not recorded at fair value through
profit or loss (“FVTPL”), transaction costs
that are attributable to the acquisition of the
financial asset.
For purposes of subsequent measurement,
financial assets are classified as follows:
Varun Beverages Limited228
Summary of significant accounting policies and other explanatory information on the Standalone Financial Statements for the year ended 31 December 2019
a) Debt instruments at amortized cost
a ‘debt instrument’ is measured at the
amortized cost where the asset is held
within a business model whose objective
is to hold assets for collecting contractual
cash flows; and contractual terms of the
asset give rise to cash flows on specified
dates that are solely payments of principal
and interest.
after initial measurement, such financial
assets are subsequently measured at
amortized cost using the EIR method.
amortized cost is calculated by taking
into account any discount or premium
on acquisition and fees or costs that are
an integral part of the EIR. The interest
income from these financial assets
is included in finance income in the
Statement of Profit and Loss. The losses
arising from impairment are recognized
in the Statement of Profit and Loss. This
category generally applies to trade and
other receivables.
b) Debt instruments at fair value through other comprehensive income
assets that are held for collection of
contractual cashflows and for selling
the financial assets, where the cash flow
represent solely payments of principal and
interest, are measured at fair value through
other comprehensive income (“FVOCI”).
The Company has not designated any debt
instrument in this category.
c) Debt instruments at fair value through profit or loss
Fair Value Through Profit or Loss (“FVTPL”)
is a residual category for debt instruments.
any debt instrument, which does not
meet the criteria for categorization as at
amortized cost or as FVTOCI, is classified
as at FVTPL.
In addition, the Company may elect
to designate a debt instrument which
otherwise meets amortized cost or
FVTOCI criteria, as at FVTPL. However,
such election is allowed only if doing so
reduces or eliminates a measurement or
recognition inconsistency (referred to as
‘accounting mismatch’).
Debt instruments included within the
FVTPL category are measured at fair
value with all changes recognized in the
Statement of Profit and Loss. The Company
has not designated any debt instrument in
this category.
d) Equity instruments
all equity investments in scope of Ind
aS 109 are measured at fair value. Equity
instruments which are held for trading and
contingent consideration recognized by an
acquirer in a business combination to which
Ind aS 103 ‘Business Combinations’ applies
are Ind aS classified as at FVTPL. Equity
instruments included within the FVTPL
category are measured at fair value with
all changes recognized in the Statement of
Profit and Loss.
For all other equity instruments, the
Company may make an irrevocable
election to present in other comprehensive
income subsequent changes in the fair
values. The Company makes such election
on an instrument-by-instrument basis. The
classification is made on initial recognition
and is irrevocable.
If the Company decides to classify an equity
instrument as at FVTOCI, then all fair value
changes on the instrument, excluding
dividends, are recognized in the OCI. There
is no recycling of the amounts from OCI to
profit or loss, even on sale of investment.
However, the Company may transfer the
cumulative gain or loss within equity.
De-recognition
a financial asset is derecognized when the
contractual rights to receive cash flows from
the asset have expired or the Company has
transferred its rights to receive the contractual
cash flows from the asset in a transaction in
which substantially all the risks and rewards of
ownership of the asset are transferred.
STATUTORY REPORTSCORPORATE OVERVIEW FINANCIAL STATEMENTS
Annual Report 2019 229

Summary of significant accounting policies and other explanatory information on the Standalone Financial Statements for the year ended 31 December 2019
Impairment of financial assets
The Company measures the Expected Credit
Loss (“ECL”) associated with its assets based
on historical trends, industry practices and
the general business environment in which it
operates. The impairment methodology applied
depends on whether there has been a significant
increase in credit risk. ECL impairment loss
allowance (or reversal) recognized during the
period is recognized as income/ expense in the
Statement of Profit and Loss under the head
‘other expenses'.
Financial liabilities
Initial recognition and measurement
Financial liabilities are classified, at initial
recognition, as financial liabilities at fair value
through profit or loss, loans and borrowings,
payables, or as derivatives designated as hedging
instruments in an effective hedge, as appropriate.
all financial liabilities are recognized initially
at fair value and, in the case of loans and
borrowings and payables, net of directly
attributable transaction costs.
The Company’s financial liabilities include trade
and other payables, loans and borrowings
including bank overdrafts and derivative
financial instruments.
Subsequent measurement
The measurement of financial liabilities depends
on their classification, as described below:
a) Financial liabilities at FVTPL
Financial liabilities at FVTPL include
financial liabilities held for trading and
financial liabilities designated upon initial
recognition as at fair value through profit
or loss. Financial liabilities are classified as
held for trading if they are incurred for the
purpose of repurchasing in the near term.
This category includes derivative financial
instruments entered into by the Company
that are not designated as hedging
instruments in hedge relationships as
defined by Ind aS 109.
Financial liabilities designated upon initial
recognition at fair value through profit or
loss are designated as such at the initial
date of recognition, and only if the criteria
in Ind aS 109 are satisfied. For liabilities
designated as FVTPL, fair value gains/
losses are recognized in the Statement
of Profit and Loss, except for those
attributable to changes in own credit risk,
which are recognized in OCI. These gains/
loss are not subsequently transferred to
the Statement of Profit and Loss.
b) Financial liabilities at amortized cost
after initial recognition, financial liabilities
designated at amortized costs are
subsequently measured at amortized cost
using the EIR method. Gains and losses are
recognized in Statement of Profit and Loss
when the liabilities are derecognized as well
as through the EIR amortization process.
amortized cost is calculated by taking
into account any discount or premium on
acquisition and fees or costs that are an
integral part of the EIR. The amortization is
included as finance costs in the Statement
of Profit and Loss.
De-recognition
a financial liability is derecognized when the
obligation under the liability is discharged or
cancelled or expires. When an existing financial
liability is replaced by another from the same
lender on substantially different terms, or the
terms of an existing liability are substantially
modified, such an exchange or modification is
treated as the de-recognition of the original
liability and the recognition of a new liability. The
difference in the respective carrying amounts is
recognized in the Statement of Profit and Loss.
Offsetting of financial instruments
Financial assets and financial liabilities are
offset and the net amount is reported in the
balance sheet if there is a currently enforceable
legal right to offset the recognized amounts
and there is an intention to settle on a net basis,
to realise the assets and settle the liabilities
simultaneously.
Varun Beverages Limited230

Summary of significant accounting policies and other explanatory information on the Standalone Financial Statements for the year ended 31 December 2019
Derivative financial instruments
Derivatives are initially recognized at fair value
on the date of executing a derivative contract
and are subsequently remeasured to their
fair value at the end of each reporting period.
Derivatives are carried as financial assets when
the fair value is positive and as financial liabilities
when the fair value is negative. Changes in the
fair value of derivatives that are designated and
qualify as fair value hedges are recognized in
the Statement of Profit and Loss immediately,
together with any changes in the fair value of
the hedged asset or liability that are attributable
to the hedged risk.
3.17 Investment in subsidiaries and associates
an investor, regardless of the nature of its
involvement with an entity (the investee), shall
determine whether it is a parent by assessing
whether it controls the investee. an investor
controls an investee when it is exposed, or has
rights, to variable returns from its involvement
with the investee and has the ability to affect
those returns through its power over the investee.
Thus, an investor controls an investee if and
only if the investor has all the following:
(a) power over the investee;
(b) exposure, or rights, to variable returns
from its involvement with the investee; and
(c) the ability to use its power over the investee
to affect the amount of the investor’s returns.
an associate is an entity over which the Company
has significant influence. Significant influence
is the power to participate in the financial and
operating policy decisions of the investee, but not
control or joint control over those policies. The
considerations made in determining significant
influence are similar to those necessary to
determine control over subsidiaries.
The Company has elected to recognise its
investments in subsidiary and associate companies
at cost in accordance with the option available in
Ind aS 27, ‘Separate Financial Statements’.
Investment carried at cost is tested for
impairment as per Ind-aS 36.
3.18 Non-current assets classified as held for sale
Non-current assets classified as held for sale are
presented separately in the Balance Sheet and
measured at the lower of their carrying amounts
immediately prior to their classification as held
for sale and their fair value less costs to sell.
Once classified as held for sale, the assets are
not subject to depreciation or amortization.
any gain or loss arises on remeasurement or
sale is included in Statement of Profit and Loss.
If an entity has classified an asset (or disposal
group) as held for sale, but the held-for-sale
criteria as specified in standard are no longer
met, the entity shall cease to classify the asset
(or disposal group) as held for sale.
The Company measures a non-current asset
that ceases to be classified as held for sale
(or ceases to be included in a disposal group
classified as held for sale) at the lower of:
(a) its carrying amount before the asset (or
disposal group) was classified as held
for sale, adjusted for any depreciation,
amortization or revaluations that would
have been recognized had the asset (or
disposal group) not been classified as held
for sale; and
(b) its recoverable amount at the date of the
subsequent decision not to sell.
3.19 Cash and cash equivalents
Cash and cash equivalent in the balance sheet
comprise cash at banks and on hand, cheques
on hand and short-term deposits with an
original maturity of three months or less, which
are subject to an insignificant risk of changes in
value. For the purpose of the statement of cash
flows, cash and cash equivalents consist of cash
and short-term deposits, as defined above.
3.20 Dividend distribution to equity holders
The Company recognises a liability to make
cash or non-cash distributions to equity holders
when the distribution is authorised and the
distribution is no longer at the discretion of the
Company. as per the corporate laws in India, a
distribution is authorised when it is approved
STATUTORY REPORTSCORPORATE OVERVIEW FINANCIAL STATEMENTS
Annual Report 2019 231

Summary of significant accounting policies and other explanatory information on the Standalone Financial Statements for the year ended 31 December 2019
by the shareholders. a corresponding amount
is recognized directly in equity.
3.21 Provisions
Provisions are recognized when the Company
has a present obligation (legal or constructive)
as a result of a past event, it is probable that
an outflow of resources embodying economic
benefits will be required to settle the obligation
and a reliable estimate can be made of the
amount of the obligation. When the Company
expects some or all of a provision to be
reimbursed, for example, under an insurance
contract, the reimbursement is recognized as a
separate asset, but only when the reimbursement
is virtually certain. The expense relating to a
provision is presented in the Statement of Profit
and Loss, net of any reimbursement.
If the effect of the time value of money is material,
provisions are discounted using a current pre-
tax rate that reflects, when appropriate, the
risks specific to the liability. When discounting
is used, the increase in the provision due to the
passage of time is recognized as a finance cost.
3.22 Contingent liabilities
a contingent liability is a possible obligation
that arises from past events whose existence
will be confirmed by the occurrence or non–
occurrence of one or more uncertain future
events beyond the control of the Company
or a present obligation that is not recognized
because it is not probable that an outflow
of resources will be required to settle the
obligation. a contingent liability also arises in
extremely rare cases where there is a liability
that cannot be recognized because it cannot
be measured reliably. The Company does not
recognize a contingent liability but discloses
its existence in the financial statements.
Contingent assets are only disclosed when it is
probable that the economic benefits will flow to
the entity.
3.23 Earnings per share
Basic earnings/ (loss) per share are calculated
by dividing the net profit or loss for the year
attributable to equity shareholders by the
weighted average number of equity shares
outstanding during the year. The weighted
average number of equity shares outstanding
during the year is adjusted for events, other
than conversion of potential equity shares, that
have changed the number of equity shares
outstanding without a corresponding change in
resources.
In case of a bonus issue, the number of ordinary
shares outstanding is increased by number of
shares issued as bonus shares in current year
and comparative period presented as if the
event had occurred at the beginning of the
earliest year presented.
For the purpose of calculating diluted earnings/
(loss) per share, the net profit or loss for the
period attributable to equity shareholders
and the weighted average number of shares
outstanding during the period are adjusted for
the effects of all dilutive potential equity shares.
3.24 Significant management judgement in applying accounting policies and estimation uncertainty
The preparation of the Company’s financial
statements requires management to make
judgements, estimates and assumptions that
affect the reported amounts of revenues,
expenses, assets and liabilities, and the
accompanying disclosures, and the disclosure of
contingent liabilities at the date of the financial
statements. Estimates and assumptions are
continuously evaluated and are based on
management’s experience and other factors,
including expectations of future events that
are believed to be reasonable under the
circumstances.
Uncertainty about these assumptions and
estimates could result in outcomes that require
a material adjustment to the carrying amount of
assets or liabilities affected in future periods.
In particular, the Company has identified the
following areas where significant judgements,
estimates and assumptions are required.
Further information on each of these areas and
how they impact the various accounting policies
are described below and also in the relevant
Varun Beverages Limited232

Summary of significant accounting policies and other explanatory information on the Standalone Financial Statements for the year ended 31 December 2019
notes to the financial statements. Changes in
estimates are accounted for prospectively.
(i) Judgements
In the process of applying the Company’s
accounting policies, management has made
the following judgements, which have the
most significant effect on the amounts
recognized in the financial statements:
a) Contingencies
Contingent liabilities may arise from
the ordinary course of business
in relation to claims against the
Company, including legal, contractor,
land access and other claims. By their
nature, contingencies will be resolved
only when one or more uncertain
future events occur or fail to occur.
The assessment of the existence, and
potential quantum, of contingencies
inherently involves the exercise of
significant judgments and the use of
estimates regarding the outcome of
future events.
b) Recognition of deferred tax assets
The extent to which deferred tax
assets can be recognized is based
on an assessment of the probability
that future taxable income will
be available against which the
deductible temporary differences
and tax loss carry-forward can
be utilised. In addition, significant
judgement is required in assessing
the impact of any legal or economic
limits or uncertainties in various tax
jurisdictions.
ii) Estimates and assumptions
The key assumptions concerning the
future and other key sources of estimation
uncertainty at the reporting date that have
a significant risk of causing a material
adjustment to the carrying amounts
of assets and liabilities within the next
financial year, are described below. The
Company based its assumptions and
estimates on parameters available when
the financial statements were prepared.
Existing circumstances and assumptions
about future developments, however,
may change due to market change or
circumstances arising beyond the control of
the Company. Such changes are reflected in
the assumptions when they occur.
a) Useful lives of tangible/intangible assets
The Company reviews its estimate of
the useful lives of tangible/intangible
assets at each reporting date, based
on the expected utility of the assets.
b) Defined benefit obligation
The cost of the defined benefit
plan and other post-employment
benefits and the present value of
such obligation are determined using
actuarial valuations. an actuarial
valuation involves making various
assumptions that may differ from
actual developments in the future.
These include the determination
of the discount rate, future salary
increases, mortality rates and future
pension increases. In view of the
complexities involved in the valuation
and its long-term nature, a defined
benefit obligation is highly sensitive
to changes in these assumptions. all
assumptions are reviewed at each
reporting date.
c) Inventories
The Company estimates the net
realisable values of inventories,
taking into account the most reliable
evidence available at each reporting
date. The future realization of these
inventories may be affected by future
technology or other market-driven
changes that may reduce future
selling prices.
d) Business combinations
The Company uses valuation
techniques when determining the fair
STATUTORY REPORTSCORPORATE OVERVIEW FINANCIAL STATEMENTS
Annual Report 2019 233

Summary of significant accounting policies and other explanatory information on the Standalone Financial Statements for the year ended 31 December 2019
values of certain assets and liabilities
acquired in a business combination.
e) Impairment of non-financial assets and goodwill
In assessing impairment, Company
estimates the recoverable amount of
each asset or cash-generating units
based on expected future cash flows
and uses an interest rate to discount
them. Estimation uncertainty relates
to assumptions about future operating
results and the determination of a
suitable discount rate.
f) Fair value measurement of financial instruments
When the fair values of financial assets
and financial liabilities recorded in the
Balance Sheet cannot be measured
based on quoted prices in active
markets, their fair value is measured
using valuation techniques including
the DCF model. The inputs to these
models are taken from observable
markets where possible, but where this
is not feasible, a degree of judgment
is required in establishing fair values.
Judgements include considerations of
inputs such as liquidity risk, credit risk
and volatility. Changes in assumptions
about these factors could affect
the reported fair value of financial
instruments.
Varun Beverages Limited234

Su
mm
ary
of s
ign
ific
an
t acco
un
tin
g p
oli
cie
s an
d o
the
r exp
lan
ato
ry in
form
ati
on
on
th
e S
tan
dalo
ne
F
inan
cia
l S
tate
me
nts
fo
r th
e y
ear
en
de
d 3
1 D
ece
mb
er
20
19
4.
Pro
pe
rty,
pla
nt
an
d e
qu
ipm
en
t(`
in
mill
ion
) L
an
d
fre
eh
old
#
Lan
d
lease
ho
ld#
B
uil
din
gs
Pla
nt
an
d
eq
uip
me
nt
Fu
rnit
ure
an
d
fixtu
res
Ve
hic
les
Off
ice
e
qu
ipm
en
t C
om
pu
ter
eq
uip
me
nt
Co
nta
ine
rs
Po
st-m
ix
ve
nd
ing
m
ach
ine
s an
d
refr
ige
rato
rs
(Vis
i C
oo
ler)
To
tal
Gro
ss c
arr
yin
g a
mo
un
tB
ala
nce a
s at
01
Jan
uary
20
19 3
,39
3.1
0
3,2
84
.27
5,8
00
.89
1
6,0
61.
13
14
8.6
9
95
5.1
8
16
5.5
0
13
8.1
9
3,3
23
.43
8
,10
1.72
41,
372.1
0
ad
dit
ion
s fo
r th
e y
ear
527.8
4
112
.01
1,3
87.7
1 4
,98
0.3
1 1
5.5
9
37.9
6
37.3
2
41.
75
7
87.6
3
85
9.0
8
8,7
87.2
0
acq
uis
itio
n t
hro
ug
h b
usi
ness
co
mb
inati
on
d
uri
ng
the y
ear
(Refe
r no
te 4
9a
) 1
,83
9.2
4
1,9
65
.04
3
,29
5.3
9
7,7
30
.79
1
4.8
4
15
.65
6
.44
6
.84
3
12.5
3
721.
66
1
5,9
08
.42
Go
vern
men
t g
ran
t re
late
d t
o a
sset
receiv
ed
(R
efe
r fo
otn
ote
iv b
elo
w)
-
-
-
(25
1.0
5)
-
-
-
-
-
-
(25
1.0
5)
Dis
po
sals
/ad
just
men
ts f
or
the y
ear
-
(3
5.2
4)
(0
.14
) (
24
.36
) (
0.1
4)
(3
7.4
3)
(10
.28
) (
0.9
3)
(3
85
.28
) (
60
.07)
(5
53
.87)
Bala
nce
as
at
31
De
ce
mb
er
20
19 5
,76
0.1
8
5,3
26
.08
10
,48
3.8
5
28
,49
6.8
2
17
8.9
8
97
1.3
6
19
8.9
8
18
5.8
5
4,0
38
.31
9,6
22
.39
6
5,2
62
.80
D
ep
recia
tio
n a
nd
im
pair
me
nt
Bala
nce a
s at
01
Jan
uary
20
19 -
1
70
.84
1
,279
.16
5
,213
.93
8
7.2
9
64
9.5
9
10
1.73
8
6.6
4
1,3
85
.75
4
,414
.13
1
3,3
89
.06
D
ep
recia
tio
n c
harg
e f
or
the y
ear
-
60
.15
3
14.8
9
1,5
43
.43
1
2.3
3
72.5
7
26
.42
28
.95
6
34
.92
1,1
27.0
6
3,8
20
.72
Revers
al o
n d
isp
osa
ls/a
dju
stm
en
ts o
f ass
ets
fo
r th
e y
ear
-
-
-
(7.7
6)
(0
.22)
(19
.86
) (
4.1
7)
(3
.90
) (
273
.16
) (
37.5
8)
(3
46
.65
)
Bala
nce
as
at
31
De
ce
mb
er
20
19 -
2
30
.99
1
,59
4.0
5
6,7
49
.60
9
9.4
0
70
2.3
0
12
3.9
8
111
.69
1
,74
7.5
1 5
,50
3.6
1 1
6,8
63
.13
C
arr
yin
g a
mo
un
t as
at
31
Dece
mb
er
20
19 5
,76
0.1
8
5,0
95
.09
8
,88
9.8
0
21,
747.
22
7
9.5
8
26
9.0
6
75
.00
7
4.1
6
2,2
90
.80
4
,118
.78
4
8,3
99
.67
(` in
mill
ion
) L
an
d
fre
eh
old
L
an
d
lease
ho
ld#
B
uil
din
gs
Pla
nt
an
d
eq
uip
me
nt
Fu
rnit
ure
an
d
fixtu
res
Ve
hic
les
Off
ice
e
qu
ipm
en
t C
om
pu
ter
eq
uip
me
nt
Co
nta
ine
rs
Po
st-m
ix
ve
nd
ing
m
ach
ine
s an
d
refr
ige
rato
rs
(Vis
i C
oo
ler)
To
tal
Gro
ss c
arr
yin
g a
mo
un
tB
ala
nce a
s at
01
Jan
uary
20
183
,04
6.6
93
,04
5.6
05
,33
6.6
916
,56
1.5
914
0.1
09
68
.03
152.6
415
1.3
73
,58
3.2
87,3
82.5
94
0,3
68
.58
ad
dit
ion
s fo
r th
e y
ear
1.0
023
5.9
94
00
.49
49
8.8
68
.99
26
.58
33
.40
24
.89
59
7.1
28
09
.17
2,6
36
.49
acq
uis
itio
n t
hro
ug
h b
usi
ness
co
mb
inati
on
d
uri
ng
the y
ear
(Refe
r no
te 4
9C
)-
2.6
63
8.2
55
8.6
00
.64
7.8
90
.48
0.5
829
.48
73
.21
211
.79
Transferfromassetsclassifiedasheld
for
sale
(R
efe
r fo
otn
ote
v b
elo
w)
34
5.4
10
.02
25
.46
--
--
--
-3
70
.89
Dis
po
sals
fo
r th
e y
ear
--
-(1
,05
7.9
2)
(1.0
4)
(47.3
2)
(21.
02)
(38
.65
)(8
86
.45
)(1
63
.25
)(2
,215
.65
)B
ala
nce
as
at
31
De
ce
mb
er
20
183
,39
3.1
03
,28
4.2
75
,80
0.8
916
,06
1.13
148
.69
95
5.1
816
5.5
013
8.1
93
,32
3.4
38
,10
1.7
24
1,3
72
.10
De
pre
cia
tio
n a
nd
im
pair
me
nt
Bala
nce a
s at
01
Jan
uary
20
18-
130
.59
1,0
71.
43
4,7
40
.18
78
.29
615
.23
100
.62
96
.05
1,4
82.4
93
,64
8.9
011
,96
3.7
8D
ep
recia
tio
n c
harg
e f
or
the y
ear
-4
0.2
319
6.1
81,
04
0.9
09
.41
74
.38
20
.11
26
.60
59
5.9
69
18.7
32,9
22.5
0R
evers
al o
n d
isp
osa
ls o
f ass
ets
fo
r th
e y
ear
--
-(5
67.1
5)
(0.4
1)(4
0.0
2)
(19
.00
)(3
6.0
1)(6
92.7
0)
(15
3.5
0)
(1,5
08
.79
)Transferfromassetsclassifiedasheld
for
sale
(R
efe
r fo
otn
ote
v b
elo
w)
-0
.02
11.5
5-
--
--
--
11.5
7
Bala
nce
as
at
31
Dece
mb
er
20
18-
170
.84
1,2
79
.16
5,2
13.9
38
7.2
96
49
.59
101.
73
86
.64
1,3
85
.75
4,4
14.1
313
,38
9.0
6C
arr
yin
g a
mo
un
t as
at
31
Dece
mb
er
20
183
,39
3.1
03
,113
.43
4,5
21.
73
10,8
47.
20
61.
40
30
5.5
96
3.7
75
1.5
51,
93
7.6
83
,68
7.5
92
7,9
83
.04
#T
he C
om
pan
y h
ad
acq
uir
ed
lease
ho
ld lan
ds
at
Path
an
ko
t (P
un
jab
), S
on
arp
ur
(Ko
lkata
) an
d S
an
gli
(Mah
ara
shtr
a)
am
ou
nti
ng
to
` 2
00
.15
(3
1 D
ecem
ber
20
18: `
20
0.1
5)
an
d f
reeh
old
la
nd
at
Nela
man
gala
(K
arn
ata
ka)
am
ou
nti
ng
to
` 1
,316
.60
(3
1 D
ecem
ber
20
18: N
il) w
hic
h is
yet
to b
e r
eg
iste
red
in
th
e n
am
e o
f th
e C
om
pan
y.
STATUTORY REPORTSCORPORATE OVERVIEW FINANCIAL STATEMENTS
Annual Report 2019 235

Summary of significant accounting policies and other explanatory information on the Standalone Financial Statements for the year ended 31 December 2019
Property, plant and equipment (contd.)Footnotes to Note 4:
i. Asset under construction/ Capital work-in-progress
(` in million)
Net Book Value 31 December 2019 31 December 2018
Capital work-in-progress* 585.75 3,392.26
Total 585.75 3,392.26 *Capital work in progress as at 31 December 2018 comprised capital expenditure mainly for the set up of new plant at Pathankot (Punjab) which was capitalised during the year on 26 March 2019.
ii. Refer Note 52 for information on property, plant and equipment pledged as security by the Company.
iii. Pre-operative expenses incurred and capitalised during the year are as under:
(` in million)
Net Book Value 31 December 2019 31 December 2018
Balance at the beginning of the year 149.29 3.20
Add: Incurred during the year
Finance costs 131.93 80.73
Other expenses 71.37 71.23
Less: Capitalised during the year (350.13) (5.87)
Amount carried over 2.46 149.29
iv. During the year, the Company has received government grant related to assets under the Central Capital
Investment Subsidy NEIIPP, 2007 amounting to ` 251.05 (31 December 2018: Nil). The grant received has been
deducted against the carrying value of the asset.
v. In June 2017, in view of set-up of new production unit at Goa, the Company decided to sell certain land and
building situated at Goa which was originally acquired with acquisition of Goa territory and land situated at
Gonda (Uttar Pradesh). During the year ended on 31 December 2018, these assets have been re-classified back
to Property, plant and equipment on account of conditions mentioned in Ind aS 105 “Non- current assets Held
for Sale and Discontinued Operations”. Given the nature of assets, such reclassification or change in plan has no
effect on result of operations for this year or prior period.
vi. The amount of contractual commitments for the acquisitions of property, plant and equipment are disclosed in
Note 42.
5A. Goodwill(` in million)
Amount
Gross carrying amount
Balance as at 01 January 2019 19.40
acquired during the year -
Balance as at 31 December 2019 19.40
Amortization and impairment
Balance as at 01 January 2019 -
amortization charge for the year -
Balance as at 31 December 2019 -
Carrying amount as at 31 December 2019 19.40
Varun Beverages Limited236
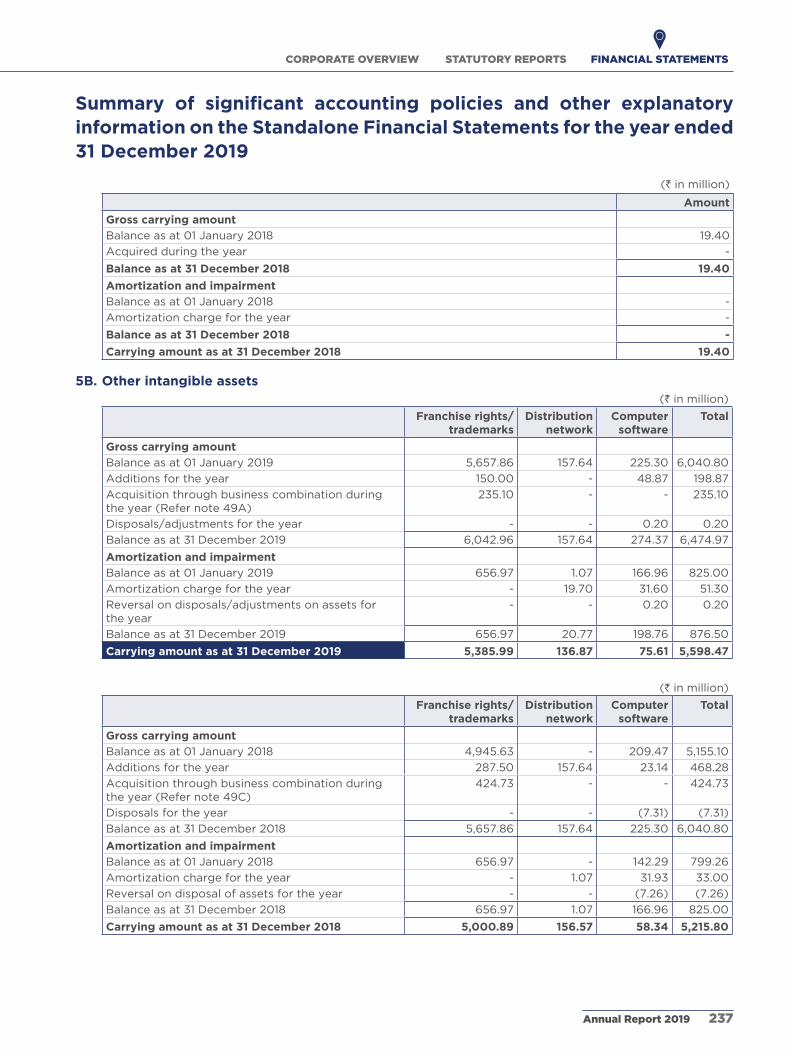
Summary of significant accounting policies and other explanatory information on the Standalone Financial Statements for the year ended 31 December 2019
(` in million)
Amount
Gross carrying amount
Balance as at 01 January 2018 19.40
acquired during the year -
Balance as at 31 December 2018 19.40
Amortization and impairment
Balance as at 01 January 2018 -
amortization charge for the year -
Balance as at 31 December 2018 -
Carrying amount as at 31 December 2018 19.40
5B. Other intangible assets(` in million)
Franchise rights/ trademarks
Distribution network
Computer software
Total
Gross carrying amount
Balance as at 01 January 2019 5,657.86 157.64 225.30 6,040.80
additions for the year 150.00 - 48.87 198.87
acquisition through business combination during the year (Refer note 49a)
235.10 - - 235.10
Disposals/adjustments for the year - - 0.20 0.20
Balance as at 31 December 2019 6,042.96 157.64 274.37 6,474.97
Amortization and impairment
Balance as at 01 January 2019 656.97 1.07 166.96 825.00
amortization charge for the year - 19.70 31.60 51.30
Reversal on disposals/adjustments on assets for the year
- - 0.20 0.20
Balance as at 31 December 2019 656.97 20.77 198.76 876.50
Carrying amount as at 31 December 2019 5,385.99 136.87 75.61 5,598.47
(` in million)
Franchise rights/ trademarks
Distribution network
Computer software
Total
Gross carrying amount
Balance as at 01 January 2018 4,945.63 - 209.47 5,155.10
additions for the year 287.50 157.64 23.14 468.28
acquisition through business combination during the year (Refer note 49C)
424.73 - - 424.73
Disposals for the year - - (7.31) (7.31)
Balance as at 31 December 2018 5,657.86 157.64 225.30 6,040.80
Amortization and impairment
Balance as at 01 January 2018 656.97 - 142.29 799.26
amortization charge for the year - 1.07 31.93 33.00
Reversal on disposal of assets for the year - - (7.26) (7.26)
Balance as at 31 December 2018 656.97 1.07 166.96 825.00
Carrying amount as at 31 December 2018 5,000.89 156.57 58.34 5,215.80
STATUTORY REPORTSCORPORATE OVERVIEW FINANCIAL STATEMENTS
Annual Report 2019 237
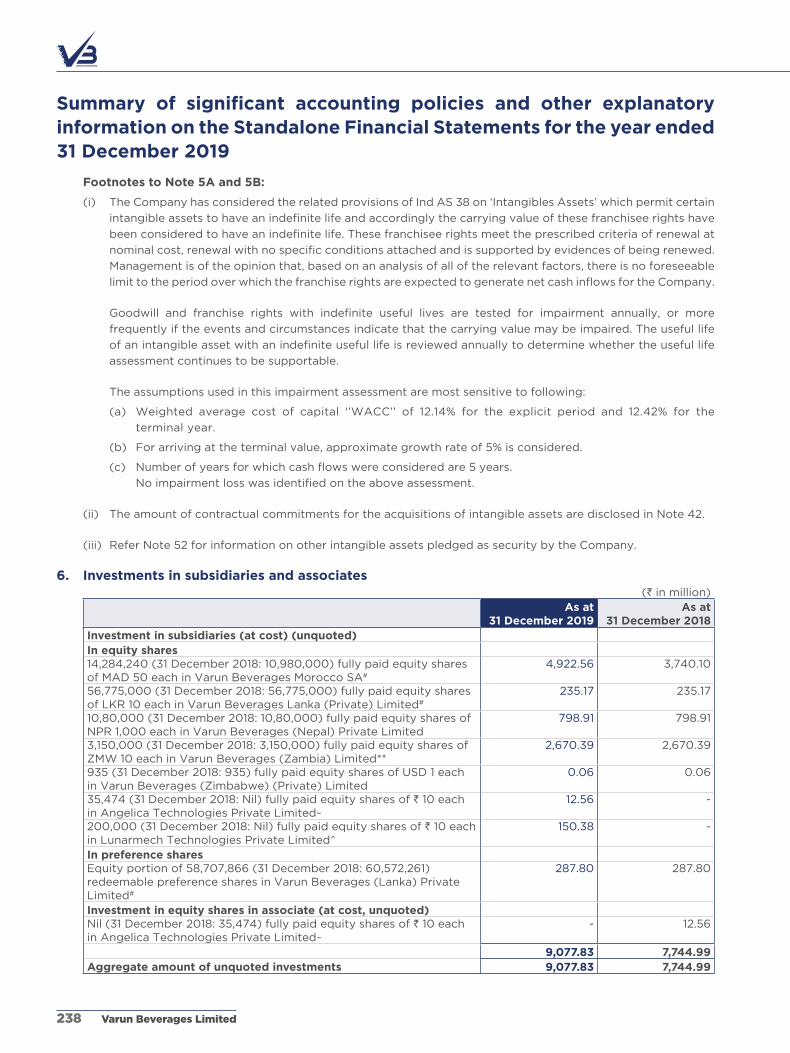
Summary of significant accounting policies and other explanatory information on the Standalone Financial Statements for the year ended 31 December 2019
Footnotes to Note 5A and 5B:
(i) The Company has considered the related provisions of Ind aS 38 on ‘Intangibles assets’ which permit certain
intangible assets to have an indefinite life and accordingly the carrying value of these franchisee rights have
been considered to have an indefinite life. These franchisee rights meet the prescribed criteria of renewal at
nominal cost, renewal with no specific conditions attached and is supported by evidences of being renewed.
Management is of the opinion that, based on an analysis of all of the relevant factors, there is no foreseeable
limit to the period over which the franchise rights are expected to generate net cash inflows for the Company.
Goodwill and franchise rights with indefinite useful lives are tested for impairment annually, or more
frequently if the events and circumstances indicate that the carrying value may be impaired. The useful life
of an intangible asset with an indefinite useful life is reviewed annually to determine whether the useful life
assessment continues to be supportable.
The assumptions used in this impairment assessment are most sensitive to following:
(a) Weighted average cost of capital ‘’WaCC’’ of 12.14% for the explicit period and 12.42% for the
terminal year.
(b) For arriving at the terminal value, approximate growth rate of 5% is considered.
(c) Number of years for which cash flows were considered are 5 years.
No impairment loss was identified on the above assessment.
(ii) The amount of contractual commitments for the acquisitions of intangible assets are disclosed in Note 42.
(iii) Refer Note 52 for information on other intangible assets pledged as security by the Company.
6. Investments in subsidiaries and associates(` in million)
As at31 December 2019
As at31 December 2018
Investment in subsidiaries (at cost) (unquoted)In equity shares14,284,240 (31 December 2018: 10,980,000) fully paid equity shares of MaD 50 each in Varun Beverages Morocco Sa#
4,922.56 3,740.10
56,775,000 (31 December 2018: 56,775,000) fully paid equity shares of LKR 10 each in Varun Beverages Lanka (Private) Limited#
235.17 235.17
10,80,000 (31 December 2018: 10,80,000) fully paid equity shares of NPR 1,000 each in Varun Beverages (Nepal) Private Limited
798.91 798.91
3,150,000 (31 December 2018: 3,150,000) fully paid equity shares of ZMW 10 each in Varun Beverages (Zambia) Limited**
2,670.39 2,670.39
935 (31 December 2018: 935) fully paid equity shares of USD 1 each in Varun Beverages (Zimbabwe) (Private) Limited
0.06 0.06
35,474 (31 December 2018: Nil) fully paid equity shares of ` 10 each in angelica Technologies Private Limited~
12.56 -
200,000 (31 December 2018: Nil) fully paid equity shares of ` 10 each in Lunarmech Technologies Private Limited^
150.38 -
In preference sharesEquity portion of 58,707,866 (31 December 2018: 60,572,261) redeemable preference shares in Varun Beverages (Lanka) Private Limited#
287.80 287.80
Investment in equity shares in associate (at cost, unquoted)Nil (31 December 2018: 35,474) fully paid equity shares of ` 10 each in angelica Technologies Private Limited~
- 12.56
9,077.83 7,744.99 Aggregate amount of unquoted investments 9,077.83 7,744.99
Varun Beverages Limited238

Summary of significant accounting policies and other explanatory information on the Standalone Financial Statements for the year ended 31 December 2019
*During the year ended on 31 December 2019, loans given to Varun Beverages Morocco Sa (“VBL Morocco”) amounting to ` 1,182.46(31December2018:` 649.73)wereconvertedintoequityinvestment.
**During the year ended on 31 December 2018, loans given to Varun Beverages (Zambia) Limited (“VBL Zambia”) amounting to ` 196.02wereconvertedintoequityinvestment.
^The Company, on 09 September 2019, has acquired 20% shareholding in Lunarmech Technologies Private Limited (Subsidiary of angelica Technologies Private Limited) for a purchase consideration of ` 150.38.
~The Company, on 04 November 2019, has acquired board control in its associate, angelica Technologies Private Limited. Consequently, both angelica Technologies Private Limited and Lunarmech Technologies Private Limited have become subsidiaries of the Company w.e.f. 04 November 2019. #These investments were tested for impairment in accordance with Ind aS 36 “Impairment of assets”.
Refer note 54 for information required under Section 186 (4) of the Companies act, 2013.
Information about investments along with proportion of ownership interest held and country of incorporation are as follows:
Name of the company/entity Country of incorporation and principal
place of business
Proportion of ownership interests held by the Company at year end
As at 31 December 2019
As at 31 December 2018
Varun Beverages (Nepal) Private Limited ('VBL Nepal')
Nepal 100% 100%
Varun Beverages Lanka (Private) Limited ('VBL Lanka')
Sri Lanka 100% 100%
Varun Beverages Morocco Sa ('VBL Morocco') Morocco 100% 100%
Ole Spring Bottlers (Private) Limited ('Ole')* Sri Lanka 100% 100%
Varun Beverages (Zambia) Limited ('VBL Zambia') Zambia 90% 90%
Varun Beverages (Zimbabwe) (Private) Limited ('VBL Zimbabwe')
Zimbabwe 85% 85%
Varun Beverages (Botswana) (Proprietary) Limited^ Botswana 90% -
angelica Technologies Private Limited India 47.30% 47.30%
Lunarmech Technologies Private Limited∞ India 55.00% 35.00%* subsidiary of VBL Lanka
^subsidiary of VBL Zambia
∞ subsidiary of angelica Technologies Private Limited
7. Investments(` in million)
As at 31 December 2019
As at 31 December 2018
Fair value through Profit or Loss
Investment in equity shares (unquoted)
200 (31 December 2018: 200) shares of ` 50 each in The Margao Urban Co-operative Bank Limited
0.01 0.01
250 (31 December 2018: 250) shares of ` 10 each in The Goa Urban Co-operative Bank Limited**
0.00 0.00
0.01 0.01
aggregate amount of unquoted investments 0.01 0.01
**Rounded off to Nil.
STATUTORY REPORTSCORPORATE OVERVIEW FINANCIAL STATEMENTS
Annual Report 2019 239
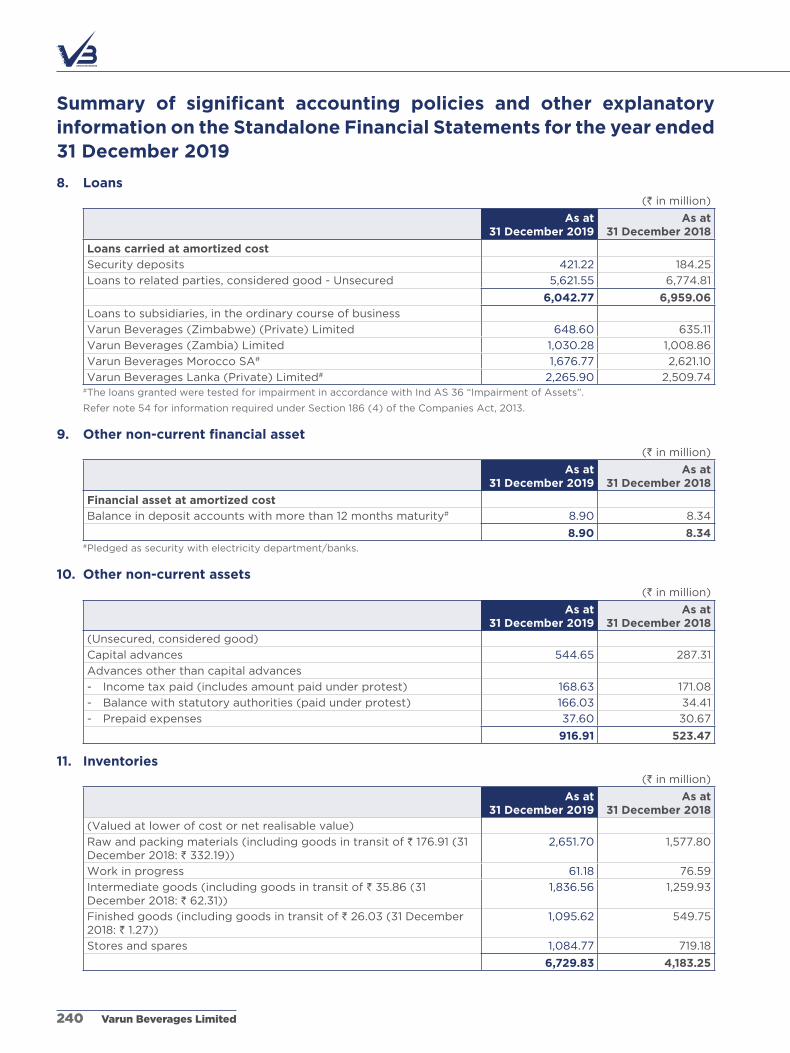
Summary of significant accounting policies and other explanatory information on the Standalone Financial Statements for the year ended 31 December 2019
8. Loans(` in million)
As at 31 December 2019
As at 31 December 2018
Loans carried at amortized cost
Security deposits 421.22 184.25
Loans to related parties, considered good - Unsecured 5,621.55 6,774.81
6,042.77 6,959.06
Loans to subsidiaries, in the ordinary course of business
Varun Beverages (Zimbabwe) (Private) Limited 648.60 635.11
Varun Beverages (Zambia) Limited 1,030.28 1,008.86
Varun Beverages Morocco Sa# 1,676.77 2,621.10
Varun Beverages Lanka (Private) Limited# 2,265.90 2,509.74 #The loans granted were tested for impairment in accordance with Ind aS 36 “Impairment of assets”.
Refer note 54 for information required under Section 186 (4) of the Companies act, 2013.
9. Other non-current financial asset(` in million)
As at 31 December 2019
As at 31 December 2018
Financial asset at amortized cost
Balance in deposit accounts with more than 12 months maturity# 8.90 8.34
8.90 8.34 #Pledged as security with electricity department/banks.
10. Other non-current assets(` in million)
As at 31 December 2019
As at 31 December 2018
(Unsecured, considered good)
Capital advances 544.65 287.31
advances other than capital advances
- Income tax paid (includes amount paid under protest) 168.63 171.08
- Balance with statutory authorities (paid under protest) 166.03 34.41
- Prepaid expenses 37.60 30.67
916.91 523.47
11. Inventories(` in million)
As at 31 December 2019
As at 31 December 2018
(Valued at lower of cost or net realisable value)
Raw and packing materials (including goods in transit of ` 176.91 (31 December 2018: ` 332.19))
2,651.70 1,577.80
Work in progress 61.18 76.59
Intermediate goods (including goods in transit of ` 35.86 (31 December 2018: ` 62.31))
1,836.56 1,259.93
Finished goods (including goods in transit of ` 26.03 (31 December 2018: ` 1.27))
1,095.62 549.75
Stores and spares 1,084.77 719.18
6,729.83 4,183.25
Varun Beverages Limited240

Summary of significant accounting policies and other explanatory information on the Standalone Financial Statements for the year ended 31 December 2019
The Company manufactures as well as purchases the same product from market for sale. In the absence of
demarcation between manufactured and purchased goods, stock in trade values, which are not significant, are
not separately ascertainable.
The cost of inventories recognized as an expense during the year is disclosed in Note 30, Note 31 and Note 32.
12. Trade receivables(` in million)
As at 31 December 2019
As at 31 December 2018
Trade receivable, considered good - Unsecured 1,198.33 1,321.64
Trade receivable, considered good - Secured 106.98 23.10
Trade receivable - Credit impaired 216.26 255.93
1,521.57 1,600.67
Less : allowance for expected credit loss (216.26) (255.93)
1,305.31 1,344.74
Includes amounts due, in the ordinary course of business, from subsidiaries
Varun Beverages (Zambia) Limited 10.61 118.22
Varun Beverages (Zimbabwe) (Private) Limited 22.79 400.71
Varun Beverages Morocco Sa 1.59 3.12
Ole Spring Bottlers (Private) Limited - 7.98
Varun Beverages (Nepal) Private Limited 476.05 398.52
Varun Beverages Lanka (Private) Limited - 0.06
Lunarmech Technologies Private Limited 2.92 -
Includes amounts due, in the ordinary course of business, from companies in which directors of the Company are also directors:
alisha Retail Private Limited - 3.28
alisha Torrent Closures (India) Private Limited 3.20 0.89
Devyani airport Services (Mumbai) Private Limited 0.57 -
Trade receivables are non-interest bearing and credit period generally falls in the range of 0 to 120 days terms.
13. Cash and cash equivalents (also for the purpose of Standalone Cash Flow Statement)
(` in million)
As at 31 December 2019
As at 31 December 2018
Balance with banks in current accounts 261.63 10.42
Balance in deposits with original maturity of less than three months 2.11 -
Cheques/drafts on hand 54.37 2.57
Cash on hand 5.40 4.76
323.51 17.75
14. Bank balances other than cash and cash equivalents(` in million)
As at 31 December 2019
As at 31 December 2018
Unpaid dividend account* 0.65 0.65
0.65 0.65 *These balances are not available for use by the Company and corresponding balance is disclosed as unclaimed dividend in note 25.
STATUTORY REPORTSCORPORATE OVERVIEW FINANCIAL STATEMENTS
Annual Report 2019 241

Summary of significant accounting policies and other explanatory information on the Standalone Financial Statements for the year ended 31 December 2019
15. Loans(` in million)
As at 31 December 2019
As at 31 December 2018
Loans carried at amortized cost
Loans to related party, considered good - Unsecured 282.34 89.15
Security deposits 69.37 15.53
351.71 104.68
Loans to a subsidiary, in the ordinary course of business
Varun Beverages Lanka (Private) Limited# 282.34 89.15
#The loans granted was tested for impairment in accordance with Ind aS 36 “Impairment of assets”.
16. Other financial assets(` in million)
As at 31 December 2019
As at 31 December 2018
(Unsecured, considered good)
Interest accrued on:
- Loan to subsidiaries* 378.04 179.51
- Term deposits 0.21 1.46
- Others 11.88 5.88
Dividend receivable** 192.19 182.58
Guarantee commission receivable# 54.16 37.50
Government grant receivable 1,840.78 1,143.92
Claim receivables 277.12 168.50
Other receivables^ 65.71 64.45
2,820.09 1,783.80
*amounts due from subsidiaries
Varun Beverages (Zambia) Limited 84.57 37.68
Varun Beverages (Zimbabwe) (Private) Limited 45.15 9.52
Varun Beverages Morocco Sa 248.32 132.31
378.04 179.51
**amount due from a subsidiary, namely, Varun Beverages (Nepal) Private Limited
192.19 182.58
# amounts due from subsidiaries:
Varun Beverages (Nepal) Private Limited 6.44 3.39
Varun Beverages Morocco Sa 1.38 1.36
Varun Beverages (Zimbabwe) (Private) Limited 46.34 32.75
54.16 37.50
^ Includes amounts due from subsidiaries:
Varun Beverages Morocco Sa 7.87 3.66
Varun Beverages (Zambia) Limited 12.43 8.61
Varun Beverages Lanka (Private) Limited 0.80 2.31
Varun Beverages (Zimbabwe) (Private) Limited 9.04 6.64
Varun Beverages (Nepal) Private Limited 1.61 1.60
31.75 22.82
Varun Beverages Limited242

Summary of significant accounting policies and other explanatory information on the Standalone Financial Statements for the year ended 31 December 2019
17. Other current assets(` in million)
As at 31 December 2019
As at 31 December 2018
(Unsecured, considered good)
Security deposits 1.28 1.60
Other advances :
- Employees 69.08 48.51
- Contractors and suppliers 565.40 649.17
- Prepaid expenses 101.01 67.87
- Balance with statutory/government authorities 772.15 733.70
- Other advances 45.91 80.56
1,554.83 1,581.41
18. Equity share capital(` in million)
As at 31 December 2019
As at 31 December 2018
Authorised share capital:
500,000,000 (31 December 2018: 500,000,000) equity shares of `10 each
5,000.00 5,000.00
5,000.00 5,000.00
Issued, subscribed and fully paid up:
288,688,720 (31 December 2018: 182,641,940) equity shares of ` 10 each
2,886.89 1,826.42
2,886.89 1,826.42
a) Reconciliation of share capital
(` in million)
Particulars No. of shares Amount
Balance as at 01 January 2019 182,641,940 1,826.42
add: Shares issued on exercise of employee stock options during the year
13,285 0.13
add: Bonus shares issued during the year (Refer note (d) below) 91,327,613 913.28
Add:SharesissuedpursuanttoQualifiedinstitutionsplacement("QIP") (Refer note (h) below)
14,705,882 147.06
Balance as at 31 December 2019 288,688,720 2,886.89
(` in million)
Particulars No. of shares Amount
Balance as at 01 January 2018 182,586,940 1,825.87
add: Shares issued on exercise of employee stock options during the year
55,000 0.55
Balance as at 31 December 2018 182,641,940 1,826.42
b) Terms/rights attached to shares
The Company has only one class of equity shares having a par value of ` 10 each. Each holder of equity share
is entitled to one vote per share. In the event of liquidation of the Company, holders of equity shares will be
entitled to receive any of the remaining assets of the Company, after distribution of all preferential amounts.
STATUTORY REPORTSCORPORATE OVERVIEW FINANCIAL STATEMENTS
Annual Report 2019 243

Summary of significant accounting policies and other explanatory information on the Standalone Financial Statements for the year ended 31 December 2019
The distribution will be in proportion to the number of equity shares held by the shareholders. The dividend, if
any, proposed by the Board of Directors is subject to the approval of the shareholders in the ensuing annual
General Meeting.
c) List of shareholders holding more than 5% of the equity share capital of the Company at the beginning and at the end of the year:
Shareholders as at 31 December 2019 No. of shares %
R J Corp Limited 81,033,517 28.07%
Ravi Kant Jaipuria & Sons (HUF) 57,481,805 19.91%
Mr. Varun Jaipuria 50,663,250 17.55%
Shareholders as at 31 December 2018 No. of shares %
R J Corp Limited 55,822,345 30.57%
Ravi Kant Jaipuria & Sons (HUF) 39,187,870 21.46%
Mr. Varun Jaipuria 39,175,500 21.46%
as per records of the Company, including its register of shareholders/members and other declaration
received from the shareholders regarding beneficial interest, the above shareholding represents both legal
and beneficial ownerships of shares.
d) Aggregate number of equity shares issued as bonus, shares issued for consideration other than cash and shares bought back during the period of five years immediately preceding the reporting date:
During the year ended 31 December 2019, the Company has issued 91,327,613 equity shares of `10 each as
fully paid-up bonus shares in the ratio of 1 (One) equity share for every 2 (Two) equity share outstanding on
record date.
e) Shares reserved for issue under options (Refer note 50)
Under Employee Stock Option Scheme, 2013:
As at 31 December 2019
As at 31 December 2018
No. of equity shares of ` 10 each at an exercise price of ` 149.51 per share
Options outstanding at the beginning of the year 23,285 78,285
Less: Options lapsed during the year 10,000 -
Less: Shares issued on exercise of employee stock options 13,285 55,000
- 23,285
f) Shares held by holding and ultimate holding company
(` in million)
As at 31 December 2019
As at 31 December 2018
RJ Corp Limited, Parent* company 810.34 558.22
81,033,517 (31 December 2018: 55,822,345) fully paid equity shares of ` 10 each
Ravi Kant Jaipuria & Sons (HUF), Parent* of RJ Corp Limited 574.82 391.88
57,481,805 (31 December 2018: 39,187,870) fully paid equity shares of ` 10 each
1,385.16 950.10 *as defined under Ind aS 24 - Related Party Disclosures (“Ind aS 24”).
Varun Beverages Limited244

Summary of significant accounting policies and other explanatory information on the Standalone Financial Statements for the year ended 31 December 2019
g) Preference share capital
The Company also has authorised preference share capital of 50,000,000 (31 December 2018: 50,000,000)
preference shares of `100 each. The Company does not have any outstanding issued preference shares.
h) Pursuant to QIP, 14,705,882 equity shares of the Company of `10 each were allotted at ` 612 per equity share: (Refer note 58)
(` in million)
Date of allotment Share capital Securities premium
07 September 2019 147.06 8,852.93
19. Other equity(` in million)
As at 31 December 2019
As at 31 December 2018
Capital reserveBalance at the beginning of the year 189.50 189.50
add: Items of other comprehensive income (''OCI'') recognized directly in capital reserve:Gain from a bargain purchase (Refer Note 49a)* 344.43 -
Balance at the end of the year 533.93 189.50 *The disaggregation of changes in OCI by each type of reserves in equity is disclosed in Note 37.General reserveBalance at the beginning of the year 444.26 191.25
add: Transfer from debenture redemption reserve - 253.01
Balance at the end of the year 444.26 444.26
Debenture redemption reserveBalance at the beginning of the year - 159.17
add: additions made during the year - 93.84
Less: Transfer to general reserve - 253.01
Balance at the end of the year - -
Securities premiumBalance at the beginning of the year 18,400.81 18,392.22
add: additions made on issue of equity shares pursuant to QIP (Refer note 18 (h))
8,852.93 -
Less: amount utilised for bonus issue (913.28) -
add: additions made pursuant to exercise of employee stock options 2.07 8.59
Less: amount utilised for share issue expenses (Refer note 58) (164.36) -
Balance at the end of the year 26,178.17 18,400.81
Retained earningsBalance at the beginning of the year 4,972.54 2,268.84
Less: Dividend paid (Refer note 40) 684.96 456.58
Less: Dividend distribution tax (Refer note 40) 91.73 54.71
Less: Transfer to debenture redemption reserve - 93.84
Add:Profitfortheyear 4,485.47 3,323.59
8,681.32 4,987.30 add: Items of OCI recognized directly in retained earnings:
Remeasurementlossesondefinedbenefitplans(Netofdeferredtax)* (61.54) (14.76)
Balance at the end of the year 8,619.78 4,972.54 *The disaggregation of changes in OCI by each type of reserves in equity is disclosed in Note 37.
STATUTORY REPORTSCORPORATE OVERVIEW FINANCIAL STATEMENTS
Annual Report 2019 245
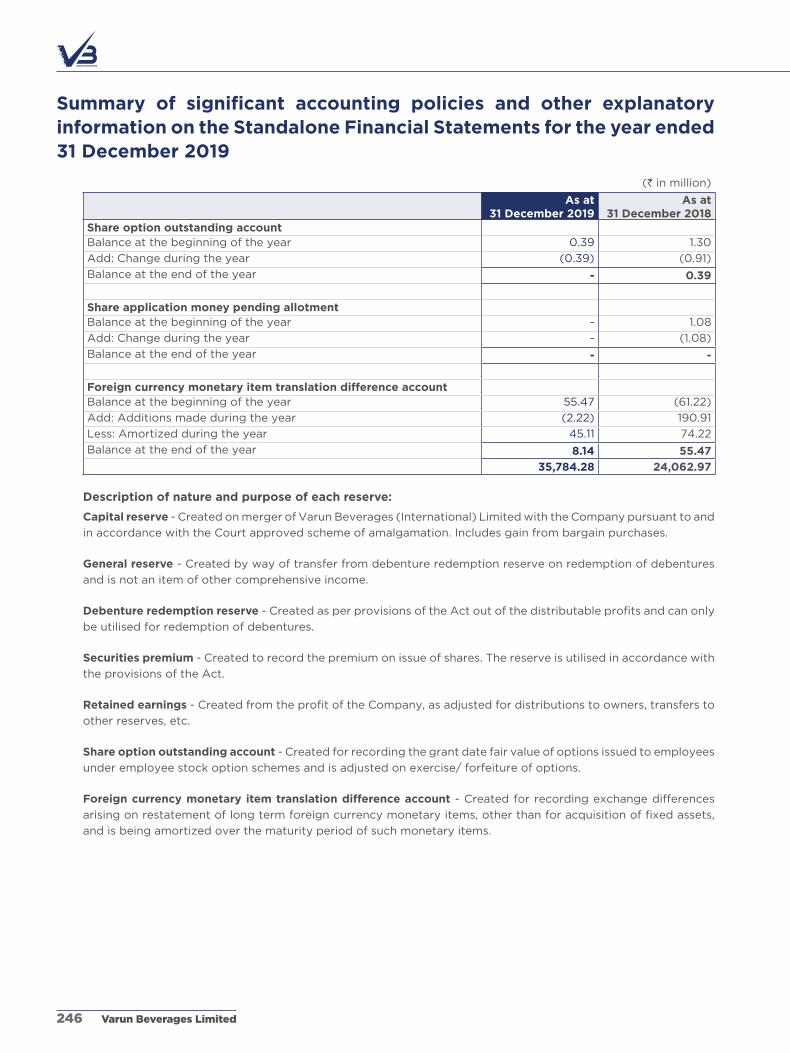
Summary of significant accounting policies and other explanatory information on the Standalone Financial Statements for the year ended 31 December 2019
(` in million)
As at 31 December 2019
As at 31 December 2018
Share option outstanding accountBalance at the beginning of the year 0.39 1.30
add: Change during the year (0.39) (0.91)
Balance at the end of the year - 0.39
Share application money pending allotmentBalance at the beginning of the year - 1.08
add: Change during the year - (1.08)
Balance at the end of the year - -
Foreign currency monetary item translation difference accountBalance at the beginning of the year 55.47 (61.22)
add: additions made during the year (2.22) 190.91
Less: amortized during the year 45.11 74.22
Balance at the end of the year 8.14 55.47
35,784.28 24,062.97
Description of nature and purpose of each reserve:
Capital reserve - Created on merger of Varun Beverages (International) Limited with the Company pursuant to and
in accordance with the Court approved scheme of amalgamation. Includes gain from bargain purchases.
General reserve - Created by way of transfer from debenture redemption reserve on redemption of debentures
and is not an item of other comprehensive income.
Debenture redemption reserve - Created as per provisions of the act out of the distributable profits and can only
be utilised for redemption of debentures.
Securities premium - Created to record the premium on issue of shares. The reserve is utilised in accordance with
the provisions of the act.
Retained earnings - Created from the profit of the Company, as adjusted for distributions to owners, transfers to
other reserves, etc.
Share option outstanding account - Created for recording the grant date fair value of options issued to employees
under employee stock option schemes and is adjusted on exercise/ forfeiture of options.
Foreign currency monetary item translation difference account - Created for recording exchange differences
arising on restatement of long term foreign currency monetary items, other than for acquisition of fixed assets,
and is being amortized over the maturity period of such monetary items.
Varun Beverages Limited246

Summary of significant accounting policies and other explanatory information on the Standalone Financial Statements for the year ended 31 December 2019
20. Borrowings A. Non-current borrowings:
(` in million, except otherwise stated)
As at31 December 2019
As at 31 December 2018
Term loans (secured) (Refer note 20C)
- Foreign currency loans from banks 1,752.25 1,686.78
- Indian rupee loans from banks 20,364.53 16,045.58
-Indianrupeeloanfromafinancialinstitutions 800.29 626.77
22,917.07 18,359.13
Loans and borrowing above are recognized at amortized cost/ fair value taking into account any discount or
premium on acquisition and fee or costs that are part of effective interest rate, accordingly the outstanding
balances above may not necessarily reconcile with repayment amounts.
B. Current borrowings:
(` in million)
As at31 December 2019
As at 31 December 2018
Loans repayable on demand
Working capital facilities from banks (secured) (Refer footnote (a))
2,110.44 2,640.14
Working capital facility from bank (secured) (Refer footnote (b))
- 500.00
Working capital facility from bank (unsecured) (Refer footnote (c))
2,000.00 -
Letter of credit (LC) payable to a bank (unsecured) (Refer footnote (d))
- 48.61
4,110.44 3,188.75
(a) Working capital facilities from banks are secured by first charge on entire current assets of the Company
ranking pari-passu amongst the banks and second charge on the movable and immovable assets of
the Company pertaining to specific manufacturing units. In previous year, one facility was secured by
subservient charge over entire current assets and movable fixed assets (both present and future) of the
Company and were repaid during the year. These facilities carry interest rates ranging between 8.35 to
9.65% (31 December 2018: 8.50 to 9.70%).
(b) Working capital facility from a bank are secured by first charge on entire current assets of the Company
ranking pari-passu amongst the banks. The facility carries interest rates ranging between 8.55 to 8.60%.
The outstanding amount of ` 500 were repaid during the year.
(c) Working capital facility from a bank carries rate of interest of 7.15% per annum and is repayable after 6
month.
(d) LC payable to a bank carried rate of interest of 8.65% per annum for 120 days. The outstanding amount
of ` 48.61 was repaid during the year.
There are no defaults in repayment of principal borrowings or interest there on. (Refer note 51)
STATUTORY REPORTSCORPORATE OVERVIEW FINANCIAL STATEMENTS
Annual Report 2019 247

Summary of significant accounting policies and other explanatory information on the Standalone Financial Statements for the year ended 31 December 2019
C. Terms and conditions/details of securities for loans:
(` in million)
Name of the bank/instrument Loan outstanding
31 December 2019 31 December 2018
Non-current
Current Non-current
Current
Term loans
(i) Foreign currency loan from banks (secured)
Loan carrying rate of interest of LIBOR+1.60% (31 December 2018: LIBOR+1.60%) and is repayable in two equal instalments of SGD 16.56 million each in May 2021 and May 2022. The Company has executed a cross currency swap to hedge total loan of SGD 33.13 million to USD 25 million and interest rate swap to hedge its exposure.
1,752.25 - 1,686.78 -
Loanissecuredonfirstpari-passuchargeontheentire movable and immovable property, plant and equipment of the Company including the territory/franchisee rights acquired under the acquisition under slump sale basis except vehicles.
1,752.25 - 1,686.78 -
(ii) Indian rupee loan from banks (secured)
Loans carrying weighted average rate of interest 8.92% (31 December 2018: 8.77%) depending upon tenure of the loans.For repayment terms refer note 20E.
20,283.64 4,942.71 16,028.61 3,332.66
Theseloanaresecuredonfirstpari-passuchargeon the entire movable and immovable property, plant and equipment of the Company including the territory /franchisee rights acquired under the business acquisition except vehicles.
(iii) Vehicle rupee term loan (secured)
Loans carrying rate of interest in range of 7.90-10.15% (31 December 2018: 7.90-10.33%). They are repayablegenerallyoveraperiodofthreetofiveyears in equal monthly instalments as per the terms of the respective agreements. Vehicle loans are securedagainstrespectivevehiclesfinanced.
80.89 38.15 16.96 44.27
20,364.53 4,980.86 16,045.57 3,376.93
(iv) Indian rupee loan from a financial institutions (secured)
Interest free loan from The Pradeshiya Industrial & Investment Corporation of U.P. Limited are repayable in one instalment after expiry of seven years from the date of disbursement. Loan is secured against bank guarantee equivalent to 100% of loan amount valid upto the repayment date of loan plus six months grace period.The loans are recognized at amortized cost basis using weighted average rate of borrowing on date of receipt, i.e., 8.52%-9.72%.The repayments are due as following:Date of repayment Amount25 December 2023 155.7930 November 2024 177.8301 November 2025 211.98
356.42 - 326.27 -
Varun Beverages Limited248

Summary of significant accounting policies and other explanatory information on the Standalone Financial Statements for the year ended 31 December 2019
(` in million)
Name of the bank/instrument Loan outstanding
31 December 2019 31 December 2018
Non-current
Current Non-current
Current
Interest free loan from The Director of Industries and Commerce, Haryana are repayable in one instalmentafterexpiryoffiveyearsfromthedateof disbursement. Loan is secured against bank guarantee equivalent to 100% of loan amount valid upto the repayment date of loan plus six months grace period.The loans are recognized at amortized cost basis using weighted average rate of borrowing on date of receipt, i.e., 8.33%.The repayments are due as following:Date of repayment Amount16 January 2023 94.0130 March 2023 90.7307 June 2023 175.0025 October 2023 73.6620 February 2024 91.36 27 May 2024 36.85 29 august 2024 39.10
443.87 - 300.51 -
800.29 - 626.78 -
Total 22,917.07 4,980.86 18,359.13 3,376.93
D. Deferred payment liabilities
(` in million)
Description Loan outstanding
31 December 2019 31 December 2018
Non-current
Current Non-current
Current
Plant and equipment acquired under deferred payment terms (secured)
The payments were secured against a letter of credit issued by the Company's banker. The outstanding amount of ` 429.58 was repaid during the year.
- - - 429.58
Total - - - 429.58
E. Repayment terms:
(` in million)
SI. No.
Description 31 December 2019 31 December 2018 Repayment terms
Non-current Current Non-current Current
1. Term loan - 1 57.67 114.60 372.00 85.95 Two instalments of ` 57.30 each due in May 2020 and June 2020 and one instalment of ` 57.84 due in May 2021.
2. Term loan - 2 700.00 350.00 1,050.00 350.00 Two instalments of ` 175 each due in May 2020 and June 2020, two instalments of ` 175 each due in May 2021 and June 2021, two instalments of ` 175 each due in May 2022 and June 2022.
STATUTORY REPORTSCORPORATE OVERVIEW FINANCIAL STATEMENTS
Annual Report 2019 249
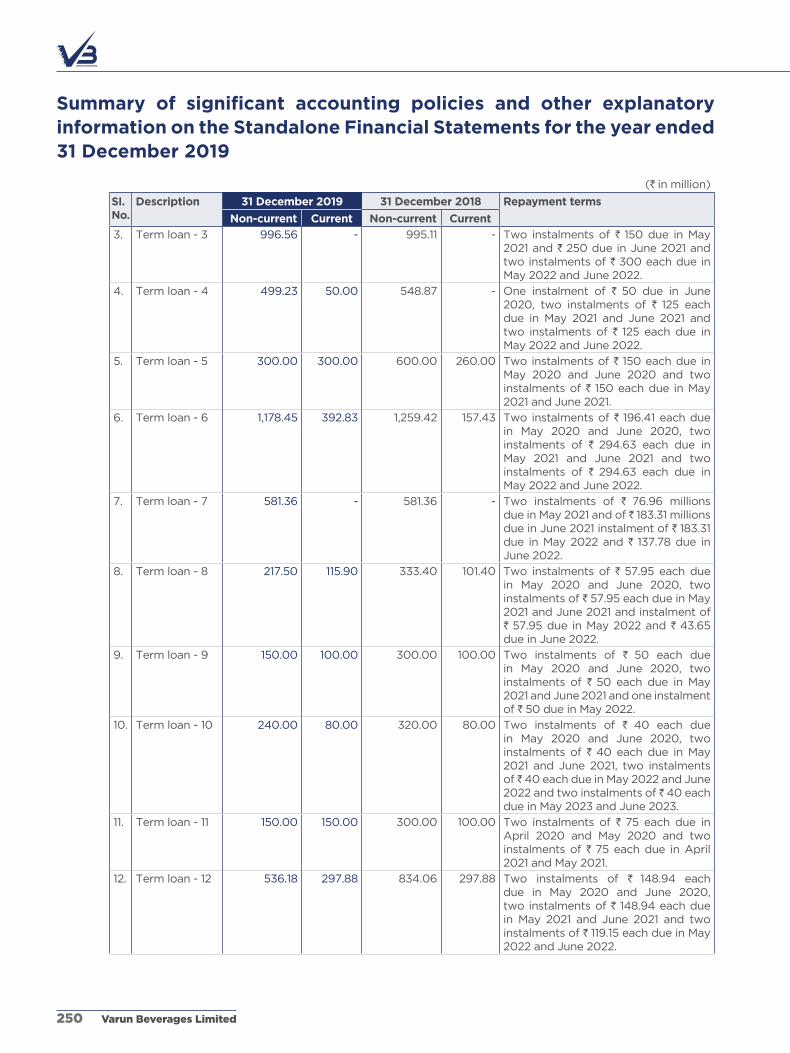
Summary of significant accounting policies and other explanatory information on the Standalone Financial Statements for the year ended 31 December 2019
(` in million)
SI. No.
Description 31 December 2019 31 December 2018 Repayment terms
Non-current Current Non-current Current
3. Term loan - 3 996.56 - 995.11 - Two instalments of ` 150 due in May 2021 and ` 250 due in June 2021 and two instalments of ` 300 each due in May 2022 and June 2022.
4. Term loan - 4 499.23 50.00 548.87 - One instalment of ` 50 due in June 2020, two instalments of ` 125 each due in May 2021 and June 2021 and two instalments of ` 125 each due in May 2022 and June 2022.
5. Term loan - 5 300.00 300.00 600.00 260.00 Two instalments of ` 150 each due in May 2020 and June 2020 and two instalments of ` 150 each due in May 2021 and June 2021.
6. Term loan - 6 1,178.45 392.83 1,259.42 157.43 Two instalments of ` 196.41 each due in May 2020 and June 2020, two instalments of ` 294.63 each due in May 2021 and June 2021 and two instalments of ` 294.63 each due in May 2022 and June 2022.
7. Term loan - 7 581.36 - 581.36 - Two instalments of ` 76.96 millions due in May 2021 and of ̀ 183.31 millions due in June 2021 instalment of ` 183.31 due in May 2022 and ` 137.78 due in June 2022.
8. Term loan - 8 217.50 115.90 333.40 101.40 Two instalments of ` 57.95 each due in May 2020 and June 2020, two instalments of ` 57.95 each due in May 2021 and June 2021 and instalment of ` 57.95 due in May 2022 and ` 43.65 due in June 2022.
9. Term loan - 9 150.00 100.00 300.00 100.00 Two instalments of ` 50 each due in May 2020 and June 2020, two instalments of ` 50 each due in May 2021 and June 2021 and one instalment of ` 50 due in May 2022.
10. Term loan - 10 240.00 80.00 320.00 80.00 Two instalments of ` 40 each due in May 2020 and June 2020, two instalments of ` 40 each due in May 2021 and June 2021, two instalments of ̀ 40 each due in May 2022 and June 2022 and two instalments of ̀ 40 each due in May 2023 and June 2023.
11. Term loan - 11 150.00 150.00 300.00 100.00 Two instalments of ` 75 each due in april 2020 and May 2020 and two instalments of ` 75 each due in april 2021 and May 2021.
12. Term loan - 12 536.18 297.88 834.06 297.88 Two instalments of ` 148.94 each due in May 2020 and June 2020, two instalments of ` 148.94 each due in May 2021 and June 2021 and two instalments of ` 119.15 each due in May 2022 and June 2022.
Varun Beverages Limited250

Summary of significant accounting policies and other explanatory information on the Standalone Financial Statements for the year ended 31 December 2019
(` in million)
SI. No.
Description 31 December 2019 31 December 2018 Repayment terms
Non-current Current Non-current Current
13. Term loan - 13 600.00 200.00 800.00 100.00 Two instalments of ` 100 each due in May 2020 and June 2020, two instalments of ` 150 each due in May 2021 and June 2021 and two instalments of ` 150 each due in May 2022 and June 2022.
14. Term loan - 14 350.00 100.00 450.00 50.00 Two instalments of ` 50 each due in May 2020 and June 2020, two instalments of ` 50 each due in May 2021 and June 2021, two instalments of ̀ 50 each due in May 2022 and June 2022 and two instalments of ` 75 each due in May 2023 and June 2023.
15. Term loan - 15 - - 1,300.00 325.00 The loan was originally repayable in two instalments of ` 162.50 each due in June 2019 and July 2019, two instalments of ` 162.50 each due in June 2020 and July 2020, two instalments of ` 162.5 each due in June 2021 and July 2021, two instalments of ` 162.50 each due in June 2022 and July 2022 and two instalments of ` 162.50 each due in June 2023 and July 2023. The outstanding amount of ` 1,625 was repaid during the year.
16. Term loan - 16 1,499.74 500.00 1,999.51 500.00 Two instalments of ` 250.00 each due in May 2020 and June 2020, two instalments of ` 250.00 each due in May 2021 and June 2021, two instalments of ` 250.00 each due in May 2022 and June 2022 and two instalments of ` 250.00 each due in May 2023 and June 2023.
17. Term loan - 17 750.00 240.00 990.00 210.00 Three instalments of `80.00 each due in May 2020, June 2020 and July 2020, three instalments of ` 80.00 each due in May 2021, June 2021 and July 2021, three instalments of ` 90.00 each due in May 2022, June 2022 and July 2022 and an installment of ` 90.00 due in May 2023 and of ` 150.00 due in June 2023.
18. Term loan - 18 395.00 150.00 545.00 140.00 Two instalments of `75.00 each due in June 2020 and July 2020, two instalments of ̀ 75.00 each due in May 2021 and June 2021, two instalments of ` 80.00 each due in June 2020 and July 2022 and one instalment of ` 85.00 due in May 2023.
STATUTORY REPORTSCORPORATE OVERVIEW FINANCIAL STATEMENTS
Annual Report 2019 251

Summary of significant accounting policies and other explanatory information on the Standalone Financial Statements for the year ended 31 December 2019
(` in million)
SI. No.
Description 31 December 2019 31 December 2018 Repayment terms
Non-current Current Non-current Current
19. Term loan - 19 628.21 193.30 816.48 150.00 One instalment of `193.30 due in May 2020, one instalment of ` 193.30 due in May 2021, one instalment of ` 193.30 due in May 2022 and one instalment of ` 241.62 due in May 2023.
20. Term loan - 20 666.80 166.60 833.40 125.00 Two instalments of ` 83.30 each due in May 2020 and June 2020, two instalments of ` 111.10 each due in May 2021 and June 2021, two instalments of ` 111.10 each due in May 2022 and June 2022 and two instalments of ` 111.10 due in May 2023 of ` 111.30 and June 2023
21. Term loan - 21 - - 800.00 200.00 The loan was originally repayable in two instalments of ` 100.00 each due in June 2019 and July 2019, two instalments of ` 100.00 each due in June 2020 and July 2020, two instalments of ` 100.00 each due in June 2021 and July 2021, two instalments of ` 100.00 each due in June 2020 and July 2022 and two instalments of ` 100.00 due in June 2023 and July 2023. The outstanding amount of ` 1,000 was repaid during the year.
22. Term loan - 22 1,457.55 291.60 - - Two instalments of ` 145.80 each due in June 2020 and July 2020, two instalments of ̀ 145.80 each due in June 2021 and July 2021, two instalments of ` 145.80 each due in June 2022 and July 2022, two instalments of ` 145.80 each due in June 2023 and July 2023, two instalments of ` 145.90 each due in June 2024 and July 2024 and two instalments of ` 145.90 each due in June 2025 and July 2025.
23. Term loan - 23 1,495.36 - - - Two instalments of ` 375.00 each due in May 2022 and June 2022 and two instalments of ` 375.00 each due in May 2023 and June 2023.
24. Term loan - 24 2,494.90 500.00 - - Two instalments of ` 250.00 each due in May 2020 and June 2020, two instalments of ̀ 250.00 each due in May 2021 and June 2021, two instalments of ` 250.00 each due in May 2022 and June 2022, two instalments of ̀ 250.00 each due in May 2023 and June 2023, two instalments of ` 250.00 each due in May 2024 and June 2024 and two instalments of ` 250.00 each due in May 2025 and June 2025.
Varun Beverages Limited252

Summary of significant accounting policies and other explanatory information on the Standalone Financial Statements for the year ended 31 December 2019
(` in million)
SI. No.
Description 31 December 2019 31 December 2018 Repayment terms
Non-current Current Non-current Current
25. Term loan - 25 1,594.35 400.00 - - Two instalments of ` 200.00 each due in May 2020 and June 2020, two instalments of ` 200.00 each due in May 2021 and June 2021, two instalments of ` 300.00 each due in May 2022 and June 2022 and two instalments of ` 300.00 each due in May 2023 and June 2023.
26. Term loan - 26 850.00 150.00 - - Two instalments of ` 75.00 each due in May 2020 and June 2020, two instalments of ̀ 75.00 each due in May 2021 and June 2021, two instalments of ` 75.00 each due in May 2022 and June 2022, two instalments of ` 75.00 each due in May 2023 and June 2023, two instalments of ` 100.00 each due in May 2024 and June 2024 and two instalments of ` 100.00 each due in May 2025 and June 2025.
27. Term loan - 27 894.78 100.00 - - Two instalments of ` 50.00 each due in May 2020 and June 2020, two instalments of ̀ 50.00 each due in May 2021 and June 2021, two instalments of ` 100.00 each due in May 2022 and June 2022, two instalments of ̀ 100.00 each due in May 2023 and June 2023, two instalments of ` 100.00 each due in May 2024 and June 2024 and two instalments of ` 100.00 each due in May 2025 and June 2025.
28. Term loan - 28 1,000.00 - - - One instalment of ̀ 200.00 due in July 2022, two instalments of ` 200.00 each due in June 2023 and July 2023 and two instalments of ` 200.00 each due in June 2024 and July 2024.
20,283.64 4,942.71 16,028.61 3,332.66
21. Provisions (Refer note 38)
(` in million)
As at31 December 2019
As at 31 December 2018
Non-current
Definedbenefitliability(net) 1,190.35 693.06
Other long term employee obligations 416.38 283.44
1,606.73 976.50
Current
Definedbenefitliability(net) 112.30 30.81
Other short term employee obligations 176.49 121.47
288.79 152.28
STATUTORY REPORTSCORPORATE OVERVIEW FINANCIAL STATEMENTS
Annual Report 2019 253

Summary of significant accounting policies and other explanatory information on the Standalone Financial Statements for the year ended 31 December 2019
22. Deferred tax assets and liabilities Deferred taxes arising from temporary differences and unused tax losses are summarised as follows:
(` in million)
Deferred tax liabilities/(assets)
As at 01 January
2019
Acquired on business
combination (Refer note 49A)
Recognised in other
comprehensive income
Recognised in Statement of
Profit and Loss
As at 31 December
2019
accelerated depreciation for tax purposes
3,590.56 - - 1,110.48 4,701.04
Minimum alternate tax (MaT) credit*
(1,047.74) - - (121.20) (1,168.94)
allowance for doubtful debts
(89.22) - - 13.65 (75.57)
Provision for bonus (18.65) (11.47) - (3.29) (33.41)
Foreign currency monetary item translation difference account
(19.38) - - 16.54 (2.84)
Fairvaluationoffinancialinstruments
(194.33) - - (36.20) (230.53)
Provision for retirement benefits
(394.45) (119.34) (33.05) (115.54) (662.38)
Borrowings (0.16) - - (0.81) (0.97)
Benefitaccruedongovernment grants
272.62 - - 1.41 274.03
Other expenses allowable on payment basis
(72.98) - - 33.84 (39.14)
2,026.27 (130.81) (33.05) 898.88 2,761.29
(` in million)
Deferred tax liabilities/(assets)
As at 01 January
2018
Acquired on business
combination (Refer note 49C)
Recognised in other
comprehensive income
Recognised in Statement of
Profit and Loss
As at 31 December
2018
accelerated depreciation for tax purposes
3,309.92 - - 280.64 3,590.56
Minimum alternate tax (MaT) credit*
(1,407.94) - - 360.20 (1,047.74)
allowance for doubtful debts
(76.97) - - (12.25) (89.22)
Provision for bonus (16.38) - - (2.27) (18.65)
Foreign currency monetary item translation difference account
21.19 - - (40.57) (19.38)
Fairvaluationoffinancialinstruments
(230.72) - - 36.39 (194.33)
Provision for retirement benefits
(281.71) (11.20) (7.78) (93.76) (394.45)
Borrowings (0.40) - - 0.24 (0.16)
Benefitaccruedongovernment grants
244.08 - - 28.54 272.62
Varun Beverages Limited254

Summary of significant accounting policies and other explanatory information on the Standalone Financial Statements for the year ended 31 December 2019
(` in million)
Deferred tax liabilities/(assets)
As at 01 January
2018
Acquired on business
combination (Refer note 49C)
Recognised in other
comprehensive income
Recognised in Statement of
Profit and Loss
As at 31 December
2018
Other expenses allowable on payment basis
(9.56) - - (63.42) (72.98)
1,551.51 (11.20) (7.78) 493.74 2,026.27
*MaT credit: (` in million)
Recognized Utilised
31 December 2019 170.76 (49.56)
31 December 2018 - (360.20)
MaT credit recognized in a year is adjustable against income taxes payable under normal tax provisions over a
period of 15 years.
MaT credit recognized on balance sheet date is accumulation of credit recognized (net of utilization) as per
below table:
(` in million)
Financial year Credit available for carry forward (net of
utilization)
Expiry date
2015-16 394.80 31 March 2031
2016-17 385.62 31 March 2032
2017-18 217.76 31 March 2033
2019-20 170.76 31 March 2035
Total 1,168.94
The amounts recognized in other comprehensive income relate to the re-measurement of net defined retirement
benefit liability. Refer note 37 for the amount of the income tax relating to these components of other
comprehensive income.
all significant deferred tax assets (including tax losses and other tax credits) have been recognized in the balance
sheet.
On 20 September 2019, vide the Taxation Laws (amendment) Ordinance 2019, the Government of India inserted
Section 115BaB in the Income Tax act, 1961 which provides domestic companies a non-reversible option to
pay corporate tax at reduced rates effective 01 april 2019 subject to certain conditions. The Company carries
unutilized minimum alternative tax credit and has other tax benefits/holidays available. The management plans to
conclude its evaluation of this option in conjunction with its tax year end of 31 March 2020.
23. Other non-current liabilities
(` in million)
As at31 December 2019
As at 31 December 2018
Deferred revenue on government grant 8.23 44.33
8.23 44.33
STATUTORY REPORTSCORPORATE OVERVIEW FINANCIAL STATEMENTS
Annual Report 2019 255

Summary of significant accounting policies and other explanatory information on the Standalone Financial Statements for the year ended 31 December 2019
24. Trade payables
(` in million)
As at31 December 2019
As at 31 December 2018
Total outstanding dues of-
Micro enterprises and small enterprises (Refer note 47) 17.79 2.47
Creditors other than micro enterprises and small enterprises 3,160.99 1,780.71
3,178.78 1,783.18
25. Other current financial liabilities
(` in million)
As at31 December 2019
As at 31 December 2018
Current maturities of long-term debts (Refer note 20C) 4,980.86 3,376.93
Interest accrued but not due on borrowings 127.61 100.58
Current portion of deferred payment liabilities (Refer note 20D) - 429.58
Payable for capital expenditure 746.97 827.39
Employee related payables 407.98 257.43
Unclaimed dividends# 0.65 0.65
Security deposits 2,152.67 1,872.47
Liability for foreign currency derivative contract 68.45 77.97
8,485.19 6,943.00 #Not due for deposit to the Investor Education and Protection Fund.
26. Other current liabilities
(` in million)
As at31 December 2019
As at 31 December 2018
advances from customers 1,033.08 638.07
Statutory dues payable 556.91 578.45
advance discount received 2.69 6.15
Deferred revenue on government grant 1.04 1.42
1,593.72 1,224.09
27. Current tax liabilities (net)
(` in million)
As at31 December 2019
As at 31 December 2018
Provision for tax, net of prepaid taxes `701.54 (31 December 2018: `439.84)
114.23 275.73
114.23 275.73
Varun Beverages Limited256

Summary of significant accounting policies and other explanatory information on the Standalone Financial Statements for the year ended 31 December 2019
The key components of income tax expense for the year ended 31 December 2019 and 31 December 2018 are:
A. Statement of Profit and Loss:
(` in million)
As at31 December 2019
As at 31 December 2018
(i) ProfitandLosssection
(a) Current tax 948.70 797.90
(b) adjustment of tax relating to earlier periods 9.86 14.35
(c) Deferred tax 898.88 493.74
Income tax expense reported in the Statement of Profit and Loss
1,857.44 1,305.99
(ii) OCI section
Deferred tax related to items recognized in OCI during the year:
(a) Netlossonremeasurementsofdefinedbenefitplans (33.05) (7.78)
Income tax charged to OCI (33.05) (7.78)
B. Reconciliation of tax expense between accounting profit at applicable tax rate and effective tax rate:
(` in million)
As at31 December 2019
As at 31 December 2018
Accounting profit before tax 6,342.91 4,629.58
Tax expense at statutory income tax rate of 34.944% (31 December 2018: 34.944%)
2,216.47 1,617.76
adjustments in respect of current income tax of previous years 9.86 14.35
Non deductible expenses 3.71 21.45
Deduction claimed u/s Chapter-VI a of Income-tax act, 1961 (273.36) (271.80)
Deferred tax related to business acquisitions - (20.37)
Deferredtaxoncapitalgainonassetsclassifiedasheldforsale - (59.14)
Income chargeable at lower tax rate (43.51) (33.58)
Income not chargeable to tax (13.48) -
Changes in tax rate - 22.53
Others (42.25) 14.79
Income tax expense at effective tax rate reported in the Statement of Profit and Loss
1,857.44 1,305.99
During the years ended 31 December 2019 and 2018, the Company has paid dividend to its shareholders. This
has resulted in payment of Dividend Distribution Tax to the taxation authorities. The Company believes that
Dividend Distribution Tax represents additional payment to taxation authority on behalf of the shareholders.
Hence, Dividend Distribution Tax paid is charged to equity.
28. Revenue from operations
(` in million)
Year ended 31 December 2019
Year ended 31 December 2018
Sale of products 54,555.93 37,136.85
Rendering of services to a subsidiary 375.23 340.21
Other operating revenue 1,225.48 1,145.70
56,156.64 38,622.76
STATUTORY REPORTSCORPORATE OVERVIEW FINANCIAL STATEMENTS
Annual Report 2019 257

Summary of significant accounting policies and other explanatory information on the Standalone Financial Statements for the year ended 31 December 2019
Disclosure on revenue pursuant to Ind AS 115- Revenue from contract with customers:
A. Reconciliation of revenue recognized with the contracted price:
(` in million)
Particulars Year ended 31 December 2019
Year ended 31 December 2018
Gross revenue/Contracted price 67,515.57 45,929.85
Less: Discounts and rebates* (12,584.41) (8,452.79)
Revenue from contracts with customers 54,931.16 37,477.06 *Includes discounts and rebates given on invoice to customers.
B. Contract balances:
The following table provides information about receivables and contract liabilities from contract with
customers:
Receivables
(` in million)
Particulars Year ended 31 December 2019
Year ended 31 December 2018
Trade receivables 1,521.57 1,600.67
Less: allowances for expected credit loss (216.26) (255.93)
Net receivables 1,305.31 1,344.74
Contract liabilities
(` in million)
Particulars Year ended 31 December 2019
Year ended 31 December 2018
advance from customers 1,033.08 638.07
1,033.08 638.07
C. Contract asset is the right to consideration in exchange for goods or services transferred to the customer.
Contract liabilities are on account of the advance payment received from customer for which performance
obligation has not yet been completed.
The performance obligation is satisfied when control of the goods or services are transferred to the customers
based on the contractual terms. The Company does not have any remaining performance obligation as
contracts entered for sale of goods are for a shorter duration. Further, there are no contracts for sale of
services wherein, performance obligation is unsatisfied to which transaction price has been allocated.
Payment terms with customers vary depending upon the contractual terms of each contract and generally
falls in the range of 0 to 120 days from the completion of performance obligation.
There is no significant financing component in any transaction with the customers.
D. Changes in the contract liabilities balances during the year are as follows:
(` in million)
Particulars Year ended 31 December 2019
Year ended 31 December 2018
Balance at the beginning of the year 638.07 676.98
addition during the year 1,033.08 638.07
Revenue recognized during the year (638.07) (676.98)
Balance at the closing of the year 1,033.08 638.07
Varun Beverages Limited258

Summary of significant accounting policies and other explanatory information on the Standalone Financial Statements for the year ended 31 December 2019
29. Other income
(` in million)
Year ended 31 December 2019
Year ended 31 December 2018
Interest income on items at amortized cost:
- term deposits 0.65 0.89
- loan to subsidiaries 254.39 272.73
- others 21.89 24.04
Net gain on foreign currency transactions and translations 161.98 292.41
Gain on sale of current investments 1.38 -
Excess provisions written back 150.18 6.54
Guarantee commission/commission income from:
- subsidiary 41.80 29.55
Dividend income from non-current investment in subsidiary 248.80 192.19
Dividend income from current investments 0.20 -
Gain on sale of property, plant and equipment (net) 45.06 -
Miscellaneous 53.74 98.04
980.07 916.39
30. Cost of materials consumed
(` in million)
Year ended 31 December 2019
Year ended 31 December 2018
Raw material and packing material consumed
Inventories at beginning of the year 1,577.80 1,159.71
Purchases during the year (net) 26,651.92 18,067.89
28,229.72 19,227.60
Sold during the year 2,097.80 1,046.79
Inventories at end of the year 2,651.70 1,577.80
23,480.22 16,603.01
31. Purchases of stock-in-trade
(` in million)
Year ended 31 December 2019
Year ended 31 December 2018
Beverages 3,776.90 1,712.15
Others 186.39 116.85
3,963.29 1,829.00
STATUTORY REPORTSCORPORATE OVERVIEW FINANCIAL STATEMENTS
Annual Report 2019 259

Summary of significant accounting policies and other explanatory information on the Standalone Financial Statements for the year ended 31 December 2019
32. Changes in inventories of finished goods, work-in-progress and traded goods
(` in million)
Year ended 31 December 2019
Year ended 31 December 2018
As at the beginning of the year
- Finished goods 549.75 305.66
- Intermediate goods 1,259.93 1,081.44
- Work in progress 76.59 69.78
1,886.27 1,456.88
As at the closing of the year
- Finished goods 1,095.62 549.75
- Intermediate goods 1,836.56 1,259.93
- Work in progress 61.18 76.59
2,993.36 1,886.27
Finished goods used as fixed assets* (217.04) (258.47)
(1,324.13) (687.86)*The Company manufactures plastic shells at one of its manufacturing facilities at alwar. The shells manufactured are used for beverages operations of the Company as property, plant and equipment (under the head “Containers”). These containers are also sold to third parties. The cost of manufacturing of plastic shells is being shown here separately with a corresponding debit to property, plant and equipment.
33. Employee benefits expense
(` in million)
Year ended 31 December 2019
Year ended 31 December 2018
Salaries, wages and bonus 5,815.74 3,770.29
Contribution to provident fund and other funds 285.61 201.90
Staff welfare expenses 206.78 142.53
6,308.13 4,114.72
34. Finance costs
(` in million)
Year ended 31 December 2019
Year ended 31 December 2018
Interest on items at amortized cost:
- Term loans 2,372.71 1,394.32
- Working capital facilities 266.30 195.91
- Non-convertible debentures - 113.92
- Financial liabilities 65.33 120.18
- Others 11.47 39.71
Exchange differences regarded as an adjustments to borrowings 64.55 52.68
Other ancillary borrowing costs 22.12 27.26
2,802.48 1,943.98
Varun Beverages Limited260
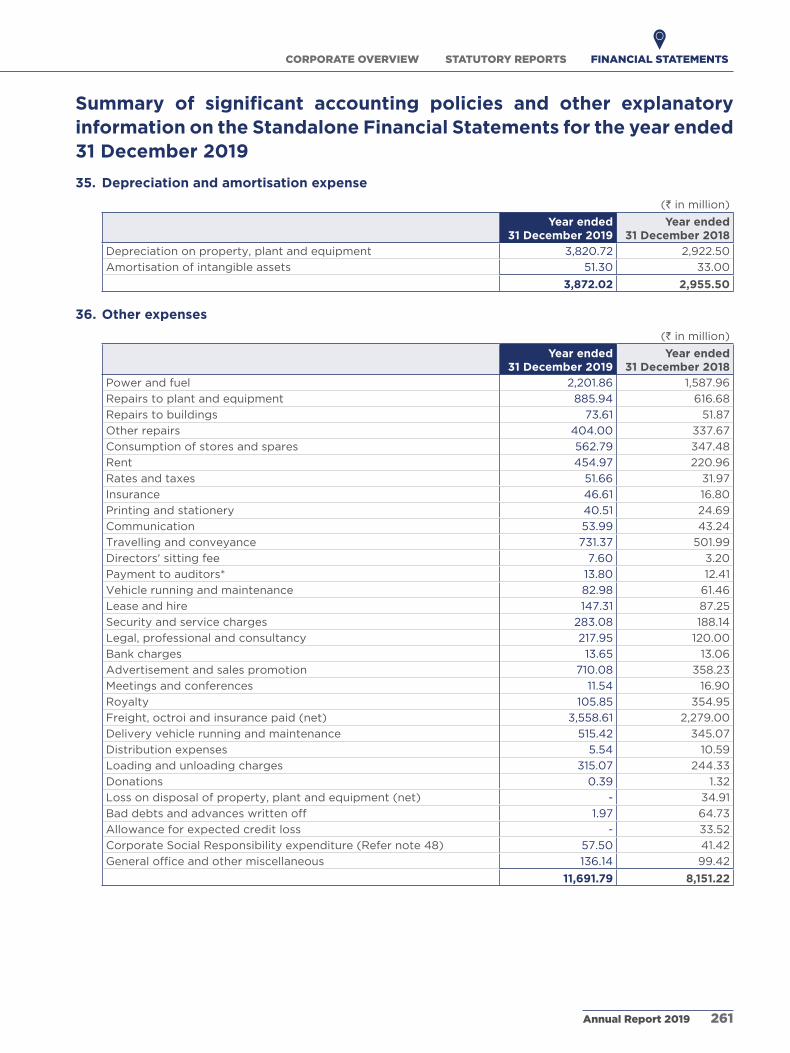
Summary of significant accounting policies and other explanatory information on the Standalone Financial Statements for the year ended 31 December 2019
35. Depreciation and amortisation expense
(` in million)
Year ended 31 December 2019
Year ended 31 December 2018
Depreciation on property, plant and equipment 3,820.72 2,922.50
amortisation of intangible assets 51.30 33.00
3,872.02 2,955.50
36. Other expenses
(` in million)
Year ended 31 December 2019
Year ended 31 December 2018
Power and fuel 2,201.86 1,587.96
Repairs to plant and equipment 885.94 616.68
Repairs to buildings 73.61 51.87
Other repairs 404.00 337.67
Consumption of stores and spares 562.79 347.48
Rent 454.97 220.96
Rates and taxes 51.66 31.97
Insurance 46.61 16.80
Printing and stationery 40.51 24.69
Communication 53.99 43.24
Travelling and conveyance 731.37 501.99
Directors' sitting fee 7.60 3.20
Payment to auditors* 13.80 12.41
Vehicle running and maintenance 82.98 61.46
Lease and hire 147.31 87.25
Security and service charges 283.08 188.14
Legal, professional and consultancy 217.95 120.00
Bank charges 13.65 13.06
advertisement and sales promotion 710.08 358.23
Meetings and conferences 11.54 16.90
Royalty 105.85 354.95
Freight, octroi and insurance paid (net) 3,558.61 2,279.00
Delivery vehicle running and maintenance 515.42 345.07
Distribution expenses 5.54 10.59
Loading and unloading charges 315.07 244.33
Donations 0.39 1.32
Loss on disposal of property, plant and equipment (net) - 34.91
Bad debts and advances written off 1.97 64.73
allowance for expected credit loss - 33.52
Corporate Social Responsibility expenditure (Refer note 48) 57.50 41.42
Generalofficeandothermiscellaneous 136.14 99.42
11,691.79 8,151.22
STATUTORY REPORTSCORPORATE OVERVIEW FINANCIAL STATEMENTS
Annual Report 2019 261

Summary of significant accounting policies and other explanatory information on the Standalone Financial Statements for the year ended 31 December 2019
*Payment to auditors
(` in million)
Year ended 31 December 2019
Year ended 31 December 2018
Services rendered for:
- audit and reviews 11.40 11.20
- taxation matters 1.24 -
- other matters** 0.45 0.46
- reimbursement of expenses 0.71 0.75
13.80 12.41 **Excludes expense of ` 4.25 (31 December 2018: Nil) towards fee related to QIP of equity shares, which has been adjusted with the securities premium as share issue expense.
37. Other comprehensive income (OCI)
The disaggregation of changes to OCI by each type of reserves in equity is shown below:
(` in million)
Year ended 31 December 2019
Year ended 31 December 2018
Retained earnings
Re-measurementlossesondefinedbenefitplans (94.59) (22.54)
Taximpactonre-measurementlossesondefinedbenefitplans 33.05 7.78
(61.54) (14.76)
Capital reserve
Gain from a bargain purchase (Refer note 49a) 344.43 -
344.43 -
38. Gratuity and other post-employment benefit plans
Gratuity:
The Company has a defined benefit gratuity plan governed by the Payments of Gratuity act, 1972. Every employee
who has completed five years or more of services is eligible for gratuity on separation at 15 days salary (last drawn
salary) for each completed year of service. The Company has formed a Gratuity Trust to which contribution is
made and an insurance policy is taken by the trust, which is a year-on-year cash accumulation plan in which the
interest rate is declared on yearly basis and is guaranteed for a period of one year. The insurance company, as
part of the policy rules, makes payment of all gratuity outflow during the year (subject to sufficiency of funds
under the policy). The policy, thus, mitigates the liquidity risk. However, being a cash accumulation plan, the
duration of assets is shorter compared to the duration of liabilities. Thus, the Company is exposed to movement
in interest rate (particularly, the significant fall in interest rates, which should result in a increase in liability without
corresponding increase in the asset. The Company makes a provision of unfunded liability based on actuarial
valuation in the Balance Sheet as part of employee cost.
Compensated absences:
The Company recognises the compensated absences expenses in the Statement of Profit and Loss based on
actuarial valuation.
Varun Beverages Limited262

Summary of significant accounting policies and other explanatory information on the Standalone Financial Statements for the year ended 31 December 2019
The following tables summaries the components of net benefit expense recognized in the Statement of Profit and
Loss and the funded status and amounts recognized in the balance sheet:
Gratuity Compensated Absences
31 December 2019
31 December 2018
31 December 2019
31 December 2018
Changes in present value are as follows:
Balance at the beginning of the year 773.03 573.50 404.91 279.13
acquired on business combination (Refer note 49a and 49C)
289.19 63.36 52.34 20.36
Current service cost 140.32 94.92 129.12 109.44
Interest cost 71.22 50.69 33.98 26.16
Benefitssettled (35.58) (31.72) (23.84) (19.55)
actuarial loss/(gain) 94.40 22.28 (3.64) (10.63)
Balance at the end of the year 1,332.58 773.03 592.87 404.91
Gratuity Compensated Absences
31 December 2019
31 December 2018
31 December 2019
31 December 2018
Change in fair value of plan assets are as follows:
Plan assets at the beginning of the year, at fair value
49.16 38.64 - -
Expected income on plan assets 2.89 3.94 - -
actuarial (loss)/gain (0.18) (0.26) - -
Contributions by employer 2.06 31.84 - -
Benefitssettled (24.00) (25.00) - -
Plan assets at the end of the year, at fair value 29.93 49.16 - -
The Company has taken an insurance policy against its liability towards gratuity, the same has been disclosed as
plan assets above.
Gratuity Compensated Absences
31 December 2019
31 December 2018
31 December 2019
31 December 2018
Reconciliation of present value of the obligation and the fair value of the plan assets:
Present value of obligation 1,332.58 773.03 592.87 404.91
Fair value of plan assets (29.93) (49.16) - -
Net liability recognized in the Balance Sheet 1,302.65 723.87 592.87 404.91
STATUTORY REPORTSCORPORATE OVERVIEW FINANCIAL STATEMENTS
Annual Report 2019 263
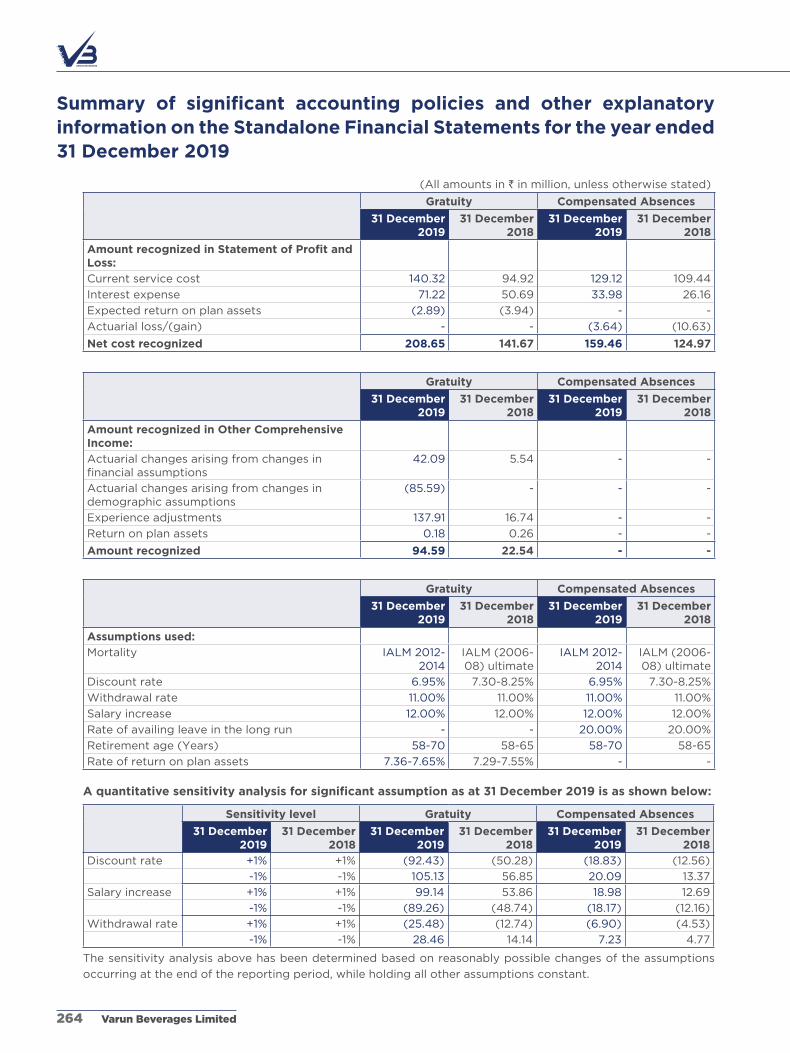
Summary of significant accounting policies and other explanatory information on the Standalone Financial Statements for the year ended 31 December 2019
(all amounts in ` in million, unless otherwise stated)
Gratuity Compensated Absences
31 December 2019
31 December 2018
31 December 2019
31 December 2018
Amount recognized in Statement of Profit and Loss:
Current service cost 140.32 94.92 129.12 109.44
Interest expense 71.22 50.69 33.98 26.16
Expected return on plan assets (2.89) (3.94) - -
actuarial loss/(gain) - - (3.64) (10.63)
Net cost recognized 208.65 141.67 159.46 124.97
Gratuity Compensated Absences
31 December 2019
31 December 2018
31 December 2019
31 December 2018
Amount recognized in Other Comprehensive Income:
actuarial changes arising from changes in financialassumptions
42.09 5.54 - -
actuarial changes arising from changes in demographic assumptions
(85.59) - - -
Experience adjustments 137.91 16.74 - -
Return on plan assets 0.18 0.26 - -
Amount recognized 94.59 22.54 - -
Gratuity Compensated Absences
31 December 2019
31 December 2018
31 December 2019
31 December 2018
Assumptions used:
Mortality IaLM 2012-2014
IaLM (2006-08) ultimate
IaLM 2012-2014
IaLM (2006-08) ultimate
Discount rate 6.95% 7.30-8.25% 6.95% 7.30-8.25%
Withdrawal rate 11.00% 11.00% 11.00% 11.00%
Salary increase 12.00% 12.00% 12.00% 12.00%
Rate of availing leave in the long run - - 20.00% 20.00%
Retirement age (Years) 58-70 58-65 58-70 58-65
Rate of return on plan assets 7.36-7.65% 7.29-7.55% - -
A quantitative sensitivity analysis for significant assumption as at 31 December 2019 is as shown below:
Sensitivity level Gratuity Compensated Absences
31 December 2019
31 December 2018
31 December 2019
31 December 2018
31 December 2019
31 December 2018
Discount rate +1% +1% (92.43) (50.28) (18.83) (12.56)
-1% -1% 105.13 56.85 20.09 13.37
Salary increase +1% +1% 99.14 53.86 18.98 12.69
-1% -1% (89.26) (48.74) (18.17) (12.16)
Withdrawal rate +1% +1% (25.48) (12.74) (6.90) (4.53)
-1% -1% 28.46 14.14 7.23 4.77
The sensitivity analysis above has been determined based on reasonably possible changes of the assumptions
occurring at the end of the reporting period, while holding all other assumptions constant.
Varun Beverages Limited264

Summary of significant accounting policies and other explanatory information on the Standalone Financial Statements for the year ended 31 December 2019
(all amounts in ` in million, unless otherwise stated)
Risk associated:
Investment risk Thepresentvalueofthedefinedbenefitplanliabilityiscalculatedusingadiscountratedetermined by reference to Government Bonds Yield. If plan liability is funded and return onplanassetsisbelowthisrate,itwillcreateaplandeficit.
Interest risk (discount rate risk)
a decrease in the bond interest rate (discount rate) will increase the plan liability.
Mortality risk Thepresentvalueofthedefinedbenefitplanliabilityiscalculatedbyreferencetothebestestimate of the mortality of plan participants. For this report we have used Indian assured Lives Mortality (2012-2014) (31 December 2018: (2006-08) ultimate table). a change in mortality rate will have a bearing on the plan's liability.
Salary risk Thepresentvalueofthedefinedbenefitplanliabilityiscalculatedwiththeassumptionofsalary increase rate of plan participants in future. Deviation in the rate of increase of salary in future for plan participants from the rate of increase in salary used to determine the present value of obligation will have a bearing on the plan's liability.
Effect of the defined benefit plan on the Company’s future cash flows:
Funding arrangements and funding policy:
The Company has purchased an insurance policy to provide for payment of gratuity to the employees. Every
year, the insurance company carries out a funding valuation based on the latest employee data provided by the
Company. any deficit in the assets arising as a result of such valuation is funded by the Company.
Expected contribution during the next annual reporting period:
The Company’s best estimate of contribution during the next financial year approximates to ` 1,459.25 (31
December 2018: ` 816.29).
The following are maturity profile of Defined Benefit Obligations in future years (before adjusting fair value of
plan assets):
Gratuity Compensated Absences
31 December 2019
31 December 2018
31 December 2019
31 December 2018
(i) Weightedaveragedurationofthedefinedbenefitobligation
7 years 7 years 3 years 3 years
(ii) Expectedcashflowsovertheyears(valued on undiscounted basis):
Duration (years)
1 142.25 79.99 176.49 121.47
2 to 5 572.20 395.28 387.98 275.06
above 5 1,791.76 987.69 201.75 132.74
2,506.21 1,462.96 766.22 529.27
Defined contribution plan:
Contribution to defined contribution plans, recognized as expense for the year is as under:
Employer’s contribution to provident and other funds ` 285.61 (31 December 2018 ` 201.90)
STATUTORY REPORTSCORPORATE OVERVIEW FINANCIAL STATEMENTS
Annual Report 2019 265

Summary of significant accounting policies and other explanatory information on the Standalone Financial Statements for the year ended 31 December 2019
39. Earnings per share (EPS)
(all amounts in ` in million, unless otherwise stated)
31 December 2019 31 December 2018
Profitattributabletotheequityshareholders 4,485.47 3,323.59
Weighted average number of equity shares outstanding during the year for calculating basic earning per share (nos.)*
278,613,350 273,947,446
Employee stock options (nos.) - 18,887
Weighted average number of equity shares outstanding during the year for calculating diluted earnings per share (nos.)*
278,613,350 273,966,333
Nominal value per equity shares (`) 10.00 10.00
Basic earnings per share (`) 16.10 12.13
Diluted earnings per share (`) 16.10 12.13 *The Company has issued 91,327,613 equity shares of ` 10 each as fully paid-up bonus shares in the ratio of 1 (One) equity share for every 2 (Two) existing equity shares. accordingly, earnings per share for the previous year has been calculated based on number of shares outstanding in previous year, as increased for issuance of bonus shares.
40. Dividend:
(` in million)
31 December 2019 31 December 2018
Interim dividend ` 2.50 per share (31 December 2018: ` 2.50 per share)
684.96 456.58
Dividend distribution tax on interim dividend 91.73 54.71
41. Contingent liabilities and commitments
(` in million)
As at 31 December 2019
As at 31 December 2018
(a) Guarantees issued on behalf of subsidiaries for business purposes
2,583.14 2,513.22
(b) Claims against the Company not acknowledged as debts (being contested):-
(i) Goods and Service Tax 2.16 1.28
(ii) For excise and service tax 50.12 166.82
(iii) For Customs 45.37 45.37
(iv) For sales tax / entry tax 760.02 728.95
(v) For income tax 85.80 3.13
(vi) Others* 315.28 255.95 *excludes pending matters where amount of liability is not ascertainable.
42. Capital commitments
(` in million)
As at 31 December 2019
As at 31 December 2018
Estimated amount of contracts remaining to be executed on capital account and not provided for (net of advances of ` 544.65 (31 December 2018: ` 287.31)).
3,783.86 1,286.08
43. Pursuant to transfer pricing legislations under the Income-tax act, 1961, the Company is required to use specified
methods for computing arm’s length price in relation to specified international and domestic transactions with its
associated enterprises. Further, the Company is required to maintain prescribed information and documents in
relation to such transactions. The appropriate method to be adopted will depend on the nature of transactions/
Varun Beverages Limited266
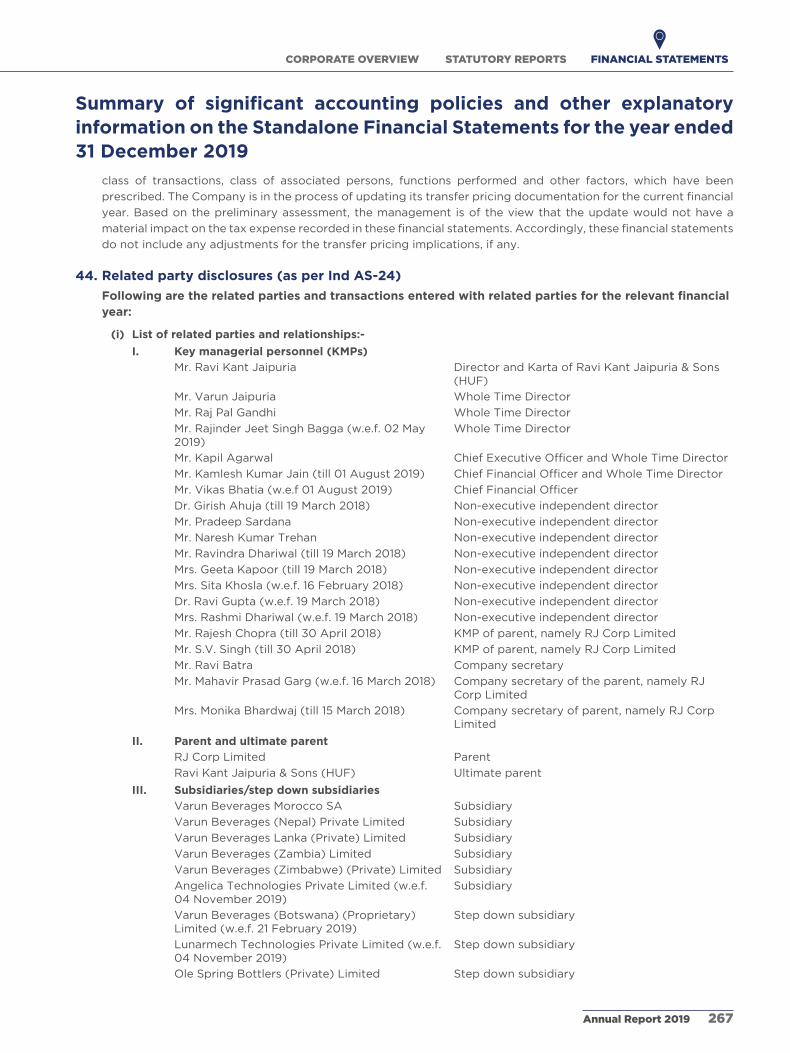
Summary of significant accounting policies and other explanatory information on the Standalone Financial Statements for the year ended 31 December 2019
class of transactions, class of associated persons, functions performed and other factors, which have been
prescribed. The Company is in the process of updating its transfer pricing documentation for the current financial
year. Based on the preliminary assessment, the management is of the view that the update would not have a
material impact on the tax expense recorded in these financial statements. accordingly, these financial statements
do not include any adjustments for the transfer pricing implications, if any.
44. Related party disclosures (as per Ind AS-24)
Following are the related parties and transactions entered with related parties for the relevant financial year:
(i) List of related parties and relationships:-
I. Key managerial personnel (KMPs)
Mr. Ravi Kant Jaipuria Director and Karta of Ravi Kant Jaipuria & Sons (HUF)
Mr. Varun Jaipuria Whole Time Director
Mr. Raj Pal Gandhi Whole Time Director
Mr. Rajinder Jeet Singh Bagga (w.e.f. 02 May 2019)
Whole Time Director
Mr. Kapil agarwal ChiefExecutiveOfficerandWholeTimeDirector
Mr. Kamlesh Kumar Jain (till 01 august 2019) ChiefFinancialOfficerandWholeTimeDirector
Mr. Vikas Bhatia (w.e.f 01 august 2019) ChiefFinancialOfficer
Dr. Girish ahuja (till 19 March 2018) Non-executive independent director
Mr. Pradeep Sardana Non-executive independent director
Mr. Naresh Kumar Trehan Non-executive independent director
Mr. Ravindra Dhariwal (till 19 March 2018) Non-executive independent director
Mrs. Geeta Kapoor (till 19 March 2018) Non-executive independent director
Mrs. Sita Khosla (w.e.f. 16 February 2018) Non-executive independent director
Dr. Ravi Gupta (w.e.f. 19 March 2018) Non-executive independent director
Mrs. Rashmi Dhariwal (w.e.f. 19 March 2018) Non-executive independent director
Mr. Rajesh Chopra (till 30 april 2018) KMP of parent, namely RJ Corp Limited
Mr. S.V. Singh (till 30 april 2018) KMP of parent, namely RJ Corp Limited
Mr. Ravi Batra Company secretary
Mr. Mahavir Prasad Garg (w.e.f. 16 March 2018) Company secretary of the parent, namely RJ Corp Limited
Mrs. Monika Bhardwaj (till 15 March 2018) Company secretary of parent, namely RJ Corp Limited
II. Parent and ultimate parent
RJ Corp Limited Parent
Ravi Kant Jaipuria & Sons (HUF) Ultimate parent
III. Subsidiaries/step down subsidiaries
Varun Beverages Morocco Sa Subsidiary
Varun Beverages (Nepal) Private Limited Subsidiary
Varun Beverages Lanka (Private) Limited Subsidiary
Varun Beverages (Zambia) Limited Subsidiary
Varun Beverages (Zimbabwe) (Private) Limited Subsidiary
angelica Technologies Private Limited (w.e.f. 04 November 2019)
Subsidiary
Varun Beverages (Botswana) (Proprietary) Limited (w.e.f. 21 February 2019)
Step down subsidiary
Lunarmech Technologies Private Limited (w.e.f. 04 November 2019)
Step down subsidiary
Ole Spring Bottlers (Private) Limited Step down subsidiary
STATUTORY REPORTSCORPORATE OVERVIEW FINANCIAL STATEMENTS
Annual Report 2019 267

Summary of significant accounting policies and other explanatory information on the Standalone Financial Statements for the year ended 31 December 2019
IV. Fellow subsidiaries and entities controlled by parent*
Devyani International Limited
Devyani Food Industries Limited
alisha Retail Private Limited
Varun Food and Beverages Zambia Limited
Wellness Holdings Limited
SVS India Private Limited
Lineage Healthcare Limited (w.e.f. 27 September 2019)
Diagno Labs Private Limited
V. Associate (or an associate of any member of the Company)
Lunarmech Technologies Private Limited (till 03 November 2019)
angelica Technologies Private Limited (till 03 November 2019)
Lineage Healthcare Limited (till 26 September 2019)
VI. Relatives of KMPs*
Mrs. Dhara Jaipuria
Mrs. Devyani Jaipuria
Mrs. Shashi Jain (till 01 august 2019)
Mr. Kanishk Jain (till 01 august 2019)
Mrs.Srishti Jain (till 01 august 2019)
Mrs. aastha agarwal
Mr. Ravindra Dhariwal (w.e.f. 19 March 2018)
Mr. Kaustubh agarwal
VII. Entities in which a director or his/her relative is a member/director/Trustee*
Champa Devi Jaipuria Charitable Trust
Mala Jaipuria Foundation (Trust)
SMV Beverages Private Limited
SMV agencies Private Limited
alisha Torrent Closures (India) Private Limited
Nectar Beverages Private Limited
Steel City Beverages Private Limited
Jai Beverages Private Limited
Sagacito Technology Private Limited
Devyani airport Services (Mumbai) Private Limited
VIII. Entities which are post employment benefits plans
VBL Employees Gratuity Trust
*With whom the Company had transactions during the current year and previous year.
(ii) Terms and conditions of transactions with related parties
The transactions with related parties are made in the ordinary business and on terms equivalent to those that prevail in arm's length transactions. Outstanding balances at the year-end are unsecured and settlement occursincash.Thisassessmentisundertakeneachfinancialyearthroughexaminingthefinancialpositionof the related party and the market in which the related party operates.
(iii) Transactions with KMPs (Refer note 44a)
(iv) Transactions with related parties (Refer note 44B)
Varun Beverages Limited268

Summary of significant accounting policies and other explanatory information on the Standalone Financial Statements for the year ended 31 December 2019
44A. Transactions with KMPs
(all amounts in ` in million, unless otherwise stated)
For year ended 2019 For year ended 2018
I. Remuneration paid
Mr. Varun Jaipuria 31.45 31.22
Mr. Raj Pal Gandhi 48.51 48.68
Mr. Kapil agarwal 57.12 47.48
Mr. Kamlesh Kumar Jain 9.89 12.27
Mr. Rajesh Chopra - 1.61
Mr. Ravi Batra 8.23 7.46
Mr. Rajinder Jeet Singh Bagga 18.44 -
Mr. Mahavir Prasad Garg 3.60 2.85
Mr. Vikas Bhatia 7.72 -
Mrs. Monika Bhardwaj - 0.35
II. Director sitting fees paid
Dr. Girish ahuja - 0.50
Mr. Pradeep Sardana 0.80 0.30
Mr. Ravindra Dhariwal - 0.40
Mrs. Geeta Kapoor - 0.20
Mrs. Sita Khosla 1.90 0.30
Dr. Ravi Gupta 1.90 0.70
Mrs. Rashmi Dhariwal 3.00 0.80
III. Professional charges paid
Mr. Rajesh Chopra - 0.76
IV. Dividend paid
Mr. Varun Jaipuria 126.66 97.94
Mr. Raj Pal Gandhi 1.53 1.02
Mr. Kapil agarwal 1.02 1.02
Mr. Kamlesh Kumar Jain 0.06 0.04
Mr. Rajinder Jeet Singh Bagga 0.32 -
Mr. Vikas Bhatia 0.02 -
Mr. Pradeep Sardana 0.00* 0.00*
V. Defined benefit obligation for KMP
(i) Gratuity
Mr. Varun Jaipuria 25.88 22.55
Mr. Raj Pal Gandhi 40.01 31.07
Mr. Kapil agarwal 48.79 39.83
Mr. Kamlesh Kumar Jain - 8.57
Mr. Ravi Batra 0.73 0.40
Mr. Mahavir Prasad Garg 0.16 0.07
Mr. Rajinder Jeet Singh Bagga 19.56 -
Mr. Vikas Bhatia 0.01 -
(ii) Compensated absences
Mr. Varun Jaipuria 8.22 6.06
Mr. Raj Pal Gandhi 13.02 10.61
Mr. Kapil agarwal 15.84 13.78
Mr. Kamlesh Kumar Jain - 2.92
Mr. Ravi Batra 1.16 0.63
Mr. Vikas Bhatia 0.54 -
STATUTORY REPORTSCORPORATE OVERVIEW FINANCIAL STATEMENTS
Annual Report 2019 269

Summary of significant accounting policies and other explanatory information on the Standalone Financial Statements for the year ended 31 December 2019
(all amounts in ` in million, unless otherwise stated)
For year ended 2019 For year ended 2018
Mr. Mahavir Prasad Garg 0.35 0.15
Mr. Rajinder Jeet Singh Bagga 7.09 -
VI. Bonus Share issued (Face value of ` 10 each)
Mr. Varun Jaipuria 16.89 -
Mr. Raj Pal Gandhi 2.04 -
Mr. Kapil agarwal 2.03 -
Mr. Kamlesh Kumar Jain 0.09 -
Mr. Pradeep Sardana 0.00* -
Mr. Rajinder Jeet Singh Bagga 0.43 -
VII. Balances (payable)/receivable outstanding at the end of the year, net
Mr. Varun Jaipuria (1.56) (1.69)
Mr. Raj Pal Gandhi (1.60) (1.58)
Mr. Kapil agarwal (2.12) (2.13)
Mr. Kamlesh Kumar Jain - (1.09)
Mr. Rajinder Jeet Singh Bagga 0.24 -
Mr. Ravi Batra (0.45) (0.94)
Mr. Mahavir Prasad Garg (0.14) (0.21)
Mrs. Sita Khosla (0.09) -
Mr. Vikas Bhatia (0.75) - *Rounded off to Nil.
Varun Beverages Limited270

Su
mm
ary
of s
ign
ific
an
t acco
un
tin
g p
oli
cie
s an
d o
the
r exp
lan
ato
ry in
form
ati
on
on
th
e S
tan
dalo
ne
F
inan
cia
l S
tate
me
nts
fo
r th
e y
ear
en
de
d 3
1 D
ece
mb
er
20
19
(all
am
ou
nts
in
` in
mill
ion
, u
nle
ss o
therw
ise s
tate
d)
De
scri
pti
on
Pare
nt
an
d
ult
imate
pare
nt
Su
bsi
dia
rie
s/ s
tep
d
ow
n s
ub
sid
iary
Fe
llo
w
sub
sid
iari
es
an
d e
nti
tie
s co
ntr
oll
ed
by
p
are
nt
Ass
ocia
te (
or
an
ass
ocia
te o
f an
y
me
mb
er
of
the
C
om
pan
y)
Re
lati
ve
s o
f K
MP
sE
nti
tie
s in
wh
ich
a d
ire
cto
r o
r h
is/h
er
rela
tive
is
a m
em
be
r/d
ire
cto
r/tr
ust
ee
En
titi
es
wh
ich
are
po
st
em
plo
ym
en
t b
en
efi
ts p
lan
s
Tota
l
Fo
r ye
ar
en
de
d
Fo
r ye
ar
en
de
d
Fo
r ye
ar
en
de
d
Fo
r ye
ar
en
de
d
Fo
r ye
ar
en
de
d
Fo
r ye
ar
en
de
d
Fo
r ye
ar
en
de
d
Fo
r ye
ar
en
de
d
20
192
018
20
192
018
20
192
018
20
192
018
20
192
018
20
192
018
20
192
018
20
192
018
Sale
of
go
od
s
- V
aru
n B
evera
ges
(Nep
al)
Pri
vate
L
imit
ed
--
61.
29
84
.05
--
--
--
--
--
61.
29
84
.05
- O
le S
pri
ng
Bo
ttle
rs (
Pri
vate
) L
imit
ed
--
18.8
616
.32
--
--
--
--
--
18.8
616
.32
- V
aru
n B
evera
ges
Mo
rocco
Sa
--
6.4
95
.82
--
--
--
--
--
6.4
95
.82
- V
aru
n B
evera
ges
Lan
ka (
Pri
vate
) L
imit
ed
--
0.0
50
.36
--
--
--
--
--
0.0
50
.36
- V
aru
n B
evera
ges
(Zam
bia
) L
imit
ed
--
54
.66
150
.36
--
--
--
--
--
54
.66
150
.36
- V
aru
n B
evera
ges
(Zim
bab
we)
(Pri
vate
) L
imit
ed
--
20
6.9
16
95
.15
--
--
--
--
--
20
6.9
16
95
.15
- S
MV
Bevera
ges
Pri
vate
Lim
ited
--
--
--
--
--
75
.48
--
-75
.48
-
- L
un
arm
ech
Tech
no
log
ies
Pri
vate
L
imit
ed
--
2.4
6-
--
12.1
714
.79
--
--
--
14.6
314
.79
- a
lish
a T
orr
en
t C
losu
res
(In
dia
) P
rivate
Lim
ited
--
--
--
--
--
5.1
54
.14
--
5.1
54
.14
- N
ecta
r B
evera
ges
Pri
vate
L
imit
ed
--
--
--
--
--
27.0
56
.82
--
27.
05
6.8
2
- Jai B
evera
ges
Pri
vate
Lim
ited
--
--
--
--
--
49
.53
52.6
4-
-4
9.5
35
2.6
4
- D
evyan
i In
tern
ati
on
al L
imit
ed
--
--
56
.52
83
.62
--
--
--
--
56
.52
83
.62
- D
evyan
i F
oo
d In
du
stri
es
Lim
ited
--
--
16.6
225
.73
--
--
--
--
16.6
22
5.7
3
- a
lish
a R
eta
il P
rivate
Lim
ited
--
--
(0.2
9)
15.9
3-
--
--
--
-(0
.29
)15
.93
- D
evyan
i a
irp
ort
Serv
ices
(Mu
mb
ai)
Pri
vate
Lim
ited
--
--
--
--
--
2.6
3-
--
2.6
3-
- L
ineag
e H
ealt
hcare
Lim
ited
--
--
0.0
5-
-0
.06
--
--
--
0.0
50
.06
Sale
of
raw
mate
rials
an
d s
tore
s
- V
aru
n B
evera
ges
(Nep
al)
Pri
vate
L
imit
ed
--
2.9
529
.38
--
--
--
--
--
2.9
52
9.3
8
- V
aru
n B
evera
ges
Lan
ka (
Pri
vate
) L
imit
ed
--
33
.98
0.1
5-
--
--
--
--
-3
3.9
80
.15
- V
aru
n B
evera
ges
(Zim
bab
we)
(Pri
vate
) L
imit
ed
--
24
4.5
39
.69
--
--
--
--
--
24
4.5
39
.69
- V
aru
n B
evera
ges
(Zam
bia
) L
imit
ed
--
2.9
54
.03
--
--
--
--
--
2.9
54
.03
- L
un
arm
ech
Tech
no
log
ies
Pri
vate
L
imit
ed
--
0.1
6-
--
--
--
--
--
0.1
6-
STATUTORY REPORTSCORPORATE OVERVIEW FINANCIAL STATEMENTS
Annual Report 2019 271

Su
mm
ary
of s
ign
ific
an
t acco
un
tin
g p
oli
cie
s an
d o
the
r exp
lan
ato
ry in
form
ati
on
on
th
e S
tan
dalo
ne
F
inan
cia
l S
tate
me
nts
fo
r th
e y
ear
en
de
d 3
1 D
ece
mb
er
20
19(a
ll am
ou
nts
in
` in
mill
ion
, u
nle
ss o
therw
ise s
tate
d)
De
scri
pti
on
Pare
nt
an
d
ult
imate
pare
nt
Su
bsi
dia
rie
s/ s
tep
d
ow
n s
ub
sid
iary
Fe
llo
w
sub
sid
iari
es
an
d e
nti
tie
s co
ntr
oll
ed
by
p
are
nt
Ass
ocia
te (
or
an
ass
ocia
te o
f an
y
me
mb
er
of
the
C
om
pan
y)
Re
lati
ve
s o
f K
MP
sE
nti
tie
s in
wh
ich
a d
ire
cto
r o
r h
is/h
er
rela
tive
is
a m
em
be
r/d
ire
cto
r/tr
ust
ee
En
titi
es
wh
ich
are
po
st
em
plo
ym
en
t b
en
efi
ts p
lan
s
Tota
l
Fo
r ye
ar
en
de
d
Fo
r ye
ar
en
de
d
Fo
r ye
ar
en
de
d
Fo
r ye
ar
en
de
d
Fo
r ye
ar
en
de
d
Fo
r ye
ar
en
de
d
Fo
r ye
ar
en
de
d
Fo
r ye
ar
en
de
d
20
192
018
20
192
018
20
192
018
20
192
018
20
192
018
20
192
018
20
192
018
20
192
018
- Jai B
evera
ges
Pri
vate
Lim
ited
--
--
--
--
--
1.5
03
.03
--
1.5
03
.03
- N
ecta
r B
evera
ges
Pri
vate
L
imit
ed
--
--
--
--
--
110
.36
0.1
2-
-11
0.3
60
.12
- D
evyan
i F
oo
d In
du
stri
es
Lim
ited
--
--
33
.54
0.1
9-
--
--
--
-3
3.5
40
.19
- S
MV
Bevera
ges
Pri
vate
Lim
ited
-
--
--
--
--
-14
4.3
2-
--
144
.32
-
Pu
rch
ase
of
go
od
s
- N
ecta
r B
evera
ges
Pri
vate
L
imit
ed
--
--
--
--
--
48
4.1
51.
25
--
48
4.1
51.
25
- S
MV
Bevera
ges
Pri
vate
Lim
ited
-
--
--
--
--
-278
.63
--
-2
78
.63
-
- D
evyan
i F
oo
d In
du
stri
es
Lim
ited
--
--
142.0
0-
--
--
--
--
142
.00
-
Pu
rch
ase
of
raw
mate
rials
an
d
sto
res
- L
un
arm
ech
Tech
no
log
ies
Pri
vate
L
imit
ed
--
99
.38
--
-4
91.
34
514
.86
--
--
--
59
0.7
25
14.8
6
- D
evyan
i F
oo
d In
du
stri
es
Lim
ited
--
--
-3
.99
--
--
--
--
-3
.99
- Jai B
evera
ges
Pri
vate
Lim
ited
--
--
--
--
--
-0
.26
--
-0
.26
- a
lish
a R
eta
il P
rivate
Lim
ited
--
--
0.0
50
.77
--
--
--
--
0.0
50
.77
Pro
mo
tio
nal
ch
arg
es
paid
- a
lish
a R
eta
il P
rivate
Lim
ited
--
--
1.9
57.4
1-
--
--
--
-1.
95
7.4
1
Lo
an
giv
en
- V
aru
n B
evera
ges
Mo
rocco
Sa
--
211
.23
73
6.2
6-
--
--
--
--
-2
11.2
373
6.2
6
- V
aru
n B
evera
ges
(Zam
bia
) L
imit
ed
--
-24
1.78
--
--
--
--
--
-2
41.
78
- V
aru
n B
evera
ges
(Zim
bab
we)
(Pri
vate
) L
imit
ed
--
-3
75
.48
--
--
--
--
--
-3
75
.48
Inte
rest
re
ce
ive
d/(
paid
)
- V
aru
n B
evera
ges
Mo
rocco
Sa
--
124
.13
144
.30
--
--
--
--
--
124
.13
144
.30
- V
aru
n B
evera
ges
(Zim
bab
we)
(Pri
vate
) L
imit
ed
--
41.
183
2.4
8-
--
--
--
--
-4
1.18
32
.48
- V
aru
n B
evera
ges
(Zam
bia
) L
imit
ed
--
50
.57
55
.91
--
--
--
--
--
50
.57
55
.91
- V
aru
n B
evera
ges
Lan
ka (
Pri
vate
) L
imit
ed
--
38
.51
40
.04
--
--
--
--
--
38
.51
40
.04
- S
MV
Bevera
ges
Pri
vate
Lim
ited
--
--
--
--
--
(4.0
0)
(3.0
0)
--
(4.0
0)
(3.0
0)
Varun Beverages Limited272

Su
mm
ary
of s
ign
ific
an
t acco
un
tin
g p
oli
cie
s an
d o
the
r exp
lan
ato
ry in
form
ati
on
on
th
e S
tan
dalo
ne
F
inan
cia
l S
tate
me
nts
fo
r th
e y
ear
en
de
d 3
1 D
ece
mb
er
20
19(a
ll am
ou
nts
in
` in
mill
ion
, u
nle
ss o
therw
ise s
tate
d)
De
scri
pti
on
Pare
nt
an
d
ult
imate
pare
nt
Su
bsi
dia
rie
s/ s
tep
d
ow
n s
ub
sid
iary
Fe
llo
w
sub
sid
iari
es
an
d e
nti
tie
s co
ntr
oll
ed
by
p
are
nt
Ass
ocia
te (
or
an
ass
ocia
te o
f an
y
me
mb
er
of
the
C
om
pan
y)
Re
lati
ve
s o
f K
MP
sE
nti
tie
s in
wh
ich
a d
ire
cto
r o
r h
is/h
er
rela
tive
is
a m
em
be
r/d
ire
cto
r/tr
ust
ee
En
titi
es
wh
ich
are
po
st
em
plo
ym
en
t b
en
efi
ts p
lan
s
Tota
l
Fo
r ye
ar
en
de
d
Fo
r ye
ar
en
de
d
Fo
r ye
ar
en
de
d
Fo
r ye
ar
en
de
d
Fo
r ye
ar
en
de
d
Fo
r ye
ar
en
de
d
Fo
r ye
ar
en
de
d
Fo
r ye
ar
en
de
d
20
192
018
20
192
018
20
192
018
20
192
018
20
192
018
20
192
018
20
192
018
20
192
018
Co
ntr
ibu
tio
n t
o c
orp
ora
te s
ocia
l re
spo
nsi
bil
ity a
cti
vit
ies
- M
ala
Jaip
uri
a F
ou
nd
ati
on
--
--
--
--
--
5.0
0-
--
5.0
0-
- C
ham
pa D
evi Jaip
uri
a C
hari
tab
le
Tru
st-
--
--
--
--
-5
0.0
03
6.5
0-
-5
0.0
03
6.5
0
Gu
ara
nte
e c
om
mis
sio
n i
nco
me
- V
aru
n B
evera
ges
(Zim
bab
we)
(Pri
vate
) L
imit
ed
--
38
.26
25
.56
--
--
--
--
--
38
.26
25
.56
- V
aru
n B
evera
ges
(Nep
al)
Pri
vate
L
imit
ed
--
3.5
93
.99
--
--
--
--
--
3.5
93
.99
Div
ide
nd
in
co
me
- V
aru
n B
evera
ges
(Nep
al)
Pri
vate
L
imit
ed
--
20
2.3
119
2.1
9-
--
--
--
--
-2
02
.31
192
.19
- V
aru
n B
evera
ges
(Zam
bia
) L
imit
ed
--
46
.49
--
--
--
--
--
-4
6.4
9-
Inve
stm
en
t in
pre
fere
nce
sh
are
s
- V
aru
n B
evera
ges
Lan
ka (
Pri
vate
) L
imit
ed
--
-20
4.3
8-
--
--
--
--
--
20
4.3
8
Re
de
mp
tio
n o
f p
refe
ren
ce
sh
are
s (c
lass
ifie
d a
s lo
an
giv
en
to
su
bsi
dia
ry)
- V
aru
n B
evera
ges
Lan
ka (
Pri
vate
) L
imit
ed
--
89
.15
94
.05
--
--
--
--
--
89
.15
94
.05
Co
nve
rsio
n o
f lo
an
in
to
inve
stm
en
t
- V
aru
n B
evera
ges
Mo
rocco
Sa
--
1,18
2.4
66
49
.73
--
--
--
--
--
1,18
2.4
66
49
.73
- V
aru
n B
evera
ges
(Zam
bia
) L
imit
ed
--
-19
6.0
2-
--
--
--
--
--
196
.02
Pro
fess
ion
al
ch
arg
es
paid
- M
r. R
avin
dra
Dh
ari
wal
--
--
--
--
5.2
03
.20
--
--
5.2
03
.20
- S
ag
acit
o T
ech
no
log
y P
rivate
L
imit
ed
--
--
--
--
--
4.0
06
.00
--
4.0
06
.00
Se
rvic
e r
en
de
red
: m
an
ag
em
en
t fe
es
- V
aru
n B
evera
ges
(Nep
al)
Pri
vate
L
imit
ed
--
165
.86
126
.56
--
--
--
--
--
165
.86
126
.56
STATUTORY REPORTSCORPORATE OVERVIEW FINANCIAL STATEMENTS
Annual Report 2019 273
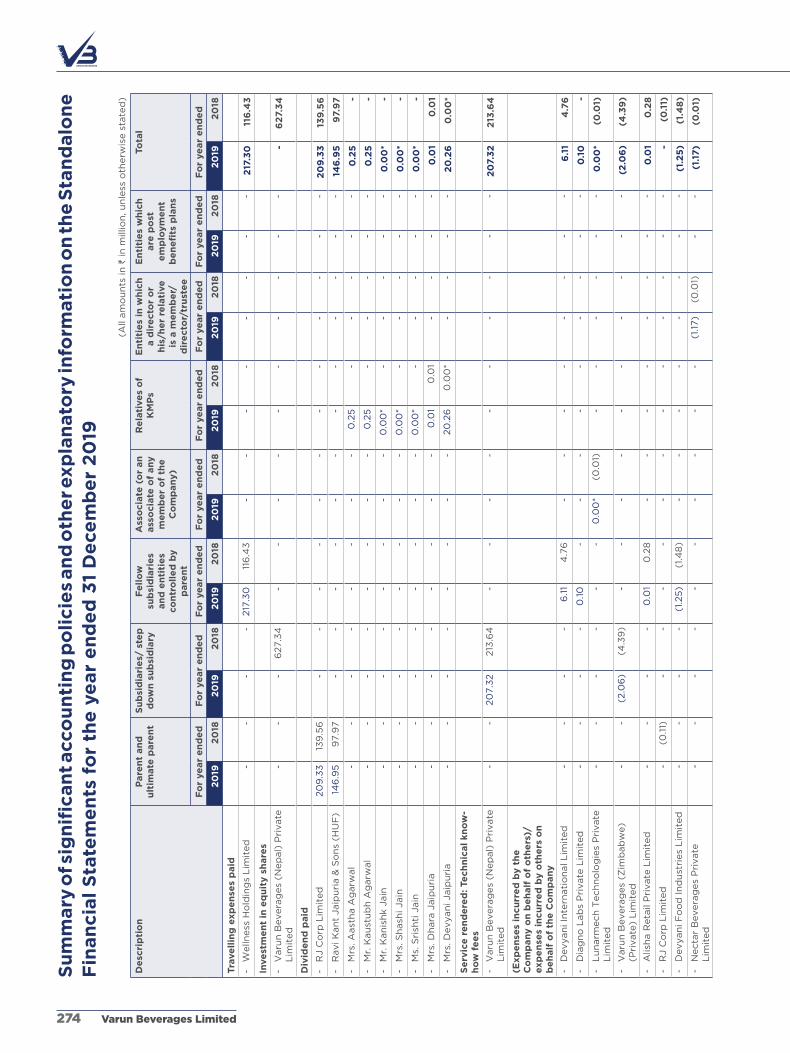
Su
mm
ary
of s
ign
ific
an
t acco
un
tin
g p
oli
cie
s an
d o
the
r exp
lan
ato
ry in
form
ati
on
on
th
e S
tan
dalo
ne
F
inan
cia
l S
tate
me
nts
fo
r th
e y
ear
en
de
d 3
1 D
ece
mb
er
20
19
(all
am
ou
nts
in
` in
mill
ion
, u
nle
ss o
therw
ise s
tate
d)
De
scri
pti
on
Pare
nt
an
d
ult
imate
pare
nt
Su
bsi
dia
rie
s/ s
tep
d
ow
n s
ub
sid
iary
Fe
llo
w
sub
sid
iari
es
an
d e
nti
tie
s co
ntr
oll
ed
by
p
are
nt
Ass
ocia
te (
or
an
ass
ocia
te o
f an
y
me
mb
er
of
the
C
om
pan
y)
Re
lati
ve
s o
f K
MP
sE
nti
tie
s in
wh
ich
a d
ire
cto
r o
r h
is/h
er
rela
tive
is
a m
em
be
r/d
ire
cto
r/tr
ust
ee
En
titi
es
wh
ich
are
po
st
em
plo
ym
en
t b
en
efi
ts p
lan
s
Tota
l
Fo
r ye
ar
en
de
d
Fo
r ye
ar
en
de
d
Fo
r ye
ar
en
de
d
Fo
r ye
ar
en
de
d
Fo
r ye
ar
en
de
d
Fo
r ye
ar
en
de
d
Fo
r ye
ar
en
de
d
Fo
r ye
ar
en
de
d
20
192
018
20
192
018
20
192
018
20
192
018
20
192
018
20
192
018
20
192
018
20
192
018
Tra
ve
llin
g e
xp
en
ses
paid
- W
elln
ess
Ho
ldin
gs
Lim
ited
--
--
217
.30
116
.43
--
--
--
--
217
.30
116
.43
Inve
stm
en
t in
eq
uit
y s
hare
s
- V
aru
n B
evera
ges
(Nep
al)
Pri
vate
L
imit
ed
--
-6
27.3
4-
--
--
--
--
--
62
7.3
4
Div
ide
nd
paid
- R
J C
orp
Lim
ited
20
9.3
313
9.5
6-
--
--
--
--
--
-2
09
.33
139
.56
- R
avi K
an
t Jaip
uri
a &
So
ns
(HU
F)
146
.95
97.9
7-
--
--
--
--
--
-14
6.9
59
7.9
7
- M
rs. a
ast
ha a
garw
al
--
--
--
--
0.2
5-
--
--
0.2
5-
- M
r. K
au
stu
bh
ag
arw
al
--
--
--
--
0.2
5-
--
--
0.2
5-
- M
r. K
an
ish
k J
ain
--
--
--
--
0.0
0*
--
--
-0
.00
*-
- M
rs. S
hash
i Jain
--
--
--
--
0.0
0*
--
--
-0
.00
*-
- M
s. S
rish
ti J
ain
--
--
--
--
0.0
0*
--
--
-0
.00
*-
- M
rs. D
hara
Jaip
uri
a-
--
--
--
-0
.01
0.0
1-
--
-0
.01
0.0
1
- M
rs. D
evyan
i Jaip
uri
a-
--
--
--
-20
.26
0.0
0*
--
--
20
.26
0.0
0*
Se
rvic
e r
en
de
red
: Te
ch
nic
al
kn
ow
-h
ow
fe
es
- V
aru
n B
evera
ges
(Nep
al)
Pri
vate
L
imit
ed
--
20
7.3
2213
.64
--
--
--
--
--
20
7.3
22
13.6
4
(Exp
en
ses
incu
rre
d b
y t
he
C
om
pan
y o
n b
eh
alf
of
oth
ers
)/exp
en
ses
incu
rre
d b
y o
the
rs o
n
be
half
of
the
Co
mp
an
y
- D
evyan
i In
tern
ati
on
al L
imit
ed
--
--
6.1
14
.76
--
--
--
--
6.1
14
.76
- D
iag
no
Lab
s P
rivate
Lim
ited
--
--
0.1
0-
--
--
--
--
0.1
0-
- L
un
arm
ech
Tech
no
log
ies
Pri
vate
L
imit
ed
--
--
--
0.0
0*
(0.0
1)-
--
--
-0
.00
*(0
.01)
- V
aru
n B
evera
ges
(Zim
bab
we)
(Pri
vate
) L
imit
ed
--
(2.0
6)
(4.3
9)
--
--
--
--
--
(2.0
6)
(4.3
9)
- a
lish
a R
eta
il P
rivate
Lim
ited
--
--
0.0
10
.28
--
--
--
--
0.0
10
.28
- R
J C
orp
Lim
ited
-(0
.11)
--
--
--
--
--
--
-(0
.11)
- D
evyan
i F
oo
d In
du
stri
es
Lim
ited
--
--
(1.2
5)
(1.4
8)
--
--
--
--
(1.2
5)
(1.4
8)
- N
ecta
r B
evera
ges
Pri
vate
L
imit
ed
--
--
--
--
--
(1.1
7)
(0.0
1)-
-(1
.17
)(0
.01)
Varun Beverages Limited274

Su
mm
ary
of s
ign
ific
an
t acco
un
tin
g p
oli
cie
s an
d o
the
r exp
lan
ato
ry in
form
ati
on
on
th
e S
tan
dalo
ne
F
inan
cia
l S
tate
me
nts
fo
r th
e y
ear
en
de
d 3
1 D
ece
mb
er
20
19(a
ll am
ou
nts
in
` in
mill
ion
, u
nle
ss o
therw
ise s
tate
d)
De
scri
pti
on
Pare
nt
an
d
ult
imate
pare
nt
Su
bsi
dia
rie
s/ s
tep
d
ow
n s
ub
sid
iary
Fe
llo
w
sub
sid
iari
es
an
d e
nti
tie
s co
ntr
oll
ed
by
p
are
nt
Ass
ocia
te (
or
an
ass
ocia
te o
f an
y
me
mb
er
of
the
C
om
pan
y)
Re
lati
ve
s o
f K
MP
sE
nti
tie
s in
wh
ich
a d
ire
cto
r o
r h
is/h
er
rela
tive
is
a m
em
be
r/d
ire
cto
r/tr
ust
ee
En
titi
es
wh
ich
are
po
st
em
plo
ym
en
t b
en
efi
ts p
lan
s
Tota
l
Fo
r ye
ar
en
de
d
Fo
r ye
ar
en
de
d
Fo
r ye
ar
en
de
d
Fo
r ye
ar
en
de
d
Fo
r ye
ar
en
de
d
Fo
r ye
ar
en
de
d
Fo
r ye
ar
en
de
d
Fo
r ye
ar
en
de
d
20
192
018
20
192
018
20
192
018
20
192
018
20
192
018
20
192
018
20
192
018
20
192
018
Am
ou
nt
paid
by C
om
pan
y o
n
be
half
of
oth
ers
/(am
ou
nt
paid
by
oth
ers
on
be
half
of
the
Co
mp
an
y)
- D
evyan
i F
oo
d In
du
stri
es
Lim
ited
--
--
1.5
6-
--
--
--
--
1.5
6-
- N
ecta
r B
evera
ges
Pri
vate
L
imit
ed
--
--
--
--
--
11.1
0-
--
11.1
0-
- S
MV
Bevera
ges
Pri
vate
Lim
ited
--
--
--
--
--
(20
.00
)-
--
(20
.00
)-
Re
nt/
le
ase
ch
arg
es
paid
/(r
ece
ive
d)
- R
J C
orp
Lim
ited
109
.80
99
.82
--
--
--
--
--
--
109
.80
99
.82
- R
avi K
an
t Jaip
uri
a &
So
ns
(HU
F)
7.2
16
.86
--
--
--
--
--
--
7.2
16
.86
- S
VS
In
dia
Pri
vate
Lim
ited
--
--
1.0
50
.48
--
--
--
--
1.0
50
.48
- N
ecta
r B
evera
ges
Pri
vate
Lim
ited
--
--
--
--
--
33
.69
--
-3
3.6
9-
- S
MV
Bevera
ges
Pri
vate
Lim
ited
--
--
--
--
--
17.1
0-
--
17.1
0-
- M
rs. D
hara
Jaip
uri
a-
--
--
--
-2.5
82.3
4-
--
-2
.58
2.3
4
- a
lish
a T
orr
en
t C
losu
res
(In
dia
) P
rivate
Lim
ited
--
--
--
--
--
(0.3
2)
(0.4
8)
--
(0.3
2)
(0.4
8)
Fin
an
cia
l g
uara
nte
es
giv
en
- V
aru
n B
evera
ges
(Zim
bab
we)
(Pri
vate
) L
imit
ed
--
213
.82
99
8.0
3-
--
--
--
--
-2
13.8
29
98
.03
- V
aru
n B
evera
ges
(Nep
al)
Pri
vate
L
imit
ed
--
28
0.9
94
68
.31
--
--
--
--
--
28
0.9
94
68
.31
Fin
an
cia
l g
uara
nte
es
clo
sed
- V
aru
n B
evera
ges
(Nep
al)
Pri
vate
L
imit
ed
--
46
8.3
1-
--
--
--
--
--
46
8.3
1-
Pu
rch
ase
of
fixe
d a
sse
ts
- N
ecta
r B
evera
ges
Pri
vate
L
imit
ed
--
--
--
--
--
1,0
75
.94
--
-1,
075
.94
-
- S
MV
Bevera
ges
Pri
vate
Lim
ited
--
--
--
--
--
34
0.2
65
87.5
0-
-3
40
.26
58
7.5
0
- S
teel C
ity B
evera
ges
Pri
vate
L
imit
ed
--
--
--
--
--
-10
1.4
9-
--
101.
49
Sale
of
fixe
d a
sse
ts
- V
aru
n B
evera
ges
(Nep
al)
Pri
vate
L
imit
ed
--
15.6
613
4.2
4-
--
--
--
--
-15
.66
134
.24
- V
aru
n B
evera
ges
(Zim
bab
we)
(Pri
vate
) L
imit
ed
--
9.4
54
42.7
2-
--
--
--
--
-9
.45
44
2.7
2
STATUTORY REPORTSCORPORATE OVERVIEW FINANCIAL STATEMENTS
Annual Report 2019 275

(all
am
ou
nts
in
` in
mill
ion
, u
nle
ss o
therw
ise s
tate
d)
De
scri
pti
on
Pare
nt
an
d
ult
imate
pare
nt
Su
bsi
dia
rie
s/ s
tep
d
ow
n s
ub
sid
iary
Fe
llo
w
sub
sid
iari
es
an
d e
nti
tie
s co
ntr
oll
ed
by
p
are
nt
Ass
ocia
te (
or
an
ass
ocia
te o
f an
y
me
mb
er
of
the
C
om
pan
y)
Re
lati
ve
s o
f K
MP
sE
nti
tie
s in
wh
ich
a d
ire
cto
r o
r h
is/h
er
rela
tive
is
a m
em
be
r/d
ire
cto
r/tr
ust
ee
En
titi
es
wh
ich
are
po
st
em
plo
ym
en
t b
en
efi
ts p
lan
s
Tota
l
Fo
r ye
ar
en
de
d
Fo
r ye
ar
en
de
d
Fo
r ye
ar
en
de
d
Fo
r ye
ar
en
de
d
Fo
r ye
ar
en
de
d
Fo
r ye
ar
en
de
d
Fo
r ye
ar
en
de
d
Fo
r ye
ar
en
de
d
20
192
018
20
192
018
20
192
018
20
192
018
20
192
018
20
192
018
20
192
018
20
192
018
Mark
eti
ng
su
pp
ort
fe
e
- N
ecta
r B
evera
ges
Pri
vate
L
imit
ed
--
--
--
--
--
98
.90
--
-9
8.9
0-
- S
MV
Bevera
ges
Pri
vate
Lim
ited
--
--
--
--
--
43
.38
--
-4
3.3
8-
Co
ntr
ibu
tio
n t
o g
ratu
ity t
rust
- V
BL
Em
plo
yees
Gra
tuit
y T
rust
--
--
--
--
--
--
2.0
63
1.8
42
.06
31.
84
Pu
rch
ase
un
de
r b
usi
ne
ss
co
mb
inati
on
- S
MV
ag
en
cie
s P
rivate
Lim
ited
--
--
--
--
--
-5
52.1
3-
--
55
2.1
3
IT i
nfr
ast
ructu
re s
up
po
rt f
ee
re
ce
ive
d
- V
aru
n B
evera
ges
(Nep
al)
Pri
vate
L
imit
ed
--
2.9
91.
88
--
--
--
--
--
2.9
91.
88
- V
aru
n B
evera
ges
Lan
ka (
Pri
vate
) L
imit
ed
--
2.8
22.5
7-
--
--
--
--
-2
.82
2.5
7
- V
aru
n B
evera
ges
(Zim
bab
we)
(Pri
vate
) L
imit
ed
--
2.6
37.8
1-
--
--
--
--
-2
.63
7.8
1
- D
evyan
i In
tern
ati
on
al L
imit
ed
--
--
2.8
3-
--
--
--
--
2.8
3-
- V
aru
n F
oo
d a
nd
Bevera
ges
Zam
bia
Lim
ited
--
--
0.6
3-
--
--
--
--
0.6
3-
- V
aru
n B
evera
ges
(Zam
bia
) L
imit
ed
--
3.9
89
.56
--
--
--
--
--
3.9
89
.56
- V
aru
n B
evera
ges
Mo
rocco
Sa
--
4.5
04
.07
--
--
--
--
--
4.5
04
.07
- D
evyan
i F
oo
d In
du
stri
es
Lim
ited
--
--
7.4
15
.94
--
--
--
--
7.4
15
.94
Ad
van
ce
paid
fo
r acq
uis
itio
n
of
ass
ets
- S
MV
Bevera
ges
Pri
vate
Lim
ited
--
--
--
--
--
4.0
0-
--
4.0
0-
Cap
ital
co
mm
itm
en
ts
- S
MV
Bevera
ges
Pri
vate
Lim
ited
--
--
--
--
--
28
2.0
0-
--
28
2.0
0-
Su
mm
ary
of s
ign
ific
an
t acco
un
tin
g p
oli
cie
s an
d o
the
r exp
lan
ato
ry in
form
ati
on
on
th
e S
tan
dalo
ne
F
inan
cia
l S
tate
me
nts
fo
r th
e y
ear
en
de
d 3
1 D
ece
mb
er
20
19
Varun Beverages Limited276

Su
mm
ary
of s
ign
ific
an
t acco
un
tin
g p
oli
cie
s an
d o
the
r exp
lan
ato
ry in
form
ati
on
on
th
e S
tan
dalo
ne
F
inan
cia
l S
tate
me
nts
fo
r th
e y
ear
en
de
d 3
1 D
ece
mb
er
20
19(a
ll am
ou
nts
in
` in
mill
ion
, u
nle
ss o
therw
ise s
tate
d)
De
scri
pti
on
Pare
nt
an
d
ult
imate
pare
nt
Su
bsi
dia
rie
s/ s
tep
d
ow
n s
ub
sid
iary
Fe
llo
w
sub
sid
iari
es
an
d e
nti
tie
s co
ntr
oll
ed
by
p
are
nt
Ass
ocia
te (
or
an
ass
ocia
te o
f an
y
me
mb
er
of
the
C
om
pan
y)
Re
lati
ve
s o
f K
MP
sE
nti
tie
s in
wh
ich
a d
ire
cto
r o
r h
is/h
er
rela
tive
is
a m
em
be
r/d
ire
cto
r/tr
ust
ee
En
titi
es
wh
ich
are
po
st
em
plo
ym
en
t b
en
efi
ts p
lan
s
Tota
l
Fo
r ye
ar
en
de
d
Fo
r ye
ar
en
de
d
Fo
r ye
ar
en
de
d
Fo
r ye
ar
en
de
d
Fo
r ye
ar
en
de
d
Fo
r ye
ar
en
de
d
Fo
r ye
ar
en
de
d
Fo
r ye
ar
en
de
d
20
192
018
20
192
018
20
192
018
20
192
018
20
192
018
20
192
018
20
192
018
20
192
018
Bo
nu
s sh
are
iss
ue
d (
Face
valu
e o
f `
10 e
ach
)
- R
J C
orp
Lim
ited
279
.11
--
--
--
--
--
--
-2
79
.11
-
- R
avi K
an
t Jaip
uri
a &
So
ns
(HU
F)
195
.94
--
--
--
--
--
--
-19
5.9
4-
- M
r. K
an
ish
k J
ain
--
--
--
--
0.0
1-
--
--
0.0
1-
- M
rs. S
hash
i Jain
--
--
--
--
0.0
0*
--
--
-0
.00
*-
- M
s. S
rish
ti J
ain
--
--
--
--
0.0
0*
--
--
-0
.00
*-
- M
rs. D
hara
Jaip
uri
a-
--
--
--
-0
.01
--
--
-0
.01
-
- M
rs. D
evyan
i Jaip
uri
a-
--
--
--
-27.0
1-
--
--
27.
01
-
Bala
nce
s o
uts
tan
din
g a
t th
e e
nd
o
f th
e y
ear,
ne
t in
clu
din
g l
oan
o
uts
tan
din
g
A. R
ece
ivab
le/(
payab
le),
ne
t
- V
aru
n B
evera
ges
Mo
rocco
Sa
--
1,9
35
.94
2,7
61.
55
--
--
--
--
--
1,9
35
.94
2,7
61.
55
- V
aru
n B
evera
ges
(Nep
al)
P
rivate
Lim
ited
--
676
.29
58
6.0
9-
--
--
--
--
-6
76
.29
58
6.0
9
- O
le S
pri
ng
Bo
ttle
rs (
Pri
vate
) L
imit
ed
--
0.0
0*
7.9
8-
--
--
--
--
-0
.00
*7.
98
- V
aru
n B
evera
ges
Lan
ka
(Pri
vate
) L
imit
ed
--
2,6
27.3
72,6
01.
26
--
--
--
--
--
2,6
27.
37
2,6
01.
26
- V
aru
n B
evera
ges
(Zam
bia
) L
imit
ed
--
1,13
7.8
91,
173
.37
--
--
--
--
--
1,13
7.8
91,
173
.37
- V
aru
n B
evera
ges
(Zim
bab
we)
(Pri
vate
) L
imit
ed
--
771.
93
1,0
84
.73
--
--
--
--
--
77
1.9
31,
08
4.7
3
- D
evyan
i In
tern
ati
on
al L
imit
ed
--
--
1.4
2(1
.92)
--
--
--
--
1.4
2(1
.92
)
- R
J C
orp
Lim
ited
34
.82
32.2
7-
--
--
--
--
--
-3
4.8
23
2.2
7
- M
rs. D
hara
Jaip
uri
a-
--
--
--
-1.
21
1.12
--
--
1.2
11.
12
STATUTORY REPORTSCORPORATE OVERVIEW FINANCIAL STATEMENTS
Annual Report 2019 277
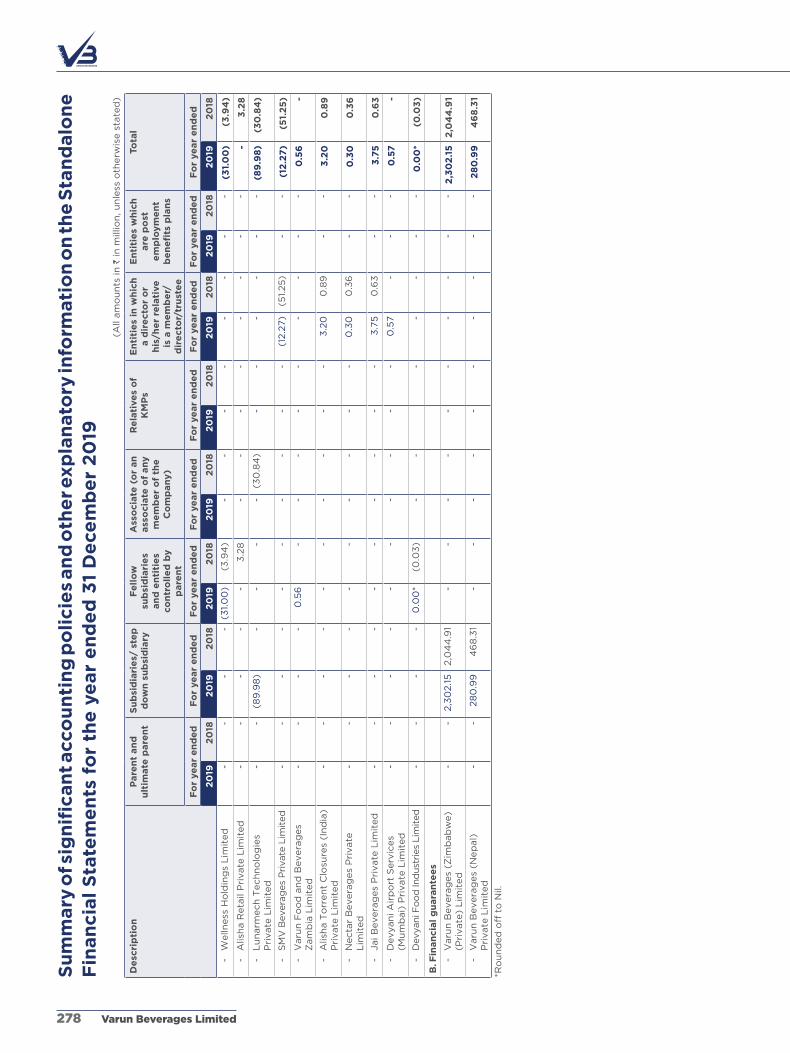
(all
am
ou
nts
in
` in
mill
ion
, u
nle
ss o
therw
ise s
tate
d)
De
scri
pti
on
Pare
nt
an
d
ult
imate
pare
nt
Su
bsi
dia
rie
s/ s
tep
d
ow
n s
ub
sid
iary
Fe
llo
w
sub
sid
iari
es
an
d e
nti
tie
s co
ntr
oll
ed
by
p
are
nt
Ass
ocia
te (
or
an
ass
ocia
te o
f an
y
me
mb
er
of
the
C
om
pan
y)
Re
lati
ve
s o
f K
MP
sE
nti
tie
s in
wh
ich
a d
ire
cto
r o
r h
is/h
er
rela
tive
is
a m
em
be
r/d
ire
cto
r/tr
ust
ee
En
titi
es
wh
ich
are
po
st
em
plo
ym
en
t b
en
efi
ts p
lan
s
Tota
l
Fo
r ye
ar
en
de
d
Fo
r ye
ar
en
de
d
Fo
r ye
ar
en
de
d
Fo
r ye
ar
en
de
d
Fo
r ye
ar
en
de
d
Fo
r ye
ar
en
de
d
Fo
r ye
ar
en
de
d
Fo
r ye
ar
en
de
d
20
192
018
20
192
018
20
192
018
20
192
018
20
192
018
20
192
018
20
192
018
20
192
018
- W
elln
ess
Ho
ldin
gs
Lim
ited
--
--
(31.
00
)(3
.94
)-
--
--
--
-(3
1.0
0)
(3.9
4)
- a
lish
a R
eta
il P
rivate
Lim
ited
--
--
-3
.28
--
--
--
--
-3
.28
- L
un
arm
ech
Tech
no
log
ies
Pri
vate
Lim
ited
--
(89
.98
)-
--
-(3
0.8
4)
--
--
--
(89
.98
)(3
0.8
4)
- S
MV
Bevera
ges
Pri
vate
Lim
ited
--
--
--
--
--
(12.2
7)
(51.
25
)-
-(1
2.2
7)
(51.
25
)
- V
aru
n F
oo
d a
nd
Bevera
ges
Zam
bia
Lim
ited
--
--
0.5
6-
--
--
--
--
0.5
6-
- a
lish
a T
orr
en
t C
losu
res
(In
dia
) P
rivate
Lim
ited
--
--
--
--
--
3.2
00
.89
--
3.2
00
.89
- N
ecta
r B
evera
ges
Pri
vate
L
imit
ed
--
--
--
--
--
0.3
00
.36
--
0.3
00
.36
- Jai B
evera
ges
Pri
vate
Lim
ited
--
--
--
--
--
3.7
50
.63
--
3.7
50
.63
- D
evyan
i a
irp
ort
Serv
ices
(Mu
mb
ai)
Pri
vate
Lim
ited
--
--
--
--
--
0.5
7-
--
0.5
7-
- D
evyani F
oo
d In
dust
ries
Lim
ited
--
--
0.0
0*
(0.0
3)
--
--
--
-0
.00
*(0
.03
)
B. F
inan
cia
l g
uara
nte
es
- V
aru
n B
evera
ges
(Zim
bab
we)
(Pri
vate
) L
imit
ed
--
2,3
02.1
52,0
44
.91
--
--
--
--
--
2,3
02
.15
2,0
44
.91
- V
aru
n B
evera
ges
(Nep
al)
P
rivate
Lim
ited
--
28
0.9
94
68
.31
--
--
--
--
--
28
0.9
94
68
.31
*Ro
un
ded
off
to
Nil.
Su
mm
ary
of s
ign
ific
an
t acco
un
tin
g p
oli
cie
s an
d o
the
r exp
lan
ato
ry in
form
ati
on
on
th
e S
tan
dalo
ne
F
inan
cia
l S
tate
me
nts
fo
r th
e y
ear
en
de
d 3
1 D
ece
mb
er
20
19
Varun Beverages Limited278

Summary of significant accounting policies and other explanatory information on the Standalone Financial Statements for the year ended 31 December 2019
45. The Company has taken various premises and other fixed assets on operating leases. The lease agreements
generally have a lock-in-period of 1-9 years and are cancellable at the option of the lessee thereafter. Majority of
the leases have escalation terms after certain years and are extendable by mutual consent on expiry of the lease.
There are no sub-leases or contingent rents. During the year, lease payments under operating leases amounting
to ` 602.28 (31 December 2018 ` 308.21) have been recognized as an expense in the Statement of Profit and Loss.
Non-cancellable operating lease rentals payable (minimum lease payments) for these leases are as follows:
(` in million)
As at 31 December 2019
As at 31 December 2018
Payable within one year 46.35 10.81
Payablebetweenoneandfiveyears 61.68 27.49
Payableafterfiveyears - -
Total 108.03 38.30
46. The business activities of the Company predominantly fall within a single reportable business segment, i.e.,
manufacturing and sale of beverages within India. There are no separately reportable business or geographical
segments that meet the criteria prescribed in Ind aS 108 on Operating Segments. The aforesaid is in line with
review of operating results by the chief operating decision maker. The sale of products of the Company is seasonal.
47. Dues to Micro and Small Enterprises
The dues to Micro and Small Enterprises as required under the Micro, Small and Medium Enterprises Development
act, 2006 to the extent information available with the Company is given below:
(` in million)
Particulars 31 December 2019 31 December 2018
The principal amount and the interest due thereon remaining unpaid to any supplier as at the end of each accounting year
Principal amount due to micro and small enterprises 17.79 2.47
Interest due on above 0.04 0.01
The amount of interest paid by the buyer in terms of section 16 of the MSMED act 2006 along with the amounts of the payment made to the supplier beyond the appointed day during each accounting year*
128.57 9.23
The amount of interest due and payable for the period of delay in making payment (which have been paid but beyond the appointed dayduringtheyear)butwithoutaddingtheinterestspecifiedunderthe MSMED act 2006.
- -
The amount of interest accrued and remaining unpaid at the end of each accounting year
1.60 0.91
The amount of further interest remaining due and payable even in the succeeding years, until such date when the interest dues as above are actually paid to the small enterprise for the purpose of disallowance as a deductible expenditure under section 23 of the MSMED act 2006
1.60 0.91
*includes principal amounting to ` 128.57 (31 December 2018: ` 9.23).
STATUTORY REPORTSCORPORATE OVERVIEW FINANCIAL STATEMENTS
Annual Report 2019 279

Summary of significant accounting policies and other explanatory information on the Standalone Financial Statements for the year ended 31 December 2019
48. Details of Corporate Social Responsibility (CSR) expenditure
In accordance with the provisions of section 135 of the Companies act, 2013, the Board of Directors of the
Company had constituted CSR Committee. The details for CSR activities is as follows.
(` in million)
For the year ended 31 December 2019
For the year ended 31 December 2018
(a) Gross amount required to be spent by the Company during the year
57.22 41.42
(b) amount spent during the year on the following
(i) Construction / acquisition of any asset - -
(ii) On purpose other than 1 above 57.50 41.42 1. Refer note 44B for amounts paid to Champa Devi Jaipuria Charitable Trust towards contribution for ‘’Shiksha Kendra’’ for
the education of underpriviledged and to Mala Jaipuria Foundation for the vocational training to underpriviledged and destitute to enhance their skills and talents to secure livelihood.
2. The Company does not carry any provisions for Corporate social responsibility expenses for current year and previous year.
49. Acquisitions and disposals
Acquisitions during the year ended 31 December 2019:
A. Acquisitions under business combination
The Company acquired franchise rights in South and West regions from PepsiCo India Holdings Private
Limited (“PepsiCo”) for a national bottling, sales and distribution footprint in 7 states and 5 Union Territories
of India along with manufacturing units in Bharuch (Gujarat), Mahul (Maharashtra), Paithan (Maharashtra),
Roha (Maharashtra), Mamandur (Tamil Nadu), Nelamangala (Karnataka), Palakkad (Kerala), Sangareddy
(Telangana) and Sricity (andhra Pradesh) for a total transaction value of ` 18,025onslumpsalebasis.The
aforesaid transaction value excludes the consideration paid for working capital taken over amounting to
` 321.64andinvestmentfundamountingto` 2,095.09receivedonacquisitionfromPepsiCo.
The details of the business combination are as follows:
Name of seller PepsiCo India Holdings Private Limited
acquisition date 01 May 2019
Recognised amounts of identifiable net assets
(` in million)Particulars Amount Property, plant and equipment 15,908.42 Other intangible assets (Franchise rights) 235.10 Deferred tax assets 130.81
Total non-current assets (a) 16,274.33 Non-current liabilities recognisedEmployeebenefitspayable(includedundertheheadprovisions) (341.53)
Total non-current liabilities (b) (341.53)Net current assets acquiredOthercurrentfinancialliabilities- Security deposits from distributors (252.05)- Employee related payables (32.82)Other current liabilities (399.59)Other current assets:- Inventories 1,076.68 - Security deposits 213.93 - Others 57.03
Net current assets (c) 663.18 Identifiable net assets (d = a+b+c) 16,595.98
amount paid (e) 16,251.55 Goodwill/(Gain from a bargain purchase) (e-d) (344.43)
Varun Beverages Limited280

Summary of significant accounting policies and other explanatory information on the Standalone Financial Statements for the year ended 31 December 2019
Gain from a bargain purchase
The above business combination has resulted in a bargain purchase due to the Company’s manufacturing
capabilities/distribution network and PepsiCo’s focus on its core activities of research, brand building and
market penetration.
B. Asset acquisitions
(i) On 14 February 2019, the Company has acquired PepsiCo’s previously franchised rights for a total
purchase consideration of ` 150.00 from SMV Beverages Private Limited and Nectar Beverages Private
Limited (together referred as ‘SMV Group’ to sell and distribute PepsiCo’s beverage brands in 13 districts
in State of Karnataka, 14 districts in State of Maharashtra and 3 districts in State of Madhya Pradesh.
(ii) On 03 October 2019, the Company has acquired a manufacturing unit at Dharwad, Karnataka along with
certain assets for a total purchase consideration of ` 747.27 from Nectar Beverages Private Limited.
(iii) On 30 October 2019, the Company has acquired a manufacturing unit at Tirunelveli, Tamil Nadu along
with certain assets for a total purchase consideration of ` 200.00 from Prathishta Business Solutions
Private Limited.
Acquisitions and disposals during the year ended 31 December 2018:
C. Acquisitions under business combination
The Company acquired PepsiCo’s previously franchised territory in the of State of Jharkhand in India along
with manufacturing unit at Jamshedpur for a total purchase consideration of ` 552.13 on a slump sale basis,
excluding net payable of ̀ 60.33 on account of net working capital adjustment taken over as part of business.
The details of the business combination are as follows:
(` in million)
Particulars Jharkhand
Name of acquiree SMV agencies Private Limited
acquisition date 23 March 2018
Non-current assets recognized
Property, plant and equipment 211.79
Other intangible assets (Franchise rights) 424.73
Deferred tax assets 11.20
Total non-current assets (a) 647.72
Non-current liabilities recognized
Employeebenefitspayable (32.87)
Security deposits from distributors (62.72)
Total non-current liabilities (b) (95.59)
Net current liabilities acquired
Other current liabilities (78.88)
Other current assets 18.55
Net current liabilities (c) (60.33)
Identifiable net assets (d = a+b+c) 491.80
STATUTORY REPORTSCORPORATE OVERVIEW FINANCIAL STATEMENTS
Annual Report 2019 281

Summary of significant accounting policies and other explanatory information on the Standalone Financial Statements for the year ended 31 December 2019
D. Asset acquisitions
(i) On 11 January 2018, the Company has acquired PepsiCo’s previously franchised territory in the State of
Chhattisgarh along with certain property, plant and equipment and other intangible assets for a total
purchase consideration of ` 150.00 from SMV Beverages Private Limited.
(ii) On 17 January 2018, PepsiCo has transferred franchise territory in the State of Bihar to the Company.
Subsequently on 12 December 2018, the Company has paid an amount of ̀ 450.00 to Lumbini Beverages
Private Limited for acquiring certain property, plant and equipment and other intangible assets for the
State of Bihar.
(iii) On 18 January 2018, the Company has acquired a manufacturing unit at Cuttack, Odisha along with
certain assets for a total purchase consideration of ` 437.50 from SMV Beverages Private Limited.
(iv) On 05 april 2018, the Company has acquired a manufacturing unit at Jamshedpur, Jharkhand along with
certain assets for a total purchase consideration of ` 101.49 from Steel City Beverages Private Limited.
E. Disposal of 41% stake in Varun Beverages Mozambique Limitada
During the year ended 31 December 2018, the Company sold its 10% stake in Varun Beverages Mozambique
Limitada to other shareholder for a consideration of ` 0.03.
50. Share-based payments
Description of share based payments arrangements
During the year ended 31 December 2013, the Company granted stock options to certain employees of the
Company and its subsidiaries. The Company has the following share-based payment arrangements for employees.
A. Employee Stock Option Plan 2013 (ESOP 2013)
The ESOP 2013 (“the Plan”) was approved by the Board of Directors and the shareholders on 13 May 2013 and
further amended by Board of Directors on 01 December 2015. The plan entitles key managerial personnel
and employees of the Company and its subsidiaries to purchase shares in the Company at the stipulated
exercise price, subject to compliance with vesting conditions. Stock options can be settled by issue of equity
shares. as per the Plan, holders of vested options are entitled to purchase one equity share for every option
at an exercise price of ` 149.51, which is 1.14 % above the stock price at the date of grant, i.e., 13 May 2013.
The expense recognized for employee services received during the respective years is ` Nil.
Movements during the year
The following table illustrates the number and weighted average exercise prices (WaEP) of, and changes in,
share options during the year:
Particulars 31 December 2019 31 December 2018
Number WAEP Number WAEP
Outstanding at the beginning of the year 23,285 149.51 78,285 149.51
Options exercised during the year (13,285) 149.51 (55,000) 149.51
Options lapsed during the year (10,000) 149.51 - -
Outstanding at the end of the year - 23,285
Exercisable at the end of the year - 23,285
The fair values of options granted under new plan were determined using a variation of the binomial option
pricing model that takes into account factors specific to the share incentive plans, such as the vesting period.
The following principal assumptions were used in the valuation:
Varun Beverages Limited282
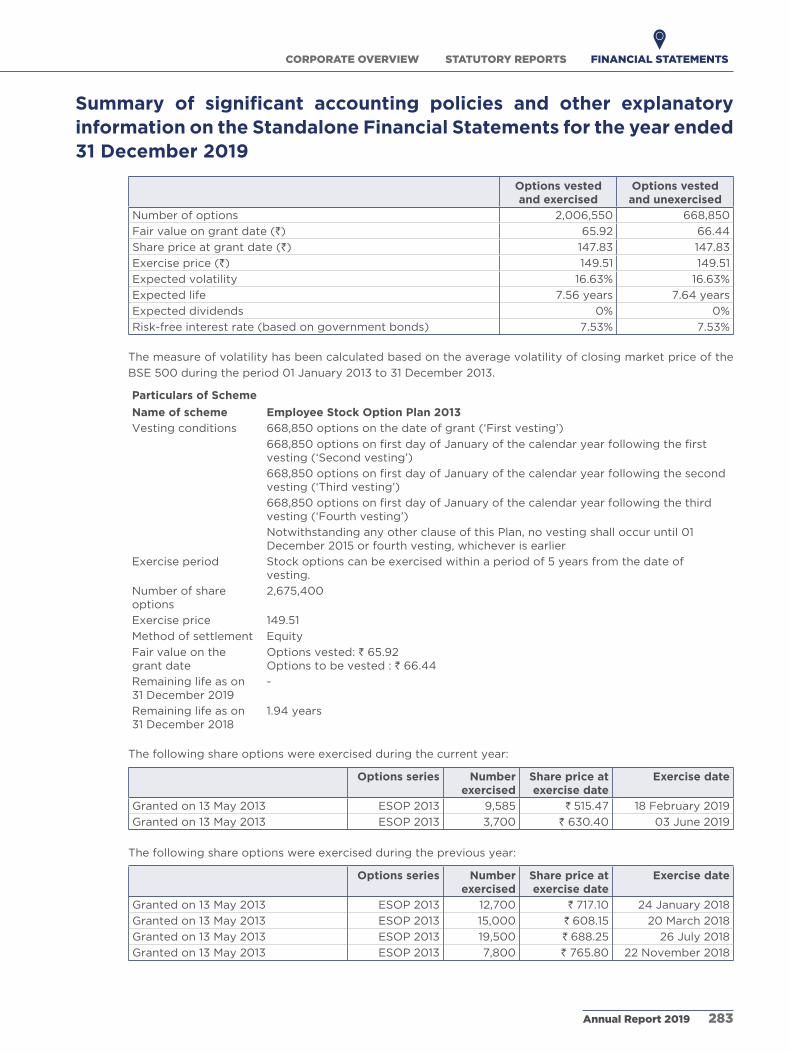
Summary of significant accounting policies and other explanatory information on the Standalone Financial Statements for the year ended 31 December 2019
Options vested and exercised
Options vested and unexercised
Number of options 2,006,550 668,850
Fair value on grant date (`) 65.92 66.44
Share price at grant date (`) 147.83 147.83
Exercise price (`) 149.51 149.51
Expected volatility 16.63% 16.63%
Expected life 7.56 years 7.64 years
Expected dividends 0% 0%
Risk-free interest rate (based on government bonds) 7.53% 7.53%
The measure of volatility has been calculated based on the average volatility of closing market price of the
BSE 500 during the period 01 January 2013 to 31 December 2013.
Particulars of Scheme
Name of scheme Employee Stock Option Plan 2013
Vesting conditions 668,850 options on the date of grant (‘First vesting’)
668,850optionsonfirstdayofJanuaryofthecalendaryearfollowingthefirstvesting (‘Second vesting’)
668,850optionsonfirstdayofJanuaryofthecalendaryearfollowingthesecondvesting (‘Third vesting’)
668,850optionsonfirstdayofJanuaryofthecalendaryearfollowingthethirdvesting (‘Fourth vesting’)
Notwithstanding any other clause of this Plan, no vesting shall occur until 01 December 2015 or fourth vesting, whichever is earlier
Exercise period Stock options can be exercised within a period of 5 years from the date of vesting.
Number of share options
2,675,400
Exercise price 149.51
Method of settlement Equity
Fair value on the grant date
Options vested: ` 65.92 Options to be vested : ` 66.44
Remaining life as on 31 December 2019
-
Remaining life as on 31 December 2018
1.94 years
The following share options were exercised during the current year:
Options series Number exercised
Share price at exercise date
Exercise date
Granted on 13 May 2013 ESOP 2013 9,585 ` 515.47 18 February 2019
Granted on 13 May 2013 ESOP 2013 3,700 ` 630.40 03 June 2019
The following share options were exercised during the previous year:
Options series Number exercised
Share price at exercise date
Exercise date
Granted on 13 May 2013 ESOP 2013 12,700 ` 717.10 24 January 2018
Granted on 13 May 2013 ESOP 2013 15,000 ` 608.15 20 March 2018
Granted on 13 May 2013 ESOP 2013 19,500 ` 688.25 26 July 2018
Granted on 13 May 2013 ESOP 2013 7,800 ` 765.80 22 November 2018
STATUTORY REPORTSCORPORATE OVERVIEW FINANCIAL STATEMENTS
Annual Report 2019 283
Summary of significant accounting policies and other explanatory information on the Standalone Financial Statements for the year ended 31 December 2019
B. Employee Stock Option Plan 2016 (“ESOS 2016”)
The ESOS 2016 (“the Scheme”) was approved by the Board of Directors and the shareholders on 27 april
2016. The Scheme entitles key managerial personnel and employees of the Company and its subsidiaries
to purchase shares in the Company at the stipulated exercise price, subject to compliance with vesting
conditions. Stock options can be settled by issue of equity shares. No options under this Scheme have been
granted in the current or previous years.
51. Capital management
For the purpose of the Company’s capital management, capital includes issued equity share capital, securities
premium and all other equity reserves attributable to the equity shareholders of the Company.
The Company’s capital management objectives are:
- to ensure the Company’s ability to continue as a going concern
- to provide an adequate return to shareholders
by pricing products and services commensurately with the level of risk.
The Company manages its capital structure and makes adjustments in light of changes in economic conditions
and the requirements of the financial covenants. To maintain or adjust the capital structure, the Company may
adjust the dividend payment to shareholders, return capital to shareholders or issue new shares. The Company
monitors capital using a gearing ratio, which is net debt divided by total capital plus net debt. The Company
includes within net debt, non-current and current borrowings, deferred payment liabilities, less cash and cash
equivalents, excluding discontinued operations, if any.
The amounts managed as capital by the Company for the reporting periods are summarised as follows:
(` in million)
Particulars As at31 December 2019
As at31 December 2018
Non-current borrowings (Refer note 20a) 22,917.07 18,359.13
Current borrowings (Refer note 20B) 4,110.44 3,188.75
Current portion of deferred payment liabilities (Refer note 20D) - 429.58
Current maturities of long-term debts (Refer note 20C) 4,980.86 3,376.93
32,008.37 25,354.39
Less: Cash and cash equivalents (Refer note 13) (323.51) (17.75)
Net debt (A) 31,684.86 25,336.64
Equity share capital (Refer note 18) 2,886.89 1,826.42
Other equity (Refer note 19) 35,784.28 24,062.97
Total capital (B) 38,671.17 25,889.39
Capital and net debt (C=A+B) 70,356.03 51,226.03
Gearing ratio (A/C) 45.04% 49.46%
In order to achieve this overall objective, the Company’s capital management, amongst other things, aims to
ensure that it meets financial covenants attached to the interest-bearing loans and borrowings that define capital
structure requirements.
No changes were made in the objectives, policies or processes for managing capital during the years ended 31
December 2019 and 31 December 2018.
Breaches in meeting the financial covenants would permit the bank to immediately call loans and borrowings.
There have been no breaches in the financial covenants of any borrowing in the reporting periods.
Varun Beverages Limited284

Summary of significant accounting policies and other explanatory information on the Standalone Financial Statements for the year ended 31 December 2019
52. Assets pledged as security
The carrying amount of assets pledged as security are:
(` in million)
Particulars As at31 December 2019
As at31 December 2018
Inventories and trade receivable (Refer note 11 and 12) 8,035.14 5,527.99
Other bank deposits (Refer note 14) 0.65 0.65
Current loans (Refer note 15) 351.71 104.68
Othercurrentfinancialassets(Refernote16) 2,820.09 1,783.80
Other current assets (Refer note 17) 1,554.83 1,581.41
Other intangible assets (Refer note 5a and 5B) 5,617.87 5,235.20
Property, plant and equipment (Refer note 4) 48,399.67 27,983.04
Capital work-in-progress (Refer note 4) 585.75 3,392.26
53. Recent accounting pronouncements (Ind AS issued but not yet effective)
The Ministry of Corporate affairs (“MCa”) issued the Companies (Indian accounting Standards) amendments
Rules, 2019 and Companies (Indian accounting Standards) Second amendments Rules, 2019, notifying new
standards and amendments to certain issued standards. These pronouncements are applicable to the Company
from accounting periods beginning on or after 01 January 2020.
a) Ind AS 116, Leases:
Ind aS 116 supersedes Ind aS 17, Leases including appendencies thereto. Ind aS 116 sets out the principles for
the recognition, measurement, presentation and disclosure of leases and requires lessees to record all leases
on the balance sheet with exemptions available for low value and short term leases. at the commencement
of a lease, a lessee will recognise lease liability and an asset representing the right to use the underlying
asset during the lease term (i.e., the right-of-use asset). Lessees will subsequently reduce the lease liability
when paid and recognise depreciation on the right of-use asset. Lessees will be required to separately
recognise the interest expense on the lease liability and the depreciation expense on the right-of-use asset.
The standard has no impact on the actual cash flows of a Company. However, operating lease payments
currently expensed as operating cash outflows will instead be capitalised and presented as financing cash
outflows in the statement of cash flows.
The Company is evaluating the requirements of the standard and the effect on the standalone financial
statements.
b) Appendix C, Uncertainty over Income Tax Treatment to Ind AS 12, Income Taxes:
The appendix clarifies how to apply the recognition and measurement principles while recognizing current
tax, deferred tax, taxable profits (losses), tax bases, unused tax losses, unused tax credits and tax rates when
there is uncertainty over tax treatments under Ind aS 12. as per the appendix, the Company needs to assess
whether it is probable that a tax authority will accept an uncertain tax treatment used or a treatment which
is being proposed to be used in its income tax filings.
The Company is evaluating the requirements of the amendments and their impact on the standalone financial
statements.
c) Amendment to Ind AS 12, Income Taxes:
The amendment clarifies that an entity shall recognize income tax consequences of dividends in profit or
loss, other comprehensive income or equity according to where the entity originally recognized those past
transactions or events.
STATUTORY REPORTSCORPORATE OVERVIEW FINANCIAL STATEMENTS
Annual Report 2019 285

Summary of significant accounting policies and other explanatory information on the Standalone Financial Statements for the year ended 31 December 2019
The Company will apply this amendment for annual reporting periods beginning on or after 01 January, 2020.
The impact on the standalone financial statements is being evaluated.
d) Amendment to Ind AS 23, Borrowing Costs:
The amendment clarifies that an entity shall consider specific borrowings as general borrowing while
calculating capitalization rate, once substantial activities necessary to prepare a qualifying asset for which
specific borrowing was obtained is completed for its intended use or sale.
In view of the management, the impact of this amendment on the standalone financial statements, as assessed
by the Company, is expected to be insignificant.
54. Information under Section 186 (4) of the Companies Act, 2013 and Regulation 34 of the SEBI (Listing Obligations and Disclosure Requirements), 2015
(` in million)
(i) Name of the Loanee Rate of Interest
Secured/ Unsecured
Maximum balance
outstanding during the year 2019
As at31 December
2019
Maximum balance
outstanding during the year 2018
As at31 December
2018
Varun Beverages Morocco Sa
3.50% + Libor
Unsecured 2,805.70 1,676.77 2,950.67 2,621.10
Varun Beverages Lanka (Private) Limited*
Zero to 2% + Libor
Unsecured 2,608.65 2,548.24 2,663.13 2,598.89
Varun Beverages (Zambia) Limited
4% + Libor Unsecured 221.32 221.32 420.05 216.72
Varun Beverages (Zambia) Limited
2% + Libor Unsecured 808.96 808.96 824.14 792.14
Varun Beverages (Zimbabwe) (Private) Limited
4% + Libor Unsecured 648.60 648.60 663.92 635.11
The above loans are given for business purposes.
*Represents debt component of investments in redeemable preference shares.
(` in million)
(ii) Name of the Investee As at 31 December 2019
As at 31 December 2018
Varun Beverages Morocco Sa 4,922.56 3,740.10
Varun Beverages (Nepal) Private Limited 798.91 798.91
Varun Beverages Lanka (Private) Limited 522.97 522.97
Varun Beverages (Zambia) Limited 2,670.39 2,670.39
angelica Technologies Private Limited 12.56 12.56
Varun Beverages (Zimbabwe) (Private) Limited 0.06 0.06
Lunarmech Technologies Private Limited 150.38 -
The above loans are given for business purposes.
Varun Beverages Limited286

Summary of significant accounting policies and other explanatory information on the Standalone Financial Statements for the year ended 31 December 2019
(` in million)
(iii) Guarantees outstanding, given on behalf of As at 31 December 2019
As at 31 December 2018
Varun Beverages (Nepal) Private Limited 280.99 468.31
Varun Beverages (Zimbabwe) (Private) Limited 2,302.15 2,044.91
The above financial guarantees are given on behalf of subsidiaries for business purposes.
The above transactions are in the ordinary course of business.
55. Financial instruments risk
Financials risk management objectives and policies
The Company is exposed to various risks in relation to financial instruments. The main types of financial risks are
market risk, credit risk and liquidity risk.
The management of the Company monitors and manages the financial risks relating to the operations of the
Company on a continuous basis. The Company’s risk management is coordinated at its head office, in close
cooperation with the management, and focuses on actively securing the Company’s short to medium-term cash
flows and simultaneously minimising the exposure to volatile financial markets. Long-term financial investments
are managed to generate lasting returns.
The Company does not engage in the trading of financial assets for speculative purposes. The most significant
financial risks to which the Company is exposed are described below.
55.1 Market risk analysis
Market risk is the risk that the fair value of future cash flows of a financial instrument will fluctuate because
of changes in market prices. The Company is exposed to market risk through its use of financial instruments
and specifically to currency risk and interest rate risk, which result from its operating, investing and financing
activities. Contracts to hedge exposures in foreign currencies, interest rates etc. are entered into wherever
considered necessary by the management.
Foreign currency risk
Foreign currency risk is the risk that the fair value or future cash flows of an exposure will fluctuate because
of changes in foreign exchange rates. The functional currency of the Company is Indian Rupees (‘INR’ or ‘` ’).
Most of the Company’s transactions are carried out in Indian Rupees. Exposures to currency exchange rates
mainly arise from the Company’s overseas sales and purchases, lending to overseas subsidiary companies,
external commercial borrowings etc. which are primarily denominated in US Dollars (‘USD’), Lankan Rupee
(LKR), Pound Sterling (‘GBP’), Singapore Dollars (‘SGD’) and Euro.
The Company has limited exposure to foreign currency risk and thereby it mainly relies on natural hedge.
To further mitigate the Company’s exposure to foreign currency risk, non-INR cash flows are continuously
monitored and derivative contracts are entered into wherever considered necessary.
The carrying amounts of the Company’s foreign currency denominated monetary items are restated at the
end of each reporting period. Foreign currency denominated financial assets and liabilities which expose the
Company to currency risk are as follows:
STATUTORY REPORTSCORPORATE OVERVIEW FINANCIAL STATEMENTS
Annual Report 2019 287

Summary of significant accounting policies and other explanatory information on the Standalone Financial Statements for the year ended 31 December 2019
(in million)
USD LKR GBP SGD Euro
31 December 2019
Financial assets
(i) Loans (non-current and current)
(a) Loans to related parties 47.08 5,701.67 - - -
(ii) Trade receivables (current) 0.58 - - - -
(iii)Otherfinancialassets(current)
(a) Interest accrued on loan to related parties 5.30 - - - -
(b) Guarantee commission receivable 0.67 - - - -
(c) Other receivables 0.42 - - - -
(iv) Other assets (non-current and current) 1.81 - - - 2.24
Total financial assets 55.86 5,701.67 - - 2.24
Financial liabilities
(i) Borrowings (non-current)
(a) Foreign currency loans from banks - - - 33.13 -
(ii) Trade payables 5.91 - - - -
(iii)Othercurrentfinancialliabilities
(a) Interest accrued but not due on borrowings - - - 0.11 -
(b) Payable for capital expenditure 0.57 - - - 0.12
Total financial liabilities 6.48 - - 33.24 0.12
31 December 2018
Financial assets
(i) Loans (non-current and current)
(a) Loans to related parties 61.11 5,805.35 - - -
(ii) Trade receivables (current) 7.63 - - - -
(iii)Otherfinancialassets(current)
(a) Interest accrued on loan to related parties 2.57 - - - -
(b) Guarantee commission receivable 0.49 - - - -
(c) Other receivables 0.32 - - - -
(iv) Other assets (non-current and current) 0.98 - - - 0.36
Total financial assets 73.10 5,805.35 - - 0.36
Financial liabilities
(i) Borrowings (non-current)
(a) Foreign currency loans from banks - - - 33.13 -
(ii) Trade payables 8.98 - 0.01 - 0.06
(iii)Othercurrentfinancialliabilities
(a) Interest accrued but not due on borrowings - - - 0.15 -
(b) Payable for capital expenditure 0.17 - - - 1.07
(c) Deferred payment liabilities - - - - 5.35
Total financial liabilities 9.15 - 0.01 33.28 6.48
The following table illustrates the foreign currency sensitivity of profit and equity with regards to the
Company’s financial assets and financial liabilities considering ‘all other things being equal’ and ignoring the
impact of taxation. It assumes a +/- 1% change of the INR/USD, INR/LKR, INR/GBP, INR/SGD and INR/Euro
exchange rate for the year ended at 31 December 2019 (31 December 2018: 1%). These are the sensitivity rates
used when reporting foreign currency exposures internally to the key management personnel and represents
management’s assessment of the reasonably possible changes in the foreign exchange rates. The sensitivity
analysis includes only outstanding foreign currency denominated monetary items at end of each period
reported upon. a positive number indicates an increase in profit or equity and vice-versa.
Varun Beverages Limited288

Summary of significant accounting policies and other explanatory information on the Standalone Financial Statements for the year ended 31 December 2019
If the INR had strengthened against the USD by 1% (31 December 2018: 1%), LKR by 1% (31 December 2018:
1%), GBP by 1% (31 December 2018: 1%), SGD by 1% (31 December 2018: Nil) and Euro by 1% (31 December
2018: 1%), the following would have been the impact:
(` in million)
Profit for the year Equity
31 December 2019 31 December 2018 31 December 2019 31 December 2018
USD (35.19) (44.63) (35.19) (44.63)
LKR (22.18) (21.95) (22.18) (21.95)
GBP - 0.01 - 0.01
SGD 17.58 16.91 17.58 16.91
Euro (1.69) 4.88 (1.69) 4.88
If the INR had weakened against the USD by 1% (31 December 2018: 1%), LKR by 1% (31 December 2018: 1%),
GBP by 1% (31 December 2018: 1%), SGD by 1% (31 December 2018: Nil) and Euro by 1% (31 December 2018:
1%), the following would have been the impact:
(` in million)
Profit for the year Equity
31 December 2019 31 December 2018 31 December 2019 31 December 2018
USD 35.19 44.63 35.19 44.63
LKR 22.18 21.95 22.18 21.95
GBP - (0.01) - (0.01)
SGD (17.58) (16.91) (17.58) (16.91)
Euro 1.69 (4.88) 1.69 (4.88)
Exposures to foreign exchange rates vary during the year depending on the volume of the overseas
transactions. Nonetheless, the analysis above is considered to be representative of the Company’s exposure
to currency risk.
Interest rate risk
Interest rate risk is the risk that the fair value or future cash flows of a financial instrument will fluctuate
because of changes in market interest rates. The Company’s policy is to minimise interest rate cash flow risk
exposures on long-term financing. The Company is exposed to changes in market interest rates as some of
the bank and other borrowings are at variable interest rates and also loans have been advanced to subsidiary
companies at variable interest rates. all the Company’s term deposits are at fixed interest rates.
The following table illustrates the sensitivity of profit and equity to a reasonably possible change in interest
rates of +/- 1% (31 December 2018: +/- 1%). These changes are considered to be reasonably possible based
on management’s assessment. The calculations are based on a change in the average market interest rate for
each period, and the financial instruments held at each reporting date that are sensitive to changes in interest
rates. all other variables are held constant.
(` in million)
Profit for the year Equity
+1% -1% +1% -1%
31 December 2019 (218.97) 218.97 (218.97) 218.97
31 December 2018 (151.03) 151.03 (151.03) 151.03
STATUTORY REPORTSCORPORATE OVERVIEW FINANCIAL STATEMENTS
Annual Report 2019 289

Summary of significant accounting policies and other explanatory information on the Standalone Financial Statements for the year ended 31 December 2019
Commodity price risk
The Company is affected by the price volatility of certain commodities. Its operating activities require the
ongoing purchase of pet chips and sugar and therefore require a continuous supply. In view of volatility of
pet chips and sugar prices, the Company also executes into various advance purchase contracts.
Commodity price sensitivity
The following tables shows the effect of price change in sugar and pet chips
(` in million)
Particulars Change in yearly average price
Effect on profit before tax
Effect on equity
31 December 2019
Sugar +1% -1% (63.14) 63.14 (63.14) 63.14
Pet chips +1% -1% (39.43) 39.43 (39.43) 39.43
(` in million)
Particulars Change in yearly average price
Effect on profit before tax
Effect on equity
31 December 2018
Sugar +1% -1% (46.07) 46.07 (46.07) 46.07
Pet chips +1% -1% (31.49) 31.49 (31.49) 31.49
Other price sensitivity
The Company is not exposed to any listed equity or listed debt price risk as it does not hold any investments
in listed entities.
55.2 Credit risk analysis
Credit risk is the risk that a counterparty fails to discharge an obligation to the Company. The Company is
operating through a network of distributors and other distribution partners based at different locations. The
Company is exposed to this risk for various financial instruments, for example loans granted, receivables
from customers, deposits placed etc. The Company’s maximum exposure to credit risk is limited to the
carrying amount of financial assets recognized at end of each reporting period, as summarised below:
(` in million)
As at 31 December 2019
As at 31 December 2018
Classesoffinancialassets-carryingamounts:
Investments (current) 0.01 0.01
Loans (current and non-current) 6,394.48 7,063.74
Trade receivables 1,305.31 1,344.74
Cash and cash equivalents 323.51 17.75
Bank balances other than mention above 0.65 0.65
Otherfinancialassets(currentandnon-current) 2,828.99 1,792.14
10,852.95 10,219.03
The Company continuously monitors receivables and defaults of customers and other counterparties, and
incorporates this information into its credit risk controls. appropriate security deposits are kept against the
supplies to customers and balances are reconciled at regular intervals. The Company’s policy is to deal only
with creditworthy counterparties.
Varun Beverages Limited290

Summary of significant accounting policies and other explanatory information on the Standalone Financial Statements for the year ended 31 December 2019
In respect of trade and other receivables, the Company is not exposed to any significant credit risk exposure
to any single counterparty. Trade receivables consist of a large number of customers of various scales and
in different geographical areas. Based on historical information about customer default rates, management
considers the credit quality of trade receivables. In case the receivables are not recovered even after regular
follow up, measures are taken to stop further supplies to the concerned customer. The expected credit loss
is based on the five years historically observed default rates over the expected life of the trade receivables
and is adjusted for forward looking estimates.
Movement in expected credit loss allowance on trade receivables
(` in million)
As at 31 December 2019
As at 31 December 2018
Balance at the beginning of the year 255.93 222.41
Loss allowance measured at lifetime expected credit loss (39.67) 33.52
Balance at the end of the year 216.26 255.93
The credit risk for cash and cash equivalents, bank deposits including interest accrued thereon and
Government grant receivables is considered negligible, since the counterparties are reputable banks
with high quality external credit ratings and State Government bodies. The credit risk for loans
advanced to subsidiary companies including interest accrued thereon is also considered negligible since
operations of these entities are regularly monitored by the Company and these companies have shown
considerable growth.
In respect of financial guarantees provided by the Company, the maximum exposure which the Company is
exposed to is the maximum amount which the Company would have to pay if the guarantee is called upon.
Based on the expectation at the end of each reporting period, the Company considers that it is more likely
than not that such an amount will not be payable under the guarantees provided.
55.3 Liquidity risk analysis
Liquidity risk is that the Company might be unable to meet its obligations. The Company manages its liquidity
needs by monitoring scheduled debt servicing payments for long-term financial liabilities and considering
the maturity profiles of financial assets and other financial liabilities as well as forecast of operational cash
inflows and outflows. Liquidity needs are monitored in various time bands, on a day-to-day basis, a week-
to-week basis and a month-to-month basis. Long-term liquidity needs for a 180-day and a 360-day lookout
period are identified monthly. Net cash requirements are compared to available borrowing facilities in order
to determine headroom or any shortfalls.
Funding for long-term liquidity needs is additionally secured by an adequate amount of committed credit
facilities and the Company’s ability to avail further credit facilities subject to creation of requisite charge
on its assets. The Company assessed the concentration of risk with respect to refinancing its debt and
concluded it to be low.
as at 31 December 2019, the Company’s non-derivative financial liabilities have contractual maturities as
summarised below:
(` in million)
31 December 2019 1 to 12 months 1 to 5 years Later than 5 years
Borrowings (current and non-current) 9,091.30 20,133.22 1,403.78
Trade payables 3,178.78 - -
Otherfinancialliabilities(current) 3,504.33 - -
Total 15,774.41 20,133.22 1,403.78
STATUTORY REPORTSCORPORATE OVERVIEW FINANCIAL STATEMENTS
Annual Report 2019 291

Summary of significant accounting policies and other explanatory information on the Standalone Financial Statements for the year ended 31 December 2019
This compares to the maturity of the Company’s non-derivative financial liabilities in the previous reporting
periods as follows:
(` in million)
31 December 2018 1 to 12 months 1 to 5 years Later than 5 years
Borrowings (current and non-current) 6,995.26 16,401.73 629.81
Trade payables 1,783.18 - -
Otherfinancialliabilities(current) 3,136.49 - -
Total 11,914.93 16,401.73 629.81
as at 31 December 2019, the contractual cash flows (excluding interest thereon) of the Company’s derivative
financial instruments are as follows:
(` in million)
31 December 2019 1 to 12 months 1 to 5 years
Cross currency interest rate swap - 1,752.25
This compares to the contractual cash flows (excluding interest thereon) of the Company’s derivative
financial instruments in the previous year as follows:
(` in million)
31 December 2018 1 to 12 months 1 to 5 years
Cross currency interest rate swap - 1,686.78
56. Fair value measurements
Financial instruments by categories
The carrying values and fair values of financial instruments by categories are as follows:
(` in million)
Particulars Notes Carrying value Fair value/amortized cost
31 December 2019
31 December 2018
31 December 2019
31 December 2018
Financial assets
Fair value through profit and loss ('FVTPL')
(i) Non-currentfinancialassets
(a) Investment (non-current) 7 0.01 0.01 0.01 0.01
Amortized cost
(i) Non-currentfinancialassets
(a) Loans 8 6,042.77 6,959.06 6,042.77 6,959.06
(b) Other 9 8.90 8.34 8.90 8.34
(ii) Currentfinancialassets
(a) Trade receivables 12 1,305.31 1,344.74 1,305.31 1,344.74
(b) Cash and cash equivalents 13 323.51 17.75 323.51 17.75
(c) Bank balances other than (b) above 14 0.65 0.65 0.65 0.65
(d) Loans 15 351.71 104.68 351.71 104.68
(e) Other 16 2,820.09 1,783.80 2,820.09 1,783.80
Total 10,852.95 10,219.03 10,852.95 10,219.03
Financial liabilities
FVTPL
(i) Currentfinancialliability
(a) Liability for foreign currency derivative contract
25 68.45 77.97 68.45 77.97
Varun Beverages Limited292

Summary of significant accounting policies and other explanatory information on the Standalone Financial Statements for the year ended 31 December 2019
(` in million)
Particulars Notes Carrying value Fair value/amortized cost
31 December 2019
31 December 2018
31 December 2019
31 December 2018
Amortized cost
(i) Non-current borrowings (excluding those disclosed under FVTPL category above)
20a 22,917.07 18,359.13 22,917.07 18,359.13
(ii) Currentfinancialliabilities
(a) Borrowings 20B 4,110.44 3,188.75 4,110.44 3,188.75
(b) Trade payables 24 3,178.78 1,783.18 3,178.78 1,783.18
(c) Other 25 8,416.74 6,865.03 8,416.74 6,865.03
Total 38,691.48 30,274.06 38,691.48 30,274.06
Valuation technique to determine fair value
Cash and cash equivalents, other bank balances, trade receivables, loans, other current financial assets, trade
payables, current borrowings and other current financial liabilities approximate their carrying amounts largely
due to the short-term maturities of these instruments. The fair value of the financial assets and liabilities is the
amount at which the instrument could be exchanged in a current transaction between willing parties, other than
in a forced or liquidation sale.
The following methods and assumptions were used to estimate the fair values:
- The fair values of the long term borrowings, loans and other deferred payments are determined by using
discounted cash flow method using the appropriate discount rate. The discount rate is determined using
other similar instruments incorporating the risk associated.
- The Company executed derivative financial instruments such as cross currency interest rate swap being
valued using valuation techniques, which employs use of market observable inputs. The Company uses mark
to market valuation provided by bank for its valuation.
Fair value hierarchy
The financial assets measured at fair value are grouped into the fair value hierarchy as on 31 December 2019 and
31 December 2018 as follows: (also refer note 3.1)
(` in million)
31 December 2019 Date of valuation
Total Fair value measurement using
Quoted prices in active markets
(Level 1)
Significant observable inputs
(Level 2)
Significant unobservable
inputs(Level 3)
Assets measured at fair value:
Investment (non-current) 31 December 2019
0.01 - - 0.01
Liabilities measured at fair value:
(a) Liability for foreign currency derivative contract
31 December 2019
68.45 - 68.45 -
STATUTORY REPORTSCORPORATE OVERVIEW FINANCIAL STATEMENTS
Annual Report 2019 293

Summary of significant accounting policies and other explanatory information on the Standalone Financial Statements for the year ended 31 December 2019
There have been no transfers of financial assets and financial liabilities between the levels during the year 2019
(` in million)
31 December 2018 Date of valuation
Total Fair value measurement using
Quoted prices in active markets
(Level 1)
Significant observable inputs
(Level 2)
Significant unobservable
inputs(Level 3)
Assets measured at fair value:
Investment (non-current) 31 December 2018
0.01 - - 0.01
Liabilities measured at fair value:
(a) Liability for foreign currency derivative contract
31 December 2018
77.97 - 77.97 -
57. Details of hedged and unhedged exposure in foreign currency denominated monetary items
A. Exposure in foreign currency - hedged
The Company executes cross currency and interest rate swap contracts to hedge against its foreign currency
exposures relating to the underlying transactions and firm commitments. The Company does not enter into
any derivative instruments for trading or speculative purposes.
Outstanding foreign currency exposure hedged (excluding interest thereon):
(in million)
Particulars Period Foreign currency Hedged currency
ECB Loan 31 December 2019 SGD 33.13 USD 25.00
31 December 2018 SGD 33.13 USD 25.00
B. Exposure in foreign currency - unhedged
Outstanding foreign currency exposure not being hedged against adverse currency fluctuation:
(in million)
Particulars Period Foreign currency Local currency
Trade receivable 31 December 2019 USD 0.58 INR 41.02
31 December 2018 USD 7.63 INR 532.55
advance to vendors 31 December 2019 USD 1.81 INR 126.69
31 December 2018 USD 1.00 INR 72.44
31 December 2019 EURO 2.24 INR 175.87
31 December 2018 EURO 0.36 INR 29.28
Loan given 31 December 2019 USD 47.08 INR 3,355.64
31 December 2018 USD 61.11 INR 4,265.07
31 December 2019 LKR 5,701.67 INR 2,548.24
31 December 2018 LKR 5,805.35 INR 2,598.89
Loan taken (ECB loan) 31 December 2019 USD 25.00 INR 1,752.25
31 December 2018 USD 25.00 INR 1,686.78
Other receivables 31 December 2019 USD 6.40 INR 455.91
31 December 2018 USD 3.36 INR 234.84
Other payables 31 December 2019 USD 0.09 INR 6.05
31 December 2018 USD 0.11 INR 7.45
Trade payables 31 December 2019 USD 5.91 INR 421.73
31 December 2018 USD 8.99 INR 627.41
Varun Beverages Limited294

Summary of significant accounting policies and other explanatory information on the Standalone Financial Statements for the year ended 31 December 2019
(in million)
Particulars Period Foreign currency Local currency
31 December 2019 GBP - INR -
31 December 2018 GBP 0.01 INR 0.61
31 December 2019 EURO - INR -
31 December 2018 EURO 0.06 INR 4.80
Payable for capital expenditure
31 December 2019 USD 0.57 INR 40.64
31 December 2018 USD 0.16 INR 13.48
31 December 2019 EURO 0.12 INR 9.56
31 December 2018 EURO 6.42 INR 519.23
58. During the year ended 31 December 2019, pursuant to Qualified institutions placement “QIP”, the Company has
raised ` 8,999.99 through fresh issue of 14,705,882 equity shares of ` 10 each at a premium of ` 602 per share.
The audit committee and the Board of Directors noted the utilization of funds raised through such fresh issue of
equity shares to be in line with the object of the issue, the details of which are as follows:
(` in million)
Particulars Amount
Gross proceeds received from QIP 8,999.99
Less: Share issue expenses 164.36
Net proceeds received from QIP 8,835.63
Amount utilised for:
Repayment of debts (8,835.63)
Unutilised amount -
59. No adjusting or significant non-adjusting events have occurred between 31 December 2019 and the date of
authorization of these standalone financial statements.
Theaccompanyingnotesareanintegralpartofthestandalonefinancialstatements. For and on behalf of the Board of Directors ofas per our report of even date attached. Varun Beverages Limited
For Walker Chandiok & Co LLP For APAS & Co. Varun Jaipuria Raj Pal GandhiChartered accountants Chartered accountants Whole Time Director Whole Time DirectorFirm’s Registration No.: 001076N/N500013 Firm’s Registration No.: 000340C DIN 02465412 DIN 00003649
Anupam Kumar Sumit Kathuria Vikas Bhatia Kapil AgarwalPartner Partner ChiefFinancialOfficer ChiefExecutiveOfficer Membership No.: 501531 Membership No.: 520078 and Whole Time Director DIN 02079161
Ravi Batra ChiefRiskOfficerand Place : Gurugram Group Company Secretary Dated : 07 February 2020 Membership No. F-5746
STATUTORY REPORTSCORPORATE OVERVIEW FINANCIAL STATEMENTS
Annual Report 2019 295

Notes


www.varunpepsi.com