2019/2020gem-set jewellery 6,300 6,400 gold products 4,200 5,000 same store average selling price1...
TRANSCRIPT
2019/2020

1 Core operating profit = Aggregate of adjusted gross profit and other income, less selling and distribution costs and general and administrative expenses2 An unrealised loss on gold loans of HK$711 million (FY2019: a gain of HK$1 million) was recorded in FY2020 3 The proposed final dividend of HK$0.12 per share is subject to the approval of shareholders at the forthcoming annual general meeting
Revenue
HK$56,751 million
14.9%
Core operating profit 1
HK$5,687 million
18.4%
Basic EPS
HK$0.29 HK$0.46FY2019
Profit attributable to shareholders 2
HK$2,901 million
36.6%
Dividend per share for the year 3
HK$0.24 82.7%Payout ratio
Same store sales
15.1%Mainland China
38.7%Hong Kong and Macau
FY2020 RESULTS HIGHLIGHTS
2

Mainland China e-commerce RSV2
5.2%
3.4%3
Contribution to respective
RSV Retail sales volume
14.4%
FY2020 OPERATIONAL HIGHLIGHTS
1
Other markets
Retail network
3,850 POS
711
716
Mainland China Hong Kong and Macau
4
T MARK
929 CIS1 4 POS
19.3%
Mainland China Hong Kong and Macau
27.8%of diamondproducts RSV
of diamondproducts RSV
18.1%FY2019
of gold products RSV
CTF ‧ HUÁ Collection in Mainland China
Average selling price
32.2%
~HK$15,700
Net openings
1 SIS/CIS = “shop-in-shop”/”counter-in-shop” format2 RSV = Retail Sales Value measured the sales at the ending price (VAT inclusive, if any) of products sold to customers in the POS network and other channels3 RSV YoY change measured at constant exchange ratesNote: Data for retail network was as at 31 March 2020
3

FINANCIALREVIEW

For the year ended 31 March(HK$ m)
2018 2019 2020YoY
Change
Revenue 59,156 66,661 56,751 -14.9%
Contribution of gem-set jewellery1 23.7% 22.8% 22.0% -0.8% pts
Gross profit 16,213 18,602 16,096 -13.5%
Gross profit margin 27.4% 27.9% 28.4% +0.5% pts
Adjusted gross profit margin2 27.2% 27.9% 29.6% +1.7% pts
Selling and distribution costs and general and administrative expenses (“SG&A”)
10,920 12,025 11,557 -3.9%
SG&A to revenue ratio 18.5% 18.0% 20.4% +2.4% pts
Core operating profit 5,606 6,972 5,687 -18.4%
Core operating profit margin 9.5% 10.5% 10.0% -0.5% pts
Profit before taxation 5,832 6,352 4,205 -33.8%
Profit attributable to shareholders 4,095 4,577 2,901 -36.6%
Basic earnings per share HK$0.41 HK$0.46 HK$0.29 -36.6%
Dividend per share HK$0.57 HK$0.65 HK$0.243 N/A
1 Revenue from jewellery trading and service income from franchisees excluded2 Adjusted gross profit margin = Gross profit margin excluding the impact of the unrealised loss (gain) on gold loans3 The proposed final dividend of HK$0.12 per share is subject to the approval of shareholders at the forthcoming annual general meeting
SUMMARY – INCOME STATEMENT
5

FY2016 FY2017 FY2018 FY2019 FY2020
71.8%
28.2%
56,751
-3.9%
-34.0%
YoY Change
-14.9%
59.5%
56,592
40.5%
60.5%
39.5%
51,246
62.2%
37.8%
59,156
66,661
Hong Kong, Macau and other markets
Mainland China
(HK$ m) 1H2019 2H2019 1H2020 2H20201H2020/1H2019Change
2H2020/2H2019Change
Mainland China 18,022 24,410 20,224 20,539 12.2% -15.9%
Hong Kong, Macau and other markets 11,681 12,548 9,309 6,679 -20.3% -46.8%
Overall 29,703 36,958 29,533 27,218 -0.6% -26.4%
63.7%
36.3%
REVENUE BREAKDOWN –REPORTABLE SEGMENTS (HK$ M)
6

FY2016 FY2017 FY2018 FY2019 FY2020
56,250
22.0%
59.9%
12.0%
YoY Change
26.8%
56,126
55.8%
25.3%
57.4%
50,82123.7%
59.4%
57,892
65,966
Platinum / Karat gold products
Gem-set jewelleryGold products
Watches
-17.5%
-16.3%
-3.9%
-14.7%
-6.4%
12.4% 11.5% 10.9%5.0% 5.7% 6.0%
% of revenue 1H2019 2H2019 1H2020 2H2020
Gem-set jewellery 23.4% 22.2% 23.3% 20.6%
Gold products 60.5% 61.5% 58.9% 61.1%
Platinum / Karat gold products 10.5% 10.7% 11.4% 12.6%
Watches 5.6% 5.5% 6.4% 5.7%
22.8%
61.1%
10.6%
5.5%
REVENUE BREAKDOWN – PRODUCTS (HK$ M)(EXCLUDING JEWELLERY TRADING AND SERVICE INCOME FROM FRANCHISEES)
7
6.1%

26.0% 23.0%
-6.0%
0.7%
-10.9%
-42.3%
-35.0%
-65.0%
-80.2%
3.8% 5.7%
-7.4%
9.1% 10.5%
-6.8%
2.3%
-49.5%
-15.4%
FY2019 FY2020
SSSG SSSG SSS volume growth
Mainland China 3.4% -15.1% -24.0%
Hong Kong and Macau 8.7% -38.7% -43.5%
Mainland China Hong Kong and Macau
1Q 2Q1Q 2Q 3Q 4Q
FY2019 FY2020
3Q 4Q
SAME STORE SALES GROWTH (“SSSG”) –MAJOR MARKETS
8
1QTD(Apr - May 2020)
FY2021

30.9%40.7%
-5.6% 2.6%
-12.7%
-49.2%
-25.8%
-66.7%
-86.0%
26.4%
-2.3% -8.2% -10.4%-15.7%
-34.8%
-53.4%
-64.2%
-78.4%
10.8% 11.1%
-11.0%
13.5% 12.4%
-15.4%
-0.9%
-53.7%
-25.2%
-3.8%1.0%
-5.4%
0.1% 8.0% -0.4%
0.6%
-49.5%
-7.9%
Same store average selling price1 (HK$)
FY2019 FY2020
Gem-set jewellery 6,300 6,400
Gold products 4,200 5,000
Same store average selling price1 (HK$)
FY2019 FY2020
Gem-set jewellery 11,100 10,900
Gold products 8,200 9,400
1 Average selling price on FY2020 same store basis, was rounded to the nearest hundred HK dollar and measured at constant exchange rates; Value-added tax (VAT) in Mainland China included
SSSG – Mainland China SSSG – Hong Kong and Macau
Gem-set jewellery Gold productsGem-set jewellery Gold products
SSSG – MAJOR PRODUCTS
9
1Q 2Q 3Q 4Q 1Q 2Q
FY2019 FY2020
3Q 4Q 1QTD(Apr - May 2020)
FY2021
1Q 2Q 3Q 4Q 1Q 2Q
FY2019 FY2020
3Q 4Q 1QTD(Apr - May 2020)
FY2021

28.7% 28.8%30.5%
17.9% 17.6% 18.7%
11.6% 11.8% 12.5%
FY2018 FY2019 FY20201,853 2,062
2,843
2,414 2,942
2,253
543 926 685
796 1,042
(94)
1,339
4,267
5,096
24.8% 26.3% 27.4%
19.3% 18.7%24.7%
6.0% 8.1%3.7%
FY2018 FY2019 FY2020
Core operating profit margin
Adjusted gross profit margin SG&A ratio
Core operating profit YoY
1H2020 2H2020 FY2020
Mainland China 37.8% -23.4% 1.8%
Hong Kong, Macau and other markets
-26.1% N/A -70.0%
Core operating profit by reportable segment (HK$ m) Profitability – Mainland China
Core operating profit marginAdjusted gross profit margin SG&A ratio
FY2018 FY2019 FY2020
Hong Kong, Macau and other markets (1H)/(2H)
Mainland China (1H)/(2H)
Profitability – Hong Kong, Macau and other markets
5,004
1,968
CORE OPERATING PROFIT AND PROFITABILITY ANALYSIS
10
591

1,692 1,912 1,659
330 476 569
517 702 705
805 847 921
1,306 1,582
1,558 252
1,888 1,908 1,585
4,106
4,622 4,561
FY2018 FY2019 FY2020
18.5% 18.0%
20.4%
%
6.9%
0.9%
2.9%
3.2%
2.7%
1.4%
%
8.0%
1.2%
2.9%
2.8%
0.4%
3.9%
FY2018 FY2019 FY20201
10,920
12,025
-1.3%
-83.9%
0.4%
163.0%
-13.2 %
YoY Change
-3.9%
As a % of revenue
Concessionaire fees
Rental expenses
Advertising and promotion expenses
Depreciation and amortisation(Right-of-use assets, “ROUA”)
Packaging materials
Staff costs and related expenses
-16.9%
%
6.9%
1.1%
2.9%
2.9%
2.3%
1.3%
11,557
1 Adoption of IFRS 16 Leases for the first time in FY2020, prior-period comparative financial information is not restated
Depreciation and amortisation(Property, plant and equipment)
Other SG&A0.6% 0.7%
SG&A ANALYSIS (HK$ M)
1.0% 19.5%
11

FY2018 FY2019 FY2020
39.2%
54.6%
1,362
52.4%
40.8%
1,551
34.8%
58.2%
7.0%
6.8% 6.9%9.2%
FY2018 FY2019 FY2020
37.4%
59.3%
2,553
2,852
37.3%
59.1%
37.3%
6.9% 6.7%7.4%
FY2020 Average no. of employees1
20,880+2.8% YoY
3,220+0.9% YoY
FY2020 Average no. of employees1
3.6%3.2% 6.8%6.1%
YoY Change
6.1%
6.1%
-27.1%
-14.4%
YoY Change
2.9% -11.1%
As a % of respective revenue
Variable staff costs
Fixed staff costsOther staff related expenses
As a % of respective revenue
Variable staff costs
Fixed staff costsOther staff related expenses
1 Employees in production function excluded
6.4%-4.9%
Mainland China Hong Kong and Macau
3,028
1,328
SG&A – STAFF COSTS ANDRELATED EXPENSES (HK$ M)
12
59.2%
3.5%

6.1%
4.9%
7.3%
1,2531,146
FY2018 FY2019 FY2020
8.5%8.3% 8.4%
1,872 1,892
1,583
FY2018 FY2019 FY2020
3.9%
87.6%
YoY Change
-16.3% -1.8%
YoY Change
As a % of respective revenue
Concessionaire fees
Mainland China Hong Kong and Macau
1 Adoption of IFRS 16 Leases for the first time in FY2020, prior-period comparative financial information is not restated
As a % of respective revenue
Rental expenses
Depreciation and amortisation (ROUA)Finance costs on leases
Pre-IFRS 16 Post-IFRS 16
1
SG&A – CONCESSIONAIRE FEES ANDLEASE-RELATED EXPENSES (HK$ M)
13
1,126
8.5%

56 60 84
240 239
297
FY2018 FY2019 FY2020
381
2,097 1,672 1,639
2,723 2,835 3,404
11,819 13,426 15,585
18,179
21,394
21,715
FY2018 FY2019 FY2020
34,818
39,327
Finished goods
Raw materials
1 Packaging materials excluded2 Inventory turnover period = Closing inventory balances (excluding packaging materials) / cost of goods sold x 365 or 366
Watches
Gem-set jewellery
Gold productsPlatinum / Karat gold products
%
52.2%
6.0%7.8%
33.9%
51.3%
36.8%
%
8.0%3.9%
Inventory balances by product1 (HK$ m) Inventory turnover period by category2 (day)
296 299
54.4%
34.1%
%
7.2%4.3%
INVENTORY ANALYSIS
14
42,343

50 91 77 135 104 89
600
1,006
742
299
191
65
FY2018 FY2019 FY2020
1,084
101 64 33
263 398
84
721
930
856
FY2018 FY2019 FY2020
1,084
1,392
973
Furniture, fixtures and equipment & leasehold improvements
Land and buildings & construction in progressPlant and machinery & motor vehicles
Offices
Projects
POSProductions
Capex by nature Capex by function
973
1,392
CAPITAL EXPENDITURE (HK$ M)
15

(HK$ m)As at
31 Mar 19% to total
equityAs at
31 Mar 20% to total
EquityIncrease/
(decrease)
Non-current assets 8,459 26.9% 10,038 37.2% 1,579
Inventories 39,486 125.7% 42,538 157.6% 3,052
Cash and cash equivalents1 7,641 24.3% 7,219 26.7% (422)
Total borrowings 18,069 57.5% 22,711 84.1% 4,642
Bank borrowings 10,057 32.0% 11,431 42.3% 1,374
Gold loans 8,012 25.5% 11,280 41.8% 3,268
Net debt2 10,428 33.2% 15,492 57.4% 5,064
Net current assets 26,307 83.8% 19,579 72.5% (6,728)
Total equity 31,403 100% 26,991 100% (4,412)
1 Bank balances and cash equivalents included 2 Aggregate of bank borrowings, gold loans, net of cash and cash equivalents
CHANGES IN CAPITAL STRUCTURE
16

1 With adoption of IFRS 16, leases paid was included in financing activities2 Net cash used in inventories included net change in inventories, gold loan raised and repayment of gold loans
7,641
8,385 1,263
1,900959 973 1,362 6,243
7497,219
FY2019(31 Mar 19)
FY2020(31 Mar 20)
Net cash used in inventories2
Operating cash flows before movements in working capital
Net cash from other operating activities
Capital expenditure
Net increase in bank borrowings
Dividends paid
Bank balances and cash
Bank balances and cash
Pro forma free cash flows5,208
Leases paid1
SUMMARY – MOVEMENTS IN CASH FLOWS (HK$ M)
Other movements
17

BUSINESSDEVELOPMENT

Mainland China
711 POS
POS movement by store brand1 FY2018 FY2019 Addition Reduction Net FY2020
CHOW TAI FOOK JEWELLERY
2,317 2,803 761 (138) 623 3,426
CTF WATCH 106 113 8 (5) 3 116
T MARK – 4 – (1) (1) 3
HEARTS ON FIRE 6 3 – (2) (2) 1
ENZO – – 60 (1) 59 59
SOINLOVE 9 27 18 (2) 16 43
MONOLOGUE 11 38 19 (6) 13 51
Total 2,449 2,988 866 (155) 711 3,699
1 Shop-in-shop and counter-in-shop excluded
RETAIL NETWORK – MAINLAND CHINA
19

53.4%41.5%
5.1%
53.2%42.8%
4.1%
57.1%
42.9%
17.4%
48.9%
17.2%
16.4%
43.5%
56.5%
12.0%
42.4%20.8%
24.9%
% of % of POS RSV
Tier I cities
Tier II cities
Tier III cities
Tier IV cities and others
MAINLAND CHINA –CHOW TAI FOOK JEWELLERY POS
% of % of POS RSV
Department store
Shopping mall
Standalone store
RSV and POS by operation model RSV and POS by tier of cities
% of % of POS RSV
Self-operated
Franchised
RSV and POS by self-operated model
RSV YoYNet POS
movement
Tier I cities -8.0% +80
Tier II cities -7.7% +214
Tier III cities -3.6% +148
Tier IV cities and others
-0.9% +181
RSV YoYNet POS
movement
Self-operated -13.9% -14
Franchised 7.1% +637
RSV YoYNet POS
movement
Department store
-19.2% -39
Shopping mall
-4.3% +28
Standalone store
-23.5% -3
20

Net openings of 623 CHOW TAI FOOK
JEWELLERY POS in FY2020
Continue to expand presence in lower
tier or county level cities through
franchisees
Continual store segmentation and
upgrade store layout
FY2021 net openings expected to be
~400-450 POS
Retail network management
Experience shop, Kunming, Yunnan Province(雲南省昆明市)
JEWELRIA, Hefei , Anhui Province(安徽省合肥市)
MAINLAND CHINA –CHOW TAI FOOK JEWELLERY POS
21

POS movement by store brand1
FY2018 FY2019 Addition Reduction Net FY2020
CHOW TAI FOOK JEWELLERY
122 130 17 (10) 7 137
Hong Kong, China 80 80 8 (6) 2 82
Macau, China 19 19 1 (2) (1) 18
Other markets 23 31 8 (2) 6 37
T MARK – 1 – – – 1
HEARTS ON FIRE 14 15 – (5) (5) 10
SOINLOVE – – 1 – 1 1
MONOLOGUE – – 2 – 2 2
Total 136 146 20 (15) 5 151
1 Shop-in-shop and counter-in-shop excluded
RETAIL NETWORK –HONG KONG, MACAU AND OTHER MARKETS
22
Hong Kong and Macau
4 POS
Other markets
1 POS

75.6%
17.9%
6.5%
HONG KONG, MACAU AND OTHER MARKETS
SOINLOVE, K11 Artmall
4 net openings in FY2020, 2 MONOLOGUE and
1 SOINLOVE POS were included
Expect 10-15 store consolidation in FY2021
Hong Kong and Macau
Other markets
Retail network management
1 net openings in FY2020
Explore further opportunities in Southeast Asia
Central Phuket Floresta, Thailand
23
57.6%
11.9%
30.5%
RSV YoYNet POS
movement
Hong Kong -40.3% +5
Macau -12.7% -1
Other markets +81.7% +1
Hong Kong and MacauRSV settled by
China UnionPay, Alipay, WeChat Pay or RMB
36.9%(FY2019: 46.5%)
RSV and POS by geography
% of % of POS RSV
Hong Kong
Macau
Other markets

CUSTOMER EXPERIENCEE-COMMERCE &
CUSTOMER RELATIONSHIPMANAGEMENT

MULTI-BRAND STRATEGY
MONOLOGUEStylish fashion jewellery
for young generation
SOINLOVEJewellery gifting brand for romantic ladies
JEWELRIAChow Tai Fook’s diversified retail experience which offers international jewellery product offerings
HEARTS ON FIREUS premium diamond brand with
exquisite cutting craftsmanship
CHOW TAI FOOK JEWELLERYIconic brand with classic product offerings
T MARKIn pursuit of true diamond authenticity and traceability
ENZOCreative and
contemporary coloured gem jewellery brand
ARTRIUMChow Tai Fook’s exclusive high-jewellery experience that melds contemporary design with a classic spirit
25

Founded in 2004; Acquired in Jan 2020
Primarily located in Tier I and II cities
A natural coloured gem specialist
JEWELRIA AND ENZOJEWELRIA ENZO
26
59 POS
Mainland China
Ocean Collection
Annoushka, a British jewellery brand
Kagayoi, a Japanese jewellery brand
59 POS
Mainland China
Guardian of Life Collection
Hayley Paige for HEARTS ON FIRE Collection
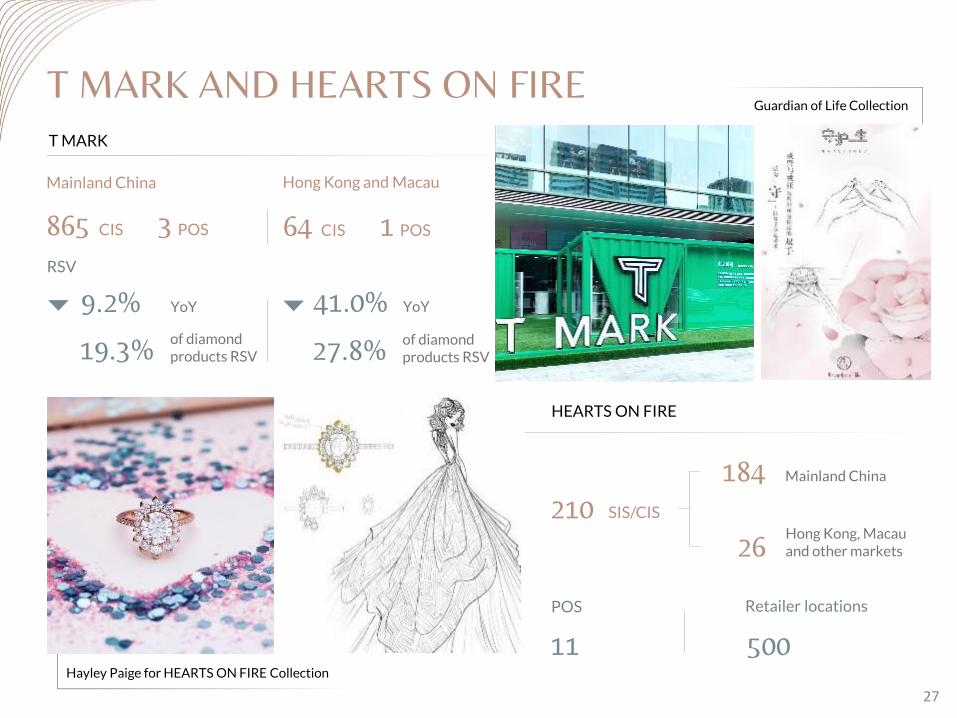
T MARK AND HEARTS ON FIRE
64 CIS 1 POS
of diamond products RSV
of diamond products RSV
9.2% YoY 41.0% YoY
865 CIS 3 POS
Hong Kong and MacauMainland China
RSV
19.3% 27.8%
T MARK
Retailer locations
50011
POS
210Mainland China184
Hong Kong, Macau and other markets26
SIS/CIS
HEARTS ON FIRE
27

Collaboration with Coca Cola
SOINLOVE AND MONOLOGUESOINLOVE
MONOLOGUE
28
43 POS
Mainland China
1 POS
Hong Kong and Macau
51 POS
Mainland China
2 POS
Hong Kong and Macau
Monogold Collection
Gold Sweeties Pink Collection
A net of 17 POS were opened in FY2020
A net of 15 POS were opened in FY2020
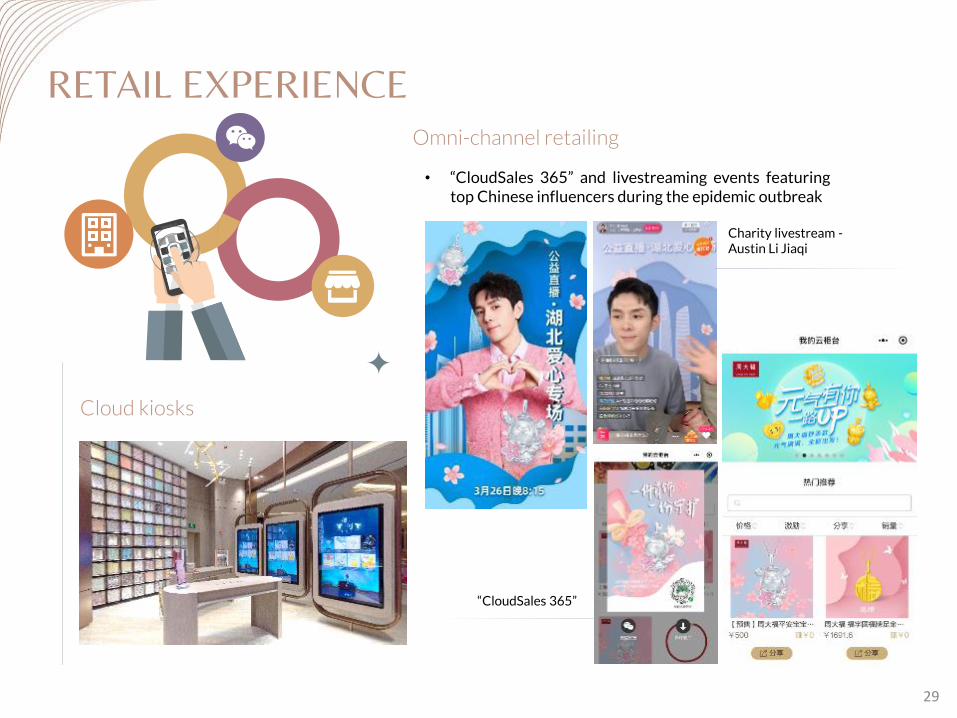
RETAIL EXPERIENCE
Cloud kiosks
• “CloudSales 365” and livestreaming events featuringtop Chinese influencers during the epidemic outbreak
Omni-channel retailing
“CloudSales 365”
Charity livestream -Austin Li Jiaqi
29

E-COMMERCE – MAINLAND CHINA
Unique daily visitors1
739,000
10,631,000+
E-commerce platforms
Number of followers2
3.4% YoY
E-commerce RSV
5.2%
14.4%
RSV
Retail sales volume
Contribution to respective
HK$1,400FY2019
HK$1,300
Average selling price
1 Source from Chow Tai Fook eShop, Tmall and JD.com2 Source from official Sina Weibo, Tencent Weibo and WeChat accounts
30

CUSTOMER RELATIONSHIP MANAGEMENT
24.9%
Mainland China Hong Kong and Macau
35.5%
2,490,000 1,180,000Members as at 31 March 2020
Repeat purchase as a % of respective RSV in FY2020
31

BUSINESS OUTLOOK & STRATEGIES

BUSINESS OUTLOOK AND STRATEGIES
Market outlook
Hong Kong and Macau
• Remain challenging in the foreseeable future
Mainland China
• Cautiously optimistic about short-term business outlook
• Stay optimistic about the mid-to long-term prospects of the jewellery market in Mainland China
Short-term strategies
Strategies to reduce short-term hiccups and support the business recovery:
Hong Kong and Macau
• Consolidate retail network, rationalise cost structure and refine business strategies
• Transform current business model, enhance retail experience and operational efficiency through innovation and technology
Mainland China
• Continue expansion plan through franchise model as situation stabilizes
• Diversify customer experiences through channel innovation and multi-brand strategy
33

BUSINESS OUTLOOK AND STRATEGIES
Jewelleryecosystem
Market leader
Operational efficiency
Tech-savvy jewellerycompany
34
Customer-centric strategy to achieving long-term goals
• The tasks will center on improving business model agility and organisational structure through technology and employee empowerment, which allow us to respond rapidly to changes, strengthen supply-chain capabilities and enhance our competitive edge to achieve long-term sustainable growth

Q&A SESSION


APPENDIX GOLD HEDGING
MECHANISM

100%hedged
0% hedged
Base inventory
20,000 KG.
Seasonal, consigned inventory & others
20,000 KG.
Base inventory
20,000 KG.
Seasonal, consigned inventory & others
30,000 KG.
Period 0 Period 1(Peak season)
Gold inventory(Weight)
Hedging ratio:50%
Hedging ratio:60%
ILLUSTRATION OF THE GOLD HEDGING MECHANISM
Note: Data provided are for illustrative purpose only
38

2,000
0
1,000
1,000
2,000
1,300 1,300
(1,300)
(1,700)
Gold price at US$1,300/oz Gold price at US$1,700/oz
Gold inventory(Book at cost)
Gold loans(Mark-to-market)
Period 0 Period 1
Mark-to-market loss
US$
Note: Data provided are for illustrative purpose only
ILLUSTRATION OF THE UNREALISED LOSS ON GOLD LOANS
39

These materials have been prepared by Chow Tai Fook Jewellery Group Limited (the “Company”) solely for use at this presentation and are not for publicdissemination.
The slides and any other materials used in this presentation are the property of the Company and must be treated as such. The information contained inthis presentation is being furnished to you solely for your information and may not be forwarded, published or distributed, directly or indirectly, to anyother person (whether within or outside your organisation/firm), in whole or in part, for any purpose and may not be reproduced in any mannerwhatsoever. Any forwarding, publication, distribution or reproduction of this document in whole or in part is unauthorised.
The information contained in this presentation does not constitute or form part of any offer for sale or subscription of or solicitation or invitation of anyoffer to buy or subscribe for any securities or other interests of the Company or its holding Company or any of its subsidiaries in any jurisdiction or aninducement to enter into any investment activity, nor shall it or any part of it form the basis of or be relied on in connection with any contracts,commitment or investment decision whatsoever.
This presentation contains forward-looking statements. Such forward-looking statements are based on a number of assumptions about the operations ofthe Company and other factors, many of which may be beyond the Company’s control. By their nature, forward-looking statements involve risks anduncertainties because they relate to events and depend on circumstances that may or may not occur in the future. Accordingly, the Company’s actualresults may differ materially from those expressed or implied by such forward-looking statements. The Company has no obligation and does not undertaketo update or revise any forward-looking statements, whether as a result of new information, future events or otherwise. The information contained in thispresentation has been compiled as of the date of this presentation, speaks as of the date of this presentation (or earlier, if so indicated) and will not beupdated to reflect material developments which may occur after the date of this presentation, and is subject to change, including substantial changes,without notice.
This presentation may include measures of financial performance which are not a measure of financial performance under IFRS, such as “Core operatingprofit”. These measures are presented because the Company believes they are useful measures to determine the Company’s operating cash flow andhistorical ability to meet debt service and capital expenditure requirements. “Core operating profit” should not be considered as an alternative to cashflows from operating activities, a measure of liquidity or an alternative to net profit or indicators of the Company’s operating performance on any othermeasure of performance derived in accordance with IFRS. Because it is not an IFRS measure, “Core operating profit” may not be comparable to similarlytitled measures presented by other companies.
The information contained in this presentation has not been independently verified. No representation, warranty, or undertaking express or implied, ismade as to, and no reliance should be placed on, the fairness, accuracy, completeness or correctness of any information or opinion contained herein. It isnot the intention to provide, and you may not rely on this document as providing, a complete or comprehensive analysis of the Company’s financial ortrading position or prospects. None of the Company or any of its directors, officers, employees, agents, shareholders, affiliates, subsidiary, advisors orrepresentatives shall be in any way responsible for the contents hereof, or shall be liable (in negligence or otherwise) for any loss howsoever arising fromany use of this document or the information contained in this presentation or otherwise arising in connection therewith.
DISCLAIMER
40