· 2019-01-04 · alan martin b. budget and finance committee john “chip” wright ; c. consent...
TRANSCRIPT

REGIONAL CENTER OF ORANGE COUNTY BOARD OF DIRECTORS’ MEETING
AGENDA
Date: Thursday, January 10, 2019 Time: 6:00 – 8:00 p.m.
Place: RCOC Board Room, 1525 North Tustin Avenue, Santa Ana, California 92705
I. Closed Session (Board Members Only) A. W&I Code §4663 and §4664 David M. Lester, Esq.
II. Recess III. General Session
A. Pledge of Allegiance/Reading of RCOC’s Mission and Vision Statement Alan Martin B. Budget and Finance Committee John “Chip” Wright C. Consent Calendar* Alan Martin
1. Approval of Board of Directors’ Minutes for November 1, 2018**2. Budget and Finance Committee**
a. Approval of Monthly Sufficiency of Allocation Report, October 2018**b. Approval of Monthly Sufficiency of Allocation Report, November 2018**c. Annual Sufficiency of Allocation Report, Fiscal Year 2018-19**d. Approval of Budget Amendment D-4, Fiscal Year 2017-18**e. Approval of CalPERS Requirement for a Publicly Available Pay Schedule**f. Approval of Budget Amendment
D. Executive Director’s Report Larry Landauer 1. Annual Sufficiency of Allocation Report for Fiscal Year 2018-192. Operations Report – October 2018**3. Operations Report – November 2018**4. Performance Contract – October 2018**5. Performance Contract – November 2018**6. Employment Update7. Fairview Developmental Center8. Housing Update
Marta Vasquez
Arturo Cazares Mary Carlson Jack Stanton
E. Community Forum*** Alan Martin F. Executive Committee Alan Martin G. Board Recruitment and Training Committee** Alan Martin H. Policies and Outcomes Committee Cliff Amsden I. Vendor Advisory Committee** Tiffany Bauer
1. Approval of Marie Sañudo as Co-Chair of the Vendor Advisory Committee**J. Peer Advisory Committee** Sylvia Delgado
K. Legislative and Community Awareness Committee Liza Krassner
L. ARCA Report Liza Krassner M. Chairperson’s Report Alan Martin
IV. Adjournment Alan Martin
*All items on the Consent Calendar will be approved by one motion, and there will be no discussion on individual items unless a Boardmember or a member of the public requests that a specific item be pulled from the Consent Calendar for separate discussion and possibleaction.**Attachments for Board members in Board packet.***This is an opportunity for the public to comment on issues of interest. Speakers should complete the "Request to Speak" form locatedat the entrance to the meeting room and return the form to the Recording Secretary. Each person's presentation is limited to a maximumof five minutes.

Regional Center of Orange County Board of Directors’ Meeting
November 1, 2018 Minutes
Board Members Present: Alan Martin, Chairperson
Cliff Amsden Marcell Bassett Tiffany Bauer Sylvia Delgado Amy Jessee Liza Krassner Hilda Mendez John “Chip” Wright
Board Members Absent: Cristina Alba
Peter Kuo Corporate Counsel Absent: David Lester, Esq.
I. General Session Mr. Alan Martin called the meeting to order at 6:02 p.m.
A. Pledge of Allegiance/Reading of RCOC’s Mission and Vision Statement
Ms. Amy Jessee led attendees in a recitation of the Pledge of Allegiance. Ms. Sylvia Delgado then read RCOC’s Mission and Vision Statement.
B. Budget and Finance Committee Mr. Chip Wright reported that the Committee met, reviewed and recommends for approval all items on the consent calendar. The Committee also discussed hiring, turnover and caseload ratios.
C. Consent Calendar
1. Approval of Board of Directors’ Minutes for September 6, 2018
2. Budget and Finance Committee
a. Approval of Monthly Sufficiency of Allocation Report, August 2018
b. Approval of Monthly Sufficiency of Allocation Report, September 2018
M/S/C to approve the consent calendar as presented.

RCOC Board of Directors’ Meeting Minutes November 1, 2018
Page 2 of 6
D. Executive Director’s Report
Mr. Larry Landauer presented for approval the Calendar Year 2019 Performance Contract. 1. Approval of Calendar Year 2019 Performance Contract
M/S/C to approve the Calendar Year 2019 Performance Contract, as presented.
Mr. Landauer presented for approval the Request for Waiver of Potential Conflict of Interest and Conflict Resolution Plan for Ms. Angela Guzman, Service Coordinator. 2. Approval of Request for Waiver of Potential Conflict of Interest and Conflict
Resolution Plan for Angela Guzman, Service Coordinator
M/S/C to approve the Request for Waiver of Potential Conflict of Interest and Conflict Resolution Plan for Angela Guzman, Service Coordinator, as presented.
Mr. Landauer gave his Executive Director’s Report, which included the following highlights: • Statewide News. Mr. Landauer shared that staff from the Office of the Inspector
General, U.S. Department of Health and Human Services, will be visiting California. The visit appears to be related to significant incidents with a vendor that does not provide services in Orange County. Mr. Landauer reported that the Departmental of Developmental Services (DDS) is visiting all the Regional Centers to discuss enhancing their risk management system. The risk management review is related to Special Incident Reporting and the many variances in the Regional Center system. Mr. Landauer also reported that the annual Sufficiency of Allocation Report (SOAR) is due to DDS on December 10, 2018.
• Purchase of Service (POS) Expenditures for Fiscal Year 2017-18. Mr. Landauer
reported that the regional center system is projecting a surplus between $67.7 and $58.1 million. Mr. Landauer added that RCOC’s caseload grew by 4% or 821 individuals.
• Person Centered Thinking (PCT). Mr. Patrick Ruppe, RCOC’s Director of Services
and Supports, reported that the beta version of the PCT Individual Program Plan (IPP) was released to all Service Coordinators last month. Over 164 PCT IPPs have been developed and the goal is to have one for all persons served by June 30, 2019, which is the end of this fiscal year.
Mr. Ruppe reported that vendors have sent 151 of their employees to the two-day Person Centered Thinking (PCT) training. In 2019, Mr. Ruppe stated that PCT trainings for vendors will continue but PCT training for families has been delayed and he will provide the Committee with training dates as they are scheduled.

RCOC Board of Directors’ Meeting Minutes November 1, 2018
Page 3 of 6
Mr. Ruppe extended an invitation to the Board to attend PCT training with the Self-Determination Program Local Advisory Committee on Monday, December 3, 2018, at 6:00 p.m. at RCOC. Any Board Members who are interested in attending the training may sign up with Mr. Ruppe after the meeting.
• Employment. Mr. Arturo Cazares, RCOC’s Associate Director of Employment, reported that as of October 2018, there are 161 persons served in work activity programs and that number will continue to decrease while the number of persons served in Competitive Integrated Employment (CIE) has increased to 2,534. Mr. Cazares also reported on Project SEARCH, whose primary objective is to secure competitive employment for people with disabilities. The University of California, Irvine Medical Center will be holding their first graduation for their program participants. Additionally, Kaiser Permanente in Anaheim has received a donation of over $16,000 from Behr Paint and will launch their first program in spring 2019.
• Fairview Developmental Center. Mr. Landauer reported that in October 2018, he
attended his fifth legislative briefing regarding the closure of Fairview Developmental Center (FDC). Mr. Landauer stated that the persons served who have transitioned from FDC to the newly renovated homes in the community are doing well.
• Legislative and Community Awareness. Mr. Landauer reported that Governor
Brown has signed Senate Bill 134, which was sponsored by the Service Employees International Union (SEIU). It will require a listing of salaries, wages, and employee benefits for all managerial positions for which the primary purpose is the administrative management of the regional center, including, but not limited to, directors and chief executive officers. It also includes procedures for employee retention if a contract between the State Department of Developmental Services and a private nonprofit association for the operation of a regional center is entered into or renewed on and after January 1, 2019.
Ms. Anh Nguyen, RCOC’s Consultant, reported that social media continues to be a successful tool for reaching out to the community, sharing activities and promoting RCOC in general. Mr. Landauer also reviewed media highlights featuring RCOC’s persons served.
• RCOC News. Mr. Landauer reported that Ms. Tiffany Bauer and he attended a joint
meeting of the Southern California Regional Center Directors and the Los Angeles Coalition of Service Providers at Harbor Regional Center on September 13, 2018. Vendor rates were the focus for this meeting. Mr. Landauer stated that due to the dire need for higher rates, they developed a petition for an 8% increase in providers’ rates next fiscal year. Mr. Landauer mentioned that Mr. Alan Martin, Ms. Liza Krassner and he attended RCOC’s Biennial Breakfast of Business Champions on October 12, 2018. RCOC’s business champions include Corner Bakery, Del Taco in Tustin, Panera in Brea and Staples in Rancho Santa Margarita.

RCOC Board of Directors’ Meeting Minutes November 1, 2018
Page 4 of 6
• Self-Determination. Mr. Landauer reported that on October 1, 2018, DDS selected
from the approximately 500 persons who enrolled, 151 persons to participate in the Self-Determination Program for Orange County. Mr. Landauer mentioned that RCOC has held over 21 Self-Determination meetings since September 2015, and the Annual Self-Determination Conference was held at Integrity House on Saturday, October 13, 2018.
• Wish Tree Holiday Gift Giving Program. Mr. Ruppe mentioned that RCOC is
holding their annual gift giving program for persons served. Wish Tree cards are available to everyone who would like to donate. Board Members who would like to participate may obtain a card from Mr. Ruppe after the meeting.
E. Community Forum
There were no speakers for community forum.
F. Executive Committee Mr. Martin stated that the Committee approved the recommendations for approval of Board membership for Ms. Meena Chockalingam Bedekar, Mr. Fernando Peña and Ms. Mine Hagen. Mr. Martin reported that the Committee’s next meeting is scheduled for Monday, November 19, 2018.
G. Board Recruitment and Training Mr. Martin presented and recommended for approval three individuals for Board membership. 1. Approval of Board Membership for Meena Chockalingam Bedekar for a New One-
Year Term Commencing January 1, 2019 and Ending December 31, 2019
M/S/C to approve Board Membership for Meena Chockalingam Bedekar for a New One-Year Term Commencing January 1, 2019 and Ending December 31, 2019.
2. Approval of Board Membership for Fernando Peña for a New One-Year Term Commencing January 1, 2019 and Ending December 31, 2019
M/S/C to approve Board Membership for Fernando Peña for a New One-Year Term Commencing January 1, 2019 and Ending December 31, 2019.
3. Approval of Board Membership for Mine Hagen for a New One-Year Term Commencing January 1, 2019 and Ending December 31, 2019
M/S/C to approve Board Membership for Mine Hagen for a New One-Year Term Commencing January 1, 2019 and Ending December 31, 2019.
RCOC Board of Directors’ Meeting Minutes November 1, 2018
Page 5 of 6
H. Policies and Outcomes Committee
Mr. Cliff Amsden presented revisions to two policies as recommended by the Policies and Outcomes Committee.
1. Approval of Revisions to the Conflict of Interest Policy
M/S/C to approve revisions to the Conflict of Interest Policy as recommended.
2. Approval of Revisions to the Zero Tolerance Policy Regarding Abuse and Neglect of Those We Serve
M/S/C to approve revisions to the Zero Tolerance Policy Regarding Abuse and Neglect of Those We Serve as recommended.
The next Policies and Outcomes Committee meeting is scheduled for Tuesday, February 19, 2019.
I. Vendor Advisory Committee
Ms. Tiffany Bauer reported that the Vendor Advisory Committee (VAC) met on October 9, 2018. Ms. Bauer presented two agenda items. 1. Resignation of Mark Antenucci as Co-Chair of the Vendor Advisory Committee
Ms. Bauer reported that Mr. Antenucci has resigned as Co-Chair of VAC; she thanked him for his many years of service to VAC.
2. Approval of Vendor Advisory Committee Members Marie Sañudo as Chair of AFHA/FFA Subcommittee and Tim Chervenak as Co-Chair of Habilitation Subcommittee
M/S/C to approve Marie Sañudo as Chair of AFHA/FFA Subcommittee and Tim Chervenak as Co-Chair of Habilitation as recommended.
J. Peer Advisory Committee
Ms. Sylvia Delgado reported that the Committee last met on October 17, 2018. At this meeting, representatives from In-Home Supportive Services (IHSS) presented on the various IHSS programs which help pay for services provided to low-income elderly, blind or disabled individuals, including children in their own homes. Ms. Delgado also reported that the Committee agreed to donate toys to RCOC’s Family Resource Center’s holiday toy collection. The Committee is also considering organizing a year-round food drive with the Orange County Rescue Mission. A representative from the Orange County Rescue Mission will be meeting with the Committee next year.

RCOC Board of Directors’ Meeting Minutes November 1, 2018
Page 6 of 6
The next PAC meeting is scheduled for Wednesday, November 21, 2018.
K. Legislative and Community Awareness Report
Ms. Liza Krassner reported on the Committee’s continuing efforts to inform the community about RCOC’s services.
The next Committee meeting is scheduled for January 8, 2019.
L. ARCA Report
Ms. Krassner reported that the ARCA Board Delegates Committee met on October 18-19, 2018, in San Diego. The Committee focused on its strategic planning for the upcoming year.
M. Chairperson’s Report Mr. Martin reported that the Board held their training on Virtual Chart on Thursday, October 4, 2018. Mr. Martin stated that this is the last public Board meeting in 2018 and thanked everyone for their time and efforts throughout the year.
II. Adjournment
Mr. Martin adjourned the meeting at 6:51 p.m.
Sylvia Delgado, Secretary Recorder: Sandra Lomelí

Regional Center of Orange County Budget and Finance Committee
Minutes November 1, 2018
Committee Members Present: John “Chip” Wright, Chair Cliff Amsden
Marcell Bassett Amy Jessee
Other Board Members Present: Sylvia Delgado RCOC Staff Present: Bette Baber, Chief Financial Officer
Larry Landauer, Executive Director Arturo Cazares, Associate Director Employment Veronica Flores, Accounting Manager Patrick Ruppe, Director of Services and Supports Marta Vasquez, Associate Finance Director Stacy Wong, HR Director
The meeting was called to order at 4:02 p.m.
1. Approval of Monthly Sufficiency of Allocation Reports (SOARs) August and September 2018 Ms. Bette Baber, Mr. Larry Landauer and Ms. Marta Vasquez discussed the process for developing the annual Sufficiency of Allocation Report which is due to the Department of Developmental Services on December 10, 2018. M/S/C to approve the monthly SOARs.
Other discussion items included the fiscal impact of the increase in the minimum hourly wage effective January 1, 2019. Ms. Baber distributed a summary of the California minimum wage increases through January 1, 2023, when the minimum hourly wage in California will be $15.00 for all employers. Employers with 26 or more employees will pay $15.00 per hour effective January 1, 2022. The increase in the minimum hourly wage also increases the minimum exempt salary which must be double the minimum hourly wage. The rising cost of benefits, hiring of Service Coordinators and caseload ratios were also discussed.
The meeting adjourned at 4:42 p.m.

REGIONAL CENTER OF ORANGE COUNTY BOARD OF DIRECTORS AGENDA ITEM DETAIL SHEET _____________________ ACTION___X___ ACTION/CONSENT_______ DISCUSSION_______ INFO ONLY_______ _____________________ DATE: January 10, 2019 TO: RCOC Board of Directors FROM: Budget and Finance Committee SUBJECT: Approval of Monthly Sufficiency of Allocation Report, October 2018 BACKGROUND: Staff presents the monthly sufficiency of allocation report to the
Budget and Finance Committee for review and approval. This committee then presents the statement to the Board.
REASON FOR CURRENT ITEM: The Board has a responsibility to monitor the Center's financial
status. FISCAL IMPACT: None. RECOMMENDATION: That the Board approve the monthly sufficiency of allocation
report as presented. Agenda Item III.C.-2.a.

REGIONAL CENTER OF ORANGE COUNTY M E M O R A N D U M Date: January 2, 2019 To: Board of Directors From: Budget and Finance Committee Subject: Highlights – October 2018 Sufficiency of Allocation Report (SOAR) ______________________________________________________________________________ Purchase of Service (POS) RCOC reported a projected deficit of $13.3 million to the Department of Developmental Services (DDS) on December 10, 2018. The projected deficit will be $3.7 million if all $9.6 million of the State Plan Amendment receivables are paid. As reported in the prior fiscal year, the increase in expenditures is due primarily to higher rates. The planning allocation for the current fiscal year included $6.5 million in continuation costs for the minimum wage increase effective January 1, 2018. The California minimum wage will increase again on January 1, 2019, from $11.00 to $12.00; and, RCOC has estimated that rates will increase by approximately $2.8 million in this fiscal year. As in the prior fiscal years, RCOC has a large number of persons served (490) who will graduate from school to regional center-funded adult day programs. RCOC’s caseload growth in fiscal year 2017-18 was 4.0%, an increase of 821 persons. To date in the current fiscal year, RCOC’s caseload grew by 180 persons, for an annualized caseload growth of 2.0%. The regional center system grew by 5,810 persons for an annualized caseload growth of 4.3%. Operations RCOC will be within budget for both Operating Expense and Personal Services.

REGIONAL CENTER OF ORANGE COUNTY Page 1
Monthly Sufficiency of Allocation ReportAs of October 31, 2018
A B C D E F G H
SOAR VARIANCEACTUAL PROJECTED PROJECTED (column A-D)/A) (column A-D) CHANGE
E-1 SPENT EXPENDITURES EXPENDITURES % AMOUNT FROM PRIOR SPENTPURCHASE OF SERVICE ALLOCATION YEAR TO DATE AT "RUN RATE" (12/10/2018) YEAR TO DATE MO. REPORTED PRIOR YEAR
(1) Licensed Residential Care $84,672,599 $28,540,132 $85,620,396 $88,894,358 -5% -4,221,759 $0 $81,676,201(2) Day Care 3,170,041 929,767 2,789,301 3,170,041 0% 0 0 2,897,829(3) Day Training 60,119,981 20,084,942 60,254,826 63,224,563 -5% -3,104,582 0 57,261,065(4) Habilitation 9,738,008 3,220,880 9,662,640 9,738,008 0% 0 0 9,894,373(5) Transportation 16,648,222 4,352,799 13,058,397 16,648,222 0% 0 0 15,430,698(6) Respite 25,322,696 8,275,964 24,827,892 27,151,720 -7% -1,829,024 0 22,978,026(7) Supported Living 39,155,997 13,122,004 39,366,012 39,155,997 0% 0 0 39,054,896(8) Non-medical 20,510,033 5,776,414 17,329,242 20,510,033 0% 0 0 26,196,596(9) Medical 4,561,718 1,545,955 4,637,865 4,561,718 0% 0 0 4,494,303(10) Other 82,661,995 26,010,814 78,032,442 86,831,468 -5% -4,169,473 0 68,470,737(11) Early Start (Age 0-3) 28,488,628 9,524,537 28,573,611 28,488,628 0% 0 0 27,200,551(12) Community Placement Plan 2,281,246 59,877 179,631 2,281,246 0% 0 0 323,538
(13) Purchase of Service Total 377,331,164 121,444,085 364,332,255 390,656,002 -4% -13,324,838 0 355,878,813
OPERATIONS -$3,722,896 ** If all SPA receivables are paid.
(14) Operating Expense (Gross) 7,600,000 2,447,949 7,343,848 7,600,000 0% 0 0 5,938,064(15) Less Interest Income and SPA Fees -300,000 -100,321 -300,963 -300,000 0% 0 0 -316,413
(16) Operating Expense (Net)** 7,300,000 2,347,628 7,042,885 7,300,000 0% 0 0 5,621,651
(17) Personal Services** 38,166,107 11,702,569 35,107,706 38,166,107 0% 0 0 33,670,792
(18) Family Resource Center 140,397 24,243 72,730 140,397 0% 0 0 106,705
(20) Operations Total 45,606,504 14,074,440 42,223,321 45,606,504 0% 0 0 39,399,148
(21) Total $422,937,668 $135,518,525 $406,555,576 $436,262,506 0% -$13,324,838 $0 $395,277,961
* State Plan Amendment (SPA). Regional centers pay the Day Program and Transportation expenditures for persons who live in Intermediate Care Facilities (ICFs); DDS pays ICFs; ICFs pay regional centers.

Page 2STATEMENT OF ASSETS, LIABILITIES AND FUND BALANCES
AS OF OCTOBER 31, 2018
ASSETS GENERAL FUND CUSTODIAL FUND
CURRENT ASSETS
Petty cash $300.00Checking 8,307,769.18Savings 13,562.79 $711,602.08Money market 0.00Payroll 172,676.64Donations 95,184.17Unemployment 385,994.56Certificate of deposit 0.00
-------------------------- --------------------------Total current assets 8,975,487.34 711,602.08
-------------------------- --------------------------RECEIVABLES
State claim 67,050,005.34Client support revenue 212,807.08 23,463.81Due from State - prior years 73,763,451.65Due from ICF - ICF Supplemental Services 8,164,850.74
-------------------------- --------------------------Total receivables 149,191,114.81 23,463.81
-------------------------- --------------------------PREPAID ITEMS
Deposits 342,375.88Prepaid expense 0.00
-------------------------- --------------------------Total prepaid items 342,375.88 0.00
-------------------------- --------------------------OTHER ASSETS
Tenant improvements 715,823.45Building acquisition 63,613.98
-------------------------- --------------------------Total other assets 779,437.43 0.00
-------------------------- --------------------------TOTAL ASSETS $159,288,415.46 $735,065.89
================ ================LIABILITIES AND FUND BALANCES
LIABILITIES
Accounts payable $18,421,207.29 $212,807.08Due to State - ICF Supplemental Services 52,522.57Loans payable 0.00Cash advance 140,333,506.87Unemployment insurance 385,994.56
-------------------------- --------------------------Total liabilities 159,193,231.29 212,807.08
-------------------------- --------------------------FUND BALANCES
General 0.00Donations 95,184.17Custodial 522,258.81
-------------------------- --------------------------TOTAL LIABILITIES AND FUND BALANCES $159,288,415.46 $735,065.89
================ ================
Page 3
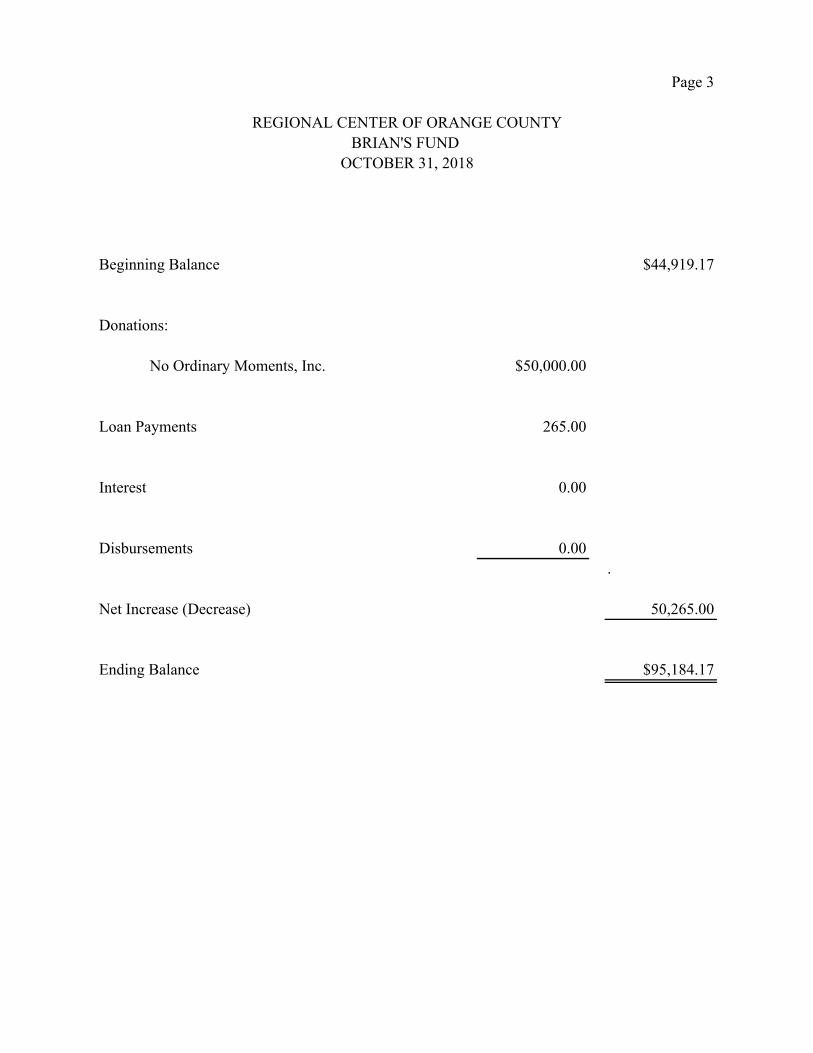
REGIONAL CENTER OF ORANGE COUNTYBRIAN'S FUND
OCTOBER 31, 2018
Beginning Balance $44,919.17
Donations:
No Ordinary Moments, Inc. $50,000.00
Loan Payments 265.00
Interest 0.00
Disbursements 0.00.
Net Increase (Decrease) 50,265.00
Ending Balance $95,184.17

REGIONAL CENTER OF ORANGE COUNTY BOARD OF DIRECTORS AGENDA ITEM DETAIL SHEET _____________________ ACTION___X___ ACTION/CONSENT_______ DISCUSSION_______ INFO ONLY_______ _____________________ DATE: January 10, 2019 TO: RCOC Board of Directors FROM: Budget and Finance Committee SUBJECT: Approval of Monthly Sufficiency of Allocation Report, November 2018 BACKGROUND: Staff presents the monthly sufficiency of allocation report to the
Budget and Finance Committee for review and approval. This committee then presents the statement to the Board.
REASON FOR CURRENT ITEM: The Board has a responsibility to monitor the Center's financial
status. FISCAL IMPACT: None. RECOMMENDATION: That the Board approve the monthly sufficiency of allocation
report as presented. Agenda Item III.C.-2.b.

REGIONAL CENTER OF ORANGE COUNTY M E M O R A N D U M Date: January 2, 2019 To: Board of Directors From: Budget and Finance Committee Subject: Highlights – November 2018 Sufficiency of Allocation Report (SOAR) ______________________________________________________________________________ Purchase of Service (POS) RCOC reported a projected deficit of $13.3 million to the Department of Developmental Services (DDS) on December 10, 2018. The projected deficit will be $3.7 million if all $9.6 million of the State Plan Amendment receivables are paid. As reported in the prior fiscal year, the increase in expenditures is due primarily to higher rates. The planning allocation for the current fiscal year included $6.5 million in continuation costs for the minimum wage increase effective January 1, 2018. The California minimum wage will increase again on January 1, 2019, from $11.00 to $12.00; and, RCOC has estimated that rates will increase by approximately $2.8 million in this fiscal year. As in the prior fiscal years, RCOC has a large number of persons served (490) who will graduate from school to regional center-funded adult day programs. RCOC’s caseload growth in fiscal year 2017-18 was 4.0%, an increase of 821 persons. To date in the current fiscal year, RCOC’s caseload grew by 180 persons, for an annualized caseload growth of 2.0%. The regional center system grew by 5,810 persons for an annualized caseload growth of 4.3%. Operations RCOC will be within budget for both Operating Expense and Personal Services.

REGIONAL CENTER OF ORANGE COUNTY Page 1
Monthly Sufficiency of Allocation Report
As of November 30, 2018
A B C D E F G H
SOAR VARIANCEACTUAL PROJECTED PROJECTED (column A-D)/A) (column A-D) CHANGE
E-1 SPENT EXPENDITURES EXPENDITURES % AMOUNT FROM PRIOR SPENTPURCHASE OF SERVICE ALLOCATION YEAR TO DATE AT "RUN RATE" (12/10/2018) YEAR TO DATE MO. REPORTED PRIOR YEAR
(1) Licensed Residential Care $84,672,599 $34,841,521 $85,400,883 $88,894,358 -5% -4,221,759 $0 $81,676,201(2) Day Care 3,170,041 1,087,773 2,676,081 3,170,041 0% 0 0 2,897,829(3) Day Training 60,119,981 23,760,938 60,763,730 63,224,563 -5% -3,104,582 0 57,261,065(4) Habilitation 9,738,008 3,381,900 9,669,366 9,738,008 0% 0 0 9,894,373(5) Transportation 16,648,222 4,450,602 13,351,806 16,648,222 0% 0 0 15,430,698(6) Respite 25,322,696 8,275,964 24,827,892 27,151,720 -7% -1,829,024 0 22,978,026(7) Supported Living 39,155,997 16,207,136 39,307,114 39,155,997 0% 0 0 39,054,896(8) Non-medical 20,510,033 6,258,018 18,774,054 20,510,033 0% 0 0 26,196,596(9) Medical 4,561,718 1,888,258 4,629,487 4,561,718 0% 0 0 4,494,303(10) Other 82,661,995 26,090,461 78,271,383 86,831,468 -5% -4,169,473 0 68,470,737(11) Early Start (Age 0-3) 28,488,628 11,152,531 28,807,734 28,488,628 0% 0 0 27,200,551(12) Community Placement Plan 2,281,246 93,605 19,017 2,281,246 0% 0 0 323,538
(13) Purchase of Service Total 377,331,165 137,488,707 366,498,547 390,656,002 -4% -13,324,837 0 355,878,813
OPERATIONS -$3,722,895 ** If all SPA receivables are paid.
(14) Operating Expense (Gross) 7,600,000 2,923,965 7,017,517 7,600,000 0% 0 0 5,938,064(15) Less Interest Income and SPA Fee -300,000 -132,077 -316,985 -300,000 0% 0 0 -316,413
(16) Operating Expense (Net)** 7,300,000 2,791,888 6,700,532 7,300,000 0% 0 0 5,621,651
(17) Personal Services** 38,166,107 15,385,107 36,924,256 38,166,107 0% 0 0 33,670,792
(18) Family Resource Center 140,397 25,822 61,973 140,397 0% 0 0 106,705
(20) Operations Total 45,606,504 18,202,817 43,686,761 45,606,504 0% 0 0 39,399,148
(21) Total $422,937,669 $155,691,524 $410,185,308 $436,262,506 0% -$13,324,837 $0 $395,277,961
* State Plan Amendment (SPA). Regional centers pay the Day Program and Transportation expenditures for persons who live in Intermediate Care Facilities (ICFs); DDS pays ICFs; ICFs pay r** Due to later payment dates, the Spent Year to Date amount (column B) for line items 5 through 10 is approximately one month less than expenditures for Residential Care and Day Training.

Page 2STATEMENT OF ASSETS, LIABILITIES AND FUND BALANCES
AS OF NOVEMBER 30, 2018
ASSETS GENERAL FUND CUSTODIAL FUND
CURRENT ASSETS
Petty cash $300.00Checking 30,212,965.93Savings 88,320.73 $672,099.09Money market 0.00Payroll 173,757.84Donations 84,282.51Unemployment 381,319.62Certificate of deposit 0.00
-------------------------- --------------------------Total current assets 30,940,946.63 672,099.09
-------------------------- --------------------------RECEIVABLES
State claim 68,372,418.65Client support revenue 210,790.90 34,158.14Due from State - prior years 74,405,706.43Due from ICF - ICF Supplemental Services 7,549,389.55
-------------------------- --------------------------Total receivables 150,538,305.53 34,158.14
-------------------------- --------------------------PREPAID ITEMS
Deposits 342,375.88Prepaid expense 0.00
-------------------------- --------------------------Total prepaid items 342,375.88 0.00
-------------------------- --------------------------OTHER ASSETS
Tenant improvements 715,823.45Building acquisition 63,613.98
-------------------------- --------------------------Total other assets 779,437.43 0.00
-------------------------- --------------------------TOTAL ASSETS $182,601,065.47 $706,257.23
================ ================LIABILITIES AND FUND BALANCES
LIABILITIES
Accounts payable $19,636,176.90 $210,790.90Due to State - ICF Supplemental Services 52,522.57Loans payable 0.00Cash advance 162,446,763.87Unemployment insurance 381,319.62
-------------------------- --------------------------Total liabilities 182,516,782.96 210,790.90
-------------------------- --------------------------FUND BALANCES
General 0.00Donations 84,282.51Custodial 495,466.33
-------------------------- --------------------------TOTAL LIABILITIES AND FUND BALANCES $182,601,065.47 $706,257.23
================ ================

Page 3
REGIONAL CENTER OF ORANGE COUNTYBRIAN'S FUND
NOVEMBER 30, 2018
Beginning Balance $95,184.17
Donations:
Accredited Nursing Facitlity $750.00Network for Good 203.10
Subtotal Donations $953.10
Loan Payments 105.00
Interest 0.00
Disbursements:
Rent deposits -1,080.00Moving expenses -250.00Refrigerator -604.76Notary -25.00Wish Tree Gift Cards -10,000.00
Subtotal Disbursements -11,959.76.
Net Increase (Decrease) -10,901.66
Ending Balance $84,282.51
REGIONAL CENTER OF ORANGE COUNTY BOARD OF DIRECTORS
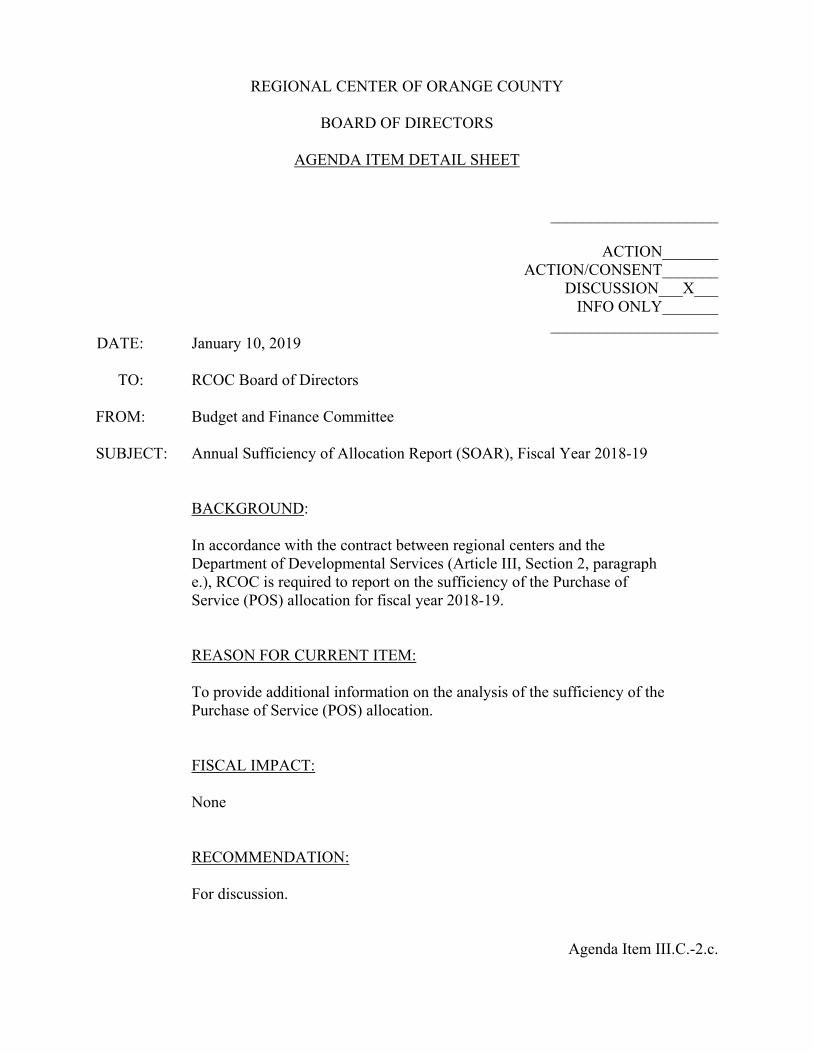
AGENDA ITEM DETAIL SHEET _____________________ ACTION_______ ACTION/CONSENT_______ DISCUSSION___X___ INFO ONLY_______ _____________________
DATE: January 10, 2019 TO: RCOC Board of Directors
FROM: Budget and Finance Committee
SUBJECT: Annual Sufficiency of Allocation Report (SOAR), Fiscal Year 2018-19 BACKGROUND: In accordance with the contract between regional centers and the
Department of Developmental Services (Article III, Section 2, paragraph e.), RCOC is required to report on the sufficiency of the Purchase of Service (POS) allocation for fiscal year 2018-19.
REASON FOR CURRENT ITEM: To provide additional information on the analysis of the sufficiency of the
Purchase of Service (POS) allocation. FISCAL IMPACT: None RECOMMENDATION: For discussion. Agenda Item III.C.-2.c.

Number of Months Claimed: 4Date of POS Payments Cut-Off: October 31, 2018 REPORT DATE: December 10, 2018
Actual Expenditures through October 2018
CURRENT MONTH PRIOR MONTH CHANGES
High Estimate Low Estimate High Estimate Low Estimate High Estimate Low EstimateNON-CPP EXPENDITURESEstimated Cost of Current Services $383,314,101 $383,314,101 N/A N/AEstimated Growth $5,060,655 $2,530,327 N/A N/AOther Items may include, but are not limited to:
1. Adjustment for SSI CCF Rate N/A N/A2. One time adjustment of base N/A N/A3. Deduct estimated receipts from ICFs for S -9,601,942 -9,601,942 N/A N/A4. SSI/SSP Restoration (Not Yet Paid) N/A N/A5. N/A N/A6. N/A N/A7. 0 08. 0 09. 0 0
10. 0 0
TOTAL ESTIMATED EXPENDITURES $378,772,814 $376,242,486 $0 $0 N/A N/A
388,374,756CPP POS EXPENDITURESEstimated Cost of Current Services $352,245 $352,245 $0 $0 352,245 352,245Estimated Growth $0 $0 $0 $0 0 0Other Items: Additional estimated costs not included in the expenditures listed on row 27 and 28. (Current & Projected Costs)
1. 0 02. 0 03. 0 0
4. 0 0
5. 0 0TOTAL ESTIMATED EXPENDITURES $352,245 $352,245 $0 $0 352,245 352,245
1/3/2019 16:17
REGIONAL CENTER OF ORANGE COUNTY
POS EXPENDITURE PROJECTION (PEP) SUMMARY2018-2019

REGIONAL CENTER: REGIONAL CENTER OF ORANGE COUNTY Number of Months 4FISCAL YEAR: 2018-2019NO. OF MONTHS CLAIMED: 4
NON-CPP EXPENDITURES
Column 1 Column 2 Column 3 Column 4 Column 5 Column 6 Column 7 Column 8 Column 9 Column 10 Column 11
Expended YTD Late Bills # of Consumers
# of Mos/Days to End Of Year
(EOY)Rate
Projected Costs for Current
Consumers
Estimated Cost of Current Services
Estimated Growth
Estimated Growth
Jul-Oct Nov-Jun HIGH LOWOUT-OF-HOME CARECommunity Care Facilities $28,062,434 $89,064 2,000 8 $3,649 $58,384,000 $86,535,498 4 0.0% $460,416 $230,208ICF/SNF Facilities $449,964 $22,400 12 8 $14,855 $1,426,080 $1,898,444 0 0.0% $0 $0
Total Out-of-Home Care $28,512,398 $111,464 $59,810,080 $88,433,942 $460,416 $230,208
DAY PROGRAMSDay Care $929,767 $113,682 208 8 $1,278 $2,126,592 $3,170,041 0 0.0% $0 $0Day Training $27,002,716 $926,618 6,469 166 $52 $55,840,408 $83,769,742 41 0.0% $1,610,800 $805,400Supported Employment 950-SEP Group $1,853,472 $0 275 8 $1,640 $3,608,000 $5,461,472 0 0.0% $0 $0 952-SEP Placement $806,378 $73,367 457 8 $476 $1,740,256 $2,620,001 0 0.0% $0 $0Work Activity Program 954-WAP $410,536 $83,999 250 8 $581 $1,162,000 $1,656,535 0 0.0% $0 $0
Total Day Programs $31,002,869 $1,197,666 $64,477,256 $96,677,791 41 $0 $1,610,800 $805,400
OTHER SERVICESNon-Medical: Professional $3,663,873 $684,570 1,681 8 $785 $10,556,680 $14,905,123 0 0.0% $0 $0Non-Medical: Programs 2,378,087 70,042 347 8 1,838 5,102,288 7,550,417 19 0.0% 1,282,560 641,280Home Care: Programs 15,476 0 2 8 1,973 31,568 47,044 0 0.0% 0 0Transportation 4,080,092 1,375,263 5,391 8 230 9,919,440 15,374,795 51 0.0% 422,400 211,200Transportation Contracts 273,875 0 144 8 501 577,152 851,027 0 0.0% 0 0Prevention 2,370 0 1 8 450 3,600 5,970 0 0.0% 0 0Other-Comm. Activity Services 063 9,767,008 0 950 8 2,753 20,922,800 30,689,808 13 0.0% 1,284,480 642,240Other-SSI/SSP Restoration 065 129,083 0 453 8 57 206,568 335,651 0 0.0% 0 0Other-SLS 896 12,804,509 0 464 8 7,099 26,351,488 39,155,997 0 0.0% 0 0Other Authorized Services 15,959,938 1,521,281 1,076 8 4,062 34,962,438 52,443,657 0 0.0% 0 0Personal and Incidentals 233,914 0 229 8 201 368,232 602,146 0 0.0% 0 0Hospital Care 741,180 0 6 8 32,851 1,576,848 2,318,028 0 0.0% 0 0Medical Equipment 12,857 0 39 8 50 15,600 28,457 0 0.0% 0 0Medical Service: Professional 1,468,303 0 1,103 8 362 3,194,288 4,662,591 0 0.0% 0 0Medical Service: Programs 648,038 36,891 142 8 1,228 1,395,008 2,079,937 0 0.0% 0 0Respite: In Own Home 8,237,660 1,148,243 3,592 8 613 17,615,168 27,001,071 0 0.0% 0 0Respite: Out of Home 58,297 0 12 8 962 92,352 150,649 0 0.0% 0 0Camps 0 0 0 8 0 0 0 0 0.0% 0 0
Total Other Services 60,474,560 4,836,290 $132,891,518 $198,202,368 83 0% $2,989,439 $1,494,720
TOTAL POS 119,989,827 6,145,420 257,178,854 383,314,101 125 0% 5,060,655 2,530,327
.
C:\Users\bbaber\Documents\[Monthly PEP 2018-19 New Format Due December 10.xlsx]Non-CPP
1/3/2019 16:17
Consumer Growth/Mo.
Growth Variance, Enter % of
Regional Centers may opt to use a different reasonable methodology to calculate Estimated Growth

REGIONAL CENTER: REGIONAL CENTER OF ORANGE COUNTYFISCAL YEAR: 2018-2019NO. OF MONTHS CLAIMED: 4
CPP EXPENDITURESColumn 1 Column 2 Column 3 Column 4 Column 5 Column 6 Column 7
Expended YTD Late BillsProjected Costs
for Current consumers
Jul-Oct Nov-JunOUT-OF-HOME CARECommunity Care Facilities $49,240 $0 2 8 $16,864.00 269,824 319,064ICF/SNF Facilities 0 0 0 8 0 0
Total Out-of-Home Care $49,240 $0 $269,824 $319,064
DAY PROGRAMSDay Care $0 $0 0 8 $0 $0Day Training 0 0 0 166 0 0Supported Employment 950-SEP Group 0 0 0 8 0 0 952-SEP Placement 0 0 0 8 0 0Work Activity Program 954-WAP 0 0 0 8 0 0
Total Day Programs $0 $0 $0 $0
OTHER SERVICESNon-Medical: Professional $0 $0 0 8 $0 $0Non-Medical: Programs 0 0 0 8 0 0Home Care: Programs 0 0 0 8 0 0Transportation 0 0 0 8 0 0Transportation Contracts 972 0 1 8 $233.00 1,864 2,836Prevention 0 0 0 8 0 0Other Services 9,665 0 1 8 $2,585.00 20,680 30,345Personal and Incidentals 0 0 0 8 0 0Hospital Care 0 0 0 8 0 0Medical Equipment 0 0 0 8 0 0Medical Service: Professional 0 0 0 8 0 0Medical Service: Programs 0 0 0 8 0 0Respite: In Own Home 0 0 0 8 0 0Respite: Out of Home 0 0 0 8 0 0Camps 0 0 0 8 0 0
Total Other Services $10,637 $0 $22,544 $33,181
TOTAL EXPENDITURES $59,877 $0 $292,368 $352,245
C:\Users\bbaber\Documents\[Monthly PEP 2018-19 New Format Due December 10.xlsx]CPP
1/3/19 4:17 PM
Rate Estimated Cost of Current Services
# of consumers
# of Mos/Days
to EOY

REGIONAL CENTER: REGIONAL CENTER OF ORANGE COUNTYFISCAL YEAR: 2018-2019NO. OF MONTHS CLAIMED 4
DAY PROGRAM EXPENDITURES: NON-CPP
Jul Aug Sep Oct Nov Dec Jan Feb Mar Apr May Jun Total
Day Programs1/ 1 1 2 2 1 1 8 Number of Consumers 6,469 6,664 6,440 5,672 POS Cost $6,700,650 $7,349,817 $6,219,586 $6,732,663 $27,002,716 POS Avg Cost $1,035.81 $1,102.91 $965.77 $1,187.00
Program Days 21 23 19 23 20 19 22 20 21 22 22 20 252
Avg Daily Cost $49.32 $47.95 $50.83 $51.61 $0.00 $0.00 $0.00 $0.00 $0.00 $0.00 $0.00 $0.00 YTD Avg Cost $48.64 $49.37 $49.93
Supported Employment Program, Group Services- 9501/
Number of Consumers 275 275 275 275 POS Cost $450,948 $493,459 $429,961 $479,104 $1,853,472 POS Avg Cost $1,639.81 $1,794.40 $1,563.49 $1,742.20
Program Days 21 23 19 23 20 19 22 20 21 22 22 20 252
Avg Daily Cost $78.09 $78.02 $82.29 $75.75 $0.00 $0.00 $0.00 $0.00 $0.00 $0.00 $0.00 $0.00 YTD Avg Cost $78.05 $79.46 $78.54
Supported Employment Program Individual Services- 9521/
Number of Consumers 440 449 449 318 POS Cost $218,691 $226,237 $213,888 $147,562 $806,378 POS Avg Cost $497.03 $503.87 $476.37 $464.03
Program Days 20 23 20 22 20 19 22 20 22 21 22 21 252
Avg Daily Cost $24.85 $21.91 $23.82 $21.09 $0.00 $0.00 $0.00 $0.00 $0.00 $0.00 $0.00 $0.00 YTD Avg Cost $23.38 $23.53 $22.92
Work Activity Program-954/2
Number of Consumers 263 250 168 49 POS Cost $152,869 $123,206 $92,463 $32,998 $401,536 POS Avg Cost $581.25 $492.82 $550.38 $673.43
21 23 19 22 20 20 21 19 21 22 22 20 250
Avg Daily Cost $27.68 $21.43 $28.97 $30.61 $0.00 $0.00 $0.00 $0.00 $0.00 $0.00 $0.00 $0.00 YTD Avg Cost $24.55 $26.02 $27.17
Transportation 65050 Number of Consumers 4,160 4,257 4,163 3,918 POS Cost $991,767 $1,078,087 $967,859 $1,042,379 $4,080,092 POS Avg Cost $238.41 $253.25 $232.49 $266.05
Program Days 21 23 19 23 20 19 22 20 21 22 22 20 252
Avg Daily Cost $11.35 $11.01 $12.24 $11.57 $0.00 $0.00 $0.00 $0.00 $0.00 $0.00 $0.00 $0.00
Program Days, Max Billing Days

REGIONAL CENTER: REGIONAL CENTER OF ORANGE COUNTYFISCAL YEAR: 2018-2019NO. OF MONTHS CLAIMED: 4
DAY PROGRAM EXPENDITURES: CPP ONLY
Jul Aug Sep Oct Nov Dec Jan Feb Mar Apr May Jun Total
Day Programs 1 1 2 2 1 1 8 Number of Consumers POS Cost $0 POS Avg Cost
Program Days 21 23 19 23 20 19 22 20 21 22 22 20 252
Avg Daily Cost YTD Avg Cost
Work Activity Program-954/2
Number of Consumers POS Cost $0 POS Avg Cost
Program Days 21 23 19 22 20 20 21 19 21 22 22 20 250
Avg Daily Cost YTD Avg Cost
1/The Program Days displayed are the number of business days for each month. This may need an adjustment to reflect the Vendor’s operational/non-operational days for Holidays properly.
2/Work Activity Program (WAP) Days displays the number of the maximum billing days noted on the WAP Billable days from 2018-19 letter. Title 17, section 58880 permits vendors to vary from this schedule as long as the vendors do not exceed the maximum of 250 billing days and the vendor sends a revised schedule to the Regional Center(s).

LATE BILLS
Jul-OctEnter the late bills either on this worksheet or directly on the Non-CPP and CPP worksheets. The data entered on the Late Bills worksheet automatically posts on the Non-CPP and CPP worksheets.
NON-CPP CPP
OUT-OF-HOME CARECommunity Care Facilities $89,064ICF/SNF Facilities 22,400
Total Out-of-Home Care $111,464 $0
DAY PROGRAMSDay Care 113,682Day Training 926,618Supported Employment 950-SEP Group 952-SEP Placement 73,367Work Activity Program 954-WAP 83,999
Total Day Programs $1,197,666 $0
OTHER SERVICESNon-Medical: Professional 684,570Non-Medical: Programs 70,042Home Care: ProgramsTransportation 1,375,263Transportation ContractsPreventionOther-Comm. Activity Services 063Other-SSI/SSP Restoration 065Other-SLS 896Other Services 1,521,281Personal and IncidentalsHospital CareMedical EquipmentMedical Service: ProfessionalMedical Service: Programs 36,891Respite: In Own Home 1,148,243Respite: Out of HomeCamps
Total Other Services $4,836,290 $0
TOTAL LATE BILLS $6,145,420 $0
C:\Users\bbaber\Documents\[Monthly PEP 2018-19 New Format Due December 10.xlsx]Late Bills
1/3/19 4:17 PM
REGIONAL CENTER OF ORANGE COUNTY

REGIONAL CENTER OF ORANGE COUNTY
Actual Expenditures through October 2018
Projection Summary: Explanation Prior Year 2017-18 Prior Year 2016-17 Prior Year 2015-16 Prior Year 2014-15 Increase Percentage
over 2017-18Other Items: Non CPP
Growth in Lanterman and Early Start
Caseload Growth4.50% 2014-15 813
3.90% 2015-16 736
4.40% 2016-17 866
4.00% 2017-18 821
1.90% 2018-19
Number of Consumers Leaving Education Funding at Age 22
Large number of consumers leaving educationfunding and receiving adult day services 490 491 483 423 419
Employment FirstCost of expanding consumer employment
Prior Year 2017-18 Prior Year 2016-17 Prior Year 2015-16 Prior Year 2014-15 Increase Percentageover 2017-18
POS Expenditures July to October
POS paid at time of SOAR $119,980,827 $112,858,201 $105,283,668 $94,531,811 $91,100,068 $7,122,626 6.3%Late bills $6,145,420 $5,637,863 $5,797,785 $5,468,802 $4,454,844 $507,557 9.0%Total Base $126,126,247 $118,496,064 $111,081,453 $100,000,613 $95,554,912 $7,630,183 6.4%
Prior year POS paid actual $119,236,402 $112,558,015 $99,605,305 $95,525,517
Difference in expenditures July to October $7,630,183 $7,414,611 $11,080,840 $4,445,701 $7,932,806Annual difference (4 months x 3 = 12) $22,890,549 $22,243,833 $34,895,895 $13,337,103 $23,798,418

REGIONAL CENTER OF ORANGE COUNTY
2018-19 SUFFICIENCY OF ALLOCATION REPORT
PROGRAM GROWTH
POS COST IMPACT
SERVICECODE
PROJECTEDSTART DATE
NUMBEROF MONTHS RATE NUMBER
OF CLIENTSTOTAL POS COST
IMPACT
Community Care all year 8 $3,597 16 $460,416
Adult Day / 505, 510, 515 all year 8 $1,500 100 $1,200,000
Look-a-Like / 063 all year 8 $2,676 60 $1,284,480
Community Integration / 055 / Employment
Firstall year 8 $2,004 80 $1,282,560
Infant Development / 805 all year 8 $1,027 50 $410,800
Transportation / 880 and 890 all year 8 $220 240 $422,400
TOTAL $5,060,656
Increase/(Decrease) in Actuals Increase/(Decrease) over Projection
Prior Year Actual Expenditures Consumers Expenditures Consumers
Adult Day $1,558,950 226 $358,950 126Habilitation $64,755 -41 $0 0Look-a-Like $1,169,012 80 $826,484 64Community Integration $1,219,712 65 -$383,488 -35Infant Development $649,133 241 -$172,467 141
Total $4,661,562 571 $629,479 296
Prior Year New Adult Day Program Projected Growth
Adult Day $1,200,000 100Habilitation $0 0Look-a-Like $342,528 16Community Integration $1,603,200 100Infant Development $821,600 100
Total $3,967,328 316
Community Care $460,416 16Transportation $528,000 300
$4,955,744 632

REGIONAL CENTER OF ORANGE COUNTY BOARD OF DIRECTORS AGENDA ITEM DETAIL SHEET _____________________ ACTION___X___ ACTION/CONSENT_______ DISCUSSION_______ INFO ONLY_______ _____________________ DATE: January 10, 2019 TO: RCOC Board of Directors FROM: Budget and Finance Committee SUBJECT: Approval of Budget Amendment D-4, Fiscal Year 2017-18 BACKGROUND: Periodically, budget amendments are required to distribute and reallocate funds
among regional centers or to change contract language. These amendments are numbered successively, e.g., D-1, D-2, etc.
REASON FOR CURRENT ITEM: The Department of Developmental Services (DDS) is scheduled to allocate
additional funds to RCOC. FISCAL IMPACT:
Regional centers are waiting for the D-4 allocation which DDS said would be sent on December 17, 2018; the amount of the allocation is unknown at this time.
RECOMMENDATION: That the Board authorize the Chairperson to execute the budget amendment upon
receipt.
Agenda Item III.C.-2.d.

REGIONAL CENTER OF ORANGE COUNTY
BOARD OF DIRECTORS
AGENDA ITEM DETAIL SHEET _____________________
ACTION___X___ ACTION/CONSENT_______
DISCUSSION_______ INFO ONLY_______
_____________________ DATE: January 10, 2019
TO: RCOC Board of Directors
FROM: Budget and Finance Committee
SUBJECT: Approval of CalPERS Requirement for a Publicly Available Pay Schedule
BACKGROUND:
Effective August 10, 2011, the California Code of Regulations, Title 2, Section 570.5, requires California Public Employees’ Retirement System’s (CalPERS’s) employers to have pay rates approved by the employer’s governing body and pay schedules publicly available. Since February 2, 2011, RCOC has posted its pay schedule on its website and the Board last approved the pay schedule at its meeting on June 7, 2018.
REASON FOR CURRENT ITEM:
The California minimum wage, and consequently the California minimum exempt salary, increased on January 1, 2019.
The following titles were added to the schedule: Associate Executive Director, Lead Service Coordinator and Home and Community-Based Services (HCBS) Coordinator.
No titles were removed.
FISCAL IMPACT:
The California minimum wage increased from $11.00 to $12.00 per hour effective January 1, 2019. The fiscal impact of complying with the new minimum wage and the new minimum exempt salary was $81,755 with benefits.
Approximately $152,182 annually for the new titles. Lead Service Coordinators will have a reduced caseload. When all eight (8) Lead Service Coordinators are promoted, it would equate to approximately three (3) Service Coordinators to assume the reduction in caseload. The annual average cost of a Service Coordinator is $76,783 with benefits;
Agenda Item III.C.-.2.e.

three (3) Service Coordinators would be $230,349. To offset this cost, RCOC has delayed hiring Area Supervisors. The annual average cost of an Area Supervisor is $100,181 with benefits. It is our expectation that the efficiency of using Lead Service Coordinators will allow us to increase the number of direct reports for Area Supervisors.
RECOMMENDATION:
That the Board approve the salary schedule for RCOC’s employees.
Agenda Item III.C.-.2.e.

RCOC Salary Schedule Effective January 10, 2019
Minimum Midpoint Maximum
EXECUTIVE DIRECTOR HR 96.19 107.19 118.18BW 7,695.41 8,574.97 9,454.54MO 16,673.38 18,579.11 20,484.83YR 200,080.61 222,949.27 245,817.94
MEDICAL DIRECTOR HR 66.73 85.91 105.10PHYSICIAN BW 5,338.05 6,873.13 8,408.21
MO 11,565.77 14,891.77 18,217.78YR 138,789.22 178,701.29 218,613.36
ASSOCIATE EXECUTIVE DIRECTOR HR 66.73 81.73 96.73CHIEF FINANCIAL OFFICER BW 5,338.05 6,538.13 7,738.22GENERAL COUNSEL MO 11,565.77 14,165.95 16,766.14
YR 138,789.22 169,991.43 201,193.63
CONSULTING PHARMACIST HR 56.72 66.81 76.90DIRECTOR: Clinical, HR, IT, BW 4,537.20 5,344.59 6,151.98Services and Supports MO 9,830.61 11,579.95 13,329.30
YR 117,967.29 138,959.42 159,951.54
MANAGER, AREA HR 42.53 49.57 56.62ASSOCIATE DIRECTOR: Employment, BW 3,402.08 3,965.68 4,529.29Finance, Housing MO 7,371.17 8,592.32 9,813.47
YR 88,453.99 103,107.79 117,761.59
MANAGER: Nursing HR 41.57 48.97 56.36PSYCHOLOGIST, BW 3,325.45 3,917.20 4,508.96THERAPIST: Occupational, Physical MO 7,205.14 8,487.27 9,769.41Speech YR 86,461.65 101,847.29 117,232.93
CHIEF COUNSELOR, CONTROLLER HR 34.44 40.01 45.59ADMINISTRATOR, MANAGER: BW 2,755.37 3,201.19 3,647.00Custodian of Records, Fair Hearings, Network MO 5,969.96 6,935.90 7,901.84Risk, Support Services YR 71,639.57 83,230.83 94,822.08
CLERK TO THE BOARD HR 35.85 40.27 44.69MANAGER: Family Support/Comm. Outreach BW 2,867.91 3,221.61 3,575.30NURSE CONSULTANT, PCT COOR. MO 6,213.80 6,980.15 7,746.49SPECIALIST: Benefits, Federal Programs YR 74,565.65 83,761.77 92,957.89
BCBA Masters HR 35.60 40.01 44.41BW 2,848.28 3,200.67 3,553.07MO 6,171.27 6,934.79 7,698.32YR 74,055.25 83,217.52 92,379.78
AREA SUPERVISOR, RESOURCE GROUP HR 28.13 35.42 42.72LEADER, MANAGER: Accounting, IT BW 2,250.06 2,833.84 3,417.62PROGRAMMER ANALYST, TRAINING MO 4,875.12 6,139.98 7,404.84COORDINATOR YR 58,501.48 73,679.75 88,858.02
LEAD SERVICE COORDINATOR HR 25.80 32.81 39.81BW 2,064.00 2,624.50 3,185.00MO 4,472.00 5,686.42 6,900.83YR 53,664.00 68,237.00 82,810.01
SERVICE COORDINATOR, HCBS COOR. HR 24.00 30.52 37.03ACCOUNTANT, ACCOUNTING SUP. BW 1,920.00 2,441.40 2,962.79CULTURAL SPECIALIST/COMM. OUT. MO 4,160.00 5,289.69 6,419.38EXECUTIVE LIAISON; HR SPECIALIST YR 49,920.00 63,476.28 77,032.57
ASSOCIATE PROGRAMMER ANALYST HR 21.00 26.54 32.08COORDINATOR: BW 1,680.00 2,123.24 2,566.48IT, Quality Assurance, Systems MO 3,640.00 4,600.35 5,560.70
YR 43,680.00 55,204.19 66,728.38
COORDINATOR: HR 19.73 22.82 25.92Fiscal, HRG Support Specialist, BW 1,578.70 1,825.97 2,073.23SIR, Vendor MO 3,420.53 3,956.26 4,491.99
YR 41,046.31 47,475.10 53,903.90
COORDINATOR: Community Resources, HR 17.88 20.26 22.63Fair Hearing, Imaging, Lead (Intake) BW 1,430.52 1,620.55 1,810.58Operations, Support Services, MO 3,099.47 3,511.20 3,922.92SPECIALIST: IT YR 37,193.61 42,134.35 47,075.09
TECHNICIAN: Accounting, Area, IT, Intake HR 14.34 17.18 20.01Scanning, Technical Assistant, Receptionist BW 1,147.48 1,374.16 1,600.84Account Clerk MO 2,486.21 2,977.35 3,468.50
YR 29,834.53 35,728.24 41,621.95
PEER ADVOCATE HR 12.00 12.86 13.72Office Aide BW 960.00 1,028.78 1,097.57
MO 2,080.00 2,229.03 2,378.06YR 24,960.00 26,748.38 28,536.77

Operations Report, Fiscal Year 2018-19 October 2018 Page 1 of 21
21,511 100%3,529 16%6,736 31%11,246 52%
398
11,818 69%2,888 17%2,598 15%6,841 36%1,307 7%
466395 85%71 15%
55352
23
10
0
220
2200
Children - Age Three No Longer Eligible for Early Start ServicesChildren - Age Three No Longer Eligible for Prevention Resource and Referral Services
Lanterman / Over Age Three / 120 days to complete determination
NUMBER OF PERSONS DETERMINED ELIGIBLEChildren - Birth to Age Three Eligible for Early Start ServicesChildren and Adults - Ages Three and Older Eligible for Lanterman Services
Children - Birth to Age Three Eligible for Prevention Resource and Referral Services
NUMBER OF CHILDREN NO LONGER ELIGIBLE FOR EARLY START OR PREVENTION RESOURCE AND REFERRAL SERVICES
• Number of children who received Early Start services
• Number of children who received Early Start services and had adiagnosis of autism
Summary of Information About Persons Served - October 2018
Early Start / Under Age Three / 45 days to complete determination
NUMBER OF PERSONS SERVEDChildren - Birth to Age Three Receiving Early Start ServicesChildren - Ages Three to 17 Receiving Lanterman ServicesAdults - Ages 18 and Older Receiving Lanterman Services
NUMBER OF PERSONS REQUESTING ELIGIBILITY DETERMINATION
Note: Many persons served have more than one diagnosis so the percentage equals more than 100%.
Children and Adults - Ages Three and Older Receiving Lanterman Services with the Following Diagnoses:
Children - Birth to Age Three Receiving Prevention Resource and Referral Services
Intellectual DisabilityEpilepsyCerebral PalsyAutismFifth Category** condition closely related to intellectual disability and requiring similar treatment

Operations Report, Fiscal Year 2018-19 October 2018 Page 2 of 21
REGIONAL CENTER OF ORANGE COUNTY
OPERATIONS REPORT
OCTOBER 2018 ACTIVITY
Mission Statement
The Regional Center of Orange County (RCOC) is a private non-profit organization that, as mandated by the Lanterman Developmental Disabilities Services Act,
collaborates with persons with developmental disabilities, their families and the community to secure individualized services and supports that enhance the quality of life
for the people we serve and assist them in realizing their full potential.

Operations Report, Fiscal Year 2018-19 October 2018 Page 3 of 21
Related Guiding Principles
Fiscal Year 2018-19
Type and Number of Reviews Jul. Aug. Sept. Oct. Nov. Dec.Annual Review 42 45 32 46Unannounced 54 59 46 55Total Number of Reviews 96 104 78 101 0 0
Provider Trainings 0 0 0 0Technical Support 230 278 195 156Corrective Action Plans 7 7 10 10Special Incident Investigations* 59 58 51 39
Type and Number of Reviews Jan. Feb. Mar. Apr. May June TotalAnnual Review 165Unannounced 214Total Number of Reviews 0 0 0 0 0 0 379
Provider Trainings 0Technical Support 859Corrective Action Plans 34Special Incident Investigations* 207
• Persons served are in safe and supportive settings that promote a life of independence,acknowledge diverse cultural perspectives and that respect the inherent risks and valuablelearning experiences that come from living in the community.
Provider Monitoring, Technical Support and Special Incident Investigation Activities
COMMUNITY LIFE

Operations Report, Fiscal Year 2018-19 October 2018 Page 4 of 21
Type of Special Incidents (from California Code of Regulations, Title 17)
1. Physical;2. Sexual;3. Fiduciary;4. Emotional/mental; or5. Physical and/or chemical restraint.
(C) Reasonably suspected neglect including failure to:1. Provide medical care for physical and mental health needs;2. Prevent malnutrition or dehydration;3. Protect from health and safety hazards;4. Assist in personal hygiene or the provision of food, clothing or shelter or
(D) A serious injury/accident including:1. Lacerations requiring sutures or staples;2. Puncture wounds requiring medical treatment beyond first aid;3. Fractures;4. Dislocations;5. Bites that break the skin and require medical treatment beyond first aid;6. Internal bleeding requiring medical treatment beyond first aid;7. Any medication errors;8. Medication reactions that require medical treatment beyond first aid; or9. Burns that require medical treatment beyond first aid.
(E) Any unplanned or unscheduled hospitalization due to the following conditions:1. Respiratory illness, including but not limited, to asthma; tuberculosis; and chronic obstructive pulmonary disease; 2. Seizure-related;3. Cardiac-related, including but not limited to, congestive heart failure; hypertension; and angina;
5. Diabetes, including diabetes-related complications;6. Wound/skin care, including but not limited to, cellulitis and decubutus;7. Nutritional deficiencies, including but not limited to, anemia and dehydration; or8. Involuntary psychiatric admission;
(2) The following special incidents regardless of when or where they occurred:(A) The death of any consumer, regardless of cause;(B) The consumer is the victim of a crime including the following:
5. Rape, including rape and attempts to commit rape.
* California Code of Regulations, Title 17, Division 2, Chapter 3 - Community Services SubChapter 2 - VendorizationArticle 2 - Vendorization Process, Section 54327 requires all vendors, excluding parents and consumers, to report thefollowing special incidents.
(A) The consumer is missing and the vendor or long-term health care facility has filed a missing persons report with alaw enforcement agency;
5. Exercise the degree of care that a reasonable person would exercise in the position of having the care andcustody of an elder or a dependent adult.
1. Robbery, including theft using a firearm, knife, or cutting instrument or other dangerous weapons or methodswhich force or threaten a victim;2. Aggravated assault, including a physical attack on a victim using hands, fist, feet or a firearm, knife or cuttinginstrument or other dangerous weapon;3. Larceny, including the unlawful taking, carrying, leading, or riding away of property, except for motor vehicles,from the possession or constructive possession of another person;4. Burglary, including forcible entry; unlawful non-forcible entry; and, attempted forcible entry of a structure tocommit a felony or theft therein;
Title 17 does not require reporting on arrest or consumer rights violations; however, RCOC includes arrest and rights violations as reportable incidents.
(B) Reasonably suspected abuse/exploitation including:
4. Internal infections, including but not limited to, ear, nose and throat; gastrointestinal; kidney; dental; pelvic; orurinary tract;

Operations Report, Fiscal Year 2018-19 October 2018 Page 5 of 21
Fiscal Year 2018-19
Type of Incident Jul. Aug. Sept. Oct. Nov. Dec.AWOL 4 7 3 3Abuse 25 28 24 22Neglect 33 31 40 24Injury 16 24 12 24Hospitalizations - Total 52 62 48 63
Psychiatric 37 10 15 14Medical 15 52 33 49
Death 14 17 13 7Victim of crime 1 4 5 8Arrest 3 2 5 2Rights 66 37 25 59Total 214 212 175 212 0 0
Type of Incident Jan. Feb. Mar. Apr. May June TotalAWOL 17Abuse 99Neglect 128Injury 76Hospitalizations - Total 225
Psychiatric 76Medical 149
Death 51Victim of Crime 18Arrest 12Rights 187Total 0 0 0 0 0 0 813
Type and Number of Special Incident Investigations
AWOL, 17, 2%
Abuse, 99, 12%
Neglect, 128, 16%
Injury, 76, 9%
Hospitalizations, 556, 25%
Death, 51, 6%
Victim of Crime, 18, 2%
Arrest, 12, 2%
Rights, 187, 23%
Special Incident Investigations

Operations Report, Fiscal Year 2018-19 October 2018 Page 6 of 21
Provider AuditsFiscal Year 2018-19
Type of Audit Jul. Aug. Sept. Oct. Nov. Dec.Service Billing 0 0 1 0Staffing 0 0 0 0Level 4I Consultant 0 0 0 0P&I (consumer funds) 0 0 0 0Total Number of Audits 0 0 1 0 0 0
State Appeal 0 0 0 0 0Recovery 0 0 1 0 0
Amount of Recovery $0.00 $0.00 $4,520.99 $0.00
Type of Audit Jan. Feb. Mar. Apr. May June TotalService Billing 1Staffing 0Level 4I Consultant 0P&I (consumer funds) 0Total Number of Audits 0 0 0 0 0 0 1
Number of Appeals / RecoveriesState Appeal 0Recovery 1
Amount of Recovery $4,520.99
COMMUNITY LIFE continued
Audit Findings (Dollar Amount)
Number of Appeals / Recoveries (Vendors may appeal after monthly data is reported)
Audit Findings (Dollar Amount)
Number of Audits / Appeals / Recoveries
Operations Report, Fiscal Year 2018-19 October 2018 Page 7 of 21
Related Guiding Principles
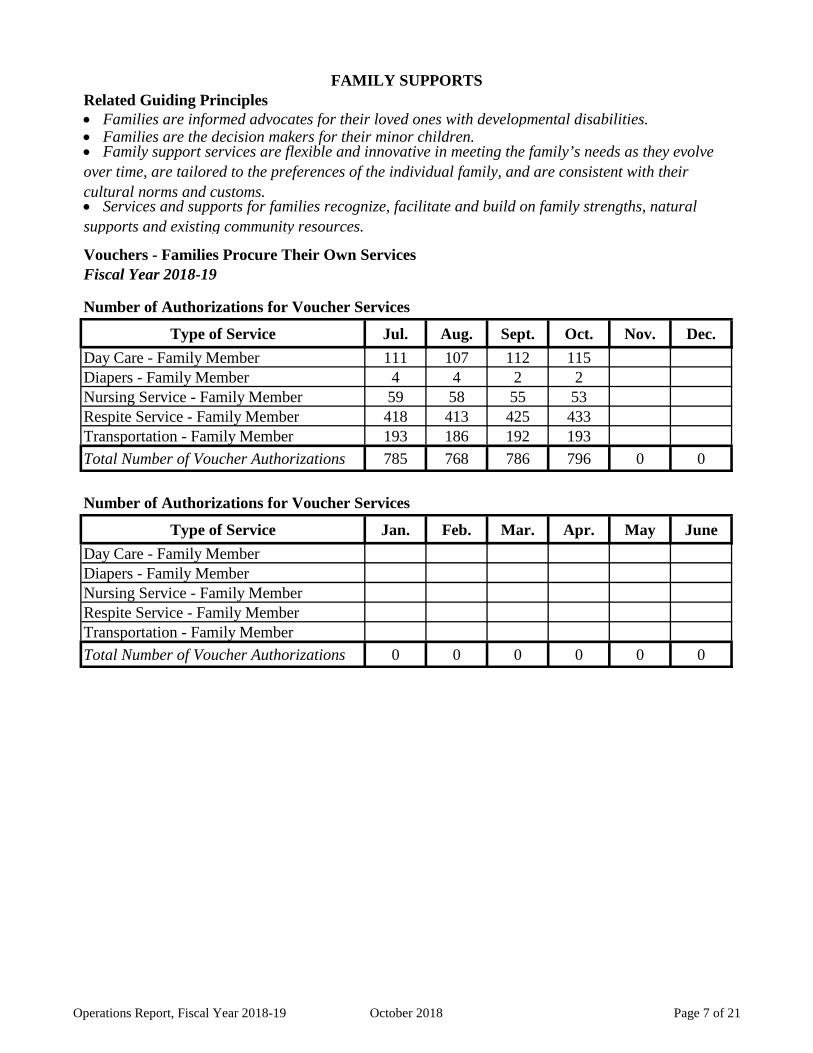
Type of Service Jul. Aug. Sept. Oct. Nov. Dec.Day Care - Family Member 111 107 112 115Diapers - Family Member 4 4 2 2Nursing Service - Family Member 59 58 55 53Respite Service - Family Member 418 413 425 433Transportation - Family Member 193 186 192 193Total Number of Voucher Authorizations 785 768 786 796 0 0
Type of Service Jan. Feb. Mar. Apr. May JuneDay Care - Family MemberDiapers - Family MemberNursing Service - Family MemberRespite Service - Family MemberTransportation - Family MemberTotal Number of Voucher Authorizations 0 0 0 0 0 0
FAMILY SUPPORTS
Number of Authorizations for Voucher Services
Number of Authorizations for Voucher Services
Vouchers - Families Procure Their Own ServicesFiscal Year 2018-19
• Families are informed advocates for their loved ones with developmental disabilities.• Families are the decision makers for their minor children.• Family support services are flexible and innovative in meeting the family’s needs as they evolve over time, are tailored to the preferences of the individual family, and are consistent with their cultural norms and customs.• Services and supports for families recognize, facilitate and build on family strengths, natural supports and existing community resources.

Operations Report, Fiscal Year 2018-19 October 2018 Page 8 of 21
Related Guiding Principles
Language Jul. Aug. Sept. Oct. Nov. Dec.English* 59,721 51,189 48,499 130,106Farsi 47 247 0 0Korean 0 0 805 0Spanish* 6,493 2,388 4,796 7,672Vietnamese* 1,391 2,461 3,614 7,651Total Number of Notifications 67,652 56,285 57,714 145,429 0 0
Language Jan. Feb. Mar. Apr. May JuneEnglishFarsiKoreanSpanishVietnameseTotal Number of Notifications 0 0 0 0 0 0
* Threshold languages for RCOC
Fiscal Year 2018-19
Number of Notifications
Number of Notifications
FAMILY SUPPORTS
• Family support services are flexible and innovative in meeting the family’s needs as they evolve over time, are tailored to the preferences of the individual family, and are consistent with their cultural norms and customs.• Services and supports for families recognize, facilitate and build on family strengths, natural supports and existing community resources.
Notifications of Community Events and Activities

Operations Report, Fiscal Year 2018-19 October 2018 Page 9 of 21
Related Guiding Principles
Language Jul. Aug. Sept. Oct. Nov. Dec.English In Person 5 13 10 16 In Print 2 2 TV / Radio 5 2Spanish In Person 5 6 2 8 In Print 1 1 TV / Radio 1 1Vietnamese In Person 2 4 3 3 In Print 1 1 TV / Radio 5 3 2 4Other Languages In Person (Korean) 1 1 In Print TV / RadioTotal Number of Outreach Events 23 34 21 32 0 0
Language Jan. Feb. Mar. Apr. May JuneEnglish In Person In Print TV / RadioSpanish In Person In Print TV / RadioVietnamese In Person In Print TV / RadioOther Languages In Person In Print TV / RadioTotal Number of Outreach Events 0 0 0 0 0 0
Number of Outreach Events
FAMILY SUPPORTS
• Family support services are flexible and innovative in meeting the family’s needs as they evolve over time, are tailored to the preferences of the individual family, and are consistent with their cultural norms and customs.• Services and supports for families recognize, facilitate and build on family strengths, natural supports and existing community resources.
Community OutreachFiscal Year 2018-19
Number of Outreach Events
Operations Report, Fiscal Year 2018-19 October 2018 Page 10 of 21
Related Guiding Principles
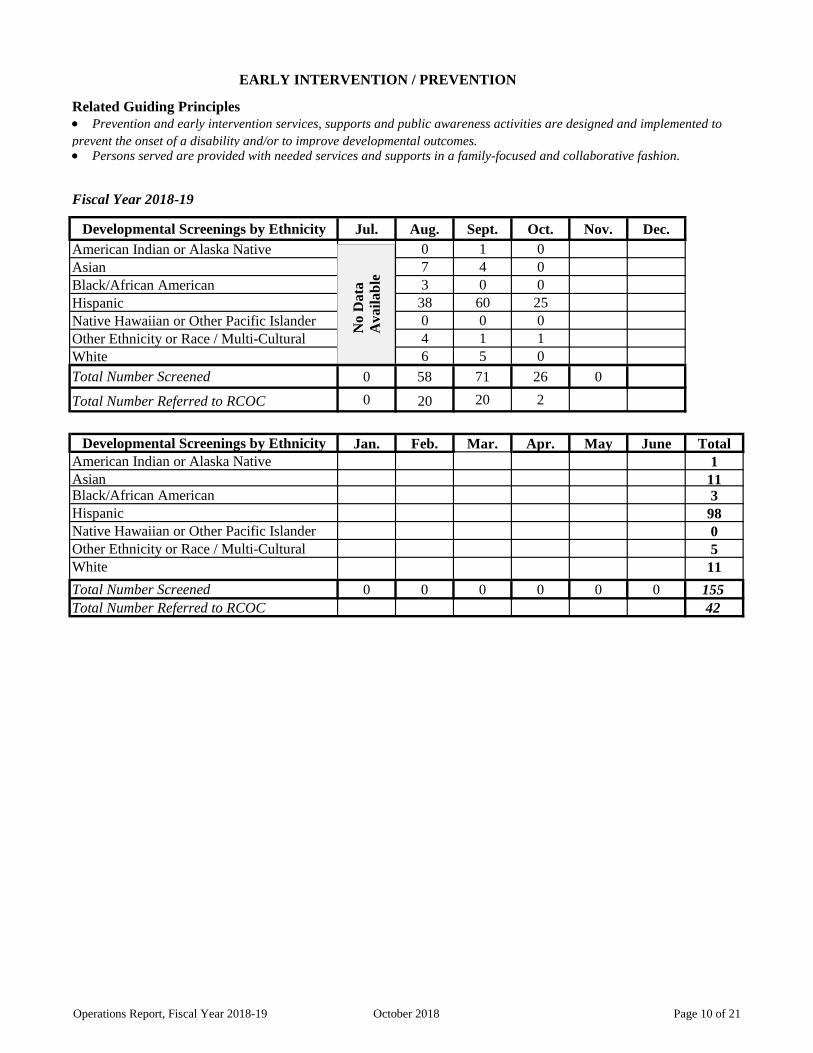
Fiscal Year 2018-19
Developmental Screenings by Ethnicity Jul. Aug. Sept. Oct. Nov. Dec.American Indian or Alaska Native 0 1 0Asian 7 4 0Black/African American 3 0 0Hispanic 38 60 25Native Hawaiian or Other Pacific Islander 0 0 0Other Ethnicity or Race / Multi-Cultural 4 1 1White 6 5 0Total Number Screened 0 58 71 26 0
Total Number Referred to RCOC 0 20 20 2
Developmental Screenings by Ethnicity Jan. Feb. Mar. Apr. May June TotalAmerican Indian or Alaska Native 1Asian 11Black/African American 3Hispanic 98Native Hawaiian or Other Pacific Islander 0Other Ethnicity or Race / Multi-Cultural 5White 11Total Number Screened 0 0 0 0 0 0 155Total Number Referred to RCOC 42
EARLY INTERVENTION / PREVENTION
• Prevention and early intervention services, supports and public awareness activities are designed and implemented to prevent the onset of a disability and/or to improve developmental outcomes.• Persons served are provided with needed services and supports in a family-focused and collaborative fashion.
No
Dat
a A
vaila
ble

Operations Report, Fiscal Year 2018-19 October 2018 Page 11 of 21
Related Guiding Principles
Persons Served Persons Served Persons ServedAll Under 18 Over 18
With Family 17,245 9,990 7,255Not With Family 4,266 275 3,991
Total 21,511 10,265 11,246
LIVING OPTIONS
• Culturally-sensitive services and supports are provided so that persons served can make informed choices on where and with whom they live, including owning or renting their own homes.• Families whose minor or adult children choose to remain in the family home are supported through available resources.• Persons served live in homes where they receive quality care and can form relationships.
Where Persons Served Live
With Family, 9,990, 97%
Not With Family, 275, 3%
Where Persons Served Under 18 Live
With Family, 7,255, 65%
Not With Family, 3,991, 35%
Where Persons Served Over 18 Live

Operations Report, Fiscal Year 2018-19 October 2018 Page 12 of 21
All Persons Served Persons ServedPersons Served Under 18 Over 18
Family Home 17,245 9,990 7,255Community Care Facility 1,661 41 1,620State Developmental Center 57 0 57Family Home Agency 90 0 90Foster Home 214 205 9Intermediate Care Facility 739 3 736Independent Living 844 0 844Supported Living 481 0 481Skilled Nursing 92 0 92Other* 88 26 62Total 21,511 10,265 11,246
Other*Acute General Hospital 6 0 6California Youth Authority 0 0 0Community Treatment 1 0 1Correctional Institution 0 0 0County Jail 2 0 2Other 0 0 0Out of State 3 0 3Psychiatric Treatment 6 1 5Rehabilitation Center 4 1 3SDC / State Hospital 0 0 0Sub-Acute 48 24 24Transient / Homeless 18 0 18Total, Other* 88 26 62
LIVING OPTIONS, continued
Where Persons Served Live
Community Care Facility, 1,661, 39%
State Developmental Center, 57, 2%
Family Home Agency, 90, 2%
Foster Home, 214, 5%
Intermediate Care Facility, 739, 17%
Independent Living, 844, 20%
Supported Living, 481, 11%
Skilled Nursing, 92, 2%
Other*, 88, 2%
Where Persons Served Live When Not With Family

Operations Report, Fiscal Year 2018-19 October 2018 Page 13 of 21
Other Living Options
Family Home Agency
Foster Family Agency
Independent Living
Supported Living
Other Living Options Total Under 18 Over 18Family Home Agency 90 0 90Foster Family 214 205 9Independent Living 844 0 844Supported Living 481 0 481Total 1,629 205 1,424
LIVING OPTIONS, continued
A Family Home Agency (FHA) is a private, not-for-profit agency that is vendored to recruit, approve, train, and monitor family home providers, provide services and supports to family home providers, and assist persons served with moving into or relocating from family homes.
Under the California Department of Social Services, county placement agencies use licensed, private Foster Family Agencies (FFAs) for the placement of children. By statute, FFAs are organized and operated on a non-profit basis and are engaged in the following activities: recruiting, certifying, and training foster parents, providing professional support to foster parents, and finding homes or other temporary or permanent placements for children who require more intensive care.
Independent Living services help persons served over 18 with the functional skills necessary to secure a self-sustaining, independent living situation in the community and/or may provide the support necessary to maintain those skills.
Supported Living Services (SLS) support efforts for persons served to live in their own home.
Family Home Agency, 90, 5%
Foster Family, 214, 13%
Independent Living, 844, 52%
Supported Living, 481, 30%
Other Living Options

Operations Report, Fiscal Year 2018-19 October 2018 Page 14 of 21
Health Licensed Facilities
General Acute Care Hospitals,Acute Psychiatric Hospitals,Skilled Nursing Facilities,Intermediate Care Facilities,Intermediate Care Facility – Developmentally Disabled,Intermediate Care Facility – Developmentally Disabled, – Habilitative,Intermediate Care Facility – Developmentally Disabled, – Nursing,Home Health Agencies andCongregate Living Health Facilities.
LIVING OPTIONS, continued
SERVICE LEVEL 4: Care, supervision, and professionally supervised training for persons with deficits in self-help skills, and/or severe impairment in physical coordination and mobility, and/or severely disruptive or self-injurious behavior. Service Level 4 is subdivided into Levels 4A through 4I, in which staffing levels are increased to correspond to the escalating severity of disability levels.
Living Options, facilities licensed by the State of California, Departments of Community Care Licensing, or Department of Health Care Services
Community Care Licensed Facilities
SERVICE LEVEL 1: Limited care and supervision for persons with self-care skills and no behavior problems. SERVICE LEVEL 2: Care, supervision, and incidental training for persons with some self-care skills and no major behavior problems.SERVICE LEVEL 3: Care, supervision, and ongoing training for persons with significant deficits in self-help skills, and/or some limitations in physical coordination and mobility, and/or disruptive or self-injurious behavior.
Health facilities are licensed by the State of California, Department of Health Services to provide 24-hour medical residential care. Health facilities are funded by Medi-Cal. Health licensed facilities
Community Care Facilities (CCFs) are licensed by the State of California, Department of Social Services, Community Care Licensing Division to provide 24-hour non-medical residential care to children and adults with developmental disabilities who are in need of personal services, supervision, and/or assistance essential for self-protection or sustaining the activities of daily living. CCFs are funded by regional centers. Based upon the types of services provided and the persons served, each CCF vendored by a regional center is designated one of the following service levels:

Operations Report, Fiscal Year 2018-19 October 2018 Page 15 of 21
Fiscal Year 2018-19
Licensed Facilities Total Over 18 Under 18Level 2 340 340 0Level 3 363 363 0Level 4A 44 44 0Level 4B 5 5 0Level 4C 54 54 0Level 4D 46 46 0Level 4E 32 32 0Level 4F 68 68 0Level 4G 28 28 0Level 4H 4 4 0Level 4I 363 350 13Elderly 1 1 0ICF/DD-H 1 1 0ICF/DD-N 2 2 0ICF/DD 0 0 0Skilled Nursing 0 0 0Total 1,351 1,338 13
Licensed Facilities Summary Total Over 18 Under 18Level 2 340 340 0Level 3 363 363 0Level 4 644 631 13ICF/DD-H 1 1 0ICF/DD-N 2 2 0Elderly 1 1 0Skilled Nursing 0 0 0Total 1,351 1,338 13
Persons Served Who Reside in Licensed Facilities Funded by RCOC
LIVING OPTIONS, continued

Operations Report, Fiscal Year 2018-19 October 2018 Page 16 of 21
Jan. Mar. Apr. May June Total
Jan. Feb. Mar. Apr. May June Total
Level 2, 340, 25%
Level 3, 363, 27%
Level 4, 644, 48%
ICF/DD-H, 1, 0% ICF/DD-N, 2, 0%
Elderly, 1, 0%
Skilled Nursing, 0, 0%
Persons Served Who Reside in Licensed Facilities Services Funded by RCOC
Level 2, 340, 26%
Level 3, 363, 27%
Level 4, 631, 47%
ICF/DD-H, 1, 0%
ICF/DD-N, 2, 0% Elderly, 1, 0%
Skilled Nursing, 0, 0%
Persons Served Over Age 18 Who Reside in Licensed Facilities Services Funded by RCOC
Level 2, 0, 0% Level 3, 0, 0%
Level 4, 13, 100%
ICF/DD-H, 0, 0% ICF/DD-N, 0, 0%
Elderly, 0, 0% Skilled Nursing, 0, 0%
Persons Served Under Age 18 Who Reside in Licensed Facilities Services Funded by RCOC

Operations Report, Fiscal Year 2018-19 October 2018 Page 17 of 21
Related Guiding Principle
Persons ServedOver 18
Comm. Activities Support Svcs. 978Activity Center 651Adult Development 2,209Behavior Management 488Supported Employment Group 308Supported Employment Ind. 501Work Activity 167Total 5,302
Definitions:
Supported Employment Program means a program that meets the requirements of the term supported employment, i.e. services that are provided by a job coach in order to support and maintain an individual with developmental disabilities in employment, and of the terms, integrated work, supported employment placement, allowable supported employment services, group and individualized services. Staff ratio ranges from 1:1 to 1:4.
Work Activity Program includes, but is not limited to, Work Activity centers or settings that provide support to persons served engaged in paid work and have demonstrated that the program is in compliance with Department of Rehabilitation certification standards or are accredited by CARF. Staff ratio ranges from 1:12 to 1:20.
• Persons served have the opportunity and support to work in integrated employment settings that are meaningful, valued by the community, and in which they are appropriately compensated and respected.
WORK
Activity Center means a day program that serves adults who generally have acquired most basic self-care skills, have some ability to interact with others, are able to make their needs known, and respond to instructions. Activity center programs focus on the development and maintenance of the functional skills required for self-advocacy, community integration and employment. Staff ratio ranges from 1:6 to 1:8.
Adult Development Center means a day program that serves adults who are in the process of acquiring self-help skills. Individuals who attend adult development centers generally need sustained support and direction in developing the ability to interact with others, to make their needs known, and to respond to instructions. Adult development center programs focus on the development and maintenance of the functional skills required for self-advocacy, community integration, employment, and self-care. Staff ratio ranges from 1:3 to 1:4.
Behavior Management Program means a day program that serves adults with severe behavior disorders and/or dual diagnosis who, because of their behavior problems, are not eligible for or acceptable in any other community-based day program. Staff ratio is 1:3.
Adult Day & Employment Services
Community Activities Support Services similar to a Behavior Management Program, this is a behavior management program with an enhanced ration of 1:1 or 1:2 due to severe behavioral challenges.
Comm. Activities Support
Svcs., 978, 18%
Activity Center, 651,
12%
Adult Development,
2,209, 42%
Behavior Management,
488, 9%
Supported Employment Group, 308,
6% Supported Employment
Ind., 501, 10%
Work Activity, 167,
3%

Operations Report, Fiscal Year 2018-19 October 2018 Page 18 of 21
Related Guiding Principles
Service CoordinationFiscal Year 2018-19
Service Coordination: Jul. Aug. Sept. Oct. Nov. Dec.Number of Service Coordinators (SC) 299.0 298.0 304.0 305.0Number of Case-Carrying SCs 271.0 269.0 274.0 275.0Number of Intake SCs 28.0 29.0 30.0 30.0Number of State Developmental Center SCs 0.0 0.0 0.0 0.0Number of Active Persons Served 21,330 21,329 21,386 21,449Caseload Ratio, # of Active Persons Served/SCs 78.7 79.3 78.1 78.0
Service Coordination: Jan. Feb. Mar. Apr. May JuneNumber of Service Coordinators (SC)Number of Case-Carrying SCsNumber of Intake SCsNumber of State Developmental Center SCsNumber of Active Persons ServedCaseload Ratio, # of Active Persons Served/SCs
• Services and supports are sensitive to the diverse religious, cultural, language, socioeconomic and ethnic characteristics of persons' served and their families' communities.
SERVICE PLANNING AND COORDINATION
• Services and supports assist person served and their families to develop support networks leading to reduced dependence on paid supports.
• Service coordinators are caring, knowledgeable and competent in service planning, coordination and resources. • Service coordinators inform families of their rights and the services and supports available to them.• Service planning and coordination is a collaborative effort between RCOC, persons served and their families to identify needed services and supports.• Person-centered planning is based upon the choices and preferences of the persons served and their families, and the identification of generic services and natural supports.
Operations Report, Fiscal Year 2018-19 October 2018 Page 19 of 21
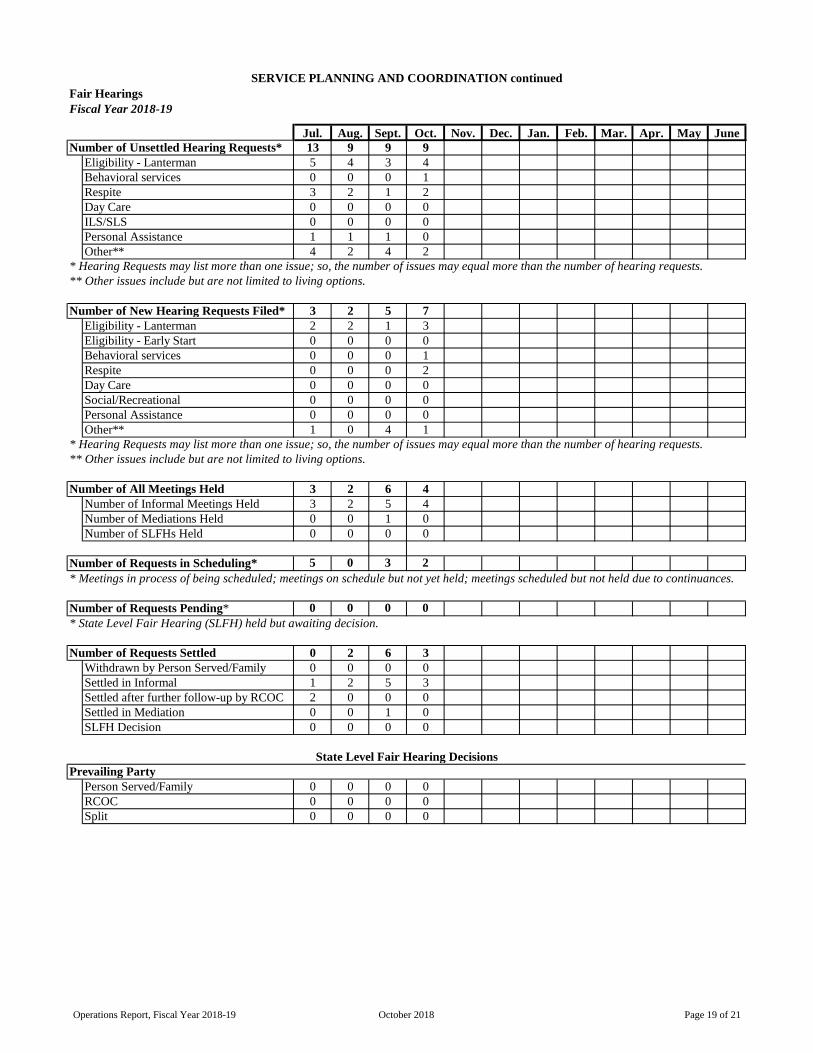
Jul. Aug. Sept. Oct. Nov. Dec. Jan. Feb. Mar. Apr. May JuneNumber of Unsettled Hearing Requests* 13 9 9 9
5 4 3 4Behavioral services 0 0 0 1Respite 3 2 1 2Day Care 0 0 0 0ILS/SLS 0 0 0 0Personal Assistance 1 1 1 0Other** 4 2 4 2
Number of New Hearing Requests Filed* 3 2 5 7Eligibility - Lanterman 2 2 1 3Eligibility - Early Start 0 0 0 0Behavioral services 0 0 0 1Respite 0 0 0 2Day Care 0 0 0 0Social/Recreational 0 0 0 0Personal Assistance 0 0 0 0Other** 1 0 4 1
Number of All Meetings Held 3 2 6 4Number of Informal Meetings Held 3 2 5 4Number of Mediations Held 0 0 1 0Number of SLFHs Held 0 0 0 0
5 0 3 2* Meetings in process of being scheduled; meetings on schedule but not yet held; meetings scheduled but not held due to continuances.
Number of Requests Pending* 0 0 0 0* State Level Fair Hearing (SLFH) held but awaiting decision.
Number of Requests Settled 0 2 6 30 0 0 0
Settled in Informal 1 2 5 3Settled after further follow-up by RCOC 2 0 0 0Settled in Mediation 0 0 1 0SLFH Decision 0 0 0 0
State Level Fair Hearing DecisionsPrevailing Party
0 0 0 00 0 0 00 0 0 0
Number of Requests in Scheduling*
RCOCPerson Served/Family
Split
SERVICE PLANNING AND COORDINATION continued
** Other issues include but are not limited to living options.* Hearing Requests may list more than one issue; so, the number of issues may equal more than the number of hearing requests.
* Hearing Requests may list more than one issue; so, the number of issues may equal more than the number of hearing requests.** Other issues include but are not limited to living options.
Eligibility - Lanterman
Withdrawn by Person Served/Family
Fiscal Year 2018-19Fair Hearings

Operations Report, Fiscal Year 2018-19 October 2018 Page 20 of 21
Guiding Principle
Adult Day 574 269 0 72 0 915Behavioral 144 142 0 16 0 302Education 0 0 0 0 0 0Eligibility/Health 90 3 0 7 0 100Early Start 1,014 105 0 77 0 1,196Living Options 212 230 0 2 0 444Supported/Ind. 252 100 0 29 0 381All Others 777 48 0 45 0 870Monthly Total 3,063 897 0 248 0 4,208
FY 2018-19Total to Date 3,128 1,168 0 276 0 4,572
ADMINISTRATION AND GOVERNANCE
TotalPending/DeferredDisposition Approved Consultation Denied Planning
Team
Resource Group Activity for October 2018 and Fiscal Year to Date
• RCOC will maximize all alternative sources of funding for necessary services and supports including federal and generic funding.• The public funds that support the service system are expended in a fashion that is cost-effective, consumer-directed, consistent with good business practices, and that reflect RCOC’s Guiding Principles and diligent stewardship.
Approved, 3,063, 73%
Consultation, 897, 21%
Denied, 0, 0%
Pending/ Deferred, 248,
6%
Planning Team, 0, 0%
Resource Group Activity For Current Month

Operations Report, Fiscal Year 2018-19 October 2018 Page 21 of 21
About Persons Served Early Start
Medicaid Waiver
All Other SDC Total Under 18 Over 18
Number of Persons Served 3,529 3,896 14,029 57 21,511 10,265 11,246Percentage of Total 16% 18% 65% 0% 100% 48% 52%
398
Persons Served by Residence Status All Under 18 Over 18 Year to
DateFamily Home 17,245 9,990 7,255 17Community Care Facility 1,661 41 1,620 99State Developmental Center 57 0 57 128Family Home Agency 90 0 90 76Foster Home 214 205 9 225Intermediate Care Facility 739 3 736 51Independent Living 844 0 844 18Supported Living 481 0 481 12Skilled Nursing 92 0 92 187Other 88 26 62Total 21,511 10,265 11,246 813
Number of Licensed Facilities Total Under 18 Over 18 Year to Date
Community Care Facilities 165Level 2 80 0 80 214Level 3 70 1 69 379Level 4 158 13 145 0Total Community Care Facilities 308 14 294 859
34
ICF-DD 1 1ICF-DD/Habilitation 83 $4,521ICF-DD/Nursing 39Total ICF Facilities 123
Total Licensed Facilities 431
Intermediate Care Facilities (ICF)
Rights
Special Incident Investigations
Total
Licensed Facility Monitoring
Arrest
AWOLAbuse
Amount of Recovery from Audits
Annual ReviewUnannounced Total Number of ReviewsProvider Trainings
Corrective Action Plans
Number of Audits
Operations Report Summary - October 2018
Victim of crime
Technical Support
NeglectInjuryHospitalizations - Total Death
Children served in Prevention Resource and Referral Services

Operations Report, Fiscal Year 2018-19 November 2018 Page 1 of 21
21,568 100%3,586 17%6,748 31%11,234 52%
392
11,802 66%2,886 16%2,592 14%6,867 38%1,317 7%
403333 83%70 17%
57352
17
10
2
191
1892
Children - Age Three No Longer Eligible for Early Start ServicesChildren - Age Three No Longer Eligible for Prevention Resource and Referral Services
Lanterman / Over Age Three / 120 days to complete determination
NUMBER OF PERSONS DETERMINED ELIGIBLEChildren - Birth to Age Three Eligible for Early Start ServicesChildren and Adults - Ages Three and Older Eligible for Lanterman Services
Children - Birth to Age Three Eligible for Prevention Resource and Referral Services
NUMBER OF CHILDREN NO LONGER ELIGIBLE FOR EARLY START OR PREVENTION RESOURCE AND REFERRAL SERVICES
• Number of children who received Early Start services
• Number of children who received Early Start services and had a diagnosis of autism
Summary of Information About Persons Served - November 2018
Early Start / Under Age Three / 45 days to complete determination
NUMBER OF PERSONS SERVEDChildren - Birth to Age Three Receiving Early Start ServicesChildren - Ages Three to 17 Receiving Lanterman ServicesAdults - Ages 18 and Older Receiving Lanterman Services
NUMBER OF PERSONS REQUESTING ELIGIBILITY DETERMINATION
Note: Many persons served have more than one diagnosis so the percentage equals more than 100%.
Children and Adults - Ages Three and Older Receiving Lanterman Services with the Following Diagnoses:
Children - Birth to Age Three Receiving Prevention Resource and Referral Services
Intellectual DisabilityEpilepsyCerebral PalsyAutismFifth Category** condition closely related to intellectual disability and requiring similar treatment

Operations Report, Fiscal Year 2018-19 November 2018 Page 2 of 21
REGIONAL CENTER OF ORANGE COUNTY
OPERATIONS REPORT
NOVEMBER 2018 ACTIVITY
Mission Statement
The Regional Center of Orange County (RCOC) is a private non-profit organization that, as mandated by the Lanterman Developmental Disabilities Services Act,
collaborates with persons with developmental disabilities, their families and the community to secure individualized services and supports that enhance the quality of life
for the people we serve and assist them in realizing their full potential.

Operations Report, Fiscal Year 2018-19 November 2018 Page 3 of 21
Related Guiding Principles
Fiscal Year 2018-19
Type and Number of Reviews Jul. Aug. Sept. Oct. Nov. Dec.Annual Review 42 45 32 46 25Unannounced 54 59 46 55 32Total Number of Reviews 96 104 78 101 0 0
Provider Trainings 0 0 0 0 0Technical Support 230 278 195 156 90Corrective Action Plans 7 7 10 10 6Special Incident Investigations* 59 58 51 39 27
Type and Number of Reviews Jan. Feb. Mar. Apr. May June TotalAnnual Review 190Unannounced 246Total Number of Reviews 0 0 0 0 0 0 436
Provider Trainings 0Technical Support 949Corrective Action Plans 40Special Incident Investigations* 234
• Persons served are in safe and supportive settings that promote a life of independence, acknowledge diverse cultural perspectives and that respect the inherent risks and valuable learning experiences that come from living in the community.
Provider Monitoring, Technical Support and Special Incident Investigation Activities
COMMUNITY LIFE

Operations Report, Fiscal Year 2018-19 November 2018 Page 4 of 21
Type of Special Incidents (from California Code of Regulations, Title 17)
1. Physical;2. Sexual;3. Fiduciary;4. Emotional/mental; or5. Physical and/or chemical restraint.
(C) Reasonably suspected neglect including failure to:1. Provide medical care for physical and mental health needs;2. Prevent malnutrition or dehydration;3. Protect from health and safety hazards; 4. Assist in personal hygiene or the provision of food, clothing or shelter or
(D) A serious injury/accident including: 1. Lacerations requiring sutures or staples; 2. Puncture wounds requiring medical treatment beyond first aid;3. Fractures; 4. Dislocations; 5. Bites that break the skin and require medical treatment beyond first aid;6. Internal bleeding requiring medical treatment beyond first aid; 7. Any medication errors; 8. Medication reactions that require medical treatment beyond first aid; or 9. Burns that require medical treatment beyond first aid.
(E) Any unplanned or unscheduled hospitalization due to the following conditions: 1. Respiratory illness, including but not limited, to asthma; tuberculosis; and chronic obstructive pulmonary disease; 2. Seizure-related; 3. Cardiac-related, including but not limited to, congestive heart failure; hypertension; and angina;
5. Diabetes, including diabetes-related complications; 6. Wound/skin care, including but not limited to, cellulitis and decubutus; 7. Nutritional deficiencies, including but not limited to, anemia and dehydration; or 8. Involuntary psychiatric admission;
(2) The following special incidents regardless of when or where they occurred: (A) The death of any consumer, regardless of cause; (B) The consumer is the victim of a crime including the following:
5. Rape, including rape and attempts to commit rape.
* California Code of Regulations, Title 17, Division 2, Chapter 3 - Community Services SubChapter 2 - Vendorization Article 2 - Vendorization Process, Section 54327 requires all vendors, excluding parents and consumers, to report the following special incidents.
(A) The consumer is missing and the vendor or long-term health care facility has filed a missing persons report with a law enforcement agency;
5. Exercise the degree of care that a reasonable person would exercise in the position of having the care and custody of an elder or a dependent adult.
1. Robbery, including theft using a firearm, knife, or cutting instrument or other dangerous weapons or methods which force or threaten a victim; 2. Aggravated assault, including a physical attack on a victim using hands, fist, feet or a firearm, knife or cutting instrument or other dangerous weapon; 3. Larceny, including the unlawful taking, carrying, leading, or riding away of property, except for motor vehicles, from the possession or constructive possession of another person; 4. Burglary, including forcible entry; unlawful non-forcible entry; and, attempted forcible entry of a structure to commit a felony or theft therein;
Title 17 does not require reporting on arrest or consumer rights violations; however, RCOC includes arrest and rights violations as reportable incidents.
(B) Reasonably suspected abuse/exploitation including:
4. Internal infections, including but not limited to, ear, nose and throat; gastrointestinal; kidney; dental; pelvic; or urinary tract;

Operations Report, Fiscal Year 2018-19 November 2018 Page 5 of 21
Fiscal Year 2018-19
Type of Incident Jul. Aug. Sept. Oct. Nov. Dec.AWOL 4 7 3 3 4Abuse 25 28 24 22 25Neglect 33 31 40 24 21Injury 16 24 12 24 14Hospitalizations - Total 52 62 48 63 24
Psychiatric 37 10 15 14 6Medical 15 52 33 49 18
Death 14 17 13 7 9Victim of crime 1 4 5 8 2Arrest 3 2 5 2 3Rights 66 37 25 59 21Total 214 212 175 212 123 0
Type of Incident Jan. Feb. Mar. Apr. May June TotalAWOL 21Abuse 124Neglect 149Injury 90Hospitalizations - Total 249
Psychiatric 82Medical 167
Death 60Victim of Crime 20Arrest 15Rights 208Total 0 0 0 0 0 0 936
Type and Number of Special Incident Investigations
AWOL, 21, 2%
Abuse, 124, 13%
Neglect, 149, 16%
Injury, 90, 10%
Hospitalizations, 556, 25%
Death, 60, 6%
Victim of Crime, 20, 2%
Arrest, 15, 2%
Rights, 208, 22%
Special Incident Investigations

Operations Report, Fiscal Year 2018-19 November 2018 Page 6 of 21
Provider AuditsFiscal Year 2018-19
Type of Audit Jul. Aug. Sept. Oct. Nov. Dec.Service Billing 0 0 1 0 0Staffing 0 0 0 0 0Level 4I Consultant 0 0 0 0 0P&I (consumer funds) 0 0 0 0 0Total Number of Audits 0 0 1 0 0 0
State Appeal 0 0 0 0 0 0Recovery 0 0 1 0 0 0
Amount of Recovery $0.00 $0.00 $4,520.99 $0.00 $0.00
Type of Audit Jan. Feb. Mar. Apr. May June TotalService Billing 1Staffing 0Level 4I Consultant 0P&I (consumer funds) 0Total Number of Audits 0 0 0 0 0 0 1
Number of Appeals / RecoveriesState Appeal 0Recovery 1
Amount of Recovery $4,520.99
COMMUNITY LIFE continued
Audit Findings (Dollar Amount)
Number of Appeals / Recoveries (Vendors may appeal after monthly data is reported)
Audit Findings (Dollar Amount)
Number of Audits / Appeals / Recoveries

Operations Report, Fiscal Year 2018-19 November 2018 Page 7 of 21
Related Guiding Principles
Type of Service Jul. Aug. Sept. Oct. Nov. Dec.Day Care - Family Member 111 107 112 115 113Diapers - Family Member 4 4 2 2 2Nursing Service - Family Member 59 58 55 53 56Respite Service - Family Member 418 413 425 433 433Transportation - Family Member 193 186 192 193 191Total Number of Voucher Authorizations 785 768 786 796 795 0
Type of Service Jan. Feb. Mar. Apr. May JuneDay Care - Family MemberDiapers - Family MemberNursing Service - Family MemberRespite Service - Family MemberTransportation - Family MemberTotal Number of Voucher Authorizations 0 0 0 0 0 0
FAMILY SUPPORTS
Number of Authorizations for Voucher Services
Number of Authorizations for Voucher Services
Vouchers - Families Procure Their Own ServicesFiscal Year 2018-19
• Families are informed advocates for their loved ones with developmental disabilities.• Families are the decision makers for their minor children.• Family support services are flexible and innovative in meeting the family’s needs as they evolve over time, are tailored to the preferences of the individual family, and are consistent with their cultural norms and customs.• Services and supports for families recognize, facilitate and build on family strengths, natural supports and existing community resources.
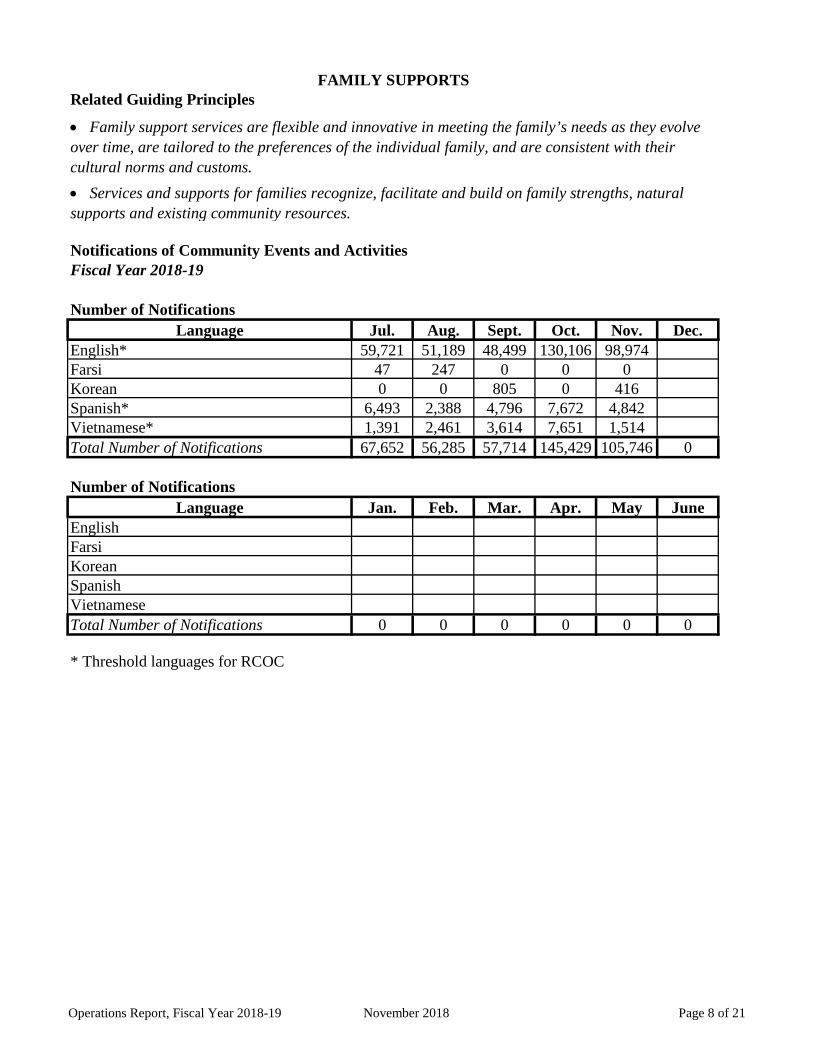
Operations Report, Fiscal Year 2018-19 November 2018 Page 8 of 21
Related Guiding Principles
Language Jul. Aug. Sept. Oct. Nov. Dec.English* 59,721 51,189 48,499 130,106 98,974Farsi 47 247 0 0 0Korean 0 0 805 0 416Spanish* 6,493 2,388 4,796 7,672 4,842Vietnamese* 1,391 2,461 3,614 7,651 1,514Total Number of Notifications 67,652 56,285 57,714 145,429 105,746 0
Language Jan. Feb. Mar. Apr. May JuneEnglishFarsiKoreanSpanishVietnameseTotal Number of Notifications 0 0 0 0 0 0
* Threshold languages for RCOC
Fiscal Year 2018-19
Number of Notifications
Number of Notifications
FAMILY SUPPORTS
• Family support services are flexible and innovative in meeting the family’s needs as they evolve over time, are tailored to the preferences of the individual family, and are consistent with their cultural norms and customs.• Services and supports for families recognize, facilitate and build on family strengths, natural supports and existing community resources.
Notifications of Community Events and Activities
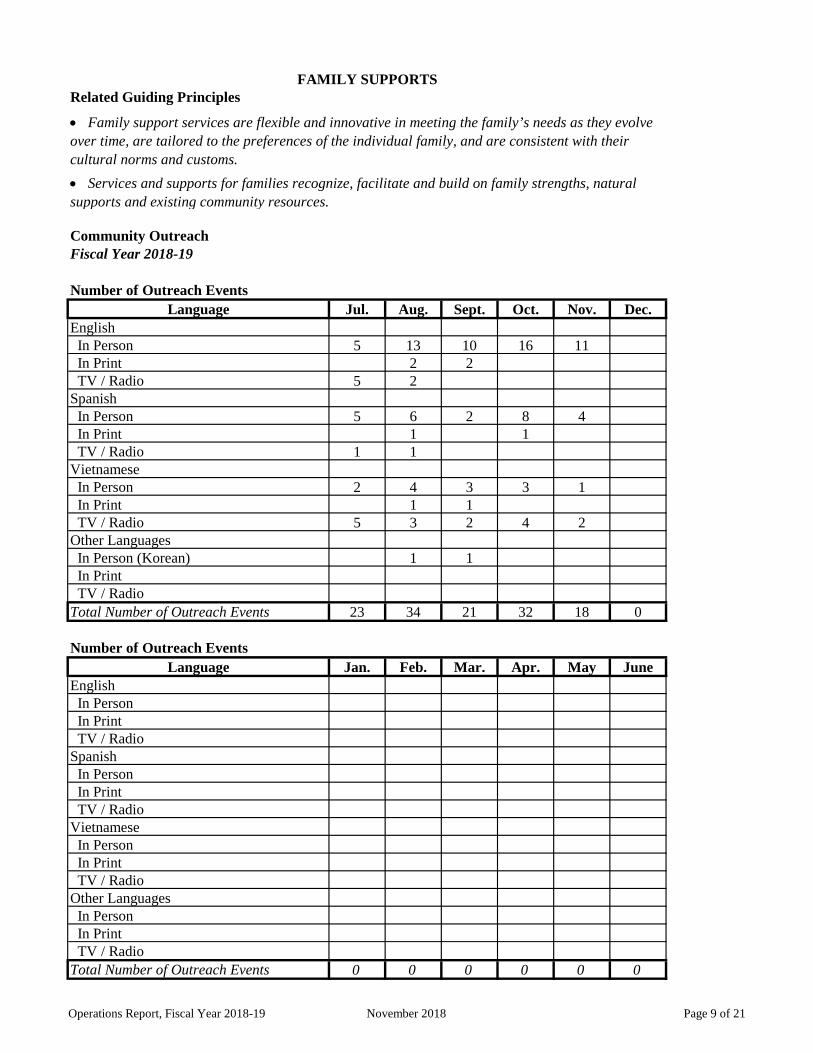
Operations Report, Fiscal Year 2018-19 November 2018 Page 9 of 21
Related Guiding Principles
Language Jul. Aug. Sept. Oct. Nov. Dec.English In Person 5 13 10 16 11 In Print 2 2 TV / Radio 5 2Spanish In Person 5 6 2 8 4 In Print 1 1 TV / Radio 1 1Vietnamese In Person 2 4 3 3 1 In Print 1 1 TV / Radio 5 3 2 4 2Other Languages In Person (Korean) 1 1 In Print TV / RadioTotal Number of Outreach Events 23 34 21 32 18 0
Language Jan. Feb. Mar. Apr. May JuneEnglish In Person In Print TV / RadioSpanish In Person In Print TV / RadioVietnamese In Person In Print TV / RadioOther Languages In Person In Print TV / RadioTotal Number of Outreach Events 0 0 0 0 0 0
Number of Outreach Events
FAMILY SUPPORTS
• Family support services are flexible and innovative in meeting the family’s needs as they evolve over time, are tailored to the preferences of the individual family, and are consistent with their cultural norms and customs.• Services and supports for families recognize, facilitate and build on family strengths, natural supports and existing community resources.
Community OutreachFiscal Year 2018-19
Number of Outreach Events

Operations Report, Fiscal Year 2018-19 November 2018 Page 10 of 21
Related Guiding Principles
Fiscal Year 2018-19
Developmental Screenings by Ethnicity Jul. Aug. Sept. Oct. Nov. Dec.American Indian or Alaska Native 0 1 0 0Asian 7 4 0 4Black/African American 3 0 0 0Hispanic 38 60 25 111Native Hawaiian or Other Pacific Islander 0 0 0 0Other Ethnicity or Race / Multi-Cultural 4 1 1 15White 6 5 0 13Total Number Screened 0 58 71 26 143
Total Number Referred to RCOC 0 20 20 2 23
Developmental Screenings by Ethnicity Jan. Feb. Mar. Apr. May June TotalAmerican Indian or Alaska Native 1Asian 11Black/African American 3Hispanic 98Native Hawaiian or Other Pacific Islander 0Other Ethnicity or Race / Multi-Cultural 5White 11Total Number Screened 0 0 0 0 0 298Total Number Referred to RCOC 65
EARLY INTERVENTION / PREVENTION
• Prevention and early intervention services, supports and public awareness activities are designed and implemented to prevent the onset of a disability and/or to improve developmental outcomes.• Persons served are provided with needed services and supports in a family-focused and collaborative fashion.
No
Dat
a A
vaila
ble

Operations Report, Fiscal Year 2018-19 November 2018 Page 11 of 21
Related Guiding Principles
Persons Served Persons Served Persons ServedAll Under 18 Over 18
With Family 17,300 10,084 7,216Not With Family 4,268 250 4,018
Total 21,568 10,334 11,234
LIVING OPTIONS
• Culturally-sensitive services and supports are provided so that persons served can make informed choices on where and with whom they live, including owning or renting their own homes.• Families whose minor or adult children choose to remain in the family home are supported through available resources.• Persons served live in homes where they receive quality care and can form relationships.
Where Persons Served Live
With Family, 10,084, 98%
Not With Family, 250, 2%
Where Persons Served Under 18 Live
With Family, 7,216, 64%
Not With Family, 4,018, 36%
Where Persons Served Over 18 Live

Operations Report, Fiscal Year 2018-19 November 2018 Page 12 of 21
All Persons Served Persons ServedPersons Served Under 18 Over 18
Family Home 17,300 10,084 7,216Community Care Facility 1,667 41 1,626State Developmental Center 58 0 58Family Home Agency 89 0 89Foster Home 214 206 8Intermediate Care Facility 742 3 739Independent Living 838 0 838Supported Living 480 0 480Skilled Nursing 92 0 92Other* 88Total 21,568 10,334 11,146
Other*Acute General Hospital 4 0 4California Youth Authority 0 0 0Community Treatment 1 0 1Correctional Institution 0 0 0County Jail 2 0 2Other 0 0 0Out of State 3 0 3Psychiatric Treatment 7 1 6Rehabilitation Center 4 1 3SDC / State Hospital 0 0 0Sub-Acute 48 23 25Transient / Homeless 15 0 15Total, Other* 84 25 59
LIVING OPTIONS, continued
Where Persons Served Live
Community Care Facility, 1,667, 39%
State Developmental Center, 58, 1%
Family Home Agency, 89, 2%
Foster Home, 214, 5%
Intermediate Care Facility, 742, 18%
Independent Living, 838, 20%
Supported Living, 480, 11%
Skilled Nursing, 92, 2%
Other*, 88, 2%
Where Persons Served Live When Not With Family

Operations Report, Fiscal Year 2018-19 November 2018 Page 13 of 21
Other Living Options
Family Home Agency
Foster Family Agency
Independent Living
Supported Living
Other Living Options Total Under 18 Over 18Family Home Agency 89 0 89Foster Family 214 206 8Independent Living 838 0 838Supported Living 480 0 480Total 1,621 206 1,415
LIVING OPTIONS, continued
A Family Home Agency (FHA) is a private, not-for-profit agency that is vendored to recruit, approve, train, and monitor family home providers, provide services and supports to family home providers, and assist persons served with moving into or relocating from family homes.
Under the California Department of Social Services, county placement agencies use licensed, private Foster Family Agencies (FFAs) for the placement of children. By statute, FFAs are organized and operated on a non-profit basis and are engaged in the following activities: recruiting, certifying, and training foster parents, providing professional support to foster parents, and finding homes or other temporary or permanent placements for children who require more intensive care.
Independent Living services help persons served over 18 with the functional skills necessary to secure a self-sustaining, independent living situation in the community and/or may provide the support necessary to maintain those skills.
Supported Living Services (SLS) support efforts for persons served to live in their own home.
Family Home Agency, 89, 5%
Foster Family, 214, 13%
Independent Living, 838, 52%
Supported Living, 480, 30%
Other Living Options

Operations Report, Fiscal Year 2018-19 November 2018 Page 14 of 21
Health Licensed Facilities
General Acute Care Hospitals,Acute Psychiatric Hospitals,Skilled Nursing Facilities,Intermediate Care Facilities,Intermediate Care Facility – Developmentally Disabled,Intermediate Care Facility – Developmentally Disabled, – Habilitative,Intermediate Care Facility – Developmentally Disabled, – Nursing,Home Health Agencies andCongregate Living Health Facilities.
LIVING OPTIONS, continued
SERVICE LEVEL 4: Care, supervision, and professionally supervised training for persons with deficits in self-help skills, and/or severe impairment in physical coordination and mobility, and/or severely disruptive or self-injurious behavior. Service Level 4 is subdivided into Levels 4A through 4I, in which staffing levels are increased to correspond to the escalating severity of disability levels.
Living Options, facilities licensed by the State of California, Departments of Community Care Licensing, or Department of Health Care Services
Community Care Licensed Facilities
SERVICE LEVEL 1: Limited care and supervision for persons with self-care skills and no behavior problems. SERVICE LEVEL 2: Care, supervision, and incidental training for persons with some self-care skills and no major behavior problems.SERVICE LEVEL 3: Care, supervision, and ongoing training for persons with significant deficits in self-help skills, and/or some limitations in physical coordination and mobility, and/or disruptive or self-injurious behavior.
Health facilities are licensed by the State of California, Department of Health Services to provide 24-hour medical residential care. Health facilities are funded by Medi-Cal. Health licensed facilities
Community Care Facilities (CCFs) are licensed by the State of California, Department of Social Services, Community Care Licensing Division to provide 24-hour non-medical residential care to children and adults with developmental disabilities who are in need of personal services, supervision, and/or assistance essential for self-protection or sustaining the activities of daily living. CCFs are funded by regional centers. Based upon the types of services provided and the persons served, each CCF vendored by a regional center is designated one of the following service levels:

Operations Report, Fiscal Year 2018-19 November 2018 Page 15 of 21
Fiscal Year 2018-19
Licensed Facilities Total Over 18 Under 18Level 2 340 340 0Level 3 365 365 0Level 4A 44 44 0Level 4B 5 5 0Level 4C 51 51 0Level 4D 44 44 0Level 4E 31 31 0Level 4F 68 68 0Level 4G 29 29 0Level 4H 4 4 0Level 4I 365 353 12Elderly 1 1 0ICF/DD-H 2 2 0ICF/DD-N 3 3 0ICF/DD 0 0 0Skilled Nursing 0 0 0Total 1,352 1,340 12
Licensed Facilities Summary Total Over 18 Under 18Level 2 340 340 0Level 3 365 365 0Level 4 641 629 12ICF/DD-H 2 2 0ICF/DD-N 3 3 0Elderly 1 1 0Skilled Nursing 0 0 0Total 1,352 1,340 12
Persons Served Who Reside in Licensed Facilities Funded by RCOC
LIVING OPTIONS, continued

Operations Report, Fiscal Year 2018-19 November 2018 Page 16 of 21
Jan. Mar. Apr. May June Total
Jan. Feb. Mar. Apr. May June Total
Level 2, 340, 25%
Level 3, 365, 27%
Level 4, 641, 48%
ICF/DD-H, 2, 0% ICF/DD-N, 3, 0%
Elderly, 1, 0%
Skilled Nursing, 0, 0%
Persons Served Who Reside in Licensed Facilities Services Funded by RCOC
Level 2, 340, 26%
Level 3, 365, 27%
Level 4, 629, 47%
ICF/DD-H, 2, 0%
ICF/DD-N, 3, 0% Elderly, 1, 0%
Skilled Nursing, 0, 0%
Persons Served Over Age 18 Who Reside in Licensed Facilities Services Funded by RCOC
Level 2, 0, 0% Level 3, 0, 0%
Level 4, 12, 100%
ICF/DD-H, 0, 0% ICF/DD-N, 0, 0%
Elderly, 0, 0% Skilled Nursing, 0, 0%
Persons Served Under Age 18 Who Reside in Licensed Facilities Services Funded by RCOC

Operations Report, Fiscal Year 2018-19 November 2018 Page 17 of 21
Related Guiding Principle
Persons ServedOver 18
Comm. Activities Support Svcs. 976Activity Center 647Adult Development 2,212Behavior Management 485Supported Employment Group 303Supported Employment Ind. 504Work Activity 164Total 5,291
Definitions:
Supported Employment Program means a program that meets the requirements of the term supported employment, i.e. services that are provided by a job coach in order to support and maintain an individual with developmental disabilities in employment, and of the terms, integrated work, supported employment placement, allowable supported employment services, group and individualized services. Staff ratio ranges from 1:1 to 1:4.
Work Activity Program includes, but is not limited to, Work Activity centers or settings that provide support to persons served engaged in paid work and have demonstrated that the program is in compliance with Department of Rehabilitation certification standards or are accredited by CARF. Staff ratio ranges from 1:12 to 1:20.
• Persons served have the opportunity and support to work in integrated employment settings that are meaningful, valued by the community, and in which they are appropriately compensated and respected.
WORK
Activity Center means a day program that serves adults who generally have acquired most basic self-care skills, have some ability to interact with others, are able to make their needs known, and respond to instructions. Activity center programs focus on the development and maintenance of the functional skills required for self-advocacy, community integration and employment. Staff ratio ranges from 1:6 to 1:8.
Adult Development Center means a day program that serves adults who are in the process of acquiring self-help skills. Individuals who attend adult development centers generally need sustained support and direction in developing the ability to interact with others, to make their needs known, and to respond to instructions. Adult development center programs focus on the development and maintenance of the functional skills required for self-advocacy, community integration, employment, and self-care. Staff ratio ranges from 1:3 to 1:4.
Behavior Management Program means a day program that serves adults with severe behavior disorders and/or dual diagnosis who, because of their behavior problems, are not eligible for or acceptable in any other community-based day program. Staff ratio is 1:3.
Adult Day & Employment Services
Community Activities Support Services similar to a Behavior Management Program, this is a behavior management program with an enhanced ration of 1:1 or 1:2 due to severe behavioral challenges.
Comm. Activities Support
Svcs., 976, 18%
Activity Center, 647,
12%
Adult Development,
2,212, 42%
Behavior Management,
485, 9%
Supported Employment Group, 303,
6% Supported Employment
Ind., 504, 10%
Work Activity, 164,
3%

Operations Report, Fiscal Year 2018-19 November 2018 Page 18 of 21
Related Guiding Principles
Service CoordinationFiscal Year 2018-19
Service Coordination: Jul. Aug. Sept. Oct. Nov. Dec.Number of Service Coordinators (SC) 299.0 298.0 304.0 305.0 312.0Number of Case-Carrying SCs 271.0 269.0 274.0 275.0 282.0Number of Intake SCs 28.0 29.0 30.0 30.0 30.0Number of State Developmental Center SCs 0.0 0.0 0.0 0.0 0.0Number of Active Persons Served 21,330 21,329 21,386 21,449 21,492Caseload Ratio, # of Active Persons Served/SCs 78.7 79.3 78.1 78.0 76.2
Service Coordination: Jan. Feb. Mar. Apr. May JuneNumber of Service Coordinators (SC)Number of Case-Carrying SCsNumber of Intake SCsNumber of State Developmental Center SCsNumber of Active Persons ServedCaseload Ratio, # of Active Persons Served/SCs
• Services and supports are sensitive to the diverse religious, cultural, language, socioeconomic and ethnic characteristics of persons' served and their families' communities.
SERVICE PLANNING AND COORDINATION
• Services and supports assist person served and their families to develop support networks leading to reduced dependence on paid supports.
• Service coordinators are caring, knowledgeable and competent in service planning, coordination and resources. • Service coordinators inform families of their rights and the services and supports available to them.• Service planning and coordination is a collaborative effort between RCOC, persons served and their families to identify needed services and supports.• Person-centered planning is based upon the choices and preferences of the persons served and their families, and the identification of generic services and natural supports.

Operations Report, Fiscal Year 2018-19 November 2018 Page 19 of 21
Jul. Aug. Sept. Oct. Nov. Dec. Jan. Feb. Mar. Apr. May JuneNumber of Unsettled Hearing Requests* 13 9 9 9 12
5 4 3 4 0Behavioral services 0 0 0 1 7Respite 3 2 1 2 3Day Care 0 0 0 0 0ILS/SLS 0 0 0 0 0Personal Assistance 1 1 1 0 0Other** 4 2 4 2 2
Number of New Hearing Requests Filed* 3 2 5 7 6Eligibility - Lanterman 2 2 1 3 4Eligibility - Early Start 0 0 0 0 0Behavioral services 0 0 0 1 2Respite 0 0 0 2 0Day Care 0 0 0 0 0Social/Recreational 0 0 0 0 0Personal Assistance 0 0 0 0 0Other** 1 0 4 1 0
Number of All Meetings Held 3 2 6 4 3Number of Informal Meetings Held 3 2 5 4 1Number of Mediations Held 0 0 1 0 1Number of SLFHs Held 0 0 0 0 1
5 0 3 2 4* Meetings in process of being scheduled; meetings on schedule but not yet held; meetings scheduled but not held due to continuances.
Number of Requests Pending* 0 0 0 0 1* State Level Fair Hearing (SLFH) held but awaiting decision.
Number of Requests Settled 0 2 6 3 40 0 0 0 0
Settled in Informal 1 2 5 3 2Settled after further follow-up by RCOC 2 0 0 0 1Settled in Mediation 0 0 1 0 1SLFH Decision 0 0 0 0 0
State Level Fair Hearing DecisionsPrevailing Party
0 0 0 0 00 0 0 0 00 0 0 0 0
Number of Requests in Scheduling*
RCOCPerson Served/Family
Split
SERVICE PLANNING AND COORDINATION continued
** Other issues include but are not limited to living options.* Hearing Requests may list more than one issue; so, the number of issues may equal more than the number of hearing requests.
* Hearing Requests may list more than one issue; so, the number of issues may equal more than the number of hearing requests.** Other issues include but are not limited to living options.
Eligibility - Lanterman
Withdrawn by Person Served/Family
Fiscal Year 2018-19Fair Hearings

Operations Report, Fiscal Year 2018-19 November 2018 Page 20 of 21
Guiding Principle
Adult Day 507 258 0 58 0 823Behavioral 137 85 0 16 0 238Education 0 0 0 0 0 0Eligibility/Health 69 1 0 8 0 78Early Start 894 93 0 83 0 1,070Living Options 158 145 0 1 0 304Supported/Ind. 202 96 0 9 0 307All Others 814 57 0 54 0 925Monthly Total 2,781 735 0 229 0 3,745
FY 2018-19Total to Date 3,128 1,168 0 276 0 4,572
ADMINISTRATION AND GOVERNANCE
TotalPending/DeferredDisposition Approved Consultation Denied Planning
Team
Resource Group Activity for November 2018 and Fiscal Year to Date
• RCOC will maximize all alternative sources of funding for necessary services and supports including federal and generic funding.• The public funds that support the service system are expended in a fashion that is cost-effective, consumer-directed, consistent with good business practices, and that reflect RCOC’s Guiding Principles and diligent stewardship.
Approved, 2,781, 74%
Consultation, 735, 20%
Denied, 0, 0%
Pending/ Deferred, 229,
6%
Planning Team, 0, 0%
Resource Group Activity For Current Month

Operations Report, Fiscal Year 2018-19 November 2018 Page 21 of 21
About Persons Served Early Start
Medicaid Waiver
All Other SDC Total Under 18 Over 18
Number of Persons Served 3,586 8,098 9,826 58 21,568 10,334 11,234Percentage of Total 17% 38% 46% 0% 100% 48% 52%
392
Persons Served by Residence Status All Under 18 Over 18 Year to
DateFamily Home 17,300 10,084 7,216 21Community Care Facility 1,667 41 1,626 124State Developmental Center 58 0 58 149Family Home Agency 89 0 89 90Foster Home 214 206 8 249Intermediate Care Facility 742 3 739 60Independent Living 838 0 838 20Supported Living 480 0 480 15Skilled Nursing 92 0 92 208Other 0 0 0Total 21,480 10,334 11,146 936
Number of Licensed Facilities Total Under 18 Over 18 Year to Date
Community Care Facilities 190Level 2 80 0 80 246Level 3 71 1 70 436Level 4 159 13 146 0Total Community Care Facilities 310 14 296 949
40
ICF-DD 1 1ICF-DD/Habilitation 83 $4,521ICF-DD/Nursing 39Total ICF Facilities 123
Total Licensed Facilities 433
Intermediate Care Facilities (ICF)
Rights
Special Incident Investigations
Total
Licensed Facility Monitoring
Arrest
AWOLAbuse
Amount of Recovery from Audits
Annual ReviewUnannounced Total Number of ReviewsProvider Trainings
Corrective Action Plans
Number of Audits
Operations Report Summary - November 2018
Victim of crime
Technical Support
NeglectInjuryHospitalizations - Total Death
Children served in Prevention Resource and Referral Services

RCOC 11/01/18 All RCOC # Goal Percentage # AttainedDevelopmental Center (DC) 21,496 57 0 0.27% -57Children in Foster Homes (FH) 10,331 207 215 2.00% -8Children Own Home Parent/Guardian 10,331 10,053 10,100 97.31% -47Total # Children (FH,Parent/Guardian) 10,331 10,260 10,315 99.31% -55Adult FHA 11,108 90 101 0.81% -11Independent Living (IL) 11,108 841 851 7.57% -10Adults Residing Own Home - Parent 11,108 7,193 7,250 64.76% -57Supported Living (SL) 11,108 476 477 4.29% -1Total # Adults (FHA, IL,Parent/Guardian, SL) 11,108 8,600 8,679 77.42% -79Children Residing in a CCF (7+ beds) 10,331 1 0 0.01% -1Children Residing in a ICF (7+ beds) 10,331 2 0 0.02% -2Children Residing in a Nursing Facility (7+ beds) 10,331 0 0 0.00% 0Total Children Residing in 7+ bed facilities 10,331 3 0 0.03% -3Adults Residing in a CCF (7+ beds) 11,108 154 145 1.39% -9Adults Residing in a ICF (7+ beds) 11,108 79 55 0.71% -24Adults Residing in a Nursing Facility (7+ beds) 11,108 90 80 0.81% -10Total Adults Residing in 7+ bed facilities 11,108 323 280 2.91% -43Total Individuals Over Age 3 with <=120 days 230 224 100.00% 100.00% 97.39%Total Individuals Over Age 3 with 121-240 days 230 6 0.00% 2.61% 2.61%Total Individuals Over Age 3 Over 240 days 230 0 0.00% 0.00% 0.00%Adults with Integrated Employment Goal 11,108 47% 50%Total Number of Incentive Payments Made 11,108Avg. Wage and Hour After Incentive Payment 11,108Number of 16-64 Earned Income 11,108 2,058Percentage of 16-64 Earned Income 11,108 18.60%Annual Earnings of 16-64 11,108 $7,385Number of Adults in CIE After Paid Intern 11,108Percentage Adults Transitioned Internship to CIE 11,108Total Annual Expenditures Residence/Ethnicity 21,496Number and Percent Race/Ethnicity Satisfied with Services 21,496Number and Percent Families by Race/Ethnicity IPP/IFSP Includes Needed Services 21,496
Performance Contract Summary

= Exceeded Regional Center of Orange County Goal
= Better than Statewide Average
= Below Regional Center of Orange County Goal
= Met or Exceeded Regional Center of Orange County Goal
= Met Regional Center of Orange County Goal
There will be a variance between consumer data in the Operations Report and the Performance Contract. Consumer data for the Operations Report and the Performance Contract are produced on different dates and from different databases. The Operations Report numbers are based on RCOC’s local database as of the end of the month. The Performance Contract numbers are based on RCOC’s information as submitted to DDS on a different date.
Performance Contract 2018 Cover Sheet
Below Goal
Met Goal
Exceeded Goal
Met or Exceeded
Goal

Compliance Measure Outcome
Unqualifed audit with no material findings Yes
Substantial compliance with DDS fiscal audit Yes
Accuracy percent of POS fiscal projections Yes
Operates within OPS budget Yes
Certified to participate in Waiver Yes
Compliance with vendor audit requirements per contract, Article III, sec. 10 Met
CDER/ESR current 99.88
Intake/Assessment and IFSP (0-2) 99.52
IPP development biennial Annual, 99.46
IFSP development 69.28
Performance Contract 2018
A. Regional Center of Orange County will maintain compliance in the following areas based upon criteria set forth in RCOC's contract with the Department of Developmental Services.

PercentageAll
consumersConsumers
in DCStatewide Average 0.16% 326,687 525RCOC Public Hearing 8/15/18 0.28% 21,293 59 Goal % # AttainedRCOC 11/01/18 0.27% 21,496 57 0 0.27% -57Analysis as of Public Hearing 6.52% 11.24%
Planned Activities
Total Active Caseload Goal DC % Number Attained
Jan-18 20,936 56 67 0.32% -11Feb-18 20,943 56 66 0.32% -10Mar-18 21,070 56 62 0.29% -6Apr-18 21,049 56 61 0.29% -5
May-18 21,201 56 59 0.28% -3Jun-18 21,264 56 59 0.28% -3Jul-18 21,376 56 59 0.27% -3
Aug-18 21,373 56 59 0.28% -3Sep-18 21,438 0 57 0.27% -57Oct-18 21,496 0 57 0.27% -57
Nov-18 0Dec-18 0
Number of Persons Served Residing DCs
Progress: In FY 2017-2018, RCOC moved 13 persons served from Developmental Centers into the community. During Public Meetings in August 2018, RCOC had 59 persons served, or 0.28%, in Developmental Centers. During this period, RCOC's overall caseload grew as a result of families and residents requesting a case transfer in order to continue residing in Orange County.
Statement: The Regional Center of Orange County (RCOC) is committed to providing assistance to individuals and their families who choose to move from a State Developmental Center (SDC) into a less restrictive environment within their home communities.
Objective: RCOC will continue to seek new and innovative methods of utilizing available resources, developing non-existing resources, and creating and implementing transition plans that will allow individuals to establish themselves and participate successfully in their home community living arrangements.• Implementation of Community Placement Plan for FYs 2017-2018 and 2018-2019.
RCOC % of DD population RCOC % of DC population
Performance Contract 2018
I. Developmental Center
A. Total number and % of regional center caseload in developmental centers.
Below Goal
Planned ActivitiesStatement: The Regional Center of Orange County ensures that children will reside with their families by providing the needed supports and services regardless of the severity of the child’s disability.
Objectives: Service Coordinators continue to identify, publicize and facilitate access to supports and services for children with developmental disabilities who are considered at risk for out-of-home placement. RCOC will hold an annual presentation on supports and services for persons served including residential and vocational (day services) and other generic resources.
• RCOC will work with the Orange County community in effort to support programs, trainings and services designed to provide equal access to child care for families of children with special needs (autism).
• RCOC will ensure that persons served are provided opportunities for safety awareness training through schools and other similar programs available.
• Continue to develop innovative resources for children 0-3 years old (i.e., respite placement).
• Continue to assess current supports and services.
• RCOC will assure that persons served and their caregivers receive complete assessments and have the opportunity to ask questions, advocate, and access to services. To be evaluated and monitored by a National Core Indicators (NCI) survey of persons served and their caregivers.
• Review and revise services, e.g. respite and family support.
• RCOC will assure that families receive full information about the developmental needs of the persons served and what types of services are available.
Performance Contract 2018
II. Children Residing with Families (Child is defined as under 18 years of age).

Percentage All children Children in
FH
Statewide Average 2.69% 162,096 4,368RCOC Public Hearing 8/15/18 1.81% 10,270 186 Goal % # Attained
RCOC 11/01/18 2.00% 10,331 207 215 2.00% -8Analysis as of Public Hearing 6.34% 4.26%
Total Children
Status 1&2 GoalChildren in
Foster Homes %Number Attained
Jan-18 10,052 175 144 1.43% -31Feb-18 10,041 175 151 1.50% -24Mar-18 10,128 175 165 1.63% -10Apr-18 10,154 175 176 1.73% 1May-18 10,218 175 180 1.76% 5Jun-18 10,292 175 187 1.82% 12Jul-18 10,311 175 185 1.79% 10
Aug-18 10,278 175 191 1.86% 16Sep-18 10,313 215 205 1.99% -10Oct-18 10,331 215 207 2.00% -8
Nov-18 215Dec-18 215
RCOC % of DD population RCOC % of FH population
Progress: A. During public meetings, RCOC had 186, or 1.81%, children in foster homes.
Number and % of regional center children in foster homes.
Below Goal

Percentage All children
Children in own home
Parent/ Guardian
Statewide Average 96.65% 162,096 156,660RCOC Public Hearing 8/15/18 97.38% 10,270 10,001 Goal % # Attained
RCOC 11/01/18 97.31% 10,331 10,053 10,100 97.31% -47Analysis as of Public Hearing 6.34% 6.38%
Total Children
Status 1&2 Goal
Children in own home
Parent/ Guardian %
Number Attained
Jan-18 10,052 9,800 9,832 97.81% 32Feb-18 10,041 9,800 9,813 97.73% 13Mar-18 10,128 9,800 9,889 97.64% 89Apr-18 10,154 9,800 9,900 97.50% 100May-18 10,218 9,800 9,959 97.47% 159Jun-18 10,292 9,800 10,023 97.39% 223Jul-18 10,311 9,800 10,046 97.43% 246
Aug-18 10,278 9,800 10,009 97.38% 209Sep-18 10,313 10,100 10,032 97.28% -68Oct-18 10,331 10,100 10,053 97.31% -47
Nov-18 10,100Dec-18 10,100
Progress: B. During public meetings, RCOC had 10,001, or 97.38%, of children in own home-parent/guardian.
RCOC % of DD population RCOC % of FH population
Number and % of regional center children in own home-parent/guardian.
Below Goal

Percentage All children
Total Number
Children in Homes
Statewide Average 99.34% 162,096 161,028RCOC Public Hearing 8/15/18 99.19% 10,270 10,187 Goal % # Attained
RCOC 11/01/18 99.31% 10,331 10,260 10,315 99.31% -55Analysis as of Public Hearing 6.34% 6.33%
Total Children
Status 1&2 Goal
Total Number
Children in Homes %
Number Attained
Jan-18 10,052 9,975 9,976 99.24% 1Feb-18 10,041 9,975 9,964 99.23% -11Mar-18 10,128 9,975 10,054 99.27% 79Apr-18 10,154 9,975 10,076 99.23% 101May-18 10,218 9,975 10,139 99.23% 164Jun-18 10,292 9,975 10,210 99.20% 235Jul-18 10,311 9,975 10,231 99.22% 256
Aug-18 10,278 9,975 10,200 99.24% 225Sep-18 10,313 10,315 10,237 99.26% -78Oct-18 10,331 10,315 10,260 99.31% -55
Nov-18 10,315Dec-18 10,315
RCOC % of DD population RCOC % of FH population
Progress: C. During public meetings, RCOC had 10,187, or 99.19%, of children in homes.
Total number and % of regional center children in homes (This is a total of sections A and B above).
Below Goal

Planned ActivitiesStatement: RCOC works with persons served and their caregivers and advocates to empower and enable them to assert the rights of persons served to determine and control the living arrangements of their choice. This may include owning, renting, or leasing the home where the persons served resides.
Objective: Using the Person Centered Thinking (PCT) Individual Program Planning process, Service Coordinators will continue to identify regional center adult persons served who have the hopes and desires to live in a new living arrangement. Cases are reviewed at least annually for the least restrictive environment.
• RCOC will provide service coordinator training to assist families in establishing maintenance plans in the event of temporary caregiver illness/incapacity and for eventual transition plans.
• RCOC will request vendors to include successionary maintenance and transitional plans in the event of temporary illness/incapacity and transfer of ownership in their Program Design.
• RCOC will ensure that persons served are provided opportunities for safety awareness training on a regular and as needed basis.
• RCOC will review and revise services, e.g. respite and family support.
• RCOC will assure that persons served and their caregivers receive complete assessments and have opportunity to ask questions, advocate, and access services. To be evaluated and monitored by an NCI survey of persons served and their caregivers.
Performance Contract 2018
III. Adults Residing in Home Settings

PercentageTotal Adults
status 2Adults in
FHA
Statewide Average 0.97% 164,066 1,588RCOC Public Hearing 8/15/18 0.84% 10,964 92 Goal % # Attained
RCOC 11/01/18 0.81% 11,108 90 101 0.81% -11Analysis as of Public Hearing 6.68% 5.79%
Total Adults
Status 2 GoalAdults in
FHA %Number Attained
Jan-18 10,817 100 94 0.87% -6Feb-18 10,836 100 99 0.86% -7Mar-18 10,880 100 92 0.85% -8Apr-18 10,895 100 88 0.81% -12
May-18 10,924 100 91 0.83% -9Jun-18 10,972 100 92 0.84% -8Jul-18 11,006 100 90 0.82% -10
Aug-18 11,036 100 92 0.83% -8Sep-18 10,068 101 94 0.85% -7Oct-18 11,108 101 90 0.81% -11
Nov-18 101Dec-18 101
RCOC % of DD population RCOC % of FH population
Progress: A. During public meetings, RCOC had 92, or 0.84%, of adults residing in Adult FHA.
Total number and % of regional center adult caseload residing in an Adult Family Home Agency (FHA).
Below Goal

PercentageTotal Adults
status 2
Adults in Independent
Living
Statewide Average 10.56% 164,066 17,325RCOC Public Hearing 8/15/18 7.62% 10,964 835 Goal % # Attained
RCOC 11/01/18 7.57% 11,108 841 851 7.57% -10Analysis as of Public Hearing 6.68% 4.82%
Total Adults
Status 2 Goal
Adults in Independent
Living %Number Attained
Jan-18 10,817 850 835 7.72% -15Feb-18 10,836 850 830 7.66% -20Mar-18 10,880 850 839 7.71% -11Apr-18 10,895 850 842 7.73% -8
May-18 10,924 850 835 7.64% -15Jun-18 10,972 850 836 7.62% -14Jul-18 11,006 850 837 7.60% -13
Aug-18 11,036 850 841 7.62% -9Sep-18 11,068 851 840 7.59% -11Oct-18 11,108 851 841 7.57% -10
Nov-18 851Dec-18 851
RCOC % of DD population RCOC % of FH population
Progress: B. During public meetings, RCOC had 835, or 7.62%, of adults residing in independent living.
Total number and % of regional center adults residing in independent living.
Below Goal

PercentageTotal Adults
status 2
Adults Residing
Own Home - Parent
Statewide Average 62.93% 164,066 103,243RCOC Public Hearing 8/15/18 60.89% 10,964 6,676 Goal % # Attained
RCOC 11/01/18 64.76% 11,108 7,193 7,250 64.76% -57Analysis as of Public Hearing 6.68% 6.47%
Total Adults
Status 2 Goal
Adults Residing
Own Home - Parent %
Number Attained
Jan-18 10,817 6,985 6,924 64.01% -61Feb-18 10,836 6,985 6,947 64.11% -38Mar-18 10,880 6,985 6,977 64.13% -8Apr-18 10,895 6,985 7,000 64.25% 15
May-18 10,924 6,985 7,028 64.34% 43Jun-18 10,972 6,985 7,073 64.46% 88Jul-18 11,006 6,985 7,102 64.53% 117
Aug-18 11,036 6,985 7,138 64.48% 153Sep-18 11,068 7,250 7,166 64.75% -84Oct-18 11,108 7,250 7,193 64.76% -57
Nov-18 7,250Dec-18 7,250
RCOC % of DD population RCOC % of FH population
Progress: C. During public meetings, RCOC had 7,069, or 64.47%, of adults residing in own home-parent.
Total number and % of regional center adults residing in own home-parent.
Below Goal

PercentageTotal Adults
status 2
Adults Residing
Supported Living
Statewide Average 5.45% 164,066 8,940RCOC Public Hearing 8/15/18 4.36% 10,964 478 Goal % # Attained
RCOC 11/01/18 4.29% 11,108 476 477 4.29% -1Analysis as of Public Hearing 6.68% 5.35%
Total Adults
Status 2 Goal
Adults Residing
Supported Living %
Number Attained
Jan-18 10,817 471 471 4.35% 0Feb-18 10,836 471 472 4.36% 1Mar-18 10,880 471 474 4.36% 3Apr-18 10,895 471 474 4.35% 3
May-18 10,924 471 481 4.40% 10Jun-18 10,972 471 479 4.37% 8Jul-18 11,006 471 479 4.35% 8
Aug-18 11,036 471 471 4.29% 2Sep-18 11,068 477 471 4.26% -6Oct-18 11,108 477 476 4.29% -1
Nov-18 477Dec-18 477
Progress: D. During public meetings, RCOC had 478, or 4.36%, of adults residing in supported living.
RCOC % of DD population RCOC % of FH population
Total number and % of regional center adults residing in supported living.
Below Goal

PercentageTotal Adults
status 2
Total Number Adults in
Home Settings
Statewide Average 79.90% 164,066 131,096RCOC Public Hearing 8/15/18 77.29% 10,964 8,474 Goal % # Attained
RCOC 11/01/18 77.42% 11,108 8,600 8,679 77.42% -79Analysis as of Public Hearing 6.68% 6.46%
Total Adults
Status 2 Goal
Total Number Adults in
Home Settings %
Number Attained
Jan-18 10,817 8,406 8,324 76.95% -82Feb-18 10,836 8,406 8,342 76.98% -64Mar-18 10,880 8,406 8,382 77.04% -24Apr-18 10,895 8,406 8,404 77.14% -2
May-18 10,924 8,406 8,435 77.22% 29Jun-18 10,972 8,406 8,480 77.29% 74Jul-18 11,006 8,406 8,508 77.30% 102
Aug-18 11,036 8,406 8,544 77.42% 138Sep-18 11,068 8,679 8,571 77.44% -108Oct-18 11,108 8,406 8,600 77.42% -79
Nov-18 8,406Dec-18 8,406
RCOC % of DD population RCOC % of FH population
Progress: E. During public meetings, RCOC had 8,474, or 77.29%, of adults residing in home-settings.
Total number and % of regional center adults in home settings (This is a total of sections A, B, C and D above).
Below Goal

Planned Activities
Statement: RCOC provides for the needs of children with medical issues or challenging behaviors in seven or greater bed facilities for limited time periods when smaller facilities cannot meet needs.
Objective: RCOC will place only those children with medical issues or challenging behaviors in seven or greater bed facilities. • RCOC will continue seeking appropriate placement in smaller facilities for these children and to support creative services and supports which would allow placement in existing small facilities, as well as development of new small facilities as needed, utilizing appropriate services and supports to ensure success for these persons served. • RCOC will adhere to Trailer Bill Language relating to the use of larger facilities to ensure the least restrictive environment is supported.
Performance Contract 2018
IV. Children Residing in Facilities with Seven or More Beds (Excluding Developmental Centers)
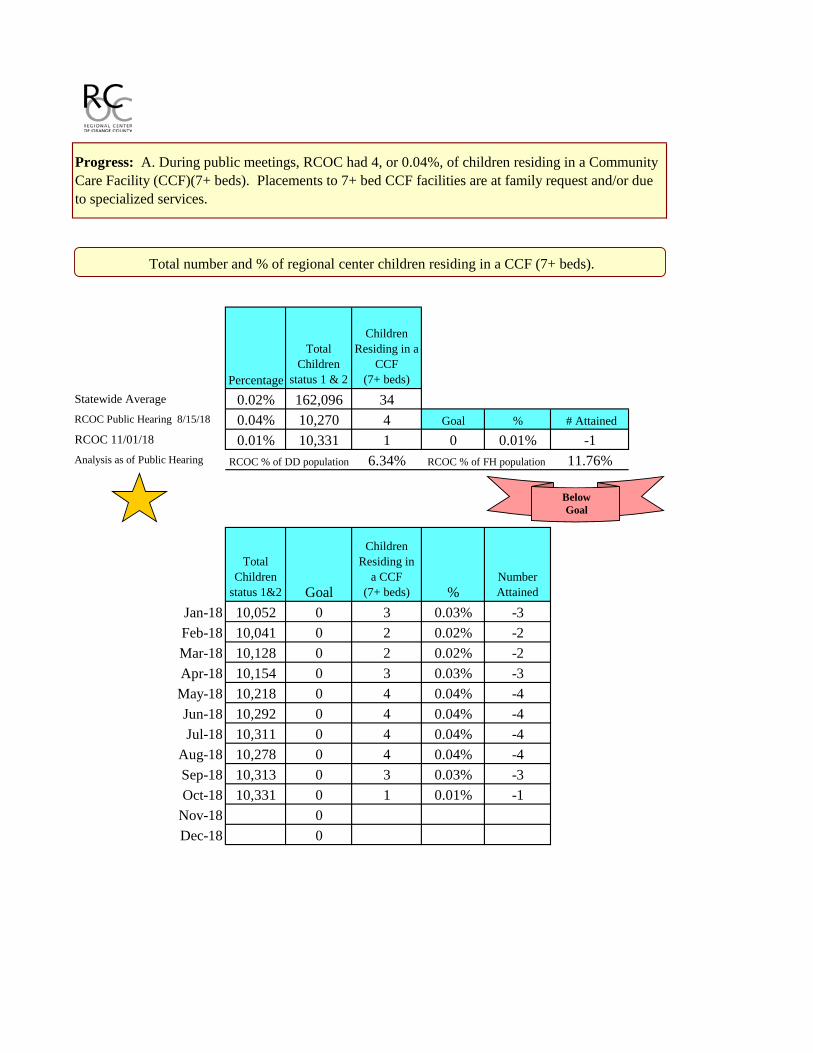
Percentage
Total Children
status 1 & 2
Children Residing in a
CCF (7+ beds)
Statewide Average 0.02% 162,096 34RCOC Public Hearing 8/15/18 0.04% 10,270 4 Goal % # AttainedRCOC 11/01/18 0.01% 10,331 1 0 0.01% -1Analysis as of Public Hearing 6.34% 11.76%
Total Children
status 1&2 Goal
Children Residing in
a CCF (7+ beds) %
Number Attained
Jan-18 10,052 0 3 0.03% -3Feb-18 10,041 0 2 0.02% -2Mar-18 10,128 0 2 0.02% -2Apr-18 10,154 0 3 0.03% -3May-18 10,218 0 4 0.04% -4Jun-18 10,292 0 4 0.04% -4Jul-18 10,311 0 4 0.04% -4
Aug-18 10,278 0 4 0.04% -4Sep-18 10,313 0 3 0.03% -3Oct-18 10,331 0 1 0.01% -1
Nov-18 0Dec-18 0
Progress: A. During public meetings, RCOC had 4, or 0.04%, of children residing in a Community Care Facility (CCF)(7+ beds). Placements to 7+ bed CCF facilities are at family request and/or due to specialized services.
RCOC % of DD population RCOC % of FH population
Total number and % of regional center children residing in a CCF (7+ beds).
Below Goal

Percentage
Total Children
status 1 & 2
Children Residing in
an ICF (7+ beds)
Statewide Average 0.02% 162,096 34RCOC Public Hearing 8/15/18 0.02% 10,270 2 Goal % # AttainedRCOC 11/01/18 0.02% 10,331 2 0 0.02% -2Analysis as of Public Hearing 6.34% 5.88%
Total Children
status 1&2 Goal
Children Residing in
a ICF (7+ beds) %
Number Attained
Jan-18 10,052 0 2 0.02% -2Feb-18 10,041 0 2 0.02% -2Mar-18 10,128 0 2 0.02% -2Apr-18 10,154 0 2 0.02% -2May-18 10,218 0 2 0.02% -2Jun-18 10,292 0 2 0.02% -2Jul-18 10,311 0 2 0.02% -2
Aug-18 10,278 0 2 0.02% -2Sep-18 10,313 0 2 0.02% -2Oct-18 10,331 0 2 0.02% -2
Nov-18 0Dec-18 0
RCOC % of FH population
Progress: B. During public meetings, RCOC had 2, or 0.02% of children residing in an Immediate Care Facility (CCF)(7+ beds). Placements to 7+ bed ICF facilities are at family request and/or due to specialized services.
RCOC % of DD population
Total number and % of regional center children residing in an ICF (7+ beds).
Total number and % of regional center adult caseload residing in own Total number and % of regional center adult caseload residing in
Below Goal

Percentage
Total Children
status 1 & 2
Children Residing in a Nursing Facility
(7+ beds)Statewide Average 0.00% 162,096 7RCOC Public Hearing 8/15/18 0.00% 10,270 0 Goal % # AttainedRCOC 11/01/18 0.00% 10,331 0 0 0.00% 0Analysis as of Public Hearing 6.34% 0.00%
Total Children
status 1&2 Goal
Children Residing in a Nursing Facility
(7+ beds) %Number Attained
Jan-18 10,052 0 0 0.00% 0Feb-18 10,041 0 0 0.00% 0Mar-18 10,128 0 0 0.00% 0Apr-18 10,154 0 0 0.00% 0May-18 10,218 0 0 0.00% 0Jun-18 10,292 0 0 0.00% 0Jul-18 10,311 0 0 0.00% 0
Aug-18 10,278 0 0 0.00% 0Sep-18 10,313 0 0 0.00% 0Oct-18 0
Nov-18 0Dec-18 0
RCOC % of DD population RCOC % of FH population
Progress: C. During public meetings, RCOC had no children residing in a nursing facility. Placements to nursing facilities are at family request and/or due to specialized services.
Total number and % of regional center children residing in a nursing facility.
Total number and % of regional center adult caseload residing in own Total number and % of regional center adult caseload residing in
Met Goal

Percentage
Total Children
status 1 & 2
Total Children
Residing in 7+ bed
facilitiesStatewide Average 0.05% 162,096 75RCOC Public Hearing 8/15/18 0.06% 10,270 6 Goal % # AttainedRCOC 11/01/18 0.03% 10,331 3 0 0.03% -3Analysis as of Public Hearing 6.34% 8.00%
Total Children
status 1&2 Goal
Total Children
Residing in 7+ bed
facilities %Number Attained
Jan-18 10,052 0 5 0.05% -5Feb-18 10,041 0 4 0.04% -4Mar-18 10,128 0 4 0.04% -4Apr-18 10,154 0 4 0.05% -5May-18 10,218 0 6 0.06% -6Jun-18 10,292 0 6 0.06% -6Jul-18 10,311 0 6 0.06% -6
Aug-18 10,278 0 6 0.06% -6Sep-18 10,313 0 5 0.05% -5Oct-18 10,331 0 3 0.03% -3
Nov-18 0Dec-18 0
RCOC % of DD population RCOC % of FH population
Progress: D. During public meetings, RCOC had 3, or 0.03%, of children residing in a facility with 7+ beds. Placements to 7+ bed facilities are at family request and/or due to specialized services.
Total number and % of regional center children residing in a facility with 7+ beds (This is a total of sections A, B and C above).
Total number and % of regional center adult caseload residing in own Total number and % of regional center adult caseload residing in
Below Goal

Planned ActivitiesStatement: RCOC continues to ensure that individuals with developmental disabilities have more choices in living options regardless of the severity of their disabilities.
Objective: RCOC will place only those adults with medical issues or challenging behaviors in seven or greater bed facilities. • RCOC will continue seeking appropriate placement in smaller facilities for these persons served and to support creative services and supports which would allow placement in existing small facilities, as well as development of new small facilities as needed, utilizing appropriate services and supports to ensure success for these persons served. • RCOC will adhere to Trailer Bill Language relating to the use of larger residential facilities to ensure the least restrictive environment is supported.
Performance Contract 2018
V. Adults Residing in Facilities with Seven or More Beds (Excluding Developmental Centers).
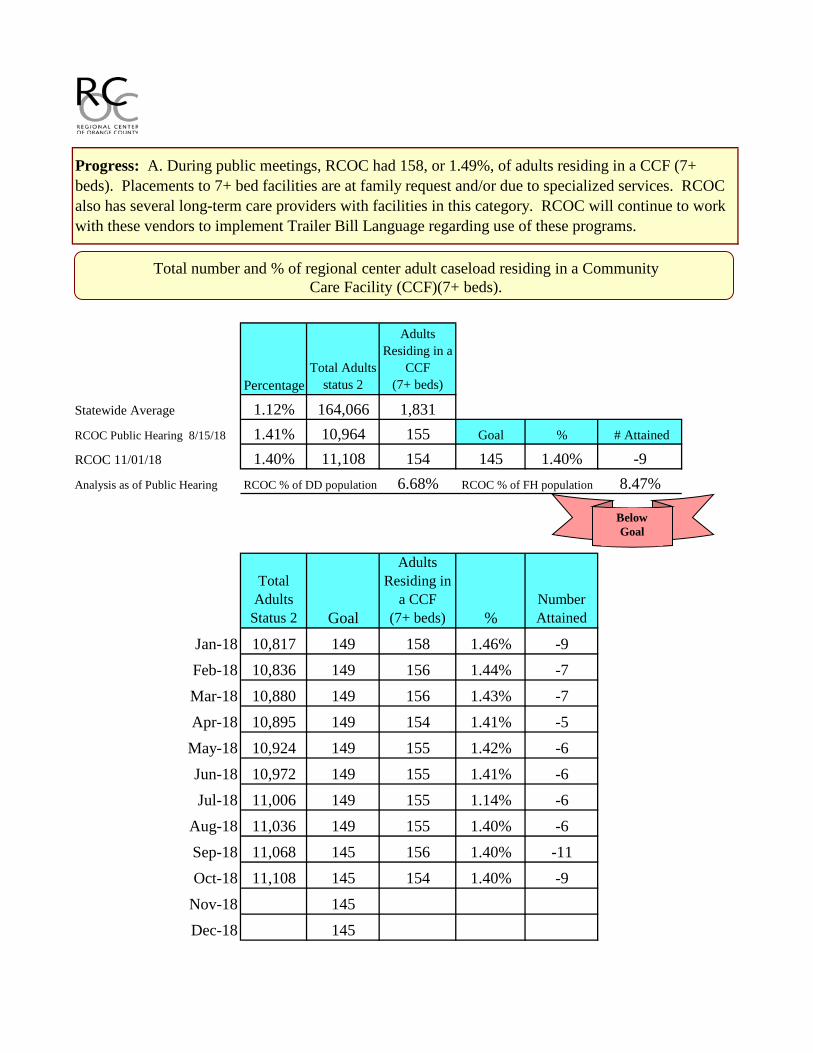
PercentageTotal Adults
status 2
Adults Residing in a
CCF (7+ beds)
Statewide Average 1.12% 164,066 1,831RCOC Public Hearing 8/15/18 1.41% 10,964 155 Goal % # Attained
RCOC 11/01/18 1.40% 11,108 154 145 1.40% -9Analysis as of Public Hearing 6.68% 8.47%
Total Adults
Status 2 Goal
Adults Residing in
a CCF (7+ beds) %
Number Attained
Jan-18 10,817 149 158 1.46% -9Feb-18 10,836 149 156 1.44% -7Mar-18 10,880 149 156 1.43% -7Apr-18 10,895 149 154 1.41% -5May-18 10,924 149 155 1.42% -6Jun-18 10,972 149 155 1.41% -6Jul-18 11,006 149 155 1.14% -6
Aug-18 11,036 149 155 1.40% -6Sep-18 11,068 145 156 1.40% -11Oct-18 11,108 145 154 1.40% -9
Nov-18 145Dec-18 145
Progress: A. During public meetings, RCOC had 158, or 1.49%, of adults residing in a CCF (7+ beds). Placements to 7+ bed facilities are at family request and/or due to specialized services. RCOC also has several long-term care providers with facilities in this category. RCOC will continue to work with these vendors to implement Trailer Bill Language regarding use of these programs.
RCOC % of DD population RCOC % of FH population
Total number and % of regional center adult caseload residing in a Community Care Facility (CCF)(7+ beds).
Below Goal

PercentageTotal Adults
status 2
Adults Residing in
a ICF (7+ beds)
Statewide Average 0.61% 164,066 1,008RCOC Public Hearing 8/15/18 0.73% 10,964 80 Goal % # AttainedRCOC 11/01/18 0.71% 11,108 79 55 0.71% -24Analysis as of Public Hearing 6.68% 7.94%
Total Adults
Status 2 Goal
Adults Residing in
a ICF (7+ beds) %
Number Attained
Jan-18 10,817 88 80 0.74% 8Feb-18 10,836 88 81 0.75% 7Mar-18 10,880 88 81 0.74% 7Apr-18 10,895 88 81 0.74% 7May-18 10,924 88 81 0.74% 7Jun-18 10,972 88 80 0.73% 8Jul-18 11,006 88 81 0.74% 7
Aug-18 11,036 88 80 0.72% 8Sep-18 11,068 55 80 0.72% -25Oct-18 11,108 88 79 0.71% -24
Nov-18 88Dec-18 88
Progress: B. During public meetings, RCOC had 80, or 0.73%, of adults residing in an Intermediate Care Facility (ICF)(7+ beds). Placements to 7+ bed facilities are at family request and/or due to specialized services.
RCOC % of DD population RCOC % of FH population
Total number and % of regional center adults residing in an ICF (7+ beds).
Below Goal

Percentage
Total Adults status 2
Adults Residing in a
Nursing Facility
(7+ beds)
Statewide Average 0.66% 164,066 1,081RCOC Public Hearing 8/15/18 0.78% 10,964 85 Goal % # Attained
RCOC 11/01/18 0.81% 11,108 90 80 0.81% -10Analysis as of Public Hearing 6.68% 7.86%
Total Adults
Status 2 Goal
Adults Residing in a
Nursing Facility
(7+ beds) %Number Attained
Jan-18 10,817 83 92 0.85% -9Feb-18 10,836 83 85 0.78% -2Mar-18 10,880 83 84 0.77% -1Apr-18 10,895 83 81 0.74% 2May-18 10,924 83 80 0.73% 3Jun-18 10,972 83 78 0.71% 5Jul-18 11,006 83 80 0.73% 3
Aug-18 11,036 83 82 0.74% 1Sep-18 11,068 80 85 0.77% -5Oct-18 11,108 80 90 0.81% -10
Nov-18 80Dec-18 80
RCOC % of DD population RCOC % of FH population
Progress: C. During public meetings, RCOC had 78, or .71%, of adults residing in a nursing facility. Placements to nursing facilities are at family request and/or due to specialized services.
Total number and % of regional center adult caseload residing in a nursing facility.
Below Goal

PercentageTotal Adults
status 2
Total Adults Residing in
7+ bed facilities
Statewide Average 2.39% 164,066 3,920RCOC Public Hearing 8/15/18 2.85% 10,964 313 Goal % # Attained
RCOC 11/01/18 2.91% 11,108 323 320 2.91% -3Analysis as of Public Hearing 6.68% 7.98%
Total Adults
Status 2 Goal
Total Adults
Residing in 7+ bed
facilities %Number Attained
Jan-18 10,817 320 330 3.05% -10Feb-18 10,836 320 322 2.97% -2Mar-18 10,880 320 321 2.95% -1Apr-18 10,895 320 316 2.90% 4May-18 10,924 320 316 2.89% 4Jun-18 10,972 320 313 2.85% 7Jul-18 11,006 320 316 2.87% 4
Aug-18 11,036 320 317 2.87% 3Sep-18 11,068 320 321 2.90% -1Oct-18 11,108 320 323 2.91% -3
Nov-18 320Dec-18 320
RCOC % of DD population RCOC % of FH population
Progress: D. During public meetings, RCOC had 337, or 3.19%, of adults residing in a facility with 7+ beds. Placements to 7+ bed facilities are at family request and/or due to specialized services.
Total number and % of regional center adults residing in a facility with 7+ beds (This is a total of sections A, B and C above).
Below Goal

Planned Activities
PercentageTotal # Age 3 or Over
Total # Over Age 3 with <=120 days
Statewide Average 99.12% 6,028 5,975RCOC Public Hearing 8/15/18 99.10% 223 221 Goal % AttainedRCOC 11/01/18 98.78% 230 224 100.00% 97.39%
Total Number
Individuals Age 3 or
Over Goal
Total Number Individuals Over Age 3 with <=120
days%
AttainedJan-18 178 100.00% 178 100.00%Feb-18 179 100.00% 179 100.00%Mar-18 196 100.00% 196 100.00%Apr-18 226 100.00% 225 99.56%May-18 225 100.00% 223 99.11%Jun-18 224 100.00% 224 99.11%Jul-18 228 100.00% 227 99.56%
Aug-18 245 100.00% 242 98.78%Sep-18 242 100.00% 237 97.93%Oct-18 230 100.00% 224 97.39%
Nov-18 100.00%Dec-18 100.00%
Objective: RCOC will continue to ensure that the duration of individuals ages 3 and over in the intake process is within mandated timeline. • RCOC will provide persons served and their caregivers/advocates with initial information about developmental needs, and about the services and supports available, inside and outside of RCOC.
Progress: A. During public meetings, RCOC had 221, or 99.10%, of regional center individuals over age 3 with <=120 days.
Statement: Management and Service Coordinator staff receive a monthly report on the duration of individuals ages 3 and over who are in the intake process.
Performance Contract 2018
Total number and % of regional center individuals over age 3 with <= 120 days.
VI. Intake Duration
Below Goal

Percentage
Total Number
Individuals Age 3 or
Over
Total Number Individuals Over Age 3
with 121-240 days
Statewide Average 0.76% 6,028 46RCOC Public Hearing 8/15/18 0.90% 223 2 Goal % AttainedRCOC 11/01/18 2.61% 230 6 0.00% 2.61%
Total Number
Individuals Age 3 or
Over Goal
Total Number
Individuals Over Age 3
with 121-240 days %
Jan-18 178 0.00% 0 0.00%Feb-18 179 0.00% 0 0.00%Mar-18 196 0.00% 0 0.00%Apr-18 226 0.00% 1 0.44%May-18 225 0.00% 1 0.44%Jun-18 224 0.00% 2 0.89%Jul-18 228 0.00% 1 0.44%
Aug-18 245 0.00% 3 1.22%Sep-18 242 0.00% 5 2.07%Oct-18 230 0.00% 6 2.61%
Nov-18 0.00%Dec-18 0.00%
Progress: B. During public meetings, RCOC had 2, or 0.90%, of regional center individuals over age 3 with 121-240 days.
Total number and % of regional center individuals over age 3 with 121-240 days.
Below Goal

Percentage
Total Number
Individuals Age 3 or
Over
Total Number Individuals Over Age 3
Over 240 daysStatewide Average 0.12% 6,028 7RCOC Public Hearing 8/15/18 0.00% 223 0 Goal %RCOC 11/01/18 0.00% 230 0 0.00% 0.00%
Total Number
Individuals Age 3 or
Over Goal
Total Number
Individuals Over
Age 3 Over 240 days
% Attained
Jan-18 178 0.00% 0 0.00%Feb-18 179 0.00% 0 0.00%Mar-18 196 0.00% 0 0.00%Apr-18 226 0.00% 0 0.00%May-18 225 0.00% 1 0.44%Jun-18 224 0.00% 0 0.00%Jul-18 228 0.00% 0 0.00%
Aug-18 245 0.00% 0 0.00%Sep-18 242 0.00% 0 0.00%Oct-18 230 0.00% 0 0.00%
Nov-18 0.00%Dec-18 0.00%
Progress: C. During public meetings, RCOC had 0, or 0.00%, of regional center individuals over age 3 with over 240 days.
Total number and % of regional center individuals over age 3 with over 240 days.
Met Goal

Planned Activities
PercentageRCOC FY 2010-11 40%RCOC FY 2011-12 46% GoalRCOC FY 2014-15* 47% 50%
*NOTE: Surveys are being conducted again in FY 2017-18
Objective: RCOC will implement its Employment First Policy by providing persons served and family members with information regarding the opportunity and support to work in employment settings that are meaningful to them and by annually reviewing those opporutunities with individuals to ensure they are engaged in activities of their choosing. RCOC will make incentive payments to vendors who assist individuals obtain competitive, integrated employment and maintain those positions over time.
Progress: A. Results from the National Core Indicator Surveys conducted in FY 2011-2012, 46% of the people interviewed who did not have a job in the community, reported wanting one. In FY 2014-2015, 47% of those interviewed indicating a desire for work in the community.
Statement: RCOC has adopted an Employment First Policy making integrated competitive employment the first option considered by planning teams for every working adult served by RCOC.
Performance Contract 2018
Percentage of adults who reported having integrated employment as a goal in their IPPs.
VII. National Core Indicators (NCI) Employment
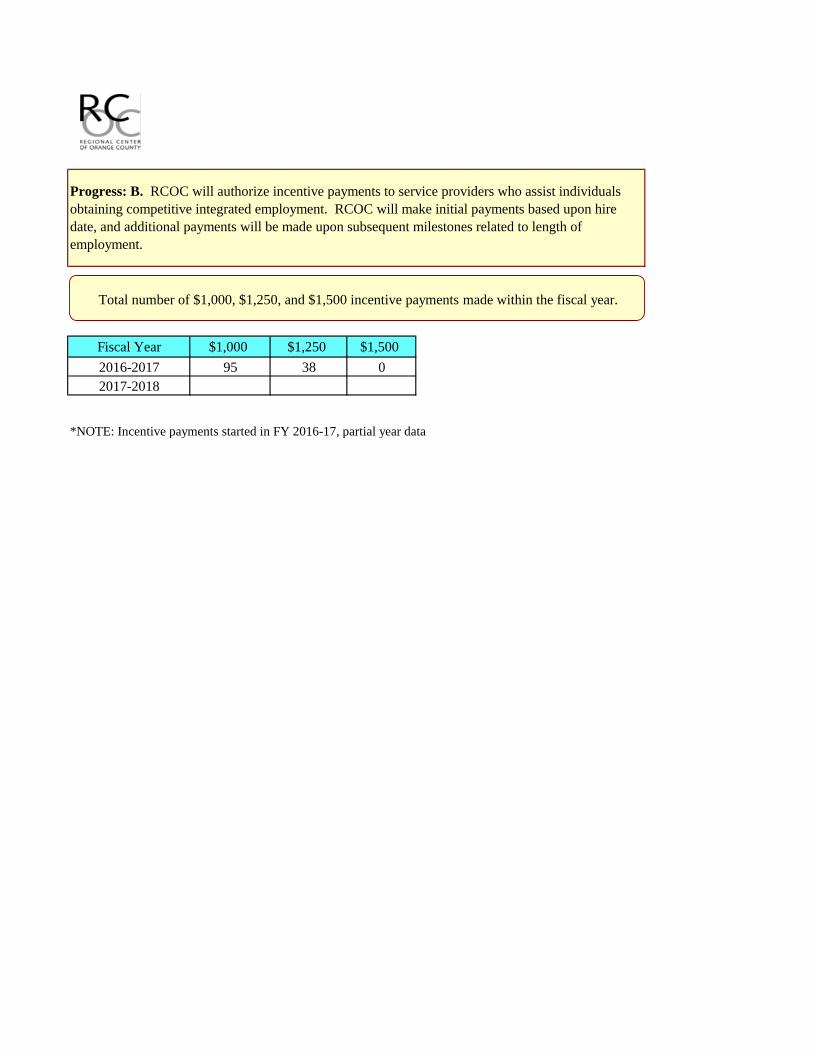
Fiscal Year $1,000 $1,250 $1,5002016-2017 95 38 02017-2018
*NOTE: Incentive payments started in FY 2016-17, partial year data
Progress: B. RCOC will authorize incentive payments to service providers who assist individuals obtaining competitive integrated employment. RCOC will make initial payments based upon hire date, and additional payments will be made upon subsequent milestones related to length of employment.
Total number of $1,000, $1,250, and $1,500 incentive payments made within the fiscal year.

Fiscal Year Hours Week Wage
2016-2017 17 $10.772017-2018
Progress: C. RCOC will work with local employment agencies and businesses to assist individuals obtain desired hours of employment on a weekly/monthly basis. Individuals will review this during the initial hiring phase when incentive payments are being sought.
Average wages and hours worked for adults engaged in competitive, integrated employment when incentive payments have been made on their behalf.

RCOC Statewide Avg.
2013 1,207 8392014 1,754 9062015 2,175 9622016 2,085 1,0332017 2,058 1,108
Planned Activities
Statement: RCOC service coordinators and vendors are implementing RCOC's Employment First Policy of integrated competitive employment as the first option for people with intellectual disabilities.
Objective: RCOC service coordinators will implement the Employment First Policy by providing persons served and families information on job preparation and procurement at annual Individual Transition Meetings through the school and Individual Program Planning meetings through RCOC. RCOC will continue to work on development of new programs that will emphasize a focus on competitive employment as a primary outcome. RCOC will work with service providers and employers to move individuals participating in Paid Internship Program (PIP) into Competitive Integrated Employment (CIE).
Progress: A. Results from the Employment Development Department (EDD) conducted in 2016 indicate that 2,085 persons served ages 16-64 had earned income. In 2017, 2,058 persons served ages 16-64 had earned income.
Performance Contract 2018
Number of persons served ages 16-64 with earned income.
VIII. Employment Development Department (EDD) Employment

RCOC Statewide Avg.
2013 12.80% 12%2014 17.90% 13.10%2015 27% 16%2016 19.80% 14.20%2017 18.60% 14.50%
Progress: B. Results from the Employment Development Department in 2016 indicate that 19.8% of persons served ages 16-64 reported having earned income. In 2017, the percentage of persons served ages 16-64 reporting earned income was 18.6%.
Percentage of people ages 16-64 reporting earned income.

RCOC Statewide Avg.
2013 $6,691 $6,6972014 $6,086 $7,0442015 $5,681 $7,2482016 $5,975 $7,6312017 $7,385 $8,698
Progress: C. Results from the Employment Development Department in 2016 indicate that average annual wage for persons served ages 16-64 was $5,975. In 2017, the average annual wage for persons served ages 16-64 was $7,385.
Annual earnings of age group 16-64 as compared with all persons served with disabilities in California.

Total
2016-2017 02017-2018
*Note: Individuals have participated in PIP for less than 12 months total.
Progress: D. In FY 2016-2017, RCOC began working with service providers to place individuals into Paid Internship Program (PIP) opportunities to help develop employment interests, and lead into opportunities for competitive integrated employment. The PIP was initiated in FY 2016-2017. RCOC currently has 5 individuals within a paid internship.
Number of adults placed in competitive, integrated employment following participation in a Paid Internship Program.
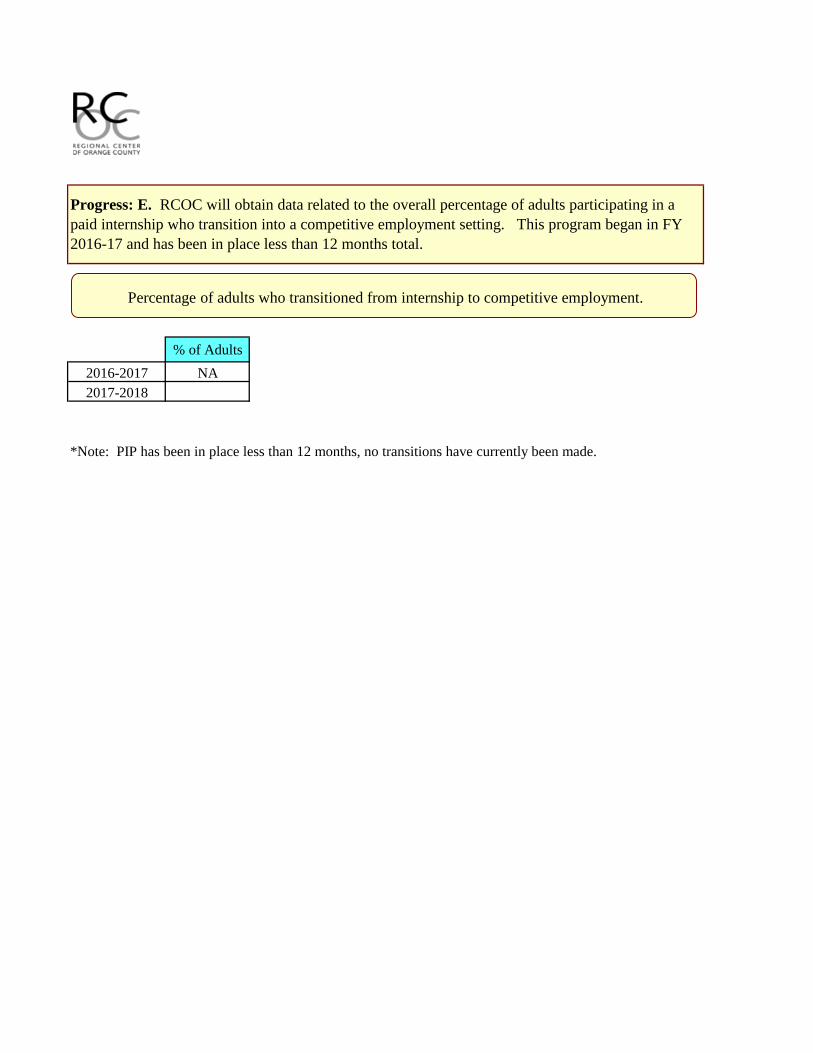
% of Adults2016-2017 NA2017-2018
Progress: E. RCOC will obtain data related to the overall percentage of adults participating in a paid internship who transition into a competitive employment setting. This program began in FY 2016-17 and has been in place less than 12 months total.
*Note: PIP has been in place less than 12 months, no transitions have currently been made.
Percentage of adults who transitioned from internship to competitive employment.

Hours Wk. Wage
2016-2017 18 $10.132017-2018
Progress: F. RCOC will monitor the hourly/salaried wages and hours worked per week for persons served who participate in a paid internship. Hours and wages will be competitively based on the job type and market rate for each setting.
Average hourly wage and weekly hours worked in Paid Internship Program.

Objective: RCOC service coordinators will work with persons served and families to develop IPP goals and objectives to address their choices of living situations. RCOC will work to develop services in the community that meet the cultural and background preferences of persons served and family members to ensure the availability of resources. RCOC will continue outreach efforts within our community to overcome potential cultural barriers when identifying appropriate services. RCOC is working to expand family outreach and support options by developing new resources within our community. RCOC will continue to develop community programs that allow for a range of options for persons served when selecting those services. RCOC service coordinators will receive initial and ongoing training related to IPP development that ensures meaningful participation os persons served and their families and will focus on Person Centered Thinking skills and outcomes. RCOC will be working to simplify and translate important documents. RCOC continues to outreach with outside agencies such as parent support group leaders, family support groups, social services agencies, faith-based organizations and educational agencies, as well as providing information via e-mail in the primary language of the family.
Statement: RCOC works to ensure that support services are flexible and innovative in meeting the family's needs as they evolve over time; are tailored to the preferences of the individual family; and are consistent with their cultural norms and customs.
Progress: A. Review of fiscal year 2015-16 purchase of service data and client master file (CMF). Initial data generation will be compared to subsequent FY information.
Performance Contract 2018
IX. Reducing Disparities and Improving Equity in Purchase of Service Expenditures.

Birth to 2 Years Old
Ethnicity Total Persons Percentage of Expenditures Total Authorized Utilized
American Indian or Alaska Native 4 0.1% $34,936 53.6%
Asian 917 22.4% $8,493,919 66.2%
Black/African American 68 1.4% $514,483 62.6%
Hispanic 2,043 33.9% $12,872,918 61.1%
Native Hawaiian or Other Pacific Islander 2 0.0% $5,111 70.4%
Other Ethnicity or Race / Multi-Cultural 1,170 23.3% $8,822,287 60.3%
White 1,048 18.9% $7,176,339 59.7%
Totals 5,252 100.0% $37,919,994 61.8%
Age 3 Years to 21 Years
Ethnicity Total Persons Percentage of Expenditures Total Authorized Utilized
American Indian or Alaska Native 15 0.2% $196,822 78.5%
Asian 1,630 17.8% $17,945,068 65.2%
Black/African American 167 2.7% $2,760,959 75.5%
Hispanic 3,561 31.8% $32,082,238 64.2%
Native Hawaiian or Other Pacific Islander 6 0.0% $12,865 27.2%
Other Ethnicity or Race / Multi-Cultural 1,608 17.8% $17,994,675 61.6%
White 2,230 29.7% $30,053,352 69.2%
Totals 9,217 100.0% $101,045,979 65.7%
Age 22 Years and Older
Ethnicity Total Persons Percentage of Expenditures Total Authorized Utilized
American Indian or Alaska Native 15 0.3% $725,240 89.3%
Asian 1,146 10.8% $31,038,803 82.4%
Black/African American 210 2.8% $7,963,856 79.2%
Hispanic 2,130 17.9% $51,260,419 81.6%
Native Hawaiian or Other Pacific Islander 5 0.1% $188,232 79.3%
Other Ethnicity or Race / Multi-Cultural 701 7.6% $21,688,093 83.9%
White 4,450 60.6% $173,372,959 85.1%
Totals 8,657 100.0% $286,237,603 83.9%
Progress: A. Review of fiscal year 2016-17 purchase of service data and client master file (CMF). Initial data generation will be compared to subsequent FY information.
Percent of total annual purchase of service expenditures by individual's ethnicity and age: Birth to age 2; Age 3-21; 22 and older.

Birth to 2 Years Old
Ethnicity Total Eligible Case Management Percent No Services
American Indian or Alaska Native 4 0 0.0%
Asian 917 27 2.9%
Black/African American 68 0 0.0%
Hispanic 2,043 105 5.1%
Native Hawaiian or Other Pacific Islander 2 1 50.0%
Other Ethnicity or Race / Multi-Cultural 1,170 40 3.4%
White 1,048 50 4.8%
Totals 5,252 223 4.2%
Age 3 Years to 21 Years
Ethnicity Total Eligible Case Management Percent No Services
American Indian or Alaska Native 15 4 26.7%
Asian 1,630 373 22.9%
Black/African American 167 49 29.3%
Hispanic 3,561 1,324 37.2%
Native Hawaiian or Other Pacific Islander 6 2 33.3%
Other Ethnicity or Race / Multi-Cultural 1,608 426 26.5%
White 2,230 542 24.3%
Totals 9,217 2,720 29.5%
Age 22 Years and Older
Ethnicity Total Eligible Case Management Percent No Services
American Indian or Alaska Native 15 2 13.3%
Asian 1,146 218 19.0%
Black/African American 210 37 17.6%
Hispanic 2,130 474 22.3%
Native Hawaiian or Other Pacific Islander 5 0 0.0%
Other Ethnicity or Race / Multi-Cultural 701 125 17.8%
White 4,450 524 11.8%
Totals 8,657 1,380 15.9%
Progress: B. Review of fiscal year 2016-17 purchase of service data and regional center caseload data. Initial data generation will be compared to subsequent FY information.
Number of individuals receiving only case management services by age and ethnicity: Birth to age 2; Age 3-21; 22 and older.

Primary Language Total People POS Authorized Per Capita Percentage Utilized
English 17,389 $20,224 78.30%
Spanish 4,286 $11,926 72.90%
Mandarin Chinese 58 $15,219 70.10%
Vietnamese 1,069 $13,037 75.00%
Korean 119 $25,681 79.00%
Tagalog 31 $24,582 76.20%
Arabic 37 $12,828 68.70%
Progress: C. Review of fiscal year 2016-17 purchase of service data and Client Master File. Initial data generation will be compared to subsequent FY information.
Per capita purchase of service expenditures by individual's primary language for all ages (30 or more people with langauge).
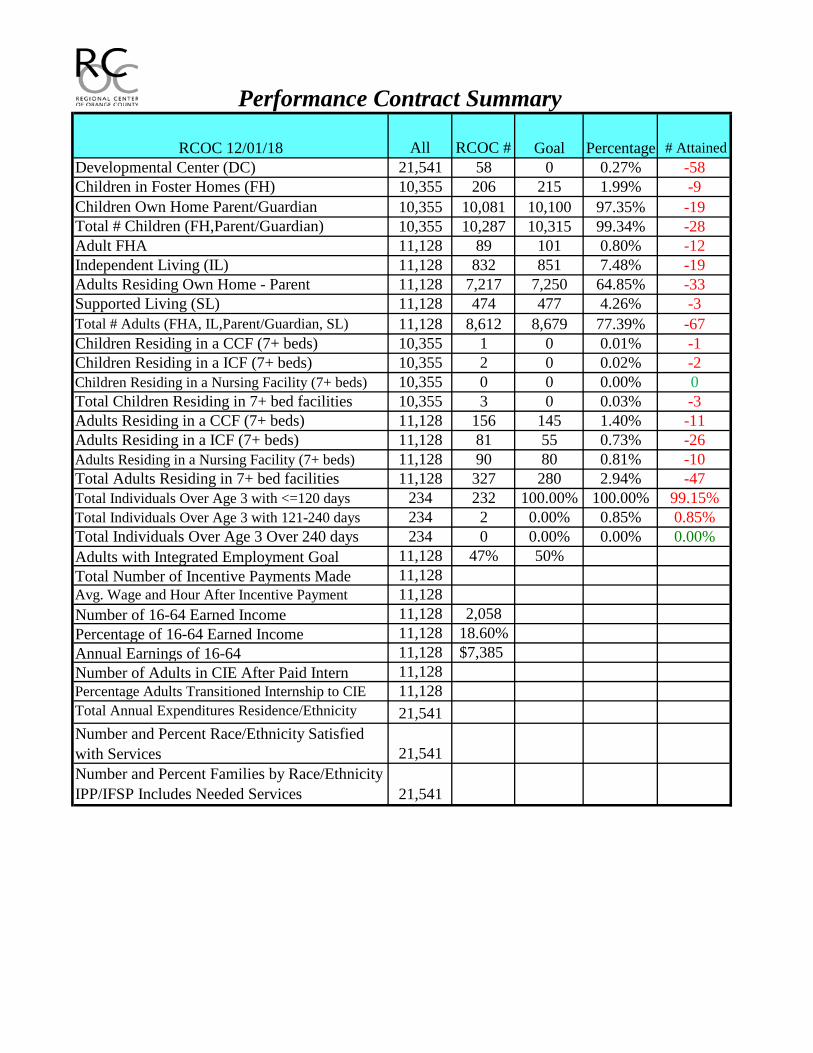
RCOC 12/01/18 All RCOC # Goal Percentage # AttainedDevelopmental Center (DC) 21,541 58 0 0.27% -58Children in Foster Homes (FH) 10,355 206 215 1.99% -9Children Own Home Parent/Guardian 10,355 10,081 10,100 97.35% -19Total # Children (FH,Parent/Guardian) 10,355 10,287 10,315 99.34% -28Adult FHA 11,128 89 101 0.80% -12Independent Living (IL) 11,128 832 851 7.48% -19Adults Residing Own Home - Parent 11,128 7,217 7,250 64.85% -33Supported Living (SL) 11,128 474 477 4.26% -3Total # Adults (FHA, IL,Parent/Guardian, SL) 11,128 8,612 8,679 77.39% -67Children Residing in a CCF (7+ beds) 10,355 1 0 0.01% -1Children Residing in a ICF (7+ beds) 10,355 2 0 0.02% -2Children Residing in a Nursing Facility (7+ beds) 10,355 0 0 0.00% 0Total Children Residing in 7+ bed facilities 10,355 3 0 0.03% -3Adults Residing in a CCF (7+ beds) 11,128 156 145 1.40% -11Adults Residing in a ICF (7+ beds) 11,128 81 55 0.73% -26Adults Residing in a Nursing Facility (7+ beds) 11,128 90 80 0.81% -10Total Adults Residing in 7+ bed facilities 11,128 327 280 2.94% -47Total Individuals Over Age 3 with <=120 days 234 232 100.00% 100.00% 99.15%Total Individuals Over Age 3 with 121-240 days 234 2 0.00% 0.85% 0.85%Total Individuals Over Age 3 Over 240 days 234 0 0.00% 0.00% 0.00%Adults with Integrated Employment Goal 11,128 47% 50%Total Number of Incentive Payments Made 11,128Avg. Wage and Hour After Incentive Payment 11,128Number of 16-64 Earned Income 11,128 2,058Percentage of 16-64 Earned Income 11,128 18.60%Annual Earnings of 16-64 11,128 $7,385Number of Adults in CIE After Paid Intern 11,128Percentage Adults Transitioned Internship to CIE 11,128Total Annual Expenditures Residence/Ethnicity 21,541Number and Percent Race/Ethnicity Satisfied with Services 21,541Number and Percent Families by Race/Ethnicity IPP/IFSP Includes Needed Services 21,541
Performance Contract Summary

= Exceeded Regional Center of Orange County Goal
= Better than Statewide Average
= Below Regional Center of Orange County Goal
= Met or Exceeded Regional Center of Orange County Goal
= Met Regional Center of Orange County Goal
There will be a variance between consumer data in the Operations Report and the Performance Contract. Consumer data for the Operations Report and the Performance Contract are produced on different dates and from different databases. The Operations Report numbers are based on RCOC’s local database as of the end of the month. The Performance Contract numbers are based on RCOC’s information as submitted to DDS on a different date.
Performance Contract 2018 Cover Sheet
Below Goal
Met Goal
Exceeded Goal
Met or Exceeded
Goal

Compliance Measure Outcome
Unqualifed audit with no material findings Yes
Substantial compliance with DDS fiscal audit Yes
Accuracy percent of POS fiscal projections Yes
Operates within OPS budget Yes
Certified to participate in Waiver YesCompliance with vendor audit requirements per contract, Article III, sec. 10 Met
CDER/ESR current 99.88
Intake/Assessment and IFSP (0-2) 99.52
IPP development biennial Annual, 99.46
IFSP development 69.28
Performance Contract 2018
A. Regional Center of Orange County will maintain compliance in the following areas based upon criteria set forth in RCOC's contract with the Department of Developmental Services.

PercentageAll
consumersConsumers
in DCStatewide Average 0.16% 326,687 525RCOC Public Hearing 8/15/18 0.28% 21,293 59 Goal % # AttainedRCOC 12/01/18 0.27% 21,541 58 0 0.27% -58Analysis as of Public Hearing 6.52% 11.24%Planned Activities
Total Active Caseload Goal DC % Number Attained
Jan-18 20,936 56 67 0.32% -11Feb-18 20,943 56 66 0.32% -10Mar-18 21,070 56 62 0.29% -6Apr-18 21,049 56 61 0.29% -5May-18 21,201 56 59 0.28% -3Jun-18 21,264 56 59 0.28% -3Jul-18 21,376 56 59 0.27% -3
Aug-18 21,373 56 59 0.28% -3Sep-18 21,438 0 57 0.27% -57Oct-18 21,496 0 57 0.27% -57
Nov-18 21,541 0 58 0.27% -57Dec-18 0
Number of Persons Served Residing DCs
Progress: In FY 2017-2018, RCOC moved 13 persons served from Developmental Centers into the community. During Public Meetings in August 2018, RCOC had 59 persons served, or 0.28%, in Developmental Centers. During this period, RCOC's overall caseload grew as a result of families and residents requesting a case transfer in order to continue residing in Orange County.
Statement: The Regional Center of Orange County (RCOC) is committed to providing assistance to individuals and their families who choose to move from a State Developmental Center (SDC) into a less restrictive environment within their home communities.
Objective: RCOC will continue to seek new and innovative methods of utilizing available resources, developing non-existing resources, and creating and implementing transition plans that will allow individuals to establish themselves and participate successfully in their home community living arrangements.• Implementation of Community Placement Plan for FYs 2017-2018 and 2018-2019.
RCOC % of DD population RCOC % of DC population
Performance Contract 2018
I. Developmental Center
A. Total number and % of regional center caseload in developmental centers.
Below Goal

Planned Activities
• RCOC will assure that persons served and their caregivers receive complete assessments and have the opportunity to ask questions, advocate, and access to services. To be evaluated and monitored by a National Core Indicators (NCI) survey of persons served and their caregivers.
• Review and revise services, e.g. respite and family support.
• RCOC will assure that families receive full information about the developmental needs of the persons served and what types of services are available.
Statement: The Regional Center of Orange County ensures that children will reside with their families by providing the needed supports and services regardless of the severity of the child’s disability.
Objectives: Service Coordinators continue to identify, publicize and facilitate access to supports and services for children with developmental disabilities who are considered at risk for out-of-home placement. RCOC will hold an annual presentation on supports and services for persons served including residential and vocational (day services) and other generic resources.
• RCOC will work with the Orange County community in effort to support programs, trainings and services designed to provide equal access to child care for families of children with special needs (autism).
• RCOC will ensure that persons served are provided opportunities for safety awareness training through schools and other similar programs available.
• Continue to develop innovative resources for children 0-3 years old (i.e., respite placement).
• Continue to assess current supports and services.
Performance Contract 2018
II. Children Residing with Families (Child is defined as under 18 years of age).

Percentage All children Children in
FHStatewide Average 2.69% 162,096 4,368RCOC Public Hearing 8/15/18 1.81% 10,270 186 Goal % # AttainedRCOC 12/01/18 1.99% 10,355 206 215 1.99% -9Analysis as of Public Hearing 6.34% 4.26%
Total Children
Status 1&2 GoalChildren in
Foster Homes %Number Attained
Jan-18 10,052 175 144 1.43% -31Feb-18 10,041 175 151 1.50% -24Mar-18 10,128 175 165 1.63% -10Apr-18 10,154 175 176 1.73% 1May-18 10,218 175 180 1.76% 5Jun-18 10,292 175 187 1.82% 12Jul-18 10,311 175 185 1.79% 10
Aug-18 10,278 175 191 1.86% 16Sep-18 10,313 215 205 1.99% -10Oct-18 10,331 215 207 2.00% -8
Nov-18 10,355 215 206 1.99% -9Dec-18 215
RCOC % of DD population RCOC % of FH population
Progress: A. During public meetings, RCOC had 186, or 1.81%, children in foster homes.
Number and % of regional center children in foster homes.
Below Goal

Percentage All children
Children in own home
Parent/ Guardian
Statewide Average 96.65% 162,096 156,660RCOC Public Hearing 8/15/18 97.38% 10,270 10,001 Goal % # AttainedRCOC 12/01/18 97.35% 10,355 10,081 10,100 97.35% -19Analysis as of Public Hearing 6.34% 6.38%
Total Children
Status 1&2 Goal
Children in own home
Parent/ Guardian %
Number Attained
Jan-18 10,052 9,800 9,832 97.81% 32Feb-18 10,041 9,800 9,813 97.73% 13Mar-18 10,128 9,800 9,889 97.64% 89Apr-18 10,154 9,800 9,900 97.50% 100May-18 10,218 9,800 9,959 97.47% 159Jun-18 10,292 9,800 10,023 97.39% 223Jul-18 10,311 9,800 10,046 97.43% 246
Aug-18 10,278 9,800 10,009 97.38% 209Sep-18 10,313 10,100 10,032 97.28% -68Oct-18 10,331 10,100 10,053 97.31% -47
Nov-18 10,355 10,100 10,081 97.35% -19Dec-18 10,100
Progress: B. During public meetings, RCOC had 10,001, or 97.38%, of children in own home-parent/guardian.
RCOC % of DD population RCOC % of FH population
Number and % of regional center children in own home-parent/guardian.
Below Goal

Percentage All children
Total Number
Children in Homes
Statewide Average 99.34% 162,096 161,028RCOC Public Hearing 8/15/18 99.19% 10,270 10,187 Goal % # AttainedRCOC 12/01/18 99.34% 10,355 10,287 10,315 99.34% -28Analysis as of Public Hearing 6.34% 6.33%
Total Children
Status 1&2 Goal
Total Number
Children in Homes %
Number Attained
Jan-18 10,052 9,975 9,976 99.24% 1Feb-18 10,041 9,975 9,964 99.23% -11Mar-18 10,128 9,975 10,054 99.27% 79Apr-18 10,154 9,975 10,076 99.23% 101May-18 10,218 9,975 10,139 99.23% 164Jun-18 10,292 9,975 10,210 99.20% 235Jul-18 10,311 9,975 10,231 99.22% 256
Aug-18 10,278 9,975 10,200 99.24% 225Sep-18 10,313 10,315 10,237 99.26% -78Oct-18 10,331 10,315 10,260 99.31% -55
Nov-18 10,355 10,315 10,287 99.34% -28Dec-18 10,315
RCOC % of DD population RCOC % of FH population
Progress: C. During public meetings, RCOC had 10,187, or 99.19%, of children in homes.
Total number and % of regional center children in homes (This is a total of sections A and B above).
Below Goal

Planned ActivitiesStatement: RCOC works with persons served and their caregivers and advocates to empower and enable them to assert the rights of persons served to determine and control the living arrangements of their choice. This may include owning, renting, or leasing the home where the persons served resides.
Objective: Using the Person Centered Thinking (PCT) Individual Program Planning process, Service Coordinators will continue to identify regional center adult persons served who have the hopes and desires to live in a new living arrangement. Cases are reviewed at least annually for the least restrictive environment.
• RCOC will provide service coordinator training to assist families in establishing maintenance plans in the event of temporary caregiver illness/incapacity and for eventual transition plans.
• RCOC will request vendors to include successionary maintenance and transitional plans in the event of temporary illness/incapacity and transfer of ownership in their Program Design.
• RCOC will ensure that persons served are provided opportunities for safety awareness training on a regular and as needed basis.
• RCOC will review and revise services, e.g. respite and family support.
• RCOC will assure that persons served and their caregivers receive complete assessments and have opportunity to ask questions, advocate, and access services. To be evaluated and monitored by an NCI survey of persons served and their caregivers.
Performance Contract 2018
III. Adults Residing in Home Settings

PercentageTotal Adults
status 2Adults in
FHAStatewide Average 0.97% 164,066 1,588RCOC Public Hearing 8/15/18 0.84% 10,964 92 Goal % # AttainedRCOC 12/01/18 0.80% 11,128 89 101 0.80% -12Analysis as of Public Hearing 6.68% 5.79%
Total Adults
Status 2 GoalAdults in
FHA %Number Attained
Jan-18 10,817 100 94 0.87% -6Feb-18 10,836 100 99 0.86% -7Mar-18 10,880 100 92 0.85% -8Apr-18 10,895 100 88 0.81% -12
May-18 10,924 100 91 0.83% -9Jun-18 10,972 100 92 0.84% -8Jul-18 11,006 100 90 0.82% -10
Aug-18 11,036 100 92 0.83% -8Sep-18 10,068 101 94 0.85% -7Oct-18 11,108 101 90 0.81% -11
Nov-18 11,128 101 89 0.80% -12Dec-18 101
Progress: A. During public meetings, RCOC had 92, or 0.84%, of adults residing in Adult FHA.
RCOC % of DD population RCOC % of FH population
Total number and % of regional center adult caseload residing in an Adult Family Home Agency (FHA).
Below Goal

PercentageTotal Adults
status 2
Adults in Independent
LivingStatewide Average 10.56% 164,066 17,325RCOC Public Hearing 8/15/18 7.62% 10,964 835 Goal % # AttainedRCOC 12/01/18 7.48% 11,128 832 851 7.48% -19Analysis as of Public Hearing 6.68% 4.82%
Total Adults
Status 2 Goal
Adults in Independent
Living %Number Attained
Jan-18 10,817 850 835 7.72% -15Feb-18 10,836 850 830 7.66% -20Mar-18 10,880 850 839 7.71% -11Apr-18 10,895 850 842 7.73% -8
May-18 10,924 850 835 7.64% -15Jun-18 10,972 850 836 7.62% -14Jul-18 11,006 850 837 7.60% -13
Aug-18 11,036 850 841 7.62% -9Sep-18 11,068 851 840 7.59% -11Oct-18 11,108 851 841 7.57% -10
Nov-18 11,128 851 832 7.48% -19Dec-18 851
RCOC % of DD population RCOC % of FH population
Progress: B. During public meetings, RCOC had 835, or 7.62%, of adults residing in independent living.
Total number and % of regional center adults residing in independent living.
Below Goal

PercentageTotal Adults
status 2
Adults Residing
Own Home - Parent
Statewide Average 62.93% 164,066 103,243RCOC Public Hearing 8/15/18 60.89% 10,964 6,676 Goal % # AttainedRCOC 12/01/18 64.85% 11,128 7,217 7,250 64.85% -33Analysis as of Public Hearing 6.68% 6.47%
Total Adults
Status 2 Goal
Adults Residing
Own Home - Parent %
Number Attained
Jan-18 10,817 6,985 6,924 64.01% -61Feb-18 10,836 6,985 6,947 64.11% -38Mar-18 10,880 6,985 6,977 64.13% -8Apr-18 10,895 6,985 7,000 64.25% 15
May-18 10,924 6,985 7,028 64.34% 43Jun-18 10,972 6,985 7,073 64.46% 88Jul-18 11,006 6,985 7,102 64.53% 117
Aug-18 11,036 6,985 7,138 64.48% 153Sep-18 11,068 7,250 7,166 64.75% -84Oct-18 11,108 7,250 7,193 64.76% -57
Nov-18 11,128 7,250 7,217 64.85% -33Dec-18 7,250
RCOC % of DD population RCOC % of FH population
Progress: C. During public meetings, RCOC had 7,069, or 64.47%, of adults residing in own home-parent.
Total number and % of regional center adults residing in own home-parent.
Below Goal

PercentageTotal Adults
status 2
Adults Residing
Supported Living
Statewide Average 5.45% 164,066 8,940RCOC Public Hearing 8/15/18 4.36% 10,964 478 Goal % # AttainedRCOC 12/01/18 4.26% 11,128 474 477 4.26% -3Analysis as of Public Hearing 6.68% 5.35%
Total Adults
Status 2 Goal
Adults Residing
Supported Living %
Number Attained
Jan-18 10,817 471 471 4.35% 0Feb-18 10,836 471 472 4.36% 1Mar-18 10,880 471 474 4.36% 3Apr-18 10,895 471 474 4.35% 3
May-18 10,924 471 481 4.40% 10Jun-18 10,972 471 479 4.37% 8Jul-18 11,006 471 479 4.35% 8
Aug-18 11,036 471 471 4.29% 2Sep-18 11,068 477 471 4.26% -6Oct-18 11,108 477 476 4.29% -1
Nov-18 11,128 477 474 4.26% -3Dec-18 477
RCOC % of FH population
Progress: D. During public meetings, RCOC had 478, or 4.36%, of adults residing in supported living.
RCOC % of DD population
Total number and % of regional center adults residing in supported living.
Below Goal

PercentageTotal Adults
status 2
Total Number Adults in
Home Settings
Statewide Average 79.90% 164,066 131,096RCOC Public Hearing 8/15/18 77.29% 10,964 8,474 Goal % # AttainedRCOC 12/01/18 77.39% 11,128 8,612 8,679 77.39% -67Analysis as of Public Hearing 6.68% 6.46%
Total Adults
Status 2 Goal
Total Number Adults in
Home Settings %
Number Attained
Jan-18 10,817 8,406 8,324 76.95% -82Feb-18 10,836 8,406 8,342 76.98% -64Mar-18 10,880 8,406 8,382 77.04% -24Apr-18 10,895 8,406 8,404 77.14% -2
May-18 10,924 8,406 8,435 77.22% 29Jun-18 10,972 8,406 8,480 77.29% 74Jul-18 11,006 8,406 8,508 77.30% 102
Aug-18 11,036 8,406 8,544 77.42% 138Sep-18 11,068 8,679 8,571 77.44% -108Oct-18 11,108 8,406 8,600 77.42% -79
Nov-18 11,128 8,406 8,612 77.39% -67Dec-18 8,406
RCOC % of DD population RCOC % of FH population
Progress: E. During public meetings, RCOC had 8,474, or 77.29%, of adults residing in home-settings.
Total number and % of regional center adults in home settings (This is a total of sections A, B, C and D above).
Below Goal

Planned Activities
Objective: RCOC will place only those children with medical issues or challenging behaviors in seven or greater bed facilities. • RCOC will continue seeking appropriate placement in smaller facilities for these children and to support creative services and supports which would allow placement in existing small facilities, as well as development of new small facilities as needed, utilizing appropriate services and supports to ensure success for these persons served. • RCOC will adhere to Trailer Bill Language relating to the use of larger facilities to ensure the least restrictive environment is supported.
Statement: RCOC provides for the needs of children with medical issues or challenging behaviors in seven or greater bed facilities for limited time periods when smaller facilities cannot meet needs.
Performance Contract 2018
IV. Children Residing in Facilities with Seven or More Beds (Excluding Developmental Centers)

Percentage
Total Children
status 1 & 2
Children Residing in a
CCF (7+ beds)
Statewide Average 0.02% 162,096 34RCOC Public Hearing 8/15/18 0.04% 10,270 4 Goal % # AttainedRCOC 12/01/18 0.01% 10,355 1 0 0.01% -1Analysis as of Public Hearing 6.34% 11.76%
Total Children
status 1&2 Goal
Children Residing in
a CCF (7+ beds) %
Number Attained
Jan-18 10,052 0 3 0.03% -3Feb-18 10,041 0 2 0.02% -2Mar-18 10,128 0 2 0.02% -2Apr-18 10,154 0 3 0.03% -3May-18 10,218 0 4 0.04% -4Jun-18 10,292 0 4 0.04% -4Jul-18 10,311 0 4 0.04% -4
Aug-18 10,278 0 4 0.04% -4Sep-18 10,313 0 3 0.03% -3Oct-18 10,331 0 1 0.01% -1
Nov-18 10,355 0 1 0.01% -1Dec-18 0
Progress: A. During public meetings, RCOC had 4, or 0.04%, of children residing in a Community Care Facility (CCF)(7+ beds). Placements to 7+ bed CCF facilities are at family request and/or due to specialized services.
RCOC % of DD population RCOC % of FH population
A. Total number and % of regional center children residing in a CCF (7+ beds).
Below Goal

Percentage
Total Children
status 1 & 2
Children Residing in
an ICF (7+ beds)
Statewide Average 0.02% 162,096 34RCOC Public Hearing 8/15/18 0.02% 10,270 2 Goal % # AttainedRCOC 12/01/18 0.02% 10,355 2 0 0.02% -2Analysis as of Public Hearing 6.34% 5.88%
Total Children
status 1&2 Goal
Children Residing in
a ICF (7+ beds) %
Number Attained
Jan-18 10,052 0 2 0.02% -2Feb-18 10,041 0 2 0.02% -2Mar-18 10,128 0 2 0.02% -2Apr-18 10,154 0 2 0.02% -2May-18 10,218 0 2 0.02% -2Jun-18 10,292 0 2 0.02% -2Jul-18 10,311 0 2 0.02% -2
Aug-18 10,278 0 2 0.02% -2Sep-18 10,313 0 2 0.02% -2Oct-18 10,331 0 2 0.02% -2
Nov-18 10,355 0 0 0.02% -2Dec-18 0
Progress: B. During public meetings, RCOC had 2, or 0.02% of children residing in an Immediate Care Facility (CCF)(7+ beds). Placements to 7+ bed ICF facilities are at family request and/or due to specialized services.
RCOC % of DD population RCOC % of FH population
Total number and % of regional center children residing in an ICF (7+ beds).
Below Goal

Percentage
Total Children
status 1 & 2
Residing in a Nursing Facility
(7+ beds)Statewide Average 0.00% 162,096 7RCOC Public Hearing 8/15/18 0.00% 10,270 0 Goal % # AttainedRCOC 12/01/18 0.00% 10,355 0 0 0.00% 0Analysis as of Public Hearing 6.34% 0.00%
Total Children
status 1&2 Goal
Children Residing in a Nursing Facility
(7+ beds) %Number Attained
Jan-18 10,052 0 0 0.00% 0Feb-18 10,041 0 0 0.00% 0Mar-18 10,128 0 0 0.00% 0Apr-18 10,154 0 0 0.00% 0May-18 10,218 0 0 0.00% 0Jun-18 10,292 0 0 0.00% 0Jul-18 10,311 0 0 0.00% 0
Aug-18 10,278 0 0 0.00% 0Sep-18 10,313 0 0 0.00% 0Oct-18 10,331 0 0 0.00% 0
Nov-18 10,355 0 0 0.00% 0Dec-18 0
RCOC % of DD population RCOC % of FH population
Progress: C. During public meetings, RCOC had no children residing in a nursing facility. Placements to nursing facilities are at family request and/or due to specialized services.
Total number and % of regional center children residing in a nursing facility.
Met Goal

Percentage
Total Children
status 1 & 2
Total Children
Residing in 7+ bed
facilitiesStatewide Average 0.05% 162,096 75RCOC Public Hearing 8/15/18 0.06% 10,270 6 Goal % # AttainedRCOC 12/01/18 0.03% 10,355 3 0 0.03% -3Analysis as of Public Hearing 6.34% 8.00%
Total Children
status 1&2 Goal
Total Children
Residing in 7+ bed
facilities %Number Attained
Jan-18 10,052 0 5 0.05% -5Feb-18 10,041 0 4 0.04% -4Mar-18 10,128 0 4 0.04% -4Apr-18 10,154 0 4 0.05% -5May-18 10,218 0 6 0.06% -6Jun-18 10,292 0 6 0.06% -6Jul-18 10,311 0 6 0.06% -6
Aug-18 10,278 0 6 0.06% -6Sep-18 10,313 0 5 0.05% -5Oct-18 10,331 0 3 0.03% -3
Nov-18 10,355 0 3 0.03% -3Dec-18 0
RCOC % of DD population RCOC % of FH population
Progress: D. During public meetings, RCOC had 3, or 0.03%, of children residing in a facility with 7+ beds. Placements to 7+ bed facilities are at family request and/or due to specialized services.
Total number and % of regional center children residing in a facility with 7+ beds (This is a total of sections A, B and C above).
Below Goal

Planned ActivitiesStatement: RCOC continues to ensure that individuals with developmental disabilities have more choices in living options regardless of the severity of their disabilities.
Objective: RCOC will place only those adults with medical issues or challenging behaviors in seven or greater bed facilities.
• RCOC will continue seeking appropriate placement in smaller facilities for these persons served andto support creative services and supports which would allow placement in existing small facilities, aswell as development of new small facilities as needed, utilizing appropriate services and supports toensure success for these persons served.
• RCOC will adhere to Trailer Bill Language relating to the use of larger residential facilities to ensurethe least restrictive environment is supported.
Performance Contract 2018
V. Adults Residing in Facilities with Seven or More Beds (Excluding DevelopmentalCenters).

PercentageTotal Adults
status 2
Adults Residing in a
CCF (7+ beds)
Statewide Average 1.12% 164,066 1,831RCOC Public Hearing 8/15/18 1.41% 10,964 155 Goal % # AttainedRCOC 12/01/18 1.40% 11,128 156 145 1.40% -11Analysis as of Public Hearing 6.68% 8.47%
Total Adults
Status 2 Goal
Adults Residing in
a CCF (7+ beds) %
Number Attained
Jan-18 10,817 149 158 1.46% -9Feb-18 10,836 149 156 1.44% -7Mar-18 10,880 149 156 1.43% -7Apr-18 10,895 149 154 1.41% -5May-18 10,924 149 155 1.42% -6Jun-18 10,972 149 155 1.41% -6Jul-18 11,006 149 155 1.14% -6
Aug-18 11,036 149 155 1.40% -6Sep-18 11,068 145 156 1.40% -11Oct-18 11,108 145 154 1.40% -9
Nov-18 11,128 145 156 1.40% -11Dec-18 145
Progress: A. During public meetings, RCOC had 158, or 1.49%, of adults residing in a CCF (7+ beds). Placements to 7+ bed facilities are at family request and/or due to specialized services. RCOC also has several long-term care providers with facilities in this category. RCOC will continue to work with these vendors to implement Trailer Bill Language regarding use of these programs.
RCOC % of DD population RCOC % of FH population
A. Total number and % of regional center adult caseload residing in a CommunityCare Facility (CCF)(7+ beds).
Below Goal

PercentageTotal Adults
status 2
Adults Residing in
a ICF (7+ beds)
Statewide Average 0.61% 164,066 1,008RCOC Public Hearing 8/15/18 0.73% 10,964 80 Goal % # AttainedRCOC 12/01/18 0.73% 11,128 81 55 0.73% -26Analysis as of Public Hearing 6.68% 7.94%
Total Adults
Status 2 Goal
Adults Residing in
a ICF (7+ beds) %
Number Attained
Jan-18 10,817 88 80 0.74% 8Feb-18 10,836 88 81 0.75% 7Mar-18 10,880 88 81 0.74% 7Apr-18 10,895 88 81 0.74% 7May-18 10,924 88 81 0.74% 7Jun-18 10,972 88 80 0.73% 8Jul-18 11,006 88 81 0.74% 7
Aug-18 11,036 88 80 0.72% 8Sep-18 11,068 55 80 0.72% -25Oct-18 11,108 55 79 0.71% -24
Nov-18 11,128 55 81 0.73% -26Dec-18 55
Progress: B. During public meetings, RCOC had 80, or 0.73%, of adults residing in an Intermediate Care Facility (ICF)(7+ beds). Placements to 7+ bed facilities are at family request and/or due to specialized services.
RCOC % of DD population RCOC % of FH population
Total number and % of regional center adults residing in an ICF (7+ beds).
Below Goal

Percentage
Total Adults status 2
Adults Residing in a
Nursing Facility
(7+ beds)Statewide Average 0.66% 164,066 1,081RCOC Public Hearing 8/15/18 0.78% 10,964 85 Goal % # AttainedRCOC 12/01/18 0.81% 11,128 90 80 0.81% -10Analysis as of Public Hearing 6.68% 7.86%
Total Adults
Status 2 Goal
Adults Residing in a
Nursing Facility
(7+ beds) %Number Attained
Jan-18 10,817 83 92 0.85% -9Feb-18 10,836 83 85 0.78% -2Mar-18 10,880 83 84 0.77% -1Apr-18 10,895 83 81 0.74% 2May-18 10,924 83 80 0.73% 3Jun-18 10,972 83 78 0.71% 5Jul-18 11,006 83 80 0.73% 3
Aug-18 11,036 83 82 0.74% 1Sep-18 11,068 80 85 0.77% -5Oct-18 11,108 80 90 0.81% -10
Nov-18 11,128 80 90 0.81% -10Dec-18 80
Progress: C. During public meetings, RCOC had 78, or .71%, of adults residing in a nursing facility. Placements to nursing facilities are at family request and/or due to specialized services.
RCOC % of DD population RCOC % of FH population
Total number and % of regional center adult caseload residing in a nursing facility.
Below Goal

PercentageTotal Adults
status 2
Total Adults Residing in
7+ bed facilities
Statewide Average 2.39% 164,066 3,920RCOC Public Hearing 8/15/18 2.85% 10,964 313 Goal % # Attained
RCOC 12/01/18 2.94% 11,128 327 280 2.94% -47Analysis as of Public Hearing 6.68% 7.98%
Total Adults
Status 2 Goal
Total Adults
Residing in 7+ bed
facilities %Number Attained
Jan-18 10,817 320 330 3.05% -10Feb-18 10,836 320 322 2.97% -2Mar-18 10,880 320 321 2.95% -1Apr-18 10,895 320 316 2.90% 4May-18 10,924 320 316 2.89% 4Jun-18 10,972 320 313 2.85% 7Jul-18 11,006 320 316 2.87% 4
Aug-18 11,036 320 317 2.87% 3Sep-18 11,068 280 321 2.90% -41Oct-18 11,108 280 323 2.91% -43
Nov-18 11,128 280 327 2.94% -47Dec-18 280
RCOC % of DD population RCOC % of FH population
Progress: D. During public meetings, RCOC had 337, or 3.19%, of adults residing in a facility with 7+ beds. Placements to 7+ bed facilities are at family request and/or due to specialized services.
Total number and % of regional center adults residing in a facility with 7+ beds (This is a total of sections A, B and C above).
Below Goal

Planned Activities
PercentageTotal # Age 3 or Over
Total # Over Age 3 with <=120 days
Statewide Average 99.12% 6,028 5,975RCOC Public Hearing 8/15/18 99.10% 223 221 Goal % AttainedRCOC 12/01/18 99.15% 234 232 100.00% 99.15%
Total Number
Individuals Age 3 or
Over Goal
Total Number Individuals Over Age 3 with <=120
days % AttainedJan-18 178 100.00% 178 100.00%Feb-18 179 100.00% 179 100.00%Mar-18 196 100.00% 196 100.00%Apr-18 226 100.00% 225 99.56%May-18 225 100.00% 223 99.11%Jun-18 224 100.00% 224 99.11%Jul-18 228 100.00% 227 99.56%
Aug-18 245 100.00% 242 98.78%Sep-18 242 100.00% 237 97.93%Oct-18 230 100.00% 224 97.39%
Nov-18 234 100.00% 232 99.15%Dec-18 100.00%
Objective: RCOC will continue to ensure that the duration of individuals ages 3 and over in the intake process is within mandated timeline.• RCOC will provide persons served and their caregivers/advocates with initial information aboutdevelopmental needs, and about the services and supports available, inside and outside of RCOC.
Progress: A. During public meetings, RCOC had 221, or 99.10%, of regional center individuals over age 3 with <=120 days.
Statement: Management and Service Coordinator staff receive a monthly report on the duration of individuals ages 3 and over who are in the intake process.
Performance Contract 2018
A. Total number and % of regional center individuals over age 3 with <= 120 days.
VI. Intake Duration
Below Goal

Percentage
Total Number
Individuals Age 3 or
Over
Total Number Individuals Over Age 3
with 121-240 days
Statewide Average 0.76% 6,028 46RCOC Public Hearing 8/15/18 0.90% 223 2 Goal % AttainedRCOC 12/01/18 0.85% 234 2 0.00% 0.85%
Total Number
Individuals Age 3 or
Over Goal
Total Number
Individuals Over Age 3
with 121-240 days %
Jan-18 178 0.00% 0 0.00%Feb-18 179 0.00% 0 0.00%Mar-18 196 0.00% 0 0.00%Apr-18 226 0.00% 1 0.44%May-18 225 0.00% 1 0.44%Jun-18 224 0.00% 2 0.89%Jul-18 228 0.00% 1 0.44%
Aug-18 245 0.00% 3 1.22%Sep-18 242 0.00% 5 2.07%Oct-18 230 0.00% 6 2.61%
Nov-18 234 0.00% 2 0.85%Dec-18 0.00%
Progress: B. During public meetings, RCOC had 2, or 0.90%, of regional center individuals over age 3 with 121-240 days.
B. Total number and % of regional center individuals over age 3 with 121-240 days.
Below Goal

Percentage
Total Number
Individuals Age 3 or
Over
Total Number Individuals Over Age 3
Over 240 daysStatewide Average 0.12% 6,028 7RCOC Public Hearing 8/15/18 0.00% 223 0 Goal %RCOC 12/01/18 0.00% 234 0 0.00% 0.00%
Total Number
Individuals Age 3 or
Over Goal
Total Number
Individuals Over
Age 3 Over 240 days % Attained
Jan-18 178 0.00% 0 0.00%Feb-18 179 0.00% 0 0.00%Mar-18 196 0.00% 0 0.00%Apr-18 226 0.00% 0 0.00%May-18 225 0.00% 1 0.44%Jun-18 224 0.00% 0 0.00%Jul-18 228 0.00% 0 0.00%
Aug-18 245 0.00% 0 0.00%Sep-18 242 0.00% 0 0.00%Oct-18 230 0.00% 0 0.00%
Nov-18 234 0.00% 0 0.00%Dec-18 0.00%
Progress: C. During public meetings, RCOC had 0, or 0.00%, of regional center individuals over age 3 with over 240 days.
C. Total number and % of regional center individuals over age 3 with over 240 days.
Met Goal

Planned Activities
Percentage
RCOC FY 2010-11 40%RCOC FY 2011-12 46% GoalRCOC FY 2014-15* 47% 50%
*NOTE: Surveys are being conducted again in FY 2017-18
Objective: RCOC will implement its Employment First Policy by providing persons served and family members with information regarding the opportunity and support to work in employment settings that are meaningful to them and by annually reviewing those opporutunities with individuals to ensure they are engaged in activities of their choosing. RCOC will make incentive payments to vendors who assist individuals obtain competitive, integrated employment and maintain those positions over time.
Progress: A. Results from the National Core Indicator Surveys conducted in FY 2011-2012, 46% of the people interviewed who did not have a job in the community, reported wanting one. In FY 2014-2015, 47% of those interviewed indicating a desire for work in the community.
Statement: RCOC has adopted an Employment First Policy making integrated competitive employment the first option considered by planning teams for every working adult served by RCOC.
Performance Contract 2018
A. Percentage of adults who reported having integrated employment as a goal in their IPPs.
VII. National Core Indicators (NCI) Employment

Fiscal Year $1,000 $1,250 $1,5002016-2017 95 38 02017-2018
*NOTE: Incentive payments started in FY 2016-17, partial year data
Progress: B. RCOC will authorize incentive payments to service providers who assist individuals obtaining competitive integrated employment. RCOC will make initial payments based upon hire date, and additional payments will be made upon subsequent milestones related to length of employment.
B. Total number of $1,000, $1,250, and $1,500 incentive payments made within the fiscal year.
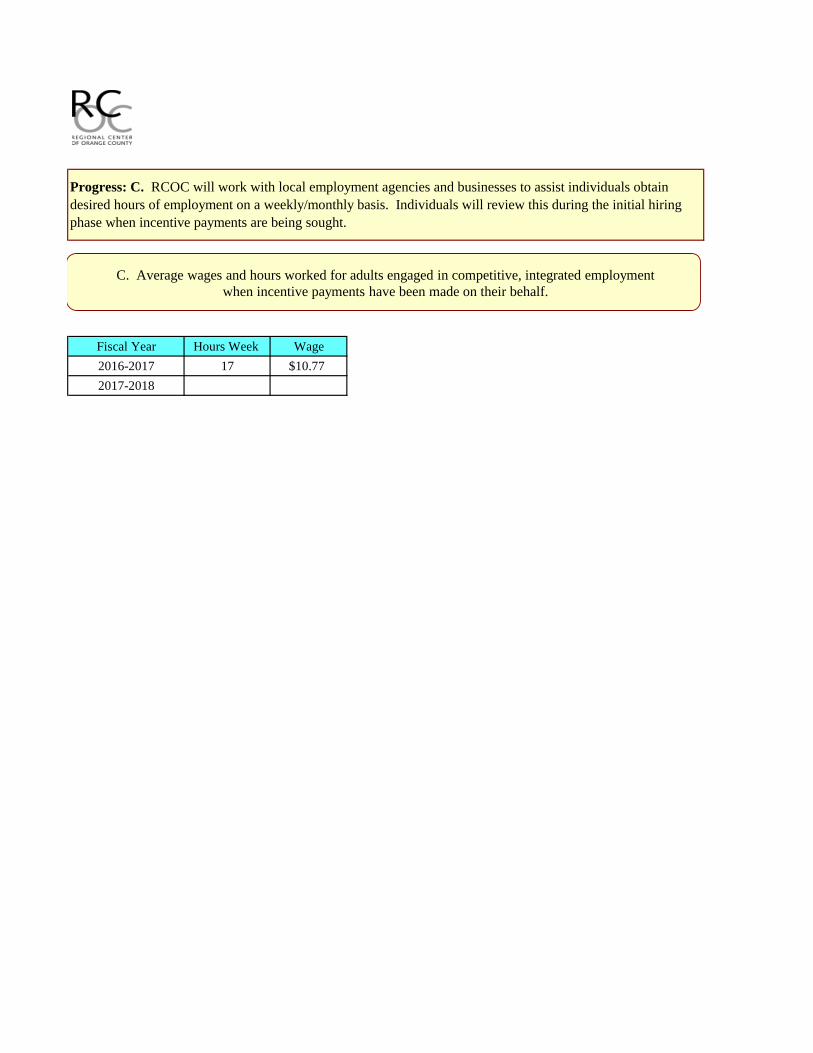
Fiscal Year Hours Week Wage2016-2017 17 $10.772017-2018
Progress: C. RCOC will work with local employment agencies and businesses to assist individuals obtain desired hours of employment on a weekly/monthly basis. Individuals will review this during the initial hiring phase when incentive payments are being sought.
C. Average wages and hours worked for adults engaged in competitive, integrated employment when incentive payments have been made on their behalf.

RCOC Statewide Avg.
2013 1,207 8392014 1,754 9062015 2,175 9622016 2,085 1,0332017 2,058 1,108
Planned Activities
Statement: RCOC service coordinators and vendors are implementing RCOC's Employment First Policy of integrated competitive employment as the first option for people with intellectual disabilities.
Objective: RCOC service coordinators will implement the Employment First Policy by providing persons served and families information on job preparation and procurement at annual Individual Transition Meetings through the school and Individual Program Planning meetings through RCOC. RCOC will continue to work on development of new programs that will emphasize a focus on competitive employment as a primary outcome. RCOC will work with service providers and employers to move individuals participating in Paid Internship Program (PIP) into Competitive Integrated Employment (CIE).
Progress: A. Results from the Employment Development Department (EDD) conducted in 2016 indicate that 2,085 persons served ages 16-64 had earned income. In 2017, 2,058 persons served ages 16-64 had earned income.
Performance Contract 2018
A. Number of persons served ages 16-64 with earned income.
VIII. Employment Development Department (EDD) Employment

RCOC Statewide Avg.
2013 12.80% 12%2014 17.90% 13.10%2015 27% 16%2016 19.80% 14.20%2017 18.60% 14.50%
Progress: B. Results from the Employment Development Department in 2016 indicate that 19.8% of persons served ages 16-64 reported having earned income. In 2017, the percentage of persons served ages 16-64 reporting earned income was 18.6%.
B. Percentage of people ages 16-64 reporting earned income.

RCOC Statewide Avg.
2013 $6,691 $6,6972014 $6,086 $7,0442015 $5,681 $7,2482016 $5,975 $7,6312017 $7,385 $8,698
Progress: C. Results from the Employment Development Department in 2016 indicate that average annual wage for persons served ages 16-64 was $5,975. In 2017, the average annual wage for persons served ages 16-64 was $7,385.
C. Annual earnings of age group 16-64 as compared with all persons served with disabilities in California.

Total
2016-2017 02017-2018
*Note: Individuals have participated in PIP for less than 12 months total.
Progress: D. In FY 2016-2017, RCOC began working with service providers to place individuals into Paid Internship Program (PIP) opportunities to help develop employment interests, and lead into opportunities for competitive integrated employment. The PIP was initiated in FY 2016-2017. RCOC currently has 5 individuals within a paid internship.
D. Number of adults placed in competitive, integrated employment following participation in a Paid Internship Program.

% of Adults2016-2017 NA2017-2018
Progress: E. RCOC will obtain data related to the overall percentage of adults participating in a paid internship who transition into a competitive employment setting. This program began in FY 2016-17 and has been in place less than 12 months total.
*Note: PIP has been in place less than 12 months, no transitions have currently been made.
E. Percentage of adults who transitioned from internship to competitive employment.

Hours Wk. Wage
2016-2017 18 $10.132017-2018
Progress: F. RCOC will monitor the hourly/salaried wages and hours worked per week for persons served who participate in a paid internship. Hours and wages will be competitively based on the job type and market rate for each setting.
F. Average hourly wage and weekly hours worked in Paid Internship Program.
Objective: RCOC service coordinators will work with persons served and families to develop IPP goals and objectives to address their choices of living situations. RCOC will work to develop services in the community that meet the cultural and background preferences of persons served and family members to ensure the availability of resources. RCOC will continue outreach efforts within our community to overcome potential cultural barriers when identifying appropriate services. RCOC is working to expand family outreach and support options by developing new resources within our community. RCOC will continue to develop community programs that allow for a range of options for persons served when selecting those services. RCOC service coordinators will receive initial and ongoing training related to IPP development that ensures meaningful participation os persons served and their families and will focus on Person Centered Thinking skills and outcomes. RCOC will be working to simplify and translate important documents. RCOC continues to outreach with outside agencies such as parent support group leaders, family support groups, social services agencies, faith-based organizations and educational agencies, as well as providing information via e-mail in the primary language of the family.
Statement: RCOC works to ensure that support services are flexible and innovative in meeting the family's needs as they evolve over time; are tailored to the preferences of the individual family; and are consistent with their cultural norms and customs.
Progress: A. Review of fiscal year 2015-16 purchase of service data and client master file (CMF). Initial data generation will be compared to subsequent FY information.
Performance Contract 2018
IX. Reducing Disparities and Improving Equity in Purchase of Service Expenditures.

Birth to 2 Years Old
Ethnicity Total Persons Percentage of Expenditures Total Authorized Utilized
American Indian or Alaska Native 4 0.1% $34,936 53.6%
Asian 917 22.4% $8,493,919 66.2%
Black/African American 68 1.4% $514,483 62.6%
Hispanic 2,043 33.9% $12,872,918 61.1%
Native Hawaiian or Other Pacific Islander 2 0.0% $5,111 70.4%
Other Ethnicity or Race / Multi-Cultural 1,170 23.3% $8,822,287 60.3%
White 1,048 18.9% $7,176,339 59.7%
Totals 5,252 100.0% $37,919,994 61.8%
Age 3 Years to 21 Years
Ethnicity Total Persons Percentage of Expenditures Total Authorized Utilized
American Indian or Alaska Native 15 0.2% $196,822 78.5%
Asian 1,630 17.8% $17,945,068 65.2%
Black/African American 167 2.7% $2,760,959 75.5%
Hispanic 3,561 31.8% $32,082,238 64.2%
Native Hawaiian or Other Pacific Islander 6 0.0% $12,865 27.2%
Other Ethnicity or Race / Multi-Cultural 1,608 17.8% $17,994,675 61.6%
White 2,230 29.7% $30,053,352 69.2%
Totals 9,217 100.0% $101,045,979 65.7%
Age 22 Years and Older
Ethnicity Total Persons Percentage of Expenditures Total Authorized Utilized
American Indian or Alaska Native 15 0.3% $725,240 89.3%
Asian 1,146 10.8% $31,038,803 82.4%
Black/African American 210 2.8% $7,963,856 79.2%
Hispanic 2,130 17.9% $51,260,419 81.6%
Native Hawaiian or Other Pacific Islander 5 0.1% $188,232 79.3%
Other Ethnicity or Race / Multi-Cultural 701 7.6% $21,688,093 83.9%
White 4,450 60.6% $173,372,959 85.1%
Totals 8,657 100.0% $286,237,603 83.9%
Progress: A. Review of fiscal year 2016-17 purchase of service data and client master file (CMF). Initial data generation will be compared to subsequent FY information.
A. Percent of total annual purchase of service expenditures by individual's ethnicity and age: Birth to age 2; Age 3-21; 22 and older.

Birth to 2 Years Old
Ethnicity Total Eligible Case Management Percent No Services
American Indian or Alaska Native 4 0 0.0%
Asian 917 27 2.9%
Black/African American 68 0 0.0%
Hispanic 2,043 105 5.1%
Native Hawaiian or Other Pacific Islander 2 1 50.0%
Other Ethnicity or Race / Multi-Cultural 1,170 40 3.4%
White 1,048 50 4.8%
Totals 5,252 223 4.2%
Age 3 Years to 21 Years
Ethnicity Total Eligible Case Management Percent No Services
American Indian or Alaska Native 15 4 26.7%
Asian 1,630 373 22.9%
Black/African American 167 49 29.3%
Hispanic 3,561 1,324 37.2%
Native Hawaiian or Other Pacific Islander 6 2 33.3%
Other Ethnicity or Race / Multi-Cultural 1,608 426 26.5%
White 2,230 542 24.3%
Totals 9,217 2,720 29.5%
Age 22 Years and Older
Ethnicity Total Eligible Case Management Percent No Services
American Indian or Alaska Native 15 2 13.3%
Asian 1,146 218 19.0%
Black/African American 210 37 17.6%
Hispanic 2,130 474 22.3%
Native Hawaiian or Other Pacific Islander 5 0 0.0%
Other Ethnicity or Race / Multi-Cultural 701 125 17.8%
White 4,450 524 11.8%
Totals 8,657 1,380 15.9%
Progress: B. Review of fiscal year 2016-17 purchase of service data and regional center caseload data. Initial data generation will be compared to subsequent FY information.
B. Number of individuals receiving only case management services by age and ethnicity: Birth to age 2; Age 3-21; 22 and older.
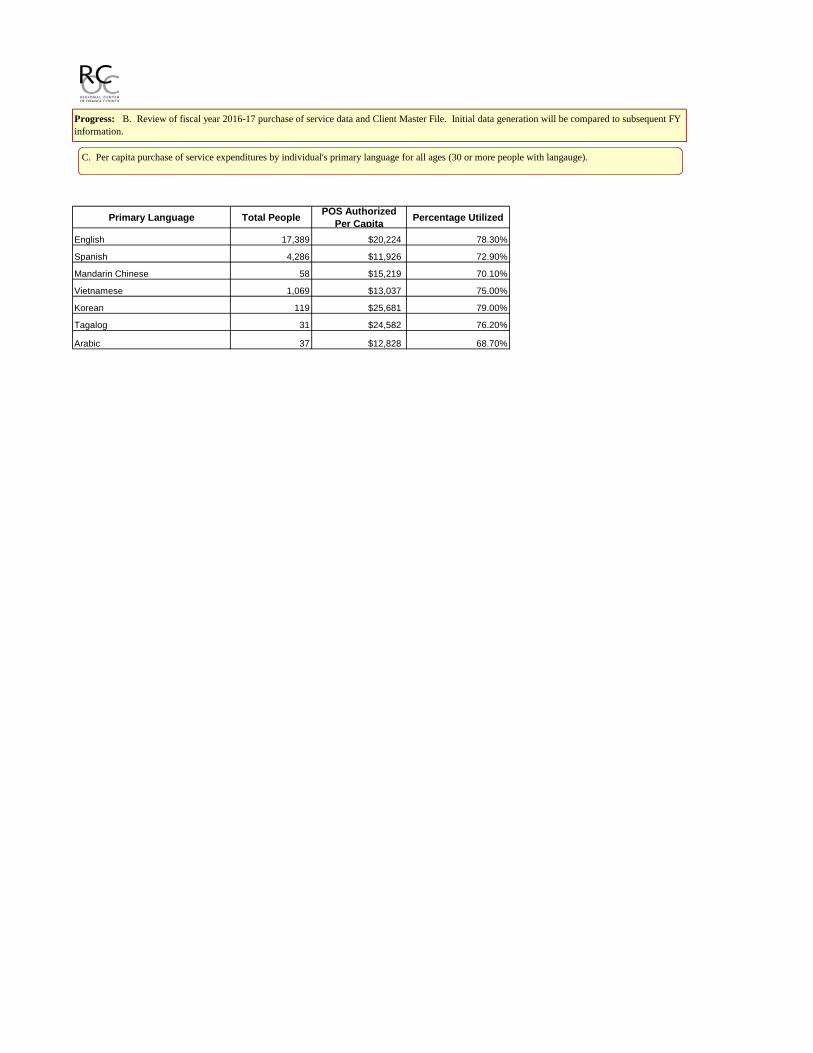
Primary Language Total People POS Authorized Per Capita Percentage Utilized
English 17,389 $20,224 78.30%
Spanish 4,286 $11,926 72.90%
Mandarin Chinese 58 $15,219 70.10%
Vietnamese 1,069 $13,037 75.00%
Korean 119 $25,681 79.00%
Tagalog 31 $24,582 76.20%
Arabic 37 $12,828 68.70%
Progress: B. Review of fiscal year 2016-17 purchase of service data and Client Master File. Initial data generation will be compared to subsequent FY information.
C. Per capita purchase of service expenditures by individual's primary language for all ages (30 or more people with langauge).

Regional Center of Orange County Board Recruitment and Training Committee
November 13, 2018 Teleconference Minutes
Committee Members Present: Alan Martin, Chair
Sylvia Delgado Hilda Mendez
Committee Members Absent: Cristina Alba RCOC Staff Present: Larry Landauer, Executive Director Christina Petteruto, General Counsel Patrick Ruppe, Director of Services and Supports Stacy Wong, Director, Human Resources (arrived at 5:02 p.m.) Mr. Alan Martin called the teleconference meeting to order at 5:00 p.m.
I. Community Forum No community members were present at the meeting.
II. Board Recruitment
A. Review Board Members’ Terms of Office and Upcoming Turnover Mr. Alan Martin reviewed the current Terms of Office and the Committee discussed upcoming turnover. Mr. Martin also informed the Committee that Mr. Peter Kuo will complete his third term on July 11, 2019. As of that date, Mr. Kuo will have served for seven years and will not be eligible for another term.
B. Discuss Recruitment Needs
The Committee discussed recruitment efforts and confirmed that with the addition of the three newly approved Board members, the Board continues to be in compliance with the composition requirements of the Lanterman Act. Much discussion ensued about recruitment efforts by individual Board members and the possibility of acquiring new Board applicants.
III. Board Development and Training
A. Discuss Board Training Schedule and Topics for Fiscal Year 2018-19

Board Recruitment and Training Committee Minutes November 13, 2018
Page 2 of 2
The Committee discussed potential topics and agreed that the next Board training would be on California’s legislative process. The training is scheduled for Thursday, February 2, 2019, and will be presented by Ms. Anh Nguyen, RCOC’s Consultant.
Mr. Martin adjourned the meeting at 5:10 p.m. Recorder: Sandra Lomelí

Regional Center of Orange County Vendor Advisory Committee
November 13, 2018 Minutes
Members: Adult Behavior Management Programs Chair, Maryam Abedi, present Co-Chair, Atrem Behmanesh, absent
Adult Day Programs Chair, Rick Perez, absent Co-Chair, Member Pending
Adult Family Home/Foster Family Agency Chair, Marie Sañudo, present Co-Chair, Member Pending
Behavior Services Chair, Junie Lazo-Pearson, present Co-Chair, Cindy Hebert, absent
Community Care Facilities Chair, Noel Villegas, absent Co-Chair, Boyd Bradshaw, present
Early Intervention Chair, Tiffany Bauer, present Co-Chair, Tina Russi, absent
Habilitation Chair, Roland Fernandez, present Co-Chair, Tim Chervenak, present
Independent/Supported Living Chair, Janice Retz, present Co-Chair, Member Pending
Intermediate Care Facilities Chair, Rich Mraule, present Co-Chair, Member Pending
Support Services/Allied Health Chair, Lizette Ceja, present Co-Chair, Yvette Staggs, absent
Liaisons: CalOptima Michael German, absent
Fairview Developmental Center Larry DuBord, absent
Orange County Transit Authority Jack Garate, absent Christina Blanco, absent

Vendor Advisory Committee Minutes November 13, 2018
Page 2 of 5
RCOC Staff Present: Larry Landauer, Executive Director
Bonnie Ivers, Clinical Director Arturo Cazares, Associate Director of Employment Jack Stanton, Associate Director of Housing Marta Vasquez, Associate Finance Director Veronica Flores, Accounting Manager Sean Watson, Manager, Risk Management, QA Lilliana Castillo, Fiscal Coordinator Jyusse Corey, Peer Advocate
I. Call to Order
Ms. Tiffany Bauer welcomed all attendees and called the meeting to order at 2:01 p.m. She then asked all Committee members and guests to introduce themselves.
II. RCOC Update
Mr. Larry Landauer reported that the Departmental of Developmental Services (DDS) is visiting all the Regional Centers to discuss enhancing its risk management system. The risk management review related to Special Incident Reporting and the many variances in the Regional Center system.
Mr. Patrick Ruppe, RCOC’s Director of Services and Supports, reported that vendors have sent 151 of their employees to the two-day Person Centered Thinking (PCT) training. In 2019, Mr. Ruppe said that PCT trainings for vendors will continue but PCT training for families has been delayed. He will provide the Committee with training dates as they are scheduled. Mr. Arturo Cazares, RCOC’s Associate Director of Employment, reported that RCOC is in the process of developing Project SEARCH programs with Edwards Lifescience in Irvine and Kaiser Permanente in Anaheim. Mr. Landauer reported that the California Insurance Commissioner did not approve the proposed classification changes submitted to the Workers’ Compensation Insurance Rating Bureau of California. The proposed classification changes could have quadrupled workers’ compensation insurance premiums for day program vendors.
Mr. Landauer shared a letter from the Southern California Regional Center Directors and the Los Angeles Coalition of Service Providers to the California Legislature requesting support for an 8% increase in provider rates.
III. VAC Co-Chair Elections
The Committee elected Ms. Maria Sañudo as VAC Co-Chair to serve the remainder of the term ending May 30, 2019.

Vendor Advisory Committee Minutes November 13, 2018
Page 3 of 5
IV. Board Report
Ms. Bauer reported that at the Board of Directors’ meeting on November 1, 2018, the Board approved several items, including the appointment of three new Board members, several governance policies and the approval of VAC members Ms. Marie Sañudo as Chair of the AFHA/FFA Subcommittee and Mr. Tim Chervenak as Co-Chair of the Habilitation Subcommittee.
V. Community Forum
Ms. Christine Tolbert from the State Council on Developmental Disabilities (SCDD), Orange County Office, said that SCDD will hold an informational meeting about Supplemental Security Income (SSI) benefits for children on Wednesday, November 14, 2018, from 10:00 a.m. to 12:00 p.m. at Project Youth, Orange County Bar Foundation, in Santa Ana.
Mr. Arturo Cazares informed the Committee that RCOC is hosting a presentation on the process for Home and Community-Based Services (HCBS) provider funding concepts. The presentation will be on the process for preparing, submitting and then hopefully obtaining the funding from DDS, which will assist providers in making the changes required to meet the Final Rule. The meeting will be on Thursday, November 14, 2018, at 1:00 p.m. at RCOC’s West Office.
VI. Peer Advisory Committee (PAC) Report
Mr. Jyusse Corey informed the Committee that PAC does not meet until Wednesday, November 21, 2018. Mr. Corey also reported that CalABLE’s launch date has been changed from December 10 to December 18, 2018.
VII. Liaison Reports
A. CalOptima – Michael German (absent)
Mr. Michael German was not present and no report was provided.
B. Fairview Developmental Center (FDC) – Larry DuBord (absent)
Mr. Larry DuBord was not present and no report was provided.
C. Orange County Transportation Authority (OCTA) – Mr. Jack Garate (absent)
Mr. Jack Garate was not present and no report was provided.
VIII. Member Reports
A. Adult Behavior Management – Maryam Abedi (present) B. Adult Day Programs – Rick Perez (absent)
In Mr. Rick Perez’s absence, Ms. Abedi reported that the two subcommittees met and shared information on the various companies that are currently hiring and addressed

Vendor Advisory Committee Minutes November 13, 2018
Page 4 of 5
complaints from parents about job coaches who are not adequately trained to provide support and how to work with employers. Ms. Abedi also stated that the two subcommittees would not meet in the month of December.
C. Adult Family Home Agency/Foster Family Agency (AFHA/FFA) – Marie Sañudo (present)
Ms. Marie Sañudo reported that their subcommittee reviewed the level of care for participants. They also had a presentation on Important To and Important For from Ms. Leah Saitz, RCOC’s Supported and Independent Living Coordinator and Mr. Nate Taleon, RCOC’s Area Supervisor.
D. Behavior Services – Junie Lazo-Pearson (present)
Ms. Junie Lazo-Pearson reported that their subcommittee did not meet and their next meeting is scheduled for January 10, 2019.
E. Community Care Facilities (CCF) – Noel Villegas (absent)
In Mr. Noel Villegas’ absence, Mr. Boyd Bradshaw reported that the subcommittee would not meet until January 2019.
F. Early Intervention – Tiffany Bauer (present)
Ms. Bauer reported that their subcommittee met on October 25, 2018, and reviewed their progress reports. The next meeting is scheduled for November 19, 2018.
G. Habilitation – Roland Fernandez (present) Mr. Roland Fernandez reported that their subcommittee discussed sexual harassment training and the difficulty of hiring and retaining job coaches.
H. Independent Living/Supported Living (IL/SL) – Janice Retz (present) Ms. Janice Retz reported that the subcommittee met this morning and discussed the effects of California wildfires on vendors and people served. They also reviewed their own safety issues and regulations.
I. Intermediate Care Facilities (ICF) – Rich Mraule (present)
Mr. Rich Mraule reported that their subcommittee would not meet until December 4, 2018.
J. Respite and Allied Health – Lizette Ceja (present)
Ms. Lizette Ceja reported that they discussed PCT training and how it could be implemented within each organization. They also reviewed the logistics for their Vendor Fair.

Vendor Advisory Committee Minutes November 13, 2018
Page 5 of 5
IX. Adjournment
Ms. Bauer adjourned the meeting at 3:04 p.m.
The next VAC meeting is scheduled for Tuesday, January 8, 2019. Recorder: Sandra Lomelí

AGENDA ITEM: III.I.1.
REGIONAL CENTER OF ORANGE COUNTY
BOARD OF DIRECTORS
AGENDA ITEM DETAIL SHEET
DATE: January 10, 2019 ACTION TO: RCOC Board of Directors ACTION/CONSENT DISCUSSION FROM: Tiffany Bauer
Chair, Vendor Advisory Committee INFO ONLY X
SUBJECT: Vendor Advisory Committee Member, Marie Sañudo, Elected Co-Chair of
the Vendor Advisory Committee BACKGROUND: RCOC’s Board of Directors appoints the members of the Vendor Advisory Committee (VAC), pursuant to Welfare and Institutions Code §4622(i), which states: “The governing board shall appoint an advisory committee composed of a wide variety of persons representing the various categories of providers from which the regional center purchases client services. The advisory committee shall provide advice, guidance, recommendations, and technical assistance to the regional center board in order to assist the regional center in carrying out its mandated functions. The advisory committee shall designate one of its members to serve as a member of the regional center board.” REASON FOR CURRENT ITEM: Ms. Sañudo was appointed Chair of VAC’s Adult Family Home/Foster Family Subcommittee by the Board on November 1, 2018. On November 13, 2018, VAC elected Ms. Sañudo as its Co-Chair to fill the vacancy left when Mr. Mark Antenucci resigned. Ms. Sañudo’s term as VAC Co-Chair began on November 13, 2018 and will end on June 30, 2019. FISCAL IMPACT: None. RECOMMENDATIONS: Information item only.

Regional Center of Orange County
Peer Advisory Committee November 28, 2018
Minutes
Committee Members Present: Sylvia Delgado, Chairperson Marcell Bassett (arrived at 4:12 p.m.) Amy Jessee Jyusse Corey, Peer Advocate John Godlasky Yvonne Klutzz Fernando Peña Sean Sullivan Committee Members Absent: Peter Kuo Sam Durbin Steven Gersten Steven Mesinas RCOC Staff Members Present: Larry Landauer, Executive Director
Arturo Cazares, Associate Director of Employment (arrived at 4:16 p.m.)
Cristina Mercado, Person Centered Thinking Coordinator Linda O’Neal, RCOC’s Consultant for Adult Transition Programming
Ms. Sylvia Delgado called the meeting to order at 4:08 p.m. I. Welcome and Introductions
Ms. Delgado welcomed everyone to the Peer Advisory Committee (PAC) meeting and asked members and guests to introduce themselves. The Committee then read RCOC’s Mission and Vision Statement.
II. RCOC Peer Advocate Report
Mr. Jyusse Corey, RCOC’s Peer Advocate, reported that the California Achieving a Better Life Experience (CalABLE) program has confirmed their program launch date as December 18, 2018.
III. Employment Project – RCOC & Chapman University’s Thompson Policy Institute
Ms. Linda O’Neal, RCOC’s Consultant for Adult Transition Programming, and Mr. Arturo Cazares, RCOC’s Associate Director of Employment, reported on a new employment project called the Orange County Transition Initiative. This collaborative

RCOC Peer Advisory Committee Minutes November 28, 2018
Page 2 of 2
group includes Chapman University’s Thompson Policy Institute, the State of California’s Department of Rehabilitation, community colleges and school districts in Orange County, the County of Orange’s Development Board, Disability Rights California, State Council on Developmental Disabilities, parents, persons served, advocates, community partners and RCOC. Ms. O’Neal explained that the group is developing a website in conjunction with Chapman’s University’s Thompson Policy Institute. The website is being developed by a student at Chapman University who will also maintain and update it. Ms. O’Neal and Mr. Cazares stated that they would like some feedback from the Committee so that the website is accessible and user friendly for individuals with disabilities. The Committee members provided various solutions and ideas for a more accessible and user friendly website.
IV. Community Forum
No community members were present at the meeting.
V. Other
Ms. Delgado thanked everyone who donated a toy for RCOC’s Family Resource Center’s (FRC) holiday toy collection. The toys collected will be donated to children served and their siblings. Ms. Delgado also wished everyone a happy holiday season.
VI. Next Scheduled Meeting
The next PAC meeting is scheduled for Wednesday, January 16, 2019, from 4:00 p.m. to 5:30 p.m.
The meeting was adjourned at 5:01 p.m. Recorder: Sandra Lomelí