2018/19 quarterly reporting template against the …
TRANSCRIPT

2018/19 QUARTERLY REPORTING TEMPLATE AGAINST THE
APPROVED BUSINESS PLANS
1. Executive Summary by the Department
The entity has managed to achieve five (5) out of the seven (7) key performance indicators.
The compliance in terms of the wastewater treatment works license conditions and/or
exemptions standards was at 90% against a target of 88% and this is an improvement as
compared to the previous financial years. Capital expenditure for the fourth quarter is at
R163.8 million against a budget of R164.2 million. The target CAPEX spending for the year is
99.74% against a target of 95%.
Revenue generated during the year was R106 million which is below the target of R160 million.
ERWAT has not been able to strengthen its position with various stakeholders by entering into
various strategic partnerships with private and public sector, where memorandum of
understanding and agreements have been agreed upon. It is envisaged that going forward
these will bear the desired fruits in terms of the entity’s revenue generation.
Total ERWAT realised R1 035 billion for the year against a budget of R1 025 billion inclusive of a grants and development contribution) The total income is 1% higher than budget for the year-to-date period ending 30 June 2019. Operational expenditure has however, continuously improved during the course of the year as the remedial plans took effect and we are on track to spend the full maintenance budget by the end of the financial year. Bulk purchases (Electricity, water, chemicals) are 14% below budget due to timing of utility accounts received which corrects at year end. Table A: Summary of Service Delivery Performance
Service Delivery Monitoring
Total number of targets set for the quarter
Achieved Not achieved Variance
City Wide SDBIP
3 2 1 1
Departmental SDBIP
4 3 1 1

Page 2/46 2019/08/16
CHALLENGES AND RISKS EXPERIENCED
Commercial business still remains a challenge and the entity has identified the following
remedial actions:
Identification and pursuance of potential clients according to the various sectors as well as reselling of our services to the existing customers through continuous improvement projects (CIP’s). These activities will be reported on weekly basis in order to ensure that our efforts and additional support are redirected towards conversion of our sales initiatives.
Continuous implementation of B-BBEE improvement plan and proper document management system in order to maintain our current status as a level one contributor. The service provider has since been appointed for the verification process and renewal of our B-BBEE certificate. This will also further require an approval to engage and prepare a joint B-BBEE Certificate together with all our potential partners for Joint Venture Agreements.
Page 3/46 2019/08/16
2. Service Delivery Monitoring
CITY- WIDE KPI’S
KPI 1 – City -wide
Total revenue generated from external business
Method of Measure
This is the total external sundry income generated through provision of external services to
external customers and it excludes the following revenue (Dividend Received, Development
contributions, Interest received and dividends, User Charges and Grants Received).
Evidence
Invoices
Q4 Target
R160 million
Q4 Actual
R106 million
Comment:
Target not achieved, only R106 million was generated from external business representing a
shortfall of R54 million.
Reasons for not achieving KPI:
The reason for the revenue not achieved was mainly due to bids that did not materialised as
per the plans including some of the existing contracts that has expired resulting in less
budgeted income.
Page 4/46 2019/08/16
KPI 2 – Metro-wide
Audit Opinion from AGSA.
Q4 Target
Audit Opinion from AGSA
Q4 Actual
Unqualified Audit Opinion .
KPI 3 – City-wide
% compliance with wastewater treatment works license conditions and/or exemptions
standards.
Method of Measure:
Water Quality analysis of all 19 Waste Water Treatment Works calculated as a percentage of
parameters complying against the set standards as per Water Use Licences/exemptions. The
percentage is then averaged to get the overall % compliance.
Evidence
Water Quality analysis reports per Wastewater Treatment Work and per month;
Quarterly reports, showing the Water Use License standards and compliance
calculations;
Q4 Target
88%
Q4 Actual
90%
Comment:
Achieved. Even though the overall target was achieved, six (6) of the nineteen (19) plants did
not achieve the required levels of compliance, for reasons stated under point 3.4.
Reasons for overachieving:
ERWAT successfully negotiated an amendment of licence conditions with DWS, using
scientific evidence, to industry norms.
Page 5/46 2019/08/16
Installed HYBACS technology has contributed to an improved effluent compliance of
the Tsakane Wastewater Treatment Works.
Adopting a risk based management process in identifying and mitigating risks.
KPI 1 Departmental
% Capital expenditure on planned projects
Method of Measure:
Increase ERWAT Wastewater Treatment Plants (WCW) treatment capacity and improve process
efficiency through infrastructure development projects (CAPEX). The total capital expenditure on major
capital projects associated with increasing capacity and improving process efficiency in ERWAT
Wastewater Treatment Plant according to green drop requirements and ERWAT Facility Development
Plan (FDP 2032).
Evidence
Project progress reports (weekly, quarterly and Annual reports)
Payments certificates
Invoices
Q4 Target
95%
Q4 Actual
99.74%
Comment:
Target exceeded. The reason for exceeding the target of 95% on capex spending is mainly due to good
planning. ERWAT have a detailed Capex plan.
Plan of Action
No plan of action required.

Page 6/46 2019/08/16
KPI – 2 Departmental SDBIP
% of planned maintenance scheduled.
Method of Measure
Total number of job cards received and loaded on the system versus number of job cards completed.
Evidence
Number of Job Cards received versus number of job cards completed.
Q4 Target
90%
Q4 Actual
53%
Comments
Target not achieved. The reason for the non-achievement was due to inadequate preventative
maintenance.
Remedial Action
Maintenance is in the process of implementing asset management strategy which will address all the
maintenance shortfalls.
KPI – 3 Departmental SDBIP
Rand value- support of SMME’s through ensuring appropriate application of preferential procurement
practices.
Method of Measure
Rand value of contracts awarded to SMME’s against a set targeted rand value amount.
Evidence
Procurement Plan and Invoices Paid.
Q4 Target
R61 846 786
Q4 Actual
R78 652 976

Page 7/46 2019/08/16
Comments
Target exceeded
Remedial Action
None
KPI – 4 Departmental SDBIP
Number of audit findings cleared per quarter.
Method of Measure
Number of audit findings cleared against a set number of targeted audit findings to be cleared.
Evidence
Implementation of the actions plans as per the recommendations on the Management Report issued
by the AG (SA).
Q4 Target
29 audit findings cleared in full by the end of Q4 2019
Q4 Actual
29 audit findings cleared in full by the end of Q2 2019
Comments
The findings cleared are awaiting verification by internal audit.
Remedial Acton
None

Page 8/46 2019/08/16
3.1 City-Wide/Institutional SDBIP 2018/19
Refer to the City-wide SDBIP 2018/19. Table1: City-Wide Indicators
NB: Please note that reasons for variance must be provided for both overachievement and under
achievement
Entity Outcome Ref No.
Performance Indicator (Output level only)
Description of Portfolio of Evidence Verified
Baseline (Annual Performance of 2017/18 estimated)
Annual Target for 2018/19
4th Quarter Planned Output as per SDBIP
4th Quarter Actual Output
Variation Actual Output Rating
Progress on Targets
Reason(s) for Variation
Remedial Action
4th Quarter Planned Budget
4th Quarter Actual Expenditure
National Prescribed Indicators
N/A
Provincial Indicators
N/A
City of Ekurhuleni Indicators
IDP Strategic Objective 2: To build a clean, capable and modernized local state ERWAT
Improved Quality of water (including wastewater).
WS4 36
Total revenue generated from external business
Invoices R125 million (target 2017/18)
R160 million
R160 million
R106 million R54 million
Not achieved
R106 million was achieved out of the R160 million target for Q4
The structure was not sales focussed to ensure market penetration and sales targets are achieved in order to increase quarterly revenue targets, hence the need to appoints sales engineers.
Implementation of the revised structure that includes sales engineers to focus on all the identified potential market sectors as clearly outlined on our recent ERWAT
R30 million R 98 million
Page 9/46 2019/08/16
Entity Outcome Ref No.
Performance Indicator (Output level only)
Description of Portfolio of Evidence Verified
Baseline (Annual Performance of 2017/18 estimated)
Annual Target for 2018/19
4th Quarter Planned Output as per SDBIP
4th Quarter Actual Output
Variation Actual Output Rating
Progress on Targets
Reason(s) for Variation
Remedial Action
4th Quarter Planned Budget
4th Quarter Actual Expenditure
Commercial Opportunities Business Case.8
To build a clean, Capable and Modernised Local State
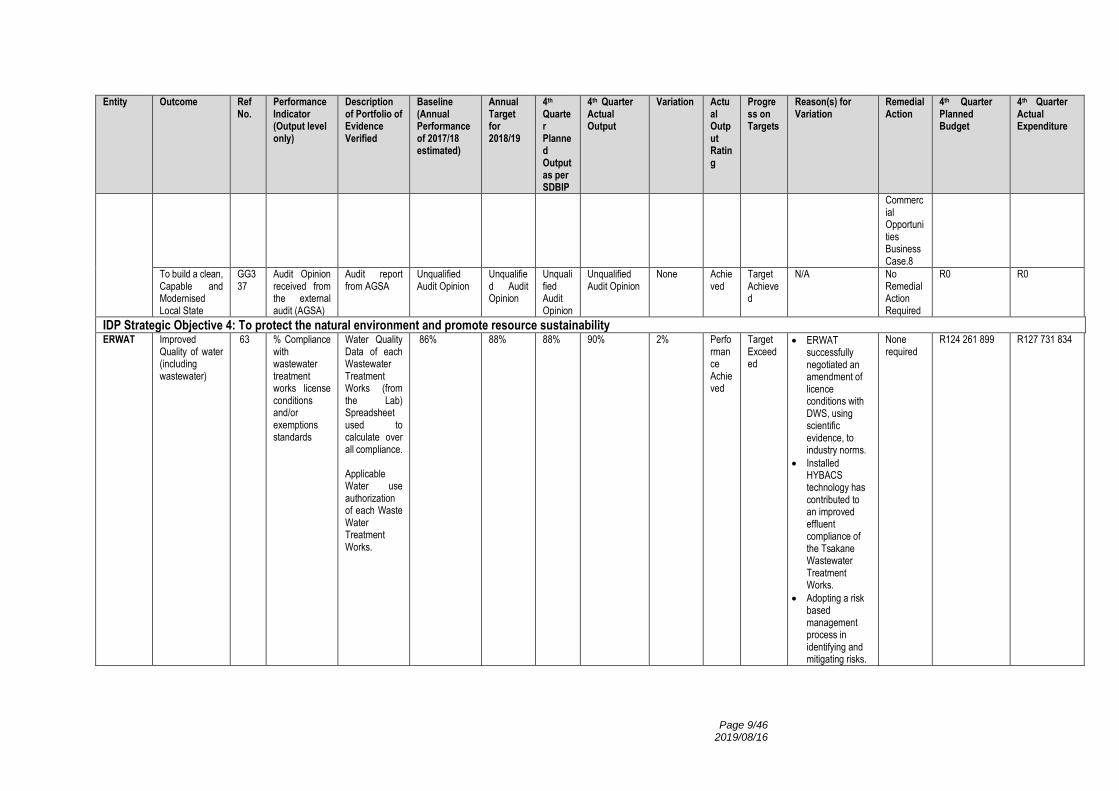
GG3 37
Audit Opinion received from the external audit (AGSA)
Audit report from AGSA
Unqualified Audit Opinion
Unqualified Audit Opinion
Unqualified Audit Opinion
Unqualified Audit Opinion
None Achieved
Target Achieved
N/A No Remedial Action Required
R0 R0
IDP Strategic Objective 4: To protect the natural environment and promote resource sustainability ERWAT Improved
Quality of water (including wastewater)
63 % Compliance with wastewater treatment works license conditions and/or exemptions standards
Water Quality Data of each Wastewater Treatment Works (from the Lab) Spreadsheet used to calculate over all compliance. Applicable Water use authorization of each Waste Water Treatment Works.
86% 88% 88% 90% 2% Performance Achieved
Target Exceeded
ERWAT successfully negotiated an amendment of licence conditions with DWS, using scientific evidence, to industry norms.
Installed HYBACS technology has contributed to an improved effluent compliance of the Tsakane Wastewater Treatment Works.
Adopting a risk based management process in identifying and mitigating risks.
None required
R124 261 899 R127 731 834
Page 10/46 2019/08/16
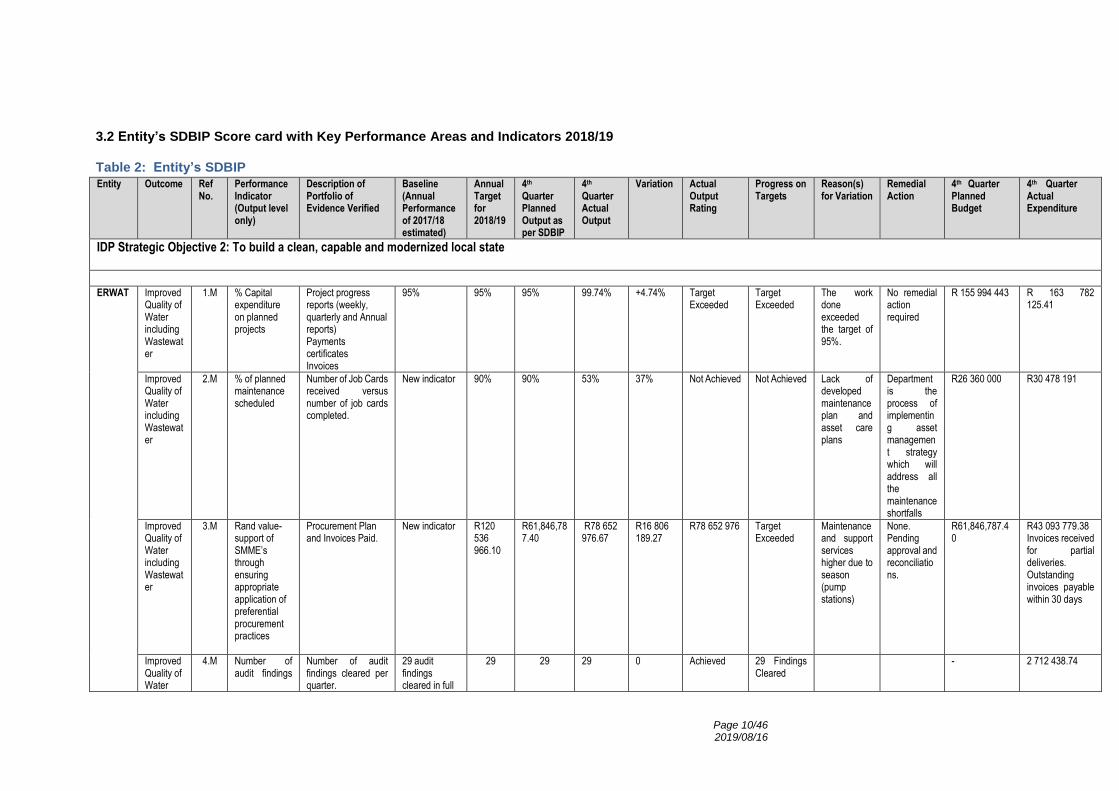
3.2 Entity’s SDBIP Score card with Key Performance Areas and Indicators 2018/19
Table 2: Entity’s SDBIP
Entity Outcome Ref No.
Performance Indicator (Output level only)
Description of Portfolio of Evidence Verified
Baseline (Annual Performance of 2017/18 estimated)
Annual Target for 2018/19
4th Quarter Planned Output as per SDBIP
4th Quarter Actual Output
Variation Actual Output Rating
Progress on Targets
Reason(s) for Variation
Remedial Action
4th Quarter Planned Budget
4th Quarter Actual Expenditure
IDP Strategic Objective 2: To build a clean, capable and modernized local state
ERWAT Improved
Quality of Water including Wastewater
1.M % Capital expenditure on planned projects
Project progress reports (weekly, quarterly and Annual reports) Payments certificates Invoices
95% 95% 95% 99.74% +4.74% Target Exceeded
Target Exceeded
The work done exceeded the target of 95%.
No remedial action required
R 155 994 443
R 163 782 125.41
Improved Quality of Water including Wastewater
2.M % of planned maintenance scheduled
Number of Job Cards received versus number of job cards completed.
New indicator 90% 90% 53% 37% Not Achieved Not Achieved Lack of developed maintenance plan and asset care plans
Department is the process of implementing asset management strategy which will address all the maintenance shortfalls
R26 360 000 R30 478 191
Improved Quality of Water including Wastewater
3.M Rand value- support of SMME’s through ensuring appropriate application of preferential procurement practices
Procurement Plan and Invoices Paid.
New indicator R120 536 966.10
R61,846,787.40
R78 652 976.67
R16 806 189.27
R78 652 976 Target Exceeded
Maintenance and support services higher due to season (pump stations)
None. Pending approval and reconciliations.
R61,846,787.40
R43 093 779.38 Invoices received for partial deliveries. Outstanding invoices payable within 30 days
Improved Quality of Water
4.M Number of audit findings
Number of audit findings cleared per quarter.
29 audit findings cleared in full
29 29
29 0 Achieved 29 Findings Cleared
- 2 712 438.74

Page 11/46 2019/08/16
Entity Outcome Ref No.
Performance Indicator (Output level only)
Description of Portfolio of Evidence Verified
Baseline (Annual Performance of 2017/18 estimated)
Annual Target for 2018/19
4th Quarter Planned Output as per SDBIP
4th Quarter Actual Output
Variation Actual Output Rating
Progress on Targets
Reason(s) for Variation
Remedial Action
4th Quarter Planned Budget
4th Quarter Actual Expenditure
including Wastewater
cleared per quarter.
by the end of Q4 2019

Page 12/46 2019/08/16
3.3. Reflection on operations/ day-to-day activities (Analytical Narrative Account)
A. Flows
Figure 1
A total of 78 569 Ml was treated in Q4 as compared to 84 113 in Q3, at an average of 863
Ml/day in Q4 and 936 Ml/day in Q3, utilising 129% of the capacity in Q4 against 139% in
Q3.
Ancor operated at 252% and Jan Smuts at 176% of its capacity, which is the highest in
ERWAT, with large regional plants such as Vlakplaats and Waterval operating at 178%.
Additional capacity is urgently needed.
0%
50%
100%
150%
200%
250%
300%F
low
Ca
pa
city v
s D
esig
n C
ap
acity
Average Flow vs Rainfall Quarter 4 2018-2019
Capacity Design Rainfall
Page 13/46 2019/08/16
3.4. Service Delivery Highlights and Challenges
CHALLENGES
A. Flows
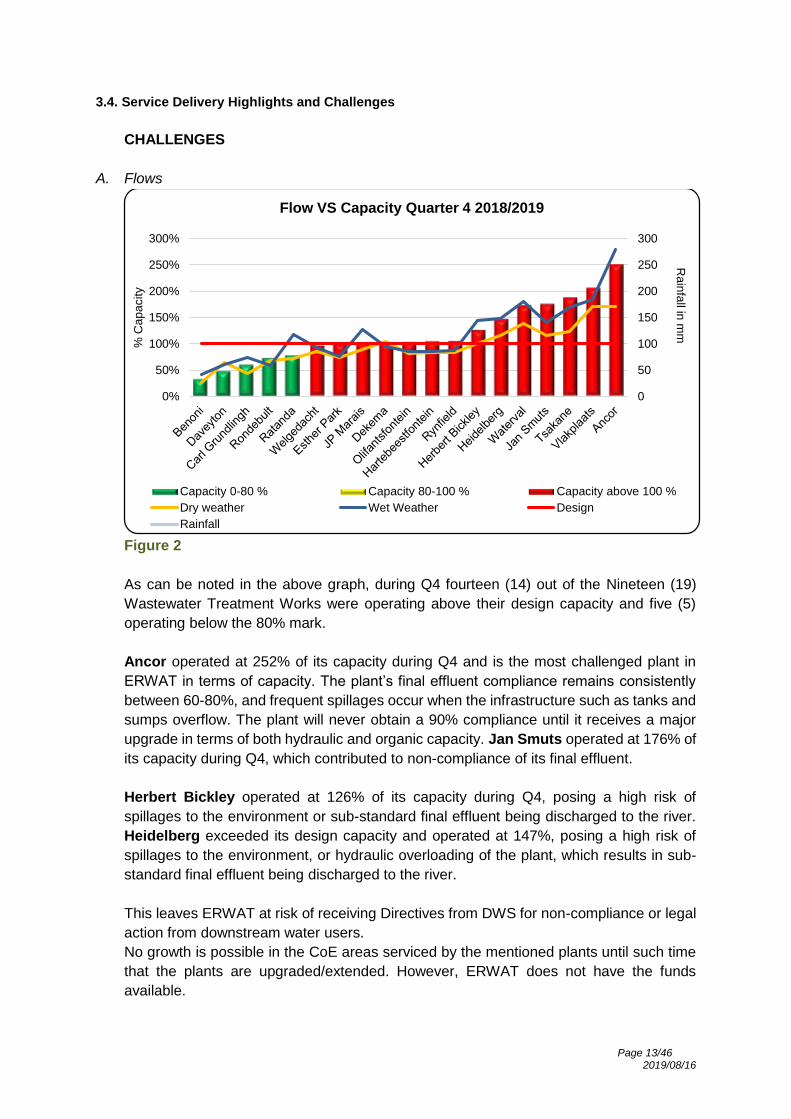
Figure 2
As can be noted in the above graph, during Q4 fourteen (14) out of the Nineteen (19)
Wastewater Treatment Works were operating above their design capacity and five (5)
operating below the 80% mark.
Ancor operated at 252% of its capacity during Q4 and is the most challenged plant in
ERWAT in terms of capacity. The plant’s final effluent compliance remains consistently
between 60-80%, and frequent spillages occur when the infrastructure such as tanks and
sumps overflow. The plant will never obtain a 90% compliance until it receives a major
upgrade in terms of both hydraulic and organic capacity. Jan Smuts operated at 176% of
its capacity during Q4, which contributed to non-compliance of its final effluent.
Herbert Bickley operated at 126% of its capacity during Q4, posing a high risk of
spillages to the environment or sub-standard final effluent being discharged to the river.
Heidelberg exceeded its design capacity and operated at 147%, posing a high risk of
spillages to the environment, or hydraulic overloading of the plant, which results in sub-
standard final effluent being discharged to the river.
This leaves ERWAT at risk of receiving Directives from DWS for non-compliance or legal
action from downstream water users.
No growth is possible in the CoE areas serviced by the mentioned plants until such time
that the plants are upgraded/extended. However, ERWAT does not have the funds
available.
0
50
100
150
200
250
300
0%
50%
100%
150%
200%
250%
300%
Ra
infa
ll in m
m
% C
ap
acity
Flow VS Capacity Quarter 4 2018/2019
Capacity 0-80 % Capacity 80-100 % Capacity above 100 %
Dry weather Wet Weather Design
Rainfall

Page 14/46 2019/08/16
CHALLENGES
Industrial Pollution:
Industrial impacts received at Ancor (52 of 91 days), Jan Smuts (4 of 91 days),
Hartebeestfontein (10 of 91 days), Herbert Bickley (26 of 91 days), Heidelberg (6 of 91
days), Olifantsfontein (25 of 91 days) and Vlakplaats (7 of 91 days) exceeded the organic
design capacities of the Wastewater Treatment Works therefore affecting the final effluent
water quality discharged.
Actions taken to address the challenges:
A steering committee has been established with the CoE to investigate how the impact
of industrial effluent discharged to Wastewater Treatment Works can be managed and
improved by developing an integrated model and review the CoE Schedule A tariff for
industrial effluent. The scope of work was finalized and is ready for appointment of a
professional consultant by the CoE in Q1.
Technology limitations and lack of infrastructure:
Trickling filter technology: Ancor, Benoni, Jan Smuts, Dekema, Rondebult and
Vlakplaats have older trickling filter technology, which is not suitable to treat high
strength sewerage containing industrial pollutants.
Tsakane and Ancor have no chlorine contact tanks, affecting disinfection efficiency
and impacts negatively on the final effluent micro compliance. Both plants fail to
produce final effluent complying 90% with the Micro standard as per WUL.
Actions taken to address the challenges
o The request for proposals for the upgrade at Ancor will continue when funds become
available.
o In–house feasibility studies are in progress for the construction of chlorine contact
tanks at both plants, but no funds are available for the construction of these structures.
Failure and replacement of critical equipment:
Degritters: The degritters at Hartebeestfontein were out of operation for
refurbishment and as a result, there is accumulation of sand in the digesters and the
pipes, which caused blockages of the downstream processes. At Ancor, two degritters
are currently not in operation and at Herbert Bickley, the degritter pumps failed during
the quarter resulting in sand and grit accumulation in the PST’s and causing blockages
to downstream processes (tanks and pipes).
Pumps: The raw feed pumps at the head of works at Herbert Bickley have reached
the end of their lifespan and are obsolete, with frequent breakdowns posing a risk of
environmental pollution. Two desludging pumps failed at Herbert Bickley and require
urgent replacement as sludge is not adequately removed from the PST and this affects
water quality compliance negatively. Frequent failure of raw feed pumps at Heidelberg
occurred. The four pumps require urgent replacement as failure thereof may result in
potential spillages to the environment. Failure of sludge recirculation pump at Ratanda
affects the efficient operation of the plant. The pump was damaged beyond repair and
therefore requires urgent replacement.

Page 15/46 2019/08/16
Screens: Frequent failure of Tsakane recycle pumps occurred due to lack of a fine
screen, resulting in screenings (papers and large objects) passing through to the
downstream processes damaging the pumps. Similarly, at JP Marais and Benoni, the
fine screen is no longer operational and downstream blockages occur because of large
objects and rags passing through to the downstream processes.
Aerators: Frequent failures of the brush aerators at Carl Grundlingh occur as they
have reached the end of their useful life. An aerator is defective at Heidelberg resulting
in less available dissolved oxygen in the reactor affecting water quality compliance.
Similarly, at Olifantsfontein, the module 3 aerators have reached the end of their
lifespan and cause frequent trippages and failures which results in noncompliant
effluent being discharged into the Kaalspruit. Waterval also experienced continuous
failures of obsolete aeration equipment for modules 2 and 3, which had an impact on
final effluent compliance. Welgedacht also experienced frequent aerator failures on
module 1 and 7 aerators are currently not operational.
Thickener: The thickener at Hartebeestfontein was out of operation for 23 days for
adhoc maintenance following the damage on the coupling.
Sand filters: Welgedacht experienced frequent challenges with solenoid valves on
four of the sand filters. There were no funds available during Q4 to procure new valves.
Screw pumps: Welgedacht, JP Marais and Ancor experienced challenges with
screw pumps at lifting stations, balancing tanks and RAS pumps at Module 2 affecting
the raw feed into the plants and the recycling streams. No funds were available during
Q3 and Q4 for preventative maintenance by external specialist service provider, which
caused frequent breakdowns during the 2 quarters.
Blowers: Welgedacht experienced challenges with three blowers providing oxygen
to module2. Two of the blowers are not operational and maintenance and repairs are
required by the service provider (specialist work) which has very long lead times. No
funds were available during Q4.
MCC panel Module 1: Welgedacht module 1 MCC panel is a risk to the plant with
frequent failures, and need to be replaced. No funds are available.
Jan Smuts: Biofilter No 5 centre column collapsed during Q3 of 2018/2019 and is
affecting the compliance of the plant significantly, especially during the cold winter
months. Maintenance is in the process of replacing the centre column and arms,
however due to funding constraints the project is delayed and will only be finalised
during Q1 of 2019/2020.
Action taken:
o Degritters: Hartebeestfontein degritters are back in operation and the pipes feeding
the digesters have been cleared. The digesters will be emptied and cleaned pending
availability of funds. Ancor degritters 3 and 4 must be replaced and were included in
the CAPEX budget request for 2019/2020, but there are no funds available. The repair
of degritters 5 and 6 are in progress with expected completion date by Q1 of
2019/2020.
o The new chlorination contact tanks at Ancor and Tsakane must be designed during
2019/2020, but no funds are available.
o Pumps: Herbert Bickley raw feed pumps - The project to replace the pumps is
currently at the installation phase, whereby six out of seven pumps and associated
valves were installed and the remaining pump will be installed in Q1. The anticipated

Page 16/46 2019/08/16
completion date is end of August 2019. Degritters and sludge pumps at Herbert
Bickley tender was awarded but awaiting availability of funds for execution. The
replacement of the raw feed pumps at Heidelberg and the recirculation pumps at
Ratanda were placed on the CAPEX list for 2019/2020 as one of the priority projects,
but no funds are available.
o Screens: Tsakane and JP Marais: The tender for the installation/ replacement of the
screens were halted due to unavailability of funds. In the meantime, the manual screen
is used at Benoni as an alternative measure.
o Welgedacht MCC: Capex budget was requested to replace the MCC panels, but no
funds are currently available.
o Welgedacht sand filters: Sand filter valves will be procured during Q1 of 2019/2020.
o Jan Smuts: Bio filter No 5 centre column collapsed during the quarter but no funds
were available during Q4 for rehabilitation of the concrete foundation. The work will be
executed during Q1 of 2019/2020.
o Aerators/aeration equipment: Floating aerators have been installed at Carl
Grundlingh as a temporary measure to assist with the aeration of the reactor basin.
The procurement of new aerators has been halted since there are no funds available
to replace the aerators. One aerator at Heidelberg: will be repaired during Q1 of
2019/2020. Five (5) blowers have been replaced at Waterval with new technology
aeration turbines during June 2019. Installation project has been completed 80% and
had a negative impact on effluent compliance during the latter part of Q4. Welgedacht
aerators and blowers: 2 x Aerators were procured during 2018/2019 but not
delivered yet. Additional 3 x aerators were put on the capex list for 2019/2020, but no
funding is available. The blowers at module 2 will be serviced during Q1 of 2019/2020,
o Thickener: the thickener was commissioned on 3 June 2019.
ERWAT is in the process of developing and implementing an Asset Management
Strategy, Policy and Processes that are in line with ISO55000 (Asset Management
world best practice).
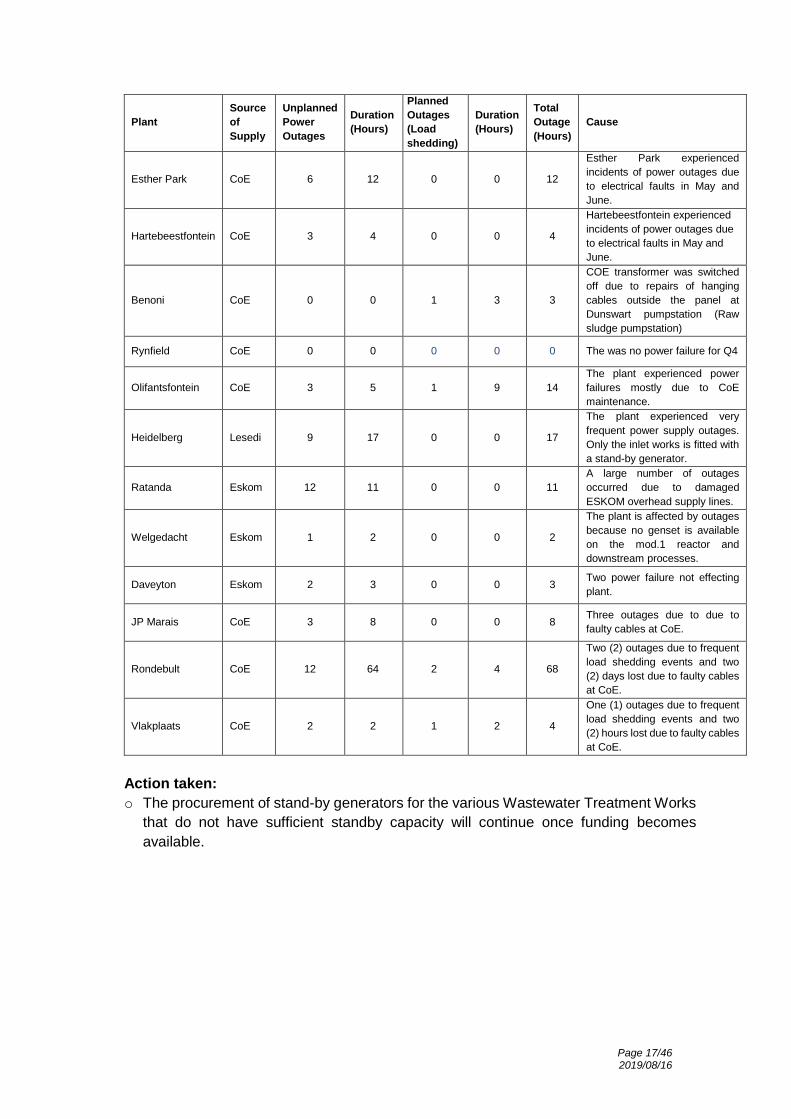
Power outages:
Power outages remain a challenge with the twelve (12) most affected plants during
Q4 being Benoni, Daveyton, Esther Park, Hartebeestfontein, Heidelberg, JP Marais,
Ratanda, Rondebult, Rynfield, Olifantsfontein, Vlakplaats and Welgedacht.
A total of 187 hours of outages occurred during Q4; of which 25 hours is attributed to
ESKOM load shedding.
Page 17/46 2019/08/16
Plant
Source
of
Supply
Unplanned
Power
Outages
Duration
(Hours)
Planned
Outages
(Load
shedding)
Duration
(Hours)
Total
Outage
(Hours)
Cause
Esther Park CoE 6 12 0 0 12
Esther Park experienced
incidents of power outages due
to electrical faults in May and
June.
Hartebeestfontein CoE 3 4 0 0 4
Hartebeestfontein experienced
incidents of power outages due
to electrical faults in May and
June.
Benoni CoE 0 0 1 3 3
COE transformer was switched
off due to repairs of hanging
cables outside the panel at
Dunswart pumpstation (Raw
sludge pumpstation)
Rynfield CoE 0 0 0 0 0 The was no power failure for Q4
Olifantsfontein CoE 3 5 1 9 14
The plant experienced power
failures mostly due to CoE
maintenance.
Heidelberg Lesedi 9 17 0 0 17
The plant experienced very
frequent power supply outages.
Only the inlet works is fitted with
a stand-by generator.
Ratanda Eskom 12 11 0 0 11
A large number of outages
occurred due to damaged
ESKOM overhead supply lines.
Welgedacht Eskom 1 2 0 0 2
The plant is affected by outages
because no genset is available
on the mod.1 reactor and
downstream processes.
Daveyton Eskom 2 3 0 0 3 Two power failure not effecting
plant.
JP Marais CoE 3 8 0 0 8 Three outages due to due to
faulty cables at CoE.
Rondebult CoE 12 64 2 4 68
Two (2) outages due to frequent
load shedding events and two
(2) days lost due to faulty cables
at CoE.
Vlakplaats CoE 2 2 1 2 4
One (1) outages due to frequent
load shedding events and two
(2) hours lost due to faulty cables
at CoE.
Action taken:
o The procurement of stand-by generators for the various Wastewater Treatment Works
that do not have sufficient standby capacity will continue once funding becomes
available.

Page 18/46 2019/08/16
Unstable Ground Conditions:
Olifantsfontein Water Care Works (WCW) discharges into the Kaalspruit and operates
under the Water Use licence granted in terms of Section 52 of the National Water Act 36
of 1998.
There have been numerous concerns raised by Department of Water & Sanitation (DWS)
together with the complaints from the downstream users, the neighbouring community
and the environmentalists over the state of the Kaalspruit and Hennops rivers. ERWAT
has subsequently communicated the challenges and proposed solutions regarding the
performance of the Olifantsfontein plant.
On the 19th December 2018, CoE was issued with a letter by DWS for failure to take
reasonable measures to prevent pollution from occurring, continuing or recurring at
Olifantsfontein. This followed the Department’s rejection of the plans for Olifantsfontein
in as far as they relate to the restoration of capacity. Lack of capital funding commitment
by CoE to address the challenges currently experienced by the plant was cited as the
reason for the rejection.
An urgent meeting on the 21st December 2018 followed between CoE and ERWAT where
it was resolved:
1. That a total amount of R233.8m is required over a period of five years to fully restore
the capacity and the functionality of the plant. It was identified that an estimated budget
amount of R80m is required in the 2018/2019 financial year to restore the functionality
of the plant. The amount was further revised to R42m as informed by the revised
detailed cash flow projection and procurement plan submitted to CoE. Both CoE and
ERWAT were to contribute equally toward the required amount; however, it would not
be possible for ERWAT to contribute as all the available funds were already committed
to other urgent capital expenditure projects. A submission for the adjustment of the
2018/2019 budget was made to CoE in this regard.
The matter was further discussed at the Senior Management Team (SMT) meeting
held on the 22nd January 2019 where it was resolved that the R42 million USDG fund
surrendered by CoE Water & Sanitation should be ring fenced and made available to
ERWAT.
2. That the CoE legal department draft an email to the Department of Water and
Sanitation to seek some clarity on the issues raised in the letter of rejection. It was
further resolved that both CoE Department of Water and Sanitation and ERWAT were
to draft a combined response to DWS. Both the detailed procurement plan as well as
the cash flow plan were submitted to CoE to form part of the response to DWS.
Action taken:
o The R42m requested was approved during budget adjustment from the USDG fund for
the 2018/2019 financial year, to be spent by 30 June 2019. The total capital cost
funding required over four (4) years which amounts to R233 800 000.00 was also
approved. The amount is required to fully restore the functionality and complete

Page 19/46 2019/08/16
restoration of the plant. This will also assist in curbing pollution of the water resource
to a great extent.
o The progress to date on the two projects are as follows;
Bio-filter refurbishment: During inspection of the biofilters (Biofilter 1 – 3) it was
discovered that the structural integrity of the supporting columns is compromised,
thus the structure might not be able to support its structural loads as per the
designs. Non-destructive testing has commenced and the results thereof will guide
the methodology that will be adopted in order to repair all the structures. This
finding have a potential of delaying the project, the exact duration of the delay in
completing the project will be determined based on the severity of the structural
damages.
Design for resuscitation of Bio-filter module, new PST, and Ekurhuleni pump
station: The tender briefing was held on the 15 of March 2019, and the closing
date was on the 27th March 2019. Designs for the following works has
commenced in order to address all issues pertaining to module 3:
Phase 1 - Rehabilitation of the whole module 3 by rerouting flow to six old PSTs
as the existing module 3 main PST is decommissioned due to the dolomitic
conditions of the area
Phase 2 - Design and construction of a new PST to replace the PST which was
decommissioned
Phase 3 - Refurbishment of Module BNR including replacement of surface
aerators and mixers.
Phase 4 - Design for the lining of emergency ponds
The designs are currently in inception stage.
Poor condition of civil structures:
Ancor: Some of the critical civil structures of the plant is in a poor condition. These
include a cracked humus tank, two distribution towers and two anaerobic digesters. Once
these structures are taken out of operation, the plant’s operating capacity will be further
reduced and the plant’s final effluent quality negatively affected. The plant is already under
tremendous pressure due to the fact that it is operating far above its design capacity.
Herbert Bickley: The one biofilter civil structure is cracked and in a poor condition, which
may cause the wall to collapse. Jan Smuts’ digester and biofilter no.5 centre column
foundation are in a poor condition. The centre column of biofilter no 5 has collapsed during
May 2019. Taking this biofilter out of operation has affected the final effluent compliance
of the plant. The cracked digester is leaking badly and had to be taken out of operation
since April 2019, which caused a constraint on the digestion capacity of the plant.
Action taken:
o Funding is required for the rehabilitation of all the above civil structures, which were
unfortunately not available during Q4.as soon as funds become available, these work
will be prioritised.
Page 20/46 2019/08/16
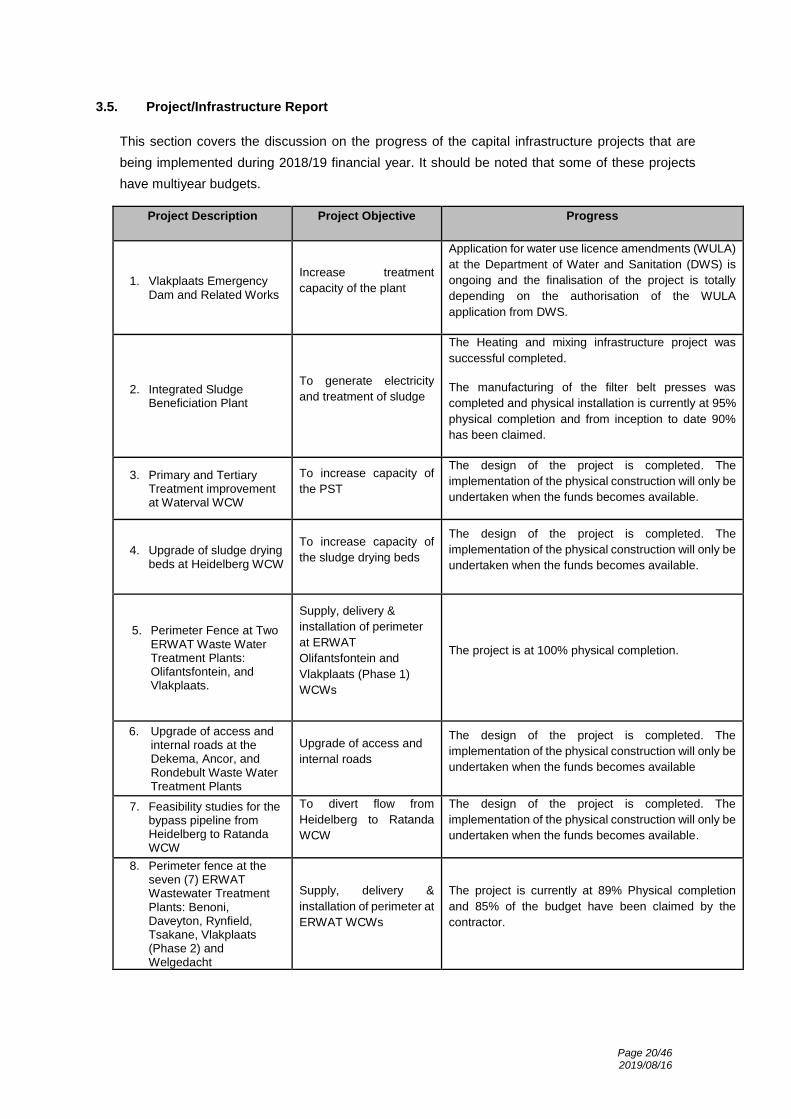
3.5. Project/Infrastructure Report
This section covers the discussion on the progress of the capital infrastructure projects that are
being implemented during 2018/19 financial year. It should be noted that some of these projects
have multiyear budgets.
Project Description Project Objective Progress
1. Vlakplaats Emergency Dam and Related Works
Increase treatment
capacity of the plant
Application for water use licence amendments (WULA)
at the Department of Water and Sanitation (DWS) is
ongoing and the finalisation of the project is totally
depending on the authorisation of the WULA
application from DWS.
2. Integrated Sludge Beneficiation Plant
To generate electricity
and treatment of sludge
The Heating and mixing infrastructure project was
successful completed.
The manufacturing of the filter belt presses was
completed and physical installation is currently at 95%
physical completion and from inception to date 90%
has been claimed.
3. Primary and Tertiary Treatment improvement at Waterval WCW
To increase capacity of
the PST
The design of the project is completed. The
implementation of the physical construction will only be
undertaken when the funds becomes available.
4. Upgrade of sludge drying beds at Heidelberg WCW
To increase capacity of
the sludge drying beds
The design of the project is completed. The
implementation of the physical construction will only be
undertaken when the funds becomes available.
5. Perimeter Fence at Two ERWAT Waste Water Treatment Plants: Olifantsfontein, and Vlakplaats.
Supply, delivery &
installation of perimeter
at ERWAT
Olifantsfontein and
Vlakplaats (Phase 1)
WCWs
The project is at 100% physical completion.
6. Upgrade of access and internal roads at the Dekema, Ancor, and Rondebult Waste Water Treatment Plants
Upgrade of access and
internal roads
The design of the project is completed. The
implementation of the physical construction will only be
undertaken when the funds becomes available
7. Feasibility studies for the bypass pipeline from Heidelberg to Ratanda WCW
To divert flow from
Heidelberg to Ratanda
WCW
The design of the project is completed. The
implementation of the physical construction will only be
undertaken when the funds becomes available.
8. Perimeter fence at the seven (7) ERWAT Wastewater Treatment Plants: Benoni, Daveyton, Rynfield, Tsakane, Vlakplaats (Phase 2) and Welgedacht
Supply, delivery &
installation of perimeter at
ERWAT WCWs
The project is currently at 89% Physical completion
and 85% of the budget have been claimed by the
contractor.

Page 21/46 2019/08/16
Project Description Project Objective Progress
9. Waterval WCW New Aeration Blowers Upgrade
Plant Efficiency
Enhancement
The Waterval WCW new aeration Blowers upgrade
project is at 75% physical completion and from
inception. To date 69% of the budget have been
claimed by the contractor.

Page 22/46 2019/08/16
3. Financial Report
Table 5: Operational expenditure
Annualised operating revenue results (based on year to date actual results)
Annualised Income:
REVENUE BY SOURCEBUDGET
ANNUAL
BUDGET FOR 12
MONTHS JUNE
2019
ACTUAL YEAR
TO DATE JUNE
2019
VARIANCE YTD
ACTUAL VS YTD
BUDGET
VARIANCE
% YTD
BUDGET VS
YTD ACTUAL
R R R R %
User Charges 791 928 000 791 928 000 791 928 669 669 0%
Commercial business - Total 179 074 000 179 074 000 106 456 930 (72 617 070) -41%
- Municipal Income 42 240 612 42 240 612 11 982 447 (30 258 165) -72%
- Government Income 7 740 612 7 740 612 46 295 (7 694 317) -99%
- External business 44 747 028 44 747 028 31 037 013 (13 710 015) -31%
- Pumpstations 84 345 748 84 345 748,00 63 391 175 (20 954 573) -25%
Other Income 3 579 000 3 579 000 44 455 424 40 876 424 1142%
Grants received 50 000 000 50 000 000 92 400 000 42 400 000 85%
OPERATING REVENUE GENERATED 1 024 581 000 1 024 581 000 1 035 241 023 10 660 023 1%
REVENUE BY SOURCEBUDGET
ANNUAL
BUDGET FOR 12
MONTHS JUNE
2019
ACTUAL YEAR
TO DATE JUNE
2019
VARIANCE YTD
ACTUAL VS YTD
BUDGET
VARIANCE
% YTD
BUDGET VS
YTD ACTUAL
ANNUALISED
PROJECTION
R R R R % R
User Charges 791 928 000 791 928 000 791 928 669 669 0% 791 928 669
Commercial business - Total 179 074 000 179 074 000 106 456 930 (72 617 070) -41% 106 456 930
- Municipal Income 42 240 612 42 240 612 11 982 447 (30 258 165) -72% 11 982 447
- Government Income 7 740 612 7 740 612 46 295 (7 694 317) -99% 46 295
- External business 44 747 028 44 747 028 31 037 013 (13 710 015) -31% 31 037 013
- Pumpstations 84 345 748 84 345 748,00 63 391 175 (20 954 573) -25% 63 391 175
Other Income 3 579 000 3 579 000 44 455 424 40 876 424 1142% 44 455 424
Grants received 50 000 000 50 000 000 92 400 000 42 400 000 85% 92 400 000
OPERATING REVENUE GENERATED 1 024 581 000 1 024 581 000 1 035 241 023 10 660 023 1% 1 035 241 023
Page 23/46 2019/08/16
Other Income has been projected to be higher than budgeted for the year.
The reason for the additional other income received mainly arises from development
(engineering) contributions received.
Total Operating Expenditure for the year to date is 8% lower than the budget for the period. Employee related cost – Salaries and Wages
The expenditure for the year to date is 7% below the budget.
ERWAT has undergone a process of correcting historical anomalies in the salaries structure and consequently some vacant positions were not filled during the 2018/19 period.
Certain specialised Repairs and Maintenance services had to be outsourced to external specialists, which were budgeted for under Employee cost.
Repairs and Maintenance
ERWAT has over spent on repairs and maintenance in total R26 998 551 (planned and ad-hoc) for the fourth quarter YTD.
Certain specialised Repairs and Maintenance services had to be outsourced to external specialists, which were budgeted for under Employee cost.
Bulk purchases
Bulk purchases was 5% higher than budgeted during the fourth quarter YTD. Bulk purchases consist of Chemical P Removal, Electricity, and Disinfection.
The primary reason for this was that a metering error occurred and the CoE had to issue ERWAT with a correction as well as a retrospective bill for the period affected by this error.
General Expenses:
General expenses have been under spent by 39%.
This primarily related to lower than anticipated expenditure on the strategy, business process mapping, business continuity management and financial model.
General expenditure was re-allocated within the same function to repairs and maintenance in order to fund the increased requirement for repairs and maintenance.
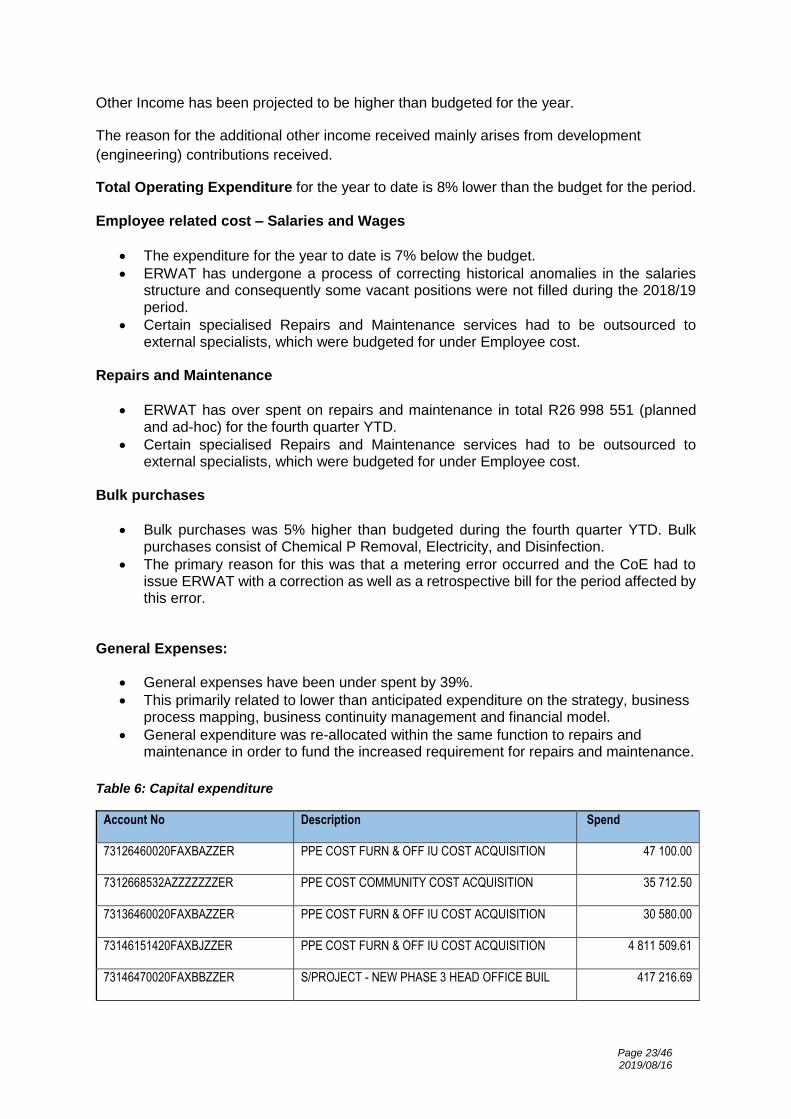
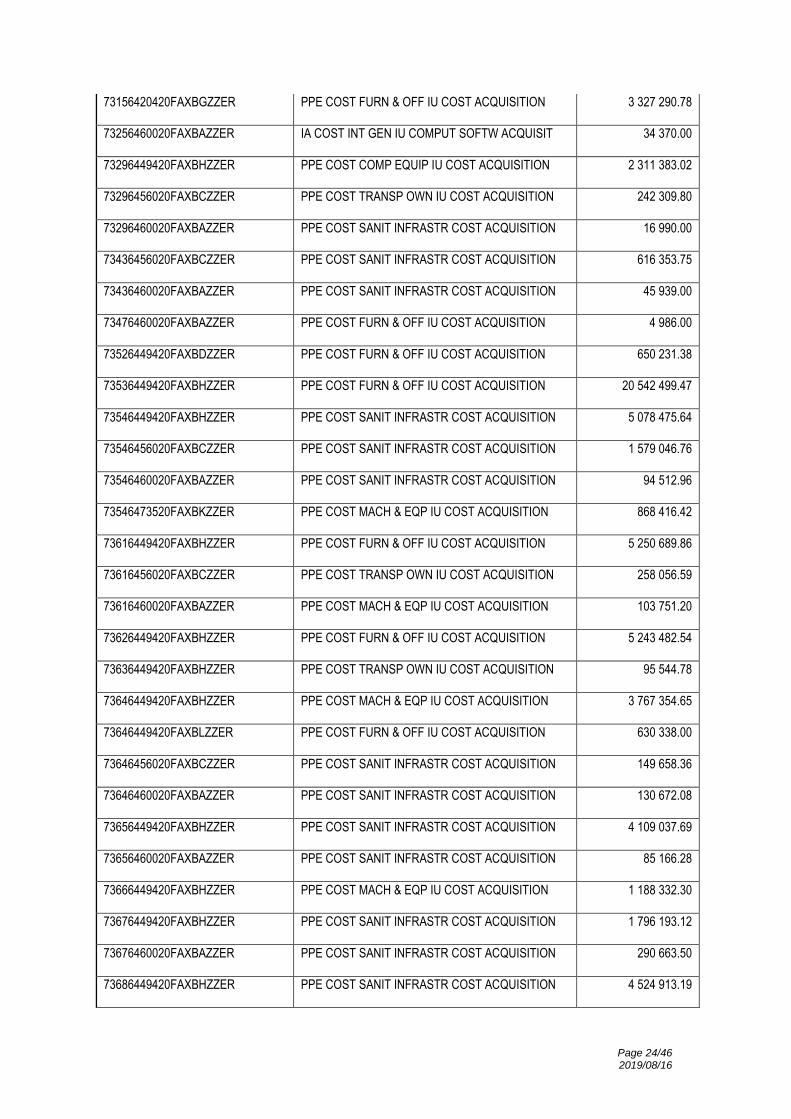
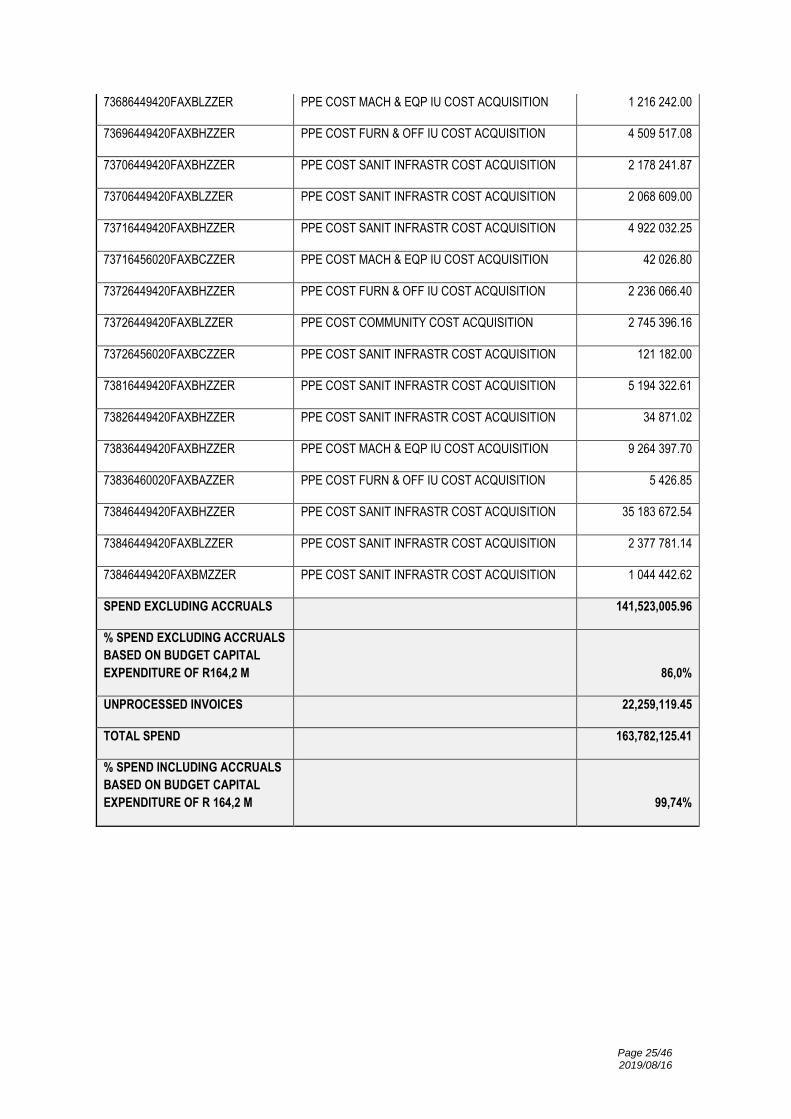
Table 6: Capital expenditure
Account No Description Spend
73126460020FAXBAZZER PPE COST FURN & OFF IU COST ACQUISITION 47 100.00
7312668532AZZZZZZZER PPE COST COMMUNITY COST ACQUISITION 35 712.50
73136460020FAXBAZZER PPE COST FURN & OFF IU COST ACQUISITION 30 580.00
73146151420FAXBJZZER PPE COST FURN & OFF IU COST ACQUISITION 4 811 509.61
73146470020FAXBBZZER S/PROJECT - NEW PHASE 3 HEAD OFFICE BUIL 417 216.69
Page 24/46 2019/08/16
73156420420FAXBGZZER PPE COST FURN & OFF IU COST ACQUISITION 3 327 290.78
73256460020FAXBAZZER IA COST INT GEN IU COMPUT SOFTW ACQUISIT 34 370.00
73296449420FAXBHZZER PPE COST COMP EQUIP IU COST ACQUISITION 2 311 383.02
73296456020FAXBCZZER PPE COST TRANSP OWN IU COST ACQUISITION 242 309.80
73296460020FAXBAZZER PPE COST SANIT INFRASTR COST ACQUISITION 16 990.00
73436456020FAXBCZZER PPE COST SANIT INFRASTR COST ACQUISITION 616 353.75
73436460020FAXBAZZER PPE COST SANIT INFRASTR COST ACQUISITION 45 939.00
73476460020FAXBAZZER PPE COST FURN & OFF IU COST ACQUISITION 4 986.00
73526449420FAXBDZZER PPE COST FURN & OFF IU COST ACQUISITION 650 231.38
73536449420FAXBHZZER PPE COST FURN & OFF IU COST ACQUISITION 20 542 499.47
73546449420FAXBHZZER PPE COST SANIT INFRASTR COST ACQUISITION 5 078 475.64
73546456020FAXBCZZER PPE COST SANIT INFRASTR COST ACQUISITION 1 579 046.76
73546460020FAXBAZZER PPE COST SANIT INFRASTR COST ACQUISITION 94 512.96
73546473520FAXBKZZER PPE COST MACH & EQP IU COST ACQUISITION 868 416.42
73616449420FAXBHZZER PPE COST FURN & OFF IU COST ACQUISITION 5 250 689.86
73616456020FAXBCZZER PPE COST TRANSP OWN IU COST ACQUISITION 258 056.59
73616460020FAXBAZZER PPE COST MACH & EQP IU COST ACQUISITION 103 751.20
73626449420FAXBHZZER PPE COST FURN & OFF IU COST ACQUISITION 5 243 482.54
73636449420FAXBHZZER PPE COST TRANSP OWN IU COST ACQUISITION 95 544.78
73646449420FAXBHZZER PPE COST MACH & EQP IU COST ACQUISITION 3 767 354.65
73646449420FAXBLZZER PPE COST FURN & OFF IU COST ACQUISITION 630 338.00
73646456020FAXBCZZER PPE COST SANIT INFRASTR COST ACQUISITION 149 658.36
73646460020FAXBAZZER PPE COST SANIT INFRASTR COST ACQUISITION 130 672.08
73656449420FAXBHZZER PPE COST SANIT INFRASTR COST ACQUISITION 4 109 037.69
73656460020FAXBAZZER PPE COST SANIT INFRASTR COST ACQUISITION 85 166.28
73666449420FAXBHZZER PPE COST MACH & EQP IU COST ACQUISITION 1 188 332.30
73676449420FAXBHZZER PPE COST SANIT INFRASTR COST ACQUISITION 1 796 193.12
73676460020FAXBAZZER PPE COST SANIT INFRASTR COST ACQUISITION 290 663.50
73686449420FAXBHZZER PPE COST SANIT INFRASTR COST ACQUISITION 4 524 913.19
Page 25/46 2019/08/16
73686449420FAXBLZZER PPE COST MACH & EQP IU COST ACQUISITION 1 216 242.00
73696449420FAXBHZZER PPE COST FURN & OFF IU COST ACQUISITION 4 509 517.08
73706449420FAXBHZZER PPE COST SANIT INFRASTR COST ACQUISITION 2 178 241.87
73706449420FAXBLZZER PPE COST SANIT INFRASTR COST ACQUISITION 2 068 609.00
73716449420FAXBHZZER PPE COST SANIT INFRASTR COST ACQUISITION 4 922 032.25
73716456020FAXBCZZER PPE COST MACH & EQP IU COST ACQUISITION 42 026.80
73726449420FAXBHZZER PPE COST FURN & OFF IU COST ACQUISITION 2 236 066.40
73726449420FAXBLZZER PPE COST COMMUNITY COST ACQUISITION 2 745 396.16
73726456020FAXBCZZER PPE COST SANIT INFRASTR COST ACQUISITION 121 182.00
73816449420FAXBHZZER PPE COST SANIT INFRASTR COST ACQUISITION 5 194 322.61
73826449420FAXBHZZER PPE COST SANIT INFRASTR COST ACQUISITION 34 871.02
73836449420FAXBHZZER PPE COST MACH & EQP IU COST ACQUISITION 9 264 397.70
73836460020FAXBAZZER PPE COST FURN & OFF IU COST ACQUISITION 5 426.85
73846449420FAXBHZZER PPE COST SANIT INFRASTR COST ACQUISITION 35 183 672.54
73846449420FAXBLZZER PPE COST SANIT INFRASTR COST ACQUISITION 2 377 781.14
73846449420FAXBMZZER PPE COST SANIT INFRASTR COST ACQUISITION 1 044 442.62
SPEND EXCLUDING ACCRUALS 141,523,005.96
% SPEND EXCLUDING ACCRUALS
BASED ON BUDGET CAPITAL
EXPENDITURE OF R164,2 M 86,0%
UNPROCESSED INVOICES 22,259,119.45
TOTAL SPEND 163,782,125.41
% SPEND INCLUDING ACCRUALS
BASED ON BUDGET CAPITAL
EXPENDITURE OF R 164,2 M 99,74%
Page 26/46 2019/08/16
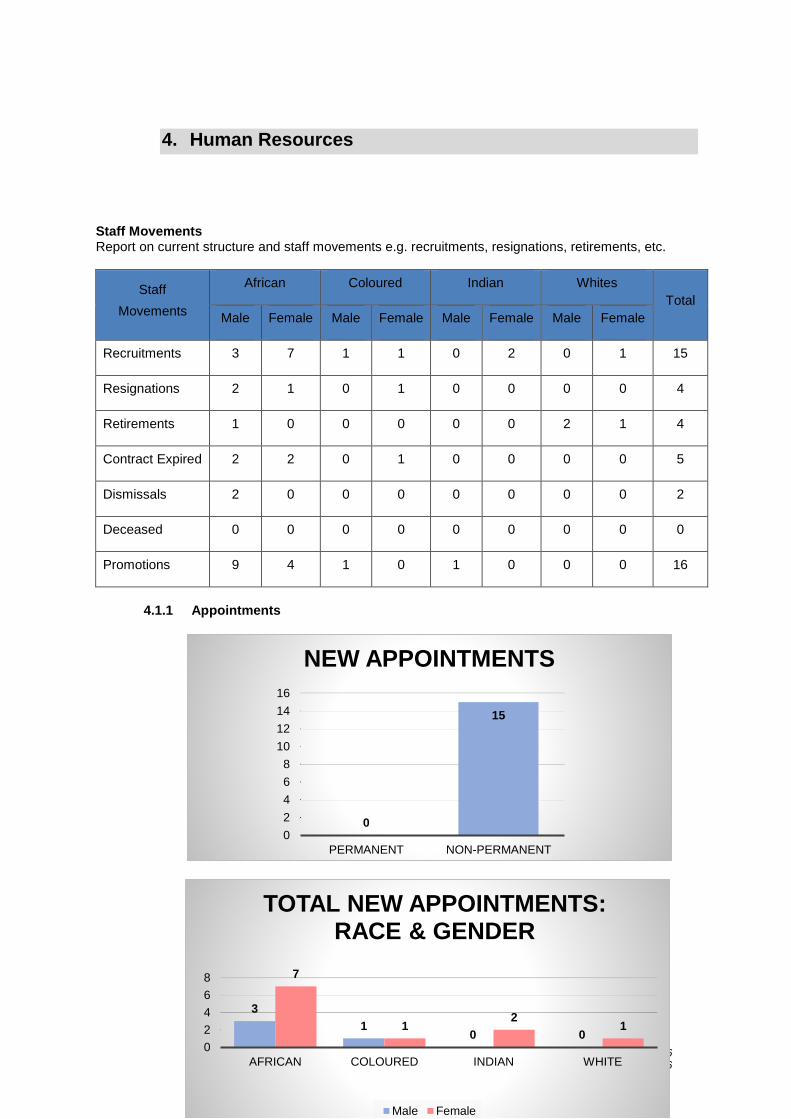
4. Human Resources
Staff Movements Report on current structure and staff movements e.g. recruitments, resignations, retirements, etc.
Staff
Movements
African Coloured Indian Whites
Total
Male Female Male Female Male Female Male Female
Recruitments 3 7 1 1 0 2 0 1 15
Resignations 2 1 0 1 0 0 0 0 4
Retirements 1 0 0 0 0 0 2 1 4
Contract Expired 2 2 0 1 0 0 0 0 5
Dismissals 2 0 0 0 0 0 0 0 2
Deceased 0 0 0 0 0 0 0 0 0
Promotions 9 4 1 0 1 0 0 0 16
4.1.1 Appointments
0
15
0
2
4
6
8
10
12
14
16
PERMANENT NON-PERMANENT
NEW APPOINTMENTS
3
10 0
7
12
1
0
2
4
6
8
AFRICAN COLOURED INDIAN WHITE
TOTAL NEW APPOINTMENTS: RACE & GENDER
Male Female

Page 27/46 2019/08/16
4.1.2 Terminations
Status Analysis
During the period under review, 15 non-permanent people were appointed.
Between the period under review 11 employees exited the organisation for the following reasons;
o 5 contracts expired; o 3 resigned for various reasons; o 4 retirements; and o 2 dismissal
36%
14%
0%
21%
29%
TERMINATIONS BREAKDOWN
CONTRACTS EXPIRED
DISMISSALS
DECEASED
RESIGNATION
RETIREMENT
8
0
1
2
TERMINATION PER RACE
AFRICAN
INDIAN
COLOURED
WHITE
Page 28/46 2019/08/16
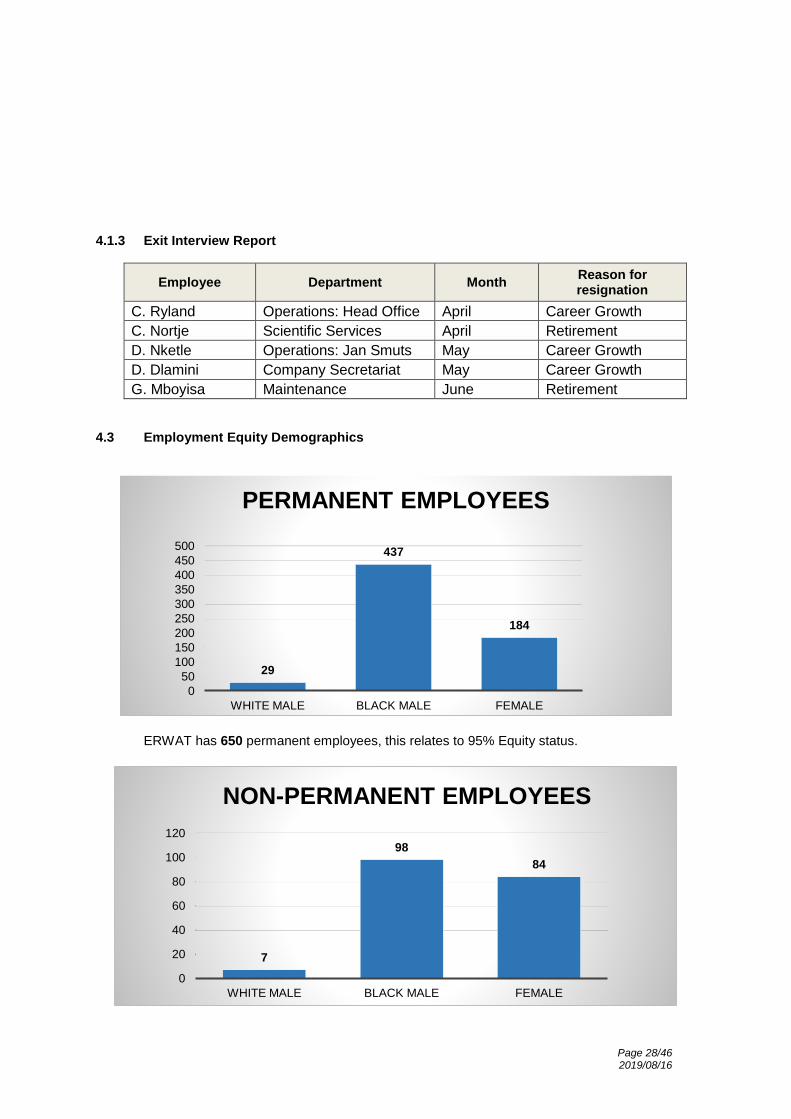
4.1.3 Exit Interview Report
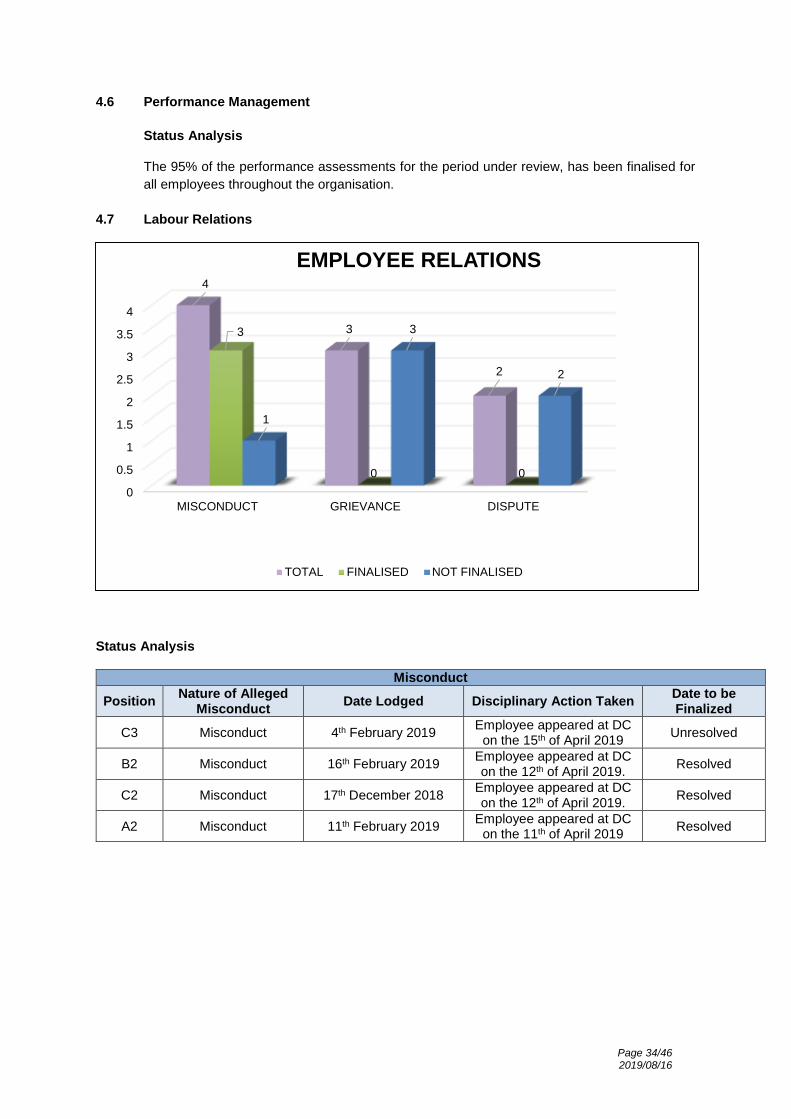
4.3 Employment Equity Demographics
ERWAT has 650 permanent employees, this relates to 95% Equity status.
29
437
184
0
50
100
150
200
250
300
350
400
450
500
WHITE MALE BLACK MALE FEMALE
PERMANENT EMPLOYEES
7
98
84
0
20
40
60
80
100
120
WHITE MALE BLACK MALE FEMALE
NON-PERMANENT EMPLOYEES
Employee Department Month Reason for resignation
C. Ryland Operations: Head Office April Career Growth
C. Nortje Scientific Services April Retirement
D. Nketle Operations: Jan Smuts May Career Growth
D. Dlamini Company Secretariat May Career Growth
G. Mboyisa Maintenance June Retirement

Page 29/46 2019/08/16
ERWAT has 189 non-permanent employees, this relate to 96% Equity status.
Status Analysis The employment demographics of ERWAT as at 30th June 2019 reflects;
– Females in both permanent and non-permanent positions within ERWAT account for 268 or
32% of a total positions filled.
EE Update
ERWAT Employment Equity Committee has finalised the 5 Year Employment Equity Plan and began implementation.
The Employment Equity Committee has also assisted with the Workplace Skills Plan and Annual Training Report submitted to the EWSETA during the last Quarter of this financial year. The Workplace Skills plan was reviewed by the committee and submitted to EWSETA by the Skills Development Facilitator on 30 April 2019.
The Employment Equity Plan will play a major role in the recruitment process, beginning in the First Quarter of the financial year 2019-2020. The recruitment process will now commence after the approval of the New ERWAT Organisational Structure. The Employment Equity Plan will support the ERWAT recruitment Strategy by identifying a need in a certain Occupational Category, Race and Gender. The current performance of ERWAT in respect of Employment Equity is on track as Implementation of the 5 Year EE plan has commenced.
Age Analysis
FEMALE, 184
MALE, 466
650 PERMANENT EMPLOYEES
FEMALE, 84MALE,
105
189 NON-PERMANENT EMPLOYEES

Page 30/46 2019/08/16
0
50
100
150
200
250
20-30 31-40 41-50 51-60 61-65
5481
4215
3
23
73
58
46
19
41
84
36
25
6
1
9
12
12
4
1
2
3
JOB GRADES:
AGE DISTRIBUTION FOR EMPLOYEES BY JOB GRADE
A B C D EL & F
119
248
150
Average age as at 12/2018 = 40
4.4 Leave Management
119
248
150
101
320
0
50
100
150
200
250
300
20-30 31-40 41-50 51-60 61-65 <65
AGE ANALYSES
PERMANENT EMPLOYEES
0200400600800
100012001400160018002000
18
1925.5
77.5 22
468672
3 86 3
9
358
43 3 6174
3 21 1
650 650 650 650 650 650 650 650 650
LEAVE OVERVIEW OF ALL LEAVE TYPES FROM THE PERIOD OF APRIL - JUNE 2019
Number of Leave days taken Number of Employees that took leave Total ERWAT Employees
*Average Age = 40
101
32

Page 31/46 2019/08/16
Status Analysis For the period under review, one disability claims were received in the process of being evaluated.
Action Taken/To Be Taken
Managers must:
Exercise their responsibility to monitor sick leave of employees.
Assist to ensure employees on sick leave longer than five days’ account for their leave.
Follow-up with employees who are on sick leave for a long time.
Must liaise with HR as soon as they are aware that the employee will be on long term sick leave.
Employees must:
Ensure that they have the correct proof for their type of illness.
Liaise with the department (their manager) when they know they are on long term sick leave, or their family must liaise with the manager as soon as they are aware that the employee will be on long term sick leave.
Overtime Trends
Quarter 1 Quarter 2 Quarter 3 Quarter 4
Total Hours 51 574.22 50 362.81 50 776.11 37 201.25
Total Cost R 6 157 354.13 R 6 054 762.96 R 5 998 879.69 R 4 485 935.38
Overtime are being monitored and approved as per the needs of the various business units.
0
50
100
150
200
250
300
350
400
450
226
147
81
259 10 20
295
6 876
101 56
14 810
13
421
8 61 421 23 8 3 3 7
100
2 1
TOTAL SICK LEAVE TAKEN FOR PERMANENT EMPLOYEES ONLY FROM THE PERIOD OF APRIL TO JUNE 2019
Total Sick Leave Days Taken Total Number of Employees per Department Total Employees that took Sick Leave

Page 32/46 2019/08/16
4.5 Training and Development
Status Analysis
During the period under review;
o 113 employees were trained through short courses/workshops and conferences. o 21 (99%) were African Females; and 1 (1%) were White Female o 74 (82%) were African Males; 4 (8%) were Coloured Males; 1 (2%) were Indian
Males and 12 (8%) were White Males Employees trained per Department were;
0 0 0 26
84
6
15
0
10
20
30
40
50
60
70
80
90S
taff
mem
bers
TRAINING COURSES PER DEPARTMENT
74
41
12
21
0 0 1
0
10
20
30
40
50
60
70
80
African Coloured Indian White
TRAINING PER RACE AND GENDER GROUP
Male Female

Page 33/46 2019/08/16
1 0 0 0 10 0 0 0 00 0 0 0 1
9
44
18 18
1
10
44
18 18
3
0
10
20
30
40
50
GRADUATES IN-SERVICETRAINEES
LEARNERSHIPS APPRENTICES BURSARS
Sta
ff m
em
bers
DEVELOPMENT PROGRAMMES
White Indian Coloured African Total
AFRICAN34%
COLOURED33%
INDIAN0%
WHITE33%
BURSARS RACE
AFRICAN
COLOURED
INDIAN
WHITE
o 84 (70%) in Operations: o 6 (6%) in Scientific Services; o 15 (17%) in Technical; o 6 (6%) in Legal and Compliance; o 2 (1%) in Human Resources; o 0 (0%) in Commercial Business; o 0 (0%) in Development and o 0 (0%) in Finance and Supply Chain
Status Analysis
As at 30 June 2019, the organisation has a Total of 189 Contractors, Graduates, In-service trainees, Learnerships, Bursars and Apprentices.
The breakdown per race is as follows: o 5 (3%) Indian o 7 (4%) Coloured o 15 (8%) White o 153 (85%) African
During the period under review, ERWAT currently has 3 bursars at various Universities.
FEMALE33%
MALE67%
BURSARS GENDER
FEMALE
MALE
Page 34/46 2019/08/16
4.6 Performance Management
Status Analysis
The 95% of the performance assessments for the period under review, has been finalised for
all employees throughout the organisation.
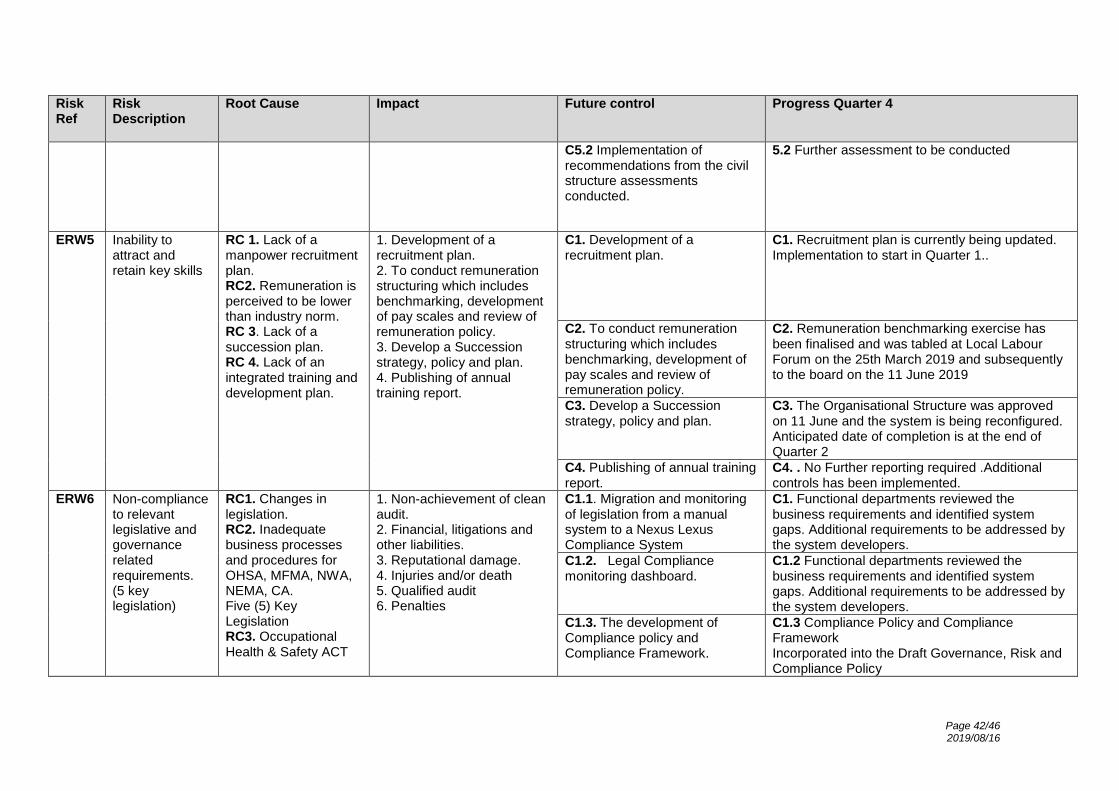
4.7 Labour Relations
Status Analysis
Misconduct
Position Nature of Alleged
Misconduct Date Lodged Disciplinary Action Taken
Date to be Finalized
C3 Misconduct 4th February 2019 Employee appeared at DC
on the 15th of April 2019 Unresolved
B2 Misconduct 16th February 2019 Employee appeared at DC on the 12th of April 2019.
Resolved
C2 Misconduct 17th December 2018 Employee appeared at DC on the 12th of April 2019.
Resolved
A2 Misconduct 11th February 2019 Employee appeared at DC
on the 11th of April 2019 Resolved
0
0.5
1
1.5
2
2.5
3
3.5
4
MISCONDUCT GRIEVANCE DISPUTE
4
3
2
3
0 0
1
3
2
EMPLOYEE RELATIONS
TOTAL FINALISED NOT FINALISED

Page 35/46 2019/08/16
Grievances
Position Nature of Grievance Date Lodged Process Followed Date to be Finalized
B1&B2 Grievance of Interest 17th April 2019 Grievance meeting
took place on the 23rd of May 2019.
Unresolved
A2 Unfair labour practice 14th March 2019 Meeting was held and employee will be sent
for RPL. 9th April 2019
C2 Unfair labour practice 12th March 2019 Grievance meeting
took place on the 2nd of May 2019.
Unresolved
Disputes
Nature of Dispute Date Lodged Process Followed Date to be Finalized
Unfair Labour Practice X2 1st July 2018 Referred to Labour
Court Unresolved
Matters of Rights 8th April 2019 Referred to Bargaining
Council Unresolved
4.8 Employee Wellness Programme Explanation
ERWAT Occupational Health Services offers Wellness Programme as follows;
HIV/AIDS Workplace Programme
ERWAT has 43 Wellness Champions (WC) that are placed on all 19 Plants including the Laboratory and Head Office.
0
10
20
30
40
50
60
70
1 1 1
67
36
0 2 3 3 1 1 0 0 0 0 0 0
OCCUPATIONAL HEALTH

Page 36/46 2019/08/16
The core function of the WC is to assist the Occupational Health nurse, in identifying any health & wellness concerns amongst employees, monitor absenteeism, they also provide health education in a form of frequently scheduled meeting with employees on site.
4.9 Percentage of Salary to Total OPEX
Quarter 1 Quarter 2 Quarter 3 Quarter 4 YTD – Actual
Total Salary Cost R 81 937 344 R 162 470 866.00 R 76 455 579.00 R 84 327 706.65 R 405 191 495,65
Total Opex R 198 495 372 R 447 024 862.00 R 222 977 685.00 R 246 746 051.00 R1 115 243 970,00
% of Salary to Opex 41.28% 36% 34% 34% 36%

Page 37/46 2019/08/16
5. Procurement Practices, Job Creation and Mainstreaming
A narrative is on how the Department has created to Job Creation. The narrative should also reflect contribution: The following should be included in this
section of the report:
INFORMATION REGARDING BIDS FOR QUARTER 4 (01 APRIL 2019 - 30 JUNE 2019)
QUARTER 4
CATEGORY APRIL MAY JUNE TOTAL VALUE
Q4 % Q4
0% HDI / JURISTIC PERSON R - R - R - R - 0.0%
1-50% HDI R 19 174 899.35 R - R - R 19 174 899.35 16.3%
51-99% HDI R - R - R 317 498.90
R 317 498.90 0.3%
100% HDI R 12 276 106.20 R 85 628 540.00 R - R 97 904 646.20 83.4%
TOTAL R 31 451 005.55 R 85 628 540.00 R 317 498.90
R 117 397 044.45
100.0%
SIZE OF COMPANY
APRIL MAY JUNE TOTAL VALUE
Q4 % Q4
LARGE R 4 800 448.15 R - R 1 433 518.15
R 6 233 966.30 5.6%
MEDIUM R 2 881 101.35 R - R 81 013.00
R 2 962 114.35 2.7%
SMALL R 16 276 106.20 R 85 628 540.00 R - R 101 904 646.20 91.7%
MICRO R - R - R - R - 0.0%
TOTAL R 23 957 655.70 R 85 628 540.00 R 1 514 531.15
R 111 100 726.85
100.0%

Page 38/46 2019/08/16
AWARDS MADE TO: APRIL MAY JUNE
TOTAL VALUE Q4
% Q4
FEMALES R 16 293 798.00 R - R - R 16 293 798.00 10.2%
BLACK FEMALE 30-100% R 44 251 453.70 R 85 628 540.00
R 1 751 017.05
R 131 631 010.75 82.2%
PEOPLE WITH DISABILITIES R - R - R - R - 0.0%
OTHER R - R - R - R - 0.0%
YOUTH R 12 276 106.20 R - R - R 12 276 106.20 7.7%
R 72 821 357.90 R 85 628 540.00 R 1 751 017.05
R 160 200 914.95
100.0%
BBEEE SCORE CARD
APRIL MAY JUNE TOTAL VALUE
Q4 % Q4
EME R 12 276 106.20 R 85 628 540.00 R - R 97 904 646.20 66.8%
QSE R 23 174 899.35 R - R 81 013.00
R 23 255 912.35 15.9%
GENERIC R 23 975 347.50 R 1 433 518.15
R 25 408 865.65 17.3%
TOTAL R 59 426 353.05 R 85 628 540.00 R 1 514 531.15
R 146 569 424.20
100.0%
AWARD MADE TO APRIL MAY JUNE TOTAL VALUE
Q4 % Q4
COE BASED COMPANIES R - R 85 628 540.00 R -
R 85 628 540.00 67.3%
NON COE BASED R 40 251 453.70 R - R 1 433 518.15
R 41 684 971.85 32.7%
R 40 251 453.70 R 85 628 540.00 R 1 433 518.15
R 127 313 511.85
100.0%

Page 39/46 2019/08/16
6. Risk Management
Risk assessment provides an assessment of the relevant and critical risks through a classification and rating system, and mitigating actions and KPIs and
targets that can be incorporated in the Balanced Scorecard. The reporting on the risk management into the quarterly reporting process is to ensure that the key
risks that may prevent the achievement of the department’s strategy are systematically identified and mitigating strategies and actions developed.
#: This report is against the risks identified in the Business Plans
Table 11: Risk Assessment
Risk Ref
Risk Description
Root Cause Impact Future control Progress Quarter 4
ERW1 Inability to meet CAPEX target.
RC 1. Planning not fully integrated including SCM processes: RC2. Inadequate project management business processes and systems
1. Ability to increase budget allocation from CoE and future cuts. 2. Ability to raise external funding 3. Impact on service delivery; Socio and economic stability 4. Not completing projects on time.
C1.1.Implementation of digitised document management system.
C1.1 Implementation of the DMS is still at the BRS/FRS stage, business requirements are being gathered as part of the ERP programme.
C1.2. Integration of digitised document management system into Supply Chain Management Process.
C1.2 a) Contract Management module activated on
the Solar System to improve contract governance. All active contracts are being uploaded
b) Electronic Bid Tender document listing on the new ERWAT Website.
C2.1. Develop business processes.
C2.1 a) ERWAT Business processes for all
departments has been completed b) Business Process Gap Analysis Workshops
conducted for all department
C2.2. Implement a Project Management System
C2.2 Process flow mapping and information provision has been completed by the user department, and awaiting system integration with the financial system.

Page 40/46 2019/08/16
Risk Ref
Risk Description
Root Cause Impact Future control Progress Quarter 4
C2.3. Develop Capital Infrastructure planning and project management policy
C2.3 No Further reporting required .Additional controls has been implemented.
C2.4. Develop standards and specifications.
C2.4 The Development of Maintenance Standards and Specifications has not commenced due to budgetary constraints
ERW2 Inability to meet external revenue targets.
RC1. The company is currently incorporated as an Non-Profit Company. RC2. Municipal Finance Management Act, Sec 164; FORBIDDEN ACTIVITIES. RC3. Products and services are not well defined. RC4. Lack of a tariff model.
1. Limitation on profit generation thus increasing reliance on parent municipality for usercharges. 2. Services only limited to area of jurisdiction.
C1. Change the current incorporation from an NPC to an SOC (LTD).
C1. A resolution taken by the Board to retain the current legal structure of the organisation. There will be no further reporting in quarter 4.
C2. No additional controls required.
C2. No reporting required.
C3. Review the marketing strategy
C3. Market analysis conducted and documented in the draft ERWAT Strategy.
C4. Tariff model to be developed.
C4. Tariff Model is part of the overall ERWAT Funding Model (a) Draft financial model has been developed and
currently finalising the dashboards
ERW3 Laws and Regulations Hindering Alignment to processes
MFMA(Chaper11) Preferential Procurement Regulations and SCM policy
Community unrest C1. Review of the Supply Chain Management Policy
C1. No Further reporting required .Additional controls has been implemented.
ERW4 Inadequate infrastructure capacity to treat wastewater
RC1. Waste Water Treatment Plants (WCW) operating above their designed capacity
1. Impact on service delivery ; Socio and economic stability. 2. Impact on environmental compliance.
C1. Develop a Waste Water Conveyance and Treatment Systems Regionalisation and 50 year Master Plan.
C1. The progress on the alternative evaluation is now at 46%. The alternative evaluation is undertaken concurrently with the SWOT analysis in order to fast track the progress and ensure the project is completed as scheduled

Page 41/46 2019/08/16
Risk Ref
Risk Description
Root Cause Impact Future control Progress Quarter 4
RC2. Inadequate asset management. RC3. Inadequate capex funding for expansion, retrofit, refurbishment and replacement RC4. Outdated Technology RC5. Ageing Infrastructure
3. Delay of CoE development growth 4. Affect credibility on the commercial business.
C2.1 Develop an asset management strategy, policy and maintenance plan.
C2.1 Draft Asset Management Policy, AM Strategy and Maintenance Plans to be tabled at the next Board for approval
C2.2 Develop maintenance standards and specifications for critical equipment;
C2.2 The Development of Maintenance Standards and Specifications has not commenced due to budgetary constraints
C2.3 Develop business continuity management plan (BCMP).
C2.3 a) BIA workshop with Maintenance, Finance and
Supply Chain Management b) First Iteration Draft Status Quo Feedback
document completed for the 1st Pilot WWCW Plant i.e. Ancor and Hartebeesfontein
c) ISO Lead Implementer Training for the BCM Coordinators (22 ERWAT Employees)
d) BCM Champion Group 2 trained (68 Employees)
C3. Develop financial model. C4. a) Draft financial model has been developed
and currently finalising the dashboards
C4. No additional control required.
C4. No reporting required
C5.1 Implementation of recommendations from the equipment assessment conducted by the original equipment manufacturers.
C5.1 Assessment recommendations incorporated into the 2018/2019 Capital Expenditure Plan.
Page 42/46 2019/08/16
Risk Ref
Risk Description
Root Cause Impact Future control Progress Quarter 4
C5.2 Implementation of recommendations from the civil structure assessments conducted.
5.2 Further assessment to be conducted
ERW5 Inability to attract and retain key skills
RC 1. Lack of a manpower recruitment plan. RC2. Remuneration is perceived to be lower than industry norm. RC 3. Lack of a succession plan. RC 4. Lack of an integrated training and development plan.
1. Development of a recruitment plan. 2. To conduct remuneration structuring which includes benchmarking, development of pay scales and review of remuneration policy. 3. Develop a Succession strategy, policy and plan. 4. Publishing of annual training report.
C1. Development of a recruitment plan.
C1. Recruitment plan is currently being updated. Implementation to start in Quarter 1..
C2. To conduct remuneration structuring which includes benchmarking, development of pay scales and review of remuneration policy.
C2. Remuneration benchmarking exercise has been finalised and was tabled at Local Labour Forum on the 25th March 2019 and subsequently to the board on the 11 June 2019
C3. Develop a Succession strategy, policy and plan.
C3. The Organisational Structure was approved on 11 June and the system is being reconfigured. Anticipated date of completion is at the end of Quarter 2
C4. Publishing of annual training report.
C4. . No Further reporting required .Additional controls has been implemented.
ERW6 Non-compliance to relevant legislative and governance related requirements. (5 key legislation)
RC1. Changes in legislation. RC2. Inadequate business processes and procedures for OHSA, MFMA, NWA, NEMA, CA. Five (5) Key Legislation RC3. Occupational Health & Safety ACT
1. Non-achievement of clean audit. 2. Financial, litigations and other liabilities. 3. Reputational damage. 4. Injuries and/or death 5. Qualified audit 6. Penalties
C1.1. Migration and monitoring of legislation from a manual system to a Nexus Lexus Compliance System
C1. Functional departments reviewed the business requirements and identified system gaps. Additional requirements to be addressed by the system developers.
C1.2. Legal Compliance monitoring dashboard.
C1.2 Functional departments reviewed the business requirements and identified system gaps. Additional requirements to be addressed by the system developers.
C1.3. The development of Compliance policy and Compliance Framework.
C1.3 Compliance Policy and Compliance Framework Incorporated into the Draft Governance, Risk and Compliance Policy

Page 43/46 2019/08/16
Risk Ref
Risk Description
Root Cause Impact Future control Progress Quarter 4
Non-compliance to relevant legislative and governance related requirements. (5 key legislation)
- Lack of Occupational, Health Safety (OHS) systems and processes. RC4. Municipal Finance Management Act 4.1 Performance (a) Budget not allocated to Key Performance Areas (b) Performance objectives not aligned with the Service Delivery Agreement. (c) Incorrect disclosures in annual financial statements and the annual report 4.2Asset Management (a) Amortisation or depreciation hich does not reflect the economic use of the asset. (b)Failure to recognise impairments in value (c)Incorrect computation of gains/losses on asset disposal (d) Capitalisation of costs that should be expensed
1. Non-achievement of clean audit. 2. Financial, litigations and other liabilities. 3. Reputational damage. 4. Injuries and/or death 5. Qualified audit 6. Penalties
C2. Annual review of the Internal Audit Plan and implement the recommendation of the Internal Audit.
C2. C.oE appointed Internal Auditors for Entities. Internal Audits Plan discussed with management and the audits commenced in the 3rd week of March 2019. 16 Auditable arears were covered and reports are available
C3.1. Review and update of the occupational health and safety plan
C3.1 No Further reporting required .Additional controls has been implemented.
C3.2. Develop a Safety Compliance Report.
C3.2 No Further reporting required .Additional controls has been implemented
C3.3 Safety video to be rolled out.
C3.3 No reporting required. Additional controls has been implemented
C4.1 Review of the Service Delivery Agreement
C4.1 Service Delivery Agreement submitted to the City for input
C4.2 The review of the Asset Management Policy
C4.2 Draft Asset Management Policy, AM Strategy and Maintenance Plans to be tabled at the next Board for aprroval
C5.1 Annual Greendrop Audits
C5.1 The Assessments took place from 10-12 June 2019, the status report will be available at the end of July 2019.

Page 44/46 2019/08/16
Risk Ref
Risk Description
Root Cause Impact Future control Progress Quarter 4
ERW7 Failure to effectively intergrate Enterprise Risk Management systems.
RC1. Lack of a formalised Business Continuity Management programme. RC2. Organisational Risk Maturity RC3. The organisational culture towards risk management prioritisation RC4 depreciated historical cost to asset replacement values (Inadequate insurance coverage for ERWAT.)
1.Impact on service delivery ; Socio and economic stability 2. Lower importance placed on risk management 3.1. Existing risks not identified, assessed and/or mitigated. 3.2. Financial liabilities arising from inappropriate execution of Risk Management Processes 4. Inability to replace critical asset
C1. Comprehensive program to update Strategy and Business Processes in conjunction with the implementation of the Business Continuity Management and Disaster Recovery Plan.
STRATEGY, Operating Model reviewed and Key Performance goals defined Communication Plan drafted Drafted 3 of the 5 business plans BUSINESS CONTINUITY MANAGEMENT a) BIA workshop with Maintenance, Finance and
Supply Chain Management
b) First Iteration Draft Status Quo Feedback
document completed for the 1st Pilot WWCW
Plant i.e. Ancor and Hartebeesfontein
c) ISO Lead Implementer Training for the BCM Coordinators (22 ERWAT Employees)
d) BCM Champion Group 2 trained (68 Employees)
BUSINESS PROCESS MAPPING a. ERWAT Business processes for all
departments has been completed Business Process
b. Gap Analysis Workshops conducted for all department
C2. Conduct a Risk Maturity Assessment
C2 Draft governance Maturity Assessment report is available
C3 -4. No additional control required
C3 – 4 No additional control required
Page 45/46 2019/08/16
7. Legislative (only if applicable to your department)
Compliance Risk Management forms part of the broader risk management within ERWAT. In order to protect ERWAT from the Risk of non-compliance, management has identified and prioritised 5 key legislation. An additional legislation, the Labour Relations Act has been added to the priority list.
Compliance Risk Management Plans has been developed and there are quarterly compliance monitoring and reviews to enhance adherence to the key legislation
1. National Water Act 36 of 1998
2. Municipal Finance Management Act of 2003
3. Companies Act 71 of 2008
4. Occupational Health & Safety Act 85 of 1993
5. National Environmental Act 107 of 1998
6. Labour Relations Act 66 of 1995

Page 46/46 2019/08/16
8. Key Audit Matters and Progress
The annual regularity audit for ERWAT commenced on 15 August 2018 and was completed
on 30 November 2018. The signed audit report and management report was provided to
ERWAT on 7/12/2018.
The final audit outcome was unqualified with findings. The audit outcome remained unchanged
from the 2016/17 financial period.
The Auditor General (South Africa) identified 34 findings which are classified as follows:
a. Administrative matters: Two (2) findings
b. Other important matters: Twenty-six (26) findings
c. Matters affecting the audit report: Six (6) findings
The quality of the financial statements and annual performance improved from the previous
financial period as evidenced by the absence of an MFMA Section 122 and Section 87
paragraph in the audit report respectively. No material adjustments to the Annual Financial
Statements or Annual Performance Report was required. Compliance with the laws and
regulations regresses from the previous financial period.
The findings noted in relation to the fixed asset register were not material and did not impact
the audit report.