2018 road inventory year-end report | mass.gov
TRANSCRIPT

2020
Massachusetts
Road Inventory
Year End Report
PREPARED BYMassachusetts Department of Transportation
Office of Transportation Planning
with funding provided by
Federal Highway Administration
July 2021

ROAD INVENTORY YEAR END REPORT 2020
CONTENTS Page Number
Introduction 1
I. DEFINITION OF TERMS AND CATEGORIES 2
II. CENTERLINE MILE REPORTS 4
TABLE 1: Jurisdiction By Functional Classification (By District) 5
TABLE 2: Jurisdiction By Federal Aid Category (By District) 8
TABLE 3: Jurisdiction By Functional Classification (By MPO) 11
TABLE 4: Jurisdiction By Funding Category (By MPO) 16
TABLE 5: City/Town By Jurisdiction 21
TABLE 6: City/Town By Functional Classification 32
TABLE 7: City/Town By Federal Aid Category 42
III. LANE MILE REPORTS 52
TABLE 8: Jurisdiction By Functional Classification (By District) 53
TABLE 9: Jurisdiction By Federal Aid Category (By District) 56
TABLE 10: Jurisdiction By Functional Classification (By MPO) 59
TABLE 11: Jurisdiction By Funding Category (By MPO) 64
TABLE 12: City/Town By Jurisdiction 69
TABLE 13: City/Town By Functional Classification 80
TABLE 14: City/Town By Federal Aid Category 90
APPENDIX 100
APPENDIX A - Description of Road Inventory File 101
APPENDIX B - Physical Road Description Fields on Divided and Undivided Roadways 109

ROAD INVENTORY YEAR END REPORT 2020
Massachusetts Department of TransportationOffice of Transportation Planning 1 / 109
Massachusetts Department of TransportationOffice of Transportation Planning
INTRODUCTION
This report contains selected 2020 year-end statistics from the Massachusetts Road Inventory file andsupersedes the 2019 report issued last year. The Road Inventory file, maintained by the Office of TransportationPlanning, contains information on mileage, identification, characteristics, and condition for all roadways in the state.It is a widely used transportation planning resource within the Massachusetts Department of Transportation[MassDOT] and is the foundation of several important programs. Among its more important uses include:
· Identifying functional classification, jurisdiction, and National Highway System status of all roadways inthe state.
· Fulfilling Highway Performance Monitoring System (HPMS) reporting requirements to the FederalHighway Administration.
· Determining centerline miles of city/town accepted roads used for allocating State Aid to communities.The Road Inventory file also serves as the foundation of Massachusetts Geographic Information System
(GIS) capabilities. It is linked to 1:5,000 Centerlines using ArcGIS and contains nearly 500,000 road inventoryrecords representing over 36,000 centerline miles of roadway. This GIS system allows for easy mapping of any ofthe 80 attributes in the Road Inventory file at any geographic level (i.e., State, MassDOT Highway District,Metropolitan Planning Organization (MPO), Town, etc.).
This 2020 year-end report contains centerline and lane mileage data on jurisdiction, functional classification,and federal-aid status at the town, MPO, MassDOT Highway District, and state levels. Please note that not allmileage for ramps are included in any of these tables and that lane miles do not include any shoulders. An appendixcontaining documentation of the Road Inventory database accompanies these reports.
We hope that you find this report useful. If you should require any additional information about the contentof this document or want to learn more about the Road Inventory program, please contact the GIS Services group at857-DOT-4GIS (857-368-4447).

ROAD INVENTORY YEAR END REPORT 2020DEFINITION OF TERMS AND CATEGORIES
Massachusetts Department of TransportationOffice of Transportation Planning 2 / 109
I. DEFINITION OF TERMS AND
CATEGORIES

ROAD INVENTORY YEAR END REPORT 2020DEFINITION OF TERMS AND CATEGORIES
Massachusetts Department of TransportationOffice of Transportation Planning 3 / 109
1. Centerline Miles refer to the linear length of a road segment. For divided highways, only the length ofone side of the roadway is counted.
2. Lane Miles refer to the linear length of lanes of a road segment. The number of lanes on both sides ofthe roadway are counted in the mileage calculation. Shoulders and auxiliary lanes are not included in thecalculation of lane miles.
3. Jurisdiction refers to the agency or entity that owns and has administrative authority over the roadway.The Road Inventory file contains 18 different jurisdiction categories. For the purposes of this report, theyhave been consolidated into ten groups. Please note that unaccepted roads consist of roads open topublic travel but not formally accepted by a city or town, as well as some private ways.
4. Functional Classification refers to the character of services that a particular roadway is intended toprovide. In general, roads either serve to provide mobility for vehicles or access to locations. The processof functional classification was mandated by Intermodal Surface Transportation Efficiency Act of 1991(ISTEA) and implemented in 1993 by the Office of Transportation Planning in cooperation with the 13Regional Planning Agencies. Roadways are divided into the following three classification categories:
Arterials: These roadways provide the highest level of mobility at the greatest vehicular speed for thelongest uninterrupted distances and are not intended to provide access to specific locations. Arterials arefurther subdivided into Principal Arterials and Minor Arterials. However, for the purposes of this report theyhave been grouped together. Please note that Interstates are considered Arterials, but they have beengiven their own category in this report.
Collectors: These roadways provide some level of both mobility and access. They collect traffic from Localroads and funnel it to Arterials. In rural areas, collectors are further subdivided into Major Collectors andMinor Collectors, but for the purposes of this report they have been grouped together.
Locals: These roadways provide access to abutting land with little or no emphasis on mobility. The termLocal road should not be confused with local jurisdiction. Most, but not all, functionally classified Localroads are under city/town jurisdiction.
5. Aid Category refers to funding categories that have been established by ISTEA and TEA-21. The RoadInventory directly identifies which roadways fall under the National Highway System Federal Fundingcategory and indirectly identifies which roadways fall under the Surface Transportation Program Federalcategory and Non-Federal Aid category. These three funding categories are described below:
National Highway System (NHS) funded roadway network represents all Interstate roadways and principalarterials spanning the state in accordance with the Moving Ahead for Progress in the 21st Century Act(MAP-21). In addition, roadways connecting the NHS roadways with military bases (known as theStrategic Highway Network) are also considered part of the NHS network. NHS passenger and freightterminals are connected by roadways called NHS connectors.
Surface Transportation Program (STP) funded roadway network is comprised of any functionally classifiedroadway. STP funded roadways include all urban arterials, urban collectors, and rural arterials. Accordingto the TEA-21 legislation, rural collectors are STP-eligible, but have a limitation on the STP fundingamount.
State and Local Aid includes chapter 90 and other non-Federal Aid categories. Roadways that fall underthis category are comprised of roads functionally classified as local roads.

ROAD INVENTORY YEAR END REPORT 2020
Massachusetts Department of TransportationOffice of Transportation Planning 4 / 109
II. CENTERLINE MILE REPORTS
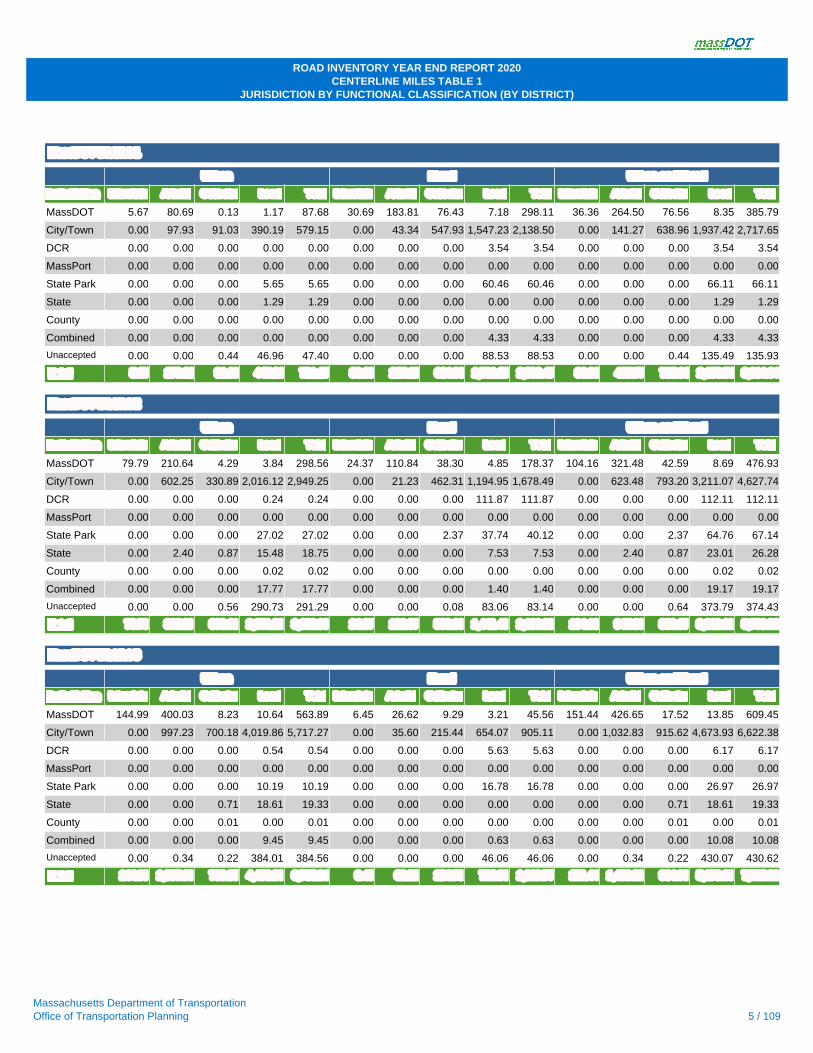
ROAD INVENTORY YEAR END REPORT 2020CENTERLINE MILES TABLE 1
JURISDICTION BY FUNCTIONAL CLASSIFICATION (BY DISTRICT)
Massachusetts Department of TransportationOffice of Transportation Planning 5 / 109
Urban Rural Urban and Rural
Jurisdiction Interstate Arterial Collector Local Total Interstate Arterial Collector Local Total Interstate Arterial Collector Local Total
MassDOT 5.67 80.69 0.13 1.17 87.68 30.69 183.81 76.43 7.18 298.11 36.36 264.50 76.56 8.35 385.79
City/Town 0.00 97.93 91.03 390.19 579.15 0.00 43.34 547.93 1,547.23 2,138.50 0.00 141.27 638.96 1,937.42 2,717.65
DCR 0.00 0.00 0.00 0.00 0.00 0.00 0.00 0.00 3.54 3.54 0.00 0.00 0.00 3.54 3.54
MassPort 0.00 0.00 0.00 0.00 0.00 0.00 0.00 0.00 0.00 0.00 0.00 0.00 0.00 0.00 0.00
State Park 0.00 0.00 0.00 5.65 5.65 0.00 0.00 0.00 60.46 60.46 0.00 0.00 0.00 66.11 66.11
State 0.00 0.00 0.00 1.29 1.29 0.00 0.00 0.00 0.00 0.00 0.00 0.00 0.00 1.29 1.29
County 0.00 0.00 0.00 0.00 0.00 0.00 0.00 0.00 0.00 0.00 0.00 0.00 0.00 0.00 0.00
Combined 0.00 0.00 0.00 0.00 0.00 0.00 0.00 0.00 4.33 4.33 0.00 0.00 0.00 4.33 4.33Unaccepted 0.00 0.00 0.44 46.96 47.40 0.00 0.00 0.00 88.53 88.53 0.00 0.00 0.44 135.49 135.93
Total 5.67 178.62 91.60 445.26 721.17 30.69 227.15 624.36 1,711.27 2,593.47 36.36 405.77 715.96 2,156.53 3,314.64
Urban Rural Urban and Rural
Jurisdiction Interstate Arterial Collector Local Total Interstate Arterial Collector Local Total Interstate Arterial Collector Local Total
MassDOT 79.79 210.64 4.29 3.84 298.56 24.37 110.84 38.30 4.85 178.37 104.16 321.48 42.59 8.69 476.93
City/Town 0.00 602.25 330.89 2,016.12 2,949.25 0.00 21.23 462.31 1,194.95 1,678.49 0.00 623.48 793.20 3,211.07 4,627.74
DCR 0.00 0.00 0.00 0.24 0.24 0.00 0.00 0.00 111.87 111.87 0.00 0.00 0.00 112.11 112.11
MassPort 0.00 0.00 0.00 0.00 0.00 0.00 0.00 0.00 0.00 0.00 0.00 0.00 0.00 0.00 0.00
State Park 0.00 0.00 0.00 27.02 27.02 0.00 0.00 2.37 37.74 40.12 0.00 0.00 2.37 64.76 67.14
State 0.00 2.40 0.87 15.48 18.75 0.00 0.00 0.00 7.53 7.53 0.00 2.40 0.87 23.01 26.28
County 0.00 0.00 0.00 0.02 0.02 0.00 0.00 0.00 0.00 0.00 0.00 0.00 0.00 0.02 0.02
Combined 0.00 0.00 0.00 17.77 17.77 0.00 0.00 0.00 1.40 1.40 0.00 0.00 0.00 19.17 19.17Unaccepted 0.00 0.00 0.56 290.73 291.29 0.00 0.00 0.08 83.06 83.14 0.00 0.00 0.64 373.79 374.43
Total 79.79 815.29 336.61 2,371.22 3,602.90 24.37 132.07 503.06 1,441.40 2,100.92 104.16 947.36 839.67 3,812.62 5,703.82
Urban Rural Urban and Rural
Jurisdiction Interstate Arterial Collector Local Total Interstate Arterial Collector Local Total Interstate Arterial Collector Local Total
MassDOT 144.99 400.03 8.23 10.64 563.89 6.45 26.62 9.29 3.21 45.56 151.44 426.65 17.52 13.85 609.45
City/Town 0.00 997.23 700.18 4,019.86 5,717.27 0.00 35.60 215.44 654.07 905.11 0.00 1,032.83 915.62 4,673.93 6,622.38
DCR 0.00 0.00 0.00 0.54 0.54 0.00 0.00 0.00 5.63 5.63 0.00 0.00 0.00 6.17 6.17
MassPort 0.00 0.00 0.00 0.00 0.00 0.00 0.00 0.00 0.00 0.00 0.00 0.00 0.00 0.00 0.00
State Park 0.00 0.00 0.00 10.19 10.19 0.00 0.00 0.00 16.78 16.78 0.00 0.00 0.00 26.97 26.97
State 0.00 0.00 0.71 18.61 19.33 0.00 0.00 0.00 0.00 0.00 0.00 0.00 0.71 18.61 19.33
County 0.00 0.00 0.01 0.00 0.01 0.00 0.00 0.00 0.00 0.00 0.00 0.00 0.01 0.00 0.01
Combined 0.00 0.00 0.00 9.45 9.45 0.00 0.00 0.00 0.63 0.63 0.00 0.00 0.00 10.08 10.08Unaccepted 0.00 0.34 0.22 384.01 384.56 0.00 0.00 0.00 46.06 46.06 0.00 0.34 0.22 430.07 430.62
Total 144.99 1,397.60 709.35 4,453.30 6,705.24 6.45 62.22 224.73 726.38 1,019.77 151.44 1,459.82 934.08 5,179.68 7,725.01
MassDOT District 1
MassDOT District 2
MassDOT District 3

ROAD INVENTORY YEAR END REPORT 2020CENTERLINE MILES TABLE 1
JURISDICTION BY FUNCTIONAL CLASSIFICATION (BY DISTRICT)
Massachusetts Department of TransportationOffice of Transportation Planning 6 / 109
Urban Rural Urban and Rural
Jurisdiction Interstate Arterial Collector Local Total Interstate Arterial Collector Local Total Interstate Arterial Collector Local Total
MassDOT 111.00 357.35 10.77 4.40 483.52 1.10 0.00 2.81 0.00 3.90 112.10 357.35 13.58 4.40 487.42
City/Town 0.00 918.09 631.19 3,967.33 5,516.61 0.00 0.00 9.24 42.34 51.58 0.00 918.09 640.43 4,009.67 5,568.19
DCR 0.00 39.30 1.20 6.02 46.51 0.00 0.00 0.00 0.00 0.00 0.00 39.30 1.20 6.02 46.51
MassPort 0.00 0.00 0.00 0.00 0.00 0.00 0.00 0.00 0.00 0.00 0.00 0.00 0.00 0.00 0.00
State Park 0.00 0.00 2.27 4.48 6.75 0.00 0.00 0.42 0.70 1.11 0.00 0.00 2.69 5.18 7.86
State 0.00 0.00 0.00 7.85 7.85 0.00 0.00 0.00 0.00 0.00 0.00 0.00 0.00 7.85 7.85
County 0.00 0.00 0.00 0.02 0.02 0.00 0.00 0.00 0.00 0.00 0.00 0.00 0.00 0.02 0.02
Combined 0.00 0.00 0.64 1.40 2.03 0.00 0.00 0.00 2.30 2.30 0.00 0.00 0.64 3.70 4.33Unaccepted 0.00 1.55 1.62 616.12 619.29 0.00 0.00 0.00 4.55 4.55 0.00 1.55 1.62 620.67 623.84
Total 111.00 1,316.29 647.69 4,607.62 6,682.58 1.10 0.00 12.47 49.89 63.44 112.10 1,316.29 660.16 4,657.51 6,746.02
Urban Rural Urban and Rural
Jurisdiction Interstate Arterial Collector Local Total Interstate Arterial Collector Local Total Interstate Arterial Collector Local Total
MassDOT 107.15 695.64 9.79 13.94 826.52 0.00 7.88 28.43 1.49 37.80 107.15 703.52 38.22 15.43 864.32
City/Town 0.00 1,235.82 927.50 5,242.06 7,405.38 0.00 0.00 81.88 245.24 327.12 0.00 1,235.82 1,009.38 5,487.30 7,732.50
DCR 0.00 0.60 0.00 0.04 0.64 0.00 0.00 0.00 0.00 0.00 0.00 0.60 0.00 0.04 0.64
MassPort 0.00 0.00 0.00 0.00 0.00 0.00 0.00 0.00 0.00 0.00 0.00 0.00 0.00 0.00 0.00
State Park 0.00 1.74 0.00 105.99 107.74 0.00 0.00 2.30 0.31 2.61 0.00 1.74 2.30 106.30 110.35
State 0.00 0.00 0.00 19.56 19.56 0.00 0.00 0.00 0.00 0.00 0.00 0.00 0.00 19.56 19.56
County 0.00 0.00 0.00 3.78 3.78 0.00 0.00 0.00 0.00 0.00 0.00 0.00 0.00 3.78 3.78
Combined 0.00 3.83 0.00 52.55 56.38 0.00 0.00 5.75 6.05 11.80 0.00 3.83 5.75 58.60 68.18Unaccepted 0.00 1.66 8.85 1,264.32 1,274.84 0.00 0.00 0.00 30.95 30.95 0.00 1.66 8.85 1,295.27 1,305.79
Total 107.15 1,939.29 946.14 6,702.24 9,694.84 0.00 7.88 118.36 284.04 410.28 107.15 1,947.17 1,064.50 6,986.28 10,105.12
Urban Rural Urban and Rural
Jurisdiction Interstate Arterial Collector Local Total Interstate Arterial Collector Local Total Interstate Arterial Collector Local Total
MassDOT 56.67 111.84 1.43 3.63 173.56 0.00 0.00 0.00 0.00 0.00 56.67 111.84 1.43 3.63 173.56
City/Town 0.00 489.45 332.97 1,889.68 2,712.11 0.00 0.00 0.00 0.00 0.00 0.00 489.45 332.97 1,889.68 2,712.11
DCR 0.00 72.69 3.74 10.16 86.58 0.00 0.00 0.00 0.00 0.00 0.00 72.69 3.74 10.16 86.58
MassPort 0.00 5.82 0.00 1.18 7.00 0.00 0.00 0.00 0.00 0.00 0.00 5.82 0.00 1.18 7.00
State Park 0.00 0.00 0.00 0.15 0.15 0.00 0.00 0.00 0.00 0.00 0.00 0.00 0.00 0.15 0.15
State 0.00 0.00 0.00 3.45 3.45 0.00 0.00 0.00 0.00 0.00 0.00 0.00 0.00 3.45 3.45
County 0.00 0.00 0.00 0.00 0.00 0.00 0.00 0.00 0.00 0.00 0.00 0.00 0.00 0.00 0.00
Combined 0.00 0.00 0.00 1.46 1.46 0.00 0.00 0.00 0.00 0.00 0.00 0.00 0.00 1.46 1.46Unaccepted 0.00 1.57 1.36 233.78 236.71 0.00 0.00 0.00 0.00 0.00 0.00 1.57 1.36 233.78 236.71
Total 56.67 681.37 339.50 2,143.49 3,221.02 0.00 0.00 0.00 0.00 0.00 56.67 681.37 339.50 2,143.49 3,221.02
MassDOT District 4
MassDOT District 5
MassDOT District 6

ROAD INVENTORY YEAR END REPORT 2020CENTERLINE MILES TABLE 1
JURISDICTION BY FUNCTIONAL CLASSIFICATION (BY DISTRICT)
Massachusetts Department of TransportationOffice of Transportation Planning 7 / 109
Urban Rural Urban and Rural
Jurisdiction Interstate Arterial Collector Local Total Interstate Arterial Collector Local Total Interstate Arterial Collector Local Total
MassDOT 505.28 1,856.18 34.64 37.63 2,433.73 62.61 329.15 155.26 16.73 563.75 567.89 2,185.33 189.90 54.36 2,997.48
City/Town 0.00 4,340.77 3,013.77 17,525.24 24,879.78 0.00 100.17 1,316.81 3,683.82 5,100.80 0.00 4,440.94 4,330.57 21,209.06 29,980.58
DCR 0.00 112.58 4.93 17.01 134.52 0.00 0.00 0.00 121.04 121.04 0.00 112.58 4.93 138.05 255.56
MassPort 0.00 5.82 0.00 1.18 7.00 0.00 0.00 0.00 0.00 0.00 0.00 5.82 0.00 1.18 7.00
State Park 0.00 1.74 2.27 153.49 157.51 0.00 0.00 5.09 115.99 121.08 0.00 1.74 7.36 269.48 278.59
State 0.00 2.40 1.58 66.25 70.23 0.00 0.00 0.00 7.53 7.53 0.00 2.40 1.58 73.78 77.76
County 0.00 0.00 0.01 3.83 3.83 0.00 0.00 0.00 0.00 0.00 0.00 0.00 0.01 3.83 3.83
Combined 0.00 3.83 0.64 82.63 87.10 0.00 0.00 5.75 14.71 20.46 0.00 3.83 6.39 97.34 107.56Unaccepted 0.00 5.13 13.05 2,835.92 2,854.09 0.00 0.00 0.08 253.15 253.23 0.00 5.13 13.13 3,089.06 3,107.32
Total 505.28 6,328.45 3,070.89 20,723.17 30,627.79 62.61 429.32 1,482.98 4,212.97 6,187.89 567.89 6,757.78 4,553.87 24,936.14 36,815.68
Total Massachusetts

ROAD INVENTORY YEAR END REPORT 2020CENTERLINE MILES TABLE 2
JURISDICTION BY FEDERAL AID CATEGORY (BY DISTRICT)
Massachusetts Department of TransportationOffice of Transportation Planning 8 / 109
MassDOT District 1
MassDOT District 2
MassDOT District 3
Jurisdiction National HighwaySystem
Surface TransportationProgram
Total Federal Aid State & Local Aid Grand Total
MassDOT 290.37 84.03 374.40 11.39 385.79
City/Town Accepted 65.65 447.18 512.83 2,204.82 2,717.66
DCR 0.00 0.00 0.00 3.54 3.54
MassPort 0.00 0.00 0.00 0.00 0.00
State Park 0.00 0.00 0.00 66.12 66.12
State Institutional 0.00 0.00 0.00 1.29 1.29
County Institutional 0.00 0.00 0.00 0.00 0.00
Combined Federal 0.00 0.00 0.00 4.33 4.33
Unaccepted 0.00 0.44 0.44 135.49 135.93
Total 356.03 531.65 887.68 2,426.97 3,314.65
Jurisdiction National HighwaySystem
Surface TransportationProgram
Total Federal Aid State & Local Aid Grand Total
MassDOT 368.48 99.62 468.10 8.83 476.93
City/Town Accepted 170.08 1,064.11 1,234.20 3,393.54 4,627.74
DCR 0.00 0.00 0.00 112.12 112.12
MassPort 0.00 0.00 0.00 0.00 0.00
State Park 0.00 0.16 0.16 66.99 67.14
State Institutional 0.58 2.68 3.27 23.01 26.28
County Institutional 0.00 0.00 0.00 0.02 0.02
Combined Federal 0.00 0.00 0.00 19.17 19.17
Unaccepted 0.00 0.56 0.56 373.88 374.44
Total 539.15 1,167.13 1,706.28 3,997.55 5,703.83
Jurisdiction National HighwaySystem
Surface TransportationProgram
Total Federal Aid State & Local Aid Grand Total
MassDOT 459.51 135.06 594.57 14.88 609.45
City/Town Accepted 288.33 1,549.92 1,838.25 4,784.13 6,622.38
DCR 0.00 0.00 0.00 6.17 6.17
MassPort 0.00 0.00 0.00 0.00 0.00
State Park 0.00 0.00 0.00 26.97 26.97
State Institutional 0.00 0.71 0.71 18.61 19.33
County Institutional 0.00 0.01 0.01 0.00 0.01
Combined Federal 0.00 0.00 0.00 10.08 10.08
Unaccepted 0.13 0.56 0.69 429.94 430.63
Total 747.97 1,686.25 2,434.22 5,290.79 7,725.01

ROAD INVENTORY YEAR END REPORT 2020CENTERLINE MILES TABLE 2
JURISDICTION BY FEDERAL AID CATEGORY (BY DISTRICT)
Massachusetts Department of TransportationOffice of Transportation Planning 9 / 109
MassDOT District 4
MassDOT District 5
MassDOT District 6
Jurisdiction National HighwaySystem
Surface TransportationProgram
Total Federal Aid State & Local Aid Grand Total
MassDOT 363.89 119.13 483.02 4.40 487.42
City/Town Accepted 208.99 1,348.56 1,557.55 4,010.64 5,568.19
DCR 15.11 25.38 40.49 6.02 46.51
MassPort 0.00 0.00 0.00 0.00 0.00
State Park 0.00 2.69 2.69 5.18 7.87
State Institutional 0.00 0.00 0.00 7.85 7.85
County Institutional 0.00 0.00 0.00 0.02 0.02
Combined Federal 0.00 0.64 0.64 3.70 4.34
Unaccepted 0.00 3.17 3.17 620.67 623.83
Total 587.99 1,499.56 2,087.55 4,658.48 6,746.03
Jurisdiction National HighwaySystem
Surface TransportationProgram
Total Federal Aid State & Local Aid Grand Total
MassDOT 517.54 331.37 848.91 15.41 864.33
City/Town Accepted 218.46 1,982.27 2,200.73 5,531.78 7,732.51
DCR 0.00 0.60 0.60 0.04 0.64
MassPort 0.00 0.00 0.00 0.00 0.00
State Park 0.00 4.04 4.04 106.30 110.34
State Institutional 0.00 0.00 0.00 19.56 19.56
County Institutional 0.00 0.00 0.00 3.78 3.78
Combined Federal 1.23 7.54 8.77 59.41 68.18
Unaccepted 0.79 10.51 11.31 1,294.48 1,305.78
Total 738.02 2,336.33 3,074.35 7,030.76 10,105.12
Jurisdiction National HighwaySystem
Surface TransportationProgram
Total Federal Aid State & Local Aid Grand Total
MassDOT 149.51 20.55 170.06 3.50 173.56
City/Town Accepted 179.82 643.68 823.50 1,888.60 2,712.11
DCR 40.39 36.29 76.68 9.90 86.58
MassPort 4.40 1.79 6.19 0.81 7.00
State Park 0.00 0.00 0.00 0.15 0.15
State Institutional 0.00 0.00 0.00 3.45 3.45
County Institutional 0.00 0.00 0.00 0.00 0.00
Combined Federal 0.00 0.00 0.00 1.46 1.46
Unaccepted 0.40 2.84 3.24 233.47 236.71
Total 374.52 705.16 1,079.68 2,141.36 3,221.04

ROAD INVENTORY YEAR END REPORT 2020CENTERLINE MILES TABLE 2
JURISDICTION BY FEDERAL AID CATEGORY (BY DISTRICT)
Massachusetts Department of TransportationOffice of Transportation Planning 10 / 109
Total Massachusetts
Jurisdiction National HighwaySystem
Surface TransportationProgram
Total Federal Aid State & Local Aid Grand Total
MassDOT 2,149.31 789.75 2,939.06 58.42 2,997.48
City/Town Accepted 1,131.34 7,035.72 8,167.06 21,813.52 29,980.58
DCR 55.50 62.27 117.77 137.79 255.56
MassPort 4.40 1.79 6.19 0.81 7.00
State Park 0.00 6.89 6.89 271.70 278.59
State Institutional 0.58 3.40 3.98 73.78 77.76
County Institutional 0.00 0.01 0.01 3.83 3.83
Combined Federal 1.23 8.18 9.40 98.15 107.56
Unaccepted 1.32 18.08 19.40 3,087.92 3,107.32
Total 3,343.68 7,926.09 11,269.77 25,545.91 36,815.68

ROAD INVENTORY YEAR END REPORT 2020CENTERLINE MILES TABLE 3
JURISDICTION BY FUNCTIONAL CLASSIFICATION (BY MPO)
Massachusetts Department of TransportationOffice of Transportation Planning 11 / 109
Urban Rural Urban and RuralJurisdiction Interstate Arterial Collector Local Total Interstate Arterial Collector Local Total Interstate Arterial Collector Local Total
MassDOT 3.39 72.12 0.05 1.16 76.71 20.64 119.88 34.41 6.37 181.30 24.03 191.99 34.45 7.54 258.01
City/Town 0.00 96.09 89.86 381.51 567.46 0.00 1.15 260.33 770.13 1,031.61 0.00 97.24 350.19 1,151.64 1,599.07
DCR 0.00 0.00 0.00 0.00 0.00 0.00 0.00 0.00 0.00 0.00 0.00 0.00 0.00 0.00 0.00
MassPort 0.00 0.00 0.00 0.00 0.00 0.00 0.00 0.00 0.00 0.00 0.00 0.00 0.00 0.00 0.00
State Park 0.00 0.00 0.00 5.65 5.65 0.00 0.00 0.00 37.86 37.86 0.00 0.00 0.00 43.51 43.51
State 0.00 0.00 0.00 1.29 1.29 0.00 0.00 0.00 0.00 0.00 0.00 0.00 0.00 1.29 1.29
County 0.00 0.00 0.00 0.00 0.00 0.00 0.00 0.00 0.00 0.00 0.00 0.00 0.00 0.00 0.00
Combined 0.00 0.00 0.00 0.00 0.00 0.00 0.00 0.00 0.00 0.00 0.00 0.00 0.00 0.00 0.00
Unaccepted 0.00 0.00 0.44 46.87 47.31 0.00 0.00 0.00 39.47 39.47 0.00 0.00 0.44 86.35 86.79
Total 3.39 168.21 90.34 436.49 698.42 20.64 121.02 294.74 853.84 1,290.24 24.03 289.23 385.08 1,290.33 1,988.67
Urban Rural Urban and Rural
Jurisdiction Interstate Arterial Collector Local Total Interstate Arterial Collector Local Total Interstate Arterial Collector Local Total
MassDOT 172.12 486.09 13.69 6.45 678.35 2.40 0.02 0.00 0.00 2.42 174.52 486.11 13.69 6.45 680.77
City/Town 0.00 1,560.22 1,170.53 6,442.81 9,173.56 0.00 8.10 15.24 39.97 63.31 0.00 1,568.32 1,185.77 6,482.78 9,236.88
DCR 0.00 112.39 4.93 16.76 134.09 0.00 0.00 0.00 0.00 0.00 0.00 112.39 4.93 16.76 134.09
MassPort 0.00 5.82 0.00 1.18 7.00 0.00 0.00 0.00 0.00 0.00 0.00 5.82 0.00 1.18 7.00
State Park 0.00 0.00 0.00 4.69 4.69 0.00 0.00 0.42 0.70 1.11 0.00 0.00 0.42 5.38 5.80
State 0.00 0.00 0.00 19.90 19.90 0.00 0.00 0.00 0.00 0.00 0.00 0.00 0.00 19.90 19.90
County 0.00 0.00 0.00 0.02 0.02 0.00 0.00 0.00 0.00 0.00 0.00 0.00 0.00 0.02 0.02
Combined 0.00 0.00 0.64 1.97 2.61 0.00 0.00 0.00 2.30 2.30 0.00 0.00 0.64 4.27 4.91
Unaccepted 0.00 2.02 2.83 896.66 901.50 0.00 0.00 0.00 2.40 2.40 0.00 2.02 2.83 899.06 903.90
Total 172.12 2,166.54 1,192.61 7,390.44 10,921.71 2.40 8.12 15.66 45.37 71.56 174.52 2,174.66 1,208.27 7,435.81 10,993.27
Urban Rural Urban and RuralJurisdiction Interstate Arterial Collector Local Total Interstate Arterial Collector Local Total Interstate Arterial Collector Local Total
MassDOT 0.00 186.29 0.91 3.54 190.74 0.00 6.38 0.13 0.41 6.92 0.00 192.68 1.04 3.94 197.66
City/Town 0.00 357.69 179.87 1,123.57 1,661.14 0.00 0.00 17.29 45.74 63.03 0.00 357.69 197.16 1,169.32 1,724.17
DCR 0.00 0.00 0.00 0.00 0.00 0.00 0.00 0.00 0.00 0.00 0.00 0.00 0.00 0.00 0.00
MassPort 0.00 0.00 0.00 0.00 0.00 0.00 0.00 0.00 0.00 0.00 0.00 0.00 0.00 0.00 0.00
State Park 0.00 0.00 0.00 11.42 11.42 0.00 0.00 2.30 0.00 2.30 0.00 0.00 2.30 11.42 13.71
State 0.00 0.00 0.00 0.10 0.10 0.00 0.00 0.00 0.00 0.00 0.00 0.00 0.00 0.10 0.10
County 0.00 0.00 0.00 1.60 1.60 0.00 0.00 0.00 0.00 0.00 0.00 0.00 0.00 1.60 1.60
Combined 0.00 3.83 0.00 50.48 54.31 0.00 0.00 5.75 5.58 11.33 0.00 3.83 5.75 56.06 65.64
Unaccepted 0.00 0.19 4.81 609.52 614.52 0.00 0.00 0.00 13.91 13.91 0.00 0.19 4.81 623.43 628.43
Total 0.00 548.01 185.58 1,800.22 2,533.81 0.00 6.38 25.47 65.64 97.50 0.00 554.39 211.05 1,865.87 2,631.31
Berkshire
Boston Region
Cape Cod

ROAD INVENTORY YEAR END REPORT 2020CENTERLINE MILES TABLE 3
JURISDICTION BY FUNCTIONAL CLASSIFICATION (BY MPO)
Massachusetts Department of TransportationOffice of Transportation Planning 12 / 109
Urban Rural Urban and RuralJurisdiction Interstate Arterial Collector Local Total Interstate Arterial Collector Local Total Interstate Arterial Collector Local Total
MassDOT 78.87 207.58 4.48 7.58 298.52 7.91 23.70 4.46 3.54 39.61 86.79 231.28 8.94 11.13 338.14
City/Town 0.00 387.76 289.37 1,750.28 2,427.41 0.00 21.90 206.87 597.39 826.16 0.00 409.66 496.24 2,347.67 3,253.57
DCR 0.00 0.00 0.00 0.00 0.00 0.00 0.00 0.00 15.31 15.31 0.00 0.00 0.00 15.31 15.31
MassPort 0.00 0.00 0.00 0.00 0.00 0.00 0.00 0.00 0.00 0.00 0.00 0.00 0.00 0.00 0.00
State Park 0.00 0.00 0.00 7.91 7.91 0.00 0.00 0.00 16.78 16.78 0.00 0.00 0.00 24.69 24.69
State 0.00 0.00 0.71 5.99 6.71 0.00 0.00 0.00 0.00 0.00 0.00 0.00 0.71 5.99 6.71
County 0.00 0.00 0.01 0.00 0.01 0.00 0.00 0.00 0.00 0.00 0.00 0.00 0.01 0.00 0.01
Combined 0.00 0.00 0.00 2.15 2.15 0.00 0.00 0.00 0.21 0.21 0.00 0.00 0.00 2.35 2.35
Unaccepted 0.00 0.34 0.06 181.96 182.37 0.00 0.00 0.00 35.04 35.04 0.00 0.34 0.06 217.00 217.41
Total 78.87 595.68 294.64 1,955.87 2,925.06 7.91 45.60 211.33 668.26 933.10 86.79 641.28 505.96 2,624.14 3,858.17
Urban Rural Urban and RuralJurisdiction Interstate Arterial Collector Local Total Interstate Arterial Collector Local Total Interstate Arterial Collector Local Total
MassDOT 10.31 40.66 0.35 1.02 52.35 13.51 70.51 44.63 2.59 131.24 23.82 111.17 44.99 3.61 183.59
City/Town 0.00 46.85 28.40 168.74 243.99 0.00 11.25 280.17 792.01 1,083.43 0.00 58.10 308.57 960.76 1,327.42
DCR 0.00 0.00 0.00 0.00 0.00 0.00 0.00 0.00 64.77 64.77 0.00 0.00 0.00 64.77 64.77
MassPort 0.00 0.00 0.00 0.00 0.00 0.00 0.00 0.00 0.00 0.00 0.00 0.00 0.00 0.00 0.00
State Park 0.00 0.00 0.00 0.68 0.68 0.00 0.00 2.37 41.78 44.15 0.00 0.00 2.37 42.46 44.83
State 0.00 0.00 0.00 0.60 0.60 0.00 0.00 0.00 0.00 0.00 0.00 0.00 0.00 0.60 0.60
County 0.00 0.00 0.00 0.00 0.00 0.00 0.00 0.00 0.00 0.00 0.00 0.00 0.00 0.00 0.00
Combined 0.00 0.00 0.00 0.00 0.00 0.00 0.00 0.00 0.00 0.00 0.00 0.00 0.00 0.00 0.00
Unaccepted 0.00 0.00 0.00 13.42 13.42 0.00 0.00 0.08 54.74 54.83 0.00 0.00 0.08 68.16 68.25
Total 10.31 87.52 28.75 184.46 311.04 13.51 81.75 327.26 955.89 1,378.42 23.82 169.27 356.01 1,140.35 1,689.45
Urban Rural Urban and RuralJurisdiction Interstate Arterial Collector Local Total Interstate Arterial Collector Local Total Interstate Arterial Collector Local Total
MassDOT 0.00 14.03 0.00 0.79 14.83 0.00 0.00 19.76 0.97 20.72 0.00 14.03 19.76 1.76 35.55
City/Town 0.00 13.39 6.37 68.77 88.52 0.00 0.00 13.10 39.75 52.85 0.00 13.39 19.46 108.52 141.37
DCR 0.00 0.00 0.00 0.00 0.00 0.00 0.00 0.00 0.00 0.00 0.00 0.00 0.00 0.00 0.00
MassPort 0.00 0.00 0.00 0.00 0.00 0.00 0.00 0.00 0.00 0.00 0.00 0.00 0.00 0.00 0.00
State Park 0.00 0.00 0.00 0.00 0.00 0.00 0.00 0.00 0.00 0.00 0.00 0.00 0.00 0.00 0.00
State 0.00 0.00 0.00 0.00 0.00 0.00 0.00 0.00 0.00 0.00 0.00 0.00 0.00 0.00 0.00
County 0.00 0.00 0.00 0.30 0.30 0.00 0.00 0.00 0.00 0.00 0.00 0.00 0.00 0.30 0.30
Combined 0.00 0.00 0.00 0.00 0.00 0.00 0.00 0.00 0.47 0.47 0.00 0.00 0.00 0.47 0.47
Unaccepted 0.00 0.00 0.00 6.90 6.90 0.00 0.00 0.00 3.48 3.48 0.00 0.00 0.00 10.39 10.39
Total 0.00 27.42 6.37 76.77 110.55 0.00 0.00 32.85 44.67 77.52 0.00 27.42 39.22 121.43 188.07
Central Massachusetts
Franklin
Martha's Vineyard

ROAD INVENTORY YEAR END REPORT 2020CENTERLINE MILES TABLE 3
JURISDICTION BY FUNCTIONAL CLASSIFICATION (BY MPO)
Massachusetts Department of TransportationOffice of Transportation Planning 13 / 109
Urban Rural Urban and RuralJurisdiction Interstate Arterial Collector Local Total Interstate Arterial Collector Local Total Interstate Arterial Collector Local Total
MassDOT 11.47 130.33 1.27 3.25 146.31 0.84 30.92 14.24 0.78 46.78 12.31 161.25 15.50 4.04 193.10
City/Town 0.00 241.16 153.17 863.98 1,258.30 0.00 17.91 138.45 376.60 532.96 0.00 259.07 291.62 1,240.57 1,791.27
DCR 0.00 0.00 0.00 0.00 0.00 0.00 0.00 0.00 1.16 1.16 0.00 0.00 0.00 1.16 1.16
MassPort 0.00 0.00 0.00 0.00 0.00 0.00 0.00 0.00 0.00 0.00 0.00 0.00 0.00 0.00 0.00
State Park 0.00 0.00 0.00 7.26 7.26 0.00 0.00 0.00 3.03 3.03 0.00 0.00 0.00 10.29 10.29
State 0.00 0.00 0.00 11.80 11.80 0.00 0.00 0.00 4.73 4.73 0.00 0.00 0.00 16.54 16.54
County 0.00 0.00 0.00 0.00 0.00 0.00 0.00 0.00 0.00 0.00 0.00 0.00 0.00 0.00 0.00
Combined 0.00 0.00 0.00 7.30 7.30 0.00 0.00 0.00 1.82 1.82 0.00 0.00 0.00 9.12 9.12
Unaccepted 0.00 0.00 0.00 75.84 75.84 0.00 0.00 0.00 26.93 26.93 0.00 0.00 0.00 102.78 102.78
Total 11.47 371.49 154.43 969.44 1,506.83 0.84 48.83 152.69 415.07 617.43 12.31 420.32 307.12 1,384.50 2,124.25
Urban Rural Urban and RuralJurisdiction Interstate Arterial Collector Local Total Interstate Arterial Collector Local Total Interstate Arterial Collector Local Total
MassDOT 52.96 97.79 1.48 2.04 154.26 1.10 0.00 2.81 0.00 3.90 54.05 97.79 4.28 2.04 158.17
City/Town 0.00 215.94 142.70 980.54 1,339.18 0.00 0.00 7.70 32.74 40.44 0.00 215.94 150.40 1,013.28 1,379.62
DCR 0.00 0.19 0.00 0.00 0.19 0.00 0.00 0.00 0.00 0.00 0.00 0.19 0.00 0.00 0.19
MassPort 0.00 0.00 0.00 0.00 0.00 0.00 0.00 0.00 0.00 0.00 0.00 0.00 0.00 0.00 0.00
State Park 0.00 0.00 2.27 2.73 5.00 0.00 0.00 0.00 0.00 0.00 0.00 0.00 2.27 2.73 5.00
State 0.00 0.00 0.00 0.00 0.00 0.00 0.00 0.00 0.00 0.00 0.00 0.00 0.00 0.00 0.00
County 0.00 0.00 0.00 0.00 0.00 0.00 0.00 0.00 0.00 0.00 0.00 0.00 0.00 0.00 0.00
Combined 0.00 0.00 0.00 0.89 0.89 0.00 0.00 0.00 0.00 0.00 0.00 0.00 0.00 0.89 0.89
Unaccepted 0.00 0.00 0.00 97.66 97.66 0.00 0.00 0.00 3.40 3.40 0.00 0.00 0.00 101.06 101.06
Total 52.96 313.92 146.45 1,083.86 1,597.19 1.10 0.00 10.51 36.14 47.74 54.05 313.92 156.96 1,120.00 1,644.93
Urban Rural Urban and RuralJurisdiction Interstate Arterial Collector Local Total Interstate Arterial Collector Local Total Interstate Arterial Collector Local Total
MassDOT 0.00 2.25 0.00 0.00 2.25 0.00 0.00 4.28 0.00 4.28 0.00 2.25 4.28 0.00 6.53
City/Town 0.00 5.90 11.18 53.99 71.07 0.00 0.00 15.59 36.74 52.32 0.00 5.90 26.77 90.72 123.40
DCR 0.00 0.00 0.00 0.00 0.00 0.00 0.00 0.00 0.00 0.00 0.00 0.00 0.00 0.00 0.00
MassPort 0.00 0.00 0.00 0.00 0.00 0.00 0.00 0.00 0.00 0.00 0.00 0.00 0.00 0.00 0.00
State Park 0.00 0.00 0.00 0.00 0.00 0.00 0.00 0.00 0.00 0.00 0.00 0.00 0.00 0.00 0.00
State 0.00 0.00 0.00 0.00 0.00 0.00 0.00 0.00 0.00 0.00 0.00 0.00 0.00 0.00 0.00
County 0.00 0.00 0.00 0.00 0.00 0.00 0.00 0.00 0.00 0.00 0.00 0.00 0.00 0.00 0.00
Combined 0.00 0.00 0.00 0.00 0.00 0.00 0.00 0.00 0.00 0.00 0.00 0.00 0.00 0.00 0.00
Unaccepted 0.00 0.00 0.00 4.72 4.72 0.00 0.00 0.00 6.04 6.04 0.00 0.00 0.00 10.76 10.76
Total 0.00 8.15 11.18 58.71 78.05 0.00 0.00 19.86 42.77 62.64 0.00 8.15 31.05 101.48 140.68
Montachusett
Merrimack Valley
Nantucket

ROAD INVENTORY YEAR END REPORT 2020CENTERLINE MILES TABLE 3
JURISDICTION BY FUNCTIONAL CLASSIFICATION (BY MPO)
Massachusetts Department of TransportationOffice of Transportation Planning 14 / 109
Urban Rural Urban and RuralJurisdiction Interstate Arterial Collector Local Total Interstate Arterial Collector Local Total Interstate Arterial Collector Local Total
MassDOT 14.70 78.03 0.82 1.25 94.81 0.00 0.00 0.00 0.00 0.00 14.70 78.03 0.82 1.25 94.81
City/Town 0.00 212.12 114.89 833.98 1,160.99 0.00 0.99 2.12 30.21 33.32 0.00 213.12 117.01 864.19 1,194.31
DCR 0.00 0.00 0.00 0.00 0.00 0.00 0.00 0.00 0.00 0.00 0.00 0.00 0.00 0.00 0.00
MassPort 0.00 0.00 0.00 0.00 0.00 0.00 0.00 0.00 0.00 0.00 0.00 0.00 0.00 0.00 0.00
State Park 0.00 0.00 0.00 0.32 0.32 0.00 0.00 0.00 0.00 0.00 0.00 0.00 0.00 0.32 0.32
State 0.00 0.00 0.00 0.00 0.00 0.00 0.00 0.00 0.00 0.00 0.00 0.00 0.00 0.00 0.00
County 0.00 0.00 0.00 0.00 0.00 0.00 0.00 0.00 0.00 0.00 0.00 0.00 0.00 0.00 0.00
Combined 0.00 0.00 0.00 0.00 0.00 0.00 0.00 0.00 0.00 0.00 0.00 0.00 0.00 0.00 0.00
Unaccepted 0.00 1.55 0.34 112.31 114.19 0.00 0.00 0.00 0.16 0.16 0.00 1.55 0.34 112.46 114.35
Total 14.70 291.70 116.05 947.86 1,370.31 0.00 0.99 2.12 30.37 33.48 14.70 292.69 118.17 978.23 1,403.79
Urban Rural Urban and RuralJurisdiction Interstate Arterial Collector Local Total Interstate Arterial Collector Local Total Interstate Arterial Collector Local Total
MassDOT 1.18 143.54 2.46 0.82 148.00 0.00 1.49 0.00 0.00 1.49 1.18 145.03 2.46 0.82 149.49
City/Town 0.00 261.40 255.21 1,028.95 1,545.56 0.00 0.00 11.63 16.28 27.91 0.00 261.40 266.84 1,045.23 1,573.47
DCR 0.00 0.00 0.00 0.00 0.00 0.00 0.00 0.00 0.00 0.00 0.00 0.00 0.00 0.00 0.00
MassPort 0.00 0.00 0.00 0.00 0.00 0.00 0.00 0.00 0.00 0.00 0.00 0.00 0.00 0.00 0.00
State Park 0.00 0.00 0.00 61.33 61.33 0.00 0.00 0.00 0.00 0.00 0.00 0.00 0.00 61.33 61.33
State 0.00 0.00 0.00 7.03 7.03 0.00 0.00 0.00 0.00 0.00 0.00 0.00 0.00 7.03 7.03
County 0.00 0.00 0.00 1.69 1.69 0.00 0.00 0.00 0.00 0.00 0.00 0.00 0.00 1.69 1.69
Combined 0.00 0.00 0.00 2.07 2.07 0.00 0.00 0.00 0.00 0.00 0.00 0.00 0.00 2.07 2.07
Unaccepted 0.00 0.06 3.27 295.97 299.31 0.00 0.00 0.00 0.70 0.70 0.00 0.06 3.27 296.67 300.00
Total 1.18 405.00 260.94 1,397.87 2,064.99 0.00 1.49 11.63 16.98 30.10 1.18 406.49 272.57 1,414.85 2,095.10
Urban Rural Urban and RuralJurisdiction Interstate Arterial Collector Local Total Interstate Arterial Collector Local Total Interstate Arterial Collector Local Total
MassDOT 71.77 138.44 3.84 1.20 215.25 16.20 76.25 26.29 1.95 120.68 87.97 214.69 30.13 3.14 335.94
City/Town 0.00 527.26 272.89 1,663.71 2,463.86 0.00 38.88 324.03 799.53 1,162.44 0.00 566.14 596.92 2,463.24 3,626.29
DCR 0.00 0.00 0.00 0.24 0.24 0.00 0.00 0.00 39.81 39.81 0.00 0.00 0.00 40.05 40.05
MassPort 0.00 0.00 0.00 0.00 0.00 0.00 0.00 0.00 0.00 0.00 0.00 0.00 0.00 0.00 0.00
State Park 0.00 0.00 0.00 20.17 20.17 0.00 0.00 0.00 15.54 15.54 0.00 0.00 0.00 35.71 35.71
State 0.00 2.40 0.87 14.88 18.15 0.00 0.00 0.00 2.79 2.79 0.00 2.40 0.87 17.68 20.94
County 0.00 0.00 0.00 0.02 0.02 0.00 0.00 0.00 0.00 0.00 0.00 0.00 0.00 0.02 0.02
Combined 0.00 0.00 0.00 17.77 17.77 0.00 0.00 0.00 4.33 4.33 0.00 0.00 0.00 22.11 22.11
Unaccepted 0.00 0.00 0.56 260.71 261.27 0.00 0.00 0.00 60.05 60.05 0.00 0.00 0.56 320.75 321.31
Total 71.77 668.11 278.16 1,978.70 2,996.74 16.20 115.13 350.32 923.99 1,405.64 87.97 783.23 628.48 2,902.69 4,402.37
Northern Middlesex
Old Colony
Pioneer Valley

ROAD INVENTORY YEAR END REPORT 2020CENTERLINE MILES TABLE 3
JURISDICTION BY FUNCTIONAL CLASSIFICATION (BY MPO)
Massachusetts Department of TransportationOffice of Transportation Planning 15 / 109
Urban Rural Urban and RuralJurisdiction Interstate Arterial Collector Local Total Interstate Arterial Collector Local Total Interstate Arterial Collector Local Total
MassDOT 88.52 259.02 5.30 8.51 361.35 0.00 0.00 4.27 0.12 4.39 88.52 259.02 9.57 8.63 365.74
City/Town 0.00 414.98 299.35 2,164.42 2,878.74 0.00 0.00 24.28 106.73 131.01 0.00 414.98 323.63 2,271.14 3,009.75
DCR 0.00 0.00 0.00 0.00 0.00 0.00 0.00 0.00 0.00 0.00 0.00 0.00 0.00 0.00 0.00
MassPort 0.00 0.00 0.00 0.00 0.00 0.00 0.00 0.00 0.00 0.00 0.00 0.00 0.00 0.00 0.00
State Park 0.00 1.74 0.00 31.33 33.07 0.00 0.00 0.00 0.31 0.31 0.00 1.74 0.00 31.64 33.38
State 0.00 0.00 0.00 4.65 4.65 0.00 0.00 0.00 0.00 0.00 0.00 0.00 0.00 4.65 4.65
County 0.00 0.00 0.00 0.20 0.20 0.00 0.00 0.00 0.00 0.00 0.00 0.00 0.00 0.20 0.20
Combined 0.00 0.00 0.00 0.00 0.00 0.00 0.00 0.00 0.00 0.00 0.00 0.00 0.00 0.00 0.00
Unaccepted 0.00 0.97 0.74 233.37 235.07 0.00 0.00 0.00 6.82 6.82 0.00 0.97 0.74 240.18 241.89
Total 88.52 676.71 305.38 2,442.48 3,513.09 0.00 0.00 28.55 113.97 142.52 88.52 676.71 333.93 2,556.44 3,655.60
Urban Rural Urban and RuralJurisdiction Interstate Arterial Collector Local Total Interstate Arterial Collector Local Total Interstate Arterial Collector Local Total
MassDOT 505.28 1,856.18 34.64 37.63 2,433.73 62.61 329.15 155.26 16.73 563.75 567.89 2,185.33 189.90 54.36 2,997.48
City/Town 0.00 4,340.77 3,013.77 17,525.24 24,879.78 0.00 100.17 1,316.81 3,683.82 5,100.80 0.00 4,440.94 4,330.57 21,209.06 29,980.58
DCR 0.00 112.58 4.93 17.01 134.52 0.00 0.00 0.00 121.04 121.04 0.00 112.58 4.93 138.05 255.56
MassPort 0.00 5.82 0.00 1.18 7.00 0.00 0.00 0.00 0.00 0.00 0.00 5.82 0.00 1.18 7.00
State Park 0.00 1.74 2.27 153.49 157.51 0.00 0.00 5.09 115.99 121.08 0.00 1.74 7.36 269.48 278.59
State 0.00 2.40 1.58 66.25 70.23 0.00 0.00 0.00 7.53 7.53 0.00 2.40 1.58 73.78 77.76
County 0.00 0.00 0.01 3.83 3.83 0.00 0.00 0.00 0.00 0.00 0.00 0.00 0.01 3.83 3.83
Combined 0.00 3.83 0.64 82.63 87.10 0.00 0.00 5.75 14.71 20.46 0.00 3.83 6.39 97.34 107.56
Unaccepted 0.00 5.13 13.05 2,835.92 2,854.09 0.00 0.00 0.08 253.15 253.23 0.00 5.13 13.13 3,089.06 3,107.32
Total 505.28 6,328.45 3,070.89 20,723.17 30,627.79 62.61 429.32 1,482.98 4,212.97 6,187.89 567.89 6,757.78 4,553.87 24,936.14 36,815.68
Southeastern Massachusetts
Total Massachusetts

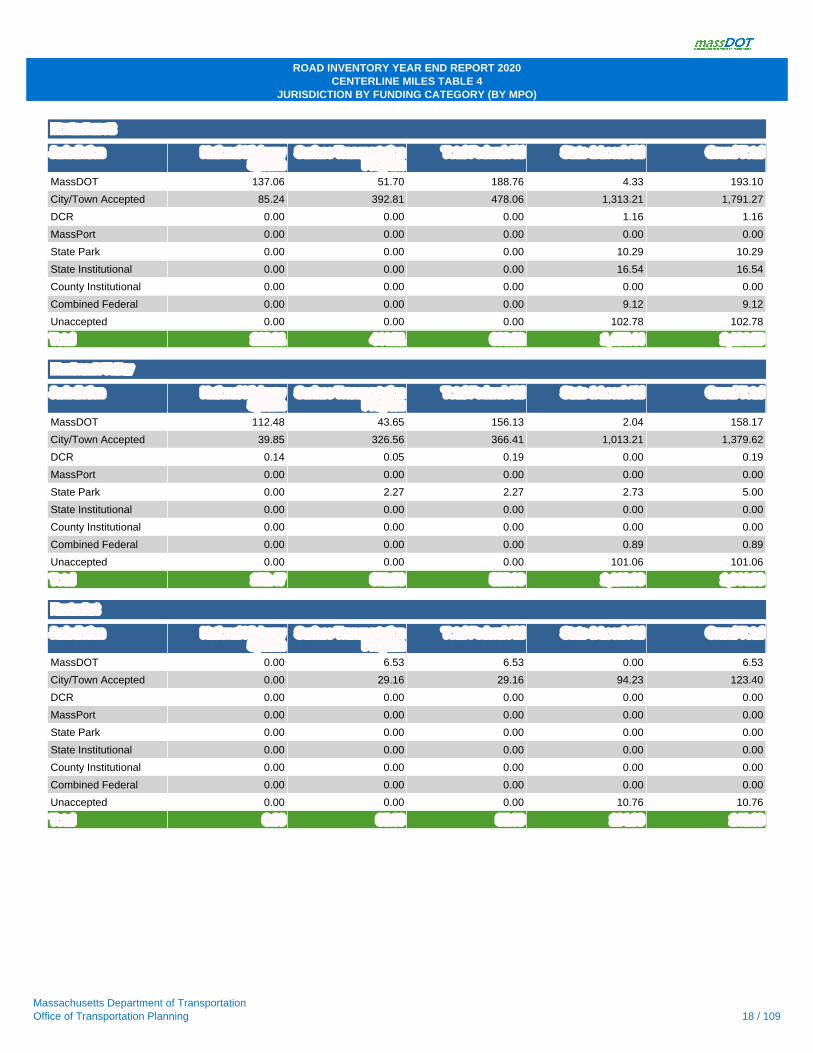
ROAD INVENTORY YEAR END REPORT 2020CENTERLINE MILES TABLE 4
JURISDICTION BY FUNDING CATEGORY (BY MPO)
Massachusetts Department of TransportationOffice of Transportation Planning 16 / 109
Berkshire
Boston Region
Cape Cod
Jurisdiction National HighwaySystem
Surface TransportationProgram
Total Federal Aid State & Local Aid Grand Total
MassDOT 206.63 40.85 247.47 10.54 258.01
City/Town Accepted 23.47 277.26 300.73 1,298.34 1,599.07
DCR 0.00 0.00 0.00 0.00 0.00
MassPort 0.00 0.00 0.00 0.00 0.00
State Park 0.00 0.00 0.00 43.51 43.51
State Institutional 0.00 0.00 0.00 1.29 1.29
County Institutional 0.00 0.00 0.00 0.00 0.00
Combined Federal 0.00 0.00 0.00 0.00 0.00
Unaccepted 0.00 0.44 0.44 86.35 86.79
Total 230.09 318.55 548.64 1,440.03 1,988.67
Jurisdiction National HighwaySystem
Surface TransportationProgram
Total Federal Aid State & Local Aid Grand Total
MassDOT 545.27 129.17 674.44 6.33 680.77
City/Town Accepted 464.60 2,278.91 2,743.51 6,493.36 9,236.88
DCR 55.36 62.22 117.58 16.50 134.09
MassPort 4.40 1.79 6.19 0.81 7.00
State Park 0.00 0.42 0.42 5.38 5.80
State Institutional 0.00 0.00 0.00 19.90 19.90
County Institutional 0.00 0.00 0.00 0.02 0.02
Combined Federal 0.00 0.64 0.64 4.27 4.91
Unaccepted 0.40 4.75 5.15 898.75 903.90
Total 1,070.04 2,477.90 3,547.93 7,445.34 10,993.27
Jurisdiction National HighwaySystem
Surface TransportationProgram
Total Federal Aid State & Local Aid Grand Total
MassDOT 98.48 50.32 148.80 0.70 149.49
City/Town Accepted 59.19 463.16 522.35 1,051.13 1,573.47
DCR 0.00 0.00 0.00 0.00 0.00
MassPort 0.00 0.00 0.00 0.00 0.00
State Park 0.00 0.00 0.00 61.33 61.33
State Institutional 0.00 0.00 0.00 7.03 7.03
County Institutional 0.00 0.00 0.00 1.69 1.69
Combined Federal 0.00 0.00 0.00 2.07 2.07
Unaccepted 0.70 3.33 4.03 295.97 300.00
Total 158.37 516.81 675.17 1,419.92 2,095.10

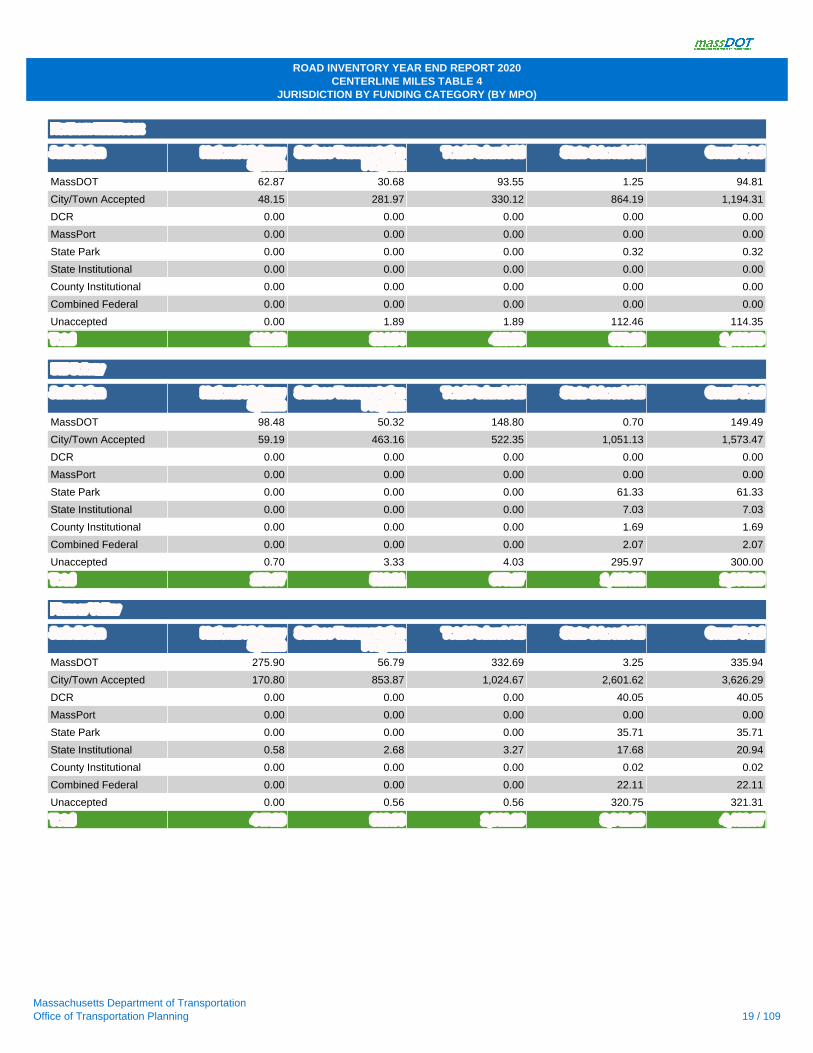
ROAD INVENTORY YEAR END REPORT 2020CENTERLINE MILES TABLE 4
JURISDICTION BY FUNDING CATEGORY (BY MPO)
Massachusetts Department of TransportationOffice of Transportation Planning 17 / 109
Central Massachusetts
Franklin
Martha's Vineyard
Jurisdiction National HighwaySystem
Surface TransportationProgram
Total Federal Aid State & Local Aid Grand Total
MassDOT 241.41 84.80 326.21 11.93 338.14
City/Town Accepted 83.67 740.88 824.55 2,429.02 3,253.57
DCR 0.00 0.00 0.00 15.31 15.31
MassPort 0.00 0.00 0.00 0.00 0.00
State Park 0.00 0.00 0.00 24.69 24.69
State Institutional 0.00 0.71 0.71 5.99 6.71
County Institutional 0.00 0.01 0.01 0.00 0.01
Combined Federal 0.00 0.00 0.00 2.35 2.35
Unaccepted 0.13 0.40 0.53 216.88 217.41
Total 325.20 826.81 1,152.01 2,706.16 3,858.17
Jurisdiction National HighwaySystem
Surface TransportationProgram
Total Federal Aid State & Local Aid Grand Total
MassDOT 121.98 57.99 179.98 3.61 183.59
City/Town Accepted 19.18 237.28 256.46 1,070.96 1,327.42
DCR 0.00 0.00 0.00 64.77 64.77
MassPort 0.00 0.00 0.00 0.00 0.00
State Park 0.00 0.16 0.16 44.67 44.83
State Institutional 0.00 0.00 0.00 0.60 0.60
County Institutional 0.00 0.00 0.00 0.00 0.00
Combined Federal 0.00 0.00 0.00 0.00 0.00
Unaccepted 0.00 0.00 0.00 68.25 68.25
Total 141.16 295.43 436.59 1,252.86 1,689.45
Jurisdiction National HighwaySystem
Surface TransportationProgram
Total Federal Aid State & Local Aid Grand Total
MassDOT 3.48 30.30 33.79 1.76 35.55
City/Town Accepted 6.90 13.19 20.09 121.28 141.37
DCR 0.00 0.00 0.00 0.00 0.00
MassPort 0.00 0.00 0.00 0.00 0.00
State Park 0.00 0.00 0.00 0.00 0.00
State Institutional 0.00 0.00 0.00 0.00 0.00
County Institutional 0.00 0.00 0.00 0.30 0.30
Combined Federal 0.00 0.00 0.00 0.47 0.47
Unaccepted 0.00 0.00 0.00 10.39 10.39
Total 10.39 43.49 53.88 134.20 188.07
ROAD INVENTORY YEAR END REPORT 2020CENTERLINE MILES TABLE 4
JURISDICTION BY FUNDING CATEGORY (BY MPO)
Massachusetts Department of TransportationOffice of Transportation Planning 18 / 109
Montachusett
Merrimack Valley
Nantucket
Jurisdiction National HighwaySystem
Surface TransportationProgram
Total Federal Aid State & Local Aid Grand Total
MassDOT 137.06 51.70 188.76 4.33 193.10
City/Town Accepted 85.24 392.81 478.06 1,313.21 1,791.27
DCR 0.00 0.00 0.00 1.16 1.16
MassPort 0.00 0.00 0.00 0.00 0.00
State Park 0.00 0.00 0.00 10.29 10.29
State Institutional 0.00 0.00 0.00 16.54 16.54
County Institutional 0.00 0.00 0.00 0.00 0.00
Combined Federal 0.00 0.00 0.00 9.12 9.12
Unaccepted 0.00 0.00 0.00 102.78 102.78
Total 222.31 444.51 666.82 1,457.44 2,124.25
Jurisdiction National HighwaySystem
Surface TransportationProgram
Total Federal Aid State & Local Aid Grand Total
MassDOT 112.48 43.65 156.13 2.04 158.17
City/Town Accepted 39.85 326.56 366.41 1,013.21 1,379.62
DCR 0.14 0.05 0.19 0.00 0.19
MassPort 0.00 0.00 0.00 0.00 0.00
State Park 0.00 2.27 2.27 2.73 5.00
State Institutional 0.00 0.00 0.00 0.00 0.00
County Institutional 0.00 0.00 0.00 0.00 0.00
Combined Federal 0.00 0.00 0.00 0.89 0.89
Unaccepted 0.00 0.00 0.00 101.06 101.06
Total 152.47 372.53 525.00 1,119.93 1,644.93
Jurisdiction National HighwaySystem
Surface TransportationProgram
Total Federal Aid State & Local Aid Grand Total
MassDOT 0.00 6.53 6.53 0.00 6.53
City/Town Accepted 0.00 29.16 29.16 94.23 123.40
DCR 0.00 0.00 0.00 0.00 0.00
MassPort 0.00 0.00 0.00 0.00 0.00
State Park 0.00 0.00 0.00 0.00 0.00
State Institutional 0.00 0.00 0.00 0.00 0.00
County Institutional 0.00 0.00 0.00 0.00 0.00
Combined Federal 0.00 0.00 0.00 0.00 0.00
Unaccepted 0.00 0.00 0.00 10.76 10.76
Total 0.00 35.69 35.69 104.99 140.68
ROAD INVENTORY YEAR END REPORT 2020CENTERLINE MILES TABLE 4
JURISDICTION BY FUNDING CATEGORY (BY MPO)
Massachusetts Department of TransportationOffice of Transportation Planning 19 / 109
Northern Middlesex
Old Colony
Pioneer Valley
Jurisdiction National HighwaySystem
Surface TransportationProgram
Total Federal Aid State & Local Aid Grand Total
MassDOT 62.87 30.68 93.55 1.25 94.81
City/Town Accepted 48.15 281.97 330.12 864.19 1,194.31
DCR 0.00 0.00 0.00 0.00 0.00
MassPort 0.00 0.00 0.00 0.00 0.00
State Park 0.00 0.00 0.00 0.32 0.32
State Institutional 0.00 0.00 0.00 0.00 0.00
County Institutional 0.00 0.00 0.00 0.00 0.00
Combined Federal 0.00 0.00 0.00 0.00 0.00
Unaccepted 0.00 1.89 1.89 112.46 114.35
Total 111.02 314.54 425.56 978.23 1,403.79
Jurisdiction National HighwaySystem
Surface TransportationProgram
Total Federal Aid State & Local Aid Grand Total
MassDOT 98.48 50.32 148.80 0.70 149.49
City/Town Accepted 59.19 463.16 522.35 1,051.13 1,573.47
DCR 0.00 0.00 0.00 0.00 0.00
MassPort 0.00 0.00 0.00 0.00 0.00
State Park 0.00 0.00 0.00 61.33 61.33
State Institutional 0.00 0.00 0.00 7.03 7.03
County Institutional 0.00 0.00 0.00 1.69 1.69
Combined Federal 0.00 0.00 0.00 2.07 2.07
Unaccepted 0.70 3.33 4.03 295.97 300.00
Total 158.37 516.81 675.17 1,419.92 2,095.10
Jurisdiction National HighwaySystem
Surface TransportationProgram
Total Federal Aid State & Local Aid Grand Total
MassDOT 275.90 56.79 332.69 3.25 335.94
City/Town Accepted 170.80 853.87 1,024.67 2,601.62 3,626.29
DCR 0.00 0.00 0.00 40.05 40.05
MassPort 0.00 0.00 0.00 0.00 0.00
State Park 0.00 0.00 0.00 35.71 35.71
State Institutional 0.58 2.68 3.27 17.68 20.94
County Institutional 0.00 0.00 0.00 0.02 0.02
Combined Federal 0.00 0.00 0.00 22.11 22.11
Unaccepted 0.00 0.56 0.56 320.75 321.31
Total 447.29 913.90 1,361.19 3,041.19 4,402.37

ROAD INVENTORY YEAR END REPORT 2020CENTERLINE MILES TABLE 4
JURISDICTION BY FUNDING CATEGORY (BY MPO)
Massachusetts Department of TransportationOffice of Transportation Planning 20 / 109
Southeastern Massachusetts
Total Massachusetts
Jurisdiction National HighwaySystem
Surface TransportationProgram
Total Federal Aid State & Local Aid Grand Total
MassDOT 193.13 163.97 357.10 8.63 365.74
City/Town Accepted 70.37 653.83 724.20 2,285.55 3,009.75
DCR 0.00 0.00 0.00 0.00 0.00
MassPort 0.00 0.00 0.00 0.00 0.00
State Park 0.00 1.74 1.74 31.64 33.38
State Institutional 0.00 0.00 0.00 4.65 4.65
County Institutional 0.00 0.00 0.00 0.20 0.20
Combined Federal 0.00 0.00 0.00 0.00 0.00
Unaccepted 0.00 1.70 1.70 240.18 241.89
Total 263.50 821.25 1,084.75 2,570.85 3,655.60
Jurisdiction National HighwaySystem
Surface TransportationProgram
Total Federal Aid State & Local Aid Grand Total
MassDOT 2,149.31 789.75 2,939.06 58.42 2,997.48
City/Town Accepted 1,131.34 7,035.72 8,167.06 21,813.52 29,980.58
DCR 55.50 62.27 117.77 137.79 255.56
MassPort 4.40 1.79 6.19 0.81 7.00
State Park 0.00 6.89 6.89 271.70 278.59
State Institutional 0.58 3.40 3.98 73.78 77.76
County Institutional 0.00 0.01 0.01 3.83 3.83
Combined Federal 1.23 8.18 9.40 98.15 107.56
Unaccepted 1.32 18.08 19.40 3,087.92 3,107.32
Total 3,343.68 7,926.09 11,269.77 25,545.91 36,815.68
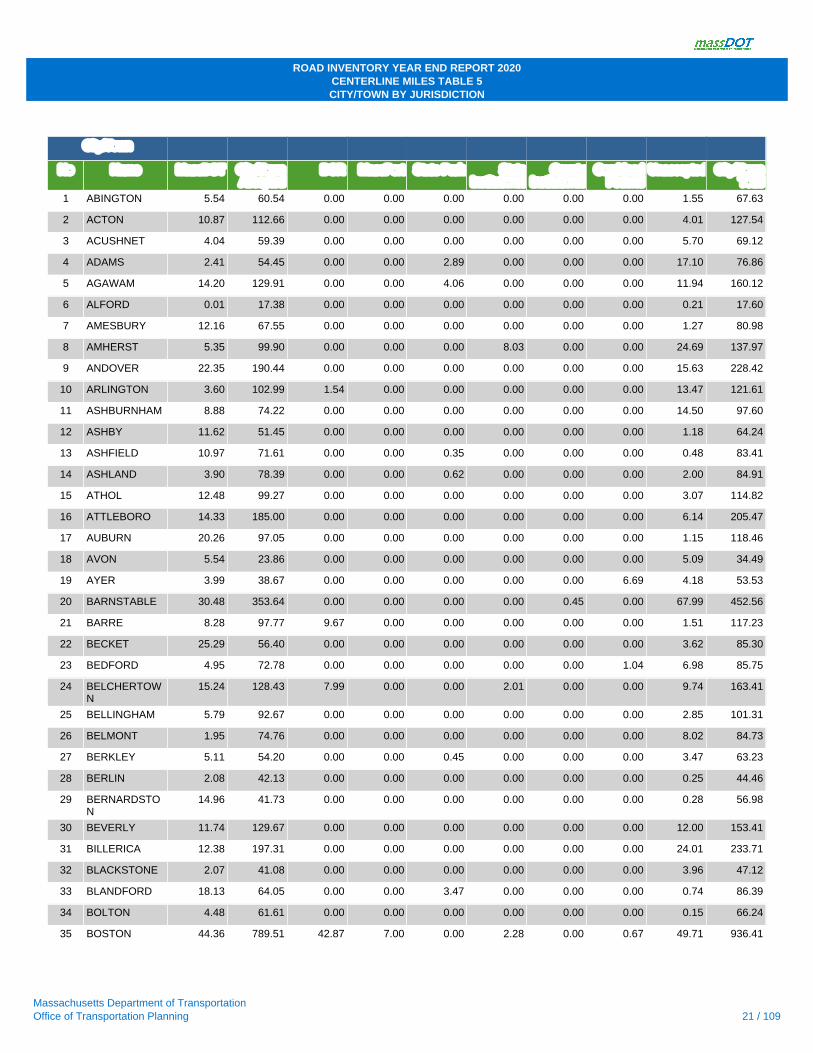
ROAD INVENTORY YEAR END REPORT 2020CENTERLINE MILES TABLE 5CITY/TOWN BY JURISDICTION
Massachusetts Department of TransportationOffice of Transportation Planning 21 / 109
City/Town
No Name MassDOT City/TownAccepted
DCR MassPort State Park StateInstitutional
CountyInstitutional
CombinedFederal
Unaccepted City/TownTotal
1 ABINGTON 5.54 60.54 0.00 0.00 0.00 0.00 0.00 0.00 1.55 67.63
2 ACTON 10.87 112.66 0.00 0.00 0.00 0.00 0.00 0.00 4.01 127.54
3 ACUSHNET 4.04 59.39 0.00 0.00 0.00 0.00 0.00 0.00 5.70 69.12
4 ADAMS 2.41 54.45 0.00 0.00 2.89 0.00 0.00 0.00 17.10 76.86
5 AGAWAM 14.20 129.91 0.00 0.00 4.06 0.00 0.00 0.00 11.94 160.12
6 ALFORD 0.01 17.38 0.00 0.00 0.00 0.00 0.00 0.00 0.21 17.60
7 AMESBURY 12.16 67.55 0.00 0.00 0.00 0.00 0.00 0.00 1.27 80.98
8 AMHERST 5.35 99.90 0.00 0.00 0.00 8.03 0.00 0.00 24.69 137.97
9 ANDOVER 22.35 190.44 0.00 0.00 0.00 0.00 0.00 0.00 15.63 228.42
10 ARLINGTON 3.60 102.99 1.54 0.00 0.00 0.00 0.00 0.00 13.47 121.61
11 ASHBURNHAM 8.88 74.22 0.00 0.00 0.00 0.00 0.00 0.00 14.50 97.60
12 ASHBY 11.62 51.45 0.00 0.00 0.00 0.00 0.00 0.00 1.18 64.24
13 ASHFIELD 10.97 71.61 0.00 0.00 0.35 0.00 0.00 0.00 0.48 83.41
14 ASHLAND 3.90 78.39 0.00 0.00 0.62 0.00 0.00 0.00 2.00 84.91
15 ATHOL 12.48 99.27 0.00 0.00 0.00 0.00 0.00 0.00 3.07 114.82
16 ATTLEBORO 14.33 185.00 0.00 0.00 0.00 0.00 0.00 0.00 6.14 205.47
17 AUBURN 20.26 97.05 0.00 0.00 0.00 0.00 0.00 0.00 1.15 118.46
18 AVON 5.54 23.86 0.00 0.00 0.00 0.00 0.00 0.00 5.09 34.49
19 AYER 3.99 38.67 0.00 0.00 0.00 0.00 0.00 6.69 4.18 53.53
20 BARNSTABLE 30.48 353.64 0.00 0.00 0.00 0.00 0.45 0.00 67.99 452.56
21 BARRE 8.28 97.77 9.67 0.00 0.00 0.00 0.00 0.00 1.51 117.23
22 BECKET 25.29 56.40 0.00 0.00 0.00 0.00 0.00 0.00 3.62 85.30
23 BEDFORD 4.95 72.78 0.00 0.00 0.00 0.00 0.00 1.04 6.98 85.75
24 BELCHERTOWN
15.24 128.43 7.99 0.00 0.00 2.01 0.00 0.00 9.74 163.41
25 BELLINGHAM 5.79 92.67 0.00 0.00 0.00 0.00 0.00 0.00 2.85 101.31
26 BELMONT 1.95 74.76 0.00 0.00 0.00 0.00 0.00 0.00 8.02 84.73
27 BERKLEY 5.11 54.20 0.00 0.00 0.45 0.00 0.00 0.00 3.47 63.23
28 BERLIN 2.08 42.13 0.00 0.00 0.00 0.00 0.00 0.00 0.25 44.46
29 BERNARDSTON
14.96 41.73 0.00 0.00 0.00 0.00 0.00 0.00 0.28 56.98
30 BEVERLY 11.74 129.67 0.00 0.00 0.00 0.00 0.00 0.00 12.00 153.41
31 BILLERICA 12.38 197.31 0.00 0.00 0.00 0.00 0.00 0.00 24.01 233.71
32 BLACKSTONE 2.07 41.08 0.00 0.00 0.00 0.00 0.00 0.00 3.96 47.12
33 BLANDFORD 18.13 64.05 0.00 0.00 3.47 0.00 0.00 0.00 0.74 86.39
34 BOLTON 4.48 61.61 0.00 0.00 0.00 0.00 0.00 0.00 0.15 66.24
35 BOSTON 44.36 789.51 42.87 7.00 0.00 2.28 0.00 0.67 49.71 936.41

ROAD INVENTORY YEAR END REPORT 2020CENTERLINE MILES TABLE 5CITY/TOWN BY JURISDICTION
Massachusetts Department of TransportationOffice of Transportation Planning 22 / 109
City/Town
No Name MassDOT City/TownAccepted
DCR MassPort State Park StateInstitutional
CountyInstitutional
CombinedFederal
Unaccepted City/TownTotal
36 BOURNE 30.20 99.43 0.00 0.00 0.00 0.00 1.14 22.92 36.24 189.94
37 BOXBOROUGH 7.01 33.86 0.00 0.00 0.00 0.00 0.00 0.00 0.47 41.34
38 BOXFORD 5.87 89.48 0.19 0.00 0.00 0.00 0.00 0.00 4.83 100.38
39 BOYLSTON 7.81 40.01 0.00 0.00 0.00 1.09 0.01 0.00 2.81 51.72
40 BRAINTREE 14.04 104.40 0.12 0.00 0.00 0.00 0.00 0.00 24.19 142.75
41 BREWSTER 10.84 56.42 0.00 0.00 10.83 0.00 0.00 0.00 84.26 162.34
42 BRIDGEWATER
10.17 114.12 0.00 0.00 0.00 6.17 0.00 0.00 5.10 135.57
43 BRIMFIELD 14.66 64.02 0.00 0.00 0.00 0.00 0.00 0.00 0.29 78.97
44 BROCKTON 10.67 245.65 0.00 0.00 0.00 0.00 0.00 2.07 32.82 291.21
45 BROOKFIELD 2.67 36.17 0.00 0.00 0.00 0.00 0.00 0.00 1.00 39.84
46 BROOKLINE 3.02 93.17 2.53 0.00 0.00 0.00 0.00 0.00 8.44 107.15
47 BUCKLAND 6.18 42.49 0.00 0.00 0.00 0.00 0.00 0.00 1.39 50.07
48 BURLINGTON 9.26 102.48 0.00 0.00 0.00 0.00 0.00 0.00 5.88 117.62
49 CAMBRIDGE 2.84 120.80 9.27 0.00 0.00 0.00 0.00 0.00 9.33 142.24
50 CANTON 11.93 95.75 1.58 0.00 0.00 0.00 0.00 0.00 6.91 116.16
51 CARLISLE 0.11 54.77 0.00 0.00 0.00 0.00 0.00 0.00 0.48 55.36
52 CARVER 4.14 79.92 0.00 0.00 15.40 0.00 0.00 0.00 5.21 104.68
53 CHARLEMONT 12.09 42.40 0.00 0.00 1.66 0.00 0.00 0.00 0.90 57.05
54 CHARLTON 18.39 126.87 0.00 0.00 0.00 0.00 0.00 0.00 11.68 156.94
55 CHATHAM 7.36 66.55 0.00 0.00 0.00 0.00 0.00 0.00 48.92 122.83
56 CHELMSFORD 22.47 172.61 0.00 0.00 0.00 0.00 0.00 0.00 9.02 204.09
57 CHELSEA 4.03 44.83 0.46 0.00 0.00 0.00 0.00 0.00 0.40 49.72
58 CHESHIRE 6.81 44.03 0.00 0.00 2.19 0.00 0.00 0.00 5.11 58.14
59 CHESTER 6.46 57.70 0.00 0.00 1.10 0.00 0.00 0.00 1.93 67.19
60 CHESTERFIELD
0.07 53.11 0.00 0.00 0.26 0.00 0.00 0.00 4.86 58.30
61 CHICOPEE 17.57 191.64 0.00 0.00 1.58 0.00 0.00 15.95 35.89 262.63
62 CHILMARK 7.77 14.11 0.00 0.00 0.00 0.00 0.00 0.00 0.00 21.88
63 CLARKSBURG 2.83 15.85 0.00 0.00 0.00 0.00 0.00 0.00 1.54 20.22
64 CLINTON 1.45 47.82 0.00 0.00 0.00 0.00 0.00 0.00 3.97 53.24
65 COHASSET 3.12 33.50 0.00 0.00 0.00 0.00 0.00 0.00 13.28 49.90
66 COLRAIN 4.10 78.06 0.00 0.00 1.18 0.00 0.00 0.00 4.47 87.81
67 CONCORD 6.61 106.17 0.00 0.00 0.00 0.76 0.00 0.00 16.42 129.95
68 CONWAY 6.44 63.88 0.00 0.00 0.00 0.00 0.00 0.00 0.59 70.91
69 CUMMINGTON 9.58 48.48 0.00 0.00 0.00 0.00 0.00 0.74 2.32 61.12
70 DALTON 5.21 40.32 0.00 0.00 0.00 0.00 0.00 0.00 2.22 47.75
71 DANVERS 13.83 106.97 0.00 0.00 0.00 1.91 0.00 0.00 4.73 127.45

ROAD INVENTORY YEAR END REPORT 2020CENTERLINE MILES TABLE 5CITY/TOWN BY JURISDICTION
Massachusetts Department of TransportationOffice of Transportation Planning 23 / 109
City/Town
No Name MassDOT City/TownAccepted
DCR MassPort State Park StateInstitutional
CountyInstitutional
CombinedFederal
Unaccepted City/TownTotal
72 DARTMOUTH 10.38 198.20 0.00 0.00 0.31 3.35 0.00 0.00 13.23 225.46
73 DEDHAM 11.30 84.70 0.49 0.00 0.00 0.74 0.00 0.00 12.63 109.86
74 DEERFIELD 19.76 77.33 0.00 0.00 1.17 0.00 0.00 0.00 2.46 100.72
75 DENNIS 10.19 146.25 0.00 0.00 0.00 0.00 0.00 0.00 53.66 210.09
76 DIGHTON 6.38 60.35 0.00 0.00 0.00 0.00 0.00 0.00 1.40 68.13
77 DOUGLAS 2.34 76.28 0.00 0.00 2.12 0.00 0.00 0.00 3.04 83.79
78 DOVER 0.02 59.19 0.01 0.00 0.00 0.00 0.00 0.00 2.90 62.11
79 DRACUT 7.31 137.55 0.00 0.00 0.00 0.00 0.00 0.00 15.33 160.19
80 DUDLEY 7.09 82.25 0.00 0.00 0.00 0.00 0.00 0.00 1.65 90.99
81 DUNSTABLE 0.00 41.50 0.00 0.00 0.00 0.00 0.00 0.00 1.04 42.54
82 DUXBURY 15.76 103.58 0.00 0.00 0.00 0.00 0.00 0.00 9.44 128.78
83 EASTBRIDGEWATER
3.83 64.78 0.00 0.00 0.00 0.00 0.00 0.00 11.23 79.84
84 EASTBROOKFIELD
6.60 19.17 0.00 0.00 0.00 0.00 0.00 0.00 1.79 27.56
85 EASTLONGMEADOW
0.00 98.36 0.00 0.00 0.00 0.00 0.00 0.00 2.54 100.90
86 EASTHAM 6.28 50.69 0.00 0.00 0.00 0.00 0.00 4.47 42.38 103.81
87 EASTHAMPTON
2.92 83.59 0.00 0.00 2.30 0.00 0.00 0.00 3.73 92.54
88 EASTON 8.28 116.94 0.00 0.00 0.00 0.00 0.00 0.00 7.67 132.89
89 EDGARTOWN 7.15 45.30 0.00 0.00 0.00 0.00 0.12 0.00 1.23 53.80
90 EGREMONT 6.19 35.91 0.00 0.00 0.00 0.00 0.00 0.00 1.33 43.44
91 ERVING 13.63 17.57 0.00 0.00 6.13 0.00 0.00 0.00 1.04 38.37
92 ESSEX 3.83 23.24 0.00 0.00 0.00 0.00 0.00 0.00 2.49 29.56
93 EVERETT 1.84 58.08 0.98 0.00 0.00 0.00 0.00 0.00 4.43 65.34
94 FAIRHAVEN 10.02 82.06 0.00 0.00 0.00 0.00 0.00 0.00 16.68 108.76
95 FALL RIVER 18.40 226.67 0.00 0.00 0.00 0.00 0.00 0.00 27.79 272.87
96 FALMOUTH 24.85 229.91 0.00 0.00 0.00 0.00 0.00 0.00 94.12 348.89
97 FITCHBURG 8.69 180.61 0.00 0.00 0.00 0.00 0.00 0.00 13.29 202.60
98 FLORIDA 7.16 39.83 0.00 0.00 0.00 0.00 0.00 0.00 0.51 47.50
99 FOXBOROUGH 16.15 90.95 0.00 0.00 0.00 0.00 0.00 0.00 5.34 112.43
100 FRAMINGHAM 16.12 217.40 0.00 0.00 0.00 0.57 0.00 0.00 7.51 241.59
101 FRANKLIN 9.81 136.70 0.00 0.00 0.00 0.00 0.00 0.00 24.76 171.27
102 FREETOWN 15.43 76.88 0.00 0.00 12.36 0.00 0.00 0.00 3.56 108.22
103 GARDNER 12.93 94.85 0.00 0.00 0.00 3.59 0.00 0.00 5.77 117.14
104 AQUINNAH 4.12 8.27 0.00 0.00 0.00 0.00 0.00 0.47 0.64 13.49
105 GEORGETOWN
4.16 55.88 0.00 0.00 0.00 0.00 0.00 0.89 3.67 64.60
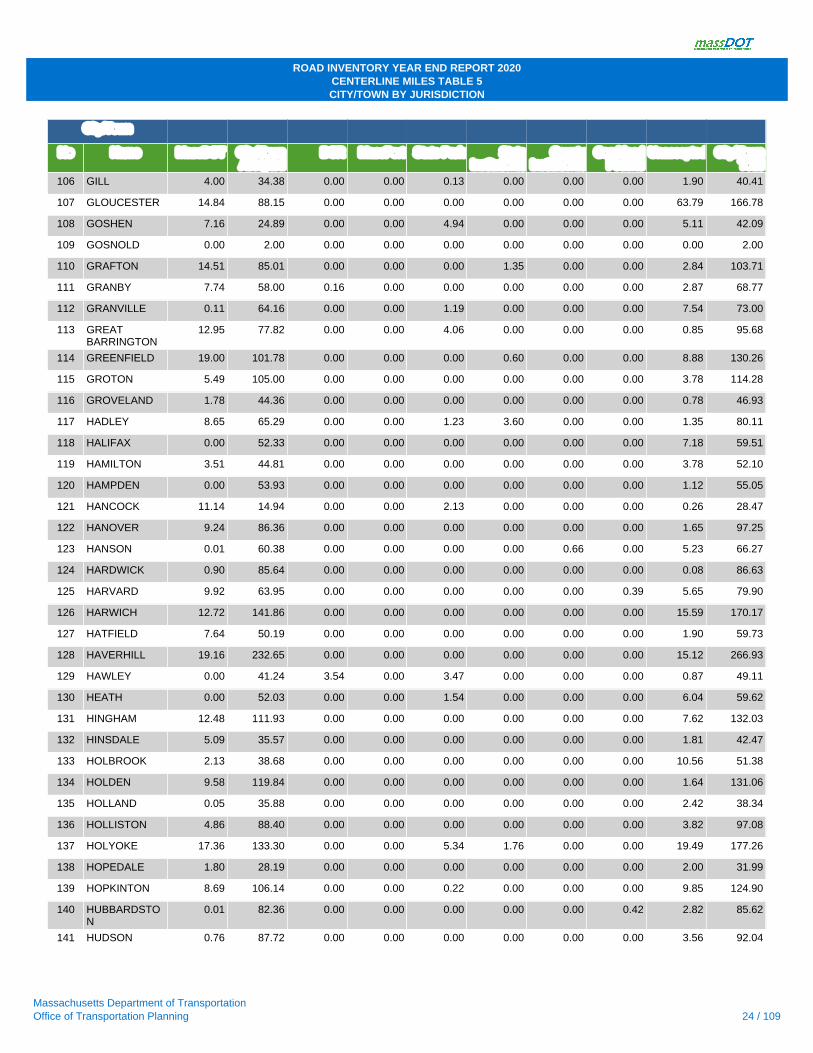
ROAD INVENTORY YEAR END REPORT 2020CENTERLINE MILES TABLE 5CITY/TOWN BY JURISDICTION
Massachusetts Department of TransportationOffice of Transportation Planning 24 / 109
City/Town
No Name MassDOT City/TownAccepted
DCR MassPort State Park StateInstitutional
CountyInstitutional
CombinedFederal
Unaccepted City/TownTotal
106 GILL 4.00 34.38 0.00 0.00 0.13 0.00 0.00 0.00 1.90 40.41
107 GLOUCESTER 14.84 88.15 0.00 0.00 0.00 0.00 0.00 0.00 63.79 166.78
108 GOSHEN 7.16 24.89 0.00 0.00 4.94 0.00 0.00 0.00 5.11 42.09
109 GOSNOLD 0.00 2.00 0.00 0.00 0.00 0.00 0.00 0.00 0.00 2.00
110 GRAFTON 14.51 85.01 0.00 0.00 0.00 1.35 0.00 0.00 2.84 103.71
111 GRANBY 7.74 58.00 0.16 0.00 0.00 0.00 0.00 0.00 2.87 68.77
112 GRANVILLE 0.11 64.16 0.00 0.00 1.19 0.00 0.00 0.00 7.54 73.00
113 GREATBARRINGTON
12.95 77.82 0.00 0.00 4.06 0.00 0.00 0.00 0.85 95.68
114 GREENFIELD 19.00 101.78 0.00 0.00 0.00 0.60 0.00 0.00 8.88 130.26
115 GROTON 5.49 105.00 0.00 0.00 0.00 0.00 0.00 0.00 3.78 114.28
116 GROVELAND 1.78 44.36 0.00 0.00 0.00 0.00 0.00 0.00 0.78 46.93
117 HADLEY 8.65 65.29 0.00 0.00 1.23 3.60 0.00 0.00 1.35 80.11
118 HALIFAX 0.00 52.33 0.00 0.00 0.00 0.00 0.00 0.00 7.18 59.51
119 HAMILTON 3.51 44.81 0.00 0.00 0.00 0.00 0.00 0.00 3.78 52.10
120 HAMPDEN 0.00 53.93 0.00 0.00 0.00 0.00 0.00 0.00 1.12 55.05
121 HANCOCK 11.14 14.94 0.00 0.00 2.13 0.00 0.00 0.00 0.26 28.47
122 HANOVER 9.24 86.36 0.00 0.00 0.00 0.00 0.00 0.00 1.65 97.25
123 HANSON 0.01 60.38 0.00 0.00 0.00 0.00 0.66 0.00 5.23 66.27
124 HARDWICK 0.90 85.64 0.00 0.00 0.00 0.00 0.00 0.00 0.08 86.63
125 HARVARD 9.92 63.95 0.00 0.00 0.00 0.00 0.00 0.39 5.65 79.90
126 HARWICH 12.72 141.86 0.00 0.00 0.00 0.00 0.00 0.00 15.59 170.17
127 HATFIELD 7.64 50.19 0.00 0.00 0.00 0.00 0.00 0.00 1.90 59.73
128 HAVERHILL 19.16 232.65 0.00 0.00 0.00 0.00 0.00 0.00 15.12 266.93
129 HAWLEY 0.00 41.24 3.54 0.00 3.47 0.00 0.00 0.00 0.87 49.11
130 HEATH 0.00 52.03 0.00 0.00 1.54 0.00 0.00 0.00 6.04 59.62
131 HINGHAM 12.48 111.93 0.00 0.00 0.00 0.00 0.00 0.00 7.62 132.03
132 HINSDALE 5.09 35.57 0.00 0.00 0.00 0.00 0.00 0.00 1.81 42.47
133 HOLBROOK 2.13 38.68 0.00 0.00 0.00 0.00 0.00 0.00 10.56 51.38
134 HOLDEN 9.58 119.84 0.00 0.00 0.00 0.00 0.00 0.00 1.64 131.06
135 HOLLAND 0.05 35.88 0.00 0.00 0.00 0.00 0.00 0.00 2.42 38.34
136 HOLLISTON 4.86 88.40 0.00 0.00 0.00 0.00 0.00 0.00 3.82 97.08
137 HOLYOKE 17.36 133.30 0.00 0.00 5.34 1.76 0.00 0.00 19.49 177.26
138 HOPEDALE 1.80 28.19 0.00 0.00 0.00 0.00 0.00 0.00 2.00 31.99
139 HOPKINTON 8.69 106.14 0.00 0.00 0.22 0.00 0.00 0.00 9.85 124.90
140 HUBBARDSTON
0.01 82.36 0.00 0.00 0.00 0.00 0.00 0.42 2.82 85.62
141 HUDSON 0.76 87.72 0.00 0.00 0.00 0.00 0.00 0.00 3.56 92.04

ROAD INVENTORY YEAR END REPORT 2020CENTERLINE MILES TABLE 5CITY/TOWN BY JURISDICTION
Massachusetts Department of TransportationOffice of Transportation Planning 25 / 109
City/Town
No Name MassDOT City/TownAccepted
DCR MassPort State Park StateInstitutional
CountyInstitutional
CombinedFederal
Unaccepted City/TownTotal
142 HULL 1.19 50.87 0.64 0.00 0.00 0.00 0.00 0.00 0.90 53.60
143 HUNTINGTON 11.81 36.60 0.00 0.00 0.00 0.00 0.00 3.59 2.66 54.66
144 IPSWICH 8.34 72.78 0.00 0.00 2.54 0.00 0.00 2.30 11.61 97.57
145 KINGSTON 12.40 69.47 0.00 0.00 0.00 0.00 0.00 0.00 25.16 107.03
146 LAKEVILLE 21.16 78.08 0.00 0.00 0.00 0.34 0.00 0.00 20.83 120.41
147 LANCASTER 6.93 63.43 0.00 0.00 0.00 3.01 0.00 0.22 1.46 75.05
148 LANESBOROUGH
10.47 47.46 0.00 0.00 2.53 0.00 0.00 0.00 3.96 64.42
149 LAWRENCE 5.72 123.72 0.00 0.00 0.00 0.00 0.00 0.00 10.36 139.79
150 LEE 17.56 53.13 0.00 0.00 0.78 0.00 0.00 0.00 1.26 72.73
151 LEICESTER 5.43 84.08 0.00 0.00 0.00 0.00 0.00 0.00 5.63 95.14
152 LENOX 11.19 51.50 0.00 0.00 0.00 0.00 0.00 0.00 0.86 63.54
153 LEOMINSTER 12.15 159.90 0.00 0.00 1.08 0.00 0.00 0.00 9.91 183.05
154 LEVERETT 5.46 34.65 0.00 0.00 0.00 0.00 0.00 0.00 1.91 42.03
155 LEXINGTON 18.42 131.35 0.00 0.00 0.00 0.00 0.02 0.00 13.18 162.98
156 LEYDEN 0.00 35.09 0.00 0.00 0.00 0.00 0.00 0.00 2.69 37.78
157 LINCOLN 7.23 52.29 0.00 0.00 0.00 0.00 0.00 0.00 1.67 61.20
158 LITTLETON 18.10 63.24 0.00 0.00 0.00 0.00 0.00 0.00 5.45 86.79
159 LONGMEADOW
3.30 84.79 0.00 0.00 0.00 0.00 0.00 0.00 12.76 100.85
160 LOWELL 14.09 188.56 0.00 0.00 0.00 0.00 0.00 0.00 41.31 243.97
161 LUDLOW 6.03 123.48 0.09 0.00 0.39 0.86 0.00 0.00 6.66 137.51
162 LUNENBURG 5.94 81.76 0.00 0.00 0.00 0.00 0.00 0.00 4.56 92.26
163 LYNN 3.11 160.08 3.37 0.00 0.00 0.00 0.00 0.00 9.29 175.85
164 LYNNFIELD 5.74 68.31 0.00 0.00 0.00 0.00 0.00 0.00 2.35 76.40
165 MALDEN 1.32 94.36 2.80 0.00 0.00 0.00 0.00 0.00 11.22 109.70
166 MANCHESTERBY THE SEA
8.26 24.20 0.00 0.00 0.00 0.00 0.00 0.00 7.29 39.74
167 MANSFIELD 11.22 115.13 0.00 0.00 0.00 0.00 0.00 0.00 1.25 127.59
168 MARBLEHEAD 0.00 69.13 0.00 0.00 0.00 0.00 0.00 0.00 11.24 80.37
169 MARION 9.86 28.58 0.00 0.00 0.00 0.00 0.00 0.00 2.69 41.13
170 MARLBOROUGH
14.79 134.36 0.00 0.00 0.00 0.00 0.00 0.00 16.92 166.07
171 MARSHFIELD 10.60 132.01 0.00 0.00 0.00 0.00 0.00 0.00 24.74 167.35
172 MASHPEE 3.78 115.13 0.00 0.00 0.00 0.10 0.00 2.77 12.89 134.67
173 MATTAPOISETT
8.73 42.97 0.00 0.00 0.00 0.00 0.00 0.00 7.19 58.90
174 MAYNARD 0.04 40.99 0.00 0.00 0.00 0.00 0.00 0.00 3.68 44.71
175 MEDFIELD 0.03 76.68 0.00 0.00 0.36 0.25 0.00 0.00 3.09 80.40
176 MEDFORD 6.86 91.60 11.08 0.00 0.00 0.00 0.00 0.00 26.86 136.41

ROAD INVENTORY YEAR END REPORT 2020CENTERLINE MILES TABLE 5CITY/TOWN BY JURISDICTION
Massachusetts Department of TransportationOffice of Transportation Planning 26 / 109
City/Town
No Name MassDOT City/TownAccepted
DCR MassPort State Park StateInstitutional
CountyInstitutional
CombinedFederal
Unaccepted City/TownTotal
177 MEDWAY 0.35 69.46 0.00 0.00 0.00 0.00 0.00 0.00 4.18 73.99
178 MELROSE 0.18 71.71 3.05 0.00 0.00 0.00 0.00 0.00 7.03 81.96
179 MENDON 4.44 56.02 0.00 0.00 0.00 0.00 0.00 0.00 1.27 61.73
180 MERRIMAC 5.47 37.35 0.00 0.00 0.00 0.00 0.00 0.00 5.35 48.17
181 METHUEN 21.05 174.72 0.00 0.00 0.00 0.00 0.00 0.00 17.87 213.64
182 MIDDLEBOROUGH
38.23 159.55 0.00 0.00 0.00 0.00 0.00 0.00 12.61 210.39
183 MIDDLEFIELD 0.00 38.30 0.00 0.00 0.00 0.00 0.00 0.00 0.00 38.30
184 MIDDLETON 4.89 48.86 0.00 0.00 0.00 1.93 0.00 0.00 4.14 59.82
185 MILFORD 10.14 108.92 0.00 0.00 0.00 0.00 0.00 0.00 4.35 123.40
186 MILLBURY 10.02 71.35 0.00 0.00 0.00 0.00 0.00 0.00 3.89 85.26
187 MILLIS 0.04 50.84 0.00 0.00 0.00 0.00 0.00 0.00 1.17 52.05
188 MILLVILLE 1.96 22.07 0.00 0.00 0.00 0.00 0.00 0.00 0.81 24.84
189 MILTON 8.80 97.96 9.65 0.00 0.00 0.00 0.00 0.00 6.06 122.48
190 MONROE 0.00 16.41 0.00 0.00 1.65 0.00 0.00 0.00 0.02 18.08
191 MONSON 7.13 100.31 0.02 0.00 0.00 0.65 0.00 0.00 1.96 110.07
192 MONTAGUE 5.65 103.10 0.00 0.00 0.58 0.00 0.00 0.00 3.73 113.06
193 MONTEREY 0.00 48.18 0.00 0.00 4.36 0.00 0.00 0.00 5.49 58.03
194 MONTGOMERY
0.10 30.40 0.00 0.00 0.00 0.00 0.00 0.00 0.66 31.16
195 MOUNTWASHINGTON
0.00 17.43 0.00 0.00 0.00 0.00 0.00 0.00 0.00 17.43
196 NAHANT 0.00 16.56 1.58 0.00 0.00 0.00 0.00 0.00 0.76 18.89
197 NANTUCKET 6.53 123.40 0.00 0.00 0.00 0.00 0.00 0.00 10.76 140.68
198 NATICK 9.56 124.00 0.00 0.00 0.00 0.00 0.00 0.00 24.11 157.68
199 NEEDHAM 6.78 120.01 0.00 0.00 0.00 0.00 0.00 0.47 13.32 140.58
200 NEWASHFORD
3.40 10.52 0.00 0.00 3.62 0.00 0.00 0.00 0.33 17.86
201 NEWBEDFORD
15.47 265.14 0.00 0.00 0.00 0.00 0.00 0.00 6.90 287.51
202 NEWBRAINTREE
0.17 49.90 0.00 0.00 0.00 0.00 0.00 0.00 0.81 50.87
203 NEWMARLBOROUGH
0.42 83.54 0.00 0.00 0.45 0.00 0.00 0.00 1.29 85.70
204 NEW SALEM 11.94 35.33 54.02 0.00 0.18 0.00 0.00 0.00 2.31 103.78
205 NEWBURY 11.50 52.82 0.00 0.00 1.05 0.00 0.00 0.00 2.16 67.53
206 NEWBURYPORT
6.74 68.32 0.00 0.00 0.00 0.00 0.00 0.00 1.71 76.77
207 NEWTON 11.39 278.53 3.36 0.00 0.00 0.00 0.00 0.00 18.19 311.47
208 NORFOLK 1.41 75.80 0.00 0.00 0.00 4.57 0.00 0.00 3.19 84.97
209 NORTHADAMS
8.49 70.43 0.00 0.00 2.59 0.00 0.00 0.00 5.16 86.66

ROAD INVENTORY YEAR END REPORT 2020CENTERLINE MILES TABLE 5CITY/TOWN BY JURISDICTION
Massachusetts Department of TransportationOffice of Transportation Planning 27 / 109
City/Town
No Name MassDOT City/TownAccepted
DCR MassPort State Park StateInstitutional
CountyInstitutional
CombinedFederal
Unaccepted City/TownTotal
210 NORTHANDOVER
12.32 117.63 0.00 0.00 2.59 0.00 0.00 0.00 18.67 151.21
211 NORTHATTLEBOROUGH
12.46 120.74 0.00 0.00 0.00 0.00 0.11 0.00 11.71 145.02
212 NORTHBROOKFIELD
0.00 68.93 0.00 0.00 0.00 0.00 0.00 0.00 2.16 71.09
213 NORTHREADING
3.62 79.72 0.00 0.00 0.00 0.00 0.00 0.00 11.07 94.42
214 NORTHAMPTON
13.42 154.31 0.00 0.00 0.00 2.03 0.00 1.82 10.17 181.76
215 NORTHBOROUGH
11.80 80.49 0.00 0.00 0.00 0.15 0.00 0.00 1.92 94.36
216 NORTHBRIDGE
5.18 78.14 0.00 0.00 0.00 0.00 0.00 0.71 3.95 87.97
217 NORTHFIELD 11.18 65.41 0.00 0.00 0.06 0.00 0.00 0.00 6.64 83.29
218 NORTON 13.40 92.35 0.00 0.00 0.00 0.00 0.00 0.00 6.09 111.85
219 NORWELL 7.74 75.09 0.00 0.00 0.00 0.00 0.00 0.00 9.03 91.87
220 NORWOOD 8.28 100.43 0.00 0.00 0.00 0.00 0.00 0.00 3.51 112.21
221 OAK BLUFFS 4.73 36.22 0.00 0.00 0.00 0.00 0.00 0.00 4.07 45.01
222 OAKHAM 2.90 42.73 4.07 0.00 0.00 0.00 0.00 0.00 0.06 49.76
223 ORANGE 12.31 87.03 0.00 0.00 0.57 0.00 0.00 0.00 3.41 103.32
224 ORLEANS 10.08 50.28 0.00 0.00 0.30 0.00 0.00 0.00 33.55 94.21
225 OTIS 19.67 41.91 0.00 0.00 1.32 0.00 0.00 0.00 0.91 63.81
226 OXFORD 16.18 91.37 0.00 0.00 0.00 0.00 0.00 0.21 4.03 111.79
227 PALMER 23.21 86.93 0.00 0.00 0.00 0.00 0.00 0.00 7.75 117.90
228 PAXTON 5.40 38.76 0.00 0.00 0.48 0.00 0.00 0.00 2.02 46.66
229 PEABODY 12.16 161.79 0.00 0.00 0.00 0.00 0.00 0.00 4.88 178.83
230 PELHAM 5.73 22.76 14.56 0.00 0.79 0.00 0.00 0.00 1.94 45.77
231 PEMBROKE 7.50 95.22 0.00 0.00 0.00 0.00 0.00 0.00 14.57 117.28
232 PEPPERELL 3.80 83.27 0.00 0.00 0.00 0.00 0.00 0.00 0.33 87.40
233 PERU 0.00 35.28 0.00 0.00 0.00 0.00 0.00 0.00 3.39 38.66
234 PETERSHAM 12.84 61.69 1.16 0.00 2.72 0.00 0.00 0.00 0.83 79.24
235 PHILLIPSTON 6.20 44.82 0.00 0.00 0.00 0.00 0.00 0.00 2.13 53.15
236 PITTSFIELD 11.47 195.95 0.00 0.00 3.08 1.29 0.00 0.00 15.86 227.65
237 PLAINFIELD 0.00 47.27 0.00 0.00 0.00 0.00 0.00 0.00 0.83 48.10
238 PLAINVILLE 4.38 46.74 0.00 0.00 0.00 0.00 0.00 0.00 3.13 54.25
239 PLYMOUTH 39.25 233.62 0.00 0.00 61.33 0.86 1.03 0.00 163.56 499.65
240 PLYMPTON 0.58 34.97 0.00 0.00 0.00 0.00 0.00 0.00 0.00 35.55
241 PRINCETON 0.02 79.19 0.00 0.00 2.23 0.00 0.00 0.00 1.44 82.87
242 PROVINCETOWN
2.13 19.44 0.00 0.00 0.00 0.00 0.00 5.34 4.99 31.90

ROAD INVENTORY YEAR END REPORT 2020CENTERLINE MILES TABLE 5CITY/TOWN BY JURISDICTION
Massachusetts Department of TransportationOffice of Transportation Planning 28 / 109
City/Town
No Name MassDOT City/TownAccepted
DCR MassPort State Park StateInstitutional
CountyInstitutional
CombinedFederal
Unaccepted City/TownTotal
243 QUINCY 6.43 187.10 9.68 0.00 0.00 0.00 0.00 0.00 23.31 226.52
244 RANDOLPH 9.34 99.51 0.00 0.00 0.00 0.00 0.00 0.18 9.29 118.33
245 RAYNHAM 16.14 76.61 0.00 0.00 0.00 0.00 0.00 0.00 2.52 95.27
246 READING 6.42 93.92 0.00 0.00 0.00 0.00 0.00 0.00 3.11 103.45
247 REHOBOTH 7.93 132.12 0.00 0.00 0.00 0.00 0.00 0.00 3.09 143.14
248 REVERE 14.33 84.03 7.49 0.00 0.00 0.00 0.00 0.00 1.83 107.68
249 RICHMOND 7.85 39.06 0.00 0.00 0.00 0.00 0.00 0.00 0.74 47.65
250 ROCHESTER 6.44 67.75 0.00 0.00 0.00 0.00 0.00 0.00 1.37 75.56
251 ROCKLAND 3.40 49.21 0.00 0.00 0.00 0.00 0.00 0.00 3.80 56.40
252 ROCKPORT 1.58 32.83 0.00 0.00 0.00 0.00 0.00 0.00 6.63 41.04
253 ROWE 0.00 35.26 0.00 0.00 0.00 0.00 0.00 0.00 3.06 38.33
254 ROWLEY 7.90 42.75 0.00 0.00 0.00 0.00 0.00 0.00 2.01 52.65
255 ROYALSTON 0.00 69.58 0.00 0.00 0.00 0.00 0.00 1.40 2.37 73.35
256 RUSSELL 13.32 22.32 0.00 0.00 0.00 0.00 0.00 0.00 0.12 35.76
257 RUTLAND 10.20 79.08 1.56 0.00 9.94 0.45 0.00 0.00 4.52 105.75
258 SALEM 4.26 90.28 0.00 0.00 0.00 0.00 0.00 0.00 5.88 100.43
259 SALISBURY 15.97 36.11 0.00 0.00 1.36 0.00 0.00 0.00 1.21 54.65
260 SANDISFIELD 8.77 81.02 0.00 0.00 1.55 0.00 0.00 0.00 0.71 92.05
261 SANDWICH 15.34 151.45 0.00 0.00 1.22 0.00 0.00 25.90 21.46 215.36
262 SAUGUS 8.02 90.41 2.66 0.00 0.00 0.00 0.00 0.00 10.49 111.58
263 SAVOY 1.72 49.06 0.00 0.00 3.76 0.00 0.00 0.00 0.53 55.08
264 SCITUATE 5.05 102.76 0.00 0.00 0.00 0.00 0.00 0.00 15.85 123.66
265 SEEKONK 12.48 101.90 0.00 0.00 0.00 0.00 0.00 0.00 0.82 115.20
266 SHARON 8.19 107.98 0.00 0.00 0.00 0.00 0.00 0.00 7.59 123.76
267 SHEFFIELD 17.79 81.16 0.00 0.00 0.00 0.00 0.00 0.00 2.09 101.04
268 SHELBURNE 9.40 48.89 0.00 0.00 0.00 0.00 0.00 0.00 0.04 58.33
269 SHERBORN 0.01 55.95 0.00 0.00 0.00 0.00 0.00 0.00 0.19 56.15
270 SHIRLEY 3.93 43.39 0.00 0.00 0.00 3.80 0.00 0.00 0.63 51.75
271 SHREWSBURY 19.14 149.74 0.00 0.00 0.00 0.00 0.00 0.00 13.40 182.29
272 SHUTESBURY 3.17 30.94 5.17 0.00 0.00 0.00 0.00 0.00 2.78 42.06
273 SOMERSET 11.27 85.46 0.00 0.00 0.00 0.00 0.00 0.00 2.67 99.39
274 SOMERVILLE 5.46 89.75 2.43 0.00 0.00 0.00 0.00 0.00 10.57 108.21
275 SOUTHHADLEY
8.76 84.45 0.00 0.00 0.58 0.00 0.00 0.00 10.08 103.87
276 SOUTHAMPTON
5.36 68.17 0.00 0.00 0.00 0.00 0.00 0.00 3.83 77.36
277 SOUTHBOROUGH
13.00 70.66 0.54 0.00 0.00 0.00 0.00 0.00 1.45 85.66
ROAD INVENTORY YEAR END REPORT 2020CENTERLINE MILES TABLE 5CITY/TOWN BY JURISDICTION
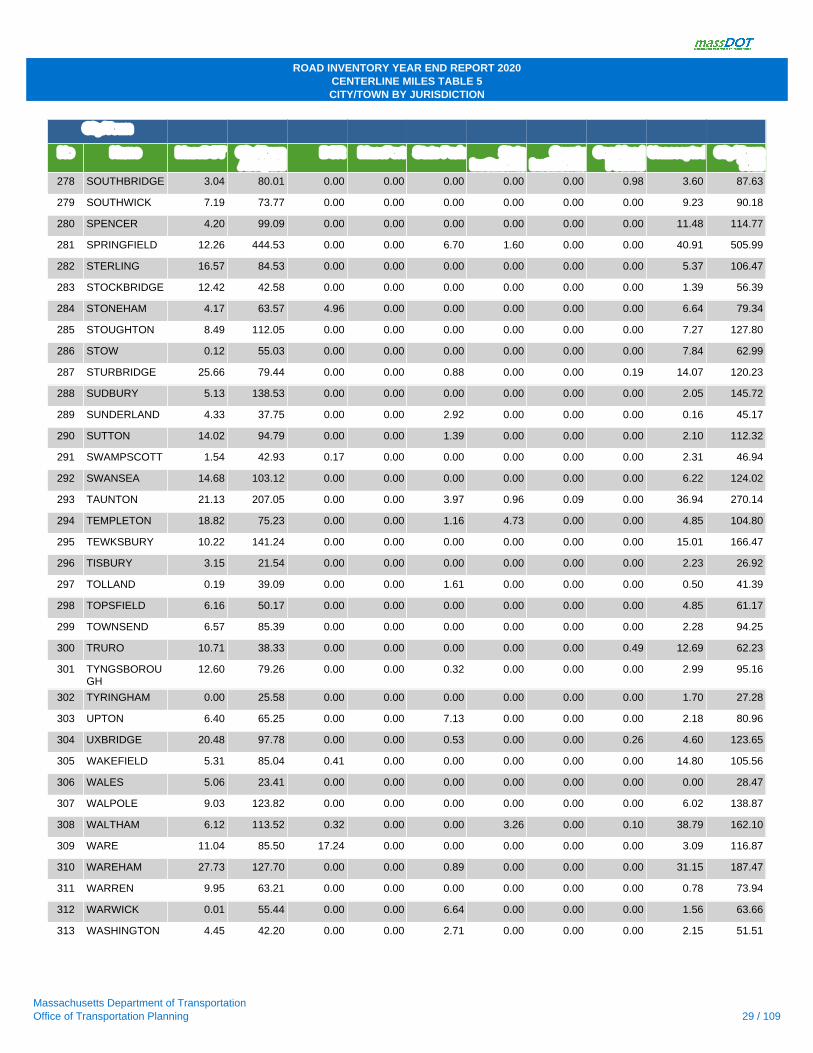
Massachusetts Department of TransportationOffice of Transportation Planning 29 / 109
City/Town
No Name MassDOT City/TownAccepted
DCR MassPort State Park StateInstitutional
CountyInstitutional
CombinedFederal
Unaccepted City/TownTotal
278 SOUTHBRIDGE 3.04 80.01 0.00 0.00 0.00 0.00 0.00 0.98 3.60 87.63
279 SOUTHWICK 7.19 73.77 0.00 0.00 0.00 0.00 0.00 0.00 9.23 90.18
280 SPENCER 4.20 99.09 0.00 0.00 0.00 0.00 0.00 0.00 11.48 114.77
281 SPRINGFIELD 12.26 444.53 0.00 0.00 6.70 1.60 0.00 0.00 40.91 505.99
282 STERLING 16.57 84.53 0.00 0.00 0.00 0.00 0.00 0.00 5.37 106.47
283 STOCKBRIDGE 12.42 42.58 0.00 0.00 0.00 0.00 0.00 0.00 1.39 56.39
284 STONEHAM 4.17 63.57 4.96 0.00 0.00 0.00 0.00 0.00 6.64 79.34
285 STOUGHTON 8.49 112.05 0.00 0.00 0.00 0.00 0.00 0.00 7.27 127.80
286 STOW 0.12 55.03 0.00 0.00 0.00 0.00 0.00 0.00 7.84 62.99
287 STURBRIDGE 25.66 79.44 0.00 0.00 0.88 0.00 0.00 0.19 14.07 120.23
288 SUDBURY 5.13 138.53 0.00 0.00 0.00 0.00 0.00 0.00 2.05 145.72
289 SUNDERLAND 4.33 37.75 0.00 0.00 2.92 0.00 0.00 0.00 0.16 45.17
290 SUTTON 14.02 94.79 0.00 0.00 1.39 0.00 0.00 0.00 2.10 112.32
291 SWAMPSCOTT 1.54 42.93 0.17 0.00 0.00 0.00 0.00 0.00 2.31 46.94
292 SWANSEA 14.68 103.12 0.00 0.00 0.00 0.00 0.00 0.00 6.22 124.02
293 TAUNTON 21.13 207.05 0.00 0.00 3.97 0.96 0.09 0.00 36.94 270.14
294 TEMPLETON 18.82 75.23 0.00 0.00 1.16 4.73 0.00 0.00 4.85 104.80
295 TEWKSBURY 10.22 141.24 0.00 0.00 0.00 0.00 0.00 0.00 15.01 166.47
296 TISBURY 3.15 21.54 0.00 0.00 0.00 0.00 0.00 0.00 2.23 26.92
297 TOLLAND 0.19 39.09 0.00 0.00 1.61 0.00 0.00 0.00 0.50 41.39
298 TOPSFIELD 6.16 50.17 0.00 0.00 0.00 0.00 0.00 0.00 4.85 61.17
299 TOWNSEND 6.57 85.39 0.00 0.00 0.00 0.00 0.00 0.00 2.28 94.25
300 TRURO 10.71 38.33 0.00 0.00 0.00 0.00 0.00 0.49 12.69 62.23
301 TYNGSBOROUGH
12.60 79.26 0.00 0.00 0.32 0.00 0.00 0.00 2.99 95.16
302 TYRINGHAM 0.00 25.58 0.00 0.00 0.00 0.00 0.00 0.00 1.70 27.28
303 UPTON 6.40 65.25 0.00 0.00 7.13 0.00 0.00 0.00 2.18 80.96
304 UXBRIDGE 20.48 97.78 0.00 0.00 0.53 0.00 0.00 0.26 4.60 123.65
305 WAKEFIELD 5.31 85.04 0.41 0.00 0.00 0.00 0.00 0.00 14.80 105.56
306 WALES 5.06 23.41 0.00 0.00 0.00 0.00 0.00 0.00 0.00 28.47
307 WALPOLE 9.03 123.82 0.00 0.00 0.00 0.00 0.00 0.00 6.02 138.87
308 WALTHAM 6.12 113.52 0.32 0.00 0.00 3.26 0.00 0.10 38.79 162.10
309 WARE 11.04 85.50 17.24 0.00 0.00 0.00 0.00 0.00 3.09 116.87
310 WAREHAM 27.73 127.70 0.00 0.00 0.89 0.00 0.00 0.00 31.15 187.47
311 WARREN 9.95 63.21 0.00 0.00 0.00 0.00 0.00 0.00 0.78 73.94
312 WARWICK 0.01 55.44 0.00 0.00 6.64 0.00 0.00 0.00 1.56 63.66
313 WASHINGTON 4.45 42.20 0.00 0.00 2.71 0.00 0.00 0.00 2.15 51.51

ROAD INVENTORY YEAR END REPORT 2020CENTERLINE MILES TABLE 5CITY/TOWN BY JURISDICTION
Massachusetts Department of TransportationOffice of Transportation Planning 30 / 109
City/Town
No Name MassDOT City/TownAccepted
DCR MassPort State Park StateInstitutional
CountyInstitutional
CombinedFederal
Unaccepted City/TownTotal
314 WATERTOWN 1.06 73.05 3.09 0.00 0.00 0.00 0.00 0.00 1.82 79.02
315 WAYLAND 3.96 88.15 0.00 0.00 0.00 0.00 0.00 0.00 4.37 96.49
316 WEBSTER 7.32 72.86 0.00 0.00 0.00 0.00 0.00 0.00 4.99 85.17
317 WELLESLEY 9.27 110.88 0.18 0.00 0.00 0.00 0.00 0.00 11.60 131.93
318 WELLFLEET 7.70 54.15 0.00 0.00 1.37 0.00 0.00 3.74 5.17 72.13
319 WENDELL 0.31 46.37 2.04 0.00 16.58 0.00 0.00 0.00 2.59 67.89
320 WENHAM 2.94 27.81 0.00 0.00 0.00 0.00 0.00 0.00 2.51 33.26
321 WESTBOYLSTON
9.56 50.33 0.00 0.00 0.00 1.74 0.00 0.00 1.65 63.30
322 WESTBRIDGEWATER
8.14 50.76 0.00 0.00 0.00 0.00 0.00 0.00 0.90 59.80
323 WESTBROOKFIELD
3.41 50.58 0.00 0.00 0.00 0.00 0.00 0.00 12.31 66.30
324 WESTNEWBURY
6.03 45.85 0.00 0.00 0.00 0.00 0.00 0.00 0.42 52.29
325 WESTSPRINGFIELD
15.10 121.39 0.00 0.00 0.00 0.00 0.02 0.00 9.95 146.46
326 WESTSTOCKBRIDGE
8.12 35.94 0.00 0.00 0.00 0.00 0.00 0.00 0.44 44.50
327 WESTTISBURY
8.64 13.93 0.00 0.00 0.00 0.00 0.18 0.00 2.22 24.97
328 WESTBOROUGH
13.26 95.86 0.00 0.00 0.00 0.00 0.00 0.00 3.00 112.12
329 WESTFIELD 16.22 189.75 0.00 0.00 0.00 0.40 0.00 0.00 43.15 249.52
330 WESTFORD 11.95 153.01 0.00 0.00 0.00 0.00 0.00 0.00 5.31 170.26
331 WESTHAMPTON
0.01 43.84 0.00 0.00 0.00 0.00 0.00 0.00 3.46 47.31
332 WESTMINSTER
15.64 88.42 0.00 0.00 0.00 1.41 0.00 0.00 4.90 110.36
333 WESTON 9.64 86.28 2.06 0.00 0.00 0.00 0.00 0.00 13.21 111.19
334 WESTPORT 24.80 136.09 0.00 0.00 0.00 0.00 0.00 0.00 1.53 162.42
335 WESTWOOD 3.74 81.18 0.00 0.00 0.00 0.00 0.00 0.00 4.30 89.22
336 WEYMOUTH 15.58 149.29 0.00 0.00 0.15 0.43 0.00 0.14 18.40 184.00
337 WHATELY 8.69 31.25 0.00 0.00 0.00 0.00 0.00 0.00 8.03 47.97
338 WHITMAN 4.02 48.85 0.00 0.00 0.00 0.00 0.00 0.00 1.63 54.50
339 WILBRAHAM 6.15 100.15 0.00 0.00 0.00 0.00 0.00 0.00 7.13 113.43
340 WILLIAMSBURG
5.71 42.58 0.00 0.00 0.00 0.00 0.00 0.00 2.62 50.91
341 WILLIAMSTOWN
18.19 52.39 0.00 0.00 2.78 0.00 0.00 0.00 3.98 77.33
342 WILMINGTON 12.59 96.96 0.00 0.00 0.00 0.00 0.00 0.00 18.83 128.38
343 WINCHENDON 12.12 94.92 0.00 0.00 5.33 0.00 0.00 0.00 5.29 117.66
344 WINCHESTER 2.01 73.09 3.47 0.00 0.00 0.00 0.00 0.00 12.80 91.38
345 WINDSOR 10.93 62.29 0.00 0.00 2.71 0.00 0.00 0.00 0.00 75.93

ROAD INVENTORY YEAR END REPORT 2020CENTERLINE MILES TABLE 5CITY/TOWN BY JURISDICTION
Massachusetts Department of TransportationOffice of Transportation Planning 31 / 109
City/Town
No Name MassDOT City/TownAccepted
DCR MassPort State Park StateInstitutional
CountyInstitutional
CombinedFederal
Unaccepted City/TownTotal
346 WINTHROP 0.00 35.96 1.24 0.00 0.00 0.00 0.00 0.00 2.71 39.91
347 WOBURN 13.09 130.11 0.00 0.00 0.00 0.00 0.00 0.00 10.01 153.21
348 WORCESTER 23.61 435.04 0.00 0.00 0.00 1.93 0.00 0.00 75.29 535.87
349 WORTHINGTON
5.97 57.35 0.00 0.00 0.18 0.00 0.00 0.00 1.39 64.89
350 WRENTHAM 20.68 67.33 0.00 0.00 1.91 3.21 0.00 0.00 2.83 95.96
351 YARMOUTH 15.01 150.62 0.00 0.00 0.00 0.00 0.00 0.00 94.54 260.16
Total 2,997.48 29,980.58 255.56 7.00 278.59 77.76 3.83 107.56 3,107.32 36,815.68
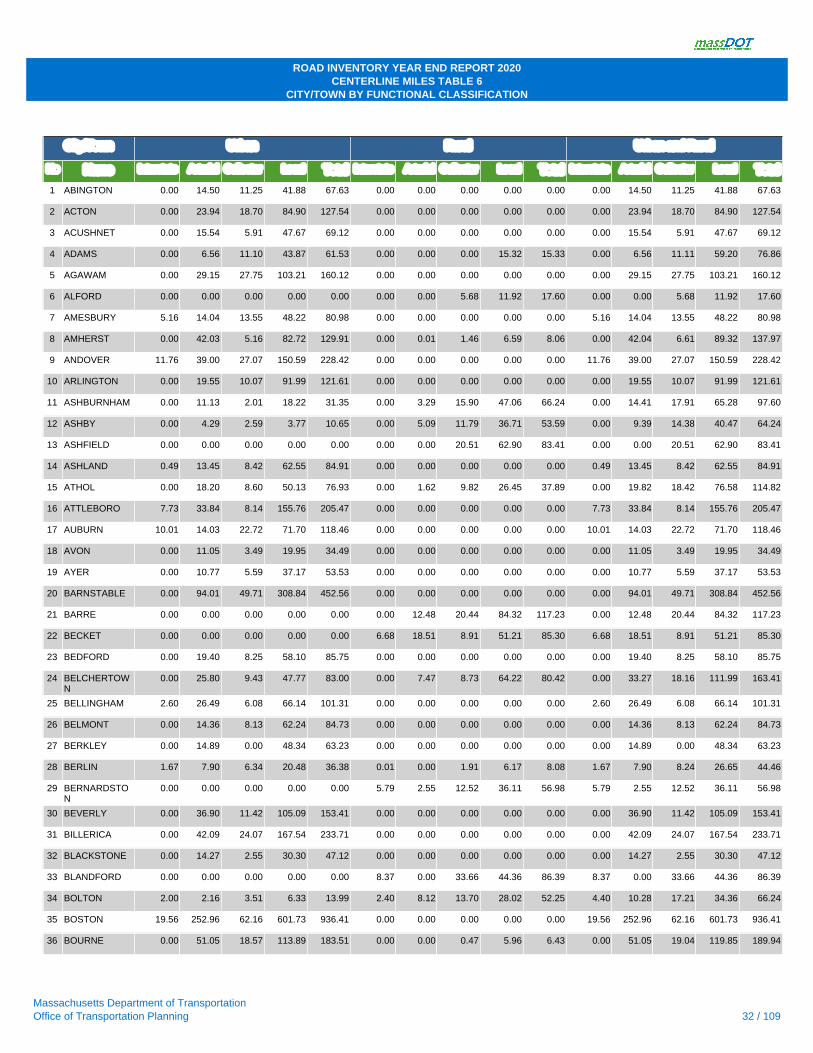
ROAD INVENTORY YEAR END REPORT 2020CENTERLINE MILES TABLE 6
CITY/TOWN BY FUNCTIONAL CLASSIFICATION
Massachusetts Department of TransportationOffice of Transportation Planning 32 / 109
City/Town Urban Rural Urban and Rural
No Name Interstate Arterial Collector Local Total Interstate Arterial Collector Local Total Interstate Arterial Collector Local Total
1 ABINGTON 0.00 14.50 11.25 41.88 67.63 0.00 0.00 0.00 0.00 0.00 0.00 14.50 11.25 41.88 67.63
2 ACTON 0.00 23.94 18.70 84.90 127.54 0.00 0.00 0.00 0.00 0.00 0.00 23.94 18.70 84.90 127.54
3 ACUSHNET 0.00 15.54 5.91 47.67 69.12 0.00 0.00 0.00 0.00 0.00 0.00 15.54 5.91 47.67 69.12
4 ADAMS 0.00 6.56 11.10 43.87 61.53 0.00 0.00 0.00 15.32 15.33 0.00 6.56 11.11 59.20 76.86
5 AGAWAM 0.00 29.15 27.75 103.21 160.12 0.00 0.00 0.00 0.00 0.00 0.00 29.15 27.75 103.21 160.12
6 ALFORD 0.00 0.00 0.00 0.00 0.00 0.00 0.00 5.68 11.92 17.60 0.00 0.00 5.68 11.92 17.60
7 AMESBURY 5.16 14.04 13.55 48.22 80.98 0.00 0.00 0.00 0.00 0.00 5.16 14.04 13.55 48.22 80.98
8 AMHERST 0.00 42.03 5.16 82.72 129.91 0.00 0.01 1.46 6.59 8.06 0.00 42.04 6.61 89.32 137.97
9 ANDOVER 11.76 39.00 27.07 150.59 228.42 0.00 0.00 0.00 0.00 0.00 11.76 39.00 27.07 150.59 228.42
10 ARLINGTON 0.00 19.55 10.07 91.99 121.61 0.00 0.00 0.00 0.00 0.00 0.00 19.55 10.07 91.99 121.61
11 ASHBURNHAM 0.00 11.13 2.01 18.22 31.35 0.00 3.29 15.90 47.06 66.24 0.00 14.41 17.91 65.28 97.60
12 ASHBY 0.00 4.29 2.59 3.77 10.65 0.00 5.09 11.79 36.71 53.59 0.00 9.39 14.38 40.47 64.24
13 ASHFIELD 0.00 0.00 0.00 0.00 0.00 0.00 0.00 20.51 62.90 83.41 0.00 0.00 20.51 62.90 83.41
14 ASHLAND 0.49 13.45 8.42 62.55 84.91 0.00 0.00 0.00 0.00 0.00 0.49 13.45 8.42 62.55 84.91
15 ATHOL 0.00 18.20 8.60 50.13 76.93 0.00 1.62 9.82 26.45 37.89 0.00 19.82 18.42 76.58 114.82
16 ATTLEBORO 7.73 33.84 8.14 155.76 205.47 0.00 0.00 0.00 0.00 0.00 7.73 33.84 8.14 155.76 205.47
17 AUBURN 10.01 14.03 22.72 71.70 118.46 0.00 0.00 0.00 0.00 0.00 10.01 14.03 22.72 71.70 118.46
18 AVON 0.00 11.05 3.49 19.95 34.49 0.00 0.00 0.00 0.00 0.00 0.00 11.05 3.49 19.95 34.49
19 AYER 0.00 10.77 5.59 37.17 53.53 0.00 0.00 0.00 0.00 0.00 0.00 10.77 5.59 37.17 53.53
20 BARNSTABLE 0.00 94.01 49.71 308.84 452.56 0.00 0.00 0.00 0.00 0.00 0.00 94.01 49.71 308.84 452.56
21 BARRE 0.00 0.00 0.00 0.00 0.00 0.00 12.48 20.44 84.32 117.23 0.00 12.48 20.44 84.32 117.23
22 BECKET 0.00 0.00 0.00 0.00 0.00 6.68 18.51 8.91 51.21 85.30 6.68 18.51 8.91 51.21 85.30
23 BEDFORD 0.00 19.40 8.25 58.10 85.75 0.00 0.00 0.00 0.00 0.00 0.00 19.40 8.25 58.10 85.75
24 BELCHERTOWN
0.00 25.80 9.43 47.77 83.00 0.00 7.47 8.73 64.22 80.42 0.00 33.27 18.16 111.99 163.41
25 BELLINGHAM 2.60 26.49 6.08 66.14 101.31 0.00 0.00 0.00 0.00 0.00 2.60 26.49 6.08 66.14 101.31
26 BELMONT 0.00 14.36 8.13 62.24 84.73 0.00 0.00 0.00 0.00 0.00 0.00 14.36 8.13 62.24 84.73
27 BERKLEY 0.00 14.89 0.00 48.34 63.23 0.00 0.00 0.00 0.00 0.00 0.00 14.89 0.00 48.34 63.23
28 BERLIN 1.67 7.90 6.34 20.48 36.38 0.01 0.00 1.91 6.17 8.08 1.67 7.90 8.24 26.65 44.46
29 BERNARDSTON
0.00 0.00 0.00 0.00 0.00 5.79 2.55 12.52 36.11 56.98 5.79 2.55 12.52 36.11 56.98
30 BEVERLY 0.00 36.90 11.42 105.09 153.41 0.00 0.00 0.00 0.00 0.00 0.00 36.90 11.42 105.09 153.41
31 BILLERICA 0.00 42.09 24.07 167.54 233.71 0.00 0.00 0.00 0.00 0.00 0.00 42.09 24.07 167.54 233.71
32 BLACKSTONE 0.00 14.27 2.55 30.30 47.12 0.00 0.00 0.00 0.00 0.00 0.00 14.27 2.55 30.30 47.12
33 BLANDFORD 0.00 0.00 0.00 0.00 0.00 8.37 0.00 33.66 44.36 86.39 8.37 0.00 33.66 44.36 86.39
34 BOLTON 2.00 2.16 3.51 6.33 13.99 2.40 8.12 13.70 28.02 52.25 4.40 10.28 17.21 34.36 66.24
35 BOSTON 19.56 252.96 62.16 601.73 936.41 0.00 0.00 0.00 0.00 0.00 19.56 252.96 62.16 601.73 936.41
36 BOURNE 0.00 51.05 18.57 113.89 183.51 0.00 0.00 0.47 5.96 6.43 0.00 51.05 19.04 119.85 189.94

ROAD INVENTORY YEAR END REPORT 2020CENTERLINE MILES TABLE 6
CITY/TOWN BY FUNCTIONAL CLASSIFICATION
Massachusetts Department of TransportationOffice of Transportation Planning 33 / 109
City/Town Urban Rural Urban and Rural
No Name Interstate Arterial Collector Local Total Interstate Arterial Collector Local Total Interstate Arterial Collector Local Total
37 BOXBOROUGH 3.51 3.84 4.22 29.78 41.34 0.00 0.00 0.00 0.00 0.00 3.51 3.84 4.22 29.78 41.34
38 BOXFORD 4.96 15.99 1.05 56.73 78.73 0.00 0.00 5.42 16.22 21.64 4.96 15.99 6.48 72.95 100.38
39 BOYLSTON 0.65 12.98 2.93 33.08 49.65 0.00 0.00 0.00 2.07 2.07 0.65 12.98 2.93 35.15 51.72
40 BRAINTREE 1.81 32.61 12.29 96.04 142.75 0.00 0.00 0.00 0.00 0.00 1.81 32.61 12.29 96.04 142.75
41 BREWSTER 0.00 34.07 5.00 123.27 162.34 0.00 0.00 0.00 0.00 0.00 0.00 34.07 5.00 123.27 162.34
42 BRIDGEWATER 1.18 30.37 12.75 91.27 135.57 0.00 0.00 0.00 0.00 0.00 1.18 30.37 12.75 91.27 135.57
43 BRIMFIELD 0.00 0.00 0.00 0.00 0.00 2.95 8.79 17.03 50.20 78.97 2.95 8.79 17.03 50.20 78.97
44 BROCKTON 0.00 55.66 30.24 205.31 291.21 0.00 0.00 0.00 0.00 0.00 0.00 55.66 30.24 205.31 291.21
45 BROOKFIELD 0.00 6.24 3.28 10.09 19.61 0.00 0.00 4.03 16.20 20.23 0.00 6.24 7.31 26.29 39.84
46 BROOKLINE 0.22 22.07 23.77 61.09 107.15 0.00 0.00 0.00 0.00 0.00 0.22 22.07 23.77 61.09 107.15
47 BUCKLAND 0.00 0.00 0.00 0.00 0.00 0.00 0.63 13.57 35.87 50.07 0.00 0.63 13.57 35.87 50.07
48 BURLINGTON 3.29 21.64 15.30 77.39 117.62 0.00 0.00 0.00 0.00 0.00 3.29 21.64 15.30 77.39 117.62
49 CAMBRIDGE 0.00 42.27 17.39 82.58 142.24 0.00 0.00 0.00 0.00 0.00 0.00 42.27 17.39 82.58 142.24
50 CANTON 5.60 19.68 9.08 81.80 116.16 0.00 0.00 0.00 0.00 0.00 5.60 19.68 9.08 81.80 116.16
51 CARLISLE 0.00 9.57 6.49 32.71 48.77 0.00 0.00 1.32 5.26 6.59 0.00 9.57 7.82 37.97 55.36
52 CARVER 0.00 24.44 3.84 76.39 104.67 0.00 0.00 0.00 0.00 0.00 0.00 24.44 3.84 76.40 104.68
53 CHARLEMONT 0.00 0.00 0.00 0.00 0.00 0.00 12.09 14.71 30.25 57.05 0.00 12.09 14.71 30.25 57.05
54 CHARLTON 7.51 21.64 3.44 53.54 86.13 0.00 1.45 15.87 53.49 70.81 7.51 23.09 19.31 107.03 156.94
55 CHATHAM 0.00 15.78 4.20 102.85 122.83 0.00 0.00 0.00 0.00 0.00 0.00 15.78 4.20 102.85 122.83
56 CHELMSFORD 5.30 46.52 8.94 143.33 204.09 0.00 0.00 0.00 0.00 0.00 5.30 46.52 8.94 143.33 204.09
57 CHELSEA 0.00 11.92 10.78 27.01 49.72 0.00 0.00 0.00 0.00 0.00 0.00 11.92 10.78 27.01 49.72
58 CHESHIRE 0.00 6.92 6.29 12.64 25.85 0.00 0.00 2.58 29.71 32.29 0.00 6.92 8.86 42.35 58.14
59 CHESTER 0.00 0.00 0.00 0.00 0.00 0.00 6.41 21.98 38.80 67.19 0.00 6.41 21.98 38.80 67.19
60 CHESTERFIELD
0.00 0.00 0.00 0.00 0.00 0.00 7.79 15.59 34.92 58.30 0.00 7.79 15.59 34.92 58.30
61 CHICOPEE 11.62 40.03 15.56 195.42 262.63 0.00 0.00 0.00 0.00 0.00 11.62 40.03 15.56 195.42 262.63
62 CHILMARK 0.00 0.00 0.00 0.00 0.00 0.00 0.00 7.77 14.11 21.88 0.00 0.00 7.77 14.11 21.88
63 CLARKSBURG 0.00 1.17 1.66 6.11 8.93 0.00 0.10 2.89 8.31 11.29 0.00 1.27 4.54 14.41 20.22
64 CLINTON 0.00 13.87 4.21 35.16 53.24 0.00 0.00 0.00 0.00 0.00 0.00 13.87 4.21 35.16 53.24
65 COHASSET 0.00 13.24 9.45 27.21 49.90 0.00 0.00 0.00 0.00 0.00 0.00 13.24 9.45 27.21 49.90
66 COLRAIN 0.00 0.00 0.00 0.00 0.00 0.00 7.89 15.78 64.14 87.81 0.00 7.89 15.78 64.14 87.81
67 CONCORD 0.00 25.97 15.25 88.72 129.95 0.00 0.00 0.00 0.00 0.00 0.00 25.97 15.25 88.72 129.95
68 CONWAY 0.00 0.00 0.00 0.00 0.00 0.00 0.00 25.99 44.92 70.91 0.00 0.00 25.99 44.92 70.91
69 CUMMINGTON 0.00 0.00 0.00 0.00 0.00 0.00 12.90 9.44 38.78 61.12 0.00 12.90 9.44 38.78 61.12
70 DALTON 0.00 8.86 7.59 26.97 43.43 0.00 1.13 0.00 3.20 4.32 0.00 9.99 7.59 30.17 47.75
71 DANVERS 3.30 34.42 9.37 80.36 127.45 0.00 0.00 0.00 0.00 0.00 3.30 34.42 9.37 80.36 127.45
72 DARTMOUTH 4.59 31.45 33.14 130.98 200.16 0.00 0.00 4.84 20.47 25.31 4.59 31.45 37.98 151.45 225.46
73 DEDHAM 4.49 21.20 10.35 73.82 109.86 0.00 0.00 0.00 0.00 0.00 4.49 21.20 10.35 73.82 109.86

ROAD INVENTORY YEAR END REPORT 2020CENTERLINE MILES TABLE 6
CITY/TOWN BY FUNCTIONAL CLASSIFICATION
Massachusetts Department of TransportationOffice of Transportation Planning 34 / 109
City/Town Urban Rural Urban and Rural
No Name Interstate Arterial Collector Local Total Interstate Arterial Collector Local Total Interstate Arterial Collector Local Total
74 DEERFIELD 3.60 12.32 4.03 20.64 40.59 3.42 0.00 9.67 47.05 60.14 7.01 12.32 13.70 67.69 100.72
75 DENNIS 0.00 36.92 17.35 155.83 210.09 0.00 0.00 0.00 0.00 0.00 0.00 36.92 17.35 155.83 210.09
76 DIGHTON 0.00 16.83 2.71 48.59 68.13 0.00 0.00 0.00 0.00 0.00 0.00 16.83 2.71 48.59 68.13
77 DOUGLAS 0.00 6.76 11.78 30.79 49.33 0.00 0.00 12.35 22.11 34.46 0.00 6.76 24.13 52.90 83.79
78 DOVER 0.00 12.46 9.42 40.24 62.11 0.00 0.00 0.00 0.00 0.00 0.00 12.46 9.42 40.24 62.11
79 DRACUT 0.00 20.14 18.40 121.65 160.19 0.00 0.00 0.00 0.00 0.00 0.00 20.14 18.40 121.65 160.19
80 DUDLEY 0.00 14.92 12.96 46.25 74.13 0.00 0.00 1.96 14.90 16.86 0.00 14.92 14.92 61.15 90.99
81 DUNSTABLE 0.00 10.29 0.00 18.19 28.49 0.00 0.00 0.00 14.05 14.05 0.00 10.29 0.00 32.24 42.54
82 DUXBURY 0.00 27.30 15.21 86.27 128.78 0.00 0.00 0.00 0.00 0.00 0.00 27.30 15.21 86.27 128.78
83 EASTBRIDGEWATER
0.00 24.95 9.46 45.44 79.84 0.00 0.00 0.00 0.00 0.00 0.00 24.95 9.46 45.44 79.84
84 EASTBROOKFIELD
0.00 3.89 0.88 6.18 10.95 0.00 2.85 8.35 5.42 16.62 0.00 6.73 9.23 11.60 27.56
85 EASTLONGMEADOW
0.00 21.52 9.35 70.02 100.90 0.00 0.00 0.00 0.00 0.00 0.00 21.52 9.35 70.02 100.90
86 EASTHAM 0.00 18.34 4.74 75.07 98.16 0.00 0.00 2.63 3.02 5.65 0.00 18.34 7.37 78.10 103.81
87 EASTHAMPTON
0.48 25.67 4.95 61.43 92.53 0.00 0.00 0.00 0.00 0.00 0.48 25.67 4.95 61.44 92.54
88 EASTON 0.00 26.52 17.79 88.57 132.89 0.00 0.00 0.00 0.00 0.00 0.00 26.52 17.79 88.57 132.89
89 EDGARTOWN 0.00 11.73 2.08 26.12 39.92 0.00 0.00 0.00 13.88 13.88 0.00 11.73 2.08 40.00 53.80
90 EGREMONT 0.00 0.00 0.00 0.00 0.00 0.00 4.10 16.76 22.58 43.44 0.00 4.10 16.76 22.58 43.44
91 ERVING 0.00 4.40 0.00 3.97 8.37 0.00 8.62 4.69 16.69 30.00 0.00 13.02 4.69 20.66 38.37
92 ESSEX 0.00 9.32 0.00 17.75 27.07 0.00 0.00 0.00 2.49 2.49 0.00 9.32 0.00 20.24 29.56
93 EVERETT 0.00 12.35 10.65 42.33 65.34 0.00 0.00 0.00 0.00 0.00 0.00 12.35 10.65 42.33 65.34
94 FAIRHAVEN 3.58 16.76 7.26 81.16 108.76 0.00 0.00 0.00 0.00 0.00 3.58 16.76 7.26 81.16 108.76
95 FALL RIVER 3.46 48.48 25.64 195.28 272.87 0.00 0.00 0.00 0.00 0.00 3.46 48.48 25.64 195.28 272.87
96 FALMOUTH 0.00 80.57 27.91 239.71 348.20 0.00 0.00 0.00 0.69 0.69 0.00 80.57 27.91 240.40 348.89
97 FITCHBURG 0.00 43.74 21.85 136.96 202.55 0.00 0.00 0.00 0.05 0.06 0.00 43.74 21.85 137.01 202.60
98 FLORIDA 0.00 0.00 0.00 0.02 0.02 0.00 7.16 12.26 28.06 47.48 0.00 7.16 12.26 28.07 47.50
99 FOXBOROUGH 6.52 23.62 9.03 73.27 112.43 0.00 0.00 0.00 0.00 0.00 6.52 23.62 9.03 73.27 112.43
100 FRAMINGHAM 6.29 37.79 43.73 153.78 241.59 0.00 0.00 0.00 0.00 0.00 6.29 37.79 43.73 153.78 241.59
101 FRANKLIN 4.91 31.86 3.38 131.12 171.27 0.00 0.00 0.00 0.00 0.00 4.91 31.86 3.38 131.12 171.27
102 FREETOWN 0.00 33.37 4.56 70.29 108.22 0.00 0.00 0.00 0.00 0.00 0.00 33.37 4.56 70.29 108.22
103 GARDNER 0.00 28.51 13.10 75.53 117.14 0.00 0.00 0.00 0.00 0.00 0.00 28.51 13.10 75.53 117.14
104 AQUINNAH 0.00 0.00 0.00 0.00 0.00 0.00 0.00 6.58 6.91 13.49 0.00 0.00 6.58 6.91 13.49
105 GEORGETOWN 3.36 13.97 3.08 44.19 64.60 0.00 0.00 0.00 0.00 0.00 3.36 13.97 3.08 44.19 64.60
106 GILL 0.00 3.71 0.00 2.64 6.34 0.00 0.29 6.62 27.16 34.07 0.00 4.00 6.62 29.79 40.41
107 GLOUCESTER 0.00 28.86 10.02 127.90 166.78 0.00 0.00 0.00 0.00 0.00 0.00 28.86 10.02 127.90 166.78
108 GOSHEN 0.00 0.00 0.00 0.00 0.00 0.00 5.41 8.24 28.44 42.09 0.00 5.41 8.24 28.44 42.09
109 GOSNOLD 0.00 0.00 0.00 0.00 0.00 0.00 0.00 1.97 0.03 2.00 0.00 0.00 1.97 0.03 2.00

ROAD INVENTORY YEAR END REPORT 2020CENTERLINE MILES TABLE 6
CITY/TOWN BY FUNCTIONAL CLASSIFICATION
Massachusetts Department of TransportationOffice of Transportation Planning 35 / 109
City/Town Urban Rural Urban and Rural
No Name Interstate Arterial Collector Local Total Interstate Arterial Collector Local Total Interstate Arterial Collector Local Total
110 GRAFTON 4.46 19.29 13.41 66.56 103.71 0.00 0.00 0.00 0.00 0.00 4.46 19.29 13.41 66.56 103.71
111 GRANBY 0.00 16.88 12.28 23.64 52.81 0.00 0.96 6.02 8.99 15.96 0.00 17.84 18.30 32.63 68.77
112 GRANVILLE 0.00 0.00 0.00 0.00 0.00 0.00 8.89 17.34 46.77 73.00 0.00 8.89 17.34 46.77 73.00
113 GREATBARRINGTON
0.00 13.79 6.58 24.25 44.62 0.00 6.18 12.07 32.80 51.06 0.00 19.97 18.65 57.06 95.68
114 GREENFIELD 6.46 21.64 18.79 67.31 114.20 0.68 1.38 2.04 11.96 16.06 7.14 23.01 20.84 79.27 130.26
115 GROTON 0.00 25.57 7.46 74.94 107.97 0.00 0.00 0.95 5.35 6.31 0.00 25.57 8.42 80.29 114.28
116 GROVELAND 0.00 11.03 6.26 29.63 46.93 0.00 0.00 0.00 0.00 0.00 0.00 11.03 6.26 29.63 46.93
117 HADLEY 0.00 19.04 4.31 29.11 52.46 0.00 4.05 10.85 12.75 27.65 0.00 23.09 15.16 41.87 80.11
118 HALIFAX 0.00 10.91 9.32 34.62 54.85 0.00 0.00 0.00 4.66 4.66 0.00 10.91 9.32 39.29 59.51
119 HAMILTON 0.00 12.61 3.08 36.42 52.10 0.00 0.00 0.00 0.00 0.00 0.00 12.61 3.08 36.42 52.10
120 HAMPDEN 0.00 5.81 2.51 17.42 25.74 0.00 0.00 7.28 22.03 29.31 0.00 5.81 9.79 39.45 55.05
121 HANCOCK 0.00 0.00 0.00 0.00 0.00 0.00 3.18 11.12 14.16 28.47 0.00 3.18 11.12 14.16 28.47
122 HANOVER 0.00 19.04 17.99 60.21 97.25 0.00 0.00 0.00 0.00 0.00 0.00 19.04 17.99 60.21 97.25
123 HANSON 0.00 16.19 12.24 37.84 66.27 0.00 0.00 0.00 0.00 0.00 0.00 16.19 12.24 37.84 66.27
124 HARDWICK 0.00 2.07 0.09 3.25 5.41 0.00 5.66 17.64 57.91 81.21 0.00 7.73 17.74 61.16 86.63
125 HARVARD 1.47 5.00 2.76 12.83 22.06 0.00 7.63 8.59 41.62 57.84 1.47 12.63 11.35 54.45 79.90
126 HARWICH 0.00 45.18 10.63 114.36 170.17 0.00 0.00 0.00 0.00 0.00 0.00 45.18 10.63 114.36 170.17
127 HATFIELD 0.82 4.42 0.00 12.76 17.99 2.98 0.00 10.17 28.59 41.74 3.79 4.42 10.17 41.34 59.73
128 HAVERHILL 8.13 47.21 24.47 187.11 266.93 0.00 0.00 0.00 0.00 0.00 8.13 47.21 24.47 187.11 266.93
129 HAWLEY 0.00 0.00 0.00 0.00 0.00 0.00 0.00 13.23 35.88 49.11 0.00 0.00 13.23 35.88 49.11
130 HEATH 0.00 0.00 0.00 0.00 0.00 0.00 0.00 12.87 46.75 59.62 0.00 0.00 12.87 46.75 59.62
131 HINGHAM 0.00 28.67 21.75 81.61 132.03 0.00 0.00 0.00 0.00 0.00 0.00 28.67 21.75 81.61 132.03
132 HINSDALE 0.00 3.32 2.03 10.75 16.10 0.00 2.52 3.59 20.26 26.37 0.00 5.83 5.62 31.01 42.47
133 HOLBROOK 0.00 13.60 0.95 36.83 51.38 0.00 0.00 0.00 0.00 0.00 0.00 13.60 0.95 36.83 51.38
134 HOLDEN 2.49 23.73 13.58 86.04 125.84 0.00 0.00 2.63 2.58 5.21 2.49 23.73 16.21 88.62 131.06
135 HOLLAND 0.00 0.00 0.00 0.00 0.00 0.05 0.00 12.02 26.27 38.34 0.05 0.00 12.02 26.27 38.34
136 HOLLISTON 0.00 19.73 3.02 74.32 97.08 0.00 0.00 0.00 0.00 0.00 0.00 19.73 3.02 74.32 97.08
137 HOLYOKE 9.93 38.46 20.91 107.96 177.26 0.00 0.00 0.00 0.00 0.00 9.93 38.46 20.91 107.96 177.26
138 HOPEDALE 0.00 4.11 1.90 25.98 31.99 0.00 0.00 0.00 0.00 0.00 0.00 4.11 1.90 25.98 31.99
139 HOPKINTON 7.93 20.81 0.32 95.83 124.90 0.00 0.00 0.00 0.00 0.00 7.93 20.81 0.32 95.83 124.90
140 HUBBARDSTON
0.00 0.00 0.01 0.00 0.01 0.00 8.18 19.83 57.61 85.61 0.00 8.18 19.83 57.61 85.62
141 HUDSON 0.57 10.82 19.21 61.44 92.04 0.00 0.00 0.00 0.00 0.00 0.57 10.82 19.21 61.44 92.04
142 HULL 0.00 8.57 7.71 37.32 53.60 0.00 0.00 0.00 0.00 0.00 0.00 8.57 7.71 37.32 53.60
143 HUNTINGTON 0.00 0.00 0.00 0.00 0.00 0.00 11.25 11.95 31.46 54.66 0.00 11.25 11.95 31.46 54.66
144 IPSWICH 0.00 28.65 0.70 61.66 91.00 0.00 0.00 0.63 5.94 6.57 0.00 28.65 1.33 67.59 97.57
145 KINGSTON 0.00 21.15 14.63 69.64 105.41 0.00 1.49 0.00 0.12 1.61 0.00 22.64 14.63 69.76 107.03
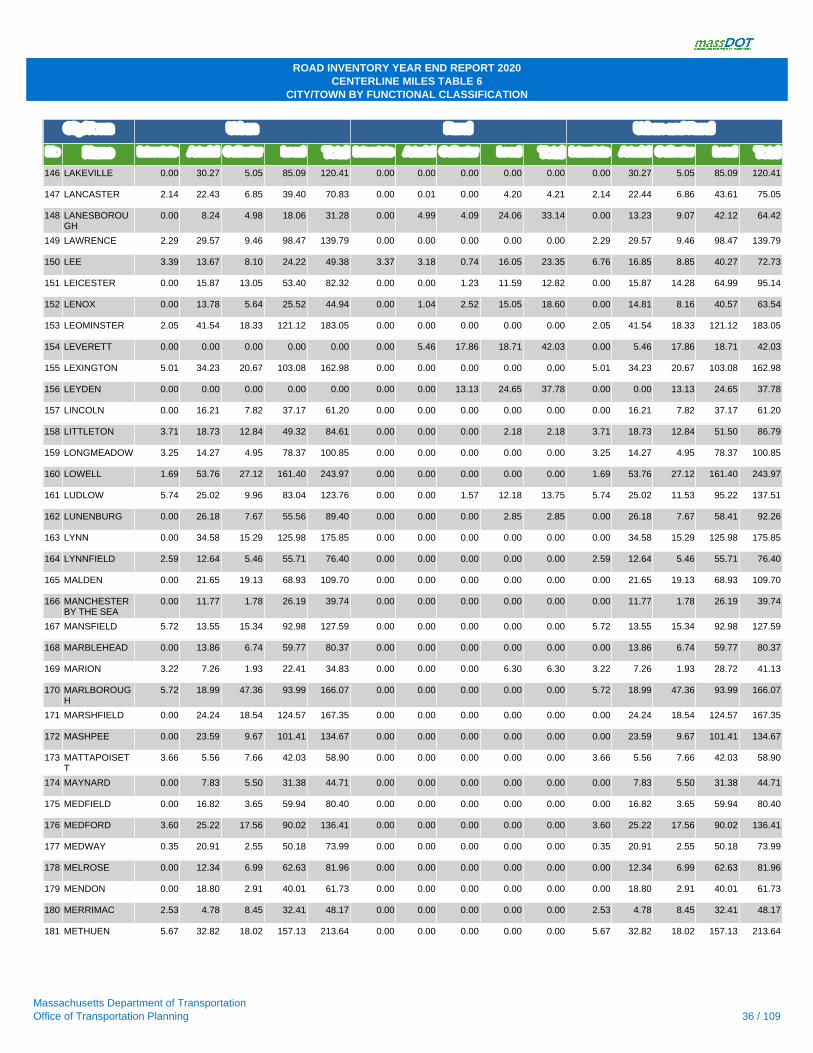
ROAD INVENTORY YEAR END REPORT 2020CENTERLINE MILES TABLE 6
CITY/TOWN BY FUNCTIONAL CLASSIFICATION
Massachusetts Department of TransportationOffice of Transportation Planning 36 / 109
City/Town Urban Rural Urban and Rural
No Name Interstate Arterial Collector Local Total Interstate Arterial Collector Local Total Interstate Arterial Collector Local Total
146 LAKEVILLE 0.00 30.27 5.05 85.09 120.41 0.00 0.00 0.00 0.00 0.00 0.00 30.27 5.05 85.09 120.41
147 LANCASTER 2.14 22.43 6.85 39.40 70.83 0.00 0.01 0.00 4.20 4.21 2.14 22.44 6.86 43.61 75.05
148 LANESBOROUGH
0.00 8.24 4.98 18.06 31.28 0.00 4.99 4.09 24.06 33.14 0.00 13.23 9.07 42.12 64.42
149 LAWRENCE 2.29 29.57 9.46 98.47 139.79 0.00 0.00 0.00 0.00 0.00 2.29 29.57 9.46 98.47 139.79
150 LEE 3.39 13.67 8.10 24.22 49.38 3.37 3.18 0.74 16.05 23.35 6.76 16.85 8.85 40.27 72.73
151 LEICESTER 0.00 15.87 13.05 53.40 82.32 0.00 0.00 1.23 11.59 12.82 0.00 15.87 14.28 64.99 95.14
152 LENOX 0.00 13.78 5.64 25.52 44.94 0.00 1.04 2.52 15.05 18.60 0.00 14.81 8.16 40.57 63.54
153 LEOMINSTER 2.05 41.54 18.33 121.12 183.05 0.00 0.00 0.00 0.00 0.00 2.05 41.54 18.33 121.12 183.05
154 LEVERETT 0.00 0.00 0.00 0.00 0.00 0.00 5.46 17.86 18.71 42.03 0.00 5.46 17.86 18.71 42.03
155 LEXINGTON 5.01 34.23 20.67 103.08 162.98 0.00 0.00 0.00 0.00 0.00 5.01 34.23 20.67 103.08 162.98
156 LEYDEN 0.00 0.00 0.00 0.00 0.00 0.00 0.00 13.13 24.65 37.78 0.00 0.00 13.13 24.65 37.78
157 LINCOLN 0.00 16.21 7.82 37.17 61.20 0.00 0.00 0.00 0.00 0.00 0.00 16.21 7.82 37.17 61.20
158 LITTLETON 3.71 18.73 12.84 49.32 84.61 0.00 0.00 0.00 2.18 2.18 3.71 18.73 12.84 51.50 86.79
159 LONGMEADOW 3.25 14.27 4.95 78.37 100.85 0.00 0.00 0.00 0.00 0.00 3.25 14.27 4.95 78.37 100.85
160 LOWELL 1.69 53.76 27.12 161.40 243.97 0.00 0.00 0.00 0.00 0.00 1.69 53.76 27.12 161.40 243.97
161 LUDLOW 5.74 25.02 9.96 83.04 123.76 0.00 0.00 1.57 12.18 13.75 5.74 25.02 11.53 95.22 137.51
162 LUNENBURG 0.00 26.18 7.67 55.56 89.40 0.00 0.00 0.00 2.85 2.85 0.00 26.18 7.67 58.41 92.26
163 LYNN 0.00 34.58 15.29 125.98 175.85 0.00 0.00 0.00 0.00 0.00 0.00 34.58 15.29 125.98 175.85
164 LYNNFIELD 2.59 12.64 5.46 55.71 76.40 0.00 0.00 0.00 0.00 0.00 2.59 12.64 5.46 55.71 76.40
165 MALDEN 0.00 21.65 19.13 68.93 109.70 0.00 0.00 0.00 0.00 0.00 0.00 21.65 19.13 68.93 109.70
166 MANCHESTERBY THE SEA
0.00 11.77 1.78 26.19 39.74 0.00 0.00 0.00 0.00 0.00 0.00 11.77 1.78 26.19 39.74
167 MANSFIELD 5.72 13.55 15.34 92.98 127.59 0.00 0.00 0.00 0.00 0.00 5.72 13.55 15.34 92.98 127.59
168 MARBLEHEAD 0.00 13.86 6.74 59.77 80.37 0.00 0.00 0.00 0.00 0.00 0.00 13.86 6.74 59.77 80.37
169 MARION 3.22 7.26 1.93 22.41 34.83 0.00 0.00 0.00 6.30 6.30 3.22 7.26 1.93 28.72 41.13
170 MARLBOROUGH
5.72 18.99 47.36 93.99 166.07 0.00 0.00 0.00 0.00 0.00 5.72 18.99 47.36 93.99 166.07
171 MARSHFIELD 0.00 24.24 18.54 124.57 167.35 0.00 0.00 0.00 0.00 0.00 0.00 24.24 18.54 124.57 167.35
172 MASHPEE 0.00 23.59 9.67 101.41 134.67 0.00 0.00 0.00 0.00 0.00 0.00 23.59 9.67 101.41 134.67
173 MATTAPOISETT
3.66 5.56 7.66 42.03 58.90 0.00 0.00 0.00 0.00 0.00 3.66 5.56 7.66 42.03 58.90
174 MAYNARD 0.00 7.83 5.50 31.38 44.71 0.00 0.00 0.00 0.00 0.00 0.00 7.83 5.50 31.38 44.71
175 MEDFIELD 0.00 16.82 3.65 59.94 80.40 0.00 0.00 0.00 0.00 0.00 0.00 16.82 3.65 59.94 80.40
176 MEDFORD 3.60 25.22 17.56 90.02 136.41 0.00 0.00 0.00 0.00 0.00 3.60 25.22 17.56 90.02 136.41
177 MEDWAY 0.35 20.91 2.55 50.18 73.99 0.00 0.00 0.00 0.00 0.00 0.35 20.91 2.55 50.18 73.99
178 MELROSE 0.00 12.34 6.99 62.63 81.96 0.00 0.00 0.00 0.00 0.00 0.00 12.34 6.99 62.63 81.96
179 MENDON 0.00 18.80 2.91 40.01 61.73 0.00 0.00 0.00 0.00 0.00 0.00 18.80 2.91 40.01 61.73
180 MERRIMAC 2.53 4.78 8.45 32.41 48.17 0.00 0.00 0.00 0.00 0.00 2.53 4.78 8.45 32.41 48.17
181 METHUEN 5.67 32.82 18.02 157.13 213.64 0.00 0.00 0.00 0.00 0.00 5.67 32.82 18.02 157.13 213.64

ROAD INVENTORY YEAR END REPORT 2020CENTERLINE MILES TABLE 6
CITY/TOWN BY FUNCTIONAL CLASSIFICATION
Massachusetts Department of TransportationOffice of Transportation Planning 37 / 109
City/Town Urban Rural Urban and Rural
No Name Interstate Arterial Collector Local Total Interstate Arterial Collector Local Total Interstate Arterial Collector Local Total
182 MIDDLEBOROUGH
14.12 44.56 16.64 115.11 190.43 0.00 0.00 4.10 15.86 19.97 14.12 44.56 20.74 130.97 210.39
183 MIDDLEFIELD 0.00 0.00 0.00 0.00 0.00 0.00 0.00 7.45 30.85 38.30 0.00 0.00 7.45 30.85 38.30
184 MIDDLETON 0.27 11.67 10.58 37.30 59.82 0.00 0.00 0.00 0.00 0.00 0.27 11.67 10.58 37.30 59.82
185 MILFORD 4.84 28.80 7.61 82.14 123.40 0.00 0.00 0.00 0.00 0.00 4.84 28.80 7.61 82.14 123.40
186 MILLBURY 3.81 15.15 11.40 52.01 82.37 0.00 0.00 0.00 2.89 2.89 3.81 15.15 11.40 54.90 85.26
187 MILLIS 0.00 16.50 2.12 33.44 52.05 0.00 0.00 0.00 0.00 0.00 0.00 16.50 2.12 33.44 52.05
188 MILLVILLE 0.00 7.05 0.00 17.78 24.84 0.00 0.00 0.00 0.00 0.00 0.00 7.05 0.00 17.78 24.84
189 MILTON 2.65 27.57 13.02 79.23 122.48 0.00 0.00 0.00 0.00 0.00 2.65 27.57 13.02 79.23 122.48
190 MONROE 0.00 0.00 0.00 0.00 0.00 0.00 0.00 8.66 9.42 18.08 0.00 0.00 8.66 9.42 18.08
191 MONSON 0.00 13.14 0.91 15.31 29.36 0.00 3.27 16.87 60.57 80.71 0.00 16.41 17.78 75.88 110.07
192 MONTAGUE 0.00 18.76 2.16 38.15 59.07 0.00 2.56 11.25 40.18 53.99 0.00 21.32 13.40 78.33 113.06
193 MONTEREY 0.00 0.00 0.00 0.00 0.00 0.00 0.00 15.06 42.97 58.03 0.00 0.00 15.06 42.97 58.03
194 MONTGOMERY 0.10 0.00 0.00 0.02 0.12 0.00 0.00 8.21 22.83 31.04 0.10 0.00 8.21 22.85 31.16
195 MOUNTWASHINGTON
0.00 0.00 0.00 0.00 0.00 0.00 0.00 4.99 12.44 17.43 0.00 0.00 4.99 12.44 17.43
196 NAHANT 0.00 6.54 0.00 12.35 18.89 0.00 0.00 0.00 0.00 0.00 0.00 6.54 0.00 12.35 18.89
197 NANTUCKET 0.00 8.15 11.18 58.71 78.05 0.00 0.00 19.86 42.77 62.64 0.00 8.15 31.05 101.48 140.68
198 NATICK 1.97 25.45 15.28 114.99 157.68 0.00 0.00 0.00 0.00 0.00 1.97 25.45 15.28 114.99 157.68
199 NEEDHAM 4.03 19.90 20.13 96.52 140.58 0.00 0.00 0.00 0.00 0.00 4.03 19.90 20.13 96.52 140.58
200 NEW ASHFORD 0.00 0.00 0.00 0.00 0.00 0.00 3.40 0.00 14.46 17.86 0.00 3.40 0.00 14.46 17.86
201 NEW BEDFORD 2.85 72.39 21.13 191.14 287.51 0.00 0.00 0.00 0.00 0.00 2.85 72.39 21.13 191.14 287.51
202 NEWBRAINTREE
0.00 0.17 0.00 0.17 0.33 0.00 0.00 19.22 31.32 50.54 0.00 0.17 19.22 31.49 50.87
203 NEWMARLBOROUGH
0.00 0.00 0.00 0.00 0.00 0.00 0.00 29.78 55.91 85.70 0.00 0.00 29.78 55.91 85.70
204 NEW SALEM 0.00 0.00 0.00 0.00 0.00 0.00 11.94 2.77 89.06 103.78 0.00 11.94 2.77 89.06 103.78
205 NEWBURY 2.27 20.44 0.08 32.56 55.35 0.42 0.00 3.99 7.77 12.18 2.70 20.44 4.06 40.33 67.53
206 NEWBURYPORT
3.17 15.80 3.27 54.52 76.77 0.00 0.00 0.00 0.00 0.00 3.17 15.80 3.27 54.52 76.77
207 NEWTON 5.91 50.03 34.68 220.85 311.47 0.00 0.00 0.00 0.00 0.00 5.91 50.03 34.68 220.85 311.47
208 NORFOLK 0.00 16.81 6.40 61.76 84.97 0.00 0.00 0.00 0.00 0.00 0.00 16.81 6.40 61.76 84.97
209 NORTH ADAMS 0.00 19.96 7.28 59.41 86.65 0.00 0.00 0.00 0.01 0.01 0.00 19.96 7.28 59.41 86.66
210 NORTHANDOVER
0.66 19.83 21.40 107.59 149.48 0.00 0.00 0.00 1.73 1.73 0.66 19.83 21.40 109.32 151.21
211 NORTHATTLEBOROUGH
6.20 18.21 18.99 101.62 145.02 0.00 0.00 0.00 0.00 0.00 6.20 18.21 18.99 101.62 145.02
212 NORTHBROOKFIELD
0.00 12.96 9.65 38.20 60.82 0.00 0.00 0.00 10.27 10.27 0.00 12.96 9.66 48.47 71.09
213 NORTHREADING
0.00 10.58 14.78 69.07 94.42 0.00 0.00 0.00 0.00 0.00 0.00 10.58 14.78 69.07 94.42
214 NORTHAMPTON
5.98 48.32 16.12 111.33 181.76 0.00 0.00 0.00 0.00 0.00 5.98 48.32 16.12 111.33 181.76
215 NORTHBOROUGH
3.48 14.00 16.63 60.25 94.36 0.00 0.00 0.00 0.00 0.00 3.48 14.00 16.63 60.25 94.36

ROAD INVENTORY YEAR END REPORT 2020CENTERLINE MILES TABLE 6
CITY/TOWN BY FUNCTIONAL CLASSIFICATION
Massachusetts Department of TransportationOffice of Transportation Planning 38 / 109
City/Town Urban Rural Urban and Rural
No Name Interstate Arterial Collector Local Total Interstate Arterial Collector Local Total Interstate Arterial Collector Local Total
216 NORTHBRIDGE 0.00 20.51 8.51 58.95 87.97 0.00 0.00 0.00 0.00 0.00 0.00 20.51 8.51 58.95 87.97
217 NORTHFIELD 0.00 0.00 0.00 0.00 0.00 0.00 10.49 16.08 56.73 83.29 0.00 10.49 16.08 56.73 83.29
218 NORTON 4.34 15.68 11.83 79.99 111.85 0.00 0.00 0.00 0.00 0.00 4.34 15.68 11.83 79.99 111.85
219 NORWELL 0.00 22.83 8.86 60.18 91.87 0.00 0.00 0.00 0.00 0.00 0.00 22.83 8.86 60.18 91.87
220 NORWOOD 1.41 16.62 18.55 75.63 112.21 0.00 0.00 0.00 0.00 0.00 1.41 16.62 18.55 75.63 112.21
221 OAK BLUFFS 0.00 6.49 4.29 34.24 45.01 0.00 0.00 0.00 0.00 0.00 0.00 6.49 4.29 34.24 45.01
222 OAKHAM 0.00 0.00 0.00 0.00 0.00 0.00 2.90 17.80 29.06 49.76 0.00 2.90 17.80 29.06 49.76
223 ORANGE 0.00 16.53 1.31 34.94 52.78 0.00 2.57 13.67 34.30 50.54 0.00 19.10 14.98 69.24 103.32
224 ORLEANS 0.00 22.13 4.85 67.23 94.21 0.00 0.00 0.00 0.00 0.00 0.00 22.13 4.85 67.23 94.21
225 OTIS 0.00 0.00 0.00 0.00 0.00 2.77 8.58 16.26 36.21 63.81 2.77 8.58 16.26 36.21 63.81
226 OXFORD 7.19 19.02 10.25 66.85 103.31 0.00 0.00 1.22 7.26 8.48 7.19 19.02 11.47 74.10 111.79
227 PALMER 7.24 30.71 7.06 49.67 94.68 0.18 1.61 9.10 12.33 23.22 7.42 32.32 16.16 62.00 117.90
228 PAXTON 0.00 12.03 0.00 18.29 30.33 0.00 0.48 4.73 11.12 16.33 0.00 12.51 4.73 29.42 46.66
229 PEABODY 3.85 27.76 12.68 134.53 178.83 0.00 0.00 0.00 0.00 0.00 3.85 27.76 12.68 134.53 178.83
230 PELHAM 0.00 2.65 0.00 1.80 4.45 0.00 5.73 8.37 27.22 41.32 0.00 8.37 8.37 29.02 45.77
231 PEMBROKE 0.00 21.69 17.93 77.67 117.28 0.00 0.00 0.00 0.00 0.00 0.00 21.69 17.93 77.67 117.28
232 PEPPERELL 0.00 25.05 0.50 42.47 68.02 0.00 0.99 2.12 16.27 19.38 0.00 26.04 2.62 58.74 87.40
233 PERU 0.00 0.00 0.00 0.00 0.00 0.00 0.00 15.60 23.06 38.66 0.00 0.00 15.60 23.06 38.66
234 PETERSHAM 0.00 0.00 0.00 0.00 0.00 0.00 12.55 14.14 52.55 79.24 0.00 12.55 14.14 52.55 79.24
235 PHILLIPSTON 0.00 0.00 0.00 0.00 0.00 0.00 2.97 20.92 29.26 53.15 0.00 2.97 20.92 29.26 53.15
236 PITTSFIELD 0.00 51.02 27.49 149.12 227.64 0.00 0.01 0.00 0.01 0.01 0.00 51.03 27.49 149.13 227.65
237 PLAINFIELD 0.00 0.00 0.00 0.00 0.00 0.00 0.00 17.64 30.47 48.10 0.00 0.00 17.64 30.47 48.10
238 PLAINVILLE 1.33 10.88 7.82 34.22 54.25 0.00 0.00 0.00 0.00 0.00 1.33 10.88 7.82 34.22 54.25
239 PLYMOUTH 0.00 58.51 55.75 384.59 498.85 0.00 0.00 0.00 0.81 0.81 0.00 58.51 55.75 385.39 499.65
240 PLYMPTON 0.00 5.38 3.38 3.78 12.53 0.00 0.00 11.63 11.39 23.02 0.00 5.38 15.01 15.17 35.55
241 PRINCETON 0.00 0.00 0.00 0.00 0.00 0.00 4.21 24.45 54.22 82.87 0.00 4.21 24.45 54.22 82.87
242 PROVINCETOWN
0.00 11.71 0.00 15.94 27.65 0.00 0.00 4.07 0.18 4.25 0.00 11.71 4.07 16.12 31.90
243 QUINCY 3.03 43.97 20.92 158.60 226.52 0.00 0.00 0.00 0.00 0.00 3.03 43.97 20.92 158.60 226.52
244 RANDOLPH 1.49 21.19 8.49 87.16 118.33 0.00 0.00 0.00 0.00 0.00 1.49 21.19 8.49 87.16 118.33
245 RAYNHAM 4.19 18.01 6.12 66.95 95.27 0.00 0.00 0.00 0.00 0.00 4.19 18.01 6.12 66.95 95.27
246 READING 2.01 17.40 6.26 77.78 103.45 0.00 0.00 0.00 0.00 0.00 2.01 17.40 6.26 77.78 103.45
247 REHOBOTH 1.38 27.52 19.39 94.85 143.14 0.00 0.00 0.00 0.00 0.00 1.38 27.52 19.39 94.85 143.14
248 REVERE 0.00 25.45 12.28 69.95 107.68 0.00 0.00 0.00 0.00 0.00 0.00 25.45 12.28 69.95 107.68
249 RICHMOND 0.00 0.00 0.00 0.96 0.96 0.00 6.10 12.46 28.13 46.69 0.00 6.10 12.46 29.09 47.65
250 ROCHESTER 0.17 14.90 2.71 9.49 27.27 0.00 0.00 7.51 40.78 48.29 0.17 14.90 10.22 50.27 75.56
251 ROCKLAND 0.00 15.40 9.55 31.46 56.40 0.00 0.00 0.00 0.00 0.00 0.00 15.40 9.55 31.46 56.40
252 ROCKPORT 0.00 9.60 0.00 31.43 41.04 0.00 0.00 0.00 0.00 0.00 0.00 9.60 0.00 31.43 41.04
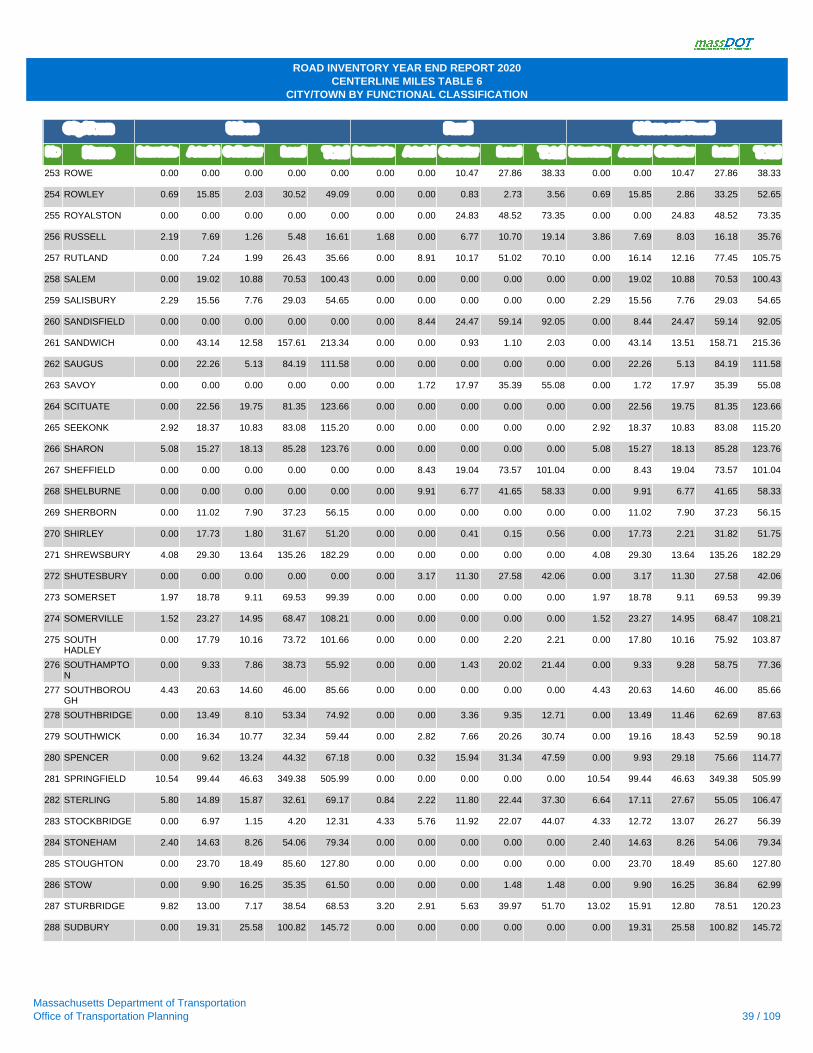
ROAD INVENTORY YEAR END REPORT 2020CENTERLINE MILES TABLE 6
CITY/TOWN BY FUNCTIONAL CLASSIFICATION
Massachusetts Department of TransportationOffice of Transportation Planning 39 / 109
City/Town Urban Rural Urban and Rural
No Name Interstate Arterial Collector Local Total Interstate Arterial Collector Local Total Interstate Arterial Collector Local Total
253 ROWE 0.00 0.00 0.00 0.00 0.00 0.00 0.00 10.47 27.86 38.33 0.00 0.00 10.47 27.86 38.33
254 ROWLEY 0.69 15.85 2.03 30.52 49.09 0.00 0.00 0.83 2.73 3.56 0.69 15.85 2.86 33.25 52.65
255 ROYALSTON 0.00 0.00 0.00 0.00 0.00 0.00 0.00 24.83 48.52 73.35 0.00 0.00 24.83 48.52 73.35
256 RUSSELL 2.19 7.69 1.26 5.48 16.61 1.68 0.00 6.77 10.70 19.14 3.86 7.69 8.03 16.18 35.76
257 RUTLAND 0.00 7.24 1.99 26.43 35.66 0.00 8.91 10.17 51.02 70.10 0.00 16.14 12.16 77.45 105.75
258 SALEM 0.00 19.02 10.88 70.53 100.43 0.00 0.00 0.00 0.00 0.00 0.00 19.02 10.88 70.53 100.43
259 SALISBURY 2.29 15.56 7.76 29.03 54.65 0.00 0.00 0.00 0.00 0.00 2.29 15.56 7.76 29.03 54.65
260 SANDISFIELD 0.00 0.00 0.00 0.00 0.00 0.00 8.44 24.47 59.14 92.05 0.00 8.44 24.47 59.14 92.05
261 SANDWICH 0.00 43.14 12.58 157.61 213.34 0.00 0.00 0.93 1.10 2.03 0.00 43.14 13.51 158.71 215.36
262 SAUGUS 0.00 22.26 5.13 84.19 111.58 0.00 0.00 0.00 0.00 0.00 0.00 22.26 5.13 84.19 111.58
263 SAVOY 0.00 0.00 0.00 0.00 0.00 0.00 1.72 17.97 35.39 55.08 0.00 1.72 17.97 35.39 55.08
264 SCITUATE 0.00 22.56 19.75 81.35 123.66 0.00 0.00 0.00 0.00 0.00 0.00 22.56 19.75 81.35 123.66
265 SEEKONK 2.92 18.37 10.83 83.08 115.20 0.00 0.00 0.00 0.00 0.00 2.92 18.37 10.83 83.08 115.20
266 SHARON 5.08 15.27 18.13 85.28 123.76 0.00 0.00 0.00 0.00 0.00 5.08 15.27 18.13 85.28 123.76
267 SHEFFIELD 0.00 0.00 0.00 0.00 0.00 0.00 8.43 19.04 73.57 101.04 0.00 8.43 19.04 73.57 101.04
268 SHELBURNE 0.00 0.00 0.00 0.00 0.00 0.00 9.91 6.77 41.65 58.33 0.00 9.91 6.77 41.65 58.33
269 SHERBORN 0.00 11.02 7.90 37.23 56.15 0.00 0.00 0.00 0.00 0.00 0.00 11.02 7.90 37.23 56.15
270 SHIRLEY 0.00 17.73 1.80 31.67 51.20 0.00 0.00 0.41 0.15 0.56 0.00 17.73 2.21 31.82 51.75
271 SHREWSBURY 4.08 29.30 13.64 135.26 182.29 0.00 0.00 0.00 0.00 0.00 4.08 29.30 13.64 135.26 182.29
272 SHUTESBURY 0.00 0.00 0.00 0.00 0.00 0.00 3.17 11.30 27.58 42.06 0.00 3.17 11.30 27.58 42.06
273 SOMERSET 1.97 18.78 9.11 69.53 99.39 0.00 0.00 0.00 0.00 0.00 1.97 18.78 9.11 69.53 99.39
274 SOMERVILLE 1.52 23.27 14.95 68.47 108.21 0.00 0.00 0.00 0.00 0.00 1.52 23.27 14.95 68.47 108.21
275 SOUTHHADLEY
0.00 17.79 10.16 73.72 101.66 0.00 0.00 0.00 2.20 2.21 0.00 17.80 10.16 75.92 103.87
276 SOUTHAMPTON
0.00 9.33 7.86 38.73 55.92 0.00 0.00 1.43 20.02 21.44 0.00 9.33 9.28 58.75 77.36
277 SOUTHBOROUGH
4.43 20.63 14.60 46.00 85.66 0.00 0.00 0.00 0.00 0.00 4.43 20.63 14.60 46.00 85.66
278 SOUTHBRIDGE 0.00 13.49 8.10 53.34 74.92 0.00 0.00 3.36 9.35 12.71 0.00 13.49 11.46 62.69 87.63
279 SOUTHWICK 0.00 16.34 10.77 32.34 59.44 0.00 2.82 7.66 20.26 30.74 0.00 19.16 18.43 52.59 90.18
280 SPENCER 0.00 9.62 13.24 44.32 67.18 0.00 0.32 15.94 31.34 47.59 0.00 9.93 29.18 75.66 114.77
281 SPRINGFIELD 10.54 99.44 46.63 349.38 505.99 0.00 0.00 0.00 0.00 0.00 10.54 99.44 46.63 349.38 505.99
282 STERLING 5.80 14.89 15.87 32.61 69.17 0.84 2.22 11.80 22.44 37.30 6.64 17.11 27.67 55.05 106.47
283 STOCKBRIDGE 0.00 6.97 1.15 4.20 12.31 4.33 5.76 11.92 22.07 44.07 4.33 12.72 13.07 26.27 56.39
284 STONEHAM 2.40 14.63 8.26 54.06 79.34 0.00 0.00 0.00 0.00 0.00 2.40 14.63 8.26 54.06 79.34
285 STOUGHTON 0.00 23.70 18.49 85.60 127.80 0.00 0.00 0.00 0.00 0.00 0.00 23.70 18.49 85.60 127.80
286 STOW 0.00 9.90 16.25 35.35 61.50 0.00 0.00 0.00 1.48 1.48 0.00 9.90 16.25 36.84 62.99
287 STURBRIDGE 9.82 13.00 7.17 38.54 68.53 3.20 2.91 5.63 39.97 51.70 13.02 15.91 12.80 78.51 120.23
288 SUDBURY 0.00 19.31 25.58 100.82 145.72 0.00 0.00 0.00 0.00 0.00 0.00 19.31 25.58 100.82 145.72

ROAD INVENTORY YEAR END REPORT 2020CENTERLINE MILES TABLE 6
CITY/TOWN BY FUNCTIONAL CLASSIFICATION
Massachusetts Department of TransportationOffice of Transportation Planning 40 / 109
City/Town Urban Rural Urban and Rural
No Name Interstate Arterial Collector Local Total Interstate Arterial Collector Local Total Interstate Arterial Collector Local Total
289 SUNDERLAND 0.00 9.45 2.46 15.96 27.87 0.00 1.90 1.86 13.54 17.30 0.00 11.35 4.32 29.50 45.17
290 SUTTON 0.00 24.92 8.71 56.58 90.20 0.00 0.00 1.77 20.34 22.11 0.00 24.92 10.47 76.93 112.32
291 SWAMPSCOTT 0.00 7.04 6.12 33.79 46.94 0.00 0.00 0.00 0.00 0.00 0.00 7.04 6.12 33.79 46.94
292 SWANSEA 5.33 21.51 11.85 85.32 124.02 0.00 0.00 0.00 0.00 0.00 5.33 21.51 11.85 85.32 124.02
293 TAUNTON 2.53 42.57 28.19 196.85 270.14 0.00 0.00 0.00 0.00 0.00 2.53 42.57 28.19 196.85 270.14
294 TEMPLETON 0.00 17.06 8.82 46.36 72.24 0.00 2.60 12.35 17.60 32.56 0.00 19.66 21.17 63.97 104.80
295 TEWKSBURY 3.44 26.59 21.87 114.57 166.47 0.00 0.00 0.00 0.00 0.00 3.44 26.59 21.87 114.57 166.47
296 TISBURY 0.00 8.42 0.00 16.07 24.49 0.00 0.00 2.43 0.00 2.43 0.00 8.42 2.43 16.07 26.92
297 TOLLAND 0.00 0.00 0.00 0.00 0.00 0.00 5.72 5.29 30.39 41.39 0.00 5.72 5.29 30.39 41.39
298 TOPSFIELD 1.43 15.53 5.18 39.03 61.17 0.00 0.00 0.00 0.00 0.00 1.43 15.53 5.18 39.03 61.17
299 TOWNSEND 0.00 17.15 5.52 46.92 69.60 0.00 2.67 0.34 21.65 24.66 0.00 19.83 5.85 68.57 94.25
300 TRURO 0.00 15.67 0.16 13.93 29.76 0.00 4.23 2.28 25.96 32.46 0.00 19.89 2.45 39.89 62.23
301 TYNGSBOROUGH
0.00 25.26 5.54 64.31 95.11 0.00 0.00 0.00 0.05 0.05 0.00 25.26 5.54 64.36 95.16
302 TYRINGHAM 0.00 0.00 0.00 0.00 0.00 0.00 0.00 7.78 19.50 27.28 0.00 0.00 7.78 19.50 27.28
303 UPTON 1.28 17.83 4.87 56.97 80.96 0.00 0.00 0.00 0.00 0.00 1.28 17.83 4.87 56.97 80.96
304 UXBRIDGE 0.00 30.04 4.79 62.24 97.06 0.00 0.00 4.88 21.71 26.59 0.00 30.04 9.67 83.95 123.65
305 WAKEFIELD 4.74 19.51 6.62 74.68 105.56 0.00 0.00 0.00 0.00 0.00 4.74 19.51 6.62 74.68 105.56
306 WALES 0.00 0.31 0.00 0.00 0.31 0.00 0.00 12.53 15.63 28.16 0.00 0.31 12.53 15.63 28.47
307 WALPOLE 0.77 25.96 23.95 88.19 138.87 0.00 0.00 0.00 0.00 0.00 0.77 25.96 23.95 88.19 138.87
308 WALTHAM 4.16 28.64 22.15 107.15 162.10 0.00 0.00 0.00 0.00 0.00 4.16 28.64 22.15 107.15 162.10
309 WARE 0.00 13.77 8.97 39.49 62.24 0.00 4.80 5.53 44.30 54.63 0.00 18.58 14.50 83.79 116.87
310 WAREHAM 5.56 33.60 8.56 139.75 187.47 0.00 0.00 0.00 0.00 0.00 5.56 33.60 8.56 139.75 187.47
311 WARREN 0.00 6.28 0.19 16.91 23.38 4.71 0.00 11.57 34.29 50.56 4.71 6.28 11.75 51.20 73.94
312 WARWICK 0.00 0.00 0.00 0.00 0.00 0.00 0.00 23.21 40.45 63.66 0.00 0.00 23.21 40.45 63.66
313 WASHINGTON 0.00 0.00 0.00 0.00 0.00 0.00 4.43 8.32 38.75 51.51 0.00 4.43 8.32 38.75 51.51
314 WATERTOWN 0.00 10.46 11.51 57.04 79.02 0.00 0.00 0.00 0.00 0.00 0.00 10.46 11.51 57.04 79.02
315 WAYLAND 1.06 17.38 9.29 68.77 96.49 0.00 0.00 0.00 0.00 0.00 1.06 17.38 9.29 68.77 96.49
316 WEBSTER 4.03 11.16 10.78 59.19 85.17 0.00 0.00 0.00 0.00 0.00 4.03 11.16 10.78 59.19 85.17
317 WELLESLEY 1.08 19.51 11.73 99.61 131.93 0.00 0.00 0.00 0.00 0.00 1.08 19.51 11.73 99.61 131.93
318 WELLFLEET 0.00 6.09 3.60 16.46 26.15 0.00 2.16 15.09 28.74 45.98 0.00 8.25 18.69 45.19 72.13
319 WENDELL 0.00 0.00 0.00 0.00 0.00 0.00 0.31 18.89 48.69 67.89 0.00 0.31 18.89 48.69 67.89
320 WENHAM 0.00 17.20 0.00 16.06 33.26 0.00 0.00 0.00 0.00 0.00 0.00 17.20 0.00 16.06 33.26
321 WESTBOYLSTON
2.84 14.56 8.29 37.00 62.69 0.00 0.00 0.00 0.61 0.61 2.84 14.56 8.30 37.60 63.30
322 WESTBRIDGEWATER
0.00 23.80 5.69 30.31 59.80 0.00 0.00 0.00 0.00 0.00 0.00 23.80 5.69 30.31 59.80
323 WESTBROOKFIELD
0.00 4.79 3.11 14.04 21.94 0.00 3.45 4.18 36.73 44.36 0.00 8.24 7.29 50.77 66.30
324 WESTNEWBURY
0.00 18.02 0.47 25.17 43.66 0.67 0.00 0.26 7.69 8.63 0.67 18.02 0.74 32.86 52.29

ROAD INVENTORY YEAR END REPORT 2020CENTERLINE MILES TABLE 6
CITY/TOWN BY FUNCTIONAL CLASSIFICATION
Massachusetts Department of TransportationOffice of Transportation Planning 41 / 109
City/Town Urban Rural Urban and Rural
No Name Interstate Arterial Collector Local Total Interstate Arterial Collector Local Total Interstate Arterial Collector Local Total
325 WESTSPRINGFIELD
6.21 30.32 8.88 101.05 146.46 0.00 0.00 0.00 0.00 0.00 6.21 30.32 8.88 101.05 146.46
326 WESTSTOCKBRIDGE
0.00 0.48 0.00 1.36 1.84 3.49 5.22 12.94 21.01 42.66 3.49 5.70 12.94 22.37 44.50
327 WEST TISBURY 0.00 0.79 0.00 0.33 1.12 0.00 0.00 14.10 9.74 23.85 0.00 0.79 14.10 10.08 24.97
328 WESTBOROUGH
4.39 25.03 9.20 73.51 112.12 0.00 0.00 0.00 0.00 0.00 4.39 25.03 9.20 73.51 112.12
329 WESTFIELD 6.62 46.80 20.04 176.05 249.51 0.00 0.00 0.01 0.00 0.01 6.62 46.80 20.05 176.05 249.52
330 WESTFORD 4.28 41.99 9.61 114.38 170.26 0.00 0.00 0.00 0.00 0.00 4.28 41.99 9.61 114.38 170.26
331 WESTHAMPTON
0.00 0.20 0.00 0.00 0.20 0.00 0.00 22.03 25.08 47.11 0.00 0.20 22.03 25.08 47.31
332 WESTMINSTER 0.00 31.93 11.24 65.17 108.35 0.00 0.00 1.01 1.00 2.02 0.00 31.93 12.25 66.18 110.36
333 WESTON 5.64 16.06 23.39 66.11 111.19 0.00 0.00 0.00 0.00 0.00 5.64 16.06 23.39 66.11 111.19
334 WESTPORT 3.68 27.50 11.01 77.59 119.78 0.00 0.00 12.09 30.55 42.64 3.68 27.50 23.10 108.14 162.42
335 WESTWOOD 1.16 11.67 15.49 60.90 89.22 0.00 0.00 0.00 0.00 0.00 1.16 11.67 15.49 60.90 89.22
336 WEYMOUTH 0.00 38.88 17.74 127.38 184.00 0.00 0.00 0.00 0.00 0.00 0.00 38.88 17.74 127.38 184.00
337 WHATELY 0.25 0.71 0.00 0.85 1.81 3.62 0.00 19.14 23.40 46.16 3.87 0.71 19.14 24.25 47.97
338 WHITMAN 0.00 14.28 5.34 34.89 54.50 0.00 0.00 0.00 0.00 0.00 0.00 14.28 5.34 34.89 54.50
339 WILBRAHAM 1.05 20.47 12.37 68.18 102.07 0.00 0.00 4.60 6.76 11.36 1.05 20.47 16.97 74.94 113.43
340 WILLIAMSBURG
0.00 2.73 0.00 3.28 6.01 0.00 6.99 12.90 25.02 44.90 0.00 9.72 12.90 28.30 50.91
341 WILLIAMSTOWN
0.00 13.47 0.45 29.03 42.95 0.00 8.77 4.76 20.86 34.39 0.00 22.24 5.21 49.89 77.33
342 WILMINGTON 4.99 19.43 17.07 86.90 128.38 0.00 0.00 0.00 0.00 0.00 4.99 19.43 17.07 86.90 128.38
343 WINCHENDON 0.00 21.51 10.15 85.99 117.65 0.00 0.00 0.00 0.00 0.00 0.00 21.51 10.16 85.99 117.66
344 WINCHESTER 0.06 15.40 10.81 65.12 91.38 0.00 0.00 0.00 0.00 0.00 0.06 15.40 10.81 65.12 91.38
345 WINDSOR 0.00 0.00 0.00 0.00 0.00 0.00 8.10 10.17 57.66 75.93 0.00 8.10 10.17 57.66 75.93
346 WINTHROP 0.00 6.96 7.17 25.77 39.91 0.00 0.00 0.00 0.00 0.00 0.00 6.96 7.17 25.77 39.91
347 WOBURN 4.40 20.99 21.40 106.41 153.21 0.00 0.00 0.00 0.00 0.00 4.40 20.99 21.40 106.41 153.21
348 WORCESTER 11.16 101.04 32.28 391.37 535.86 0.00 0.00 0.01 0.00 0.01 11.16 101.04 32.29 391.37 535.87
349 WORTHINGTON
0.00 0.00 0.00 0.00 0.00 0.00 10.27 10.60 44.02 64.89 0.00 10.27 10.60 44.02 64.89
350 WRENTHAM 3.67 26.61 4.07 61.60 95.96 0.00 0.00 0.00 0.00 0.00 3.67 26.61 4.07 61.60 95.96
351 YARMOUTH 0.00 49.74 16.60 193.82 260.16 0.00 0.00 0.00 0.00 0.00 0.00 49.74 16.60 193.82 260.16
Total 505.28 6,328.45 3,070.89 20,723.17 30,627.79 62.61 429.32 1,482.98 4,212.97 6,187.89 567.89 6,757.78 4,553.87 24,936.14 36,815.68

ROAD INVENTORY YEAR END REPORT 2020CENTERLINE MILES TABLE 7
CITY/TOWN BY FEDERAL AID CATEGORY
Massachusetts Department of TransportationOffice of Transportation Planning 42 / 109
City Town
No Name National HighwaySystem
SurfaceTransportation
Program
Total Federal Aid State & Local Aid Grand Total
1 ABINGTON 7.12 18.63 25.75 41.88 67.63
2 ACTON 15.92 26.73 42.64 84.90 127.54
3 ACUSHNET 0.00 21.45 21.45 47.67 69.12
4 ADAMS 4.80 12.86 17.66 59.20 76.86
5 AGAWAM 12.49 44.42 56.91 103.21 160.12
6 ALFORD 0.00 1.49 1.49 16.11 17.60
7 AMESBURY 6.87 25.89 32.76 48.22 80.98
8 AMHERST 14.81 33.83 48.65 89.32 137.97
9 ANDOVER 28.41 49.42 77.84 150.59 228.42
10 ARLINGTON 8.72 20.90 29.62 91.99 121.61
11 ASHBURNHAM 9.60 10.70 20.29 77.30 97.60
12 ASHBY 6.69 7.52 14.21 50.04 64.24
13 ASHFIELD 0.00 18.79 18.79 64.62 83.41
14 ASHLAND 5.34 17.02 22.36 62.55 84.91
15 ATHOL 13.10 19.31 32.41 82.41 114.82
16 ATTLEBORO 20.38 29.52 49.90 155.57 205.47
17 AUBURN 15.23 31.52 46.76 71.70 118.46
18 AVON 3.33 11.21 14.54 19.95 34.49
19 AYER 6.96 9.75 16.70 36.82 53.53
20 BARNSTABLE 32.29 111.50 143.79 308.78 452.56
21 BARRE 12.48 13.92 26.40 90.83 117.23
22 BECKET 25.11 0.13 25.24 60.07 85.30
23 BEDFORD 2.42 25.23 27.65 58.10 85.75
24 BELCHERTOWN 23.69 22.00 45.68 117.73 163.41
25 BELLINGHAM 14.69 20.48 35.17 66.14 101.31
26 BELMONT 7.43 15.06 22.49 62.24 84.73
27 BERKLEY 8.57 6.32 14.89 48.34 63.23
28 BERLIN 6.22 9.68 15.91 28.55 44.46
29 BERNARDSTON 8.92 5.99 14.92 42.06 56.98
30 BEVERLY 10.11 38.21 48.32 105.09 153.41
31 BILLERICA 13.93 52.23 66.16 167.54 233.71
32 BLACKSTONE 0.06 16.76 16.82 30.30 47.12
33 BLANDFORD 8.37 23.22 31.59 54.80 86.39
34 BOLTON 12.76 8.13 20.90 45.34 66.24
35 BOSTON 154.82 181.03 335.86 600.55 936.41

ROAD INVENTORY YEAR END REPORT 2020CENTERLINE MILES TABLE 7
CITY/TOWN BY FEDERAL AID CATEGORY
Massachusetts Department of TransportationOffice of Transportation Planning 43 / 109
City Town
No Name National HighwaySystem
SurfaceTransportation
Program
Total Federal Aid State & Local Aid Grand Total
36 BOURNE 19.88 49.73 69.62 120.32 189.94
37 BOXBOROUGH 3.70 7.87 11.57 29.78 41.34
38 BOXFORD 6.24 21.19 27.43 72.95 100.38
39 BOYLSTON 0.65 15.92 16.57 35.15 51.72
40 BRAINTREE 15.41 31.85 47.26 95.49 142.75
41 BREWSTER 13.33 25.75 39.07 123.27 162.34
42 BRIDGEWATER 11.69 32.95 44.64 90.93 135.57
43 BRIMFIELD 11.74 15.39 27.12 51.85 78.97
44 BROCKTON 25.76 60.20 85.96 205.25 291.21
45 BROOKFIELD 2.39 11.16 13.55 26.29 39.84
46 BROOKLINE 9.91 36.15 46.06 61.09 107.15
47 BUCKLAND 0.63 13.57 14.20 35.87 50.07
48 BURLINGTON 8.23 32.01 40.23 77.39 117.62
49 CAMBRIDGE 27.20 32.46 59.66 82.58 142.24
50 CANTON 17.89 16.54 34.43 81.73 116.16
51 CARLISLE 0.05 16.01 16.06 39.29 55.36
52 CARVER 7.36 20.92 28.28 76.40 104.68
53 CHARLEMONT 12.09 13.19 25.28 31.77 57.05
54 CHARLTON 18.35 26.57 44.92 112.02 156.94
55 CHATHAM 9.90 10.08 19.98 102.85 122.83
56 CHELMSFORD 19.84 40.92 60.76 143.33 204.09
57 CHELSEA 5.48 17.22 22.70 27.01 49.72
58 CHESHIRE 6.42 8.81 15.23 42.91 58.14
59 CHESTER 6.41 1.61 8.03 59.16 67.19
60 CHESTERFIELD 7.79 9.31 17.10 41.20 58.30
61 CHICOPEE 22.75 44.45 67.21 195.42 262.63
62 CHILMARK 0.00 7.77 7.77 14.11 21.88
63 CLARKSBURG 0.11 4.38 4.49 15.73 20.22
64 CLINTON 4.96 13.11 18.08 35.16 53.24
65 COHASSET 3.12 19.57 22.69 27.21 49.90
66 COLRAIN 7.89 9.58 17.47 70.34 87.81
67 CONCORD 12.38 28.84 41.22 88.72 129.95
68 CONWAY 0.00 19.24 19.24 51.67 70.91
69 CUMMINGTON 12.90 7.89 20.79 40.33 61.12
70 DALTON 6.63 10.95 17.58 30.17 47.75
71 DANVERS 15.74 31.35 47.09 80.36 127.45

ROAD INVENTORY YEAR END REPORT 2020CENTERLINE MILES TABLE 7
CITY/TOWN BY FEDERAL AID CATEGORY
Massachusetts Department of TransportationOffice of Transportation Planning 44 / 109
City Town
No Name National HighwaySystem
SurfaceTransportation
Program
Total Federal Aid State & Local Aid Grand Total
72 DARTMOUTH 7.09 66.91 74.01 151.45 225.46
73 DEDHAM 15.54 20.50 36.04 73.82 109.86
74 DEERFIELD 9.48 16.19 25.67 75.06 100.72
75 DENNIS 11.51 42.76 54.27 155.83 210.09
76 DIGHTON 6.79 12.75 19.54 48.59 68.13
77 DOUGLAS 0.27 29.09 29.36 54.42 83.79
78 DOVER 0.65 21.22 21.88 40.24 62.11
79 DRACUT 5.51 33.03 38.54 121.65 160.19
80 DUDLEY 2.55 27.28 29.84 61.15 90.99
81 DUNSTABLE 4.78 5.51 10.29 32.24 42.54
82 DUXBURY 13.35 29.16 42.51 86.27 128.78
83 EAST BRIDGEWATER 4.37 30.04 34.40 45.44 79.84
84 EAST BROOKFIELD 5.78 6.56 12.35 15.22 27.56
85 EAST LONGMEADOW 5.56 25.32 30.88 70.02 100.90
86 EASTHAM 6.40 19.32 25.71 78.10 103.81
87 EASTHAMPTON 4.82 26.28 31.10 61.44 92.54
88 EASTON 11.31 33.00 44.31 88.57 132.89
89 EDGARTOWN 2.92 10.92 13.84 39.96 53.80
90 EGREMONT 4.10 11.29 15.39 28.05 43.44
91 ERVING 11.67 3.86 15.53 22.84 38.37
92 ESSEX 0.17 9.15 9.32 20.24 29.56
93 EVERETT 5.56 17.45 23.01 42.33 65.34
94 FAIRHAVEN 6.20 21.40 27.60 81.16 108.76
95 FALL RIVER 18.73 58.90 77.62 195.24 272.87
96 FALMOUTH 33.17 75.54 108.71 240.17 348.89
97 FITCHBURG 18.45 47.13 65.59 137.01 202.60
98 FLORIDA 7.16 0.00 7.16 40.33 47.50
99 FOXBOROUGH 10.54 28.63 39.17 73.27 112.43
100 FRAMINGHAM 19.29 68.71 88.00 153.59 241.59
101 FRANKLIN 10.45 29.70 40.15 131.12 171.27
102 FREETOWN 11.11 26.82 37.93 70.29 108.22
103 GARDNER 10.89 30.72 41.61 75.53 117.14
104 AQUINNAH 0.00 3.45 3.45 10.03 13.49
105 GEORGETOWN 8.84 11.57 20.41 44.19 64.60
106 GILL 3.77 6.85 10.62 29.79 40.41
107 GLOUCESTER 10.02 28.87 38.88 127.90 166.78
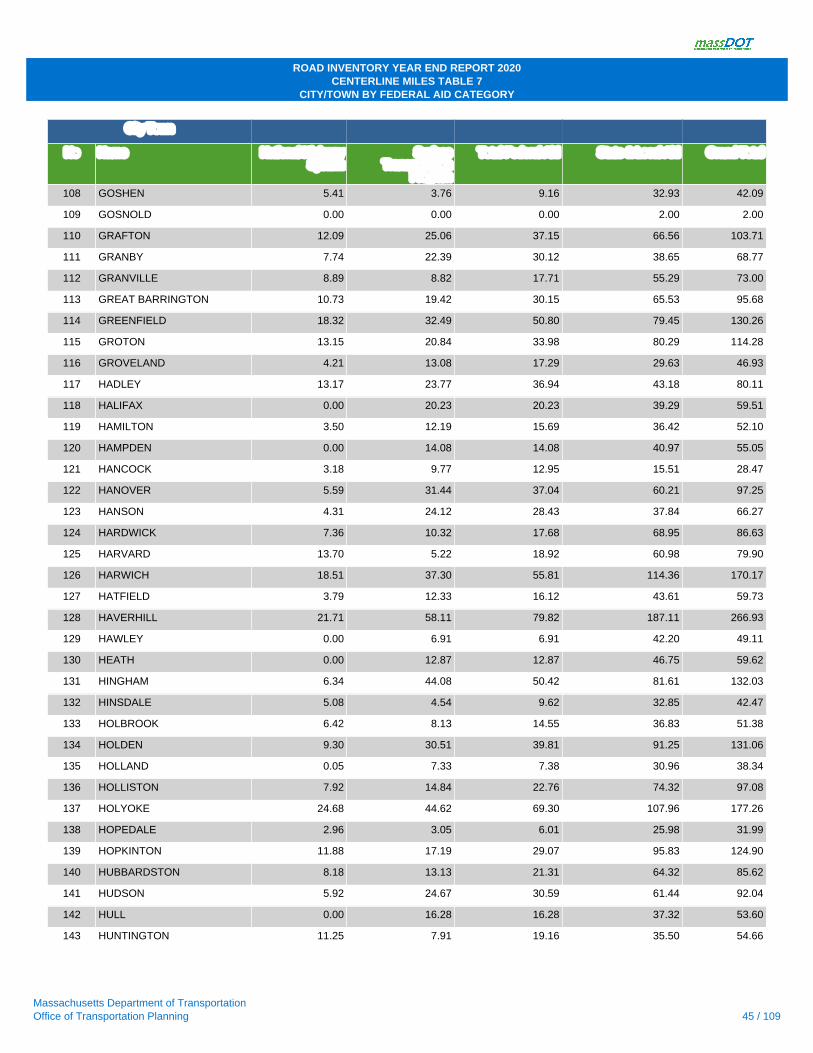
ROAD INVENTORY YEAR END REPORT 2020CENTERLINE MILES TABLE 7
CITY/TOWN BY FEDERAL AID CATEGORY
Massachusetts Department of TransportationOffice of Transportation Planning 45 / 109
City Town
No Name National HighwaySystem
SurfaceTransportation
Program
Total Federal Aid State & Local Aid Grand Total
108 GOSHEN 5.41 3.76 9.16 32.93 42.09
109 GOSNOLD 0.00 0.00 0.00 2.00 2.00
110 GRAFTON 12.09 25.06 37.15 66.56 103.71
111 GRANBY 7.74 22.39 30.12 38.65 68.77
112 GRANVILLE 8.89 8.82 17.71 55.29 73.00
113 GREAT BARRINGTON 10.73 19.42 30.15 65.53 95.68
114 GREENFIELD 18.32 32.49 50.80 79.45 130.26
115 GROTON 13.15 20.84 33.98 80.29 114.28
116 GROVELAND 4.21 13.08 17.29 29.63 46.93
117 HADLEY 13.17 23.77 36.94 43.18 80.11
118 HALIFAX 0.00 20.23 20.23 39.29 59.51
119 HAMILTON 3.50 12.19 15.69 36.42 52.10
120 HAMPDEN 0.00 14.08 14.08 40.97 55.05
121 HANCOCK 3.18 9.77 12.95 15.51 28.47
122 HANOVER 5.59 31.44 37.04 60.21 97.25
123 HANSON 4.31 24.12 28.43 37.84 66.27
124 HARDWICK 7.36 10.32 17.68 68.95 86.63
125 HARVARD 13.70 5.22 18.92 60.98 79.90
126 HARWICH 18.51 37.30 55.81 114.36 170.17
127 HATFIELD 3.79 12.33 16.12 43.61 59.73
128 HAVERHILL 21.71 58.11 79.82 187.11 266.93
129 HAWLEY 0.00 6.91 6.91 42.20 49.11
130 HEATH 0.00 12.87 12.87 46.75 59.62
131 HINGHAM 6.34 44.08 50.42 81.61 132.03
132 HINSDALE 5.08 4.54 9.62 32.85 42.47
133 HOLBROOK 6.42 8.13 14.55 36.83 51.38
134 HOLDEN 9.30 30.51 39.81 91.25 131.06
135 HOLLAND 0.05 7.33 7.38 30.96 38.34
136 HOLLISTON 7.92 14.84 22.76 74.32 97.08
137 HOLYOKE 24.68 44.62 69.30 107.96 177.26
138 HOPEDALE 2.96 3.05 6.01 25.98 31.99
139 HOPKINTON 11.88 17.19 29.07 95.83 124.90
140 HUBBARDSTON 8.18 13.13 21.31 64.32 85.62
141 HUDSON 5.92 24.67 30.59 61.44 92.04
142 HULL 0.00 16.28 16.28 37.32 53.60
143 HUNTINGTON 11.25 7.91 19.16 35.50 54.66

ROAD INVENTORY YEAR END REPORT 2020CENTERLINE MILES TABLE 7
CITY/TOWN BY FEDERAL AID CATEGORY
Massachusetts Department of TransportationOffice of Transportation Planning 46 / 109
City Town
No Name National HighwaySystem
SurfaceTransportation
Program
Total Federal Aid State & Local Aid Grand Total
144 IPSWICH 7.40 22.58 29.98 67.59 97.57
145 KINGSTON 11.09 26.93 38.02 69.01 107.03
146 LAKEVILLE 5.62 29.93 35.55 84.85 120.41
147 LANCASTER 14.29 17.15 31.44 43.61 75.05
148 LANESBOROUGH 9.09 10.72 19.80 44.62 64.42
149 LAWRENCE 8.39 32.94 41.33 98.47 139.79
150 LEE 18.04 14.07 32.11 40.62 72.73
151 LEICESTER 5.24 23.68 28.92 66.22 95.14
152 LENOX 7.72 13.49 21.21 42.33 63.54
153 LEOMINSTER 19.28 42.64 61.92 121.12 183.05
154 LEVERETT 5.46 16.76 22.22 19.81 42.03
155 LEXINGTON 20.98 38.93 59.90 103.08 162.98
156 LEYDEN 0.00 0.00 0.00 37.78 37.78
157 LINCOLN 8.60 15.42 24.03 37.17 61.20
158 LITTLETON 16.63 18.66 35.29 51.50 86.79
159 LONGMEADOW 6.51 15.96 22.47 78.37 100.85
160 LOWELL 25.60 56.96 82.56 161.40 243.97
161 LUDLOW 6.77 35.51 42.29 95.22 137.51
162 LUNENBURG 10.26 23.59 33.85 58.41 92.26
163 LYNN 17.01 32.86 49.87 125.98 175.85
164 LYNNFIELD 4.60 16.08 20.69 55.71 76.40
165 MALDEN 8.98 31.79 40.77 68.93 109.70
166 MANCHESTER BY THE SEA 3.60 9.95 13.55 26.19 39.74
167 MANSFIELD 12.21 23.06 35.27 92.32 127.59
168 MARBLEHEAD 6.10 14.50 20.60 59.77 80.37
169 MARION 3.22 9.19 12.41 28.72 41.13
170 MARLBOROUGH 15.99 56.09 72.07 93.99 166.07
171 MARSHFIELD 10.60 32.18 42.78 124.57 167.35
172 MASHPEE 10.92 22.33 33.25 101.41 134.67
173 MATTAPOISETT 3.66 13.22 16.88 42.03 58.90
174 MAYNARD 6.33 7.00 13.33 31.38 44.71
175 MEDFIELD 8.69 11.78 20.47 59.94 80.40
176 MEDFORD 14.55 31.83 46.38 90.02 136.41
177 MEDWAY 8.67 15.14 23.81 50.18 73.99
178 MELROSE 4.44 14.89 19.33 62.63 81.96
179 MENDON 4.44 17.27 21.71 40.01 61.73
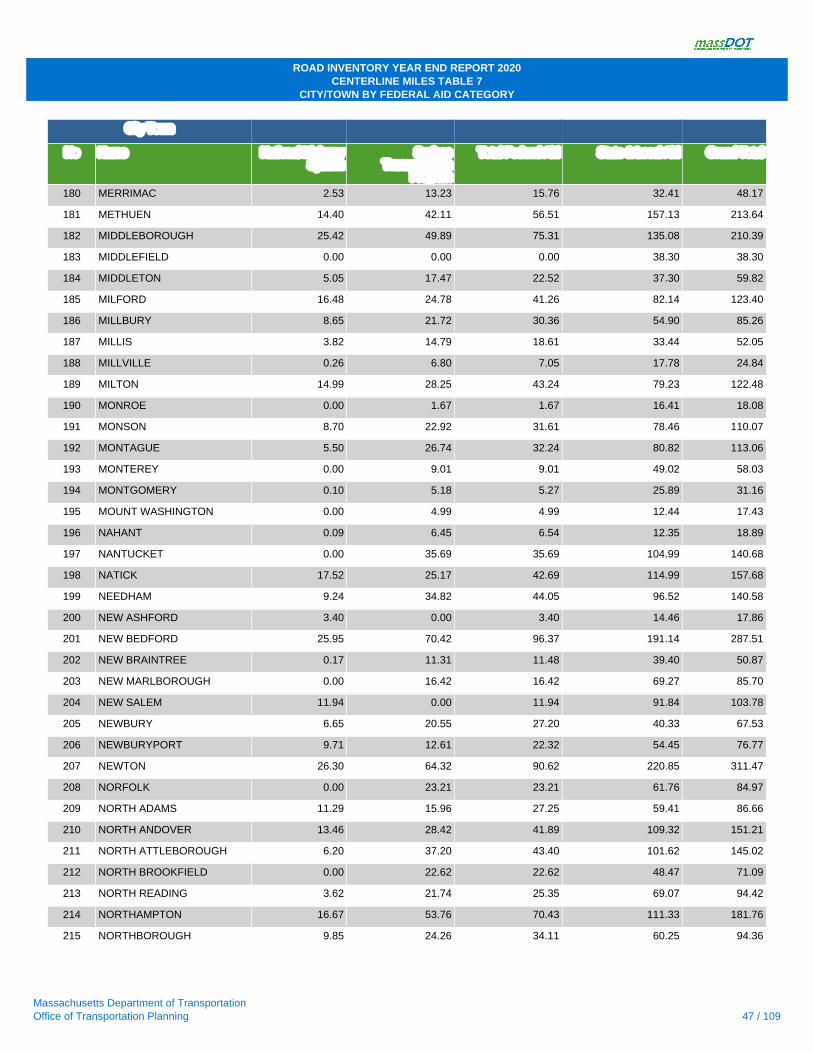
ROAD INVENTORY YEAR END REPORT 2020CENTERLINE MILES TABLE 7
CITY/TOWN BY FEDERAL AID CATEGORY
Massachusetts Department of TransportationOffice of Transportation Planning 47 / 109
City Town
No Name National HighwaySystem
SurfaceTransportation
Program
Total Federal Aid State & Local Aid Grand Total
180 MERRIMAC 2.53 13.23 15.76 32.41 48.17
181 METHUEN 14.40 42.11 56.51 157.13 213.64
182 MIDDLEBOROUGH 25.42 49.89 75.31 135.08 210.39
183 MIDDLEFIELD 0.00 0.00 0.00 38.30 38.30
184 MIDDLETON 5.05 17.47 22.52 37.30 59.82
185 MILFORD 16.48 24.78 41.26 82.14 123.40
186 MILLBURY 8.65 21.72 30.36 54.90 85.26
187 MILLIS 3.82 14.79 18.61 33.44 52.05
188 MILLVILLE 0.26 6.80 7.05 17.78 24.84
189 MILTON 14.99 28.25 43.24 79.23 122.48
190 MONROE 0.00 1.67 1.67 16.41 18.08
191 MONSON 8.70 22.92 31.61 78.46 110.07
192 MONTAGUE 5.50 26.74 32.24 80.82 113.06
193 MONTEREY 0.00 9.01 9.01 49.02 58.03
194 MONTGOMERY 0.10 5.18 5.27 25.89 31.16
195 MOUNT WASHINGTON 0.00 4.99 4.99 12.44 17.43
196 NAHANT 0.09 6.45 6.54 12.35 18.89
197 NANTUCKET 0.00 35.69 35.69 104.99 140.68
198 NATICK 17.52 25.17 42.69 114.99 157.68
199 NEEDHAM 9.24 34.82 44.05 96.52 140.58
200 NEW ASHFORD 3.40 0.00 3.40 14.46 17.86
201 NEW BEDFORD 25.95 70.42 96.37 191.14 287.51
202 NEW BRAINTREE 0.17 11.31 11.48 39.40 50.87
203 NEW MARLBOROUGH 0.00 16.42 16.42 69.27 85.70
204 NEW SALEM 11.94 0.00 11.94 91.84 103.78
205 NEWBURY 6.65 20.55 27.20 40.33 67.53
206 NEWBURYPORT 9.71 12.61 22.32 54.45 76.77
207 NEWTON 26.30 64.32 90.62 220.85 311.47
208 NORFOLK 0.00 23.21 23.21 61.76 84.97
209 NORTH ADAMS 11.29 15.96 27.25 59.41 86.66
210 NORTH ANDOVER 13.46 28.42 41.89 109.32 151.21
211 NORTH ATTLEBOROUGH 6.20 37.20 43.40 101.62 145.02
212 NORTH BROOKFIELD 0.00 22.62 22.62 48.47 71.09
213 NORTH READING 3.62 21.74 25.35 69.07 94.42
214 NORTHAMPTON 16.67 53.76 70.43 111.33 181.76
215 NORTHBOROUGH 9.85 24.26 34.11 60.25 94.36

ROAD INVENTORY YEAR END REPORT 2020CENTERLINE MILES TABLE 7
CITY/TOWN BY FEDERAL AID CATEGORY
Massachusetts Department of TransportationOffice of Transportation Planning 48 / 109
City Town
No Name National HighwaySystem
SurfaceTransportation
Program
Total Federal Aid State & Local Aid Grand Total
216 NORTHBRIDGE 0.19 28.84 29.02 58.95 87.97
217 NORTHFIELD 10.49 16.08 26.56 56.73 83.29
218 NORTON 10.89 20.96 31.86 79.99 111.85
219 NORWELL 10.31 21.38 31.69 60.18 91.87
220 NORWOOD 8.55 28.17 36.71 75.50 112.21
221 OAK BLUFFS 4.80 5.98 10.78 34.24 45.01
222 OAKHAM 2.90 8.53 11.43 38.33 49.76
223 ORANGE 13.09 9.38 22.47 80.84 103.32
224 ORLEANS 10.02 16.96 26.98 67.23 94.21
225 OTIS 11.35 9.57 20.92 42.90 63.81
226 OXFORD 9.40 27.65 37.05 74.74 111.79
227 PALMER 23.87 30.45 54.32 63.58 117.90
228 PAXTON 5.40 8.59 13.99 32.67 46.66
229 PEABODY 18.69 25.61 44.30 134.53 178.83
230 PELHAM 5.80 6.04 11.84 33.93 45.77
231 PEMBROKE 7.28 32.33 39.61 77.67 117.28
232 PEPPERELL 13.43 15.23 28.66 58.74 87.40
233 PERU 0.00 4.55 4.55 34.12 38.66
234 PETERSHAM 12.55 7.07 19.61 59.63 79.24
235 PHILLIPSTON 2.97 8.23 11.20 41.94 53.15
236 PITTSFIELD 21.28 57.24 78.52 149.13 227.65
237 PLAINFIELD 0.00 12.01 12.01 36.10 48.10
238 PLAINVILLE 1.57 18.46 20.03 34.22 54.25
239 PLYMOUTH 22.86 91.40 114.26 385.39 499.65
240 PLYMPTON 0.58 13.22 13.80 21.76 35.55
241 PRINCETON 4.21 19.76 23.97 58.90 82.87
242 PROVINCETOWN 3.17 11.81 14.97 16.93 31.90
243 QUINCY 20.05 48.08 68.14 158.39 226.52
244 RANDOLPH 11.68 19.49 31.17 87.16 118.33
245 RAYNHAM 11.14 17.18 28.32 66.95 95.27
246 READING 9.36 16.31 25.67 77.78 103.45
247 REHOBOTH 18.25 30.04 48.29 94.85 143.14
248 REVERE 14.88 22.85 37.73 69.95 107.68
249 RICHMOND 6.10 7.07 13.17 34.48 47.65
250 ROCHESTER 0.17 17.61 17.78 57.78 75.56
251 ROCKLAND 0.59 24.35 24.94 31.46 56.40
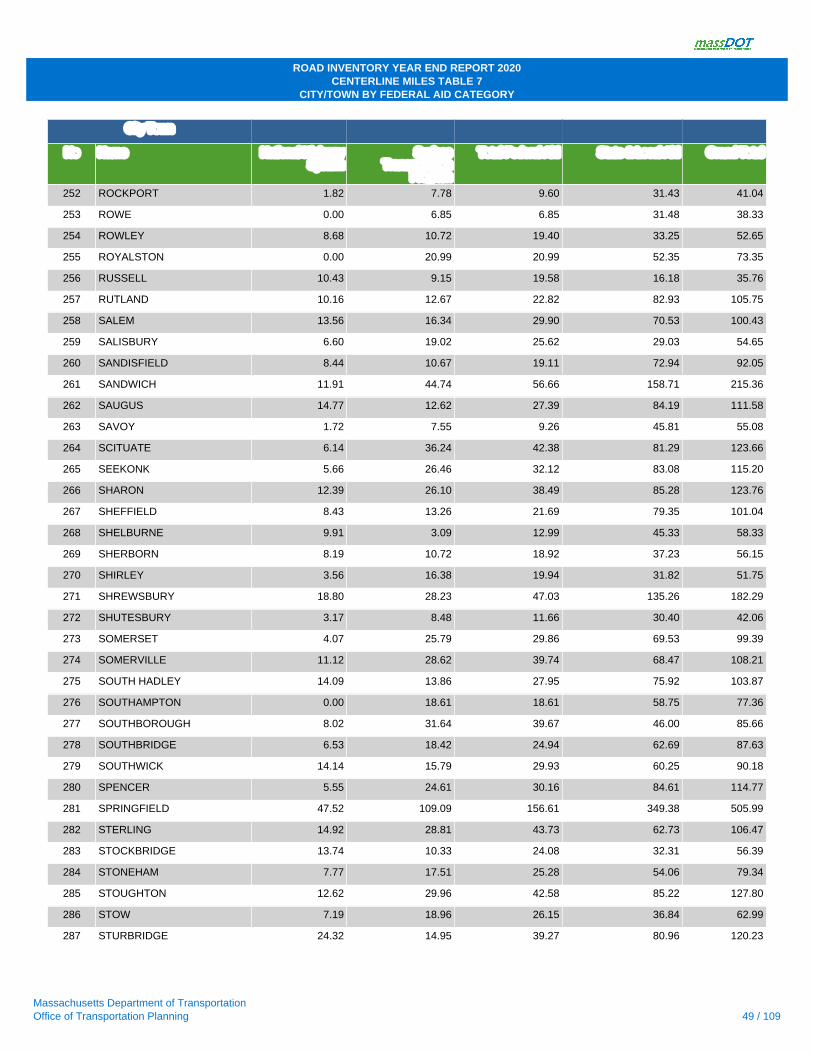
ROAD INVENTORY YEAR END REPORT 2020CENTERLINE MILES TABLE 7
CITY/TOWN BY FEDERAL AID CATEGORY
Massachusetts Department of TransportationOffice of Transportation Planning 49 / 109
City Town
No Name National HighwaySystem
SurfaceTransportation
Program
Total Federal Aid State & Local Aid Grand Total
252 ROCKPORT 1.82 7.78 9.60 31.43 41.04
253 ROWE 0.00 6.85 6.85 31.48 38.33
254 ROWLEY 8.68 10.72 19.40 33.25 52.65
255 ROYALSTON 0.00 20.99 20.99 52.35 73.35
256 RUSSELL 10.43 9.15 19.58 16.18 35.76
257 RUTLAND 10.16 12.67 22.82 82.93 105.75
258 SALEM 13.56 16.34 29.90 70.53 100.43
259 SALISBURY 6.60 19.02 25.62 29.03 54.65
260 SANDISFIELD 8.44 10.67 19.11 72.94 92.05
261 SANDWICH 11.91 44.74 56.66 158.71 215.36
262 SAUGUS 14.77 12.62 27.39 84.19 111.58
263 SAVOY 1.72 7.55 9.26 45.81 55.08
264 SCITUATE 6.14 36.24 42.38 81.29 123.66
265 SEEKONK 5.66 26.46 32.12 83.08 115.20
266 SHARON 12.39 26.10 38.49 85.28 123.76
267 SHEFFIELD 8.43 13.26 21.69 79.35 101.04
268 SHELBURNE 9.91 3.09 12.99 45.33 58.33
269 SHERBORN 8.19 10.72 18.92 37.23 56.15
270 SHIRLEY 3.56 16.38 19.94 31.82 51.75
271 SHREWSBURY 18.80 28.23 47.03 135.26 182.29
272 SHUTESBURY 3.17 8.48 11.66 30.40 42.06
273 SOMERSET 4.07 25.79 29.86 69.53 99.39
274 SOMERVILLE 11.12 28.62 39.74 68.47 108.21
275 SOUTH HADLEY 14.09 13.86 27.95 75.92 103.87
276 SOUTHAMPTON 0.00 18.61 18.61 58.75 77.36
277 SOUTHBOROUGH 8.02 31.64 39.67 46.00 85.66
278 SOUTHBRIDGE 6.53 18.42 24.94 62.69 87.63
279 SOUTHWICK 14.14 15.79 29.93 60.25 90.18
280 SPENCER 5.55 24.61 30.16 84.61 114.77
281 SPRINGFIELD 47.52 109.09 156.61 349.38 505.99
282 STERLING 14.92 28.81 43.73 62.73 106.47
283 STOCKBRIDGE 13.74 10.33 24.08 32.31 56.39
284 STONEHAM 7.77 17.51 25.28 54.06 79.34
285 STOUGHTON 12.62 29.96 42.58 85.22 127.80
286 STOW 7.19 18.96 26.15 36.84 62.99
287 STURBRIDGE 24.32 14.95 39.27 80.96 120.23

ROAD INVENTORY YEAR END REPORT 2020CENTERLINE MILES TABLE 7
CITY/TOWN BY FEDERAL AID CATEGORY
Massachusetts Department of TransportationOffice of Transportation Planning 50 / 109
City Town
No Name National HighwaySystem
SurfaceTransportation
Program
Total Federal Aid State & Local Aid Grand Total
288 SUDBURY 9.01 35.88 44.90 100.82 145.72
289 SUNDERLAND 4.33 10.53 14.86 30.31 45.17
290 SUTTON 6.77 26.85 33.62 78.69 112.32
291 SWAMPSCOTT 4.30 8.86 13.15 33.79 46.94
292 SWANSEA 10.98 27.72 38.70 85.32 124.02
293 TAUNTON 17.21 56.08 73.29 196.85 270.14
294 TEMPLETON 5.68 35.15 40.83 63.97 104.80
295 TEWKSBURY 12.04 39.86 51.90 114.57 166.47
296 TISBURY 2.67 6.73 9.40 17.52 26.92
297 TOLLAND 5.72 0.00 5.72 35.68 41.39
298 TOPSFIELD 6.15 15.99 22.14 39.03 61.17
299 TOWNSEND 9.03 16.32 25.35 68.91 94.25
300 TRURO 9.97 10.25 20.22 42.01 62.23
301 TYNGSBOROUGH 4.34 26.46 30.80 64.36 95.16
302 TYRINGHAM 0.00 6.58 6.58 20.70 27.28
303 UPTON 6.40 17.59 23.99 56.97 80.96
304 UXBRIDGE 12.33 22.50 34.83 88.83 123.65
305 WAKEFIELD 11.64 19.24 30.88 74.68 105.56
306 WALES 0.00 8.03 8.03 20.43 28.47
307 WALPOLE 7.67 43.01 50.68 88.19 138.87
308 WALTHAM 14.81 40.14 54.95 107.15 162.10
309 WARE 13.16 14.39 27.55 89.32 116.87
310 WAREHAM 11.36 36.37 47.72 139.75 187.47
311 WARREN 4.71 15.02 19.73 54.21 73.94
312 WARWICK 0.00 12.72 12.72 50.93 63.66
313 WASHINGTON 4.43 0.00 4.43 47.08 51.51
314 WATERTOWN 5.67 16.31 21.97 57.04 79.02
315 WAYLAND 12.92 14.81 27.73 68.77 96.49
316 WEBSTER 4.03 21.95 25.98 59.19 85.17
317 WELLESLEY 13.67 18.65 32.31 99.61 131.93
318 WELLFLEET 7.31 13.83 21.14 50.99 72.13
319 WENDELL 0.31 12.08 12.39 55.50 67.89
320 WENHAM 2.65 14.54 17.20 16.06 33.26
321 WEST BOYLSTON 2.84 22.86 25.70 37.60 63.30
322 WEST BRIDGEWATER 10.46 19.03 29.49 30.31 59.80
323 WEST BROOKFIELD 7.18 8.35 15.53 50.77 66.30

ROAD INVENTORY YEAR END REPORT 2020CENTERLINE MILES TABLE 7
CITY/TOWN BY FEDERAL AID CATEGORY
Massachusetts Department of TransportationOffice of Transportation Planning 51 / 109
City Town
No Name National HighwaySystem
SurfaceTransportation
Program
Total Federal Aid State & Local Aid Grand Total
324 WEST NEWBURY 5.77 13.66 19.43 32.86 52.29
325 WEST SPRINGFIELD 18.67 26.74 45.41 101.05 146.46
326 WEST STOCKBRIDGE 8.71 6.54 15.25 29.25 44.50
327 WEST TISBURY 0.00 8.64 8.64 16.33 24.97
328 WESTBOROUGH 11.36 27.61 38.97 73.15 112.12
329 WESTFIELD 24.53 48.94 73.47 176.05 249.52
330 WESTFORD 11.55 44.34 55.88 114.38 170.26
331 WESTHAMPTON 0.00 21.16 21.16 26.15 47.31
332 WESTMINSTER 13.65 29.53 43.18 67.19 110.36
333 WESTON 9.04 36.04 45.08 66.11 111.19
334 WESTPORT 3.68 46.68 50.36 112.06 162.42
335 WESTWOOD 6.54 21.91 28.45 60.77 89.22
336 WEYMOUTH 10.44 46.17 56.62 127.38 184.00
337 WHATELY 4.21 11.50 15.71 32.26 47.97
338 WHITMAN 6.64 12.98 19.61 34.89 54.50
339 WILBRAHAM 6.14 29.10 35.25 78.18 113.43
340 WILLIAMSBURG 7.89 11.21 19.10 31.81 50.91
341 WILLIAMSTOWN 14.94 12.50 27.44 49.89 77.33
342 WILMINGTON 12.51 28.97 41.48 86.90 128.38
343 WINCHENDON 10.44 21.23 31.67 85.99 117.66
344 WINCHESTER 4.42 21.84 26.26 65.12 91.38
345 WINDSOR 8.10 4.40 12.49 63.44 75.93
346 WINTHROP 0.00 14.13 14.13 25.77 39.91
347 WOBURN 16.46 30.61 47.07 106.14 153.21
348 WORCESTER 57.84 86.77 144.61 391.26 535.87
349 WORTHINGTON 10.27 7.28 17.54 47.35 64.89
350 WRENTHAM 11.26 23.09 34.35 61.60 95.96
351 YARMOUTH 13.55 52.79 66.34 193.82 260.16
Total 3,343.68 7,926.09 11,269.77 25,545.91 36,815.68

ROAD INVENTORY YEAR END REPORT 2020
Massachusetts Department of TransportationOffice of Transportation Planning 52 / 109
III. LANE MILE REPORTS

ROAD INVENTORY YEAR END REPORT 2020LANE MILES TABLE 8
JURISDICTION BY FUNCTIONAL CLASSIFICATION (BY DISTRICT)
Massachusetts Department of TransportationOffice of Transportation Planning 53 / 109
Urban Rural Urban and Rural
Jurisdiction Interstate Arterial Collector Local Total Interstate Arterial Collector Local Total Interstate Arterial Collector Local Total
MassDOT 24.89 187.20 0.27 1.99 214.35 127.52 379.56 152.82 14.34 674.24 152.41 566.76 153.09 16.33 888.59
City/Town 0.00 202.44 182.42 735.64 1,120.49 0.00 86.67 1,078.88 2,243.61 3,409.16 0.00 289.11 1,261.30 2,979.25 4,529.65
DCR 0.00 0.00 0.00 0.00 0.00 0.00 0.00 0.00 3.54 3.54 0.00 0.00 0.00 3.54 3.54
MassPort 0.00 0.00 0.00 0.00 0.00 0.00 0.00 0.00 0.00 0.00 0.00 0.00 0.00 0.00 0.00
State Park 0.00 0.00 0.00 11.30 11.30 0.00 0.00 0.00 76.61 76.61 0.00 0.00 0.00 87.91 87.91
State 0.00 0.00 0.00 2.58 2.58 0.00 0.00 0.00 0.00 0.00 0.00 0.00 0.00 2.58 2.58
County 0.00 0.00 0.00 0.00 0.00 0.00 0.00 0.00 0.00 0.00 0.00 0.00 0.00 0.00 0.00
Combined 0.00 0.00 0.00 0.00 0.00 0.00 0.00 0.00 5.52 5.52 0.00 0.00 0.00 5.52 5.52Unaccepted 0.00 0.00 0.88 54.77 55.66 0.00 0.00 0.00 79.73 79.73 0.00 0.00 0.88 134.50 135.39
Total 24.89 389.64 183.57 806.28 1,404.38 127.52 466.23 1,231.70 2,423.35 4,248.80 152.41 855.87 1,415.27 3,229.63 5,653.18
Urban Rural Urban and Rural
Jurisdiction Interstate Arterial Collector Local Total Interstate Arterial Collector Local Total Interstate Arterial Collector Local Total
MassDOT 361.35 495.02 8.59 7.62 872.57 97.58 242.22 76.60 9.70 426.11 458.93 737.24 85.19 17.32 1,298.68
City/Town 0.00 1,283.50 655.73 3,854.01 5,793.25 0.00 42.47 914.33 1,818.64 2,775.43 0.00 1,325.97 1,570.06 5,672.65 8,568.68
DCR 0.00 0.00 0.00 0.49 0.49 0.00 0.00 0.00 123.90 123.90 0.00 0.00 0.00 124.39 124.39
MassPort 0.00 0.00 0.00 0.00 0.00 0.00 0.00 0.00 0.00 0.00 0.00 0.00 0.00 0.00 0.00
State Park 0.00 0.00 0.00 46.59 46.59 0.00 0.00 4.75 42.39 47.13 0.00 0.00 4.75 88.98 93.72
State 0.00 7.14 1.73 30.33 39.20 0.00 0.00 0.00 11.68 11.68 0.00 7.14 1.73 42.01 50.88
County 0.00 0.00 0.00 0.00 0.00 0.00 0.00 0.00 0.00 0.00 0.00 0.00 0.00 0.00 0.00
Combined 0.00 0.00 0.00 35.34 35.34 0.00 0.00 0.00 2.79 2.79 0.00 0.00 0.00 38.13 38.13Unaccepted 0.00 0.00 0.94 481.15 482.08 0.00 0.00 0.17 97.96 98.13 0.00 0.00 1.11 579.11 580.21
Total 361.35 1,785.66 666.99 4,455.53 7,269.52 97.58 284.69 995.85 2,107.06 3,485.17 458.93 2,070.35 1,662.84 6,562.59 10,754.69
Urban Rural Urban and Rural
Jurisdiction Interstate Arterial Collector Local Total Interstate Arterial Collector Local Total Interstate Arterial Collector Local Total
MassDOT 807.48 1,041.29 16.87 20.81 1,886.45 37.01 59.95 18.57 6.41 121.94 844.49 1,101.24 35.44 27.22 2,008.39
City/Town 0.00 2,061.87 1,381.02 7,631.83 11,074.72 0.00 71.22 425.31 1,067.65 1,564.18 0.00 2,133.09 1,806.33 8,699.48 12,638.90
DCR 0.00 0.00 0.00 1.03 1.03 0.00 0.00 0.00 7.30 7.30 0.00 0.00 0.00 8.33 8.33
MassPort 0.00 0.00 0.00 0.00 0.00 0.00 0.00 0.00 0.00 0.00 0.00 0.00 0.00 0.00 0.00
State Park 0.00 0.00 0.00 11.59 11.59 0.00 0.00 0.00 20.91 20.91 0.00 0.00 0.00 32.50 32.50
State 0.00 0.00 1.43 36.54 37.96 0.00 0.00 0.00 0.00 0.00 0.00 0.00 1.43 36.54 37.96
County 0.00 0.00 0.01 0.00 0.01 0.00 0.00 0.00 0.00 0.00 0.00 0.00 0.01 0.00 0.01
Combined 0.00 0.00 0.00 18.27 18.27 0.00 0.00 0.00 1.06 1.06 0.00 0.00 0.00 19.33 19.33Unaccepted 0.00 0.68 0.44 607.75 608.87 0.00 0.00 0.00 61.49 61.49 0.00 0.68 0.44 669.24 670.36
Total 807.48 3,103.84 1,399.77 8,327.82 13,638.90 37.01 131.17 443.88 1,164.82 1,776.88 844.49 3,235.01 1,843.65 9,492.64 15,415.78
MassDOT District 1
MassDOT District 2
MassDOT District 3

ROAD INVENTORY YEAR END REPORT 2020LANE MILES TABLE 8
JURISDICTION BY FUNCTIONAL CLASSIFICATION (BY DISTRICT)
Massachusetts Department of TransportationOffice of Transportation Planning 54 / 109
Urban Rural Urban and Rural
Jurisdiction Interstate Arterial Collector Local Total Interstate Arterial Collector Local Total Interstate Arterial Collector Local Total
MassDOT 758.40 1,071.56 23.57 8.74 1,862.27 8.76 0.00 5.62 0.00 14.38 767.16 1,071.56 29.19 8.74 1,876.65
City/Town 0.00 1,895.52 1,256.93 7,683.51 10,835.95 0.00 0.00 18.48 77.91 96.39 0.00 1,895.52 1,275.41 7,761.42 10,932.34
DCR 0.00 113.51 2.39 11.91 127.81 0.00 0.00 0.00 0.00 0.00 0.00 113.51 2.39 11.91 127.81
MassPort 0.00 0.00 0.00 0.00 0.00 0.00 0.00 0.00 0.00 0.00 0.00 0.00 0.00 0.00 0.00
State Park 0.00 0.00 4.55 8.28 12.83 0.00 0.00 0.83 0.85 1.69 0.00 0.00 5.38 9.13 14.52
State 0.00 0.00 0.00 15.58 15.58 0.00 0.00 0.00 0.00 0.00 0.00 0.00 0.00 15.58 15.58
County 0.00 0.00 0.00 0.05 0.05 0.00 0.00 0.00 0.00 0.00 0.00 0.00 0.00 0.05 0.05
Combined 0.00 0.00 1.28 1.90 3.18 0.00 0.00 0.00 4.60 4.60 0.00 0.00 1.28 6.50 7.78Unaccepted 0.00 3.10 2.96 1,017.57 1,023.64 0.00 0.00 0.00 6.01 6.01 0.00 3.10 2.96 1,023.58 1,029.65
Total 758.40 3,083.69 1,291.68 8,747.54 13,881.31 8.76 0.00 24.93 89.37 123.07 767.16 3,083.69 1,316.61 8,836.91 14,004.38
Urban Rural Urban and Rural
Jurisdiction Interstate Arterial Collector Local Total Interstate Arterial Collector Local Total Interstate Arterial Collector Local Total
MassDOT 573.85 1,993.57 20.77 26.70 2,614.89 0.00 18.83 57.98 2.98 79.79 573.85 2,012.40 78.75 29.68 2,694.68
City/Town 0.00 2,506.81 1,850.70 10,136.62 14,494.13 0.00 0.00 162.87 442.88 605.76 0.00 2,506.81 2,013.57 10,579.50 15,099.89
DCR 0.00 1.34 0.00 0.08 1.42 0.00 0.00 0.00 0.00 0.00 0.00 1.34 0.00 0.08 1.42
MassPort 0.00 0.00 0.00 0.00 0.00 0.00 0.00 0.00 0.00 0.00 0.00 0.00 0.00 0.00 0.00
State Park 0.00 3.49 0.00 130.24 133.72 0.00 0.00 4.60 0.61 5.21 0.00 3.49 4.60 130.85 138.93
State 0.00 0.00 0.00 37.82 37.82 0.00 0.00 0.00 0.00 0.00 0.00 0.00 0.00 37.82 37.82
County 0.00 0.00 0.00 7.46 7.46 0.00 0.00 0.00 0.00 0.00 0.00 0.00 0.00 7.46 7.46
Combined 0.00 9.84 0.00 103.12 112.96 0.00 0.00 11.50 10.61 22.11 0.00 9.84 11.50 113.73 135.07Unaccepted 0.00 3.23 19.25 2,042.63 2,065.11 0.00 0.00 0.00 41.74 41.74 0.00 3.23 19.25 2,084.37 2,106.85
Total 573.85 4,518.28 1,890.72 12,484.67 19,467.51 0.00 18.83 236.95 498.82 754.61 573.85 4,537.11 2,127.67 12,983.49 20,222.12
Urban Rural Urban and Rural
Jurisdiction Interstate Arterial Collector Local Total Interstate Arterial Collector Local Total Interstate Arterial Collector Local Total
MassDOT 393.56 374.80 2.82 7.12 778.30 0.00 0.00 0.00 0.00 0.00 393.56 374.80 2.82 7.12 778.30
City/Town 0.00 1,181.48 666.97 3,726.30 5,574.76 0.00 0.00 0.00 0.00 0.00 0.00 1,181.48 666.97 3,726.30 5,574.76
DCR 0.00 229.90 7.52 19.65 257.07 0.00 0.00 0.00 0.00 0.00 0.00 229.90 7.52 19.65 257.07
MassPort 0.00 15.16 0.00 3.09 18.26 0.00 0.00 0.00 0.00 0.00 0.00 15.16 0.00 3.09 18.26
State Park 0.00 0.00 0.00 0.30 0.30 0.00 0.00 0.00 0.00 0.00 0.00 0.00 0.00 0.30 0.30
State 0.00 0.00 0.00 7.42 7.42 0.00 0.00 0.00 0.00 0.00 0.00 0.00 0.00 7.42 7.42
County 0.00 0.00 0.00 0.00 0.00 0.00 0.00 0.00 0.00 0.00 0.00 0.00 0.00 0.00 0.00
Combined 0.00 0.00 0.00 2.93 2.93 0.00 0.00 0.00 0.00 0.00 0.00 0.00 0.00 2.93 2.93Unaccepted 0.00 4.28 2.65 398.40 405.33 0.00 0.00 0.00 0.00 0.00 0.00 4.28 2.65 398.40 405.33
Total 393.56 1,805.62 679.96 4,165.21 7,044.37 0.00 0.00 0.00 0.00 0.00 393.56 1,805.62 679.96 4,165.21 7,044.37
MassDOT District 4
MassDOT District 5
MassDOT District 6

ROAD INVENTORY YEAR END REPORT 2020LANE MILES TABLE 8
JURISDICTION BY FUNCTIONAL CLASSIFICATION (BY DISTRICT)
Massachusetts Department of TransportationOffice of Transportation Planning 55 / 109
Urban Rural Urban and Rural
Jurisdiction Interstate Arterial Collector Local Total Interstate Arterial Collector Local Total Interstate Arterial Collector Local Total
MassDOT 2,919.52 5,163.44 72.88 72.98 8,228.82 270.88 700.55 311.59 33.43 1,316.45 3,190.39 5,863.99 384.47 106.41 9,545.27
City/Town 0.00 9,131.62 5,993.78 33,767.92 48,893.31 0.00 200.36 2,599.86 5,650.69 8,450.92 0.00 9,331.98 8,593.64 39,418.61 57,344.23
DCR 0.00 344.75 9.91 33.16 387.82 0.00 0.00 0.00 134.74 134.74 0.00 344.75 9.91 167.90 522.55
MassPort 0.00 15.16 0.00 3.09 18.26 0.00 0.00 0.00 0.00 0.00 0.00 15.16 0.00 3.09 18.26
State Park 0.00 3.49 4.55 208.30 216.33 0.00 0.00 10.18 141.37 151.55 0.00 3.49 14.73 349.67 367.88
State 0.00 7.14 3.16 130.27 140.57 0.00 0.00 0.00 11.68 11.68 0.00 7.14 3.16 141.96 152.25
County 0.00 0.00 0.01 7.51 7.52 0.00 0.00 0.00 0.00 0.00 0.00 0.00 0.01 7.51 7.52
Combined 0.00 9.84 1.28 161.56 172.67 0.00 0.00 11.50 24.59 36.09 0.00 9.84 12.77 186.15 208.76Unaccepted 0.00 11.29 27.12 4,602.27 4,640.68 0.00 0.00 0.17 286.93 287.09 0.00 11.29 27.29 4,889.20 4,927.78
Total 2,919.52 14,686.72 6,112.69 38,987.06 62,705.98 270.88 900.91 2,933.29 6,283.44 10,388.52 3,190.39 15,587.63 9,045.98 45,270.49 73,094.50
Total Massachusetts

ROAD INVENTORY YEAR END REPORT 2020LANE MILES TABLE 9
JURISDICTION BY FEDERAL AID CATEGORY (BY DISTRICT)
Massachusetts Department of TransportationOffice of Transportation Planning 56 / 109
MassDOT District 1
MassDOT District 2
MassDOT District 3
Jurisdiction National HighwaySystem
Surface TransportationProgram
Total Federal Aid State & Local Aid Grand Total
MassDOT 698.17 168.02 866.18 22.40 888.58
City/Town Accepted 137.20 888.15 1,025.35 3,504.30 4,529.65
DCR 0.00 0.00 0.00 3.54 3.54
MassPort 0.00 0.00 0.00 0.00 0.00
State Park 0.00 0.00 0.00 87.91 87.91
State Institutional 0.00 0.00 0.00 2.58 2.58
County Institutional 0.00 0.00 0.00 0.00 0.00
Combined Federal 0.00 0.00 0.00 5.52 5.52
Unaccepted 0.00 0.88 0.88 134.51 135.39
Total 835.37 1,057.05 1,892.42 3,760.76 5,653.18
Jurisdiction National HighwaySystem
Surface TransportationProgram
Total Federal Aid State & Local Aid Grand Total
MassDOT 1,077.09 203.98 1,281.07 17.60 1,298.67
City/Town Accepted 398.77 2,141.60 2,540.36 6,028.32 8,568.68
DCR 0.00 0.00 0.00 124.39 124.39
MassPort 0.00 0.00 0.00 0.00 0.00
State Park 0.00 0.31 0.31 93.42 93.73
State Institutional 2.34 6.53 8.87 42.02 50.88
County Institutional 0.00 0.00 0.00 0.00 0.00
Combined Federal 0.00 0.00 0.00 38.13 38.13
Unaccepted 0.00 0.94 0.94 579.28 580.21
Total 1,478.19 2,353.36 3,831.55 6,923.15 10,754.71
Jurisdiction National HighwaySystem
Surface TransportationProgram
Total Federal Aid State & Local Aid Grand Total
MassDOT 1,695.36 283.75 1,979.11 29.28 2,008.39
City/Town Accepted 619.89 3,104.17 3,724.05 8,914.85 12,638.90
DCR 0.00 0.00 0.00 8.32 8.32
MassPort 0.00 0.00 0.00 0.00 0.00
State Park 0.00 0.00 0.00 32.50 32.50
State Institutional 0.00 1.43 1.43 36.54 37.96
County Institutional 0.00 0.01 0.01 0.00 0.01
Combined Federal 0.00 0.00 0.00 19.33 19.33
Unaccepted 0.25 1.12 1.37 668.98 670.35
Total 2,315.50 3,390.47 5,705.97 9,709.80 15,415.77
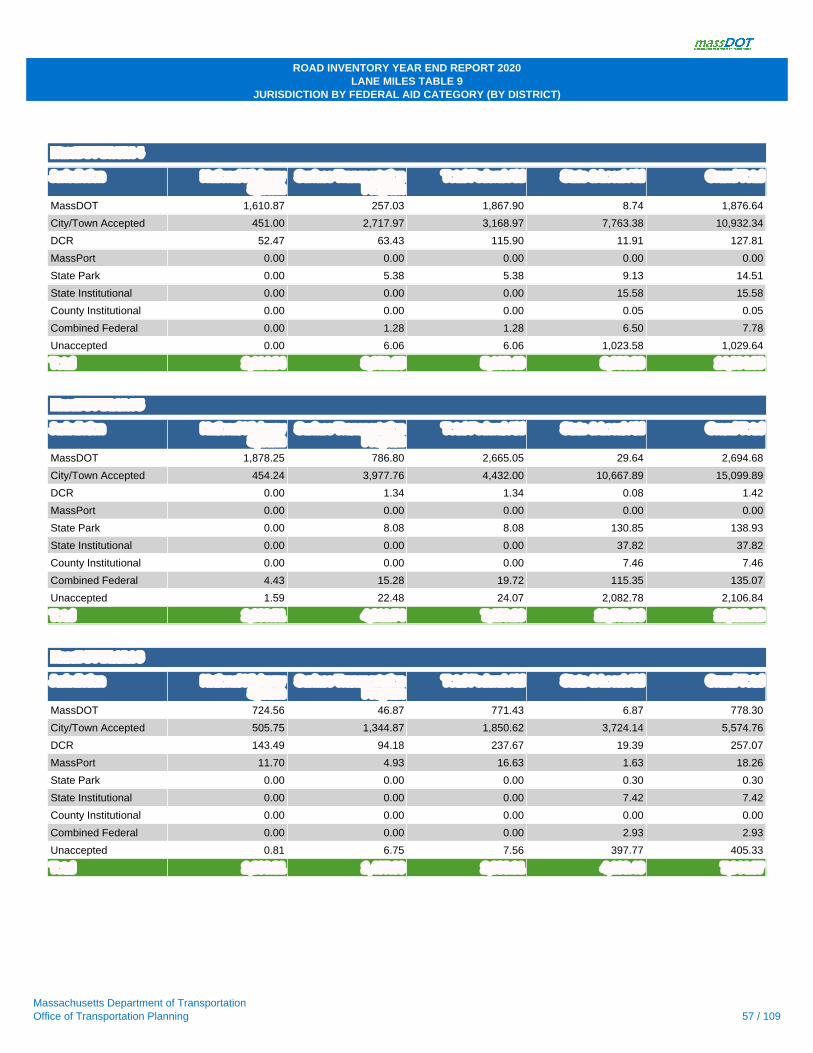
ROAD INVENTORY YEAR END REPORT 2020LANE MILES TABLE 9
JURISDICTION BY FEDERAL AID CATEGORY (BY DISTRICT)
Massachusetts Department of TransportationOffice of Transportation Planning 57 / 109
MassDOT District 4
MassDOT District 5
MassDOT District 6
Jurisdiction National HighwaySystem
Surface TransportationProgram
Total Federal Aid State & Local Aid Grand Total
MassDOT 1,610.87 257.03 1,867.90 8.74 1,876.64
City/Town Accepted 451.00 2,717.97 3,168.97 7,763.38 10,932.34
DCR 52.47 63.43 115.90 11.91 127.81
MassPort 0.00 0.00 0.00 0.00 0.00
State Park 0.00 5.38 5.38 9.13 14.51
State Institutional 0.00 0.00 0.00 15.58 15.58
County Institutional 0.00 0.00 0.00 0.05 0.05
Combined Federal 0.00 1.28 1.28 6.50 7.78
Unaccepted 0.00 6.06 6.06 1,023.58 1,029.64
Total 2,114.34 3,051.15 5,165.49 8,838.86 14,004.35
Jurisdiction National HighwaySystem
Surface TransportationProgram
Total Federal Aid State & Local Aid Grand Total
MassDOT 1,878.25 786.80 2,665.05 29.64 2,694.68
City/Town Accepted 454.24 3,977.76 4,432.00 10,667.89 15,099.89
DCR 0.00 1.34 1.34 0.08 1.42
MassPort 0.00 0.00 0.00 0.00 0.00
State Park 0.00 8.08 8.08 130.85 138.93
State Institutional 0.00 0.00 0.00 37.82 37.82
County Institutional 0.00 0.00 0.00 7.46 7.46
Combined Federal 4.43 15.28 19.72 115.35 135.07
Unaccepted 1.59 22.48 24.07 2,082.78 2,106.84
Total 2,338.51 4,811.74 7,150.26 13,071.86 20,222.12
Jurisdiction National HighwaySystem
Surface TransportationProgram
Total Federal Aid State & Local Aid Grand Total
MassDOT 724.56 46.87 771.43 6.87 778.30
City/Town Accepted 505.75 1,344.87 1,850.62 3,724.14 5,574.76
DCR 143.49 94.18 237.67 19.39 257.07
MassPort 11.70 4.93 16.63 1.63 18.26
State Park 0.00 0.00 0.00 0.30 0.30
State Institutional 0.00 0.00 0.00 7.42 7.42
County Institutional 0.00 0.00 0.00 0.00 0.00
Combined Federal 0.00 0.00 0.00 2.93 2.93
Unaccepted 0.81 6.75 7.56 397.77 405.33
Total 1,386.31 1,497.60 2,883.91 4,160.46 7,044.37

ROAD INVENTORY YEAR END REPORT 2020LANE MILES TABLE 9
JURISDICTION BY FEDERAL AID CATEGORY (BY DISTRICT)
Massachusetts Department of TransportationOffice of Transportation Planning 58 / 109
Total Massachusetts
Jurisdiction National HighwaySystem
Surface TransportationProgram
Total Federal Aid State & Local Aid Grand Total
MassDOT 7,684.29 1,746.45 9,430.74 114.53 9,545.27
City/Town Accepted 2,566.85 14,174.51 16,741.36 40,602.87 57,344.23
DCR 195.96 158.95 354.92 167.64 522.55
MassPort 11.70 4.93 16.63 1.63 18.26
State Park 0.00 13.77 13.77 354.11 367.88
State Institutional 2.34 7.96 10.30 141.96 152.25
County Institutional 0.00 0.01 0.01 7.51 7.52
Combined Federal 4.43 16.56 20.99 187.76 208.76
Unaccepted 2.65 38.23 40.88 4,886.90 4,927.78
Total 10,468.22 16,161.38 26,629.60 46,464.90 73,094.50

ROAD INVENTORY YEAR END REPORT 2020LANE MILES TABLE 10
JURISDICTION BY FUNCTIONAL CLASSIFICATION (BY MPO)
Massachusetts Department of TransportationOffice of Transportation Planning 59 / 109
Urban Rural Urban and RuralJurisdiction Interstate Arterial Collector Local Total Interstate Arterial Collector Local Total Interstate Arterial Collector Local Total
MassDOT 13.55 169.17 0.09 1.96 184.77 82.58 250.87 68.77 12.74 414.95 96.12 420.04 68.86 14.70 599.72
City/Town 0.00 198.76 180.08 720.81 1,099.65 0.00 2.30 520.01 1,139.74 1,662.06 0.00 201.05 700.09 1,860.56 2,761.70
DCR 0.00 0.00 0.00 0.00 0.00 0.00 0.00 0.00 0.00 0.00 0.00 0.00 0.00 0.00 0.00
MassPort 0.00 0.00 0.00 0.00 0.00 0.00 0.00 0.00 0.00 0.00 0.00 0.00 0.00 0.00 0.00
State Park 0.00 0.00 0.00 11.30 11.30 0.00 0.00 0.00 48.71 48.71 0.00 0.00 0.00 60.01 60.01
State 0.00 0.00 0.00 2.58 2.58 0.00 0.00 0.00 0.00 0.00 0.00 0.00 0.00 2.58 2.58
County 0.00 0.00 0.00 0.00 0.00 0.00 0.00 0.00 0.00 0.00 0.00 0.00 0.00 0.00 0.00
Combined 0.00 0.00 0.00 0.00 0.00 0.00 0.00 0.00 0.00 0.00 0.00 0.00 0.00 0.00 0.00
Unaccepted 0.00 0.00 0.88 54.77 55.66 0.00 0.00 0.00 34.05 34.05 0.00 0.00 0.88 88.83 89.71
Total 13.55 367.93 181.05 791.43 1,353.96 82.58 253.16 588.78 1,235.24 2,159.77 96.12 621.09 769.84 2,026.67 3,513.72
Urban Rural Urban and Rural
Jurisdiction Interstate Arterial Collector Local Total Interstate Arterial Collector Local Total Interstate Arterial Collector Local Total
MassDOT 1,155.38 1,481.43 29.41 12.97 2,679.20 14.41 0.04 0.00 0.00 14.45 1,169.79 1,481.47 29.41 12.97 2,693.64
City/Town 0.00 3,371.68 2,337.14 12,607.32 18,316.15 0.00 16.20 30.48 67.93 114.61 0.00 3,387.88 2,367.63 12,675.25 18,430.76
DCR 0.00 344.37 9.91 32.67 386.94 0.00 0.00 0.00 0.00 0.00 0.00 344.37 9.91 32.67 386.94
MassPort 0.00 15.16 0.00 3.09 18.26 0.00 0.00 0.00 0.00 0.00 0.00 15.16 0.00 3.09 18.26
State Park 0.00 0.00 0.00 7.62 7.62 0.00 0.00 0.83 0.85 1.69 0.00 0.00 0.83 8.47 9.30
State 0.00 0.00 0.00 39.95 39.95 0.00 0.00 0.00 0.00 0.00 0.00 0.00 0.00 39.95 39.95
County 0.00 0.00 0.00 0.05 0.05 0.00 0.00 0.00 0.00 0.00 0.00 0.00 0.00 0.05 0.05
Combined 0.00 0.00 1.28 3.94 5.21 0.00 0.00 0.00 4.60 4.60 0.00 0.00 1.28 8.54 9.81
Unaccepted 0.00 5.16 5.59 1,485.18 1,495.94 0.00 0.00 0.00 2.69 2.69 0.00 5.16 5.59 1,487.88 1,498.63
Total 1,155.38 5,217.80 2,383.33 14,192.80 22,949.31 14.41 16.24 31.32 76.08 138.05 1,169.79 5,234.04 2,414.65 14,268.87 23,087.35
Urban Rural Urban and RuralJurisdiction Interstate Arterial Collector Local Total Interstate Arterial Collector Local Total Interstate Arterial Collector Local Total
MassDOT 0.00 493.99 1.82 7.04 502.84 0.00 12.85 0.26 0.81 13.93 0.00 506.84 2.08 7.85 516.77
City/Town 0.00 727.05 354.90 2,117.69 3,199.64 0.00 0.00 34.03 77.77 111.81 0.00 727.05 388.93 2,195.47 3,311.45
DCR 0.00 0.00 0.00 0.00 0.00 0.00 0.00 0.00 0.00 0.00 0.00 0.00 0.00 0.00 0.00
MassPort 0.00 0.00 0.00 0.00 0.00 0.00 0.00 0.00 0.00 0.00 0.00 0.00 0.00 0.00 0.00
State Park 0.00 0.00 0.00 22.54 22.54 0.00 0.00 4.60 0.00 4.60 0.00 0.00 4.60 22.54 27.13
State 0.00 0.00 0.00 0.20 0.20 0.00 0.00 0.00 0.00 0.00 0.00 0.00 0.00 0.20 0.20
County 0.00 0.00 0.00 3.19 3.19 0.00 0.00 0.00 0.00 0.00 0.00 0.00 0.00 3.19 3.19
Combined 0.00 9.84 0.00 98.97 108.81 0.00 0.00 11.50 9.68 21.18 0.00 9.84 11.50 108.66 129.99
Unaccepted 0.00 0.29 11.16 998.48 1,009.94 0.00 0.00 0.00 22.15 22.15 0.00 0.29 11.16 1,020.63 1,032.08
Total 0.00 1,231.17 367.88 3,248.11 4,847.15 0.00 12.85 50.39 110.42 173.65 0.00 1,244.02 418.26 3,358.53 5,020.81
Berkshire
Boston Region
Cape Cod

ROAD INVENTORY YEAR END REPORT 2020LANE MILES TABLE 10
JURISDICTION BY FUNCTIONAL CLASSIFICATION (BY MPO)
Massachusetts Department of TransportationOffice of Transportation Planning 60 / 109
Urban Rural Urban and RuralJurisdiction Interstate Arterial Collector Local Total Interstate Arterial Collector Local Total Interstate Arterial Collector Local Total
MassDOT 431.50 533.89 9.37 14.95 989.72 38.06 48.11 8.91 7.07 102.16 469.57 582.01 18.28 22.02 1,091.88
City/Town 0.00 832.21 571.54 3,286.82 4,690.56 0.00 43.79 407.09 953.84 1,404.73 0.00 876.00 978.63 4,240.66 6,095.29
DCR 0.00 0.00 0.00 0.00 0.00 0.00 0.00 0.00 18.65 18.65 0.00 0.00 0.00 18.65 18.65
MassPort 0.00 0.00 0.00 0.00 0.00 0.00 0.00 0.00 0.00 0.00 0.00 0.00 0.00 0.00 0.00
State Park 0.00 0.00 0.00 8.11 8.11 0.00 0.00 0.00 20.91 20.91 0.00 0.00 0.00 29.02 29.02
State 0.00 0.00 1.43 11.65 13.08 0.00 0.00 0.00 0.00 0.00 0.00 0.00 1.43 11.65 13.08
County 0.00 0.00 0.01 0.00 0.01 0.00 0.00 0.00 0.00 0.00 0.00 0.00 0.01 0.00 0.01
Combined 0.00 0.00 0.00 3.88 3.88 0.00 0.00 0.00 0.21 0.21 0.00 0.00 0.00 4.08 4.08
Unaccepted 0.00 0.68 0.13 277.67 278.48 0.00 0.00 0.00 42.23 42.23 0.00 0.68 0.13 319.90 320.71
Total 431.50 1,366.78 582.48 3,603.08 5,983.84 38.06 91.91 416.00 1,042.91 1,588.88 469.57 1,458.68 998.48 4,645.99 7,572.72
Urban Rural Urban and RuralJurisdiction Interstate Arterial Collector Local Total Interstate Arterial Collector Local Total Interstate Arterial Collector Local Total
MassDOT 41.22 83.99 0.71 2.05 127.97 54.06 142.57 89.27 5.18 291.08 95.28 226.56 89.98 7.23 419.05
City/Town 0.00 93.65 56.79 321.48 471.92 0.00 22.49 550.92 1,134.48 1,707.90 0.00 116.14 607.72 1,455.96 2,179.82
DCR 0.00 0.00 0.00 0.00 0.00 0.00 0.00 0.00 64.72 64.72 0.00 0.00 0.00 64.72 64.72
MassPort 0.00 0.00 0.00 0.00 0.00 0.00 0.00 0.00 0.00 0.00 0.00 0.00 0.00 0.00 0.00
State Park 0.00 0.00 0.00 0.81 0.81 0.00 0.00 4.75 42.67 47.42 0.00 0.00 4.75 43.48 48.23
State 0.00 0.00 0.00 1.11 1.11 0.00 0.00 0.00 0.00 0.00 0.00 0.00 0.00 1.11 1.11
County 0.00 0.00 0.00 0.00 0.00 0.00 0.00 0.00 0.00 0.00 0.00 0.00 0.00 0.00 0.00
Combined 0.00 0.00 0.00 0.00 0.00 0.00 0.00 0.00 0.00 0.00 0.00 0.00 0.00 0.00 0.00
Unaccepted 0.00 0.00 0.00 21.80 21.80 0.00 0.00 0.17 56.73 56.89 0.00 0.00 0.17 78.53 78.70
Total 41.22 177.64 57.50 347.25 623.62 54.06 165.06 645.10 1,303.78 2,168.01 95.28 342.70 702.61 1,651.03 2,791.62
Urban Rural Urban and RuralJurisdiction Interstate Arterial Collector Local Total Interstate Arterial Collector Local Total Interstate Arterial Collector Local Total
MassDOT 0.00 28.06 0.00 0.00 28.06 0.00 0.00 39.51 1.93 41.44 0.00 28.06 39.51 1.93 69.51
City/Town 0.00 26.77 12.73 122.64 162.15 0.00 0.00 26.09 71.86 97.95 0.00 26.77 38.82 194.50 260.09
DCR 0.00 0.00 0.00 0.00 0.00 0.00 0.00 0.00 0.00 0.00 0.00 0.00 0.00 0.00 0.00
MassPort 0.00 0.00 0.00 0.00 0.00 0.00 0.00 0.00 0.00 0.00 0.00 0.00 0.00 0.00 0.00
State Park 0.00 0.00 0.00 0.00 0.00 0.00 0.00 0.00 0.00 0.00 0.00 0.00 0.00 0.00 0.00
State 0.00 0.00 0.00 0.00 0.00 0.00 0.00 0.00 0.00 0.00 0.00 0.00 0.00 0.00 0.00
County 0.00 0.00 0.00 0.60 0.60 0.00 0.00 0.00 0.00 0.00 0.00 0.00 0.00 0.60 0.60
Combined 0.00 0.00 0.00 0.00 0.00 0.00 0.00 0.00 0.93 0.93 0.00 0.00 0.00 0.93 0.93
Unaccepted 0.00 0.00 0.00 9.41 9.41 0.00 0.00 0.00 2.24 2.24 0.00 0.00 0.00 11.65 11.65
Total 0.00 54.84 12.73 132.66 200.23 0.00 0.00 65.60 76.97 142.56 0.00 54.84 78.33 209.62 342.79
Central Massachusetts
Franklin
Martha's Vineyard

ROAD INVENTORY YEAR END REPORT 2020LANE MILES TABLE 10
JURISDICTION BY FUNCTIONAL CLASSIFICATION (BY MPO)
Massachusetts Department of TransportationOffice of Transportation Planning 61 / 109
Urban Rural Urban and RuralJurisdiction Interstate Arterial Collector Local Total Interstate Arterial Collector Local Total Interstate Arterial Collector Local Total
MassDOT 48.80 325.57 2.53 6.29 383.19 3.37 74.32 28.47 1.57 107.73 52.17 399.88 31.00 7.86 490.92
City/Town 0.00 486.52 300.00 1,586.61 2,373.13 0.00 35.84 274.18 568.31 878.33 0.00 522.36 574.18 2,154.92 3,251.46
DCR 0.00 0.00 0.00 0.00 0.00 0.00 0.00 0.00 1.16 1.16 0.00 0.00 0.00 1.16 1.16
MassPort 0.00 0.00 0.00 0.00 0.00 0.00 0.00 0.00 0.00 0.00 0.00 0.00 0.00 0.00 0.00
State Park 0.00 0.00 0.00 9.04 9.04 0.00 0.00 0.00 4.83 4.83 0.00 0.00 0.00 13.87 13.87
State 0.00 0.00 0.00 23.25 23.25 0.00 0.00 0.00 8.54 8.54 0.00 0.00 0.00 31.79 31.79
County 0.00 0.00 0.00 0.00 0.00 0.00 0.00 0.00 0.00 0.00 0.00 0.00 0.00 0.00 0.00
Combined 0.00 0.00 0.00 14.39 14.39 0.00 0.00 0.00 3.64 3.64 0.00 0.00 0.00 18.04 18.04
Unaccepted 0.00 0.00 0.00 113.40 113.40 0.00 0.00 0.00 36.40 36.40 0.00 0.00 0.00 149.79 149.79
Total 48.80 812.08 302.53 1,752.99 2,916.41 3.37 110.16 302.65 624.46 1,040.64 52.17 922.24 605.19 2,377.45 3,957.05
Urban Rural Urban and RuralJurisdiction Interstate Arterial Collector Local Total Interstate Arterial Collector Local Total Interstate Arterial Collector Local Total
MassDOT 340.23 232.42 2.92 4.03 579.60 8.76 0.00 5.62 0.00 14.38 348.99 232.42 8.54 4.03 593.97
City/Town 0.00 442.18 276.63 1,863.33 2,582.15 0.00 0.00 15.40 60.70 76.10 0.00 442.18 292.03 1,924.03 2,658.25
DCR 0.00 0.38 0.00 0.00 0.38 0.00 0.00 0.00 0.00 0.00 0.00 0.38 0.00 0.00 0.38
MassPort 0.00 0.00 0.00 0.00 0.00 0.00 0.00 0.00 0.00 0.00 0.00 0.00 0.00 0.00 0.00
State Park 0.00 0.00 4.55 4.80 9.35 0.00 0.00 0.00 0.00 0.00 0.00 0.00 4.55 4.80 9.35
State 0.00 0.00 0.00 0.00 0.00 0.00 0.00 0.00 0.00 0.00 0.00 0.00 0.00 0.00 0.00
County 0.00 0.00 0.00 0.00 0.00 0.00 0.00 0.00 0.00 0.00 0.00 0.00 0.00 0.00 0.00
Combined 0.00 0.00 0.00 0.89 0.89 0.00 0.00 0.00 0.00 0.00 0.00 0.00 0.00 0.89 0.89
Unaccepted 0.00 0.00 0.00 165.07 165.07 0.00 0.00 0.00 4.10 4.10 0.00 0.00 0.00 169.17 169.17
Total 340.23 674.99 284.10 2,038.12 3,337.44 8.76 0.00 21.01 64.80 94.57 348.99 674.99 305.11 2,102.92 3,432.01
Urban Rural Urban and RuralJurisdiction Interstate Arterial Collector Local Total Interstate Arterial Collector Local Total Interstate Arterial Collector Local Total
MassDOT 0.00 4.54 0.00 0.00 4.54 0.00 0.00 8.56 0.00 8.56 0.00 4.54 8.56 0.00 13.10
City/Town 0.00 11.47 22.37 73.32 107.16 0.00 0.00 31.17 54.11 85.28 0.00 11.47 53.54 127.43 192.44
DCR 0.00 0.00 0.00 0.00 0.00 0.00 0.00 0.00 0.00 0.00 0.00 0.00 0.00 0.00 0.00
MassPort 0.00 0.00 0.00 0.00 0.00 0.00 0.00 0.00 0.00 0.00 0.00 0.00 0.00 0.00 0.00
State Park 0.00 0.00 0.00 0.00 0.00 0.00 0.00 0.00 0.00 0.00 0.00 0.00 0.00 0.00 0.00
State 0.00 0.00 0.00 0.00 0.00 0.00 0.00 0.00 0.00 0.00 0.00 0.00 0.00 0.00 0.00
County 0.00 0.00 0.00 0.00 0.00 0.00 0.00 0.00 0.00 0.00 0.00 0.00 0.00 0.00 0.00
Combined 0.00 0.00 0.00 0.00 0.00 0.00 0.00 0.00 0.00 0.00 0.00 0.00 0.00 0.00 0.00
Unaccepted 0.00 0.00 0.00 7.42 7.42 0.00 0.00 0.00 8.06 8.06 0.00 0.00 0.00 15.48 15.48
Total 0.00 16.01 22.37 80.74 119.11 0.00 0.00 39.73 62.17 101.90 0.00 16.01 62.09 142.91 221.02
Montachusett
Merrimack Valley
Nantucket

ROAD INVENTORY YEAR END REPORT 2020LANE MILES TABLE 10
JURISDICTION BY FUNCTIONAL CLASSIFICATION (BY MPO)
Massachusetts Department of TransportationOffice of Transportation Planning 62 / 109
Urban Rural Urban and RuralJurisdiction Interstate Arterial Collector Local Total Interstate Arterial Collector Local Total Interstate Arterial Collector Local Total
MassDOT 88.23 248.00 1.65 2.51 340.38 0.00 0.00 0.00 0.00 0.00 88.23 248.00 1.65 2.51 340.38
City/Town 0.00 433.02 229.05 1,599.49 2,261.57 0.00 1.98 4.24 50.21 56.43 0.00 435.01 233.29 1,649.70 2,317.99
DCR 0.00 0.00 0.00 0.00 0.00 0.00 0.00 0.00 0.00 0.00 0.00 0.00 0.00 0.00 0.00
MassPort 0.00 0.00 0.00 0.00 0.00 0.00 0.00 0.00 0.00 0.00 0.00 0.00 0.00 0.00 0.00
State Park 0.00 0.00 0.00 0.62 0.62 0.00 0.00 0.00 0.00 0.00 0.00 0.00 0.00 0.62 0.62
State 0.00 0.00 0.00 0.00 0.00 0.00 0.00 0.00 0.00 0.00 0.00 0.00 0.00 0.00 0.00
County 0.00 0.00 0.00 0.00 0.00 0.00 0.00 0.00 0.00 0.00 0.00 0.00 0.00 0.00 0.00
Combined 0.00 0.00 0.00 0.00 0.00 0.00 0.00 0.00 0.00 0.00 0.00 0.00 0.00 0.00 0.00
Unaccepted 0.00 3.10 0.40 187.23 190.74 0.00 0.00 0.00 0.00 0.00 0.00 3.10 0.40 187.23 190.74
Total 88.23 684.13 231.10 1,789.86 2,793.31 0.00 1.98 4.24 50.21 56.43 88.23 686.11 235.33 1,840.07 2,849.74
Urban Rural Urban and RuralJurisdiction Interstate Arterial Collector Local Total Interstate Arterial Collector Local Total Interstate Arterial Collector Local Total
MassDOT 7.08 445.74 5.27 1.62 459.72 0.00 5.98 0.00 0.00 5.98 7.08 451.72 5.27 1.62 465.70
City/Town 0.00 527.80 510.66 2,025.83 3,064.29 0.00 0.00 23.26 32.16 55.42 0.00 527.80 533.92 2,057.99 3,119.71
DCR 0.00 0.00 0.00 0.00 0.00 0.00 0.00 0.00 0.00 0.00 0.00 0.00 0.00 0.00 0.00
MassPort 0.00 0.00 0.00 0.00 0.00 0.00 0.00 0.00 0.00 0.00 0.00 0.00 0.00 0.00 0.00
State Park 0.00 0.00 0.00 68.04 68.04 0.00 0.00 0.00 0.00 0.00 0.00 0.00 0.00 68.04 68.04
State 0.00 0.00 0.00 13.01 13.01 0.00 0.00 0.00 0.00 0.00 0.00 0.00 0.00 13.01 13.01
County 0.00 0.00 0.00 3.27 3.27 0.00 0.00 0.00 0.00 0.00 0.00 0.00 0.00 3.27 3.27
Combined 0.00 0.00 0.00 4.15 4.15 0.00 0.00 0.00 0.00 0.00 0.00 0.00 0.00 4.15 4.15
Unaccepted 0.00 0.12 6.54 487.47 494.14 0.00 0.00 0.00 1.40 1.40 0.00 0.12 6.54 488.87 495.53
Total 7.08 973.67 522.47 2,603.39 4,106.61 0.00 5.98 23.26 33.56 62.80 7.08 979.65 545.73 2,636.94 4,169.41
Urban Rural Urban and RuralJurisdiction Interstate Arterial Collector Local Total Interstate Arterial Collector Local Total Interstate Arterial Collector Local Total
MassDOT 331.46 342.69 7.68 2.33 684.16 69.64 165.81 52.58 3.89 291.92 401.10 508.50 60.26 6.23 976.08
City/Town 0.00 1,132.86 541.27 3,212.79 4,886.92 0.00 77.76 634.66 1,232.59 1,945.01 0.00 1,210.62 1,175.93 4,445.37 6,831.93
DCR 0.00 0.00 0.00 0.49 0.49 0.00 0.00 0.00 50.20 50.20 0.00 0.00 0.00 50.69 50.69
MassPort 0.00 0.00 0.00 0.00 0.00 0.00 0.00 0.00 0.00 0.00 0.00 0.00 0.00 0.00 0.00
State Park 0.00 0.00 0.00 37.82 37.82 0.00 0.00 0.00 22.79 22.79 0.00 0.00 0.00 60.61 60.61
State 0.00 7.14 1.73 29.22 38.09 0.00 0.00 0.00 3.14 3.14 0.00 7.14 1.73 32.36 41.23
County 0.00 0.00 0.00 0.00 0.00 0.00 0.00 0.00 0.00 0.00 0.00 0.00 0.00 0.00 0.00
Combined 0.00 0.00 0.00 35.34 35.34 0.00 0.00 0.00 5.52 5.52 0.00 0.00 0.00 40.86 40.86
Unaccepted 0.00 0.00 0.94 435.09 436.03 0.00 0.00 0.00 68.99 68.99 0.00 0.00 0.94 504.08 505.02
Total 331.46 1,482.69 551.62 3,753.07 6,118.84 69.64 243.57 687.24 1,387.13 2,387.58 401.10 1,726.26 1,238.86 5,140.21 8,506.42
Northern Middlesex
Old Colony
Pioneer Valley

ROAD INVENTORY YEAR END REPORT 2020LANE MILES TABLE 10
JURISDICTION BY FUNCTIONAL CLASSIFICATION (BY MPO)
Massachusetts Department of TransportationOffice of Transportation Planning 63 / 109
Urban Rural Urban and RuralJurisdiction Interstate Arterial Collector Local Total Interstate Arterial Collector Local Total Interstate Arterial Collector Local Total
MassDOT 462.05 773.95 11.43 17.23 1,264.66 0.00 0.00 9.65 0.24 9.89 462.05 773.95 21.07 17.47 1,274.54
City/Town 0.00 847.63 600.63 4,229.79 5,678.04 0.00 0.00 48.32 206.98 255.30 0.00 847.63 648.95 4,436.76 5,933.35
DCR 0.00 0.00 0.00 0.00 0.00 0.00 0.00 0.00 0.00 0.00 0.00 0.00 0.00 0.00 0.00
MassPort 0.00 0.00 0.00 0.00 0.00 0.00 0.00 0.00 0.00 0.00 0.00 0.00 0.00 0.00 0.00
State Park 0.00 3.49 0.00 37.59 41.07 0.00 0.00 0.00 0.61 0.61 0.00 3.49 0.00 38.20 41.69
State 0.00 0.00 0.00 9.30 9.30 0.00 0.00 0.00 0.00 0.00 0.00 0.00 0.00 9.30 9.30
County 0.00 0.00 0.00 0.39 0.39 0.00 0.00 0.00 0.00 0.00 0.00 0.00 0.00 0.39 0.39
Combined 0.00 0.00 0.00 0.00 0.00 0.00 0.00 0.00 0.00 0.00 0.00 0.00 0.00 0.00 0.00
Unaccepted 0.00 1.93 1.48 359.27 362.68 0.00 0.00 0.00 7.88 7.88 0.00 1.93 1.48 367.16 370.57
Total 462.05 1,627.00 613.53 4,653.57 7,356.15 0.00 0.00 57.97 215.72 273.69 462.05 1,627.00 671.50 4,869.28 7,629.84
Urban Rural Urban and RuralJurisdiction Interstate Arterial Collector Local Total Interstate Arterial Collector Local Total Interstate Arterial Collector Local Total
MassDOT 2,919.52 5,163.44 72.88 72.98 8,228.82 270.88 700.55 311.59 33.43 1,316.45 3,190.39 5,863.99 384.47 106.41 9,545.27
City/Town 0.00 9,131.62 5,993.78 33,767.92 48,893.31 0.00 200.36 2,599.86 5,650.69 8,450.92 0.00 9,331.98 8,593.64 39,418.61 57,344.23
DCR 0.00 344.75 9.91 33.16 387.82 0.00 0.00 0.00 134.74 134.74 0.00 344.75 9.91 167.90 522.55
MassPort 0.00 15.16 0.00 3.09 18.26 0.00 0.00 0.00 0.00 0.00 0.00 15.16 0.00 3.09 18.26
State Park 0.00 3.49 4.55 208.30 216.33 0.00 0.00 10.18 141.37 151.55 0.00 3.49 14.73 349.67 367.88
State 0.00 7.14 3.16 130.27 140.57 0.00 0.00 0.00 11.68 11.68 0.00 7.14 3.16 141.96 152.25
County 0.00 0.00 0.01 7.51 7.52 0.00 0.00 0.00 0.00 0.00 0.00 0.00 0.01 7.51 7.52
Combined 0.00 9.84 1.28 161.56 172.67 0.00 0.00 11.50 24.59 36.09 0.00 9.84 12.77 186.15 208.76
Unaccepted 0.00 11.29 27.12 4,602.27 4,640.68 0.00 0.00 0.17 286.93 287.09 0.00 11.29 27.29 4,889.20 4,927.78
Total 2,919.52 14,686.72 6,112.69 38,987.06 62,705.98 270.88 900.91 2,933.29 6,283.44 10,388.52 3,190.39 15,587.63 9,045.98 45,270.49 73,094.50
Southeastern Massachusetts
Total Massachusetts

ROAD INVENTORY YEAR END REPORT 2020LANE MILES TABLE 11
JURISDICTION BY FUNDING CATEGORY (BY MPO)
Massachusetts Department of TransportationOffice of Transportation Planning 64 / 109
Berkshire
Boston Region
Cape Cod
Jurisdiction National HighwaySystem
Surface TransportationProgram
Total Federal Aid State & Local Aid Grand Total
MassDOT 497.37 81.65 579.02 20.70 599.72
City/Town Accepted 52.83 555.59 608.41 2,153.29 2,761.70
DCR 0.00 0.00 0.00 0.00 0.00
MassPort 0.00 0.00 0.00 0.00 0.00
State Park 0.00 0.00 0.00 60.01 60.01
State Institutional 0.00 0.00 0.00 2.58 2.58
County Institutional 0.00 0.00 0.00 0.00 0.00
Combined Federal 0.00 0.00 0.00 0.00 0.00
Unaccepted 0.00 0.88 0.88 88.83 89.71
Total 550.20 638.12 1,188.32 2,325.41 3,513.72
Jurisdiction National HighwaySystem
Surface TransportationProgram
Total Federal Aid State & Local Aid Grand Total
MassDOT 2,393.45 287.47 2,680.92 12.72 2,693.64
City/Town Accepted 1,104.31 4,630.01 5,734.32 12,696.44 18,430.76
DCR 195.68 158.86 354.53 32.41 386.94
MassPort 11.70 4.93 16.63 1.63 18.26
State Park 0.00 0.83 0.83 8.47 9.30
State Institutional 0.00 0.00 0.00 39.95 39.95
County Institutional 0.00 0.00 0.00 0.05 0.05
Combined Federal 0.00 1.28 1.28 8.54 9.81
Unaccepted 0.81 10.57 11.38 1,487.25 1,498.63
Total 3,705.96 5,093.94 8,799.90 14,287.46 23,087.35
Jurisdiction National HighwaySystem
Surface TransportationProgram
Total Federal Aid State & Local Aid Grand Total
MassDOT 358.46 105.87 464.33 1.37 465.70
City/Town Accepted 120.75 929.18 1,049.93 2,069.78 3,119.71
DCR 0.00 0.00 0.00 0.00 0.00
MassPort 0.00 0.00 0.00 0.00 0.00
State Park 0.00 0.00 0.00 68.04 68.04
State Institutional 0.00 0.00 0.00 13.01 13.01
County Institutional 0.00 0.00 0.00 3.27 3.27
Combined Federal 0.00 0.00 0.00 4.15 4.15
Unaccepted 1.40 6.66 8.07 487.47 495.53
Total 480.61 1,041.72 1,522.32 2,647.08 4,169.41

ROAD INVENTORY YEAR END REPORT 2020LANE MILES TABLE 11
JURISDICTION BY FUNDING CATEGORY (BY MPO)
Massachusetts Department of TransportationOffice of Transportation Planning 65 / 109
Central Massachusetts
Franklin
Martha's Vineyard
Jurisdiction National HighwaySystem
Surface TransportationProgram
Total Federal Aid State & Local Aid Grand Total
MassDOT 890.15 178.10 1,068.25 23.63 1,091.88
City/Town Accepted 201.20 1,497.11 1,698.31 4,396.98 6,095.29
DCR 0.00 0.00 0.00 18.65 18.65
MassPort 0.00 0.00 0.00 0.00 0.00
State Park 0.00 0.00 0.00 29.02 29.02
State Institutional 0.00 1.43 1.43 11.65 13.08
County Institutional 0.00 0.01 0.01 0.00 0.01
Combined Federal 0.00 0.00 0.00 4.08 4.08
Unaccepted 0.25 0.81 1.06 319.64 320.71
Total 1,091.61 1,677.46 2,769.07 4,803.66 7,572.72
Jurisdiction National HighwaySystem
Surface TransportationProgram
Total Federal Aid State & Local Aid Grand Total
MassDOT 295.83 115.99 411.82 7.23 419.05
City/Town Accepted 38.36 469.27 507.63 1,672.19 2,179.82
DCR 0.00 0.00 0.00 64.72 64.72
MassPort 0.00 0.00 0.00 0.00 0.00
State Park 0.00 0.31 0.31 47.92 48.23
State Institutional 0.00 0.00 0.00 1.11 1.11
County Institutional 0.00 0.00 0.00 0.00 0.00
Combined Federal 0.00 0.00 0.00 0.00 0.00
Unaccepted 0.00 0.00 0.00 78.70 78.70
Total 334.19 585.56 919.76 1,871.87 2,791.62
Jurisdiction National HighwaySystem
Surface TransportationProgram
Total Federal Aid State & Local Aid Grand Total
MassDOT 6.97 60.61 67.58 1.93 69.51
City/Town Accepted 13.80 26.37 40.18 219.92 260.09
DCR 0.00 0.00 0.00 0.00 0.00
MassPort 0.00 0.00 0.00 0.00 0.00
State Park 0.00 0.00 0.00 0.00 0.00
State Institutional 0.00 0.00 0.00 0.00 0.00
County Institutional 0.00 0.00 0.00 0.60 0.60
Combined Federal 0.00 0.00 0.00 0.93 0.93
Unaccepted 0.00 0.00 0.00 11.65 11.65
Total 20.77 86.98 107.75 235.04 342.79
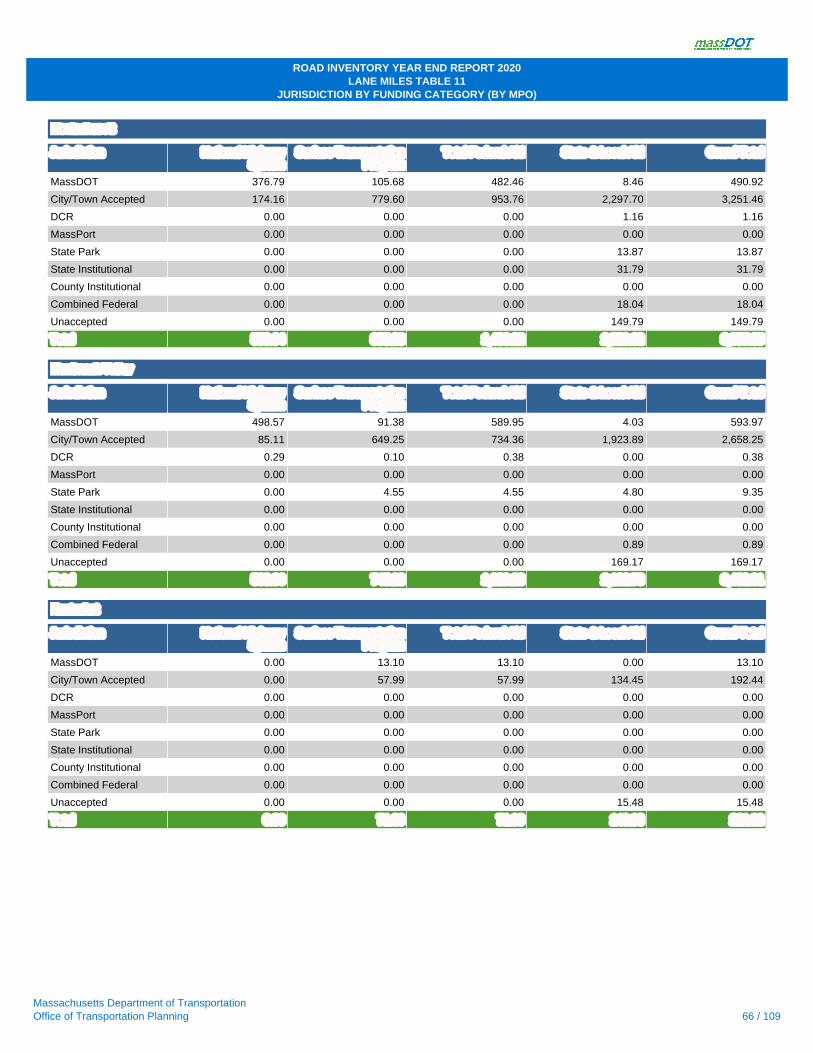
ROAD INVENTORY YEAR END REPORT 2020LANE MILES TABLE 11
JURISDICTION BY FUNDING CATEGORY (BY MPO)
Massachusetts Department of TransportationOffice of Transportation Planning 66 / 109
Montachusett
Merrimack Valley
Nantucket
Jurisdiction National HighwaySystem
Surface TransportationProgram
Total Federal Aid State & Local Aid Grand Total
MassDOT 376.79 105.68 482.46 8.46 490.92
City/Town Accepted 174.16 779.60 953.76 2,297.70 3,251.46
DCR 0.00 0.00 0.00 1.16 1.16
MassPort 0.00 0.00 0.00 0.00 0.00
State Park 0.00 0.00 0.00 13.87 13.87
State Institutional 0.00 0.00 0.00 31.79 31.79
County Institutional 0.00 0.00 0.00 0.00 0.00
Combined Federal 0.00 0.00 0.00 18.04 18.04
Unaccepted 0.00 0.00 0.00 149.79 149.79
Total 550.94 885.28 1,436.22 2,520.82 3,957.05
Jurisdiction National HighwaySystem
Surface TransportationProgram
Total Federal Aid State & Local Aid Grand Total
MassDOT 498.57 91.38 589.95 4.03 593.97
City/Town Accepted 85.11 649.25 734.36 1,923.89 2,658.25
DCR 0.29 0.10 0.38 0.00 0.38
MassPort 0.00 0.00 0.00 0.00 0.00
State Park 0.00 4.55 4.55 4.80 9.35
State Institutional 0.00 0.00 0.00 0.00 0.00
County Institutional 0.00 0.00 0.00 0.00 0.00
Combined Federal 0.00 0.00 0.00 0.89 0.89
Unaccepted 0.00 0.00 0.00 169.17 169.17
Total 583.96 745.28 1,329.23 2,102.78 3,432.01
Jurisdiction National HighwaySystem
Surface TransportationProgram
Total Federal Aid State & Local Aid Grand Total
MassDOT 0.00 13.10 13.10 0.00 13.10
City/Town Accepted 0.00 57.99 57.99 134.45 192.44
DCR 0.00 0.00 0.00 0.00 0.00
MassPort 0.00 0.00 0.00 0.00 0.00
State Park 0.00 0.00 0.00 0.00 0.00
State Institutional 0.00 0.00 0.00 0.00 0.00
County Institutional 0.00 0.00 0.00 0.00 0.00
Combined Federal 0.00 0.00 0.00 0.00 0.00
Unaccepted 0.00 0.00 0.00 15.48 15.48
Total 0.00 71.09 71.09 149.93 221.02
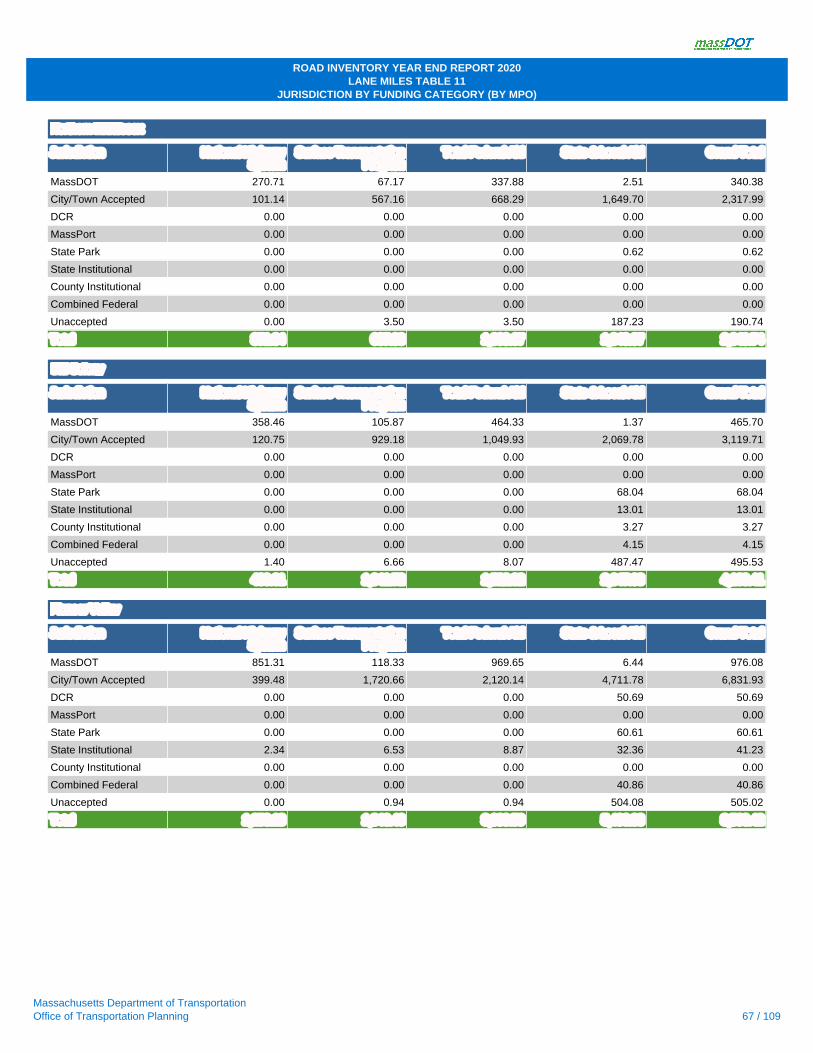
ROAD INVENTORY YEAR END REPORT 2020LANE MILES TABLE 11
JURISDICTION BY FUNDING CATEGORY (BY MPO)
Massachusetts Department of TransportationOffice of Transportation Planning 67 / 109
Northern Middlesex
Old Colony
Pioneer Valley
Jurisdiction National HighwaySystem
Surface TransportationProgram
Total Federal Aid State & Local Aid Grand Total
MassDOT 270.71 67.17 337.88 2.51 340.38
City/Town Accepted 101.14 567.16 668.29 1,649.70 2,317.99
DCR 0.00 0.00 0.00 0.00 0.00
MassPort 0.00 0.00 0.00 0.00 0.00
State Park 0.00 0.00 0.00 0.62 0.62
State Institutional 0.00 0.00 0.00 0.00 0.00
County Institutional 0.00 0.00 0.00 0.00 0.00
Combined Federal 0.00 0.00 0.00 0.00 0.00
Unaccepted 0.00 3.50 3.50 187.23 190.74
Total 371.84 637.83 1,009.67 1,840.07 2,849.74
Jurisdiction National HighwaySystem
Surface TransportationProgram
Total Federal Aid State & Local Aid Grand Total
MassDOT 358.46 105.87 464.33 1.37 465.70
City/Town Accepted 120.75 929.18 1,049.93 2,069.78 3,119.71
DCR 0.00 0.00 0.00 0.00 0.00
MassPort 0.00 0.00 0.00 0.00 0.00
State Park 0.00 0.00 0.00 68.04 68.04
State Institutional 0.00 0.00 0.00 13.01 13.01
County Institutional 0.00 0.00 0.00 3.27 3.27
Combined Federal 0.00 0.00 0.00 4.15 4.15
Unaccepted 1.40 6.66 8.07 487.47 495.53
Total 480.61 1,041.72 1,522.32 2,647.08 4,169.41
Jurisdiction National HighwaySystem
Surface TransportationProgram
Total Federal Aid State & Local Aid Grand Total
MassDOT 851.31 118.33 969.65 6.44 976.08
City/Town Accepted 399.48 1,720.66 2,120.14 4,711.78 6,831.93
DCR 0.00 0.00 0.00 50.69 50.69
MassPort 0.00 0.00 0.00 0.00 0.00
State Park 0.00 0.00 0.00 60.61 60.61
State Institutional 2.34 6.53 8.87 32.36 41.23
County Institutional 0.00 0.00 0.00 0.00 0.00
Combined Federal 0.00 0.00 0.00 40.86 40.86
Unaccepted 0.00 0.94 0.94 504.08 505.02
Total 1,253.13 1,846.46 3,099.59 5,406.83 8,506.42

ROAD INVENTORY YEAR END REPORT 2020LANE MILES TABLE 11
JURISDICTION BY FUNDING CATEGORY (BY MPO)
Massachusetts Department of TransportationOffice of Transportation Planning 68 / 109
Southeastern Massachusetts
Total Massachusetts
Jurisdiction National HighwaySystem
Surface TransportationProgram
Total Federal Aid State & Local Aid Grand Total
MassDOT 825.37 431.71 1,257.08 17.47 1,274.54
City/Town Accepted 143.97 1,323.79 1,467.76 4,465.58 5,933.35
DCR 0.00 0.00 0.00 0.00 0.00
MassPort 0.00 0.00 0.00 0.00 0.00
State Park 0.00 3.49 3.49 38.20 41.69
State Institutional 0.00 0.00 0.00 9.30 9.30
County Institutional 0.00 0.00 0.00 0.39 0.39
Combined Federal 0.00 0.00 0.00 0.00 0.00
Unaccepted 0.00 3.41 3.41 367.16 370.57
Total 969.34 1,762.40 2,731.74 4,898.10 7,629.84
Jurisdiction National HighwaySystem
Surface TransportationProgram
Total Federal Aid State & Local Aid Grand Total
MassDOT 7,684.29 1,746.45 9,430.74 114.53 9,545.27
City/Town Accepted 2,566.85 14,174.51 16,741.36 40,602.87 57,344.23
DCR 195.96 158.95 354.92 167.64 522.55
MassPort 11.70 4.93 16.63 1.63 18.26
State Park 0.00 13.77 13.77 354.11 367.88
State Institutional 2.34 7.96 10.30 141.96 152.25
County Institutional 0.00 0.01 0.01 7.51 7.52
Combined Federal 4.43 16.56 20.99 187.76 208.76
Unaccepted 2.65 38.23 40.88 4,886.90 4,927.78
Total 10,468.22 16,161.38 26,629.60 46,464.90 73,094.50
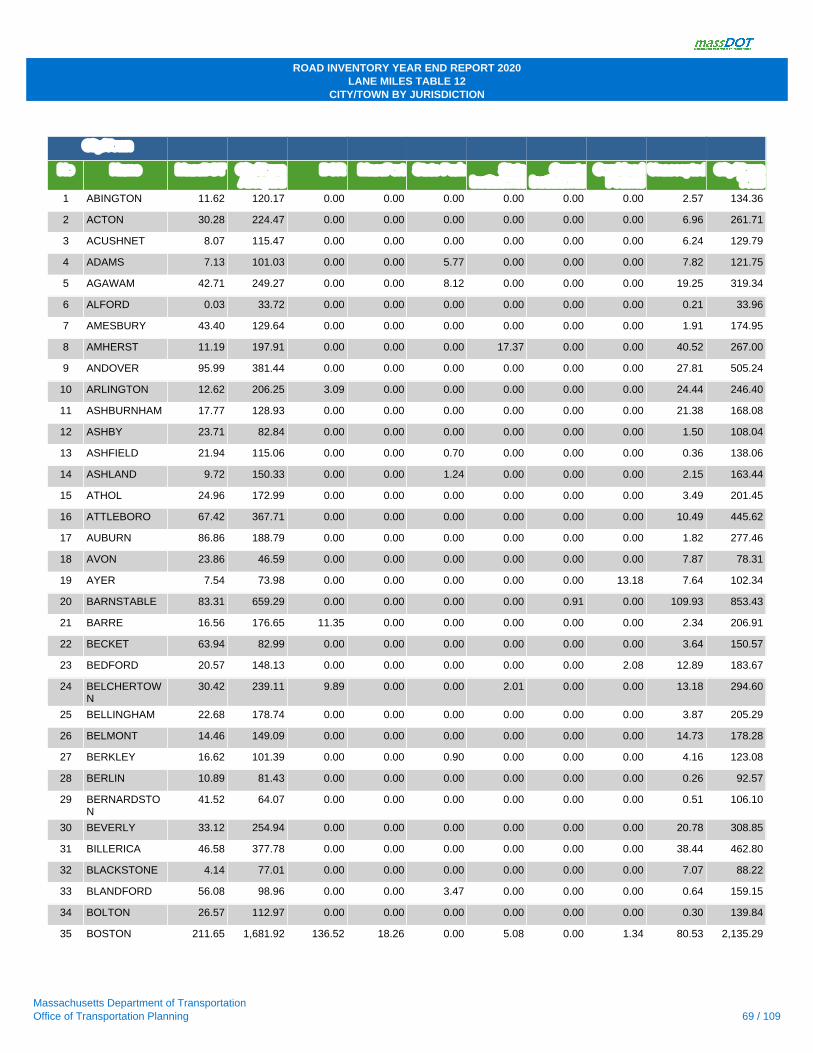
ROAD INVENTORY YEAR END REPORT 2020LANE MILES TABLE 12
CITY/TOWN BY JURISDICTION
Massachusetts Department of TransportationOffice of Transportation Planning 69 / 109
City/Town
No Name MassDOT City/TownAccepted
DCR MassPort State Park StateInstitutional
CountyInstitutional
CombinedFederal
Unaccepted City/TownTotal
1 ABINGTON 11.62 120.17 0.00 0.00 0.00 0.00 0.00 0.00 2.57 134.36
2 ACTON 30.28 224.47 0.00 0.00 0.00 0.00 0.00 0.00 6.96 261.71
3 ACUSHNET 8.07 115.47 0.00 0.00 0.00 0.00 0.00 0.00 6.24 129.79
4 ADAMS 7.13 101.03 0.00 0.00 5.77 0.00 0.00 0.00 7.82 121.75
5 AGAWAM 42.71 249.27 0.00 0.00 8.12 0.00 0.00 0.00 19.25 319.34
6 ALFORD 0.03 33.72 0.00 0.00 0.00 0.00 0.00 0.00 0.21 33.96
7 AMESBURY 43.40 129.64 0.00 0.00 0.00 0.00 0.00 0.00 1.91 174.95
8 AMHERST 11.19 197.91 0.00 0.00 0.00 17.37 0.00 0.00 40.52 267.00
9 ANDOVER 95.99 381.44 0.00 0.00 0.00 0.00 0.00 0.00 27.81 505.24
10 ARLINGTON 12.62 206.25 3.09 0.00 0.00 0.00 0.00 0.00 24.44 246.40
11 ASHBURNHAM 17.77 128.93 0.00 0.00 0.00 0.00 0.00 0.00 21.38 168.08
12 ASHBY 23.71 82.84 0.00 0.00 0.00 0.00 0.00 0.00 1.50 108.04
13 ASHFIELD 21.94 115.06 0.00 0.00 0.70 0.00 0.00 0.00 0.36 138.06
14 ASHLAND 9.72 150.33 0.00 0.00 1.24 0.00 0.00 0.00 2.15 163.44
15 ATHOL 24.96 172.99 0.00 0.00 0.00 0.00 0.00 0.00 3.49 201.45
16 ATTLEBORO 67.42 367.71 0.00 0.00 0.00 0.00 0.00 0.00 10.49 445.62
17 AUBURN 86.86 188.79 0.00 0.00 0.00 0.00 0.00 0.00 1.82 277.46
18 AVON 23.86 46.59 0.00 0.00 0.00 0.00 0.00 0.00 7.87 78.31
19 AYER 7.54 73.98 0.00 0.00 0.00 0.00 0.00 13.18 7.64 102.34
20 BARNSTABLE 83.31 659.29 0.00 0.00 0.00 0.00 0.91 0.00 109.93 853.43
21 BARRE 16.56 176.65 11.35 0.00 0.00 0.00 0.00 0.00 2.34 206.91
22 BECKET 63.94 82.99 0.00 0.00 0.00 0.00 0.00 0.00 3.64 150.57
23 BEDFORD 20.57 148.13 0.00 0.00 0.00 0.00 0.00 2.08 12.89 183.67
24 BELCHERTOWN
30.42 239.11 9.89 0.00 0.00 2.01 0.00 0.00 13.18 294.60
25 BELLINGHAM 22.68 178.74 0.00 0.00 0.00 0.00 0.00 0.00 3.87 205.29
26 BELMONT 14.46 149.09 0.00 0.00 0.00 0.00 0.00 0.00 14.73 178.28
27 BERKLEY 16.62 101.39 0.00 0.00 0.90 0.00 0.00 0.00 4.16 123.08
28 BERLIN 10.89 81.43 0.00 0.00 0.00 0.00 0.00 0.00 0.26 92.57
29 BERNARDSTON
41.52 64.07 0.00 0.00 0.00 0.00 0.00 0.00 0.51 106.10
30 BEVERLY 33.12 254.94 0.00 0.00 0.00 0.00 0.00 0.00 20.78 308.85
31 BILLERICA 46.58 377.78 0.00 0.00 0.00 0.00 0.00 0.00 38.44 462.80
32 BLACKSTONE 4.14 77.01 0.00 0.00 0.00 0.00 0.00 0.00 7.07 88.22
33 BLANDFORD 56.08 98.96 0.00 0.00 3.47 0.00 0.00 0.00 0.64 159.15
34 BOLTON 26.57 112.97 0.00 0.00 0.00 0.00 0.00 0.00 0.30 139.84
35 BOSTON 211.65 1,681.92 136.52 18.26 0.00 5.08 0.00 1.34 80.53 2,135.29

ROAD INVENTORY YEAR END REPORT 2020LANE MILES TABLE 12
CITY/TOWN BY JURISDICTION
Massachusetts Department of TransportationOffice of Transportation Planning 70 / 109
City/Town
No Name MassDOT City/TownAccepted
DCR MassPort State Park StateInstitutional
CountyInstitutional
CombinedFederal
Unaccepted City/TownTotal
36 BOURNE 97.11 194.41 0.00 0.00 0.00 0.00 2.29 45.92 62.55 402.28
37 BOXBOROUGH 29.34 63.46 0.00 0.00 0.00 0.00 0.00 0.00 0.59 93.38
38 BOXFORD 41.51 173.76 0.38 0.00 0.00 0.00 0.00 0.00 7.03 222.69
39 BOYLSTON 18.22 74.65 0.00 0.00 0.00 2.10 0.01 0.00 4.15 99.14
40 BRAINTREE 55.88 210.09 0.24 0.00 0.00 0.00 0.00 0.00 45.16 311.37
41 BREWSTER 21.67 111.81 0.00 0.00 21.65 0.00 0.00 0.00 165.41 320.55
42 BRIDGEWATER
37.73 224.55 0.00 0.00 0.00 12.15 0.00 0.00 9.40 283.83
43 BRIMFIELD 47.10 108.75 0.00 0.00 0.00 0.00 0.00 0.00 0.58 156.43
44 BROCKTON 43.66 489.41 0.00 0.00 0.00 0.00 0.00 4.15 60.98 598.19
45 BROOKFIELD 5.33 67.69 0.00 0.00 0.00 0.00 0.00 0.00 1.43 74.45
46 BROOKLINE 12.92 199.95 7.91 0.00 0.00 0.00 0.00 0.00 14.95 235.73
47 BUCKLAND 12.36 61.61 0.00 0.00 0.00 0.00 0.00 0.00 1.40 75.36
48 BURLINGTON 45.78 212.40 0.00 0.00 0.00 0.00 0.00 0.00 10.73 268.91
49 CAMBRIDGE 11.36 251.68 31.56 0.00 0.00 0.00 0.00 0.00 14.80 309.40
50 CANTON 53.54 187.67 3.16 0.00 0.00 0.00 0.00 0.00 11.41 255.77
51 CARLISLE 0.22 99.19 0.00 0.00 0.00 0.00 0.00 0.00 0.85 100.26
52 CARVER 14.27 149.61 0.00 0.00 16.15 0.00 0.00 0.00 9.03 189.06
53 CHARLEMONT 24.17 72.63 0.00 0.00 1.98 0.00 0.00 0.00 0.75 99.53
54 CHARLTON 81.33 205.70 0.00 0.00 0.00 0.00 0.00 0.00 16.49 303.51
55 CHATHAM 14.90 128.79 0.00 0.00 0.00 0.00 0.00 0.00 73.36 217.05
56 CHELMSFORD 93.44 340.70 0.00 0.00 0.00 0.00 0.00 0.00 12.35 446.49
57 CHELSEA 20.03 86.96 0.92 0.00 0.00 0.00 0.00 0.00 0.22 108.13
58 CHESHIRE 14.55 78.07 0.00 0.00 2.19 0.00 0.00 0.00 3.95 98.76
59 CHESTER 12.92 89.03 0.00 0.00 1.10 0.00 0.00 0.00 0.49 103.54
60 CHESTERFIELD
0.14 85.97 0.00 0.00 0.26 0.00 0.00 0.00 6.11 92.48
61 CHICOPEE 78.10 381.53 0.00 0.00 3.16 0.00 0.00 31.69 64.71 559.19
62 CHILMARK 15.54 25.36 0.00 0.00 0.00 0.00 0.00 0.00 0.00 40.90
63 CLARKSBURG 5.67 30.26 0.00 0.00 0.00 0.00 0.00 0.00 1.84 37.76
64 CLINTON 2.89 94.62 0.00 0.00 0.00 0.00 0.00 0.00 5.50 103.01
65 COHASSET 6.56 64.62 0.00 0.00 0.00 0.00 0.00 0.00 22.48 93.67
66 COLRAIN 8.19 101.02 0.00 0.00 1.18 0.00 0.00 0.00 4.08 114.47
67 CONCORD 23.59 209.82 0.00 0.00 0.00 1.51 0.00 0.00 26.86 261.78
68 CONWAY 12.88 93.51 0.00 0.00 0.00 0.00 0.00 0.00 0.31 106.70
69 CUMMINGTON 19.97 73.85 0.00 0.00 0.00 0.00 0.00 1.48 2.66 97.95
70 DALTON 10.66 78.30 0.00 0.00 0.00 0.00 0.00 0.00 2.63 91.58
71 DANVERS 64.29 212.90 0.00 0.00 0.00 3.78 0.00 0.00 8.46 289.43

ROAD INVENTORY YEAR END REPORT 2020LANE MILES TABLE 12
CITY/TOWN BY JURISDICTION
Massachusetts Department of TransportationOffice of Transportation Planning 71 / 109
City/Town
No Name MassDOT City/TownAccepted
DCR MassPort State Park StateInstitutional
CountyInstitutional
CombinedFederal
Unaccepted City/TownTotal
72 DARTMOUTH 49.15 396.15 0.00 0.00 0.61 6.70 0.00 0.00 21.65 474.26
73 DEDHAM 58.91 168.43 0.98 0.00 0.00 1.48 0.00 0.00 19.09 248.89
74 DEERFIELD 53.55 132.30 0.00 0.00 1.17 0.00 0.00 0.00 2.17 189.19
75 DENNIS 23.50 287.85 0.00 0.00 0.00 0.00 0.00 0.00 86.29 397.64
76 DIGHTON 12.75 117.99 0.00 0.00 0.00 0.00 0.00 0.00 1.89 132.63
77 DOUGLAS 5.22 119.39 0.00 0.00 2.82 0.00 0.00 0.00 4.20 131.63
78 DOVER 0.04 114.45 0.02 0.00 0.00 0.00 0.00 0.00 5.20 119.70
79 DRACUT 14.62 272.34 0.00 0.00 0.00 0.00 0.00 0.00 27.81 314.78
80 DUDLEY 14.18 152.12 0.00 0.00 0.00 0.00 0.00 0.00 2.43 168.73
81 DUNSTABLE 0.00 68.88 0.00 0.00 0.00 0.00 0.00 0.00 0.28 69.16
82 DUXBURY 44.59 205.40 0.00 0.00 0.00 0.00 0.00 0.00 14.22 264.21
83 EASTBRIDGEWATER
8.38 128.35 0.00 0.00 0.00 0.00 0.00 0.00 21.95 158.68
84 EASTBROOKFIELD
13.20 37.90 0.00 0.00 0.00 0.00 0.00 0.00 2.44 53.54
85 EASTLONGMEADOW
0.00 195.88 0.00 0.00 0.00 0.00 0.00 0.00 4.18 200.07
86 EASTHAM 24.02 100.87 0.00 0.00 0.00 0.00 0.00 8.90 58.24 192.03
87 EASTHAMPTON
6.79 163.98 0.00 0.00 4.59 0.00 0.00 0.00 6.59 181.95
88 EASTON 17.68 233.07 0.00 0.00 0.00 0.00 0.00 0.00 14.87 265.63
89 EDGARTOWN 14.30 79.74 0.00 0.00 0.00 0.00 0.24 0.00 0.78 95.05
90 EGREMONT 12.35 64.50 0.00 0.00 0.00 0.00 0.00 0.00 2.50 79.34
91 ERVING 28.14 31.79 0.00 0.00 7.64 0.00 0.00 0.00 1.03 68.59
92 ESSEX 8.00 42.14 0.00 0.00 0.00 0.00 0.00 0.00 2.23 52.36
93 EVERETT 10.55 116.86 1.97 0.00 0.00 0.00 0.00 0.00 6.41 135.79
94 FAIRHAVEN 36.42 161.95 0.00 0.00 0.00 0.00 0.00 0.00 25.98 224.35
95 FALL RIVER 76.72 463.23 0.00 0.00 0.00 0.00 0.00 0.00 46.80 586.75
96 FALMOUTH 60.93 443.94 0.00 0.00 0.00 0.00 0.00 0.00 154.83 659.69
97 FITCHBURG 25.76 351.39 0.00 0.00 0.00 0.00 0.00 0.00 22.47 399.61
98 FLORIDA 14.32 63.57 0.00 0.00 0.00 0.00 0.00 0.00 0.05 77.94
99 FOXBOROUGH 67.20 176.02 0.00 0.00 0.00 0.00 0.00 0.00 7.59 250.80
100 FRAMINGHAM 69.20 434.48 0.00 0.00 0.00 1.14 0.00 0.00 15.34 520.16
101 FRANKLIN 43.11 274.21 0.00 0.00 0.00 0.00 0.00 0.00 45.92 363.25
102 FREETOWN 46.18 151.42 0.00 0.00 17.07 0.00 0.00 0.00 6.09 220.76
103 GARDNER 35.43 185.61 0.00 0.00 0.00 7.12 0.00 0.00 8.51 236.67
104 AQUINNAH 8.23 16.05 0.00 0.00 0.00 0.00 0.00 0.93 1.27 26.49
105 GEORGETOWN
29.57 108.03 0.00 0.00 0.00 0.00 0.00 0.89 6.15 144.63

ROAD INVENTORY YEAR END REPORT 2020LANE MILES TABLE 12
CITY/TOWN BY JURISDICTION
Massachusetts Department of TransportationOffice of Transportation Planning 72 / 109
City/Town
No Name MassDOT City/TownAccepted
DCR MassPort State Park StateInstitutional
CountyInstitutional
CombinedFederal
Unaccepted City/TownTotal
106 GILL 8.30 60.66 0.00 0.00 0.27 0.00 0.00 0.00 2.95 72.18
107 GLOUCESTER 40.05 166.80 0.00 0.00 0.00 0.00 0.00 0.00 99.30 306.16
108 GOSHEN 14.32 40.85 0.00 0.00 7.77 0.00 0.00 0.00 6.08 69.02
109 GOSNOLD 0.00 3.86 0.00 0.00 0.00 0.00 0.00 0.00 0.00 3.86
110 GRAFTON 47.82 163.68 0.00 0.00 0.00 2.49 0.00 0.00 4.81 218.79
111 GRANBY 15.47 111.48 0.31 0.00 0.00 0.00 0.00 0.00 3.41 130.67
112 GRANVILLE 0.23 110.18 0.00 0.00 1.19 0.00 0.00 0.00 8.31 119.90
113 GREATBARRINGTON
27.26 144.35 0.00 0.00 6.34 0.00 0.00 0.00 0.70 178.64
114 GREENFIELD 54.73 200.98 0.00 0.00 0.00 1.11 0.00 0.00 14.21 271.03
115 GROTON 10.99 192.18 0.00 0.00 0.00 0.00 0.00 0.00 7.33 210.50
116 GROVELAND 3.56 82.24 0.00 0.00 0.00 0.00 0.00 0.00 1.06 86.86
117 HADLEY 26.62 125.80 0.00 0.00 2.45 7.67 0.00 0.00 1.63 164.17
118 HALIFAX 0.00 101.22 0.00 0.00 0.00 0.00 0.00 0.00 12.83 114.05
119 HAMILTON 7.01 84.81 0.00 0.00 0.00 0.00 0.00 0.00 5.75 97.57
120 HAMPDEN 0.00 105.34 0.00 0.00 0.00 0.00 0.00 0.00 1.55 106.89
121 HANCOCK 24.24 21.94 0.00 0.00 2.13 0.00 0.00 0.00 0.45 48.77
122 HANOVER 25.65 172.19 0.00 0.00 0.00 0.00 0.00 0.00 2.95 200.80
123 HANSON 0.01 119.79 0.00 0.00 0.00 0.00 1.22 0.00 8.08 129.10
124 HARDWICK 1.80 125.40 0.00 0.00 0.00 0.00 0.00 0.00 0.00 127.21
125 HARVARD 36.94 122.94 0.00 0.00 0.00 0.00 0.00 0.78 2.48 163.13
126 HARWICH 26.59 279.35 0.00 0.00 0.00 0.00 0.00 0.00 20.97 326.90
127 HATFIELD 22.87 77.05 0.00 0.00 0.00 0.01 0.00 0.00 2.03 101.96
128 HAVERHILL 76.87 447.29 0.00 0.00 0.00 0.00 0.00 0.00 28.74 552.90
129 HAWLEY 0.00 62.53 3.54 0.00 3.47 0.00 0.00 0.00 0.31 69.85
130 HEATH 0.00 77.94 0.00 0.00 1.54 0.00 0.00 0.00 6.04 85.53
131 HINGHAM 38.79 219.57 0.00 0.00 0.00 0.00 0.00 0.00 12.38 270.74
132 HINSDALE 10.19 57.97 0.00 0.00 0.00 0.00 0.00 0.00 2.81 70.97
133 HOLBROOK 4.27 77.37 0.00 0.00 0.00 0.00 0.00 0.00 18.73 100.37
134 HOLDEN 24.15 222.53 0.00 0.00 0.00 0.00 0.00 0.00 1.65 248.33
135 HOLLAND 0.29 68.26 0.00 0.00 0.00 0.00 0.00 0.00 3.93 72.47
136 HOLLISTON 9.72 173.42 0.00 0.00 0.00 0.00 0.00 0.00 6.82 189.96
137 HOLYOKE 63.10 266.87 0.00 0.00 10.69 3.49 0.00 0.00 35.69 379.84
138 HOPEDALE 3.61 56.37 0.00 0.00 0.00 0.00 0.00 0.00 3.29 63.27
139 HOPKINTON 50.21 199.54 0.00 0.00 0.45 0.00 0.00 0.00 17.90 268.10
140 HUBBARDSTON
0.03 136.29 0.00 0.00 0.00 0.00 0.00 0.85 4.76 141.92
141 HUDSON 3.79 171.74 0.00 0.00 0.00 0.00 0.00 0.00 6.18 181.70

ROAD INVENTORY YEAR END REPORT 2020LANE MILES TABLE 12
CITY/TOWN BY JURISDICTION
Massachusetts Department of TransportationOffice of Transportation Planning 73 / 109
City/Town
No Name MassDOT City/TownAccepted
DCR MassPort State Park StateInstitutional
CountyInstitutional
CombinedFederal
Unaccepted City/TownTotal
142 HULL 4.75 100.66 1.42 0.00 0.00 0.00 0.00 0.00 1.66 108.49
143 HUNTINGTON 23.61 72.26 0.00 0.00 0.00 0.00 0.00 4.05 1.79 101.71
144 IPSWICH 16.68 139.32 0.00 0.00 4.54 0.00 0.00 4.60 18.36 183.50
145 KINGSTON 36.09 136.39 0.00 0.00 0.00 0.00 0.00 0.00 45.51 217.99
146 LAKEVILLE 51.90 151.49 0.00 0.00 0.00 0.68 0.00 0.00 27.52 231.59
147 LANCASTER 26.42 124.45 0.00 0.00 0.00 6.01 0.00 0.44 2.46 159.78
148 LANESBOROUGH
21.36 77.30 0.00 0.00 4.88 0.00 0.00 0.00 4.13 107.66
149 LAWRENCE 22.18 250.09 0.00 0.00 0.00 0.00 0.00 0.00 18.36 290.64
150 LEE 49.36 100.90 0.00 0.00 1.57 0.00 0.00 0.00 2.00 153.83
151 LEICESTER 11.68 148.11 0.00 0.00 0.00 0.00 0.00 0.00 7.80 167.58
152 LENOX 33.31 94.45 0.00 0.00 0.00 0.00 0.00 0.00 1.40 129.16
153 LEOMINSTER 39.33 317.91 0.00 0.00 1.08 0.00 0.00 0.00 16.21 374.53
154 LEVERETT 10.92 60.88 0.00 0.00 0.00 0.00 0.00 0.00 1.98 73.78
155 LEXINGTON 83.32 260.56 0.00 0.00 0.00 0.00 0.05 0.00 21.97 365.89
156 LEYDEN 0.00 49.06 0.00 0.00 0.00 0.00 0.00 0.00 3.29 52.35
157 LINCOLN 21.95 104.97 0.00 0.00 0.00 0.00 0.00 0.00 2.03 128.96
158 LITTLETON 58.52 122.29 0.00 0.00 0.00 0.00 0.00 0.00 8.20 189.01
159 LONGMEADOW
19.61 165.79 0.00 0.00 0.00 0.00 0.00 0.00 21.86 207.26
160 LOWELL 56.58 379.47 0.00 0.00 0.00 0.00 0.00 0.00 74.36 510.41
161 LUDLOW 23.54 242.59 0.18 0.00 0.78 1.73 0.00 0.00 10.12 278.93
162 LUNENBURG 12.45 156.42 0.00 0.00 0.00 0.00 0.00 0.00 7.37 176.24
163 LYNN 6.79 318.83 14.84 0.00 0.00 0.00 0.00 0.00 15.40 355.86
164 LYNNFIELD 26.48 135.97 0.00 0.00 0.00 0.00 0.00 0.00 3.10 165.54
165 MALDEN 4.22 192.80 8.73 0.00 0.00 0.00 0.00 0.00 18.13 223.88
166 MANCHESTERBY THE SEA
23.72 47.51 0.00 0.00 0.00 0.00 0.00 0.00 11.11 82.34
167 MANSFIELD 49.49 234.74 0.00 0.00 0.00 0.00 0.00 0.00 1.90 286.14
168 MARBLEHEAD 0.00 135.07 0.00 0.00 0.00 0.00 0.00 0.00 15.30 150.38
169 MARION 36.63 54.45 0.00 0.00 0.00 0.00 0.00 0.00 3.49 94.57
170 MARLBOROUGH
58.97 270.35 0.00 0.00 0.00 0.00 0.00 0.00 31.35 360.67
171 MARSHFIELD 24.85 258.72 0.00 0.00 0.00 0.00 0.00 0.00 36.47 320.04
172 MASHPEE 7.87 213.13 0.00 0.00 0.00 0.20 0.00 5.54 17.41 244.14
173 MATTAPOISETT
34.37 80.81 0.00 0.00 0.00 0.00 0.00 0.00 10.55 125.73
174 MAYNARD 0.08 80.01 0.00 0.00 0.00 0.00 0.00 0.00 3.86 83.95
175 MEDFIELD 0.07 151.55 0.00 0.00 0.71 0.49 0.00 0.00 5.19 158.01
176 MEDFORD 40.86 185.79 29.72 0.00 0.00 0.00 0.00 0.00 49.13 305.50

ROAD INVENTORY YEAR END REPORT 2020LANE MILES TABLE 12
CITY/TOWN BY JURISDICTION
Massachusetts Department of TransportationOffice of Transportation Planning 74 / 109
City/Town
No Name MassDOT City/TownAccepted
DCR MassPort State Park StateInstitutional
CountyInstitutional
CombinedFederal
Unaccepted City/TownTotal
177 MEDWAY 2.08 135.51 0.00 0.00 0.00 0.00 0.00 0.00 7.12 144.71
178 MELROSE 0.35 142.99 6.09 0.00 0.00 0.00 0.00 0.00 10.16 159.59
179 MENDON 8.88 102.82 0.00 0.00 0.00 0.00 0.00 0.00 1.31 113.01
180 MERRIMAC 21.07 73.43 0.00 0.00 0.00 0.00 0.00 0.00 9.10 103.60
181 METHUEN 72.46 338.91 0.00 0.00 0.00 0.00 0.00 0.00 29.18 440.54
182 MIDDLEBOROUGH
106.64 302.78 0.00 0.00 0.00 0.00 0.00 0.00 16.47 425.89
183 MIDDLEFIELD 0.00 60.81 0.00 0.00 0.00 0.00 0.00 0.00 0.00 60.81
184 MIDDLETON 12.34 93.49 0.00 0.00 0.00 3.77 0.00 0.00 7.02 116.61
185 MILFORD 41.37 217.93 0.00 0.00 0.00 0.00 0.00 0.00 6.46 265.76
186 MILLBURY 43.31 138.81 0.00 0.00 0.00 0.00 0.00 0.00 5.43 187.55
187 MILLIS 0.07 98.25 0.00 0.00 0.00 0.00 0.00 0.00 2.29 100.61
188 MILLVILLE 4.43 37.69 0.00 0.00 0.00 0.00 0.00 0.00 1.16 43.28
189 MILTON 37.97 198.51 25.86 0.00 0.00 0.00 0.00 0.00 9.93 272.28
190 MONROE 0.00 27.45 0.00 0.00 1.82 0.00 0.00 0.00 0.00 29.27
191 MONSON 14.27 175.93 0.05 0.00 0.00 1.29 0.00 0.00 3.07 194.60
192 MONTAGUE 11.30 189.83 0.00 0.00 0.73 0.00 0.00 0.00 5.90 207.77
193 MONTEREY 0.00 76.44 0.00 0.00 5.28 0.00 0.00 0.00 7.33 89.05
194 MONTGOMERY
0.40 50.37 0.00 0.00 0.00 0.00 0.00 0.00 0.00 50.76
195 MOUNTWASHINGTON
0.00 31.17 0.00 0.00 0.00 0.00 0.00 0.00 0.00 31.17
196 NAHANT 0.00 31.20 6.13 0.00 0.00 0.00 0.00 0.00 0.84 38.16
197 NANTUCKET 13.10 192.44 0.00 0.00 0.00 0.00 0.00 0.00 15.48 221.02
198 NATICK 36.27 246.95 0.00 0.00 0.00 0.00 0.00 0.00 39.31 322.52
199 NEEDHAM 38.98 240.40 0.00 0.00 0.00 0.00 0.00 0.93 23.83 304.13
200 NEWASHFORD
7.24 14.71 0.00 0.00 3.62 0.00 0.00 0.00 0.58 26.15
201 NEWBEDFORD
61.81 527.51 0.00 0.00 0.00 0.00 0.00 0.00 7.47 596.79
202 NEWBRAINTREE
0.33 89.49 0.00 0.00 0.00 0.00 0.00 0.00 1.32 91.13
203 NEWMARLBOROUGH
0.84 132.67 0.00 0.00 0.45 0.00 0.00 0.00 0.80 134.76
204 NEW SALEM 23.88 52.56 53.98 0.00 0.23 0.00 0.00 0.00 3.34 133.98
205 NEWBURY 40.12 98.36 0.00 0.00 1.44 0.00 0.00 0.00 1.95 141.87
206 NEWBURYPORT
35.10 130.07 0.00 0.00 0.00 0.00 0.00 0.00 1.99 167.16
207 NEWTON 56.15 566.99 8.59 0.00 0.00 0.00 0.00 0.00 29.51 661.23
208 NORFOLK 2.82 147.32 0.00 0.00 0.00 9.14 0.00 0.00 4.46 163.73
209 NORTHADAMS
19.87 130.81 0.00 0.00 5.17 0.00 0.00 0.00 5.21 161.06

ROAD INVENTORY YEAR END REPORT 2020LANE MILES TABLE 12
CITY/TOWN BY JURISDICTION
Massachusetts Department of TransportationOffice of Transportation Planning 75 / 109
City/Town
No Name MassDOT City/TownAccepted
DCR MassPort State Park StateInstitutional
CountyInstitutional
CombinedFederal
Unaccepted City/TownTotal
210 NORTHANDOVER
35.23 215.44 0.00 0.00 5.18 0.00 0.00 0.00 31.94 287.79
211 NORTHATTLEBOROUGH
58.84 240.48 0.00 0.00 0.00 0.00 0.21 0.00 19.31 318.84
212 NORTHBROOKFIELD
0.00 127.90 0.00 0.00 0.00 0.00 0.00 0.00 2.37 130.27
213 NORTHREADING
14.26 156.11 0.00 0.00 0.00 0.00 0.00 0.00 15.50 185.87
214 NORTHAMPTON
40.13 288.06 0.00 0.00 0.00 3.83 0.00 3.65 12.81 348.47
215 NORTHBOROUGH
39.68 153.20 0.00 0.00 0.00 0.31 0.00 0.00 3.06 196.25
216 NORTHBRIDGE
10.73 152.97 0.00 0.00 0.00 0.00 0.00 1.16 6.15 171.01
217 NORTHFIELD 22.76 101.87 0.00 0.00 0.06 0.00 0.00 0.00 8.52 133.21
218 NORTON 44.93 177.79 0.00 0.00 0.00 0.00 0.00 0.00 7.36 230.08
219 NORWELL 26.48 146.04 0.00 0.00 0.00 0.00 0.00 0.00 13.89 186.40
220 NORWOOD 31.05 200.49 0.00 0.00 0.00 0.00 0.00 0.00 5.73 237.27
221 OAK BLUFFS 7.87 65.97 0.00 0.00 0.00 0.00 0.00 0.00 5.46 79.29
222 OAKHAM 5.80 78.43 5.43 0.00 0.00 0.00 0.00 0.00 0.13 89.78
223 ORANGE 24.83 153.75 0.00 0.00 0.57 0.00 0.00 0.00 4.90 184.05
224 ORLEANS 21.41 96.42 0.00 0.00 0.30 0.00 0.00 0.00 44.36 162.50
225 OTIS 44.89 66.78 0.00 0.00 1.91 0.00 0.00 0.00 0.91 114.50
226 OXFORD 54.46 170.04 0.00 0.00 0.00 0.00 0.00 0.21 7.15 231.86
227 PALMER 61.05 166.81 0.00 0.00 0.00 0.00 0.00 0.00 12.39 240.26
228 PAXTON 10.80 71.56 0.00 0.00 0.48 0.00 0.00 0.00 2.25 85.09
229 PEABODY 57.07 322.58 0.00 0.00 0.00 0.00 0.00 0.00 7.24 386.89
230 PELHAM 11.45 39.65 14.56 0.00 1.58 0.00 0.00 0.00 1.94 69.17
231 PEMBROKE 18.70 186.78 0.00 0.00 0.00 0.00 0.00 0.00 21.08 226.56
232 PEPPERELL 7.59 156.65 0.00 0.00 0.00 0.00 0.00 0.00 0.00 164.24
233 PERU 0.00 59.71 0.00 0.00 0.00 0.00 0.00 0.00 3.39 63.10
234 PETERSHAM 25.68 88.85 1.16 0.00 4.52 0.00 0.00 0.00 0.16 120.37
235 PHILLIPSTON 13.66 71.37 0.00 0.00 0.00 0.00 0.00 0.00 2.63 87.66
236 PITTSFIELD 31.59 393.62 0.00 0.00 6.15 2.58 0.00 0.00 25.90 459.84
237 PLAINFIELD 0.00 72.56 0.00 0.00 0.00 0.00 0.00 0.00 0.83 73.39
238 PLAINVILLE 20.19 92.62 0.00 0.00 0.00 0.00 0.00 0.00 6.22 119.02
239 PLYMOUTH 126.11 466.28 0.00 0.00 68.04 0.86 2.05 0.00 256.46 919.81
240 PLYMPTON 2.32 69.91 0.00 0.00 0.00 0.00 0.00 0.00 0.00 72.24
241 PRINCETON 0.03 127.52 0.00 0.00 3.39 0.00 0.00 0.00 1.86 132.80
242 PROVINCETOWN
4.26 41.69 0.00 0.00 0.00 0.00 0.00 10.88 7.31 64.14

ROAD INVENTORY YEAR END REPORT 2020LANE MILES TABLE 12
CITY/TOWN BY JURISDICTION
Massachusetts Department of TransportationOffice of Transportation Planning 76 / 109
City/Town
No Name MassDOT City/TownAccepted
DCR MassPort State Park StateInstitutional
CountyInstitutional
CombinedFederal
Unaccepted City/TownTotal
243 QUINCY 33.60 392.96 27.17 0.00 0.00 0.00 0.00 0.00 46.56 500.29
244 RANDOLPH 39.21 197.86 0.00 0.00 0.00 0.00 0.00 0.37 16.28 253.72
245 RAYNHAM 59.31 151.85 0.00 0.00 0.00 0.00 0.00 0.00 4.39 215.55
246 READING 31.85 187.32 0.00 0.00 0.00 0.00 0.00 0.00 4.79 223.96
247 REHOBOTH 22.78 254.31 0.00 0.00 0.00 0.00 0.00 0.00 4.31 281.40
248 REVERE 58.55 166.01 21.16 0.00 0.00 0.00 0.00 0.00 2.48 248.20
249 RICHMOND 15.69 62.27 0.00 0.00 0.00 0.00 0.00 0.00 0.97 78.93
250 ROCHESTER 13.21 132.10 0.00 0.00 0.00 0.00 0.00 0.00 0.44 145.75
251 ROCKLAND 8.87 97.66 0.00 0.00 0.00 0.00 0.00 0.00 6.90 113.43
252 ROCKPORT 3.15 62.32 0.00 0.00 0.00 0.00 0.00 0.00 7.35 72.82
253 ROWE 0.00 58.52 0.00 0.00 0.00 0.00 0.00 0.00 0.66 59.18
254 ROWLEY 19.92 78.23 0.00 0.00 0.00 0.00 0.00 0.00 1.90 100.05
255 ROYALSTON 0.00 103.49 0.00 0.00 0.00 0.00 0.00 2.79 0.48 106.76
256 RUSSELL 39.12 41.99 0.00 0.00 0.00 0.00 0.00 0.00 0.06 81.17
257 RUTLAND 21.11 142.40 1.86 0.00 11.34 0.89 0.00 0.00 5.38 182.97
258 SALEM 12.70 179.31 0.00 0.00 0.00 0.00 0.00 0.00 9.92 201.93
259 SALISBURY 40.90 67.88 0.00 0.00 2.72 0.00 0.00 0.00 1.73 113.23
260 SANDISFIELD 17.55 111.68 0.00 0.00 1.55 0.00 0.00 0.00 0.69 131.47
261 SANDWICH 44.77 290.45 0.00 0.00 2.43 0.00 0.00 51.78 32.46 421.90
262 SAUGUS 34.41 175.88 5.33 0.00 0.00 0.00 0.00 0.00 16.47 232.09
263 SAVOY 3.44 75.23 0.00 0.00 3.76 0.00 0.00 0.00 0.00 82.43
264 SCITUATE 10.10 204.65 0.00 0.00 0.00 0.00 0.00 0.00 24.74 239.49
265 SEEKONK 44.93 201.36 0.00 0.00 0.00 0.00 0.00 0.00 0.47 246.76
266 SHARON 40.69 211.16 0.00 0.00 0.00 0.00 0.00 0.00 13.93 265.79
267 SHEFFIELD 35.58 147.06 0.00 0.00 0.00 0.00 0.00 0.00 3.24 185.87
268 SHELBURNE 18.80 83.57 0.00 0.00 0.00 0.00 0.00 0.00 0.00 102.37
269 SHERBORN 0.02 108.57 0.00 0.00 0.00 0.00 0.00 0.00 0.27 108.86
270 SHIRLEY 7.73 81.17 0.00 0.00 0.00 7.60 0.00 0.00 1.16 97.67
271 SHREWSBURY 67.77 298.10 0.00 0.00 0.00 0.00 0.00 0.00 19.29 385.17
272 SHUTESBURY 6.35 48.01 5.17 0.00 0.00 0.00 0.00 0.00 2.91 62.44
273 SOMERSET 34.62 171.38 0.00 0.00 0.00 0.00 0.00 0.00 2.44 208.44
274 SOMERVILLE 25.41 181.32 8.89 0.00 0.00 0.00 0.00 0.00 18.95 234.57
275 SOUTHHADLEY
20.04 161.39 0.00 0.00 1.16 0.00 0.00 0.00 16.03 198.63
276 SOUTHAMPTON
10.72 128.97 0.00 0.00 0.00 0.00 0.00 0.00 4.70 144.39
277 SOUTHBOROUGH
51.46 137.56 1.03 0.00 0.00 0.00 0.00 0.00 2.90 192.95

ROAD INVENTORY YEAR END REPORT 2020LANE MILES TABLE 12
CITY/TOWN BY JURISDICTION
Massachusetts Department of TransportationOffice of Transportation Planning 77 / 109
City/Town
No Name MassDOT City/TownAccepted
DCR MassPort State Park StateInstitutional
CountyInstitutional
CombinedFederal
Unaccepted City/TownTotal
278 SOUTHBRIDGE 6.08 152.60 0.00 0.00 0.00 0.00 0.00 1.81 5.61 166.10
279 SOUTHWICK 14.38 142.32 0.00 0.00 0.00 0.00 0.00 0.00 14.89 171.59
280 SPENCER 8.64 184.03 0.00 0.00 0.00 0.00 0.00 0.00 16.18 208.85
281 SPRINGFIELD 61.65 944.03 0.00 0.00 10.89 3.04 0.00 0.00 71.38 1,090.98
282 STERLING 50.37 157.85 0.00 0.00 0.00 0.00 0.00 0.00 7.85 216.08
283 STOCKBRIDGE 33.85 77.70 0.00 0.00 0.00 0.00 0.00 0.00 0.92 112.46
284 STONEHAM 23.58 128.03 12.74 0.00 0.00 0.00 0.00 0.00 10.01 174.36
285 STOUGHTON 26.00 222.71 0.00 0.00 0.00 0.00 0.00 0.00 12.43 261.14
286 STOW 0.23 105.18 0.00 0.00 0.00 0.00 0.00 0.00 13.42 118.84
287 STURBRIDGE 102.71 148.20 0.00 0.00 1.75 0.00 0.00 0.38 17.68 270.73
288 SUDBURY 10.27 266.49 0.00 0.00 0.00 0.00 0.00 0.00 2.85 279.61
289 SUNDERLAND 8.66 61.35 0.00 0.00 2.92 0.00 0.00 0.00 0.00 72.94
290 SUTTON 41.59 163.66 0.00 0.00 1.59 0.00 0.00 0.00 2.57 209.41
291 SWAMPSCOTT 3.07 83.86 0.34 0.00 0.00 0.00 0.00 0.00 3.90 91.17
292 SWANSEA 61.87 205.81 0.00 0.00 0.00 0.00 0.00 0.00 10.44 278.12
293 TAUNTON 67.31 411.28 0.00 0.00 5.84 1.92 0.18 0.00 69.12 555.65
294 TEMPLETON 49.02 141.88 0.00 0.00 2.01 8.54 0.00 0.00 8.25 209.70
295 TEWKSBURY 35.78 275.92 0.00 0.00 0.00 0.00 0.00 0.00 27.29 338.99
296 TISBURY 6.30 41.52 0.00 0.00 0.00 0.00 0.00 0.00 3.26 51.08
297 TOLLAND 0.38 60.38 0.00 0.00 3.23 0.00 0.00 0.00 0.00 63.99
298 TOPSFIELD 20.93 96.57 0.00 0.00 0.00 0.00 0.00 0.00 8.33 125.83
299 TOWNSEND 13.15 149.86 0.00 0.00 0.00 0.00 0.00 0.00 4.21 167.22
300 TRURO 30.65 72.01 0.00 0.00 0.00 0.00 0.00 0.91 18.06 121.64
301 TYNGSBOROUGH
41.74 150.63 0.00 0.00 0.62 0.00 0.00 0.00 3.63 196.62
302 TYRINGHAM 0.00 40.61 0.00 0.00 0.00 0.00 0.00 0.00 1.42 42.03
303 UPTON 17.93 123.52 0.00 0.00 7.13 0.00 0.00 0.00 3.69 152.27
304 UXBRIDGE 56.42 182.14 0.00 0.00 0.53 0.00 0.00 0.53 6.35 245.96
305 WAKEFIELD 29.59 168.87 0.82 0.00 0.00 0.00 0.00 0.00 25.34 224.61
306 WALES 10.11 41.65 0.00 0.00 0.00 0.00 0.00 0.00 0.00 51.76
307 WALPOLE 26.67 245.84 0.00 0.00 0.00 0.00 0.00 0.00 8.85 281.36
308 WALTHAM 38.37 233.16 0.63 0.00 0.00 6.52 0.00 0.20 71.64 350.52
309 WARE 23.04 136.69 25.71 0.00 0.00 0.00 0.00 0.00 4.01 189.46
310 WAREHAM 101.88 249.85 0.00 0.00 1.11 0.00 0.00 0.00 44.73 397.58
311 WARREN 29.32 103.18 0.00 0.00 0.00 0.00 0.00 0.00 1.31 133.81
312 WARWICK 0.02 89.98 0.00 0.00 7.35 0.00 0.00 0.00 1.56 98.91
313 WASHINGTON 8.89 62.68 0.00 0.00 2.71 0.00 0.00 0.00 0.00 74.28

ROAD INVENTORY YEAR END REPORT 2020LANE MILES TABLE 12
CITY/TOWN BY JURISDICTION
Massachusetts Department of TransportationOffice of Transportation Planning 78 / 109
City/Town
No Name MassDOT City/TownAccepted
DCR MassPort State Park StateInstitutional
CountyInstitutional
CombinedFederal
Unaccepted City/TownTotal
314 WATERTOWN 2.36 153.93 7.23 0.00 0.00 0.00 0.00 0.00 2.87 166.40
315 WAYLAND 12.17 171.89 0.00 0.00 0.00 0.00 0.00 0.00 6.01 190.06
316 WEBSTER 22.70 144.20 0.00 0.00 0.00 0.00 0.00 0.00 7.60 174.50
317 WELLESLEY 35.44 222.25 0.36 0.00 0.00 0.00 0.00 0.00 19.24 277.29
318 WELLFLEET 15.78 94.28 0.00 0.00 2.74 0.00 0.00 6.06 6.24 125.10
319 WENDELL 0.62 71.82 2.04 0.00 16.58 0.00 0.00 0.00 2.31 93.38
320 WENHAM 7.62 54.89 0.00 0.00 0.00 0.00 0.00 0.00 2.80 65.31
321 WESTBOYLSTON
27.05 99.08 0.00 0.00 0.00 3.49 0.00 0.00 2.14 131.77
322 WESTBRIDGEWATER
35.11 100.08 0.00 0.00 0.00 0.00 0.00 0.00 1.65 136.84
323 WESTBROOKFIELD
6.82 91.48 0.00 0.00 0.00 0.00 0.00 0.00 14.90 113.20
324 WESTNEWBURY
16.09 83.44 0.00 0.00 0.00 0.00 0.00 0.00 0.33 99.86
325 WESTSPRINGFIELD
65.46 243.46 0.00 0.00 0.00 0.00 0.00 0.00 16.58 325.49
326 WESTSTOCKBRIDGE
23.23 68.36 0.00 0.00 0.00 0.00 0.00 0.00 0.71 92.29
327 WESTTISBURY
17.27 27.60 0.00 0.00 0.00 0.00 0.36 0.00 0.89 46.12
328 WESTBOROUGH
55.56 189.56 0.00 0.00 0.00 0.00 0.00 0.00 5.13 250.25
329 WESTFIELD 50.77 377.44 0.00 0.00 0.00 0.79 0.00 0.00 72.50 501.50
330 WESTFORD 44.05 295.61 0.00 0.00 0.00 0.00 0.00 0.00 6.59 346.25
331 WESTHAMPTON
0.02 74.50 0.00 0.00 0.00 0.00 0.00 0.00 3.46 77.98
332 WESTMINSTER
43.01 156.33 0.00 0.00 0.00 2.52 0.00 0.00 6.66 208.52
333 WESTON 46.64 170.72 4.09 0.00 0.00 0.00 0.00 0.00 21.40 242.86
334 WESTPORT 76.23 267.80 0.00 0.00 0.00 0.00 0.00 0.00 1.62 345.64
335 WESTWOOD 16.94 162.79 0.00 0.00 0.00 0.00 0.00 0.00 7.45 187.18
336 WEYMOUTH 46.70 296.05 0.00 0.00 0.30 0.86 0.00 0.29 32.69 376.88
337 WHATELY 25.13 57.06 0.00 0.00 0.00 0.00 0.00 0.00 9.20 91.38
338 WHITMAN 8.04 96.82 0.00 0.00 0.00 0.00 0.00 0.00 2.75 107.61
339 WILBRAHAM 14.67 197.30 0.00 0.00 0.00 0.00 0.00 0.00 10.29 222.26
340 WILLIAMSBURG
11.42 71.44 0.00 0.00 0.00 0.00 0.00 0.00 4.55 87.41
341 WILLIAMSTOWN
36.37 93.12 0.00 0.00 3.83 0.00 0.00 0.00 3.53 136.85
342 WILMINGTON 56.91 188.91 0.00 0.00 0.00 0.00 0.00 0.00 28.96 274.77
343 WINCHENDON 24.25 160.12 0.00 0.00 6.26 0.00 0.00 0.00 7.29 197.91
344 WINCHESTER 4.75 145.38 6.95 0.00 0.00 0.00 0.00 0.00 21.62 178.70
345 WINDSOR 26.34 87.74 0.00 0.00 2.71 0.00 0.00 0.00 0.00 116.80

ROAD INVENTORY YEAR END REPORT 2020LANE MILES TABLE 12
CITY/TOWN BY JURISDICTION
Massachusetts Department of TransportationOffice of Transportation Planning 79 / 109
City/Town
No Name MassDOT City/TownAccepted
DCR MassPort State Park StateInstitutional
CountyInstitutional
CombinedFederal
Unaccepted City/TownTotal
346 WINTHROP 0.00 71.15 2.47 0.00 0.00 0.00 0.00 0.00 4.20 77.82
347 WOBURN 54.73 254.92 0.00 0.00 0.00 0.00 0.00 0.00 15.32 324.97
348 WORCESTER 104.72 925.30 0.00 0.00 0.00 3.81 0.00 0.00 120.42 1,154.25
349 WORTHINGTON
11.94 85.47 0.00 0.00 0.18 0.00 0.00 0.00 0.24 97.84
350 WRENTHAM 62.12 132.74 0.00 0.00 2.07 6.18 0.00 0.00 3.64 206.75
351 YARMOUTH 39.99 297.16 0.00 0.00 0.00 0.00 0.00 0.00 174.65 511.80
Total 9,545.27 57,344.23 522.55 18.26 367.88 152.25 7.52 208.76 4,927.78 73,094.50

ROAD INVENTORY YEAR END REPORT 2020LANE MILES TABLE 13
CITY/TOWN BY FUNCTIONAL CLASSIFICATION
Massachusetts Department of TransportationOffice of Transportation Planning 80 / 109
City/Town Urban Rural Urban and Rural
No Name Interstate Arterial Collector Local Total Interstate Arterial Collector Local Total Interstate Arterial Collector Local Total
1 ABINGTON 0.00 29.54 22.49 82.33 134.36 0.00 0.00 0.00 0.00 0.00 0.00 29.54 22.49 82.33 134.36
2 ACTON 0.00 56.42 37.36 167.93 261.71 0.00 0.00 0.00 0.00 0.00 0.00 56.42 37.36 167.93 261.71
3 ACUSHNET 0.00 31.07 11.83 86.89 129.79 0.00 0.00 0.00 0.00 0.00 0.00 31.07 11.83 86.89 129.79
4 ADAMS 0.00 15.38 22.17 64.41 101.97 0.00 0.00 0.01 19.77 19.78 0.00 15.38 22.18 84.19 121.75
5 AGAWAM 0.00 72.61 55.50 191.23 319.34 0.00 0.00 0.00 0.00 0.00 0.00 72.61 55.50 191.23 319.34
6 ALFORD 0.00 0.00 0.00 0.00 0.00 0.00 0.00 11.37 22.59 33.96 0.00 0.00 11.37 22.59 33.96
7 AMESBURY 28.57 28.71 27.10 90.57 174.95 0.00 0.00 0.00 0.00 0.00 28.57 28.71 27.10 90.57 174.95
8 AMHERST 0.00 86.30 10.31 155.21 251.82 0.00 0.01 2.91 12.24 15.17 0.00 86.32 13.22 167.45 267.00
9 ANDOVER 70.58 84.79 54.15 295.71 505.24 0.00 0.00 0.00 0.00 0.00 70.58 84.79 54.15 295.71 505.24
10 ARLINGTON 0.00 45.70 20.13 180.56 246.40 0.00 0.00 0.00 0.00 0.00 0.00 45.70 20.13 180.56 246.40
11 ASHBURNHAM 0.00 22.25 4.01 28.51 54.77 0.00 6.57 31.80 74.93 113.31 0.00 28.82 35.82 103.44 168.08
12 ASHBY 0.00 8.59 5.19 5.29 19.07 0.00 10.66 23.38 54.94 88.97 0.00 19.25 28.56 60.23 108.04
13 ASHFIELD 0.00 0.00 0.00 0.00 0.00 0.00 0.00 41.02 97.04 138.06 0.00 0.00 41.02 97.04 138.06
14 ASHLAND 2.91 26.90 16.43 117.19 163.44 0.00 0.00 0.00 0.00 0.00 2.91 26.90 16.43 117.19 163.44
15 ATHOL 0.00 36.40 17.07 90.02 143.50 0.00 3.24 19.64 35.07 57.95 0.00 39.64 36.72 125.09 201.45
16 ATTLEBORO 44.38 78.37 16.28 306.59 445.62 0.00 0.00 0.00 0.00 0.00 44.38 78.37 16.28 306.59 445.62
17 AUBURN 55.74 38.77 45.94 137.02 277.46 0.00 0.00 0.00 0.00 0.00 55.74 38.77 45.94 137.02 277.46
18 AVON 0.00 34.88 6.98 36.45 78.31 0.00 0.00 0.00 0.00 0.00 0.00 34.88 6.98 36.45 78.31
19 AYER 0.00 21.09 11.18 70.07 102.34 0.00 0.00 0.00 0.00 0.00 0.00 21.09 11.18 70.07 102.34
20 BARNSTABLE 0.00 212.91 100.85 539.68 853.43 0.00 0.00 0.00 0.00 0.00 0.00 212.91 100.85 539.68 853.43
21 BARRE 0.00 0.00 0.00 0.00 0.00 0.00 24.95 40.26 141.70 206.91 0.00 24.95 40.26 141.70 206.91
22 BECKET 0.00 0.00 0.00 0.00 0.00 26.72 37.01 17.82 69.02 150.57 26.72 37.01 17.82 69.02 150.57
23 BEDFORD 0.00 53.58 16.46 113.63 183.67 0.00 0.00 0.00 0.00 0.00 0.00 53.58 16.46 113.63 183.67
24 BELCHERTOWN
0.00 51.60 17.76 85.73 155.09 0.00 14.94 17.46 107.12 139.52 0.00 66.53 35.22 192.85 294.60
25 BELLINGHAM 15.60 53.75 10.87 125.06 205.29 0.00 0.00 0.00 0.00 0.00 15.60 53.75 10.87 125.06 205.29
26 BELMONT 0.00 39.55 16.23 122.51 178.28 0.00 0.00 0.00 0.00 0.00 0.00 39.55 16.23 122.51 178.28
27 BERKLEY 0.00 36.19 0.00 86.89 123.08 0.00 0.00 0.00 0.00 0.00 0.00 36.19 0.00 86.89 123.08
28 BERLIN 10.00 15.92 12.62 37.85 76.39 0.04 0.00 3.81 12.33 16.19 10.04 15.92 16.43 50.19 92.57
29 BERNARDSTON
0.00 0.00 0.00 0.00 0.00 23.18 5.11 25.03 52.78 106.10 23.18 5.11 25.03 52.78 106.10
30 BEVERLY 0.00 84.61 22.66 201.58 308.85 0.00 0.00 0.00 0.00 0.00 0.00 84.61 22.66 201.58 308.85
31 BILLERICA 0.00 108.51 47.87 306.42 462.80 0.00 0.00 0.00 0.00 0.00 0.00 108.51 47.87 306.42 462.80
32 BLACKSTONE 0.00 28.54 5.10 54.59 88.22 0.00 0.00 0.00 0.00 0.00 0.00 28.54 5.10 54.59 88.22
33 BLANDFORD 0.00 0.00 0.00 0.00 0.00 36.56 0.00 65.08 57.51 159.15 36.56 0.00 65.08 57.51 159.15
34 BOLTON 12.00 4.32 6.92 12.09 35.32 14.41 16.23 27.40 46.47 104.52 26.41 20.55 34.32 58.56 139.84
35 BOSTON 124.26 724.66 124.78 1161.60 2135.29 0.00 0.00 0.00 0.00 0.00 124.26 724.66 124.78 1161.60 2135.29
36 BOURNE 0.00 140.74 36.11 214.52 391.37 0.00 0.00 0.55 10.36 10.91 0.00 140.74 36.66 224.88 402.28
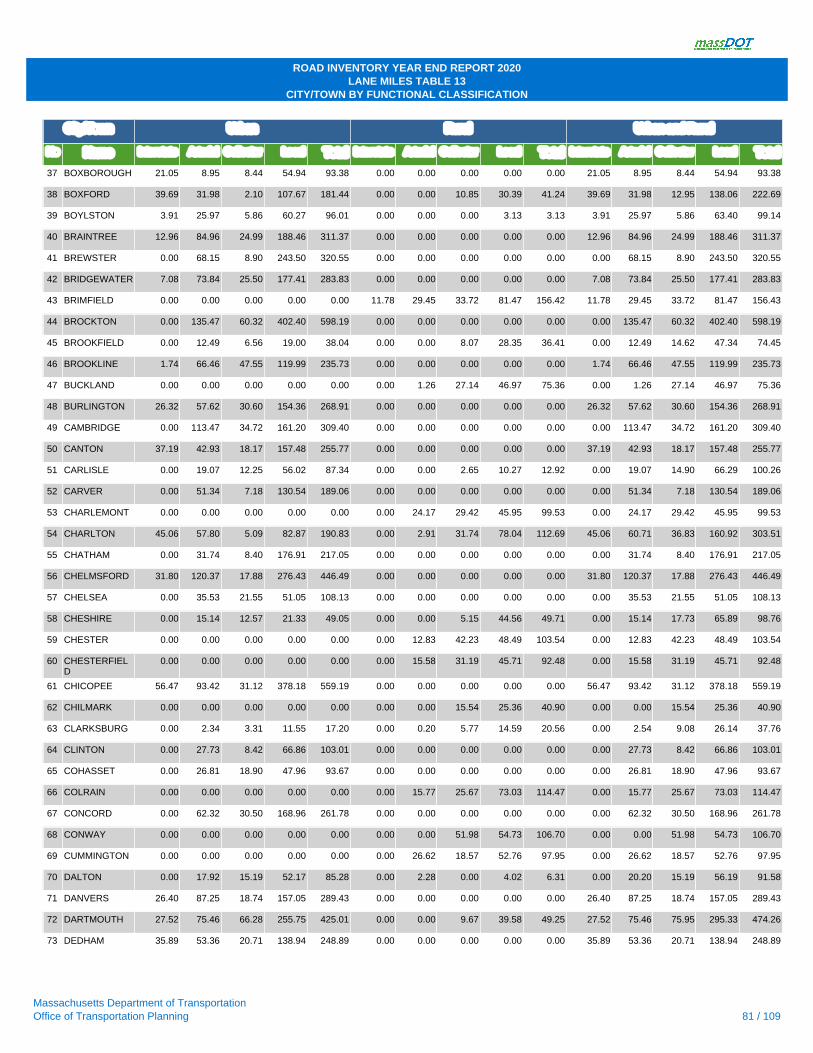
ROAD INVENTORY YEAR END REPORT 2020LANE MILES TABLE 13
CITY/TOWN BY FUNCTIONAL CLASSIFICATION
Massachusetts Department of TransportationOffice of Transportation Planning 81 / 109
City/Town Urban Rural Urban and Rural
No Name Interstate Arterial Collector Local Total Interstate Arterial Collector Local Total Interstate Arterial Collector Local Total
37 BOXBOROUGH 21.05 8.95 8.44 54.94 93.38 0.00 0.00 0.00 0.00 0.00 21.05 8.95 8.44 54.94 93.38
38 BOXFORD 39.69 31.98 2.10 107.67 181.44 0.00 0.00 10.85 30.39 41.24 39.69 31.98 12.95 138.06 222.69
39 BOYLSTON 3.91 25.97 5.86 60.27 96.01 0.00 0.00 0.00 3.13 3.13 3.91 25.97 5.86 63.40 99.14
40 BRAINTREE 12.96 84.96 24.99 188.46 311.37 0.00 0.00 0.00 0.00 0.00 12.96 84.96 24.99 188.46 311.37
41 BREWSTER 0.00 68.15 8.90 243.50 320.55 0.00 0.00 0.00 0.00 0.00 0.00 68.15 8.90 243.50 320.55
42 BRIDGEWATER 7.08 73.84 25.50 177.41 283.83 0.00 0.00 0.00 0.00 0.00 7.08 73.84 25.50 177.41 283.83
43 BRIMFIELD 0.00 0.00 0.00 0.00 0.00 11.78 29.45 33.72 81.47 156.42 11.78 29.45 33.72 81.47 156.43
44 BROCKTON 0.00 135.47 60.32 402.40 598.19 0.00 0.00 0.00 0.00 0.00 0.00 135.47 60.32 402.40 598.19
45 BROOKFIELD 0.00 12.49 6.56 19.00 38.04 0.00 0.00 8.07 28.35 36.41 0.00 12.49 14.62 47.34 74.45
46 BROOKLINE 1.74 66.46 47.55 119.99 235.73 0.00 0.00 0.00 0.00 0.00 1.74 66.46 47.55 119.99 235.73
47 BUCKLAND 0.00 0.00 0.00 0.00 0.00 0.00 1.26 27.14 46.97 75.36 0.00 1.26 27.14 46.97 75.36
48 BURLINGTON 26.32 57.62 30.60 154.36 268.91 0.00 0.00 0.00 0.00 0.00 26.32 57.62 30.60 154.36 268.91
49 CAMBRIDGE 0.00 113.47 34.72 161.20 309.40 0.00 0.00 0.00 0.00 0.00 0.00 113.47 34.72 161.20 309.40
50 CANTON 37.19 42.93 18.17 157.48 255.77 0.00 0.00 0.00 0.00 0.00 37.19 42.93 18.17 157.48 255.77
51 CARLISLE 0.00 19.07 12.25 56.02 87.34 0.00 0.00 2.65 10.27 12.92 0.00 19.07 14.90 66.29 100.26
52 CARVER 0.00 51.34 7.18 130.54 189.06 0.00 0.00 0.00 0.00 0.00 0.00 51.34 7.18 130.54 189.06
53 CHARLEMONT 0.00 0.00 0.00 0.00 0.00 0.00 24.17 29.42 45.95 99.53 0.00 24.17 29.42 45.95 99.53
54 CHARLTON 45.06 57.80 5.09 82.87 190.83 0.00 2.91 31.74 78.04 112.69 45.06 60.71 36.83 160.92 303.51
55 CHATHAM 0.00 31.74 8.40 176.91 217.05 0.00 0.00 0.00 0.00 0.00 0.00 31.74 8.40 176.91 217.05
56 CHELMSFORD 31.80 120.37 17.88 276.43 446.49 0.00 0.00 0.00 0.00 0.00 31.80 120.37 17.88 276.43 446.49
57 CHELSEA 0.00 35.53 21.55 51.05 108.13 0.00 0.00 0.00 0.00 0.00 0.00 35.53 21.55 51.05 108.13
58 CHESHIRE 0.00 15.14 12.57 21.33 49.05 0.00 0.00 5.15 44.56 49.71 0.00 15.14 17.73 65.89 98.76
59 CHESTER 0.00 0.00 0.00 0.00 0.00 0.00 12.83 42.23 48.49 103.54 0.00 12.83 42.23 48.49 103.54
60 CHESTERFIELD
0.00 0.00 0.00 0.00 0.00 0.00 15.58 31.19 45.71 92.48 0.00 15.58 31.19 45.71 92.48
61 CHICOPEE 56.47 93.42 31.12 378.18 559.19 0.00 0.00 0.00 0.00 0.00 56.47 93.42 31.12 378.18 559.19
62 CHILMARK 0.00 0.00 0.00 0.00 0.00 0.00 0.00 15.54 25.36 40.90 0.00 0.00 15.54 25.36 40.90
63 CLARKSBURG 0.00 2.34 3.31 11.55 17.20 0.00 0.20 5.77 14.59 20.56 0.00 2.54 9.08 26.14 37.76
64 CLINTON 0.00 27.73 8.42 66.86 103.01 0.00 0.00 0.00 0.00 0.00 0.00 27.73 8.42 66.86 103.01
65 COHASSET 0.00 26.81 18.90 47.96 93.67 0.00 0.00 0.00 0.00 0.00 0.00 26.81 18.90 47.96 93.67
66 COLRAIN 0.00 0.00 0.00 0.00 0.00 0.00 15.77 25.67 73.03 114.47 0.00 15.77 25.67 73.03 114.47
67 CONCORD 0.00 62.32 30.50 168.96 261.78 0.00 0.00 0.00 0.00 0.00 0.00 62.32 30.50 168.96 261.78
68 CONWAY 0.00 0.00 0.00 0.00 0.00 0.00 0.00 51.98 54.73 106.70 0.00 0.00 51.98 54.73 106.70
69 CUMMINGTON 0.00 0.00 0.00 0.00 0.00 0.00 26.62 18.57 52.76 97.95 0.00 26.62 18.57 52.76 97.95
70 DALTON 0.00 17.92 15.19 52.17 85.28 0.00 2.28 0.00 4.02 6.31 0.00 20.20 15.19 56.19 91.58
71 DANVERS 26.40 87.25 18.74 157.05 289.43 0.00 0.00 0.00 0.00 0.00 26.40 87.25 18.74 157.05 289.43
72 DARTMOUTH 27.52 75.46 66.28 255.75 425.01 0.00 0.00 9.67 39.58 49.25 27.52 75.46 75.95 295.33 474.26
73 DEDHAM 35.89 53.36 20.71 138.94 248.89 0.00 0.00 0.00 0.00 0.00 35.89 53.36 20.71 138.94 248.89

ROAD INVENTORY YEAR END REPORT 2020LANE MILES TABLE 13
CITY/TOWN BY FUNCTIONAL CLASSIFICATION
Massachusetts Department of TransportationOffice of Transportation Planning 82 / 109
City/Town Urban Rural Urban and Rural
No Name Interstate Arterial Collector Local Total Interstate Arterial Collector Local Total Interstate Arterial Collector Local Total
74 DEERFIELD 14.38 24.65 8.06 37.28 84.37 13.68 0.00 19.34 71.80 104.81 28.06 24.65 27.40 109.08 189.19
75 DENNIS 0.00 78.62 34.54 284.48 397.64 0.00 0.00 0.00 0.00 0.00 0.00 78.62 34.54 284.48 397.64
76 DIGHTON 0.00 33.66 5.42 93.54 132.63 0.00 0.00 0.00 0.00 0.00 0.00 33.66 5.42 93.54 132.63
77 DOUGLAS 0.00 14.06 17.64 44.78 76.47 0.00 0.00 24.44 30.72 55.16 0.00 14.06 42.08 75.50 131.63
78 DOVER 0.00 24.92 18.83 75.95 119.70 0.00 0.00 0.00 0.00 0.00 0.00 24.92 18.83 75.95 119.70
79 DRACUT 0.00 40.29 36.80 237.70 314.78 0.00 0.00 0.00 0.00 0.00 0.00 40.29 36.80 237.70 314.78
80 DUDLEY 0.00 29.87 25.92 86.00 141.78 0.00 0.00 3.92 23.04 26.95 0.00 29.87 29.84 109.03 168.73
81 DUNSTABLE 0.00 20.58 0.00 27.59 48.17 0.00 0.00 0.00 20.99 20.99 0.00 20.58 0.00 48.58 69.16
82 DUXBURY 0.00 67.67 30.43 166.11 264.21 0.00 0.00 0.00 0.00 0.00 0.00 67.67 30.43 166.11 264.21
83 EASTBRIDGEWATER
0.00 50.61 19.21 88.86 158.68 0.00 0.00 0.00 0.00 0.00 0.00 50.61 19.21 88.86 158.68
84 EASTBROOKFIELD
0.00 7.78 1.76 11.12 20.66 0.00 5.69 16.70 10.49 32.88 0.00 13.47 18.46 21.61 53.54
85 EASTLONGMEADOW
0.00 42.85 18.71 138.51 200.07 0.00 0.00 0.00 0.00 0.00 0.00 42.85 18.71 138.51 200.07
86 EASTHAM 0.00 48.29 9.48 123.13 180.91 0.00 0.00 5.26 5.87 11.13 0.00 48.29 14.74 129.00 192.03
87 EASTHAMPTON
1.90 51.18 9.91 118.95 181.94 0.00 0.00 0.00 0.01 0.01 1.90 51.18 9.91 118.96 181.95
88 EASTON 0.00 54.18 35.58 175.87 265.63 0.00 0.00 0.00 0.00 0.00 0.00 54.18 35.58 175.87 265.63
89 EDGARTOWN 0.00 23.45 4.15 44.87 72.48 0.00 0.00 0.00 22.58 22.58 0.00 23.45 4.15 67.44 95.05
90 EGREMONT 0.00 0.00 0.00 0.00 0.00 0.00 8.20 33.50 37.64 79.34 0.00 8.20 33.50 37.64 79.34
91 ERVING 0.00 8.80 0.00 7.68 16.48 0.00 18.10 9.26 24.75 52.11 0.00 26.90 9.26 32.43 68.59
92 ESSEX 0.00 18.96 0.00 29.56 48.53 0.00 0.00 0.00 3.84 3.84 0.00 18.96 0.00 33.40 52.36
93 EVERETT 0.00 32.78 21.31 81.69 135.79 0.00 0.00 0.00 0.00 0.00 0.00 32.78 21.31 81.69 135.79
94 FAIRHAVEN 14.31 42.87 14.52 152.65 224.35 0.00 0.00 0.00 0.00 0.00 14.31 42.87 14.52 152.65 224.35
95 FALL RIVER 20.77 137.37 51.61 377.00 586.75 0.00 0.00 0.00 0.00 0.00 20.77 137.37 51.61 377.00 586.75
96 FALMOUTH 0.00 172.35 55.83 430.83 659.01 0.00 0.00 0.00 0.69 0.69 0.00 172.35 55.83 431.52 659.69
97 FITCHBURG 0.00 96.65 43.70 259.15 399.50 0.00 0.00 0.00 0.11 0.11 0.00 96.65 43.70 259.26 399.61
98 FLORIDA 0.00 0.01 0.00 0.02 0.02 0.00 14.32 24.52 39.08 77.92 0.00 14.32 24.52 39.10 77.94
99 FOXBOROUGH 39.11 55.70 17.88 138.11 250.80 0.00 0.00 0.00 0.00 0.00 39.11 55.70 17.88 138.11 250.80
100 FRAMINGHAM 37.73 90.66 86.54 305.23 520.16 0.00 0.00 0.00 0.00 0.00 37.73 90.66 86.54 305.23 520.16
101 FRANKLIN 29.46 67.57 6.76 259.46 363.25 0.00 0.00 0.00 0.00 0.00 29.46 67.57 6.76 259.46 363.25
102 FREETOWN 0.00 82.06 9.13 129.57 220.76 0.00 0.00 0.00 0.00 0.00 0.00 82.06 9.13 129.57 220.76
103 GARDNER 0.00 67.31 26.19 143.16 236.67 0.00 0.00 0.00 0.00 0.00 0.00 67.31 26.19 143.16 236.67
104 AQUINNAH 0.00 0.00 0.00 0.00 0.00 0.00 0.00 13.16 13.33 26.49 0.00 0.00 13.16 13.33 26.49
105 GEORGETOWN 26.87 28.89 6.16 82.72 144.63 0.00 0.00 0.00 0.00 0.00 26.87 28.89 6.16 82.72 144.63
106 GILL 0.00 7.42 0.00 4.78 12.20 0.00 0.88 13.24 45.87 59.98 0.00 8.30 13.24 50.64 72.18
107 GLOUCESTER 0.00 67.37 20.04 218.75 306.16 0.00 0.00 0.00 0.00 0.00 0.00 67.37 20.04 218.75 306.16
108 GOSHEN 0.00 0.00 0.00 0.00 0.00 0.00 10.81 16.49 41.72 69.02 0.00 10.81 16.49 41.72 69.02
109 GOSNOLD 0.00 0.00 0.00 0.00 0.00 0.00 0.00 3.83 0.03 3.86 0.00 0.00 3.83 0.03 3.86

ROAD INVENTORY YEAR END REPORT 2020LANE MILES TABLE 13
CITY/TOWN BY FUNCTIONAL CLASSIFICATION
Massachusetts Department of TransportationOffice of Transportation Planning 83 / 109
City/Town Urban Rural Urban and Rural
No Name Interstate Arterial Collector Local Total Interstate Arterial Collector Local Total Interstate Arterial Collector Local Total
110 GRAFTON 26.74 39.54 26.81 125.70 218.79 0.00 0.00 0.00 0.00 0.00 26.74 39.54 26.81 125.70 218.79
111 GRANBY 0.00 33.77 24.56 43.03 101.36 0.00 1.92 12.03 15.37 29.32 0.00 35.68 36.60 58.40 130.67
112 GRANVILLE 0.00 0.00 0.00 0.00 0.00 0.00 17.78 34.68 67.44 119.90 0.00 17.78 34.68 67.44 119.90
113 GREATBARRINGTON
0.00 28.51 13.16 45.10 86.76 0.00 13.71 24.15 54.02 91.88 0.00 42.22 37.30 99.12 178.64
114 GREENFIELD 25.85 45.66 37.58 129.69 238.79 2.71 2.75 4.09 22.69 32.24 28.56 48.41 41.67 152.38 271.03
115 GROTON 0.00 51.13 14.93 133.32 199.38 0.00 0.00 1.91 9.21 11.12 0.00 51.13 16.83 142.53 210.50
116 GROVELAND 0.00 22.06 11.33 53.47 86.86 0.00 0.00 0.00 0.00 0.00 0.00 22.06 11.33 53.47 86.86
117 HADLEY 0.00 47.37 8.62 55.74 111.74 0.00 8.60 21.69 22.14 52.44 0.00 55.98 30.32 77.88 164.17
118 HALIFAX 0.00 21.82 18.63 64.63 105.09 0.00 0.00 0.00 8.96 8.96 0.00 21.82 18.63 73.60 114.05
119 HAMILTON 0.00 25.21 6.16 66.20 97.57 0.00 0.00 0.00 0.00 0.00 0.00 25.21 6.16 66.20 97.57
120 HAMPDEN 0.00 11.62 5.02 34.67 51.31 0.00 0.00 14.56 41.02 55.58 0.00 11.62 19.58 75.69 106.89
121 HANCOCK 0.00 0.00 0.00 0.00 0.00 0.00 8.33 22.25 18.19 48.77 0.00 8.33 22.25 18.19 48.77
122 HANOVER 0.00 45.27 36.01 119.52 200.80 0.00 0.00 0.00 0.00 0.00 0.00 45.27 36.01 119.52 200.80
123 HANSON 0.00 32.38 24.47 72.25 129.10 0.00 0.00 0.00 0.00 0.00 0.00 32.38 24.47 72.25 129.10
124 HARDWICK 0.00 4.15 0.19 5.23 9.57 0.00 11.31 32.09 74.24 117.64 0.00 15.46 32.28 79.47 127.21
125 HARVARD 8.83 15.76 5.52 18.62 48.73 0.00 20.82 17.18 76.41 114.40 8.83 36.58 22.69 95.03 163.13
126 HARWICH 0.00 91.62 21.27 214.01 326.90 0.00 0.00 0.00 0.00 0.00 0.00 91.62 21.27 214.01 326.90
127 HATFIELD 3.26 8.85 0.00 21.89 34.00 11.91 0.00 20.34 35.70 67.96 15.17 8.85 20.34 57.60 101.96
128 HAVERHILL 48.80 103.13 45.95 355.01 552.90 0.00 0.00 0.00 0.00 0.00 48.80 103.13 45.95 355.01 552.90
129 HAWLEY 0.00 0.00 0.00 0.00 0.00 0.00 0.00 26.46 43.39 69.85 0.00 0.00 26.46 43.39 69.85
130 HEATH 0.00 0.00 0.00 0.00 0.00 0.00 0.00 25.74 59.79 85.53 0.00 0.00 25.74 59.79 85.53
131 HINGHAM 0.00 71.18 43.20 156.37 270.74 0.00 0.00 0.00 0.00 0.00 0.00 71.18 43.20 156.37 270.74
132 HINSDALE 0.00 6.63 4.06 16.81 27.51 0.00 5.03 7.18 31.25 43.46 0.00 11.67 11.25 48.06 70.97
133 HOLBROOK 0.00 27.20 1.90 71.27 100.37 0.00 0.00 0.00 0.00 0.00 0.00 27.20 1.90 71.27 100.37
134 HOLDEN 9.96 47.46 25.58 156.42 239.43 0.00 0.00 5.26 3.64 8.90 9.96 47.46 30.84 160.06 248.33
135 HOLLAND 0.00 0.00 0.00 0.00 0.00 0.29 0.00 24.04 48.14 72.47 0.29 0.00 24.04 48.14 72.47
136 HOLLISTON 0.00 39.47 6.05 144.44 189.96 0.00 0.00 0.00 0.00 0.00 0.00 39.47 6.05 144.44 189.96
137 HOLYOKE 45.80 83.25 41.82 208.98 379.84 0.00 0.00 0.00 0.00 0.00 45.80 83.25 41.82 208.98 379.84
138 HOPEDALE 0.00 8.22 3.81 51.25 63.27 0.00 0.00 0.00 0.00 0.00 0.00 8.22 3.81 51.25 63.27
139 HOPKINTON 47.59 42.80 0.65 177.05 268.10 0.00 0.00 0.00 0.00 0.00 47.59 42.80 0.65 177.05 268.10
140 HUBBARDSTON
0.00 0.00 0.01 0.01 0.02 0.00 16.36 37.13 88.41 141.90 0.00 16.36 37.15 88.42 141.92
141 HUDSON 3.40 21.64 37.52 119.14 181.70 0.00 0.00 0.00 0.00 0.00 3.40 21.64 37.52 119.14 181.70
142 HULL 0.00 21.01 15.41 72.07 108.49 0.00 0.00 0.00 0.00 0.00 0.00 21.01 15.41 72.07 108.49
143 HUNTINGTON 0.00 0.00 0.00 0.00 0.00 0.00 22.50 23.79 55.42 101.71 0.00 22.50 23.79 55.42 101.71
144 IPSWICH 0.00 57.29 1.40 113.13 171.83 0.00 0.00 1.26 10.41 11.67 0.00 57.29 2.66 123.55 183.50
145 KINGSTON 0.00 50.61 28.39 132.78 211.78 0.00 5.98 0.00 0.24 6.22 0.00 56.59 28.39 133.02 217.99
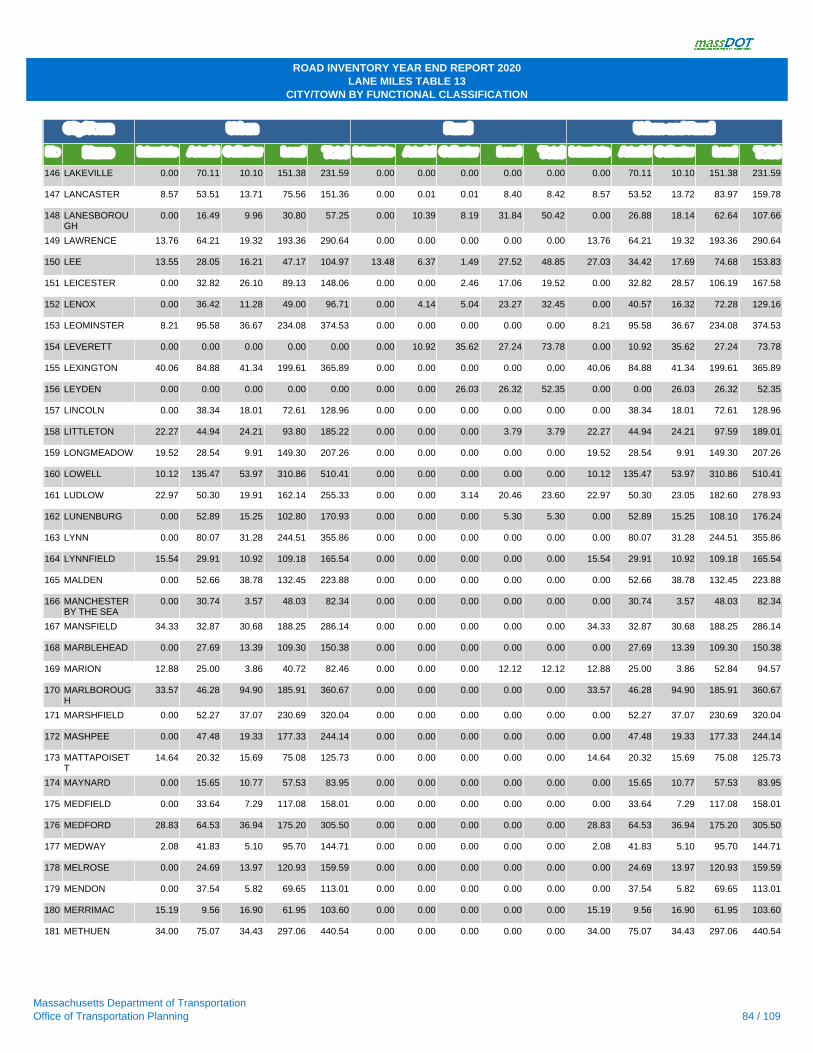
ROAD INVENTORY YEAR END REPORT 2020LANE MILES TABLE 13
CITY/TOWN BY FUNCTIONAL CLASSIFICATION
Massachusetts Department of TransportationOffice of Transportation Planning 84 / 109
City/Town Urban Rural Urban and Rural
No Name Interstate Arterial Collector Local Total Interstate Arterial Collector Local Total Interstate Arterial Collector Local Total
146 LAKEVILLE 0.00 70.11 10.10 151.38 231.59 0.00 0.00 0.00 0.00 0.00 0.00 70.11 10.10 151.38 231.59
147 LANCASTER 8.57 53.51 13.71 75.56 151.36 0.00 0.01 0.01 8.40 8.42 8.57 53.52 13.72 83.97 159.78
148 LANESBOROUGH
0.00 16.49 9.96 30.80 57.25 0.00 10.39 8.19 31.84 50.42 0.00 26.88 18.14 62.64 107.66
149 LAWRENCE 13.76 64.21 19.32 193.36 290.64 0.00 0.00 0.00 0.00 0.00 13.76 64.21 19.32 193.36 290.64
150 LEE 13.55 28.05 16.21 47.17 104.97 13.48 6.37 1.49 27.52 48.85 27.03 34.42 17.69 74.68 153.83
151 LEICESTER 0.00 32.82 26.10 89.13 148.06 0.00 0.00 2.46 17.06 19.52 0.00 32.82 28.57 106.19 167.58
152 LENOX 0.00 36.42 11.28 49.00 96.71 0.00 4.14 5.04 23.27 32.45 0.00 40.57 16.32 72.28 129.16
153 LEOMINSTER 8.21 95.58 36.67 234.08 374.53 0.00 0.00 0.00 0.00 0.00 8.21 95.58 36.67 234.08 374.53
154 LEVERETT 0.00 0.00 0.00 0.00 0.00 0.00 10.92 35.62 27.24 73.78 0.00 10.92 35.62 27.24 73.78
155 LEXINGTON 40.06 84.88 41.34 199.61 365.89 0.00 0.00 0.00 0.00 0.00 40.06 84.88 41.34 199.61 365.89
156 LEYDEN 0.00 0.00 0.00 0.00 0.00 0.00 0.00 26.03 26.32 52.35 0.00 0.00 26.03 26.32 52.35
157 LINCOLN 0.00 38.34 18.01 72.61 128.96 0.00 0.00 0.00 0.00 0.00 0.00 38.34 18.01 72.61 128.96
158 LITTLETON 22.27 44.94 24.21 93.80 185.22 0.00 0.00 0.00 3.79 3.79 22.27 44.94 24.21 97.59 189.01
159 LONGMEADOW 19.52 28.54 9.91 149.30 207.26 0.00 0.00 0.00 0.00 0.00 19.52 28.54 9.91 149.30 207.26
160 LOWELL 10.12 135.47 53.97 310.86 510.41 0.00 0.00 0.00 0.00 0.00 10.12 135.47 53.97 310.86 510.41
161 LUDLOW 22.97 50.30 19.91 162.14 255.33 0.00 0.00 3.14 20.46 23.60 22.97 50.30 23.05 182.60 278.93
162 LUNENBURG 0.00 52.89 15.25 102.80 170.93 0.00 0.00 0.00 5.30 5.30 0.00 52.89 15.25 108.10 176.24
163 LYNN 0.00 80.07 31.28 244.51 355.86 0.00 0.00 0.00 0.00 0.00 0.00 80.07 31.28 244.51 355.86
164 LYNNFIELD 15.54 29.91 10.92 109.18 165.54 0.00 0.00 0.00 0.00 0.00 15.54 29.91 10.92 109.18 165.54
165 MALDEN 0.00 52.66 38.78 132.45 223.88 0.00 0.00 0.00 0.00 0.00 0.00 52.66 38.78 132.45 223.88
166 MANCHESTERBY THE SEA
0.00 30.74 3.57 48.03 82.34 0.00 0.00 0.00 0.00 0.00 0.00 30.74 3.57 48.03 82.34
167 MANSFIELD 34.33 32.87 30.68 188.25 286.14 0.00 0.00 0.00 0.00 0.00 34.33 32.87 30.68 188.25 286.14
168 MARBLEHEAD 0.00 27.69 13.39 109.30 150.38 0.00 0.00 0.00 0.00 0.00 0.00 27.69 13.39 109.30 150.38
169 MARION 12.88 25.00 3.86 40.72 82.46 0.00 0.00 0.00 12.12 12.12 12.88 25.00 3.86 52.84 94.57
170 MARLBOROUGH
33.57 46.28 94.90 185.91 360.67 0.00 0.00 0.00 0.00 0.00 33.57 46.28 94.90 185.91 360.67
171 MARSHFIELD 0.00 52.27 37.07 230.69 320.04 0.00 0.00 0.00 0.00 0.00 0.00 52.27 37.07 230.69 320.04
172 MASHPEE 0.00 47.48 19.33 177.33 244.14 0.00 0.00 0.00 0.00 0.00 0.00 47.48 19.33 177.33 244.14
173 MATTAPOISETT
14.64 20.32 15.69 75.08 125.73 0.00 0.00 0.00 0.00 0.00 14.64 20.32 15.69 75.08 125.73
174 MAYNARD 0.00 15.65 10.77 57.53 83.95 0.00 0.00 0.00 0.00 0.00 0.00 15.65 10.77 57.53 83.95
175 MEDFIELD 0.00 33.64 7.29 117.08 158.01 0.00 0.00 0.00 0.00 0.00 0.00 33.64 7.29 117.08 158.01
176 MEDFORD 28.83 64.53 36.94 175.20 305.50 0.00 0.00 0.00 0.00 0.00 28.83 64.53 36.94 175.20 305.50
177 MEDWAY 2.08 41.83 5.10 95.70 144.71 0.00 0.00 0.00 0.00 0.00 2.08 41.83 5.10 95.70 144.71
178 MELROSE 0.00 24.69 13.97 120.93 159.59 0.00 0.00 0.00 0.00 0.00 0.00 24.69 13.97 120.93 159.59
179 MENDON 0.00 37.54 5.82 69.65 113.01 0.00 0.00 0.00 0.00 0.00 0.00 37.54 5.82 69.65 113.01
180 MERRIMAC 15.19 9.56 16.90 61.95 103.60 0.00 0.00 0.00 0.00 0.00 15.19 9.56 16.90 61.95 103.60
181 METHUEN 34.00 75.07 34.43 297.06 440.54 0.00 0.00 0.00 0.00 0.00 34.00 75.07 34.43 297.06 440.54

ROAD INVENTORY YEAR END REPORT 2020LANE MILES TABLE 13
CITY/TOWN BY FUNCTIONAL CLASSIFICATION
Massachusetts Department of TransportationOffice of Transportation Planning 85 / 109
City/Town Urban Rural Urban and Rural
No Name Interstate Arterial Collector Local Total Interstate Arterial Collector Local Total Interstate Arterial Collector Local Total
182 MIDDLEBOROUGH
56.48 90.94 32.58 207.34 387.34 0.00 0.00 8.21 30.34 38.54 56.48 90.94 40.79 237.68 425.89
183 MIDDLEFIELD 0.00 0.00 0.00 0.00 0.00 0.00 0.00 14.90 45.91 60.81 0.00 0.00 14.90 45.91 60.81
184 MIDDLETON 2.15 24.34 21.16 68.97 116.61 0.00 0.00 0.00 0.00 0.00 2.15 24.34 21.16 68.97 116.61
185 MILFORD 29.05 61.28 15.22 160.20 265.76 0.00 0.00 0.00 0.00 0.00 29.05 61.28 15.22 160.20 265.76
186 MILLBURY 22.84 38.26 22.77 98.84 182.71 0.00 0.00 0.00 4.84 4.84 22.84 38.26 22.77 103.68 187.55
187 MILLIS 0.00 32.99 4.23 63.39 100.61 0.00 0.00 0.00 0.00 0.00 0.00 32.99 4.23 63.39 100.61
188 MILLVILLE 0.00 14.63 0.00 28.66 43.28 0.00 0.00 0.00 0.00 0.00 0.00 14.63 0.00 28.66 43.28
189 MILTON 21.23 71.26 26.02 153.77 272.28 0.00 0.00 0.00 0.00 0.00 21.23 71.26 26.02 153.77 272.28
190 MONROE 0.00 0.00 0.00 0.00 0.00 0.00 0.00 17.32 11.95 29.27 0.00 0.00 17.32 11.95 29.27
191 MONSON 0.00 26.28 1.82 28.09 56.19 0.00 6.54 33.60 98.28 138.41 0.00 32.82 35.42 126.37 194.60
192 MONTAGUE 0.00 37.52 4.31 72.18 114.01 0.00 5.12 22.49 66.14 93.76 0.00 42.64 26.81 138.32 207.77
193 MONTEREY 0.00 0.00 0.00 0.00 0.00 0.00 0.00 30.11 58.94 89.05 0.00 0.00 30.11 58.94 89.05
194 MONTGOMERY 0.40 0.00 0.00 0.03 0.43 0.00 0.00 16.43 33.91 50.34 0.40 0.00 16.43 33.94 50.76
195 MOUNTWASHINGTON
0.00 0.00 0.00 0.00 0.00 0.00 0.00 9.98 21.19 31.17 0.00 0.00 9.98 21.19 31.17
196 NAHANT 0.00 16.05 0.00 22.11 38.16 0.00 0.00 0.00 0.00 0.00 0.00 16.05 0.00 22.11 38.16
197 NANTUCKET 0.00 16.01 22.37 80.74 119.11 0.00 0.00 39.73 62.17 101.90 0.00 16.01 62.09 142.91 221.02
198 NATICK 11.80 61.07 30.56 219.10 322.52 0.00 0.00 0.00 0.00 0.00 11.80 61.07 30.56 219.10 322.52
199 NEEDHAM 32.23 42.06 40.42 189.42 304.13 0.00 0.00 0.00 0.00 0.00 32.23 42.06 40.42 189.42 304.13
200 NEW ASHFORD 0.00 0.00 0.00 0.00 0.00 0.00 7.24 0.00 18.91 26.15 0.00 7.24 0.00 18.91 26.15
201 NEW BEDFORD 13.98 166.69 41.92 374.20 596.79 0.00 0.00 0.00 0.00 0.00 13.98 166.69 41.92 374.20 596.79
202 NEWBRAINTREE
0.00 0.33 0.00 0.17 0.50 0.00 0.00 38.44 52.19 90.64 0.00 0.33 38.44 52.36 91.13
203 NEWMARLBOROUGH
0.00 0.00 0.00 0.00 0.00 0.00 0.00 59.56 75.20 134.76 0.00 0.00 59.56 75.20 134.76
204 NEW SALEM 0.00 0.00 0.00 0.00 0.00 0.00 23.88 5.55 104.55 133.98 0.00 23.88 5.55 104.55 133.98
205 NEWBURY 18.20 41.83 0.11 55.66 115.80 3.38 0.00 7.97 14.72 26.07 21.57 41.83 8.08 70.39 141.87
206 NEWBURYPORT
23.53 36.21 6.14 101.28 167.16 0.00 0.00 0.00 0.00 0.00 23.53 36.21 6.14 101.28 167.16
207 NEWTON 38.24 120.24 70.33 432.42 661.23 0.00 0.00 0.00 0.00 0.00 38.24 120.24 70.33 432.42 661.23
208 NORFOLK 0.00 33.62 12.79 117.32 163.73 0.00 0.00 0.00 0.00 0.00 0.00 33.62 12.79 117.32 163.73
209 NORTH ADAMS 0.00 42.83 14.87 103.35 161.05 0.00 0.00 0.00 0.01 0.01 0.00 42.83 14.87 103.36 161.06
210 NORTHANDOVER
3.95 47.58 40.16 193.80 285.49 0.00 0.00 0.00 2.29 2.29 3.95 47.58 40.16 196.09 287.79
211 NORTHATTLEBOROUGH
36.01 46.76 37.98 198.09 318.84 0.00 0.00 0.00 0.00 0.00 36.01 46.76 37.98 198.09 318.84
212 NORTHBROOKFIELD
0.00 25.92 18.91 66.23 111.06 0.00 0.00 0.00 19.20 19.21 0.00 25.92 18.92 85.43 130.27
213 NORTHREADING
0.00 28.16 29.21 128.50 185.87 0.00 0.00 0.00 0.00 0.00 0.00 28.16 29.21 128.50 185.87
214 NORTHAMPTON
23.94 99.15 32.24 193.14 348.47 0.00 0.00 0.00 0.00 0.00 23.94 99.15 32.24 193.14 348.47
215 NORTHBOROUGH
20.87 30.22 32.79 112.36 196.25 0.00 0.00 0.00 0.00 0.00 20.87 30.22 32.79 112.36 196.25

ROAD INVENTORY YEAR END REPORT 2020LANE MILES TABLE 13
CITY/TOWN BY FUNCTIONAL CLASSIFICATION
Massachusetts Department of TransportationOffice of Transportation Planning 86 / 109
City/Town Urban Rural Urban and Rural
No Name Interstate Arterial Collector Local Total Interstate Arterial Collector Local Total Interstate Arterial Collector Local Total
216 NORTHBRIDGE 0.00 41.45 17.03 112.53 171.01 0.00 0.00 0.00 0.00 0.00 0.00 41.45 17.03 112.53 171.01
217 NORTHFIELD 0.00 0.00 0.00 0.00 0.00 0.00 21.38 31.52 80.30 133.21 0.00 21.38 31.52 80.30 133.21
218 NORTON 26.05 32.13 23.67 148.24 230.08 0.00 0.00 0.00 0.00 0.00 26.05 32.13 23.67 148.24 230.08
219 NORWELL 0.00 56.66 17.67 112.07 186.40 0.00 0.00 0.00 0.00 0.00 0.00 56.66 17.67 112.07 186.40
220 NORWOOD 8.48 42.07 37.06 149.66 237.27 0.00 0.00 0.00 0.00 0.00 8.48 42.07 37.06 149.66 237.27
221 OAK BLUFFS 0.00 12.97 8.58 57.74 79.29 0.00 0.00 0.00 0.00 0.00 0.00 12.97 8.58 57.74 79.29
222 OAKHAM 0.00 0.00 0.00 0.00 0.00 0.00 5.80 35.46 48.52 89.78 0.00 5.80 35.46 48.52 89.78
223 ORANGE 0.00 33.27 2.62 65.92 101.81 0.00 5.14 27.12 49.98 82.24 0.00 38.41 29.75 115.90 184.05
224 ORLEANS 0.00 45.51 9.70 107.29 162.50 0.00 0.00 0.00 0.00 0.00 0.00 45.51 9.70 107.29 162.50
225 OTIS 0.00 0.00 0.00 0.00 0.00 11.10 17.15 32.51 53.73 114.50 11.10 17.15 32.51 53.73 114.50
226 OXFORD 31.69 43.90 21.73 120.89 218.22 0.00 0.00 2.45 11.20 13.65 31.69 43.90 24.18 132.09 231.86
227 PALMER 28.96 61.21 12.47 96.87 199.51 0.71 3.22 18.21 18.61 40.74 29.67 64.43 30.68 115.48 240.26
228 PAXTON 0.00 24.06 0.00 30.82 54.88 0.00 0.96 9.47 19.79 30.21 0.00 25.02 9.47 50.60 85.09
229 PEABODY 22.36 76.30 25.37 262.87 386.89 0.00 0.00 0.00 0.00 0.00 22.36 76.30 25.37 262.87 386.89
230 PELHAM 0.00 5.30 0.00 2.08 7.38 0.00 11.45 15.97 34.38 61.79 0.00 16.75 15.97 36.46 69.17
231 PEMBROKE 0.00 47.06 35.85 143.64 226.56 0.00 0.00 0.00 0.00 0.00 0.00 47.06 35.85 143.64 226.56
232 PEPPERELL 0.00 50.05 1.00 77.81 128.86 0.00 1.98 4.24 29.17 35.39 0.00 52.03 5.23 106.98 164.24
233 PERU 0.00 0.00 0.00 0.00 0.00 0.00 0.00 31.20 31.90 63.10 0.00 0.00 31.20 31.90 63.10
234 PETERSHAM 0.00 0.00 0.00 0.00 0.00 0.00 25.10 28.28 67.00 120.37 0.00 25.10 28.28 67.00 120.37
235 PHILLIPSTON 0.00 0.00 0.00 0.00 0.00 0.00 7.21 41.84 38.61 87.66 0.00 7.21 41.84 38.61 87.66
236 PITTSFIELD 0.00 116.37 55.07 288.38 459.82 0.00 0.02 0.00 0.01 0.02 0.00 116.39 55.07 288.39 459.84
237 PLAINFIELD 0.00 0.00 0.00 0.00 0.00 0.00 0.00 35.03 38.35 73.39 0.00 0.00 35.03 38.35 73.39
238 PLAINVILLE 7.97 27.86 15.65 67.55 119.02 0.00 0.00 0.00 0.00 0.00 7.97 27.86 15.65 67.55 119.02
239 PLYMOUTH 0.00 165.66 113.02 639.51 918.19 0.00 0.00 0.00 1.61 1.61 0.00 165.66 113.02 641.12 919.81
240 PLYMPTON 0.00 11.91 6.76 7.56 26.23 0.00 0.00 23.26 22.74 46.01 0.00 11.91 30.02 30.30 72.24
241 PRINCETON 0.00 0.01 0.00 0.00 0.01 0.00 8.41 47.70 76.69 132.79 0.00 8.42 47.70 76.69 132.80
242 PROVINCETOWN
0.00 29.87 0.00 25.78 55.64 0.00 0.00 8.14 0.36 8.50 0.00 29.87 8.14 26.14 64.14
243 QUINCY 23.53 121.40 41.72 313.64 500.29 0.00 0.00 0.00 0.00 0.00 23.53 121.40 41.72 313.64 500.29
244 RANDOLPH 10.49 56.08 16.97 170.18 253.72 0.00 0.00 0.00 0.00 0.00 10.49 56.08 16.97 170.18 253.72
245 RAYNHAM 22.95 48.47 12.25 131.89 215.55 0.00 0.00 0.00 0.00 0.00 22.95 48.47 12.25 131.89 215.55
246 READING 15.36 43.22 12.52 152.86 223.96 0.00 0.00 0.00 0.00 0.00 15.36 43.22 12.52 152.86 223.96
247 REHOBOTH 8.25 56.46 38.36 178.32 281.40 0.00 0.00 0.00 0.00 0.00 8.25 56.46 38.36 178.32 281.40
248 REVERE 0.00 87.10 24.56 136.54 248.20 0.00 0.00 0.00 0.00 0.00 0.00 87.10 24.56 136.54 248.20
249 RICHMOND 0.00 0.00 0.00 1.87 1.87 0.00 12.21 24.92 39.93 77.05 0.00 12.21 24.92 41.80 78.93
250 ROCHESTER 0.66 29.81 5.42 17.87 53.76 0.00 0.00 15.03 76.97 92.00 0.66 29.81 20.45 94.84 145.75
251 ROCKLAND 0.00 32.87 19.09 61.47 113.43 0.00 0.00 0.00 0.00 0.00 0.00 32.87 19.09 61.47 113.43
252 ROCKPORT 0.00 19.20 0.00 53.61 72.82 0.00 0.00 0.00 0.00 0.00 0.00 19.20 0.00 53.61 72.82
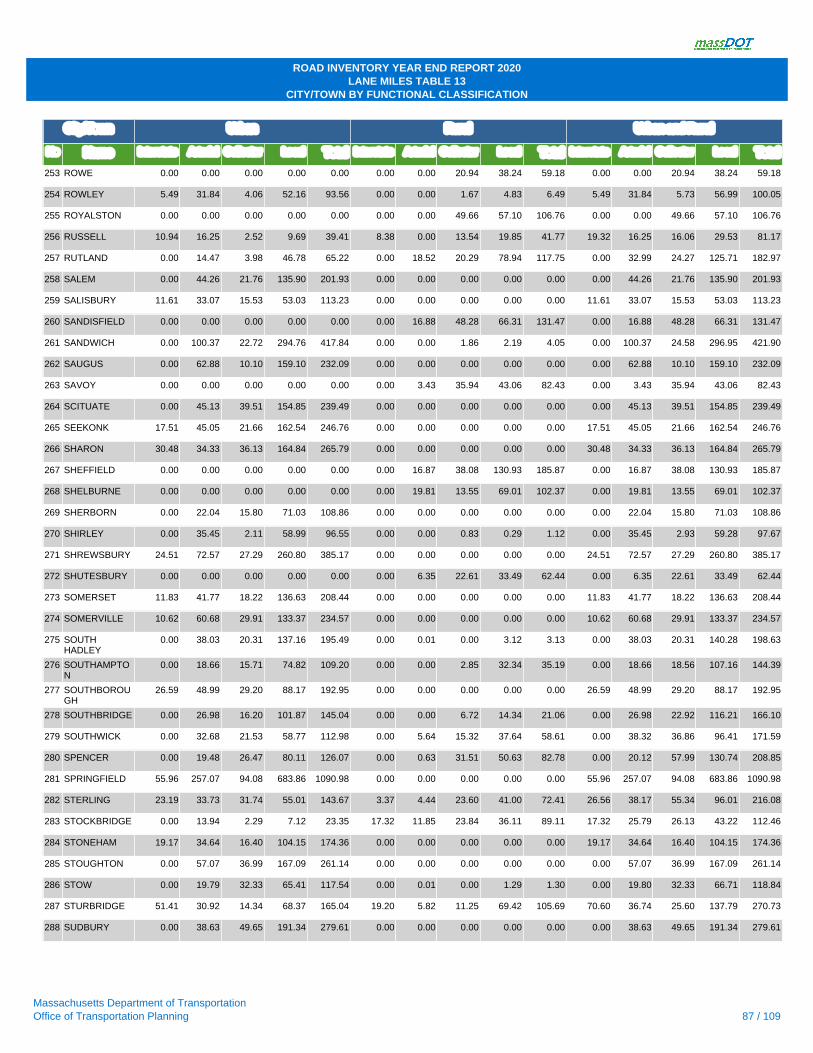
ROAD INVENTORY YEAR END REPORT 2020LANE MILES TABLE 13
CITY/TOWN BY FUNCTIONAL CLASSIFICATION
Massachusetts Department of TransportationOffice of Transportation Planning 87 / 109
City/Town Urban Rural Urban and Rural
No Name Interstate Arterial Collector Local Total Interstate Arterial Collector Local Total Interstate Arterial Collector Local Total
253 ROWE 0.00 0.00 0.00 0.00 0.00 0.00 0.00 20.94 38.24 59.18 0.00 0.00 20.94 38.24 59.18
254 ROWLEY 5.49 31.84 4.06 52.16 93.56 0.00 0.00 1.67 4.83 6.49 5.49 31.84 5.73 56.99 100.05
255 ROYALSTON 0.00 0.00 0.00 0.00 0.00 0.00 0.00 49.66 57.10 106.76 0.00 0.00 49.66 57.10 106.76
256 RUSSELL 10.94 16.25 2.52 9.69 39.41 8.38 0.00 13.54 19.85 41.77 19.32 16.25 16.06 29.53 81.17
257 RUTLAND 0.00 14.47 3.98 46.78 65.22 0.00 18.52 20.29 78.94 117.75 0.00 32.99 24.27 125.71 182.97
258 SALEM 0.00 44.26 21.76 135.90 201.93 0.00 0.00 0.00 0.00 0.00 0.00 44.26 21.76 135.90 201.93
259 SALISBURY 11.61 33.07 15.53 53.03 113.23 0.00 0.00 0.00 0.00 0.00 11.61 33.07 15.53 53.03 113.23
260 SANDISFIELD 0.00 0.00 0.00 0.00 0.00 0.00 16.88 48.28 66.31 131.47 0.00 16.88 48.28 66.31 131.47
261 SANDWICH 0.00 100.37 22.72 294.76 417.84 0.00 0.00 1.86 2.19 4.05 0.00 100.37 24.58 296.95 421.90
262 SAUGUS 0.00 62.88 10.10 159.10 232.09 0.00 0.00 0.00 0.00 0.00 0.00 62.88 10.10 159.10 232.09
263 SAVOY 0.00 0.00 0.00 0.00 0.00 0.00 3.43 35.94 43.06 82.43 0.00 3.43 35.94 43.06 82.43
264 SCITUATE 0.00 45.13 39.51 154.85 239.49 0.00 0.00 0.00 0.00 0.00 0.00 45.13 39.51 154.85 239.49
265 SEEKONK 17.51 45.05 21.66 162.54 246.76 0.00 0.00 0.00 0.00 0.00 17.51 45.05 21.66 162.54 246.76
266 SHARON 30.48 34.33 36.13 164.84 265.79 0.00 0.00 0.00 0.00 0.00 30.48 34.33 36.13 164.84 265.79
267 SHEFFIELD 0.00 0.00 0.00 0.00 0.00 0.00 16.87 38.08 130.93 185.87 0.00 16.87 38.08 130.93 185.87
268 SHELBURNE 0.00 0.00 0.00 0.00 0.00 0.00 19.81 13.55 69.01 102.37 0.00 19.81 13.55 69.01 102.37
269 SHERBORN 0.00 22.04 15.80 71.03 108.86 0.00 0.00 0.00 0.00 0.00 0.00 22.04 15.80 71.03 108.86
270 SHIRLEY 0.00 35.45 2.11 58.99 96.55 0.00 0.00 0.83 0.29 1.12 0.00 35.45 2.93 59.28 97.67
271 SHREWSBURY 24.51 72.57 27.29 260.80 385.17 0.00 0.00 0.00 0.00 0.00 24.51 72.57 27.29 260.80 385.17
272 SHUTESBURY 0.00 0.00 0.00 0.00 0.00 0.00 6.35 22.61 33.49 62.44 0.00 6.35 22.61 33.49 62.44
273 SOMERSET 11.83 41.77 18.22 136.63 208.44 0.00 0.00 0.00 0.00 0.00 11.83 41.77 18.22 136.63 208.44
274 SOMERVILLE 10.62 60.68 29.91 133.37 234.57 0.00 0.00 0.00 0.00 0.00 10.62 60.68 29.91 133.37 234.57
275 SOUTHHADLEY
0.00 38.03 20.31 137.16 195.49 0.00 0.01 0.00 3.12 3.13 0.00 38.03 20.31 140.28 198.63
276 SOUTHAMPTON
0.00 18.66 15.71 74.82 109.20 0.00 0.00 2.85 32.34 35.19 0.00 18.66 18.56 107.16 144.39
277 SOUTHBOROUGH
26.59 48.99 29.20 88.17 192.95 0.00 0.00 0.00 0.00 0.00 26.59 48.99 29.20 88.17 192.95
278 SOUTHBRIDGE 0.00 26.98 16.20 101.87 145.04 0.00 0.00 6.72 14.34 21.06 0.00 26.98 22.92 116.21 166.10
279 SOUTHWICK 0.00 32.68 21.53 58.77 112.98 0.00 5.64 15.32 37.64 58.61 0.00 38.32 36.86 96.41 171.59
280 SPENCER 0.00 19.48 26.47 80.11 126.07 0.00 0.63 31.51 50.63 82.78 0.00 20.12 57.99 130.74 208.85
281 SPRINGFIELD 55.96 257.07 94.08 683.86 1090.98 0.00 0.00 0.00 0.00 0.00 55.96 257.07 94.08 683.86 1090.98
282 STERLING 23.19 33.73 31.74 55.01 143.67 3.37 4.44 23.60 41.00 72.41 26.56 38.17 55.34 96.01 216.08
283 STOCKBRIDGE 0.00 13.94 2.29 7.12 23.35 17.32 11.85 23.84 36.11 89.11 17.32 25.79 26.13 43.22 112.46
284 STONEHAM 19.17 34.64 16.40 104.15 174.36 0.00 0.00 0.00 0.00 0.00 19.17 34.64 16.40 104.15 174.36
285 STOUGHTON 0.00 57.07 36.99 167.09 261.14 0.00 0.00 0.00 0.00 0.00 0.00 57.07 36.99 167.09 261.14
286 STOW 0.00 19.79 32.33 65.41 117.54 0.00 0.01 0.00 1.29 1.30 0.00 19.80 32.33 66.71 118.84
287 STURBRIDGE 51.41 30.92 14.34 68.37 165.04 19.20 5.82 11.25 69.42 105.69 70.60 36.74 25.60 137.79 270.73
288 SUDBURY 0.00 38.63 49.65 191.34 279.61 0.00 0.00 0.00 0.00 0.00 0.00 38.63 49.65 191.34 279.61

ROAD INVENTORY YEAR END REPORT 2020LANE MILES TABLE 13
CITY/TOWN BY FUNCTIONAL CLASSIFICATION
Massachusetts Department of TransportationOffice of Transportation Planning 88 / 109
City/Town Urban Rural Urban and Rural
No Name Interstate Arterial Collector Local Total Interstate Arterial Collector Local Total Interstate Arterial Collector Local Total
289 SUNDERLAND 0.00 18.89 4.92 28.01 51.82 0.00 3.80 3.72 13.59 21.12 0.00 22.70 8.64 41.60 72.94
290 SUTTON 0.00 63.37 17.41 95.18 175.97 0.00 0.00 3.54 29.91 33.45 0.00 63.37 20.95 125.09 209.41
291 SWAMPSCOTT 0.00 14.07 12.24 64.87 91.17 0.00 0.00 0.00 0.00 0.00 0.00 14.07 12.24 64.87 91.17
292 SWANSEA 32.01 56.12 23.71 166.29 278.12 0.00 0.00 0.00 0.00 0.00 32.01 56.12 23.71 166.29 278.12
293 TAUNTON 15.21 100.17 60.40 379.87 555.65 0.00 0.00 0.00 0.00 0.00 15.21 100.17 60.40 379.87 555.65
294 TEMPLETON 0.00 40.28 17.46 86.56 144.30 0.00 10.41 24.70 30.29 65.40 0.00 50.69 42.16 116.85 209.70
295 TEWKSBURY 20.61 54.78 43.74 219.85 338.99 0.00 0.00 0.00 0.00 0.00 20.61 54.78 43.74 219.85 338.99
296 TISBURY 0.00 16.83 0.00 29.38 46.22 0.00 0.00 4.86 0.00 4.86 0.00 16.83 4.86 29.38 51.08
297 TOLLAND 0.00 0.00 0.00 0.00 0.00 0.00 11.43 8.29 44.27 63.99 0.00 11.43 8.29 44.27 63.99
298 TOPSFIELD 11.47 31.06 10.35 72.94 125.82 0.00 0.00 0.01 0.00 0.01 11.47 31.06 10.36 72.94 125.83
299 TOWNSEND 0.00 34.31 11.04 80.48 125.83 0.00 5.35 0.67 35.38 41.39 0.00 39.65 11.71 115.86 167.22
300 TRURO 0.00 40.57 0.33 21.09 61.99 0.00 8.45 4.49 46.71 59.65 0.00 49.03 4.82 67.80 121.64
301 TYNGSBOROUGH
0.00 67.07 11.08 118.42 196.57 0.00 0.00 0.00 0.05 0.05 0.00 67.07 11.08 118.47 196.62
302 TYRINGHAM 0.00 0.00 0.00 0.00 0.00 0.00 0.00 15.57 26.46 42.03 0.00 0.00 15.57 26.46 42.03
303 UPTON 7.70 35.66 9.75 99.17 152.27 0.00 0.00 0.00 0.00 0.00 7.70 35.66 9.75 99.17 152.27
304 UXBRIDGE 0.00 75.53 9.58 116.58 201.69 0.00 0.00 8.90 35.37 44.27 0.00 75.53 18.48 151.95 245.96
305 WAKEFIELD 28.46 39.02 13.19 143.94 224.61 0.00 0.00 0.00 0.00 0.00 28.46 39.02 13.19 143.94 224.61
306 WALES 0.00 0.61 0.00 0.00 0.61 0.00 0.00 25.06 26.08 51.15 0.00 0.61 25.06 26.08 51.76
307 WALPOLE 4.63 57.44 46.98 172.31 281.36 0.00 0.00 0.00 0.00 0.00 4.63 57.44 46.98 172.31 281.36
308 WALTHAM 33.27 64.61 44.78 207.86 350.52 0.00 0.00 0.00 0.00 0.00 33.27 64.61 44.78 207.86 350.52
309 WARE 0.00 28.38 16.21 66.65 111.24 0.00 9.74 9.38 59.11 78.22 0.00 38.11 25.59 125.76 189.46
310 WAREHAM 22.25 102.31 17.12 255.90 397.58 0.00 0.00 0.00 0.00 0.00 22.25 102.31 17.12 255.90 397.58
311 WARREN 0.00 12.56 0.38 29.30 42.24 18.83 0.00 23.13 49.61 91.57 18.83 12.56 23.51 78.91 133.81
312 WARWICK 0.00 0.00 0.00 0.00 0.00 0.00 0.00 46.42 52.49 98.91 0.00 0.00 46.42 52.49 98.91
313 WASHINGTON 0.00 0.00 0.00 0.00 0.00 0.00 8.87 16.64 48.77 74.28 0.00 8.87 16.64 48.77 74.28
314 WATERTOWN 0.00 30.36 23.04 113.00 166.40 0.00 0.00 0.00 0.00 0.00 0.00 30.36 23.04 113.00 166.40
315 WAYLAND 6.36 34.76 18.58 130.37 190.06 0.00 0.00 0.00 0.00 0.00 6.36 34.76 18.58 130.37 190.06
316 WEBSTER 16.12 22.33 21.56 114.48 174.50 0.00 0.00 0.00 0.00 0.00 16.12 22.33 21.57 114.48 174.50
317 WELLESLEY 8.65 50.08 23.45 195.11 277.29 0.00 0.00 0.00 0.00 0.00 8.65 50.08 23.45 195.11 277.29
318 WELLFLEET 0.00 12.49 7.21 26.68 46.38 0.00 4.40 30.09 44.23 78.73 0.00 16.89 37.30 70.91 125.10
319 WENDELL 0.00 0.00 0.00 0.00 0.00 0.00 0.62 36.75 56.01 93.38 0.00 0.62 36.75 56.01 93.38
320 WENHAM 0.00 36.15 0.00 29.17 65.31 0.00 0.00 0.00 0.00 0.00 0.00 36.15 0.00 29.17 65.31
321 WESTBOYLSTON
13.48 29.24 16.59 71.39 130.70 0.00 0.00 0.00 1.06 1.07 13.48 29.24 16.59 72.45 131.77
322 WESTBRIDGEWATER
0.00 67.15 11.39 58.30 136.84 0.00 0.00 0.00 0.00 0.00 0.00 67.15 11.39 58.30 136.84
323 WESTBROOKFIELD
0.00 9.58 6.22 23.68 39.48 0.00 6.90 8.36 58.47 73.72 0.00 16.48 14.58 82.14 113.20
324 WESTNEWBURY
0.00 36.04 0.66 44.68 81.38 5.38 0.00 0.53 12.56 18.48 5.39 36.04 1.19 57.24 99.86

ROAD INVENTORY YEAR END REPORT 2020LANE MILES TABLE 13
CITY/TOWN BY FUNCTIONAL CLASSIFICATION
Massachusetts Department of TransportationOffice of Transportation Planning 89 / 109
City/Town Urban Rural Urban and Rural
No Name Interstate Arterial Collector Local Total Interstate Arterial Collector Local Total Interstate Arterial Collector Local Total
325 WESTSPRINGFIELD
30.65 84.72 17.65 192.48 325.49 0.00 0.00 0.00 0.00 0.00 30.65 84.72 17.65 192.48 325.49
326 WESTSTOCKBRIDGE
0.00 0.96 0.00 2.16 3.12 13.96 10.44 25.89 38.88 89.17 13.96 11.40 25.89 41.04 92.29
327 WEST TISBURY 0.00 1.57 0.00 0.67 2.24 0.00 0.00 28.21 15.66 43.87 0.00 1.57 28.21 16.33 46.12
328 WESTBOROUGH
26.31 61.41 18.64 143.88 250.25 0.00 0.00 0.00 0.00 0.00 26.31 61.41 18.64 143.88 250.25
329 WESTFIELD 26.49 105.63 39.17 330.21 501.49 0.00 0.00 0.01 0.00 0.01 26.49 105.63 39.18 330.21 501.50
330 WESTFORD 25.69 87.02 18.76 214.78 346.25 0.00 0.00 0.00 0.00 0.00 25.69 87.02 18.76 214.78 346.25
331 WESTHAMPTON
0.00 0.39 0.00 0.00 0.39 0.00 0.00 44.06 33.52 77.58 0.00 0.39 44.06 33.52 77.98
332 WESTMINSTER 0.00 75.65 19.27 109.56 204.49 0.00 0.00 2.02 2.01 4.03 0.00 75.65 21.30 111.57 208.52
333 WESTON 37.86 32.91 46.10 125.99 242.86 0.00 0.00 0.00 0.00 0.00 37.86 32.91 46.10 125.99 242.86
334 WESTPORT 22.09 65.78 22.01 153.99 263.87 0.00 0.00 25.06 56.72 81.78 22.09 65.78 47.08 210.70 345.64
335 WESTWOOD 9.30 27.74 30.97 119.17 187.18 0.00 0.00 0.00 0.00 0.00 9.30 27.74 30.97 119.17 187.18
336 WEYMOUTH 0.00 93.30 35.47 248.11 376.88 0.00 0.00 0.00 0.00 0.00 0.00 93.30 35.47 248.11 376.88
337 WHATELY 0.99 1.43 0.00 1.71 4.12 14.50 0.00 37.08 35.68 87.26 15.49 1.43 37.08 37.39 91.38
338 WHITMAN 0.00 28.56 10.44 68.62 107.61 0.00 0.00 0.00 0.00 0.00 0.00 28.56 10.44 68.62 107.61
339 WILBRAHAM 4.20 41.21 24.74 130.56 200.71 0.00 0.00 9.20 12.36 21.55 4.20 41.21 33.94 142.91 222.26
340 WILLIAMSBURG
0.00 5.46 0.00 5.13 10.59 0.00 13.97 23.79 39.06 76.82 0.00 19.43 23.79 44.19 87.41
341 WILLIAMSTOWN
0.00 26.93 0.90 50.19 78.02 0.00 17.54 9.51 31.78 58.83 0.00 44.47 10.41 81.96 136.85
342 WILMINGTON 39.91 40.66 34.13 160.07 274.77 0.00 0.00 0.00 0.00 0.00 39.91 40.66 34.13 160.07 274.77
343 WINCHENDON 0.00 43.74 19.07 135.09 197.91 0.00 0.00 0.01 0.00 0.01 0.00 43.74 19.08 135.09 197.91
344 WINCHESTER 0.46 31.17 21.61 125.46 178.70 0.00 0.00 0.00 0.00 0.00 0.46 31.17 21.61 125.46 178.70
345 WINDSOR 0.00 0.00 0.00 0.00 0.00 0.00 20.68 20.34 75.78 116.80 0.00 20.68 20.34 75.78 116.80
346 WINTHROP 0.00 13.92 14.16 49.74 77.82 0.00 0.00 0.00 0.00 0.00 0.00 13.92 14.16 49.74 77.82
347 WOBURN 35.24 43.83 44.28 201.63 324.97 0.00 0.00 0.00 0.00 0.00 35.24 43.83 44.28 201.63 324.97
348 WORCESTER 65.16 272.98 66.05 750.03 1154.23 0.00 0.00 0.02 0.00 0.02 65.16 272.98 66.07 750.03 1154.25
349 WORTHINGTON
0.00 0.00 0.00 0.00 0.00 0.00 20.53 19.68 57.62 97.84 0.00 20.53 19.68 57.62 97.84
350 WRENTHAM 22.02 59.30 8.15 117.28 206.75 0.00 0.00 0.00 0.00 0.00 22.02 59.30 8.15 117.28 206.75
351 YARMOUTH 0.00 110.47 33.21 368.13 511.80 0.00 0.00 0.00 0.00 0.00 0.00 110.47 33.21 368.13 511.80
Total 2,919.52 14,686.72 6,112.69 38,987.06 62,705.98 270.88 900.91 2,933.29 6,283.44 10,388.52 3,190.39 15,587.63 9,045.98 45,270.49 73,094.50

ROAD INVENTORY YEAR END REPORT 2020LANE MILES TABLE 14
CITY/TOWN BY FEDERAL AID CATEGORY
Massachusetts Department of TransportationOffice of Transportation Planning 90 / 109
City Town
No Name National HighwaySystem
SurfaceTransportation
Program
Total Federal Aid State & Local Aid Grand Total
1 ABINGTON 14.78 37.25 52.03 82.33 134.36
2 ACTON 40.38 53.41 93.79 167.93 261.71
3 ACUSHNET 0.00 42.90 42.90 86.89 129.79
4 ADAMS 11.87 25.69 37.56 84.19 121.75
5 AGAWAM 38.57 89.54 128.11 191.23 319.34
6 ALFORD 0.00 2.98 2.98 30.98 33.96
7 AMESBURY 32.83 51.55 84.38 90.57 174.95
8 AMHERST 31.19 68.36 99.54 167.45 267.00
9 ANDOVER 108.62 100.91 209.53 295.71 505.24
10 ARLINGTON 24.06 41.78 65.84 180.56 246.40
11 ASHBURNHAM 19.19 21.40 40.59 127.49 168.08
12 ASHBY 13.84 15.05 28.89 79.15 108.04
13 ASHFIELD 0.00 37.59 37.59 100.48 138.06
14 ASHLAND 12.62 33.62 46.24 117.19 163.44
15 ATHOL 26.21 38.49 64.70 136.75 201.45
16 ATTLEBORO 72.27 67.15 139.41 306.20 445.62
17 AUBURN 71.38 69.07 140.45 137.02 277.46
18 AVON 17.95 23.91 41.87 36.45 78.31
19 AYER 13.47 19.50 32.97 69.38 102.34
20 BARNSTABLE 89.39 224.49 313.88 539.55 853.43
21 BARRE 24.95 27.85 52.80 154.11 206.91
22 BECKET 63.58 0.26 63.84 86.74 150.57
23 BEDFORD 14.53 55.50 70.04 113.63 183.67
24 BELCHERTOWN 47.37 42.89 90.27 204.34 294.60
25 BELLINGHAM 40.56 39.67 80.23 125.06 205.29
26 BELMONT 25.70 30.08 55.77 122.51 178.28
27 BERKLEY 23.55 12.64 36.19 86.89 123.08
28 BERLIN 19.27 19.31 38.57 54.00 92.57
29 BERNARDSTON 29.43 11.99 41.42 64.68 106.10
30 BEVERLY 31.30 75.97 107.26 201.58 308.85
31 BILLERICA 50.96 105.41 156.38 306.42 462.80
32 BLACKSTONE 0.11 33.52 33.63 54.59 88.22
33 BLANDFORD 36.56 44.27 80.83 78.33 159.15
34 BOLTON 43.13 16.17 59.30 80.53 139.84
35 BOSTON 579.68 396.84 976.52 1,158.77 2,135.29
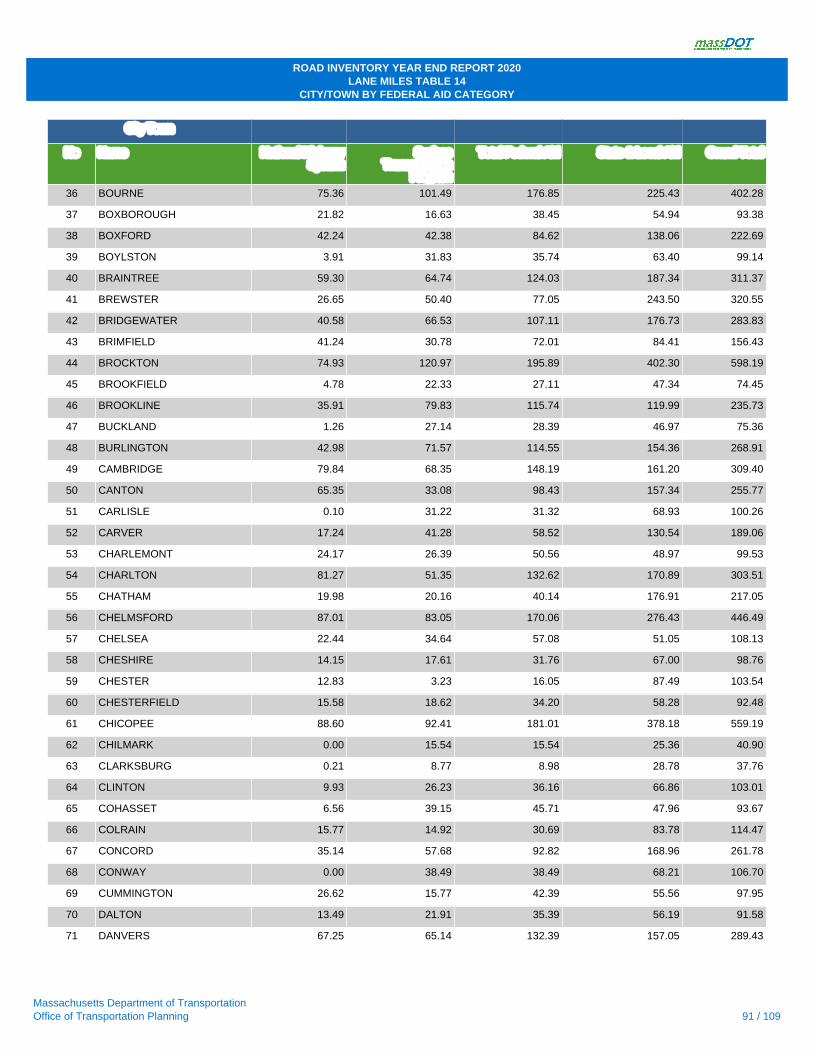
ROAD INVENTORY YEAR END REPORT 2020LANE MILES TABLE 14
CITY/TOWN BY FEDERAL AID CATEGORY
Massachusetts Department of TransportationOffice of Transportation Planning 91 / 109
City Town
No Name National HighwaySystem
SurfaceTransportation
Program
Total Federal Aid State & Local Aid Grand Total
36 BOURNE 75.36 101.49 176.85 225.43 402.28
37 BOXBOROUGH 21.82 16.63 38.45 54.94 93.38
38 BOXFORD 42.24 42.38 84.62 138.06 222.69
39 BOYLSTON 3.91 31.83 35.74 63.40 99.14
40 BRAINTREE 59.30 64.74 124.03 187.34 311.37
41 BREWSTER 26.65 50.40 77.05 243.50 320.55
42 BRIDGEWATER 40.58 66.53 107.11 176.73 283.83
43 BRIMFIELD 41.24 30.78 72.01 84.41 156.43
44 BROCKTON 74.93 120.97 195.89 402.30 598.19
45 BROOKFIELD 4.78 22.33 27.11 47.34 74.45
46 BROOKLINE 35.91 79.83 115.74 119.99 235.73
47 BUCKLAND 1.26 27.14 28.39 46.97 75.36
48 BURLINGTON 42.98 71.57 114.55 154.36 268.91
49 CAMBRIDGE 79.84 68.35 148.19 161.20 309.40
50 CANTON 65.35 33.08 98.43 157.34 255.77
51 CARLISLE 0.10 31.22 31.32 68.93 100.26
52 CARVER 17.24 41.28 58.52 130.54 189.06
53 CHARLEMONT 24.17 26.39 50.56 48.97 99.53
54 CHARLTON 81.27 51.35 132.62 170.89 303.51
55 CHATHAM 19.98 20.16 40.14 176.91 217.05
56 CHELMSFORD 87.01 83.05 170.06 276.43 446.49
57 CHELSEA 22.44 34.64 57.08 51.05 108.13
58 CHESHIRE 14.15 17.61 31.76 67.00 98.76
59 CHESTER 12.83 3.23 16.05 87.49 103.54
60 CHESTERFIELD 15.58 18.62 34.20 58.28 92.48
61 CHICOPEE 88.60 92.41 181.01 378.18 559.19
62 CHILMARK 0.00 15.54 15.54 25.36 40.90
63 CLARKSBURG 0.21 8.77 8.98 28.78 37.76
64 CLINTON 9.93 26.23 36.16 66.86 103.01
65 COHASSET 6.56 39.15 45.71 47.96 93.67
66 COLRAIN 15.77 14.92 30.69 83.78 114.47
67 CONCORD 35.14 57.68 92.82 168.96 261.78
68 CONWAY 0.00 38.49 38.49 68.21 106.70
69 CUMMINGTON 26.62 15.77 42.39 55.56 97.95
70 DALTON 13.49 21.91 35.39 56.19 91.58
71 DANVERS 67.25 65.14 132.39 157.05 289.43

ROAD INVENTORY YEAR END REPORT 2020LANE MILES TABLE 14
CITY/TOWN BY FEDERAL AID CATEGORY
Massachusetts Department of TransportationOffice of Transportation Planning 92 / 109
City Town
No Name National HighwaySystem
SurfaceTransportation
Program
Total Federal Aid State & Local Aid Grand Total
72 DARTMOUTH 37.44 141.49 178.93 295.33 474.26
73 DEDHAM 67.33 42.61 109.95 138.94 248.89
74 DEERFIELD 32.98 32.38 65.36 123.82 189.19
75 DENNIS 27.80 85.36 113.16 284.48 397.64
76 DIGHTON 13.59 25.50 39.09 93.54 132.63
77 DOUGLAS 1.09 52.25 53.34 78.29 131.63
78 DOVER 1.30 42.45 43.75 75.95 119.70
79 DRACUT 11.02 66.07 77.08 237.70 314.78
80 DUDLEY 5.10 54.60 59.70 109.03 168.73
81 DUNSTABLE 9.56 11.02 20.58 48.58 69.16
82 DUXBURY 39.54 58.56 98.10 166.11 264.21
83 EAST BRIDGEWATER 9.45 60.37 69.82 88.86 158.68
84 EAST BROOKFIELD 11.56 13.13 24.69 28.85 53.54
85 EAST LONGMEADOW 11.03 50.53 61.56 138.51 200.07
86 EASTHAM 24.41 38.62 63.03 129.00 192.03
87 EASTHAMPTON 10.43 52.56 62.99 118.96 181.95
88 EASTON 23.74 66.01 89.76 175.87 265.63
89 EDGARTOWN 5.84 21.84 27.68 67.38 95.05
90 EGREMONT 8.20 22.56 30.76 48.58 79.34
91 ERVING 24.21 7.60 31.81 36.79 68.59
92 ESSEX 0.66 18.30 18.96 33.40 52.36
93 EVERETT 19.19 34.90 54.09 81.69 135.79
94 FAIRHAVEN 24.79 46.91 71.70 152.65 224.35
95 FALL RIVER 76.27 133.57 209.84 376.91 586.75
96 FALMOUTH 77.57 151.06 228.63 431.06 659.69
97 FITCHBURG 46.10 94.25 140.35 259.26 399.61
98 FLORIDA 14.32 0.00 14.32 63.62 77.94
99 FOXBOROUGH 54.54 58.16 112.69 138.11 250.80
100 FRAMINGHAM 78.81 136.47 215.28 304.88 520.16
101 FRANKLIN 44.39 59.39 103.79 259.46 363.25
102 FREETOWN 37.54 53.64 91.18 129.57 220.76
103 GARDNER 32.23 61.28 93.50 143.16 236.67
104 AQUINNAH 0.00 6.90 6.90 19.58 26.49
105 GEORGETOWN 38.98 22.94 61.92 82.72 144.63
106 GILL 7.83 13.71 21.53 50.64 72.18
107 GLOUCESTER 29.68 57.73 87.41 218.75 306.16

ROAD INVENTORY YEAR END REPORT 2020LANE MILES TABLE 14
CITY/TOWN BY FEDERAL AID CATEGORY
Massachusetts Department of TransportationOffice of Transportation Planning 93 / 109
City Town
No Name National HighwaySystem
SurfaceTransportation
Program
Total Federal Aid State & Local Aid Grand Total
108 GOSHEN 10.81 7.51 18.32 50.70 69.02
109 GOSNOLD 0.00 0.00 0.00 3.86 3.86
110 GRAFTON 42.97 50.12 93.09 125.70 218.79
111 GRANBY 15.47 44.77 60.24 70.43 130.67
112 GRANVILLE 17.78 17.63 35.41 84.49 119.90
113 GREAT BARRINGTON 23.74 38.84 62.58 116.06 178.64
114 GREENFIELD 53.36 64.92 118.27 152.76 271.03
115 GROTON 26.30 41.67 67.97 142.53 210.50
116 GROVELAND 8.42 24.98 33.40 53.47 86.86
117 HADLEY 35.66 48.01 83.67 80.50 164.17
118 HALIFAX 0.00 40.45 40.45 73.60 114.05
119 HAMILTON 7.00 24.37 31.37 66.20 97.57
120 HAMPDEN 0.00 28.16 28.16 78.73 106.89
121 HANCOCK 8.33 19.55 27.88 20.89 48.77
122 HANOVER 18.03 63.25 81.28 119.52 200.80
123 HANSON 8.62 48.23 56.86 72.25 129.10
124 HARDWICK 14.71 20.64 35.36 91.85 127.21
125 HARVARD 44.60 10.44 55.04 108.09 163.13
126 HARWICH 38.16 74.73 112.88 214.01 326.90
127 HATFIELD 15.17 24.66 39.84 62.12 101.96
128 HAVERHILL 83.22 114.67 197.88 355.01 552.90
129 HAWLEY 0.00 13.83 13.83 56.03 69.85
130 HEATH 0.00 25.74 25.74 59.79 85.53
131 HINGHAM 20.64 93.73 114.37 156.37 270.74
132 HINSDALE 10.16 9.08 19.24 51.73 70.97
133 HOLBROOK 12.84 16.25 29.10 71.27 100.37
134 HOLDEN 23.58 59.43 83.01 165.32 248.33
135 HOLLAND 0.29 14.67 14.96 57.52 72.47
136 HOLLISTON 15.83 29.69 45.52 144.44 189.96
137 HOLYOKE 77.88 92.99 170.86 208.98 379.84
138 HOPEDALE 5.93 6.10 12.03 51.25 63.27
139 HOPKINTON 55.50 35.55 91.04 177.05 268.10
140 HUBBARDSTON 16.36 26.02 42.38 99.54 141.92
141 HUDSON 14.11 48.45 62.56 119.14 181.70
142 HULL 0.00 36.42 36.42 72.07 108.49
143 HUNTINGTON 22.50 15.72 38.22 63.49 101.71

ROAD INVENTORY YEAR END REPORT 2020LANE MILES TABLE 14
CITY/TOWN BY FEDERAL AID CATEGORY
Massachusetts Department of TransportationOffice of Transportation Planning 94 / 109
City Town
No Name National HighwaySystem
SurfaceTransportation
Program
Total Federal Aid State & Local Aid Grand Total
144 IPSWICH 14.79 45.17 59.96 123.55 183.50
145 KINGSTON 33.09 53.38 86.47 131.52 217.99
146 LAKEVILLE 20.82 59.87 80.69 150.90 231.59
147 LANCASTER 41.51 34.29 75.80 83.98 159.78
148 LANESBOROUGH 18.59 21.43 40.02 67.64 107.66
149 LAWRENCE 29.06 68.22 97.28 193.36 290.64
150 LEE 50.31 28.15 78.46 75.37 153.83
151 LEICESTER 11.34 47.59 58.93 108.66 167.58
152 LENOX 26.39 26.98 53.37 75.80 129.16
153 LEOMINSTER 53.46 86.99 140.46 234.08 374.53
154 LEVERETT 10.92 33.42 44.34 29.44 73.78
155 LEXINGTON 88.17 78.11 166.28 199.61 365.89
156 LEYDEN 0.00 0.00 0.00 52.35 52.35
157 LINCOLN 24.11 32.23 56.35 72.61 128.96
158 LITTLETON 55.25 36.17 91.42 97.59 189.01
159 LONGMEADOW 26.05 31.92 57.97 149.30 207.26
160 LOWELL 80.43 119.12 199.56 310.86 510.41
161 LUDLOW 25.03 71.29 96.32 182.61 278.93
162 LUNENBURG 21.05 47.08 68.14 108.10 176.24
163 LYNN 44.41 66.94 111.35 244.51 355.86
164 LYNNFIELD 24.25 32.11 56.36 109.18 165.54
165 MALDEN 23.20 68.23 91.43 132.45 223.88
166 MANCHESTER BY THE SEA 14.41 19.89 34.31 48.03 82.34
167 MANSFIELD 52.22 46.97 99.19 186.95 286.14
168 MARBLEHEAD 12.17 28.91 41.08 109.30 150.38
169 MARION 12.88 28.86 41.73 52.84 94.57
170 MARLBOROUGH 61.78 112.97 174.76 185.91 360.67
171 MARSHFIELD 24.85 64.49 89.34 230.69 320.04
172 MASHPEE 22.15 44.66 66.81 177.33 244.14
173 MATTAPOISETT 14.64 36.01 50.65 75.08 125.73
174 MAYNARD 12.65 13.78 26.43 57.53 83.95
175 MEDFIELD 17.38 23.56 40.93 117.08 158.01
176 MEDFORD 60.63 69.67 130.30 175.20 305.50
177 MEDWAY 18.73 30.28 49.01 95.70 144.71
178 MELROSE 8.88 29.78 38.66 120.93 159.59
179 MENDON 8.88 34.48 43.36 69.65 113.01

ROAD INVENTORY YEAR END REPORT 2020LANE MILES TABLE 14
CITY/TOWN BY FEDERAL AID CATEGORY
Massachusetts Department of TransportationOffice of Transportation Planning 95 / 109
City Town
No Name National HighwaySystem
SurfaceTransportation
Program
Total Federal Aid State & Local Aid Grand Total
180 MERRIMAC 15.19 26.46 41.66 61.95 103.60
181 METHUEN 58.19 85.30 143.49 297.06 440.54
182 MIDDLEBOROUGH 79.56 100.44 180.00 245.89 425.89
183 MIDDLEFIELD 0.00 0.00 0.00 60.81 60.81
184 MIDDLETON 12.71 34.94 47.65 68.97 116.61
185 MILFORD 55.95 49.61 105.56 160.20 265.76
186 MILLBURY 40.60 43.27 83.87 103.68 187.55
187 MILLIS 7.64 29.58 37.22 63.39 100.61
188 MILLVILLE 1.03 13.59 14.63 28.66 43.28
189 MILTON 54.36 64.15 118.51 153.77 272.28
190 MONROE 0.00 3.34 3.34 25.93 29.27
191 MONSON 17.39 45.83 63.23 131.38 194.60
192 MONTAGUE 11.00 53.49 64.48 143.29 207.77
193 MONTEREY 0.00 18.02 18.02 71.02 89.05
194 MONTGOMERY 0.40 10.35 10.75 40.02 50.76
195 MOUNT WASHINGTON 0.00 9.98 9.98 21.19 31.17
196 NAHANT 0.18 15.86 16.05 22.11 38.16
197 NANTUCKET 0.00 71.09 71.09 149.93 221.02
198 NATICK 52.47 50.95 103.42 219.10 322.52
199 NEEDHAM 43.20 71.51 114.71 189.42 304.13
200 NEW ASHFORD 7.24 0.00 7.24 18.91 26.15
201 NEW BEDFORD 81.82 140.78 222.60 374.20 596.79
202 NEW BRAINTREE 0.33 22.62 22.95 68.18 91.13
203 NEW MARLBOROUGH 0.00 32.84 32.84 101.92 134.76
204 NEW SALEM 23.88 0.00 23.88 110.10 133.98
205 NEWBURY 30.43 41.05 71.48 70.39 141.87
206 NEWBURYPORT 41.22 24.80 66.02 101.13 167.16
207 NEWTON 94.91 133.90 228.81 432.42 661.23
208 NORFOLK 0.00 46.41 46.41 117.32 163.73
209 NORTH ADAMS 25.48 32.22 57.70 103.36 161.06
210 NORTH ANDOVER 37.51 54.18 91.69 196.09 287.79
211 NORTH ATTLEBOROUGH 36.01 84.74 120.75 198.09 318.84
212 NORTH BROOKFIELD 0.00 44.84 44.84 85.43 130.27
213 NORTH READING 14.24 43.13 57.37 128.50 185.87
214 NORTHAMPTON 46.24 109.10 155.33 193.14 348.47
215 NORTHBOROUGH 35.11 48.77 83.89 112.36 196.25

ROAD INVENTORY YEAR END REPORT 2020LANE MILES TABLE 14
CITY/TOWN BY FEDERAL AID CATEGORY
Massachusetts Department of TransportationOffice of Transportation Planning 96 / 109
City Town
No Name National HighwaySystem
SurfaceTransportation
Program
Total Federal Aid State & Local Aid Grand Total
216 NORTHBRIDGE 0.74 57.73 58.48 112.53 171.01
217 NORTHFIELD 21.38 31.52 52.90 80.30 133.21
218 NORTON 39.91 41.93 81.84 148.24 230.08
219 NORWELL 31.42 42.91 74.33 112.07 186.40
220 NORWOOD 31.59 56.29 87.87 149.40 237.27
221 OAK BLUFFS 9.60 11.96 21.55 57.74 79.29
222 OAKHAM 5.80 17.06 22.86 66.93 89.78
223 ORANGE 26.40 18.76 45.16 138.89 184.05
224 ORLEANS 21.28 33.93 55.21 107.29 162.50
225 OTIS 28.25 19.13 47.38 67.11 114.50
226 OXFORD 40.51 57.98 98.49 133.37 231.86
227 PALMER 62.58 59.05 121.62 118.63 240.26
228 PAXTON 10.80 17.17 27.98 57.11 85.09
229 PEABODY 72.81 51.21 124.03 262.87 386.89
230 PELHAM 11.60 12.07 23.67 45.50 69.17
231 PEMBROKE 18.30 64.62 82.92 143.64 226.56
232 PEPPERELL 26.80 30.46 57.26 106.98 164.24
233 PERU 0.00 9.09 9.09 54.01 63.10
234 PETERSHAM 25.09 14.13 39.23 81.15 120.37
235 PHILLIPSTON 7.21 16.47 23.67 63.99 87.66
236 PITTSFIELD 56.20 115.26 171.46 288.39 459.84
237 PLAINFIELD 0.00 24.01 24.01 49.37 73.39
238 PLAINVILLE 8.93 42.55 51.48 67.55 119.02
239 PLYMOUTH 90.76 187.93 278.68 641.12 919.81
240 PLYMPTON 2.32 26.43 28.75 43.48 72.24
241 PRINCETON 8.42 39.52 47.94 84.86 132.80
242 PROVINCETOWN 12.66 23.73 36.39 27.75 64.14
243 QUINCY 72.51 114.55 187.07 313.22 500.29
244 RANDOLPH 44.55 38.99 83.54 170.18 253.72
245 RAYNHAM 48.01 35.65 83.66 131.89 215.55
246 READING 38.59 32.51 71.10 152.86 223.96
247 REHOBOTH 42.00 61.07 103.07 178.32 281.40
248 REVERE 61.17 50.50 111.66 136.54 248.20
249 RICHMOND 12.21 14.14 26.35 52.58 78.93
250 ROCHESTER 0.66 35.23 35.89 109.87 145.75
251 ROCKLAND 2.37 49.59 51.96 61.47 113.43

ROAD INVENTORY YEAR END REPORT 2020LANE MILES TABLE 14
CITY/TOWN BY FEDERAL AID CATEGORY
Massachusetts Department of TransportationOffice of Transportation Planning 97 / 109
City Town
No Name National HighwaySystem
SurfaceTransportation
Program
Total Federal Aid State & Local Aid Grand Total
252 ROCKPORT 3.64 15.57 19.20 53.61 72.82
253 ROWE 0.00 13.70 13.70 45.48 59.18
254 ROWLEY 21.62 21.44 43.06 56.99 100.05
255 ROYALSTON 0.00 41.99 41.99 64.77 106.76
256 RUSSELL 33.33 18.31 51.64 29.53 81.17
257 RUTLAND 21.02 25.29 46.31 136.67 182.97
258 SALEM 33.35 32.67 66.02 135.90 201.93
259 SALISBURY 20.84 39.36 60.20 53.03 113.23
260 SANDISFIELD 16.88 21.33 38.21 93.26 131.47
261 SANDWICH 37.92 87.02 124.95 296.95 421.90
262 SAUGUS 47.90 25.08 72.98 159.10 232.09
263 SAVOY 3.43 15.09 18.52 63.91 82.43
264 SCITUATE 12.28 72.48 84.75 154.74 239.49
265 SEEKONK 23.86 60.36 84.22 162.54 246.76
266 SHARON 48.88 52.07 100.95 164.84 265.79
267 SHEFFIELD 16.87 26.51 43.38 142.49 185.87
268 SHELBURNE 19.81 6.17 25.99 76.38 102.37
269 SHERBORN 16.39 21.45 37.84 71.03 108.86
270 SHIRLEY 7.11 31.27 38.39 59.28 97.67
271 SHREWSBURY 66.11 58.25 124.36 260.80 385.17
272 SHUTESBURY 6.35 16.96 23.31 39.13 62.44
273 SOMERSET 20.24 51.58 71.82 136.63 208.44
274 SOMERVILLE 40.67 60.53 101.20 133.37 234.57
275 SOUTH HADLEY 30.63 27.72 58.35 140.28 198.63
276 SOUTHAMPTON 0.00 37.23 37.23 107.16 144.39
277 SOUTHBOROUGH 41.50 63.28 104.78 88.17 192.95
278 SOUTHBRIDGE 13.05 36.84 49.89 116.22 166.10
279 SOUTHWICK 28.28 31.58 59.86 111.73 171.59
280 SPENCER 11.35 49.22 60.57 148.28 208.85
281 SPRINGFIELD 175.26 231.86 407.12 683.86 1,090.98
282 STERLING 45.80 58.91 104.71 111.37 216.08
283 STOCKBRIDGE 36.49 20.67 57.16 55.30 112.46
284 STONEHAM 32.48 37.73 70.21 104.15 174.36
285 STOUGHTON 34.77 60.04 94.81 166.33 261.14
286 STOW 14.39 37.74 52.13 66.71 118.84
287 STURBRIDGE 100.05 27.98 128.03 142.70 270.73

ROAD INVENTORY YEAR END REPORT 2020LANE MILES TABLE 14
CITY/TOWN BY FEDERAL AID CATEGORY
Massachusetts Department of TransportationOffice of Transportation Planning 98 / 109
City Town
No Name National HighwaySystem
SurfaceTransportation
Program
Total Federal Aid State & Local Aid Grand Total
288 SUDBURY 18.03 70.25 88.28 191.34 279.61
289 SUNDERLAND 8.66 21.06 29.72 43.22 72.94
290 SUTTON 27.07 53.71 80.78 128.63 209.41
291 SWAMPSCOTT 8.59 17.71 26.31 64.87 91.17
292 SWANSEA 49.02 62.82 111.83 166.29 278.12
293 TAUNTON 57.65 118.13 175.78 379.87 555.65
294 TEMPLETON 22.74 70.11 92.85 116.85 209.70
295 TEWKSBURY 39.42 79.71 119.13 219.85 338.99
296 TISBURY 5.34 13.47 18.81 32.27 51.08
297 TOLLAND 11.43 0.00 11.43 52.56 63.99
298 TOPSFIELD 20.91 31.97 52.88 72.94 125.83
299 TOWNSEND 18.06 32.63 50.69 116.53 167.22
300 TRURO 29.18 20.42 49.60 72.04 121.64
301 TYNGSBOROUGH 23.39 54.76 78.15 118.47 196.62
302 TYRINGHAM 0.00 13.15 13.15 28.87 42.03
303 UPTON 17.93 35.18 53.11 99.17 152.27
304 UXBRIDGE 40.08 45.02 85.11 160.85 245.96
305 WAKEFIELD 42.25 38.43 80.68 143.94 224.61
306 WALES 0.00 16.07 16.07 35.69 51.76
307 WALPOLE 23.95 85.09 109.05 172.31 281.36
308 WALTHAM 61.69 80.98 142.67 207.86 350.52
309 WARE 27.29 27.04 54.33 135.13 189.46
310 WAREHAM 56.35 85.33 141.68 255.90 397.58
311 WARREN 18.83 30.05 48.88 84.93 133.81
312 WARWICK 0.00 25.44 25.44 73.47 98.91
313 WASHINGTON 8.87 0.00 8.87 65.42 74.28
314 WATERTOWN 16.16 37.24 53.40 113.00 166.40
315 WAYLAND 30.08 29.61 59.69 130.37 190.06
316 WEBSTER 16.12 43.89 60.02 114.48 174.50
317 WELLESLEY 44.91 37.27 82.18 195.11 277.29
318 WELLFLEET 15.00 27.67 42.67 82.43 125.10
319 WENDELL 0.62 24.02 24.64 68.74 93.38
320 WENHAM 7.06 29.09 36.15 29.17 65.31
321 WEST BOYLSTON 13.48 45.83 59.31 72.45 131.77
322 WEST BRIDGEWATER 40.48 38.06 78.54 58.30 136.84
323 WEST BROOKFIELD 14.37 16.69 31.06 82.14 113.20

ROAD INVENTORY YEAR END REPORT 2020LANE MILES TABLE 14
CITY/TOWN BY FEDERAL AID CATEGORY
Massachusetts Department of TransportationOffice of Transportation Planning 99 / 109
City Town
No Name National HighwaySystem
SurfaceTransportation
Program
Total Federal Aid State & Local Aid Grand Total
324 WEST NEWBURY 15.58 27.03 42.62 57.24 99.86
325 WEST SPRINGFIELD 76.99 56.02 133.01 192.48 325.49
326 WEST STOCKBRIDGE 24.40 13.08 37.48 54.81 92.29
327 WEST TISBURY 0.00 17.27 17.27 28.84 46.12
328 WESTBOROUGH 51.70 55.15 106.85 143.40 250.25
329 WESTFIELD 74.09 97.20 171.29 330.21 501.50
330 WESTFORD 43.24 88.22 131.47 214.78 346.25
331 WESTHAMPTON 0.00 42.32 42.32 35.66 77.98
332 WESTMINSTER 39.08 55.85 94.93 113.59 208.52
333 WESTON 45.17 71.70 116.87 125.99 242.86
334 WESTPORT 22.09 105.01 127.10 218.54 345.64
335 WESTWOOD 22.96 45.30 68.26 118.92 187.18
336 WEYMOUTH 36.42 92.35 128.77 248.11 376.88
337 WHATELY 16.17 23.00 39.17 52.21 91.38
338 WHITMAN 13.27 25.72 38.99 68.62 107.61
339 WILBRAHAM 14.65 58.21 72.86 149.40 222.26
340 WILLIAMSBURG 15.79 22.41 38.20 49.20 87.41
341 WILLIAMSTOWN 29.88 25.01 54.88 81.96 136.85
342 WILMINGTON 56.76 57.94 114.70 160.07 274.77
343 WINCHENDON 21.59 41.23 62.82 135.09 197.91
344 WINCHESTER 9.56 43.69 53.24 125.46 178.70
345 WINDSOR 20.68 8.79 29.47 87.32 116.80
346 WINTHROP 0.00 28.08 28.08 49.74 77.82
347 WOBURN 60.98 62.91 123.89 201.08 324.97
348 WORCESTER 206.26 198.19 404.45 749.80 1,154.25
349 WORTHINGTON 20.53 13.80 34.33 63.51 97.84
350 WRENTHAM 42.21 47.26 89.47 117.28 206.75
351 YARMOUTH 38.14 105.53 143.67 368.13 511.80
Total 10,468.22 16,161.38 26,629.60 46,464.90 73,094.50
ROAD INVENTORY YEAR END REPORT 2020
Massachusetts Department of TransportationOffice of Transportation Planning 100 / 109
APPENDIX

ROAD INVENTORY YEAR END REPORT 2020APPENDIX A
DESCRIPTION OF ROAD INVENTORY FILE
Massachusetts Department of TransportationOffice of Transportation Planning 101 / 109
Route_ID: The primary state numbered route or designated non-numbered route on which this segment lies; whenmore than one route traverse a segment, the highest order (Interstate > US Highway > State Route), lowest numberroute is primary; non-numbered routes are used internally by Planning for pavement data collections. Route_ID isalso the unique identifier for the LRS record.
From_Measure: The measured length along the specified Routes feature where the RoadInventory segment starts
To_Measure: The measured length along the Routes feature where the RoadInventory segment ends
From_Date: The date the Routes or event section became active, or, if not known, the date it was entered into thesystem; all roads active when this field was implemented were assigned a date 1/1/2004
To_Date: The date the specified Routes or events section is retired.
Rd_Seg_ID: RoadSegment ID - The unique identifier of the base arcs
St_Name: ( Street Name) The name of the street the segment lies on
City1= Abington & 351 = Yarmouth
CountyA = BarnstableB = BerkshireC = BristolD = DukesE = EssexF = FranklinG = HampdenH = HampshireI = MiddlesexJ = NantucketK = NorfolkL = PlymouthM = SuffolkN = Worcester
Fm_St_Name: ( From Street Name) The cross-street where the street starts when the street starts at a cross-street,otherwise the from end type is used:
1 = Cross-street name2 = Dead end3 = Cul-de-sac4 = Private property5 = Town line6 = State line
To_St_Name: ( To Street Name) The cross-street where the street ends when the street ends at a cross-street,otherwise the to end type is used:
1 = Cross-street2 = Dead end3 = Cul-de-sac4 = Private property5 = Town line6 = State line
Mile_Count: ( Mileage Counted) Describes whether the segments length is counted towards the official statewideroad centerline mileage
1 = Yes0 = No
Note - See Facility Type

ROAD INVENTORY YEAR END REPORT 2020APPENDIX A
DESCRIPTION OF ROAD INVENTORY FILE
Massachusetts Department of TransportationOffice of Transportation Planning 102 / 109
RPA: Regional Planning AgencyBRPC =Berkshire Regional Planning CommissionCCC = Cape Cod CommissionCMRPC = Central Massachusetts Regional Planning CommissionFRCOG = Franklin Regional Council of GovernmentsMAPC = Metropolitan Area Planning CouncilMRPC = Montachusett Regional Planning CommissionMVC = Marthas Vineyard CommissionMVPC = Merrimack Valley Planning CommissionNMCOG = Northern Middlesex Council of GovernmentsNPEDC = Nantucket Planning and Economic Development CommissionOCPC = Old Colony Planning CouncilPVPC = Pioneer Valley Planning CommissionSRPEDD = Southeastern Regional Planning and Economic Development District
MPO: Metropolitan Planning OrganizationBerkshireBoston RegionCape CodCentral MassachusettsFranklinMartha's VineyardMerrimack ValleyMontachusettNantucketNorthern MiddlesexOld ColonyPioneer ValleySoutheastern Massachusetts
Hwy_Dist: MassDOT Highway DistrictMinValue: 1MaxValue: 6
Urban_Type:1 = Large Urbanized Area – Densely settled territory that contains 200,000 people or more2 = Small Urbanized Area – Densely settled territory that contains at least 50,000 people but fewer than 200,000 people3 = Large Urban Cluster – Densely settled territory that contains at least 5000 people but fewer than 50,000 people4 = Small Urban Cluster – Densely settled territory that contains at least 2500 people but fewer than 5000 people5 = Rural
F_Class: Functional Classification Note: use urban/rural designation to interpret functional classification0 = Local1 = Interstate2 = Principal arterial3 = Rural minor arterial or urban principal arterial5 = Urban minor arterial or rural major collector6 = Urban collector or rural minor collector

ROAD INVENTORY YEAR END REPORT 2020APPENDIX A
DESCRIPTION OF ROAD INVENTORY FILE
Massachusetts Department of TransportationOffice of Transportation Planning 103 / 109
F_F_Class: Federal Functional Classification1 = Interstate2 = Principal Arterial – Other Freeways and Expressways3 = Principal Arterial – Other4 = Minor Arterial5 = Major Collector6 = Minor Collector7 = Local
Urban_Area:0 = RURAL
Large Urbanized Area05167 = Barnstable Town09271 = Boston (MA-NH-RI)72505 = Providence (RI-MA)83926 = Springfield (MA-CT)97291 = Worcester (MA-CT)
Small Urbanized Area49096 = Leominster-Fitchburg61165 = Nashua (NH-MA)61786 = New Bedford69778 = Pittsfield
Large Urban Cluster03790 = Athol34975 = Greenfield48745 = Lee61003 = Nantucket63460 = North Adams (MA-VT)63568 = North Brookfield83156 = South Deerfield90757= Vineyard Haven91756 = Ware
Small Urban Cluster34678 = Great Barrington72532 = Provincetown84169 = Stafford (CT-MA)

ROAD INVENTORY YEAR END REPORT 2020APPENDIX A
DESCRIPTION OF ROAD INVENTORY FILE
Massachusetts Department of TransportationOffice of Transportation Planning 104 / 109
Jurisdictn: Jurisdiction1 = Massachusetts Department of Transportation2 = City or Town accepted road3 = Department of Conservation and Recreation5 = Massachusetts Port Authority6 = State Park or Forest7 = State Institutional8 = Federal Park or Forest9 = County Institutional0 = Unaccepted by city or townB = State college or universityC = US Air ForceD = US Army Corps of EngineersE = Federal InstitutionalF = Other FederalG = Federal Bureau of Indian AffairsH = PrivateI = US ArmyJ = US Navy
Truck_Rte: Truck Route0 = Not a parkway - not on a designated truck route1 = Designated truck route under Federal Authority in 23 CFR 658 Available to STAA vehicles (Twin 28' Semi-trailer-trailer and 48' Semi-trailer combinations)2 = Designated truck route ONLY under State Authority. Fully available to both types of STAA vehicles described above3 = Department of Conservation and Recreation Parkway – No trucks allowed
T_Exc_Type: Truck Exclusion Type1 = Open to all vehicles2 = All vehicles over 2.5 tons excluded3 = All vehicles over 3 tons excluded4 = All vehicles over 5 tons excluded5 = All vehicles over 10 tons excluded6 = All vehicles over 2000 pounds excluded7 = All vehicles over 28 feet in length excluded8 = Gross vehicle weight over 18 tons and greater than 2 axles excluded9 = Gross vehicle weight over 30 tons and greater than 4 axles excluded10 = Commercial vehicles over 5 tons carry capacity excluded11 = All vehicles over 20 tons excluded12 = Hazardous Truck Route13 = Cambridge Overnight Exclusions

ROAD INVENTORY YEAR END REPORT 2020APPENDIX A
DESCRIPTION OF ROAD INVENTORY FILE
Massachusetts Department of TransportationOffice of Transportation Planning 105 / 109
T_Exc_Time: Truck Exclusion Time1 = None2 = 24 Hours, 7 Days3 = 5AM to 8PM, 7 Days4 = 6AM to 6PM, 7 Days5 = 6AM to 7PM, 7 Days6 = 6AM to 10PM, 7 Days7 = 7AM to 6PM, 7 Days8 = 7AM to 11PM, 7 Days9 = 4PM to 6PM10 = 6PM to 6AM, 7 Days11 = 7PM to 7AM, 7 Days12 = 8PM to 6AM, 7 Days13 = 8PM to 7AM, 7 Days14 = 9PM to 6AM, 7 Days15 = 9PM to 7AM, 7 Days16 = 10PM to 6AM, 7 Days17 = 11PM to 6AM, 7 Days18 = 11PM to 6AM, NB Only, 7 Days19 = 11PM to 7AM, 7 Days20 = 8AM to 930AM and 2PM to 330PM, School Days Only
NHS: National Highway System Status0 = Not on NHS1 = NHS - Interstate2 = NHS - Strategic Defense Highway System (STRAHNET)3 = NHS - STRAHNET Connector4 = NHS - Other - One-way pair5 = NHS - Other - Truck route exclusion6 = NHS - Major Airport7 = NHS - Major Port Facility8 = NHS - Major Amtrak Station9 = NHS - Major Rail/Truck terminal10 = NHS - Major Intercity Bus Terminal11 = NHS - Major Public Transit or Multi-Modal Passenger Terminal12 = NHS - Major Pipeline Terminal13 = NHS - Major Ferry Terminal14 = NHS - Other (not in above categories)15 = NHS – MAP-21
MHS: Metropolitan Highway System0 = Not on MHS1 = MHS
Fd_Aid_Rd: Federal Aid Eligible Roads (National Highway System and Surface Transportation Program)0 = Not Eligible1 = Interstate - NHS2 = Other Road - NHS3 = STP Eligible4 = STP Road - C15
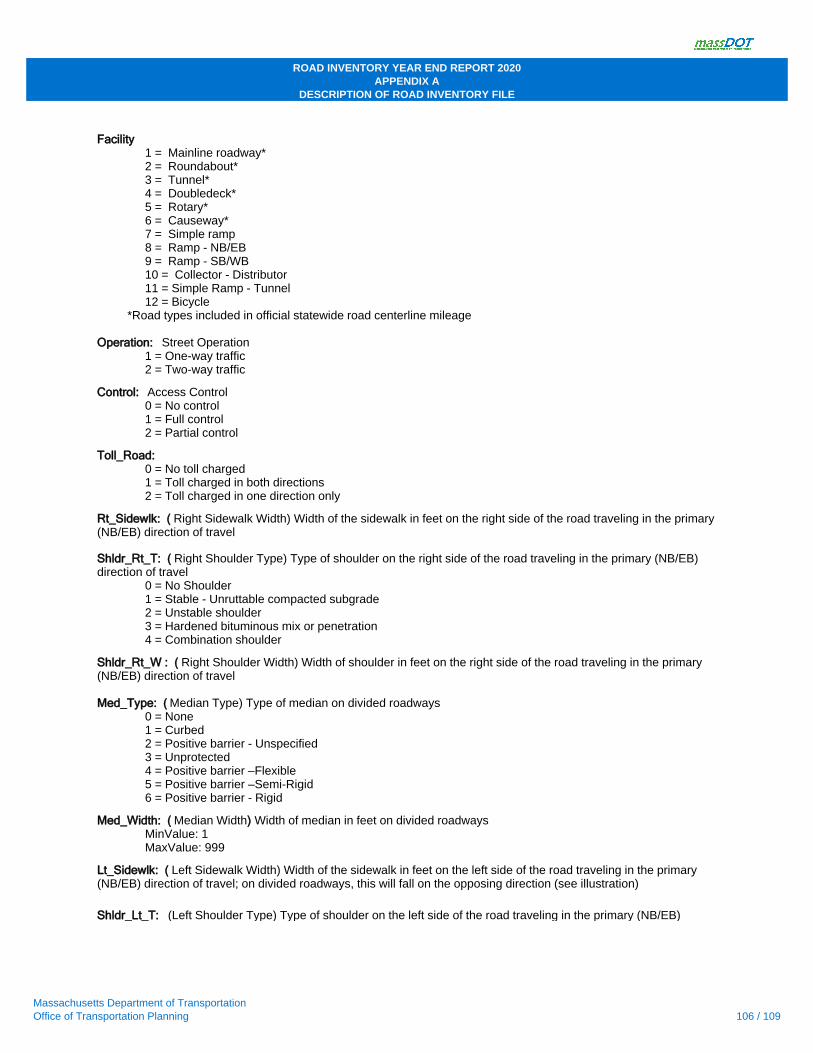
ROAD INVENTORY YEAR END REPORT 2020APPENDIX A
DESCRIPTION OF ROAD INVENTORY FILE
Massachusetts Department of TransportationOffice of Transportation Planning 106 / 109
Facility1 = Mainline roadway*2 = Roundabout*3 = Tunnel*4 = Doubledeck*5 = Rotary*6 = Causeway*7 = Simple ramp8 = Ramp - NB/EB9 = Ramp - SB/WB10 = Collector - Distributor11 = Simple Ramp - Tunnel12 = Bicycle
*Road types included in official statewide road centerline mileage
Operation: Street Operation1 = One-way traffic2 = Two-way traffic
Control: Access Control0 = No control1 = Full control2 = Partial control
Toll_Road:0 = No toll charged1 = Toll charged in both directions2 = Toll charged in one direction only
Rt_Sidewlk: ( Right Sidewalk Width) Width of the sidewalk in feet on the right side of the road traveling in the primary(NB/EB) direction of travel
Shldr_Rt_T: ( Right Shoulder Type) Type of shoulder on the right side of the road traveling in the primary (NB/EB)direction of travel
0 = No Shoulder1 = Stable - Unruttable compacted subgrade2 = Unstable shoulder3 = Hardened bituminous mix or penetration4 = Combination shoulder
Shldr_Rt_W : ( Right Shoulder Width) Width of shoulder in feet on the right side of the road traveling in the primary(NB/EB) direction of travel
Med_Type: ( Median Type) Type of median on divided roadways0 = None1 = Curbed2 = Positive barrier - Unspecified3 = Unprotected4 = Positive barrier – Flexible5 = Positive barrier – Semi-Rigid6 = Positive barrier - Rigid
Med_Width: ( Median Width) Width of median in feet on divided roadwaysMinValue: 1MaxValue: 999
Lt_Sidewlk: ( Left Sidewalk Width) Width of the sidewalk in feet on the left side of the road traveling in the primary(NB/EB) direction of travel; on divided roadways, this will fall on the opposing direction (see illustration)
Shldr_Lt_T: (Left Shoulder Type) Type of shoulder on the left side of the road traveling in the primary (NB/EB)

ROAD INVENTORY YEAR END REPORT 2020APPENDIX A
DESCRIPTION OF ROAD INVENTORY FILE
Massachusetts Department of TransportationOffice of Transportation Planning 107 / 109
direction of travel; for divided roadways median shoulders are assumed to be of the same type0 = No Shoulder1 = Stable - Unruttable compacted subgrade2 = Unstable shoulder3 = Hardened bituminous mix or penetration4 = Combination shoulder
Shldr_Lt_W: (Left Shoulder Width) Width of shoulder in feet on the left side of the road traveling in the primary(NB/EB) direction of travel; for divided roadways median shoulders are assumed to be of the same type
Shldr_UL_T: (UndividedLeftShoulderType) Type of shoulder on the opposing side of an undivided road0 = No Shoulder1 = Stable - Unruttable compacted subgrade2 = Unstable shoulder3 = Hardened bituminous mix or penetration4 = Combination shoulder
Shldr_UL_W: ( UndividedLeftShoulderWidth) Width of shoulder in feet on the opposing side of an undivided road
Surface_Tp: Surface Type1 = Unimproved, graded earth, or soil surface road2 = Gravel or stone road3 = Brick road4 = Block road5 = Surface-treated road6 = Bituminous concrete road7 = Portland cement concrete road8 = Composite road; flexible over rigid9 = Composite road; rigid over flexible or rigid over rigid ("white topping")10=Stone dust
Surface_Wd: (Surface Width) Surface width in feet; measurement of traveled way, excluding shoulders/auxiliarylanes
ROW_Width: Right-of-way width in feet
Num_Lanes: ( Number Of Travel Lanes) Number of travel lanes (for undivided roadways, number of lanes in bothdirections of travel, for divided roadways, number of lanes on the given segment only)
MinValue: 1MaxValue: 6
Opp_Lanes: (Opposite Number Of Travel Lanes) Number of lanes in the opposite direction of a divided roadwayMinValue: 1MaxValue: 6
Curb0 = None1 = Left side only2 = Right side only3 = Both sides4 = Along median only5 = All curbs (divided highway)
Terrain1 = Level2 = Rolling3 = Mountainous
Speed_Lim: Speed LimitMinValue: 5MaxValue: 65
Op_Dir_SL: Opposing Direction Speed Limit

ROAD INVENTORY YEAR END REPORT 2020APPENDIX A
DESCRIPTION OF ROAD INVENTORY FILE
Massachusetts Department of TransportationOffice of Transportation Planning 108 / 109
MinValue: 5MaxValue: 65
Struct_Cnd: Structural Condition1 = Good2 = Fair3 = Deficient4 = Intolerable
AADT: Average Annual Daily Traffic
Statn_Num: (AADT Station Number) AADT count station location number; used to reference Traffic Data Collectionscounting station number
AADT_Deriv: AADT Derivation0 = Not applicable1 = Derived from counts collected on or adjacent to the section during the current year2 = Derived from factoring counts from the previous year count-base AADT that is less than three years old3 = Derived from count data that is three or more years old4 = Derived from an estimate5 = Working code for principal arterial counting program6 = MassDOT Highway Special Count7 = RPA Count8 = Other Count
AADT_Year: Year of ADT collection
IRI: (International Roughness Index) Pavement Roughness; value reflects calibrated value in inches of roughnessper mile
IRI_Year: Year of IRI collection
PSI: (Present Serviceability Rating) Pavement Condition; value reflects estimated condition on selected roadwaysection
PSI_Year: Year of PSI collection

ROAD INVENTORY YEAR END REPORT 2020APPENDIX B
PHYSICAL ROAD DESCRIPTION ON DIVIDED AND UNDIVIDED ROADWAYS
Massachusetts Department of TransportationOffice of Transportation Planning 109 / 109
Div
ide
d H
igh
wa
y O
nly
Diff
er
on
Div
ide
d/
Un
div
ide
d H
igh
wa
ys
Un
div
ide
d H
igh
wa
y
On
ly
Sa
me
On
All
Ro
ad
s
Div
ided
Hig
hw
ay
Un
div
ide
d H
igh
way
Un
div
ide
dL
eft
Sh
ou
lde
rWid
th
Un
div
ide
dL
eftS
ho
uld
erT
yp
e
Su
rfa
ce
Wid
thS
urf
ac
eT
yp
e Rig
htS
ide
wa
lkW
idth
Rig
htS
ho
uld
erW
idth
Rig
htS
ho
uld
erT
yp
e
Le
ftS
ho
uld
erW
idth
Le
ftS
ho
uld
erT
yp
e
Me
dia
nW
idth
Me
dia
nT
yp
e
Le
ftS
ide
wa
lkW
idth
Nu
mb
erO
fTra
ve
lLan
es
Op
po
sit
eN
um
be
rOfT
rav
elL
an
es
Rig
htO
fWa
yWid
th
Le
ftS
ide
wa
lkW
idth
Le
ftS
ho
uld
erW
idth
Le
ftS
ho
uld
erT
yp
e
Nu
mb
erO
fTra
ve
lLan
es
Su
rfa
ce
Wid
th
Su
rfa
ce
Ty
pe
Rig
htO
fWa
yWid
th
Rig
htS
ho
uld
erW
idth
Rig
htS
ho
uld
erT
yp
e
Rig
htS
ide
wa
lkW
idth