2018 q4 results & 2019 guidance webcast...
TRANSCRIPT

A Canadian Focused Gold Producer
CORPORATE PRESENTATION
2018 Q4 RESULTS &
2019 GUIDANCE WEBCAST
PRESENTATION
FEBRUARY 14, 2019

Cautionary Statements
2
ALL AMOUNTS IN U.S. DOLLARS UNLESS OTHERWISE STATEDCAUTIONARY NOTE REGARDING FORWARD-LOOKING STATEMENTSCertain information contained in this presentation, including any information relating to New Gold’s future financial or operating performance are “forward looking”. All statements in this presentation, other than statements of historical fact, which address events, results, outcomes or developments that New Gold expects to occur are “forward-looking statements”. Forward-looking statements are statements that are not historical facts and are generally, but not always, identified by the use of forward-looking terminology such as “plans”, “expects”, “is expected”, “budget”, “scheduled”, “targeted”, “estimates”, “forecasts”, “intends”, “anticipates”, “projects”, “potential”, “believes” or variations of such words and phrases or statements that certain actions, events or results “may”, “could”, “would”, “should”, “might” or “will be taken”, “occur” or “be achieved” or the negative connotation of such terms. Forward looking statements in this presentation include statements with respect to: guidance for production and costs, and the factors contributing to those expected results, including mill throughput, metal recoveries and ore grade, as well as expected capital and other expenditures; and planned development and exploration activities and timing for 2019 and future years.All forward-looking statements in this presentation are based on the opinions and estimates of management as of the date such statements are made and are subject to important
risk factors and uncertainties, many of which are beyond New Gold’s ability to control or predict. Certain material assumptions regarding such forward-looking statements are discussed in this presentation, New Gold’s latest annual management’s discussion and analysis (“MD&A”), Annual Information Form and Technical Reports filed at www.sedar.com and on EDGAR at www.sec.gov. In addition to, and subject to, such assumptions discussed in more detail elsewhere, the forward-looking statements in this presentation are also subject to the following assumptions: (1) there being no significant disruptions affecting New Gold’s operations; (2) political and legal developments in jurisdictions where New Gold operates, or may in the future operate, being consistent with New Gold’s current expectations; (3) the accuracy of New Gold’s current mineral reserve and mineral resource estimates; (4) the exchange rate between the Canadian dollar and U.S. dollar, and to a lesser extent, the Mexican Peso, being approximately consistent with current levels; (5) prices for diesel, natural gas, fuel oil, electricity and other key supplies being approximately consistent with current levels; (6) equipment, labour and materials costs increasing on a basis consistent with New Gold’s current expectations; (7) arrangements with First Nations and other Aboriginal groups in respect of the Rainy River mine, New Afton mine and Blackwater project being consistent with New Gold’s current expectations; (8) all required permits, licenses and authorizations being obtained from the relevant governments and other relevant stakeholders within the expected timelines and the absence of material negative comments during the applicable regulatory processes; and (9) in the case of production, cost and expenditure outlooks at the operating mines for 2019, commodity prices, exchange rates, grades, recovery rates, mill availability and mill throughput rates being consistent with those estimated for the purposes for 2019.Forward-looking statements are necessarily based on estimates and assumptions that are inherently subject to known and unknown risks, uncertainties and other factors that may cause actual results, level of activity, performance or achievements to be materially different from those expressed or implied by such forward-looking statements. Such factors include, without limitation: significant capital requirements and the availability and management of capital resources; additional funding requirements; price volatility in the spot and forward markets for metals and other commodities; fluctuations in the international currency markets and in the rates of exchange of the currencies of Canada, the United States and, to a lesser extent, Mexico; discrepancies between actual and estimated production, between actual and estimated mineral reserves and mineral resources and between actual and estimated metallurgical recoveries; risks related to early production at the Rainy River Mine, including failure of equipment, machinery, the process circuit or other processes to perform as designed or intended; fluctuation in treatment and refining charges; changes in national and local government legislation in Canada, the United States and, to a lesser extent, Mexico or any other country in which New Gold currently or may in the future carry on business; taxation; controls, regulations and political or economic developments in the countries in which New Gold does or may carry on business; the speculative nature of mineral exploration and development, including the risks of obtaining and maintaining the validity and enforceability of the necessary licenses and permits and complying with the permitting requirements of each jurisdiction in which New Gold operates, the lack of certainty with respect to foreign legal systems, which may not be immune from the influence of political pressure, corruption or other factors that are inconsistent with the rule of law; the uncertainties inherent to current and future legal challenges New Gold is or may become a party to; diminishing quantities or grades of mineral reserves and mineral resources; competition; loss of key employees; rising costs of labour, supplies, fuel and equipment; actual results of current exploration or reclamation activities; uncertainties inherent to mining economic studies; changes in project parameters as plans continue to be refined; accidents; labour disputes; defective title to mineral claims or property or contests over claims to mineral properties; unexpected delays and costs inherent to consulting and accommodating rights of Indigenous groups; risks, uncertainties and unanticipated delays associated with obtaining and maintaining necessary licenses, permits and authorizations and complying with permitting requirements. In addition, there are risks and hazards associated with the business of mineral exploration, development and mining, including environmental events and hazards, industrial accidents, unusual or unexpected formations, pressures, cave-ins, flooding and gold bullion losses and risks associated with early production of a mine, such as Rainy River, (and the risk of inadequate insurance or inability to obtain insurance to cover these risks) as well as “Risk Factors” included in New Gold’s Annual Information Form, MD&A and other disclosure documents filed on and available at www.sedar.com and on EDGAR at www.sec.gov. Forward-looking statements are not guarantees of future performance, and actual results and future events could materially differ from those anticipated in such statements. All of the forward-looking statements contained in this news release are qualified by these cautionary statements. New Gold expressly disclaims any intention or obligation to update or revise any forward-looking statements whether as a result of new information, events or otherwise, except in accordance with applicable securities laws.

Webcast Presentation Agenda
3
• Opening Remarks (Renaud Adams, CEO)
• Presentation of Q4 and year-end financial results (Rob Chausse, CFO)
• December 31, 2018 Reserve & Resource Estimates (Renaud Adams, CEO)
• Presentation of 2019 Outlook (Renaud Adams, CEO)
• Q&A Session

Q4 and Year-end Review

Q4 2018 Operating Highlights
5
All amounts are in US$ unless otherwise indicated
• Higher quarterly production compared to prior-year period due to additional ounces from Rainy River
• Lower quarterly operating costs and AISC due to stronger operational performance as well as higher gold ounces sold and lower sustaining capital spent at Rainy River
Q4 Operational Highlights Rainy River New Afton Cerro San Pedro
Consolidated Continuing Operations
Q4 2018
Consolidated Continuing Operations
Q4 2017
Gold Produced (oz) 77,202 18,778 1,448 97,428 58,070
Gold Sold (oz) 66,123 17,176 1,122 84,421 54,170
Copper Produced (Mlb) - 20.8 - 20.8 24.6
Copper Sold (Mlb) - 19.7 - 19.7 22.0
Operating Expense ($ per gold oz) 648 375 6,583 568 731
Operating Expense ($ per copper lb) - 0.90 - 1.37 1.56
AISC ($ per gold oz) 1,054 (1,306) 14 688 714

2018 Operational Highlights
6
All amounts are in US$ unless otherwise indicated
2018 Operational Highlights Rainy River New Afton Cerro San Pedro
Consolidated Continuing Operations
2018
Consolidated Continuing Operations
2017
Gold Produced (oz) 227,284 77,329 10,870 315,483 149,009
Gold Sold (oz) 214,804 72,489 10,709 298,002 140,654
Copper Produced (Mlb) - 85.1 - 85.1 90.6
Copper Sold (Mlb) - 81.1 - 81.1 84.5
Operating Expense ($ per gold oz) 826 384 3,308 648 605
Operating Expense ($ per copper lb) - 0.93 - 1.57 1.26
AISC ($ per oz) 1,501 (1,147) 2,023 961 488
• Higher annual production compared to prior-year period due to additional ounces from Rainy River
• Higher annual operating costs and AISC primarily due to start-up challenges at Rainy River

Q4 and Full Year Financial Highlights
7
All amounts are in US$ unless otherwise indicated
Continuing Operations Q4 2018 Q4 2017 FY 2018 FY 2017
Revenues ($M) 157.4 123.5 604.5 388.7
Loss per share, basic (1.26) (0.39) (1.85) (0.28)
Earnings (loss) per share, adj. 0.04 (0.04) (0.02) (0.04)
OCF per share, before working capital adj. 0.13 0.07 0.46 0.27
OCF per share 0.10 0.10 0.33 0.35
Realized gold price 1,230 1,268 1,263 1,278
Realized copper price 2.96 2.70 3.06 2.66
Total Operations (including Mesquite and Peak Mines) Q4 2018 Q4 2017 FY 2018 FY 2017
Loss per share, basic (1.26) (0.34) (2.12) (0.19)
OCF per share 0.11 0.21 0.42 0.61

Q4 and 2018 Capital Expenditures
8
Capital Expenditures – Q4 2018
Rainy River New Afton Mesquite CSP Blackwater Total (1)
Tailings Dam 5.8 3.9 - - - 9.7
Capitalized Mining 5.8 - 1.0 - - 6.8
Mine 1.6 0.3 - - - 1.9
Mill 0.4 1.0 - - - 1.4
Other 12.0 (0.2) - - - 11.9
Sustaining Capital ($M) 25.6 5.0 1.0 - - 31.7
Growth Capital ($M) 6.1 1.0 - - 1.6 8.7
Capital Expenditures - 2018
Rainy River New Afton Mesquite CSP Blackwater Total (1)
Tailings Dam 70.7 21.6 - - - 92.3
Capitalized Mining 39.5 1.4 3.0 - - 43.9
Mine 13.1 4.2 0.7 - - 18.0
Mill 3.2 3.9 0.6 - - 7.7
Other 15.6 1.5 0.4 - - 17.6
Sustaining Capital ($M) 142.1 32.6 4.7 - - 179.5
Growth Capital ($M) 28.5 3.3 - - 7.3 39.1
All amounts are in US$ unless otherwise indicated
1. Total includes Corporate
• The majority of capital expenditure in 2018 is related to the completion of the construction of stage 1 of Rainy River’s Tailings Disposal Facility, and a Tailings Dam Raise at New Afton.
• Rainy River growth capital expenditures were related to the payment of working capital for project development and advancing the underground• New Afton growth capital expenditures were primarily study costs related to the C-zone
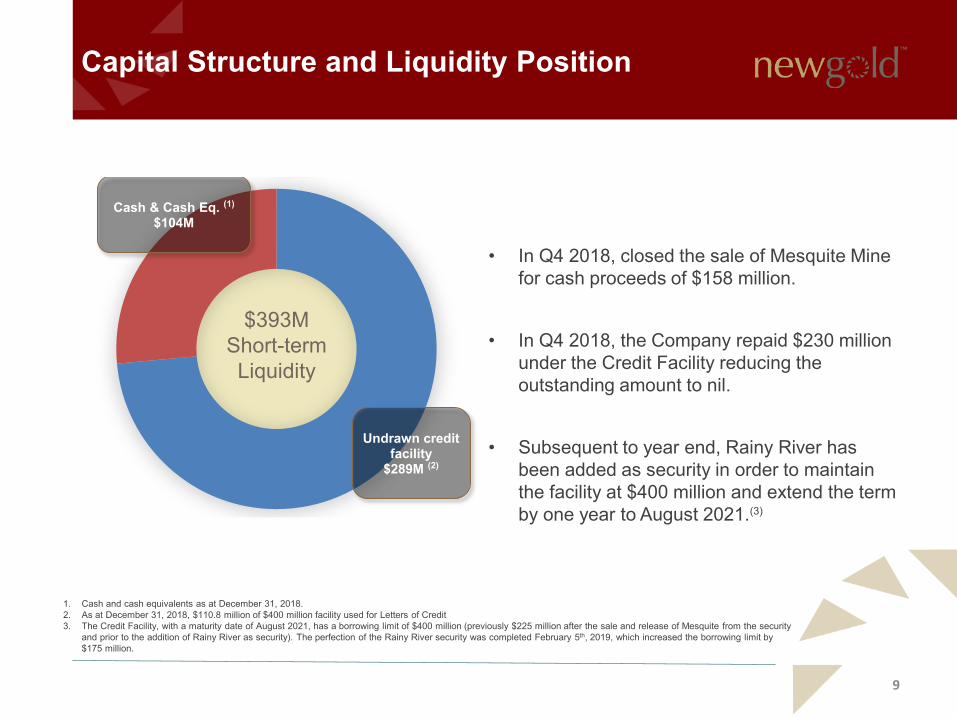
$393M Short-term Liquidity
Undrawn credit facility
$289M (2)
Cash & Cash Eq. (1)
$104M
Capital Structure and Liquidity Position
9
1. Cash and cash equivalents as at December 31, 2018.2. As at December 31, 2018, $110.8 million of $400 million facility used for Letters of Credit3. The Credit Facility, with a maturity date of August 2021, has a borrowing limit of $400 million (previously $225 million after the sale and release of Mesquite from the security
and prior to the addition of Rainy River as security). The perfection of the Rainy River security was completed February 5th, 2019, which increased the borrowing limit by $175 million.
• In Q4 2018, closed the sale of Mesquite Mine for cash proceeds of $158 million.
• In Q4 2018, the Company repaid $230 million under the Credit Facility reducing the outstanding amount to nil.
• Subsequent to year end, Rainy River has been added as security in order to maintain the facility at $400 million and extend the term by one year to August 2021.(3)

December 31, 2018 Reserves & Resources

Mineral Reserves and Resources by Site
Rainy River: Proven and probable reserves have decreased by 35 Koz, reflecting a decrease from mining depletion that has been largely offset through a combination of an updated open pit design and transition from a gold-only to a gold-equivalent cut-off basis for mine planning and reporting to account for by-product silver mined.
Measured and indicated resources (exclusive of reserves) remain materially unchanged compared to mid-year 2018. Inferred resources have increased by 0.13 Moz due to the recognition of inferred material in the open pit that previously went unreported as zero-grade waste.
New Afton: Gold reserves remain materially unchanged at 1.08 Moz compared to year-end 2017. This is due primarily to updated cone shapes applied to the B and C-zone block cave mining designs. Copper reserves decreased by 38 Mlbs, less than the total 97 Mlbs of mining depletion during 2018 as a result of the favorable impact of the revised block cave design.
Measured and indicated resources (exclusive of reserves) decreased by 0.13 Moz gold and 77 Mlbs copper as a result of resource-to-reserve conversions, likewise stemming from the revised block cave mining design. Inferred gold resources decreased marginally as a result of the lower gold pricing assumption; inferred copper resources remain unchanged compared to year-end 2017.
Blackwater: Proven and probable reserves remain unchanged compared to year-end 2017. Measured, indicated and inferred resources likewise remain materially unchanged compared to year-end 2017.
Mineral Reserves and Resources Summary (as at Dec 31, 2018)
11

Mineral Reserves and Resources (as at Dec 31, 2018)
12
Mineral Reserves Statement as at December 31, 2018
Proven & Probable Metal grade Contained metal
Tonnes000s
Goldg/t
Silverg/t
Copper%
GoldKoz
SilverKoz
CopperMlbs
RAINY RIVERDirect processing reservesOpen Pit
Proven 18,663 1.24 2.4 - 744 1,450 -Probable 47,670 1.18 3.0 - 1,810 4,542 -Open Pit P&P (direct processing-MGO&HGO) 66,333 1.20 2.8 - 2,554 5,993 -
UndergroundProven - - - - - - -Probable 8,954 3.55 9.5 - 1,021 2,728 -Underground P&P (direct processing) 8,954 3.55 9.5 - 1,021 2,728 -
Low grade reservesOpen Pit
Proven 8,430 0.36 2.0 - 97 541 -Probable 32,714 0.35 2.3 - 366 2,428 -Open Pit P&P (LGO) 41,145 0.35 2.2 - 463 2,969 -
Surface StockpilesProven 7,307 0.63 1.8 - 147 426 -Open Pit P&P (stockpile) 7,307 0.63 1.8 - 147 426 -
Combined P&PProven 34,400 0.89 2.4 - 989 2,291 -Probable 89,339 1.11 3.4 - 3,197 9,825 -
Total Rainy River P&P 123,739 1.05 3.0 - 4,186 12,116 -

Mineral Reserves and Resources (as at Dec 31, 2018)
13
Mineral Reserves Statement as at December 31, 2018
Proven & Probable Metal grade Contained metal
Tonnes000s
Goldg/t
Silverg/t
Copper%
GoldKoz
SilverKoz
CopperMlbs
NEW AFTON
A&B ZonesProven - - - - - - -Probable 25,731 0.51 1.9 0.74 420 1,612 420
C ZoneProven - - - - - - -Probable 26,911 0.76 1.9 0.82 657 1,668 484
Total New Afton P&P 52,642 0.64 1.9 0.78 1,077 3,280 903
BLACKWATERDirect processing reserves
Proven 124,500 0.95 5.5 - 3,790 22,100 -Probable 169,700 0.68 4.1 - 3,730 22,300 -P&P (direct processing) 294,300 0.79 4.7 - 7,510 44,400 -
Low grade reservesProven 20,100 0.50 3.6 - 330 2,300 -Probable 30,100 0.34 14.6 - 330 14,100 -P&P (stockpile) 50,200 0.40 10.2 - 650 16,400 -
Total Blackwater P&P 344,400 0.74 5.5 - 8,170 60,800 -
Total P&P 13,433 76,196 903

2019 Outlook Overview

15
2019 Consolidated Guidance
Operational Estimates Rainy River New Afton 2019 Consolidated Guidance1
Gold Produced (ounces) 245,000 – 270,000 55,000 – 65,000 300,000 – 335,000
Copper Produced (Mlbs) - 75 – 85 75 - 85
Gold Eq. Produced (ounces)2 250,000 – 275,000 215,000 – 245,000 465,000 – 520,000
Operating Expense per gold ounce $870 - $950 $480 - $520 $690 - $770
Operating Expense per copper pound - $0.95 - $1.15 -
Cash Costs per gold ounce (with by-product credits) $870 - $950 ($1,350) – ($1,310) $470 - $540
Cash Costs per gold eq. ounce (on a co-product basis) $870 - $950 $600 - $640 $740 - $820
Corporate G&A per gold eq. ounce (on a co-product basis) - - $30 - $50
All-in Sustaining Costs per gold ounce (with by-product credits) $1,690 - $1,790 ($500) – ($420) $1,370- $1,470
All-in Sustaining Costs per gold eq. ounce (on a co-product basis) $1,690 - $1,790 $810 - $890 $1,330 - $1,430
Capital Investment & Exploration Expense Estimates Rainy River New Afton 2019 Consolidated Guidance1
Sustaining Capital ($M) $210 - $230 $45 - $55 $255 - $285
Growth Capital ($M) ~$3 $40 - $45 $50 - $553
Exploration ($M) ~$5 ~$4 ~$91. All production and cost estimates exclude potential production from Cerro San Pedro residual leaching. 2. Gold equivalent ounces includes approximately 245,000 to 270,000 ounces of silver at Rainy River and approximately 255,000 to 265,000 ounces of silver at New Afton3. Consolidated growth capital includes ~$7 million for Blackwater permitting.
2019 a pivotal year as we re-position New Gold for long-term success
Material assumptions include: Spot prices of $1,300 per gold ounce, and $2.75 per pound copper, and a foreign exchange rate of 1.30 Canadian dollarsto the US dollar.

Rainy River: 2019 Key Objectives
Construction Completion• Advance all remaining construction for completion in 2019 (72% of total estimated capital)
Open Pit
• Engaged external consultant to review performance and overall equipment efficiencies (OEE)
• Objective of optimizing open pit mining productivity while decoupling from sourcing the non-acid generating (NAG) material for dam construction
Mill Facility• Complete outstanding mill upgrades; Objective to increase availability, throughput and
recoveries
Organic Growth Opportunities• Launch strategic exploration program
• Northeast extension
• Intrepid extension a top priority
• Evaluate options to further optimize the long-term mine plan with a focus on medium and high grade open pit and underground reserves
16

17
Rainy River: 2019 Guidance Estimates
• Operating expense and cash costs on a per ounce basis are expected to be higher in 2019 due to a higher planned strip ratio and lower planned grades
• Up to 72% ($150-$165 million) of sustaining capital requirements for the year is to complete deferred mine construction
Rainy River 2019 Operational Guidance 2019 Estimates
Gold produced (ounces) 245,000 – 270,000Gold eq. ounces produced1 250,000– 275,000Operating Expense per gold ounce $870 - $950
Cash costs per gold eq. ounce (on a co-product basis) $870 - $950All-in Sustaining Costs per gold eq. ounce (on a co-product basis) $1,690 - $1,790
Sustaining Capital, ARO Amort. & Other ($M) 2019 Estimates
Sustaining Capital2 $210 - $230Total construction capital $150 - $165− Tailings facility (Stage 2) $65 - $70− Waste Dump (Management & Stabilization/Wick Drains) $45 - $50− Water treatment train $5 - $10− Maintenance/Warehouse facility ~$20− Mill commissioning completion ~$5− Camp facility ~$10
Other sustaining capital $60-$65− Machinery & Equipment $10-$13− Mining infrastructure $6-$8− Capital Leases ~$9− Mill upgrades ~$2− Capitalized Mining, Sustaining Capital and Working
Capital ~$33
ARO Amortization and Other ~$2
Non-Sustaining and Exploration Expense ($M) 2019 Estimates
Growth Capital ~$3Expensed exploration ~$51. Gold eq. production includes approximately 245,000 to 270,000 ounces of silver
Rainy River Operating KPIs 2019 EstimatesEx-pit1 tonnes mined (ore and waste) Mt ~46.7
Ex-pit ore tonnes mined Mt ~11.3Ex-pit ore tonnes mined per day ~31,000Ex-pit Strip ratio (waste:ore) ~3.1:1Out pit2 tonnes mined Mt ~4.5Out/in pit re-handling Mt ~5.3Total tonnes moved Mt ~56.5Tonnes milled per calendar day 22,000 - 24,000Gold grade milled (g/t) ~1.10Gold recovery (%) 90 – 92%Mill availability (%) 85 – 88%
Unit Operating Costs 2019 EstimatesOpen pit mining costs ($/tonne moved) $3.25 - $3.75
Processing costs ($/per tonne milled) $8.50- $9.00Site G&A ($/tonne milled) $3.75 - $4.251. Ex-pit tonnes are tonnes mined from the operating open pit.2. Non-acid generating (NAG) material mined outside the operating open pit

Focused on improving availability and throughput• Stabilize mill availability; reach 90% in H2 (Q4 2018 – 80%)
• Ball mill trunnion replaced in Q1 followed by optimization of both SAG and ball mills power drawn and commissioning of pebble crusher
• Potential reconfiguration of SAG mill liners
Increase recovery to 90-92% (Q4 2018 – 89%) target by minimizing gold loss in solids and solution
• Solids: Grinding medium optimization + commissioning pebble crusher = consistent grind size of 75um (currently ~90um) while maintaining high throughput
• Solution: Optimize carbon stripping and carbon regeneration• Additional optimization: Commission gravity circuit
Rainy River: 2019 Mill Objectives
181. Run rate is defined by (total tonnes milled / mill availability) / calendar days.
70%
80%
90%
100%
Oct-18 Nov-18 Dec-18 Jan-19
Plant Recovery Losses
Recovery - Gold Losses Solids Losses Solution
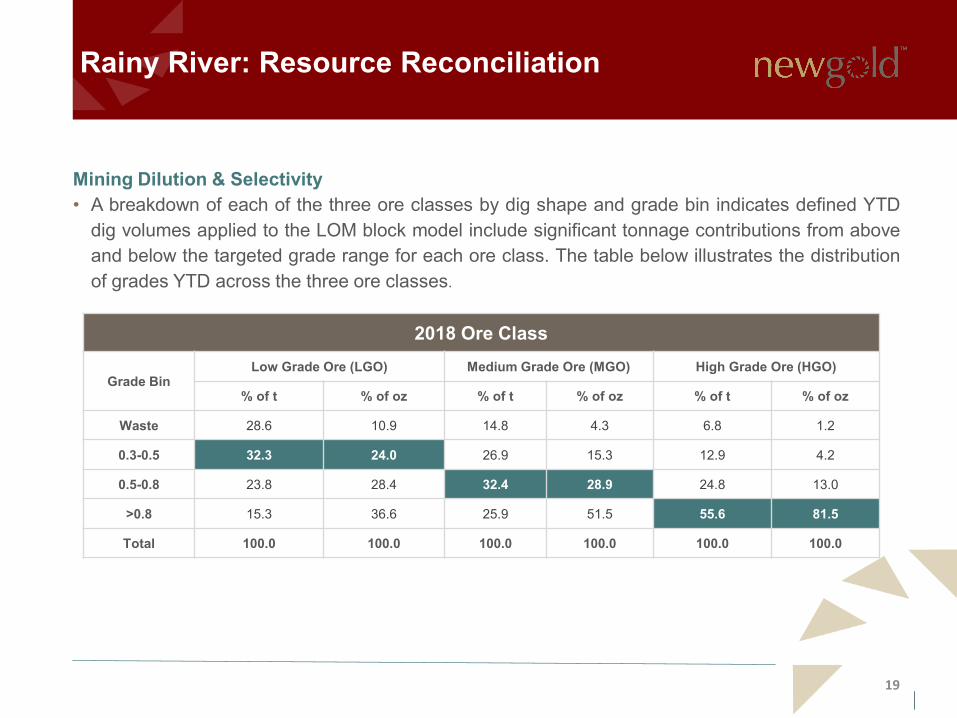
Mining Dilution & Selectivity• A breakdown of each of the three ore classes by dig shape and grade bin indicates defined YTD
dig volumes applied to the LOM block model include significant tonnage contributions from aboveand below the targeted grade range for each ore class. The table below illustrates the distributionof grades YTD across the three ore classes.
Rainy River: Resource Reconciliation
2018 Ore Class
Grade BinLow Grade Ore (LGO) Medium Grade Ore (MGO) High Grade Ore (HGO)
% of t % of oz % of t % of oz % of t % of oz
Waste 28.6 10.9 14.8 4.3 6.8 1.2
0.3-0.5 32.3 24.0 26.9 15.3 12.9 4.2
0.5-0.8 23.8 28.4 32.4 28.9 24.8 13.0
>0.8 15.3 36.6 25.9 51.5 55.6 81.5
Total 100.0 100.0 100.0 100.0 100.0 100.0
19

Rainy River: 2018 Resource Reconciliation
• The mill produced a grade of 1.25 g/t versus the depleted resources of 1.25 g/t • Resource model performance continues to be in-line • Optimization of dilution model is underway with external consultant
Grade Control Model Blocks – Cut-off Grade Resource Model Blocks – Cut-off Grade % Difference
Tonnes Au g/t Au oz Tonnes Au g/t Au oz Tonnes Au g/t Au oz
HGO 6,259,627 1.62 325,668 HGO 5,503,799 1.70 300,836 12% -5% 8%
MGO 3,839,835 0.64 79,007 MGO 3,535,629 0.64 72,492 8% 0% 8%
LGO 3,519,472 0.39 44,632 LGO 3,190,289 0.40 40,628 9% -3% 9%
Total 13,634,949 1.02 449,139 Total 12,229,715 1.05 414,009 10% -3% 8%
Grade Control Model Blocks – Dig Shapes Resource Model Blocks – Dig Shapes % Difference
Tonnes Au g/t Au oz Tonnes Au g/t Au oz Tonnes Au g/t Au oz
HGO 6,686,985 1.38 296,368 HGO 7,053,759 1.25 284,452 -5% 9% 4%
MGO 3,601,628 0.72 83,715 MGO 3,787,670 0.74 89,698 -5% -3% -7%
LGO 2,416,791 0.52 40,296 LGO 2,092,539 0.54 36,365 -13% -4% 10%
Total 12,705,406 1.03 420,261 Total 12,933,968 0.99 410,515 -2% 4% 2%
Mill – Ore Processed Resource Model Blocks – Dig Shapes
Tonnes Au g/t Au oz Tonnes Au g/t Au oz
Milled 6,545,727 1.25 263,008 HGO 7,053,759 1.25 284,452
20
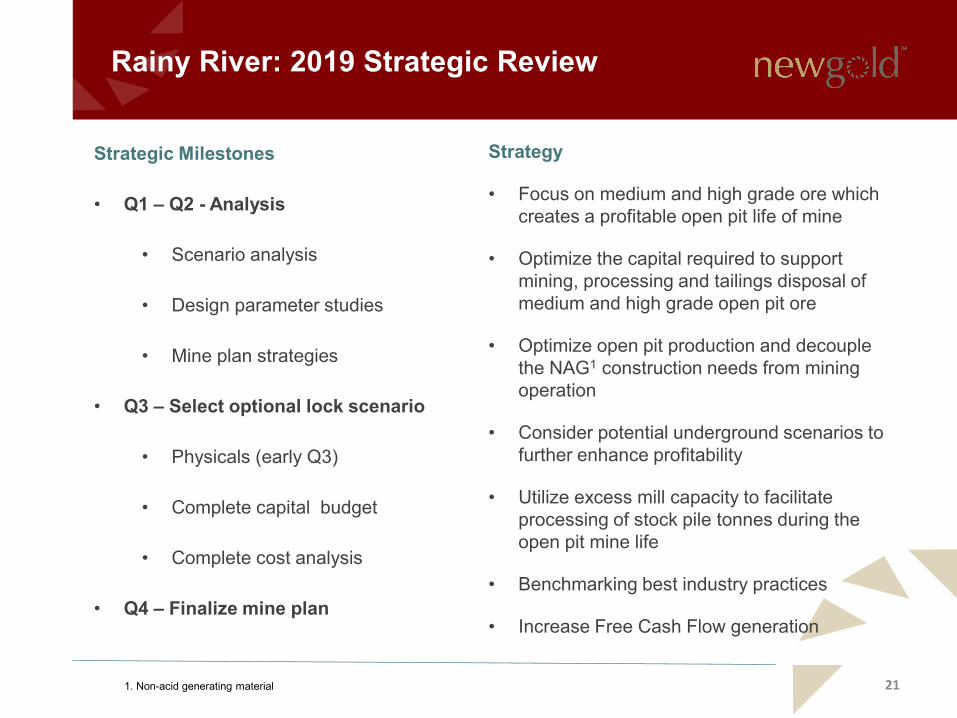
Rainy River: 2019 Strategic Review
Strategy
• Focus on medium and high grade ore which creates a profitable open pit life of mine
• Optimize the capital required to support mining, processing and tailings disposal of medium and high grade open pit ore
• Optimize open pit production and decouple the NAG1 construction needs from mining operation
• Consider potential underground scenarios to further enhance profitability
• Utilize excess mill capacity to facilitate processing of stock pile tonnes during the open pit mine life
• Benchmarking best industry practices
• Increase Free Cash Flow generation
21
Strategic Milestones
• Q1 – Q2 - Analysis
• Scenario analysis
• Design parameter studies
• Mine plan strategies
• Q3 – Select optional lock scenario
• Physicals (early Q3)
• Complete capital budget
• Complete cost analysis
• Q4 – Finalize mine plan
1. Non-acid generating material
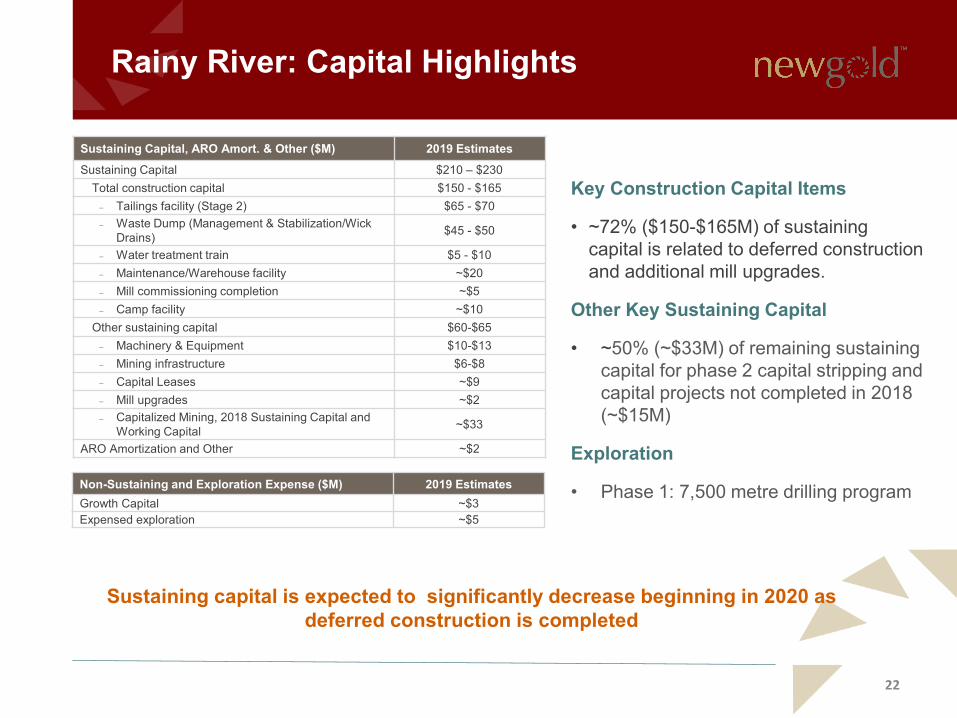
Rainy River: Capital Highlights
22
Sustaining Capital, ARO Amort. & Other ($M) 2019 EstimatesSustaining Capital $210 – $230
Total construction capital $150 - $165− Tailings facility (Stage 2) $65 - $70− Waste Dump (Management & Stabilization/Wick
Drains) $45 - $50
− Water treatment train $5 - $10− Maintenance/Warehouse facility ~$20− Mill commissioning completion ~$5− Camp facility ~$10
Other sustaining capital $60-$65− Machinery & Equipment $10-$13− Mining infrastructure $6-$8− Capital Leases ~$9− Mill upgrades ~$2− Capitalized Mining, 2018 Sustaining Capital and
Working Capital ~$33
ARO Amortization and Other ~$2
Non-Sustaining and Exploration Expense ($M) 2019 EstimatesGrowth Capital ~$3Expensed exploration ~$5
Key Construction Capital Items
• ~72% ($150-$165M) of sustaining capital is related to deferred construction and additional mill upgrades.
Other Key Sustaining Capital
• ~50% (~$33M) of remaining sustaining capital for phase 2 capital stripping and capital projects not completed in 2018 (~$15M)
Exploration
• Phase 1: 7,500 metre drilling program
Sustaining capital is expected to significantly decrease beginning in 2020 as deferred construction is completed

New Afton: 2019 Key Objectives
23
• C-zone development plan launched in 2019
• Continued evaluation and further de-risking of C-zone mine plan; tailings disposal; permit applications submission
• Ore segregation strategy to improve mill grade; ore scanner commissioned
• Mill upgrade to improve supergene recovery; phase 2 mill upgrade underway; commissioning in Q3
• 2019 exploration program will target near-mine opportunity below the C-zone
• Regional exploration focused on two near-surface exploration targets located within 5km of mill facility
• Optimization and update of life of mine

24
New Afton: 2019 Guidance Estimates
• Continue current block cave production• Initiate B3/C-zone development • Operating expenses are higher due to
planned lower grade• ~75% of total capital are related to
underground activities and equipment• Gold eq. production introduced in 2019
New Afton 2019 Operational Guidance 2019 EstimatesGold produced (ounces) 55,000 – 65,000Copper produced (Mlbs) 75 - 85Gold eq. ounces produced1 215,000 – 245,000Operating Expense per gold ounce $480 - $520Operating Expense per copper pound $0.95 - $1.15Cash Costs per gold ounce (with by-product credits) ($1,350) – ($1,310)Cash Costs per gold eq. ounce $600 - $640All-in Sustaining Costs per gold ounce (with by-product credits) ($500) – ($420)All-in Sustaining Costs per gold eq. ounce (on a co-product basis) $810 - $890
Sustaining Capital, ARO Amort. & Other ($M) 2019 Estimates
Sustaining Capital $45 – $55- Tailings Facility Dam Raise $17 - $20- B3 Mine Development and Equipment $20 - $25- Other Sustaining Capital $6 - $8- Capitalized Sustaining Exploration ~$2
ARO Amortization and Other ($M) ~$1
Non-Sustaining Capital and Exploration Expense ($M) 2019 Estimates
Growth Capital (C-zone mine development and equipment) $40 - $45Exploration Expense ~$41. Gold equivalent ounces for New Afton includes approximately 255,000 to 265,000 ounces of silver
New Afton Operating KPIs 2019 Estimates
Ore tonnes mined per day 16,000 – 17,000
Tonnes milled per calendar day 14,000 – 15,000
Gold grade milled (g/t) ~0.45
Gold recovery (%) 76 – 80%
Copper grade milled (%) ~0.86%
Copper recovery (%) 80 – 85%
Mill availability (%) 92 – 96%
Unit Operating Costs 2019 Estimates
Underground mining costs ($/tonne mined) $7.75 - $8.25
Processing costs ($/per tonne milled) $8.50 - $9.25
Site G&A ($/tonne milled) $2.25 - $2.75

The bulk ore sorting project increases the mill feed grade from ~0.80% to 0.85% Cu
16,500 tpd0.80% Cu
Underground Block Cave
Mill Feed 14,500 tpd0.85% Cu
0.45 g/t Au
Stockpile 2,000 tpd~0.40% Cu
Ore sorting has 2 components:• Underground materials handling
• Coarse high / low grade split• Surface Belt plow & Ore Scanner
• Fine high / low grade split
Surface Destinations
Ore Sorting
New Afton: Ore Sorting Strategy
25
New Afton: Capital Program
26
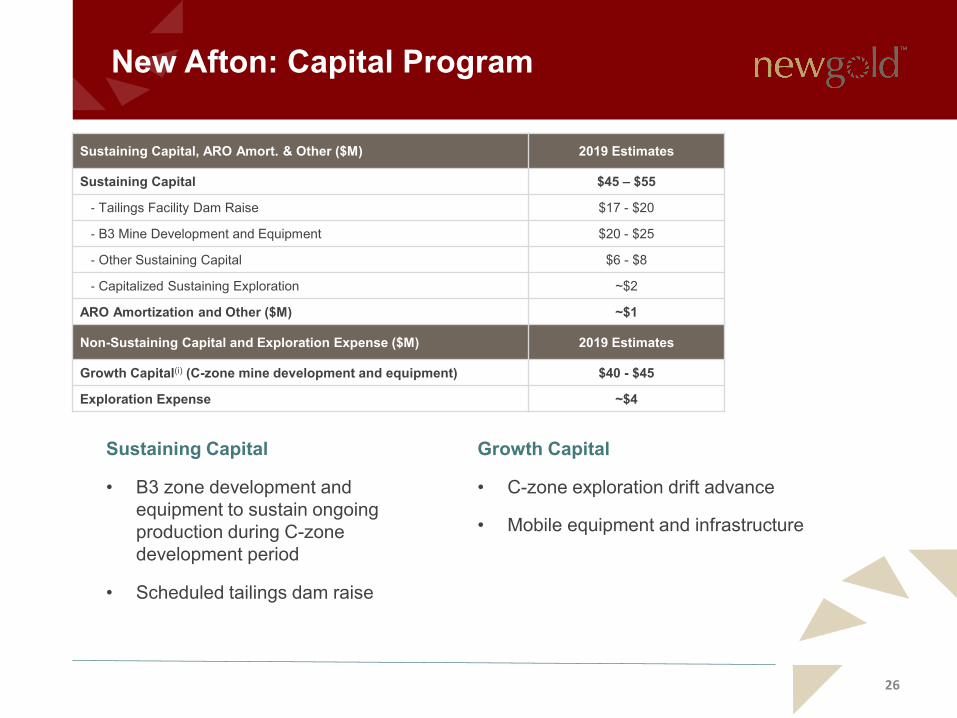
Sustaining Capital, ARO Amort. & Other ($M) 2019 Estimates
Sustaining Capital $45 – $55
- Tailings Facility Dam Raise $17 - $20
- B3 Mine Development and Equipment $20 - $25
- Other Sustaining Capital $6 - $8
- Capitalized Sustaining Exploration ~$2
ARO Amortization and Other ($M) ~$1
Non-Sustaining Capital and Exploration Expense ($M) 2019 Estimates
Growth Capital(i) (C-zone mine development and equipment) $40 - $45
Exploration Expense ~$4
Sustaining Capital
• B3 zone development and equipment to sustain ongoing production during C-zone development period
• Scheduled tailings dam raise
Growth Capital
• C-zone exploration drift advance
• Mobile equipment and infrastructure

New Afton: C-zone Development
• An internally funded development strategy for the New Afton C-zone has been launched.
• Development of the C-zone (2019 to 2024) would provide mine life extension to 2030 with robust economics.
• At metal prices of $1,275 per gold ounce and $2.50 per copper pound and a foreign exchange rate of 1.30 Canadian dollars to 1 US dollar, current LOM economics show that potential cumulative cash flow will be sufficient to support C-zone development.
• At spot metal prices of $1,300 per gold ounce and $2.75 per copper pound and a foreign exchange rate of 1.30 Canadian dollars to 1 US dollar, current LOM economics show that potential cumulative cash flow generated will exceed capital requirements over the C-zone development period and deliver free cash flow.
• Assuming non-sustaining capital of $450 million and LOM sustaining capital of $185 million:
• Growth capital for 2019 is estimated to be between $40 and $45 million, which primarily consists of advancing an exploration decline and the purchase of required mobile equipment and infrastructure ($5 to 7.5 million).
• Growth capital in 2020 is expected to be consistent with 2019 and during those years the operation is expected to deliver a strong positive cash flow stream. Growth capital is expected to increase substantially during the period from 2021 to 2023, during which time the operation is expected to remain cash flow neutral. The operation is expected to return to positive cash flow status beginning in 2024 as remaining capital requirements decline and are spread over the years 2024 and 2025.
• Sustaining capital: Capital requirements for the B3 zone in 2020 are expected to be consistent with 2019 with the remaining one-third of the capital requirements for the B3 zone to be spread over the 2021 to 2024 period. 27

New Afton: 2019 Objectives
2019 Life of Mine Update
• C-zone fully integrated business case vs 2015 approach (C-zone decoupled)
• Geotechnical study update; subsidence & corrective actions
• Tailings update: In-pit disposal using a thickened & amended tailings approach to increase stability; Update on stabilization of current and old tailings
• Permitting & timeline
• Capital and opex optimization
28

2019 Exploration

Rainy River: Exploration Program
30
• During 2018 exploration activities at Rainy River were limited to the completion of an Airborne drone magnetic survey to support and improve to drill ready status conceptual targets defined through geological interpretation in near mine areas
• Geophysical data interpretation is progressing on exploration targets refinement and drill hole planning
• Key exploration target area has been defined as Intrepid North, where ~7,500 m first pass reconnaissance drilling has been planned to test potential for eastern repeats of Rainy River mine sequence (e.g.: ODM, HS and 433 zones) north of Intrepid and east of mill site. Planning for the program is ongoing to commence field activities in early April
• Regional exploration covering prospective areas on regional claim holdings to the northeast (Off Lake) and southwest (Coventry) of mine site and within the newly acquired claim block to the north (GoldOn), where historical high grade gold occurrences were recorded both from surface samples and from drill hole intercepts (up to 98 g/t Au) , is planned to start in the second half of the year
?
?
?
Potential series of stacked lenses (saddle reefs?) extending north from Intrepid ore body
433
HS
ODM
CAP
INTREPID

New Afton: Exploration Program
31
• Planning for the exploration activities on the targets identified at New Afton in 2018 (one near mine: D-zone and two at the district level: Cherry Creek Fault and DL2017) is ongoing
• Additionally an UG infill drilling program (~8,700 m) to upgrade the resource inventory to M&I within the SLC (sub level cave) commenced in early February. The objective of the drilling program is to define ~3.4 Mt in Reserve to help fill future mine production gap.
• Key exploration target area to grow the resource inventory at New Afton has been defined as D-Zone, ~8,000 m UG exploration drilling has been designed to test the down plunge extension of the mineralization immediately below C-Zone
• Potential exists to increase mineral resource below C-Zone (~20Mt at run of mine grade). Planning for the program is ongoing. The program to commence in early May, immediately after the completion of SLC drilling.
• Regional exploration activities on Cherry Creek (high grade Au and Cu-Au Porphyry target) and DL2017 Cu-Au Porphyry target) prospects is planned to start in the second half of the year upon agreement with SSN First Nation and reception of exploration permits

Q&A

Appendix
Mineral Reserves and Resources (as at Dec 31, 2018)
34
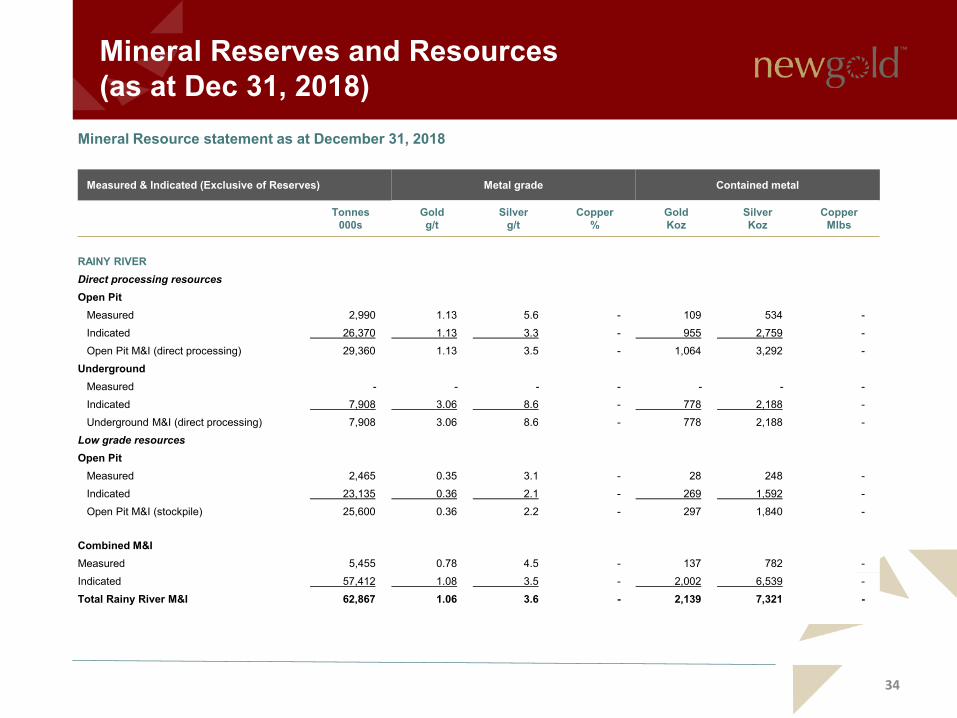
Mineral Resource statement as at December 31, 2018
Measured & Indicated (Exclusive of Reserves) Metal grade Contained metal
Tonnes000s
Goldg/t
Silverg/t
Copper%
GoldKoz
SilverKoz
CopperMlbs
RAINY RIVERDirect processing resourcesOpen Pit
Measured 2,990 1.13 5.6 - 109 534 -Indicated 26,370 1.13 3.3 - 955 2,759 -Open Pit M&I (direct processing) 29,360 1.13 3.5 - 1,064 3,292 -
UndergroundMeasured - - - - - - -Indicated 7,908 3.06 8.6 - 778 2,188 -Underground M&I (direct processing) 7,908 3.06 8.6 - 778 2,188 -
Low grade resourcesOpen Pit
Measured 2,465 0.35 3.1 - 28 248 -Indicated 23,135 0.36 2.1 - 269 1,592 -Open Pit M&I (stockpile) 25,600 0.36 2.2 - 297 1,840 -
Combined M&IMeasured 5,455 0.78 4.5 - 137 782 -Indicated 57,412 1.08 3.5 - 2,002 6,539 -Total Rainy River M&I 62,867 1.06 3.6 - 2,139 7,321 -

Mineral Reserves and Resources (as at Dec 31, 2018)
35
Mineral Resource statement as at December 31, 2018
Measured & Indicated (Exclusive of Reserves) Metal grade Contained metal
Tonnes000s
Goldg/t
Silverg/t
Copper%
GoldKoz
SilverKoz
CopperMlbs
NEW AFTONA&B Zones
Measured 15,239 0.64 2.0 0.86 315 972 289 Indicated 8,530 0.51 2.8 0.77 140 776 145 A&B Zone M&I 23,769 0.60 2.3 0.83 455 1,748 434
C-ZoneMeasured 5,711 0.79 2.0 0.96 144 366 120 Indicated 11,976 0.72 2.1 0.87 279 809 230 C-Zone M&I 17,687 0.74 2.1 0.90 423 1,174 350
HW LensMeasured - - - - - - -Indicated 10,951 0.52 2.1 0.44 183 722 107 HW Lens M&I 10,951 0.52 2.1 0.44 183 722 107
Total New Afton M&I 52,407 0.63 2.2 0.77 1,061 3,645 891
BLACKWATERDirect processing resources
Measured 288 1.39 6.6 - 13 61 -Indicated 45,249 0.84 4.6 - 1,225 6,692 -M&I (direct processing) 45,537 0.85 4.6 - 1,238 6,753 -
Low grade resourcesMeasured - - - - - - -Indicated 15,779 0.32 3.9 - 162 1,980 -
M&I (low grade) 15,779 0.32 3.9 - 162 1,980 -Total Blackwater M&I 61,316 0.71 4.4 - 1,400 8,733 -
Total M&I Exclusive of Reserves 4,600 19,699 891

Mineral Reserves and Resources (as at Dec 31, 2018)
36
Mineral Resources statement as at December 31, 2018
Inferred Metal grade Contained metal
Tonnes000s
Goldg/t
Silverg/t
Copper%
GoldKoz
SilverKoz
CopperMlbs
RAINY RIVERDirect processing
Open Pit 5,883 1.17 3.1 - 222 578 -Underground 1,270 3.68 3.8 - 150 156 -Total Direct Processing 7,153 1.62 3.2 - 372 733 -
Low grade resourcesOpen Pit 6,049 0.37 1.4 - 72 274 -
Rainy River Inferred 13,202 1.05 2.4 - 444 1,007 -
NEW AFTONA&B-Zone 6,530 0.35 1.4 0.38 74 295 54 C-Zone 7,034 0.43 1.4 0.51 98 309 77 HW Lens 0 0 0 0 0 0 0
New Afton Inferred 13,564 0.40 1.4 0.45 172 605 132
BLACKWATERDirect processing 13,905 0.76 4.0 - 341 1,788 -Low grade resources 4,207 0.33 3.4 - 44 460 -
Blackwater Inferred 18,112 0.66 3.9 - 385 2,248 -
Total Inferred 1,001 3,860 132

Notes to Mineral Reserve and Resource Estimates
37
Notes to Mineral Reserve and Resource Estimates 1. New Gold’s Mineral Reserves and Mineral Resources have been estimated in accordance with the CIM Standards, which
are incorporated by reference in NI 43-101. 2. All Mineral Reserve and Mineral Resource estimates for New Gold’s properties and projects are effective December 31,
2018. 3. New Gold’s year-end 2018 Mineral Reserves and Mineral Resources have been estimated based on the following metal
prices and foreign exchange (FX) rate criteria:
Gold $/ounce
Silver $/ounce
Copper $/pound
FX CAD:USD
Mineral Reserves $1,275 $17.00 $3.00 1.30 Mineral Resources $1,350 $18.00 $3.25 1.30
4. Lower cut-offs for the Company’s Mineral Reserves and Mineral Resources are outlined in the following table:
Mineral Property Mineral Reserves Lower cut-off
Mineral Resources Lower Cut-off
Rainy River O/P direct processing: 0.30 – 0.50 g/t AuEq 0.30 – 0.50 g/t AuEq O/P low grade material: 0.30 g/t AuEq 0.30 g/t AuEq U/G direct processing: 2.20 g/t AuEq 2.00 g/t AuEq New Afton Main Zone – B1 & B2 Blocks: C$ 17.00/t All Resources: 0.40% CuEq B3 Block & C-zone: C$ 24.00/t Blackwater O/P direct processing: 0.26 – 0.38 g/t AuEq All Resources: 0.40 g/t AuEq O/P low grade material: 0.32 g/t AuEq

Notes to Mineral Reserve and Resource Estimates
38