2018 omer s. alabidalkreem all rights reserved
TRANSCRIPT

1
2018
Omer S. Alabidalkreem
ALL RIGHTS RESERVED

2
AN INVESTIGATION OF THE DRYING PROCESS IN
PICKERING FOAMS
by
OMER S. ALABIDALKREEM
A dissertation submitted to the
School of Graduate Studies
Rutgers, The State University of New Jersey
In partial fulfillment of the requirements
For the degree of
Doctor Philosophy
Graduate Program in Mechanical and Aerospace Engineering
Written under the direction of
Dr. Shahab Shojaei-Zadeh
And approved by
__________________________________
__________________________________
__________________________________
__________________________________
New Brunswick, New Jersey
May, 2018

ii
ABSTRACT OF THE DISSERATATION
An Investigation of the Drying Process in Pickering Foams
By OMER S. ALABIDALKREEM
Dissertation Director:
Dr. Shahab Shojaei-Zadeh
Pickering foams, aqueous foams stabilized by solid particles, can be used as a
precursor to fabricate solid porous polymers, ceramics, and composite materials. The
fabrication process usually comprises of two subsequent steps of drying and solidification
(e.g. sintering) after foam is prepared. Drying (or aging) in aqueous Pickering foams is a
complex transport process which involves evaporation and drainage (induced by gravity)
of the excess liquid along with deformation of the foam and possible formation of cracks
caused by capillary-induced stresses. Crack formation is therefore depended on the
drying conditions and the mechanical properties of sample. A comprehensive
understanding of the drying process can provide us with predictive tools to select
efficient process parameters (e.g. required drying time prior to sintering) as well as
providing input prameters for developing numerical models.
In this thesis, we first provide experimental data (end of drying time, average
moisture content, and effective moisture diffusivity) on drying of Pickering foams
stabilized by polymer particles under controlled conditions (i.e. relative humidity and

iii
temperature). Drying curves are presented for samples of various initial thicknesses and
shapes on substrates of different hydrophobicity and temperatures. Moisture transport is
represented via calculating the effective moisture diffusivity coefficients using method of
slope. Also, we investigate drying for a bi-component Pickering foam prepared using
Multi-walled Carbon Nanotubes (MWCNTs) and polymer particles. We show that the
effective moisture diffusivity increases as the average moisture content decreases for all
trials and that all data can be collapsed on a master curve. Also, effective moisture
diffusivity increased as initial sample thickness as well as substrate temperature increase.
On the other hand, effective moisture diffusivity does not depend strongly on the sample
shape and MWCNTs concentration.
In next part, we explore the effect of initial sample thickness and shape, substrate
temperature and wettability, as well as MWCNTs concentration on the crack formations
in the samples. We demonstrate that substrate wettability, initial sample thickness, and
MWCNTs concentration have a strong influence on the formation and propagation of
cracks. We found that decreasing the wettability of the substrate reduces crack formation.
Also, increasing the initial sample thickness reduces crack formation. On the contrary,
increasing the MWCNTs concentration increases crack formation for all types of
substrates. We demonstrate that substrate temperature and sample shape do not seem to
influence crack formation but these parameters influence the crack patterns. Such
information can be beneficial in using these foams as a precursor to fabricate porous
composite porous materials.

iv
Acknowledgments
Praise is to Allah for everything.
At the beginning I would like to thank God for his great help and guidance.
I am very grateful to my advisor Dr. Shahab Shojaei-Zadeh for his continuous
encouragement, generous efforts, and valuable supervision. Also, I want to thank my
thesis committee members, Dr. Nina Shapley, Dr. Kimberly Cook Chennault, and Dr.
German Drazer for the time they spent to review my thesis.
Many thank go to John Petrowski and Paul Pickard for their help to complete the setup.
I would like to take sincerely this opportunity to thank my parents for their support,
prayer and encouragement to overcome the difficulties in my work. Also, I would like to
thank my brothers, my sisters, and my kids. Also, I would like to thank my wife, Zenaa
Gader for her love and her encouragement and endurance through these challenging time.
If it wasn’t because of her presence, I would have never been able to take this long journey
and accomplish this degree.
Finally, my special thanks to my lab-mates and my friends for their always help: Isabel
Liberis, Abhay Srinivas, David Cunningham, Rick Schieni, Hassan Alsaraj, Mustafa
Mozael, and Arab Hammadi.
Without the financial support of the College of Engineering, University of Mosul, Mosul,
Ninawa, Iraq, this work never have been started.
Omer S. Alabidalkreem
Mechanical and Aerospace Engineering
Rutgers, The State University of New Jersey
April 11, 2018

v
Table of Contents
ABSTRACT OF THE DISSERATATION .................................................................. ii
Acknowledgments ........................................................................................................ iv
Table of Contents ...........................................................................................................v
List of Illustrations .................................................................................................... viii
Chapter 1 .......................................................................................................................1
Introduction ...................................................................................................................1
1.1 Overview ...........................................................................................................1
1.1.1 Pickering Foams ..............................................................................................1
1.1.2 Drying Dynamics ............................................................................................6
1.1.3 Crack Formation .............................................................................................8
1.2 Scope of the Present Work ................................................................................... 10
1.3 Outline ................................................................................................................. 11
Chapter 2 ..................................................................................................................... 12
Drying Kinetics ............................................................................................................ 12
2.1 Introduction ......................................................................................................... 12
2.2 Materials and Methods ......................................................................................... 14
2.2.1 Materials ....................................................................................................... 14
2.2.2 Methods ........................................................................................................ 15
2.3 Aging of Pickering Foams .................................................................................... 21
2.3.1 Drying Curve ................................................................................................ 21
2.3.2 Dimensional Variation and Shrinkage ........................................................... 25
2.3.3 Substrate Temperature ................................................................................... 31
2.3.4 Sample Shape ................................................................................................ 33
2.3.5 Composite PVDF/MWCNTs Foam ............................................................... 36
2.4 Characterization of Pickering Foams .................................................................... 39
2.4.1 Volume reduction .......................................................................................... 39
2.4.2 Porosity ......................................................................................................... 42
2.4.3 Density .......................................................................................................... 47
2.5 Piezoelectric Coefficient ...................................................................................... 51
2.6 Summary ............................................................................................................. 54
Chapter 3 ..................................................................................................................... 55
Effective Moisture Diffusivity ..................................................................................... 55

vi
3.1 Introduction ......................................................................................................... 55
3.2 Neglecteing Shrinkage ......................................................................................... 57
3.2.1 Mathematical Simplification ......................................................................... 57
3.2.2 Moisture Transport ........................................................................................ 59
3.2.3 Effective Moisture Diffusivity ....................................................................... 62
3.3 Including Shrinkage ............................................................................................. 64
3.3.1 Mathematical Simplification ......................................................................... 64
3.3.2 Modified Moisture Transport......................................................................... 68
3.3.3 Modified Effective Moisture Diffusivity........................................................ 72
3.4 Effective Moisture Diffusivity Behavior .............................................................. 72
3.4.1 Shrinkage Influence....................................................................................... 72
3.4.2 Sample Thickness as well as Substrate Wettability and Temperature ............. 75
3.4.3 Non Dimensional Form ................................................................................. 77
3.5 Summary ............................................................................................................. 80
Chapter 4 ..................................................................................................................... 81
Crack Formation ......................................................................................................... 81
4.1 Introduction ......................................................................................................... 81
4.2 Crack Formation .................................................................................................. 86
4.2.1 Substrate Wettability ..................................................................................... 86
4.2.2 Substrate Temperature ................................................................................... 88
4.2.3 Sample Thickness ......................................................................................... 91
4.2.4 Sample Shape ................................................................................................ 94
4.2.5 Composite PVDF/MWCNTs Foams .............................................................. 97
4.3 Summary ........................................................................................................... 101
Chapter 5 ................................................................................................................... 102
Conclusions ................................................................................................................ 102
5.1 Conclusions ....................................................................................................... 102
5.2 Future Work....................................................................................................... 104
Appendix A ................................................................................................................ 105
Drying Conditions ..................................................................................................... 105
Appendix B ................................................................................................................ 106
Diffusivity Curves ...................................................................................................... 106
1. Average Moisture Content and Fractional Average Moisture Content ............... 106
2. Effective Moisture Diffusivity........................................................................... 108

vii
3. Non-Dimensional Curves .................................................................................. 110
Appendix C ................................................................................................................ 112
Crack Formation ....................................................................................................... 112
1. Initial Sample Thickness ...................................................................................... 112
2. Substrate Temperature ......................................................................................... 114
3. Sample Shape ...................................................................................................... 115
4. Composite PVDF/MWCNTs Foam ...................................................................... 116
References .................................................................................................................. 124
viii
List of Illustrations
Figure 1. 1 (a) Surfactants (molecule contains hydrophilic head (polar) and hydrophobic
tail (non-polar)) at a liquid-gas interface, (b) colloidal particles at a liquid-gas interface
with 0 < < 90) (Pickering foams), and (c) colloidal particles at a liquid-gas interface
with 90 < < 180 (Liquid marbles). These figures are not drawn to scale. .......................2
Figure 1. 2 Pickering foams stabilized by polymer particles (a) without Multi-walled
Carbon Nanotubes and (b) with Multi-walled Carbon Nanotubes. These figures are not
drawn to scale. .................................................................................................................5
Figure 1. 3 (a) An as-prepared wet foams and (b) crack-free dried foams. Scale bar is 10
mm. .................................................................................................................................6
Figure 1. 4 Crack formation in Pickering foams during the drying processes (a) dried
PVDF foams and (b) dried PVDF/MWCNTs composite foams. Scale bar is 10 mm. .......8
Figure 2. 1 Contact angle () between droplet (DI-Water) and substrate at: (a) glass
(hydrophilic with 30), (b) PDMS (hydrophobic with 95), and (c) modified glass
(superhydrophobic with 160).................................................................................. 17
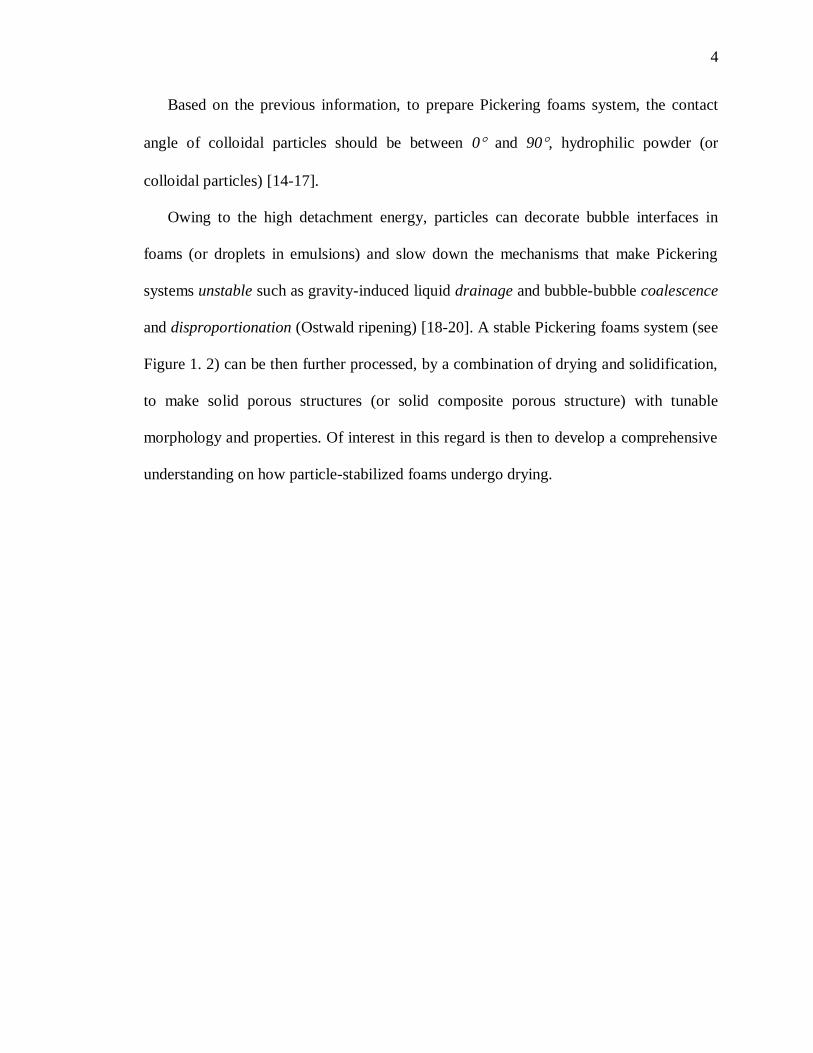
Figure 2. 2 Experimental setup. ..................................................................................... 20
Figure 2. 3 (a) Mass change during drying for samples with initial thickness of Z0 = 5
mm and initial diameter of D0 = 52 mm as well as substrates with 30, 95, and 160 and (b) end of drying time for samples with initial thickness ranging between 2.5 and
12.5 mm and initial diameter of D0 = 52 mm on three different types of substrates. ........ 23
Figure 2. 4 Drying rate during drying for samples with initial thickness of Z0 = 5 mm
and initial diameter of D0 = 52 mm as well as substrates with 30, 95, and 160. te is
the end of drying time. ................................................................................................... 24
Figure 2. 5 Change in diameter and thickness during drying for samples with initial
thickness of (a) Z0 = 5 mm and (b) Z0 = 12.5 mm, and initial diameter of D0 = 52 mm as
well as substrates with 30, 95, and 160. te is the end of drying time. ................... 26
Figure 2. 6 Change in volume during drying for un-cracked samples with initial
thickness ranging between 2.5 and 12.5 mm on substrate with 160. The curves in the
box show the expansion in foams volume through the end of drying. V0 and te is the
initial foam volume and the end of drying time, respectively. ........................................ 27

ix
Figure 2. 7 Shrinkage ratio in diameter and thickness during drying for samples with
initial thickness of (a) Z0 = 5 mm and (b) Z0 = 12.5 mm and initial diameter of D0 = 52
mm as well as substrates with 30, 95, and 160. .................................................... 29
Figure 2. 8 Change in sample size, temperature, and mass during drying for sample with
initial thickness of Z0 = 5 mm and initial diameter of D0 = 52 mm as well as substrate
with 160. Sample diameter shows a slight expansion teward the end of drying. ...... 30
Figure 2. 9 (a) Mass change during drying for sample with initial thickness of Z0 = 5 mm
and initial diameter of D0 = 52 mm as well as substrates with 160 and (b) end of
drying time for samples with initial thickness Z0 = 5 mm and initial diameter of D0 = 52
mm, substrate temperature of T = 24 - 60 C, as well as substrates with 30, 95, and
160 . ............................................................................................................................. 32
Figure 2. 10 (a) Mass change during drying for sample with three different shapes of
samples and initial thickness of Z0 = 5 mm and substrate with 160 and (b) end of
drying time for samples with three different shapes and initial thickness of Z0 = 5 mm on
three different types of substrate. The surface area of all samples is equal. The initial
dimension of samples are: circle with diameter of D0 = 34 mm, square with length of L0
= 30.13 mm, and triangle with base of B0 = 45.79 mm and height of H0 = 39.66 mm. .... 34
Figure 2. 11 Drying rate during drying for samples with three different shapes and initial
thickness of Z0 = 5 mm as well as substrates with 160. te is the end of drying time.
...................................................................................................................................... 35
Figure 2. 12 (a) Mass change during drying for sample with initial thickness of Z0 = 5
mm and initial diameter of D0 = 52 mm as well as substrate with 160 and (b) end of
drying time for samples with initial thickness of Z0 = 5 mm and initial diameter of D0 =
52 mm, multi walled carbon nanotubes concentration of CMWCNTs = 0 - 0.5 % v/v, and
substrates with 30, 95, and 160. All samples dried at laboratory conditions. ........ 37
Figure 2. 13 Drying rate during drying for samples with initial thickness of Z0 = 5 mm
and initial diameter of D0 = 52 mm, multi-walled carbon nanotubes concentration of
CMWCNTs = 0 - 0.5 % v/v as well as substrates with 160. All samples dried at
laboratory conditions. te is the end of drying. ................................................................. 38
Figure 2. 14 Volume change during drying for (a) samples with initial thickness of Z0 =
12.5 mm initial diameter of D0 = 52 mm and substrates with 160, 95,and 30 and
(b) samples with initial thickness of Z0 = 5 mm and substrates with 160 and
temperature of T = 24 to 60 C. V0 and te is the initial sample volume and the end of
drying time, respectively. ............................................................................................... 41
Figure 2. 15 Scanning electron micrograph (SEM) images of the sintered un-cracked
solid foams produced after drying the aqueous foams precursor for 24 h and then sintered
at 165 C. ...................................................................................................................... 43

x
Figure 2. 16 Porosity change during drying for (a) samples with initial thickness of Z0 =
12.5 mm and initial diameter of D0 = 52 mm as well as substrates with 160, 95, and
30 and (b) samples with initial thickness of Z0 = 5 mm and initial diameter of D0 = 52
mm as well as substrates with 160 and temperature of T = 24 to 60 C. te is the end
of drying time. ............................................................................................................... 46
Figure 2. 17 Bulk density change during drying for (a) samples with initial thickness of
Z0 = 12.5 mm and initial diameter of D0 = 52 mm as well as substrates with 160,
95, and 30 and (b) samples with initial thickness of Z0 = 5 mm and initial diameter of
D0 = 52 mm as well as substrates with 160 and temperature of T = 24 to 60 C. te is
the end of drying time. ................................................................................................... 49
Figure 2. 18 Relative density change during drying for (a) samples with initial thickness
of Z0 = 12.5 mm and initial diameter of D0 = 52 mm as well as substrates with 160,
95, and 30 and (b) samples with initial thickness of Z0 = 5 mm and initial diameter of
D0 = 52 mm as well as substrates with 160 and temperature of T = 24 to 60 C. te is
the end of drying time. ................................................................................................... 50
Figure 2. 19 Piezoelectric coefficients before and after poling for sintered un-cracked
samples with thickness of Z = 1.5 - 3 mm (a) longitudinal piezoelectric coefficient (d33)
and (b) transverse piezoelectric coefficient (d31). Poling voltage (11 kV for sample
thickness of Z = 1.5 mm, 13 kV for sample thickness of Z = 2.5 mm, 14.5 kV for sample
thickness of Z = 3 mm). ................................................................................................. 53
Figure 3. 1 Sample shape (not drawn to scale)............................................................... 55
Figure 3. 2 (a) Average moisture content and (b) fractional average moisture content for
samples with initial thickness of Z0 = 12.5 mm and initial diameter of D0 = 52 mm as well
as substrates with 30, 95, and 160. ...................................................................... 60
Figure 3. 3 (a) Average moisture content and (b) fractional average moisture content for
samples with initial thickness of Z0 = 5 mm and initial diameter of D0 = 52 mm as well as
substrate with 160 and temperature of T = 24 to 60 C. .......................................... 61
Figure 3. 4 Effective moisture diffusivity for (a) samples with initial thickness of Z0 =
5.0 to 12.5 mm and initial diameter of D0 = 52 mm as well as substrates with 30, 95,
and 160 and (b) samples with initial thickness of Z0 = 5 mm and initial diameter of D0 =
52 mm as well as substrates with 160 and temperature of T = 24 to 60 C. The first
number in the parenthesis is initial sample thickness in mm and the second number is
substrate contact angle in degree. ................................................................................... 63
Figure 3. 5 Volume change versus average moisture content during drying for (a)
samples with initial thickness of Z0 = 12.5 mm and initial diameter of D0 = 52 mm as well
as substrates with 160, 95, and 30 and (b) samples with initial thickness of Z0 = 5

xi
mm and initial diameter of D0 = 52 mm as well as substrates with 160 and
temperature of T = 24 to 60 C. ..................................................................................... 69
Figure 3. 6 (a) Modified average moisture content and (b) modified fractional average
moisture content for samples with initial thickness of Z0 = 12.5 mm and initial diameter
of D0 = 52 mm as well as substrates with 30, 95, and 160. ................................... 70
Figure 3. 7 (a) Modified average moisture content and (b) modified fractional average
moisture content for samples with initial thickness of Z0 = 5 mm and initial diameter of
D0 = 52 mm as well as substrates with 160 and temperature of T = 24 - 60 C. ...... 71
Figure 3. 8 Modified effective moisture diffusivity for (a) samples with initial thickness
of Z0 = 5.0 to 12.5 mm and initial diameter of D0 = 52 mm as well as substrates with
30, 95, and 160 and (b) samples with initial thickness of Z0 = 5 mm and initial
diameter of D0 = 52 mm as well as substrates with 160 and temperature of T = 24 –
60 C. The first number in the parenthesis is initial sample thickness in mm and the
second number is substrate contact angle in degree. ....................................................... 73
Figure 3. 9 The difference between effective moisture diffusivity and modified effective
moisture diffusivity during drying for samples with initial thickness of Z0 = 12.5 mm and
initial diameter of D0 = 52 mm as well as substrates with 30, 95, and 160. te is the
end of drying time. ........................................................................................................ 74
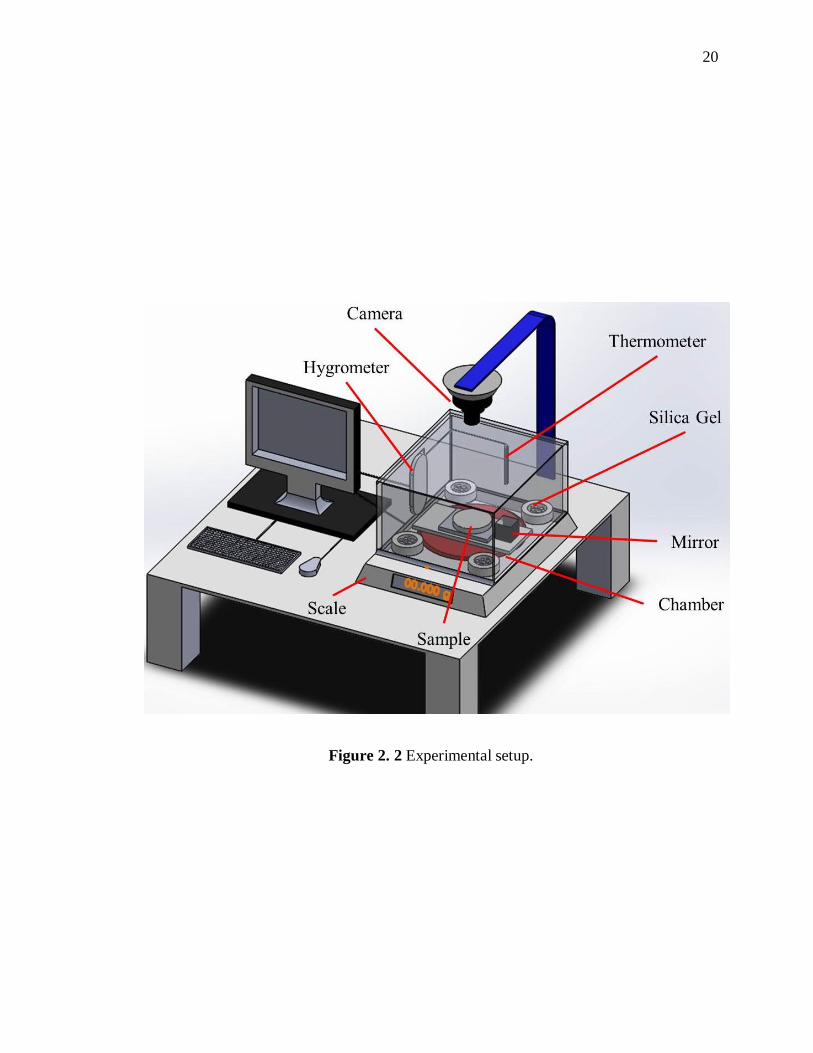
Figure 3. 10 Average effective moisture diffusivity (a) for samples with initial thickness
of Z0 = 5.0 to 12.5 mm and initial diameter of D0 = 52 mm as well as substrates with
30, 95, and 160 and (b) for samples with initial thickness of Z0 = 5 mm and initial
diameter of D0 = 52 mm as well as substrates with 160 and temperature of T = 24 -
60 C. ............................................................................................................................ 76
Figure 3.11 Non-dimensionalized form for liquid diffusion in Pickering foam for
samples with initial thickness of Z0 = 5.0 - 12.5 mm and initial diameter of D0 = 52 mm
as well as substrates with 30, 95, and 160 (a) Fourier number of diffusion vs.
fractional average moisture content and (b) Modified Fourier number of diffusion vs.
modified fractional average moisture content. The first number in the parenthesis is initial
sample thickness in mm and the second number is substrate contact angle in degree. ..... 78
Figure 3.12 Non-dimensionalized form for liquid diffusion in Pickering foam for
samples with initial thickness of Z0 = 5 mm and initial diameter of D0 = 52 mm as well as
substrates with 160 and temperature of T = 24 – 60 C (a) Fourier number of
diffusion vs. fractional average moisture content and (b) Modified Fourier number of
diffusion vs. modified fractional average moisture content............................................. 79
Figure 4. 1 Schematic illustration of Pickering foam aging at (a) high adhesive force
hydrophilic substrate (glass), in this case the value of adhesive force is greater than the

xii
cohesive force and (b) low adhesive force super hydrophobic substrate (modified glass),
in this case the adhesive force is less than the cohesive force. ........................................ 82
Figure 4. 2 The evolution in nanomenisci shape during drying of Pickering foam: (a)
fully wet, (b) partially wet, and (c) almost dry. .............................................................. 85
Figure 4. 3 The effect of substrate wettability on the crack formation behavior of sample
with initial thickness of Z0 = 5 mm and initial diameter of D0 = 52 mm as well as
substrates with: (a) 30, (b) 95, and (c) 160. Each point contains a portion
of the side-view (left) and top-view (right) of the sample. Scale bar is 10 mm................ 87
Figure 4. 4 The effect of substrate temperature on the crack formation behavior of
sample with initial thickness of Z0 = 5 mm and initial diameter of D0 = 52 mm as well as
substrate with 30 and temperature of: (a) T = 24 C, (b) T = 40 C, and (c) T = 60
C. Each picture contains a portion of the side-view (left) and top-view (right) of the
sample. Scale bar is 10 mm. ........................................................................................... 89
Figure 4. 5 (a) Final crack patterns for sample with initial thickness of Z0 = 5 mm and
initial diameter of D0 = 52 mm as well as substrate with 95 (i.e. PDMS) and
temperature of T = 24 – 60 C and (b) drying curves for samples on five different
temperaures. As shown, crack begins at same fractional averge moisture content........... 90
Figure 4. 6 The effect of contact angle and initial sample thickness on the crack behavior
of samples at the end of drying. Each picture contains a portion of the side-view (left) and
top-view (right) of the sample. Scale bar is 10 mm. ....................................................... 92
Figure 4. 7 Initial crack formation time versus initial sample thickness of Z0 = 2.5 - 10
mm and initial diameter of D0 = 52 mm as well as substrates with 30 and 95. ....... 93
Figure 4. 8 The effect of sample shapes on the crack formation behavior of sample with
initial thickness of Z0 = 5.0 mm and substrates with 30 and temperature of: (a)
square, (b) triangle, and (c) circle. Each picture contains a portion of the side-view
(right) and top-view (lift) of the sample. The surface area of all samples is equal. The
initial dimension of samples are: circle with diameter of D0 = 34 mm, square with length
of L0 = 30.13 mm, and triangle with base of B0 = 45.79 mm and height of H0 = 39.66 mm.
Scale bar is 10 mm. ....................................................................................................... 95
Figure 4. 9 (a) Final crack patterns in sample of initial thickness Z0 = 5 mm with
different shape located over PDMS substrate (i.e. 95 ) and (b) drying curves for
three different shapes. Note that cracks initiaton happens at the same fractional average
moisture content for all three shapes. ............................................................................. 96
Figure 4. 10 The effect of MWCNTs concentration on the crack formation behavior of
sample with initial thickness of Z0 = 5 mm and initial diameter of D0 = 52 mm as well as
substrates with 160 at: (a) CMWCNTs = 0 % v/v, (b) CMWCNTs = 0.1 % v/v, (c) CMWCNTs
= 0.3 % v/v, and (d) CMWCNTs = 0.5 % v/v. Each picture contains a portion of the side-
view (right) and top-view (left) of the sample. Scale bar is 10 mm. ................................ 98

xiii
Figure 4. 11 (a) Final crack patterns in sample with initial thickness of Z0 = 5 mm and
initial diameter of D0 = 52 mm as well as substrate with 95 (i.e. PDMS) and various
MWCNTs concentration of CMWCNTs = 0 – 0.5 % (b) drying curves for four different
concentration of MWCNTs. Note that cracks initiaton happens at the different fractional
average moisture content. .............................................................................................. 99
Figure 4. 12 Scanning electron micrograph (SEM) images taken of the sintered (a) un-
cracked solid foams and (b) cracked solid composite foams with MWCNTs (CMWCNTs =
0.3 % v/v). These samples are dried over superhydrophobic substrate (i.e. 160). ... 100
Figure A. 1 The drying conditions for samples with initial thickness of Z0 = 5 mm and
initial diameter of D0 = 52 mm as well as substrates with 160, 95, and 30 (a)
temperature (T) and (b) relative humidity (). ............................................................. 105
Figure B. 1 (a) Average moisture content and (b) fractional average moisture content for
sample with three different shapes of samples and initial thickness of Z0 = 5 mm and
substrate with 160. ............................................................................................... 106
Figure B. 2 (a) Average moisture content and (b) fractional average moisture content for
samples with initial thickness of Z0 = 5 mm and initial diameter of D0 = 52 mm as well as
MWCNTs concentration of CMWCNTs = 0 – 0.5 % v/v on substrates with 160. ....... 107
Figure B. 3 (a) Effective moisture diffusivity and (b) modified effective moisture
diffusivity for samples with initial thickness of Z0 = 5.0 mm and three different shapes
and substrates with 160. ....................................................................................... 108
Figure B. 4 (a) Effective moisture diffusivity and (b) modified effective moisture
diffusivity for samples with initial thickness of Z0 = 5 mm and initial diameter of D0 = 52
mm as well as different MWCNTs concentration of CMWCNTs = 0.0 – 0.5 % v/v and
substrates with 160. .............................................................................................. 109
Figure B. 5 Non-dimensionalized form for liquid diffusion in Pickering foam for samples
with initial thickness of Z0 = 5 mm and initial diameter of D0 = 52 mm as well as three
shapes and substrates with 160,. (a) Fourier number of diffusion vs. modified
fractional average moisture content and (b) Modified Fourier number of diffusion vs.
modified fractional average moisture content. The surface area of all sample are equal.
The initial dimension of samples are: circle with diameter of D0 = 34 mm, square with
length of L0 = 30.13 mm, and triangle with base of B0 = 45.79 mm and height of H0 =
39.66 mm. .................................................................................................................... 110
Figure B. 6 Non-dimensionalized form for liquid diffusion in Pickering foam for samples
with initial thickness of Z0 = 5 mm and initial diameter of D0 = 52 mm as well as
MWCNTs concentration of CMWCNTs = 0 – 0.5 % v/v and substrates with 160,. (a)

xiv
Fourier number of diffusion vs. fractional average moisture content and (b) Modified
Fourier number of diffusion vs. modified fractional average moisture content. ............ 111
Figure C. 1 The effect of substrate wettability on the crack formation behavior of
samples with initial thickness of Z0 = 7.5 mm and substrate of: (a) 30, (b) 95,
and (c) 160. Each picture contains a portion of the side-view (left) and top-view
(right) of the sample. Scale bar is 10 mm. .................................................................... 112
Figure C. 2 The effect of substrate wettability on the crack formation behavior of
samples with initial thickness of Z0 = 10 mm and initial diameter of D0 = 52 mm as well
as substrate of: (a) 30, (b) 95, and (c) 160. Each picture contains a portion
of the side-view (left) and top-view (right) of the sample. Scale bar is 10 mm.............. 113
Figure C. 3 The effect of substrate wettability on the crack formation behavior of
samples with initial thickness of Z0 = 12.5 mm and initial diameter of D0 = 52 mm as well
as substrate of: (a) 30, (b) 95, and (c) 160. Each picture contains a portion
of the side-view (left) and top-view (right) of the sample. Scale bar is 10 mm.............. 114
Figure C. 4 (a) Final crack patterns in samples of initial thickness of Z0 = 5 mm and
initial diameter of D0 = 52 mm as well as substrate with 30 and temperature of T =
24 - 60 C and. (b) crack begins at same fractional moisture content value with different
temperature of substrate. .............................................................................................. 115
Figure C. 5 (a) Final crack patterns in samples with initial thickness of Z = 5 mm and
different shapes and substrate with 30 and (b) crack begins at different fractional
average moisture content value for samples with different shapes. The surface area of all
samples is equal. The initial dimension of samples are: circle with diameter of D0 = 34
mm, square with length of L0 = 30.13 mm, and triangle with base of B0 = 45.79 mm and
height of H0 = 39.66 mm. ............................................................................................ 116
Figure C. 6 (a) Final crack patterns in samples with initial thickness of Z0 = 5 mm and
initial diameter of D0 = 52 mm as well as different concentration of MWCNTs of
CMWCNTs = 0.0 – 0.5 % v/v and substrates with 30 and (b) crack begins at different
fractional average moisture content value in samples with initial thickness of Z0 = 5 mm
and initial diameter of D0 = 52 mm as well as different concentration of MWCNTs of
CMWCNTs = 0.0 – 0.5 % v/v and substrates with 30. ................................................ 117
Figure C. 7 The effect of substrate temperature on the crack formation behavior of
samples with initial thickness of Z0 = 5 mm and initial diameter of D0 = 52 mm as well
as substrate with 95 and temperature of: (a) T = 24 C, (b) T = 30 C, and (c) T = 40
C. Each picture contains a portion of the side-view (left) and top-view (right) of the
sample. Scale bar is 10 mm. ......................................................................................... 118
Figure C. 8 The effect of substrate temperature on the crack formation behavior of
sample with initial thickness of Z0 = 5 mm and initial diameter of D0 = 52 mm as well as

xv
substrate with 95 and temperature of: (a) T = 50 C and (b) T = 60 C. Each picture
contains a portion of the side-view (left) and top-view (right) of the sample. Scale bar is
10 mm. ........................................................................................................................ 119
Figure C. 9 The effect of substrate temperature on the crack formation behavior of
sample with initial thickness of Z0 = 5 mm and initial diameter of D0 = 52 mm as well as
substrate with 30 and temperature of: (a) T = 24 C, (b) T = 30 C, and (c) T = 40
C. Each picture contains a portion of the side-view (left) and top-view (right) of the
sample. Scale bar is 10 mm. ......................................................................................... 120
Figure C. 10 The effect of substrate wettability on the crack formation behavior of
sample with initial thickness of Z0 = 5 mm and initial diameter of D0 = 52 mm as well as
substrate with 30 and temperature of: (a) T = 50 C and (b) T = 60 C. Each picture
contains a portion of the side-view (left) and top-view (right) of the sample. Scale bar is
10 mm. ........................................................................................................................ 121
Figure C. 11 The effect of sample shape on the crack formation behavior of samples with
initial thickness of Z0 = 5 mm as well as substrate with 95: (a) square, (b) triangle,
and (c) circle. Each picture contains a portion of the side-view (right) and top-view (left)
of the sample. The surface area of all samples is equal. The initial dimension of samples
are: circle with diameter of D0 = 34 mm, square with length of L0 = 30.13 mm, and
triangle with base of B0 = 45.79 mm and height of H0 = 39.66 mm. Scale bar is 10 mm.
.................................................................................................................................... 122
Figure C. 12 The effect of MWCNTs concentration on the crack formation behavior of
samples with initial thickness of Z0 = 5 mm and initial diameter of D0 = 52 mm as well as
substrate with 95 at: (a) CMWCNTs = 0 % v/v, (b) CMWCNTs = 0.1 % v/v, (c) CMWCNTs =
0.3 % v/v, and (d) CMWCNTs = 0.5 % v/v. Each picture contains a portion of the side-view
(right) and top-view (left) of the sample. Scale bar is 10 mm. ...................................... 123

1
Chapter 1
Introduction
1.1 Overview
1.1.1 Pickering Foams
Fine solid particles with proper size and hydrophobicity are known to irreversibly
adsorb at liquid/fluid interfaces (i.e. being surface active) [1-10]. Similar to surfactants
(or surface active agents) molecules, such solid particles can stabilize interfaces forming
particle-stabilized (aka Pickering) liquid/gas foams or liquid/liquid emulsions as shown in
Figure 1. 1.
When adsorbed, the required energy needed to remove a particle (or molecule)
from the interface, known as the detachment energy, is significantly higher than the
thermal energy ―kT‖ which explains their irreversible adsorption unlike the fast
adsorption/desorption dynamics of surfactant molecules of similar size. The detachment
energy of surfactant can be 1-3 kT, while for solid particle the detachment energy can be
103-10
5 kT, where k is the Boltzmann constant (k = 1.38064852×10
−23 J/K) and T is the
temperature (K), [1, 8, 11].

2
(a)
(b)
(c)
Figure 1. 1 (a) Surfactants (molecule contains hydrophilic head (polar) and hydrophobic
tail (non-polar)) at a liquid-gas interface, (b) colloidal particles at a liquid-gas interface
with 0 < < 90) (Pickering foams), and (c) colloidal particles at a liquid-gas interface
with 90 < < 180 (Liquid marbles). These figures are not drawn to scale.

3
The detachment energy for a spherical particle at flat liquid/fluid interface can be
calculated as [12]:
( ) (1. 1)
where;
(1. 2)
here is the detachment energy required to remove a particle from the interface,
r is the radius of particle, is the interfacial tension between the gas and liquid, is
the interfacial tension between the solid and gas, is the interfacial tension between the
solid and liquid, and is the particle three phase contact angle at the solid-liquid-gas
interface (see Figure 1. 1).
The detachment energy is scaled with square of the particle radius, bigger particle
provide higher detachment energy, while smaller particles provide foams with stronger
stability, more nanoparticles adsorbe at the liquid/fluid interface [2, 7, 13]. To get higher
value of detachment energy, the contact angle of solid particle should be near 90, see
equation (1. 1). The contact angle of colloidal particles at a liquid/gas interface is too
important to create a Pickering foams system. If contact angle is greater than 90 then the
air will be around the liquid (i.e. Liquid marbles), the particles encapsulated the liquid.
On the contrary, if contact angle is less than 90, then the liquid will be around the gas
(i.e. Pickering foams), the particles encapsulated the air (see Figure 1. 1).
4
Based on the previous information, to prepare Pickering foams system, the contact
angle of colloidal particles should be between 0 and 90, hydrophilic powder (or
colloidal particles) [14-17].
Owing to the high detachment energy, particles can decorate bubble interfaces in
foams (or droplets in emulsions) and slow down the mechanisms that make Pickering
systems unstable such as gravity-induced liquid drainage and bubble-bubble coalescence
and disproportionation (Ostwald ripening) [18-20]. A stable Pickering foams system (see
Figure 1. 2) can be then further processed, by a combination of drying and solidification,
to make solid porous structures (or solid composite porous structure) with tunable
morphology and properties. Of interest in this regard is then to develop a comprehensive
understanding on how particle-stabilized foams undergo drying.

5
(a)
(b)
Figure 1. 2 Pickering foams stabilized by polymer particles (a) without Multi-walled
Carbon Nanotubes and (b) with Multi-walled Carbon Nanotubes. These figures are not
drawn to scale.

6
1.1.2 Drying Dynamics
Drying is a complex and dynamic transport process, where the liquid inside the wet
foam leaves through a combination of surface evaporation (induced by diffusion) and
drainage (induced by gravity), causing the foam to undergo dimensional reduction (i.e.
shrinkage) as shown in Figure 1. 3. Also, liquid evaporation leads to morphology change
(i.e. porosity) due to the capillary stress that occurs between the particles [3, 6, 9, 21-23].
One of the common transport properties used to describe the drying process in wet
porous materials (e.g. Pickering foams) is effective moisture diffusivity. The effective
moisture diffusivity includes moisture gradient (caused by evaporation and drainage),
temperature gradient (change in sample temperature during drying), and porosity gradient
(change in sample volume) [24-33].
(a) (b)
Figure 1. 3 (a) An as-prepared wet foams and (b) crack-free dried foams. Scale bar is 10
mm.

7
The moisture transport can be described by the Fick’s second law equation of
unsteady state diffusion, which for the case of drying relates the spatial and temporal
changes of the moisture content X (kg liquid/ kg dry solid) via moisture-dependent
diffusivity Deff (m2/s) [34]. The diffusivity can be estimated by analysis of the drying data
and applying the method of slope [35-39]. This method is described in more details in
chapter three and we utilize it in this thesis to calculate the effective moisture diffusivity
(Deff) of the drying Pickering foams. As mentioned, change in sample volume due to
shrinkage influences moisture diffusivity and should be included in calculation of
effective moisture diffusivity. However, this may be neglected for certain conditions [40-
46]. In this study, we first neglected and then included effect of samples shrinkage when
calculating the effective moisture diffusivity and evaluate the appropriateness of each
approach in certain situations.
Theoretical prediction of moisture diffusivity in such a complex system is not straight
forward thus arising need for experimental measurements including the analysis of the
drying data (i.e. moisture vs. time), and X-ray computed tomography to determine the
sorption kinetics [47, 48]. In this thesis, we investigate the drying dynamics of Pickering
foams and report the influence of several control parameters such as substrate wettability
(i.e. contact angle), substrate temperature (i.e. drying rate), initial foams thickness, foams
shape, and Multi-walled Carbon Nanotubes concentration (CMWCNTs) in the foams on end
of drying, change in dimensions, average moisture content, and effective moisture
diffusivity of the samples.

8
1.1.3 Crack Formation
Pickering foams whose intrinsic phase properties are affected by the formation of
cracks, cracked foam has a much different set to regular un-cracked foam. Because
fractures compromise the integrity of porous materials, the cracking phenomenon can
invite failure of devices or products (see Figure 1. 4).
(a) (b)
Figure 1. 4 Crack formation in Pickering foams during the drying processes (a) dried
PVDF foams and (b) dried PVDF/MWCNTs composite foams. Scale bar is 10 mm.
Accordingly, several trials and investigations have been conducted by researchers in the
past to gather more information about crack formation on Pickering foams but very
limited studies try to solve this challenging problem [6, 49, 50]. Moreover, the shrinkage
maybe accompanied by cracks (or defects) formation which may render the structure
unusable. Therefore, developing strategies to predict and control the drying as well as
preventing crack formation and propagation seems to be necessary for successful
fabrication of solid porous structures (or composite solid porous structure) using particle-

9
stabilized foams as precursor. It is worth noting that drying (i.e. aging) and crack
formation are also relevant in other system such as in drying of particulate suspensions,
gel, building materials (e.g. porous bricks and wood), pharmaceutical manufacturing (e.g.
foam drying of vaccines), and in drying of food products and significant efforts have
been placed to study such systems [51-59].
Common approaches proposed to obtain dry, crack-free structures in such systems
include slow drying under controlled conditions (e.g. relative humidity, air velocity,
pressure, and temperature), unidirectional drying, freezing drying, drying by chemical
additives, and drying on superhydrophobic as well as flexible substrates [60-70].
In this thesis, we elimenated crack formation in Pickering foams by using low-
adhesion substrates with high contact angles (i.e. superhydrophobic substrate), as well as
large initial sample thickness both of which have been found to reduce the formation of
cracks. Also, for samples located on glass substrate, we found that the probability of
samples cracking depends strongly on the drying rate or substrate temperature (it
decreases as substrate temperature increases, but the crack still occurs). On the contrary,
this does not deppen for samples on PDMS substrates. In addition, as MWCNTs
concentration in the composite Pickering foams increases the formation of cracks
increases for the all types of substrates.

10
1.2 Scope of the Present Work
Overall, the aims of this work can be stated as follows:
(1) Determining the drying curves and the change in sample dimensions of Pickering
foams under different drying conditions such as varying substrate wettability (i.e.
contact angle) and temperature, sample shape and initial thickness, as well as
concentration of MWCNTs. Three different substrates were used: hydrophilic
glass with a contact angle (measured through DI-water) of θ 30, hydrophobic
poly(dimethylsiloxane) (PDMS) with θ 95, and superhydrophobic modified
glass with θ 160. Also, five different temperatures were selected T = 24, 30,
40, 50, and 60 C. In addition, three shapes of samples were examined (circle,
square, and equilateral triangle). For circular case, samples with initial thicknesses
of Z0 = 2.5, 3.25, 5, 7.5, 10, and 12.5 mm and initial diameter of D0 = 34 and 52
mm were considered. For square shape, samples with initial thicknesses of Z0 = 5
mm and initial length of L0 = 30.13 mm is selected. For equilateral triangle case,
samples with initial thicknesses of Z0 = 5 mm , initial height of H0 = 39.66 mm,
and initial base of B0 = 45.79 mm is selected. The concentration of MWCNTs
varied between 0 – 0.5 % v/v.
(2) Estimating the change in Pickering foams characterization such as porosity,
volume, and density (bulk density and relative density) during drying.
(3) Calculting the effective moisture diffusivity of Pickering foams under all drying
conditions by using the drying curves. Method of slope is employed to estimate
the effective moisture diffusivity. Two approaches were used to determine the

11
effective moisture diffusivity. In the first approach, the effect of sample shrinkage
is neglected while sample shrinkage is included in the second approach.
(4) Investegating the influence of all drying conditions on the probability of crack
formation and pattern of Pickering foams during the drying processe.
1.3 Outline
In what follows, in chapter two, we first describe the material and methods used
to conduct the experiments. Then, drying curves and change in samples dimension as
well as sample characterization under all drying conditions are presented. The theoretical
description to calculate the effective diffusivity is discussed in chapter three. In chapter
four, the effect of drying conditions such as substrate wettability and temperature, initial
sample thickness, sample shape, as well as MWCNTs concentration on crack formation
in samples is discussed in detailes. Finally, the conclusion of all results and the future
work are presented in chapter five.

12
Chapter 2
Drying Kinetics
2.1 Introduction
Drying of porous materials (or composite porous material) is an important subject
both from engineering and fundamental point of views. One such system is foams
stabilized by solid particles (i.e. Pickering foams). An understanding of drying process in
Pickering foams will provide information on fabrication of solid porous materials (or
composite solid porous material) using such foams as precursor. Several recent studies
have been conducted on drying of Pickering foams. Lesov et al. studied the change in
Pickering foams size during drying process. They clarified the mechanism of shrinkage
of Pickering foams and he described the quantitatively the relation between the properties
of foams suspension and the dry porous materials obtained from this suspensions [22]. In
other work, Lesov et al. investigated the effect of foams porosity (air fraction) on the
probability of cracking during drying processes [6]. Wong et al. investigate the effect of
particles size, concentration, and wettability on the manufacture of Pickering foams.
Where, macroporous materials with porosities between 33 and 95% and median pore
sizes between 13 and 634 m were obtained [10]. Rezvantalab et. al. demonstrate the
fabrication of composite solid porous materials based on foaming of aqueous desperation
of suspension particles and Multi-walled Carbon Nanotubes with varies concentration.
They study the mechanical, morphological, as well as thermal and electrical transport

13
properties of the fabric (i.e. PVDF/MWCNTs porous composite). They found that the
concentration of Multi-walled Carbon Nanotubes results in changing in the
characterization of the dry composite foams [71].
Here, we are investigating drying kinetics by focusing on parameters such as end of
drying, drying rate, average moisture content, and effective moisture diffusivity. Also, the
change in foams dimensions, density, and porosity during drying process is explained.
In this work, natural convection was used to remove liquid via evaporation and
drainage from wet Pickering foams. The drying process involves the application of heat
to materials; the heat is transferred from the surroundings to the surface of the sample or
it can transfer from substrate to the samples (e.g. heating from below). As a result of the
applied heat, liquid leaves the sample to the surroundings via evaporation.
Fundamental Questions
(1) What is the effect of substrate wettability and temperature on the drying
kinetices?
(2) What is the influence of sample shape and thickness as well as MWCNTs
concentration on the drying kinetics?
(3) How is foam characterization change during drying under different drying
conditions?

14
2.2 Materials and Methods
In this section, the materials used in this work are presented. Also, the method of
preparing the Pickering foams (or composite Pickering foams) as well as the description
of the experimental setup is explained with details.
2.2.1 Materials
We use commercially available poly(vinylidene fluoride) (PVDF) nanoparticles
(Polysciences Inc.) with the primary particle size of D50 = 250 ± 30 nm and a contact
angle of ~ 90°, density of 1.76 g/cm3 , and melting point of ~ 160 °C. The contact angle
of the PVDF is close to the value that gives maximum detachment energy to the particles
adsorbing at liquid/gas interfaces (i.e. 90), see equation (1. 1). Also, we used Multi-
walled Carbon Nanotubes (Sigma-Aldrich) as nanofillers. The average outer diameter of
the MWCNTs is around 10 - 20 nm and length of 5-9 m.
Ethanol was added to lower the surface tension and facilitate foaming and
adsorption of particles at liquid/gas (bubble) interfaces. Previous studies have
demonstrated that 9 v/v % aqueous ethanol solutions maybe used to produce stable PVDF
foams, on the one hand and to reduce the three-phase contact angle of the solid particle to
around 70°, on the other hand [10, 23].

15
2.2.2 Methods
Beforehand, mold and substrate were hand cleaned by using DI-water then
ethanol after that compressed nitrogen was applied to dry them. Details of the foam
production process is described elsewhere [71]. Briefly, aqueous foams are prepared
through direct foaming of PVDF and liquid (Deionized water and ethanol) suspensions.
A specified mass of PVDF (4 v/v %) is added to a test tube along with adequate amount
of ethanol (9 v/v %) and DI water (Millipore) and the mixture is sonicated for one minute
with a probe sonicator (Qsonica, Q500) to uniformly disperse the particles in the
suspension. The test tube was then capped and vigorously hand shaken for five minutes to
foam the suspension. The resulting aqueous foam was then scooped into molds and the
top surface was shaved with a blade to ensure constant volume across all trials.
In the case of composite foams (i.e. MWCNTs/PVDF), composite foams are
prepared through direct foaming of PVDF and suspension of MWCNTs (Deionized
water, MWCNTs and ethanol). A specified mass of MWCNTs with different
concentrations (CMWCNTs = 0, 0.1, 0.3, and 0.5 v/v %) is added to a test tube along with DI
water and the mixture is sonicated for two minutes with a probe sonicator to uniformly
disperse the MWCNTs in the suspension. Then, a specific amount of ethanol (9 v/v %) is
added to the suspension and the suspension is hand shaken for half minute. Next, a
specified mass of PVDF (4 v/v %) is added to the suspension and the mixture is sonicated
again for two minutes. The test tube was then capped and vigorously hand shaken for five
minutes to foam the suspension.

16
Three molds with different shapes are used:
(1) Circle.
(2) Square.
(3) Triangle (equilateral).
In the case of circle shape, the molds are cut from poly(vinylchloride) (PVC) tubes,
forming rings with two different inner diameter of 52 and 34varying thickness of 2.5,
3.25, 5, 7.5, 10, and 12.5 mm.
In the case of square shape, the molds are cut from plastic sheet (Acrylic) using laser
cutter, forming molds with inner dimension length of 30.13 mm and thickness of 5 mm.
In the case of triangle (equilateral) shape, the mold are cut also from plastic (Acrylic)
sheet using laser cutter, forming molds with inner dimension of base of 45.79 mm, height
of 39.66 mm, and thickness of 5 mm.
Three substrates with different wettability are used:
(1) Hydrophilic glass substrate with contact angle of θ 30;
(2) Hydrophobic polydimethylsiloxane (PDMS) substrate with θ 95;
(3) Superhydrophobic modified glass substrate with θ 160.
The contact angles of all the substrates are measured using an in-house goniometer as
shown in Figure 2. 1.

17
(a)
(b)
(c)
Figure 2. 1 Contact angle () between droplet (DI-Water) and substrate at: (a) glass
(hydrophilic with 30), (b) PDMS (hydrophobic with 95), and (c) modified glass
(superhydrophobic with 160).

18
PDMS substrates (~ 2 mm thick) are prepared by thoroughly mixing a 10:1 ratio of
silicone base (Sylgard 184, Dow Corning) to cross-linking agent and subsequent curing at
60 C in an oven. Superhydrophobic substrates are prepared by spraying glass substrates
with a thin non-stick coating agent (Rust-Oleum). We determined that the coated surface
remains superhydrophobic for the duration of the experiments. To ensure use
superhydrophobic substrate with high contact angle for each test, a new
superhydrophobic substrate is used for each trial (i.e. used substrate is not reused for next
trial)
Immediately after scooping the foam into PVC molds, they are placed on one of
the substrates and the combination is placed on a digital scale (Mettler Toledo, PB303-
SRS) that is confined in a transparent air-tight acrylic chamber with dimensions (depth =
15 cm, width = 17 cm, and length = 18 cm). The scale is interfaced with a data logger
(RS232, Eltima) to record sample mass over time. A digital thermometer and a digital
hygrometer (Inkbird) are placed near the sample to continuously record the temperature
and relative humidity of the chamber.
We remove the PVC and plastic molds after short period to eliminate the effect of
mold contact surface on sample shrinkage as well as crack formation. The following
points shows the period for each case:
1- One hour for samples dried at room temperature;
2- Half hour for samples dried at heated substrate;
3- Immediately for samples of different shapes and those with PVDF/MWCNTs
(i.e. composite porous foams).

19
All trials are carried out at laboratory conditions (temperature, pressure, and relative
humidity).
To keep the relative humidity constant during drying, containers of silica gel are
placed inside the chamber. To determine changes in dimension, top- and side-view
images of samples are recorded at regular intervals using a digital camera (Infinity,
Lumenera) as shown in Figure 2. 2.
When samples are completely dried, an air convection oven (Tuttlingen/Germany)
was used to sintering the dried samples. The samples were placed on an aluminum plate,
and then they heated gradually. The initial temperature inside the oven was 65 C with 10
C increments every 10 min, till 165 C. The samples were kept at this temperature
(above polymers melting point) for 3 hours, after which consolidated porous structures
were formed. To reuse the used silica gel with black color (i.e. fully wet silica) for next
trial, they dried using the oven at temperature of T = 180 C for around t = 12 h. Later
on, a dry silica gel with an orange color (i.e. fully dry silica) is ready to use for next
trials.
20
Figure 2. 2 Experimental setup.

21
2.3 Aging of Pickering Foams
The change in sample mass and dimensions (i.e. shrinkage) as well as the effect of
substrate temperature and wettability, sample thickness and shape, and the effect of
MWCNTs concentration on the samples are presented and discussed with details in this
section.
2.3.1 Drying Curve
The change in sample mass over time is shown in Figure 2. 3 (a) for an initial
foam thickness of 5 mm and initial diameter of 52 mm as it dries out on three different
substrates ( 30, 95, and 160). As expected, the sample mass decreases as the liquid
content leaves due to a combination of surface evaporation and gravity-induced drainage,
eventually reaching a plateau which indicates the end of drying point (te) as highlighted
in Figure 2. 3 (a), see appendix A to see the drying conditions over time.
The end of drying point, defined as the point after which the change in sample
mass is negligible, is plotted in Figure 2. 3 (b) for samples of various initial thickness
undergoing drying on three different substrates, obviously thin samples dry faster as
expected. Moreover, at a fixed initial thickness, the drying takes longer on
superhydrophobic substrates. This is possible due to two factors:
(1) As the substrate contact angle increases, drained liquid is forced to stay within
the sample making the surface evaporation the only drying mechanism;
(2) Decreasing the wettability (i.e. increase the contact angle value) of the
substrate results in crack-free dried samples. Formation of cracks on the other hand,
maybe considered as added pathways for liquid evaporation, lack of which may

22
lengthening sample drying time. Crack formation is presented and discussed in chapter
four.
Using the presented data, MATLAB is used to find the relationship between the
end of drying time and initial sample thickness (i.e. curve fitting) for un-cracked samples
with initial thickness of Z = 2.5 – 12.5 and initial diameter of D0 = 52 mm as well as
substrate with 160 (i.e. superhydrophobic substrate) as shown in equation (2. 1). The
unit of the end of drying time (te) is hour and initial sample thickness (Z0) is mm. Clearly,
the end of drying time is increased linearly as initial sample thickness increases.
(2. 1)
By employing the following equation and by using the presented data in Figure 2. 3 (a),
the drying rate (DR) for samples over time can be estimated [26, 28, 72], see Figure 2. 4.
(2. 2)
Where, is the sample mass at any time ( ), is the sample mass at , and is
period of drying step.
We can see from Figure 2. 4, during the drying process for foam samples, drying rate is
not depended strongly on the drying conditions such substrate wettability. Also, drying
rate under different drying conditions decreased continuously as drying time increases.
We can report that falling rate period is the main stage in this system (i.e. Pickering
foams), the constant rate period is absence during the drying process in this system which
usual occurs at the beginning of drying in different system [57].
.

23
(a)
(b)
Figure 2. 3 (a) Mass change during drying for samples with initial thickness of Z0 = 5
mm and initial diameter of D0 = 52 mm as well as substrates with 30, 95, and 160 and (b) end of drying time for samples with initial thickness ranging between 2.5 and
12.5 mm and initial diameter of D0 = 52 mm on three different types of substrates.

24
Figure 2. 4 Drying rate during drying for samples with initial thickness of Z0 = 5 mm
and initial diameter of D0 = 52 mm as well as substrates with 30, 95, and 160. te is
the end of drying time.

25
2.3.2 Dimensional Variation and Shrinkage
As samples undergo drying and lose their moisture content, their dimension
changes resulting in shrinkage in all directions (i.e. radial and vertical) as demonstrated in
Figure 2. 5. Drying-induced shrinkage is caused by capillary-induced stresses and is a
well-known phenomenon in drying of wet porous materials and thin coating of nano-
particle suspensions [73, 74]. We notice that diameter reduction (i.e. shrinkage) is larger
for the sample on the superhydrophobic substrate. This is because of the low adhesion
between the sample and the substrate as opposed to the hydrophilic and partially
hydrophobic substrates.
Assuming constant final volume for the samples, larger reduction in radial
direction may translate into smaller reduction in sample thickness, see Figure 2. 5 (b),
samples located on superhydrophobic substrate. This however seems not to be the case
for the other two substrates which may be an indication of change in local sample
porosity during aging. Shrinkage in diameter or thickness for all un-cracked samples
follows two distinct slopes before reaching a constant plateau. However, two-linear
slopes trend are less pronounced for the shrinkage in sample thickness.
Obviously, as initial sample thickness increase, the change in sample dimensions
is closer as shown in this figure. This is due to the free crack in foams samples. In other
words, the difference in the change in sample dimension is dependent strongly on the
probability of crack formation during drying process.

26
(a)
(b)
Figure 2. 5 Change in diameter and thickness during drying for samples with initial
thickness of (a) Z0 = 5 mm and (b) Z0 = 12.5 mm, and initial diameter of D0 = 52 mm as
well as substrates with 30, 95, and 160. te is the end of drying time.

27
Figure 2. 6 shows the change in samples volume versus drying time, where V0 is the
initial foam volume and te is the end of drying time.
The behavior of sample in first step is discussed earlier in this section. In the next
section, the increased in sample volume (i.e. swilling) over time is discussed in details. In
the last step, the drying is stopped (i.e. fully dry sample) so there is no change in sample
dimensions.
Using the data in Figure 2. 5, we have calculated radial shrinkage ratio as
demonstrated in Figure 2. 7 (a) [22] as:
(
)
(2. 3)
Figure 2. 6 Change in volume during drying for un-cracked samples with initial
thickness ranging between 2.5 and 12.5 mm on substrate with 160. The curves
in the box show the expansion in foams volume through the end of drying. V0 and
te is the initial foam volume and the end of drying time, respectively.

28
where, is the shrinkage ratio in radial direction, is sample diameter at any time, and
is the initial sample diameter. Also, the vertical shrinkage ratio using the following
equation is demonstrated in Figure 2. 7 (b).
(
)
(2. 4)
where, is the shrinkage ratio in vertical direction, is sample thickness at any time,
and is the initial sample thickness.
The degree of sample shrinkage in both directions depended on the substrate type
and initial sample thickness. Where for samples with initial thickness of Z0 = 5 mm and
initial iameter of D0 = 52 mm on substrate with 160 as well as Z0 = 12.5 mm and
initial iameter of D0 = 52 mm on substrate with 30 - 160, the vertical and horizontal
shrinkage trend two slopes, the second slope is higher than the first slope. On the
contrary, for sample with initial thickness of Z0 = 5 mm and initial iameter of D0 = 52
mm on substrate with 95 and 30, the vertical and horizontal shrinkage trend one
slope. The reason is the crack free in samples with Z0 = 5 mm and initial iameter of D0 =
52 mm on substrate with 160 and Z0 = 12.5 mm and initial iameter of D0 = 52 mm on
substrate with 30 - 160. During the second slope, the capillary pressure is higher
than for the first period, more details about the crack and capillary pressure is discussed
in chapter four.
For all un-cracked samples, the shrinkage ratio in vertical and horizontal direction
are seem equivalent. While for cracked samples, the shrinkage in vertical direction is
higher than the shrinkage in vertical direction due to the crack formation. More details
about the crack formation is discuused with detail in chapter four.

29
(a)
(b)
Figure 2. 7 Shrinkage ratio in diameter and thickness during drying for samples with
initial thickness of (a) Z0 = 5 mm and (b) Z0 = 12.5 mm and initial diameter of D0 =
52 mm as well as substrates with 30, 95, and 160.

30
To investigate the sample expansion during drying, we have measured the sample
temperature and we plotted diameter, mass, and temperature over time for initial sample
thickness (Z0 = 5 mm) and initial iameter (D0 = 52 mm) as well as superhydrophobic
substrate ( 160) as shown in Figure 2. 8. We note from this figure that the sample
size (i.e. diameter) follow the change in mass and temperature of the sample. By focusing
on the end of drying (see Figure 2. 8), we observe that as sample temperature increase,
there seems to be an expansion in sample diameter.
The temperature of the ambient is around 24 C (i.e. dry bulb temperature), while the
sample temperature is around 20 C (i.e. wet bulb temperature) Other researchers have
observed similar
behavior in temperature
although for different
system [57]. We would
like to point out that this
behavior has not been
observed or reported in
other studies and we
believe this is the first
time that such expansion
is reported. This behavior
however requires further
investigation.
Figure 2. 8 Change in sample size, temperature, and mass
during drying for sample with initial thickness of Z0 = 5 mm
and initial diameter of D0 = 52 mm as well as substrate with
160. Sample diameter shows a slight expansion teward
the end of drying.

31
2.3.3 Substrate Temperature
The effect of substrate temperature on the samples drying curves is discussed in
this section. As substrate temperature increased, the drying time decreased exponentially
in all cases due to increase in the evaporation rate as shown in Figure 2. 9. For samples
dried on superhydrophobic substrate, the end of drying time is around 21 h at laboratory
conditions, while it is around 1.5 h for substrate at 60 C, 90 % reduction. Also, one can
note from this figure that the end of drying of samples located on the superhydrophobic
substrate is more than the sample located on hydrophobic and hydrophilic substrates due
to the crack free of these samples (more detail is presented and discussed in chapter four).
The result presented in Figure 2. 9 (b) are fitted to find the relationship between
the end of drying and substrate temperature for un-cracked samples as shown in equation
(2. 5). The unit of the end of drying time (te) is h and substrate temperature (T) is C.
( ) ( ) (2. 5)
We can assume a linear decreases in mass over time, for samples located over
superhydrophobic substrate, the drying rate increased from around (-0.19 g/h) for
substrate tuned at laboratory temperature (T = 24 C) to around (-2.07 g/h) for substrate
tuned at higher temperature (T = 60). Clearly, the substrate temperature played a positive
rule to increase the drying rate during drying.

32
(a)
(b)
Figure 2. 9 (a) Mass change during drying for sample with initial thickness of Z0 = 5 mm
and initial diameter of D0 = 52 mm as well as substrates with 160 and (b) end of
drying time for samples with initial thickness Z0 = 5 mm and initial diameter of D0 = 52
mm, substrate temperature of T = 24 - 60 C, as well as substrates with 30, 95, and
160 .

33
2.3.4 Sample Shape
The effect of sample shape on the drying curves is showed and discussed in this
section. Three shapes with equal surface area are selected here in this work (circle,
square, and triangle). The initial dimension of samples are: circle with diameter of D0 =
34 mm, square with length of L0 = 30.13 mm, and triangle with base of B0 = 45.79 mm
and height of H0 = 39.66 mm. As shown in Figure 2. 10, for samples with different
shapes and initial thickness of Z0 = 5 mm on superhydrophobic substrate, the sample
shape has no strong effect on the drying curve.
The end of drying time for all shapes is ranged between 13 and 17 h due to the
equal surface area of all samples. The end of drying time is estimated for all samples
under different drying conditions as shown in Figure 2. 10 (b). All samples dried at
laboratory conditions (T = 22 C and = 25 ± 5 %). In conclusion, for samples with
same surface area, the drying curves is not depend strongly on the samples shape.
By using equation (2. 2) and by using the presented data in Figure 2. 10 (a), the drying
rate (DR) for samples with different shapes over time can be estimated as shown in
Figure 2. 11. Obeviosly, during the drying period time, there are only one drying period
(i.e. falling rate period), same behavior is reported in the case of samples dried at
different substrate, see Figure 2. 4. For samples with different shapes and same surface
area, the drying rate is seems similar during drying process. If we assumed linear
decreases in sample mass during drying process, the drying rate (DR) for samples located
over superhydrophobic substrate with different shapes is around (-0.12 g/h).

34
(a)
(b)
Figure 2. 10 (a) Mass change during drying for sample with three different shapes of
samples and initial thickness of Z0 = 5 mm and substrate with 160 and (b) end of
drying time for samples with three different shapes and initial thickness of Z0 = 5 mm on
three different types of substrate. The surface area of all samples is equal. The initial
dimension of samples are: circle with diameter of D0 = 34 mm, square with length of L0
= 30.13 mm, and triangle with base of B0 = 45.79 mm and height of H0 = 39.66 mm.

35
Figure 2. 11 Drying rate during drying for samples with three different shapes and initial
thickness of Z0 = 5 mm as well as substrates with 160. te is the end of drying time.

36
2.3.5 Composite PVDF/MWCNTs Foam
The effect of MWCNTs concentration (CMWCNTs) loaded in foams on the drying
curves is discussed in this section. For a fixed PVDF volume fraction, we note the drying
time needed to remove the liquid from the sample (i.e. end of drying time) increases
linearly as the concentration of MWCNTs increases for all cases (i.e. three different
substrates). The reasons for this increase maybe due to the change in sample morphology
(i.e bubble size) as well as the increases in the initial mass of the sample as shown in
Figure 2. 12(a), more details about the sample morphology is shown and discussed in
next section. For samples dried on superhydrophobic substrate, the end of drying time is
increased from 16 h for sample with 0 % v/v concentration to 30 h for sample with 0.5 %
v/v concentration, which show a two-fold increase. In this section, all samples are dried at
laboratory conditions, T = 22 ± 1 C and = 25 ± 5 %.
By employing equation (2. 2) and by using the presented data in Figure 2. 12 (a), the
drying rate (DR) for samples over time can be estimated, see Figure 2. 13.
We can see from this figure , in the case of CMWCNTs = 0.1 and 0.3 v/v % and during the
drying period time, there are two drying period. In the first period, drying rate is
increased. While, drying rate is decreased in the second period (i.e. falling rate period).
In the case of CMWCNTs = 0 and 5 v/v %, during the drying period time, there are just one
drying period (i.e. falling rate period), same behavior is reported in the case of samples
dried at different substrate, see Figure 2. 4.
We can report, for composite PVDF/MWCNTs foams, there is no constatnt rate period
which usual appear in another sustem [57].

37
(a)
(b)
Figure 2. 12 (a) Mass change during drying for sample with initial thickness of Z0 = 5
mm and initial diameter of D0 = 52 mm as well as substrate with 160 and (b) end of
drying time for samples with initial thickness of Z0 = 5 mm and initial diameter of D0 =
52 mm, multi walled carbon nanotubes concentration of CMWCNTs = 0 - 0.5 % v/v, and
substrates with 30, 95, and 160. All samples dried at laboratory conditions.

38
Figure 2. 13 Drying rate during drying for samples with initial thickness of Z0 = 5 mm
and initial diameter of D0 = 52 mm, multi-walled carbon nanotubes concentration of
CMWCNTs = 0 - 0.5 % v/v as well as substrates with 160. All samples dried at
laboratory conditions. te is the end of drying.

39
2.4 Characterization of Pickering Foams
In this section, the change in foams characterization such as volume reduction,
porosity, and density (bulk density and relative density) during drying is studied in
details. The effect of the drying conditions (initial sample thickness as well as substarte
wettability and temperature) on foams characterization is investigated.
As mentioned before, the composition of Pickering foams can be divided into
three phases:
(1) Solid (PVDF or PVDF/MWCNTs);
(2) Liquid (DI-water and ethanol);
(3) Gas (occurs during foaming process).
Solid mass (or volume) stays constant during drying process, while liquid and air mass
(or volume) are continue to change. For the liquid phase, the whole liquid inside sample
is vanished due to drainage and evaporation. On the contrary, the air volume is increased
due to the the fact that the evaporated liquid is replaced partially by air, if we assume
there is change in sample size (i.e. shrinkage).
2.4.1 Volume reduction
The volume of foam changes during drying due to shrinkage induced by capillary
stresses. The ratio of volume change is depends on the volume of liquid that leaves the
sample by evaporation and drainage. In this study, the entire liquid is totally evaporated
and drainaged. If the volume of evaporated and draianged liquid are replaced by air,
collapse or shrinkage does not occur during drying and the size of foam remains constant.

40
However, if the volume of the evaporated and drainaged liquid are partially replaced
partially by the air, the foam under go shrinkage (i.e. shrink).
To show the change in sample characterization during drying process, the sample
dimensions are collected in real time using a digital camera. Utilizing the collected data
(e.g. diameter and thickness), sample volume is calculated, assuming a cylindrical shapes.
Figure 2. 14 shows the change in foam volume for un-cracked sample under
different drying conditions, the foams dimension change (i.e. shrink) over time. We can
see the foam volume reduces over drying time. The decrease in foam volume is not
depends on the drying condition (i.e. initial sample thickness as well as substrate
temperature and wettability), see Figure 2. 14 (a) and Figure 2. 14 (b). The final volume
(Ve) of all un-cracked samples is around 0.37 of the initial sample volume (V0).
Generally, for Pickering foams system, the reduction in foams volume toward the
end of drying is linear with two slopes. The second slope is higher than the first slope due
to the increases in capillary pressure over time. More details about the evoluation of
capillary pressure in Pickering foams during drying process is discussed in chapter four.

41
(a)
(b)
Figure 2. 14 Volume change during drying for (a) samples with initial thickness of Z0 =
12.5 mm initial diameter of D0 = 52 mm and substrates with 160, 95,and 30 and
(b) samples with initial thickness of Z0 = 5 mm and substrates with 160 and
temperature of T = 24 to 60 C. V0 and te is the initial sample volume and the end of
drying time, respectively.

42
2.4.2 Porosity
Porosity (or void fraction) has important effect on mass and heat transfer during
drying. In addition, it has a significant affect on the mechanical properties and quality of
solid foam products. Porosity ( ) is the ratio of gas (or air) volume ( ) inside the sample
to the whole sample volume ( ). By studying the change in porosity over time, we may
inter some information about the moisture migration behavior duting drying.
Scanning electron micrograph (SEM) images are taken to examine the
microstructure for the sintered un-cracked solid foams as shown in Figure 2. 15. These
images showe the morphology of the dried foams (distribution of pores or bubbles) and
the high porosity of the solid samples.
Sample porosity during drying is calculated using the following equation [75, 76]:
(2. 6)
The sample volume over time (V) is measured experimentally, see Figure 2. 14.
We use equation (2. 7) to calculate the air volume over time:
( ) (2. 7)
here is the volume of solid matrix (or solid particles used to prepare sample). We
calculate from the mass of fully dried foam sample (with neglecting the mass of air).

43
Figure 2. 15 Scanning electron micrograph (SEM) images of the sintered un-cracked
solid foams produced after drying the aqueous foams precursor for 24 h and then sintered
at 165 C.

44
To calculate the volume of solid matrix inside the sample, we use:
(2. 8)
where is the mass of the sample at the end of drying (i.e. fully dried) and is the
density of solid material (e.g. PVDF particles, 1.76 g/cm3).
Furthermore, is the volume of liquid (DI-Water and ethanol) used to prepare aqueos
foams. By measuring total sample mass over time, the liquid volume is calculated as:
(2. 9)
here is the mass and is the density of the liquid (DI-water and ethanol). Note that
the liquid mass over time is:
(2. 10)
As mentioned before, is the sample mass in real time which measured experimentally.
The sample porosity is increased over time due to the evaporation and drainage of
liquid as shown in Figure 2. 16. For example, the porosity of sample located over
superhydrophobic substrate is changed from 43 % at the begging (i.e. wet sample) to 79
% at the end (i.e. dry sample). For all un-cracked samples, the final porosity for dry

45
sample is around two times the initial porosity under different drying conditions, see
Figure 2. 16.(a) and Figure 2. 16. (b).
Generally, for all uncracked samples, the sample porosity depends on two parameters;
(1) The amount of air that is replaced by the liquid inside the sample (induced due
to the liquid evaporation).
(2) Ratio of sample shrinkage during drying induced by capillary stresses.
There are four periods marked on Figure 2. 16 (a). In the first period shows linear
increase in sample porosity that means the change in air volume inside the sample is
equivalent to the change in sample size (i.e. shrinkage). In the second period, the sample
porosity stays constant due to the domination of sample shrinkage (i.e. change in sample
size in this period is greater than the change in air volume). In the third period, the
porosity is increased sharply due to the expansion phenomenon that occurs in this period
(i.e. the sample is swelling during this period). Lastly, the porosity stays constant due to
the end of drying (i.e. fully dry sample during this period).
Generally, the change in sample porosity over time is not depends on the drying
conditions (i.e. initial sample thickness as well as substrate wettability and temperature)
as shown in Figure 2. 16 (a) and Figure 2. 16 (b). The results presented in these figures
show the high porosity of the dry foams that fabricated using foaming method. For all un-
cracked samples, the final porosity is around 0.83, which show a two-fold increase.

46
(a)
(b)
Figure 2. 16 Porosity change during drying for (a) samples with initial thickness of Z0 =
12.5 mm and initial diameter of D0 = 52 mm as well as substrates with 160, 95, and
30 and (b) samples with initial thickness of Z0 = 5 mm and initial diameter of D0 = 52
mm as well as substrates with 160 and temperature of T = 24 to 60 C. te is the end
of drying time.

47
2.4.3 Density
In this section, both bulk density and relative density are defined and studied in
details. The bulk density ( ) or apparent density is defined as the ratio of sample mass
to the sample volume and it can calculate as:
(2. 11)
where;
(2. 12)
(2. 13)
The air mass can be neglectedin compared to the solid and liquid fractions
( ). The bulk density is then:
(2. 14)
The relative density ( ) is the ratio of the foam density/bulk density ( ) to that
of the solid matrix ( ), it is calculated as [71]:
(2. 15)

48
This parameter provides information about the air content of porous structures.
The bulk density and relative density for sample located over superhydrophobic
substrate are changed from 1.47 g/cm3 and 0.82 for wet Pickering foams to 0.1 g/cm
3 and
0.07 , respectively for fully dry Pickering foams as shown in Figure 2. 17 (a). Moreover,
for the un-cracked sample, the final bulk density and relative density are around 0.1 g/cm3
and 0.07, respectively as shown in Figure 2. 17 and Figure 2. 18.
We can report from these figures that neither the sample size (i.e. sample
thickness) nor the substrate temperature and wettability influance the final density (i.e.
bulk density and relative density) of dry Pickering foams samples.

49
(a)
(b)
Figure 2. 17 Bulk density change during drying for (a) samples with initial thickness of
Z0 = 12.5 mm and initial diameter of D0 = 52 mm as well as substrates with 160,
95, and 30 and (b) samples with initial thickness of Z0 = 5 mm and initial diameter of
D0 = 52 mm as well as substrates with 160 and temperature of T = 24 to 60 C. te is
the end of drying time.

50
(a)
(b)
Figure 2. 18 Relative density change during drying for (a) samples with initial thickness
of Z0 = 12.5 mm and initial diameter of D0 = 52 mm as well as substrates with 160,
95, and 30 and (b) samples with initial thickness of Z0 = 5 mm and initial diameter of
D0 = 52 mm as well as substrates with 160 and temperature of T = 24 to 60 C. te is
the end of drying time.

51
2.5 Piezoelectric Coefficient
One of the most important properties of the Poly(vinylidene fluoride) porous
material is the piezoelectric properties [77-79]. Poly(vinylidene fluoride) (PVDF) is a
type of polymer that has wide applications in biomedical, chemical, electronic industries
due to the great properties of this polymer. PVDF has low density, high elasticity, fine
thermal stability and chemical resistance, on one hand as well as it is commercially
available with low cost. Furthermore, It is semi crystalline thermoplastic and
electroactive polymer and exists in the five different phases (, , , , , and β) [80].
PVDF in β phase has fined piezoelectric and dielectric constant due to its
biocompatibility and high flexibility makes it an interesting material [77-79].
Based on these properties, PVDF has more technical important; used as smart
materials (i.e. convert the mechanical energy to mechanical energy and vice versa) such
as actuator, transducers and sensors [79, 81, 82]. There are many methods used to form
PVDF in β phase, one method is formed by adding nanofillers such as multi-walled
carbon nanotubes (MWCNTs) and the other method is by mechanical stretching [80, 83,
84].
In this section, the piezoelectric coefficients of the sintered un-cracked samples
are measured and discussed.
The sintered un-cracked samples with different thickness are tested in this work.
A layer of 0.025 mm thick stainless steel foil tape was applied to each side to prevent
short circuits through the sample. A high electrical poling field is applied to the samples
by using a high voltage generator. The value of the voltage depends on the sample
thickness. The voltage is varied between 11 kV for the thinner sample to 18.5 kV for the

52
thicker sample. Samples are polled under the following conditions: substrate temperature
of (Tsb = 80 C), Frequency of (Freq = 110 Hz), dynamic force of (Fdy = 0.25 N), and
pooling time of (tp = 30 min).
Figure 2. 19 shows the Piezoelectric coefficients of samples before and after
poling, longitudinal piezoelectric coefficient (d33) and transverse piezoelectric coefficient
(d31). The piezoelectric coefficient of theun-poled sampes are seem similar. While, the
piezoelectric coefficient of the poled samples can be significantly higher than of the un-
poled samples. Also, we can see the the piezoelectric coefficient is dependent on the
pooling voltage.
For the longitudinal piezoelectric coefficient (d33), the increase in the
piezoelectric coefficient for lower pooling voltage is higher than the higher pooling
voltage. While, for the transverse piezoelectric coefficient (d31), the increase in the
piezoelectric coefficient for higher pooling voltage is higher than the lower pooling
voltage. The difference in the piezoelectric coefficients may due to the difference in the
voltage applied that used to pole the samples. Lastly, for all samples, the piezoelectric
coefficients for poled samples are increased if we compare with unpoled samples.

53
(a)
(b)
Figure 2. 19 Piezoelectric coefficients before and after poling for sintered un-cracked
samples with thickness of Z = 1.5 - 3 mm (a) longitudinal piezoelectric coefficient (d33)
and (b) transverse piezoelectric coefficient (d31). Poling voltage (11 kV for sample
thickness of Z = 1.5 mm, 13 kV for sample thickness of Z = 2.5 mm, 14.5 kV for sample
thickness of Z = 3 mm).

54
2.6 Summary
In summary, drying curves and change in dimensions of Pickering foams (or
composite foams) under different drying conditions are measured in this chapter. For all
cases, drying curves were performed in the falling rate period. The end of drying time is
found for all samples, where thicker samples as well as composite foams take longer time
to dry. On the contrary, by increasing the substrate temperature, the end of drying time is
decreased exponentially. Also, the wettability of substrate has not a strong effect on the
end of drying time. For all samples (Z0 = 2.5 – 12.5 mm) located on superhydrophobic
substrate, the change in sample dimension (i.e. diameter and thickness) are seem to
happen in a similar rate. While, in the case of samples located on PDMS and glass
substrates, the change in sample thickness is dominated. As the initial sample thickness
increases it seems that change in sample dimensions have similar trends. We reported that
the characterization of dry samples (e.g. density and porosity) do not depend on the initial
sample size and drying conditions. We calculated the change in volume, porosity, as well
as density (i.e. relative density and bulk density) of samples during aging based on
different drying conditions. We find that sample volume and density decrease over time,
while porosity increase during drying. Finally, the piezoelectric coefficient of all sintered
un-cracked samples are increased after poling.

55
Chapter 3
Effective Moisture Diffusivity
3.1 Introduction
To describe the drying process, we calculate the effective moisture diffusivity
(Deff) based on the collected drying data. For this, we use the method of the slope that is
derived based on the solution to the Fick’s second law of diffusion.
The assumption can be made that mass transfer resistance at the edges of the disk
is negligible and that moisture transfer is one dimensional in the Z-direction, see Figure
3. 1.
Figure 3. 1 Sample shape (not drawn to scale).
We use the data that we have collected beyond the first hour mark (when the mold is
removed) and thus assume that the moisture transfer is one-dimensional across the
sample thickness (Z-direction). The unsteady state Fick’s second law in cylindrical
coordinates is [34]:
(3. 1)

56
Where is the moisture concentration (kg/m3), is the mass (kg) of liquid used to
prepare the sample over the sample volume (m3), t is time (h), Deff is the effective
diffusivity (m2/h), a function of moisture concentration, and Z is the coordinate along the
sample thickness.
We can multiply both sides of equation (3. 1) by (1/Cs), where Cs is the solid
concentration (kg/m3):
(
)
(3. 2)
substituting:
(3. 3)
equation (3. 1) becomes:
(3. 4)
where X is the average moisture content (g liq./g dry solid). The average moisture content
is related to the measured sample mass during drying and can be calculated as
(3. 5)
where is liquid mass, is solid mass, and is the sample mass at any given time.
As mentioned before, two approaches were taken to estimate the Deff of Pickering
foams. In the first approach, the influence of sample shrinkage is neglected, while it is
included in the second one. In the next sections both approaches are presented in details.

57
3.2 Neglecteing Shrinkage
In this section, the effect of sample shrinkage on the effective diffusivity
calculation is neglected. The details of mathematical simplification of the governing
equation and the approach used to estimate the effective moisture diffusivity is presented
in the next steps.
3.2.1 Mathematical Simplification
Applying the initial and boundary conditions, equations (3. 6) – (3. 8), the
solution to equation (3. 4), assuming constant Deff and ignoring sample shrinkage, is
given by equation (3. 9) [34] (see Figure 3. 1, initial thickness is Z0)
(3. 6)
Fundamental Questions
(1) What is the effect of substrate wettability and temperature on the effective
moisture diffusivity during drying process?
(2) What is the effect of initial sample thickness and shape on the effective
diffusivity?
(3) Do MWCNTs concentration in composite foams (i.e. PVDF/MWCNTs) affect
the diffusivity over time.

58
(3. 7)
(3. 8)
∑
( )
( )
(3. 9)
where,
(3. 10)
here, W is the fractional average moisture content or dimensionless moisture content, X is
the average moisture content at any time, see equation (3. 5), Xe is the final average
moisture content and Xo is the initial average moisture content, both described as:
(3. 11)
(3. 12)
In equation (3. 11) is the final mass of liquid and is the mass of solid used to
prepare the sample (this quantity stays constant during aging). In equation (3. 12) is
the initial mass of liquid, the liquid used to prepare the sample.

59
In this work, , is equal to (we assumed that all liquid is evaporated during
drying process) for dry sample, and .
For long drying times, equation (3. 9) can be simplified by taking n = 0 to give:
(3. 13)
Taking the logarithm and subsequently the time derivative on both sides of equation (3.
13), we arrive at:
(3. 14)
By plotting versus time, we then calculate the effective diffusivity, Deff, as:
3.2.2 Moisture Transport
For un-cracked samples dried under different drying conditions (substrate
wettability, initial sample thiacknes, and substrate temperature), the change in the average
moisture content, equation.(3. 5), and fractional average moisture content, equation (3.
10), are plotted over time in Figure 3. 2 and Figure 3. 3. For all investigated drying,
fractional moisture content is normalized by the change in the sample moisture content
and varies between one and zero (for fully dried sample with no bound water).
(
) ( ) (3. 15)

60
(a)
(b)
Figure 3. 2 (a) Average moisture content and (b) fractional average moisture content for
samples with initial thickness of Z0 = 12.5 mm and initial diameter of D0 = 52 mm as well
as substrates with 30, 95, and 160.

61
(a)
(b)
Figure 3. 3 (a) Average moisture content and (b) fractional average moisture content for
samples with initial thickness of Z0 = 5 mm and initial diameter of D0 = 52 mm as well as
substrate with 160 and temperature of T = 24 to 60 C.

62
3.2.3 Effective Moisture Diffusivity
We employ method of slope to calculate the effective moisture diffusivities of the
drying samples. As expected, we note that the effective moisture diffusivity vary with the
average moisture content of the samples as shown in Figure 3. 4.
The effective moisture diffusivity increases with a decrease in average moisture
content for all the experimental cases. This maybe due to changes in the sample
morphology and structure during drying. For instance, the sample permeability at the
beginning is close to zero but increases with time as the excess liquid leaves the sample.
The increase in permeability may cause to increase in the effective moisture diffusivity
during aging. Previous studies with different systems (e.g. some type of food) focused on
the effective moisture diffusivity behavior during drying also found similar behaviors of
results [30, 85-88].
As substrate temperature increased, the drying time decreased exponentially due
to higher evaporation rate. As shown in Figure 3. 4 (b), the substrate temperature playes a
role to increase the values of effective moisture diffusivity (or modified effective
moisture diffusivity) due to the increase in evaporation rate during drying process. See
appendix B for diffusivity curves.

63
(a)
(b)
Figure 3. 4 Effective moisture diffusivity for (a) samples with initial thickness of Z0 =
5.0 to 12.5 mm and initial diameter of D0 = 52 mm as well as substrates with 30, 95,
and 160 and (b) samples with initial thickness of Z0 = 5 mm and initial diameter of D0 =
52 mm as well as substrates with 160 and temperature of T = 24 to 60 C. The first
number in the parenthesis is initial sample thickness in mm and the second number is
substrate contact angle in degree.

64
3.3 Including Shrinkage
In this section, consider the effect of samples shrinkage on the effective moisture
diffusivity during drying processe. In this approach we include the sample volume in real
time when estimate effective moisture diffusivity of Pickering foams. The new effective
moisture diffusivity is called modified effective moisture diffusivity. We compare between
the values of effective moisture diffusivity (i.e. shrinkage neglected) and modified
effective moisture diffusivity (i.e. shrinkage included) in the next section.
3.3.1 Mathematical Simplification
To include the effect of sample shrinkage during drying on effective moisture
diffusivity, both sides of equation (3. 4) are multiplied by the density of the dry solid ( )
[40-46]:
( )
( )
(3. 16)
where Deff,m is the modified effective moisture diffusivity. For constant mass of dry solid,
is replaced by:
(3. 17)

65
so equation (3. 16) becomes
( )
(( ) )
(3. 18)
In this equation, is the mass of solid material used to prepare the sample and it is
constant during the drying process. Eliminate from both sides of equation (3. 18):
( )
( )
(3. 19)
We show that the change in sample volume ( ) is linear over time, see Figure 3. 5, so we
can assume:
(3. 20)
so equation (3. 19) becomes:
We defined the following parameters:
( )
(3. 21)

66
(3. 22)
(3. 23)
here, Y is the modified average moisture content (g liquid / g dry solid .m3) at any time,
Ye is the final average modified moisture content (in this study Ye = 0), Y0 is the initial
modified moisture content, V is the volume of the sample (m3) at any time, and Ve and V0
are the final and initial sample volume respectively.
Solve this along with the modified initial and boundary conditions, equations (3. 24) - (3.
26), we get equation (3. 27):
(3. 24)
(3. 25)
(3. 26)
∑
( )
( )
(3. 27)
where;
(3. 28)

67
here, M is the modified fractional average moisture content or dimensionless modified
average moisture content that varies as 0 ≤ M ≤ 1.
To simplify equation (3. 28), for long drying times we can set n = 0 and get:
(3. 29)
By taking the logarithm for the both sides of equation (3. 29), arrive at equation (3. 30)
(3. 30)
By taking the time derivative of both sides of equation (3. 30), one finally obtains to
equation (3. 31)
(3. 31)
Once again, by plotting versus drying time and by using the method of slope
is calculated as
(
) ( ) (3. 32)

68
3.3.2 Modified Moisture Transport
Figure 3. 5 shows the relation between the foam volume and average moisture
content during drying process. As mentioned in chapter two, there are two linear slopes,
during the falling rate period, the second linear slope is higher than the first linear slope
due to the increase in the capillary stress. This figure shows the validity of the assumption
between the foam volume and average moisture content, see equation (3. 20).
By using equation (3. 20) and equation (3. 28), the modified average moisture
content and modified fractional average moisture content values are calculated and
plotted against the drying time as shown in Figure 3. 6 and Figure 3. 7.
We can see from these figures that both the modified average moisture content
and modified fractional average moisture content are decreased linearly under all drying
conditions (i.e initial sample thickness, substrate wettability, and substrate temperature)..

69
(a)
(b)
Figure 3. 5 Volume change versus average moisture content during drying for (a)
samples with initial thickness of Z0 = 12.5 mm and initial diameter of D0 = 52 mm as well
as substrates with 160, 95, and 30 and (b) samples with initial thickness of Z0 = 5
mm and initial diameter of D0 = 52 mm as well as substrates with 160 and
temperature of T = 24 to 60 C.

70
(a)
(b)
Figure 3. 6 (a) Modified average moisture content and (b) modified fractional average
moisture content for samples with initial thickness of Z0 = 12.5 mm and initial diameter
of D0 = 52 mm as well as substrates with 30, 95, and 160.

71
(a)
(b)
Figure 3. 7 (a) Modified average moisture content and (b) modified fractional average
moisture content for samples with initial thickness of Z0 = 5 mm and initial diameter of
D0 = 52 mm as well as substrates with 160 and temperature of T = 24 - 60 C.

72
3.3.3 Modified Effective Moisture Diffusivity
As illuminated in Figure 3. 8, for samples with initial sample thickness of Z0 = 5 -
12.5, substrate wettability of 30 to 160 , and substarte temperature of T = 24 – 60
C, the modified effective moisture diffusivity increases with a decrease in the average
moisture content. The change in mofified effective diffusivity is seems similar to the
change in effective moisture diffusivity during drying process. In the next section. We
calculate the difference between these values over time so we can study the effect of
including on neglecting the foam shrinkage on the effective diffusivity during the drying
process. See appendix B for diffusivity curves.
3.4 Effective Moisture Diffusivity Behavior
In this section, the effect of sample shrinkage, initial sample thickness as well as
substrate wettability and temperature on the effective moisture diffusivity over time are
presented in details. Also, the non-dimensional parameters are found and plotted for
different cases of drying.
3.4.1 Shrinkage Influence
To study the effect of sample shrinkage on the effective moisture diffusivity
during drying, the difference between the effective moisture diffusivity (Deff) and
modified effective moisture diffusivity (Deff,m) is calculated as shown in Figure 3. 9. At
the first period of drying, the difference between Deff and Deff,m is negligible, but increases
at the second period. The reason for this increase is the higher shrinkage in sample
volume during this period, see Figure 2. 14 (a). Based on this plot, shrinkage should be
considered towards the end of drying curve.

73
(a)
(b)
Figure 3. 8 Modified effective moisture diffusivity for (a) samples with initial thickness
of Z0 = 5.0 to 12.5 mm and initial diameter of D0 = 52 mm as well as substrates with
30, 95, and 160 and (b) samples with initial thickness of Z0 = 5 mm and initial
diameter of D0 = 52 mm as well as substrates with 160 and temperature of T = 24 –
60 C. The first number in the parenthesis is initial sample thickness in mm and the
second number is substrate contact angle in degree.

74
Figure 3. 9 The difference between effective moisture diffusivity and modified
effective moisture diffusivity during drying for samples with initial thickness of Z0
= 12.5 mm and initial diameter of D0 = 52 mm as well as substrates with 30,
95, and 160. te is the end of drying time.

75
3.4.2 Sample Thickness as well as Substrate Wettability and Temperature
From equation (3. 15), we can note that effective moisture diffusivity is depended
on two parameters:
(1) The size of sample (i.e. thickness);
(2) Slope of drying curve (i.e. drying conditions).
To show the effect of substrate wettability on the effective moisture diffusivity
values, the average effective moisture diffusivity (Deff)avg is calculated by taking the
mathematical mean of Deff. As shown in Figure 3. 10 (a), for different wettability of
substrates, the difference between the average effective moisture diffusivity values is not
clear. For low initial sample thickness, average effective moisture diffusivity for all cases
are close. While for higher initial thickness, there is some difference between the values
of the average effective moisture diffusivities.
Generally, we can conclude from this figure that the value of average effective moisture
diffusivity for Pickering foams system do not depend strongly on the substrate
wettability, especially for smaller sample size (i.e. Z0 = 5 mm).
Figure 3. 10 (b) showed that (Deff)avg increases linearly as substrate temperature
increases.
76
(a)
(b)
Figure 3. 10 Average effective moisture diffusivity (a) for samples with initial thickness
of Z0 = 5.0 to 12.5 mm and initial diameter of D0 = 52 mm as well as substrates with
30, 95, and 160 and (b) for samples with initial thickness of Z0 = 5 mm and initial
diameter of D0 = 52 mm as well as substrates with 160 and temperature of T = 24 -
60 C.

77
3.4.3 Non Dimensional Form
We non-dimensionalized the effective moisture diffusivities for all samples under
different drying conditions by noting the available groups in equations (3. 10) and (3. 28).
We define the Fourier number of diffusion ( ) and modified Fourier number of diffusion
( ) as [89, 90]:
(3. 33)
(3. 34)
here Z is sample thickness at any time. As demonstrated in Figure 3.11and Figure 3.12,
for all the trial under different drying conditions, we see that the diffusivity curves
collapse on a master curve. Also, we note from these figures that the value of Fourier
number of diffusion is increased as fractional average moisture content/modified
fractional average moisture content decrease. See appendix B for more cases of non-
dimensional diffusivities.

78
(a)
(b)
Figure 3.11 Non-dimensionalized form for liquid diffusion in Pickering foam for
samples with initial thickness of Z0 = 5.0 - 12.5 mm and initial diameter of D0 = 52 mm
as well as substrates with 30, 95, and 160 (a) Fourier number of diffusion vs.
fractional average moisture content and (b) Modified Fourier number of diffusion vs.
modified fractional average moisture content. The first number in the parenthesis is initial
sample thickness in mm and the second number is substrate contact angle in degree.

79
(a)
(b)
Figure 3.12 Non-dimensionalized form for liquid diffusion in Pickering foam for
samples with initial thickness of Z0 = 5 mm and initial diameter of D0 = 52 mm as well as
substrates with 160 and temperature of T = 24 – 60 C (a) Fourier number of
diffusion vs. fractional average moisture content and (b) Modified Fourier number of
diffusion vs. modified fractional average moisture content.

80
3.5 Summary
In conclusions, using the drying curves and by employing the method of slope, the
effective moisture diffusivity and modified effective moisture diffusivity are estimated as
a function of average moisture content. The difference between these diffusivities is
calculated then discussed in this chapter. We recommend to include the effect of sample
shrinkage on the effective moisture diffusivity calculation of Pickering foams during the
drying process under all drying conditions. The value of effective moisture diffusivity is
decreased as average moisture content increase due to the change in sample morphology
(porosity). Both initial sample thickness and substrate temperature influence the values of
average effective moisture diffusivity. As initial sample thickness and substrate
temperature increase, the effective moisture diffusivity and modified effective moisture
diffusivity are increased too. In other hand, neither sample shape nor MWCNTs
concentration are not effected strongly on the effective moisture diffusivity or modified
effective moisture diffusivity. Finally, we non-dimensionalized the diffusivities and
showed that diffusivities collapsed on a master curve under all drying conditions.

81
Chapter 4
Crack Formation
4.1 Introduction
Pickering foams, as well as most of multiphase porous materials, are likely to
deform (or shrink) during drying process. This phenomenon sometime leads to samples
crack (or fragment) over time. The probability of crack formation depends on the drying
conditions (i.e. drying rate), substrate wettability, and on the mechanical properties of
sample. In Pickering foams system, the change in sample volume during drying is
depended on the values of adhesive force and cohesive force, which force is dominate.
These forces can be viewed in more detail.
Adhesive force is an interface characteristic between external substrate and
sample particles [61]. This force prevents samples shrinkage through drying processes
(resist capillary stress). The value of adhesive force is depended on the contact area
between sample and substrate. Lower substrate wettability value (higher contact area
between sample and substrate) leads to higher adhesion force value and vice versa.
However, cohesive force is an interior characteristic between sample particles. This force
causes sample shrinkage during drying processes. To get dry sample with no crack, the
adhesive force should be less than the cohesive force as shown in Figure 4. 1.

82
Wenzel State Cassie State
(a) (b)
Figure 4. 1 Schematic illustration of Pickering foam aging at (a) high adhesive force
hydrophilic substrate (glass), in this case the value of adhesive force is greater than the
cohesive force and (b) low adhesive force super hydrophobic substrate (modified glass),
in this case the adhesive force is less than the cohesive force.

83
As shown in Figure 4. 1 (a), the liquid-solid-gas triple contact line is pinned so
the adhesive force between sample and substrate, which is glass in this case, is higher
than the cohesive force. As aresults, the crack is appeared on the upper surface.
Obviously, it is noted that sample edge is hold/stacked with the substrate over time. On
the contrary, the liquid-solid-gas triple contact line is receding, see Figure 4. 1 (b), so the
adhesive force between sample and substrate (which is modified glass in this case) is less
than the cohesive force. As a result, no crack occurs on the upper surface of sample. We
can note how the edge is hold/stacked and substrate (which is modified glass in this case)
is less than the cohesive force. This case called Cassie state [91]. As a result, no crack is
occurs on the upper surface of sample. Obviously, we can note how the edge of sample is
moves freely over time. The value of cohesive force depends on the capillary pressure
between the particles inside the sample. One can calculate the magnitude of capillary
pressure between any two particles by using the following equation [66, 92, 93]:
(4. 1)
In equation (4. 1) is the capillary pressure is the surface tension between the
liquid and gas, and rm is the radius of nanomenisci curvature between solid particles. We
can calculate the minimum radius of nanomenisci through drying from the following
equation [94]:
(4. 2)

84
In above equation is the radius of particle. By using the previous equations, we can
calculate the maximum value of capillary pressure to be around -77 atm., particle
diameter of 250 nm. The negative sign means the direction of capillary pressure is
inward, this causing shrinkage.
Figure 4. 2 shows the nanomenisci radius evolution during drying, where it
decreases as drying time increases. At the beginning, the nanomenisci shape looks flat,
low capillary pressure, but after short period it starts to deform due to evaporation,
capillary stress starts increase due to the decrease in the radius of menisci. Furthermore,
the of initial sample thickness influences the volume change of aqueous foam. Capillary
force depends on the sample thickness (cross section area) [64, 95, 96] so thicker samples
give higher capillary forces.
Fundamental Questions
(1) What is the effect of substrate wettability and temperature on the crack
formation in samples during drying process?
(2) What is the effect of initial sample thickness and shape on crack pattern?
(3) Do MWCNTs prevent crack formation in composite foams (i.e.
PVDF/MWCNTs).

85
(a)
(b)
(c)
Figure 4. 2 The evolution in nanomenisci shape during drying of Pickering foam: (a)
fully wet, (b) partially wet, and (c) almost dry.

86
4.2 Crack Formation
The effects of initial sample thickness and shape, substrate wettability and
temperature, and MWCNTs concentration on crack formation is presented in this section.
4.2.1 Substrate Wettability
Figure 4. 3 demonstrates the sequence of drying for an initial sample thickness of
5 mm on three different substrates. As drying proceeds, cracks began to appear in some
samples and spread outward to the edge. We note that as substrate wettability decreases,
crack formation is prohibited. This means that samples drying on superhydrophobic
substrates remain crack-free; an important feature from a manufacturing point of view. A
superhydrophobic substrate has low surface energy (i.e. weak adhesive interactions) and
as such can relax the capillary-induced stresses as they form during the drying. On the
contrary, a hydrophilic substrate facilitates adhesion between the sample and the
substrate; the resulting capillary-induced stresses therefore cannot get relaxed. When
such stresses overcome the mechanical integrity of the samples, cracks are formed and
propagate.

87
t = 0 h
t = 1 h
t = 13 h
t = 16 h
t = 24 h
(a) (b) (c)
Figure 4. 3 The effect of substrate wettability on the crack formation behavior of sample with
initial thickness of Z0 = 5 mm and initial diameter of D0 = 52 mm as well as substrates with: (a)
30, (b) 95, and (c) 160. Each point contains a portion of the side-view (left) and
top-view (right) of the sample. Scale bar is 10 mm.

88
4.2.2 Substrate Temperature
To examine the effect of drying rate on the probability of cracking during drying
process, five different temperatures were tested in this study as shown in Figure 4. 4, see
appendix B. Increasing the substrate temperature reduces crack density as well as the
required time for samples to reach the end of drying.
Figure 4. 5 (a) shows the final crack pattern for 5 mm initial thick sample and 52
mm initial diameter for five different temperaturs. Coresponding drying curves are shown
in Figure 4. 5 (b). An interesting observation is that the point where cracks occurs begin
to form happens at the same value of fractional average moisture content for all cases
irresptive of substrate temperature.

89
t = 0 h
t = 0.5 h
t = 16:30 h t = 2:40 h t = 1:20 h
t = 17 h t = 2:50 h t = 1:25 h
t = 20 h t = 4:30 h t = 2 h
(a) (b) (c)
Figure 4. 4 The effect of substrate temperature on the crack formation behavior of sample
with initial thickness of Z0 = 5 mm and initial diameter of D0 = 52 mm as well as substrate
with 30 and temperature of: (a) T = 24 C, (b) T = 40 C, and (c) T = 60 C. Each
picture contains a portion of the side-view (left) and top-view (right) of the sample. Scale
bar is 10 mm.

90
T = 24 C
T = 30 C
T = 40C
T = 50 C
T = 60 C
(a)
(b)
Figure 4. 5 (a) Final crack patterns for sample with initial thickness of Z0 = 5 mm and
initial diameter of D0 = 52 mm as well as substrate with 95 (i.e. PDMS) and
temperature of T = 24 – 60 C and (b) drying curves for samples on five different
temperaures. As shown, crack begins at same fractional averge moisture content.

91
4.2.3 Sample Thickness
For three substrates types and six initial sample thicknesses, crack formation
depends on the substrate wettability and the initial sample thickness as demonstrated in
Figure 4. 6. Under the given drying conditions (chamber temperature of 22 ± 1C and
relative humidity of 46 ± 5 %), there seems to be an initial sample thickness after which
visible cracks are not formed. In addition, like those shown in Figure 4. 7, cracked
samples become fragmented on hydrophilic and partially hydrophobic substrates,
resulting in faster drying times.
We also note that there exists a deposition of unbounded particles on some
substrates (see Figure 4. 3 θ 30) due to gravity-induced drainage. Simply put, not all
the particles may find the opportunity to adsorb at the liquid-gas interfaces during the
foaming process. The un-adsorbed particles remain suspended in the liquid film between
neighboring bubbles and in Plateau borders and get deposited on the substrate as they
leave the foam along with the excess drained liquid. Such particle deposited residue is
absent for the superhydrophobic substrate, since drained liquid is forced to remain
contained inside the sample.
As a predictive tool, we have determined the time when the initial crack begins to
appear as a function of sample thickness as shown in Figure 4. 7. The data shows a linear
trend for the hydrophilic and partially hydrophobic substrates, which may suggest (given
possible measurement errors) that the crack initiation time is independent of the substrate
type.

92
(Z0 = 2.5 mm & 30)
(2.5 mm, 95)
(2.5 mm, 160)
(3.25 mm, 30)
(3.25 mm, 95)
(3.25 mm, 160)
(5 mm, 30)
(5 mm, 95)
(5 mm, 160)
(7.5 mm, 30)
(7.5 mm, 95)
(7.5 mm, 160)
(10 mm, 30)
(10 mm, 95)
(10 mm, 160)
(12.5mm, 30)
(12.5 mm, 95)
(12.5 mm, 160)
Figure 4. 6 The effect of contact angle and initial sample thickness on the crack
behavior of samples at the end of drying. Each picture contains a portion of the side-
view (left) and top-view (right) of the sample. Scale bar is 10 mm.

93
Figure 4. 7 Initial crack formation time versus initial sample thickness of Z0 = 2.5 - 10
mm and initial diameter of D0 = 52 mm as well as substrates with 30 and 95.

94
4.2.4 Sample Shape
To examine the effect of sample shape on crack formation during drying process,
three different shapes were examined in this study as shown in Figure 4. 8. The surface
area of all samples is equal. The dimension of samples are: circle with thickness of Z0 = 5
mm and diameter of D0 = 34 mm, square with thickness of Z0 = 5 mm and length of L0 =
30.13 mm, and triangle with thickness of Z0 = 5 mm and base of B0 = 45.79 mm and
height of H0 = 39.66 mm. all samples are dried at laborotary conditions.
Our observations show that cracks in square and triangle extend to the sides. This
is surprising as sharp corners are usually the source of stress concentrations. We also note
that cracks in square sample begin sooner than other shapes.
Two points of interest are marked in Figure 4. 9. The first point shows where the
crack begins for samples with different shapes. The second point of interest shows that
crack starts around at the same value of fractional average moisture content for all tests.
That means the probability of sample cracking does not depend on the sample shape. See
Appendix C for more cases of drying conditions.

95
t = 0 h
t = 0.5 h
t = 5 h
t = 9 h
t = 23 h
(a) (b) (c)
Figure 4. 8 The effect of sample shapes on the crack formation behavior of sample with
initial thickness of Z0 = 5.0 mm and substrates with 30 and temperature of: (a)
square, (b) triangle, and (c) circle. Each picture contains a portion of the side-view
(right) and top-view (lift) of the sample. The surface area of all samples is equal. The
initial dimension of samples are: circle with diameter of D0 = 34 mm, square with length
of L0 = 30.13 mm, and triangle with base of B0 = 45.79 mm and height of H0 = 39.66 mm.
Scale bar is 10 mm.

96
Square Triangle Circle
(a)
(b)
Figure 4. 9 (a) Final crack patterns in sample of initial thickness Z0 = 5 mm with different
shape located over PDMS substrate (i.e. 95 ) and (b) drying curves for three different
shapes. Note that cracks initiaton happens at the same fractional average moisture content
for all three shapes.

97
4.2.5 Composite PVDF/MWCNTs Foams
To examine the effect of multi-walled carbon nanotubes concentration (CMWCNTs)
on the probability of crack density (or pattern) during drying process, three different
concentrations of MWCNTs are selected in this study. As shown in Figure 4. 10, the
crack density is increased as MWCMTs concentration increase. The increase in crack
density maybe due to the increase in the viscosity of the suspension. The increase in the
suspension viscosity results in increase of the adhesion between the sample and substrate
so the probability of the crack is increased. That means the probability of sample
cracking depends strongly on the concentration of the MWCNTs. Also, a previous studies
found that increasing the concentration of MWCNTs decreases the mechanical strength
of the sample due to the lack of adequate PVDF-MWCNTs bonding [71].
Two points of interest are marked in Figure 4. 11. The first point shows where
crack begins for samples with different concentration of multi walled carbon nano tubes.
The second point shows as MWCNTs concentration increase the crack initiate early
during drying process. The crack begins at fractional average moisture content around 0.1
in the case of lower concentration (i.e. CMWCNTs = 0 % v/v), while the crack begins at
fractional average moisture content around 0.2 in the case of higher concentration (i.e.
CMWCNTs = 0.5 % v/v). See Appendix C for more experiments.

98
t = 0 h
t = 0 h
t = 10:00 h
t = 17 h
t = 30 h
(a) (b) (c) (d)
Figure 4. 10 The effect of MWCNTs concentration on the crack formation behavior of
sample with initial thickness of Z0 = 5 mm and initial diameter of D0 = 52 mm as well as
substrates with 160 at: (a) CMWCNTs = 0 % v/v, (b) CMWCNTs = 0.1 % v/v, (c) CMWCNTs
= 0.3 % v/v, and (d) CMWCNTs = 0.5 % v/v. Each picture contains a portion of the side-
view (right) and top-view (left) of the sample. Scale bar is 10 mm.

99
CMWCNTs = 0 % v/v CMWCNTs = 0.1 % v/v CMWCNTs = 0.3 % v/v CMWCNTs = 0.5 % v/v
(a)
(b)
Figure 4. 11 (a) Final crack patterns in sample with initial thickness of Z0 = 5 mm and
initial diameter of D0 = 52 mm as well as substrate with 95 (i.e. PDMS) and various
MWCNTs concentration of CMWCNTs = 0 – 0.5 % (b) drying curves for four different
concentration of MWCNTs. Note that cracks initiaton happens at the different fractional
average moisture content.

100
Scanning electron microgarph (SEM) images for PVDF foams and
PVDF/MWCNTs composite foams are shown in Figure 4. 12. The effect of MWCNTs on
the morphology of the sample is evident. Firstly, adding MWCNTs cause defects on the
walls of the bubbles. Secondly, they result in change in bubble size. Average bubble
diameter goes from around 80 m for samples with no MWCNTs (i.e. PVDF foams)to
around 40 m for those with MWCNTs (i.e. PVDF/MWCNTs composite foams).
(a) (b)
Figure 4. 12 Scanning electron micrograph (SEM) images taken of the sintered (a) un-
cracked solid foams and (b) cracked solid composite foams with MWCNTs (CMWCNTs =
0.3 % v/v). These samples are dried over superhydrophobic substrate (i.e. 160).

101
4.3 Summary
Dry porous PVDF particle stabilized foams with no cracks (or defect) have been
produced by tuning the hydrophobicity of substrate, initial sample thickness, and
controlling drying conditions (or drying rate). By keeping the cohesion force of Pickering
foam samples greater than the adhesion force, the creation of crack (or defects) in
samples are decrease. In this work also, we have been reported that dry samples with no
crack can produce by using low-adhesive superhydrophobic substrate (i.e. modified
glass). The critical cracking thickness (CCT) for samples located on both PDMS and
glass substrates have been found (CCT = 12.5 mm). Loading MWCNTs with different
concentration increase the crack formation for all types of substrates. Where, the crack
formation increases as MWCNTs concentrations increase, as well. Finally both sample
shape and substrate temperature have not prevented crack formation during drying
drocess but they influence crack pattern.

102
Chapter 5
Conclusions
5.1 Conclusions
The drying curves as well as the required drying time (i.e. end of drying point) are
determined for Pickering foams samples under all drying conditions. In addition, the
evaluation in Pickering foams size during drying is investigated. Generally, the Pickering
foams have three steps during drying: reduction, expansion, and no change. By utilizing
from the drying curves and sample volume, the effective moisture diffusivity and
modified effective moisture diffusivity were estimated as a function of average moisture
content (method of slope is used in this work). Where, the values of effective moisture
diffusivity and modified effective moisture diffusivity are increased as average moisture
content decrease due to the change in sample morphology such as porosity. Both initial
sample thickness and substrate temperature result to increase the values of effective
moisture diffusivity. While sample shape and multi-walled carbon nanotubes have not
srong effect on the effective moisture diffusivity. We have been recommended include
the sample shrinkage effect on the effective moisture diffusivity calculation during drying
for Pickering foams system under all drying conditions. In conclusions, highly porous
(i.e. low weight) PVDF particle stabilized foams with no crack (or defects) have been
produced by tuning the hydrophobicity of substrate (i.e. contact angle), on one hand and
controlling drying rates (i.e. substrate temperature) and adding MWCNTs have not

103
prevented this problem, on the other hand. By keeping the strength of Pickering foam
samples less than the drying stress, the creation of crack in samples is decreased. Finally,
we have been reported that dry samples with no crack can be manufacturing by using
low-adhesive superhydrophobic substrate.
The research presented in this thesis is unique in that for the first time, to
the best of our knowledge, effective moisture diffusivity is reported for drying
of particle-stabilized foams. Such data can be used to numerically model this
process which is currently unavailable in the literature. Combination of
predictive models along with experimental values will enable design and
fabrication of low-density/high-porosity porous materials using Pickering foam
as precursor. This manufacturing approach is environmentally friendly, cost-
effective, and does not require complex equipment and trained personnel.
Crack formation is a by-product of drying in many systems including the one
we have investigated here, and they are detrimental to the integrity of the final
product. In this thesis, we have presented a detailed investigation to understand
and prevent crack-formation in dried Pickering foams. We show that substrate
wettability plays an important role in relaxing the capillary-induced stresses
that are responsible for crack formation. A superhydrophobic substrate prevents
crack formation for a wide range of of initial foam thickness but causes the
samples to undergo largest radial shrinkage. Other investigated parameters,
such as substrate temperature and including nanofillers, influenced crack

104
pattern (density) but could not prohibit their formation.This dissertation shed
some light on the complex transport phenomena during drying of Pickering
foams. We hope that our findings ignite an interest in the scientific community
to continue investigating the fascinating physics of drying and aging in relevant
systems.
5.2 Future Work
Exploring the influence of initial sample porosity on drying kinetics as well as
crack formation behavior.
Studying the effect of introducing functional multi-walled carbon nanotubes
(FMWCNTs) on the drying kinetics and crack formation in Pickering foams.
Predict numerically the concentration of moisture content inside the foams
during the drying process by utilizing from the exist results (e.g. effective
moisture diffusivity, average moisture content.

105
Appendix A
Drying Conditions
(a)
(b)
Figure A. 1 The drying conditions for samples with initial thickness of Z0 = 5 mm and
initial diameter of D0 = 52 mm as well as substrates with 160, 95, and 30 (a)
temperature (T) and (b) relative humidity ().
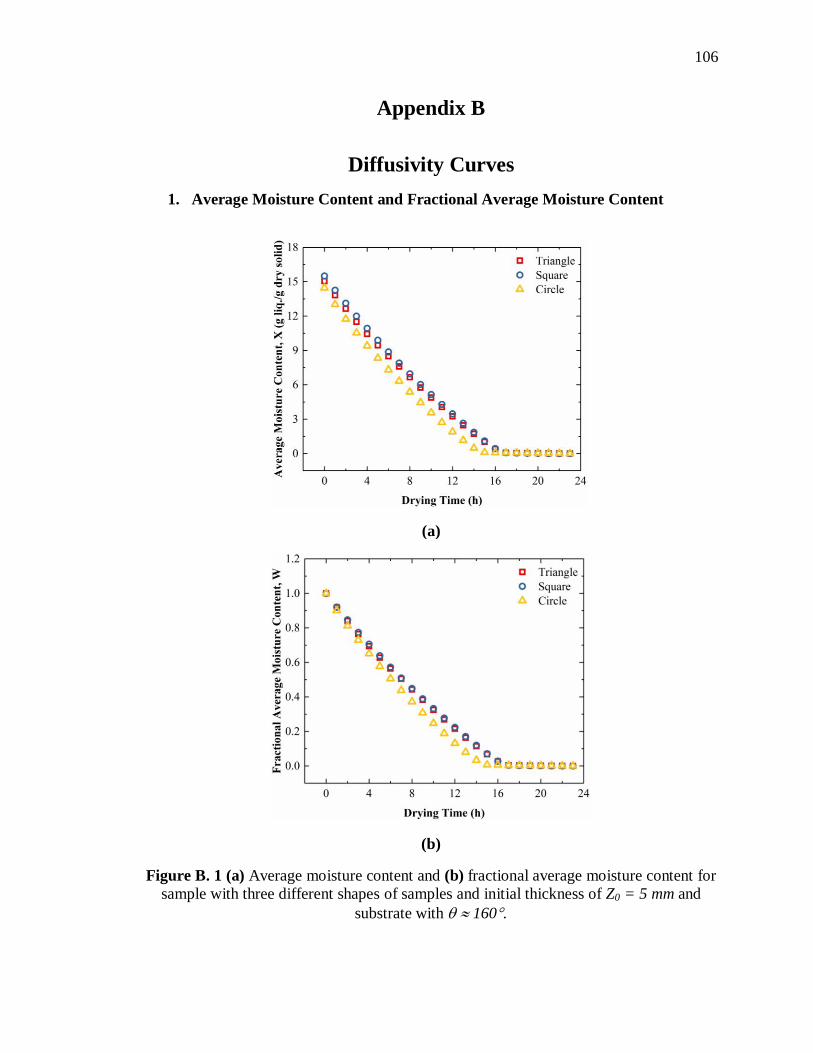
106
Appendix B
Diffusivity Curves
1. Average Moisture Content and Fractional Average Moisture Content
(a)
(b)
Figure B. 1 (a) Average moisture content and (b) fractional average moisture content for
sample with three different shapes of samples and initial thickness of Z0 = 5 mm and
substrate with 160.

107
(a)
(b)
Figure B. 2 (a) Average moisture content and (b) fractional average moisture content for
samples with initial thickness of Z0 = 5 mm and initial diameter of D0 = 52 mm as well as
MWCNTs concentration of CMWCNTs = 0 – 0.5 % v/v on substrates with 160.

108
2. Effective Moisture Diffusivity
(a)
(b)
Figure B. 3 (a) Effective moisture diffusivity and (b) modified effective moisture
diffusivity for samples with initial thickness of Z0 = 5.0 mm and three different shapes
and substrates with 160.

109
(a)
(b)
Figure B. 4 (a) Effective moisture diffusivity and (b) modified effective moisture
diffusivity for samples with initial thickness of Z0 = 5 mm and initial diameter of D0 = 52
mm as well as different MWCNTs concentration of CMWCNTs = 0.0 – 0.5 % v/v and
substrates with 160.

110
3. Non-Dimensional Curves
(a)
(b)
Figure B. 5 Non-dimensionalized form for liquid diffusion in Pickering foam for samples
with initial thickness of Z0 = 5 mm and initial diameter of D0 = 52 mm as well as three
shapes and substrates with 160,. (a) Fourier number of diffusion vs. modified
fractional average moisture content and (b) Modified Fourier number of diffusion vs.
modified fractional average moisture content. The surface area of all sample are equal.
The initial dimension of samples are: circle with diameter of D0 = 34 mm, square with
length of L0 = 30.13 mm, and triangle with base of B0 = 45.79 mm and height of H0 =
39.66 mm.
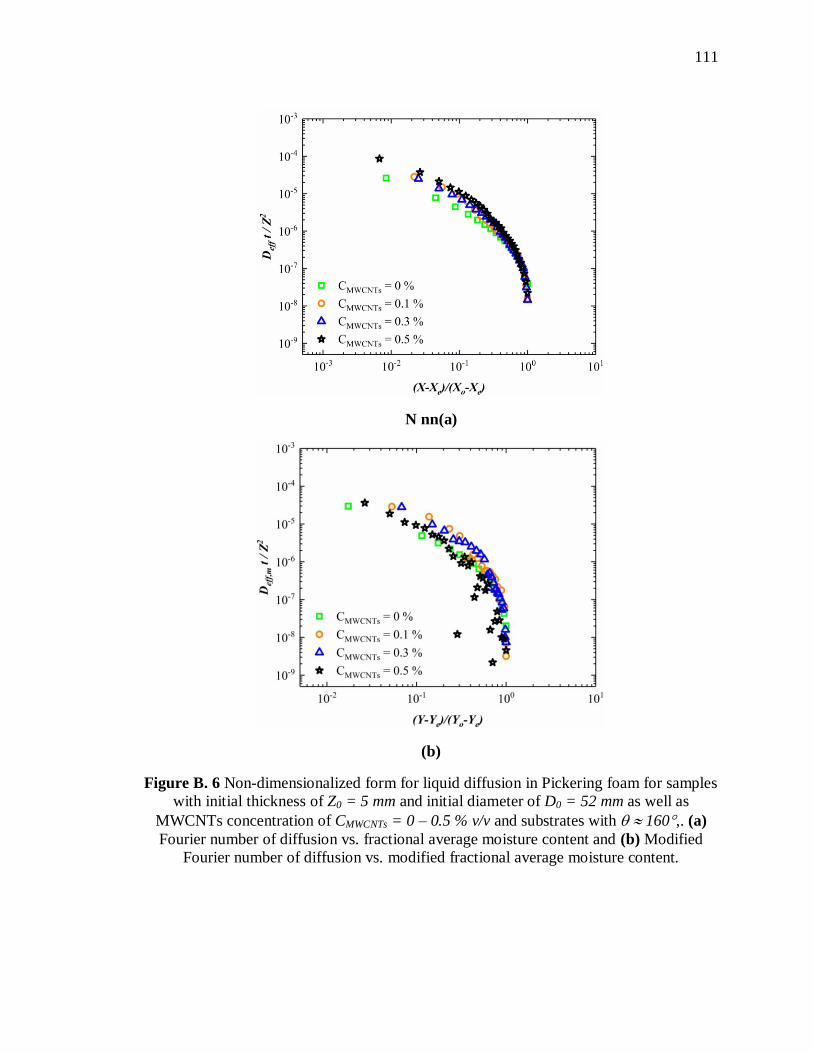
111
N nn(a)
(b)
Figure B. 6 Non-dimensionalized form for liquid diffusion in Pickering foam for samples
with initial thickness of Z0 = 5 mm and initial diameter of D0 = 52 mm as well as
MWCNTs concentration of CMWCNTs = 0 – 0.5 % v/v and substrates with 160,. (a)
Fourier number of diffusion vs. fractional average moisture content and (b) Modified
Fourier number of diffusion vs. modified fractional average moisture content.

112
Appendix C
Crack Formation
1. Initial Sample Thickness
t = 0 h
t = 1 h
t = 17 h
t = 18 h
t = 28 h
(a) (b) (c)
Figure C. 1 The effect of substrate wettability on the crack formation behavior of samples with
initial thickness of Z0 = 7.5 mm and substrate of: (a) 30, (b) 95, and (c) 160. Each
picture contains a portion of the side-view (left) and top-view (right) of the sample. Scale bar is
10 mm.

113
t = 0 h
t = 1 h
t = 19 h
t = 20 h
t = 30 h
(a) (b) (c)
Figure C. 2 The effect of substrate wettability on the crack formation behavior of samples with
initial thickness of Z0 = 10 mm and initial diameter of D0 = 52 mm as well as substrate of: (a)
30, (b) 95, and (c) 160. Each picture contains a portion of the side-view (left) and
top-view (right) of the sample. Scale bar is 10 mm.
t = 0 h

114
2. Substrate Temperature
t = 1 h
t = 25 h
t = 30 h
t = 39 h
(a) (b) (c)
Figure C. 3 The effect of substrate wettability on the crack formation behavior of samples with
initial thickness of Z0 = 12.5 mm and initial diameter of D0 = 52 mm as well as substrate of: (a)
30, (b) 95, and (c) 160. Each picture contains a portion of the side-view (left) and
top-view (right) of the sample. Scale bar is 10 mm.

115
3. Sample Shape
Square Triangle Circle
T = 24 C T = 30 C T = 40 C T = 50 C T = 60 C
(a)
(b)
Figure C. 4 (a) Final crack patterns in samples of initial thickness of Z0 = 5 mm
and initial diameter of D0 = 52 mm as well as substrate with 30 and
temperature of T = 24 - 60 C and. (b) crack begins at same fractional moisture
content value with different temperature of substrate.

116
(a)
(b)
Figure C. 5 (a) Final crack patterns in samples with initial thickness of Z = 5 mm and
different shapes and substrate with 30 and (b) crack begins at different fractional
average moisture content value for samples with different shapes. The surface area of all
samples is equal. The initial dimension of samples are: circle with diameter of D0 = 34
mm, square with length of L0 = 30.13 mm, and triangle with base of B0 = 45.79 mm and
height of H0 = 39.66 mm.
4. Composite PVDF/MWCNTs Foam
CMWCNTs = 0 % v/v CMWCNTs = 0.1 % v/v CMWCNTs = 0.3 % v/v CMWCNTs = 0.5 % v/v

117
(a)
(b)
Figure C. 6 (a) Final crack patterns in samples with initial thickness of Z0 = 5 mm and
initial diameter of D0 = 52 mm as well as different concentration of MWCNTs of
CMWCNTs = 0.0 – 0.5 % v/v and substrates with 30 and (b) crack begins at different
fractional average moisture content value in samples with initial thickness of Z0 = 5 mm
and initial diameter of D0 = 52 mm as well as different concentration of MWCNTs of
CMWCNTs = 0.0 – 0.5 % v/v and substrates with 30.
t = 0 h
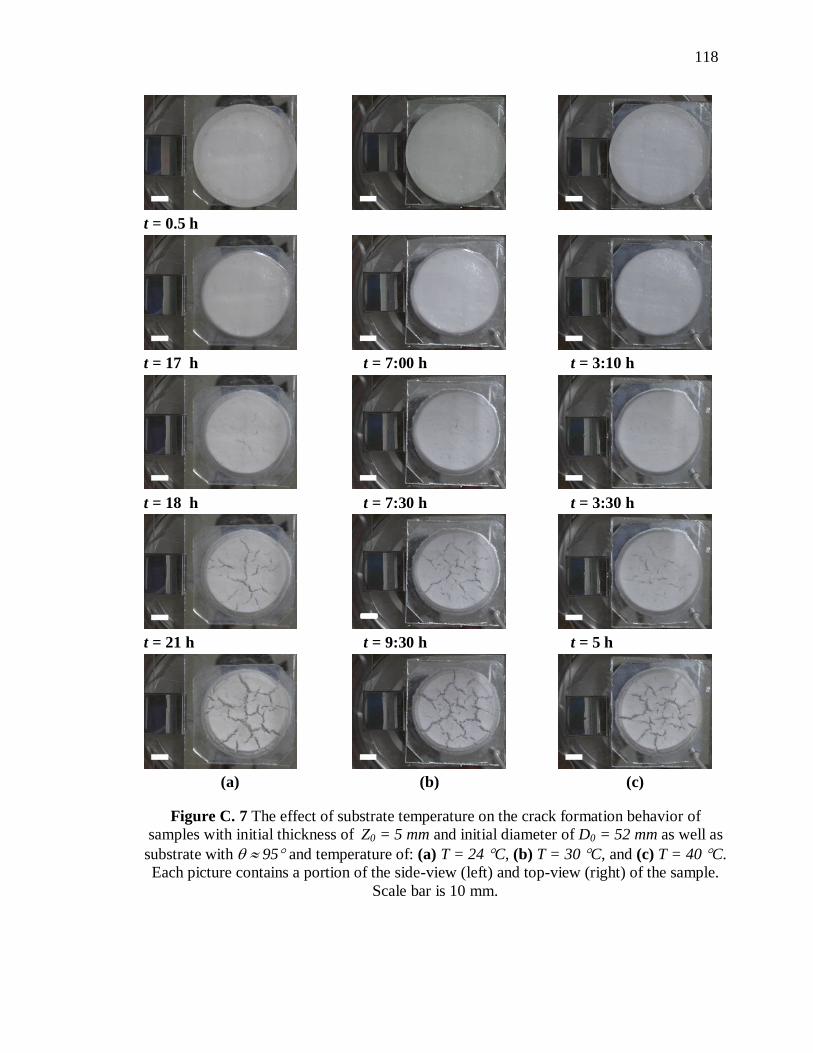
118
t = 0.5 h
t = 17 h t = 7:00 h t = 3:10 h
t = 18 h t = 7:30 h t = 3:30 h
t = 21 h t = 9:30 h t = 5 h
(a) (b) (c)
Figure C. 7 The effect of substrate temperature on the crack formation behavior of
samples with initial thickness of Z0 = 5 mm and initial diameter of D0 = 52 mm as well as
substrate with 95 and temperature of: (a) T = 24 C, (b) T = 30 C, and (c) T = 40 C.
Each picture contains a portion of the side-view (left) and top-view (right) of the sample.
Scale bar is 10 mm.

119
t = 0 h
t = 0.5 h
t = 2:20 h t = 1:35 h
t = 2:30 h t = 1:40 h
t = 3:30 h t = 2:30 h
(a) (b)
Figure C. 8 The effect of substrate temperature on the crack formation behavior of sample
with initial thickness of Z0 = 5 mm and initial diameter of D0 = 52 mm as well as substrate
with 95 and temperature of: (a) T = 50 C and (b) T = 60 C. Each picture contains a
portion of the side-view (left) and top-view (right) of the sample. Scale bar is 10 mm.

120
t = 0 h
t = 0.5 h
t = 16:30 h t = 5 h t = 2:40 h
t = 17 h t = 5:10 h t = 2:50 h
t = 20 h t = 6:30 h t = 4:30 h
(a) (b) (c)
Figure C. 9 The effect of substrate temperature on the crack formation behavior of sample
with initial thickness of Z0 = 5 mm and initial diameter of D0 = 52 mm as well as substrate
with 30 and temperature of: (a) T = 24 C, (b) T = 30 C, and (c) T = 40 C. Each
picture contains a portion of the side-view (left) and top-view (right) of the sample. Scale
bar is 10 mm.

121
t = 0 h
t = 0.5 h
t = 2 h t = 1:20 h
t = 2:10 h t = 1:25 h
t = 3 h t = 2 h
(a) (b)
Figure C. 10 The effect of substrate wettability on the crack formation behavior of sample
with initial thickness of Z0 = 5 mm and initial diameter of D0 = 52 mm as well as substrate
with 30 and temperature of: (a) T = 50 C and (b) T = 60 C. Each picture contains a
portion of the side-view (left) and top-view (right) of the sample. Scale bar is 10 mm.
t = 0 h

122
t = 0 h
t = 11 h
t = 12 h
t = 16 h
(a) (b) (c)
Figure C. 11 The effect of sample shape on the crack formation behavior of samples with
initial thickness of Z0 = 5 mm as well as substrate with 95: (a) square, (b) triangle, and
(c) circle. Each picture contains a portion of the side-view (right) and top-view (left) of the
sample. The surface area of all samples is equal. The initial dimension of samples are:
circle with diameter of D0 = 34 mm, square with length of L0 = 30.13 mm, and triangle
with base of B0 = 45.79 mm and height of H0 = 39.66 mm. Scale bar is 10 mm.

123
t = 0 h
t = 0 h
t = 15 h
t = 20 h
t = 23 h t = 28 h t = 30 h t = 32 h
(a) (b) (c) (d)
Figure C. 12 The effect of MWCNTs concentration on the crack formation behavior of
samples with initial thickness of Z0 = 5 mm and initial diameter of D0 = 52 mm as well as
substrate with 95 at: (a) CMWCNTs = 0 % v/v, (b) CMWCNTs = 0.1 % v/v, (c) CMWCNTs =
0.3 % v/v, and (d) CMWCNTs = 0.5 % v/v. Each picture contains a portion of the side-view
(right) and top-view (left) of the sample. Scale bar is 10 mm.

124
References
1. Binks, B.P., Particles as surfactants—similarities and differences. Current
opinion in colloid & interface science, 2002. 7(1): p. 21-41.
2. Kim, I., A.J. Worthen, K.P. Johnston, D.A. DiCarlo, and C. Huh, Size-dependent
properties of silica nanoparticles for Pickering stabilization of emulsions and
foams. Journal of Nanoparticle Research, 2016. 18(4): p. 82.
3. Nakayama, S., S. Hamasaki, K. Ueno, M. Mochizuki, S. Yusa, Y. Nakamura, and
S. Fujii, Foams stabilized with solid particles carrying stimuli-responsive polymer
hairs. Soft matter, 2016. 12(21): p. 4794-4804.
4. Binks, B.P., K. Muijlwijk, H. Koman, and A.T. Poortinga, Food-grade Pickering
stabilisation of foams by in situ hydrophobisation of calcium carbonate particles.
Food Hydrocolloids, 2017. 63: p. 585-592.
5. Gonzenbach, U.T., A.R. Studart, E. Tervoort, and L.J. Gauckler, Stabilization of
foams with inorganic colloidal particles. Langmuir, 2006. 22(26): p. 10983-
10988.
6. Lesov, I., S. Tcholakova, and N. Denkov, Factors controlling the formation and
stability of foams used as precursors of porous materials. Journal of Colloid and
Interface Science, 2014. 426: p. 9-21.
7. Bournival, G., S. Ata, and E.J. Wanless, The roles of particles in multiphase
processes: Particles on bubble surfaces. Advances in colloid and interface
science, 2015. 225: p. 114-133.
8. Chevalier, Y. and M.-A. Bolzinger, Emulsions stabilized with solid nanoparticles:
Pickering emulsions. Colloids and Surfaces A: Physicochemical and Engineering
Aspects, 2013. 439: p. 23-34.
9. Joanna C. H. Wong, E.T., Stephan Busato, Urs T. Gonzenbach, Andre R. Studart,
Paolo Ermanni and Ludwig J. Gauckler, Macroporous polymers from particle-
stabilized foams. Journal of Materials Chemistry, 2009. 19: p. 5129-5133.
10. Wong, J.C., E. Tervoort, S. Busato, U.T. Gonzenbach, A.R. Studart, P. Ermanni,
and L.J. Gauckler, Designing macroporous polymers from particle-stabilized
foams. Journal of Materials Chemistry, 2010. 20(27): p. 5628-5640.
11. Callen, H.B., Thermodynamics and An Introduction to Thermostatics, ed. 2nd.
2014: Wiley.

125
12. Binks, B.P., Colloidal particles at liquid interfaces. Physical Chemistry Chemical
Physics, 2007. 9(48): p. 6298-6299.
13. Wang, J. and A. Nguyen, Foam drainage in the presence of solid particles. Soft
matter, 2016. 12(12): p. 3004-3012.
14. Studart, A.R., U.T. Gonzenbach, I. Akartuna, E. Tervoort, and L.J. Gauckler,
Materials from foams and emulsions stabilized by colloidal particles. Journal of
Materials Chemistry, 2007. 17(31): p. 3283-3289.
15. McHale, G. and M. Newton, Liquid marbles: topical context within soft matter
and recent progress. Soft Matter, 2015. 11(13): p. 2530-2546.
16. K., L., B. A., S.D. Simeon, and P.N. V., Colloidal and nanocellulose-stabilized
emulsions. In HANDBOOK OF GREEN MATERIALS: 3 Self-and direct-
assembling of bionanomaterials, 2014: p. 185-196.
17. Hunter, T.N., R.J. Pugh, G.V. Franks, and G.J. Jameson, The role of particles in
stabilising foams and emulsions. Advances in Colloid and Interface Science,
2008. 137(2): p. 57-81.
18. Gonzenbach, U.T., A.R. Studart, T. E., and G.J. L., Ultrastable Particle-
Stabilized Foams Angew, Chem. Int. Ed., 2006. 45: p. 3526-3530.
19. Gonzenbach, U.T., A.R. Studart, E. Tervoort, and L.J. Gauckler, Tailoring the
microstructure of particle-stabilized wet foams. Langmuir, 2007. 23(3): p. 1025-
1032.
20. Zabiegaj, D., E. Santini, M. Ferrari, L. Liggieri, and F. Ravera, Carbon based
porous materials from particle stabilized wet foams. Colloids and Surfaces A:
Physicochemical and Engineering Aspects, 2015. 473: p. 24-31.
21. D., F., S.E. G., M.-L. M., and G.S. G., Crack-Free Drying of Ceramic Foams by
the Use of Viscous Cosolvents. Am. Soc., 2010. 93: p. 3632-3636.
22. Lesov, I., S. Tcholakova, and N. Denkov, Drying of particle-loaded foams for
production of porous materials: mechanism and theoretical modeling. Rsc
Advances, 2014. 4(2): p. 811-823.
23. Wong, J.C., E. Tervoort, S. Busato, U.T. Gonzenbach, A.R. Studart, P. Ermanni,
and L.J. Gauckler, Macroporous polymers from particle-stabilized foams. Journal
of Materials Chemistry, 2009. 19(29): p. 5129-5133.
24. Dhall, A. and A.K. Datta, Transport in deformable food materials: A
poromechanics approach. Chemical Engineering Science, 2011. 66(24): p. 6482-
6497.

126
25. Onwude, D.I., N. Hashim, R.B. Janius, N. Nawi, and K. Abdan, Modelling
Effective Moisture Diffusivity of Pumpkin (Cucurbita moschata) Slices under
Convective Hot Air Drying Condition. International Journal of Food Engineering,
2016. 12(5): p. 481-489.
26. Torki-Harchegani, M., D. Ghanbarian, A.G. Pirbalouti, and M. Sadeghi,
Dehydration behaviour, mathematical modelling, energy efficiency and essential
oil yield of peppermint leaves undergoing microwave and hot air treatments.
Renewable & Sustainable Energy Reviews, 2016. 58: p. 407-418.
27. Hathan, B.S., Studies on Mass Transfer and Diffusion Coefficients in Elephant
Foot Yam (Amorphophallus spp.) during Osmotic Dehydration in Sodium
Chloride Solution. Journal of Food Processing and Preservation, 2015.
28. Cao, Z.z., L.y. Zhou, J.f. Bi, J.y. Yi, Q.q. Chen, X.y. Wu, J.k. Zheng, and S.r. Li,
Effect of different drying technologies on drying characteristics and quality of red
pepper (Capsicum frutescens L.): a comparative study. Journal of the Science of
Food and Agriculture, 2016.
29. Gulati, T. and A.K. Datta, Mechanistic understanding of case-hardening and
texture development during drying of food materials. Journal of Food
Engineering, 2015. 166: p. 119-138.
30. Batista, L.M., C.A. da Rosa, and L.A. Pinto, Diffusive model with variable
effective diffusivity considering shrinkage in thin layer drying of chitosan. Journal
of Food Engineering, 2007. 81(1): p. 127-132.
31. Karim, M.A. and M. Hawlader, Mathematical modelling and experimental
investigation of tropical fruits drying. International Journal of Heat and Mass
Transfer, 2005. 48(23): p. 4914-4925.
32. Mohan, V.C. and P. Talukdar, Three dimensional numerical modeling of
simultaneous heat and moisture transfer in a moist object subjected to convective
drying. International Journal of Heat and Mass Transfer, 2010. 53(21): p. 4638-
4650.
33. Katekawa, M. and M. Silva, A review of drying models including shrinkage
effects. Drying technology, 2006. 24(1): p. 5-20.
34. Crank, J., The Mathematics of Diffusion. 2nd ed. 1975, Oxford: Oxford University
Press.
35. Beigi, M., Hot air drying of apple slices: dehydration characteristics and quality
assessment. Heat and Mass Transfer, 2016. 52(8): p. 1435-1442.
36. Babalis, S.J. and V.G. Belessiotis, Influence of the drying conditions on the drying
constants and moisture diffusivity during the thin-layer drying of figs. Journal of
Food Engineering, 2004. 65(3): p. 449-458.

127
37. Batista, L.M., C.A. da Rosa, and L.A.A. Pinto, Diffusive model with variable
effective diffusivity considering shrinkage in thin layer drying of chitosan. Journal
of Food Engineering, 2007. 81(1): p. 127-132.
38. Perry R, G.D., Perry’s chemical engineers’ handbook. 6th edn. ed. 1984, New
York: McGraw-Hill International.
39. Saravacos, G. and G. Raouzeos, Diffusivity of moisture in air drying of starch
gels. Engineering and food, 1984. 1: p. 499-507.
40. Aral, S. and A.V. Bese, Convective drying of hawthorn fruit (Crataegus spp.):
Effect of experimental parameters on drying kinetics, color, shrinkage, and
rehydration capacity. Food Chemistry, 2016. 210: p. 577-584.
41. Sharma, G. and S. Prasad, Effective moisture diffusivity of garlic cloves
undergoing microwave-convective drying. Journal of Food Engineering, 2004.
65(4): p. 609-617.
42. Schossler, K., H. Jager, and D. Knorr, Effect of continuous and intermittent
ultrasound on drying time and effective diffusivity during convective drying of
apple and red bell pepper. Journal of Food Engineering, 2012. 108(1): p. 103-
110.
43. Hanson, T., W. Cramer, W. Abraham, and E. Lancaster. Rates of water-vapor
absorption in granular corn starch. in Chemical Engineering Progress
Symposium Series. 1971.
44. Arevalo-Pinedo, A. and F.E.X. Murr, Kinetics of vacuum drying of pumpkin
(Cucurbita maxima): Modeling with shrinkage. Journal of Food Engineering,
2006. 76(4): p. 562-567.
45. Park, K.J., Diffusional model with and without shrinkage during salted fish
muscle drying. Drying Technology, 1998. 16(3-5): p. 889-905.
46. Sahin, U. and H.K. Ouml;zturk, Effects of pulsed vacuum osmotic dehydration
(PVOD) on drying kinetics of figs (Ficus carica L). Innovative Food Science &
Emerging Technologies, 2016. 36: p. 104-111.
47. Ketelaars, A.A.J., Drying Deformable Media Kinetics, Shrinkage and Stresses.
Drying Technology, 1994. 12(4): p. 983-987.
48. Osman, A., L. Goehring, A. Patti, H. Stitt, and N. Shokri, Fundamental
investigation of the drying of solid suspensions. Industrial & Engineering
Chemistry Research, 2017. 56(37): p. 10506-10513.
49. Fuks, D., G.E. Shter, M. Mann–Lahav, and G.S. Grader, Crack‐free drying of
ceramic foams by the use of viscous cosolvents. Journal of the American Ceramic
Society, 2010. 93(11): p. 3632-3636.

128
50. Gonzenbach, U.T., A.R. Studart, D. Steinlin, E. Tervoort, and L.J. Gauckler,
Processing of particle-stabilized wet foams into porous ceramics. Journal of the
American Ceramic Society, 2007. 90(11): p. 3407-3414.
51. Tirumkudulu, M.S. and W.B. Russel, Cracking in drying latex films. Langmuir,
2005. 21(11): p. 4938-4948.
52. Singh, K.B. and M.S. Tirumkudulu, Cracking in drying colloidal films. Physical
review letters, 2007. 98(21): p. 218302.
53. Gan, S.-H. and C.-L. Law, Conventional and Intermittent Food Drying Processes
and the Effect on Food Quality. Intermittent and Nonstationary Drying
Technologies: Principles and Applications, 2017.
54. Khalloufi, S., C. Almeida-Rivera, and P. Bongers, A theoretical model and its
experimental validation to predict the porosity as a function of shrinkage and
collapse phenomena during drying. Food Research International, 2009. 42(8): p.
1122-1130.
55. Govani, K.J. and J.K.S. , Study of Cold Chain Status at Mamta Session of Each
Urban Health Centres(UHCs) of Ahmedabad Municipal Corporation (AMC)
Area. International Journal of Health Sciences & Research, 2014. 4(6): p. 15-19.
56. Oltean, L., A. Teischinger, and C. Hansmann, Influence of temperature on
cracking and mechanical properties of wood during wood drying–A review.
BioResources, 2007. 2(4): p. 789-811.
57. Scherer, G.W., Theory of drying. Journal of the American Ceramic Society, 1990.
73(1): p. 3-14.
58. Russel, W.B., Mechanics of Drying Colloidal Dispersions: Fluid/Solid
Transitions, Skinning, Crystallization, Cracking, and Peeling. Aiche Journal,
2011. 57(6): p. 1378-1385.
59. Hu, X., Z. Shi, C. Shi, Z. Wu, B. Tong, Z. Ou, and G. de Schutter, Drying
shrinkage and cracking resistance of concrete made with ternary cementitious
components. Construction and Building Materials, 2017. 149: p. 406-415.
60. Rumpf, H., The Strength of Granules and Agglomerates, chap, W. Knepper (), .
1962.
61. Papadakis, S.E. and R.E. Bahu, The sticky issues of drying. Drying Technology,
1992. 10(4): p. 817-837.
62. Quéré, D., A. Lafuma, and J. Bico, Slippy and sticky microtextured solids.
Nanotechnology, 2003. 14(10): p. 1109.

129
63. Ghosh, U.U., C. M., B.B. A., C. S., and D.G. S., Effect of Surface Wettability on
Crack Dynamics and Morphology of Colloidal Films. Langmuir, 2015. 31: p.
6001-6010.
64. Lazarus, V. and L. Pauchard, From craquelures to spiral crack patterns:
influence of layer thickness on the crack patterns induced by desiccation. Soft
Matter, 2011. 7(6): p. 2552-2559.
65. Wallace, S. and L. Hench, The processing and characterization of DCCA
modified gel-derived silica. MRS Online Proceedings Library Archive, 1984. 32.
66. Cervin, N.T., L.a. Andersson, . . . g, . lin, . ergstr m, and . gberg,
Lightweight and strong cellulose materials made from aqueous foams stabilized
by nanofibrillated cellulose. Biomacromolecules, 2013. 14(2): p. 503-511.
67. Huang, Y., J. Zhou, B. Su, L. Shi, J. Wang, S. Chen, L. Wang, J. Zi, Y. Song, and
L. Jiang, Colloidal photonic crystals with narrow stopbands assembled from low-
adhesive superhydrophobic substrates. Journal of the American Chemical
Society, 2012. 134(41): p. 17053-17058.
68. Zhou, J., J. Wang, Y. Huang, G. Liu, L. Wang, S. Chen, X. Li, D. Wang, Y. Song,
and L. Jiang, Large-area crack-free single-crystal photonic crystals via combined
effects of polymerization-assisted assembly and flexible substrate. NPG Asia
Materials, 2012. 4(8): p. e21.
69. Chiu, R.C., T. Garino, and M. Cima, Drying of granular ceramic films: I, effect of
processing variables on cracking behavior. Journal of the American Ceramic
Society, 1993. 76(9): p. 2257-2264.
70. Chiu, R.C. and M.J. Cima, Drying of granular ceramic films: II, drying stress and
saturation uniformity. Journal of the American Ceramic Society, 1993. 76(11): p.
2769-2777.
71. Rezvantalab, H., N. Ghazi, M.J. Ambrusch, J. Infante, and S. Shojaei-Zadeh, An
Aqueous-Based Approach for Fabrication of PVDF/MWCNT Porous Composites.
Scientific Reports, 2017. 7.
72. Khedkar, M.A., P.R. Nimbalkar, S.G. Gaikwad, P.V. Chavan, and S.B. Bankar,
Sustainable biobutanol production from pineapple waste by using Clostridium
acetobutylicum B 527: Drying kinetics study. Bioresource technology, 2017. 225:
p. 359-366.
73. Goehring, L., W.J. Clegg, and A.F. Routh, Solidification and ordering during
directional drying of a colloidal dispersion. Langmuir, 2010. 26(12): p. 9269-
9275.

130
74. Peron, H., L. Laloui, L.-B. Hu, and T. Hueckel, Formation of drying crack
patterns in soils: a deterministic approach. Acta Geotechnica, 2013. 8(2): p. 215-
221.
75. Madiouli, J., J. Sghaier, D. Lecomte, and H. Sammouda, Determination of
porosity change from shrinkage curves during drying of food material. Food and
bioproducts processing, 2012. 90(1): p. 43-51.
76. Mayor, L. and A. Sereno, Modelling shrinkage during convective drying of food
materials: a review. Journal of Food Engineering, 2004. 61(3): p. 373-386.
77. Wong, J.C., S. Busato, E. Tervoort, U.T. Gonzenbach, A.R. Studart, L.J.
Gauckler, and P. Ermanni, PVDF Particle-stabilized Polymeric Foams as
Piezoelectric Space-charge Electrets. 2008.
78. Chen, D. and J.X. Zhang, Microporous polyvinylidene fluoride film with dense
surface enables efficient piezoelectric conversion. Applied Physics Letters, 2015.
106(19): p. 193901.
79. Dmitriev, I.Y., I. Kuryndin, V. Lavrentyev, and G. Elyashevich, Structure and
piezoelectric properties of microporous polyvinylidene fluoride films. Physics of
the Solid State, 2017. 59(5): p. 1041-1046.
80. Begum, S., A. Kausar, H. Ullah, and M. Siddiq, Potential of Polyvinylidene
Fluoride/Carbon Nanotube Composite in Energy, Electronics, and Membrane
Technology: An Overview. Polymer-Plastics Technology and Engineering, 2016.
55(18): p. 1949-1970.
81. Singh, H.H., S. Singh, and N. Khare, Enhanced β‐phase in PVDF polymer
nanocomposite and its application for nanogenerator. Polymers for Advanced
Technologies, 2017.
82. Sharifi Olyaei, N., M.M. Mohebi, and R. Kaveh, Directional properties of
ordered 3‐3 piezocomposites fabricated by sacrificial template. Journal of the
American Ceramic Society, 2017. 100(4): p. 1432-1439.
83. Begum, S., A. Kausar, H. Ullah, and M. Siddiq, Exploitation of carbon nanotubes
in high performance polyvinylidene fluoride matrix composite: A review.
Polymer-Plastics Technology and Engineering, 2016. 55(2): p. 199-222.
84. Kausar, A., Mechanical, thermal, and electrical properties of epoxy matrix
composites reinforced with polyamide-grafted-MWCNT/poly (azo-pyridine-
benzophenone-imide)/polyaniline nanofibers. International Journal of Polymeric
Materials and Polymeric Biomaterials, 2014. 63(16): p. 831-839.
85. Carrín, M.E. and G.H. Crapiste, Convective drying of foods. Advances in food
dehydration. CRC Press, Boca Raton, 2008: p. 123-151.

131
86. Ramesh, M.N., W. Wolf, D. Tevini, and G. Jung, Influence of processing
parameters on the drying of spice paprika. Journal of Food Engineering, 2001.
49(1): p. 63-72.
87. Kim, S.S. and S.R. Bhowmik, Effective Moisture Diffusivity of Plain Yogurt
Undergoing Microwave Vacuum Drying. Journal of Food Engineering, 1995.
24(1): p. 137-148.
88. Marousis, S.N., V.T. Karathanos, and G.D. Saravacos, Effect of Physical
Structure of Starch Materials on Water Diffusivity. Journal of Food Processing
and Preservation, 1991. 15(3): p. 183-195.
89. Karathanos, V., G. Villalobos, and G. Saravacos, Comparison of two methods of
estimation of the effective moisture diffusivity from drying data. Journal of Food
Science, 19 90. 55(1): p. 218-223.
90. Fusco, A., J. Avanza, R. Aguerre, and J. Gabitto, A diffusional model for drying
with volume change. Drying Technology, 1991. 9(2): p. 397-417.
91. Cassie, A. and S. Baxter, Wettability of porous surfaces. Transactions of the
Faraday society, 1944. 40: p. 546-551.
92. Holmes, D.M., R. Vasant Kumar, and W.J. Clegg, Cracking during lateral drying
of alumina suspensions. Journal of the American Ceramic Society, 2006. 89(6): p.
1908-1913.
93. Strauch, S. and S. Herminghaus, Wet granular matter: a truly complex fluid. Soft
Matter, 2012. 8(32): p. 8271-8280.
94. Dufresne, E., D. Stark, N. Greenblatt, J. Cheng, J. Hutchinson, L. Mahadevan,
and D. Weitz, Dynamics of fracture in drying suspensions. Langmuir, 2006.
22(17): p. 7144-7147.
95. Smith, M. and J. Sharp, Effects of substrate constraint on crack pattern formation
in thin films of colloidal polystyrene particles. Langmuir, 2011. 27(13): p. 8009-
8017.
96. Boulogne, F., F. Giorgiutti-Dauphiné, and L. Pauchard, How to reduce the crack
density in drying colloidal material? Oil & Gas Science and Technology–Revue
d’IF Energies nouvelles, 2014. 69(3): p. 397-404.