2018 nebraska higher education progress report · pdf file · 2018-03-16miste...
TRANSCRIPT
2018 Nebraska
Higher Education Progress Report
Approved by the Commission March 8, 2018

COMMISSIONERS W. Scot Wilson, Chair Dr. John Bernthal Dr. Joyce D. Simmons Plattsmouth, Member-at-Large Lincoln, District 1 Lincoln, Member-at-Large Dr. Deborah A. Frison, Vice Chair Dr. Ronald Hunter Dr. Paul Von Behren Omaha, District 2 Hay Springs, District 6 Ames, District 3 Colleen Adam Mary Lauritzen Hastings, District 5 West Point, Member-at-Large Gwenn Aspen Dwayne Probyn Omaha, Member-at-Large Papillion, District 4 STAFF Dr. Michael Baumgartner Dr. Duncan Hsu Helen Pope Executive Director Database Manager/ Executive Assistant Special Projects Miste Adamson Gary Timm Administrative Assistant Kadi Lukesh Chief Finance & Bookkeeper, Budget Coordinator, Administrative Officer Dr. Kathleen Fimple & Office Manager Academic Programs Officer Mike Wemhoff Ritchie Morrow Facilities Officer Jill Heese Financial Aid Officer Research Coordinator
Coordinating Commission for Postsecondary Education 140 N. 8th Street, Suite 300 · P.O. Box 95005 · Lincoln, NE 68509-5005
Phone: (402) 471-2847
The Commission’s reports are available online at ccpe.nebraska.gov/reports
The Coordinating Commission for Postsecondary Education does not discriminate on the basis of race, color, national origin, sex, religion, age, or disability in the employment or the provision of services.

Nebraska’s Coordinating Commission for Postsecondary Education – 2018 Progress Report i
Table of Contents Key Takeaways .......................................................................................................................... I Executive Summary ............................................................................................................... S1
2018 Progress Report Recommendations .................................................................. S21 Introduction ............................................................................................................................... 1 Section 1: Increasing Postsecondary Enrollment .................................................................. 3
Nebraska Total Fall Headcount Enrollment ......................................................................... 3
Nebraska Total Fall Headcount Enrollment by Sector ......................................................... 4
Nebraska Public Colleges and Universities: Fall Enrollment by Institution ........................... 5
Nebraska Independent Colleges and Universities: Fall Enrollment ...................................... 8
Nebraska For-Profit/Career Schools: Fall Enrollment ......................................................... 9
Nebraska Fall Headcount Enrollment Summary by Sector ................................................ 10
12-Month Unduplicated Headcounts at Nebraska Postsecondary Institutions Compared to Fall Headcount Enrollment ................................................................. 11
Nebraska First-Time Freshmen Enrollments ..................................................................... 15
Number of Degrees Conferred at Nebraska Postsecondary Institutions ............................ 19
Strategic Objectives to Increase Postsecondary Enrollment .............................................. 21 1.1.a High School Graduation Rates ............................................................................. 23
Past and Present Trends in the Number of Nebraska High School Graduates ......... 23
Projected Trends in the Number of Nebraska High School Graduates ..................... 24
Projected and Recent Changes in Nebraska Public High School Graduates by Race/Ethnicity ............................................................................ 25
Nebraska Public High School Graduation Rates ...................................................... 27
Public High School Graduation Rates by State ........................................................ 28
Nebraska Public High School Graduation Rates by Gender .................................... 30
Nebraska Public High School Graduation Rates by Race/Ethnicity .......................... 31
District-Level Analysis of Graduation Rates ............................................................. 32
Nebraska Public High School Cohort Extended Graduation Rates .......................... 33
1.1.b Preparation for College ......................................................................................... 35
Nebraska Participation Rates for the ACT Assessment and the SAT Test ............................................................................................. 35
Nebraska SAT Test Scores ..................................................................................... 36
Nebraska ACT Assessment Scores ......................................................................... 36
ACT College Readiness Benchmark Scores ............................................................ 38

Nebraska’s Coordinating Commission for Postsecondary Education – 2018 Progress Report ii
Percentages of Nebraska ACT-Tested Students Ready for College-Level Coursework ............................................................... 39
Changes in the Number of Students Who Took the ACT Assessment ..................... 40
ACT Composite Scores and College Readiness Percentages by Race/Ethnicity ..... 40
The Importance of the ACT-Recommended High School Core Curriculum .............. 43
Nebraska ACT Composite Scores of Students Who Take the ACT-Recommended Core and Students Who Take Less than the Core Curriculum ......................................................................... 43
Percentage of Nebraska ACT-Tested Students Who Take the Core or More ............................................................................. 45 1.1.c College Continuation Rates .................................................................................. 49
Introduction: Two Measures of Nebraska’s College Continuation Rates ................. 49
Nebraska Statewide College Continuation Rates Based on IPEDS Data ................. 51
State-by-State College Continuation Rates .............................................................. 51
In-State and Out-of-State College Continuation Rates ............................................. 53
Percentages of Students Who Continue Their Education at Public and Private Institutions ...................................................................... 54
College Continuation Rates for Nebraska Public High School Graduates by Gender, Student Income Status, and Race/Ethnicity, Based on National Student Clearinghouse Data .............................................. 56 1.2 Nebraska High School Graduates Who Go to College in Nebraska ................... 63
Changes in the Number of Nebraska-Resident, First-Time Freshmen Enrolled at Postsecondary Institutions by Length of Time Since High School Graduation ......................................................................... 64
In-State and Out-of-State Enrollments of Nebraska-Resident, First-Time Freshmen Who Graduated from High School Within 12 Months of College Enrollment .......................................................... 65
In-State and Out-of-State Enrollments of Nebraska-Resident, First-Time Freshmen Who Graduated from High School More than 12 Months Prior to College Enrollment ............................................ 67
1.3 Non-Nebraska, First-Time Freshmen Who Enroll at Nebraska Colleges and Net Migration .......................................... 69
Non-Nebraska, First-Time Freshmen Who Attend Nebraska Colleges and Universities ................................................................................. 69
Net Migration of Nebraska and Non-Nebraska, First-Time Freshmen ...................... 75
1.4 Enrollment of First-Time Freshmen by Race/Ethnicity ....................................... 73
Changes in the Numbers of First-Time Freshmen Enrolled at Nebraska Institutions........................................................................................ 73
Racial/Ethnic Representation in Nebraska’s Postsecondary Education System Fall 2016 ............................................................................................. 75
Nebraska’s Coordinating Commission for Postsecondary Education – 2018 Progress Report iii
Comparison of the Representation of Racial/Ethnic Groups in Fall 2006 and Fall 2016 ................................................................................ 76
Types of Institutions Most Frequently Attended by Each Racial/Ethnic Group ......................................................................................... 76
Representation of Racial/Ethnic Groups by Sector .................................................. 79 1.5 Financial Aid .......................................................................................................... 81
Number of Students Not Served by Nebraska’s Opportunity Grant Program ........... 81
Other Evidence of Unmet Need for Financial Aid ..................................................... 84
Nebraska State Grant Program and Other Sources of Title IV Financial Aid ............ 86
Funding of Awarded Nebraska Opportunity Grants .................................................. 86
Nebraska Opportunity Grants as a Percentage of All Title IV Financial Aid .............. 87
Nebraska Opportunity Grants as a Percentage of Title IV Financial Aid Awarded at Nebraska Public Institutions .......................................................... 88
Need-Based Financial Aid (Excluding Loans) Awarded at Nebraska’s Public Institutions ...................................................................... 89
Access College Early (ACE) Scholarship Program .................................................. 92
College Continuation Rates of ACE Scholarship Recipients .................................... 93 Section 2: Increasing College Retention and Graduation Rates ......................................... 97 2.1 Freshmen Retention Rates (Based on IPEDS Data) ............................................. 99
Full-Time Freshmen Retention Rates by Sector ...................................................... 99
Part-Time Freshmen Retention Rates by Sector .................................................... 100
Nebraska Freshmen Retention Rates Compared to Those of Other States ........... 101 2.2 College Graduation and Transfer Rates within 150% of Normal Time (Based on IPEDS Data) ................................................................................. 107
Overall Public College Graduation Rates within 150% of Normal Time for Nebraska .................................................................................................. 107
College Graduation Rates within 150% of Normal Time by Sector and by Institution ................................................................................................... 108
College Graduation Rates within 150% of Normal Time by Race/Ethnicity ............ 109
College Graduation Rates within 150% of Normal Time by Sector and by Race/Ethnicity ........................................................................................... 110
College Graduation Rates within 150% of Normal Time by Financial Aid Received .............................................................................. 113
Nebraska Graduation Rates within 150% of Normal Time Compared to the Graduation Rates of Other States ....................................... 114
Transfer Rates within 150% of Normal Time for Nebraska Community Colleges ...................................................................... 117

Nebraska’s Coordinating Commission for Postsecondary Education – 2018 Progress Report iv
2.3 Graduation and Persistence Rates (Based on Clearinghouse Data) ............................ 119
Introduction to the National Student Clearinghouse Study ..................................... 119
Reported Student Outcomes ................................................................................. 120
Nebraska Completion and Persistence Rates Compared to National Rates .......... 121
Nebraska Student Outcomes by Enrollment Status ............................................... 123
Nebraska Student Outcomes by Age Group .......................................................... 125
Nebraska Student Outcomes by Gender ............................................................... 127
Conclusion ............................................................................................................. 127 Section 3: Reversing the Net Out-Migration of College-Educated Nebraskans ............... 129
Educational Attainment for 22- to 64-Year-Olds .............................................................. 131
Migration Estimates for 22- to 64-Year Olds .................................................................... 132
Migration Estimates Compared to Educational Attainment for 22- to 64-Year Olds ......... 134 Appendices ........................................................................................................................... 137 Appendix 1: Nebraska College Enrollments .................................................................... 139
Appendix 2: Actual and Projected Numbers of Nebraska High School Graduates .......... 151
Appendix 3: Nebraska High School Graduation Rates ................................................... 155
Appendix 4: Nebraska Scores on ACT and SAT Student Assessments ......................... 161
Appendix 5: Nebraska College Continuation Rates ........................................................ 165
Appendix 6: Nebraska and Non-Nebraska, First-Time Freshmen Migration Data ........... 177
Appendix 7: Nebraska First-Time Freshmen Enrollments by Race/Ethnicity ................... 197
Appendix 8: Financial Aid Programs ............................................................................... 225
Appendix 9: IPEDS Freshmen Retention Rates ............................................................. 241
Appendix 10: IPEDS College Graduation Rates within 150% of Normal Time ................ 259
Appendix 11: IPEDS College Transfer Rates within 150% of Normal Time .................... 293
Appendix 12: National Student Clearinghouse Research Center Study, Six-Year Student Success Outcomes and College Completion Rates for Nebraska and the United States .......................................................... 299
Appendix 13: Estimated Nebraska Net Migration of 22- to 64-Year Olds ........................ 303

2018 Nebraska Higher Education Progress Report | Key Takeaways I
Key Takeaways — 2018 Progress Report In 2006, the Nebraska Legislature identified education as key to the state’s economic future: “Increasing the number of Nebraskans with high levels of educational attainment is essential to support economic expansion and diversification.” (Neb. Rev. Stat. § 85-1428) In 2018, it remains essential, as an estimated 71 percent of Nebraska jobs will require at least some postsecondary education by 2020. This report provides detailed analysis of Nebraska’s progress toward increasing its educational attainment. The Comprehensive Statewide Plan for Postsecondary Education, produced by the Coordinating Commission, includes many of these same metrics within its “Measuring Accomplishments” section.
71.0 The college continuation rate for the 2015-2016 Nebraska public high school graduating class. (See Figure 1.1.c.6, page 57.)
39.6
The six-year completion rates for Nebraska public two-year institutions (39.6%) and four-year public institutions (65.6%), compared to national rates of 39.3% and 62.4%, respectively. (Fall 2010 cohort.) (See Figure 2.3.1, page 121.)
47.6
The percentage of ACE Scholarship recipients who have gone on to college. The comparable college continuation rates were 53.2% for low-income high school graduates who did not receive ACE and 77.8% for non-low-income high school graduates. (See Figure 1.5.8, page 95.)
26.8 The percentage difference in college attainment between whites and minorities ages 25 to 44, which ranks third worst in the country. (See page S20.)
32.4
The percentage of Nebraskans ages 22 to 64 who have a bachelor’s degree or higher for the period 2012-2016, according to the American Community Survey. This is up from 29.7% for the period 2007-2011. The percentage of Nebraskans ages 22 to 64 who have some college or an associate’s degree is 35.6%, down from 36.3%. (See Figure 3.1, page 131.)
65.6
89.1
Nebraska’s 2016-2017 public high school graduation rate. (See Figure 1.1.a.4, page 28.) However, ACT reports that only 28% of Nebraska’s ACT-tested high school graduates are sufficiently prepared to succeed in all four common areas of entry-level college coursework in algebra, biology, English, and social sciences. (See Figure 1.1.b.4 on page 39.)
For every 10,000 working-age (22 to 64) Nebraskans with a bachelor’s degree or higher, there was an average annual net out-migration of 47.6 people from 2012 to 2016, meaning that Nebraska continues to lose more residents with a bachelor’s degree than it attracts from other states. (See page 134.)
81.0

2018 Nebraska Higher Education Progress Report | Executive Summary S1
This report provides the Nebraska Legislature with comparative statistics to monitor and evaluate progress toward achieving three key priorities for Nebraska’s postsecondary education system:
Increase the number of students who enter postsecondary education in Nebraska.
Increase the percentage of students who persist and successfully complete a degree.
Reduce, eliminate, and then reverse the net out-migration of Nebraskans with high levels of educational attainment.
These priorities were developed by the 2003 LR 174 Higher Education Task Force and are incorporated in Neb. Rev. Stat. § 85-1428 (3).
This summary highlights the comparative analysis used to measure and evaluate performance with respect to each priority. Throughout this analysis, the latest available statistics are analyzed in the context of 10-year trends. See pages S21-S22 for recommendations based on the findings of this report. The complete report and its appendices, which are online at ccpe.nebraska.gov/reports, provide a detailed and fully documented analysis.
Executive Summary
Overall Progress and Challenges Facing the State • The research findings in the 2018 Nebraska Higher Education Progress Report reflect modest annual changes in the state’s postsecondary education system. • While the changes measured each year have been relatively small, progress through 2010 was generally in the right direction with respect to the first and second priorities recommended in 2003. However, between 2010 and 2017, enrollments have declined. • Estimates of net migration—priority three—indicate that out-migration of highly educated working- age Nebraskans has not been eliminated. • Even though progress toward most of the state’s higher-education goals is generally in the right direction, it is not aggressive enough to meet the state’s long-term needs and goals. • Since 2006-2007, the number of students graduating from Nebraska’s high schools has increased 10.1%. The cohort four-year graduation rate has increased from 86.1% in 2010- 2011 to 89.1% in 2016-2017. However, many students are not graduating on time or are taking more than four years to graduate from high school, lessening their likelihood of financial and other successes and, for the purposes of this report, reducing the pool of students who could go to college.
• The fall 2014 college-going rate of Nebraska public and private high school students was the 26th highest nationally, but it has not increased significantly for graduates of Nebraska’s public high schools since the Commission began estimating college continuation rates in 2007-2008.
• Nebraska has increased the amount of state funds allocated for need-based financial aid, but state funding has not kept pace with the number of students who are eligible for state grants. The Nebraska Opportunity Grant program has aided thousands of students, but more state-funded, need-based aid is needed to enable more of the state’s low-income and moderately low-income students to go to college and earn degrees.
• Since 2006, the overall freshmen retention rate has increased slightly. Meanwhile, the state’s overall college graduation rate for public two-year institutions has stayed the same while the state’s overall college graduation rate for public four-year institutions has increased. College graduation rates are significantly lower for Hispanics, Native Americans, black non- Hispanics, and multiracial students than for white non-Hispanics and Asian/Pacific Islander undergraduate students.

2018 Nebraska Higher Education Progress Report | Executive Summary S2
Priority 1
Increase the number of students who enter postsecondary
education in Nebraska
Decreasing enrollments are one of the most significant trends evidenced in this report on higher education in Nebraska. Since 2010, Nebraska’s total fall enrollment has decreased an estimated 7.0% to 135,663. Meanwhile, first-time freshmen (FTF) enrollment decreased to 18,936, a 3.6% decline since 2010. The decrease is consistent with national trends over the same period. Total fall enrollments Nebraska’s total postsecondary headcount enrollment increased steadily from 125,543 in fall 2006 to a high of 145,893 in fall 2010, an increase of 16.2%. However, fall enrollment decreased to 136,917 in fall 2016, for an overall 10-year increase of 9.1%.
It is estimated that fall 2017 statewide enrollment decreased 0.9% since 2016, resulting in an 11-year increase of 8.1% since fall 2006. As shown on the next page, between 2006 and 2016, total fall enrollment increased 14.6% at the University of Nebraska, 9.8% at the state colleges, and 24.7% at the independent institutions. Meanwhile, fall enrollment declined 2.5% at the community colleges and 45.9% at the for-profit/career schools. Based on preliminary estimates, between 2016 and 2017, fall enrollments increased 0.4% at the University of Nebraska and 0.5% at the community colleges. It is estimated that fall enrollments declined 5.9% at the state colleges, 1.8% at the independent institutions, and 25.0% at the for-profit/career schools.
Fall Total Headcount Enrollment and First-Time Freshmen Enrollment Fall 2006 through Fall 2017
Note. See Figure 1.1 (page 3) and Figure 1.13 (page 16).

2018 Nebraska Higher Education Progress Report | Executive Summary S3
Freshmen fall enrollments Total enrollment of first-time freshmen (FTF) at the state’s postsecondary institutions increased 1.9%, from 18,294 in fall 2006 to 18,936 in fall 2016. It is estimated that fall 2017 statewide FTF enrollment increased 1.6% over 2016, resulting in an 11-year increase of 3.5% since fall 2006.
Between fall 2006 and fall 2017, FTF enrollment decreased an estimated 0.2% at the community colleges and 67.2% at the for-profit/career schools. However, FTF enrollment increased 18.3% at the University of Nebraska, 3.7% at the state colleges, and 4.9% at the independent institutions.
Fall Total Headcount Enrollment by Sector Fall 2006 through Fall 2017
Note. See Figure 1.2 (page 4) and Figure 1.12 (page 15).
First-Time Freshmen Enrollment by Sector Fall 2006 through Fall 2017

2018 Nebraska Higher Education Progress Report | Executive Summary S4
Strategic objectives to increase postsecondary enrollment The 2003 LR 174 Task Force recommended the following strategic objectives to increase the number of students who enter postsecondary education in Nebraska: Increase the proportion of PK-12 students
who graduate from high school, enroll in postsecondary education and are adequately prepared to proceed through postsecondary degree completion.
Increase the proportion of Nebraska high school graduates who pursue their postsecondary education in Nebraska.
Increase the number of non-Nebraska high school graduates who pursue postsecondary education in Nebraska.
Increase the number and proportion of Nebraska postsecondary students who have been underrepresented in the state’s higher education system.
Increase need-based financial aid in order to improve access to higher education for Nebraskans with limited financial means.
Nebraska high schools—Nebraska’s primary source of college students Since 2006-2007, the number of students graduating annually from Nebraska high schools has increased 10.1%, from 21,241 to 23,385 in
2016-2017. Based on the latest projections, Nebraska high schools will graduate about 1,931 more students in 2026-2027 than in 2016-2017, an increase of 8.3%. Shifting high school demographics As shown on the next page, the demographic profile of Nebraska’s public high school graduates has changed considerably over the last decade and is forecast to continue to change over the next decade. Since 2006-2007, the percentage of students who are white non-Hispanic has declined while the percentages of students who are minorities has increased. The overwhelming shift has been the increase in the number of Hispanic graduates. Furthermore, Hispanic students are projected to account for 21.3% of Nebraska’s public high school graduates by 2026-2027, compared to 16.1% in 2016-2017. Asian/Pacific Islanders are also projected to account for a larger percentage of Nebraska’s public high school graduates in 2026-2027. However, black non-Hispanics and Native Americans are projected to account for a smaller percentage of Nebraska’s public high school graduates in 2026-2027.
Actual and Projected Number of Nebraska High School Graduates 2006-2007 through 2026-2027
Note. The gap in the above line graph separates actual from projected graduates. See Figure 1.1.a.1 (page 23) and Figure 1.1.a.2 (page 25).

2018 Nebraska Higher Education Progress Report | Executive Summary S5
By Race/Ethnicity: Actual and Projected Percentages of Nebraska Public High School Graduates
Note. See Figure 1.1.a.3 (page 26).
2018 Nebraska Higher Education Progress Report | Executive Summary S6
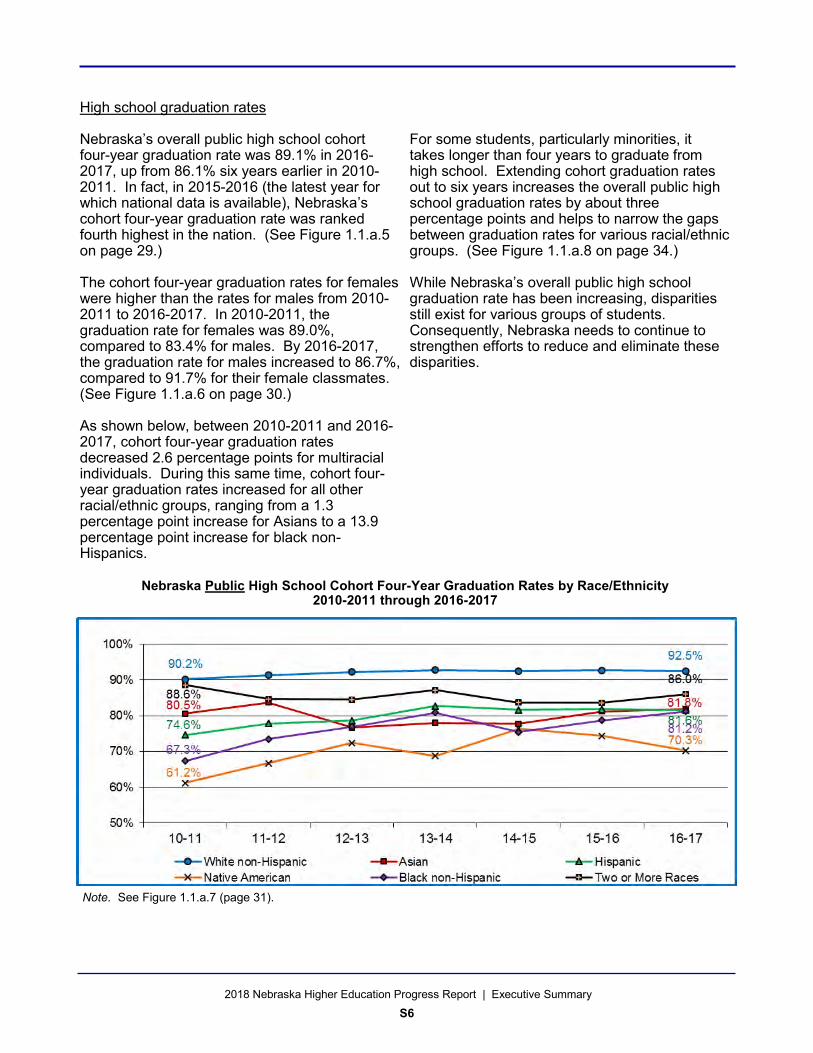
High school graduation rates Nebraska’s overall public high school cohort four-year graduation rate was 89.1% in 2016-2017, up from 86.1% six years earlier in 2010-2011. In fact, in 2015-2016 (the latest year for which national data is available), Nebraska’s cohort four-year graduation rate was ranked fourth highest in the nation. (See Figure 1.1.a.5 on page 29.) The cohort four-year graduation rates for females were higher than the rates for males from 2010-2011 to 2016-2017. In 2010-2011, the graduation rate for females was 89.0%, compared to 83.4% for males. By 2016-2017, the graduation rate for males increased to 86.7%, compared to 91.7% for their female classmates. (See Figure 1.1.a.6 on page 30.) As shown below, between 2010-2011 and 2016-2017, cohort four-year graduation rates decreased 2.6 percentage points for multiracial individuals. During this same time, cohort four-year graduation rates increased for all other racial/ethnic groups, ranging from a 1.3 percentage point increase for Asians to a 13.9 percentage point increase for black non-Hispanics.
For some students, particularly minorities, it takes longer than four years to graduate from high school. Extending cohort graduation rates out to six years increases the overall public high school graduation rates by about three percentage points and helps to narrow the gaps between graduation rates for various racial/ethnic groups. (See Figure 1.1.a.8 on page 34.) While Nebraska’s overall public high school graduation rate has been increasing, disparities still exist for various groups of students. Consequently, Nebraska needs to continue to strengthen efforts to reduce and eliminate these disparities.
Nebraska Public High School Cohort Four-Year Graduation Rates by Race/Ethnicity 2010-2011 through 2016-2017
Note. See Figure 1.1.a.7 (page 31).

2018 Nebraska Higher Education Progress Report | Executive Summary S7
Preparation for college The average ACT composite score for Nebraska high school students was 21.4 in 2017, compared to 22.1 in 2007. Nebraska’s 2017 ACT composite score is higher than the 2017 national average of 21.0. (See Figure 1.1.b.2 on page 37.) Data from ACT, Inc. for the class of 2017 suggest that only 28% of Nebraska’s ACT-tested high school graduates are sufficiently prepared to succeed in all four common areas of entry-level college coursework: algebra, biology, English, and social science. (See Figure 1.1.b.4 on page 39.) Furthermore, as shown below, compared to their white non-Hispanic and Asian classmates, even lower percentages of the state’s Hispanic, Native American, black non-Hispanic, and multiracial high school graduates are adequately prepared for entry-level college coursework.
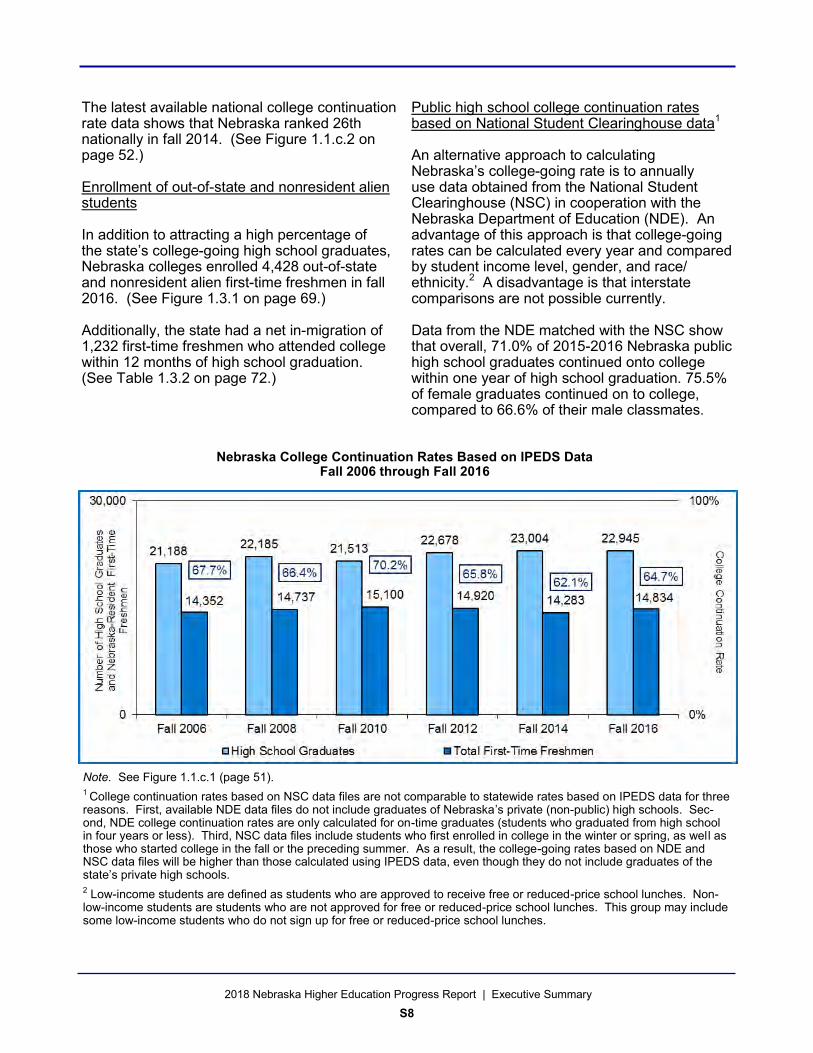
College continuation rates: using IPEDS data While limited by its fall enrollment measure, the most common approach to estimating college continuation rates uses data collected every two years through the Integrated Postsecondary Education Data System (IPEDS) maintained by the National Center for Education Statistics (NCES). The advantage of this approach is that, every other year, Nebraska’s college-going rate can be compared directly to the rates of other states. For Nebraska, the latest available IPEDS data are for the high school graduating class of 2015-2016 who continued to college in fall 2016. Of the 22,945 students who graduated from high school in 2015-2016, 35.3% did not go on to college in fall 2016, while 52.8% went to college in Nebraska and 11.9% went out of state to further their education. Based on the latest available IPEDS data, a total of 64.7% of Nebraska’s high school graduates from the class of 2015-2016 enrolled in college in fall 2016, a decrease of 3.0 percentage points from the 67.7% continuation rate in 2006.
Percentages of 2017 ACT-Tested Nebraska High School Students Who Met or Exceeded ACT College Readiness Scores by Race/Ethnicity
Percentages of 2015-2016 Nebraska High School Graduates by Whether and Where They Went to
College in Fall 2016
Note. Data for Native Hawaiians and other Pacific Islanders is excluded from this figure due to the small number of individuals (23) who took the ACT Assessment. See Figure 1.1.b.6 (page 42).
Note. College continuation rate limited to students who enroll in the fall following their high school graduation. See Figure 1.1.c.3 (page 54).
2018 Nebraska Higher Education Progress Report | Executive Summary S8
Note. See Figure 1.1.c.1 (page 51).
1 College continuation rates based on NSC data files are not comparable to statewide rates based on IPEDS data for three reasons. First, available NDE data files do not include graduates of Nebraska’s private (non-public) high schools. Sec-ond, NDE college continuation rates are only calculated for on-time graduates (students who graduated from high school in four years or less). Third, NSC data files include students who first enrolled in college in the winter or spring, as well as those who started college in the fall or the preceding summer. As a result, the college-going rates based on NDE and NSC data files will be higher than those calculated using IPEDS data, even though they do not include graduates of the state’s private high schools. 2 Low-income students are defined as students who are approved to receive free or reduced-price school lunches. Non-low-income students are students who are not approved for free or reduced-price school lunches. This group may include some low-income students who do not sign up for free or reduced-price school lunches.
Nebraska College Continuation Rates Based on IPEDS Data Fall 2006 through Fall 2016
The latest available national college continuation rate data shows that Nebraska ranked 26th nationally in fall 2014. (See Figure 1.1.c.2 on page 52.) Enrollment of out-of-state and nonresident alien students In addition to attracting a high percentage of the state’s college-going high school graduates, Nebraska colleges enrolled 4,428 out-of-state and nonresident alien first-time freshmen in fall 2016. (See Figure 1.3.1 on page 69.) Additionally, the state had a net in-migration of 1,232 first-time freshmen who attended college within 12 months of high school graduation. (See Table 1.3.2 on page 72.)
Public high school college continuation rates based on National Student Clearinghouse data1
An alternative approach to calculating Nebraska’s college-going rate is to annually use data obtained from the National Student Clearinghouse (NSC) in cooperation with the Nebraska Department of Education (NDE). An advantage of this approach is that college-going rates can be calculated every year and compared by student income level, gender, and race/ethnicity.2 A disadvantage is that interstate comparisons are not possible currently. Data from the NDE matched with the NSC show that overall, 71.0% of 2015-2016 Nebraska public high school graduates continued onto college within one year of high school graduation. 75.5% of female graduates continued on to college, compared to 66.6% of their male classmates.
2018 Nebraska Higher Education Progress Report | Executive Summary S9
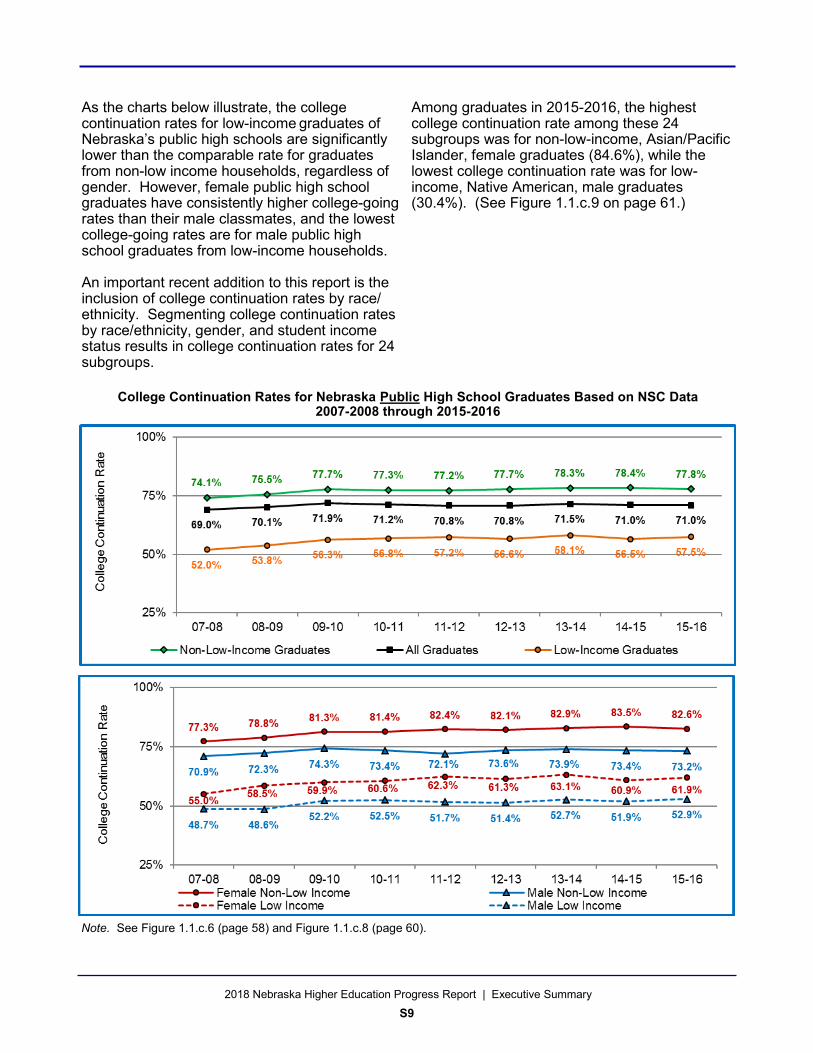
As the charts below illustrate, the college continuation rates for low-income graduates of Nebraska’s public high schools are significantly lower than the comparable rate for graduates from non-low income households, regardless of gender. However, female public high school graduates have consistently higher college-going rates than their male classmates, and the lowest college-going rates are for male public high school graduates from low-income households. An important recent addition to this report is the inclusion of college continuation rates by race/ethnicity. Segmenting college continuation rates by race/ethnicity, gender, and student income status results in college continuation rates for 24 subgroups.
Among graduates in 2015-2016, the highest college continuation rate among these 24 subgroups was for non-low-income, Asian/Pacific Islander, female graduates (84.6%), while the lowest college continuation rate was for low-income, Native American, male graduates (30.4%). (See Figure 1.1.c.9 on page 61.)
College Continuation Rates for Nebraska Public High School Graduates Based on NSC Data 2007-2008 through 2015-2016
Note. See Figure 1.1.c.6 (page 58) and Figure 1.1.c.8 (page 60).

2018 Nebraska Higher Education Progress Report | Executive Summary S10
Trends in first-time freshmen enrollments Using IPEDS data collected every other year, the Commission monitors the enrollment of first-time freshmen who are residents of Nebraska, classified by whether they start college within 12 months of high school graduation or wait to enroll in college more than 12 months after they graduate from high school. The Commission’s latest analysis reveals that between fall 2006 and fall 2016, the number of first-time freshmen (FTF) who enrolled within a year of high school graduation increased at the University of Nebraska (9.3%) and the
community colleges (9.6%). Meanwhile, the state colleges, independent institutions, and for-profit/career schools reported decreases of 8.1%, 12.5%, and 55.4%, respectively. Analysis also reveals that the number of FTF who started college more than a year after high school graduation decreased between fall 2006 and fall 2016 within all sectors.
Changes in the Numbers of Nebraska-Resident, First-Time Freshmen Enrolled at Nebraska Postsecondary Institutions within 12 Months of High School Graduation
Fall 2016 Compared to Fall 2006
Note. See Figure 1.2.2 (page 66) and Figure 1.2.4 (page 68).
Changes in the Numbers of Nebraska-Resident, First-Time Freshmen Enrolled at Nebraska Postsecondary Institutions More than 12 Months After High School Graduation
Fall 2016 Compared to Fall 2006

2018 Nebraska Higher Education Progress Report | Executive Summary S11
First-time freshmen enrollments by race/ethnicity Based on IPEDS data collected annually, higher numbers of Asian/Pacific Islanders, Hispanics, and black non-Hispanics were enrolled at Nebraska institutions in fall 2016 than in fall 2006. Over the same period, there was a predictable decrease in the number of white non-Hispanic first-time freshmen, given the decrease over the last decade in the number of white non-Hispanics who graduated from Nebraska’s public high schools. (See Figure 1.4.1 and Figure 1.4.2 on page 74.) There were 2,031 more minority students attending Nebraska colleges as first-time freshmen in fall 2016 than in fall 2006, an increase of 88.2%. (Hispanic enrollments
accounted for 61.9% of this increase.) In comparison, there were 1,863 fewer white non-Hispanic first-time freshmen in fall 2016 than in fall 2006, a decrease of 12.5%. As shown in the chart below, white non-Hispanics, Asians/Pacific Islanders, and multiracial individuals were overrepresented among first-time freshmen in fall 2016, while Hispanics, Native Americans, and black non-Hispanics were underrepresented among first-time freshmen in fall 2016. This should be interpreted as an approximate measure of representation of the previous year high school graduating class as it does not account for in-state and out-of-state enrollments.
Percentages of 2015-2016 Nebraska High School Graduates and First-Time Freshmen Enrolled at Nebraska Colleges and Universities in Fall 2016 by Race/Ethnicity
Note. See Figure 1.4.3 (page 75).

2018 Nebraska Higher Education Progress Report | Executive Summary S12
The importance of state-funded financial aid Over the last decade, Nebraska has made progress toward the goal of improving access to higher education by increasing the amount of state funds allocated for need-based financial aid. However, additional financial aid is needed to enable more of Nebraska’s low-income and moderately low-income students to go to college, stay enrolled, and complete degrees. Nebraska currently provides need-based financial aid to college students through the Nebraska Opportunity Grant (NOG) Program, originally authorized as the Nebraska State Grant Program by the Nebraska Scholarship Act, which was passed by the Legislature in 2003. Including state lottery and federal funds, total dollars available for the state grant program increased from $10,295,730 in 2006-2007 to $16,889,748 in 2016-2017. Meanwhile, the number of low-income students served by the NOG program increased 9.0%, from 11,860 in 2006-2007 to 12,928 in 2016-2017, and the average award increased 49.1%, from $876 to $1,306. (See Figure 1.5.2 on page 83.)
The success of the ACE Scholarship Program The state-funded Access College Early (ACE) Scholarship Program, which was initiated in 2007-2008, enables eligible low-income students to take college courses while they are still enrolled in high school. Using state and federal funds, appropriations for ACE scholarships increased from $115,000 in 2007-2008 to $951,414 in 2016-2017. For 2017-2018, $985,000 of state funds is appropriated for ACE scholarships. In 2007-2008, 294 Nebraska high school students took 1,698 credit hours of college coursework paid for by their ACE scholarships. With increased funding, 2,157 low-income Nebraska high school students were able to take 13,977 credit hours of college coursework in 2016-2017. (See Figure 1.5.6 on page 92.) Research on the college continuation rates of ACE Scholarship recipients As illustrated in the chart on the following page, the college continuation rates of ACE scholarship recipients are significantly higher than the college continuation rates of other low-income public high school graduates. Since inception, the college-going rates of ACE scholarship recipients have been higher than, or about equal to, the college-going rates of non-low-income graduates of the state’s public high schools.
Available Funding for Nebraska’s State Grant Program
2016-2017 Compared to 2006-2017
Note. See Figure 1.5.1 (page 82).

2018 Nebraska Higher Education Progress Report | Executive Summary S13
College Continuation Rates for Public High School Seniors who Received ACE Scholarships Compared to the College Continuation Rates of Other Public High School Graduates
2007-2008 through 2015-2016
Note. See Figure 1.5.8 (page 95).

2018 Nebraska Higher Education Progress Report | Executive Summary S14
Success is measured not only by the number of freshmen who enroll in college, but by those who stay in college beyond their freshmen year and earn degrees or other awards. Based on IPEDS data that are collected annually, freshmen retention rates and graduation rates are not improving across all sectors of higher education in Nebraska.3 Furthermore, analyses of IPEDS data show that there are continuing racial/ethnic disparities in graduation rates. However, analysis of records at the National Student Clearinghouse provides evidence that notable percentages of students who start college at Nebraska’s public and independent institutions transfer to other schools where they persist in their studies and earn degrees or certificates. This study also reveals that students
who attend college part time are far less likely to complete degree or certificate programs than students who attend college full time. Freshmen retention rates As shown in the chart below, full-time freshmen retention rates for the University of Nebraska and the independent sector were higher in fall 2016 than they were in fall 2006. For the remaining sectors, full-time retention rates were lower in fall 2016 than they were in fall 2006 or data are not sufficient to compute a sector retention rate for fall 2006. Retention rates for full-time students in fall 2015 varied between the sectors, ranging from 62.3% at the community colleges to 81.1% at the University of Nebraska.
Priority 2 Increase the percentage of students who enroll and successfully
complete a degree
Full-Time Freshmen Retention Rates of Nebraska Postsecondary Institutions by Sector Fall 2016 Compared to Fall 2006
Note. See Figure 2.1.1 (page 99).
3 The freshmen retention rate is the number of freshmen who are enrolled at the same college one year later. The IPEDS definition of a college graduation rate is the percentage of full-time, first-time freshmen who complete their degree programs at the same college within 150% of the time specified for the programs. For example, the specified time frame for four-year programs is six years, while the time frame for two-year programs is three years.

2018 Nebraska Higher Education Progress Report | Executive Summary S15
Full-time and part-time retention rates compared Freshmen retention rates for full-time and part-time students at the state’s public institutions are compared in the chart below. This comparison clearly indicates that students who start college full time are much more likely than part-time students to continue going to college beyond their freshmen year. Conversely, freshmen who attend college only part time are less likely to continue their studies and, therefore, are less likely to earn degrees. Nebraska freshmen retention rates compared to those of other states Nebraska’s retention rates for 2016 were generally lower than corresponding national rates. For four-year public institutions, Nebraska’s full-time retention rate was 78.8% and its part-time retention rate was 49.3%
(compared to 81.1% and 54.7% nationally). For two-year public institutions, Nebraska’s full-time retention rate was 62.3% and its part-time rate was 37.1% (compared to 62.0% and 44.3% nationally). (See Figure 2.1.3, Figure 2.1.4, Figure 2.1.5, and Figure 2.1.6 on pages 102-105.) Some of these differences may result from the propensity of Nebraska students to transfer after their first year compared to students in other states.
Fall 2016 Full-Time and Part-Time Freshmen Retention Rates for Students in Nebraska’s Public Colleges and Universities
Note. See Figure 2.1.1 (page 99) and Figure 2.1.2 (page 100).

2018 Nebraska Higher Education Progress Report | Executive Summary S16
College graduation rates based on IPEDS data Historically, graduation rates based on IPEDS data have been calculated only for full-time students who graduate within 150% of normal time from the same college where they started as first-time freshmen. Because transfer students are not tracked into subsequent institutions, IPEDS graduation rates underestimate the percentage of first-time full-time freshmen who complete degree, certificate, or diploma programs.4 Based on IPEDS data, the statewide graduation rate for Nebraska’s public four-year institutions increased from 53.7% in 2005-2006 to 57.2% in 2015-2016. Meanwhile, the statewide graduation rate for Nebraska’s public two-year institutions was 31.7% in 2005-2006 and 2015-2016. (See Figure 2.2.1 on page 107.) In 2015-2016, sector graduation rates ranged from 31.5% at Nebraska’s community colleges to 66.6% at the for-profit/career schools. The lower graduation rates at the community colleges are due in part to the number of students who begin their studies at a community college and transfer to another institution. In 2015-2016, Nebraska’s six community colleges had an overall transfer rate of 18.2%. (See Figure 2.2.11 on page 117.)
Racial/ethnic disparities in graduation rates As shown in the chart on the next page, Hispanics, Native Americans, black non-Hispanics, and multiracial students have significantly lower college graduation rates than white non-Hispanics and Asian/Pacific Islanders. Between 2005-2006 and 2015-2016, graduation rates increased for white non-Hispanics and Asian/Pacific Islanders but decreased for Hispanics, Native Americans, and black non-Hispanics. Between 2005-2006 and 2015-2016, graduation rates at the University of Nebraska decreased for Native Americans but increased for all other racial/ethnic groups. (See Figure 2.2.4 on page 110.) At the state colleges, graduation rates decreased for white non-Hispanics, remained the same for Asian/Pacific Islanders, and increased for all other racial/ethnic groups. (See Figure 2.2.5 on page 111.)
Graduation Rates within 150% of Normal Time for Nebraska Postsecondary Institutions by Sector 2015-2016 Compared to 2005-2006
Note. 150% of expected time is equivalent to six years for a bachelor’s degree and three years for an associate’s degree. See Figure 2.2.2 (page 108). 4 The recent addition of the IPEDS Outcome Measures Survey may yield usable data in the future for calculating the graduation rates over time for non-first-time students and part-time students.

2018 Nebraska Higher Education Progress Report | Executive Summary S17
Graduation rates at Nebraska’s community colleges decreased for Hispanics and Native Americans but increased for all other racial/ethnic groups. (See Figure 2.2.6 on page 111.) At Nebraska’s independent institutions, graduation rates decreased for Hispanics and black non-Hispanics, remained the same for Native Americans, and increased for white non-Hispanics and Asian/Pacific Islanders. See Figure 2.2.7 on page 112.) Meanwhile, graduation rates at the for-profit/career schools decreased for Hispanics and Native Americans but increased for all other racial/ethnic groups. (See Figure 2.2.9 on page 112.) College graduation rates by financial aid received Beginning with the 2018 Progress Report, the Commission has obtained IPEDS college graduation rates for Pell Grant recipients and graduation rates for Subsidized Stafford Loan recipients that did not receive Pell Grants and has compared these rates to students that did not receive these grants or loans. Pell Grants and Subsidized Stafford Loans are awarded to students who have demonstrated financial need, and they serve as a proxy for low-income students.
The 2015-2016 graduation rate for Pell Grant recipients at two-year public institutions was 26.6% while the graduation rate for Subsidized Stafford Loan recipients was 40.4%. Students at two-year public institutions who did not receive these grants or loans had an overall graduation rate of 36.6%. (See Table 2.2.1 on page 113.) The 2015-2016 graduation rate for Pell Grant recipients at four-year public institutions was 48.9% while the graduation rate for Subsidized Stafford Loan recipients was 54.0%. Students at four-year public institutions who did not receive these grants or loans had an overall graduation rate of 64.1%. (See Table 2.2.2 on page 114.) Nebraska graduation rates compared to those of other states Nebraska’s 2015-2016 six-year graduation rate for degree-granting four-year institutions was 59.2%, compared to 54.9% nationally. For degree-granting two-year institutions, Nebraska’s three-year graduation rate was 31.9%, compared to 30.4% nationally. (See Figure 2.2.9 and Figure 2.2.10 on pages 115 and 116.)
Graduation Rates within 150% of Normal Time for Nebraska Postsecondary Institutions by Race/Ethnicity
2015-2016 Compared to 2005-2006
Note. See Figure 2.2.3 (page 109).

2018 Nebraska Higher Education Progress Report | Executive Summary S18
Graduation and persistence rates based on National Student Clearinghouse data The National Student Clearinghouse Research Center recently conducted a study of six-year student outcomes based on a national cohort of degree-seeking, first-time freshmen who started college in fall 2010, analyzed by state as well as for the United States as a whole. For the study, students were classified by the state of the institution where they first started college and by type of institution. Based on Clearinghouse enrollment and completion records, comparable six-year completion and persistence rates were calculated for the students who started college at (a) two-year public colleges, (b) four-year public colleges and universities, and (c) four-year private nonprofit institutions.5
In addition, completion and persistence rates were calculated for exclusively full-time students, exclusively part-time students, mixed enrollment students with combinations of full- and part-time enrollment, students who started college when they were 20 years of age or younger, students who started college when they were 21 to 24 years of age, and students who were 25 or older when they first enrolled in college. The completion and persistence rates that the Clearinghouse calculated for Nebraska were sometimes higher and sometimes lower than the comparable national rates, depending on the type of institution and the student enrollment or age group that was analyzed. More importantly, the findings of the study confirm that college completion and persistence rates vary significantly by student enrollment status and age group, as well as by the type of institution where students first enroll. The findings of the Clearinghouse study are evidence that students who enroll initially at four-year institutions—public or private nonprofit—are more likely to earn degrees or certificates than
students who start college at two-year institutions, regardless of whether they enroll full or part time. However, students who are able to attend college full time—exclusively or at least sometime during the course of their studies—are much more likely to earn degrees or certificates and less likely to drop out of college than students who go to college only part time. (See Figure 2.3.5 on page 124.) The findings of the Clearinghouse study also are evidence that students who start college when they are age 20 or younger are more likely to persist in their studies and complete degree or certificate programs than students who don’t start college until they are over the age of 20. (See Figure 2.3.7 on page 125.) This is not surprising since non-traditional students often have family and work responsibilities that may be equally or more important than finishing college. The completion rates calculated by the Clearinghouse also confirm that a notable percentage of freshmen start college at one institution and then transfer to another where they complete a program of study. Specifically, 15.3% to 20.1% of the degree-seeking, first-time students at Nebraska’s public and private nonprofit institutions in fall 2010 graduated from two-year or four-year schools to which they had transferred. (See Figure 2.3.3 on page 122.) Another finding of interest is that 14.9% of the students who initially enrolled at Nebraska’s two-year public colleges in fall 2010 graduated from four-year institutions over the course of the next six years. (See Table A12.2 on page 300.)
5 Completion rates and graduation rates are synonymous terms. In general, a completion or graduation rate is the percentage of students in a specified cohort who earn degrees, certificates, or diplomas within a specified period of time. A persistence rate is the percentage of the students in a cohort who have not earned degrees or other academic awards but who are still enrolled in college at the end of a specified period of time.

2018 Nebraska Higher Education Progress Report | Executive Summary S19
Beginning in 2005, the U.S. Census Bureau started collecting data annually through the American Community Survey (ACS) to estimate net migration by education level for each state. Because the ACS estimates for Nebraska are based on very small sample sizes, the migration estimates for 22- to 64-year-olds developed from ACS data can vary dramatically from one year to another, not because any significant changes in migration patterns have occurred, but because estimates based on small samples commonly fluctuate as a result of sampling error. Theoretically, by calculating migration estimates based on the combined data collected through five consecutive ACS surveys, these limitations may be reduced. Therefore, average annual migration estimates are calculated using five-year ACS PUMS files. In addition, to help provide context to the average annual migration estimates, the educational attainment of 22- to 64-year-olds is also discussed. Educational Attainment for 22- to 64-Year-Olds Between 2007-2011 and 2012-2016, Nebraska’s estimated population of 22- to 64-year-olds increased 2.3%. As shown below by education level, Nebraska’s estimated population of 22- to 64-year-olds decreased 2.1 percentage points for high school graduates or below, decreased 0.7 percentage point for those with some college or an associate’s degree, and increased 2.7 percentage points for those with a bachelor’s degree or higher. The result of these increases
and decreases is that overall, educational attainment in Nebraska is increasing. Migration Estimates for 22- to 64-Year-Olds Between 2007-2011, Nebraska had an average annual net in-migration of 2,165 working-age adults with a high school education or below and an average annual net out-migration of 1,590 working-age adults with a bachelor’s degree or higher. (See Figure 3.2 on page 132.) Due to sample size limitations, no conclusions can be drawn for the net migration of those with some college or associate’s degrees for 2007-2011 or the net migration for any education level for 2012-2016. Migration Estimates Compared to Educational Attainment for 22- to 64-Year-Olds As shown below, for every 10,000 people in Nebraska with a bachelor’s degree or higher, there was an average annual net out-migration of 47.6 22- to 64-year-olds between 2012-2016. However, caution should be exercised when interpreting the migration estimates based on ACS data. While out-migration of Nebraskans with at least a bachelor’s degree continues to be a serious issue that Nebraska must address, it is worth noting that the educational attainment of 22- to 64-year-olds continues to increase, albeit less than it would have if out-migration were curtailed.
Priority 3
Reduce, eliminate, and then reverse the net out-migration of
Nebraskans with high levels of educational attainment
Nebraska Educational Attainment of 22- to 64-Year Olds
Note. See Figure 3.1 (page 131).
Nebraska Net Migration by Education Level per 10,000 People Age 22 to 64
Note. See page 134.
2018 Nebraska Higher Education Progress Report | Executive Summary S20
2018 Progress Report Conclusion
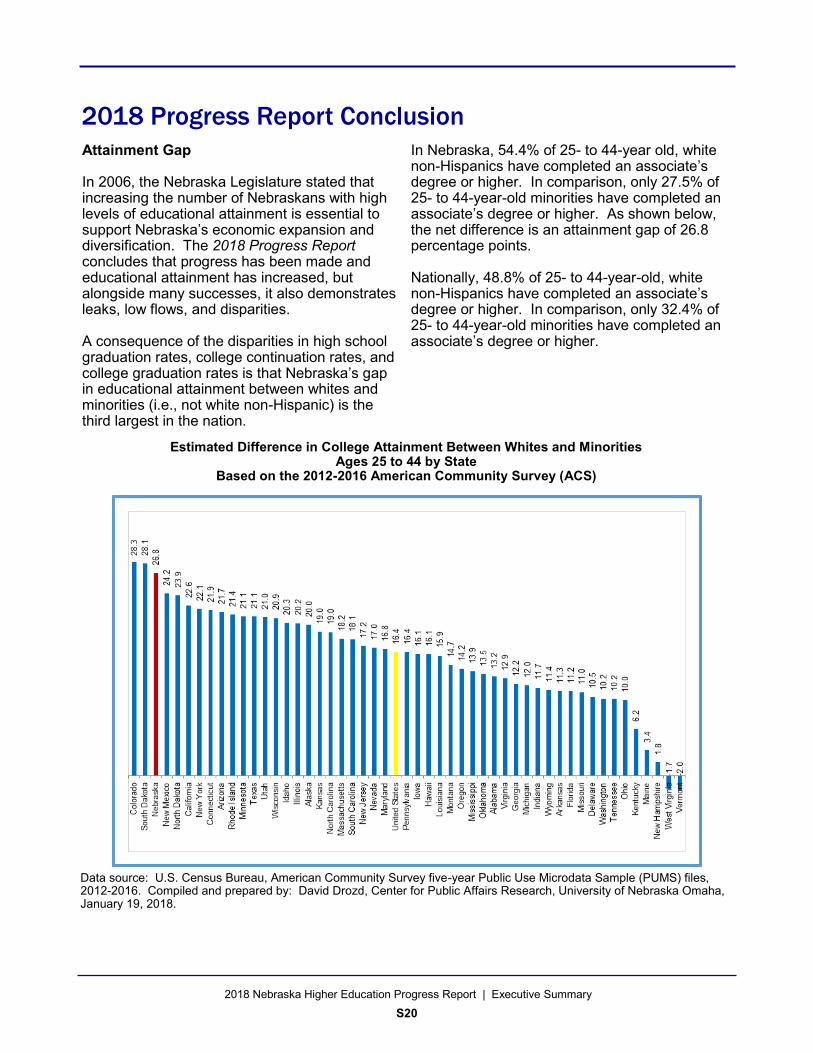
Estimated Difference in College Attainment Between Whites and Minorities Ages 25 to 44 by State
Based on the 2012-2016 American Community Survey (ACS)
Attainment Gap In 2006, the Nebraska Legislature stated that increasing the number of Nebraskans with high levels of educational attainment is essential to support Nebraska’s economic expansion and diversification. The 2018 Progress Report concludes that progress has been made and educational attainment has increased, but alongside many successes, it also demonstrates leaks, low flows, and disparities. A consequence of the disparities in high school graduation rates, college continuation rates, and college graduation rates is that Nebraska’s gap in educational attainment between whites and minorities (i.e., not white non-Hispanic) is the third largest in the nation.
In Nebraska, 54.4% of 25- to 44-year old, white non-Hispanics have completed an associate’s degree or higher. In comparison, only 27.5% of 25- to 44-year-old minorities have completed an associate’s degree or higher. As shown below, the net difference is an attainment gap of 26.8 percentage points. Nationally, 48.8% of 25- to 44-year-old, white non-Hispanics have completed an associate’s degree or higher. In comparison, only 32.4% of 25- to 44-year-old minorities have completed an associate’s degree or higher.
Data source: U.S. Census Bureau, American Community Survey five-year Public Use Microdata Sample (PUMS) files, 2012-2016. Compiled and prepared by: David Drozd, Center for Public Affairs Research, University of Nebraska Omaha, January 19, 2018.

2018 Nebraska Higher Education Progress Report | Executive Summary S21
Among the Commission’s statutory duties are to “Encourage initiatives and collaboration between public institutions, public state and local entities, and private state and local entities to increase the contribution of postsecondary education in advancing Nebraska’s economy.” The findings evidenced in the 2018 Progress Report indicate that more work needs to be done in order for Nebraskans to enroll in college and successfully complete degrees. Among the initiatives and collaboration that may address the shortcomings identified in the 2018 Progress Report are the following recommendations.
At the High School Level: Increase the percentage of students who stay
in school and earn diplomas. Nebraska’s 2015-2016 public high school graduation rate is one of the best in the nation (89.3%), but disparities continue to be seen. While 91.7% of females graduate, only 86.7% of males earn diplomas. Disparities are even more pronounced between racial/ethnic groups with only 70.3% (Native American) to 86.0% (two or more races) of minorities earning diplomas.
Increase the percentage of students who are
prepared academically for college. According to ACT, only 28% of Nebraska’s ACT-tested high school graduates are sufficiently prepared to succeed in college. With the recent requirement that all high school juniors take the ACT, Nebraska has an opportunity to identify students who are likely to need developmental education prior to enrolling in college-level courses and remediate deficiencies during the students’ senior year, saving them time and money when they pursue a postsecondary credential.
Increase the number of students who take
dual and concurrent enrollment courses that grant college credit and make sure opportunities to take such courses are equitable. This will require that districts have the resources and information to partner with postsecondary institutions, that interested high school teachers have the opportunity and incentives to meet faculty qualification standards, and that students are not denied the opportunity to participate as a result of financial resources.
For males, minorities, and low-income students especially, more effort needs to be exerted to increase:
- The percentage who are prepared for college academically - The number who take dual enrollment courses - High school graduation rates - College-going rates Increase opportunities for high school
students to connect to career pathways of interest to them that lead to employment and additional education, such as through the continuing development of career academies and internship programs. Consider innovative partnership models, such as the Northeast Nebraska Career Academy Partnership, to address the unique needs of rural school districts.
At the Postsecondary Level: Increase the percentage of high school
graduates who go on to college, encouraging as many as possible to enroll full time and not delay enrollment. About 71.0% of Nebraska public high school graduates go on to college, but National Student Clearinghouse research shows that those who attend school full-time are much more likely to earn degrees than those who attend part-time.
Increase counseling to improve students’
awareness of the range of higher education opportunities, their associated career pathways, and possible employment outcomes to help students plan the most direct pathway to their educational goals.
2018 Progress Report Recommendations
2018 Nebraska Higher Education Progress Report | Executive Summary S22
Increase efforts to improve retention and persistence rates, such as integrated planning and advising systems. Full-time retention rates vary by sector, ranging from 62.3% at the community colleges to 81.1% at the University of Nebraska.
Support and expand efforts, such as Transfer
Nebraska and 2+2 agreements, to improve students’ knowledge of how credits will transfer among Nebraska colleges and universities, allowing them to plan their path to a degree in the most efficient manner.
Increase efforts to improve graduation rates
for all students across all sectors of higher education in Nebraska, especially at the community colleges and for minority students at all institutions. While graduation rates are generally increasing for minority students, they continue to lag behind their white non-Hispanic and Asian classmates.
Reach out to adults with college credit but no
earned certificates or degrees with degree completion initiatives. Identify what additional resources may be necessary to be successful.
Reach out to adults who have not attained a
high school diploma to enroll them in adult education programs that result in a GED and prepare them for the workforce and additional postsecondary education.
Partner with other colleges and universities
and state departments to use longitudinal data to study the employment patterns of recent graduates so that strategies to reduce brain-drain can be developed and implemented in a targeted fashion.
At the State Government Level: Adequately fund public colleges and
universities to maintain affordable tuition and fees, provide adequate student support services and timely course offerings, and ensure that a full range of programs connected to Nebraska’s statewide and regional economic needs is available.
Continue to support and increase funding for the Nebraska Opportunity Grant program so that more students that are eligible will receive aid. Currently, only about one-third of eligible students receive aid. Nebraska must reduce the gap in college enrollment and graduation rates between low-income and non-low-income high school graduates.
Continue to support and increase funding for
the ACE program so that scholarships are sufficient to allow all academically qualified students to participate in dual enrollment courses.
Evaluate programs, such as Tennessee
Reconnect and Indiana Adult Student Grants, that are aimed at adults without degrees to determine the costs and benefits of adopting similar programs in Nebraska.
Evaluate programs, such as Minnesota’s Two
-Year Occupational Grant Program and South Dakota’s Dakota Builds scholarship, that pay tuition and fees for community college students in technical fields, for their suitability to Nebraska, particularly for ACE recipients who have accumulated college credits in high-need technology fields while in high school.
Annually measure progress toward the
Comprehensive Statewide Plan for Postsecondary Education’s goal that Nebraska be among the top ten states in educational attainment.
Initiate incentives for the state’s public-funded
colleges and universities to improve graduation rates and increase the number of degrees and certificates awarded.
Encourage the growth of high-wage, high-skill
jobs that keep Nebraska graduates in Nebraska and inspire students to pursue postsecondary credentials.

2018 Nebraska Higher Education Progress Report | Executive Summary S23
University of Nebraska Nebraska College of Technical Agriculture University of Nebraska at Kearney University of Nebraska-Lincoln University of Nebraska Medical Center University of Nebraska at Omaha Nebraska State College System Chadron State College Peru State College Wayne State College Nebraska Community Colleges Central Community College Metropolitan Community College Mid-Plains Community College Northeast Community College Southeast Community College Western Nebraska Community College Independent College & Universities Bellevue University Bryan College of Health Sciences Clarkson College College of Saint Mary Concordia University-Seward Creighton University Dana College (Closed Fall 2010) Doane University-Arts & Sciences Doane University-Graduate and Professional Studies Grace University Hastings College Little Priest Tribal College Midland University Nebraska Christian College of Hope International University Nebraska Indian Community College Nebraska Methodist College of Nursing & Allied Health Nebraska Wesleyan University Summit Christian College Union College York College
For-Profit/Career Schools Capitol School of Hairstyling and Esthetics* CHI Health School of Radiologic Technology College of Hair Design* College of Hair Design-East Campus* Fullen School of Hair Design* (No longer an IPEDS reporting institution Fall 2016) ITT Technical Institute-Omaha (Closed Fall 2016) Joseph’s College Cosmetology* Kaplan University-Lincoln Campus Kaplan University-Omaha Campus La’James International College* Mary Lanning Memorial Hospital School of Radiologic Technology Myotherapy Institute National American University-Bellevue Omaha School of Massage and Healthcare of Herzing University Paul Mitchell the School Lincoln* Regional West Medical Center School of Radiologic Technology* (No longer an IPEDS reporting institution Fall 2016) The Creative Center Universal College of Healing Arts University of Phoenix-Omaha Campus (Closed Fall 2015) Vatterott College (Closed Fall 2005) Vatterott College-Spring Valley (Closed Fall 2015) Xenon International Academy-Omaha*
Institutions Reporting to the Integrated Postsecondary Education Data System (IPEDS)
Note. See page 138 for a detailed listing of institutional changes that have occurred during the reporting period. All institutions in the for-profit/career school category are currently operated for profit except for the three schools of radiologic technology, which are operated by not-for-profit hospitals or medical centers, and Omaha School of Massage and Healthcare of Herzing University. * = Institution was classified as non-degree-granting as of the most recent IPEDS survey.

2018 Nebraska Higher Education Progress Report | Executive Summary S24
This page left blank intentionally.

Nebraska’s Coordinating Commission for Postsecondary Education – 2018 Progress Report 1
2018 Nebraska Higher Education Progress Report
Introduction
The 2018 Nebraska Higher Education Progress Report is the thirteenth annual report designed to provide the Nebraska Legislature with comparative statistics to monitor and evaluate progress toward achieving three major goals for Nebraska’s postsecondary education system. Developed by the LR 174 Higher Education Task Force in 2003, these key priorities are incorporated in subdivision (3) of LB 962 (2006), now Neb. Rev. Stat. § 85-1428, which states:
The Legislature finds that:
(1) Expansion and diversification of Nebraska’s economy are necessary in order to sustain essential public services sponsored or aided by the state;
(2) Increasing the number of Nebraskans with high levels of educational attainment is
essential to support economic expansion and diversification;
(3) In order to increase the number of Nebraskans with high levels of educational attainment, the state’s postsecondary education system shall include, but not be limited to, the following key priorities that were identified by the LR 174 Task Force of 2003:
(a) Increasing the number of students who enter postsecondary education in Nebraska;
(b) Increasing the percentage of students who enroll, persist, and successfully complete a degree; and (c) Reducing, eliminating, and then reversing the net out-migration of Nebraskans with
high levels of educational attainment; and
(4) Unprecedented collaboration and cooperation between and among educational institutions and sectors will be necessary to develop community, regional, and statewide strategies to achieve progress toward these priorities and to assist the state in serving Nebraska students and allowing them to reach their academic caliber.1
The 2018 Nebraska Higher Education Progress Report provides legislators and other state policy makers with a detailed comparative analysis to monitor progress toward the three key priorities listed above. Throughout this report, the latest available statistics are analyzed in the context of 10-year trends. These comparisons evidence the extent to which Nebraska’s postsecondary education system is making progress toward achieving the key priorities and corresponding strategic objectives recommended by the LR 174 Task Force. Nebraska’s postsecondary education system consists of five sectors of higher education. This report covers all five sectors and also includes important information about Nebraska high schools, which are a primary source of students for Nebraska’s postsecondary institutions. As defined in the Coordinating Commission’s Comprehensive Statewide Plan for Postsecondary Education, there are three public sectors of higher education in Nebraska:
1 Neb. Rev. Stat. § 85-1429 requires the Coordinating Commission for Postsecondary Education to provide, on or before March 15 of each year, a report that evaluates progress toward the achievement of the priorities listed in § 85-1428.

Nebraska’s Coordinating Commission for Postsecondary Education – 2018 Progress Report 2
University of Nebraska: “The University of Nebraska provides extensive, comprehensive postsecondary education to Nebraska citizens through its four campuses: the University of Nebraska-Lincoln, the University of Nebraska at Omaha, the University of Nebraska at Kearney, and the University of Nebraska Medical Center. The two-year Nebraska College of Technical Agriculture, under the management of the Institute of Agriculture and Natural Resources at UNL, is also part of the University of Nebraska system.”
Nebraska State College System: “The state colleges at Chadron, Peru, and Wayne are regional institutions that provide educational programs and public services to meet needs indigenous to their service areas.”
Nebraska Community Colleges: “Community colleges provide educational options for students seeking entry-level career training. The education program may culminate in an applied technology associate degree, diploma, or certificate; or an associate of arts or associate of science degree from an academic transfer program.” Nebraska’s six public community colleges are: Central, Metropolitan, Mid-Plains, Northeast, Southeast, and Western Nebraska.
In addition to the public colleges and universities, private not-for-profit, private for-profit, and federally-funded tribal colleges submit data to IPEDS and are categorized into one of two categories:
Nebraska Independent Institutions: All institutions in this sector are not-for-profit colleges, which includes 18 private four-year institutions and two federally-funded tribal colleges.
Nebraska For-Profit/Career Schools: All institutions in this sector are private for-profit colleges, except for the three schools of radiologic technology and Omaha School of Massage and Healthcare of Herzing University. Institutions in this sector offer programs in areas such as cosmetology, business, allied health, real estate, and skilled crafts.
The 2018 Progress Report provides an update of every section of the 2017 report—from an analysis of the pool of Nebraska high school graduates preparing for college to the migration of educated Nebraskans to and from the state—provided that updated information is available to report. Copies of all previous Progress Reports are available on the Coordinating Commission’s website: ccpe.nebraska.gov. However, due to data corrections and additions to the Commission’s database that have been made since the previous reports were published, the 2018 Progress Report supersedes all previous editions. In updating this report, the Coordinating Commission always uses the latest data available for analysis. However, for several of the analyses for this report, the Commission has to rely primarily on data collected through the Integrated Postsecondary Education Data System (IPEDS), which is maintained by the National Center for Education Statistics (NCES) in the U.S. Department of Education. Data obtained from the NCES are usually not available for six to nine months after they have been collected through IPEDS, and some data are collected only every other year. Consequently, the latest data available for analysis may not be the most current data.

Nebraska’s Coordinating Commission for Postsecondary Education – 2018 Progress Report 3
Section 1 Increasing Postsecondary Enrollment
Priority 1. Increase the number of students who enter postsecondary education in Nebraska. The first priority recommended by the 2003 LR 174 Task Force is to increase the number of students who enter postsecondary education in Nebraska. To monitor progress toward achieving this goal, this section compares the latest available total student unduplicated headcounts and enrollments of first-time freshmen to fall 2006 within the context of 10-year trends and estimated 11-year trends. The National Center for Education Statistics (NCES) in the U.S. Department of Education is the official source of the enrollment data summarized for fall 2006 through fall 2016. Enrollments for fall 2017 are preliminary, based on estimates that institutions reported directly to the Coordinating Commission for Postsecondary Education. Nebraska Total Fall Headcount Enrollment
• Total headcount—the count of all students taking courses for credit—at Nebraska’s
postsecondary institutions increased steadily from 125,543 in fall 2006 to 145,893 in fall 2010. However, total enrollment decreased 6.2% between fall 2010 and fall 2016. Furthermore, it is estimated that enrollment decreased 0.9% between fall 2016 and fall 2017. As a result, total headcount enrollment increased from 125,543 in fall 2006 to 136,917 in fall 2016, for a 10-year increase of 9.1%, as shown in Figure 1.1. In the context of estimated 11-year trends, total fall enrollment increased 8.1% between 2006 and 2017.
Figure 1.1
Total Fall Headcount Enrollment at Nebraska Postsecondary Institutions Fall 2006 through Fall 2017
Note. See Table A1.1 in Appendix 1 for supporting data. Data sources: For 2006 through 2016 data, National Center for Education Statistics (NCES), Integrated Postsecondary Education Data System (IPEDS) fall 2006 through fall 2016 surveys. Preliminary enrollments for fall 2017 were collected from each institution by the Coordinating Commission for Postsecondary Education, December 2017.
125,543136,925 136,917 135,663
0
30,000
60,000
90,000
120,000
150,000
180,000
2006 2007 2008 2009 2010 2011 2012 2013 2014 2015 2016 2017 Estimate
Tota
l Fal
l Hea
dcou
nt E
nrol
lmen
t
Nebraska State Total
Preliminary

Nebraska’s Coordinating Commission for Postsecondary Education – 2018 Progress Report 4
Nebraska Total Fall Headcount Enrollment by Sector • The University of Nebraska continues to lead the state’s higher education system in terms of
fall headcount enrollment. As shown in Figure 1.2, Nebraska’s state colleges and independent (not-for-profit) institutions have also contributed positively to the state’s increased enrollment since 2006. However, based on preliminary data for fall 2017, enrollments at Nebraska’s community colleges declined slightly, while the for-profit/career schools experienced substantial decreases in enrollments between fall 2006 and fall 2017.
• By sector, Nebraska’s postsecondary enrollment has changed as follows:
Sector
1-Year Change
2015 to 2016
Est. 1-Year Change
2016 to 2017
10-Year Change
2006 to 2016
Est. 11-Year Change
2006 to 2017 University of Nebraska 1.3% 0.4% 14.6% 15.1% Nebraska State College System -0.3% -5.9% 9.8% 3.3% Nebraska Community Colleges 0.8% 0.5% -2.5% -2.0% Independent Colleges & Universities -1.4% -1.8% 24.7% 22.5% For-Profit/Career Schools -18.8% -25.0% -45.9% -59.4%
Figure 1.2 Fall Headcount Enrollment at Nebraska Postsecondary Institutions by Sector
Fall 2006 through Fall 2017
Note. See Table A1.2 in Appendix 1 for supporting data. Data sources: For 2006 through 2016 data, National Center for Education Statistics, IPEDS fall 2006 through fall 2016 surveys. Preliminary enrollments for fall 2017 were collected from each institution by the Coordinating Commission for Postsecondary Education, December 2017.
45,819
51,835 52,516 52,718
8,108 8,930 8,905 8,378
40,444
39,107 39,436 39,641
27,197
34,404 33,908 33,313
3,975 2,649 2,152 1,613
0
15,000
30,000
45,000
60,000
2006 2007 2008 2009 2010 2011 2012 2013 2014 2015 2016 2017 Estimate
Tota
l Fal
l Hea
dcou
nt E
nrol
lmen
t
University of Nebraska Nebraska State College SystemNebraska Community Colleges Independent Colleges & UniversitiesFor-Profit/Career Schools
Preliminary

Nebraska’s Coordinating Commission for Postsecondary Education – 2018 Progress Report 5
Nebraska Public Colleges and Universities: Fall Enrollment by Institution Within all sectors, changes in enrollment vary from one institution to another. The charts in this section show the enrollment trends of the institutions in each public sector from fall 2006 to fall 2017. University of Nebraska • From fall 2006 to fall 2017, fall enrollment increased an estimated 15.1% at the
University of Nebraska. All institutions experienced increases during this 11-year period, with the largest increase seen at the University of Nebraska Medical Center (28.7%).
• Following are the most recent one-year changes in enrollment, as well as the total
changes in enrollment between fall 2006 and fall 2017, at the institutions constituting the University of Nebraska:
Institution
1-Year Change
2015 to 2016
Est. 1-Year Change
2016 to 2017
10-Year Change
2006 to 2016
Est. 11-Year Change
2006 to 2017 Neb. College of Technical Agriculture -33.2% -7.3% 25.7% 16.5% University of Nebraska at Kearney 0.6% -2.1% 4.9% 2.7% University of Nebraska-Lincoln 2.5% 0.7% 17.1% 18.0% University of Neb. Medical Center 1.9% 2.2% 25.9% 28.7% University of Nebraska at Omaha 0.7% 0.7% 12.4% 13.1%
Figure 1.3 Fall Headcount Enrollment at the University of Nebraska by Institution
Fall 2006 through Fall 2017
Note. See Table A1.2 in Appendix 1 for supporting data. Data sources: For 2006 through 2016 data, National Center for Education Statistics, IPEDS fall 2006 through fall 2016 surveys. Preliminary enrollments for fall 2017 were collected from each institution by the Coordinating Commission for Postsecondary Education, December 2017.
272 512 342 317
6,468 6,747 6,788 6,644
22,10625,260 25,897 26,079
3,067 3,790 3,862 3,947
13,90615,526 15,627 15,731
0
5,000
10,000
15,000
20,000
25,000
30,000
2006 2007 2008 2009 2010 2011 2012 2013 2014 2015 2016 2017 Estimate
Tota
l Fal
l Hea
dcou
nt E
nrol
lmen
t
Nebraska College of Technical Agriculture University of Nebraska at KearneyUniversity of Nebraska-Lincoln University of Nebraska Medical CenterUniversity of Nebraska at Omaha
Preliminary

Nebraska’s Coordinating Commission for Postsecondary Education – 2018 Progress Report 6
Nebraska State College System • From fall 2006 to fall 2017, fall enrollment increased an estimated 3.3% within the
Nebraska State College System. While Chadron State College and Peru State College experienced increases during this 11-year period, Wayne State College experienced a decrease of 3.4%.
• Notably, between fall 2016 and fall 2017, all of the state colleges experienced
decreases in estimated fall enrollments. • Following are the most recent one-year changes in enrollment, as well as the total
changes in enrollment between fall 2006 and fall 2017, at the institutions constituting the Nebraska State College System:
Institution
1-Year Change
2015 to 2016
Est. 1-Year Change
2016 to 2017
10-Year Change
2006 to 2016
Est. 11-Year Change
2006 to 2017 Chadron State College -0.5% -8.1% 15.5% 6.2% Peru State College 2.6% -8.6% 21.0% 10.6% Wayne State College -2.2% -1.9% -1.5% -3.4%
Figure 1.4 Fall Headcount Enrollment at Nebraska State College System by Institution
Fall 2006 through Fall 2017
Note. See Table A1.2 in Appendix 1 for supporting data. Data sources: For 2006 through 2016 data, National Center for Education Statistics, IPEDS fall 2006 through fall 2016 surveys. Preliminary enrollments for fall 2017 were collected from each institution by the Coordinating Commission for Postsecondary Education, December 2017.
2,5772,993 2,977
2,737
2,124
2,506 2,5712,349
3,407 3,431 3,357 3,292
0
1,000
2,000
3,000
4,000
2006 2007 2008 2009 2010 2011 2012 2013 2014 2015 2016 2017 Estimate
Tota
l Fal
l Hea
dcou
nt E
nrol
lmen
t
Chadron State College Peru State College Wayne State College
Preliminary

Nebraska’s Coordinating Commission for Postsecondary Education – 2018 Progress Report 7
Nebraska Community Colleges • From fall 2006 to fall 2017, total fall enrollment decreased an estimated 2.0% at the
community colleges. Five out of six of Nebraska’s community colleges experienced decreases during this 11-year period. Metropolitan Community College was the only college to report an increase in fall enrollment over the 11-year period.
• Following are the most recent one-year changes in enrollment, as well as the total
changes in enrollment between fall 2006 and fall 2017, at Nebraska’s six community colleges:
Institution
1-Year Change
2015 to 2016
Est. 1-Year Change
2016 to 2017
10-Year Change
2006 to 2016
Est. 11-Year Change
2006 to 2017 Central Community College 1.4% -3.7% -3.5% -7.0% Metropolitan Community College -0.2% 1.1% 4.9% 6.1% Mid-Plains Community College 1.8% -0.9% -24.9% -25.6% Northeast Community College 0.5% -0.2% -3.5% -3.8% Southeast Community College 0.2% 1.3% -3.5% -2.2% Western Neb. Community College 12.1% 10.8% -10.4% -0.7%
Figure 1.5 Fall Headcount Enrollment at Nebraska Community Colleges by Institution
Fall 2006 through Fall 2017
Note. See Table A1.2 in Appendix 1 for supporting data. Data sources: For 2006 through 2016 data, National Center for Education Statistics, IPEDS fall 2006 through fall 2016 surveys. Preliminary enrollments for fall 2017 were collected from each institution by the Coordinating Commission for Postsecondary Education, December 2017.
6,543 6,227 6,316 6,082
14,098 14,812 14,788 14,954
3,0302,235 2,276 2,255
5,2615,051 5,075 5,063
9,594 9,248 9,262 9,382
1,918 1,534 1,719 1,9050
5,000
10,000
15,000
20,000
2006 2007 2008 2009 2010 2011 2012 2013 2014 2015 2016 2017 Estimate
Tota
l Fal
l Hea
dcou
nt E
nrol
lmen
t
Central Community College Metropolitan Community CollegeMid-Plains Community College Northeast Community CollegeSoutheast Community College Western Nebraska Community College
Preliminary

Nebraska’s Coordinating Commission for Postsecondary Education – 2018 Progress Report 8
Nebraska Independent Colleges and Universities: Fall Enrollment • From fall 2006 to fall 2017, total fall enrollment increased an estimated 22.5% at Nebraska’s
independent colleges and universities. • The following five independent institutions are estimated to have enrolled the highest
number of students within the independent sector in fall 2017: Bellevue University, Creighton University, Concordia University-Seward, Nebraska Wesleyan, and Doane University-Graduate and Professional Studies.
• Following are the most recent one-year changes in enrollment, as well as the total changes
in enrollment between fall 2006 and fall 2017, at Nebraska’s independent institutions. (See Table A1.2 in Appendix 1 for more information on fall enrollments at Nebraska’s independent institutions.)
Institution
1-Year Change
2015 to 2016
Est. 1-Year Change
2016 to 2017
10-Year Change
2006 to 2016
Est. 11-Year Change
2006 to 2017 Bellevue University -8.9% -2.5% 30.7% 27.4% Creighton University -0.5% 3.1% 20.2% 23.9% Concordia University-Seward 12.2% -8.6% 120.4% 101.4% Nebraska Wesleyan University 0.5% 0.2% -0.4% -0.2% Doane University-Graduate and Professional Studies -0.9% -1.8% 0.5% -1.3%
Other Independent Institutions 1.1% -3.6% 20.0% 15.6%
Figure 1.6 Fall Headcount Enrollment at Nebraska Independent Colleges and Universities
Fall 2006 through Fall 2017
Note. See Table A1.2 in Appendix 1 for supporting data. Data sources: For 2006 through 2016 data, National Center for Education Statistics, IPEDS fall 2006 through fall 2016 surveys. Preliminary enrollments for fall 2017 were collected from each institution by the Coordinating Commission for Postsecondary Education, December 2017.
6808
9760 8896 8676
6981 8435 8393 8651
1251
2457 2757 25202068
2049 2059 20641560 1582 1568 1539
8,529
10,121 10,235 9,863
0
3000
6000
9000
12000
2006 2007 2008 2009 2010 2011 2012 2013 2014 2015 2016 2017 Estimate
Tota
l Fal
l Hea
dcou
nt E
nrol
lmen
t
Bellevue University Creighton UniversityConcordia University-Seward Nebraska Wesleyan UniversityDoane University-Graduate and Professional Studies Other Independent Institutions
Preliminary

Nebraska’s Coordinating Commission for Postsecondary Education – 2018 Progress Report 9
Nebraska For-Profit/Career Schools: Fall Enrollment All of the institutions in the for-profit/career school sector are currently operated for profit except for three schools of radiologic technology, which are operated by not-for-profit hospitals or medical centers, and Omaha School of Massage and Healthcare of Herzing University. • From fall 2006 to fall 2017, total fall enrollment decreased an estimated 59.4% at
Nebraska’s for-profit/career schools. During this time, several for-profit/career schools closed. See page 138 for a listing of schools that have closed.
• The following five for-profit/career schools are estimated to have enrolled the highest
number of students within the for-profit/career school sector in fall 2017: Kaplan University-Omaha Campus, Kaplan University-Lincoln Campus, Xenon International Academy-Omaha, College of Hair Design, and Capital School of Hairstyling and Esthetics.
• Following are the most recent one-year changes in enrollment, as well as the total changes
in enrollment between fall 2006 and fall 2017, at Nebraska’s for-profit/career schools. (See Table A1.2 in Appendix 1 for more information on fall enrollments at Nebraska’s for-profit/career schools.)
Institution
1-Year Change
2015 to 2016
Est. 1-Year Change
2016 to 2017
10-Year Change
2006 to 2016
Est. 11-Year Change
2006 to 2017 Kaplan University-Omaha Campus -13.7% -21.5% -25.8% -41.8% Kaplan University-Lincoln Campus -17.7% -27.6% -50.4% -64.0% Xenon International Academy-Omaha -1.5% 12.0% -9.0% 1.9% College of Hair Design -10.7% 16.3% -32.4% -21.3% Capitol School of Hairstyling and Esthetics 2.5% -18.5% 39.3% 13.5%
Other For-Profit/Career Schools -28.9% -42.0% -61.1% -77.4%
Figure 1.7 Total Fall Headcount Enrollment within the Nebraska For-Profit/Career School Sector
Fall 2006 through Fall 2017
Note. See Table A1.2 in Appendix 1 for supporting data. Data sources: For 2006 through 2016 data, National Center for Education Statistics, IPEDS fall 2006 through fall 2016 surveys. Preliminary enrollments for fall 2017 were collected from each institution by the Coordinating Commission for Postsecondary Education, December 2017.
788678 585 459
826
498 410 297210 194 191 214136
103 92107
89121 124
101
1,926
1,055750
435
0
700
1400
2100
2800
2006 2007 2008 2009 2010 2011 2012 2013 2014 2015 2016 2017 Estimate
Tota
l Fal
l Hea
dcou
nt E
nrol
lmen
t
Kaplan University-Omaha Campus Kaplan University-Lincoln CampusXenon International Academy-Omaha College of Hair DesignCapitol School of Hairstyling and Esthetics Other For-Profit/Career Schools
Preliminary

Nebraska’s Coordinating Commission for Postsecondary Education – 2018 Progress Report 10
Nebraska Fall Headcount Enrollment Summary by Sector • As shown in Table 1.1, the net effect of the changes in enrollment that occurred between fall
2006 and fall 2017 is that enrollments at the University of Nebraska and the independent colleges and universities accounted for a higher percentage of Nebraska’s total postsecondary enrollment in fall 2017 than they did in fall 2006.
Table 1.1 Nebraska Total Fall Headcount Enrollment by Sector
2006 and 2017
Enrollment Sector
Fall 2006 Estimated Fall 2017
Enrollment % of
Enrollment Enrollment % of
Enrollment University of Nebraska 45,819 36.5% 52,718 38.9%
Nebraska State College System 8,108 6.5% 8,378 6.2%
Nebraska Community Colleges 40,444 32.2% 39,641 29.2%
Total Public Colleges and Universities 94,371 75.2% 100,737 74.3%
Independent Colleges and Universities 27,197 21.7% 33,313 24.6%
For-Profit/Career Schools 3,975 3.2% 1,613 1.2%
Total Nebraska Postsecondary Headcount Enrollment 125,543 100.0% 135,663 100.0%
Data sources: For 2006 data, National Center for Education Statistics, IPEDS fall 2005 survey. Preliminary enrollments for fall 2017 were collected from each institution by the Coordinating Commission for Postsecondary Education, December 2017.

Nebraska’s Coordinating Commission for Postsecondary Education – 2018 Progress Report 11
12-Month Unduplicated Headcounts at Nebraska Postsecondary Institutions Compared to Fall Headcount Enrollment Fall headcount enrollment is the best available indicator of enrollment trends across all of the sectors of postsecondary education in Nebraska because it is reported by and can be analyzed by race/ethnicity, gender, enrollment status (part-time/full-time), level of study (undergraduate/ graduate), and distance enrollment status. However, fall enrollment totals provide only a snapshot of the number of students at an institution on a specific date during the fall of the academic year. As a result, fall enrollment totals do not include students who enrolled later in the fall or who were enrolled in college only during the spring or summer of the academic year. Nebraska’s postsecondary institutions also report 12-month unduplicated headcounts to the National Center for Education Statistics (NCES). Also referred to as 12-month enrollment, a 12-month unduplicated headcount is the total number of students who were enrolled at an institution at any time during the academic year. Each student is counted only once per academic year. For example, if a student was enrolled in the fall and spring semester at Wayne State College, that student would be counted only once for the entire academic year. The advantage of this count is that it captures students who were enrolled any time during the year. In this way, 12-month enrollment is designed to capture the total number of students an institution serves throughout the academic year. For some institutions, fall enrollment is about the same or only slightly lower than the school’s 12-month unduplicated headcount. However, for other institutions, fall enrollment is considerably lower than the total number of students the school serves over the course of an academic year. This is particularly true for Nebraska’s community colleges, where the percentage of students enrolled in the fall is about 50% to 60% of the students served over the course of an academic year. The following analysis compares fall and 12-month unduplicated headcounts for Nebraska’s five sectors of higher education. • Figure 1.8 shows total fall enrollment by sector from fall 2006 through fall 2016, the latest
period for which official data are available from the NCES. Figure 1.9 shows the comparable 12-month enrollments reported to the NCES for the 2006-2007 academic year through the 2016-2017 academic year.
• The fall and 12-month enrollments shown in Figure 1.8 and Figure 1.9 are both valid
measures for determining whether sector enrollments are generally increasing, decreasing, or staying about the same. However, the two headcounts provide different information about sector enrollments.
• Based on the fall enrollments charted in Figure 1.8, the University of Nebraska enrolls a
higher number of students than Nebraska’s six community colleges. In fall 2016, for example, the University of Nebraska enrolled 52,516 students compared to enrollment of 39,436 students at the community colleges.
• The 12-month enrollments summarized in Figure 1.9, on the other hand, show that
Nebraska’s community colleges serve a greater number of students than the University of Nebraska over the course of an academic year. In 2016-2017, the community colleges served a total of 62,113 students over the course of the academic year, while the University of Nebraska served 59,963 students. This is not surprising, given the differences in the institutional missions and programs offered by these two sectors.

Nebraska’s Coordinating Commission for Postsecondary Education – 2018 Progress Report 12
Figure 1.8 Fall Headcount Enrollment
at Nebraska Postsecondary Institutions by Sector Fall 2006 through Fall 2016
Note. See Table A1.1 in Appendix 1 for supporting data. Data source: National Center for Education Statistics, IPEDS fall 2006 through fall 2016 surveys.
Figure 1.9 12-Month Unduplicated Headcount
at Nebraska Postsecondary Institutions by Sector 2006-2007 Academic Year through 2016-2017 Academic Year
Note. See Table A1.3 in Appendix 1 for supporting data. Data source: National Center for Education Statistics, IPEDS 2007 through 2017 surveys.
45,819
51,835 52,516
8,108 8,930 8,905
40,444
39,107 39,436
27,197
34,404 33,908
3,975 2,649 2,1520
10,000
20,000
30,000
40,000
50,000
60,000
2006 2007 2008 2009 2010 2011 2012 2013 2014 2015 2016
Fall
Enro
llmen
t
University of Nebraska Nebraska State College SystemNebraska Community Colleges Independent Colleges & UniversitiesFor-Profit/Career Schools
53,59159,217 59,963
10,807 11,622 11,339
82,708
64,268 62,113
39,555 44,523 43,002
6,443 3,698 3,1920
20,000
40,000
60,000
80,000
100,000
06-07 07-08 08-09 09-10 10-11 11-12 12-13 13-14 14-15 15-16 16-17
12-M
onth
Enr
ollm
ent
University of Nebraska Nebraska State College SystemNebraska Community Colleges Independent Colleges & UniversitiesFor-Profit/Career Schools

Nebraska’s Coordinating Commission for Postsecondary Education – 2018 Progress Report 13
• The higher 12-month headcount of the community colleges reflects the fact that these colleges serve many students who take courses only one semester or quarter of the academic year. Furthermore, the community colleges enroll more part-time students than the University of Nebraska, Nebraska state colleges, independent institutions, and for-profit/career schools. As shown in Figure 1.10, part-time students accounted for 62.3% of total fall enrollment at the community colleges in fall 2016. In comparison, part-time students accounted for 21.9% of the University of Nebraska’s fall 2016 enrollment, 36.0% of the fall enrollment at the state colleges, 23.6% at the independent institutions, and 31.6% at the for-profit/career schools.2
Figure 1.10
Part-Time Fall Enrollment as a Percentage of Total Fall Headcount Enrollment at Nebraska Postsecondary Institutions by Sector
Fall 2006 through Fall 2016
Note. For more information, see the 2017 Factual Look at Higher Education in Nebraska – Enrollment on the Commission’s website at ccpe.nebraska.gov/reports. Data source: National Center for Education Statistics, IPEDS fall 2006 through fall 2016 surveys. • Figure 1.11 shows fall enrollment as a percentage of 12-month enrollment as a means of
directly comparing these two headcounts. As shown in this chart, fall enrollment in 2016 accounted for 87.6%, 78.9%, and 78.5% of 12-month enrollment during the 2016-2017 academic year at the University of Nebraska, the independent sector, and the Nebraska State College System, respectively. In contrast, fall enrollments accounted for 67.4% of the students served annually by the for-profit/career schools and 63.5% of the students served annually by the state’s six community colleges.
• The Commission will continue to use fall unduplicated headcounts as the primary measure
of the number of students enrolled at colleges and universities in Nebraska. However, fall headcount enrollments should be interpreted with the understanding that there are many more students who are served by Nebraska’s postsecondary education system over the course of any given academic year, and this is especially true in the case of the state’s community colleges and for-profit/career schools.
2 The NCES does not ask institutions to report 12-month unduplicated headcounts by full-time/part-time enrollment status. Consequently, the numbers and percentages of students who attend any institution on a part-time basis are available only for fall headcount enrollments.
21.6%
22.5% 21.9%
31.2% 34.4% 36.0%
58.9% 61.3% 62.3%
21.0% 23.2% 23.6%
10.0%
26.1% 31.6%
0%
25%
50%
75%
100%
2006 2007 2008 2009 2010 2011 2012 2013 2014 2015 2016
Part-
Tim
e Fa
ll En
rollm
ent
as a
% o
f Tot
al F
all E
nrol
lmen
t
University of Nebraska Nebraska State College SystemNebraska Community Colleges Independent Colleges & UniversitiesFor-Profit/Career Schools
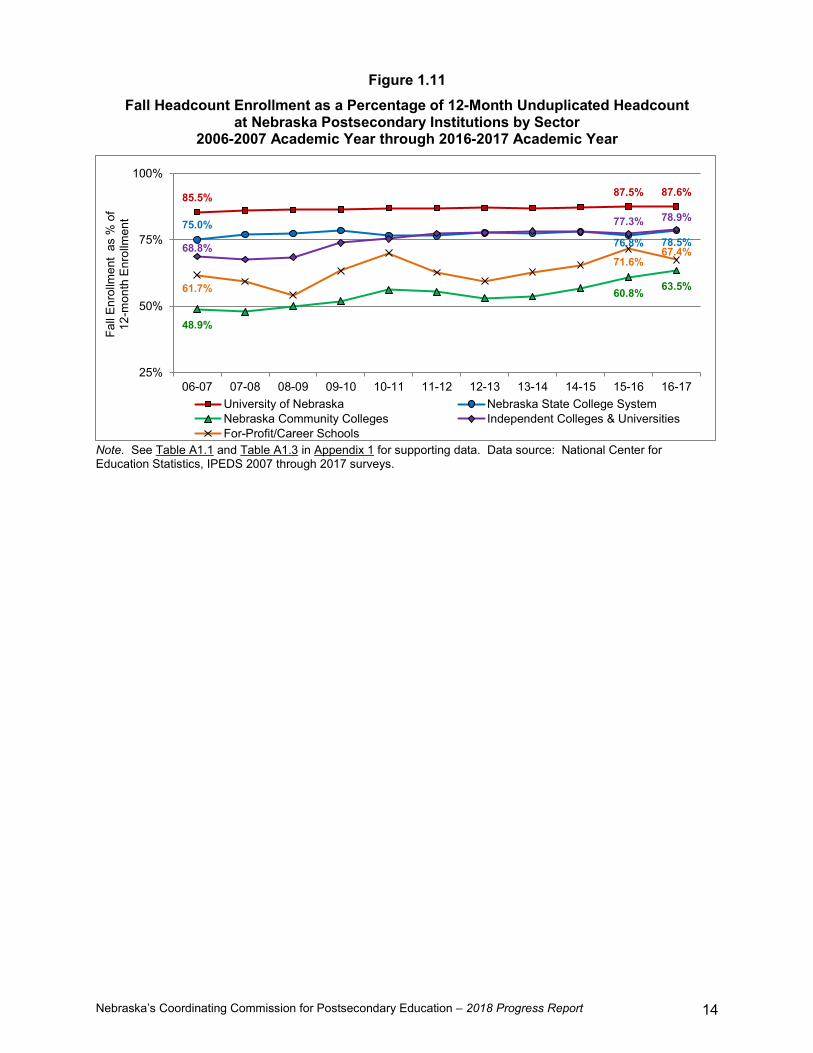
Nebraska’s Coordinating Commission for Postsecondary Education – 2018 Progress Report 14
Figure 1.11 Fall Headcount Enrollment as a Percentage of 12-Month Unduplicated Headcount
at Nebraska Postsecondary Institutions by Sector 2006-2007 Academic Year through 2016-2017 Academic Year
Note. See Table A1.1 and Table A1.3 in Appendix 1 for supporting data. Data source: National Center for Education Statistics, IPEDS 2007 through 2017 surveys.
85.5% 87.5% 87.6%
75.0%76.8% 78.5%
48.9%
60.8% 63.5%
68.8%
77.3% 78.9%
61.7%
71.6%67.4%
25%
50%
75%
100%
06-07 07-08 08-09 09-10 10-11 11-12 12-13 13-14 14-15 15-16 16-17
Fall
Enro
llmen
t as
% o
f 12
-mon
th E
nrol
lmen
t
University of Nebraska Nebraska State College SystemNebraska Community Colleges Independent Colleges & UniversitiesFor-Profit/Career Schools

Nebraska’s Coordinating Commission for Postsecondary Education – 2018 Progress Report 15
Nebraska First-Time Freshmen Enrollments First-time freshmen enrollments are indicators of the general direction undergraduate enrollments are headed as well as general measures of the numbers of high school graduates who go on to college in Nebraska. Consequently, this section compares fall 2006 enrollments of first-time freshmen to estimated first-time freshmen enrollment in fall 2017. Enrollments for fall 2017 are preliminary, based on estimates that institutions report directly to the Coordinating Commission for Postsecondary Education. Nebraska Total Enrollment of First-Time Freshmen by Sector • As shown in Figure 1.12, the University of Nebraska has enrolled more first-time
freshmen than any other sector since fall 2006. • Following are the most recent one-year changes in first-time freshmen enrollments,
as well as the total changes in first-time freshmen enrollments, between fall 2006 and fall 2017:
Sector
1-Year Change
2015 to 2016
Est. 1-Year Change
2016 to 2017
10-Year Change
2006 to 2016
Est. 11-Year Change
2006 to 2017 University of Nebraska 4.2% -0.4% 18.8% 18.3% Nebraska State College System -6.1% 0.7% 3.0% 3.7% Nebraska Community Colleges 3.7% 1.2% -1.4% -0.2% Independent Colleges & Universities -3.9% 5.9% -1.0% 4.9% For-Profit/Career Schools 8.3% 14.1% -71.3% -67.2% Total Nebraska 1.9% 1.6% 1.9% 3.5%
Figure 1.12
Nebraska Total First-Time Freshmen Enrollment by Sector Fall 2006 through Fall 2017
Note. See Table A1.4 in Appendix 1 for supporting data. Data sources: For 2006 through 2016 data, National Center for Education Statistics, IPEDS fall 2006 through fall 2016 surveys. Preliminary enrollments for fall 2017 were collected from each institution by the Coordinating Commission for Postsecondary Education, December 2017.
6,770
7,717 8,042 8,012
1,193 1,309 1,229 1,237
5,767 5,484 5,689 5,756
3,377 3,479 3,344 3,542
1,187 315 341 389
0
3,000
6,000
9,000
2006 2007 2008 2009 2010 2011 2012 2013 2014 2015 2016 2017 Estimate
Firs
t-Tim
e Fr
eshm
en
University of Nebraska Nebraska State College SystemNebraska Community Colleges Independent Colleges & UniversitiesFor-Profit/Career Schools
Preliminary

Nebraska’s Coordinating Commission for Postsecondary Education – 2018 Progress Report 16
Nebraska Total Enrollment of Full- and Part-Time, First-Time Freshmen • As shown in Figure 1.13, total enrollment of first-time freshmen at Nebraska’s
postsecondary institutions increased an estimated 3.5% between fall 2006 and fall 2017.
• Full-time first-time freshmen accounted for an estimated 89.6% of the first-time
freshmen attending postsecondary institutions in Nebraska in fall 2017, up from 89.3% in fall 2006.
• Full-time first-time freshmen enrollment increased an estimated 3.8% over the 11-
year period between fall 2006 and fall 2017. Meanwhile, part-time first-time freshmen enrollment increased an estimated 0.9% over the 11-year period, despite an estimated increase of 14.7% between fall 2016 and fall 2017. (This one-year increase was driven largely by increased enrollments within the community college sector.)
• Analyzing the actual changes in fall enrollment between 2006 and 2016 reveals that
Nebraska’s total first-time freshmen enrollment increased 1.9% while full-time first-time freshmen enrollment increased 3.6% and part-time first-time freshmen enrollment decreased 12.0%.
Figure 1.13
Nebraska Total First-Time Freshmen Enrollment by Full- and Part-Time Student Status Fall 2006 through Fall 2017
Note. See Table A1.4 in Appendix 1 for supporting data. Data sources: For 2006 through 2016 data, National Center for Education Statistics, IPEDS fall 2006 through fall 2016 surveys. Preliminary enrollments for fall 2017 were collected from each institution by the Coordinating Commission for Postsecondary Education, December 2017.
18,294 18,304 18,645 18,936
16,338 16,545 16,924 16,962
1,956 1,759 1,721 1,974
0
5,000
10,000
15,000
20,000
25,000
2006 2007 2008 2009 2010 2011 2012 2013 2014 2015 2016 2017 Estimate
Firs
t-Tim
e Fr
eshm
en
Total First-Time Freshmen Full-Time, First-Time Freshmen Part-Time, First-Time Freshmen
Preliminary

Nebraska’s Coordinating Commission for Postsecondary Education – 2018 Progress Report 17
Nebraska Enrollment of Full- and Part-Time, First-Time Freshmen by Sector • From fall 2006 to fall 2017, full-time first-time freshmen enrollment increased an
estimated 3.8%. As illustrated in Figure 1.14, full-time first-time freshmen enrollments varied by sector.
• Following are the most recent one-year changes in full-time first-time freshmen
enrollments, as well as the total changes in full-time first-time freshmen enrollments, between fall 2006 and fall 2017:
Sector
1-Year Change
2015 to 2016
Est. 1-Year Change
2016 to 2017
10-Year Change
2006 to 2016
Est. 11-Year Change
2006 to 2017 University of Nebraska 4.8% -0.4% 19.8% 19.3% Nebraska State College System -5.8% 0.9% 4.6% 5.5% Nebraska Community Colleges 6.0% -3.9% 0.2% -3.8% Independent Colleges & Universities -4.3% 5.7% 0.8% 6.5% For-Profit/Career Schools 0.0% 13.3% -73.9% -70.4% Total Nebraska Full-Time First-Time 2.3% 0.2% 3.6% 3.8%
Figure 1.14 Nebraska Total Full-Time, First-Time Freshmen Enrollment by Sector
Fall 2006 through Fall 2017
Note. See Table A1.4 in Appendix 1 for supporting data. Data sources: For 2006 through 2016 data, National Center for Education Statistics, IPEDS fall 2006 through fall 2016 surveys. Preliminary enrollments for fall 2017 were collected from each institution by the Coordinating Commission for Postsecondary Education, December 2017. • As shown in Figure 1.15, Nebraska’s community colleges account for the majority of
first-time freshmen who attend school part-time (81.4% of the state total in fall 2006 and 88.0% in fall 2017).
• Enrollment of part-time first-time freshmen at Nebraska’s community colleges
increased an estimated 15.4% from fall 2016 to fall 2017, resulting in an estimated 11-year increase of 9.2%.
6,626
7,5707,935 7,902
1,164 1,292 1,217 1,228
4,175 3,946 4,183 4,018
3,278 3,451 3,303 3,490
1,095286 286 324
0
3,000
6,000
9,000
2006 2007 2008 2009 2010 2011 2012 2013 2014 2015 2016 2017 Estimate
Full-
Tim
e Fi
rst-T
ime
Fres
hmen
University of Nebraska Nebraska State College SystemNebraska Community Colleges Independent Colleges & UniversitiesFor-Profit/Career Schools
Preliminary

Nebraska’s Coordinating Commission for Postsecondary Education – 2018 Progress Report 18
• The number of part-time first-time freshmen enrolled at other types of institutions increased an estimated 9.8% from fall 2016 to fall 2017, resulting in an estimated 11-year decrease of 35.2%.
Figure 1.15
Nebraska Total Part-Time, First-Time Freshmen Enrollment by Sector Fall 2006 through Fall 2017
Note. See Table A1.4 in Appendix 1 for supporting data. Data sources: For 2006 through 2016 data, National Center for Education Statistics, IPEDS fall 2006 through fall 2016 surveys. Preliminary enrollments for fall 2017 were collected from each institution by the Coordinating Commission for Postsecondary Education, December 2017.
1,592 1,538 1,506
1,738
364221 215 236
0
500
1,000
1,500
2,000
2006 2007 2008 2009 2010 2011 2012 2013 2014 2015 2016 2017 Estimate
Part-
Tim
e Fi
rst-T
ime
Fres
hmen
Nebraska Community Colleges All Sectors Except Community Colleges
Preliminary

Nebraska’s Coordinating Commission for Postsecondary Education – 2018 Progress Report 19
Number of Degrees Conferred at Nebraska Postsecondary Institutions Although not specified as a state priority by the 2003 LR 174 Higher Education Task Force, increasing the number of degrees is a logical outcome of increasing enrollment and increasing the percentage of students who complete degree programs. • As shown in Figure 1.16, the total number of degrees and awards conferred by Nebraska
institutions increased 18.3% from 26,132 in 2006-2007 to 30,916 in 2016-2017.
Figure 1.16 Total Number of Degrees and Other Awards Conferred
by Nebraska Public and Independent Institutions and For-Profit/Career Schools 2006-2007 Academic Year through 2016-2017 Academic Year
Note. For more information, see the 2017 Factual Look at Higher Education in Nebraska – Degrees and Other Awards on the Commission’s website at ccpe.nebraska.gov/reports. Data source: National Center for Education Statistics, IPEDS 2007 through 2017 surveys. • As shown in Figure 1.17, all sectors, except for the for-profit/career school sector, awarded
more degrees and other awards in 2016-2017 than in 2006-2007. • By sector, the number of degrees and other awards conferred by Nebraska’s postsecondary
institutions changed as follows:
Sector 1-Year Change 15-16 to 16-17
10-Year Change 06-07 to 16-17
University of Nebraska 4.9% 24.3% Nebraska State College System 9.0% 13.8% Nebraska Community Colleges -3.5% 21.1% Independent Colleges & Universities -1.4% 26.1% For-Profit/Career Schools -3.3% -48.0%
• Table 1.2 shows, by award level, the number of degrees and other awards conferred by all
Nebraska colleges and universities. Based on these data, from 2006-2007 to 2016-2017, the largest percentage point increase was at the master’s level (51.6%). Meanwhile, less-than-four-year certificates declined 3.5%.
26,132
30,627 30,916
0
5,000
10,000
15,000
20,000
25,000
30,000
35,000
40,000
06-07 07-08 08-09 09-10 10-11 11-12 12-13 13-14 14-15 15-16 16-17
Deg
rees
and
Oth
er A
war
ds C
onfe
rred
Nebraska State Total

Nebraska’s Coordinating Commission for Postsecondary Education – 2018 Progress Report 20
Figure 1.17 Total Number of Degrees and Other Awards Conferred by Sector
2006-2007 Academic Year through 2016-2017 Academic Year
Note. For more information, see the 2017 Factual Look at Higher Education in Nebraska – Degrees and Other Awards on the Commission’s website at ccpe.nebraska.gov/reports. Data source: National Center for Education Statistics, IPEDS 2007 through 2017 surveys.
Table 1.2 Total Number of Degrees and Other Awards Conferred by Award Level
Nebraska Postsecondary Institutions 2006-2007 Academic Year through 2016-2017 Academic Year
Award Level 06-07 07-08 08-09 09-10 10-11 11-12 12-13 13-14 14-15 15-16 16-17 10-Yr. Chg.
Less-than-Four-Year Certificates 3,118 3,450 3,251 2,975 3,261 3,227 3,746 3,404 3,383 3,282 3,009 -3.5%
Associate Degrees 4,919 4,837 4,763 4,862 5,352 5,765 5,944 5,755 5,712 5,144 5,067 3.0%
Bachelor's Degrees & Post-Baccalaureate Certificates
12,640 12,775 13,017 13,091 14,061 14,548 14,523 15,022 14,514 14,714 14,965 18.4%
Master’s Degrees & Post-Master’s Certificates
4,135 4,696 4,979 4,914 5,163 5,692 5,244 5,074 5,481 5,788 6,268 51.6%
Doctor's Degrees 1,320 1,330 1,371 1,392 1,371 1,392 1,495 1,503 1,583 1,699 1,607 21.7%
Total Degrees Conferred 26,132 27,088 27,381 27,234 29,208 30,624 30,952 30,758 30,673 30,627 30,916 18.3%
Note. For more information, see the 2017 Factual Look at Higher Education in Nebraska – Degrees and Other Awards on the Commission’s website at ccpe.nebraska.gov/reports. Data source: National Center for Education Statistics, IPEDS 2007 through 2017 surveys.
9,552
11,31211,870
1,583
1,653 1,802
5,693
7,149 6,8977,433
9,507 9,374
1,871
1,006 9730
2,500
5,000
7,500
10,000
12,500
06-07 07-08 08-09 09-10 10-11 11-12 12-13 13-14 14-15 15-16 16-17
Deg
rees
and
Oth
er A
war
ds C
onfe
rred
University of Nebraska Nebraska State College SystemNebraska Community Colleges Independent Colleges & UniversitiesFor-Profit/Career Schools

Nebraska’s Coordinating Commission for Postsecondary Education – 2018 Progress Report 21
Strategic Objectives to Increase Postsecondary Enrollment Recommended by the 2003 LR 174 Task Force Given the first priority to increase the number of students who enter postsecondary education in Nebraska, the 2003 LR 174 Task Force recommended a series of strategic objectives to increase college enrollments. For the purposes of establishing baseline statistical indicators and monitoring progress toward achieving these objectives, they are stated as follows: 1.1 Increase the proportion of PK-12 students who graduate from high school, enroll
in postsecondary education and are adequately prepared to proceed through postsecondary degree completion.
1.2 Increase the proportion of Nebraska high school graduates who pursue their
postsecondary education in Nebraska. 1.3 Increase the number of non-Nebraska high school graduates who pursue
postsecondary education in Nebraska. 1.4 Increase the number and proportion of Nebraska postsecondary students who
have been underrepresented in the state’s higher education system. 1.5 Increase need-based financial aid in order to improve access to higher education for Nebraskans with limited financial means. Following this outline, the remainder of this section focuses on the extent to which each of these measurable objectives is being achieved.

Nebraska’s Coordinating Commission for Postsecondary Education – 2018 Progress Report 22
This page left blank intentionally.

Nebraska’s Coordinating Commission for Postsecondary Education – 2018 Progress Report 23
1.1.a High School Graduation Rates Increase the proportion of students who graduate from Nebraska high schools. One strategic approach to increasing the number of students who enter postsecondary education in Nebraska is to increase the proportion of students who graduate from the state’s high schools. In other words, increase Nebraska’s high school graduation rate and, in the process, increase the pool of high school students who could potentially attend college. Past and Present Trends in the Number of Nebraska High School Graduates • As shown in Figure 1.1.a.1, 23,385 students graduated from Nebraska high schools in
2016-2017, an increase of 10.1% (2,144 students) since 2006-2007. • The number of students who graduated from Nebraska high schools increased 4.4% from
2006-2007 to 2007-2008, and there was a one-year increase of 5.2% in 2010-2011. Otherwise, the total number of graduates has increased or decreased only slightly between 2006-2007 and 2016-2017.
• Between 2006-2007 and 2016-2017, the number of public high school graduates increased
9.4% to 20,730, while the number graduating from nonpublic (private) high schools increased 16.1% to 2,537.
• Notably, between 2015-2016 and 2016-2017, the number of public high school graduates
increased 0.8% (168 students) while the number of nonpublic high school graduates increased 16.8% (364 students).
Figure 1.1.a.1
Numbers of Nebraska Public and Nonpublic High School Graduates 2006-2007 through 2016-2017
Note. Graduates do not include GED recipients or completers who did not receive regular diplomas. The total number of graduates includes graduates of public schools, nonpublic (private) schools, educational service units, and state-operated schools. See Table A2.1 in Appendix 2 for supporting data. Data source: Nebraska Department of Education, January 2009 (2006-07 data), February 2010 (2007-08 data), February 2011 (2008-09 and 2009-10 data), February 2012 (2010-11 data), December 2012 (2011-12 data), January 2014 (2012-13 data), January 2015 (2013-14 data), January 2016 (2014-15 data), December 2016 (2015-16 data), and December 2017 (2016-17 data).
21,241 22,185 21,618 21,513 22,637 22,678 22,641 23,004 22,912 22,945 23,385
18,951 19,987 19,401 19,293 20,313 20,379 20,326 20,359 20,281 20,562 20,730
2,186 2,158 2,121 2,143 2,205 2,192 2,197 2,557 2,544 2,173 2,537
0
5,000
10,000
15,000
20,000
25,000
30,000
06-07 07-08 08-09 09-10 10-11 11-12 12-13 13-14 14-15 15-16 16-17
Total No. of Graduates Public Schools Nonpublic Schools

Nebraska’s Coordinating Commission for Postsecondary Education – 2018 Progress Report 24
• As shown in Table 1.1.a.1, since 2006-2007, about 9 out of 10 Nebraska high school graduates have received their diplomas from public schools.
Table 1.1.a.1
Numbers of Nebraska High School Graduates 2015-2016 and 2016-2017 Compared to 2006-2007
Type of School
2006-2007 2015-2016 2016-2017 No. of
Graduates % of
Graduates No. of
Graduates % of
Graduates No. of
Graduates % of
Graduates Public 18,951 89.7% 20,562 90.4% 20,730 89.1% Nonpublic 2,186 10.3% 2,173 9.6% 2,537 10.9%
Subtotal 21,137 100.0% 22,735 100.0% 23,267 100.0% ESU & SO 104 210 118
State Total 21,241 22,945 23,385 Note. Graduates do not include GED recipients or completers who did not receive regular diplomas. ESU = Educational service units; SO = State-operated schools. Data source: Nebraska Department of Education, January 2009 (2006-07 data), December 2016 (2015-16 data), and December 2017 (2016-17 data).
Projected Trends in the Number of Nebraska High School Graduates3 • As shown in Figure 1.1.a.2, 25,216 students are forecast to graduate from Nebraska public
and nonpublic high schools in 2026-2027. In addition, an estimated 100 students are projected to graduate from educational service units and state-operated schools, resulting in a total projected increase of 8.3% (1,931 students) since 2016-2017.
• Public schools are projected to account for 90% to 91% of Nebraska’s high school
graduates through the 2026-2027 school year. • The numbers of graduates from Nebraska’s public high schools are projected to increase
2.5% between 2016-2017 and 2017-2018 and then increase 7.1% from 2017-2018 to 2026-2027.
• The numbers of graduates from the state’s nonpublic (private) high schools are projected to
decrease 6.3% from 2016-2017 to 2017-2018 and then increase 3.7% from 2017-2018 to 2026-2027.
3 Western Interstate Commission for Higher Education, Knocking at the College Door: Projections of High School Graduates, 2016. See Table A2.2 in Appendix 2 for supporting data. For 2016-2017, the actual number of public school graduates (20,730) was 2.6% higher than WICHE predicted in their 2016 report (20,209).

Nebraska’s Coordinating Commission for Postsecondary Education – 2018 Progress Report 25
Figure 1.1.a.2 Projected Numbers of Graduates from Nebraska Public and Nonpublic High Schools
2017-2018 through 2026-2027
Note. Projections do not include graduates of educational service units or state-operated schools. Graduates do not include GED recipients or completers who did not receive regular diplomas. See Table A2.2 in Appendix 2 for supporting data. Data source: Western Interstate Commission for Higher Education, Knocking at the College Door: Projections of High School Graduates, 2016. Projected and Recent Changes in Nebraska Public High School Graduates by Race/Ethnicity • As illustrated in Figure 1.1.a.3, minority students, especially Hispanics, are projected to
account for much higher percentages of the state’s public high school graduates in 2026-2027 than they did in 2006-2007.
• Actual changes in the racial/ethnic distribution of Nebraska’s public high school graduates
over the decade have been in the direction of the projected trend. Between 2006-2007 and 2016-2017, the number of public high school graduates in each of the major racial/ethnic groups changed as follows:
• White non-Hispanics decreased 9.7% (from 16,354 to 14,770 graduates)
• Asian/Pacific Islanders increased 73.6% (from 330 to 573 graduates)
• Hispanics increased 184.5% (from 1,172 to 3,334 graduates)
• Native Americans increased 9.9% (from 196 to 240 graduates)
• Black non-Hispanics increased 32.0% (from 899 to 1,187 graduates) • Since 2010-2011, graduates also have been classified in the category of “two or more
races.” In 2010-2011, there were 492 public high school graduates in this category. By 2016-2017, the number had increased 27.2% to 626 graduates.
23,627 24,001 24,272 24,542 25,100 25,004 25,49324,151 25,107 25,216
21,250 21,599 21,968 22,186 22,674 22,634 23,03721,687 22,639 22,751
2,377 2,402 2,304 2,356 2,426 2,370 2,456 2,463 2,468 2,465
0
5,000
10,000
15,000
20,000
25,000
30,000
17-18 18-19 19-20 20-21 21-22 22-23 23-24 24-25 25-26 26-27
Total Public & Nonpublic Graduates Public Graduates Nonpublic Graduates

Nebraska’s Coordinating Commission for Postsecondary Education – 2018 Progress Report 26
Figure 1.1.a.3 By Race/Ethnicity: Actual and Projected
Percentages of Nebraska Public High School Graduates
Note. Graduates do not include GED recipients or completers who did not receive regular diplomas. Actual counts and projections do not include graduates of educational service units or state-operated schools. *‘Two or more races’ was not a racial/ethnic category until 2010-11. For projections, multiracial graduates are proportionally distributed to the four race categories (American Indian/Alaska Native (i.e., Native American), Asian/Pacific Islander, black non-Hispanic, and white non-Hispanic). See Table A2.3 in Appendix 2 for supporting data. Data sources: Nebraska Department of Education, January 2009, and December 2017 (actual number of graduates). Projection data obtained from Western Interstate Commission for Higher Education, Knocking at the College Door: Projections of High School Graduates, 2016.
White non-Hispanic, 86.3%
Asian/Pacific Islander, 1.7%
Hispanic , 6.2%
Native American, 1.0% Black non-Hispanic,
4.7%
Actual Percentages of Graduates: 2006-2007
White non-Hispanic, 71.2%
Asian/Pacific Islander, 2.8%
Hispanic , 16.1%
Native American, 1.2%
Black non-Hispanic, 5.7% Two or More Races*,
3.0%
Actual Percentages of Graduates: 2016-2017
White non-Hispanic, 68.7%
Asian/Pacific Islander, 3.7%
Hispanic , 21.3%
Native American, 0.9% Black non-Hispanic,
5.4%
Projected Percentages of Graduates: 2026-2027
Nebraska’s Coordinating Commission for Postsecondary Education – 2018 Progress Report 27
Nebraska Public High School Graduation Rates The Coordinating Commission monitors Nebraska high school graduation rates to determine if the proportion of Nebraska’s high school students who graduate from high school is increasing, thereby potentially increasing the pool of students who are prepared to go on to college. • Prior to the 2010-2011 school year, the Nebraska Department of Education used the four-
year high school graduation rate to measure the proportion of high school students who receive regular diplomas.
• With the 2010-2011 school year, the Nebraska Department of Education began using the
cohort four-year graduation rate to measure the proportion of Nebraska’s public high school students who earn regular diplomas. The cohort four-year graduation rate is calculated using an entirely different methodology than the four-year graduation rate; therefore, it is not comparable to the four-year graduation rates for previous school years. Consequently, the 2011 cohort four-year graduation rate established a new baseline for future comparisons.4
• See Explanatory Note A3.1 in Appendix 3 for information on how the cohort four-year
graduation rates are calculated and see Table A3.1 in Appendix 3 for supporting data. Cohort Four-Year High School Graduation Rates (2010-2011 through 2016-2017) • Currently, data are not available to calculate a cohort four-year graduation rate for the
nonpublic (private) high schools in Nebraska. Consequently, a statewide cohort four-year graduation rate for all public and nonpublic schools in Nebraska is not available.
• As shown in Figure 1.1.a.4, the cohort four-year graduation rate for Nebraska’s public
schools was 86.1% in 2011 (2010-2011) and 89.1% in 2017 (2016-2017), or three percentage points higher than the cohort rate for 2011.
4 With the adoption of the cohort four-year graduation rate, the Nebraska Department of Education is no longer using its previous methodology for calculating graduation rates.

Nebraska’s Coordinating Commission for Postsecondary Education – 2018 Progress Report 28
Figure 1.1.a.4 Nebraska Public High School Cohort Four-Year Graduation Rates
2010-2011 through 2016-2017
Note. See Table A3.1 in Appendix 3 for supporting data. Data source: Nebraska Department of Education, 2016-2017 Education Profile for State of Nebraska, Cohort Graduation Data. Public High School Graduation Rates by State Figure 1.1.a.5 shows the state-to-state comparisons of the cohort four-year graduation rates calculated for the 2015-2016 cohort. • As shown in Figure 1.1.a.5, Nebraska’s 2015-2016 cohort four-year graduation rate was the
fourth highest among the rates reported by 50 states and the District of Columbia.
86.1% 87.6% 88.5% 89.7% 88.9% 89.3% 89.1%
50%
60%
70%
80%
90%
100%
10-11 11-12 12-13 13-14 14-15 15-16 16-17
Cohort 4-Year Graduation Rate
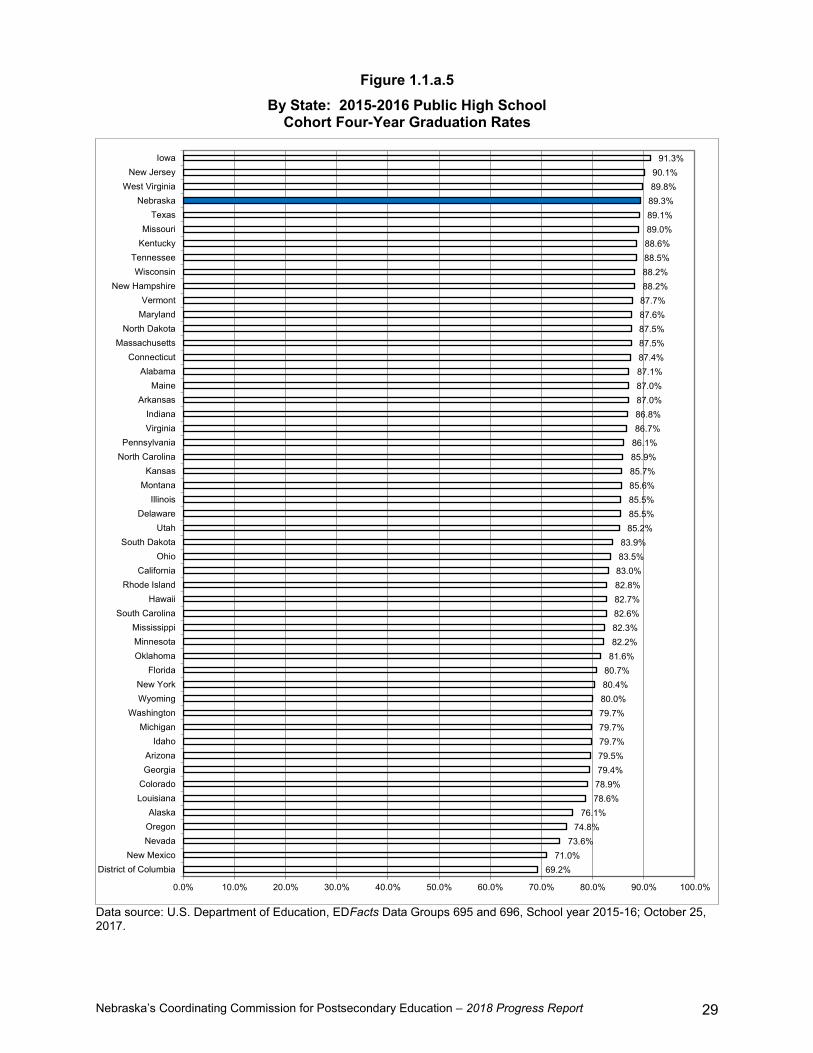
Nebraska’s Coordinating Commission for Postsecondary Education – 2018 Progress Report 29
Figure 1.1.a.5 By State: 2015-2016 Public High School
Cohort Four-Year Graduation Rates
Data source: U.S. Department of Education, EDFacts Data Groups 695 and 696, School year 2015-16; October 25, 2017.
69.2%71.0%
73.6%74.8%
76.1%78.6%78.9%79.4%79.5%79.7%79.7%79.7%80.0%80.4%80.7%81.6%82.2%82.3%82.6%82.7%82.8%83.0%83.5%83.9%
85.2%85.5%85.5%85.6%85.7%85.9%86.1%86.7%86.8%87.0%87.0%87.1%87.4%87.5%87.5%87.6%87.7%88.2%88.2%88.5%88.6%89.0%89.1%89.3%89.8%90.1%
91.3%
0.0% 10.0% 20.0% 30.0% 40.0% 50.0% 60.0% 70.0% 80.0% 90.0% 100.0%
District of ColumbiaNew Mexico
NevadaOregonAlaska
LouisianaColoradoGeorgiaArizona
IdahoMichigan
WashingtonWyomingNew York
FloridaOklahomaMinnesotaMississippi
South CarolinaHawaii
Rhode IslandCalifornia
OhioSouth Dakota
UtahDelaware
IllinoisMontana
KansasNorth CarolinaPennsylvania
VirginiaIndiana
ArkansasMaine
AlabamaConnecticut
MassachusettsNorth Dakota
MarylandVermont
New HampshireWisconsin
TennesseeKentuckyMissouri
TexasNebraska
West VirginiaNew Jersey
Iowa

Nebraska’s Coordinating Commission for Postsecondary Education – 2018 Progress Report 30
Nebraska Public High School Graduation Rates by Gender An analysis of the high school graduation rate data obtained from the Nebraska Department of Education reveals that females continue to have higher graduation rates than males who attend Nebraska’s public high schools, regardless of the methodology used to calculate them. • As evidenced in Figure 1.1.a.6, the cohort four-year graduation rates for females were
higher than the rates for males from 2010-2011 to 2016-2017. Both rates gradually increased during this time, and the gap between males and females decreased from 5.7 percentage points in 2010-2011 to 5.1 percentage points in 2016-2017.
• The cohort graduation rate for females in 2016-2017 was 91.7%, 2.7 percentage points
higher than the rate for 2010-2011. The cohort graduation rate for males in 2016-2017 was 86.7%, 3.3 percentage points higher than the rate for 2010-2011.
Figure 1.1.a.6
By Gender: Nebraska Public High School Cohort Four-Year Graduation Rates
2010-2011 through 2016-2017
Note. See Table A3.1 in Appendix 3 for supporting data. Data source: Nebraska Department of Education, 2016-2017 Education Profile for State of Nebraska, Cohort Graduation Data.
89.0% 90.2% 90.9% 92.4% 92.2% 92.1% 91.7%
83.4% 85.2% 86.3% 87.1% 85.8% 86.6% 86.7%
50%
60%
70%
80%
90%
100%
10-11 11-12 12-13 13-14 14-15 15-16 16-17
Female Graduation Rate Male Graduation Rate

Nebraska’s Coordinating Commission for Postsecondary Education – 2018 Progress Report 31
Nebraska Public High School Graduation Rates by Race/Ethnicity As illustrated in Figure 1.1.a.7, high school graduation rates vary considerably by race/ethnicity. • Between 2010-2011 and 2016-2017, the cohort four-year graduation rate decreased 2.6
percentage points for multiracial individuals. During this same time, cohort four-year graduation rates increased for all other racial/ethnic groups, ranging from a 1.3 percentage point change for Asians to a 13.9 percentage point increase for black non-Hispanics.
Figure 1.1.a.7
By Race/Ethnicity: Nebraska Public High School Cohort Four-Year Graduation Rates
2010-2011 through 2016-2017
Note. Cohort graduation rates are not shown for Native Hawaiians and other Pacific Islanders. See Table A3.1 in Appendix 3 for supporting data. Data source: Nebraska Department of Education, 2016-2017 Education Profile for State of Nebraska, Cohort Graduation Data.
90.2%92.5%
80.5% 81.8%
74.6% 81.6%
61.2%
70.3%67.3%
81.2%
88.6%86.0%
50%
60%
70%
80%
90%
100%
10-11 11-12 12-13 13-14 14-15 15-16 16-17
White non-Hispanic Asian HispanicNative American Black non-Hispanic Two or More Races

Nebraska’s Coordinating Commission for Postsecondary Education – 2018 Progress Report 32
District-Level Analysis of Graduation Rates The Nebraska Department of Education provides the Commission with the distribution of the 2016-2017 cohort four-year graduation rates for Nebraska’s 250 public school districts, as shown in Table 1.1.a.2. • 84 (33.6%) of Nebraska’s public school districts had cohort four-year graduation rates of
100%, and 207 districts (82.8%) had graduation rates equal to or higher than the statewide rate in 2016-2017.
• 43 (17.2%) of the districts had graduation rates that were lower than the statewide rate for
public schools in 2016-2017, and eight districts had rates of less than 75.0%. • The three districts with the largest number of cohort graduates were Omaha Public Schools
with a graduation rate of 78.7% (2,711 graduates), Lincoln Public Schools with a graduation rate of 82.8% (2,189 graduates), and Millard Public Schools with a graduation rate of 93.4% (1,635 graduates).
Table 1.1.a.2 Distribution of the Cohort Four-Year High School Graduation Rates
for Nebraska Public High School Districts 2016-2017
Cohort Four-Year High School Graduation Rate
No. of School Districts
% of School Districts
Cumulative % of School Districts
100.00% 84 33.6% 33.6%
97.00% - 99.99% 14 5.6% 39.2%
94.00% - 96.99% 54 21.6% 60.8%
91.00% - 93.99% 41 16.4% 77.2%
89.11% - 90.99% 14 5.6% 82.8%
89.11% Nebraska Public High School Rate
85.00% - 89.10% 20 8.0% 90.8%
75.00% - 84.99% 15 6.0% 96.8%
Less than 75.00% 8 3.2% 100.0%
All Public Districts 250 Data source: Nebraska Department of Education, December 2017.

Nebraska’s Coordinating Commission for Postsecondary Education – 2018 Progress Report 33
Nebraska Public High School Cohort Extended Graduation Rates Figure 1.1.a.8 shows extended five- and six-year graduation rates for the 2014-2015 cohort (Part A) and extended five-year graduation rates for the 2015-2016 cohort (Part B). • As evidenced in Part A of Figure 1.1.a.8, the 2014-2015 cohort six-year graduation rate for
Nebraska’s public school was 92%, three percentage points higher than the cohort four-year graduation rate.
• As shown in Part B of Figure 1.1.a.8, the overall five-year graduation rate for the 2015-2016
cohort was 91%, two percentage points higher than the cohort four-year graduation rate. Extended Graduation Rates by Gender Extending cohort graduation rates to five and six years narrows the gap between graduation rates for males and females. In other words, males are more likely than females to take five or six years to graduate from high school. • For the 2014-2015 cohort, the four-year graduation rate was 86% for males and 92% for
females, a gap of six percentage points. However, extending the graduation rate out to six years reveals the gap narrowed to five percentage points (90% for males and 95% for females).
• For the 2015-2016 cohort, the five-year graduation rate was 94% for females (up from 92%
for four years) and 89% for males (up from 87% for four years). Extended Graduation Rates by Race/Ethnicity Extending cohort graduation rates to five and six years also narrows the gaps between graduation rates for various racial/ethnic groups. • The 2014-2015 cohort graduation rate for Asians increased 11 percentage points when
extended from four to six years, while the cohort graduation rate for black non-Hispanics increased nine percentage points when extended from four to six years.
• For the 2015-2016 cohort, the largest increases reported were for Hispanics, Native
Americans, black non-Hispanics, and multiracial students (three percentage point increase for each of these racial/ethnic groups).

Nebraska’s Coordinating Commission for Postsecondary Education – 2018 Progress Report 34
Figure 1.1.a.8 By Gender and By Race/Ethnicity: Nebraska Public High School Cohort Extended Graduation Rates for 2014-2015 and 2015-2016
Part A: 2014-2015 Cohort
Part B: 2015-2016 Cohort
Note. Graduates do not include GED recipients or completers who did not receive regular diplomas. Cohort graduation rates are not shown for Native Hawaiians and other Pacific Islanders. See Table A3.1 in Appendix 3 for supporting data. Data source: Nebraska Department of Education, 2016-2017 Education Profile for State of Nebraska, Cohort Graduation Data.
NE PublicTotal Male Female White non-
Hispanic Asian Hispanic NativeAmerican
Black non-Hispanic
Two orMoreRaces
6-Year 92% 90% 95% 95% 89% 87% 80% 84% 89%6 Year Gain 0% 1% 1% 1% 3% 1% 1% 1% 1%5 Year Gain 3% 3% 2% 1% 8% 4% 3% 8% 4%4-Year 89% 86% 92% 93% 78% 82% 76% 75% 84%
50%
60%
70%
80%
90%
100%
NE PublicTotal Male Female White non-
Hispanic Asian Hispanic NativeAmerican
Black non-Hispanic
Two orMoreRaces
5-Year 91% 89% 94% 94% 83% 85% 77% 82% 87%5 Year Gain 2% 2% 2% 1% 2% 3% 3% 3% 3%4-Year 89% 87% 92% 93% 81% 82% 74% 79% 84%
50%
60%
70%
80%
90%
100%

Nebraska’s Coordinating Commission for Postsecondary Education – 2018 Progress Report 35
1.1.b Preparation for College Increase the proportion of Nebraska high school graduates who are adequately prepared to enroll in postsecondary education and proceed through degree completion. The results of the ACT Assessment and the new SAT® are summarized in this section as indicators of the extent to which Nebraska high school graduates are prepared academically to enter and proceed through postsecondary education.5 Of particular interest are (1) the estimated percentages of Nebraska high school graduates who are prepared for college-level coursework and (2) the higher average ACT scores achieved by students who take the “core” high school courses recommended to prepare them for college. Nebraska Participation Rates for the ACT Assessment and the SAT Test • The ACT Assessment is the predominant college entrance exam available to measure the
extent to which Nebraska students are prepared for academic coursework beyond high school. As shown in Figure 1.1.b.1, 81.2% of the Nebraska high school students in the graduating class of 2017 took the ACT Assessment (up from 76.0% in 2007). In comparison, 2.9% of the students took the SAT Test in 2017 (down from 6.2% in 2007).
Figure 1.1.b.1
Percentages of Nebraska High School Graduates Who Took the ACT Assessment and/or the SAT Test
2007 through 2017
Note. See Table A4.1 in Appendix 4 for supporting data. Data sources: ACT, Inc., College Board, and the Nebraska Department of Education, 2007 through 2017.
5 SAT cohort data for 2007 through 2015 include students tested through June of their senior year. Cohort data for 2016 include students tested through January. The SAT was then redesigned, and the first administration of the new SAT took place in March 2016. Participation data for students who took the new SAT between March 2016 and June 2016 are not included in the 2016 cohort data due to the redesign of the SAT test. Due to the redesign of the SAT test, new SAT outcomes should not be compared against results from the old SAT. Consequently, the 2017 performance data for the new SAT established a new baseline for future comparisons.
76.0% 74.7% 75.3% 75.2% 72.7% 73.1%78.4% 77.2% 80.1% 81.1% 81.2%
6.2% 5.1% 4.6% 4.4% 4.3% 4.5% 3.7% 3.4% 3.2% 2.6% 2.9%
0%
25%
50%
75%
100%
2007 2008 2009 2010 2011 2012 2013 2014 2015 2016 2017ACT Assessment SAT Reasoning Test

Nebraska’s Coordinating Commission for Postsecondary Education – 2018 Progress Report 36
• The recent increase in participation rates for the ACT Assessment is at least partially due to the Nebraska ACT Pilot Project. Funded by the Nebraska Legislature, this project required all 11th graders in eight selected Nebraska public school districts to take the ACT during a school day in the spring of 2012, 2013, and 2014.
• Beginning in 2016, all 11th graders now take the ACT in place of the NeSA (Nebraska State
Accountability). This change will affect participation rates, and will also likely affect test scores, beginning with the class of 2018.
Nebraska SAT Test Scores The two components of the new SAT Test measure achievement in mathematics and evidenced-based reading and writing. As discussed in the footnote on the previous page, the SAT Test was redesigned in the spring of 2016, and the 2017 performance data for the new SAT established a new baseline for future comparisons. • As shown in Table 1.1.b.1, the average evidenced-based reading and writing scores and
math scores of Nebraska high school students who took the SAT were well above the national averages in 2017. However, it is important to note that only a relatively small number of students in Nebraska’s graduating class of 2017 took the SAT (680).
Table 1.1.b.1
National and Nebraska Average SAT Test Scores 2017
Year of High School Graduation
Evidenced-Based Reading and Writing Scores Math Scores
National Nebraska National Nebraska 2017 533 629 527 625
Data source: College Board, SAT Suite of Assessments Annual Report Nebraska, 2017.
Nebraska ACT Assessment Scores The ACT Assessment consists of four curriculum-based achievement tests in English, reading, mathematics, and science. A student’s scores for each of these tests are reported on a 36-point scale. A composite score is reported on a 36-point scale to reflect the student’s overall performance on the series of four tests. • As shown in Figure 1.1.b.2, the average ACT composite score for Nebraska high school
students in the graduating class of 2017 was 21.4, down from 22.1 in 2007. Nebraska’s 2017 average ACT composite score was 0.4 point higher than the national average of 21.0.
• There are two known reasons for the recent decline in the average ACT composite score.
• First, starting in 2013, extended-time test takers are included in national and state composite scores. Nebraska’s average ACT composite score for extended-time test takers in 2017 was 17.4. Without extended-time students, Nebraska’s average composite score would increase 0.2 point to 21.6.6
6 Students with disabilities are provided reasonable accommodations appropriate to the student’s disability. Approved students have up to five total hours (50% more time) to complete all four multiple-choice tests.
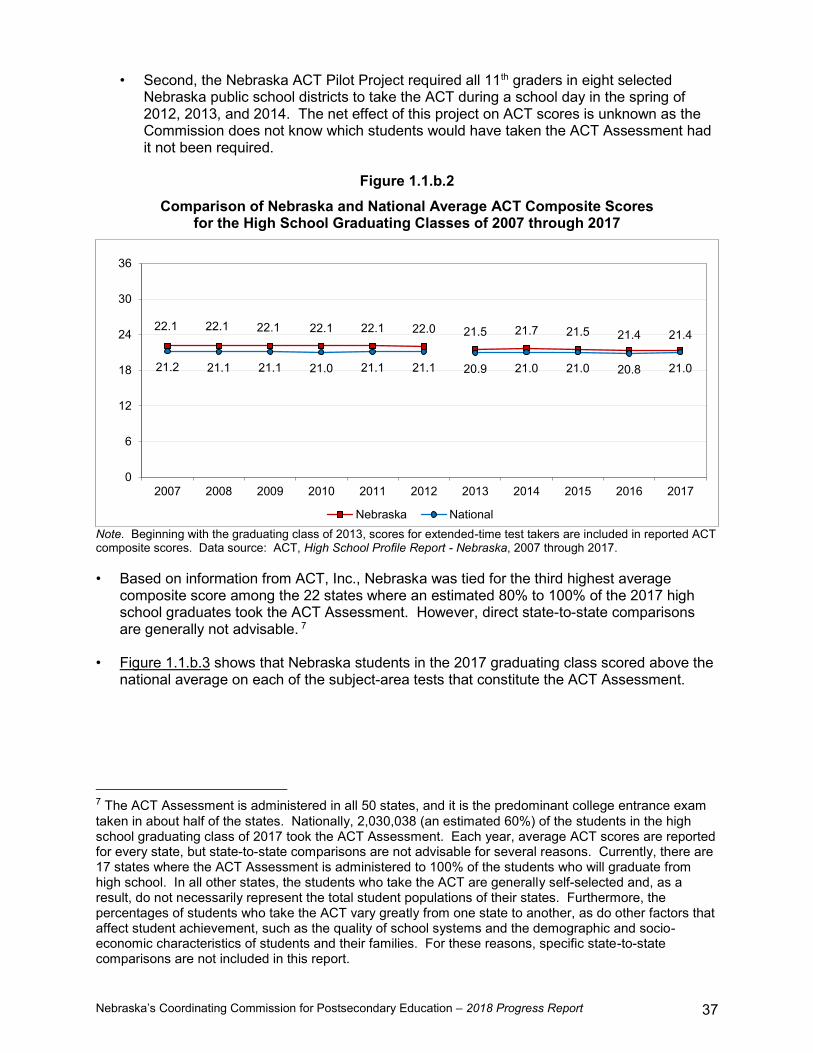
Nebraska’s Coordinating Commission for Postsecondary Education – 2018 Progress Report 37
• Second, the Nebraska ACT Pilot Project required all 11th graders in eight selected Nebraska public school districts to take the ACT during a school day in the spring of 2012, 2013, and 2014. The net effect of this project on ACT scores is unknown as the Commission does not know which students would have taken the ACT Assessment had it not been required.
Figure 1.1.b.2
Comparison of Nebraska and National Average ACT Composite Scores for the High School Graduating Classes of 2007 through 2017
Note. Beginning with the graduating class of 2013, scores for extended-time test takers are included in reported ACT composite scores. Data source: ACT, High School Profile Report - Nebraska, 2007 through 2017. • Based on information from ACT, Inc., Nebraska was tied for the third highest average
composite score among the 22 states where an estimated 80% to 100% of the 2017 high school graduates took the ACT Assessment. However, direct state-to-state comparisons are generally not advisable. 7
• Figure 1.1.b.3 shows that Nebraska students in the 2017 graduating class scored above the national average on each of the subject-area tests that constitute the ACT Assessment.
7 The ACT Assessment is administered in all 50 states, and it is the predominant college entrance exam taken in about half of the states. Nationally, 2,030,038 (an estimated 60%) of the students in the high school graduating class of 2017 took the ACT Assessment. Each year, average ACT scores are reported for every state, but state-to-state comparisons are not advisable for several reasons. Currently, there are 17 states where the ACT Assessment is administered to 100% of the students who will graduate from high school. In all other states, the students who take the ACT are generally self-selected and, as a result, do not necessarily represent the total student populations of their states. Furthermore, the percentages of students who take the ACT vary greatly from one state to another, as do other factors that affect student achievement, such as the quality of school systems and the demographic and socio-economic characteristics of students and their families. For these reasons, specific state-to-state comparisons are not included in this report.
22.1 22.1 22.1 22.1 22.1 22.0 21.5 21.7 21.5 21.4 21.4
21.2 21.1 21.1 21.0 21.1 21.1 20.9 21.0 21.0 20.8 21.0
0
6
12
18
24
30
36
2007 2008 2009 2010 2011 2012 2013 2014 2015 2016 2017
Nebraska National

Nebraska’s Coordinating Commission for Postsecondary Education – 2018 Progress Report 38
Figure 1.1.b.3 Comparison of National and Nebraska Average ACT Composite Scores
in English, Reading, Mathematics, and Science for the High School Graduating Class of 2017
Data source: ACT, High School Profile Report - Nebraska, 2017. ACT College Readiness Benchmark Scores Based on research conducted by ACT, Inc., students are prepared to succeed in entry-level college courses if their scores on the ACT Assessment meet or exceed ACT College Readiness Benchmark Scores. A benchmark score is the minimum score needed on an ACT subject-matter test to indicate that a student has a 50% chance of earning a B or higher or about a 75% chance of earning a C or higher in related entry-level, credit-bearing college courses. Corresponding to the subject-matter tests that constitute the ACT Assessment, these courses include English composition, social sciences, algebra, and biology. For each college course or subject area, the 2017 ACT subject-area test and College Readiness Benchmark Scores are: College Readiness College Course or Area ACT Subject-Area Test Benchmark Score8
English Composition English 18 Social Science Reading 22 Algebra Mathematics 22 Biology Science 23
8 Beginning in 2013, the reading benchmark score increased from 21 to 22 and the science benchmark score decreased from 24 to 23.
20.9 20.9 21.9 21.520.3 20.7 21.4 21.0
0
6
12
18
24
30
36
English Mathematics Reading Science
Nebraska National

Nebraska’s Coordinating Commission for Postsecondary Education – 2018 Progress Report 39
Percentages of Nebraska ACT-Tested Students Ready for College-Level Coursework • Based on the data summarized in Figure 1.1.b.4, 67% of the ACT-tested Nebraska high
school graduating class of 2017 met or exceeded the College Readiness Benchmark Score of 18 on the ACT English test, indicating that there is a relatively high probability that these students will earn at least a C in college-level English composition courses.
• In comparison, 42% met or exceeded the mathematics benchmark score of 22 for college
algebra; 50% met or exceeded the benchmark score of 22 on the reading test; and only 41% met or exceeded the science benchmark score of 23 for biology.
• Between 2007 and 2017, the percentages of Nebraska students who met or exceeded ACT
College Readiness Benchmarks on the English, mathematics, and reading tests decreased ten, seven, and eight percentage points, respectively. The only increase seen from 2007 to 2017 was for the science benchmark, which increased seven percentage points.
• Between 2016 and 2017, the percentage of Nebraska students who met or exceeded ACT
College Readiness Benchmarks for English and mathematics both decreased one percentage point. Meanwhile, the percentage that met or exceeded the benchmark for reading increased two percentage points while the percentage that met or exceeded the benchmark for science increased one percentage point.
• Only 28% of Nebraska’s high school graduates in the class of 2017 met or exceeded
the ACT College Readiness Benchmarks in all four subject areas included in the ACT Assessment. This percentage is one point higher than in 2007.
Figure 1.1.b.4
Percentages of ACT-Tested Students Meeting ACT College Readiness Benchmarks that Indicate Sufficient Preparation for College-Level Courses
Nebraska High School Graduating Classes: 2016 and 2017 Compared to 2007
Note. Beginning with the 2013 graduating class, ACT’s college readiness benchmark score for reading increased from 21 to 22 while their college readiness benchmark score for science decreased from 24 to 23. The benchmark scores for English (18) and mathematics (22) were unchanged during the reporting period. In addition, starting in 2013, extended-time test takers are included in national and state scores. See Table A4.2 in Appendix 4 for supporting data. Data source: ACT, High School Profile Report - Nebraska, 2007, 2016, and 2017.
77%
49%
58%
34%27%
68%
43%48%
40%
28%
67%
42%50%
41%
28%
0%
25%
50%
75%
100%
EnglishTest Benchmark =
18
MathematicsTest Benchmark =
22
ReadingTest Benchmark =
21 / 22
ScienceTest Benchmark =
24 / 23
Students Meeting AllFour ACT
Benchmark Scores
2007
2016
2017

Nebraska’s Coordinating Commission for Postsecondary Education – 2018 Progress Report 40
Changes in the Number of Students Who Took the ACT Assessment • Between 2016 and 2017, every racial/ethnic group saw an increase in the number of
students who took the ACT Assessment. • The largest increase in the number of students who took the ACT Assessment in 2017 was
the increase in the number of Hispanics: 2,514 in the class of 2017, up from 2,324 in the class of 2016, an increase of 190 students (8.2%) in one year.
• See Table A4.4 in Appendix 4 for the number of students in each racial/ethnic group who
took the ACT Assessment in 2007, 2016, and 2017. ACT Composite Scores and College Readiness Percentages by Race/Ethnicity • As shown in Figure 1.1.b.5, average ACT composite scores vary by race/ethnicity. • The average composite scores for Asians, Hispanics, Native Americans, black non-
Hispanics, and multiracial persons who graduated from Nebraska high schools in 2007, 2016, and 2017 were generally lower than the average composite scores of their white non-Hispanic classmates. (The only exception were Asians who graduated in 2007.)
• Between 2016 and 2017, average composite scores increased 0.1 point for white non-
Hispanics and Hispanics while Native Americans increased 0.8 point, and black non-Hispanics increased 0.4 point. Meanwhile, the average scores for Asians and multiracial students decreased 0.3 and 0.2 point, respectively.
• The average composite scores of white non-Hispanics remained unchanged between 2007
and 2017. Meanwhile, the average scores of Asians, Hispanics, Native Americans, and black non-Hispanics decreased 1.1, 0.8, 1.2, and 0.3 point respectively.
• It is unknown how much of the overall decline was attributable to the inclusion of extended-
time test takers and students who took the ACT Assessment only because they were required to do so through the Nebraska ACT Pilot Project, and how much of the decline is attributable to other variables.

Nebraska’s Coordinating Commission for Postsecondary Education – 2018 Progress Report 41
Figure 1.1.b.5
Nebraska Average ACT Composite Scores by Race/Ethnicity 2016 and 2017 Compared to 2007
Note. Beginning with the graduating class of 2013, scores for extended-time test takers are included in reported ACT composite scores. Prior to 2011, the Asian category included Native Hawaiians and other Pacific Islanders. Average composite scores for Native Hawaiians and other Pacific Islanders are excluded from this figure due to the small number of individuals in this racial category who took the ACT Assessment. In 2016, 23 Native Hawaiians and other Pacific Islanders took the ACT Assessment with an average composite score of 17.1. In 2017, 23 Native Hawaiians and other Pacific Islanders took the ACT Assessment with an average composite score of 19.2. These students are not included in the calculation of the average composite score for Asians in 2016 or 2017. Prior to 2011, ACT did not have a racial/ethnic category for individuals who were more than one race. Data source: ACT, High School Profile Report - Nebraska, 2007, 2016, and 2017. • Based on the data for the graduating class of 2017 summarized in Figure 1.1.b.6, lower
percentages of Hispanics, Native Americans, and black non-Hispanics are sufficiently prepared for college-level coursework compared to their white non-Hispanic, Asian, and multiracial classmates.
• For example, only 19% of the ACT-tested Hispanics in the class of 2017 met or exceeded
the ACT College Readiness Benchmark Score in mathematics, compared to 50% of the white non-Hispanic students, 51% of the Asian students, and 33% of the multiracial students. More dramatically, only 16% of the ACT-tested Native Americans and 12% of the ACT-tested black non-Hispanics met or exceeded the benchmark score in mathematics. A similar pattern is evidenced for the other three ACT subject-matter tests as well as the percentage of students who met all four ACT benchmark scores.
• In fact, 34% of white non-Hispanics, 32% of Asians, and 22% of multiracial students met or
exceeded the benchmarks for all four subject-matter tests in 2017, while only 9% of Hispanics, 8% of Native Americans, and 6% of black non-Hispanics met or exceeded the benchmarks for all four subject-matter tests.
22.4 22.7
19.2 19.1 17.9
22.3 21.9
18.3 17.1 17.2
21.122.4 21.618.4 17.9 17.6
20.9
0
6
12
18
24
30
36
White non-Hispanic
Asian Hispanic Native American Black non-Hispanic
Two or MoreRaces
2007 2016 2017
N/A

Nebraska’s Coordinating Commission for Postsecondary Education – 2018 Progress Report 42
Figure 1.1.b.6 Percentages of ACT-Tested High School Students in the Graduating Class of 2017
Who Met or Exceeded ACT College Readiness Benchmark Scores that Indicate Sufficient Preparation for College-Level Courses
by Race/Ethnicity
Note. Data for Native Hawaiians and other Pacific Islanders are excluded from this figure due to the small number of individuals in this racial category (23) who took the ACT Assessment. Data source: ACT, High School Profile Report - Nebraska, 2017.
75%
50%
61%51%
41%
19%
38%
16%
39%
12%
63%
33%
0%
25%
50%
75%
100%
EnglishTest Benchmark = 18
MathematicsTest Benchmark = 22
White non-Hispanic
Asian
Hispanic
Native American
Black non-Hispanic
Two or More Races
57%48%
34%
43% 42%
32%28%
18%9%
27%17%
8%
25%
13%6%
50%
35%
22%
0%
25%
50%
75%
100%
ReadingTest Benchmark = 22
ScienceTest Benchmark = 23
Students Meeting All FourACT Benchmark Scores
Nebraska’s Coordinating Commission for Postsecondary Education – 2018 Progress Report 43
The Importance of the ACT-Recommended High School Core Curriculum ACT, Inc. defines the core, college-preparatory high school curriculum (i.e., the core) as consisting of four years of English and three or more years each of social studies, science, and mathematics (beginning with Algebra I). Specifically, the core is defined as consisting of the following courses: • 4 years of English: English 9, English 10, English 11, and English 12
• 3 years of Math: Selected from Algebra I, Algebra II, Geometry, Trigonometry, and Calculus
• 3 years of Social Sciences: Selected from American History, World History, American Government, Economics, Geography, and Psychology
• 3 years of Natural Sciences: Selected from General/Physical/Earth Science, Biology, Chemistry, and Physics
When students register to take the ACT Assessment, they are asked to report the courses they have taken or plan to take before they graduate from high school. Based on the combinations of courses that students report they have taken or plan to take, ACT, Inc. conducts research to determine how taking the core—or more than the core—is related to scores on the ACT Assessment and academic achievement in college. • The research conducted by ACT, Inc. has repeatedly confirmed that students who complete
the high school core generally score higher on the ACT Assessment and are more likely to progress successfully through postsecondary education programs than students who do not complete the recommended core courses.
• Furthermore, research conducted by ACT, Inc. indicates that students who take rigorous
courses beyond the recommended minimum number of core courses are even more likely to be ready for college than students who take the minimum core. This research indicates that students whose coursework beyond the core includes advanced courses in mathematics, such as trigonometry or calculus, as well as courses in biology, chemistry, and physics, are the likeliest of all high school students to be ready for college-level coursework.9
Consequently, it is important to monitor the average ACT composite scores of students who report that they completed the core—or more than the core—compared to the scores of students who report taking less than the minimum core courses. Nebraska ACT Composite Scores of Students Who Take the ACT-Recommended Core and Students Who Take Less than the Core Curriculum • As shown in Figure 1.1.b.7, Nebraska students who have taken or plan to take the core
college preparatory courses—or more than the core—in high school have consistently scored higher on the ACT than the students who have completed or plan to complete less than the minimum core.
• Of the ACT-tested students in the class of 2017, those who took the core or more had an
average composite score of 22.3 compared to an average score of 19.1 for the students who reported that they took courses that did not meet the minimum core requirements.
9 Executive Summary, Crisis at the Core: Preparing All Students for College and Work, ACT, Inc., 2004, page 3.

Nebraska’s Coordinating Commission for Postsecondary Education – 2018 Progress Report 44
• The average ACT composite score for the students who took the core or more was 0.6 point lower in 2017 than it was in 2007 while the average score for students who took less than the core was 1.3 points lower in 2017 than it was in 2007.
• Regardless of score variations, the data summarized in Figure 1.1.b.7 provide strong
evidence that taking the college-preparatory curriculum continues to have a positive effect on ACT composite scores and improves a student’s chances for achieving academic success in college-level courses.
Figure 1.1.b.7
Nebraska Average ACT Composite Scores of Students Who Took the College-Preparatory Core and Students Who Took Less than the Core
2007 through 2017
Note. Beginning with the graduating class of 2013, scores for extended-time test takers are now included in reported ACT composite scores. Data source: ACT, High School Profile Report - Nebraska, 2007 through 2017. Note: Beginning with the 2014-2015 school year, Nebraska school districts are required to adopt and implement graduation requirements that include meeting standards similar to those represented by the core, college-preparatory high school curriculum advocated by ACT, Inc. Prior to adoption of the new statewide standards, Nebraska high school graduation requirements were set by each school district individually and may or may not have included “the core” as defined by ACT, Inc. Data source: Nebraska Department of Education, Rule 10, Regulations and Procedures for the Accreditation of Schools (pages 5-6), August 1, 2015.
22.9 22.8 22.9 22.8 22.7 22.6 22.3 22.5 22.5 22.5 22.3
20.4 20.1 19.8 19.6 19.6 19.5 18.8 19.0 18.8 18.8 19.1
0
6
12
18
24
30
36
2007 2008 2009 2010 2011 2012 2013 2014 2015 2016 2017
Took the College-Prep Core or More Took Less than the Core

Nebraska’s Coordinating Commission for Postsecondary Education – 2018 Progress Report 45
• Taking “the core or more” helps students of every race/ethnicity. Within each of the six racial/ethnic groups, the average ACT composite score was higher for the students in the graduating class of 2017 who took the college-preparatory core than the average score for students who took less than the core, as illustrated in Figure 1.1.b.8.
Figure 1.1.b.8 Nebraska ACT Composite Scores for Students Who Took the College-Preparatory
Core or More and Students Who Took Less than the Core by Race/Ethnicity for the High School Graduating Class of 2017
Note. Data for Native Hawaiians and other Pacific Islanders are excluded from this figure due to the small number of individuals in this racial category (23) who took the ACT Assessment. Data source: ACT, High School Profile Report - Nebraska, 2017. Percentage of Nebraska ACT-Tested Students Who Take the Core or More As mentioned earlier in this section, the students themselves report the courses they have taken and plan to take before they graduate from high school when they register for the ACT Assessment. Self-reporting may make the data less accurate and/or less reliable. However, the percentage of ACT-tested students who reported the courses they took or planned to take in high school was 87% in 2007, 93% in 2016, and 94% in 2017. • A direct comparison of 2007, 2016, and 2017 percentages indicates that the percentage of
high school students who took the core or more increased noticeably over the past 10 years. As shown in Figure 1.1.b.9, the percentage of students who reported that they took the core or more was 17 percentage points higher in 2017 than in 2007.
20.0 18.616.7 15.8 16.0
18.6
23.1 22.519.2 19.1 18.2
21.7
0
6
12
18
24
30
36
White non-Hispanic
Asian Hispanic Native American Black non-Hispanic
Two or MoreRaces
Students Who Took Less than Core Students Who Took the Core or More

Nebraska’s Coordinating Commission for Postsecondary Education – 2018 Progress Report 46
Figure 1.1.b.9 Percentages of Nebraska’s ACT-Tested Students Who Took the
College-Preparatory Core or More and Students Who Took Less than the Core 2016 and 2017 Compared to 2007
Note. Beginning with the graduating class of 2013, scores for extended-time test takers are included in reported ACT composite scores. See Table A4.3 in Appendix 4 for supporting data. Data source: ACT, High School Profile Report - Nebraska, 2007, 2016, and 2017. • Figure 1.1.b.10 shows that for all major racial/ethnic groups, there has been a general
increase since 2007 in the percentage of the ACT-tested students who have reported taking the core or more in high school.
• As shown in Figure 1.1.b.11, lower percentages of Native American and black non-Hispanic
high school graduates in Nebraska have been taking the ACT Assessment than their white non-Hispanic, Asian/Pacific Islander, Hispanic, and multiracial classmates.
• Between 2016 and 2017, ACT participation rates increased for white non-Hispanics, Native
Americans, and black non-Hispanics. • Comparing the graduating classes of 2016 and 2017 to the number of students who took the
ACT Assessment reveals a disconnect between the coding of multiracial students in NDE’s records and the coding of multiracial students in ACT’s records.
• NDE’s records indicate there were 598 multiracial students in the graduating class of
2016, and ACT’s records indicate that 691 multiracial students in the graduating class of 2016 took the ACT.
• NDE’s records indicate there were 681 multiracial students in the graduating class of
2017, and ACT’s records indicate that 711 multiracial students in the graduating class of 2017 took the ACT.
59%
28%
13%
75%
19%
7%
76%
18%
6%
0%
25%
50%
75%
100%
% Who Tookthe Core or More
% Who TookLess than the Core
% Who Did Not ReportCourses Taken
2007 2016 2017
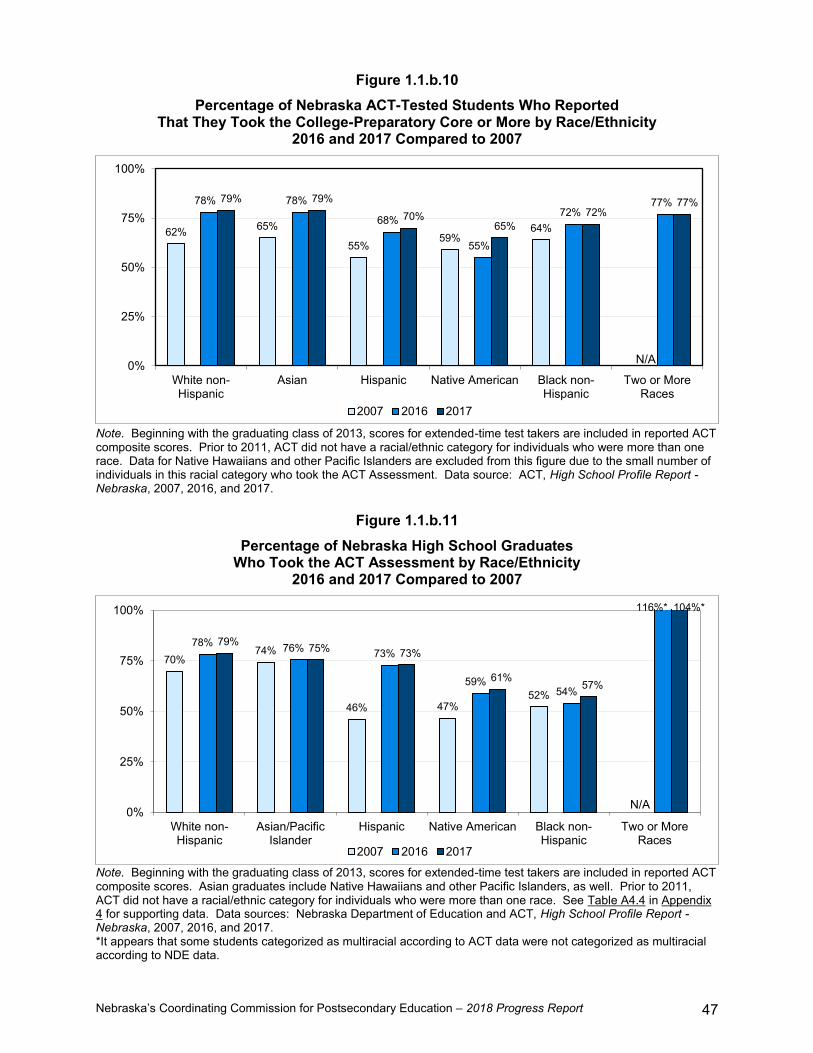
Nebraska’s Coordinating Commission for Postsecondary Education – 2018 Progress Report 47
Figure 1.1.b.10
Percentage of Nebraska ACT-Tested Students Who Reported That They Took the College-Preparatory Core or More by Race/Ethnicity
2016 and 2017 Compared to 2007
Note. Beginning with the graduating class of 2013, scores for extended-time test takers are included in reported ACT composite scores. Prior to 2011, ACT did not have a racial/ethnic category for individuals who were more than one race. Data for Native Hawaiians and other Pacific Islanders are excluded from this figure due to the small number of individuals in this racial category who took the ACT Assessment. Data source: ACT, High School Profile Report - Nebraska, 2007, 2016, and 2017.
Figure 1.1.b.11
Percentage of Nebraska High School Graduates Who Took the ACT Assessment by Race/Ethnicity
2016 and 2017 Compared to 2007
Note. Beginning with the graduating class of 2013, scores for extended-time test takers are included in reported ACT composite scores. Asian graduates include Native Hawaiians and other Pacific Islanders, as well. Prior to 2011, ACT did not have a racial/ethnic category for individuals who were more than one race. See Table A4.4 in Appendix 4 for supporting data. Data sources: Nebraska Department of Education and ACT, High School Profile Report - Nebraska, 2007, 2016, and 2017. *It appears that some students categorized as multiracial according to ACT data were not categorized as multiracial according to NDE data.
62% 65%
55%59%
64%
78% 78%
68%
55%
72%77%79% 79%
70%65%
72%77%
0%
25%
50%
75%
100%
White non-Hispanic
Asian Hispanic Native American Black non-Hispanic
Two or MoreRaces
2007 2016 2017
N/A
70%74%
46% 47%52%
78% 76% 73%
59%54%
79% 75% 73%
61%57%
0%
25%
50%
75%
100%
White non-Hispanic
Asian/PacificIslander
Hispanic Native American Black non-Hispanic
Two or MoreRaces
2007 2016 2017
N/A
116%* 104%*

Nebraska’s Coordinating Commission for Postsecondary Education – 2018 Progress Report 48
This page left blank intentionally.
Nebraska’s Coordinating Commission for Postsecondary Education – 2018 Progress Report 49
1.1.c College Continuation Rates Increase the proportion of Nebraska high school graduates who enroll in postsecondary education. One strategic approach to increasing the total number of students who enroll at Nebraska’s postsecondary institutions is to increase the state’s college continuation rate, or the percentage of Nebraska high school graduates who go to college. (Since a college-going rate is the same as a college continuation rate, the two terms are used interchangeably in this report.) Introduction: Two Measures of Nebraska’s College Continuation Rates This section of the Nebraska Higher Education Progress Report provides estimates of the state’s college continuation rate based on two different approaches to data collection and analysis. The first approach relies on data collected every two years through the Integrated Postsecondary Education Data System (IPEDS) maintained by the National Center for Education Statistics (NCES) in the U.S. Department of Education. The second approach is an annual study that is based on data obtained from the National Student Clearinghouse (NSC) in cooperation with the Nebraska Department of Education. College Continuation Rates Based on IPEDS Data The Coordinating Commission estimates Nebraska’s college continuation rates using IPEDS data that are collected every other year in the fall. The Nebraska Department of Education provides the total number of students who graduated from Nebraska public and private high schools during the school year preceding IPEDS data collection. Given the number of high school graduates, the Commission uses IPEDS data to estimate how many of these Nebraskans continued on to college at degree-granting and non-degree-granting institutions throughout the United States. Using available data from IPEDS, college continuation rates are estimated only for first-time freshmen who start college in the fall term of the academic year following their graduation from high school. First-time freshmen enrolled in the fall term who attended college for the first time in the prior summer term are also included. First-time freshmen who wait to start college until after the fall term are not included. College continuation rates do not account for these students because the NCES does not require institutions to report when each of the students in this category graduated from high school. Another limitation of the college continuation rates based on IPEDS data is that they cannot be calculated for any subgroups based on gender, race/ethnicity, household income, or any other demographic or socioeconomic variable. Using IPEDS data, a college continuation rate can be estimated only for the total number of students who graduated from Nebraska high schools during a given school year. An important advantage of using IPEDS data is that the National Center for Education Statistics has consistently collected these data for a number of years, allowing the Commission to calculate and publish statewide college continuation rates for degree- and non-degree-granting institutions for an extended period of time. In addition, IPEDS data are currently the only source that research organizations can use to calculate a national college continuation rate and make state-to-state comparisons of college-going rates. The latest available IPEDS data were reported by institutions for first-time freshmen who started college in fall 2016, providing a basis for estimating the college continuation rate for

Nebraska’s Coordinating Commission for Postsecondary Education – 2018 Progress Report 50
students who graduated from Nebraska high schools during the 2015-2016 school year. In this section, the estimated college continuation rates are analyzed for fall 2006 through fall 2016. College Continuation Rates Based on National Clearinghouse Data An approach to estimating college continuation rates that overcomes major limitations of using IPEDS data is to use data available from the National Student Clearinghouse (NSC). The NSC is a not-for-profit organization that serves as a central repository of postsecondary student enrollment, degree, and diploma data voluntarily submitted by more than 3,700 colleges and universities. These institutions enroll an estimated 96.8% of the college students in the United States that attend Title IV, degree-granting institutions.10
Since the beginning of 2009, the Coordinating Commission has worked in cooperation with the Nebraska Department of Education to obtain and analyze data from the NSC to estimate the college continuation rates for male and female low-income and non-low-income students who have graduated from Nebraska’s public high schools. Additionally, college continuation rates are analyzed by race/ethnicity, gender, and student income status. Currently, students who have graduated from Nebraska’s nonpublic (or private) high schools are not included in the analysis. However, this research has the important advantage of providing estimates and comparisons of college continuation rates by race/ethnicity, gender, and student income status. Another advantage is that this research is conducted in the spring of the year following high school graduation. As a result, students who do not start college in the summer or fall immediately following high school graduation but who instead wait to begin college until the winter or spring are included in the count of the state’s public high school graduates who continued on to college. The Coordinating Commission has estimated college continuation rates for the students who graduated from Nebraska’s public high schools during the 2007-2008 through 2015-2016 school years, using data obtained from the National Student Clearinghouse. The findings of this research are summarized at the end of this section.
10 Data source: National Student Clearinghouse Research Center, Enrollment Coverage Workbook, updated January 2, 2018.

Nebraska’s Coordinating Commission for Postsecondary Education – 2018 Progress Report 51
Nebraska Statewide College Continuation Rates Based on IPEDS Data Using IPEDS data, the college continuation rate is the number of Nebraska-resident, first-time freshmen who enrolled in college in the fall term following their high school graduation, divided by the number of students who graduated from Nebraska high schools during the previous school year. • As illustrated in Figure 1.1.c.1, the estimated college continuation rate for Nebraska
students who graduated in the high school class of 2016 and attended degree-granting and non-degree-granting colleges in fall 2016 was 64.7%, a decrease of 3.0 percentage points from the 67.7% continuation rate in fall 2006.
Figure 1.1.c.1
College Continuation Rate for Nebraska High School Graduates Who Attended Degree-Granting and Non-Degree-Granting Institutions in the United States
in the Fall Term Following High School Graduation Fall 2006 through Fall 2016
Note. Includes full-time and part-time students. See Table A5.1 in Appendix 5 for supporting data. Data sources: Nebraska Department of Education, January 2009, January 2011, December 2013, January 2015, and December 2016, and the National Center for Education Statistics, IPEDS fall 2006 through 2016 surveys. State-by-State College Continuation Rates National high school graduation data for the 2013-2014 school year has not yet been released by the National Center for Education Statistics. In place of this information, projections of 2013-2014 high school graduates were used to calculate fall 2014 college continuation rates by state. Therefore, the national college continuation rate data presented in this edition of the Progress Report is not directly comparable to previously reported national comparisons. The most recent national study of college continuation rates includes students who attended postsecondary institutions in the United States as first-time freshmen in the 2014 fall term after graduating from high school during the 2013-2014 school year. • As shown in Figure 1.1.c.2, Nebraska’s fall 2014 estimated college continuation rate of
62.6% was the 26th highest in the nation and 0.1 percentage point below the national rate.
21,188 22,185 21,513 22,678 23,004 22,945
14,352 14,737 15,100 14,920 14,283 14,834
67.7% 66.4% 70.2%65.8% 62.1% 64.7%
0%
100%
0
30,000
Fall 2006 Fall 2008 Fall 2010 Fall 2012 Fall 2014 Fall 2016
College C
ontinuation Rate
Num
ber o
f Hig
h Sc
hool
Gra
duat
esan
d N
ebra
ska-
Res
iden
t Firs
t-Tim
e Fr
eshm
en
High School Graduates Total First-Time Freshmen

Nebraska’s Coordinating Commission for Postsecondary Education – 2018 Progress Report 52
Figure 1.1.c.2 College Continuation Rates for High School Graduates Who Attended
Degree-Granting and Non-Degree-Granting Institutions in the United States in the Fall Term Following High School Graduation: Fall 2014
Data sources: Western Interstate Commission for Higher Education, Knocking at the College Door: Projections of High School Graduates, 2016, and the National Center for Education Statistics, IPEDS fall 2014 survey. College continuation rates obtained from the National Center for Higher Education Management Systems (NCHEMS), February 2018.
43.7%44.0%
45.3%47.6%
50.1%52.3%52.7%53.8%54.0%54.6%54.7%
58.2%58.7%
60.8%60.9%60.9%61.3%61.3%61.5%61.5%61.6%62.0%62.1%62.1%62.5%62.5%62.6%62.9%63.0%63.2%63.3%63.4%63.5%63.6%63.6%63.9%64.0%64.5%65.4%65.9%
67.2%67.2%67.7%68.1%
69.3%69.5%69.8%69.9%
72.2%73.4%74.5%
0% 10% 20% 30% 40% 50% 60% 70% 80% 90% 100%
Idaho
Alaska
Utah
Oregon
Washington
Arizona
Nevada
Wyoming
Vermont
Maine
West Virginia
Colorado
Texas
Hawaii
California
Montana
Indiana
Wisconsin
Illinois
New Hampshire
Pennsylvania
Rhode Island
Alabama
Missouri
Nebraska
Ohio
Nation
North Carolina
Oklahoma
Delaware
New Mexico
Florida
Arkansas
Georgia
Kentucky
Maryland
Michigan
Tennessee
Kansas
North Dakota
Iowa
South Dakota
Virginia
South Carolina
New York
Louisiana
New Jersey
Minnesota
Mississippi
Connecticut
Massachusetts
Nebraska’s Coordinating Commission for Postsecondary Education – 2018 Progress Report 53
In-State and Out-of-State College Continuation Rates • The statewide college continuation rate for Nebraska high school graduates can be
partitioned into two rates: • In-state college continuation rate: the percentage of Nebraska high school graduates
who attended postsecondary institutions in Nebraska in the fall term following high school graduation.
• Out-of-state college continuation rate: the percentage of Nebraska high school graduates who continued on to college at out-of-state institutions in the fall term following high school graduation.
• As illustrated in Figure 1.1.c.3, the Commission estimates Nebraska’s in-state college
continuation rate was 52.8% for the state’s 2015-2016 high school graduates who attended degree-granting or non-degree-granting colleges. This is a decrease of 2.6 percentage points since fall 2006.
• Meanwhile, the out-of-state college continuation rate for degree-granting and non-degree-
granting schools decreased, from 12.3% of the high school graduating class of 2005-2006 to 11.9% of Nebraska high graduates in 2015-2016.

Nebraska’s Coordinating Commission for Postsecondary Education – 2018 Progress Report 54
Figure 1.1.c.3 In-State and Out-of-State College Continuation Rates for
Nebraska High School Graduates Who Attended Degree-Granting and Non-Degree-Granting Institutions and the Percentage Who Did Not Go on to College
in the Fall Term Following High School Graduation Fall 2016 Compared to Fall 2006
Note. Includes full-time and part-time students. Percentages do not always add to 100.0% due to rounding. See Table A5.2 in Appendix 5 for supporting data. Date sources: Nebraska Department of Education, January 2009 and December 2016, and the National Center for Education Statistics, IPEDS fall 2006 and 2016 surveys. Percentages of Students Who Continue Their Education at Public and Private Institutions Of related interest are the types of postsecondary institutions attended by recent graduates of Nebraska’s high schools. As shown in Part A and Part B of Figure 1.1.c.4, the pattern of attendance of Nebraska-resident, first-time freshmen who go to college in Nebraska in the fall term following high school graduation is different than the pattern of Nebraskans who go out of state to school their freshmen year. • Part A of Figure 1.1.c.4 shows that 86.2% of the fall 2016 first-time freshmen who stayed in
state attended Nebraska’s public colleges or universities, compared to 13.8% who went to Nebraska’s private, for-profit or not-for-profit institutions.
• In contrast, Part B of Figure 1.1.c.4 reveals that 63.6% of the fall 2016 first-time freshmen
who went out of state attended public institutions, while 36.4% went to private institutions.
Graduates Who Attended Nebraska
Institutions 11,73655.4%
Graduates Who Attend Out-of-State Schools2,616 12.3%
Graduates Who Did Not Go on to
College 6,83632.3%
Fall 200621,188 Nebraska High School Graduates
Graduates Who Attended Nebraska
Institutions 12,11052.8%
Graduates Who Attend Out-of-State Schools2,724 11.9%
Graduates Who Did Not Go on to
College 8,11135.3%
Fall 201622,945 Nebraska High School Graduates
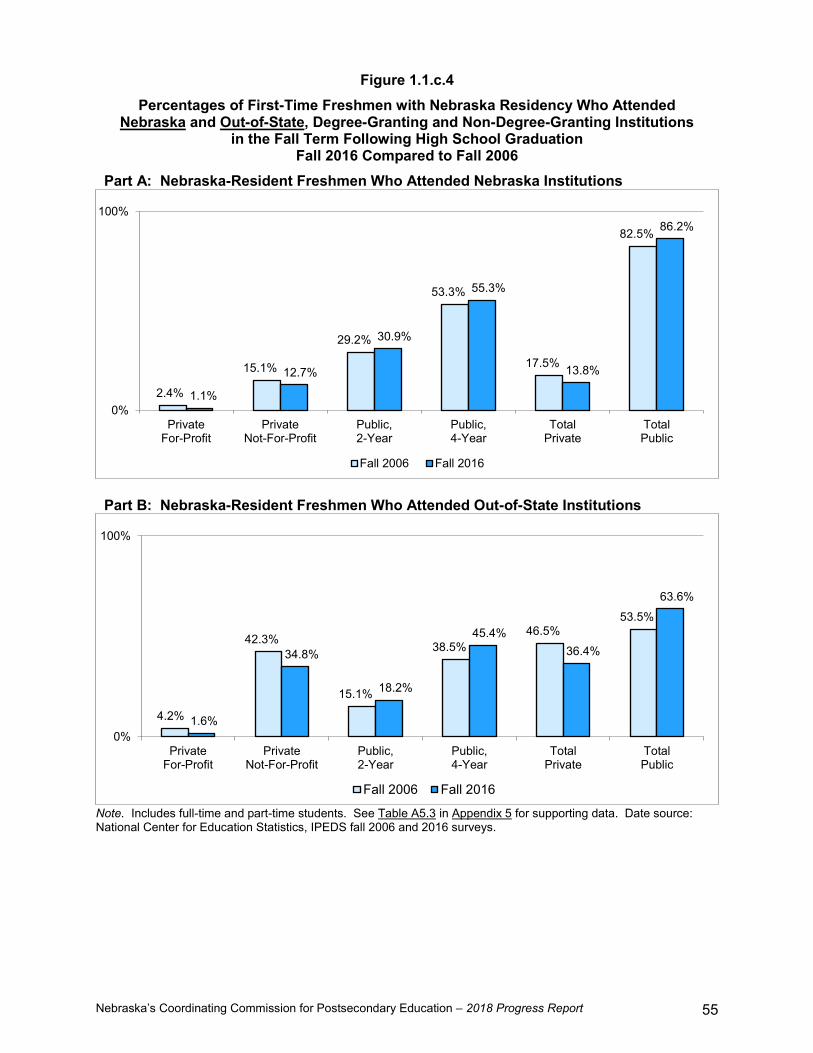
Nebraska’s Coordinating Commission for Postsecondary Education – 2018 Progress Report 55
Figure 1.1.c.4 Percentages of First-Time Freshmen with Nebraska Residency Who Attended
Nebraska and Out-of-State, Degree-Granting and Non-Degree-Granting Institutions in the Fall Term Following High School Graduation
Fall 2016 Compared to Fall 2006 Part A: Nebraska-Resident Freshmen Who Attended Nebraska Institutions
Part B: Nebraska-Resident Freshmen Who Attended Out-of-State Institutions
Note. Includes full-time and part-time students. See Table A5.3 in Appendix 5 for supporting data. Date source: National Center for Education Statistics, IPEDS fall 2006 and 2016 surveys.
2.4%
15.1%
29.2%
53.3%
17.5%
82.5%
1.1%
12.7%
30.9%
55.3%
13.8%
86.2%
0%
100%
PrivateFor-Profit
PrivateNot-For-Profit
Public,2-Year
Public,4-Year
TotalPrivate
TotalPublic
Fall 2006 Fall 2016
4.2%
42.3%
15.1%
38.5%46.5%
53.5%
1.6%
34.8%
18.2%
45.4%36.4%
63.6%
0%
100%
PrivateFor-Profit
PrivateNot-For-Profit
Public,2-Year
Public,4-Year
TotalPrivate
TotalPublic
Fall 2006 Fall 2016

Nebraska’s Coordinating Commission for Postsecondary Education – 2018 Progress Report 56
College Continuation Rates for Nebraska Public High School Graduates by Gender, Student Income Status, and Race/Ethnicity, Based on National Student Clearinghouse Data As mentioned in the introduction to this section, the Coordinating Commission has worked with the Nebraska Department of Education (NDE) to estimate the college continuation rates for students who graduated from Nebraska public high schools during the 2007-2008 through 2015-2016 school years. • These estimates included only “on-time” graduates—students who graduated from high
school in four years or less. • In addition, students who graduated from Nebraska’s nonpublic (private) high schools
were not included in this research. Using student records from the NDE and enrollment data from the Clearinghouse, the Coordinating Commission estimated the college continuation rate for all public high school students who earned regular diplomas between 2007-2008 and 2015-2016.11 In addition, the Commission asked the NDE to determine the number of male and female low-income students in these graduating classes and to determine how many of these students continued on to college within a year of high school graduation, based on enrollment records obtained from the Clearinghouse. Using the counts provided by the NDE, the Commission estimated the college continuation rates for male and female low-income and non-low-income students who graduated from Nebraska’s public schools. Additionally, the Commission has obtained college continuation rates by race/ethnicity, gender, and student income status, for all public high school students who earned regular diplomas between 2011-2012 and 2015-2016. Low-income students are defined as students who are approved to receive free or reduced-price school lunches. Non-low-income students are students who are not approved for free or reduced-price school lunches. The numbers of non-low-income graduates in each class were determined by subtracting the number of low-income graduates from the total number of graduates provided by the NDE. The non-low-income students in this study include at least some students who lived in low-income households but who did not apply for free or reduced-price school lunches. Since participation in the free or reduced-price school lunch program is the only indicant of household income in the student records maintained by the NDE, low-income students in the non-low-income category cannot be identified and excluded for the purposes of analysis. The Commission’s analysis of the college enrollment records received from the Clearinghouse indicates that these records do not include a few hundred students who continued on to college from Nebraska high schools each year. These students are not included because they attended private, not-for-profit colleges or for-profit colleges and career schools that do not submit enrollment records to the Clearinghouse. As a result, the college continuation rates reported in this section are underestimated to some degree.
11 The Commission has also estimated the college continuation rates for each of the public high schools in Nebraska that award regular high school diplomas. A data dashboard and downloadable Excel workbook for each of these analyses is available on the Commission’s website, ccpe.nebraska.gov/reports.
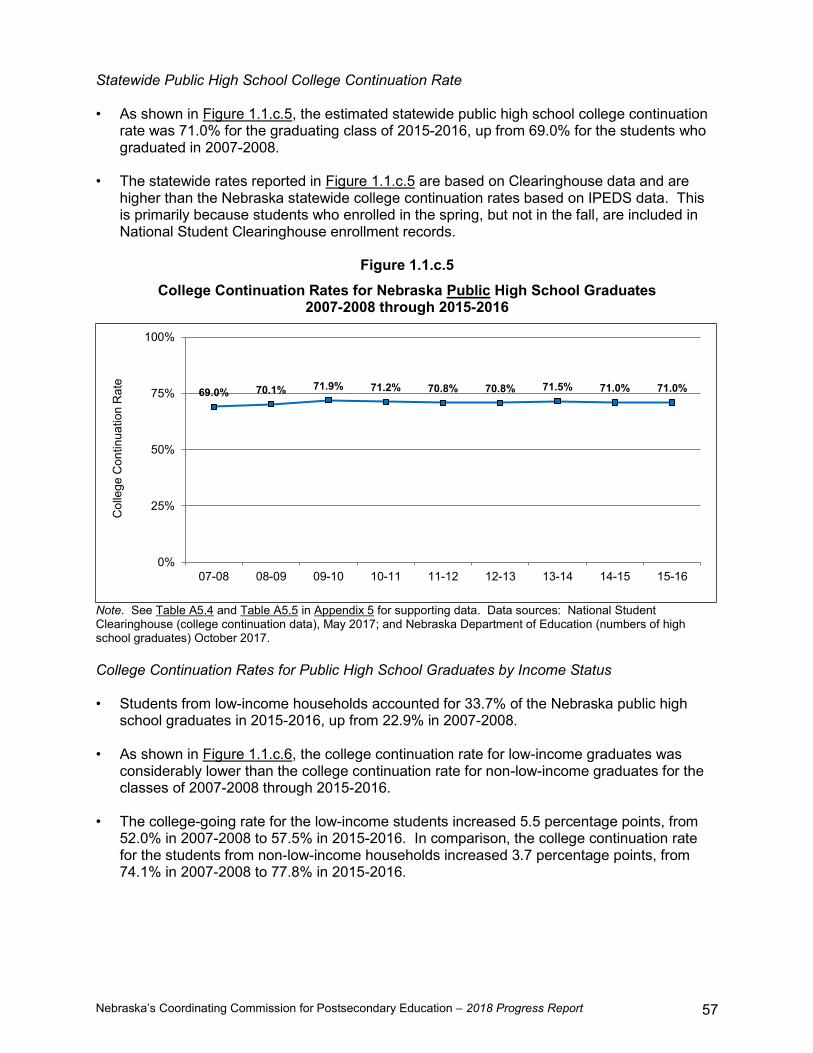
Nebraska’s Coordinating Commission for Postsecondary Education – 2018 Progress Report 57
Statewide Public High School College Continuation Rate • As shown in Figure 1.1.c.5, the estimated statewide public high school college continuation
rate was 71.0% for the graduating class of 2015-2016, up from 69.0% for the students who graduated in 2007-2008.
• The statewide rates reported in Figure 1.1.c.5 are based on Clearinghouse data and are
higher than the Nebraska statewide college continuation rates based on IPEDS data. This is primarily because students who enrolled in the spring, but not in the fall, are included in National Student Clearinghouse enrollment records.
Figure 1.1.c.5
College Continuation Rates for Nebraska Public High School Graduates 2007-2008 through 2015-2016
Note. See Table A5.4 and Table A5.5 in Appendix 5 for supporting data. Data sources: National Student Clearinghouse (college continuation data), May 2017; and Nebraska Department of Education (numbers of high school graduates) October 2017. College Continuation Rates for Public High School Graduates by Income Status • Students from low-income households accounted for 33.7% of the Nebraska public high school graduates in 2015-2016, up from 22.9% in 2007-2008. • As shown in Figure 1.1.c.6, the college continuation rate for low-income graduates was
considerably lower than the college continuation rate for non-low-income graduates for the classes of 2007-2008 through 2015-2016.
• The college-going rate for the low-income students increased 5.5 percentage points, from
52.0% in 2007-2008 to 57.5% in 2015-2016. In comparison, the college continuation rate for the students from non-low-income households increased 3.7 percentage points, from 74.1% in 2007-2008 to 77.8% in 2015-2016.
69.0% 70.1% 71.9% 71.2% 70.8% 70.8% 71.5% 71.0% 71.0%
0%
25%
50%
75%
100%
07-08 08-09 09-10 10-11 11-12 12-13 13-14 14-15 15-16
Col
lege
Con
tinua
tion
Rat
e

Nebraska’s Coordinating Commission for Postsecondary Education – 2018 Progress Report 58
Figure 1.1.c.6 College Continuation Rates for Nebraska Public High School Graduates
by Student Income Status: 2007-2008 through 2015-2016
Note. See Table A5.4 and Table A5.5 in Appendix 5 for supporting data. Data sources: National Student Clearinghouse (college continuation data), May 2017; and Nebraska Department of Education (numbers of high school graduates) October 2017. College Continuation Rates for Public High School Graduates by Gender • Female and male students each accounted for about half of the graduates of Nebraska’s
public high schools from 2007-2008 through 2015-2016. • As shown in Figure 1.1.c.7, the college continuation rate for female students in each of
these graduating classes was considerably higher than the college continuation rate for their male classmates.
• While the college-going rate for females increased from 71.9% in 2007-2008 to 75.5% in
2015-2016, the college-going rate for males increased from 66.1% in 2007-2008 to 66.5% in 2015-2016.
• The difference between the college-going rates of male and female graduates increased
from 5.8 percentage points in 2007-2008 to 9.0 percentage points in 2015-2016.
74.1% 75.5% 77.7% 77.3% 77.2% 77.7% 78.3% 78.4% 77.8%
69.0% 70.1% 71.9% 71.2% 70.8% 70.8% 71.5% 71.0% 71.0%
52.0% 53.8% 56.3% 56.8% 57.2% 56.6% 58.1% 56.5% 57.5%
0%
25%
50%
75%
100%
07-08 08-09 09-10 10-11 11-12 12-13 13-14 14-15 15-16
Col
lege
Con
tinua
tion
Rat
e
Non-Low-Income Graduates All Graduates Low-Income Graduates

Nebraska’s Coordinating Commission for Postsecondary Education – 2018 Progress Report 59
Figure 1.1.c.7 College Continuation Rates for Nebraska Public High School Graduates
by Gender: 2007-2008 through 2015-2016
Note. See Table A5.4 and Table A5.5 in Appendix 5 for supporting data. Data sources: National Student Clearinghouse (college continuation data), May 2017; and Nebraska Department of Education (numbers of high school graduates) October 2017. College Continuation Rates for Public High School Graduates by Gender and Income Status • As shown in Figure 1.1.c.8, the college continuation rate for female graduates was higher
than the rate for male graduates among both the low-income and non-low-income students who graduated between 2007-2008 and 2015-2016.
• Among low-income graduates in 2007-2008, 55.0% of females continued on to college,
compared to 48.7% of males. Among low-income graduates in 2015-2016, 61.9% of females continued on to college, compared to 52.9% of males.
• Among non-low-income graduates in 2007-2008, 77.3% of females went to college,
compared to 70.9% of males. Among non-low-income graduates in 2015-2016, 82.6% of females continued on to college, compared to 73.2% of males.
• Between 2014-2015 and 2015-2016, college-going rates increased for low-income males
and females but decreased for the non-low-income comparison groups. • Directly comparing the students in the two income categories in Figure 1.1.c.8 clearly shows
the college continuation rates for low-income students have been considerably lower than the comparable rates for graduates from non-low-income households, regardless of gender.
• However, the lowest college continuation rates revealed by this research were for male high
school graduates from low-income households.
71.9% 73.6% 75.2% 74.9% 75.7% 74.9% 76.0% 75.6% 75.5%
66.1% 66.6% 68.5% 67.5% 65.8% 66.6% 67.0% 66.3% 66.5%
0%
25%
50%
75%
100%
07-08 08-09 09-10 10-11 11-12 12-13 13-14 14-15 15-16
Col
lege
Con
tinua
tion
Rat
e
Female Male

Nebraska’s Coordinating Commission for Postsecondary Education – 2018 Progress Report 60
Figure 1.1.c.8 College Continuation Rates for Nebraska Public High School Graduates
by Gender and Student Income Status: 2007-2008 through 2015-2016
Note. See Table A5.4 and Table A5.5 in Appendix 5 for supporting data. Data sources: National Student Clearinghouse (college continuation data), May 2017; and Nebraska Department of Education (numbers of high school graduates) October 2017. College Continuation Rates for Public High School Graduates by Race/Ethnicity, Gender, and Income Status • As shown in Figure 1.1.c.9, segmenting college continuation rates by race/ethnicity, gender,
and student income status results in college continuation rates for 24 subgroups. • Among graduates in 2015-2016, the highest college continuation rate among these 24
subgroups was for non-low-income, Asian/Pacific Islander, female graduates (84.6%). Meanwhile, the lowest college continuation rate among these 24 subgroups was for low-income, Native American, male graduates (30.4%).
• Overall, college continuation rates by race/ethnicity ranged from 45.8% for Native Americans
to 79.3% for Asian/Pacific Islanders. (See Table A5.5 in Appendix 5 for supporting data.) • College continuation rates by gender, student income status, and race/ethnicity for the
graduating classes of 2010-2011 through 2015-2016 can be found in Table A5.5 in Appendix 5.
77.3% 78.8% 81.3% 81.4% 82.4% 82.1% 82.9% 83.5% 82.6%
70.9% 72.3% 74.3% 73.4% 72.1% 73.6% 73.9% 73.4% 73.2%
55.0% 58.5% 59.9% 60.6% 62.3% 61.3% 63.1% 60.9% 61.9%
48.7% 48.6% 52.2% 52.5% 51.7% 51.4% 52.7% 51.9% 52.9%
0%
25%
50%
75%
100%
07-08 08-09 09-10 10-11 11-12 12-13 13-14 14-15 15-16
Col
lege
Con
tinua
tion
Rat
e
Female Non-Low Income Male Non-Low IncomeFemale Low Income Male Low Income
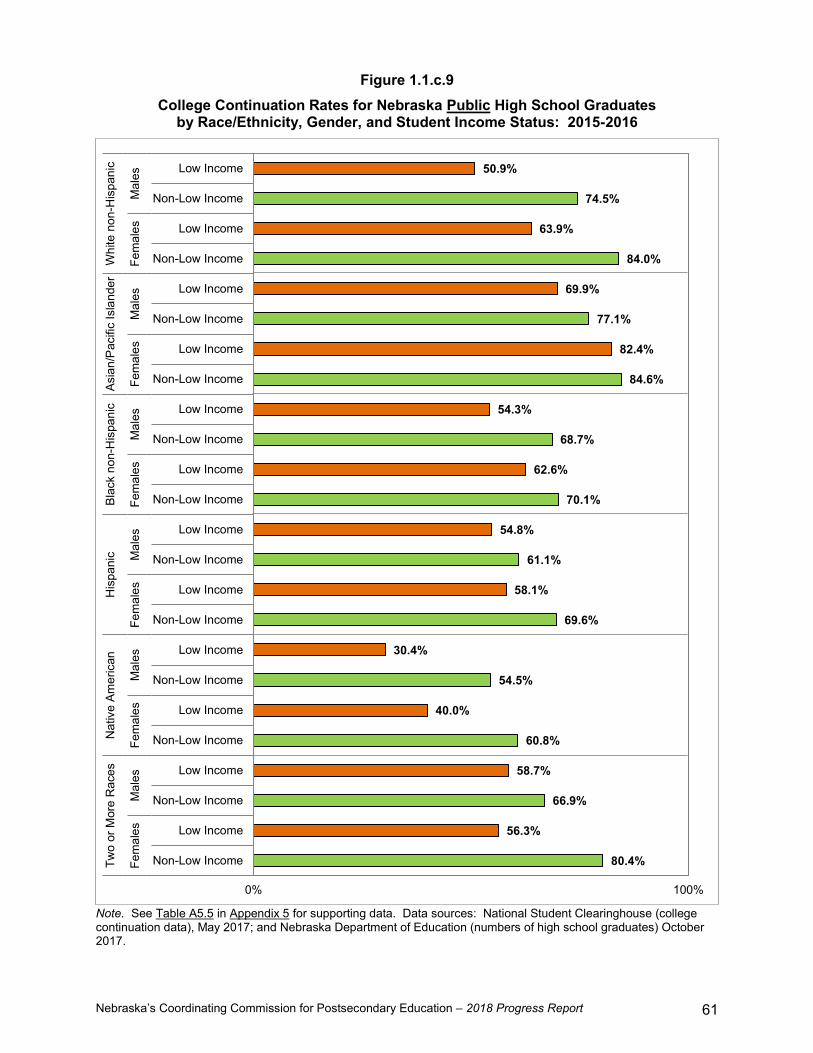
Nebraska’s Coordinating Commission for Postsecondary Education – 2018 Progress Report 61
Figure 1.1.c.9 College Continuation Rates for Nebraska Public High School Graduates
by Race/Ethnicity, Gender, and Student Income Status: 2015-2016
Note. See Table A5.5 in Appendix 5 for supporting data. Data sources: National Student Clearinghouse (college continuation data), May 2017; and Nebraska Department of Education (numbers of high school graduates) October 2017.
50.9%
74.5%
63.9%
84.0%
69.9%
77.1%
82.4%
84.6%
54.3%
68.7%
62.6%
70.1%
54.8%
61.1%
58.1%
69.6%
30.4%
54.5%
40.0%
60.8%
58.7%
66.9%
56.3%
80.4%
0% 100%
Low Income
Non-Low Income
Low Income
Non-Low Income
Low Income
Non-Low Income
Low Income
Non-Low Income
Low Income
Non-Low Income
Low Income
Non-Low Income
Low Income
Non-Low Income
Low Income
Non-Low Income
Low Income
Non-Low Income
Low Income
Non-Low Income
Low Income
Non-Low Income
Low Income
Non-Low Income
Mal
esFe
mal
esM
ales
Fem
ales
Mal
esFe
mal
esM
ales
Fem
ales
Mal
esFe
mal
esM
ales
Fem
ales
Whi
te n
on-H
ispa
nic
Asia
n/Pa
cific
Isla
nder
Blac
k no
n-H
ispa
nic
His
pani
cN
ativ
e Am
eric
anTw
o or
Mor
e R
aces

Nebraska’s Coordinating Commission for Postsecondary Education – 2018 Progress Report 62
This page left blank intentionally.

Nebraska’s Coordinating Commission for Postsecondary Education – 2018 Progress Report 63
1.2 Nebraska High School Graduates Who Go to College in Nebraska Increase the proportion of Nebraska high school graduates who pursue their postsecondary education in Nebraska. In addition to increasing college-going rates of Nebraska high school graduates, another approach to increasing college enrollment in Nebraska that was recommended by the 2003 LR 174 Higher Education Task Force is to increase the proportion of Nebraska high school graduates who pursue their postsecondary education in their home state, rather than going out of state to college. The data required to monitor the proportion of recent Nebraska high school graduates who go to colleges and universities in Nebraska or other states are collected every two years through the Integrated Postsecondary Education Data System’s (IPEDS) Fall Enrollment survey maintained by the National Center of Education Statistics in the U.S. Department of Education. The latest available data are for fall 2016. The best available estimate of the proportion of Nebraska high school graduates who pursue their postsecondary education in Nebraska is the number of students with Nebraska residency who enroll at Nebraska postsecondary institutions as first-time freshmen within a year of graduating from high school, compared directly to the number who go out of state to college. Consequently, this section provides a detailed analysis of the numbers and percentages of Nebraska high school graduates who attended Nebraska and out-of-state postsecondary institutions as first-time freshmen within 12 months of graduating from high school between fall 2006 and fall 2016.12
Nebraska-resident, first-time freshmen who start college at Nebraska or out-of-state postsecondary institutions more than 12 months after they graduated from high school are also of interest. However, since there is no way of knowing exactly when they received their diplomas from Nebraska or out-of-state high schools, these students are considered separately in the analysis reported in this section.
12 For the purposes of IPEDS reporting, first-time freshmen are defined to be degree/certificate-seeking students. Students taking courses for credit but not seeking degrees are not included in first-time freshmen cohorts.

Nebraska’s Coordinating Commission for Postsecondary Education – 2018 Progress Report 64
Changes in the Number of Nebraska-Resident, First-Time Freshmen Enrolled at Postsecondary Institutions by Length of Time Since High School Graduation • Between fall 2006 and fall 2016, 482 more Nebraska-resident, first-time freshmen attended
postsecondary institutions within one year of high school graduation. During the same period, 1,596 fewer Nebraska-resident first-time freshmen enrolled in college more than a year after they graduated from high school, as shown in Table 1.2.1. As a result, the net total enrollment of Nebraska-resident, first-time freshmen at postsecondary institutions decreased 6.1% (1,114 students) since fall 2006.
Table 1.2.1
Nebraska-Resident, First-Time Freshmen Enrolled at Nebraska and Out-of-State Postsecondary Institutions
Classified by Length of Time Since High School Graduation Fall 2006 through Fall 2016
Length of Time Since High School Graduation
Fall 2006 Fall 2008 Fall 2010 Fall 2012
N % N % N % N % Graduated During the 12 Months Prior to College Enrollment
14,352 78.7% 14,737 80.8% 15,100 79.1% 14,920 83.2%
Graduated More than 12 Months Prior to College Enrollment
3,882 21.3% 3,510 19.2% 3,980 20.9% 3,005 16.8%
Total 18,234 100.0% 18,247 100.0% 19,080 100.0% 17,925 100.0% Length of Time Since
High School Graduation
Fall 2014 Fall 2016
∆ Since Fall 2006
N % N % N % Graduated During the 12 Months Prior to College Enrollment
14,283 81.6% 14,834 86.6% 482 3.4%
Graduated More than 12 Months Prior to College Enrollment
3,212 18.4% 2,286 13.4% -1,596 -41.1%
Total 17,495 100.0% 17,120 100.0% -1,114 -6.1% Note. Includes full-time and part-time students. ∆ = change. See Table A6.1 and Table A6.3 in Appendix 6 for supporting data. Data sources: National Center for Education Statistics, IPEDS fall 2006, 2008, 2010, 2012, 2014, and 2016 surveys.

Nebraska’s Coordinating Commission for Postsecondary Education – 2018 Progress Report 65
In-State and Out-of-State Enrollments of Nebraska-Resident, First-Time Freshmen Who Graduated from High School Within 12 Months of College Enrollment • The net increase between fall 2006 and fall 2016 of 482 students who continued on to
college within 12 months of high school graduation, shown in Table 1.2.1, is attributable to an increase of 108 Nebraska-resident, first-time freshmen who enrolled at out-of-state institutions within 12 months of high school graduation and an increase of 374 students who pursued their postsecondary education at institutions in Nebraska.
• Overall, the percent of Nebraska-resident, first-time freshmen who choose to begin college
in Nebraska has remained relatively stable since fall 2006. As illustrated in Figure 1.2.1, 81.6% of Nebraska-resident, first-time freshmen started college in Nebraska in fall 2016, compared to 81.8% in fall 2006.
Figure 1.2.1
Number of Nebraska-Resident, First-Time Freshmen Enrolled at Nebraska and Out-of-State Postsecondary Institutions
Within 12 Months of Graduation from High School Fall 2006 through Fall 2016
Note. Includes full-time and part-time students. FTF = first-time freshmen. See Table A6.1 in Appendix 6 for supporting data. Data source: National Center for Education Statistics, IPEDS fall 2006, 2008, 2010, 2012, 2014, and 2016 surveys.
11,736 12,09612,651
12,11711,593
12,110
2,616 2,641 2,449 2,8032,690
2,724
81.8% 82.1% 83.8% 81.2% 81.2% 81.6%0
16,000
Fall 2006 Fall 2008 Fall 2010 Fall 2012 Fall 2014 Fall 2016
Num
ber o
f Neb
rask
a-R
esid
ent F
TF
Who
Gra
duat
ed fr
om H
SW
ithin
12
Mon
ths
of E
nrol
lmen
t
Nebraska Colleges Out-of-State Colleges
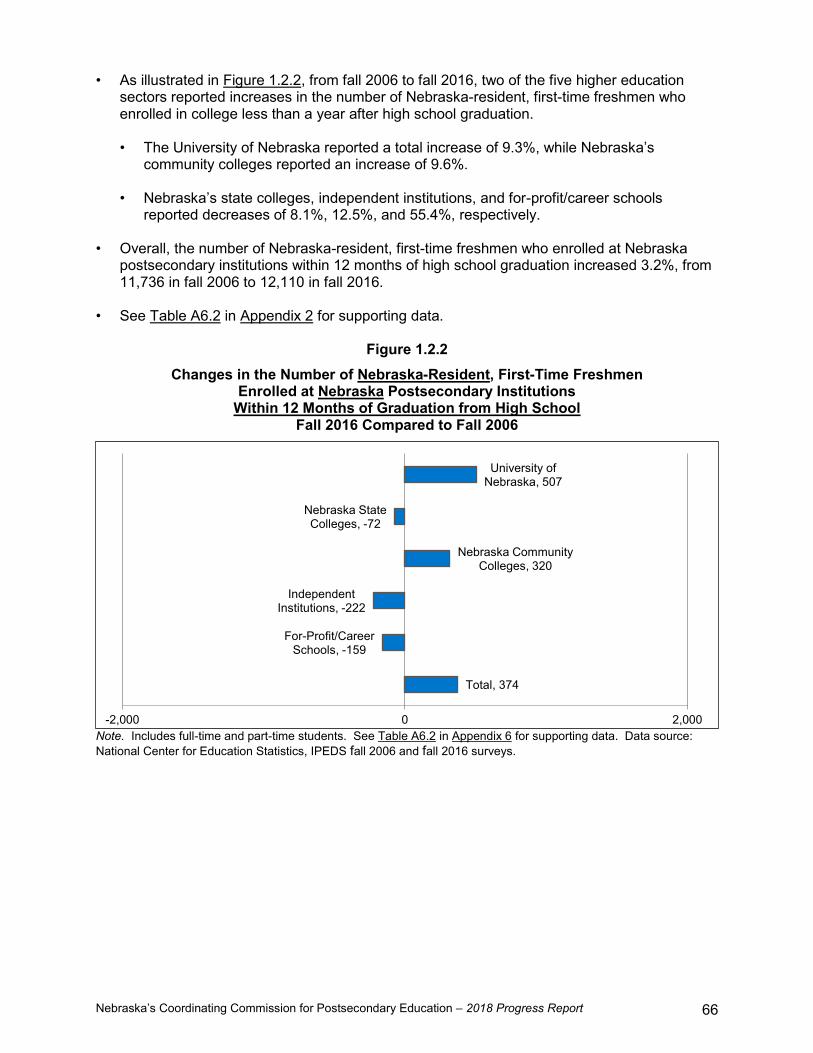
Nebraska’s Coordinating Commission for Postsecondary Education – 2018 Progress Report 66
• As illustrated in Figure 1.2.2, from fall 2006 to fall 2016, two of the five higher education sectors reported increases in the number of Nebraska-resident, first-time freshmen who enrolled in college less than a year after high school graduation.
• The University of Nebraska reported a total increase of 9.3%, while Nebraska’s
community colleges reported an increase of 9.6%. • Nebraska’s state colleges, independent institutions, and for-profit/career schools
reported decreases of 8.1%, 12.5%, and 55.4%, respectively. • Overall, the number of Nebraska-resident, first-time freshmen who enrolled at Nebraska
postsecondary institutions within 12 months of high school graduation increased 3.2%, from 11,736 in fall 2006 to 12,110 in fall 2016.
• See Table A6.2 in Appendix 2 for supporting data.
Figure 1.2.2 Changes in the Number of Nebraska-Resident, First-Time Freshmen
Enrolled at Nebraska Postsecondary Institutions Within 12 Months of Graduation from High School
Fall 2016 Compared to Fall 2006
Note. Includes full-time and part-time students. See Table A6.2 in Appendix 6 for supporting data. Data source: National Center for Education Statistics, IPEDS fall 2006 and fall 2016 surveys.
Total, 374
For-Profit/Career Schools, -159
Independent Institutions, -222
Nebraska Community Colleges, 320
Nebraska State Colleges, -72
University of Nebraska, 507
-2,000 0 2,000

Nebraska’s Coordinating Commission for Postsecondary Education – 2018 Progress Report 67
In-State and Out-of-State Enrollments of Nebraska-Resident, First-Time Freshmen Who Graduated from High School More than 12 Months Prior to College Enrollment • Between fall 2006 and fall 2016, there was a decrease in the number of first-time freshmen
with Nebraska residency who started their postsecondary studies at postsecondary institutions in Nebraska more than a year after they graduated from high school.
• As illustrated in Figure 1.2.3, 1,421 fewer first-time freshmen attended Nebraska colleges in
fall 2016 than in fall 2006, a decrease of 42.8%. • Likewise, between 2006 and 2016, 175 fewer first-time freshmen from Nebraska went to
out-of-state colleges more than a year after graduating from high school, a 31.2% decrease. • As shown in Figure 1.2.3, the net effect of these changes in enrollment was that a lower
percentage of the students who graduated from high school more than a year before college enrollment attended Nebraska postsecondary institutions in fall 2016 than in fall 2006, while a higher percentage chose to go out of state. Specifically, 83.1% attended Nebraska colleges in 2016, compared to 85.5% in 2006.
• Total enrollment of first-time freshmen at out-of-state and in-state schools decreased 41.1%
(1,596 students) from 3,882 in fall 2006 to 2,286 in fall 2016. Much of this decline was seen between fall 2014 and fall 2016 when enrollment decreased 28.8% (926 students). (See Table A6.3 in Appendix 6 for supporting data.)
Figure 1.2.3
Number of Nebraska-Resident, First-Time Freshmen Enrolled at Nebraska and Out-of-State Postsecondary Institutions
More than 12 Months After Graduation from High School Fall 2006 through Fall 2016
Note. Includes full-time and part-time students. FTF = first-time freshmen. HS = high school. See Table A6.3 in Appendix 6 for supporting data. Data source: National Center for Education Statistics, IPEDS fall 2006, 2008, 2010, 2012, 2014, and 2016 surveys.
3,321
2,861
3,330
2,4832,742
1,900
561649
650
522470
386
85.5% 81.5% 83.7% 82.6% 85.4% 83.1%0
5,000
Fall 2006 Fall 2008 Fall 2010 Fall 2012 Fall 2014 Fall 2016
Num
ber o
f Neb
rask
a-R
esid
ent F
TF
Who
Gra
duat
ed fr
om H
SM
ore
than
12
Mon
ths
Prio
r to
Enro
llmen
t
Nebraska Colleges Out-of-State Colleges

Nebraska’s Coordinating Commission for Postsecondary Education – 2018 Progress Report 68
• As illustrated in Figure 1.2.4, from fall 2006 to fall 2016, all of the sectors of higher education in Nebraska reported decreases in the number of Nebraska-resident, first-time freshmen who enrolled in college more than a year after high school graduation.
• The University of Nebraska, Nebraska’s state colleges, and the independent institutions
reported decreases of 6.9%, 18.2%, and 76.7%, respectively. • In terms of the number of students enrolled, Nebraska’s community colleges and for-
profit/career schools experienced the largest declines between fall 2006 and fall 2016. The community colleges enrolled 635 fewer first-time freshmen, a decrease of 30.6%, while the for-profit/career schools enrolled 584 fewer first-time freshmen, a decrease of 79.1%
• Overall, the number of Nebraska-resident, first-time freshmen who enrolled at Nebraska
postsecondary institutions more than a year after high school graduation decreased 42.8%, from 3,321 in fall 2006 to 1,900 in fall 2016. This decrease of 1,421 students is mostly attributable to reduced enrollments at Nebraska’s community colleges and for-profit/career schools.
• See Table A6.4 in Appendix 6 for supporting data and a summary of enrollment changes by
sector.
Figure 1.2.4 Changes in the Numbers of Nebraska-Resident, First-Time Freshmen
Enrolled at Nebraska Postsecondary Institutions More than 12 Months After Graduation from High School
Fall 2016 Compared to Fall 2006
Note. Includes full-time and part-time students. See Table A6.4 in Appendix 6 for supporting data. Data source: National Center for Education Statistics, IPEDS fall 2006 and fall 2016 surveys.
Total, -1,421
For-Profit/Career Schools, -584
Independent Institutions, -178
Nebraska Community Colleges, -635
Nebraska State Colleges, -8
University of Nebraska, -16
-2,000 0 2,000

Nebraska’s Coordinating Commission for Postsecondary Education – 2018 Progress Report 69
1.3 Non-Nebraska, First-Time Freshmen Who Enroll at Nebraska Colleges and Net Migration Increase the number of non-Nebraska high school graduates who pursue postsecondary education in Nebraska. The 2003 LR 174 Higher Education Task Force recommended that Nebraska’s colleges and universities should more actively recruit high school graduates from outside the state to increase college enrollments in Nebraska. The data required to monitor the total number of out-of-state and nonresident alien students who enroll as first-time freshmen at Nebraska’s postsecondary institutions are collected every two years through the Integrated Postsecondary Education Data System (IPEDS) maintained by the National Center for Education Statistics. In this section, the latest available data, which are for fall 2016, are compared to the data for fall 2006, fall 2008, fall 2010, fall 2012, and fall 2014. Emphasis is primarily on the comparison of the findings for fall 2016 to those for fall 2006. Non-Nebraska, First-Time Freshmen Who Attend Nebraska Colleges and Universities • As shown in Figure 1.3.1, Nebraska’s postsecondary institutions attracted 1,182, or 36.4%,
more non-Nebraska, first-time freshmen in fall 2016 than in fall 2006.
Figure 1.3.1 Total Number of Non-Nebraska, First-Time Freshmen
Enrolled at Nebraska Postsecondary Institutions Fall 2006 through Fall 2016
Note. Includes full-time and part-time students as well as nonresident alien students. Does not include students with reported unknown states of residence and students for whom no residence information was reported. Data source: National Center for Education Statistics, IPEDS fall 2006, 2008, 2010, 2012, 2014, and 2016 surveys.
3,246 3,388 3,457 3,6094,055
4,428
0
5,000
Fall 2006 Fall 2008 Fall 2010 Fall 2012 Fall 2014 Fall 2016
Tota
l Num
ber o
f Non
-Neb
rask
aFi
rst-T
ime
Fres
hmen

Nebraska’s Coordinating Commission for Postsecondary Education – 2018 Progress Report 70
• The University of Nebraska-Lincoln enrolled 1,391 (31.4%) of the non-Nebraska, first-time freshmen in fall 2016, up from 767 (23.6%) in fall 2006. Creighton University enrolled 853 (19.3%) of the non-Nebraska, first-time freshmen in fall 2016, up from 610 (18.8%) in fall 2006. Together, these two institutions accounted for 867, or 73.4%, of the additional 1,182 non-Nebraska, first-time freshmen enrolled at Nebraska’s postsecondary institutions. (See Table A6.8 in Appendix 6 for supporting data on total non-Nebraska, first-time freshmen by institution.)
• Between fall 2006 and fall 2016, postsecondary institutions in Nebraska attracted a noticeably higher number of non-Nebraskans who went to college within a year of high school graduation. The state attracted about the same number of out-of-state and nonresident alien students who started college more than a year after they graduated from high school. Both of these trends are evidenced in Table 1.3.1.
• As shown in Table 1.3.1, the net enrollment of out-of-state and nonresident alien students at
Nebraska postsecondary institutions increased by 1,182 students, or 36.4%, between fall 2006 and fall 2016.
Table 1.3.1
Non-Nebraska, First-Time Freshmen Enrolled at Nebraska Postsecondary Institutions
Classified by Length of Time Since High School Graduation Fall 2006 through Fall 2016
Length of Time Since High School Graduation
Fall 2006 Fall 2008 Fall 2010 Fall 2012
N % N % N % N % Graduated During the 12 Months Prior to College Enrollment
2,794 86.1% 2,973 87.8% 2,948 85.3% 2,981 82.6%
Graduated More than 12 Months Prior to College Enrollment
452 13.9% 415 12.2% 509 14.7% 628 17.4%
Total 3,246 100.0% 3,388 100.0% 3,457 100.0% 3,609 100.0%
Length of Time Since High School Graduation
Fall 2014 Fall 2016
∆ Since Fall 2006
N % N % N % Graduated During the 12 Months Prior to College Enrollment
3,488 86.0% 3,956 89.3% 1,162 41.6%
Graduated More than 12 Months Prior to College Enrollment
567 14.0% 472 10.7% 20 4.4%
Total 4,055 100.0% 4,428 100.0% 1,182 36.4% Note. Includes full-time and part-time students as well as nonresident alien students. Does not include students with reported unknown states of residence and students for whom no residence information was reported. ∆ = change. See Table A6.5 and Table A6.6 in Appendix 6 for supporting data. Data source: National Center for Education Statistics, IPEDS fall 2006, 2008, 2010, 2012, 2014, and 2016 surveys.

Nebraska’s Coordinating Commission for Postsecondary Education – 2018 Progress Report 71
• As shown in Figure 1.3.2, 52.9% of the net increase of 1,162 students who started college within 12 months of high school graduation is attributable to the increased number of non-Nebraskans who attended the University of Nebraska.
• The Nebraska State College System, Nebraska’s community colleges, and Nebraska’s
independent institutions also experienced gains in the number of non-Nebraskans that they attracted, but the for-profit/career schools attracted eight fewer out-of-state students in fall 2016 than in fall 2006. (See Table A6.5 in Appendix 6 for supporting data.)
• See Table A6.6 in Appendix 6 for information on the enrollment of non-Nebraskan first-time
freshmen who enrolled at Nebraska colleges more than a year after high school graduation. • Table A6.7 in Appendix 6 provide detailed listings by institution of the numbers of first-time
freshmen with Nebraska, out-of-state, and foreign (i.e., nonresident alien) residencies who were enrolled at Nebraska’s colleges and universities within 12 months of high school graduation from fall 2006 through fall 2016.
Figure 1.3.2
Changes in the Numbers of Non-Nebraska, First-Time Freshmen Enrolled at Nebraska Postsecondary Institutions
Within 12 Months of Graduation from High School Fall 2016 Compared to Fall 2006
Note. Includes full-time and part-time students as well as nonresident alien students. Does not include students with reported unknown states of residence and students for whom no residence information was reported. See Table A6.5 in Appendix 6 for supporting data. Data source: National Center for Education Statistics, IPEDS fall 2006 and fall 2016 surveys.
Total, 1,162
For-Profit/Career Schools, -8
Independent Institutions, 302
Nebraska Community Colleges, 135
Nebraska State Colleges, 118
University of Nebraska, 615
-2,000 0 2,000

Nebraska’s Coordinating Commission for Postsecondary Education – 2018 Progress Report 72
Net Migration of Nebraska and Non-Nebraska, First-Time Freshmen Data summarized in the preceding sections can be used to calculate the net migration of first-time freshmen who attended postsecondary institutions within one year of high school graduation. • As shown in Table 1.3.2, in fall 2006, fall 2008, fall 2010, fall 2012, fall 2014, and fall 2016,
more first-time freshmen came to Nebraska to attend college within 12 months of high school graduation than left Nebraska to go to school out of state.
• Interestingly, between fall 2014 and fall 2016, in-migration of non-Nebraska students
increased 13.4% (468 students) while out-migration of Nebraska students increased only 1.3% (34 students)
Table 1.3.2 Net Migration of First-Time Freshmen Who Attended
Postsecondary Institutions Within 12 Months of High School Graduation Fall 2006 through Fall 2016
Student Residency and Where They Attended College
Fall 2006
Fall 2008
Fall 2010
Fall 2012
Fall 2014
Fall 2016
∆ Since Fall 2006
N % In-Migration
Non-Nebraska Students Enrolled at Nebraska Colleges and Universities
2,794 2,973 2,948 2,981 3,488 3,956 1,162 41.6%
Out-Migration
Resident Nebraska Students Enrolled at Out-of-State Colleges and Universities
2,616 2,641 2,449 2,803 2,690 2,724 108 4.1%
Net Migration 178 332 499 178 798 1,232 Note. Includes full-time and part-time students as well as nonresident alien students. Does not include students with reported unknown states of residence and students for whom no residence information was reported. ∆ = change. Data source: National Center for Education Statistics, IPEDS fall 2006, 2008, 2010, 2012, 2014, and 2016 surveys.

Nebraska’s Coordinating Commission for Postsecondary Education – 2018 Progress Report 73
1.4 Enrollment of First-Time Freshmen by Race/Ethnicity Increase the number and proportion of Nebraska postsecondary students who have been underrepresented in the state’s higher education system. Increasing the number and percentage of students who have been underrepresented in Nebraska’s higher education system is another recommended approach to increasing the state’s postsecondary enrollment. To determine the extent to which this strategic objective is being achieved, the following analysis focuses on (1) the changes that have occurred since 2006 in the numbers of white non-Hispanics and minority students who have been enrolled as first-time freshmen at Nebraska colleges and (2) the extent to which each racial/ethnic group was represented in the state’s postsecondary education system in fall 2016, the latest period for which data are available. (Estimated enrollments for fall 2017 are not available by race/ethnicity; therefore, enrollments by race/ethnicity for fall 2017 will be reported in the 2019 Progress Report.) Changes in the Numbers of First-Time Freshmen Enrolled at Nebraska Institutions • As shown in Figure 1.4.1, 17,404 first-time freshmen of known race/ethnicity were enrolled
at Nebraska’s postsecondary institutions in fall 2016, a 1.0% increase from the 17,236 first-time freshmen of known race/ethnicity enrolled in fall 2006.
• Between fall 2015 and fall 2016, total enrollment of first-time freshmen of known
race/ethnicity increased 1.2%. • In fall 2006, white non-Hispanics accounted for 86.6% of the first-time freshmen, while
minorities accounted for 13.4%. Of the first-time freshmen enrolled in fall 2016, 75.1% were white non-Hispanics, while 24.9% were minorities.13
• As shown in Figure 1.4.2, higher numbers of Asians/Pacific Islanders, Hispanics, and black
non-Hispanics were enrolled in college in fall 2016 than in fall 2006. However, the number of Native-American first-time freshmen decreased from 216 in fall 2006 to 151 in fall 2016.
• The net effect of these changes is that there were 2,031 more minority students attending
Nebraska colleges as first-time freshmen in fall 2016 than in fall 2006, an increase of 88.2%. In comparison, there were 1,863 fewer white non-Hispanic first-time freshmen in fall 2016 than in fall 2006, a decrease of 12.5%.
13 Minority students are defined as students from the following race/ethnicity categories: Asian/Pacific Islander, black non-Hispanic, Hispanic, Native American, and two or more races. Figures do not include nonresident aliens or students of unknown race/ethnicity.

Nebraska’s Coordinating Commission for Postsecondary Education – 2018 Progress Report 74
Figure 1.4.1
Numbers of White Non-Hispanic and Minority First-Time Freshmen at Nebraska Postsecondary Institutions
Fall 2006 through Fall 2016
Note. Counts include full-time and part-time students. Counts do not include nonresident aliens or students of unknown race/ethnicity. See Table A7.1 in Appendix 7 for supporting data. Data source: National Center for Education Statistics, IPEDS fall 2006 through fall 2016 surveys.
Figure 1.4.2
Numbers of Minority Students Enrolled as First-Time Freshmen at Nebraska Postsecondary Institutions
Fall 2006 through Fall 2016
Note. Includes full-time and part-time students. The race/ethnicity category ‘two or more races’ was an optional reporting category for enrollments reported for fall 2008 and fall 2009. Adoption of the category was mandatory beginning with data reported for fall 2010. See Table A7.1 in Appendix 7 for supporting data. Data source: National Center for Education Statistics, IPEDS fall 2006 through fall 2016 surveys.
17,236 17,201 17,404
14,93212,971 13,069
2,3044,230 4,335
0
5,000
10,000
15,000
20,000
2006 2007 2008 2009 2010 2011 2012 2013 2014 2015 2016
Firs
t-Tim
e Fr
eshm
en
Total First-Time Freshmen White non-Hispanic Total Minority
423 518 513
840
1,9862,098
216 151 151
825
859 910
39
716663
0
500
1,000
1,500
2,000
2,500
2006 2007 2008 2009 2010 2011 2012 2013 2014 2015 2016
Firs
t-Tim
e Fr
eshm
en
Asian/Pacific Islander Hispanic Native AmericanBlack non-Hispanic Two or More Races

Nebraska’s Coordinating Commission for Postsecondary Education – 2018 Progress Report 75
Racial/Ethnic Representation in Nebraska’s Postsecondary Education System Fall 2016 The following analysis examines the extent to which students in each racial/ethnic group have been represented in Nebraska’s postsecondary education system. In this analysis, students in a race/ethnic category are considered to be underrepresented if they accounted for a smaller percentage of the first-time college freshmen at Nebraska institutions than they did of the students who graduated from Nebraska high schools the preceding year. Conversely, students are considered to be overrepresented if they accounted for a larger percentage of first-time college freshmen than they did of the students who graduated from high school the year before. This should be interpreted as an approximate measure as it does not account for in-state and out-of-state enrollments. • As evidenced in Section 1.1.a of this report, disproportionately lower percentages of
Asians/Pacific Islanders, Hispanics, Native Americans, black non-Hispanics, and multiracial students graduate from Nebraska high schools compared to white non-Hispanics.
• Furthermore, as evidenced in Section 1.1.c of this report, college continuation rates for
Hispanics, Native Americans, black non-Hispanics, and multiracial graduates are lower than college continuation rates for white non-Hispanic and Asian/Pacific Islander graduates.
• As illustrated in Figure 1.4.3, white non-Hispanics, Asians/Pacific Islanders, and multiracial
individuals were overrepresented among first-time freshmen in fall 2016, while Hispanics, Native Americans, and black non-Hispanics were underrepresented among first-time freshmen in fall 2016.
Figure 1.4.3
Percentages of 2015-2016 Nebraska High School Graduates and First-Time Freshmen Enrolled at Nebraska Postsecondary Institutions in
Fall 2016 by Race/Ethnicity
Note. High school graduates include graduates of nonpublic schools, public schools, educational service units, and state-operated schools. Graduates do not include GED recipients or completers who did not receive regular diplomas. First-time freshmen include full-time and part-time students. Counts do not include nonresident aliens or students of unknown race/ethnicity. See Table A7.2 in Appendix 7 for supporting data. Data sources: Nebraska Department of Education, January 2017, and the National Center for Education Statistics, IPEDS fall 2016 survey.
73.9%
2.7%13.9%
1.0%5.9% 2.6%
75.1%
2.9%12.1%
0.9% 5.2% 3.8%0%
25%
50%
75%
100%
White non-Hispanic
Asian/PacificIslander
Hispanic Native American Black non-Hispanic
Two or MoreRaces
% of 2015-2016 High School Graduates % of Fall 2016 First-Time Freshmen

Nebraska’s Coordinating Commission for Postsecondary Education – 2018 Progress Report 76
Comparison of the Representation of Racial/Ethnic Groups in Fall 2006 and Fall 2016 Determining if there was any change between fall 2006 and fall 2016 in the pattern of racial/ethnic representation in Nebraska’s postsecondary education system is complicated by the fact that fewer white non-Hispanics and more minority students graduated from Nebraska high schools in 2015-2016 than in 2005-2006. However, as shown in Table A7.2 in Appendix 7, comparing the percentage distributions of high school graduates in 2005-2006 and 2015-2016 to the percentage distributions of first-time freshmen in fall 2006 and fall 2016 reveals that compared to the first-time freshmen who started college in 2006:
1. White non-Hispanics were underrepresented in fall 2006 but overrepresented in fall 2016.
2. Asians/Pacific Islanders were overrepresented among first-time freshmen in fall 2006 and fall 2016.
3. Hispanics were underrepresented among first-time freshmen in fall 2006 and fall 2016. 4. Native Americans were overrepresented in fall 2006 but were appropriately represented
in fall 2016. 5. Black non-Hispanics were overrepresented in fall 2006 but underrepresented in fall
2016. 6. Students of two or more races were appropriately represented in fall 2011 but were
overrepresented in fall 2016.14 As stated on the previous page, these measures are approximations of representation, as they do not account for the flow of first-time freshmen between states. Types of Institutions Most Frequently Attended by Each Racial/Ethnic Group Another approach to analyzing the representation of white non-Hispanics and minorities is to examine the percentage of students in each racial/ethnic group who attend each of the institutional sectors within Nebraska’s postsecondary education system. For the purposes of statewide analysis, two Native American tribal colleges—Little Priest Tribal College and Nebraska Indian Community College—are included among the independent colleges and universities since they are not state or locally supported. However, in the following analysis, the tribal colleges are considered separately from other independent institutions so that student enrollment patterns of Native Americans can be interpreted more clearly. • As shown in Figure 1.4.4 and Table A7.3 in Appendix 7, 56 (37.1%) of the 151 Native
Americans who were first-time freshmen in fall 2016 attended Little Priest Tribal College or Nebraska Indian Community College, while 6 (4.0%) chose to enroll at other independent colleges and universities.
14 The racial/ethnicity category ‘two or more races’ was an optional reporting category for enrollments reported for fall 2008 and fall 2009. Adoption of the category was mandatory beginning with data reported for fall 2010. In addition, the ‘two or more races’ category was first utilized by the Nebraska Department of Education with the 2010-2011 high school graduating class. Therefore, comparisons of the representation of multiracial students are limited to the fall 2011 through fall 2016 cohorts.

Nebraska’s Coordinating Commission for Postsecondary Education – 2018 Progress Report 77
Figure 1.4.4 Nebraska Enrollment of Native American,
First-Time Freshmen at Nebraska Postsecondary Institutions Fall 2016
Note. Includes full-time and part-time students. See Table A7.3 in Appendix 7 for supporting data. Data source: National Center for Education Statistics, IPEDS fall 2016 survey.
• Figure 1.4.5 shows the percentages of the first-time freshmen in each of the six major racial/ethnic groups who attended, by sector, institutions within Nebraska’s postsecondary education system in fall 2016, excluding the two native tribal colleges in the analysis of Native American enrollments.
• As evidenced in Figure 1.4.5, white non-Hispanics, Asian/Pacific Islanders, and multiracial
students most frequently enrolled as first-time freshmen at the University of Nebraska. • Hispanic and black non-Hispanic first-time freshmen were most likely to enroll at the state’s
community college or the University of Nebraska. • If the tribal colleges are excluded from the independent sector, as shown in Figure 1.4.5, the
first-time freshmen enrollment pattern for Native Americans in fall 2016 is dominated by the high percentage of these students who enroll at the state’s community colleges.
13.9%
5.3%
39.1%
4.0%0.7%
37.1%
0%
10%
20%
30%
40%
50%
60%
70%
Native American
Perc
enta
ge o
f Firs
t-Tim
e Fr
eshm
en
University of Nebraska
Nebraska State College System
Nebraska Community Colleges
Independent Colleges andUniversities
For-Profit/ Career Schools
Tribal Schools

Nebraska’s Coordinating Commission for Postsecondary Education – 2018 Progress Report 78
Figure 1.4.5 Nebraska First-Time Freshmen Sector Enrollments by Race/Ethnicity
Fall 2016
Note. Counts include full-time and part-time students. Counts do not include nonresident aliens or students of unknown race/ethnicity. The two native tribal colleges, Little Priest Tribal College and Nebraska Indian Community College, are excluded from the analysis of Native American enrollments in this figure. See Table A7.3 in Appendix 7 for fall 2006 through fall 2016 data. Data source: National Center for Education Statistics, IPEDS fall 2016 survey.
44.8% 45.0%
37.9%
7.3%1.9%
5.1%
28.9%22.8%
41.8%
16.9%
29.4%
13.6%
2.1% 0.8% 1.6%0%
10%
20%
30%
40%
50%
60%
70%
White non-Hispanic Asian/Pacific Islander Hispanic
Perc
enta
ge o
f Firs
t-Tim
e Fr
eshm
en
22.1%
32.6%
49.5%
8.4% 9.3% 8.0%
62.1%
43.3%
22.5%
6.3%12.6%
18.6%
1.1% 2.1% 1.5%0%
10%
20%
30%
40%
50%
60%
70%
Native American Black non-Hispanic Two or More Races
Perc
enta
ge o
f Firs
t-Tim
e Fr
eshm
en
University of Nebraska Nebraska State College System
Nebraska Community Colleges Independent Colleges and Universities
For-Profit/ Career Schools
Excluding Tribal Colleges

Nebraska’s Coordinating Commission for Postsecondary Education – 2018 Progress Report 79
Representation of Racial/Ethnic Groups by Sector Since different percentages of white non-Hispanics and minority students enrolled as first-time freshmen at each of the sectors of postsecondary institutions in fall 2016, their representation varied across the five sectors of higher education, as shown in Figure 1.4.6. Native Americans accounted for 86% of the combined first-time freshmen enrollment in fall 2016 of Little Priest Tribal College and Nebraska Indian Community College. Consequently, these two schools are excluded from the sector of independent colleges in the following analysis so sectors can be more clearly compared. See Table A7.4 in Appendix 7 for supporting data.
Figure 1.4.6
Nebraska First-Time Freshmen Racial/Ethnic Enrollments by Sector Excluding Little Priest Tribal College and Nebraska Indian Community College
Fall 2016
Note. Includes full-time and part-time students. Does not include nonresident aliens or students of unknown race/ethnicity. See Table A7.4 and Table A7.5 in Appendix 7 for fall 2006 through fall 2016 data. Data source: National Center for Education Statistics, IPEDS fall 2016 survey
77.8% 78.4%
3.1% 0.8%10.6% 8.7%
0.3% 0.7%3.9% 7.0%4.4% 4.4%
0%
25%
50%
75%
100%
University of Nebraska Nebraska State College System
Perc
enta
ge o
f Firs
t-Tim
e Fr
eshm
en
White non-Hispanic
Asian/Pacific Islander
Hispanic
Native American
Black non-Hispanic
Two or More Races
70.3%75.0%
80.0%
2.2% 5.1% 1.2%
16.3%9.7% 9.9%
1.1% 2.1% 0.3%7.3% 3.9% 5.7%2.8% 4.2% 3.0%
0%
25%
50%
75%
100%
Nebraska Community Colleges Independent Colleges and Universities For-Profit/Career Schools
Perc
enta
ge o
f Firs
t-Tim
e Fr
eshm
en

Nebraska’s Coordinating Commission for Postsecondary Education – 2018 Progress Report 80
This page left blank intentionally.

Nebraska’s Coordinating Commission for Postsecondary Education – 2018 Progress Report 81
1.5 Financial Aid Increase need-based financial aid in order to improve access to higher education for Nebraskans with limited financial means. The 2003 LR 174 Higher Education Task Force recommended increasing need-based financial aid as a means of improving access to higher education for Nebraskans with limited financial resources. Since 2003, Nebraska has increased the amount of state funds allocated for need-based financial aid, thereby making progress toward the goal of improving access to higher education within the state.15 Financial aid is even more important today than it was in 2003 as increasing college costs make it more difficult for many Nebraskans to be educated beyond high school. While there are several sources of need-based financial aid available to students, the amount available has not kept up with increasing costs and the corresponding need for more financial aid. This can be illustrated in several ways. Number of Students Not Served by Nebraska’s Opportunity Grant Program Nebraska allocates state General and lottery funds to a financial aid program called the Nebraska Opportunity Grant (NOG) program. Nebraska Opportunity Grants, also referred to as state grants, are awarded to students who are residents of Nebraska, have not earned a bachelor’s, graduate, or professional degree, have high financial need, and who are attending eligible Nebraska colleges and universities.16 As the following discussion illustrates, Nebraska has significantly increased the amount of funding available for state grants to college students. However, the amount of available funding for financial aid continues to be insufficient to meet the needs of an increasing number of students who are eligible to receive state assistance. As a result, only about a third of the students who are eligible for state-funded financial aid receive state grants. Figure 1.5.1 illustrates how the amount of available funding for state grants has significantly increased since 2006-2007. For the 2006-2007 academic year, the state allocated $9,717,065 for grant aid to students attending public and private institutions in Nebraska. For 2016-2017, the state allocated $16,889,748 to assist students from low-income families attend higher education institutions in Nebraska, an increase of 73.8%. For the 2017-2018 academic year, the amount of available state funding for grant aid increased to $17,448,302, or 3.3% above the amount allocated for 2016-2017. As a result, available state funding for state grants awarded in 2017-2018 is 79.6% higher than the state appropriated for student financial aid in 2006-2007. Between 2006-2007 and 2017-2018, allocation of lottery funds for state grants increased 164.5%, from $4,000,000 in 2006-2007 to $10,580,145 in 2017-2018. Over the same period, appropriations for state grants from the state’s General Fund increased 20.1%, from $5,717,065 to $6,868,157. Meanwhile, federal funding decreased from $578,665 in 2006-2007 to $566,751 in 2010-2011 and was eliminated in 2011-2012.
15 For more information on tuition, fees, and financial aid, see the 2016 Tuition, Fees, and Financial Aid Report, available on the Commission’s website at ccpe.nebraska.gov/reports. 16 For more information on the Nebraska Opportunity Grant, see the Nebraska Opportunity Grant 2016-17 Year-End Report, available on the Commission’s website at ccpe.nebraska.gov/reports.

Nebraska’s Coordinating Commission for Postsecondary Education – 2018 Progress Report 82
Figure 1.5.1 Sources and Amounts of Available Funding for the Nebraska Opportunity Grant Program
2006-2007 through 2017-2018
Total State Funds $9,717,065 $11,467,065 $12,217,065 $13,633,101 $14,380,912 $14,678,211
Total State & Federal $10,295,730 $11,969,780 $12,709,925 $14,145,480 $14,947,663 $14,678,211
Total State Funds $15,185,498 $16,419,718 $16,455,272 $16,833,918 $16,889,748 $17,448,302
Total State & Federal $15,185,498 $16,419,718 $16,455,272 $16,833,918 $16,889,748 $17,448,302 Data source: Nebraska’s Coordinating Commission for Postsecondary Education, 2016 Tuition, Fees, and Financial Aid Report, supplemented with CCPE records, December 2017.
2006-07 2007-08 2008-09 2009-10 2010-11 2011-12Lottery Funds $4,000,000 $4,750,000 $5,500,000 $7,000,000 $7,963,756 $8,261,055State General Funds $5,717,065 $6,717,065 $6,717,065 $6,633,101 $6,417,156 $6,417,156Federal Funds $578,665 $502,715 $492,860 $512,379 $566,751 $0
$0
$2,000,000
$4,000,000
$6,000,000
$8,000,000
$10,000,000
$12,000,000
$14,000,000
$16,000,000
$18,000,000
2012-13 2013-14 2014-15 2015-16 2016-17 2017-18 Est.Lottery Funds $8,767,344 $9,751,562 $9,587,116 $9,965,762 $10,021,592 $10,580,145State General Funds $6,418,154 $6,668,156 $6,868,156 $6,868,156 $6,868,156 $6,868,157Federal Funds $0 $0 $0 $0 $0 $0
$0
$2,000,000
$4,000,000
$6,000,000
$8,000,000
$10,000,000
$12,000,000
$14,000,000
$16,000,000
$18,000,000

Nebraska’s Coordinating Commission for Postsecondary Education – 2018 Progress Report 83
Between 2006-2007 and 2016-2017, as shown in Figure 1.5.2, the number of students who received state grants increased 9.0%, from 11,860 to 12,928, and the average awarded grant increased 49.1%, from $876 to $1,306.17
Figure 1.5.2
Number of Students Who Received Nebraska Opportunity Grants (NOGs) and the Average Grant Awarded
2006-2007 through 2016-2017
Data source: Nebraska’s Coordinating Commission for Postsecondary Education, Nebraska Opportunity Grant Year-End Report, 2007 through 2017. Unfortunately, as shown in Figure 1.5.3, many students who are eligible for state grants do not receive them. In 2016-2017, for example, 12,928 students received state grants. However, based upon expenditure reports submitted to the Commission by each institution, it is estimated that an additional 22,250 students qualified for state grants but did not receive them due to insufficient available funding. Furthermore, the percentage of eligible students who receive state grants has decreased. In 2006-2007, 44.5% of the students who were eligible for state grants received them. In 2016-2017, only 36.8% of the eligible students received state grants. This decrease is due to state funding not keeping pace with the increases in the numbers of eligible students.18
See Table A8.1 and Table A8.2 in Appendix 8 for supporting data and for additional information about the numbers and amounts of Nebraska state grants awarded by sector.
17 The maximum award a student could receive has been 25% or 50% of the tuition and mandatory fees charged by UNL to a full-time, Nebraska-resident undergraduate student, depending on the year. In 2006-2007, the maximum award was at the 50% level, or $2,770. For 2016-2017, the maximum award was at the 50% level, or $4,139. 18 Part of the increase beginning in 2010-2011 in the number of students eligible to receive Nebraska Opportunity Grants is likely due to the expansion of Pell Grant eligibility.
11,86013,158
14,10615,704 15,556
14,23915,757 15,944 15,943
13,73912,928
$876 $944 $894 $897 $961
$1,031 $964 $1,030 $1,032
$1,225 $1,306
$0
$500
$1,000
$1,500
$2,000
0
5,000
10,000
15,000
20,000
06-07 07-08 08-09 09-10 10-11 11-12 12-13 13-14 14-15 15-16 16-17
# of Students Awarded an NSG/NOG Average NSG/NOG Amount
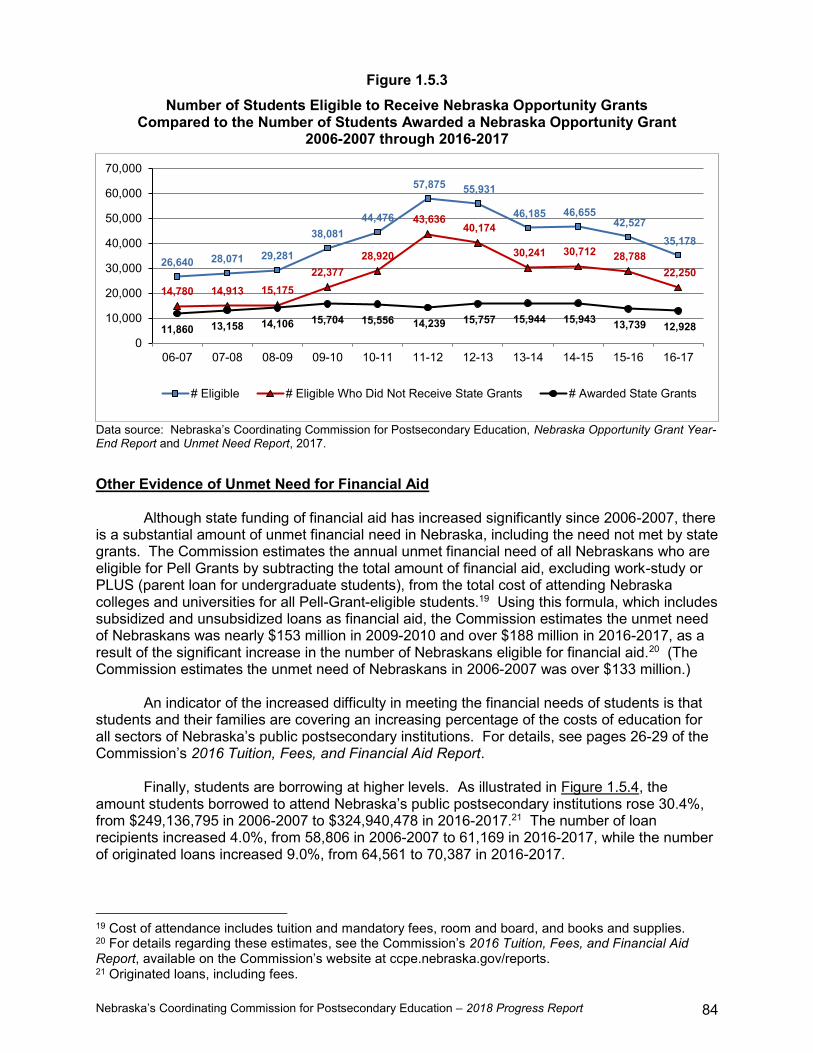
Nebraska’s Coordinating Commission for Postsecondary Education – 2018 Progress Report 84
Figure 1.5.3 Number of Students Eligible to Receive Nebraska Opportunity Grants
Compared to the Number of Students Awarded a Nebraska Opportunity Grant 2006-2007 through 2016-2017
Data source: Nebraska’s Coordinating Commission for Postsecondary Education, Nebraska Opportunity Grant Year-End Report and Unmet Need Report, 2017.
Other Evidence of Unmet Need for Financial Aid Although state funding of financial aid has increased significantly since 2006-2007, there is a substantial amount of unmet financial need in Nebraska, including the need not met by state grants. The Commission estimates the annual unmet financial need of all Nebraskans who are eligible for Pell Grants by subtracting the total amount of financial aid, excluding work-study or PLUS (parent loan for undergraduate students), from the total cost of attending Nebraska colleges and universities for all Pell-Grant-eligible students.19 Using this formula, which includes subsidized and unsubsidized loans as financial aid, the Commission estimates the unmet need of Nebraskans was nearly $153 million in 2009-2010 and over $188 million in 2016-2017, as a result of the significant increase in the number of Nebraskans eligible for financial aid.20 (The Commission estimates the unmet need of Nebraskans in 2006-2007 was over $133 million.) An indicator of the increased difficulty in meeting the financial needs of students is that students and their families are covering an increasing percentage of the costs of education for all sectors of Nebraska’s public postsecondary institutions. For details, see pages 26-29 of the Commission’s 2016 Tuition, Fees, and Financial Aid Report. Finally, students are borrowing at higher levels. As illustrated in Figure 1.5.4, the amount students borrowed to attend Nebraska’s public postsecondary institutions rose 30.4%, from $249,136,795 in 2006-2007 to $324,940,478 in 2016-2017.21 The number of loan recipients increased 4.0%, from 58,806 in 2006-2007 to 61,169 in 2016-2017, while the number of originated loans increased 9.0%, from 64,561 to 70,387 in 2016-2017.
19 Cost of attendance includes tuition and mandatory fees, room and board, and books and supplies. 20 For details regarding these estimates, see the Commission’s 2016 Tuition, Fees, and Financial Aid Report, available on the Commission’s website at ccpe.nebraska.gov/reports. 21 Originated loans, including fees.
26,640 28,071 29,281
38,08144,476
57,875 55,931
46,185 46,655 42,527
35,178
14,780 14,913 15,17522,377
28,920
43,636 40,174
30,241 30,712 28,788 22,250
11,860 13,158 14,106 15,704 15,556 14,239 15,757 15,944 15,943 13,739 12,928 0
10,000
20,000
30,000
40,000
50,000
60,000
70,000
06-07 07-08 08-09 09-10 10-11 11-12 12-13 13-14 14-15 15-16 16-17
# Eligible # Eligible Who Did Not Receive State Grants # Awarded State Grants

Nebraska’s Coordinating Commission for Postsecondary Education – 2018 Progress Report 85
Figure 1.5.4 Level of Student Borrowing to Attend Nebraska’s Public Colleges and Universities
2016-2017 Compared to 2006-2007
Data sources: U.S. Department of Education Office of Postsecondary Education, December 2017; Nebraska DAS Supplements, and Nebraska CCPE Supplementals, December 2017. Need-Based Financial Aid In addition to the Nebraska Opportunity Grant, financial aid is provided through a system of tuition waivers at Nebraska public institutions. However, tuition waivers may or may not be need-based, depending on how each institution decides to allocate them. The State of Nebraska also funds the Access College Early (ACE) Scholarship Program. Initiated in fall 2007, ACE scholarships are awarded to eligible low-income Nebraska high school students who take college courses for credit from qualified postsecondary institutions. In fall 2011, the ACE Plus program was initiated. This program was fully funded by the federal College Access Challenge Grant (CACG) and was designed to provide financial aid to Nebraska college students who received ACE scholarships while they were in high school. Award year 2015-2016 was the final year of this program due to federal funding being discontinued. Since Nebraska’s state grant program has been the primary source of state-funded, need-based financial aid for Nebraska residents who are attending postsecondary institutions within the state, the analysis in this section focuses primarily on the changes in the funding of Nebraska’s state grant program that occurred between 2006-2007 and 2016-2017. In the analysis of the Nebraska’s state grant program, other sources of need-based aid also are discussed to present a complete picture of the amount of financial aid available to Nebraskans. The last part of this section focuses on the growth of the Access College Early (ACE) Scholarship Program and the college continuation rates of ACE scholarship recipients.
$249
$325
$
$80
$160
$240
$320
$400
2006-07 2016-17
Amount Borrowed in Millions
Million
Million
64,56170,387
58,80661,169
0
20,000
40,000
60,000
80,000
100,000
2006-07 2016-17
# Loans Originated # Recipients
loans tostudents
loans tostudents

Nebraska’s Coordinating Commission for Postsecondary Education – 2018 Progress Report 86
Nebraska Opportunity Grant Program and Other Sources of Title IV Financial Aid The Nebraska Opportunity Grant program was one of several programs based on or administered under the guidelines of Title IV of the U.S. Higher Education Act between 2006-2007 and 2016-2017.22 These programs provide financial aid to students attending postsecondary institutions in Nebraska and include the following federal programs (see Explanatory Note A8.1 in Appendix 8 for definitions of all of the financial aid programs listed below):
Academic Competitiveness Grant (ACG)
Federal Pell Grant
Federal Supplemental Educational Opportunity Grant (FSEOG)
Federal Work-Study (FWS)
Iraq and Afghanistan Service Grant (IASG)
National Science and Mathematics Access to Retain Talent (SMART) Grant
Perkins Loans
PLUS Loans
PLUS Loans for Graduate and Professional Degree Students (Grad PLUS)
Subsidized (Sub) and Unsubsidized (Unsub) Stafford Loans
Teacher Education Assistance for College and Higher Education Grant (TEACH)
Federal Pell Grants are awarded to undergraduates who have not yet earned bachelor’s degrees and who demonstrate high financial need. Nebraska state grants are awarded to Nebraska-resident students who demonstrate high financial need and attend eligible Nebraska postsecondary institutions. Funding of Awarded Nebraska Opportunity Grants
• The majority of the funding for Nebraska Opportunity Grants has come from the state
through the Nebraska Lottery and the state’s General Fund. From 2006-2007 through 2010-2011, the remaining funding came from the federal government through its regular and special Leveraging Educational Assistance Partnership (S/LEAP) authorizations. In 2011-2012, the Nebraska state grant program became entirely dependent on state funding.
• As shown in Table 1.5.1, $9,809,558 in state General Funds accounted for 94.4% of the
$10,388,223 awarded through Nebraska state grants in 2006-2007. • Between 2006-2007 and 2016-2017, state funding increased $7,080,190, or 72.2%. • In total, the amount of funding awarded through the state grant program increased 62.6%,
from $10,388,223 in 2006-2007 to $16,889,748 in 2016-2017.
22 The Academic Competitiveness Grant and National Science and Mathematics Access to Retain Talent (SMART) Grant were eliminated after the 2010-2011 academic year.

Nebraska’s Coordinating Commission for Postsecondary Education – 2018 Progress Report 87
Table 1.5.1 Amounts of Nebraska and Federal Funding
Awarded through the Nebraska Opportunity Grant Program 2006-2007 through 2016-2017
Academic Year
State Funding
% of Total
Federal Funding
% of Total
Total Funding
2006-2007 $9,809,558 94.4% $578,665 5.6% $10,388,223
2007-2008 $11,919,109 96.0% $502,715 4.0% $12,421,824
2008-2009 $12,118,524 96.1% $492,860 3.9% $12,611,384
2009-2010 $13,580,674 96.4% $512,379 3.6% $14,093,053
2010-2011 $14,380,912 96.2% $566,751 3.8% $14,947,663
2011-2012 $14,678,211 100.0% $0 0.0% $14,678,211
2012-2013 $15,185,498 100.0% $0 0.0% $15,185,498
2013-2014 $16,419,718 100.0% $0 0.0% $16,419,718
2014-2015 $16,455,272 100.0% $0 0.0% $16,455,272
2015-2016 $16,833,918 100.0% $0 0.0% $16,833,918
2016-2017 $16,889,748 100.0% $0 0.0% $16,889,748
$ Change Since 2006-2007 $7,080,190
-$578,665
$6,501,525
% Change Since 2006-2007 72.2% -100.0% 62.6%
Data source: Nebraska’s Coordinating Commission for Postsecondary Education, 2016 Tuition, Fees, and Financial Aid Report, supplemented with CCPE records, December 2017.
Nebraska Opportunity Grants as a Percentage of All Title IV Financial Aid Between 2006-2007 and 2015-2016, Nebraska’s Opportunity Grants represented only a small percentage of the total Title IV financial aid awarded through all of the eligible postsecondary institutions in Nebraska. Table 1.5.2 compares the total amount of financial aid awarded to students attending Nebraska colleges and universities in 2015-2016, the latest year for which federal data for all Nebraska institutions are available, to financial aid awarded in 2006-2007.23
• A total of $797,040,724 Title IV financial aid was awarded to students at Nebraska’s
postsecondary institutions in 2015-2016, an increase of 47.4% from 2006-2007.
• Nebraska’s state grants were equivalent to 2.1% of the total Title IV financial aid awarded to students attending Nebraska postsecondary institutions in 2015-2016, up from 1.9% in 2006-2007.
23 The interest on a Perkins Loan or a subsidized loan is paid by the federal government while the student borrower is in college. Therefore, this interest is comparable to a grant in the sense that it does not have to be repaid. For the sake of clarification, the amounts reported in this section are for the actual amounts borrowed, not including interest.
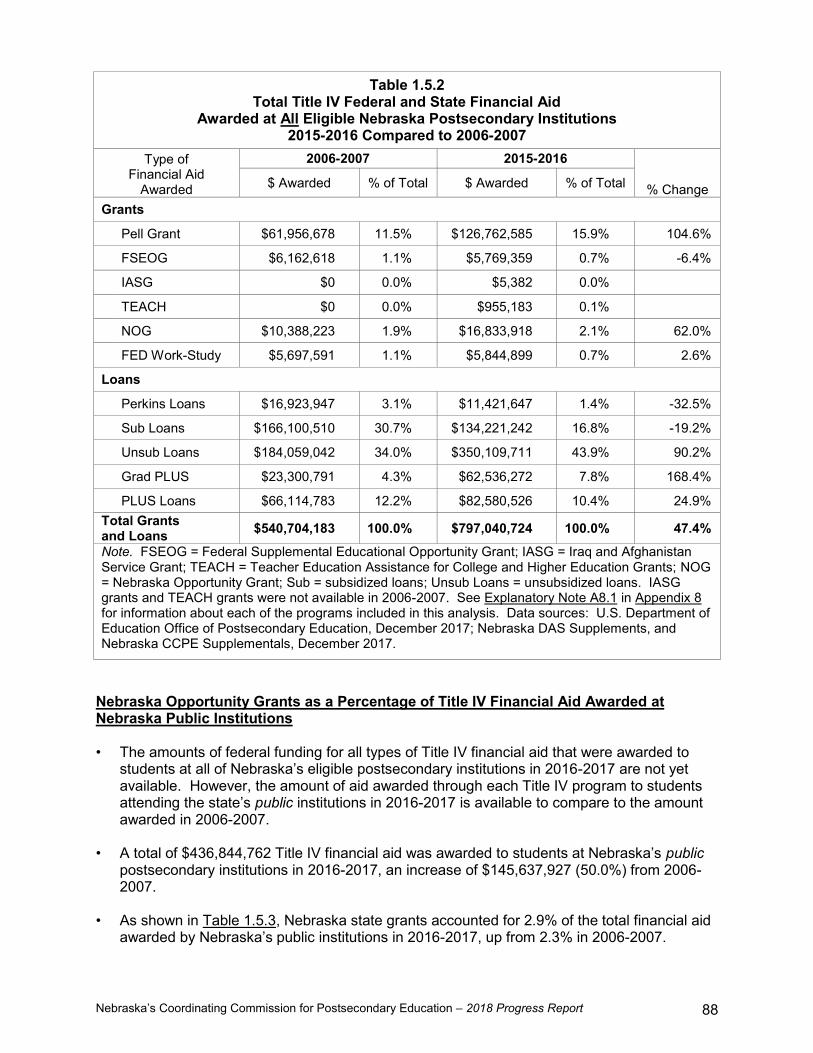
Nebraska’s Coordinating Commission for Postsecondary Education – 2018 Progress Report 88
Table 1.5.2 Total Title IV Federal and State Financial Aid
Awarded at All Eligible Nebraska Postsecondary Institutions 2015-2016 Compared to 2006-2007
Type of Financial Aid
Awarded
2006-2007 2015-2016
% Change $ Awarded % of Total $ Awarded % of Total
Grants
Pell Grant $61,956,678 11.5% $126,762,585 15.9% 104.6%
FSEOG $6,162,618 1.1% $5,769,359 0.7% -6.4%
IASG $0 0.0% $5,382 0.0%
TEACH $0 0.0% $955,183 0.1%
NOG $10,388,223 1.9% $16,833,918 2.1% 62.0%
FED Work-Study $5,697,591 1.1% $5,844,899 0.7% 2.6%
Loans
Perkins Loans $16,923,947 3.1% $11,421,647 1.4% -32.5%
Sub Loans $166,100,510 30.7% $134,221,242 16.8% -19.2%
Unsub Loans $184,059,042 34.0% $350,109,711 43.9% 90.2%
Grad PLUS $23,300,791 4.3% $62,536,272 7.8% 168.4%
PLUS Loans $66,114,783 12.2% $82,580,526 10.4% 24.9% Total Grants and Loans $540,704,183 100.0% $797,040,724 100.0% 47.4% Note. FSEOG = Federal Supplemental Educational Opportunity Grant; IASG = Iraq and Afghanistan Service Grant; TEACH = Teacher Education Assistance for College and Higher Education Grants; NOG = Nebraska Opportunity Grant; Sub = subsidized loans; Unsub Loans = unsubsidized loans. IASG grants and TEACH grants were not available in 2006-2007. See Explanatory Note A8.1 in Appendix 8 for information about each of the programs included in this analysis. Data sources: U.S. Department of Education Office of Postsecondary Education, December 2017; Nebraska DAS Supplements, and Nebraska CCPE Supplementals, December 2017.
Nebraska Opportunity Grants as a Percentage of Title IV Financial Aid Awarded at Nebraska Public Institutions • The amounts of federal funding for all types of Title IV financial aid that were awarded to
students at all of Nebraska’s eligible postsecondary institutions in 2016-2017 are not yet available. However, the amount of aid awarded through each Title IV program to students attending the state’s public institutions in 2016-2017 is available to compare to the amount awarded in 2006-2007.
• A total of $436,844,762 Title IV financial aid was awarded to students at Nebraska’s public postsecondary institutions in 2016-2017, an increase of $145,637,927 (50.0%) from 2006-2007.
• As shown in Table 1.5.3, Nebraska state grants accounted for 2.9% of the total financial aid
awarded by Nebraska’s public institutions in 2016-2017, up from 2.3% in 2006-2007.

Nebraska’s Coordinating Commission for Postsecondary Education – 2018 Progress Report 89
Table 1.5.3 Total Title IV Federal and State Financial Aid
Awarded at Nebraska Public Postsecondary Institutions 2016-2017 Compared to 2006-2007
Type of Financial Aid
Awarded
2006-2007 2016-2017
% Change $ Awarded % of Total $ Awarded % of Total
Grants
Pell Grant $44,543,134 15.3% $93,420,747 21.4% 109.7%
FSEOG $2,864,225 1.0% $2,455,736 0.6% -14.3%
IASG $0 0.0% $0 0.0%
TEACH $0 0.0% $323,469 0.1%
NOG $6,557,086 2.3% $12,632,146 2.9% 92.6%
FED Work-Study $3,408,183 1.2% $3,072,186 0.7% -9.9%
Loans
Perkins Loans $7,543,677 2.6% $3,973,825 0.9% -47.3%
Sub Loans $92,702,497 31.8% $82,404,861 18.9% -11.1%
Unsub Loans $92,930,919 31.9% $167,858,531 38.4% 80.6%
Grad PLUS $2,466,956 0.8% $12,860,674 2.9% 421.3%
PLUS Loans $38,190,158 13.1% $57,842,587 13.2% 51.5% Total Grants and Loans $291,206,835 100.0% $436,844,762 100.0% 50.0% Note. FSEOG = Federal Supplemental Educational Opportunity Grant; IASG = Iraq and Afghanistan Service Grant; TEACH = Teacher Education Assistance for College and Higher Education Grants; NOG = Nebraska Opportunity Grant; Sub = subsidized loans; Unsub Loans = unsubsidized loans. IASG grants and TEACH grants were not available in 2006-2007. See Explanatory Note A8.1 in Appendix 8 for information about each of the programs included in this analysis. Data sources: U.S. Department of Education Office of Postsecondary Education, December 2017; Nebraska DAS Supplements, and Nebraska CCPE Supplementals, December 2017.
Need-Based Financial Aid (Excluding Loans) Awarded at Nebraska’s Public Institutions Title IV Aid (Excluding Loans): • As shown in Table 1.5.4, of the $111,904,284 awarded through grants or the work-study
program in 2016-2017, 11.3% was awarded through the Nebraska state grant program, compared to 11.4% in 2006-2007.
• State funds accounted for 100% of the $12,632,146 awarded in state grants to students enrolled at public institutions in 2016-2017. Since 2011-2012, no federal funds have been available for funding the state grant program.
• Total federal funding of grants and work-study increased by 74.1%, from $57,009,835 in 2006-2007 to $99,272,138 in 2016-2017.
• Between 2006-2007 and 2016-2017, state funding of state grants increased by 103.9%, from $6,194,293 to $12,632,146. The state funded portion of the Nebraska state grants

Nebraska’s Coordinating Commission for Postsecondary Education – 2018 Progress Report 90
program increased from being equivalent to 10.8% of the total Title IV financial aid, excluding loans, awarded through Nebraska public institutions in 2006-2007 to equaling 11.3% in 2016-2017.
Table 1.5.4
Total Need-Based Financial Aid (Excluding Loans) Awarded at Nebraska Public Postsecondary Institutions
2016-2017 Compared to 2006-2007
Type of Need-Based Financial Aid
2006-2007 2016-2017 %
Change $ Awarded % of Total $ Awarded % of Total
Title IV Aid (Excluding Loans)
Nebraska Opportunity Grants
State-Funded $6,194,293 8.4% $12,632,146 8.2% 103.9%
Federal-Funded $362,793 0.5% $0 0.0% -100.0%
Total NE State Grant $6,557,086 8.9% $12,632,146 8.2% 92.6%
Federal Title IV
Pell Grant $44,543,134 60.6% $93,420,747 60.4% 109.7%
FSEOG $2,864,225 3.9% $2,455,736 1.6% -14.3%
IASG $0 0.0% $0 0.0%
TEACH $0 0.0% $323,469 0.2%
Federal Work Study $3,408,183 4.6% $3,072,186 2.0% -9.9%
Total Federal Title IV $50,815,542 69.1% $99,272,138 64.2% 95.4%
Total Title IV Aid (Excluding Loans) $57,372,628 78.0% $111,904,284 72.4% 95.0%
Other Need-Based Aid (Excluding Loans)
University of Nebraska $12,227,756 16.6% $38,287,074 24.8% 213.1%
NE State College System $969,423 1.3% $1,454,535 0.9% 50.0%
NE Community Colleges $2,964,924 4.0% $2,899,050 1.9% -2.2%
Total Other Need-Based Aid (Excluding Loans) $16,162,103 22.0% $42,640,659 27.6% 163.8%
Total Need-Based Aid (Excluding Loans) $73,534,731 100.0% $154,544,943 100.0% 110.2%
Note. FSEOG = Federal Supplemental Educational Opportunity Grant; IASG = Iraq and Afghanistan Service Grant; TEACH = Teacher Education Assistance for College and Higher Education Grants; Sub = subsidized loans; Unsub Loans = unsubsidized loans. IASG grants and TEACH grants were not available in 2006-2007. See Explanatory Note A8.1 in Appendix 8 for information about each of the programs included in this analysis. Data sources: U.S. Department of Education Office of Postsecondary Education, December 2017; Nebraska DAS Supplements, and Nebraska CCPE Supplementals, December 2017.

Nebraska’s Coordinating Commission for Postsecondary Education – 2018 Progress Report 91
Other Need-Based Aid (Excluding Loans): Although Title IV-related programs are the primary source of need-based financial aid, other institution-based programs are available to assist students. Programs available through the state’s public institutions are funded by the institutions and private sources. In addition, state funding is provided through need-based tuition waivers offered by the Nebraska state colleges and the institutions constituting the University of Nebraska. • As shown in Table 1.5.4, the total amount of need-based financial aid, not including Title IV
aid, provided to students by Nebraska’s public institutions increased 163.8% from $16,162,103 in 2006-2007 to $42,640,659 in 2016-2017.
• Between 2006-2007 and 2016-2017, the amount of other need-based aid provided by the
University of Nebraska increased 213.1%, while the amount of other need-based aid provided by the Nebraska State College System increased 50.0%. Meanwhile, the amount of other need-based aid awarded by Nebraska’s six community colleges decreased 2.2%.
Total Need-Based Aid (Excluding Loans): • The total amount of need-based financial aid provided to students attending Nebraska’s
public institutions, including Title IV programs and other need-based aid, but excluding loans, increased 110.2% from $73,534,731 in 2006-2007 to $154,544,943 in 2016-2017.
• As illustrated in Figure 1.5.5, the state-funded portion of the Nebraska state grants program
accounted for 8.4% of all of the need-based aid awarded by Nebraska public institutions in 2006-2007, excluding loans, compared to 8.2% in 2016-2017.
Figure 1.5.5
Total Need-Based Financial Aid (Excluding Loans) Awarded by Public Nebraska Postsecondary Institutions
2016-2017 Compared to 2006-2007
Note. Data sources: U.S. Department of Education Office of Postsecondary Education, December 2017; Nebraska DAS Supplements, and Nebraska CCPE Supplementals, December 2017.
0.5% 0.0%8.4% 8.2%
69.1%64.2%
22.0%27.6%
0%
25%
50%
75%
100%
2006-2007 2016-2017
Fed-Funded NSG/NOG State-Funded NSG/NOGFederal Title IV Grants & Work-Study Funds Other Need-Based Aid
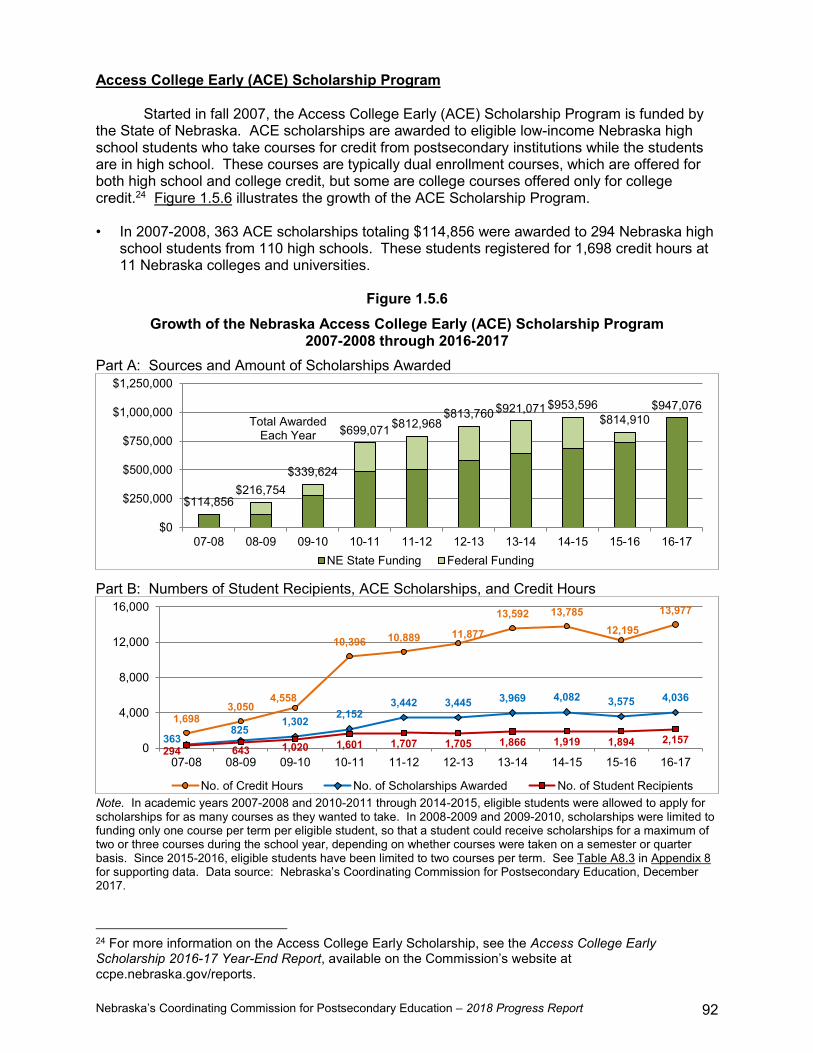
Nebraska’s Coordinating Commission for Postsecondary Education – 2018 Progress Report 92
Access College Early (ACE) Scholarship Program Started in fall 2007, the Access College Early (ACE) Scholarship Program is funded by the State of Nebraska. ACE scholarships are awarded to eligible low-income Nebraska high school students who take courses for credit from postsecondary institutions while the students are in high school. These courses are typically dual enrollment courses, which are offered for both high school and college credit, but some are college courses offered only for college credit.24 Figure 1.5.6 illustrates the growth of the ACE Scholarship Program. • In 2007-2008, 363 ACE scholarships totaling $114,856 were awarded to 294 Nebraska high
school students from 110 high schools. These students registered for 1,698 credit hours at 11 Nebraska colleges and universities.
Figure 1.5.6
Growth of the Nebraska Access College Early (ACE) Scholarship Program 2007-2008 through 2016-2017
Part A: Sources and Amount of Scholarships Awarded
Part B: Numbers of Student Recipients, ACE Scholarships, and Credit Hours
Note. In academic years 2007-2008 and 2010-2011 through 2014-2015, eligible students were allowed to apply for scholarships for as many courses as they wanted to take. In 2008-2009 and 2009-2010, scholarships were limited to funding only one course per term per eligible student, so that a student could receive scholarships for a maximum of two or three courses during the school year, depending on whether courses were taken on a semester or quarter basis. Since 2015-2016, eligible students have been limited to two courses per term. See Table A8.3 in Appendix 8 for supporting data. Data source: Nebraska’s Coordinating Commission for Postsecondary Education, December 2017.
24 For more information on the Access College Early Scholarship, see the Access College Early Scholarship 2016-17 Year-End Report, available on the Commission’s website at ccpe.nebraska.gov/reports.
$114,856$216,754
$339,624
$699,071 $812,968$813,760 $921,071 $953,596
$814,910$947,076
$0
$250,000
$500,000
$750,000
$1,000,000
$1,250,000
07-08 08-09 09-10 10-11 11-12 12-13 13-14 14-15 15-16 16-17NE State Funding Federal Funding
Total AwardedEach Year
1,6983,050
4,558
10,396 10,889 11,877
13,592 13,78512,195
13,977
363825
1,302 2,1523,442 3,445 3,969 4,082 3,575 4,036
294 643 1,020 1,601 1,707 1,705 1,866 1,919 1,894 2,1570
4,000
8,000
12,000
16,000
07-08 08-09 09-10 10-11 11-12 12-13 13-14 14-15 15-16 16-17
No. of Credit Hours No. of Scholarships Awarded No. of Student Recipients
Nebraska’s Coordinating Commission for Postsecondary Education – 2018 Progress Report 93
• In 2016-2017, 4,036 ACE scholarships totaling $947,076 were awarded to 2,157 Nebraska
high school students from 209 high schools. These students registered for 13,977 credit hours at 18 Nebraska colleges and universities. A total of $985,000 is appropriated for ACE scholarships for 2017-2018.
College Continuation Rates of ACE Scholarship Recipients Since 2009, the Coordinating Commission has conducted research to determine how many of the high school seniors who receive ACE scholarships continue on to college compared to other low-income and non-low-income graduates of Nebraska’s public high schools. For this research, a college continuation rate is defined as the percentage of high school graduates who were enrolled in college within one year of their high school graduation. For example, for the high school seniors who received ACE scholarships during 2015-2016, the college continuation rate is the percentage of these students who were enrolled in college any time between June 1, 2016, and May 31, 2017. Throughout this summary, the terms college continuation rate and college-going rate are used interchangeably. Using student records and summary reports from the Nebraska Department of Education (NDE) and enrollment records from the National Student Clearinghouse (NSC), the Commission calculates the college continuation rates by gender for the high school seniors who were ACE scholarship recipients. The Commission then compares the college continuation rates for the seniors who received ACE scholarships while attending public high schools to the college continuation rates for other low-income and non-low-income graduates of Nebraska’s public high schools.
Low-income students are defined as students who are approved to receive free or reduced-price school lunches. Non-low-income students are students who are not approved for free or reduced-price school lunches.25
Since the Commission relies on college enrollment records from the NSC, students who
continue on to college at non-NSC-reporting institutions are classified as not continuing on to college. As a result, college continuation rates reported here are underestimated to some degree. (See Section 1.1.c of this report for further information on college continuation rates.)
Students who were home-schooled or attended nonpublic (private) high schools are not
included in this phase of the research because the NDE does not have sufficient records for the Commission to compute college continuation rates for nonpublic high school students by income status.
25 Non-low-income students for this study include at least some students who live in low-income households but who did not apply for free or reduced-price school lunches. Since participation in the free or reduced-price school lunch program is the only indicant of household income in the student records maintained by the Nebraska Department of Education, low-income students in the non-low-income category cannot be identified and excluded for the purposes of analysis.

Nebraska’s Coordinating Commission for Postsecondary Education – 2018 Progress Report 94
College Continuation Rates for Nebraska ACE Scholarship Recipients • From the first year of the program in 2007-2008 to the third year in 2009-2010, the college
continuation rates of ACE scholarship recipients decreased as the number of awarded ACE scholarships increased. As shown in Figure 1.5.7, the college continuation rate for all seniors who received ACE scholarships decreased from 84.1% for students who graduated in 2007-2008 to 78.6% for those who finished high school in 2009-2010.
• Since 2009-2010, the college-going rate for ACE scholarship recipients steadily increased to
a high of 86.1% in 2012-2013 and has since decreased to 81.0% for 2015-2016 graduates.
Figure 1.5.7 College Continuation Rates for All High School Seniors
Who Received Access College Early (ACE) Scholarships 2007-2008 through 2015-2016
Note. See Tables A8.4.a, A8.4.b, A8.4.c, A8.4.d, A8.4.e, A8.4.f, A8.4.g, A8.4.h, and A8.4.i in Appendix 8 for supporting data. Data sources: Nebraska’s Coordinating Commission for Postsecondary Education (numbers of ACE recipients), May 2017; National Student Clearinghouse (college continuation data), May 2017. College Continuation Rates by Household Income • As shown in Figure 1.5.8, college continuation rates of ACE scholarship recipients have
been higher than, or about equal to, the rates for non-low-income graduates of the state’s public high schools.
• College continuation rates for ACE scholarship recipients were significantly higher than the
college-going rates for other low-income students who graduated from Nebraska’s public high schools between 2007-2008 and 2015-2016.26
26 To calculate the college continuation rates for other low-income graduates, the recipients of ACE scholarships were assumed to be included among the male and female low-income graduates reported by the Nebraska Department of Education to the Coordinating Commission. The numbers of other low-income graduates were determined by subtracting the numbers of male and female ACE scholarship recipients from the total numbers of male and female low-income graduates reported by the Nebraska Department of Education.
84.1%81.2%
78.6%81.5% 82.8%
86.1%82.3% 81.9% 81.0%
30%
40%
50%
60%
70%
80%
90%
100%
07-08 08-09 09-10 10-11 11-12 12-13 13-14 14-15 15-16
Col
lege
Con
tinua
tion
Rat
e
All Senior ACE Recipients

Nebraska’s Coordinating Commission for Postsecondary Education – 2018 Progress Report 95
Figure 1.5.8
College Continuation Rates for Public High School Seniors Who Received Access Early (ACE) Scholarships
and Other Graduates of Nebraska Public High Schools by Student Income Status: 2007-2008 through 2015-2016
Note. See Tables A8.4.a, A8.4.b, A8.4.c, A8.4.d, A8.4.e, A8.4.f, A8.4.g, A8.4.h, and A8.4.i in Appendix 8 for supporting data. Data sources: Nebraska’s Coordinating Commission for Postsecondary Education (numbers of ACE recipients), May 2017; National Student Clearinghouse (college continuation data), May 2017; and Nebraska Department of Education (numbers of low-income and non-low-income graduates) October 2017.
74.1% 75.5%
77.7%
77.3% 77.2% 77.7% 78.3% 78.4% 77.8%
83.7%80.7%
77.4%
81.2% 82.3%86.1%
82.0% 81.6% 81.0%
50.5% 51.1%53.8% 52.3% 52.6% 51.5% 53.6% 51.6% 53.2%
30%
40%
50%
60%
70%
80%
90%
100%
07-08 08-09 09-10 10-11 11-12 12-13 13-14 14-15 15-16
Publ
ic H
S C
olle
ge C
ontin
uatio
n R
ate
Non-Low-Income Grads ACE Scholarship Recipients Other Low-Income Grads

Nebraska’s Coordinating Commission for Postsecondary Education – 2018 Progress Report 96
This page left blank intentionally.

Nebraska’s Coordinating Commission for Postsecondary Education – 2018 Progress Report 97
Section 2 Increasing College Retention and Graduation Rates
Priority 2. Increase the percentage of students who enroll and successfully complete a degree. The second priority recommended by the 2003 LR 174 Task Force is to increase the percentage of students who enroll, persist, and successfully complete a degree. To achieve this goal, the LR 174 Task Force concluded that Nebraska’s postsecondary education system must (1) decrease the percentage of students who fail to persist beyond their first year(s) of enrollment, (2) increase the percentage of students who complete associate degrees within three years and baccalaureate degrees within six years, and (3) expand upon and strengthen existing associate degree to baccalaureate degree transfer programs. To monitor the extent to which the first and second strategic objectives are being achieved, this section focuses primarily on freshmen retention rates and college graduation rates that are based on data collected through the Integrated Postsecondary Education Data System (IPEDS), maintained by the National Center for Education Statistics (NCES) in the U.S. Department of Education. In addition, the Coordinating Commission analyzes the transfer rates based on IPEDS data for Nebraska’s six community colleges. Retention rate: The rate at which students persist in their educational program at an institution. For four-year institutions, this is the percentage of first-time bachelors (or equivalent) degree-seeking undergraduates from the previous fall who are again enrolled in the current fall. For all other institutions, this is the percentage of first-time degree/certificate-seeking students from the previous fall who either re-enrolled or successfully completed their program by the current fall. Retention rates are reported for full-time and part-time students.
Graduation rate: The total number of completers within 150% of normal time divided by the adjusted cohort. Graduation rates are only available historically for full-time, first-time freshmen.
Transfer-out rate: Total number of students who are known to have transferred out of the reporting institution within 150% of normal time to completion divided by the adjusted cohort. Transfer-out rates are only available for full-time, first-time freshmen. Note that IPEDS data are not available to determine if transfer students persist in their studies and graduate from the institutions to which they transfer. In this report, the terms transfer-out rate and transfer rate are used interchangeably. Cohorts for retention rates, graduation rates, and transfer rates are adjusted for allowable exclusions.27 The NCES is the best available source of data for monitoring the retention and graduation rates of institutions on an annual basis and over time, either by institution or by sector. However, the retention and graduation rates that are calculated using data collected through IPEDS are for first-time freshmen who continue their studies at the same institution
27 For the Graduation Rates, Outcome Measures, and Fall Enrollment retention rate reporting, students may be removed from a cohort if they left the institution for one of the following reasons: death or total and permanent disability; service in the armed forces (including those called to active duty); service with a foreign aid service of the federal government, such as the Peace Corps; or service on official church missions. Beginning with 2016 retention data, the freshmen cohort is adjusted by adding inclusions to the adjusted freshmen cohort. See Explanatory Note A9.1 in Appendix 9 for more information about freshmen retention rate calculations.

Nebraska’s Coordinating Commission for Postsecondary Education – 2018 Progress Report 98
where they started college. This type of student represents a decreasing percentage of postsecondary students. Consequently, a statewide analysis of retention and graduation rates based on NCES-IPEDS data does not provide any information about the persistence or graduation rates of a significant number of Nebraska college students who transfer to other institutions to continue their studies, including students who start college in the academic transfer programs offered by Nebraska’s community colleges and then transfer to four-year schools to earn bachelor’s degrees. Another limitation of the currently available transfer data is that not all institutions are required to report the number of full-time, first-time freshmen who transfer to other schools. As a result, it is impossible to compute a statewide transfer rate that is comparable to Nebraska’s statewide graduation rate. However, beginning with the 2010-2011 academic year, all six of Nebraska’s community colleges have reported the number of students in their full-time, first-time freshmen cohorts who transferred to other schools. Resulting transfer rates for these schools are reported at the end of Section 2.2 on college graduation and transfer rates based on IPEDS data. In addition to reporting the latest available retention, graduation, and transfer rates based on NCES-IPEDS data, this section of the Progress Report includes information about graduation and persistence rates obtained from research conducted by the National Student Clearinghouse Research Center. Using Clearinghouse data, six-year student outcomes based on national cohorts of degree-seeking, first-time freshmen were analyzed by state as well as for the United States as a whole. As a result, it provides additional information about the graduation and persistence rates of students who have started college at two-year public institutions, four-year public institutions, and four-year private nonprofit institutions in Nebraska. The research conducted by the National Student Clearinghouse Research Center is not without limitations. However, the research encompasses part-time students as well as full-time students and includes students who transferred to other institutions before completing their programs of study. Including these students overcomes important limitations of the analyses that are based only on NCES-IPEDS data. In overcoming these limitations, the research conducted by the Clearinghouse provides previously unavailable information about graduation and persistence rates. Consequently, this information, presented in Section 2.3, should be of interest to public policy makers and administrators of postsecondary institutions in Nebraska.

Nebraska’s Coordinating Commission for Postsecondary Education – 2018 Progress Report 99
2.1 Freshmen Retention Rates (Based on IPEDS Data)
Increase the percentage of students who persist beyond their first year(s) of enrollment.
The following analysis of freshmen retention rates is based on data reported by Nebraska institutions to the National Center for Education Statistics (NCES) through the Integrated Postsecondary Education Data System (IPEDS). The NCES defines a retention rate as the rate at which students persist in their educational program at an institution, expressed as a percentage. For four-year institutions, this is the percentage of first-time bachelors (or equivalent) degree-seeking undergraduates from the previous fall who are again enrolled in the current fall. For all other institutions, this is the percentage of first-time degree/certificate-seeking students from the previous fall who either re-enrolled or successfully completed their program by the current fall. Separate retention rates are reported by institutions for their full-time and part-time students. The latest available data are for fall 2016. Retention rates for fall 2017 will not be available until mid-2018 and will be reported in the 2019 Progress Report. Consequently, the following analysis focuses on how fall 2016 retention rates compare to fall 2006 rates. Full-Time Freshmen Retention Rates by Sector Figure 2.1.1 shows that full-time freshmen retention rates for the University of Nebraska and Nebraska’s independent institutions were higher in fall 2016 than they were in fall 2006. For the remaining sectors, full-time retention rates were lower in fall 2016 than they were in fall 2006 or data are not sufficient to compute a sector retention rate for fall 2006.
Figure 2.1.1 Full-Time Freshmen Retention Rates
of Nebraska Postsecondary Institutions by Sector Fall 2016 Compared to Fall 2006
Note. Data are insufficient to calculate the overall full-time retention rate for the for-profit/career school sector for fall 2006. See Explanatory Note A9.1 and Table A9.4 in Appendix 9 for more information on limitations of sector comparisons. See Table A9.1 in Appendix 9 for supporting data. Data source: National Center for Education Statistics, IPEDS fall 2005, fall 2006, and fall 2016 surveys.
79.7%
68.8%63.2%
72.8% 75.5%81.1%
65.1% 62.3%
73.5% 76.4% 79.1%
0%
25%
50%
75%
100%
University ofNebraska
Nebraska StateCollege System
NebraskaCommunity
Colleges
Total NebraskaPublic
Institutions
IndependentColleges &Universities
For-Profit/CareerSchools
Full-
Tim
e Fr
eshm
en R
eten
tion
Rat
e
2006 Full-Time Freshmen Retention Rate 2016 Full-Time Freshmen Retention Rate
Insufficient Data

Nebraska’s Coordinating Commission for Postsecondary Education – 2018 Progress Report 100
• The net effect of these changes in sector rates was that the estimated overall full-time retention rate for the three public sectors increased 0.7 percentage point, from 72.8% in fall 2006 to 73.5% in fall 2016, while the rate for all institutions in Nebraska, excluding the for-profit/career schools, increased 0.9 percentage point, from 75.5% in fall 2006 to 76.4% in fall 2016.
• See Table A9.1 in Appendix 9 for data related to the calculated sector and state retention
rates for full-time freshmen. See Table A9.4 in Appendix 9 for the full-time retention rates by institution for fall 2006 and fall 2016.
Part-Time Freshmen Retention Rates by Sector As shown in Figure 2.1.2, the overall part-time retention rate for Nebraska’s three public sectors of higher education was 38.1% in fall 2016, down from 40.5% in fall 2006. Sector retention rates for the public sectors were lower in fall 2016 than in fall 2006.28 • Regardless of sector, retention rates for part-time students are much lower than comparable
rates for full-time students.
Figure 2.1.2 Part-Time Freshmen Retention Rates
of Nebraska Postsecondary Institutions by Sector Fall 2016 Compared to Fall 2006
Note. The schools in the independent and for-profit/career school sectors did not provide sufficient data to calculate part-time retention rates for the sectors or for the state for fall 2006. See Explanatory Note A9.1 and Table A9.5 in Appendix 9 for more information on limitations of sector comparisons. See Table A9.2 in Appendix 9 for supporting data. Data source: National Center for Education Statistics, IPEDS fall 2005, fall 2006, and fall 2016 surveys.
28 The Nebraska State College System and the University of Nebraska reported small numbers of part-time first-time freshmen compared to Nebraska’s community colleges. Fall 2006 retention rates are based on the following cohorts: NU = 124; NSCS = 60; CCs = 1,499. Fall 2016 retention rates are based on the following cohorts: NU = 127; NSCS = 17; CCs = 1,538.
51.6% 53.3%
39.1% 40.5%50.4%
41.2% 37.1% 38.1%
0%
25%
50%
75%
100%
University of Nebraska Nebraska State CollegeSystem
Nebraska CommunityColleges
Total Nebraska PublicInstitutions
Part-
Tim
e Fr
eshm
en R
eten
tion
Rat
e
2006 Part-Time Freshmen Retention Rate 2016 Part-Time Freshmen Retention Rate
Nebraska’s Coordinating Commission for Postsecondary Education – 2018 Progress Report 101
Nebraska Freshmen Retention Rates Compared to Those of Other States The charts in this section show the fall 2016 overall freshmen retention rates for full-time and part-time freshmen enrolled at Nebraska’s public four-year colleges and universities and Nebraska’s six community colleges, compared to the retention rates for other states and the nation. (See Table A9.3 in Appendix 9 for supporting data.) Retention Rates for Public Four-Year Institutions Figure 2.1.3 and Figure 2.1.4 reveal that the fall 2016 retention rates for full-time and part-time freshmen enrolled at Nebraska’s public four-year institutions were below the corresponding national averages. • As shown in Figure 2.1.3, the overall full-time retention rate for Nebraska’s public four-year
institutions—the University of Nebraska at Kearney, the University of Nebraska–Lincoln, the University of Nebraska at Omaha, and the three institutions in the Nebraska State College System—was 78.8% in fall 2016, compared to an 81.1% retention rate for the nation.
• Nebraska’s fall 2016 full-time retention rate for public four-year institutions was the 29th
highest in the nation. • As shown in Figure 2.1.4, the overall part-time retention rate for Nebraska’s public four-year
institutions was 49.3% in fall 2016, compared to the national average of 54.7%. • Nebraska’s fall 2016 part-time retention rate for public four-year institutions was the 26th
highest in the nation. Retention Rates for Public Two-Year Institutions Figure 2.1.5 and Figure 2.1.6 compare the overall full-time and part-time freshmen retention rates for Nebraska’s six community colleges to the state and national rates for all two-year public colleges. These colleges include publicly supported tribal colleges and technical colleges, as well as community colleges. Consequently, retention data for the Nebraska College of Technical Agriculture at Curtis (NCTA-Curtis) and the Nebraska Indian Community College (NICC) are included in the computation of the national full-time and part-time retention rates for all two-year public colleges. Data for NCTA-Curtis and the NICC are not included in the calculation of the full-time retention rate for Nebraska’s six community colleges shown in Figure 2.1.5 and Figure 2.1.6. • As shown in Figure 2.1.5, the overall full-time retention rate for Nebraska’s community
colleges was 62.3% in fall 2016, compared to a 62.0% retention rate for the nation. • Nebraska’s fall 2016 full-time retention rate for the community colleges was the 13th highest
in the nation. • As shown in Figure 2.1.6, the overall part-time retention rate for Nebraska’s community
colleges was 37.1% in fall 2016, compared to the national average of 44.3%. • Nebraska’s fall 2016 part-time retention rate for the community colleges was the 44th highest
in the nation.

Nebraska’s Coordinating Commission for Postsecondary Education – 2018 Progress Report 102
Figure 2.1.3
2016 Full-Time Freshmen Retention Rates for Four-Year Public Institutions by State
Data source: National Center for Education Statistics, IPEDS fall 2016 survey.
71.1%71.4%71.7%71.9%72.0%72.7%73.4%73.5%74.0%74.4%75.1%75.6%76.3%76.5%76.7%77.4%77.5%77.8%77.9%78.3%78.7%78.8%78.8%78.9%79.1%79.4%79.5%80.0%80.0%80.3%80.5%80.8%80.9%80.9%81.1%81.1%81.6%82.4%82.8%83.0%83.1%83.3%83.7%83.8%83.9%
85.9%87.0%87.4%87.5%87.6%88.2%
0% 10% 20% 30% 40% 50% 60% 70% 80% 90% 100%
AlaskaMontana
UtahWest Virginia
MaineLouisiana
New MexicoArkansas
IdahoOklahoma
HawaiiSouth Dakota
KentuckyTennessee
WyomingNorth Dakota
MissouriTexas
ColoradoMississippiWisconsinNebraska
NevadaKansas
OhioIndianaIllinois
GeorgiaSouth Carolina
New HampshireAlabama
Rhode IslandMinnesota
OregonNation (50 States Only)
ArizonaVermont
MassachusettsPennsylvania
New YorkMarylandMichigan
ConnecticutNorth Carolina
WashingtonNew Jersey
FloridaIowa
VirginiaCaliforniaDelaware

Nebraska’s Coordinating Commission for Postsecondary Education – 2018 Progress Report 103
Figure 2.1.4
2016 Part-Time Freshmen Retention Rates for Four-Year Public Institutions by State
Data source: National Center for Education Statistics, IPEDS fall 2016 survey.
31.0%37.0%
38.3%38.9%39.5%40.0%40.3%41.0%
42.9%43.0%43.2%43.8%44.1%44.9%45.5%46.3%46.4%47.0%47.1%47.3%47.7%48.5%48.7%48.8%49.3%50.1%50.3%51.0%51.5%52.0%52.4%52.7%
53.8%54.7%
56.3%56.4%56.9%56.9%
59.1%59.4%60.0%60.3%60.9%61.5%62.0%
64.0%64.5%64.5%65.4%
68.6%74.1%
0% 10% 20% 30% 40% 50% 60% 70% 80% 90% 100%
MarylandKentucky
IllinoisWyoming
LouisianaIdaho
South CarolinaMaine
New MexicoAlabama
WisconsinOhio
NevadaPennsylvania
ArkansasWest Virginia
MissouriUtah
ConnecticutColorado
MississippiMinnesota
IndianaAlaska
NebraskaGeorgia
TennesseeMassachusetts
South DakotaRhode Island
KansasNorth Dakota
MontanaNation (50 States Only)
DelawareArizonaVirginia
MichiganOregon
WashingtonVermont
CaliforniaOklahoma
New HampshireNorth Carolina
HawaiiFlorida
New JerseyNew York
TexasIowa

Nebraska’s Coordinating Commission for Postsecondary Education – 2018 Progress Report 104
Figure 2.1.5
2016 Full-Time Freshmen Retention Rates for Two-Year Public Institutions by State (Nebraska Rate for Nebraska Community Colleges Only)
Data source: National Center for Education Statistics, IPEDS fall 2016 survey.
45.5%49.2%
50.9%51.3%51.6%51.7%52.2%52.3%
55.4%55.5%55.7%56.3%56.3%57.3%57.8%57.9%58.0%58.0%58.3%58.4%58.8%59.2%59.3%59.3%59.4%59.6%59.6%60.5%61.4%61.4%61.5%61.5%61.6%61.6%62.0%62.2%62.2%62.3%62.4%62.4%
63.5%64.0%64.1%64.6%65.5%65.6%65.6%
68.7%70.6%
76.2%
0% 10% 20% 30% 40% 50% 60% 70% 80% 90% 100%
DelawareAlaska
IndianaWest Virginia
TennesseeMontana
South CarolinaVermont
LouisianaOklahoma
IdahoOhio
OregonColorado
UtahKentucky
KansasAlabamaGeorgia
MinnesotaConnecticut
ArkansasNew MexicoPennsylvania
MassachusettsMaine
MichiganIowa
MissouriWyoming
North CarolinaWashington
WisconsinTexas
HawaiiNation (50 States Only)
MississippiFlorida
NebraskaNorth Dakota
New YorkArizona
MarylandNew Hampshire
NevadaVirginiaIllinois
New JerseyRhode Island
CaliforniaSouth Dakota
N/A

Nebraska’s Coordinating Commission for Postsecondary Education – 2018 Progress Report 105
Figure 2.1.6
2016 Part-Time Freshmen Retention Rates for Two-Year Public Institutions by State (Nebraska Rate for Nebraska Community Colleges Only)
Data source: National Center for Education Statistics, IPEDS fall 2016 survey.
15.0%30.0%
32.9%33.3%
37.0%37.1%37.4%37.6%38.1%38.7%38.9%39.0%
40.2%40.3%40.3%40.4%40.4%40.7%41.3%41.5%41.5%42.0%42.0%42.2%42.9%43.2%43.2%43.2%43.7%44.0%44.3%44.6%44.8%44.9%44.9%45.2%45.2%45.3%45.4%45.6%45.9%
47.3%48.2%48.6%48.9%
50.6%53.2%53.2%53.9%
55.5%
0% 10% 20% 30% 40% 50% 60% 70% 80% 90% 100%
DelawareMississippi
MontanaWyoming
AlaskaMissouri
NebraskaIdaho
South CarolinaKansas
TennesseeOklahoma
IowaNorth Dakota
KentuckyOregon
VermontIndiana
New MexicoAlabamaColorado
OhioArizonaHawaii
WashingtonVirginia
LouisianaWest Virginia
MichiganArkansas
PennsylvaniaNation (50 States Only)
IllinoisMinnesotaCaliforniaNew York
ConnecticutNorth Carolina
New JerseyUtah
NevadaMaryland
MassachusettsTexas
GeorgiaMaineFlorida
New HampshireWisconsin
Rhode IslandSouth Dakota
N/A

Nebraska’s Coordinating Commission for Postsecondary Education – 2018 Progress Report 106
This page left blank intentionally.

Nebraska’s Coordinating Commission for Postsecondary Education – 2018 Progress Report 107
2.2 College Graduation and Transfer Rates within 150% of Normal Time (Based on IPEDS Data)
Increase the percentage of students who complete associate degrees within three years and baccalaureate degrees within six years The college graduation rates reported in this section are based on data collected by the National Center for Education Statistics (NCES) through the Integrated Postsecondary Education Data System (IPEDS). The latest available data are for undergraduates who completed degree programs during the 2015-2016 academic year. Completion data for students who finished their degree programs in 2016-2017 will not be available for analysis until mid-2018. Consequently, the following analysis focuses on how 2015-2016 graduation rates for Nebraska institutions compare to 2005-2006 rates. Throughout this analysis, the terms “completion rate” and “graduation rate” are used interchangeably. Based on the same cohorts as graduation rates, the 2015-2016 transfer rates for Nebraska’s six community colleges are presented at the end of this section. Presenting these rates provides an important supplement to the graduation rates reported for these institutions. Generally, baccalaureate graduation and transfer rates are based on a six-year time frame, while rates for associate degrees are based on three years. In all cases, rates are calculated only for students who enrolled in degree programs as full-time, first-time freshmen. See Explanatory Note A10.1 in Appendix 10 and Explanatory Note A11.1 in Appendix 11 for further information on how completion and transfer rates are calculated using IPEDS data. Overall Public College Graduation Rates within 150% of Normal Time for Nebraska • As shown in Figure 2.2.1 the statewide graduation rate for Nebraska’s public four-year
postsecondary institutions increased from 53.7% in 2006-2007 to 57.2% in 2016-2017. Meanwhile, the statewide graduation rate for Nebraska’s public two-year institutions was 31.7% in 2005-2006 and 2015-2016
Figure 2.2.1
Overall Public College Graduation Rates within 150% of Normal Time for Nebraska 2005-2006 through 2015-2016
Note. See Table A10.1 in Appendix 10 for supporting data. Data source: National Center for Education Statistics, IPEDS 2006 through 2016 surveys.
31.7% 31.2% 33.2%28.6% 30.9% 29.7% 27.7% 27.0% 29.1% 28.9% 31.7%
53.7% 54.4% 55.7% 55.8% 55.7% 57.0% 56.8% 56.2% 57.0% 57.6% 57.2%
0%
25%
50%
75%
100%
05-06 06-07 07-08 08-09 09-10 10-11 11-12 12-13 13-14 14-15 15-16
Neb
rask
a P
ublic
Col
lege
Gra
duat
ion
Rat
es
Total Public 2-Year Total Public 4-Year

Nebraska’s Coordinating Commission for Postsecondary Education – 2018 Progress Report 108
College Graduation Rates within 150% of Normal Time by Sector and by Institution • Completion rates by sector varied noticeably, as shown in Figure 2.2.2. • The overall graduation rate for the University of Nebraska system increased from 54.9% in
2005-2006 to 59.5% in 2015-2016. The highest graduation rate within this sector in 2015-2016 was at the University of Nebraska–Lincoln (66.7%) while the lowest rate was at the Nebraska College of Technical Agriculture (42.9%).
• The overall graduation rate for the Nebraska State College System decreased from 47.2%
in 2005-2006 to 44.2% in 2015-2016. The highest graduation rate within this sector in 2015-2016 was at Wayne State College (47.9%) while the lowest rate was at Peru State College (35.4%).
• The overall graduation rate for Nebraska’s community colleges was 31.5% in 2005-2006
and 2015-2016. The highest graduation rate within this sector in 2015-2016 was at Northeast Community College (53.0%) while the lowest rate was at Metropolitan Community College (13.1%).
• Within the independent sector, the graduation rate increased from 62.5% in 2005-2006 to
64.2% in 2015-2016. The highest graduation rate in the independent sector in 2015-2016 was at Summit Christian College (100%). Meanwhile, Nebraska Indian Community College reported the lowest graduation rate (6.1%).
• The overall graduation rate for the for-profit/career schools increased from 63.2% in 2005-
2006 to 66.6% in 2015-2016. The highest graduation rates within this sector were at Paul Mitchell the School Lincoln (100.0%) and the Universal College of Healing Arts (100.0%) while the lowest rate was at Kaplan University-Lincoln (22.2%).
Figure 2.2.2
Graduation Rates within 150% of Normal Time for Nebraska Postsecondary Institutions by Sector
2015-2016 Compared to 2005-2006
Note. See Table A10.2 in Appendix 10 for supporting data. Data source: National Center for Education Statistics, IPEDS 2006 and 2016 surveys.
54.9%47.2%
31.5%
62.5% 63.2%59.5%
44.2%
31.5%
64.2% 66.6%
0%
25%
50%
75%
100%
University ofNebraska
Nebraska StateCollege System
NebraskaCommunity
Colleges
IndependentColleges andUniversities
For-Profit/CareerSchools
Col
lege
Gra
duat
ion
Rat
e
2005-2006 2015-2016

Nebraska’s Coordinating Commission for Postsecondary Education – 2018 Progress Report 109
• Within all of the sectors, some schools showed significant changes in their completion rates. Consequently, the sector completion rates shown in Figure 2.2.2 should not be interpreted as an indicant of the performance of any particular school.
• See Table A10.3 for the 2005-2006 and 2015-2016 completion rates by institution and by
sector. See Table A10.4 in Appendix 10 for the data used to calculate the completion rates by institution and by sector for 2005-2006 through 2015-2016.
College Graduation Rates within 150% of Normal Time by Race/Ethnicity • As shown in Figure 2.2.3, the 2005-2006 and 2015-2016 graduation rates for white non-
Hispanics and Asians/Pacific Islanders were significantly higher than the graduation rates for Hispanics, Native Americans, black non-Hispanics, and multiracial students.29
• Between 2005-2006 and 2015-2016, graduation rates increased for white non-Hispanics
and Asian/Pacific Islanders but decreased for Hispanics, Native Americans, and black non-Hispanics.
• See Table A10.5 and Table A10.6 in Appendix 10 for supporting data.
Figure 2.2.3 Graduation Rates within 150% of Normal Time
for Nebraska Postsecondary Institutions by Race/Ethnicity 2015-2016 Compared to 2005-2006
Note. See Table A10.5 in Appendix 10 for supporting data. Data source: National Center for Education Statistics, IPEDS 2006 and 2016 surveys.
29 The race/ethnicity category ‘two or more races’ was an optional reporting category for graduation rates reported for 2007-2008, 2008-2009, and 2009-2010. Adoption of the category was mandatory beginning with graduation rate data reported for 2010-2011.
51.1% 49.2%39.6%
21.6%
31.6%
N/A
55.4% 57.7%
38.6%
17.5%26.3%
41.2%
0%
25%
50%
75%
100%
White non-Hispanic
Asian/PacificIslander
Hispanic Native American Black non-Hispanic
Two or MoreRaces
Col
lege
Gra
duat
ion
Rat
e
2005-2006 2015-2016

Nebraska’s Coordinating Commission for Postsecondary Education – 2018 Progress Report 110
College Graduation Rates within 150% of Normal Time by Sector and by Race/Ethnicity • The following charts show how the graduation rates for each racial/ethnic group varied and
changed between 2005-2006 and 2015-2016 within each sector of higher education in Nebraska.
• Segmenting college graduation rates by sector and by race/ethnicity results in graduation
rates for 30 subgroups. For some subgroups, the cohorts are very small and graduation rates should be interpreted with caution. For example, the 2015-2016 graduation rate for Native Americans at for-profit/career schools was 0%, but the cohort consisted of only three students. See Table A10.7 in Appendix 7 for more information.
• As shown in Figure 2.2.4, graduation rates at the University of Nebraska decreased for
Native Americans but increased for all other racial/ethnic groups. • At the state colleges, graduation rates decreased for white non-Hispanics, remained the
same for Asian/Pacific Islanders, and increased for all other racial/ethnic groups (see Figure 2.2.5).
• As shown in Figure 2.2.6, graduation rates at Nebraska’s community colleges decreased for
Hispanics and Native Americans but increased for all racial/ethnic groups. • As shown in Figure 2.2.7, graduation rates at Nebraska’s independent institutions
decreased for Hispanics and black non-Hispanics, remained the same for Native Americans, and increased for white non-Hispanics and Asian/Pacific Islanders.
• Meanwhile, graduation rates at the for-profit/career schools decreased for Hispanics and
Native Americans but increased for all other racial/ethnic groups (see Figure 2.2.8).
Figure 2.2.4 Graduation Rates within 150% of Normal Time
for the University of Nebraska by Race/Ethnicity 2015-2016 Compared to 2005-2006
Note. See Table A10.7 in Appendix 10 for supporting data. Data source: National Center for Education Statistics, IPEDS 2006 and 2016 surveys.
56.4%51.5%
38.3%33.3% 32.1%
N/A
62.1%55.1%
48.8%
29.4%35.4%
45.0%
0%
25%
50%
75%
100%
White non-Hispanic
Asian/PacificIslander
Hispanic Native American Black non-Hispanic
Two or MoreRaces
Gra
duat
ion
Rat
es fo
r the
Uni
vers
ity o
f Neb
rask
a
2005-2006 2015-2016

Nebraska’s Coordinating Commission for Postsecondary Education – 2018 Progress Report 111
Figure 2.2.5 Graduation Rates within 150% of Normal Time
for the Nebraska State College System by Race/Ethnicity 2015-2016 Compared to 2005-2006
Note. See Table A10.7 in Appendix 10 for supporting data. Data source: National Center for Education Statistics, IPEDS 2006 and 2016 surveys.
Figure 2.2.6 Graduation Rates within 150% of Normal Time
for Nebraska Community Colleges by Race/Ethnicity 2015-2016 Compared to 2005-2006
Note. See Table A10.7 in Appendix 10 for supporting data. Data source: National Center for Education Statistics, IPEDS 2006 and 2016 surveys.
49.6%
33.3%25.0%
13.3%8.0%
N/A
47.1%
33.3%38.5%
22.2% 22.6% 18.8%
0%
25%
50%
75%
100%
White non-Hispanic
Asian/PacificIslander
Hispanic Native American Black non-Hispanic
Two or MoreRaces
Gra
duat
ion
Rat
es fo
r the
Neb
rask
a St
ate
Col
lege
Sys
tem
2005-2006 2015-2016
33.6%
21.4%25.8%
15.6%9.0%
N/A
35.5%
22.1% 22.6%
9.7% 11.7% 14.1%
0%
25%
50%
75%
100%
White non-Hispanic
Asian/PacificIslander
Hispanic Native American Black non-Hispanic
Two or MoreRaces
Gra
duat
ion
Rat
es fo
r N
ebra
ska
Com
mun
ity C
olle
ges
2005-2006 2015-2016

Nebraska’s Coordinating Commission for Postsecondary Education – 2018 Progress Report 112
Figure 2.2.7
Graduation Rates within 150% of Normal Time for Independent Colleges and Universities by Race/Ethnicity
2015-2016 Compared to 2005-2006
Note. See Table A10.7 in Appendix 10 for supporting data. Data source: National Center for Education Statistics, IPEDS 2006 and 2016 surveys.
Figure 2.2.8 Graduation Rates within 150% of Normal Time for For-Profit/Career Schools by Race/Ethnicity
2015-2016 Compared to 2005-2006
Note. See Table A10.7 in Appendix 10 for supporting data. Data source: National Center for Education Statistics, IPEDS 2006 and 2016 surveys.
64.6% 62.9% 61.7%
17.6%
41.5%
N/A
67.7%76.7%
53.9%
17.6%
38.9%
57.3%
0%
25%
50%
75%
100%
White non-Hispanic
Asian/PacificIslander
Hispanic Native American Black non-Hispanic
Two or MoreRaces
Gra
duat
ion
Rat
es fo
r In
depe
nden
t Col
lege
s &
Uni
vers
ities
2005-2006 2015-2016
64.1%71.4%
58.0% 55.6%48.0%
N/A
70.4%
100.0%
55.7%
0.0%
52.5%57.1%
0%
25%
50%
75%
100%
White non-Hispanic
Asian/PacificIslander
Hispanic Native American Black non-Hispanic
Two or MoreRaces
Gra
duat
ion
Rat
es fo
r Fo
r-Pro
fit/C
aree
r Sch
ools
2005-2006 2015-2016
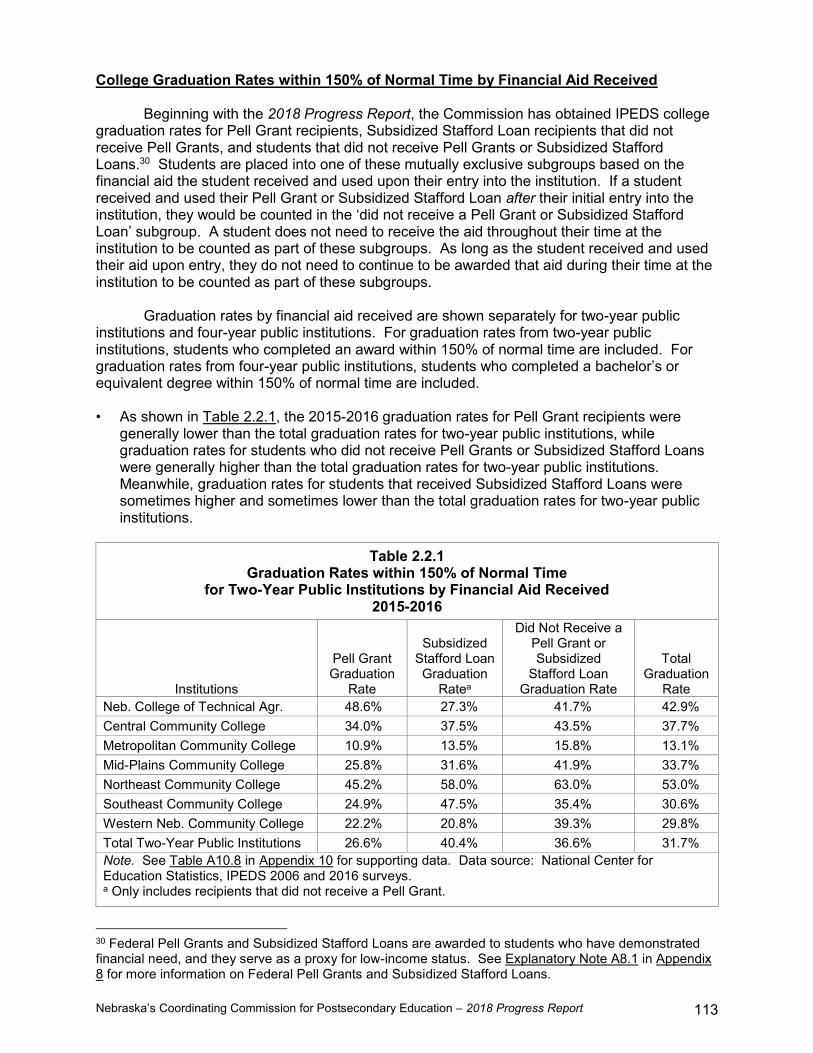
Nebraska’s Coordinating Commission for Postsecondary Education – 2018 Progress Report 113
College Graduation Rates within 150% of Normal Time by Financial Aid Received Beginning with the 2018 Progress Report, the Commission has obtained IPEDS college graduation rates for Pell Grant recipients, Subsidized Stafford Loan recipients that did not receive Pell Grants, and students that did not receive Pell Grants or Subsidized Stafford Loans.30 Students are placed into one of these mutually exclusive subgroups based on the financial aid the student received and used upon their entry into the institution. If a student received and used their Pell Grant or Subsidized Stafford Loan after their initial entry into the institution, they would be counted in the ‘did not receive a Pell Grant or Subsidized Stafford Loan’ subgroup. A student does not need to receive the aid throughout their time at the institution to be counted as part of these subgroups. As long as the student received and used their aid upon entry, they do not need to continue to be awarded that aid during their time at the institution to be counted as part of these subgroups. Graduation rates by financial aid received are shown separately for two-year public institutions and four-year public institutions. For graduation rates from two-year public institutions, students who completed an award within 150% of normal time are included. For graduation rates from four-year public institutions, students who completed a bachelor’s or equivalent degree within 150% of normal time are included. • As shown in Table 2.2.1, the 2015-2016 graduation rates for Pell Grant recipients were
generally lower than the total graduation rates for two-year public institutions, while graduation rates for students who did not receive Pell Grants or Subsidized Stafford Loans were generally higher than the total graduation rates for two-year public institutions. Meanwhile, graduation rates for students that received Subsidized Stafford Loans were sometimes higher and sometimes lower than the total graduation rates for two-year public institutions.
Table 2.2.1
Graduation Rates within 150% of Normal Time for Two-Year Public Institutions by Financial Aid Received
2015-2016
Institutions
Pell Grant Graduation
Rate
Subsidized Stafford Loan Graduation
Ratea
Did Not Receive a Pell Grant or Subsidized
Stafford Loan Graduation Rate
Total Graduation
Rate Neb. College of Technical Agr. 48.6% 27.3% 41.7% 42.9% Central Community College 34.0% 37.5% 43.5% 37.7% Metropolitan Community College 10.9% 13.5% 15.8% 13.1% Mid-Plains Community College 25.8% 31.6% 41.9% 33.7% Northeast Community College 45.2% 58.0% 63.0% 53.0% Southeast Community College 24.9% 47.5% 35.4% 30.6% Western Neb. Community College 22.2% 20.8% 39.3% 29.8% Total Two-Year Public Institutions 26.6% 40.4% 36.6% 31.7% Note. See Table A10.8 in Appendix 10 for supporting data. Data source: National Center for Education Statistics, IPEDS 2006 and 2016 surveys. a Only includes recipients that did not receive a Pell Grant.
30 Federal Pell Grants and Subsidized Stafford Loans are awarded to students who have demonstrated financial need, and they serve as a proxy for low-income status. See Explanatory Note A8.1 in Appendix 8 for more information on Federal Pell Grants and Subsidized Stafford Loans.

Nebraska’s Coordinating Commission for Postsecondary Education – 2018 Progress Report 114
• As shown in Table 2.2.2, graduation rates for Pell Grant recipients and Subsidized Stafford Loan recipients were generally lower than the total graduation rates for Nebraska’s four-year public institutions, while graduation rates for students who did not receive Pell Grants or Subsidized Stafford Loans were generally higher than the total graduation rates for two-year public institutions.
Table 2.2.2
Graduation Rates within 150% of Normal Time for Four-Year Public Institutions by Financial Aid Received
2015-2016
Institutions
Pell Grant Graduation
Rate
Subsidized Stafford Loan Graduation
Ratea
Did Not Receive a Pell Grant or Subsidized
Stafford Loan Graduation Rate
Total Graduation
Rate University of Nebraska at Kearney 49.9% 54.3% 64.1% 56.9% University of Nebraska-Lincoln 56.0% 61.3% 73.5% 66.7% University of Nebraska at Omaha 40.6% 40.1% 49.0% 45.2% Chadron State College 47.8% 34.3% 40.4% 43.2% Peru State College 34.2% 23.7% 41.5% 35.4% Wayne State College 41.3% 46.3% 55.6% 47.9% Total Four-Year Public Institutions 48.9% 54.0% 64.1% 57.6% Note. See Table A10.9 in Appendix 10 for supporting data. Data source: National Center for Education Statistics, IPEDS 2006 and 2016 surveys. a Only includes recipients that did not receive a Pell Grant.
Nebraska Graduation Rates within 150% of Normal Time Compared to the Graduation Rates of Other States • Figure 2.2.9 and Figure 2.2.10 show how the graduation rates of Nebraska’s four-year and
two-year institutions compare to the rates calculated for other states and the United States as a whole. These rates are calculated for all of the degree-granting institutions within each state, including public, private (not-for-profit), and for-profit schools. Institutions classified as non-degree-granting are not included in these comparisons. These rates are for all awards conferred. For example, the graduation rate for Nebraska’s two-year schools encompasses awards of diplomas and certificates as well as two-year associate degrees.
• As shown in Figure 2.2.9, the graduation rate for Nebraska’s four-year institutions was
59.2% for 2015-2016, or 17th highest among the 50 states and 4.3 percentage points above the 54.9% graduation rate for all four-year institutions in the United States.
• As illustrated in Figure 2.2.10, the graduation rate for Nebraska’s two-year institutions was
31.9%, or 16th highest among the 50 states, and 1.5 percentage points higher than the graduation rate of 30.4% for all two-year institutions in the United States.

Nebraska’s Coordinating Commission for Postsecondary Education – 2018 Progress Report 115
Figure 2.2.9 2014-2015 Graduation Rates within 150% of Normal Time for
Degree-Granting Four-Year Institutions by State
Data source: National Center for Education Statistics, IPEDS 2016 survey. Graduation rates obtained from the National Center for Higher Education Management Systems (NCHEMS), January 2018.
24.3%33.8%
36.8%41.7%
43.3%43.7%44.3%44.3%
45.6%46.6%47.2%47.9%48.0%48.2%48.6%49.0%49.9%50.1%50.7%51.1%51.5%51.6%51.8%51.9%52.1%
54.0%54.2%54.9%55.4%55.7%56.6%56.6%57.6%57.8%
59.2%60.3%60.8%61.4%
62.5%63.5%63.5%64.5%65.4%65.4%66.2%66.4%66.6%
68.3%69.2%
71.7%86.8%
0% 10% 20% 30% 40% 50% 60% 70% 80% 90% 100%
AlaskaNevadaGeorgia
New MexicoIdaho
ArkansasWest Virginia
OklahomaMontana
FloridaHawaii
UtahAlabamaKentucky
South DakotaNorth Dakota
LouisianaColorado
TennesseeMississippi
DelawareMichigan
KansasTexas
ArizonaOhio
WyomingNation (50 States + DC)
IndianaWisconsin
South CarolinaMissouri
MaineWashington
NebraskaIllinois
OregonNorth Carolina
New YorkCalifornia
MinnesotaVermontVirginia
New JerseyPennsylvania
ConnecticutMaryland
New HampshireRhode Island
MassachusettsIowa

Nebraska’s Coordinating Commission for Postsecondary Education – 2018 Progress Report 116
Figure 2.2.10 2014-2015 Graduation Rates within 150% of Normal Time for
Degree-Granting Two-Year Institutions by State
Data source: National Center for Education Statistics, IPEDS 2016 survey. Graduation rates obtained from the National Center for Higher Education Management Systems (NCHEMS), January 2018.
14.2%15.5%16.5%17.5%17.9%18.2%
19.5%21.2%21.6%21.9%22.0%22.3%22.7%22.7%
23.9%24.1%24.3%24.6%24.8%25.1%25.3%
26.5%26.5%27.5%27.8%27.8%
29.2%29.2%29.2%29.8%30.4%30.8%31.4%31.6%31.7%31.9%
33.6%33.9%34.6%
35.9%36.6%37.0%
43.6%45.5%
48.5%50.5%
54.0%57.6%
59.1%67.2%
71.3%
0% 10% 20% 30% 40% 50% 60% 70% 80% 90% 100%
VermontConnecticut
Rhode IslandHawaii
MichiganSouth CarolinaMassachusetts
IdahoNorth Carolina
IndianaNew Jersey
AlabamaMaryland
New HampshireOhioUtah
OregonNew Mexico
MaineNew YorkLouisianaMontana
TexasArkansasKentuckyMissouri
MinnesotaTennessee
IllinoisVirginia
Nation (50 States + DC)Iowa
OklahomaArizona
MississippiNebraska
GeorgiaWest Virginia
KansasWisconsin
PennsylvaniaCalifornia
North DakotaColoradoWyoming
WashingtonNevada
South DakotaFloridaAlaska
Delaware

Nebraska’s Coordinating Commission for Postsecondary Education – 2018 Progress Report 117
Transfer Rates within 150% of Normal Time for Nebraska Community Colleges A college’s graduation and transfer rates are based on the same full-time, first-time freshmen cohort. Consequently, a college’s graduation and transfer rates can be added together to determine the total percentage of the full-time, first-time freshmen who either completed their programs or transferred to other schools within 150% of the time specified for normal program completion.
Institutions are not required to report the number of students in their freshmen cohorts who transfer to other institutions unless the mission of the institution, “…includes providing substantial preparation for students to enroll in another eligible institution…” (IPEDS Graduation Rates Full Instructions). Since 2010-2011, all six of Nebraska’s community colleges have reported transfer data. (For more information about computed college transfer rates based on IPEDS data, see Explanatory Note A11.1 in Appendix 11.) Figure 2.2.11 compares the 2015-2016 graduation rates, transfer rates, and graduation plus transfer rates for Nebraska’s six community colleges. • As shown in Figure 2.2.11, the overall graduation rate for Nebraska’s community colleges in
2015-2016 was 31.5% while the overall transfer rate was 18.2%. • The 2015-2016 graduation rates for the community colleges ranged from 13.1% at
Metropolitan Community College to 53.0% at Northeast Community College. • Meanwhile, the schools’ transfer rates ranged from 13.5% at Northeast Community College
to 24.8% at Mid-Plains Community College. • The rates produced by combining each institution’s graduation rates and transfer rates
ranged from 33.8% at Metropolitan Community College to 66.5% at Northeast Community College.
Figure 2.2.11
2015-2016 Graduation Rates and Transfers Rates within 150% of Normal Time for Nebraska Community Colleges
Note. See Table A10.4 in Appendix 10 and Table A11.1 and Table A11.2 in Appendix 11 for supporting data. Data source: National Center for Education Statistics, IPEDS 2016 survey.
37.7%
15.4%
53.1%
13.1%
20.7%
33.8%33.7%24.8%
58.5%53.0%
13.5%
66.5%
30.6%
18.1%
48.7%
29.8%
18.8%
48.5%
31.5%
18.2%
49.6%
0%
25%
50%
75%
100%
Graduation Rate Transfer Rate Graduation + Transfer Rate
Central Community College Metropolitan Community CollegeMid-Plains Community College Northeast Community CollegeSoutheast Community College Western Nebraska Community CollegeNE Community Colleges Total
Nebraska’s Coordinating Commission for Postsecondary Education – 2018 Progress Report 118
This page left blank intentionally.
Nebraska’s Coordinating Commission for Postsecondary Education – 2018 Progress Report 119
2.3 Graduation and Persistence Rates (Based on Clearinghouse Data)
Research by the National Student Clearinghouse Research Center provides important information about the completion and persistence rates of students who start college at Nebraska’s public and independent institutions.
This section of the Nebraska Higher Education Progress Report summarizes the findings of a recent study of the six-year completion and persistence rates of degree-seeking, first-time freshmen who started college in Nebraska in fall 2010. The annual study was conducted by the National Student Clearinghouse (NSC) Research Center and is published in the report Completing College: A State-Level View of Student Attainment Rates. First available in February 2013, the report presents the findings of the NSC’s fifth annual study of six-year student outcomes based on a national cohort analyzed by state as well as for the United States as a whole. The report is important because it presents comparable six-year completion and persistence rates for students who started college at (a) two-year public colleges, (b) four-year public colleges and universities, and (c) four-year private nonprofit institutions.31 Introduction to the National Student Clearinghouse Study The completion and persistence rates reported in this section are based on the enrollment and completion records maintained by the NSC since 2006. An analysis of these records resulted in a national cohort of approximately 2.9 million college students who could be classified as degree-seeking, first-time freshmen in fall 2010.32 The enrollment and completion records of these students were then analyzed through the six-year period ending May 31, 2016.
Each student was classified by the state of the institution where the student first entered college, not by the student’s residential home state. First-time enrollment status was established by confirming that a student (1) did not show any postsecondary enrollment record in the four years prior to June 1, 2010, and (2) did not receive a degree or certificate from any postsecondary institution prior to fall 2010. Consequently, data for 2006 through 2010 had to be available in the Clearinghouse database for an institution’s students to be included in this study. In addition, records for the six-year period from fall 2010 through May 31, 2016 were required.
This study included students who entered college with prior college-level experience through taking dual enrollment courses in high school. In addition, students who began their studies in summer 2010 (July 11 through August 14) were included. The study was not limited to recent high school graduates. The number of Nebraska’s two-year and four-year institutions with Clearinghouse records dating back to 2006 varied by type of institution. The historical data coverage rate, based on student enrollments, for Nebraska’s four-year public institutions was 100.0%, and Nebraska’s four-year private nonprofit institutions coverage rate was 94.1%. Meanwhile, the historical coverage rate for Nebraska’s two-year public colleges was 99.7%. (The Nebraska institutions included in the study are listed in Table A12.1 in Appendix 12 of this report.) The Nebraska cohort included 22,503 degree-seeking first-time freshmen—9,140 started college at two-year public institutions, 9,516 started college at four-year public institutions, and 3,847 started at four-year private nonprofit institutions.
31 Students who began at multistate four-year nonprofit institutions were excluded from the results summarized in this section. 32 Fall 2010 enrollment is defined as enrollment during any term beginning August 15 through October 31, 2010, inclusive. If no term started between these dates, the term that started between July 11 and August 14, 2010, inclusive, was used.

Nebraska’s Coordinating Commission for Postsecondary Education – 2018 Progress Report 120
Degree-seeking status was defined differently for students at two-year and four-year schools. For students who started at four-year institutions, Clearinghouse records had to show that they were enrolled at least half time for at least one term and that they were enrolled for more than one term. For students who started at two-year institutions, they had to either be enrolled for at least one term full time before August 15, 2011, or be enrolled at least half time for at least two terms before December 31, 2011. The students in this study were classified as exclusively full-time students, exclusively part-time students, or mixed enrollment students. Mixed enrollment students were those who enrolled at least one term full-time and at least one term part-time over the course of their enrollment, rather than being enrolled exclusively full-time or part-time. (Enrollments during summer terms and shorter terms lasting less than 21 days were excluded from consideration.) For students enrolled concurrently at more than one institution, the two highest-intensity enrollment records were considered. So, if a student was concurrently enrolled half time at two institutions, that student was categorized as full time for that term. Students were also divided into three groups based on the age of the students when they first entered college (20 or younger, 21 to 24, and 25 or older). Finally, student outcomes were analyzed by gender. Reported Student Outcomes The six-year student outcomes calculated and compared in the National Student Clearinghouse study are as follows: Total completion rate: The percentage of the cohort who received diplomas or certificates from any institution in the United States by the end of the defined six-year period. Starting institution completion rate: The percentage of the cohort who received degrees or certificates from the same institution where they enrolled as first-time freshmen. Other institutions completion rates: The percentage of the cohort who received degrees or certificates from institutions anywhere in the United States to which they had transferred. This rate is reported separately for the two-year and four-year schools where the students did not initially enroll as first-time freshmen.
Note: For two-year public institutions, the percentage of students who completed degrees at four-year institutions after they completed programs at two-year colleges was also calculated (i.e., subsequent completion). This percentage added to the rate of first-time completions at four-year institutions equals the reported total four-year graduation rate for students who initially enrolled as first-time freshmen at two-year public institutions.
Persistence rate: The percentage of students in a cohort who did not earn a degree or other academic award but were still enrolled in college during the last year of the study period. Percentage of students not enrolled: The percentage of the cohort who had not completed degrees or certificate programs and were not enrolled at any institution during the last year of the study period.

Nebraska’s Coordinating Commission for Postsecondary Education – 2018 Progress Report 121
Nebraska Completion and Persistence Rates Compared to National Rates • Figure 2.3.1 shows how the total completion rates for Nebraska institutions compared to the
national rates for two-year public institutions, four-year public institutions, and four-year private nonprofit institutions.
• Total completion rates for degree-seeking, first-time freshmen at Nebraska’s two-year and
four-year public institutions were both higher than the comparable national rates. • The total completion rate for Nebraska’s four-year private nonprofit institutions was lower
than the national rate for similar institutions.
Figure 2.3.1 Six-Year Total Completion Rates for Nebraska and the United States
for First-Time Degree-Seeking Freshmen (Fall 2010)
Note. See Table A12.2 in Appendix 12 for supporting data. Data source: National Student Clearinghouse Research Center, Completing College: A State-Level View of Student Attainment Rates (Signature Report No. 12a), March 2017. • Figure 2.3.2 compares the U.S. and Nebraska completion rates for students who received
degrees or certificates from the same institutions where they initially enrolled as first-time freshmen.
• Completion rates for Nebraska’s two-year pubic, four-year public, and four-year private
nonprofit institutions were lower than the comparable national rates. • The rate of first completion at the starting institution for Nebraska’s two-year institutions was
significantly lower than the rates for the four-year institutions.
39.3%
62.4%73.9%
39.6%
65.6% 70.2%
0%
25%
50%
75%
100%
Two-Year PublicInstitutions
Four-Year PublicInstitutions
Four-Year PrivateNonprofit Institutions
Com
plet
ion
Rat
e
U.S. Total Completion Rate Nebraska Total Completion Rate
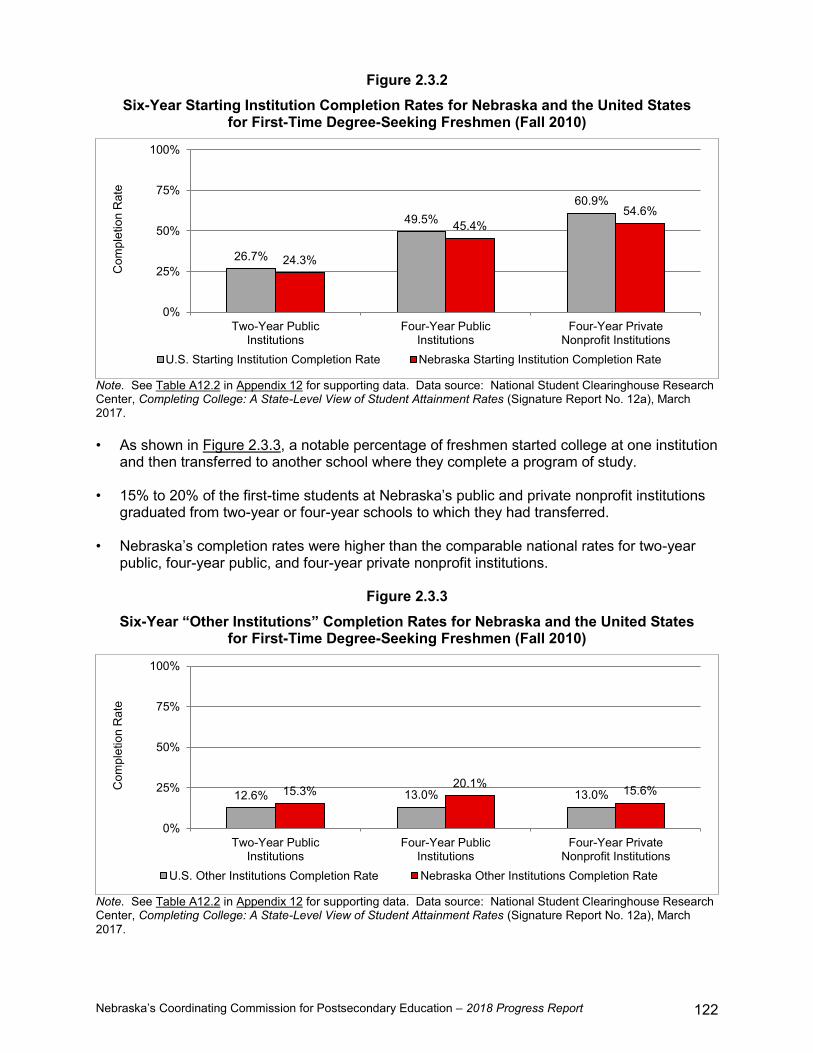
Nebraska’s Coordinating Commission for Postsecondary Education – 2018 Progress Report 122
Figure 2.3.2 Six-Year Starting Institution Completion Rates for Nebraska and the United States
for First-Time Degree-Seeking Freshmen (Fall 2010)
Note. See Table A12.2 in Appendix 12 for supporting data. Data source: National Student Clearinghouse Research Center, Completing College: A State-Level View of Student Attainment Rates (Signature Report No. 12a), March 2017. • As shown in Figure 2.3.3, a notable percentage of freshmen started college at one institution
and then transferred to another school where they complete a program of study. • 15% to 20% of the first-time students at Nebraska’s public and private nonprofit institutions
graduated from two-year or four-year schools to which they had transferred. • Nebraska’s completion rates were higher than the comparable national rates for two-year
public, four-year public, and four-year private nonprofit institutions.
Figure 2.3.3 Six-Year “Other Institutions” Completion Rates for Nebraska and the United States
for First-Time Degree-Seeking Freshmen (Fall 2010)
Note. See Table A12.2 in Appendix 12 for supporting data. Data source: National Student Clearinghouse Research Center, Completing College: A State-Level View of Student Attainment Rates (Signature Report No. 12a), March 2017.
26.7%
49.5%60.9%
24.3%
45.4%54.6%
0%
25%
50%
75%
100%
Two-Year PublicInstitutions
Four-Year PublicInstitutions
Four-Year PrivateNonprofit Institutions
Com
plet
ion
Rat
e
U.S. Starting Institution Completion Rate Nebraska Starting Institution Completion Rate
12.6% 13.0% 13.0%15.3% 20.1% 15.6%
0%
25%
50%
75%
100%
Two-Year PublicInstitutions
Four-Year PublicInstitutions
Four-Year PrivateNonprofit Institutions
Com
plet
ion
Rat
e
U.S. Other Institutions Completion Rate Nebraska Other Institutions Completion Rate

Nebraska’s Coordinating Commission for Postsecondary Education – 2018 Progress Report 123
• As shown in Figure 2.3.4, 9% to 15% of the students who started college at Nebraska’s public and private nonprofit institutions had not completed a degree or certificate program and were still enrolled at these or other institutions during the last year of the study period.
• Nebraska’s persistence rate for two-year public institutions was lower than the national
persistence rate for similar institutions. However, Nebraska’s persistence rates for the other two sectors were generally in line with the reported national rates.
Figure 2.3.4
Six-Year Persistence Rates for Nebraska and the United States
for First-Time Degree-Seeking Freshmen (Fall 2010)
Note. See Table A12.2 in Appendix 12 for supporting data. Data source: National Student Clearinghouse Research Center, Completing College: A State-Level View of Student Attainment Rates (Signature Report No. 12a), March 2017. Nebraska Student Outcomes by Enrollment Status The findings of the National Student Clearinghouse study confirm that the completion rates of full-time students are significantly higher than for students who attend college only part-time. This study also reveals that the completion rates for students with combinations of full-time and part-time enrollment are higher than those for exclusively part-time students but lower than the rates for students who consistently go to college full time. In addition, this study confirms that part-time students are less likely to persist in their studies and more likely to drop out of college than exclusively full-time students. Student Outcomes Compared Within Each Sector • Figure 2.3.5 shows that exclusively part-time students had total completion rates that were
significantly lower than the completion rates for exclusively full-time students or mixed enrollment students, regardless of whether they started college at two-year public, four-year public, or four-year private nonprofit institutions in Nebraska.
• The six-year persistence rates (i.e., the percentage of students who had not completed a
degree or certificate program but were still enrolled) were highest for the mixed enrollment students and lowest for the exclusively full-time students, regardless of the type of institution where they enrolled as first-time freshmen.
15.8% 13.2% 8.5%12.8% 14.7%9.4%
0%
25%
50%
75%
100%
Two-Year PublicInstitutions
Four-Year PublicInstitutions
Four-Year PrivateNonprofit Institutions
Pers
iste
nce
Rat
e
U.S. Persistence Rate Nebraska Persistence Rate

Nebraska’s Coordinating Commission for Postsecondary Education – 2018 Progress Report 124
• The percentage of students who were no longer enrolled six years after they started college was significantly higher for exclusively part-time students than for exclusively full-time students or mixed enrollment students.
Figure 2.3.5
Nebraska Six-Year Student Outcomes by Sector and Student Enrollment Status for First-Time Degree-Seeking Freshmen (Fall 2010)
Note. See Table A12.2 in Appendix 12 for supporting data. Data source: National Student Clearinghouse Research Center, Completing College: A State-Level View of Student Attainment Rates (Signature Report No. 12a), March 2017.
48.3%
3.6%
48.1%
13.0%3.7%
83.3%
36.9%
18.4%
44.6%
0%
25%
50%
75%
100%
Total Completion Rate Percent Still Enrolled Percent No Longer Enrolled
Exclusively Full-Time Students Exclusively Part-Time Students Mixed Enrollment Students
Two-Year Public Institutions
82.5%
3.3%14.2%
20.6%8.3%
71.1%
53.1%
24.8% 22.1%
0%
25%
50%
75%
100%
Total Completion Rate Percent Still Enrolled Percent No Longer Enrolled
Exclusively Full-Time Students Exclusively Part-Time Students Mixed Enrollment Students
Four-Year Public Institutions
81.7%
2.4%
15.9%26.0%
6.6%
67.4%
50.9%
23.3% 25.7%
0%
25%
50%
75%
100%
Total Completion Rate Percent Still Enrolled Percent No Longer Enrolled
Exclusively Full-Time Students Exclusively Part-Time Students Mixed Enrollment Students
Four-Year Private Nonprofit Institutions

Nebraska’s Coordinating Commission for Postsecondary Education – 2018 Progress Report 125
Four-Year Completion Rates for Two-Year Public Institutions • Another finding of the National Student Clearinghouse study that is of interest is the
percentage of students who started college at two-year institutions but earned degrees at four-year institutions. As evidenced in Figure 2.3.6, 14.9% of the students who initially enrolled at Nebraska’s two-year public colleges in fall 2010 had earned degrees from four-year institutions over the course of the next six years. For 10.9% of the cohort, these degrees were their first completions. For 4.1% of the cohort, their four-year degrees were subsequently completed after they had already completed a degree or certificate program at the two-year college where they initially enrolled or at another two-year school.
• Exclusively full-time students and mixed enrollment students had higher total four-year
graduation rates than students who attended college part time. Interestingly, exclusively full-time students were more likely than mixed enrollment students to have earned four-year degrees after they had already earned degrees or certificates at two-year schools, even though the total four-year completion rates for these two groups of students were similar.
Figure 2.3.6
Nebraska Completion Rates for Four-Year Degrees Earned by Students Who Initially Enrolled at Two-Year Public Institutions for First-Time Degree-Seeking Freshmen (Fall 2010)
Note. See Table A12.2 in Appendix 12 for supporting data. Data source: National Student Clearinghouse Research Center, Completing College: A State-Level View of Student Attainment Rates (Signature Report No. 12a), March 2017. Nebraska Student Outcomes by Age Group • As shown in Figure 2.3.7, students who started college when they were age 20 or younger
were more likely to complete degrees or certificate programs than students who didn’t start college until they were over the age of 20, regardless of where they initially enrolled.
• Students who started college when they were age 21 through 24 were the least likely to
complete degrees, regardless of where they were initially enrolled. • The highest total completion rate for students age 20 or younger was 77.1% at the four-year
private nonprofit schools. Meanwhile, the highest total completion rates for students age 21 through 24 and students age 25 or older were at four-year public institutions (51.8% and 59.9%, respectively).
6.1%
1.3%
13.9%10.9%
8.2%
1.3% 2.6%4.1%
14.3%
2.6%
16.5%14.9%
0%
25%
Exclusively Full-TimeStudents
Exclusively Part-TimeStudents
Mixed EnrollmentStudents
All Students Combined
First Completion at 4-Year Completion at 4-Year After Completing at 2-Year Total 4-Year Completion Rate

Nebraska’s Coordinating Commission for Postsecondary Education – 2018 Progress Report 126
Figure 2.3.7
Nebraska Six-Year Student Outcomes by Sector and Age Group
for First-Time Degree-Seeking Freshmen (Fall 2010)
Note. See Table A12.2 in Appendix 12 for supporting data. Data source: National Student Clearinghouse Research Center, Completing College: A State-Level View of Student Attainment Rates (Signature Report No. 12a), March 2017.
42.9%
15.0%
42.1%
25.6%13.1%
61.3%
32.4%
7.9%
59.7%
0%
25%
50%
75%
100%
Total Completion Rate Percent Still Enrolled Percent No Longer Enrolled
Started College Age 20 or Younger Started College Age 21 Through Age 24 Started College Age 25 or Older
Two-Year Public Institutions
66.3%
15.1% 18.6%
51.8%
11.3%
36.9%
59.9%
10.3%
29.9%
0%
25%
50%
75%
100%
Total Completion Rate Percent Still Enrolled Percent No Longer Enrolled
Started College Age 20 or Younger Started College Age 21 Through Age 24 Started College Age 25 or Older
Four-Year Public Institutions
77.1%
9.6%13.3%
45.6%
12.8%
41.7%47.1%
7.9%
45.0%
0%
25%
50%
75%
100%
Total Completion Rate Percent Still Enrolled Percent No Longer Enrolled
Started College Age 20 or Younger Started College Age 21 Through Age 24 Started College Age 25 or Older
Four-Year Private Nonprofit Institutions

Nebraska’s Coordinating Commission for Postsecondary Education – 2018 Progress Report 127
Nebraska Student Outcomes by Gender • As shown in Figure 2.3.8, females were more likely than males to have completed degrees
or certificate programs within six years, regardless of sector. • Across all sectors, the percentages of female students who left college before degree
completion were much lower than the percentages of male students who dropped out of college. However, at the four-year public and four-year private nonprofit institutions, the persistence rates of students who did not earn a degree or certificate within six years were slightly higher for males than for females.
Conclusion All of the six-year student outcomes for the United States as a whole and for Nebraska’s public and private nonprofit institutions are presented in Table A12.2 in Appendix 12 of this report. When the national percentages are compared to Nebraska’s percentages, Nebraska’s rates are not consistently higher or lower than the national percentages. Instead, Nebraska’s outcomes are higher, lower, or about the same as the comparable national rates, depending on the type of institution and the specific student enrollment or age group that was analyzed. This study clearly shows that students who start college earlier and attend full time are much more likely to earn degrees and certificates. While this study is not without limitations, it does provide reasonable estimates of the six-year completion and persistence rates for Nebraska’s two-year public institutions, four-year public institutions, and four-year private nonprofit institutions, compared to national rates.

Nebraska’s Coordinating Commission for Postsecondary Education – 2018 Progress Report 128
Figure 2.3.8
Nebraska Six-Year Student Outcomes by Sector and Gender
for First-Time Degree-Seeking Freshmen (Fall 2010)
Note. See Table A12.2 in Appendix 12 for supporting data. Data source: National Student Clearinghouse Research Center, Completing College: A State-Level View of Student Attainment Rates (Signature Report No. 12a), March 2017.
37.5%
11.4%
51.1%40.2%
15.0%
44.7%
0%
25%
50%
75%
100%
Total Completion Rate Percent Still Enrolled Percent No Longer Enrolled
Male Female
Two-Year Public Institutions
61.2%
15.4%23.5%
69.4%
14.9% 15.7%
0%
25%
50%
75%
100%
Total Completion Rate Percent Still Enrolled Percent No Longer Enrolled
Male Female
Four-Year Public Institutions
64.8%
10.1%
25.2%
75.4%
9.3%15.4%
0%
25%
50%
75%
100%
Total Completion Rate Percent Still Enrolled Percent No Longer Enrolled
Male Female
Four-Year Private Nonprofit Institutions
Nebraska’s Coordinating Commission for Postsecondary Education – 2018 Progress Report 129
Section 3
Reversing the Net Out-Migration of College-Educated Nebraskans
Priority 3. Reduce, eliminate, and then reverse the net out-migration of Nebraskans with
high levels of educational attainment. The third priority recommended by the 2003 LR 174 Task Force is to reduce, eliminate, and then reverse the net out-migration of Nebraskans with high levels of educational attainment. This priority was advised because data from the 2000 U.S. Census showed that Nebraska lost more college-educated adults than the state attracted between 1995 and 2000. Furthermore, during the same period, Nebraska attracted a significant net in-migration of adults with less than a high school education. The results of this analysis underscore the importance of developing more employment opportunities for individuals who are educated at Nebraska’s colleges and universities. The migration analysis presented in the 2004 Baseline Report was based on the U.S. Census Bureau’s estimates of the numbers of adults aged 22 to 64 who left and entered the state during the five-year period preceding the 2000 census. These estimates and the resulting estimates of net migration were based on responses to questions asked on the 2000 Census long-form, completed by a one-in-six sample of U.S. households. Migration estimates based on 2000 census data were included in the 2004 Baseline Report with the intention that they would later be compared to data collected through the 2010 decennial census. However, the U.S. Census Bureau no longer collects migration data comparable to the data collected in 2000. Instead, the Census Bureau replaced the long-form of the decennial census with the annual American Community Survey (ACS). First conducted in 2005, the ACS is an ongoing survey that provides annual population estimates for the United States. The ACS is collected monthly over the course of the survey year, and migration estimates are obtained by asking if members of a household lived in a different residence one year ago. Compared to the decennial census, the major advantage of the ACS is that it provides new estimates of interstate migration every year, rather than only once every ten years. For the purposes of this report, the major disadvantage of the annual ACS is that it provides estimates of the numbers of 22- to 64-year-olds who migrated to and from Nebraska based on small samples of individuals who entered or left the state. As a result, the migration estimates for 22- to 64-year-olds developed from ACS data can vary dramatically from one year to another, not because any significant changes in migration patterns have occurred, but because estimates based on small samples commonly fluctuate as a result of sampling error. In contrast, the migration data collected through the long-form of the decennial census in 2000 were from large samples of respondents, thus resulting in estimates with small margins of error. In 2016, the nationwide ACS had an initial sample of approximately 3.54 million households. Using the total ACS sample, the U.S. Census Bureau publishes estimates of the number of adults 25 years of age or older that move in to or out of each state. However, the only way to obtain migration estimates for 22- to 64-year-olds is to develop them based on a smaller sample of ACS data that is available for public use, Public Use Microdata Sample (PUMS).

Nebraska’s Coordinating Commission for Postsecondary Education – 2018 Progress Report 130
The ACS PUMS files include the survey responses obtained from an annual sample of about 1% of Nebraska’s households. However, only a small fraction of the individuals surveyed report that they lived in Nebraska for less than a year or that they moved out of Nebraska within one year of the survey. When these groups of respondents are classified by level of education, sample sizes are further reduced, thereby decreasing the reliability of the migration estimates by education level. Even though migration estimates based on ACS data can be expected to vary quite dramatically from one year to another, they are currently the only available statistics for monitoring Nebraska migration patterns. Consequently, the Coordinating Commission has reported the estimates for 22- to 64-year-olds by education level since ACS data first became available for public use. Generally, only limited conclusions can be drawn from one-year migration estimates, due to the small samples on which the estimates are based each year and the relatively high margin of error associated with each estimate. Theoretically, by calculating average annual migration estimates based on the combined data collected through five consecutive ACS surveys, these limitations may be reduced. Therefore, average annual migration estimates presented in this section are calculated using five-year ACS PUMS files. This section summarizes the average annual migration estimates based on the 2012-2016 ACS data collected from samples of 22- to 64-year-olds that migrated to and from the state, and compares these estimates to those based on average annual estimates based on 2007-2011 ACS. To provide context to the average annual migration estimates, the educational attainment of 22- to 64-year-olds is also discussed. While out-migration of Nebraskans with at least a bachelor’s degree continues to be a serious issue that Nebraska must address, it is worth noting that the educational attainment of 22- to 64-year-olds continues to increase, albeit less than it would have if out-migration were curtailed.

Nebraska’s Coordinating Commission for Postsecondary Education – 2018 Progress Report 131
Educational Attainment for 22- to 64-Year-Olds • Between 2007-2011 and 2012-2016, Nebraska’s estimated population of 22- to 64-year-olds
increased 2.3% (from 1,006,697 to 1,029,846). (See Table A13.1 in Appendix 13.) • Analysis by education level reveals that between 2007-2011 and 2012-2016, Nebraska’s
estimated population of 22- to 64-year-olds: • Decreased 2.1 percentage points for high school graduates or below. • Decreased 0.7 percentage point for those with some college or an associate’s degree. • Increased 2.7 percentage points for those with a bachelor’s degree or higher. • As shown in Figure 3.1, the result of these increases and decreases is that overall,
educational attainment in Nebraska is increasing.
Figure 3.1
Nebraska Educational Attainment of 22- to 64-Year-Olds Based on the 2007-2011 and 2012-2016 American Community Survey
Note. See Table A13.1 in Appendix 13 for supporting data. Data source: U.S. Census Bureau, American Community Survey five-year Public Use Microdata Sample (PUMS) files, 2007-2011 and 2012-2016. Compiled by Dr. Duncan Hsu.
34.0%
31.9%
36.3%
35.6%
29.7%
32.4%
2007-2011
2012-2016
High School Graduate or Below Some College or Associate's Bachelor's Degree or Higher

Nebraska’s Coordinating Commission for Postsecondary Education – 2018 Progress Report 132
Migration Estimates for 22- to 64-Year-Olds • Figure 3.2 summarizes the average annual net migration estimates for Nebraska by
education level, based on the results of the 2007-2011 and 2012-2016 ACS.33 • Figure 3.2 demonstrates that the net out-migration of highly educated working-age
Nebraskans has not been eliminated since the 2003 LR 174 Task Force prioritized the issue.
Figure 3.2
Nebraska Average Annual Net Migration of 22- to 64-Year-Olds by Education Level Based on the 2007-2011 and 2012-2016 American Community Survey
Note. See Table A13.2 in Appendix 13 for supporting data. Data source: U.S. Census Bureau, American Community Survey five-year Public Use Microdata Sample (PUMS) files, 2007-2011 and 2012-2016. Compiled by Dr. Duncan Hsu. • Figure 3.3 visually illustrates the margins of error for the average annual net migration
estimates that are based on 2007-2011 and 2012-2016 ACS data. • When the margin of error exceeds the absolute value of the point estimate, no conclusions
should be drawn about the estimate. For example, since the 2012-2016 estimated average annual net in-migration of -1,590 individuals with a bachelor’s degree or higher has a 90% margin of error of +/- 1,764, no conclusions can be drawn about the relative migration of that group.
• For the 2007-2011 ACS, no conclusions can be drawn about the estimated net migration of
those with some college or associate’s degrees. • However, it is estimated that Nebraska had an average annual net in-migration of 2,165
individuals with a high school education or below, +/- 1,574. In other words, if one were to draw indefinite samples of the population, the average annual net in-migration point
33 Net migration is the difference between the estimated numbers of individuals who moved to or from Nebraska. If net migration is positive, the number of people who moved to the state is higher than the number who left Nebraska. If net migration is negative, the number of people who left the state exceeded the number who moved to Nebraska.
244
660
-1,590
-686
2,165
1,654
-1,644
2,175
-7,500 -5,000 -2,500 0 2,500 5,000 7,500
High School Graduate or Below
Some College or Associate's
Bachelor's Degree or Higher
Total Migration
2007-2011 2012-2016

Nebraska’s Coordinating Commission for Postsecondary Education – 2018 Progress Report 133
estimate would fall between 591 and 3,739 90% of the time. During this same time, it is estimated that Nebraska had an average annual net out-migration of 1,590 individuals with a bachelor’s degree or higher, +/- 3,194. In other words, if one were to draw indefinite samples of the population, the average annual net out-migration point estimate would fall between 88 and 3,200 90% of the time. Hence, Nebraska was not meeting the goal of eliminating the net out-migration of Nebraskans with high levels of educational attainment during the 2007-2011 time period.
• For the 2012-2016 ACS, no conclusions can be drawn about the estimated net migration of
those with a high school education or below, some college or associate’s degrees, or bachelor’s degrees or higher.
• See Table A13.3 in Appendix 13 for more information on confidence intervals for ACS data.
Figure 3.3 Nebraska Average Annual Net Migration of 22- to 64-Year-Olds by Education Level
Based on the 2007-2011 and 2012-2016 American Community Survey Part A: 2007-2011
Part B: 2012-2016
Note. See Table A13.2 and Table A13.3 in Appendix 13 for the margins of error and the number of cases on which each estimate is based. This chart shows each average annual net migration estimate as the mid-point of the range of values based on the margin of error at the 90% confidence level. Data source: U.S. Census Bureau, American Community Survey five-year Public Use Microdata Sample (PUMS) files, 2007-2011 and 2012-2016. Compiled by Dr. Duncan Hsu.
Total Migration,2,175
High School Graduate or Below,
2,165
Some College or Associate's, 1,654
Bachelor's Degree or Higher, -1,644
-7,500 -5,000 -2,500 0 2,500 5,000 7,500
Total Migration,-686
High School Graduate or Below,
244
Some College or Associate's, 660
Bachelor's Degree or Higher, -1,590
-7,500 -5,000 -2,500 0 2,500 5,000 7,500
Nebraska’s Coordinating Commission for Postsecondary Education – 2018 Progress Report 134
Migration Estimates Compared to Educational Attainment for 22- to 64-Year-Olds Although currently available estimates from the U.S. Census Bureau do not reveal a clear picture of overall Nebraska migration patterns at all levels of education, there is still reason to be concerned about the net migration of working-age adults, particularly at the bachelor’s degree and above level. In fact, using a slightly different population (age 25+ rather than 22-64) the University of Nebraska at Omaha Center for Public Affairs Research calculates that Nebraska ranks 42nd in the net loss of people age 25 or older with a bachelor’s degree or higher over the past five years.34 As illustrated in Figure 3.4, the latest available average annual net migration estimate at each education level is small, relative to the corresponding total estimated working-age population of the state. Nevertheless, repeated positive or negative net migration will have a corresponding positive or negative effect on the size and quality of the state’s labor force over the long run. • Analyzing the overall educational attainment and the overall net migration of 22- to-64-year-
olds reveals that for every 10,000 people in Nebraska with a high school education or below, there was an average annual net in-migration of 7.4 people for 2012-2016, compared to an average annual net in-migration of 63.2 people for 2007-2011.
• For every 10,000 people in Nebraska with some college or an associate’s degree, there was
an average annual net in-migration of 18.0 people for 2012-2016, compared to an average annual net in-migration of 45.2 people for 2007-2011.
• For every 10,000 people in Nebraska with a bachelor’s degree or higher, there was an
average annual net out-migration of 47.6 people for 2012-2016, compared to an average annual net out-migration of 55.1 people for 2007-2011.
• As previously discussed, only limited conclusions can be drawn about the net migration of
22- to-64-year-olds due to the large margins of error relative to the estimates. Caution should be exercised when interpreting the migration estimates based on American Community Survey data.
• A better future measure to analyze the net migration of Nebraskans with high levels of
education attainment would be to obtain data from the postsecondary institutions related to where their recent college graduates are employed.
34 2012-16 American Community Survey, U.S. Census Bureau analyzed by David Drozd, UNO Center for Public Affairs Research.

Nebraska’s Coordinating Commission for Postsecondary Education – 2018 Progress Report 135
Figure 3.4 Nebraska Educational Attainment of 22- to 64-Year-Olds Compared to the
Nebraska Average Annual Net Migration of 22- to 64-Year-Olds by Education Level Based on the 2007-2011 and 2012-2016 American Community Survey
Part A: 2007-2011
Part B: 2012-2016
Note. See Table A13.1 and Table A13.2 in Appendix 13 for supporting data. Data source: U.S. Census Bureau, American Community Survey five-year Public Use Microdata Sample (PUMS) files, 2007-2011 and 2012-2016. Compiled by Dr. Duncan Hsu.
342,463365,706
298,528
2,165 1,654
-1,644-50,000
0
50,000
100,000
150,000
200,000
250,000
300,000
350,000
400,000
High School Graduate or Below Some College or Associate's Bachelor's Degree or Higher
Estimated Total Population Age 22 to 64 Estimated Net Migration Age 22 to 64
328,754366,922
334,170
244 660
-1,590-50,000
0
50,000
100,000
150,000
200,000
250,000
300,000
350,000
400,000
High School Graduate or Below Some College or Associate's Bachelor's Degree or Higher
Estimated Total Population Age 22 to 64 Estimated Net Migration Age 22 to 64

Nebraska’s Coordinating Commission for Postsecondary Education – 2018 Progress Report 136
This page left blank intentionally.

Nebraska’s Coordinating Commission for Postsecondary Education – 2018 Progress Report 137
Appendices Note. Adjustments are occasionally made to improve data accuracy. Therefore, it is generally advisable to reference the most recent edition of this report. Due to rounding, percentages may not sum to 100.0% for data summarized in this report. Additionally, due to rounding, totals may not equal the sum of their parts.

Nebraska’s Coordinating Commission for Postsecondary Education – 2018 Progress Report 138
Reporting Institutions and History of Name/Sector Changes
University of Nebraska Nebraska College of Technical Agriculture University of Nebraska at Kearney University of Nebraska-Lincoln University of Nebraska Medical Center University of Nebraska at Omaha Nebraska State College System Chadron State College Peru State College Wayne State College
Nebraska Community Colleges Central Community College Metropolitan Community College Mid-Plains Community College Northeast Community College Southeast Community College Western Nebraska Community College
Independent College & Universities Bellevue University Bryan College of Health Sciences
Formerly BryanLGH College of Health Sciences
Clarkson College College of Saint Mary Concordia University-Seward
Formerly Concordia University Creighton University Dana College
Closed Fall 2010 Doane University-Arts & Sciences
Formerly Doane College Formerly Doane College-Crete
Doane University-Graduate and Professional Studies Formerly Doane College-Lincoln
Grace University Hastings College Little Priest Tribal College Midland University
Formerly Midland Lutheran College Nebraska Christian College of Hope
International University Formerly Nebraska Christian College
Nebraska Indian Community College Nebraska Methodist College of Nursing & Allied
Health Nebraska Wesleyan University Summit Christian College Union College York College
For-Profit/Career Schools Capitol School of Hairstyling and Esthetics*
Formerly Capitol School of Hairstyling CHI Health School of Radiologic Technology
Formerly Alegent Health School of Radiologic Technology
Changed from non-degree-granting to degree-granting Fall 2007
College of Hair Design* College of Hair Design-East Campus*
Did not report to IPEDS until Fall 2009 Fullen School of Hair Design*
No longer an IPEDS reporting institution Fall 2016
ITT Technical Institute-Omaha Closed Fall 2016
Joseph’s College Cosmetology* Formerly Joseph’s College of Beauty Formerly Joseph’s College
Kaplan University-Lincoln Campus Formerly Hamilton College-Lincoln Campus
Kaplan University-Omaha Campus Formerly Hamilton College-Omaha Campus
La’James International College* Mary Lanning Memorial Hospital School of
Radiologic Technology Changed from non-degree-granting to degree-
granting Fall 2010 Myotherapy Institute National American University-Bellevue
Did not report to IPEDS until Fall 2012 Omaha School of Massage and Healthcare of
Herzing University Formerly Omaha School of Massage Therapy Changed from non-degree-granting to degree-
granting Fall 2009 Changed from for-profit to not-for-profit Fall
2017 Paul Mitchell the School Lincoln*
Did not report to IPEDS until Fall 2016 Regional West Medical Center School of Radiologic
Technology* No longer an IPEDS reporting institution Fall
2016 The Creative Center Universal College of Healing Arts University of Phoenix-Omaha Campus
Closed Fall 2015 Vatterott College
Closed Fall 2005 Vatterott College-Spring Valley
Closed Fall 2015 Xenon International Academy-Omaha*
Formerly Xenon International School of Hair Design II Inc
Note. All institutions in the for-profit/career school category are currently operated for profit except for the three schools of radiologic technology, which are operated by not-for-profit hospitals or medical centers, and Omaha School of Massage and Healthcare of Herzing University. * = Institution was classified as non-degree-granting as of the most recent IPEDS survey.
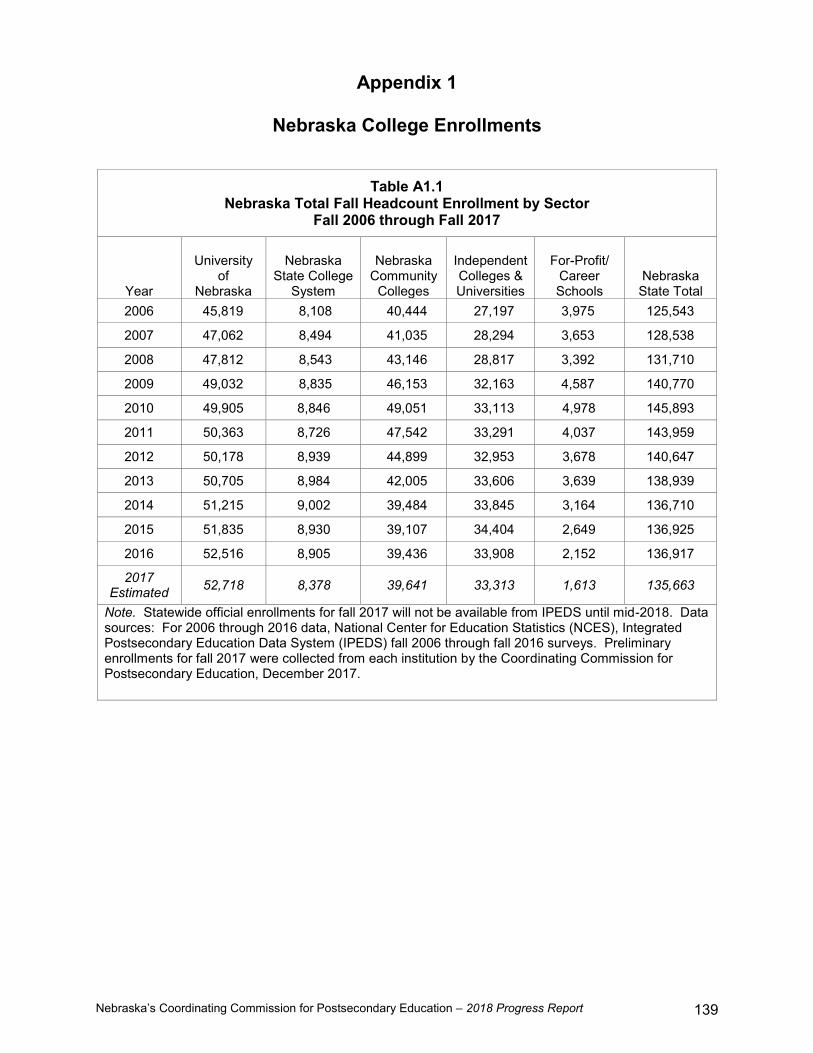
Nebraska’s Coordinating Commission for Postsecondary Education – 2018 Progress Report 139
Appendix 1
Nebraska College Enrollments
Table A1.1 Nebraska Total Fall Headcount Enrollment by Sector
Fall 2006 through Fall 2017
Year
University of
Nebraska
Nebraska State College
System
Nebraska Community
Colleges
Independent Colleges & Universities
For-Profit/ Career Schools
Nebraska State Total
2006 45,819 8,108 40,444 27,197 3,975 125,543
2007 47,062 8,494 41,035 28,294 3,653 128,538
2008 47,812 8,543 43,146 28,817 3,392 131,710
2009 49,032 8,835 46,153 32,163 4,587 140,770
2010 49,905 8,846 49,051 33,113 4,978 145,893
2011 50,363 8,726 47,542 33,291 4,037 143,959
2012 50,178 8,939 44,899 32,953 3,678 140,647
2013 50,705 8,984 42,005 33,606 3,639 138,939
2014 51,215 9,002 39,484 33,845 3,164 136,710
2015 51,835 8,930 39,107 34,404 2,649 136,925
2016 52,516 8,905 39,436 33,908 2,152 136,917
2017 Estimated 52,718 8,378 39,641 33,313 1,613 135,663
Note. Statewide official enrollments for fall 2017 will not be available from IPEDS until mid-2018. Data sources: For 2006 through 2016 data, National Center for Education Statistics (NCES), Integrated Postsecondary Education Data System (IPEDS) fall 2006 through fall 2016 surveys. Preliminary enrollments for fall 2017 were collected from each institution by the Coordinating Commission for Postsecondary Education, December 2017.

Nebraska’s Coordinating Commission for Postsecondary Education – 2018 Progress Report 140
Table A1.2 Nebraska Total Fall Headcount Enrollment by Sector and by Institution
Fall 2006 through Fall 2017
Total Fall Headcount Enrollment 2006 2007 2008 2009 2010 2011
Nebraska Public Institutions 94,371 96,591 99,501 104,020 107,802 106,631
University of Nebraska 45,819 47,062 47,812 49,032 49,905 50,363 Neb. College of Technical Agriculture 272 327 289 425 383 333 University of Nebraska at Kearney 6,468 6,478 6,543 6,650 6,753 7,100 University of Nebraska-Lincoln 22,106 22,973 23,573 24,100 24,610 24,593 University of Nebraska Medical Center 3,067 3,128 3,194 3,237 3,494 3,625 University of Nebraska at Omaha 13,906 14,156 14,213 14,620 14,665 14,712
Nebraska State College System 8,108 8,494 8,543 8,835 8,846 8,726 Chadron State College 2,577 2,660 2,649 2,712 2,759 2,851 Peru State College 2,124 2,307 2,328 2,492 2,518 2,358 Wayne State College 3,407 3,527 3,566 3,631 3,569 3,517
Nebraska Community Colleges 40,444 41,035 43,146 46,153 49,051 47,542 Central Community College 6,543 6,531 6,885 7,320 7,527 7,521 Metropolitan Community College 14,098 14,804 15,055 17,003 18,523 18,518 Mid-Plains Community College 3,030 2,715 2,708 2,765 2,987 2,623 Northeast Community College 5,261 5,149 5,140 5,205 5,377 5,161 Southeast Community College 9,594 9,603 10,419 11,556 12,242 11,479 Western Nebraska Community College 1,918 2,233 2,939 2,304 2,395 2,240
Nebraska Independent Institutions 27,197 28,294 28,817 32,163 33,113 33,291 Bellevue University 6,808 7,792 8,278 10,407 10,407 10,304 Bryan College of Health Sciences 381 397 493 500 528 636 Clarkson College 789 788 820 934 980 1,114 College of Saint Mary 960 973 953 1,120 1,070 1,063 Concordia University-Seward 1,251 1,279 1,344 1,717 2,146 2,196 Creighton University 6,981 6,992 7,051 7,385 7,662 7,730 Dana College 602 634 546 596 - - Doane University-Arts & Sciences 922 921 894 964 1,045 1,068 Doane University-Graduate and Professional Studies 1,560 1,649 1,651 1,674 1,698 1,633
Grace University 410 431 433 490 481 459 Hastings College 1,137 1,138 1,153 1,154 1,193 1,240 Little Priest Tribal College 95 120 116 141 148 172 Midland University 932 827 803 716 1,117 1,030 Nebraska Christian College of Hope International University 159 101 164 123 141 131
Nebraska Indian Community College 115 89 92 129 177 163 Nebraska Methodist College of Nursing & Allied Health 587 592 589 672 765 847
Nebraska Wesleyan University 2,068 2,107 2,086 2,093 2,138 2,070 Summit Christian College 43 51 41 35 38 39 Union College 956 1,009 914 883 901 886 York College 441 404 396 430 478 510
Nebraska Public and Independent Colleges and Universities 121,568 124,885 128,318 136,183 140,915 139,922
Continued on the next page.
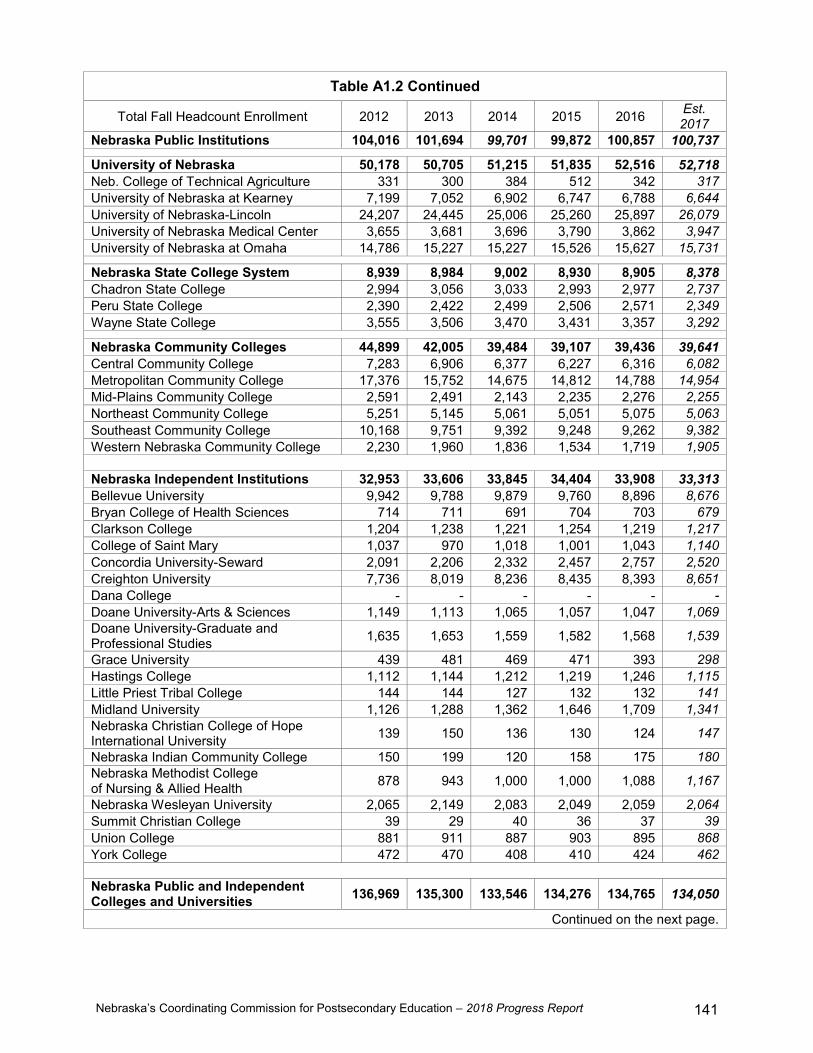
Nebraska’s Coordinating Commission for Postsecondary Education – 2018 Progress Report 141
Table A1.2 Continued
Total Fall Headcount Enrollment 2012 2013 2014 2015 2016 Est. 2017
Nebraska Public Institutions 104,016 101,694 99,701 99,872 100,857 100,737
University of Nebraska 50,178 50,705 51,215 51,835 52,516 52,718 Neb. College of Technical Agriculture 331 300 384 512 342 317 University of Nebraska at Kearney 7,199 7,052 6,902 6,747 6,788 6,644 University of Nebraska-Lincoln 24,207 24,445 25,006 25,260 25,897 26,079 University of Nebraska Medical Center 3,655 3,681 3,696 3,790 3,862 3,947 University of Nebraska at Omaha 14,786 15,227 15,227 15,526 15,627 15,731
Nebraska State College System 8,939 8,984 9,002 8,930 8,905 8,378 Chadron State College 2,994 3,056 3,033 2,993 2,977 2,737 Peru State College 2,390 2,422 2,499 2,506 2,571 2,349 Wayne State College 3,555 3,506 3,470 3,431 3,357 3,292
Nebraska Community Colleges 44,899 42,005 39,484 39,107 39,436 39,641 Central Community College 7,283 6,906 6,377 6,227 6,316 6,082 Metropolitan Community College 17,376 15,752 14,675 14,812 14,788 14,954 Mid-Plains Community College 2,591 2,491 2,143 2,235 2,276 2,255 Northeast Community College 5,251 5,145 5,061 5,051 5,075 5,063 Southeast Community College 10,168 9,751 9,392 9,248 9,262 9,382 Western Nebraska Community College 2,230 1,960 1,836 1,534 1,719 1,905
Nebraska Independent Institutions 32,953 33,606 33,845 34,404 33,908 33,313 Bellevue University 9,942 9,788 9,879 9,760 8,896 8,676 Bryan College of Health Sciences 714 711 691 704 703 679 Clarkson College 1,204 1,238 1,221 1,254 1,219 1,217 College of Saint Mary 1,037 970 1,018 1,001 1,043 1,140 Concordia University-Seward 2,091 2,206 2,332 2,457 2,757 2,520 Creighton University 7,736 8,019 8,236 8,435 8,393 8,651 Dana College - - - - - - Doane University-Arts & Sciences 1,149 1,113 1,065 1,057 1,047 1,069 Doane University-Graduate and Professional Studies 1,635 1,653 1,559 1,582 1,568 1,539
Grace University 439 481 469 471 393 298 Hastings College 1,112 1,144 1,212 1,219 1,246 1,115 Little Priest Tribal College 144 144 127 132 132 141 Midland University 1,126 1,288 1,362 1,646 1,709 1,341 Nebraska Christian College of Hope International University 139 150 136 130 124 147
Nebraska Indian Community College 150 199 120 158 175 180 Nebraska Methodist College of Nursing & Allied Health 878 943 1,000 1,000 1,088 1,167
Nebraska Wesleyan University 2,065 2,149 2,083 2,049 2,059 2,064 Summit Christian College 39 29 40 36 37 39 Union College 881 911 887 903 895 868 York College 472 470 408 410 424 462
Nebraska Public and Independent Colleges and Universities 136,969 135,300 133,546 134,276 134,765 134,050
Continued on the next page.

Nebraska’s Coordinating Commission for Postsecondary Education – 2018 Progress Report 142
Table A1.2 Continued
Total Fall Headcount Enrollment
1-Year Change 15-16
Est. 1-Year Change 16-17
10-Year Change 06-16
Est. 11-Year Change 06-17
Nebraska Public Institutions 1.0% -0.1% 6.9% 6.7%
University of Nebraska 1.3% 0.4% 14.6% 15.1% Neb. College of Technical Agriculture -33.2% -7.3% 25.7% 16.5% University of Nebraska at Kearney 0.6% -2.1% 4.9% 2.7% University of Nebraska-Lincoln 2.5% 0.7% 17.1% 18.0% University of Nebraska Medical Center 1.9% 2.2% 25.9% 28.7% University of Nebraska at Omaha 0.7% 0.7% 12.4% 13.1%
Nebraska State College System -0.3% -5.9% 9.8% 3.3% Chadron State College -0.5% -8.1% 15.5% 6.2% Peru State College 2.6% -8.6% 21.0% 10.6% Wayne State College -2.2% -1.9% -1.5% -3.4%
Nebraska Community Colleges 0.8% 0.5% -2.5% -2.0% Central Community College 1.4% -3.7% -3.5% -7.0% Metropolitan Community College -0.2% 1.1% 4.9% 6.1% Mid-Plains Community College 1.8% -0.9% -24.9% -25.6% Northeast Community College 0.5% -0.2% -3.5% -3.8% Southeast Community College 0.2% 1.3% -3.5% -2.2% Western Nebraska Community College 12.1% 10.8% -10.4% -0.7%
Nebraska Independent Institutions -1.4% -1.8% 24.7% 22.5% Bellevue University -8.9% -2.5% 30.7% 27.4% Bryan College of Health Sciences -0.1% -3.4% 84.5% 78.2% Clarkson College -2.8% -0.2% 54.5% 54.2% College of Saint Mary 4.2% 9.3% 8.6% 18.8% Concordia University-Seward 12.2% -8.6% 120.4% 101.4% Creighton University -0.5% 3.1% 20.2% 23.9% Dana College - - - - Doane University-Arts & Sciences -0.9% 2.1% 13.6% 15.9% Doane University-Graduate and Professional Studies -0.9% -1.8% 0.5% -1.3%
Grace University -16.6% -24.2% -4.1% -27.3% Hastings College 2.2% -10.5% 9.6% -1.9% Little Priest Tribal College 0.0% 6.8% 38.9% 48.4% Midland University 3.8% -21.5% 83.4% 43.9% Nebraska Christian College of Hope International University -4.6% 18.5% -22.0% -7.5%
Nebraska Indian Community College 10.8% 2.9% 52.2% 56.5% Nebraska Methodist College of Nursing & Allied Health 8.8% 7.3% 85.3% 98.8%
Nebraska Wesleyan University 0.5% 0.2% -0.4% -0.2% Summit Christian College 2.8% 5.4% -14.0% -9.3% Union College -0.9% -3.0% -6.4% -9.2% York College 3.4% 9.0% -3.9% 4.8%
Nebraska Public and Independent Colleges and Universities 0.4% -0.5% 10.9% 10.3%
Continued on the next page.

Nebraska’s Coordinating Commission for Postsecondary Education – 2018 Progress Report 143
Table A1.2 Continued
Total Fall Headcount Enrollment 2006 2007 2008 2009 2010 2011
For-Profit/Career Schools 3975 3653 3,392 4,587 4,978 4,037 Capitol School of Hairstyling and Esthetics 89 98 90 121 104 131
CHI Health School of Radiologic Technology 26 23 22 22 22 19
College of Hair Design 136 203 230 160 220 130 College of Hair Design-East Campus - - - 92 154 169 Fullen School of Hair Design 12 23 34 40 40 43 ITT Technical Institute-Omaha 441 490 532 617 732 735 Joseph's College Cosmetology 317 302 365 353 303 264 Kaplan University-Lincoln Campus 826 522 429 644 690 469 Kaplan University-Omaha Campus 788 631 660 1,071 1,059 721 La'James International College 90 88 49 51 47 40 Mary Lanning Memorial Hospital School of Radiologic Technologya 20 19 20 19 20 -
Myotherapy Institute 43 35 29 26 45 38 National American University-Bellevue - - - - - - Omaha School of Massage and Healthcare of Herzing University 88 122 145 104 236 179
Paul Mitchell the School Lincoln - - - - - - Regional West Medical Center School of Radiologic Technology 12 11 10 9 10 8
The Creative Center 101 107 118 127 114 119 Universal College of Healing Arts 96 100 55 61 55 46 University of Phoenix-Omaha Campus 115 127 60 36 76 79 Vatterott College 2 - - - - - Vatterott College-Spring Valley 563 509 276 748 766 587 Xenon International Academy-Omaha 210 243 268 286 285 260
Nebraska State Total 125,543 128,538 131,710 140,770 145,893 143,959
Continued on the next page.
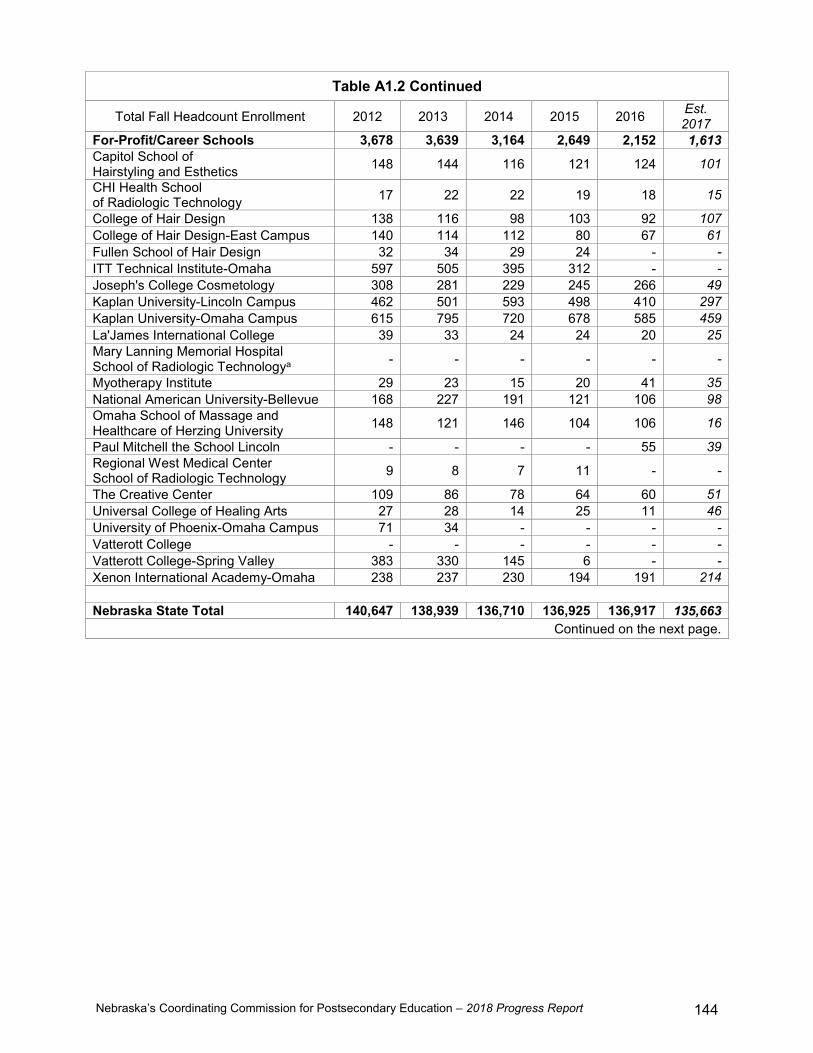
Nebraska’s Coordinating Commission for Postsecondary Education – 2018 Progress Report 144
Table A1.2 Continued
Total Fall Headcount Enrollment 2012 2013 2014 2015 2016 Est. 2017
For-Profit/Career Schools 3,678 3,639 3,164 2,649 2,152 1,613 Capitol School of Hairstyling and Esthetics 148 144 116 121 124 101
CHI Health School of Radiologic Technology 17 22 22 19 18 15
College of Hair Design 138 116 98 103 92 107 College of Hair Design-East Campus 140 114 112 80 67 61 Fullen School of Hair Design 32 34 29 24 - - ITT Technical Institute-Omaha 597 505 395 312 - - Joseph's College Cosmetology 308 281 229 245 266 49 Kaplan University-Lincoln Campus 462 501 593 498 410 297 Kaplan University-Omaha Campus 615 795 720 678 585 459 La'James International College 39 33 24 24 20 25 Mary Lanning Memorial Hospital School of Radiologic Technologya - - - - - -
Myotherapy Institute 29 23 15 20 41 35 National American University-Bellevue 168 227 191 121 106 98 Omaha School of Massage and Healthcare of Herzing University 148 121 146 104 106 16
Paul Mitchell the School Lincoln - - - - 55 39 Regional West Medical Center School of Radiologic Technology 9 8 7 11 - -
The Creative Center 109 86 78 64 60 51 Universal College of Healing Arts 27 28 14 25 11 46 University of Phoenix-Omaha Campus 71 34 - - - - Vatterott College - - - - - - Vatterott College-Spring Valley 383 330 145 6 - - Xenon International Academy-Omaha 238 237 230 194 191 214
Nebraska State Total 140,647 138,939 136,710 136,925 136,917 135,663
Continued on the next page.

Nebraska’s Coordinating Commission for Postsecondary Education – 2018 Progress Report 145
Table A1.2 Continued
Total Fall Headcount Enrollment
1-Year Change 15-16
Est. 1-Year Change 16-17
10-Year Change 06-16
Est. 11-Year Change 06-17
For-Profit/Career Schools -18.8% -25.0% -45.9% -59.4% Capitol School of Hairstyling and Esthetics 2.5% -18.5% 39.3% 13.5%
CHI Health School of Radiologic Technology -5.3% -16.7% -30.8% -42.3%
College of Hair Design -10.7% 16.3% -32.4% -21.3% College of Hair Design-East Campus -16.3% -9.0% Fullen School of Hair Design - - - - ITT Technical Institute-Omaha - - - - Joseph's College Cosmetology 8.6% -81.6% -16.1% -84.5% Kaplan University-Lincoln Campus -17.7% -27.6% -50.4% -64.0% Kaplan University-Omaha Campus -13.7% -21.5% -25.8% -41.8% La'James International College -16.7% 25.0% -77.8% -72.2% Mary Lanning Memorial Hospital School of Radiologic Technologya - - - -
Myotherapy Institute 105.0% -14.6% -4.7% -18.6% National American University-Bellevue -12.4% -7.5% Omaha School of Massage and Healthcare of Herzing University 1.9% -84.9% 20.5% -81.8%
Paul Mitchell the School Lincoln - -29.1% - - Regional West Medical Center School of Radiologic Technology - - - -
The Creative Center -6.3% -15.0% -40.6% -49.5% Universal College of Healing Arts -56.0% 318.2% -88.5% -52.1% University of Phoenix-Omaha Campus - - - - Vatterott College - - - - Vatterott College-Spring Valley - - - - Xenon International Academy-Omaha -1.5% 91.6% -9.0% 74.3%
Nebraska State Total 0.0% -0.9% 9.1% 8.1% Data sources: For 2006 through 2016 data, National Center for Education Statistics, IPEDS fall 2006 through fall 2016 surveys. Preliminary enrollments for fall 2017 were collected from each institution by the Coordinating Commission for Postsecondary Education, December 2017. a Beginning in 2011, Mary Lanning Memorial Hospital School of Radiologic Technology reports enrollment through the University of Nebraska at Kearney.

Nebraska’s Coordinating Commission for Postsecondary Education – 2018 Progress Report 146
Table A1.3 Nebraska 12-Month Unduplicated Headcount Enrollment by Sector
2006-2007 through 2016-2017
Academic Year
University of
Nebraska
Nebraska State College
System
Nebraska Community
Colleges
Independent Colleges & Universities
For-Profit/ Career Schools
Nebraska State Total
2006-2007 53,591 10,807 82,708 39,555 6,443 193,104
2007-2008 54,725 11,020 85,610 41,857 6,161 199,373
2008-2009 55,418 11,039 86,335 42,074 6,262 201,128
2009-2010 56,737 11,250 88,865 43,494 7,249 207,595
2010-2011 57,450 11,540 87,335 43,915 7,107 207,347
2011-2012 57,913 11,397 85,780 43,023 6,440 204,553
2012-2013 57,626 11,520 84,583 42,438 6,191 202,358
2013-2014 58,373 11,584 78,308 42,955 5,790 197,010
2014-2015 58,708 11,537 69,560 43,388 4,833 188,026
2015-2016 59,217 11,622 64,268 44,523 3,698 183,328
2016-2017 59,963 11,339 62,113 43,002 3,192 179,609 Data source: National Center for Education Statistics, IPEDS 2007 through 2017 surveys.

Nebraska’s Coordinating Commission for Postsecondary Education – 2018 Progress Report 147
Table A1.4 Nebraska First-Time Freshmen Enrollment by Sector
Fall 2006 through Fall 2017 Part A: Full-Time, First-Time Freshmen
Number of Students 2006 2007 2008 2009 2010 2011
University of Nebraska 6,626 6,861 7,058 6,804 7,011 6,909 Nebraska State College System 1,164 1,261 1,265 1,296 1,304 1,240 Nebraska Community Colleges 4,175 4,668 4,540 5,127 5,192 4,747 Independent Colleges and Universities 3,278 3,336 3,153 3,238 3,221 3,151
For-Profit/Career Schools 1,095 1,203 751 908 825 516 Nebraska Total 16,338 17,329 16,767 17,373 17,553 16,563 % of Total Freshmen Enrolled 89.3% 91.1% 90.9% 90.1% 89.3% 89.6%
Number of Students 2012 2013 2014 2015 2016 Est. 2017
University of Nebraska 6,785 7,267 7,478 7,570 7,935 7,902 Nebraska State College System 1,286 1,420 1,399 1,292 1,217 1,228 Nebraska Community Colleges 4,789 4,475 4,235 3,946 4,183 4,018 Independent Colleges and Universities 3,126 3,383 3,295 3,451 3,303 3,490
For-Profit/Career Schools 414 476 372 286 286 324 Nebraska Total 16,400 17,021 16,779 16,545 16,924 16,962 % of Total Freshmen Enrolled 89.1% 89.5% 90.3% 90.4% 90.8% 89.6%
Percentage Changes 1-Year Change 15-16
Est. 1-Year Change 16-17
10-Year Change 06-16
Est. 11-Year Change 06-17
University of Nebraska 4.8% -0.4% 19.8% 19.3% Nebraska State College System -5.8% 0.9% 4.6% 5.5% Nebraska Community Colleges 6.0% -3.9% 0.2% -3.8% Independent Colleges and Universities -4.3% 5.7% 0.8% 6.5%
For-Profit/Career Schools 0.0% 13.3% -73.9% -70.4% Nebraska Total 2.3% 0.2% 3.6% 3.8%
Continued on the next page.

Nebraska’s Coordinating Commission for Postsecondary Education – 2018 Progress Report 148
Table A1.4 Continued
Part B: Part-Time, First-Time Freshmen
Number of Students 2006 2007 2008 2009 2010 2011
University of Nebraska 144 141 95 94 112 129 Nebraska State College System 29 21 27 28 23 20 Nebraska Community Colleges 1,592 1,374 1,293 1,462 1,607 1,515 Independent Colleges and Universities 99 66 187 149 154 193
For-Profit/Career Schools 92 94 76 170 201 67 Nebraska Total 1,956 1,696 1,678 1,903 2,097 1,924 % of Total Freshmen Enrolled 10.7% 8.9% 9.1% 9.9% 10.7% 10.4%
Number of Students 2012 2013 2014 2015 2016 Est. 2017
University of Nebraska 145 134 125 147 107 110 Nebraska State College System 27 12 20 17 12 9 Nebraska Community Colleges 1,565 1,669 1,574 1,538 1,506 1,738 Independent Colleges and Universities 195 83 37 28 41 52
For-Profit/Career Schools 80 103 51 29 55 65 Nebraska Total 2,012 2,001 1,807 1,759 1,721 1,974 % of Total Freshmen Enrolled 10.9% 10.5% 9.7% 9.6% 9.2% 10.4%
Percentage Changes 1-Year Change 15-16
Est. 1-Year Change 16-17
10-Year Change 06-16
Est. 11-Year Change 06-17
University of Nebraska -27.2% 2.8% -25.7% -23.6% Nebraska State College System -29.4% -25.0% -58.6% -69.0% Nebraska Community Colleges -2.1% 15.4% -5.4% 9.2% Independent Colleges and Universities 46.4% 26.8% -58.6% -47.5%
For-Profit/Career Schools 89.7% 18.2% -40.2% -29.3% Nebraska Total -2.2% 14.7% -12.0% 0.9%
Continued on the next page.
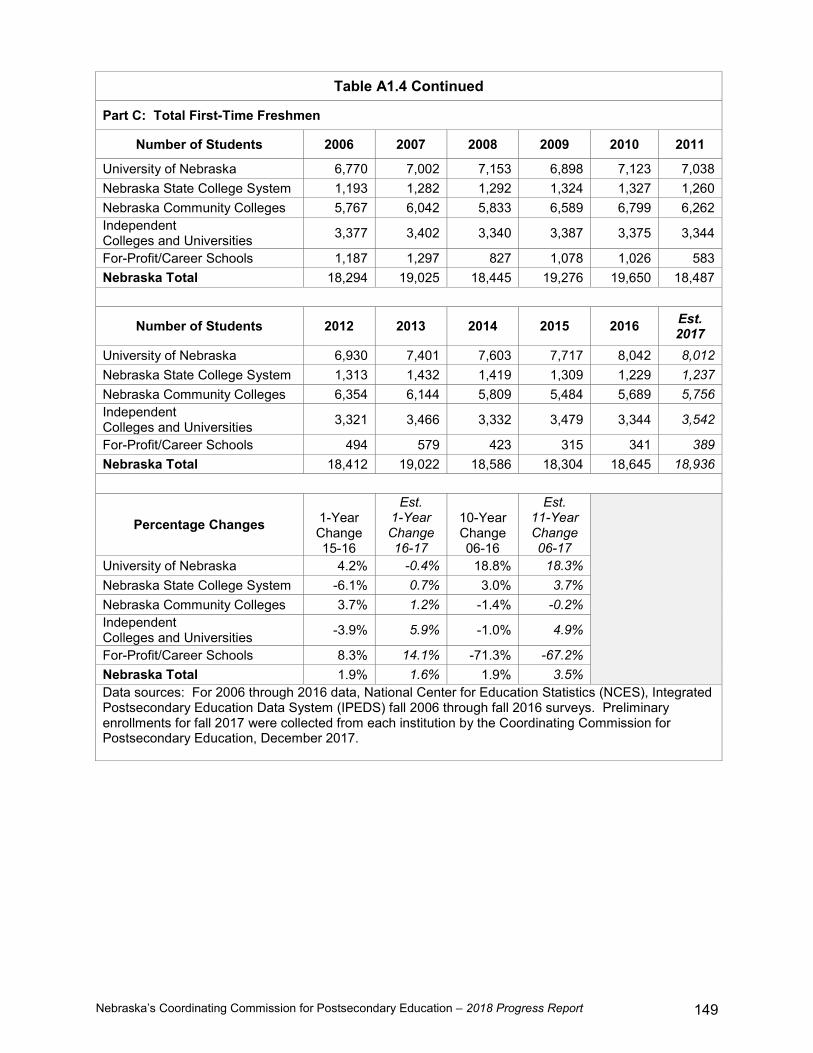
Nebraska’s Coordinating Commission for Postsecondary Education – 2018 Progress Report 149
Table A1.4 Continued
Part C: Total First-Time Freshmen
Number of Students 2006 2007 2008 2009 2010 2011
University of Nebraska 6,770 7,002 7,153 6,898 7,123 7,038 Nebraska State College System 1,193 1,282 1,292 1,324 1,327 1,260 Nebraska Community Colleges 5,767 6,042 5,833 6,589 6,799 6,262 Independent Colleges and Universities 3,377 3,402 3,340 3,387 3,375 3,344
For-Profit/Career Schools 1,187 1,297 827 1,078 1,026 583 Nebraska Total 18,294 19,025 18,445 19,276 19,650 18,487
Number of Students 2012 2013 2014 2015 2016 Est. 2017
University of Nebraska 6,930 7,401 7,603 7,717 8,042 8,012 Nebraska State College System 1,313 1,432 1,419 1,309 1,229 1,237 Nebraska Community Colleges 6,354 6,144 5,809 5,484 5,689 5,756 Independent Colleges and Universities 3,321 3,466 3,332 3,479 3,344 3,542
For-Profit/Career Schools 494 579 423 315 341 389 Nebraska Total 18,412 19,022 18,586 18,304 18,645 18,936
Percentage Changes 1-Year Change 15-16
Est. 1-Year Change 16-17
10-Year Change 06-16
Est. 11-Year Change 06-17
University of Nebraska 4.2% -0.4% 18.8% 18.3% Nebraska State College System -6.1% 0.7% 3.0% 3.7% Nebraska Community Colleges 3.7% 1.2% -1.4% -0.2% Independent Colleges and Universities -3.9% 5.9% -1.0% 4.9%
For-Profit/Career Schools 8.3% 14.1% -71.3% -67.2% Nebraska Total 1.9% 1.6% 1.9% 3.5% Data sources: For 2006 through 2016 data, National Center for Education Statistics (NCES), Integrated Postsecondary Education Data System (IPEDS) fall 2006 through fall 2016 surveys. Preliminary enrollments for fall 2017 were collected from each institution by the Coordinating Commission for Postsecondary Education, December 2017.

Nebraska’s Coordinating Commission for Postsecondary Education – 2018 Progress Report 150
This page left blank intentionally.

Nebraska’s Coordinating Commission for Postsecondary Education – 2018 Progress Report 151
Appendix 2
Actual and Projected Numbers of Nebraska High School Graduates
Table A2.1 Numbers of Nebraska High School Graduates
2006-2007 through 2016-2017
School Year
Type of School/Agency Total Number of
Graduates One-Year % Change
Public Schools
Nonpublic Schools
ESU & SO
06-07 18,951 2,186 104 21,241 0.3% 07-08 19,987 2,158 40 22,185 4.4% 08-09 19,401 2,121 96 21,618 - 2.6% 09-10 19,293 2,143 77 21,513 - 0.5% 10-11 20,313 2,205 119 22,637 5.2% 11-12 20,379 2,192 107 22,678 0.2% 12-13 20,326 2,197 118 22,641 - 0.2% 13-14 20,359 2,557 88 23,004 1.6% 14-15 20,281 2,544 87 22,912 -0.4% 15-16 20,562 2,173 210 22,945 -0.3% 16-17 20,730 2,537 118 23,385 2.1%
Note. Graduates do not include GED recipients or completers who did not receive regular diplomas. ESU = Educational service units; SO = State-operated schools. Data source: Nebraska Department of Education, January 2009 (2006-07 data), February 2010 (2007-08 data), February 2011 (2008-09 and 2009-10 data), February 2012 (2010-11 data), December 2012 (2011-12 data), January 2014 (2012-13 data), January 2015 (2013-14 data), January 2016 (2014-15 data), December 2016 (2015-16 data), and December 2017 (2016-17 data).

Nebraska’s Coordinating Commission for Postsecondary Education – 2018 Progress Report 152
Table A2.2 Actual and Projected Numbers of Nebraska High School Graduates
2006-2007 through 2026-2027
Academic Year
Public by Race/Ethnicity
Public Total
Non Public Total Total
White non-
Hispanic
Asian/ Pacific
Islander Hispanic Native
American
Black non-
Hispanic
Race/ Ethnicity
Total Actual
06-07 16,354 330 1,172 196 899 18,951 18,951 2,186 21,137
07-08 16,930 355 1,430 225 1,047 19,987 19,987 2,158 22,145
08-09 16,203 328 1,609 222 1,039 19,401 19,401 2,121 21,522
09-10 15,878 351 1,801 186 1,077 19,293 19,293 2,143 21,436
10-11 15,779 380 2,351 237 1,074 19,821 20,313 2,205 22,518
11-12 15,399 451 2,516 265 1,223 19,854 20,379 2,192 22,571
12-13 15,268 408 2,654 227 1,233 19,790 20,326 2,197 22,523
13-14 14,964 507 2,907 211 1,179 19,768 20,359 2,557 22,916
14-15 14,817 503 3,026 228 1,112 19,686 20,281 2,544 22,825
15-16 15,007 484 3,082 211 1,206 20,000 20,562 2,173 22,735
16-17 14,770 573 3,334 240 1,187 20,104 20,730 2,537 23,267
Projected
16-17 15,250 561 3,191 229 1,034 20,265 20,209 2,334 22,542
17-18 15,703 570 3,562 225 1,217 21,277 21,250 2,377 23,627
18-19 15,760 636 3,729 268 1,232 21,625 21,599 2,402 24,001
19-20 16,001 646 4,053 229 1,133 22,062 21,968 2,304 24,272
20-21 16,101 681 4,131 235 1,149 22,297 22,186 2,356 24,542
21-22 16,433 727 4,295 230 1,142 22,827 22,674 2,426 25,100
22-23 16,209 791 4,416 198 1,204 22,818 22,634 2,370 25,004
23-24 16,285 805 4,695 224 1,225 23,234 23,037 2,456 25,493
24-25 15,526 708 4,364 208 1,085 21,891 21,687 2,463 24,151
25-26 15,901 756 4,893 204 1,228 22,982 22,639 2,468 25,107
26-27 15,874 858 4,925 216 1,245 23,118 22,751 2,465 25,216 Note. Graduates do not include GED recipients or completers who did not receive regular diplomas. The actual and projected public totals do not include graduates from education service units or state-operated schools. Beginning in 2010-2011, the actual race/ethnicity total does not equal the public total because students in the “two or more races” category are not included in the race/ethnicity total. They are, however, included in the public total. (Number of multiracial public high school graduates by year: 2010-11 = 492, 2011-12 = 525, 2012-13 = 536, 2013-14 = 591, 2014-15 = 595, 2015-16 = 562, 2016-17 = 626.) The projected race/ethnicity total does not equal the projected total number of public school graduates, due to differences in the way historical data may have been reported by the state and because graduates for each race/ethnicity were projected independently from the total public projections. The sum of the projected public and nonpublic graduates may not equal the total graduates, and the sum of the projected races may not equal the race/ethnicity total. For 2016-2017, the actual number of public school graduates (20,730) was 2.6% higher than WICHE predicted in their 2016 report (20,209). Data sources: For actual numbers of graduates: Nebraska Department of Education, January 2009 (2006-07 data), February 2010 (2007-08 data), February 2011 (2008-09 and 2009-10 data), February 2012 (2010-11 data), December 2012 (2011-12 data), January 2014 (2012-13 data), January 2015 (2013-14 data), January 2016 (2014-15 data), December 2016 (2015-16 data), December 2017 (2016-17 data). For projected numbers of graduates: Western Interstate Commission for Higher Education, Knocking at the College Door: Projections of High School Graduates, 2016.

Nebraska’s Coordinating Commission for Postsecondary Education – 2018 Progress Report 153
Table A2.3 Actual and Projected Changes in the Numbers and Percentages of
Nebraska Public High School Graduates by Race/Ethnicity: 2006-2007, 2016-17, and 2026-2027
Race/Ethnicity
2006-2007a 2016-2017 Actual %
Change 06-07 to
16-17
2026-2027b Projected %
Change 16-17 to
26-27
Actual No. of Grads
% of Actual Grads
Actual No. of Grads
% of Actual Grads
Projected No. of Grads
% of Projected
Grads White non-Hispanic 16,354 86.3% 14,770 71.2% -9.7% 15,874 68.7% 7.5%
Asian/ Pacific Islander 330 1.7% 573 2.8% 73.6% 858 3.7% 49.7%
Hispanic 1,172 6.2% 3,334 16.1% 184.5% 4,925 21.3% 47.7%
Native American 196 1.0% 240 1.2% 22.4% 216 0.9% -10.0% Black non-Hispanic 899 4.7% 1,187 5.7% 32.0% 1,245 5.4% 4.9%
Two or More Races N/A N/A 626 6.1% N/A N/Ab N/Ab N/Ab
Total for Public High Schools
18,951 20,730 9.4% 23,118 11.5%c
Note. The number of actual graduates and the projected number of graduates do not include graduates of educational service units or state-operated schools. Data source: For actual numbers of graduates: Nebraska Department of Education, January 2009, and December 2017. For projected numbers of graduates: For projected numbers of graduates: Western Interstate Commission for Higher Education, Knocking at the College Door: Projections of High School Graduates, 2016. a Two or more races was not a racial/ethnic category in 2006-07. b WICHE proportionately allocated two or more races data to the “four non-Hispanic race groups (American Indian/Alaska Native, Asian/Pacific Islander, black non-Hispanic, and white non-Hispanic) based on each group’s average share of the combined race total over the three most recent previous years. (Data in the Hispanic category were not part of the apportionment, because Hispanic is considered an ethnicity, not a race.)” (WICHE, page 126.) c Because projections were made independently for the various race/ethnic groups, the total shown here for 2026-27 includes 367 more public high school graduates than the projected total number of public high school graduates. WICHE projects a total of 22,751 individuals will graduate from Nebraska’s public schools in 2026-27. This is a projected increase of 9.7% between 2016-17 and 2026-27.

Nebraska’s Coordinating Commission for Postsecondary Education – 2018 Progress Report 154
This page left blank intentionally.

Nebraska’s Coordinating Commission for Postsecondary Education – 2018 Progress Report 155
Appendix 3
Nebraska High School Graduation Rates
Explanatory Note A3.1 The Cohort Four-Year High School Graduation Rate
Prior to the 2010-2011 school year, the Nebraska Department of Education used the four-year high school graduation rate to measure the proportion of high school students who receive regular diplomas. Beginning with the 2010-2011 school year, the Nebraska Department of Education (NDE) started using the cohort four-year graduation rate or, more simply, the cohort graduation rate, to measure the proportion of Nebraska’s public high school students who receive regular diplomas. The cohort graduation rate is not currently calculated for nonpublic schools in Nebraska. The cohort four-year graduation rate is calculated by dividing the number of students in a cohort who graduate with a regular high school diploma in four years or less by the number of students in the graduation cohort, including students who graduate in the summer following the expected graduation year. A student belongs to a graduation cohort based on school enrollment status. The demographic subgroups for a graduation cohort are determined by data submitted by the school district and reported at the student’s final status. A graduation cohort represents the group of students sharing an expected graduation year. The expected graduation year is determined by adding four years to the school year when the student reaches 9th grade for the first time and remains unchanged. For example, the 2017 graduation cohort is the group of students who entered 9th grade for the first time at the beginning of or during the 2013-2014 school year. The expected graduation year for this cohort was the 2016-2017 school year. A graduation cohort is adjusted by adding any students transferring into the cohort and by subtracting any students who transfer out, emigrate to another country, or die during the four-year cohort period. Only students who earn and receive regular diplomas are counted as completers in calculating the cohort graduation rate. Students who receive certificates of achievement or attendance, alternative awards, or General Education Diplomas (GED) remain in the cohort, but they are not counted as completers for the purposes of calculating the cohort graduate rate. Instead, they remain only in the denominator. The cohort graduation rate is computed using the following formula:
𝐻𝑖𝑔ℎ 𝑠𝑐ℎ𝑜𝑜𝑙 𝑑𝑖𝑝𝑙𝑜𝑚𝑎 𝑟𝑒𝑐𝑖𝑝𝑖𝑒𝑛𝑡𝑠 (𝑌𝑒𝑎𝑟 𝑋)
1𝑠𝑡 𝑡𝑖𝑚𝑒 9𝑡ℎ 𝑔𝑟𝑎𝑑𝑒𝑟𝑠 (𝑌𝑒𝑎𝑟 𝑋 − 4) + 𝑆𝑡𝑢𝑑𝑒𝑛𝑡𝑠 𝑤ℎ𝑜 𝑡𝑟𝑎𝑛𝑠𝑓𝑒𝑟 𝑖𝑛 −(𝑆𝑡𝑢𝑑𝑒𝑛𝑡𝑠 𝑤ℎ𝑜 𝑡𝑟𝑎𝑛𝑠𝑓𝑒𝑟 𝑜𝑢𝑡, 𝑒𝑚𝑖𝑔𝑟𝑎𝑡𝑒 𝑡𝑜 𝑎𝑛𝑜𝑡ℎ𝑒𝑟 𝑐𝑜𝑢𝑛𝑡𝑟𝑦, 𝑜𝑟 𝑑𝑖𝑒)
Continued on the next page.

Nebraska’s Coordinating Commission for Postsecondary Education – 2018 Progress Report 156
Explanatory Note A3.1 (Continued)
The cohort four-year graduation rate is calculated using an entirely different methodology than the four-year graduation rate; therefore, it is not comparable to the four-year graduation rates for previous school years. Consequently, the 2011 cohort four-year graduation rate established a new baseline for future comparisons. Data source: Nebraska Department of Education, 2016-2017 Education Profile for State of Nebraska, Definitions.

Nebraska’s Coordinating Commission for Postsecondary Education – 2018 Progress Report 157
Table A3.1 Cohort Graduation Rates for Nebraska Public High Schools
By Gender, Race/Ethnicity, and Other Student Groups 2010-2011 through 2016-2017
Student Group
Cohort Four-Year Cohort Five-Year Cohort Six-Year
N Grad Rate N
Grad Rate N
Grad Rate
2010-2011
Total Cohort Graduates 19,313 86% 19,957 89% 20,210 90%
Gender Male 9,560 83% 9,979 87% 10,129 88% Female 9,753 89% 9,978 91% 10,081 92%
Race/Ethnicity White non-Hispanic 15,246 90% 15,566 92% 15,701 93% Asian 327 81% 358 88% 364 90% Native Hawaiian/Other Pac. Islander 27 90% 29 97% 29 97% Hispanic 2,113 75% 2,264 79% 2,317 81% Native American 210 61% 236 68% 239 69% Black non-Hispanic 939 67% 1,038 73% 1,086 76% Two or More Races 451 89% 466 91% 474 92%
Other Groups Eligible for Free or Reduced Lunch 5,711 78% 6,087 83% 6,226 85% Special Education Students 1,725 69% 1,874 75% 1,980 80% English Language Learners 485 62% 569 72% 589 75%
2011-2012
Total Cohort Graduates 19,317 88% 19,945 90% 20,136 91%
Gender Male 9,607 85% 9,984 88% 10,100 89% Female 9,710 90% 9,961 92% 10,036 93%
Race/Ethnicity White non-Hispanic 14,849 91% 15,161 93% 15,260 94% Asian 375 84% 400 89% 417 92% Native Hawaiian/Other Pac. Islander 29 85% 30 88% 30 88% Hispanic 2,276 78% 2,430 83% 2,469 84% Native American 232 67% 261 73% 276 77% Black non-Hispanic 1,066 73% 1,148 79% 1,165 80% Two or More Races 490 85% 515 89% 519 90%
Other Groups Eligible for Free or Reduced Lunch 6,150 79% 6,540 86% 6,660 88% Special Education Students 1,824 71% 1,980 79% 2,071 83% English Language Learners 566 64% 643 75% 669 79%
Continued on the next page.

Nebraska’s Coordinating Commission for Postsecondary Education – 2018 Progress Report 158
Table A3.1 (Continued)
Student Group
Cohort Four-Year Cohort Five-Year Cohort Six-Year
N Grad Rate N
Grad Rate N
Grad Rate
2012-2013
Total Cohort Graduates 19,389 88% 19,977 91% 20,222 92%
Gender Male 9,711 86% 10,075 89% 10,218 91% Female 9,678 91% 9,902 93% 10,004 94%
Race/Ethnicity White non-Hispanic 14,772 92% 15,049 94% 15,169 95% Asian 365 77% 408 84% 425 88% Native Hawaiian/Other Pac. Islander 18 100% 19 100% 19 100% Hispanic 2,435 79% 2,579 83% 2,647 85% Native American 194 72% 206 76% 208 77% Black non-Hispanic 1,098 77% 1,182 82% 1,211 84% Two or More Races 507 85% 534 88% 543 90%
Other Groups Eligible for Free or Reduced Lunch 6,388 81% 6,735 87% 6,857 89% Special Education Students 1,820 72% 2,000 80% 2,132 86% English Language Learners 468 60% 557 72% 588 76%
2013-2014
Total Cohort Graduates 19,493 90% 19,987 92% 20,215 93%
Gender Male 9,655 87% 9,960 90% 10,108 91% Female 9,838 92% 10,027 94% 10,107 95%
Race/Ethnicity White non-Hispanic 14,526 93% 14,777 94% 14,893 95% Asian 418 78% 447 83% 481 89% Native Hawaiian/Other Pac. Islander 24 77% 26 84% 27 84% Hispanic 2,695 83% 2,824 87% 2,860 88% Native American 187 69% 204 76% 208 77% Black non-Hispanic 1,085 81% 1,136 84% 1,166 86% Two or More Races 558 87% 573 90% 580 91%
Other Groups Eligible for Free or Reduced Lunch 6,550 82% 6,842 88% 6,967 90% Special Education Students 1,801 72% 1,956 80% 2,069 85% English Language Learners 449 60% 510 70% 550 75%
Continued on the next page.

Nebraska’s Coordinating Commission for Postsecondary Education – 2018 Progress Report 159
Table A3.1 (Continued)
Student Group
Cohort Four-Year Cohort Five-Year Cohort Six-Year
N Grad Rate N
Grad Rate N
Grad Rate
2014-2015
Total Cohort Graduates 19,430 89% 20,036 92% 20,250 92%
Gender Male 9,619 86% 10,008 89% 10,136 90% Female 9,811 92% 10,028 94% 10,114 95%
Race/Ethnicity White non-Hispanic 14,374 93% 14,656 94% 14,775 95% Asian 434 78% 475 86% 502 89% Native Hawaiian/Other Pac. Islander 23 96% 23 96% 23 96% Hispanic 2,804 82% 2,953 86% 2,989 87% Native American 207 76% 215 79% 219 80% Black non-Hispanic 1,020 75% 1,116 83% 1,135 84% Two or More Races 568 84% 598 88% 607 89%
Other Groups Eligible for Free or Reduced Lunch 6,530 81% 6,880 88% 6,994 90% Special Education Students 1,803 71% 1,975 79% 2,087 84% English Language Learners 410 55% 505 68% 541 72%
2015-2016
Total Cohort Graduates 19,668 89% 20,149 91%
Gender Male 9,850 87% 10,153 89% Female 9,818 92% 9,996 94%
Race/Ethnicity White non-Hispanic 14,536 93% 14,776 94% Asian 410 81% 428 83% Native Hawaiian/Other Pac. Islander 27 77% 31 89% Hispanic 2,883 82% 3,022 85% Native American 197 74% 204 77% Black non-Hispanic 1,094 79% 1,152 82% Two or More Races 521 84% 536 87%
Other Groups Eligible for Free or Reduced Lunch 6,631 82% 6,910 87% Special Education Students 1,837 70% 1,992 77% English Language Learners 348 55% 408 63%
Continued on the next page.

Nebraska’s Coordinating Commission for Postsecondary Education – 2018 Progress Report 160
Table A3.1 (Continued)
Student Group
Cohort Four-Year Cohort Five-Year Cohort Six-Year
N Grad Rate N
Grad Rate N
Grad Rate
2016-2017
Total Cohort Graduates 19,931 89%
Gender Male 10,030 87% Female 9,901 92%
Race/Ethnicity White non-Hispanic 14,345 92% Asian 499 82% Native Hawaiian/Other Pac. Islander 35 85% Hispanic 3,130 82% Native American 227 70% Black non-Hispanic 1,100 81% Two or More Races 595 86%
Other Groups Eligible for Free or Reduced Lunch 7,099 82% Special Education Students 1,768 71% English Language Learners 411 50%
Note. Graduates do not include GED recipients or completers who did not receive regular diplomas. Data source: Nebraska Department of Education, 2016-2017 Education Profile for State of Nebraska, Cohort Graduation Data.

Nebraska’s Coordinating Commission for Postsecondary Education – 2018 Progress Report 161
Appendix 4
Nebraska Scores on ACT and SAT Student Assessments
Table A4.1 Percentages of Nebraska High School Graduates Who Took the ACT Assessment and/or SAT Test
2007 through 2017
Year of High School
Graduation
No. of High School Graduates
ACT Assessment SAT Test No. of
Graduates Tested
% of Graduates
Tested
No. of Graduates
Tested
% of Graduates
Tested
2007 21,241 16,137 76.0% 1,325 6.2%
2008 22,185 16,573 74.7% 1,139 5.1%
2009 22,618 16,286 75.3% 1,002 4.6%
2010 21,513 16,172 75.2% 957 4.4%
2011 22,637 16,461 72.7% 980 4.3%
2012 22,678 16,581 73.1% 1,027 4.5%
2013 22,641 17,745 78.4% 827 3.7%
2014 23,004 17,765 77.2% 772 3.4%
2015 22,912 18,347 80.1% 723 3.2%
2016 22,945 18,598 81.1% 604 2.6%
2017 23,385 18,993 81.2% 680 2.9% Note. Numbers are state totals and include graduates from public and nonpublic schools, state-operated schools, and educational service units. Number of graduates tested includes students who were tested any time before graduating from high school. Data sources: For number of high school graduates, Nebraska Department of Education, January 2009 (2007 data), January 2010 (2008 data), January 2011 (2009 and 2010 data), February 2012 (2011 data), December 2012 (2012 data), January 2014 (2013 data), January 2015 (2014 data), January 2016 (2015 data), December 2016 (2016 data), and December 2017 (2017 data); for ACT data, ACT, High School Profile Report - Nebraska, 2007 through 2017; for SAT data, College Board, College-Bound Seniors State Profile Report Nebraska, 2007 through 2016, and SAT Suite of Assessments Annual Report Nebraska, 2017.
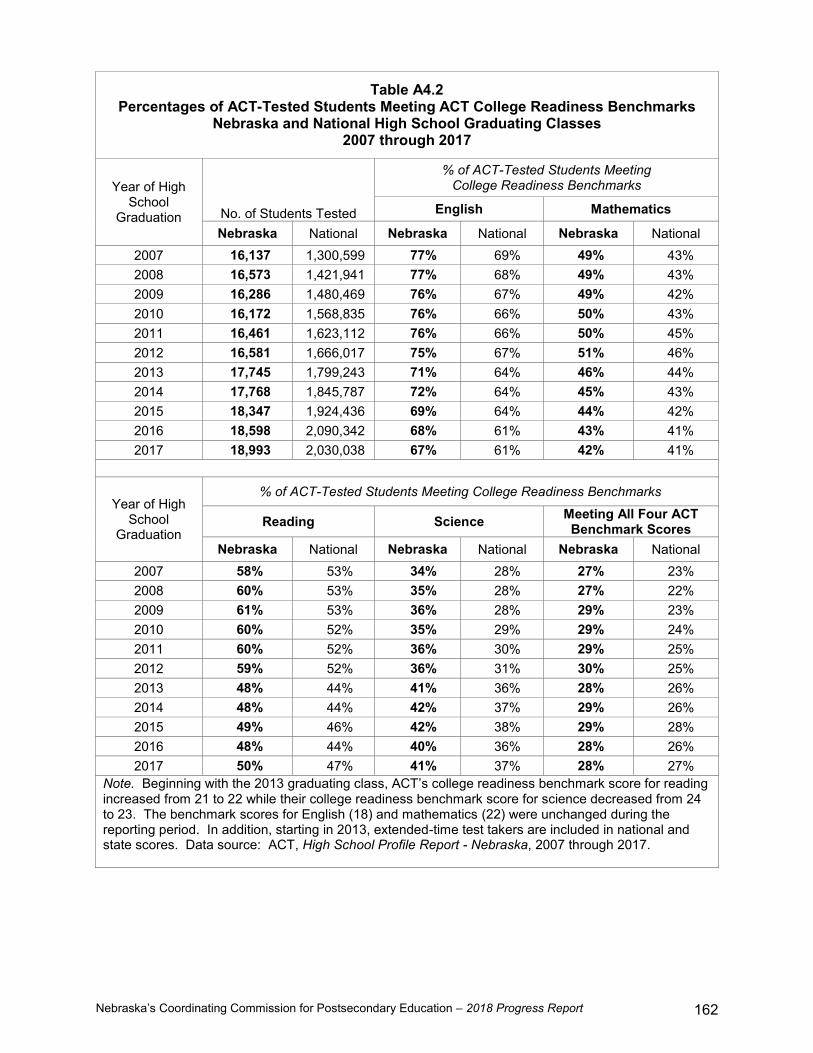
Nebraska’s Coordinating Commission for Postsecondary Education – 2018 Progress Report 162
Table A4.2 Percentages of ACT-Tested Students Meeting ACT College Readiness Benchmarks
Nebraska and National High School Graduating Classes 2007 through 2017
Year of High School
Graduation No. of Students Tested
% of ACT-Tested Students Meeting College Readiness Benchmarks
English Mathematics
Nebraska National Nebraska National Nebraska National 2007 16,137 1,300,599 77% 69% 49% 43% 2008 16,573 1,421,941 77% 68% 49% 43% 2009 16,286 1,480,469 76% 67% 49% 42% 2010 16,172 1,568,835 76% 66% 50% 43% 2011 16,461 1,623,112 76% 66% 50% 45% 2012 16,581 1,666,017 75% 67% 51% 46% 2013 17,745 1,799,243 71% 64% 46% 44% 2014 17,768 1,845,787 72% 64% 45% 43% 2015 18,347 1,924,436 69% 64% 44% 42% 2016 18,598 2,090,342 68% 61% 43% 41% 2017 18,993 2,030,038 67% 61% 42% 41%
Year of High School
Graduation
% of ACT-Tested Students Meeting College Readiness Benchmarks
Reading Science Meeting All Four ACT Benchmark Scores
Nebraska National Nebraska National Nebraska National 2007 58% 53% 34% 28% 27% 23% 2008 60% 53% 35% 28% 27% 22% 2009 61% 53% 36% 28% 29% 23% 2010 60% 52% 35% 29% 29% 24% 2011 60% 52% 36% 30% 29% 25% 2012 59% 52% 36% 31% 30% 25% 2013 48% 44% 41% 36% 28% 26% 2014 48% 44% 42% 37% 29% 26% 2015 49% 46% 42% 38% 29% 28% 2016 48% 44% 40% 36% 28% 26% 2017 50% 47% 41% 37% 28% 27%
Note. Beginning with the 2013 graduating class, ACT’s college readiness benchmark score for reading increased from 21 to 22 while their college readiness benchmark score for science decreased from 24 to 23. The benchmark scores for English (18) and mathematics (22) were unchanged during the reporting period. In addition, starting in 2013, extended-time test takers are included in national and state scores. Data source: ACT, High School Profile Report - Nebraska, 2007 through 2017.

Nebraska’s Coordinating Commission for Postsecondary Education – 2018 Progress Report 163
Table A4.3 Numbers and Percentages of ACT-Tested Students
by High School Curriculum Completed or Planned to Complete Before Graduation 2007 through 2017
Year of High School
Graduation
The Core or More
Less Than the Core
Did Not Report Courses Taken
Total No. of Students
No. of Students
% of Total
No. of Students
% of Total
No. of Students
% of Total
2007 9,539 59% 4,458 28% 2,140 13% 16,137 2008 11,934 72% 3,944 24% 695 4% 16,573 2009 12,701 78% 3,346 21% 239 1% 16,286 2010 12,870 80% 3,053 19% 249 2% 16,172 2011 13,168 80% 3,120 19% 173 1% 16,461 2012 13,515 82% 2,896 17% 170 1% 16,581 2013 13,851 78% 3,372 19% 522 3% 17,745 2014 13,909 78% 3,283 18% 576 3% 17,768 2015 13,943 76% 3,489 19% 915 5% 18,347 2016 13,865 75% 3,480 19% 1,253 7% 18,598 2017 14,384 76% 3,501 18% 1,108 6% 18,993
Note. ACT, Inc. defines the core, college-preparatory high school curriculum (or what is simply called “the core”) as consisting of four years of English and three or more years each of social studies, science, and mathematics (beginning with Algebra I). Data is self-reported by the student. Data source: ACT, High School Profile Report - Nebraska, 2007 through 2017.
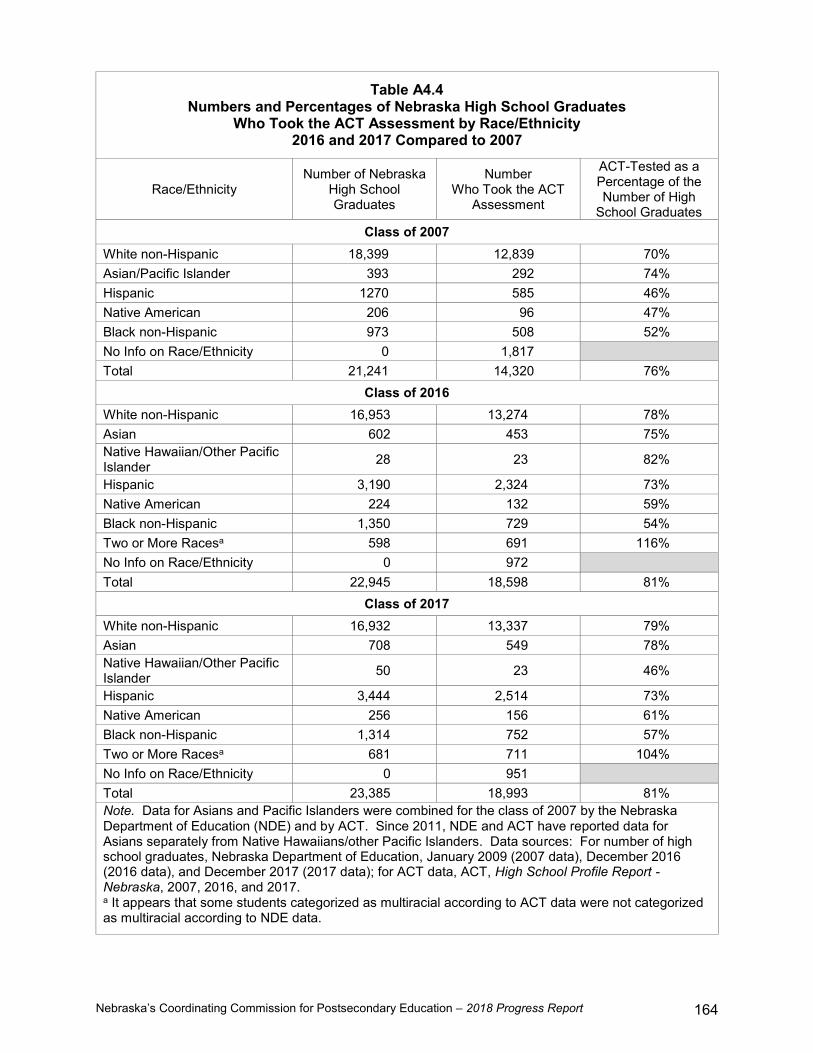
Nebraska’s Coordinating Commission for Postsecondary Education – 2018 Progress Report 164
Table A4.4 Numbers and Percentages of Nebraska High School Graduates
Who Took the ACT Assessment by Race/Ethnicity 2016 and 2017 Compared to 2007
Race/Ethnicity Number of Nebraska
High School Graduates
Number Who Took the ACT
Assessment
ACT-Tested as a Percentage of the Number of High
School Graduates Class of 2007
White non-Hispanic 18,399 12,839 70% Asian/Pacific Islander 393 292 74% Hispanic 1270 585 46% Native American 206 96 47% Black non-Hispanic 973 508 52% No Info on Race/Ethnicity 0 1,817 Total 21,241 14,320 76%
Class of 2016 White non-Hispanic 16,953 13,274 78% Asian 602 453 75% Native Hawaiian/Other Pacific Islander 28 23 82%
Hispanic 3,190 2,324 73% Native American 224 132 59% Black non-Hispanic 1,350 729 54% Two or More Racesa 598 691 116% No Info on Race/Ethnicity 0 972 Total 22,945 18,598 81%
Class of 2017 White non-Hispanic 16,932 13,337 79% Asian 708 549 78% Native Hawaiian/Other Pacific Islander 50 23 46%
Hispanic 3,444 2,514 73% Native American 256 156 61% Black non-Hispanic 1,314 752 57% Two or More Racesa 681 711 104% No Info on Race/Ethnicity 0 951 Total 23,385 18,993 81% Note. Data for Asians and Pacific Islanders were combined for the class of 2007 by the Nebraska Department of Education (NDE) and by ACT. Since 2011, NDE and ACT have reported data for Asians separately from Native Hawaiians/other Pacific Islanders. Data sources: For number of high school graduates, Nebraska Department of Education, January 2009 (2007 data), December 2016 (2016 data), and December 2017 (2017 data); for ACT data, ACT, High School Profile Report - Nebraska, 2007, 2016, and 2017. a It appears that some students categorized as multiracial according to ACT data were not categorized as multiracial according to NDE data.

Nebraska’s Coordinating Commission for Postsecondary Education – 2018 Progress Report 165
Appendix 5
Nebraska College Continuation Rates
Table A5.1 College Continuation Rates for Nebraska High School Graduates Who Attended
Degree-Granting and Non-Degree-Granting Institutions in the United States in the Fall Term Following High School Graduation
Fall 2006 through Fall 2016
Year of HS Graduation
No. of HS
Graduates
Fall IPEDS Survey
No. of FTF with Nebraska Residency Who Graduated from HS During the
Past 12 Months and Attended Degree-Granting and Non-Degree-
Granting Institutions
College Continuation Rate
2005-2006 21,188 2006 14,352 67.7%
2007-2008 22,185 2008 14,737 66.4%
2009-2010 21,513 2010 15,100 70.2%
2011-2012 22,678 2012 14,920 65.8%
2013-2014 23,004 2014 14,283 62.1%
2015-2016 22,945 2016 14,834 64.7%
Change Since: 2005-06 (HS) & Fall 2006 (FTF)
8.3% (HS) 3.4%
(FTF)
Note. High school graduates include graduates of public schools, nonpublic (private) schools, educational service units, and state-operated schools. Graduates do not include GED recipients or completers who did not receive regular diplomas. First-time freshmen include both full-time and part-time students. FTF = first-time freshmen. HS = high school. Continuation rate = the number of first-time freshmen who graduated from high school within the past 12 months and enrolled at degree-granting or non-degree-granting institutions in the fall term following high school graduation divided by the total number of high school graduates. First-time freshmen enrolled in the fall term who attended college for the first time in the prior summer term are also included. Nebraskans who have delayed going to college are not included in the calculation of Nebraska’s college continuation rate because there is no way of determining from IPEDS data when they received their high school diplomas. Data sources: For high school data, Nebraska Department of Education, January 2007 (2005-06 data), January 2009 (2007-08 data), February 2011 (2009-10 data), December 2013 (2011-12 data), January 2015 (2013-14 data), December 2016 (2015-16 data); for first-time freshmen data, National Center for Education Statistics, IPEDS fall 2006, 2008, 2010, 2012, 2014, and 2016 surveys.
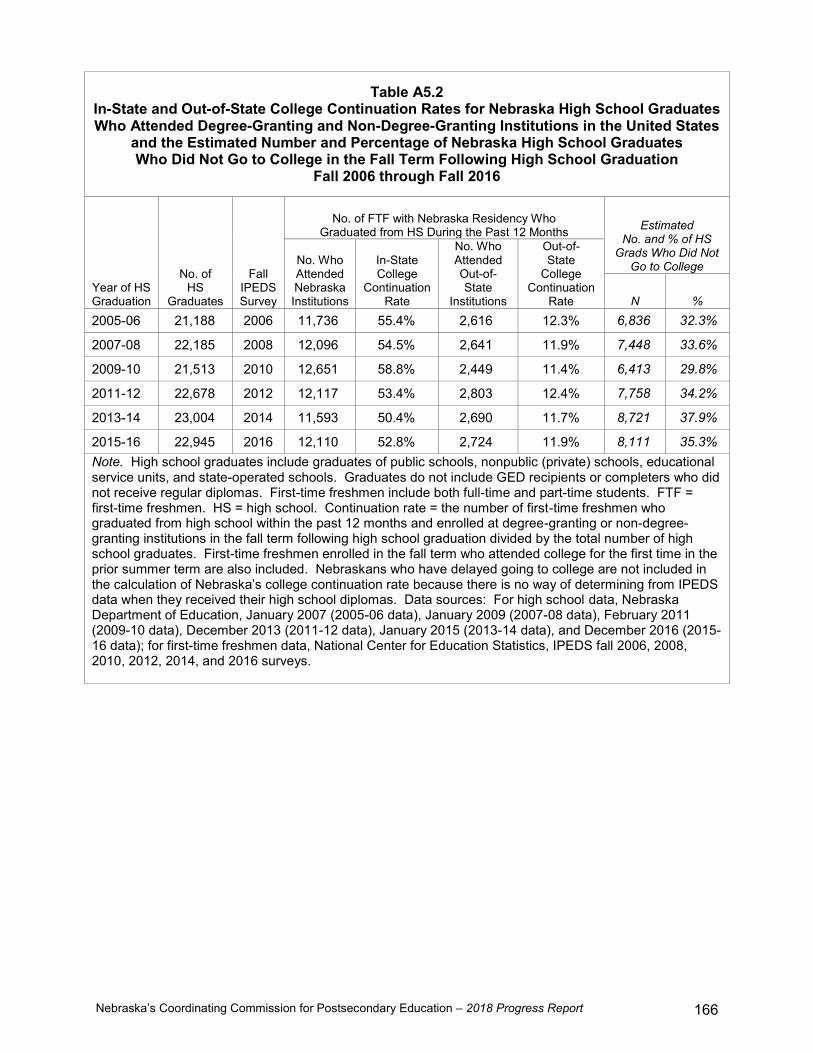
Nebraska’s Coordinating Commission for Postsecondary Education – 2018 Progress Report 166
Table A5.2 In-State and Out-of-State College Continuation Rates for Nebraska High School Graduates Who Attended Degree-Granting and Non-Degree-Granting Institutions in the United States
and the Estimated Number and Percentage of Nebraska High School Graduates Who Did Not Go to College in the Fall Term Following High School Graduation
Fall 2006 through Fall 2016
Year of HS Graduation
No. of HS
Graduates
Fall IPEDS Survey
No. of FTF with Nebraska Residency Who Graduated from HS During the Past 12 Months Estimated
No. and % of HS Grads Who Did Not
Go to College No. Who Attended Nebraska Institutions
In-State College
Continuation Rate
No. Who Attended Out-of-State
Institutions
Out-of- State
College Continuation
Rate N %
2005-06 21,188 2006 11,736 55.4% 2,616 12.3% 6,836 32.3%
2007-08 22,185 2008 12,096 54.5% 2,641 11.9% 7,448 33.6%
2009-10 21,513 2010 12,651 58.8% 2,449 11.4% 6,413 29.8%
2011-12 22,678 2012 12,117 53.4% 2,803 12.4% 7,758 34.2%
2013-14 23,004 2014 11,593 50.4% 2,690 11.7% 8,721 37.9%
2015-16 22,945 2016 12,110 52.8% 2,724 11.9% 8,111 35.3% Note. High school graduates include graduates of public schools, nonpublic (private) schools, educational service units, and state-operated schools. Graduates do not include GED recipients or completers who did not receive regular diplomas. First-time freshmen include both full-time and part-time students. FTF = first-time freshmen. HS = high school. Continuation rate = the number of first-time freshmen who graduated from high school within the past 12 months and enrolled at degree-granting or non-degree-granting institutions in the fall term following high school graduation divided by the total number of high school graduates. First-time freshmen enrolled in the fall term who attended college for the first time in the prior summer term are also included. Nebraskans who have delayed going to college are not included in the calculation of Nebraska’s college continuation rate because there is no way of determining from IPEDS data when they received their high school diplomas. Data sources: For high school data, Nebraska Department of Education, January 2007 (2005-06 data), January 2009 (2007-08 data), February 2011 (2009-10 data), December 2013 (2011-12 data), January 2015 (2013-14 data), and December 2016 (2015-16 data); for first-time freshmen data, National Center for Education Statistics, IPEDS fall 2006, 2008, 2010, 2012, 2014, and 2016 surveys.

Nebraska’s Coordinating Commission for Postsecondary Education – 2018 Progress Report 167
Table A5.3 Percentages of First-Time Freshmen with Nebraska Residency Who Attended
Nebraska and Out-of-State, Degree-Granting and Non-Degree-Granting Institutions in the Fall Term Following High School Graduation by Type of Institution
Fall 2016 Compared to Fall 2006
Type of Postsecondary Institution Attended
No. and % of FTF with Nebraska Residency Who Attended Nebraska Institutions
Fall 2006 Fall 2016 N % N %
Private For-Profit 287 2.4% 128 1.1%
Private Not-For-Profit 1,770 15.1% 1,544 12.7%
Subtotal 2,057 17.5% 1,672 13.8%
Public, 2-Year 3,426 29.2% 3,742 30.9%
Public, 4-Year 6,253 53.3% 6,696 55.3%
Subtotal 9,679 82.5% 10,438 86.2%
Total to Nebraska Institutions 11,736 100.0% 12,110 100.0%
Type of Postsecondary Institution Attended
No. and % of FTF with Nebraska Residency Who Attended Out-of-State Institutions
Fall 2006 Fall 2016 N % N %
Private For-Profit 109 4.2% 44 1.6%
Private Not-For-Profit 1,107 42.3% 948 34.8%
Subtotal 1,216 46.5% 992 36.4%
Public, 2-Year 394 15.1% 495 18.2%
Public, 4-Year 1,006 38.5% 1,237 45.4%
Subtotal 1,400 53.5% 1,732 63.6%
Total to Out-of-State Institutions 2,616 100.0% 2,724 100.0%
Total All States 14,352 14,834 Note. FTF = first-time freshmen. Includes both full-time and part-time students. Data source: National Center for Education Statistics, IPEDS fall 2006 and 2016 surveys.

Nebraska’s Coordinating Commission for Postsecondary Education – 2018 Progress Report 168
Table A5.4 College Continuation Rates for Nebraska Public High School Graduates
by Gender and Student Income Status 2007-2008 through 2010-2011
Student Income Status
No. of Public High School Graduates
No. of Graduates Who Enrolled in College
College Continuation Rate
2007-2008 Public High School Graduates Males Low Income 2,156 1,049 48.7% Non-Low Income 7,803 5,536 70.9% Total 9,959 6,585 66.1% Females Low Income 2,423 1,333 55.0% Non-Low Income 7,654 5,913 77.3% Total 10,077 7,246 71.9% Total Low Income 4,579 (22.9%) 2,382 52.0% Non-Low Income 15,457 (77.1%) 11,449 74.1% Total 20,036 (100.0%) 13,831 69.0%
2008-2009 Public High School Graduates
Males Low Income 2,323 1,130 48.6% Non-Low Income 7,354 5,314 72.3% Total 9,677 6,444 66.6% Females Low Income 2,497 1,461 58.5% Non-Low Income 7,320 5,769 78.8% Total 9,817 7,230 73.6% Total Low Income 4,820 (24.7%) 2,591 53.8% Non-Low Income 14,674 (75.3%) 11,083 75.5% Total 19,494 (100.0%) 13,674 70.1%
Continued on the next page.

Nebraska’s Coordinating Commission for Postsecondary Education – 2018 Progress Report 169
Table A5.4 (Continued)
Student Income Status
No. of Public High School Graduates
No. of Graduates Who Enrolled in College
College Continuation Rate
2009-2010 Public High School Graduates Males Low Income 2,529 1,321 52.2% Non-Low Income 7,165 5,321 74.3% Total 9,694 6,642 68.5% Females Low Income 2,767 1,658 59.9% Non-Low Income 6,947 5,648 81.3% Total 9,714 7,306 75.2% Total Low Income 5,296 (27.3%) 2,979 56.3% Non-Low Income 14,112 (72.7%) 10,969 77.7% Total 19,408 (100.0%) 13,948 71.9%
2010-2011 Public High School Graduates
Males Low Income 2,708 1,423 52.5% Non-Low Income 6,872 5,044 73.4% Total 9,580 6,467 67.5% Females Low Income 3,032 1,836 60.6% Non-Low Income 6,747 5,489 81.4% Total 9,779 7,325 74.9% Total Low Income 5,740 (29.7%) 3,259 56.8% Non-Low Income 13,619 (70.3%) 10,533 77.3% Total 19,359 (100.0%) 13,792 71.2% Note. Includes only “on-time” graduates (students who graduated from high school in four years or less). Includes graduates of Nebraska’s state operated schools. Low-income students = students approved to receive free or reduced-price school lunches (FRL). Non-low-income students = students not approved for FRL. The non-low-income students include at least some students who live in low-income households, but who do not apply for FRL. Since participation in the FRL program is the only indicant of household income in the student records maintained by the Nebraska Department of Education, low-income students in the non-low-income category cannot be identified or excluded for the purposes of analysis. College continuation rate = the number of students enrolled in college on or before April 7, 2009 (2007-08 graduates), April 20, 2010 (2008-09 graduates), April 28, 2011 (2009-10 graduates), or April 24, 2012 (2010-11 graduates) divided by the total number of students who graduated from Nebraska public high schools during the academic year. Data sources: For high school graduates, Nebraska Department of Education, April 2009, April 2010, April 2011, and April 2012; for number of graduates who enrolled in college, National Student Clearinghouse, April 2009, April 2010, April 2011, and April 2012.

Nebraska’s Coordinating Commission for Postsecondary Education – 2018 Progress Report 170
Table A5.5 College Continuation Rates for Nebraska Public High School Graduates
by Gender, Student Income Status, and Race/Ethnicity: 2011-2012 through 2015-2016 Gender /
Student Income Status / Race/Ethnicity
2011-2012 2012-2013 Public HS
Grads # Enrolled in College
College Cont. Rate
Public HS Grads
# Enrolled in College
College Cont. Rate
Males Low Income White non-Hispanic 1,570 852 54.3% 1,581 798 50.5% Asian/Pacific Islander 73 47 64.4% 75 57 76.0% Black non-Hispanic 359 203 56.5% 360 209 58.1% Hispanic 771 339 44.0% 847 409 48.3% Native American 82 29 35.4% 64 25 39.1% Two or More Races 92 53 57.6% 120 68 56.7% Total 2,947 1,523 51.7% 3,047 1,566 51.4% Non-Low Income White non-Hispanic 5,903 4,309 73.0% 5,911 4,419 74.8% Asian/Pacific Islander 136 107 78.7% 109 89 81.7% Black non-Hispanic 162 116 71.6% 162 112 69.1% Hispanic 325 192 59.1% 347 202 58.2% Native American 41 21 51.2% 41 19 46.3% Two or More Races 120 75 62.5% 119 80 67.2% Total 6,687 4,820 72.1% 6,689 4,921 73.6% Total White non-Hispanic 7,473 5,161 69.1% 7,492 5,217 69.6% Asian/Pacific Islander 209 154 73.7% 184 146 79.3% Black non-Hispanic 521 319 61.2% 522 321 61.5% Hispanic 1,096 531 48.4% 1,194 611 51.2% Native American 123 50 40.7% 105 44 41.9% Two or More Races 212 128 60.4% 239 148 61.9% Total 9,634 6,343 65.8% 9,736 6,487 66.6% Females Low Income White non-Hispanic 1,691 1,120 66.2% 1,721 1,113 64.7% Asian/Pacific Islander 80 59 73.8% 90 70 77.8% Black non-Hispanic 412 256 62.1% 437 251 57.4% Hispanic 830 457 55.1% 917 521 56.8% Native American 69 23 33.3% 63 22 34.9% Two or More Races 158 104 65.8% 147 93 63.3% Total 3,240 2,019 62.3% 3,375 2,070 61.3% Non-Low Income White non-Hispanic 5,715 4,778 83.6% 5,598 4,685 83.7% Asian/Pacific Islander 119 95 79.8% 102 79 77.5% Black non-Hispanic 137 109 79.6% 157 121 77.1% Hispanic 362 252 69.6% 337 223 66.2% Native American 44 24 54.5% 29 9 31.0% Two or More Races 124 97 78.2% 119 91 76.5% Total 6,501 5,355 82.4% 6,342 5,208 82.1% Total White non-Hispanic 7,406 5,898 79.6% 7,319 5,798 79.2% Asian/Pacific Islander 199 154 77.4% 192 149 77.6% Black non-Hispanic 549 365 66.5% 594 372 62.6% Hispanic 1,192 709 59.5% 1,254 744 59.3% Native American 113 47 41.6% 92 31 33.7% Two or More Races 282 201 71.3% 266 184 69.2% Total 9,741 7,374 75.7% 9,717 7,278 74.9%
Continued on the next page.

Nebraska’s Coordinating Commission for Postsecondary Education – 2018 Progress Report 171
Table A5.5 (Continued) Gender /
Student Income Status / Race/Ethnicity
2011-2012 2012-2013 Public HS
Grads # Enrolled in College
College Cont. Rate
Public HS Grads
# Enrolled in College
College Cont. Rate
Total Low Income White non-Hispanic 3,261 1,972 60.5% 3,302 1,911 57.9% Asian/Pacific Islander 153 106 69.3% 165 127 77.0% Black non-Hispanic 771 459 59.5% 797 460 57.7% Hispanic 1,601 796 49.7% 1,764 930 52.7% Native American 151 52 34.4% 127 47 37.0% Two or More Races 250 157 62.8% 267 161 60.3%
Total 6,187 (31.9%) 3,542 57.2% 6,422
(33.0%) 3,636 56.6%
Non-Low Income White non-Hispanic 11,618 9,087 78.2% 11,509 9,104 79.1% Asian/Pacific Islander 255 202 79.2% 211 168 79.6% Black non-Hispanic 299 225 75.3% 319 233 73.0% Hispanic 687 444 64.6% 684 425 62.1% Native American 85 45 52.9% 70 28 40.0% Two or More Races 244 172 70.5% 238 171 71.8%
Total 13,188 (70.3%) 10,175 77.2% 13,031
(67.0%) 10,129 77.7%
Total White non-Hispanic 14,879 11,059 74.3% 14,811 11,015 74.4% Asian/Pacific Islander 408 308 75.5% 376 295 78.5% Black non-Hispanic 1,070 684 63.9% 1,116 693 62.1% Hispanic 2,288 1,240 54.2% 2,448 1,355 55.4% Native American 236 97 41.1% 197 75 38.1% Two or More Races 494 329 66.6% 505 332 65.7%
Total 19,375 (100.0%) 13,717 70.8% 19,453
(100.0%) 13,765 70.8%
Continued on the next page.

Nebraska’s Coordinating Commission for Postsecondary Education – 2018 Progress Report 172
Table A5.5 (Continued) Gender /
Student Income Status / Race/Ethnicity
2013-2014 2014-2015 Public HS
Grads # Enrolled in College
College Cont. Rate
Public HS Grads
# Enrolled in College
College Cont. Rate
Males Low Income White non-Hispanic 1,515 769 50.8% 1,658 833 50.2% Asian/Pacific Islander 100 75 75.0% 98 68 69.4% Black non-Hispanic 362 211 58.3% 340 193 56.8% Hispanic 971 516 53.1% 936 487 52.0% Native American 62 24 38.7% 54 22 40.7% Two or More Races 114 51 44.7% 120 61 50.8% Total 3,124 1,646 52.7% 3,206 1,664 51.9% Non-Low Income White non-Hispanic 5,750 4,337 75.4% 5,637 4,206 74.6% Asian/Pacific Islander 107 87 81.3% 115 99 86.1% Black non-Hispanic 164 92 56.1% 188 124 66.0% Hispanic 391 225 57.5% 415 251 60.5% Native American 26 13 50.0% 51 24 47.1% Two or More Races 130 98 75.4% 143 102 71.3% Total 6,568 4,852 73.9% 6,549 4,806 73.4% Total White non-Hispanic 7,265 5,106 70.3% 7,295 5,039 69.1% Asian/Pacific Islander 207 162 78.3% 213 167 78.4% Black non-Hispanic 526 303 57.6% 528 317 60.0% Hispanic 1,362 741 54.4% 1,351 738 54.6% Native American 88 37 42.0% 105 46 43.8% Two or More Races 244 149 61.1% 263 163 62.0% Total 9,692 6,498 67.0% 9,755 6,470 66.3% Females Low Income White non-Hispanic 1,702 1,114 65.5% 1,678 1,052 62.7% Asian/Pacific Islander 94 75 79.8% 87 65 74.7% Black non-Hispanic 423 250 59.1% 360 226 62.8% Hispanic 983 597 60.7% 1081 623 57.6% Native American 68 28 41.2% 66 34 51.5% Two or More Races 167 105 62.9% 164 92 56.1% Total 3,437 2,169 63.1% 3,436 2,092 60.9% Non-Low Income White non-Hispanic 5,578 4,690 84.1% 5,516 4,691 85.0% Asian/Pacific Islander 144 120 83.3% 180 149 82.8% Black non-Hispanic 140 118 84.3% 152 123 80.9% Hispanic 360 245 68.1% 407 284 69.8% Native American 31 14 45.2% 40 25 62.5% Two or More Races 147 116 78.9% 150 107 71.3% Total 6,400 5,303 82.9% 6,445 5,379 83.5% Total White non-Hispanic 7,280 5,804 79.7% 7,194 5,743 79.8% Asian/Pacific Islander 238 195 81.9% 267 214 80.1% Black non-Hispanic 563 368 65.4% 512 349 68.2% Hispanic 1,343 842 62.7% 1,488 907 61.0% Native American 99 42 42.4% 106 59 55.7% Two or More Races 314 221 70.4% 314 199 63.4% Total 9,837 7,472 76.0% 9,881 7,471 75.6%
Continued on the next page.

Nebraska’s Coordinating Commission for Postsecondary Education – 2018 Progress Report 173
Table A5.5 (Continued) Gender /
Student Income Status / Race/Ethnicity
2013-2014 2014-2015 Public HS
Grads # Enrolled in College
College Cont. Rate
Public HS Grads
# Enrolled in College
College Cont. Rate
Total Low Income White non-Hispanic 3,217 1,883 58.5% 3,336 1,885 56.5% Asian/Pacific Islander 194 150 77.3% 185 133 71.9% Black non-Hispanic 785 461 58.7% 700 419 59.9% Hispanic 1,954 1,113 57.0% 2,017 1,110 55.0% Native American 130 52 40.0% 120 56 46.7% Two or More Races 281 156 55.5% 284 153 53.9%
Total 6,561 (33.6%) 3,815 58.1% 6,642
(33.8%) 3,756 56.5%
Non-Low Income White non-Hispanic 11,328 9,027 79.7% 11,153 8,897 79.8% Asian/Pacific Islander 251 207 82.5% 295 248 84.1% Black non-Hispanic 304 210 69.1% 340 247 72.6% Hispanic 751 470 62.6% 822 535 65.1% Native American 57 27 47.4% 91 49 53.8% Two or More Races 277 214 77.3% 293 209 71.3%
Total 12,968 (66.4%) 10,155 78.3% 12,994
(66.2%) 10,185 78.4%
Total White non-Hispanic 14,545 10,910 75.0% 14,489 10,782 74.4% Asian/Pacific Islander 445 357 80.2% 480 381 79.4% Black non-Hispanic 1,089 671 61.6% 1,040 666 64.0% Hispanic 2,705 1,583 58.5% 2,839 1,645 57.9% Native American 187 79 42.2% 211 105 49.8% Two or More Races 558 370 66.3% 577 362 62.7%
Total 19,529 (100.0%) 13,970 71.5% 19,636
(100.0%) 13,941 71.0%
Continued on the next page.
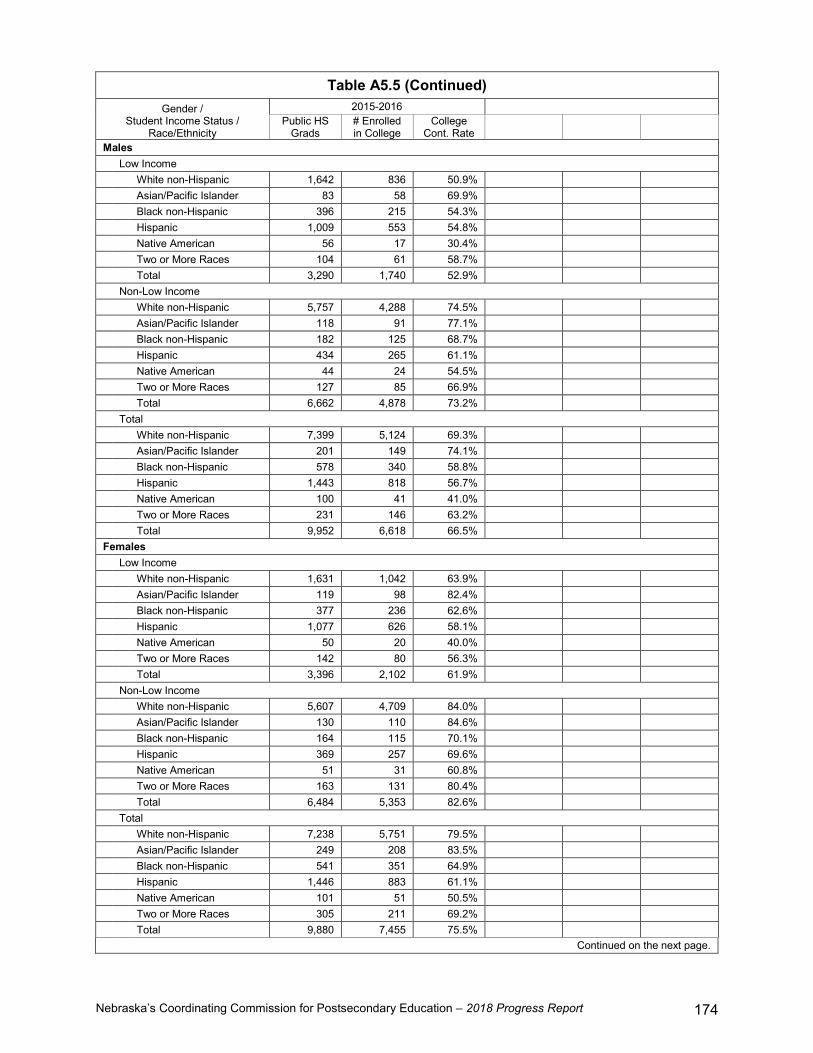
Nebraska’s Coordinating Commission for Postsecondary Education – 2018 Progress Report 174
Table A5.5 (Continued) Gender /
Student Income Status / Race/Ethnicity
2015-2016 Public HS
Grads # Enrolled in College
College Cont. Rate
Males Low Income White non-Hispanic 1,642 836 50.9% Asian/Pacific Islander 83 58 69.9% Black non-Hispanic 396 215 54.3% Hispanic 1,009 553 54.8% Native American 56 17 30.4% Two or More Races 104 61 58.7% Total 3,290 1,740 52.9% Non-Low Income White non-Hispanic 5,757 4,288 74.5% Asian/Pacific Islander 118 91 77.1% Black non-Hispanic 182 125 68.7% Hispanic 434 265 61.1% Native American 44 24 54.5% Two or More Races 127 85 66.9% Total 6,662 4,878 73.2% Total White non-Hispanic 7,399 5,124 69.3% Asian/Pacific Islander 201 149 74.1% Black non-Hispanic 578 340 58.8% Hispanic 1,443 818 56.7% Native American 100 41 41.0% Two or More Races 231 146 63.2% Total 9,952 6,618 66.5% Females Low Income White non-Hispanic 1,631 1,042 63.9% Asian/Pacific Islander 119 98 82.4% Black non-Hispanic 377 236 62.6% Hispanic 1,077 626 58.1% Native American 50 20 40.0% Two or More Races 142 80 56.3% Total 3,396 2,102 61.9% Non-Low Income White non-Hispanic 5,607 4,709 84.0% Asian/Pacific Islander 130 110 84.6% Black non-Hispanic 164 115 70.1% Hispanic 369 257 69.6% Native American 51 31 60.8% Two or More Races 163 131 80.4% Total 6,484 5,353 82.6% Total White non-Hispanic 7,238 5,751 79.5% Asian/Pacific Islander 249 208 83.5% Black non-Hispanic 541 351 64.9% Hispanic 1,446 883 61.1% Native American 101 51 50.5% Two or More Races 305 211 69.2% Total 9,880 7,455 75.5%
Continued on the next page.

Nebraska’s Coordinating Commission for Postsecondary Education – 2018 Progress Report 175
Table A5.5 (Continued) Gender /
Student Income Status / Race/Ethnicity
2015-2016 Public HS
Grads # Enrolled in College
College Cont. Rate
Total Low Income White non-Hispanic 3,273 1,878 57.4% Asian/Pacific Islander 202 156 77.2% Black non-Hispanic 773 451 58.3% Hispanic 2,086 1,179 56.5% Native American 106 37 34.9% Two or More Races 246 141 57.3%
Total 6,686 (33.7%) 3,842 57.5%
Non-Low Income White non-Hispanic 11,364 8,997 79.2% Asian/Pacific Islander 248 201 81.0% Black non-Hispanic 346 240 69.4% Hispanic 803 522 65.0% Native American 95 55 57.9% Two or More Races 290 216 74.5%
Total 13,146 (66.3%) 10,231 77.8%
Total White non-Hispanic 14,637 10,875 74.3% Asian/Pacific Islander 450 357 79.3% Black non-Hispanic 1,119 691 61.8% Hispanic 2,889 1,701 58.9% Native American 201 92 45.8% Two or More Races 536 357 66.6%
Total 19,832 (100.0%) 14,073 71.0%
Note. Includes only “on-time” graduates (students who graduated from high school in four years or less). Includes graduates of Nebraska’s state operated schools. Low-income students = students approved to receive free or reduced-price school lunches (FRL). Non-low-income students = students not approved for FRL. The non-low-income students include at least some students who live in low-income households, but who do not apply for FRL. Since participation in the FRL program is the only indicant of household income in the student records maintained by the Nebraska Department of Education, low-income students in the non-low-income category cannot be identified or excluded for the purposes of analysis. College continuation rate = the number of students enrolled in college on or before May 31, 2013 (2011-12 graduates), March 27, 2014 (2012-13 graduates), May 31, 2015 (2013-14 graduates), May 27, 2016 (2014-15 graduates), or May 25, 2017 (2015-16 graduates) divided by the total number of students who graduated from Nebraska public high schools during the academic year. Data sources: Nebraska Department of Education (numbers of high school graduates), August 2013, April 2014, August 2015, April 2016, and October 2017; National Student Clearinghouse (college continuation data), August and September 2013, March and April 2014, August 2015, May 2016, and May 2017.

Nebraska’s Coordinating Commission for Postsecondary Education – 2018 Progress Report 176
This page left blank intentionally.

Nebraska’s Coordinating Commission for Postsecondary Education – 2018 Progress Report 177
Appendix 6
Nebraska and Non-Nebraska, First-Time Freshmen Migration Data
Table A6.1 Nebraska-Resident, First-Time Freshmen
Enrolled at Nebraska and Out-of-State Postsecondary Institutions Within 12 Months of High School Graduation
Fall 2006 through Fall 2016
Where Students Enrolled as FTF
Fall 2006 Fall 2008 Fall 2010 Fall 2012
N % N % N % N %
Nebraska Schools 11,736 81.8% 12,096 82.1% 12,651 83.8% 12,117 81.2%
Out-of-State Schools 2,616 18.2% 2,641 17.9% 2,449 16.2% 2,803 18.8%
Total 14,352 100.0% 14,737 100.0% 15,100 100.0% 14,920 100.0% ∆ Since the Previous IPEDS Survey 385 2.7% 363 2.5% -180 -1.2%
Where Students Enrolled as FTF
Fall 2014 Fall 2016
∆ Since Fall 2006
N % N % N %
Nebraska Schools 11,593 81.2% 12,110 81.6% 374 3.2%
Out-of-State Schools 2,690 18.8% 2,724 18.4% 108 4.1%
Total 14,283 100.0% 14,834 100.0% 482 3.4% ∆ Since the Previous IPEDS Survey -637 -4.3% 551 3.9%
Note. Includes full-time and part-time students. FTF = first-time freshmen; ∆ = change. Data source: National Center for Education Statistics, IPEDS fall 2006, 2008, 2010, 2012, 2014, and 2016 surveys.

Nebraska’s Coordinating Commission for Postsecondary Education – 2018 Progress Report 178
Table A6.2 Nebraska-Resident, First-Time Freshmen
Enrolled at Nebraska Postsecondary Institutions Within 12 Months of High School Graduation
Fall 2006 through Fall 2016
Where Students Enrolled as FTF
Fall 2006 Fall 2008 Fall 2010 Fall 2012
N % N % N % N %
University of Nebraska 5,452 46.5% 5,651 46.7% 5,690 45.0% 5,454 45.0% Nebraska State College System 892 7.6% 942 7.8% 965 7.6% 924 7.6%
Nebraska Community Colleges 3,326 28.3% 3,431 28.4% 3,989 31.5% 3,920 32.4%
Public Total 9,670 82.4% 10,024 82.9% 10,644 84.1% 10,298 85.0% Independent Colleges and Universities 1,779 15.2% 1,727 14.3% 1,709 13.5% 1,623 13.4%
For-Profit/ Career Schools 287 2.4% 345 2.9% 298 2.4% 196 1.6%
Nebraska Total 11,736 100.0% 12,096 100.0% 12,651 100.0% 12,117 100.0%
Where Students Enrolled as FTF
Fall 2014 Fall 2016
∆ Since Fall 2006
N % N % N %
University of Nebraska 5,776 49.8% 5,959 49.2% 507 9.3% Nebraska State College System 994 8.6% 820 6.8% -72 -8.1%
Nebraska Community Colleges 3,126 27.0% 3,646 30.1% 320 9.6%
Public Total 9,896 85.4% 10,425 86.1% 755 7.8% Independent Colleges and Universities 1,551 13.4% 1,557 12.9% -222 -12.5%
For-Profit/ Career Schools 146 1.3% 128 1.1% -159 -55.4%
Nebraska Total 11,593 100.0% 12,110 100.0% 374 3.2% Note. Includes full-time and part-time students. FTF = first-time freshmen; ∆ = change. Data source: National Center for Education Statistics, IPEDS fall 2006, 2008, 2010, 2012, 2014, and 2016 surveys.

Nebraska’s Coordinating Commission for Postsecondary Education – 2018 Progress Report 179
Table A6.3 Nebraska-Resident, First-Time Freshmen
Enrolled at Nebraska and Out-of-State Postsecondary Institutions More than 12 Months After High School Graduation
Fall 2006 through Fall 2016
Where Students Enrolled as FTF
Fall 2006 Fall 2008 Fall 2010 Fall 2012
N % N % N % N %
Nebraska Schools 3,321 85.5% 2,861 81.5% 3,330 83.7% 2,483 82.6%
Out-of-State Schools 561 14.5% 649 18.5% 650 16.3% 522 17.4%
Total 3,882 100.0% 3,510 100.0% 3,980 100.0% 3,005 100.0% ∆ Since the Previous IPEDS Survey -372 -9.6% 470 13.4% -975 -24.5%
Where Students Enrolled as FTF
Fall 2014 Fall 2016
∆ Since Fall 2006
N % N % N %
Nebraska Schools 2,742 85.4% 1,900 83.1% -1,421 -42.8%
Out-of-State Schools 470 14.6% 386 16.9% -175 -31.2%
Total 3,212 100.0% 2,286 100.0% -1,596 -41.1% ∆ Since the Previous IPEDS Survey 207 6.9% -926 -28.8%
Note. Includes full-time and part-time students. FTF = first-time freshmen; ∆ = change. Data source: National Center for Education Statistics, IPEDS fall 2006, 2008, 2010, 2012, 2014, and 2016 surveys.

Nebraska’s Coordinating Commission for Postsecondary Education – 2018 Progress Report 180
Table A6.4 Nebraska-Resident First-Time Freshmen,
Enrolled at Nebraska Postsecondary Institutions More than 12 Months After High School Graduation
Fall 2006 through Fall 2016
Where Students Enrolled as FTF
Fall 2006 Fall 2008 Fall 2010 Fall 2012
N % N % N % N %
University of Nebraska 233 7.0% 292 10.2% 238 7.1% 136 5.5% Nebraska State College System 44 1.3% 50 1.7% 47 1.4% 59 2.4%
Nebraska Community Colleges 2,074 62.5% 2,010 70.3% 2,304 69.2% 1,908 76.8%
Public Total 2,351 70.8% 2,352 82.2% 2,589 77.7% 2,103 84.7% Independent Colleges and Universities 232 7.0% 99 3.5% 116 3.5% 141 5.7%
For-Profit/ Career Schools 738 22.2% 410 14.3% 625 18.8% 239 9.6%
Nebraska Total 3,321 100.0% 2,861 100.0% 3,330 100.0% 2,483 100.0%
Where Students Enrolled as FTF
Fall 2014 Fall 2016
∆ Since Fall 2006
N % N % N %
University of Nebraska 189 6.9% 217 11.4% -16 -6.9% Nebraska State College System 56 2.0% 36 1.9% -8 -18.2%
Nebraska Community Colleges 2,190 79.9% 1,439 75.7% -635 -30.6%
Public Total 2,435 88.8% 1,692 89.1% -659 -28.0% Independent Colleges and Universities 70 2.6% 54 2.8% -178 -76.7%
For-Profit/ Career Schools 237 8.6% 154 8.1% -584 -79.1%
Nebraska Total 2,742 100.0% 1,900 100.0% -1,421 -42.8% Note. Includes full-time and part-time students. FTF = first-time freshmen; ∆ = change. Data source: National Center for Education Statistics, IPEDS fall 2006, 2008, 2010, 2012, 2014, and 2016 surveys.

Nebraska’s Coordinating Commission for Postsecondary Education – 2018 Progress Report 181
Table A6.5 Non-Nebraska, First-Time Freshmen
Enrolled at Nebraska Postsecondary Institutions Within 12 Months of High School Graduation
Fall 2006 through Fall 2016
Where Students Enrolled as FTF
Fall 2006 Fall 2008 Fall 2010 Fall 2012
N % N % N % N %
University of Nebraska 966 34.6% 1,079 36.3% 1,006 34.1% 1,072 36.0% Nebraska State College System 227 8.1% 259 8.7% 277 9.4% 294 9.9%
Nebraska Community Colleges 200 7.2% 192 6.5% 185 6.3% 271 9.1%
Public Total 1,393 49.9% 1,530 51.5% 1,468 49.8% 1,637 54.9% Independent Colleges and Universities 1,374 49.2% 1,412 47.5% 1,452 49.3% 1,316 44.1%
For-Profit/ Career Schools 27 1.0% 31 1.0% 28 0.9% 28 0.9%
Nebraska Total 2,794 100.0% 2,973 100.0% 2,948 100.0% 2,981 100.0%
Where Students Enrolled as FTF
Fall 2014 Fall 2016
∆ Since Fall 2006
N % N % N %
University of Nebraska 1,347 38.6% 1,581 40.0% 615 63.7% Nebraska State College System 331 9.5% 345 8.7% 118 52.0%
Nebraska Community Colleges 295 8.5% 335 8.5% 135 67.5%
Public Total 1,973 56.6% 2,261 57.2% 868 62.3% Independent Colleges and Universities 1,502 43.1% 1,676 42.4% 302 22.0%
For-Profit/ Career Schools 13 0.4% 19 0.5% -8 -29.6%
Nebraska Total 3,488 100.0% 3,956 100.0% 1,162 41.6% Note. Includes full-time and part-time students as well as nonresident alien students. Does not include students with reported unknown states of residence and students for whom no residence information was reported. FTF = first-time freshmen; ∆ = change. Data source: National Center for Education Statistics, IPEDS fall 2006, 2008, 2010, 2012, 2014, and 2016 surveys.
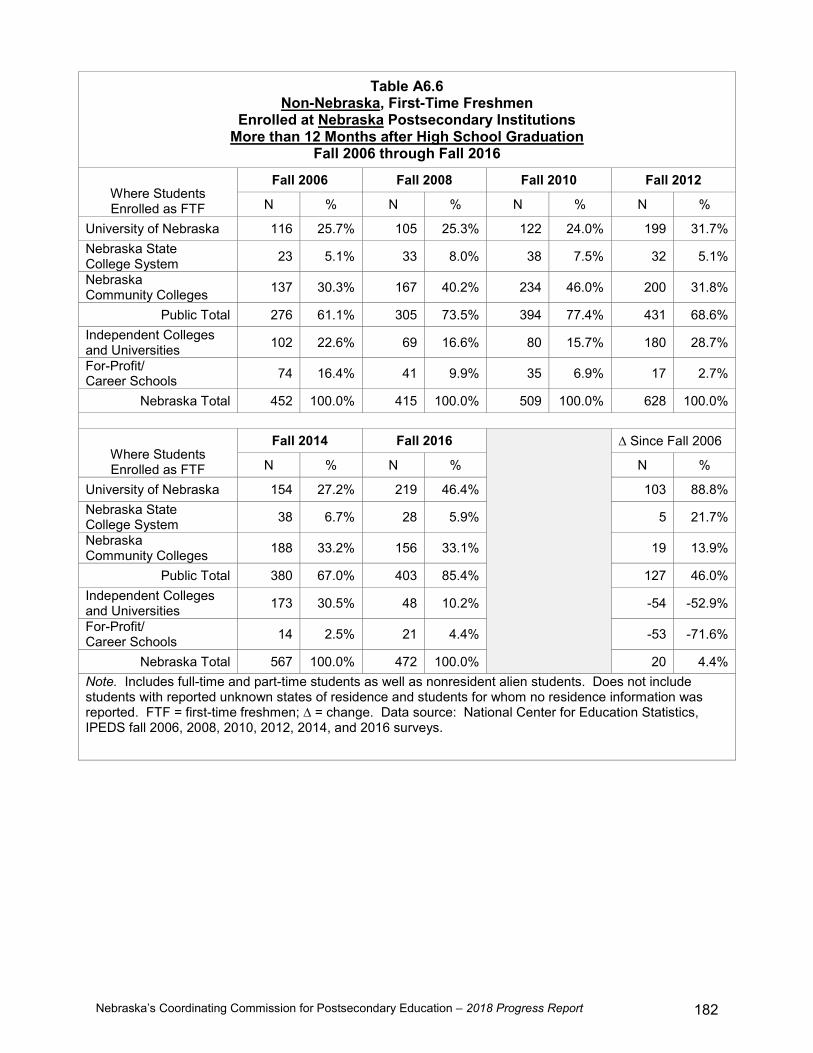
Nebraska’s Coordinating Commission for Postsecondary Education – 2018 Progress Report 182
Table A6.6 Non-Nebraska, First-Time Freshmen
Enrolled at Nebraska Postsecondary Institutions More than 12 Months after High School Graduation
Fall 2006 through Fall 2016
Where Students Enrolled as FTF
Fall 2006 Fall 2008 Fall 2010 Fall 2012
N % N % N % N %
University of Nebraska 116 25.7% 105 25.3% 122 24.0% 199 31.7% Nebraska State College System 23 5.1% 33 8.0% 38 7.5% 32 5.1%
Nebraska Community Colleges 137 30.3% 167 40.2% 234 46.0% 200 31.8%
Public Total 276 61.1% 305 73.5% 394 77.4% 431 68.6% Independent Colleges and Universities 102 22.6% 69 16.6% 80 15.7% 180 28.7%
For-Profit/ Career Schools 74 16.4% 41 9.9% 35 6.9% 17 2.7%
Nebraska Total 452 100.0% 415 100.0% 509 100.0% 628 100.0%
Where Students Enrolled as FTF
Fall 2014 Fall 2016
∆ Since Fall 2006
N % N % N %
University of Nebraska 154 27.2% 219 46.4% 103 88.8% Nebraska State College System 38 6.7% 28 5.9% 5 21.7%
Nebraska Community Colleges 188 33.2% 156 33.1% 19 13.9%
Public Total 380 67.0% 403 85.4% 127 46.0% Independent Colleges and Universities 173 30.5% 48 10.2% -54 -52.9%
For-Profit/ Career Schools 14 2.5% 21 4.4% -53 -71.6%
Nebraska Total 567 100.0% 472 100.0% 20 4.4% Note. Includes full-time and part-time students as well as nonresident alien students. Does not include students with reported unknown states of residence and students for whom no residence information was reported. FTF = first-time freshmen; ∆ = change. Data source: National Center for Education Statistics, IPEDS fall 2006, 2008, 2010, 2012, 2014, and 2016 surveys.

Nebraska’s Coordinating Commission for Postsecondary Education – 2018 Progress Report 183
Table A6.7 Nebraska and Non-Nebraska, First-Time Freshmen Enrolled at Nebraska Postsecondary
Institutions Within 12 Months of High School Graduation: Fall 2006 through Fall 2016
Fall 2006
Sector or Institution
Nebraska Students
Out-of-State Students
Nonresident Aliens
Total N % N % N % Nebraska Public Institutions 9,670 87.4% 1,299 11.7% 94 0.8% 11,063 University of Nebraska 5,452 84.9% 879 13.7% 87 1.4% 6,418 Neb. College of Tech. Agriculture 91 79.8% 23 20.2% 114 University of Nebraska at Kearney 804 88.3% 57 6.3% 50 5.5% 911 University of Nebraska-Lincoln 3,038 80.5% 705 18.7% 33 0.9% 3,776 University of Neb. Medical Center Not applicable University of Nebraska at Omaha 1,519 93.9% 94 5.8% 4 0.2% 1,617 Nebraska State College System 892 79.7% 227 20.3% 1,119 Chadron State College 217 66.6% 109 33.4% 326 Peru State College 168 85.3% 29 14.7% 197 Wayne State College 507 85.1% 89 14.9% 596 Nebraska Community Colleges 3,326 94.3% 193 5.5% 7 0.2% 3,526 Central Community College 694 99.1% 6 0.9% 700 Metropolitan Community College 751 97.2% 22 2.8% 773 Mid-Plains Community College 149 75.6% 47 23.9% 1 0.5% 197 Northeast Community College 550 96.2% 22 3.8% 572 Southeast Community College 927 95.2% 47 4.8% 974 Western Neb. Community College 255 82.3% 49 15.8% 6 1.9% 310 Nebraska Independent Institutions 1,779 56.4% 1,359 43.1% 15 0.5% 3,153 Bellevue University 69 90.8% 7 9.2% 76 Bryan College of Health Sciences 4 100.0% 4 Clarkson College 0 College of St. Mary 56 74.7% 19 25.3% 75 Concordia University-Seward 113 39.4% 174 60.6% 287 Creighton University 357 37.0% 602 62.4% 5 0.5% 964 Dana College 78 56.1% 61 43.9% 139 Doane Univ.-Arts & Sciences 195 79.6% 50 20.4% 245 Doane Univ.-Grad. & Prof. Studies 5 100.0% 5 Grace University 48 75.0% 16 25.0% 64 Hastings College 172 65.9% 87 33.3% 2 0.8% 261 Little Priest Tribal College 11 91.7% 1 8.3% 12 Midland University 210 78.7% 57 21.3% 267 Neb. Christian College of Hope Int’l 19 45.2% 23 54.8% 42 Neb. Indian Community College 9 100.0% 9 Nebraska Methodist College 20 90.9% 2 9.1% 22 Nebraska Wesleyan University 369 89.6% 40 9.7% 3 0.7% 412 Summit Christian College 1 50.0% 1 50.0% 2 Union College 23 12.6% 156 85.2% 4 2.2% 183 York College 20 23.8% 63 75.0% 1 1.2% 84
Continued on the next page.

Nebraska’s Coordinating Commission for Postsecondary Education – 2018 Progress Report 184
Table A6.7 Continued
Fall 2006
Sector or Institution
Nebraska Students
Out-of-State Students
Nonresident Aliens
Total N % N % N % For-Profit/Career Schools 287 91.4% 27 8.6% 0 0.0% 314
Capitol School of Hairstyling and Esthetics 13 100.0% 13
CHI Health School of Radiologic Technology Not applicable
College of Hair Design 24 96.0% 1 4.0% 25
College of Hair Design- East Campus Did not report freshmen data to IPEDS until 2010
Fullen School of Hair Design 1 100.0% 1 ITT Technical Institute-Omaha 13 76.5% 4 23.5% 17 Joseph's College Cosmetology 76 95.0% 4 5.0% 80 Kaplan University-Lincoln Campus 53 96.4% 2 3.6% 55 Kaplan University-Omaha Campus 10 100.0% 10 La'James International College 42 95.5% 2 4.5% 44
Mary Lanning Memorial Hospital School of Radiologic Technology Not applicable
Myotherapy Institute 7 100.0% 7
National American University-Bellevue Did not report freshmen data to IPEDS until 2012
Omaha School of Massage and Healthcare of Herzing University 11 73.3% 4 26.7% 15
Paul Mitchell the School Lincoln Did not report freshmen data to IPEDS until 2016
Regional West Medical Center School of Radiologic Technology Not applicable
The Creative Center 12 54.5% 10 45.5% 22 Universal College of Healing Arts 3 100.0% 3
University of Phoenix- Omaha Campus 0
Vatterott College 0 Vatterott College-Spring Valley 0
Xenon International Academy-Omaha 22 100.0% 22
Nebraska Total 11,736 80.8% 2,685 18.5% 109 0.8% 14,530
Continued on the next page.
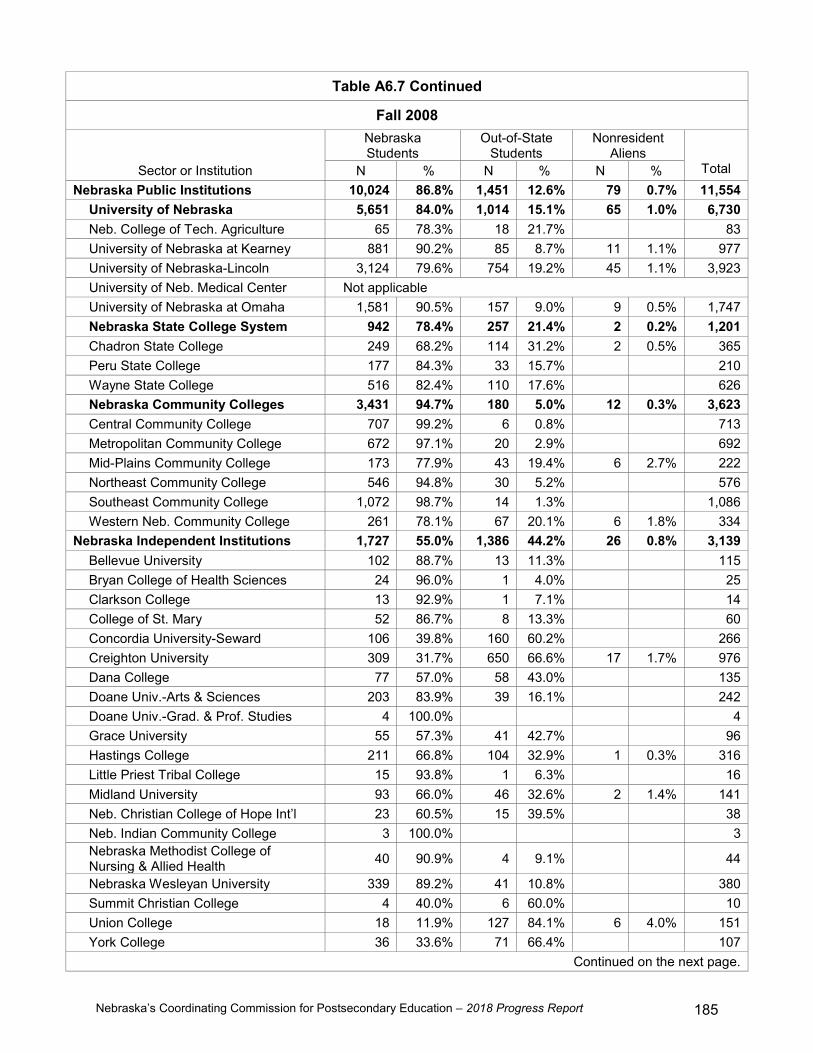
Nebraska’s Coordinating Commission for Postsecondary Education – 2018 Progress Report 185
Table A6.7 Continued
Fall 2008
Sector or Institution
Nebraska Students
Out-of-State Students
Nonresident Aliens
Total N % N % N % Nebraska Public Institutions 10,024 86.8% 1,451 12.6% 79 0.7% 11,554 University of Nebraska 5,651 84.0% 1,014 15.1% 65 1.0% 6,730 Neb. College of Tech. Agriculture 65 78.3% 18 21.7% 83 University of Nebraska at Kearney 881 90.2% 85 8.7% 11 1.1% 977 University of Nebraska-Lincoln 3,124 79.6% 754 19.2% 45 1.1% 3,923 University of Neb. Medical Center Not applicable University of Nebraska at Omaha 1,581 90.5% 157 9.0% 9 0.5% 1,747 Nebraska State College System 942 78.4% 257 21.4% 2 0.2% 1,201 Chadron State College 249 68.2% 114 31.2% 2 0.5% 365 Peru State College 177 84.3% 33 15.7% 210 Wayne State College 516 82.4% 110 17.6% 626 Nebraska Community Colleges 3,431 94.7% 180 5.0% 12 0.3% 3,623 Central Community College 707 99.2% 6 0.8% 713 Metropolitan Community College 672 97.1% 20 2.9% 692 Mid-Plains Community College 173 77.9% 43 19.4% 6 2.7% 222 Northeast Community College 546 94.8% 30 5.2% 576 Southeast Community College 1,072 98.7% 14 1.3% 1,086 Western Neb. Community College 261 78.1% 67 20.1% 6 1.8% 334 Nebraska Independent Institutions 1,727 55.0% 1,386 44.2% 26 0.8% 3,139 Bellevue University 102 88.7% 13 11.3% 115 Bryan College of Health Sciences 24 96.0% 1 4.0% 25 Clarkson College 13 92.9% 1 7.1% 14 College of St. Mary 52 86.7% 8 13.3% 60 Concordia University-Seward 106 39.8% 160 60.2% 266 Creighton University 309 31.7% 650 66.6% 17 1.7% 976 Dana College 77 57.0% 58 43.0% 135 Doane Univ.-Arts & Sciences 203 83.9% 39 16.1% 242 Doane Univ.-Grad. & Prof. Studies 4 100.0% 4 Grace University 55 57.3% 41 42.7% 96 Hastings College 211 66.8% 104 32.9% 1 0.3% 316 Little Priest Tribal College 15 93.8% 1 6.3% 16 Midland University 93 66.0% 46 32.6% 2 1.4% 141 Neb. Christian College of Hope Int’l 23 60.5% 15 39.5% 38 Neb. Indian Community College 3 100.0% 3
Nebraska Methodist College of Nursing & Allied Health 40 90.9% 4 9.1% 44
Nebraska Wesleyan University 339 89.2% 41 10.8% 380 Summit Christian College 4 40.0% 6 60.0% 10 Union College 18 11.9% 127 84.1% 6 4.0% 151 York College 36 33.6% 71 66.4% 107
Continued on the next page.

Nebraska’s Coordinating Commission for Postsecondary Education – 2018 Progress Report 186
Table A6.7 Continued
Fall 2008
Sector or Institution
Nebraska Students
Out-of-State Students
Nonresident Aliens
Total N % N % N % For-Profit/Career Schools 345 91.8% 31 8.2% 376
Capitol School of Hairstyling and Esthetics 25 89.3% 3 10.7% 28
CHI Health School of Radiologic Technology Not applicable
College of Hair Design 35 97.2% 1 2.8% 36
College of Hair Design- East Campus Did not report freshmen data to IPEDS until 2010
Fullen School of Hair Design 1 100.0% 1 ITT Technical Institute-Omaha 9 90.0% 1 10.0% 10 Joseph's College Cosmetology 38 100.0% 38 Kaplan University-Lincoln Campus 44 100.0% 44 Kaplan University-Omaha Campus 17 94.4% 1 5.6% 18 La'James International College 46 93.9% 3 6.1% 49
Mary Lanning Memorial Hospital School of Radiologic Technology Not applicable
Myotherapy Institute 27 100.0% 27
National American University-Bellevue Did not report freshmen data to IPEDS until 2012
Omaha School of Massage and Healthcare of Herzing University 22 91.7% 2 8.3% 24
Paul Mitchell the School Lincoln Did not report freshmen data to IPEDS until 2016
Regional West Medical Center School of Radiologic Technology Not applicable
The Creative Center 28 65.1% 15 34.9% 43 Universal College of Healing Arts 3 100.0% 3
University of Phoenix- Omaha Campus 0
Vatterott College Closed Vatterott College-Spring Valley 8 100.0% 8
Xenon International Academy-Omaha 35 87.5% 5 12.5% 40
Nebraska Total 12,096 80.3% 2,868 19.0% 105 0.7% 15,069
Continued on the next page.

Nebraska’s Coordinating Commission for Postsecondary Education – 2018 Progress Report 187
Table A6.7 Continued
Fall 2010
Sector or Institution
Nebraska Students
Out-of-State Students
Nonresident Aliens
Total N % N % N % Nebraska Public Institutions 10,644 87.9% 1,386 11.4% 82 0.7% 12,112 University of Nebraska 5,690 85.0% 933 13.9% 73 1.1% 6,696 Neb. College of Tech. Agriculture 83 80.6% 20 19.4% 103 University of Nebraska at Kearney 879 89.3% 93 9.5% 12 1.2% 984 University of Nebraska-Lincoln 3,189 80.6% 705 17.8% 61 1.5% 3,955 University of Neb. Medical Center Not applicable University of Nebraska at Omaha 1,539 93.0% 115 7.0% 1,654 Nebraska State College System 965 77.7% 275 22.1% 2 0.2% 1,242 Chadron State College 213 61.2% 135 38.8% 348 Peru State College 178 74.2% 62 25.8% 240 Wayne State College 574 87.8% 78 11.9% 2 0.3% 654 Nebraska Community Colleges 3,989 95.6% 178 4.3% 7 0.2% 4,174 Central Community College 800 99.4% 5 0.6% 805 Metropolitan Community College 976 97.0% 30 3.0% 1,006 Mid-Plains Community College 194 78.5% 50 20.2% 3 1.2% 247 Northeast Community College 676 97.1% 19 2.7% 1 0.1% 696 Southeast Community College 1,082 98.2% 19 1.7% 1 0.1% 1,102 Western Neb. Community College 261 82.1% 55 17.3% 2 0.6% 318 Nebraska Independent Institutions 1,709 54.1% 1,432 45.3% 20 0.6% 3,161 Bellevue University 47 85.5% 8 14.5% 55 Bryan College of Health Sciences 33 97.1% 1 2.9% 34 Clarkson College 7 100.0% 7 College of St. Mary 64 76.2% 20 23.8% 84 Concordia University-Seward 129 48.0% 139 51.7% 1 0.4% 269 Creighton University 272 27.0% 718 71.4% 16 1.6% 1,006 Dana College Closed Doane Univ.-Arts & Sciences 268 83.8% 52 16.3% 320 Doane Univ.-Grad. & Prof. Studies 0 Grace University 28 54.9% 23 45.1% 51 Hastings College 214 68.6% 97 31.1% 1 0.3% 312 Little Priest Tribal College 12 100.0% 12 Midland University 145 64.7% 78 34.8% 1 0.4% 224 Neb. Christian College of Hope Int’l 26 53.1% 23 46.9% 49 Neb. Indian Community College 12 100.0% 12
Nebraska Methodist College of Nursing & Allied Health 32 91.4% 2 5.7% 1 2.9% 35
Nebraska Wesleyan University 367 85.5% 62 14.5% 429 Summit Christian College 1 25.0% 3 75.0% 4 Union College 13 9.4% 126 90.6% 139 York College 39 32.8% 80 67.2% 119
Continued on the next page.

Nebraska’s Coordinating Commission for Postsecondary Education – 2018 Progress Report 188
Table A6.7 Continued
Fall 2010
Sector or Institution
Nebraska Students
Out-of-State Students
Nonresident Aliens
Total N % N % N % For-Profit/Career Schools 298 91.4% 28 8.6% 326
Capitol School of Hairstyling and Esthetics 80 100.0% 80
CHI Health School of Radiologic Technology Not applicable
College of Hair Design 17 100.0% 17
College of Hair Design- East Campus 27 93.1% 2 6.9% 29
Fullen School of Hair Design 8 100.0% 8 ITT Technical Institute-Omaha 22 100.0% 22 Joseph's College Cosmetology 28 93.3% 2 6.7% 30 Kaplan University-Lincoln Campus 6 100.0% 6 Kaplan University-Omaha Campus 10 90.9% 1 9.1% 11 La'James International College 11 100.0% 11
Mary Lanning Memorial Hospital School of Radiologic Technology Not applicable
Myotherapy Institute 6 100.0% 6
National American University-Bellevue Did not report freshmen data to IPEDS until 2012
Omaha School of Massage and Healthcare of Herzing University 20 83.3% 4 16.7% 24
Paul Mitchell the School Lincoln Did not report freshmen data to IPEDS until 2016
Regional West Medical Center School of Radiologic Technology Not applicable
The Creative Center 17 51.5% 16 48.5% 33 Universal College of Healing Arts 3 100.0% 3
University of Phoenix- Omaha Campus 0
Vatterott College Closed Vatterott College-Spring Valley 20 87.0% 3 13.0% 23
Xenon International Academy-Omaha 23 100.0% 23
Nebraska Total 12,651 81.1% 2,846 18.2% 102 0.7% 15,599
Continued on the next page.

Nebraska’s Coordinating Commission for Postsecondary Education – 2018 Progress Report 189
Table A6.7 Continued
Fall 2012
Sector or Institution
Nebraska Students
Out-of-State Students
Nonresident Aliens
Total N % N % N % Nebraska Public Institutions 10,298 86.3% 1,520 12.7% 117 1.0% 11,935 University of Nebraska 5,454 83.6% 979 15.0% 93 1.4% 6,526 Neb. College of Tech. Agriculture 75 81.5% 17 18.5% 92 University of Nebraska at Kearney 893 90.3% 82 8.3% 14 1.4% 989 University of Nebraska-Lincoln 2,975 78.7% 738 19.5% 66 1.7% 3,779 University of Neb. Medical Center Not applicable University of Nebraska at Omaha 1,511 90.7% 142 8.5% 13 0.8% 1,666 Nebraska State College System 924 75.9% 292 24.0% 2 0.2% 1,218 Chadron State College 218 59.4% 149 40.6% 367 Peru State College 120 70.2% 50 29.2% 1 0.6% 171 Wayne State College 586 86.2% 93 13.7% 1 0.1% 680 Nebraska Community Colleges 3,920 93.5% 249 5.9% 22 0.5% 4,191 Central Community College 713 98.5% 11 1.5% 724 Metropolitan Community College 989 97.6% 24 2.4% 1,013 Mid-Plains Community College 263 82.2% 56 17.5% 1 0.3% 320 Northeast Community College 660 95.4% 31 4.5% 1 0.1% 692 Southeast Community College 1,023 93.5% 68 6.2% 3 0.3% 1,094 Western Neb. Community College 272 78.2% 59 17.0% 17 4.9% 348 Nebraska Independent Institutions 1,623 55.2% 1,278 43.5% 38 1.3% 2,939 Bellevue University 35 74.5% 12 25.5% 47 Bryan College of Health Sciences 40 97.6% 1 2.4% 41 Clarkson College 37 86.0% 6 14.0% 43 College of St. Mary 68 76.4% 21 23.6% 89 Concordia University-Seward 138 47.3% 150 51.4% 4 1.4% 292 Creighton University 210 22.4% 712 75.8% 17 1.8% 939 Dana College Closed Doane Univ.-Arts & Sciences 280 86.7% 42 13.0% 1 0.3% 323 Doane Univ.-Grad. & Prof. Studies Grace University 38 55.9% 30 44.1% 68 Hastings College 140 59.8% 91 38.9% 3 1.3% 234 Little Priest Tribal College 3 100.0% 3 Midland University 238 78.0% 67 22.0% 305 Neb. Christian College of Hope Int’l 13 44.8% 16 55.2% 29 Neb. Indian Community College 13 81.3% 3 18.8% 16
Nebraska Methodist College of Nursing & Allied Health 27 93.1% 2 6.9% 29
Nebraska Wesleyan University 304 86.1% 46 13.0% 3 0.8% 353 Summit Christian College 6 46.2% 7 53.8% 13 Union College 1 3.1% 21 65.6% 10 31.3% 32 York College 32 38.6% 51 61.4% 83
Continued on the next page.

Nebraska’s Coordinating Commission for Postsecondary Education – 2018 Progress Report 190
Table A6.7 Continued
Fall 2012
Sector or Institution
Nebraska Students
Out-of-State Students
Nonresident Aliens
Total N % N % N % For-Profit/Career Schools 196 87.5% 28 12.5% 224
Capitol School of Hairstyling and Esthetics 44 88.0% 6 12.0% 50
CHI Health School of Radiologic Technology Not applicable
College of Hair Design 14 100.0% 14
College of Hair Design- East Campus 19 86.4% 3 13.6% 22
Fullen School of Hair Design 7 87.5% 1 12.5% 8 ITT Technical Institute-Omaha 16 100.0% 16 Joseph's College Cosmetology 30 93.8% 2 6.3% 32 Kaplan University-Lincoln Campus 1 100.0% 1 Kaplan University-Omaha Campus 4 80.0% 1 20.0% 5 La'James International College 6 100.0% 6
Mary Lanning Memorial Hospital School of Radiologic Technology Not applicable
Myotherapy Institute 3 100.0% 3
National American University-Bellevue 4 100.0% 4
Omaha School of Massage and Healthcare of Herzing University 6 75.0% 2 25.0% 8
Paul Mitchell the School Lincoln Did not report freshmen data to IPEDS until 2016
Regional West Medical Center School of Radiologic Technology Not applicable
The Creative Center 15 55.6% 12 44.4% 27 Universal College of Healing Arts 1 100.0% 1
University of Phoenix- Omaha Campus 0
Vatterott College Closed Vatterott College-Spring Valley 4 100.0% 4
Xenon International Academy-Omaha 22 95.7% 1 4.3% 23
Nebraska Total 12,117 80.3% 2,826 18.7% 155 1.0% 15,098
Continued on the next page.
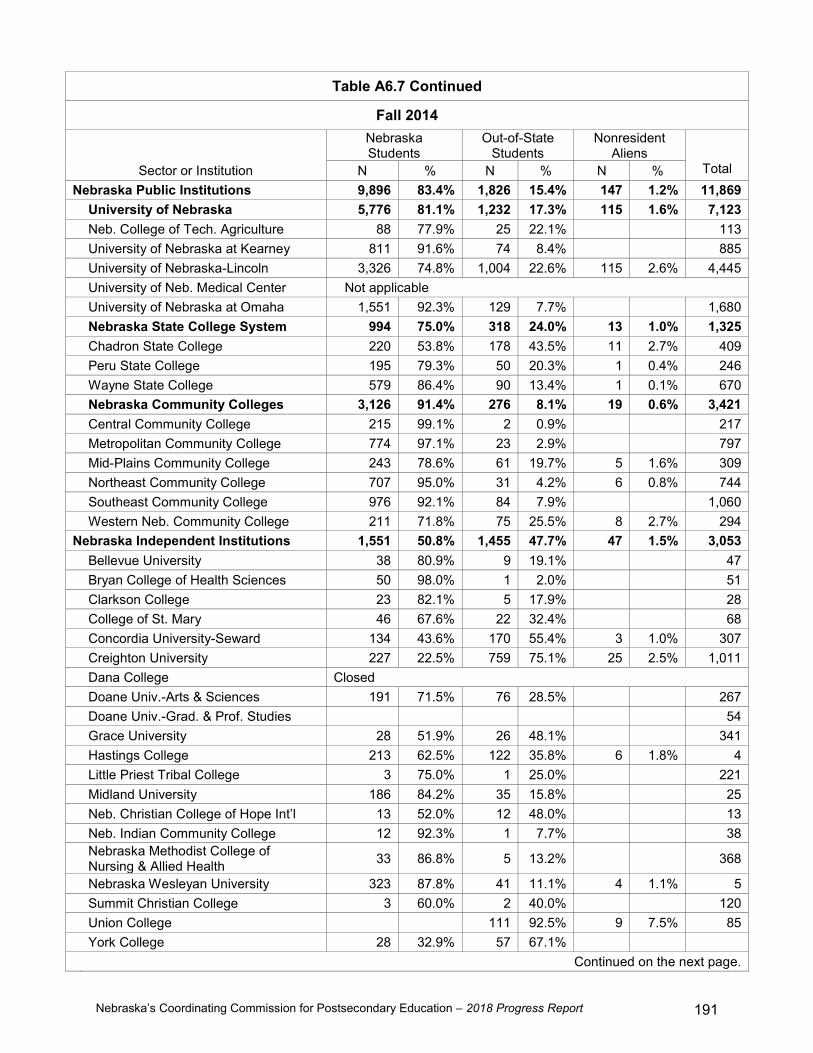
Nebraska’s Coordinating Commission for Postsecondary Education – 2018 Progress Report 191
Table A6.7 Continued
Fall 2014
Sector or Institution
Nebraska Students
Out-of-State Students
Nonresident Aliens
Total N % N % N % Nebraska Public Institutions 9,896 83.4% 1,826 15.4% 147 1.2% 11,869 University of Nebraska 5,776 81.1% 1,232 17.3% 115 1.6% 7,123 Neb. College of Tech. Agriculture 88 77.9% 25 22.1% 113 University of Nebraska at Kearney 811 91.6% 74 8.4% 885 University of Nebraska-Lincoln 3,326 74.8% 1,004 22.6% 115 2.6% 4,445 University of Neb. Medical Center Not applicable University of Nebraska at Omaha 1,551 92.3% 129 7.7% 1,680 Nebraska State College System 994 75.0% 318 24.0% 13 1.0% 1,325 Chadron State College 220 53.8% 178 43.5% 11 2.7% 409 Peru State College 195 79.3% 50 20.3% 1 0.4% 246 Wayne State College 579 86.4% 90 13.4% 1 0.1% 670 Nebraska Community Colleges 3,126 91.4% 276 8.1% 19 0.6% 3,421 Central Community College 215 99.1% 2 0.9% 217 Metropolitan Community College 774 97.1% 23 2.9% 797 Mid-Plains Community College 243 78.6% 61 19.7% 5 1.6% 309 Northeast Community College 707 95.0% 31 4.2% 6 0.8% 744 Southeast Community College 976 92.1% 84 7.9% 1,060 Western Neb. Community College 211 71.8% 75 25.5% 8 2.7% 294 Nebraska Independent Institutions 1,551 50.8% 1,455 47.7% 47 1.5% 3,053 Bellevue University 38 80.9% 9 19.1% 47 Bryan College of Health Sciences 50 98.0% 1 2.0% 51 Clarkson College 23 82.1% 5 17.9% 28 College of St. Mary 46 67.6% 22 32.4% 68 Concordia University-Seward 134 43.6% 170 55.4% 3 1.0% 307 Creighton University 227 22.5% 759 75.1% 25 2.5% 1,011 Dana College Closed Doane Univ.-Arts & Sciences 191 71.5% 76 28.5% 267 Doane Univ.-Grad. & Prof. Studies 54 Grace University 28 51.9% 26 48.1% 341 Hastings College 213 62.5% 122 35.8% 6 1.8% 4 Little Priest Tribal College 3 75.0% 1 25.0% 221 Midland University 186 84.2% 35 15.8% 25 Neb. Christian College of Hope Int’l 13 52.0% 12 48.0% 13 Neb. Indian Community College 12 92.3% 1 7.7% 38
Nebraska Methodist College of Nursing & Allied Health 33 86.8% 5 13.2% 368
Nebraska Wesleyan University 323 87.8% 41 11.1% 4 1.1% 5 Summit Christian College 3 60.0% 2 40.0% 120 Union College 111 92.5% 9 7.5% 85 York College 28 32.9% 57 67.1% Continued on the next page.

Nebraska’s Coordinating Commission for Postsecondary Education – 2018 Progress Report 192
Table A6.7 Continued
Fall 2014
Sector or Institution
Nebraska Students
Out-of-State Students
Nonresident Aliens
Total N % N % N % For-Profit/Career Schools 146 91.8% 13 8.2% 159
Capitol School of Hairstyling and Esthetics 30 100.0% 30
CHI Health School of Radiologic Technology Not applicable
College of Hair Design 8 100.0% 8
College of Hair Design- East Campus 4 100.0% 4
Fullen School of Hair Design 5 100.0% 5 ITT Technical Institute-Omaha 7 100.0% 7 Joseph's College Cosmetology 30 96.8% 1 3.2% 31 Kaplan University-Lincoln Campus 0 Kaplan University-Omaha Campus 2 100.0% 2 La'James International College 3 100.0% 3
Mary Lanning Memorial Hospital School of Radiologic Technology Not applicable
Myotherapy Institute 7 100.0% 7
National American University-Bellevue 1 100.0% 1
Omaha School of Massage and Healthcare of Herzing University 8 88.9% 1 11.1% 9
Paul Mitchell the School Lincoln Did not report freshmen data to IPEDS until 2016
Regional West Medical Center School of Radiologic Technology Not applicable
The Creative Center 16 66.7% 8 33.3% 24 Universal College of Healing Arts 1 100.0% 1
University of Phoenix- Omaha Campus Closed
Vatterott College Closed Vatterott College-Spring Valley 0
Xenon International Academy-Omaha 24 88.9% 3 11.1% 27
Nebraska Total 11,593 76.9% 3,294 21.8% 194 1.3% 15,081
Continued on the next page.
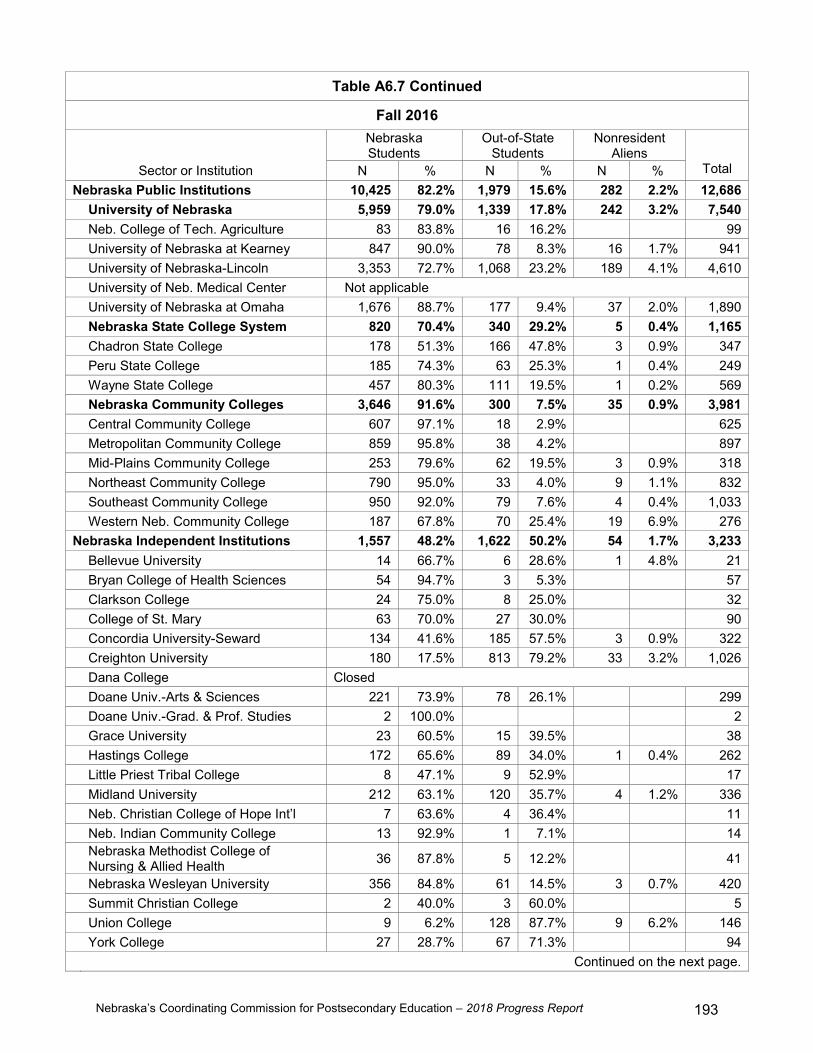
Nebraska’s Coordinating Commission for Postsecondary Education – 2018 Progress Report 193
Table A6.7 Continued
Fall 2016
Sector or Institution
Nebraska Students
Out-of-State Students
Nonresident Aliens
Total N % N % N % Nebraska Public Institutions 10,425 82.2% 1,979 15.6% 282 2.2% 12,686 University of Nebraska 5,959 79.0% 1,339 17.8% 242 3.2% 7,540 Neb. College of Tech. Agriculture 83 83.8% 16 16.2% 99 University of Nebraska at Kearney 847 90.0% 78 8.3% 16 1.7% 941 University of Nebraska-Lincoln 3,353 72.7% 1,068 23.2% 189 4.1% 4,610 University of Neb. Medical Center Not applicable University of Nebraska at Omaha 1,676 88.7% 177 9.4% 37 2.0% 1,890 Nebraska State College System 820 70.4% 340 29.2% 5 0.4% 1,165 Chadron State College 178 51.3% 166 47.8% 3 0.9% 347 Peru State College 185 74.3% 63 25.3% 1 0.4% 249 Wayne State College 457 80.3% 111 19.5% 1 0.2% 569 Nebraska Community Colleges 3,646 91.6% 300 7.5% 35 0.9% 3,981 Central Community College 607 97.1% 18 2.9% 625 Metropolitan Community College 859 95.8% 38 4.2% 897 Mid-Plains Community College 253 79.6% 62 19.5% 3 0.9% 318 Northeast Community College 790 95.0% 33 4.0% 9 1.1% 832 Southeast Community College 950 92.0% 79 7.6% 4 0.4% 1,033 Western Neb. Community College 187 67.8% 70 25.4% 19 6.9% 276 Nebraska Independent Institutions 1,557 48.2% 1,622 50.2% 54 1.7% 3,233 Bellevue University 14 66.7% 6 28.6% 1 4.8% 21 Bryan College of Health Sciences 54 94.7% 3 5.3% 57 Clarkson College 24 75.0% 8 25.0% 32 College of St. Mary 63 70.0% 27 30.0% 90 Concordia University-Seward 134 41.6% 185 57.5% 3 0.9% 322 Creighton University 180 17.5% 813 79.2% 33 3.2% 1,026 Dana College Closed Doane Univ.-Arts & Sciences 221 73.9% 78 26.1% 299 Doane Univ.-Grad. & Prof. Studies 2 100.0% 2 Grace University 23 60.5% 15 39.5% 38 Hastings College 172 65.6% 89 34.0% 1 0.4% 262 Little Priest Tribal College 8 47.1% 9 52.9% 17 Midland University 212 63.1% 120 35.7% 4 1.2% 336 Neb. Christian College of Hope Int’l 7 63.6% 4 36.4% 11 Neb. Indian Community College 13 92.9% 1 7.1% 14
Nebraska Methodist College of Nursing & Allied Health 36 87.8% 5 12.2% 41
Nebraska Wesleyan University 356 84.8% 61 14.5% 3 0.7% 420 Summit Christian College 2 40.0% 3 60.0% 5 Union College 9 6.2% 128 87.7% 9 6.2% 146 York College 27 28.7% 67 71.3% 94 Continued on the next page.

Nebraska’s Coordinating Commission for Postsecondary Education – 2018 Progress Report 194
Table A6.7 Continued
Fall 2016
Sector or Institution
Nebraska Students
Out-of-State Students
Nonresident Aliens
Total N % N % N % For-Profit/Career Schools 128 87.1% 19 12.9% 147
Capitol School of Hairstyling and Esthetics 15 75.0% 5 25.0% 20
CHI Health School of Radiologic Technology Not applicable
College of Hair Design 10 100.0% 10
College of Hair Design- East Campus 9 100.0% 9
Fullen School of Hair Design No longer an IPEDS reporting institution ITT Technical Institute-Omaha Closed Joseph's College Cosmetology 38 100.0% 38 Kaplan University-Lincoln Campus 0 Kaplan University-Omaha Campus 0 La'James International College 1 50.0% 1 50.0% 2
Mary Lanning Memorial Hospital School of Radiologic Technology Not applicable
Myotherapy Institute 4 100.0% 4
National American University-Bellevue 2 100.0% 2
Omaha School of Massage and Healthcare of Herzing University 7 87.5% 1 12.5% 8
Paul Mitchell the School Lincoln 1 33.3% 2 66.7% 3
Regional West Medical Center School of Radiologic Technology No longer an IPEDS reporting institution
The Creative Center 12 57.1% 9 42.9% 21 Universal College of Healing Arts 1 100.0% 1
University of Phoenix- Omaha Campus Closed
Vatterott College Closed Vatterott College-Spring Valley Closed
Xenon International Academy-Omaha 28 96.6% 1 3.4% 29
Nebraska Total 12,110 75.4% 3,620 22.5% 336 2.1% 16,066 Note. Counts include full-time and part-time students. Counts do not include students with reported unknown states of residence and students for whom no residence information was reported. Data source: National Center for Education Statistics, IPEDS fall 2006, 2008, 2010, 2012, 2014, and 2016 surveys.

Nebraska’s Coordinating Commission for Postsecondary Education – 2018 Progress Report 195
Table A6.8 Non-Nebraska, First-Time Freshmen Enrolled at Nebraska Institutions
Fall 2016 Compared to Fall 2006
Institution
Fall 2006 Fall 2016 ∆ Since
Fall 2006
N % of Non-NE FTF
N
% of Non-NE FTF
University of Nebraska Nebraska College of Technical Agriculture 37 1.1% 16 0.4% -21 University of Nebraska at Kearney 156 4.8% 125 2.8% -31 University of Nebraska-Lincoln 767 23.6% 1,391 31.4% 624 University of Nebraska Medical Center - - - - 0 University of Nebraska at Omaha 122 3.8% 268 6.1% 146 Nebraska State College System Chadron State College 127 3.9% 191 4.3% 64 Peru State College 31 1.0% 69 1.6% 38 Wayne State College 92 2.8% 113 2.6% 21 Nebraska Community Colleges Central Community College 9 0.3% 19 0.4% 10 Metropolitan Community College 63 1.9% 85 1.9% 22 Mid-Plains Community College 63 1.9% 92 2.1% 29 Northeast Community College 54 1.7% 57 1.3% 3 Southeast Community College 64 2.0% 122 2.8% 58 Western Nebraska Community College 84 2.6% 116 2.6% 32 Nebraska Independent Institutions Bellevue University 40 1.2% 14 0.3% -26 Bryan College of Health Sciences 0 0.0% 3 0.1% 3 Clarkson College 32 1.0% 8 0.2% -24 College of Saint Mary 22 0.7% 31 0.7% 9 Concordia University-Seward 182 5.6% 188 4.2% 6 Creighton University 610 18.8% 853 19.3% 243 Dana College 65 2.0% - - -65 Doane University-Arts & Sciences 50 1.5% 78 1.8% 28 Doane University-Grad. and Prof. Studies 0 0.0% 0 0.0% 0 Grace University 19 0.6% 15 0.3% -4 Hastings College 90 2.8% 98 2.2% 8 Little Priest Tribal College 2 0.1% 11 0.2% 9 Midland University 58 1.8% 129 2.9% 71 Nebraska Christian College of Hope International University 23 0.7% 6 0.1% -17
Nebraska Indian Community College 0 0.0% 5 0.1% 5 Nebraska Methodist College of Nursing & Allied Health 2 0.1% 5 0.1% 3
Nebraska Wesleyan University 43 1.3% 64 1.4% 21 Summit Christian College 3 0.1% 4 0.1% 1 Union College 168 5.2% 145 3.3% -23 York College 67 2.1% 67 1.5% 0
Continued on the next page.

Nebraska’s Coordinating Commission for Postsecondary Education – 2018 Progress Report 196
Table A6.8 Continued
Institution
Fall 2006 Fall 2016 ∆ Since
Fall 2006
N % of Non-NE FTF
N
% of Non-NE FTF
For-Profit/Career Schools Capitol School of Hairstyling and Esthetics 0 0.0% 12 0.3% 12 CHI Health School of Radiologic Technology - - - - 0 College of Hair Design 1 0.0% 0 0.0% -1 College of Hair Design-East Campus - - 0 0.0% 0 Fullen School of Hair Design 2 0.1% - - -2 ITT Technical Institute-Omaha 13 0.4% - - -13 Joseph's College Cosmetology 8 0.2% 0 0.0% -8 Kaplan University-Lincoln Campus 6 0.2% 1 0.0% -5 Kaplan University-Omaha Campus 25 0.8% 7 0.2% -18 La'James International College 3 0.1% 2 0.0% -1 Mary Lanning Memorial Hospital School of Radiologic Technology - - - - 0
Myotherapy Institute 0 0.0% 0 0.0% 0 National American University-Bellevue - - 0 0.0% 0 Omaha School of Massage and Healthcare of Herzing University 9 0.3% 4 0.1% -5
Paul Mitchell the School Lincoln - - 2 0.0% 2 Regional West Medical Center School of Radiologic Technology - - - - 0
The Creative Center 14 0.4% 9 0.2% -5 Universal College of Healing Arts 1 0.0% 2 0.0% 1 University of Phoenix-Omaha Campus 0 0.0% - - 0 Vatterott College 0 0.0% - - 0 Vatterott College-Spring Valley 14 0.4% - - -14 Xenon International Academy-Omaha 5 0.2% 1 0.0% -4
Nebraska Total 3,246 100.0% 4,428 100.0% 1,182 Note. Counts include out-of-state and nonresident alien students and full-time and part-time students. Counts do not include students with reported unknown states of residence and students for whom no residence information was reported. FTF = first-time freshmen; ∆ = change. Data source: National Center for Education Statistics, IPEDS fall 2006 and fall 2016 surveys.
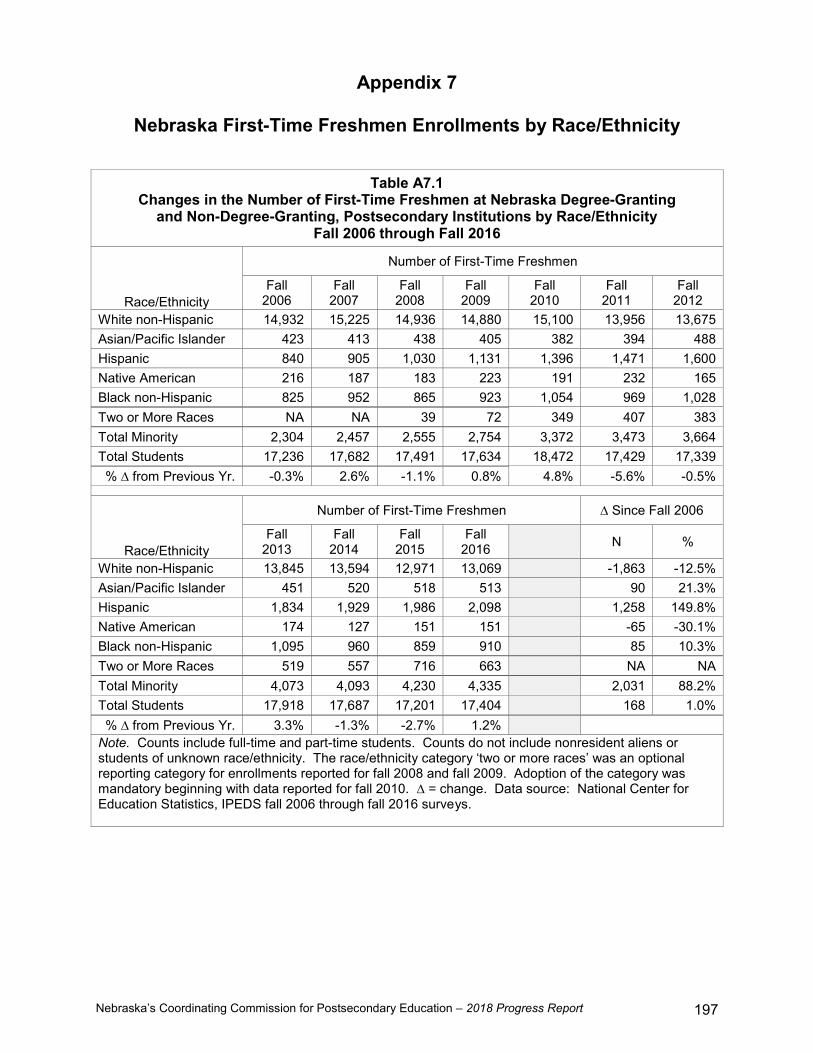
Nebraska’s Coordinating Commission for Postsecondary Education – 2018 Progress Report 197
Appendix 7
Nebraska First-Time Freshmen Enrollments by Race/Ethnicity
Table A7.1 Changes in the Number of First-Time Freshmen at Nebraska Degree-Granting
and Non-Degree-Granting, Postsecondary Institutions by Race/Ethnicity Fall 2006 through Fall 2016
Race/Ethnicity
Number of First-Time Freshmen
Fall 2006
Fall 2007
Fall 2008
Fall 2009
Fall 2010
Fall 2011
Fall 2012
White non-Hispanic 14,932 15,225 14,936 14,880 15,100 13,956 13,675 Asian/Pacific Islander 423 413 438 405 382 394 488 Hispanic 840 905 1,030 1,131 1,396 1,471 1,600 Native American 216 187 183 223 191 232 165 Black non-Hispanic 825 952 865 923 1,054 969 1,028 Two or More Races NA NA 39 72 349 407 383 Total Minority 2,304 2,457 2,555 2,754 3,372 3,473 3,664 Total Students 17,236 17,682 17,491 17,634 18,472 17,429 17,339 % ∆ from Previous Yr. -0.3% 2.6% -1.1% 0.8% 4.8% -5.6% -0.5%
Race/Ethnicity
Number of First-Time Freshmen ∆ Since Fall 2006
Fall 2013
Fall 2014
Fall 2015
Fall 2016 N %
White non-Hispanic 13,845 13,594 12,971 13,069 -1,863 -12.5% Asian/Pacific Islander 451 520 518 513 90 21.3% Hispanic 1,834 1,929 1,986 2,098 1,258 149.8% Native American 174 127 151 151 -65 -30.1% Black non-Hispanic 1,095 960 859 910 85 10.3% Two or More Races 519 557 716 663 NA NA Total Minority 4,073 4,093 4,230 4,335 2,031 88.2% Total Students 17,918 17,687 17,201 17,404 168 1.0% % ∆ from Previous Yr. 3.3% -1.3% -2.7% 1.2%
Note. Counts include full-time and part-time students. Counts do not include nonresident aliens or students of unknown race/ethnicity. The race/ethnicity category ‘two or more races’ was an optional reporting category for enrollments reported for fall 2008 and fall 2009. Adoption of the category was mandatory beginning with data reported for fall 2010. ∆ = change. Data source: National Center for Education Statistics, IPEDS fall 2006 through fall 2016 surveys.

Nebraska’s Coordinating Commission for Postsecondary Education – 2018 Progress Report 198
Table A7.2 Comparison of the Percentage Distributions of Nebraska High School Graduates
and First-Time Freshmen at Nebraska Degree-Granting and Non-Degree-Granting, Postsecondary Institutions by Race/Ethnicity
2005-2006/Fall 2006 through 2015-2016/Fall 2016
Race/Ethnicity
2005-2006 Neb. HS Grads Fall 2006 FTF % Point Difference High School
Grads vs FTF N % N % White non-Hispanic 18,448 87.1% 14,932 86.6% -0.5% Asian/Pacific Islander 382 1.8% 423 2.5% 0.7% Hispanic 1,186 5.6% 840 4.9% -0.7% Native American 202 1.0% 216 1.3% 0.3% Black non-Hispanic 970 4.6% 825 4.8% 0.2% Total Students 21,188 100.0% 17,236 100.0% -0.5%
Race/Ethnicity
2006-2007 Neb. HS Grads Fall 2007 FTF % Point Difference High School
Grads vs FTF N % N % White non-Hispanic 18,399 86.6% 15,225 86.1% -0.5% Asian/Pacific Islander 393 1.9% 413 2.3% 0.4% Hispanic 1,270 6.0% 905 5.1% -0.9% Native American 206 1.0% 187 1.1% 0.1% Black non-Hispanic 973 4.6% 952 5.4% 0.8% Total Students 21,241 100.0% 17,682 100.0%
Race/Ethnicity
2007-2008 Neb. HS Grads Fall 2008 FTF % Point Difference High School
Grads vs FTF N % N % White non-Hispanic 18,910 85.2% 14,936 85.6% 0.4% Asian/Pacific Islander 402 1.8% 438 2.5% 0.7% Hispanic 1,508 6.8% 1,030 5.9% -0.9% Native American 245 1.1% 183 1.0% -0.1% Black non-Hispanic 1,120 5.0% 865 5.0% 0.0% Total Known Race 22,185 100.0% 17,452 100.0% Two or More Races 39 Total Students 17,491
Race/Ethnicity
2008-2009 Neb. HS Grads Fall 2009 FTF % Point Difference High School
Grads vs FTF N % N % White non-Hispanic 18,172 84.1% 14,880 84.7% 0.6% Asian/Pacific Islander 393 1.8% 405 2.3% 0.5% Hispanic 1,689 7.8% 1,131 6.4% -1.4% Native American 238 1.1% 223 1.3% 0.2% Black non-Hispanic 1,126 5.2% 923 5.3% 0.1% Total Known Race 21,618 100.0% 17,562 100.0% Two or More Races 72 Total Students 17,634
Continued on the next page.

Nebraska’s Coordinating Commission for Postsecondary Education – 2018 Progress Report 199
Table A7.2 Continued
Race/Ethnicity
2009-2010 Neb. HS Grads Fall 2010 FTF % Point Difference High School Grads
vs FTF N % N % White non-Hispanic 17,795 82.7% 15,100 83.3% 0.6% Asian/Pacific Islander 410 1.9% 382 2.1% 0.2% Hispanic 1,892 8.8% 1,396 7.7% -1.1% Native American 207 1.0% 191 1.1% 0.1% Black non-Hispanic 1,209 5.6% 1,054 5.8% 0.2% Total Known Race 21,513 100.0% 18,132 100.0% Two or More Races 349 Total Students 18,472
Race/Ethnicity
2010-2011 Neb. HS Grads Fall 2011 FTF % Point Difference High School
Grads vs FTF N % N % White non-Hispanic 17,738 78.4% 13,956 80.1% 1.7% Asian/Pacific Islander 477 2.1% 394 2.3% 0.2% Hispanic 2,457 10.9% 1,471 8.4% -2.4% Native American 244 1.1% 232 1.3% 0.3% Black non-Hispanic 1,205 5.3% 969 5.6% 0.2% Two or More Races 516 2.3% 407 2.3% 0.1% Total Students 22,637 100.0% 17,429 100.0%
Race/Ethnicity
2011-2012 Neb. HS Grads Fall 2012 FTF % Point Difference High School Grads
vs FTF N % N % White non-Hispanic 17,390 76.7% 13,675 78.9% 2.2% Asian/Pacific Islander 544 2.4% 488 2.8% 0.4% Hispanic 2,591 11.4% 1,600 9.2% -2.2% Native American 279 1.2% 165 1.0% -0.3% Black non-Hispanic 1,324 5.8% 1,028 5.9% 0.1% Two or More Races 550 2.4% 383 2.2% -0.2% Total Students 22,678 100.0% 17,339 100.0%
Race/Ethnicity
2012-2013 Neb. HS Grads Fall 2013 FTF % Point Difference High School Grads
vs FTF N % N % White non-Hispanic 17,092 75.5% 13,845 77.3% 1.8% Asian/Pacific Islander 493 2.2% 451 2.5% 0.3% Hispanic 2,761 12.2% 1,834 10.2% -2.0% Native American 243 1.1% 174 1.0% -0.1% Black non-Hispanic 1,338 5.9% 1,095 6.1% 0.2% Two or More Races 714 3.2% 519 2.9% -0.3% Total Students 22,641 100.0% 17,918 100.0%
Continued on the next page.

Nebraska’s Coordinating Commission for Postsecondary Education – 2018 Progress Report 200
Table A7.2 Continued
Race/Ethnicity
2013-2014 Neb. HS Grads Fall 2014 FTF % Point Difference High School Grads
vs FTF N % N % White non-Hispanic 17,168 74.6% 13,594 76.9% 2.2% Asian/Pacific Islander 619 2.7% 520 2.9% 0.2% Hispanic 3,024 13.1% 1,929 10.9% -2.2% Native American 226 1.0% 127 0.7% -0.3% Black non-Hispanic 1,337 5.8% 960 5.4% -0.4% Two or More Races 630 2.7% 557 3.1% 0.4% Total Students 23,004 100.0% 17,687 100.0%
Race/Ethnicity
2014-2015 Neb. HS Grads Fall 2015 FTF % Point Difference High School Grads
vs FTF N % N % White non-Hispanic 16,976 74.1% 12,971 75.4% 1.3% Asian/Pacific Islander 625 2.7% 518 3.0% 0.3% Hispanic 3,151 13.8% 1,986 11.5% -2.2% Native American 235 1.0% 151 0.9% -0.1% Black non-Hispanic 1,247 5.4% 859 5.0% -0.4% Two or More Races 678 3.0% 716 4.2% 1.2% Total Students 22,912 100.0% 17,201 100.0%
Race/Ethnicity
2015-2016 Neb. HS Grads Fall 2016 FTF % Point Difference High School Grads
vs FTF N % N % White non-Hispanic 16,953 73.9% 13,069 75.1% 1.2% Asian/Pacific Islander 630 2.7% 513 2.9% 0.2% Hispanic 3,190 13.9% 2,098 12.1% -1.8% Native American 224 1.0% 151 0.9% -0.1% Black non-Hispanic 1,350 5.9% 910 5.2% -0.7% Two or More Races 598 2.6% 663 3.8% 1.2% Total Students 22,945 100.0% 17,404 100.0% Note. High school graduates include graduates of nonpublic schools, public schools, educational service units, and state-operated schools. Graduates do not include GED recipients or completers who did not receive regular diplomas. First-time freshmen include full-time and part-time students. Counts do not include nonresident aliens or students of unknown race/ethnicity. The race/ethnicity category ‘two or more races’ was an optional reporting category for enrollments reported for fall 2008 and fall 2009. Adoption of the category was mandatory beginning with data reported for fall 2010. FTF = first-time freshmen. HS = high school. Data sources: For high school graduates: Nebraska Department of Education, January 2017. For first-time freshmen: National Center for Education Statistics, IPEDS fall 2006 through 2016 surveys.

Nebraska’s Coordinating Commission for Postsecondary Education – 2018 Progress Report 201
Table A7.3 Nebraska First-Time Freshmen Sector Enrollments by Race/Ethnicity
Fall 2006 through Fall 2016
Fall 2006
Sector of Higher Education
White non-Hispanic
Asian/Pacific Islander Hispanic
N % N % N %
University of Nebraska 5,651 37.8% 181 42.8% 285 33.9%
Nebraska State College System 984 6.6% 10 2.4% 33 3.9%
Nebraska Community Colleges 4,664 31.2% 107 25.3% 364 43.3%
Independent Colleges and Universities 2,747 18.4% 113 26.7% 124 14.8%
For-Profit/Career Schools 886 5.9% 12 2.8% 34 4.0%
Total 14,932 100.0% 423 100.0% 840 100.0%
Sector of Higher Education
Native Americana
Black non-Hispanic Total
N % N % N %
University of Nebraska 49 22.7% 203 24.6% 6,369 37.0%
Nebraska State College System 20 9.3% 45 5.5% 1,092 6.3%
Nebraska Community Colleges 65 30.1% 296 35.9% 5,496 31.9%
Independent Colleges and Universities 67 31.0% 97 11.8% 3,148 18.3%
For-Profit/Career Schools 15 6.9% 184 22.3% 1,131 6.6%
Total 216 100.0% 825 100.0% 17,236 100.0% a A total of 46 (21.3%) of the 216 Native Americans who were first-time freshmen in 2006 were enrolled at Little Priest Tribal College (LPTC) or Nebraska Indian Community College (NICC), and 21 (9.7%) were enrolled at other institutions within the independent sector. For the purpose of comparing the racial/ethnic groups, excluding the tribal colleges results in the following distribution for Native Americans for 2006:
University of Nebraska (49) 28.8% Nebraska State College System (20) 11.8% Nebraska Community Colleges (65) 38.2% Independent Colleges and Universities (21) 12.4% For-Profit/Career Schools (15) 8.8%
Continued on the next page.

Nebraska’s Coordinating Commission for Postsecondary Education – 2018 Progress Report 202
Table A7.3 Continued
Fall 2007
Sector of Higher Education
White non-Hispanic
Asian/Pacific Islander Hispanic
N % N % N %
University of Nebraska 5,628 37.0% 173 41.9% 282 31.2%
Nebraska State College System 1,051 6.9% 7 1.7% 39 4.3%
Nebraska Community Colleges 4,947 32.5% 95 23.0% 377 41.7%
Independent Colleges and Universities 2,712 17.8% 130 31.5% 175 19.3%
For-Profit/Career Schools 887 5.8% 8 1.9% 32 3.5%
Total 15,225 100.0% 413 100.0% 905 100.0%
Sector of Higher Education
Native Americana
Black non-Hispanic Total
N % N % N %
University of Nebraska 35 18.7% 239 25.1% 6,357 36.0%
Nebraska State College System 24 12.8% 47 4.9% 1,168 6.6%
Nebraska Community Colleges 59 31.6% 354 37.2% 5,832 33.0%
Independent Colleges and Universities 61 32.6% 111 11.7% 3,189 18.0%
For-Profit/Career Schools 8 4.3% 201 21.1% 1,136 6.4%
Total 187 100.0% 952 100.0% 17,682 100.0% a A total of 43 (23.0%) of the 187 Native Americans who were first-time freshmen in 2007 were enrolled at Little Priest Tribal College (LPTC) or Nebraska Indian Community College (NICC), and 18 (9.6%) were enrolled at other institutions within the independent sector. For the purpose of comparing the racial/ethnic groups, excluding the tribal colleges results in the following distribution for Native Americans for 2007:
University of Nebraska (35) 24.3% Nebraska State College System (24) 16.7% Nebraska Community Colleges (59) 41.0% Independent Colleges and Universities (18) 12.5% For-Profit/Career Schools (8) 5.6%
Continued on the next page.

Nebraska’s Coordinating Commission for Postsecondary Education – 2018 Progress Report 203
Table A7.3 Continued
Fall 2008
Sector of Higher Education
White non-Hispanic
Asian/Pacific Islander Hispanic
N % N % N %
University of Nebraska 6,003 40.2% 160 36.5% 325 31.6%
Nebraska State College System 1,089 7.3% 7 1.6% 34 3.3%
Neb. Community Colleges 4,641 31.1% 109 24.9% 427 41.5%
Independent Colleges and Universities 2,591 17.3% 158 36.1% 213 20.7%
For-Profit/Career Schools 612 4.1% 4 0.9% 31 3.0%
Total 14,936 100.0% 438 100.0% 1,030 100.0%
Sector of Higher Education
Native Americana
Black non-Hispanic
Two or More Races Total
N % N % N % N %
University of Nebraska 35 19.1% 220 25.4% 0 0.0% 6,743 38.6%
Nebraska State College System 21 11.5% 46 5.3% 4 10.3% 1,201 6.9%
Neb. Community Colleges 43 23.5% 335 38.7% 25 64.1% 5,580 31.9%
Independent Colleges and Universities 78 42.6% 146 16.9% 10 25.6% 3,196 18.3%
For-Profit/Career Schools 6 3.3% 118 13.6% 0 0.0% 771 4.4%
Total 183 100.0% 865 100.0% 39 100.0% 17,491 100.0% a A total of 49 (26.8%) of the 183 Native Americans who were first-time freshmen in 2008 were enrolled at Little Priest Tribal College (LPTC) or Nebraska Indian Community College (NICC), and 29 (15.8%) were enrolled at other institutions within the independent sector. For the purpose of comparing the racial/ethnic groups, excluding the tribal colleges results in the following distribution for Native Americans for 2008:
University of Nebraska (35) 26.1% Nebraska State College System (21) 15.7% Nebraska Community Colleges (43) 32.1% Independent Colleges and Universities (29) 21.6% For-Profit/Career Schools (6) 4.5%
Continued on the next page.

Nebraska’s Coordinating Commission for Postsecondary Education – 2018 Progress Report 204
Table A7.3 Continued
Fall 2009
Sector of Higher Education
White non-Hispanic
Asian/Pacific Islander Hispanic
N % N % N %
University of Nebraska 5,754 38.6% 141 34.8% 355 31.5%
Nebraska State College System 912 6.1% 11 2.7% 42 3.7%
Neb. Community Colleges 4,912 33.0% 87 21.5% 509 45.0%
Independent Colleges and Universities 2,686 18.1% 153 37.8% 181 16.0%
For-Profit/Career Schools 616 4.1% 13 3.2% 44 3.9%
Total 14,880 100.0% 405 100.0% 1,131 100.0%
Sector of Higher Education
Native Americana
Black non-Hispanic
Two or More Races Total
N % N % N % N %
University of Nebraska 39 17.5% 255 27.6% 0 0.0% 6,544 37.1%
Nebraska State College System 16 7.2% 36 3.9% 17 23.6% 1,034 5.9%
Neb. Community Colleges 66 29.6% 384 41.6% 30 41.7% 5,988 34.0%
Independent Colleges and Universities 95 42.6% 155 16.8% 24 33.3% 3,294 18.7%
For-Profit/Career Schools 7 3.1% 93 10.1% 1 1.4% 774 4.4%
Total 223 100.0% 923 100.0% 72 100.0% 17,634 100.0% a A total of 65 (29.1%) of the 223 Native Americans who were first-time freshmen in 2009 were enrolled at Little Priest Tribal College (LPTC) or Nebraska Indian Community College (NICC), and 30 (13.5%) were enrolled at other institutions within the independent sector. For the purpose of comparing the racial/ethnic groups, excluding the tribal colleges results in the following distribution for Native Americans for 2009:
University of Nebraska (39) 24.7% Nebraska State College System (16) 10.1% Nebraska Community Colleges (66) 41.8% Independent Colleges and Universities (30) 19.0% For-Profit/Career Schools (7) 4.4%
Continued on the next page.

Nebraska’s Coordinating Commission for Postsecondary Education – 2018 Progress Report 205
Table A7.3 Continued
Fall 2010
Sector of Higher Education
White non-Hispanic
Asian/Pacific Islander Hispanic
N % N % N %
University of Nebraska 5,910 39.1% 119 31.2% 432 30.9%
Nebraska State College System 1,073 7.1% 9 2.4% 68 4.9%
Neb. Community Colleges 4,786 31.7% 92 24.1% 629 45.1%
Independent Colleges and Universities 2,595 17.2% 149 39.0% 214 15.3%
For-Profit/Career Schools 736 4.9% 13 3.4% 53 3.8%
Total 15,100 100.0% 382 100.0% 1,396 100.0%
Sector of Higher Education
Native Americana
Black non-Hispanic
Two or More Races Total
N % N % N % N %
University of Nebraska 19 9.9% 233 22.1% 151 43.3% 6,864 37.2%
Nebraska State College System 18 9.4% 53 5.0% 18 5.2% 1,239 6.7%
Neb. Community Colleges 59 30.9% 491 46.6% 74 21.2% 6,131 33.2%
Independent Colleges and Universities 84 44.0% 129 12.2% 102 29.2% 3,273 17.7%
For-Profit/Career Schools 11 5.8% 148 14.0% 4 1.1% 965 5.2%
Total 191 100.0% 1,054 100.0% 349 100.0% 18,472 100.0% a A total of 64 (33.5%) of the 191 Native Americans who were first-time freshmen in 2010 were enrolled at Little Priest Tribal College (LPTC) or Nebraska Indian Community College (NICC), and 20 (10.5%) were enrolled at other institutions within the independent sector. For the purpose of comparing the racial/ethnic groups, excluding the tribal colleges results in the following distribution for Native Americans for 2010:
University of Nebraska (19) 15.0% Nebraska State College System (18) 14.2% Nebraska Community Colleges (59) 46.4% Independent Colleges and Universities (20) 15.7% For-Profit/Career Schools (11) 8.7%
Continued on the next page.

Nebraska’s Coordinating Commission for Postsecondary Education – 2018 Progress Report 206
Table A7.3 Continued
Fall 2011
Sector of Higher Education
White non-Hispanic
Asian/Pacific Islander Hispanic
N % N % N %
University of Nebraska 5,477 39.2% 139 35.3% 505 34.3%
Nebraska State College System 1,007 7.2% 8 2.0% 68 4.6%
Neb. Community Colleges 4,491 32.2% 107 27.2% 659 44.8%
Independent Colleges and Universities 2,527 18.1% 133 33.8% 203 13.8%
For-Profit/Career Schools 454 3.3% 7 1.8% 36 2.4%
Total 13,956 100.0% 394 100.0% 1,471 100.0%
Sector of Higher Education
Native Americana
Black non-Hispanic
Two or More Races Total
N % N % N % N %
University of Nebraska 16 6.9% 229 23.6% 188 46.2% 6,554 37.6%
Nebraska State College System 14 6.0% 74 7.6% 30 7.4% 1,201 6.9%
Neb. Community Colleges 89 38.4% 454 46.9% 79 19.4% 5,879 33.7%
Independent Colleges and Universities 106 45.7% 160 16.5% 102 25.1% 3,231 18.5%
For-Profit/Career Schools 7 3.0% 52 5.4% 8 2.0% 564 3.2%
Total 232 100.0% 969 100.0% 407 100.0% 17,429 100.0% a A total of 91 (39.2%) of the 232 Native Americans who were first-time freshmen in 2011 were enrolled at Little Priest Tribal College (LPTC) or Nebraska Indian Community College (NICC), and 15 (6.5%) were enrolled at other institutions within the independent sector. For the purpose of comparing the racial/ethnic groups, excluding the tribal colleges results in the following distribution for Native Americans for 2011:
University of Nebraska (16) 11.4% Nebraska State College System (14) 9.9% Nebraska Community Colleges (89) 63.1% Independent Colleges and Universities (15) 10.6% For-Profit/Career Schools (7) 5.0%
Continued on the next page.

Nebraska’s Coordinating Commission for Postsecondary Education – 2018 Progress Report 207
Table A7.3 Continued
Fall 2012
Sector of Higher Education
White non-Hispanic
Asian/Pacific Islander Hispanic
N % N % N %
University of Nebraska 5,366 39.2% 188 38.5% 493 30.8%
Nebraska State College System 1,011 7.4% 14 2.9% 89 5.6%
Neb. Community Colleges 4,507 33.0% 119 24.4% 744 46.5%
Independent Colleges and Universities 2,433 17.8% 160 32.8% 229 14.3%
For-Profit/Career Schools 358 2.6% 7 1.4% 45 2.8%
Total 13,675 100.0% 488 100.0% 1,600 100.0%
Sector of Higher Education
Native Americana
Black non-Hispanic
Two or More Races Total
N % N % N % N %
University of Nebraska 15 9.1% 233 22.7% 218 56.9% 6,513 37.6%
Nebraska State College System 17 10.3% 106 10.3% 26 6.8% 1,263 7.3%
Neb. Community Colleges 64 38.8% 509 49.5% 51 13.3% 5,994 34.6%
Independent Colleges and Universities 62 37.6% 124 12.1% 81 21.1% 3,089 17.8%
For-Profit/Career Schools 7 4.2% 56 5.4% 7 1.8% 480 2.8%
Total 165 100.0% 1,028 100.0% 383 100.0% 17,339 100.0% a A total of 49 (29.7%) of the 165 Native Americans who were first-time freshmen in 2012 were enrolled at Little Priest Tribal College (LPTC) or Nebraska Indian Community College (NICC), and 13 (7.9%) were enrolled at other institutions within the independent sector. For the purpose of comparing the racial/ethnic groups, excluding the tribal colleges results in the following distribution for Native Americans for 2012:
University of Nebraska (15) 12.9% Nebraska State College System (17) 14.7% Nebraska Community Colleges (64) 55.2% Independent Colleges and Universities (13) 11.2% For-Profit/Career Schools (7) 6.0%
Continued on the next page.

Nebraska’s Coordinating Commission for Postsecondary Education – 2018 Progress Report 208
Table A7.3 Continued
Fall 2013
Sector of Higher Education
White non-Hispanic
Asian/Pacific Islander Hispanic
N % N % N %
University of Nebraska 5,657 40.9% 181 40.1% 614 33.5%
Nebraska State College System 1,043 7.5% 11 2.4% 118 6.4%
Neb. Community Colleges 4,268 30.8% 114 25.3% 790 43.1%
Independent Colleges and Universities 2,488 18.0% 139 30.8% 246 13.4%
For-Profit/Career Schools 389 2.8% 6 1.3% 66 3.6%
Total 13,845 100.0% 451 100.0% 1,834 100.0%
Sector of Higher Education
Native Americana
Black non-Hispanic
Two or More Races Total
N % N % N % N %
University of Nebraska 14 8.0% 277 25.3% 235 45.3% 6,978 38.9%
Nebraska State College System 8 4.6% 59 5.4% 57 11.0% 1,296 7.2%
Neb. Community Colleges 54 31.0% 501 45.8% 86 16.6% 5,813 32.4%
Independent Colleges and Universities 95 54.6% 158 14.4% 138 26.6% 3,264 18.2%
For-Profit/Career Schools 3 1.7% 100 9.1% 3 0.6% 567 3.2%
Total 174 100.0% 1,095 100.0% 519 100.0% 17,918 100.0% a A total of 78 (44.8%) of the 174 Native Americans who were first-time freshmen in 2013 were enrolled at Little Priest Tribal College (LPTC) or Nebraska Indian Community College (NICC), and 17 (9.8%) were enrolled at other institutions within the independent sector. For the purpose of comparing the racial/ethnic groups, excluding the tribal colleges results in the following distribution for Native Americans for 2013:
University of Nebraska (14) 14.6% Nebraska State College System (8) 8.3% Nebraska Community Colleges (54) 56.3% Independent Colleges and Universities (17) 17.7% For-Profit/Career Schools (3) 3.1%
Continued on the next page.

Nebraska’s Coordinating Commission for Postsecondary Education – 2018 Progress Report 209
Table A7.3 Continued
Fall 2014
Sector of Higher Education
White non-Hispanic
Asian/Pacific Islander Hispanic
N % N % N %
University of Nebraska 5,754 42.3% 219 42.1% 670 34.7%
Nebraska State College System 1,127 8.3% 14 2.7% 108 5.6%
Neb. Community Colleges 3,929 28.9% 137 26.3% 851 44.1%
Independent Colleges and Universities 2,470 18.2% 145 27.9% 258 13.4%
For-Profit/Career Schools 314 2.3% 5 1.0% 42 2.2%
Total 13,594 100.0% 520 100.0% 1,929 100.0%
Sector of Higher Education
Native Americana
Black non-Hispanic
Two or More Races Total
N % N % N % N %
University of Nebraska 13 10.2% 276 28.8% 266 47.8% 7,198 40.7%
Nebraska State College System 19 15.0% 71 7.4% 37 6.6% 1,376 7.8%
Neb. Community Colleges 40 31.5% 436 45.4% 146 26.2% 5,539 31.3%
Independent Colleges and Universities 55 43.3% 134 14.0% 103 18.5% 3,165 17.9%
For-Profit/Career Schools 0 0.0% 43 4.5% 5 0.9% 409 2.3%
Total 127 100.0% 960 100.0% 557 100.0% 17,687 100.0% a A total of 40 (31.5%) of the 127 Native Americans who were first-time freshmen in 2014 were enrolled at Little Priest Tribal College (LPTC) or Nebraska Indian Community College (NICC), and 15 (11.8%) were enrolled at other institutions within the independent sector. For the purpose of comparing the racial/ethnic groups, excluding the tribal colleges results in the following distribution for Native Americans for 2014:
University of Nebraska (13) 14.9% Nebraska State College System (19) 21.8% Nebraska Community Colleges (40) 46.0% Independent Colleges and Universities (15) 17.2% For-Profit/Career Schools (0) 0.0%
Continued on the next page.
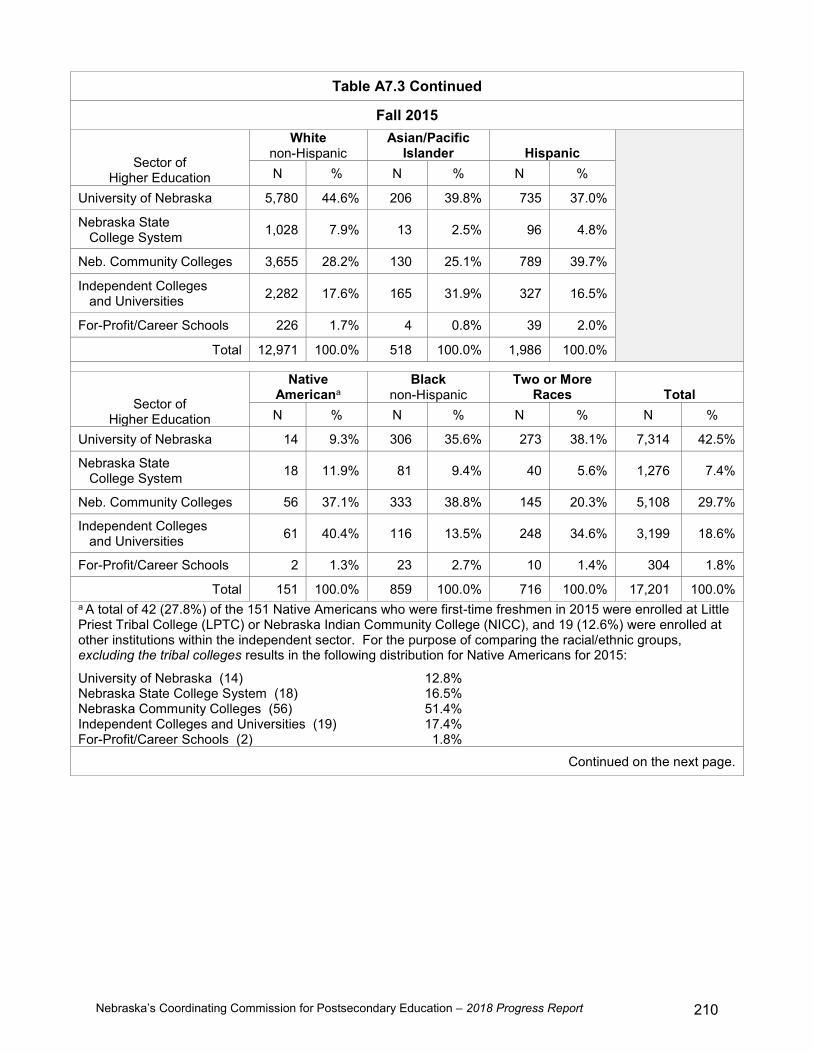
Nebraska’s Coordinating Commission for Postsecondary Education – 2018 Progress Report 210
Table A7.3 Continued
Fall 2015
Sector of Higher Education
White non-Hispanic
Asian/Pacific Islander Hispanic
N % N % N %
University of Nebraska 5,780 44.6% 206 39.8% 735 37.0%
Nebraska State College System 1,028 7.9% 13 2.5% 96 4.8%
Neb. Community Colleges 3,655 28.2% 130 25.1% 789 39.7%
Independent Colleges and Universities 2,282 17.6% 165 31.9% 327 16.5%
For-Profit/Career Schools 226 1.7% 4 0.8% 39 2.0%
Total 12,971 100.0% 518 100.0% 1,986 100.0%
Sector of Higher Education
Native Americana
Black non-Hispanic
Two or More Races Total
N % N % N % N %
University of Nebraska 14 9.3% 306 35.6% 273 38.1% 7,314 42.5%
Nebraska State College System 18 11.9% 81 9.4% 40 5.6% 1,276 7.4%
Neb. Community Colleges 56 37.1% 333 38.8% 145 20.3% 5,108 29.7%
Independent Colleges and Universities 61 40.4% 116 13.5% 248 34.6% 3,199 18.6%
For-Profit/Career Schools 2 1.3% 23 2.7% 10 1.4% 304 1.8%
Total 151 100.0% 859 100.0% 716 100.0% 17,201 100.0% a A total of 42 (27.8%) of the 151 Native Americans who were first-time freshmen in 2015 were enrolled at Little Priest Tribal College (LPTC) or Nebraska Indian Community College (NICC), and 19 (12.6%) were enrolled at other institutions within the independent sector. For the purpose of comparing the racial/ethnic groups, excluding the tribal colleges results in the following distribution for Native Americans for 2015:
University of Nebraska (14) 12.8% Nebraska State College System (18) 16.5% Nebraska Community Colleges (56) 51.4% Independent Colleges and Universities (19) 17.4% For-Profit/Career Schools (2) 1.8%
Continued on the next page.

Nebraska’s Coordinating Commission for Postsecondary Education – 2018 Progress Report 211
Table A7.3 Continued
Fall 2016
Sector of Higher Education
White non-Hispanic
Asian/Pacific Islander Hispanic
N % N % N %
University of Nebraska 5,858 44.8% 231 45.0% 796 37.9%
Nebraska State College System 953 7.3% 10 1.9% 106 5.1%
Neb. Community Colleges 3,777 28.9% 117 22.8% 877 41.8%
Independent Colleges and Universities 2,213 16.9% 151 29.4% 286 13.6%
For-Profit/Career Schools 268 2.1% 4 0.8% 33 1.6%
Total 13,069 100.0% 513 100.0% 2,098 100.0%
Sector of Higher Education
Native Americana
Black non-Hispanic
Two or More Races Total
N % N % N % N %
University of Nebraska 21 13.9% 297 32.6% 328 49.5% 7,531 43.3%
Nebraska State College System 8 5.3% 85 9.3% 53 8.0% 1,215 7.0%
Neb. Community Colleges 59 39.1% 394 43.3% 149 22.5% 5,373 30.9%
Independent Colleges and Universities 62 41.1% 115 12.6% 123 18.6% 2,950 17.0%
For-Profit/Career Schools 1 0.7% 19 2.1% 10 1.5% 335 1.9%
Total 151 100.0% 910 100.0% 663 100.0% 17,404 100.0% a A total of 56 (37.1%) of the 151 Native Americans who were first-time freshmen in 2016 were enrolled at Little Priest Tribal College (LPTC) or Nebraska Indian Community College (NICC), and 6 (4.0%) were enrolled at other institutions within the independent sector. For the purpose of comparing the racial/ethnic groups, excluding the tribal colleges results in the following distribution for Native Americans for 2016:
University of Nebraska (21) 22.1% Nebraska State College System (8) 8.4% Nebraska Community Colleges (59) 62.1% Independent Colleges and Universities (6) 6.3% For-Profit/Career Schools (1) 1.1% Note. Counts include full-time and part-time students. Counts do not include nonresident aliens or students of unknown race/ethnicity. The race/ethnicity category ‘two or more races’ was an optional reporting category for enrollments reported for fall 2008 and fall 2009. Adoption of the category was mandatory beginning with data reported for fall 2010. Data source: National Center for Education Statistics, IPEDS fall 2006 through 2016 surveys.
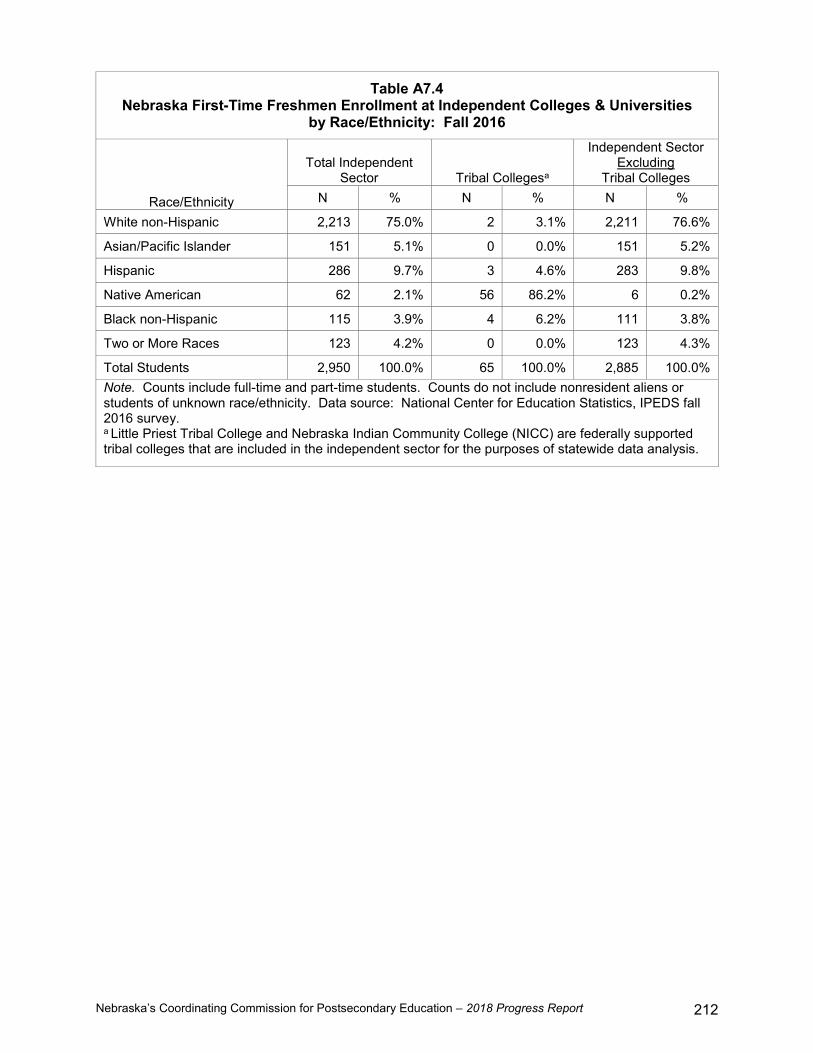
Nebraska’s Coordinating Commission for Postsecondary Education – 2018 Progress Report 212
Table A7.4 Nebraska First-Time Freshmen Enrollment at Independent Colleges & Universities
by Race/Ethnicity: Fall 2016
Race/Ethnicity
Total Independent Sector Tribal Collegesa
Independent Sector Excluding
Tribal Colleges N % N % N %
White non-Hispanic 2,213 75.0% 2 3.1% 2,211 76.6%
Asian/Pacific Islander 151 5.1% 0 0.0% 151 5.2%
Hispanic 286 9.7% 3 4.6% 283 9.8%
Native American 62 2.1% 56 86.2% 6 0.2%
Black non-Hispanic 115 3.9% 4 6.2% 111 3.8%
Two or More Races 123 4.2% 0 0.0% 123 4.3%
Total Students 2,950 100.0% 65 100.0% 2,885 100.0% Note. Counts include full-time and part-time students. Counts do not include nonresident aliens or students of unknown race/ethnicity. Data source: National Center for Education Statistics, IPEDS fall 2016 survey. a Little Priest Tribal College and Nebraska Indian Community College (NICC) are federally supported tribal colleges that are included in the independent sector for the purposes of statewide data analysis.

Nebraska’s Coordinating Commission for Postsecondary Education – 2018 Progress Report 213
Table A7.5 Nebraska First-Time Freshmen Racial/Ethnic Enrollments by Sector
Fall 2006 through Fall 2016
Fall 2006
Race/ Ethnicity
Public Institutions
University of Nebraska
Nebraska State Colleges
Community Colleges
Total Public Institutions
N % N % N % N %
White non-Hispanic 5,651 88.7% 984 90.1% 4,664 84.9% 11,299 87.2%
Asian/Pacific Islander 181 2.8% 10 0.9% 107 1.9% 298 2.3%
Hispanic 285 4.5% 33 3.0% 364 6.6% 682 5.3%
Native American 49 0.8% 20 1.8% 65 1.2% 134 1.0%
Black non-Hispanic 203 3.2% 45 4.1% 296 5.4% 544 4.2%
Total 6,369 100.0% 1,092 100.0% 5,496 100.0% 12,957 100.0%
Race/ Ethnicity
Other Colleges and Universities
Nebraska Total
Independent Colleges and Universities
For-Profit/Career Schools
N % N % N %
White non-Hispanic 2,747 87.3% 886 78.3% 14,932 86.6%
Asian/Pacific Islander 113 3.6% 12 1.1% 423 2.5%
Hispanic 124 3.9% 34 3.0% 840 4.9%
Native American 67 2.1% 15 1.3% 216 1.3%
Black non-Hispanic 97 3.1% 184 16.3% 825 4.8%
Total 3,148 100.0% 1,131 100.0% 17,236 100.0%
Continued on the next page.

Nebraska’s Coordinating Commission for Postsecondary Education – 2018 Progress Report 214
Table A7.5 Continued
Fall 2007
Race/ Ethnicity
Public Institutions
University of Nebraska
Nebraska State Colleges
Community Colleges
Total Public Institutions
N % N % N % N %
White non-Hispanic 5,628 88.5% 1,051 90.0% 4,947 84.8% 11,626 87.0%
Asian/Pacific Islander 173 2.7% 7 0.6% 95 1.6% 275 2.1%
Hispanic 282 4.4% 39 3.3% 377 6.5% 698 5.2%
Native American 35 0.6% 24 2.1% 59 1.0% 118 0.9%
Black non-Hispanic 239 3.8% 47 4.0% 354 6.1% 640 4.8%
Total 6,357 100.0% 1,168 100.0% 5,832 100.0% 13,357 100.0%
Race/ Ethnicity
Other Colleges and Universities
Nebraska Total
Independent Colleges and Universities
For-Profit/Career Schools
N % N % N %
White non-Hispanic 2,712 85.0% 887 78.1% 15,225 86.1%
Asian/Pacific Islander 130 4.2% 8 0.7% 413 2.3%
Hispanic 175 5.5% 32 2.8% 905 5.1%
Native American 61 1.9% 8 0.7% 187 1.1%
Black non-Hispanic 111 3.5% 201 17.7% 952 5.4%
Total 3,189 100.0% 1,136 100.0% 17,682 100.0%
Continued on the next page.

Nebraska’s Coordinating Commission for Postsecondary Education – 2018 Progress Report 215
Table A7.5 Continued
Fall 2008
Race/ Ethnicity
Public Institutions
University of Nebraska
Nebraska State Colleges
Community Colleges
Total Public Institutions
N % N % N % N %
White non-Hispanic 6,003 89.0% 1,089 90.7% 4,641 83.2% 11,733 86.8%
Asian/Pacific Islander 160 2.4% 7 0.6% 109 2.0% 276 2.0%
Hispanic 325 4.8% 34 2.8% 427 7.7% 786 5.8%
Native American 35 0.5% 21 1.7% 43 0.8% 99 0.7%
Black non-Hispanic 220 3.3% 46 3.8% 335 6.0% 601 4.4%
Two or More Races 0 0.0% 4 0.3% 25 0.4% 29 0.2%
Total 6,743 100.0% 1,201 100.0% 5,580 100.0% 13,524 100.0%
Race/ Ethnicity
Other Colleges and Universities
Nebraska Total
Independent Colleges and Universities
For-Profit/Career Schools
N % N % N %
White non-Hispanic 2,591 81.1% 612 79.4% 14,936 85.4%
Asian/Pacific Islander 158 4.9% 4 0.5% 438 2.5%
Hispanic 213 6.7% 31 4.0% 1,030 5.9%
Native American 78 2.4% 6 0.8% 183 1.0%
Black non-Hispanic 146 4.6% 118 15.3% 865 4.9%
Two or More Races 10 0.3% 0 0.0% 39 0.2%
Total 3,196 100.0% 771 100.0% 17,491 100.0%
Continued on the next page.

Nebraska’s Coordinating Commission for Postsecondary Education – 2018 Progress Report 216
Table A7.5 Continued
Fall 2009
Race/ Ethnicity
Public Institutions
University of Nebraska
Nebraska State Colleges
Community Colleges
Total Public Institutions
N % N % N % N %
White non-Hispanic 5,754 87.9% 912 88.2% 4,912 82.0% 11,578 85.3%
Asian/Pacific Islander 141 2.2% 11 1.1% 87 1.5% 239 1.8%
Hispanic 355 5.4% 42 4.1% 509 8.5% 906 6.7%
Native American 39 0.6% 16 1.5% 66 1.1% 121 0.9%
Black non-Hispanic 255 3.9% 36 3.5% 384 6.4% 675 5.0%
Two or More Races 0 0.0% 17 1.6% 30 0.5% 47 0.3%
Total 6,544 100.0% 1,034 100.0% 5,988 100.0% 13,566 100.0%
Race/ Ethnicity
Other Colleges and Universities
Nebraska Total
Independent Colleges and Universities
For-Profit/Career Schools
N % N % N %
White non-Hispanic 2,686 81.5% 616 79.6% 14,880 84.4%
Asian/Pacific Islander 153 4.6% 13 1.7% 405 2.3%
Hispanic 181 5.5% 44 5.7% 1,131 6.4%
Native American 95 2.9% 7 0.9% 223 1.3%
Black non-Hispanic 155 4.7% 93 12.0% 923 5.2%
Two or More Races 24 0.7% 1 0.1% 72 0.4%
Total 3,294 100.0% 774 100.0% 17,634 100.0%
Continued on the next page.
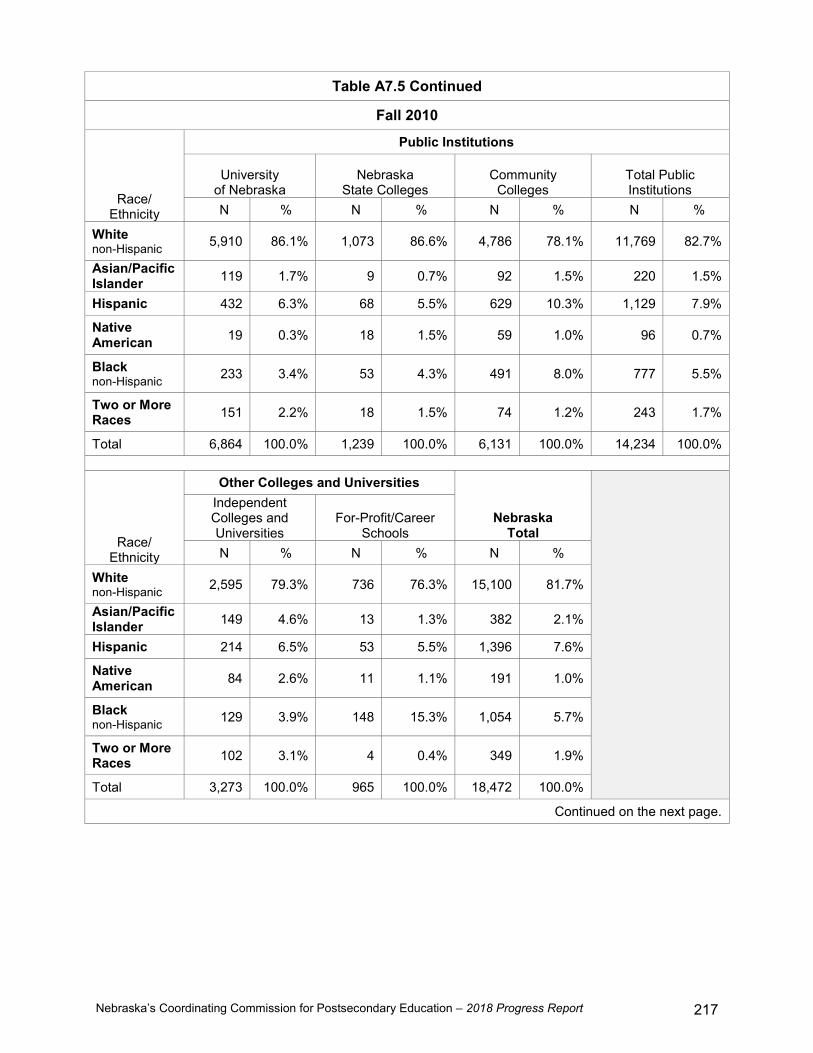
Nebraska’s Coordinating Commission for Postsecondary Education – 2018 Progress Report 217
Table A7.5 Continued
Fall 2010
Race/ Ethnicity
Public Institutions
University of Nebraska
Nebraska State Colleges
Community Colleges
Total Public Institutions
N % N % N % N %
White non-Hispanic 5,910 86.1% 1,073 86.6% 4,786 78.1% 11,769 82.7%
Asian/Pacific Islander 119 1.7% 9 0.7% 92 1.5% 220 1.5%
Hispanic 432 6.3% 68 5.5% 629 10.3% 1,129 7.9%
Native American 19 0.3% 18 1.5% 59 1.0% 96 0.7%
Black non-Hispanic 233 3.4% 53 4.3% 491 8.0% 777 5.5%
Two or More Races 151 2.2% 18 1.5% 74 1.2% 243 1.7%
Total 6,864 100.0% 1,239 100.0% 6,131 100.0% 14,234 100.0%
Race/ Ethnicity
Other Colleges and Universities
Nebraska Total
Independent Colleges and Universities
For-Profit/Career Schools
N % N % N %
White non-Hispanic 2,595 79.3% 736 76.3% 15,100 81.7%
Asian/Pacific Islander 149 4.6% 13 1.3% 382 2.1%
Hispanic 214 6.5% 53 5.5% 1,396 7.6%
Native American 84 2.6% 11 1.1% 191 1.0%
Black non-Hispanic 129 3.9% 148 15.3% 1,054 5.7%
Two or More Races 102 3.1% 4 0.4% 349 1.9%
Total 3,273 100.0% 965 100.0% 18,472 100.0%
Continued on the next page.

Nebraska’s Coordinating Commission for Postsecondary Education – 2018 Progress Report 218
Table A7.5 Continued
Fall 2011
Race/ Ethnicity
Public Institutions
University of Nebraska
Nebraska State Colleges
Community Colleges
Total Public Institutions
N % N % N % N %
White non-Hispanic 5,477 83.6% 1,007 83.8% 4,491 76.4% 10,975 80.5%
Asian/Pacific Islander 139 2.1% 8 0.7% 107 1.8% 254 1.9%
Hispanic 505 7.7% 68 5.7% 659 11.2% 1,232 9.0%
Native American 16 0.2% 14 1.2% 89 1.5% 119 0.9%
Black non-Hispanic 229 3.5% 74 6.2% 454 7.7% 757 5.6%
Two or More Races 188 2.9% 30 2.5% 79 1.3% 297 2.2%
Total 6,554 100.0% 1,201 100.0% 5,879 100.0% 13,634 100.0%
Race/ Ethnicity
Other Colleges and Universities
Nebraska Total
Independent Colleges and Universities
For-Profit/Career Schools
N % N % N %
White non-Hispanic 2,527 78.2% 454 80.5% 13,956 80.1%
Asian/Pacific Islander 133 4.1% 7 1.2% 394 2.3%
Hispanic 203 6.3% 36 6.4% 1,471 8.4%
Native American 106 3.3% 7 1.2% 232 1.3%
Black non-Hispanic 160 5.0% 52 9.2% 969 5.6%
Two or More Races 102 3.2% 8 1.4% 407 2.3%
Total 3,231 100.0% 564 100.0% 17,429 100.0%
Continued on the next page.
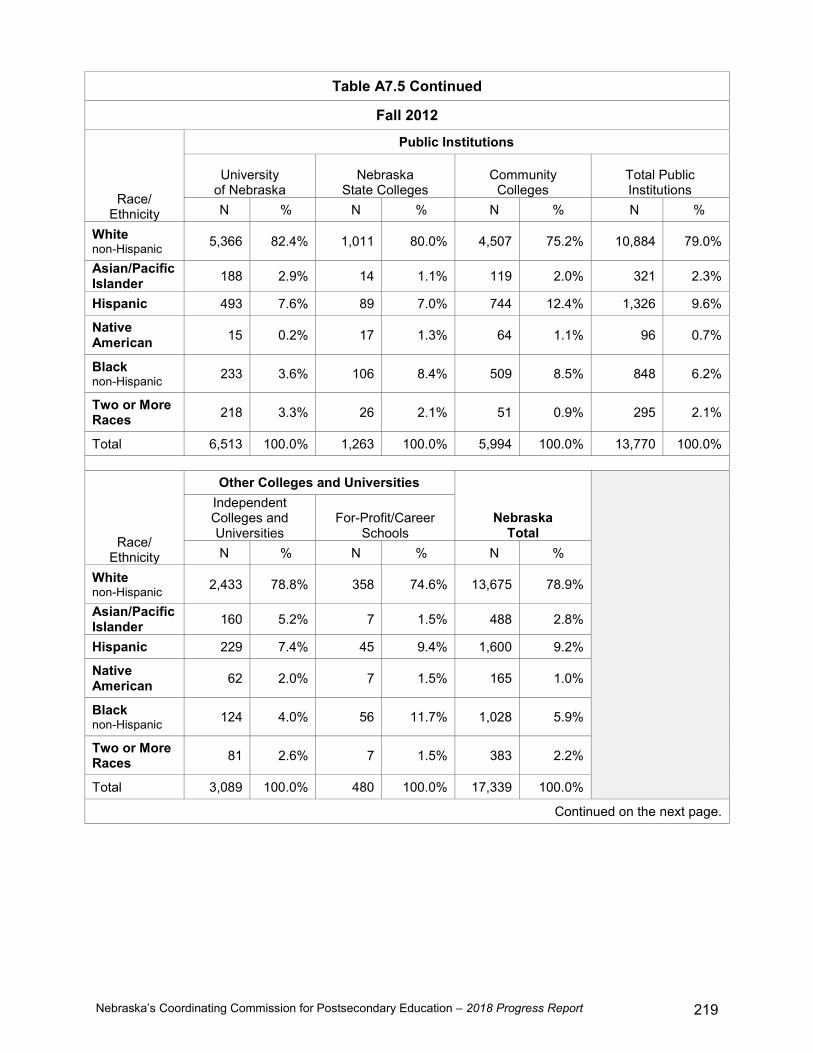
Nebraska’s Coordinating Commission for Postsecondary Education – 2018 Progress Report 219
Table A7.5 Continued
Fall 2012
Race/ Ethnicity
Public Institutions
University of Nebraska
Nebraska State Colleges
Community Colleges
Total Public Institutions
N % N % N % N %
White non-Hispanic 5,366 82.4% 1,011 80.0% 4,507 75.2% 10,884 79.0%
Asian/Pacific Islander 188 2.9% 14 1.1% 119 2.0% 321 2.3%
Hispanic 493 7.6% 89 7.0% 744 12.4% 1,326 9.6%
Native American 15 0.2% 17 1.3% 64 1.1% 96 0.7%
Black non-Hispanic 233 3.6% 106 8.4% 509 8.5% 848 6.2%
Two or More Races 218 3.3% 26 2.1% 51 0.9% 295 2.1%
Total 6,513 100.0% 1,263 100.0% 5,994 100.0% 13,770 100.0%
Race/ Ethnicity
Other Colleges and Universities
Nebraska Total
Independent Colleges and Universities
For-Profit/Career Schools
N % N % N %
White non-Hispanic 2,433 78.8% 358 74.6% 13,675 78.9%
Asian/Pacific Islander 160 5.2% 7 1.5% 488 2.8%
Hispanic 229 7.4% 45 9.4% 1,600 9.2%
Native American 62 2.0% 7 1.5% 165 1.0%
Black non-Hispanic 124 4.0% 56 11.7% 1,028 5.9%
Two or More Races 81 2.6% 7 1.5% 383 2.2%
Total 3,089 100.0% 480 100.0% 17,339 100.0%
Continued on the next page.

Nebraska’s Coordinating Commission for Postsecondary Education – 2018 Progress Report 220
Table A7.5 Continued
Fall 2013
Race/ Ethnicity
Public Institutions
University of Nebraska
Nebraska State Colleges
Community Colleges
Total Public Institutions
N % N % N % N %
White non-Hispanic 5,657 81.1% 1,043 80.5% 4,268 73.4% 10,968 77.9%
Asian/Pacific Islander 181 2.6% 11 0.8% 114 2.0% 306 2.2%
Hispanic 614 8.8% 118 9.1% 790 13.6% 1,522 10.8%
Native American 14 0.2% 8 0.6% 54 0.9% 76 0.5%
Black non-Hispanic 277 4.0% 59 4.6% 501 8.6% 837 5.9%
Two or More Races 235 3.4% 57 4.4% 86 1.5% 378 2.7%
Total 6,978 100.0% 1,296 100.0% 5,813 100.0% 14,087 100.0%
Race/ Ethnicity
Other Colleges and Universities
Nebraska Total
Independent Colleges and Universities
For-Profit/Career Schools
N % N % N %
White non-Hispanic 2,488 76.2% 389 68.6% 13,845 77.3%
Asian/Pacific Islander 139 4.3% 6 1.1% 451 2.5%
Hispanic 246 7.5% 66 11.6% 1,834 10.2%
Native American 95 2.9% 3 0.5% 174 1.0%
Black non-Hispanic 158 4.8% 100 17.6% 1,095 6.1%
Two or More Races 138 4.2% 3 0.5% 519 2.9%
Total 3,264 100.0% 567 100.0% 17,918 100.0%
Continued on the next page.

Nebraska’s Coordinating Commission for Postsecondary Education – 2018 Progress Report 221
Table A7.5 Continued
Fall 2014
Race/ Ethnicity
Public Institutions
University of Nebraska
Nebraska State Colleges
Community Colleges
Total Public Institutions
N % N % N % N %
White non-Hispanic 5,754 79.9% 1,127 81.9% 3,929 70.9% 10,810 76.6%
Asian/Pacific Islander 219 3.0% 14 1.0% 137 2.5% 370 2.6%
Hispanic 670 9.3% 108 7.8% 851 15.4% 1,629 11.5%
Native American 13 0.2% 19 1.4% 40 0.7% 72 0.5%
Black non-Hispanic 276 3.8% 71 5.2% 436 7.9% 783 5.5%
Two or More Races 266 3.7% 37 2.7% 146 2.6% 449 3.2%
Total 7,198 100.0% 1,376 100.0% 5,539 100.0% 14,113 100.0%
Race/ Ethnicity
Other Colleges and Universities
Nebraska Total
Independent Colleges and Universities
For-Profit/Career Schools
N % N % N %
White non-Hispanic 2,470 78.0% 314 76.8% 13,594 76.9%
Asian/Pacific Islander 145 4.6% 5 1.2% 520 2.9%
Hispanic 258 8.2% 42 10.3% 1,929 10.9%
Native American 55 1.7% 0 0.0% 127 0.7%
Black non-Hispanic 134 4.2% 43 10.5% 960 5.4%
Two or More Races 103 3.3% 5 1.2% 557 3.1%
Total 3,165 100.0% 409 100.0% 17,687 100.0%
Continued on the next page.

Nebraska’s Coordinating Commission for Postsecondary Education – 2018 Progress Report 222
Table A7.5 Continued
Fall 2015
Race/ Ethnicity
Public Institutions
University of Nebraska
Nebraska State Colleges
Community Colleges
Total Public Institutions
N % N % N % N %
White non-Hispanic 5,780 79.0% 1,028 80.6% 3,655 71.6% 10,463 76.4%
Asian/Pacific Islander 206 2.8% 13 1.0% 130 2.5% 349 2.5%
Hispanic 735 10.0% 96 7.5% 789 15.4% 1,620 11.8%
Native American 14 0.2% 18 1.4% 56 1.1% 88 0.6%
Black non-Hispanic 306 4.2% 81 6.3% 333 6.5% 720 5.3%
Two or More Races 273 3.7% 40 3.1% 145 2.8% 458 3.3%
Total 7,314 100.0% 1,276 100.0% 5,108 100.0% 13,698 100.0%
Race/ Ethnicity
Other Colleges and Universities
Nebraska Total
Independent Colleges and Universities
For-Profit/Career Schools
N % N % N %
White non-Hispanic 2,282 71.3% 226 74.3% 12,971 75.4%
Asian/Pacific Islander 165 5.2% 4 1.3% 518 3.0%
Hispanic 327 10.2% 39 12.8% 1,986 11.5%
Native American 61 1.9% 2 0.7% 151 0.9%
Black non-Hispanic 116 3.6% 23 7.6% 859 5.0%
Two or More Races 248 7.8% 10 3.3% 716 4.2%
Total 3,199 100.0% 304 100.0% 17,201 100.0%
Continued on the next page.

Nebraska’s Coordinating Commission for Postsecondary Education – 2018 Progress Report 223
Table A7.5 Continued
Fall 2016
Race/ Ethnicity
Public Institutions
University of Nebraska
Nebraska State Colleges
Community Colleges
Total Public Institutions
N % N % N % N %
White non-Hispanic 5,858 77.8% 953 78.4% 3,777 70.3% 10,588 75.0%
Asian/Pacific Islander 231 3.1% 10 0.8% 117 2.2% 358 2.5%
Hispanic 796 10.6% 106 8.7% 877 16.3% 1,779 12.6%
Native American 21 0.3% 8 0.7% 59 1.1% 88 0.6%
Black non-Hispanic 297 3.9% 85 7.0% 394 7.3% 776 5.5%
Two or More Races 328 4.4% 53 4.4% 149 2.8% 530 3.8%
Total 7,531 100.0% 1,215 100.0% 5,373 100.0% 14,119 100.0%
Race/ Ethnicity
Other Colleges and Universities
Nebraska Total
Independent Colleges and Universities
For-Profit/Career Schools
N % N % N %
White non-Hispanic 2,213 75.0% 268 80.0% 13,069 75.1%
Asian/Pacific Islander 151 5.1% 4 1.2% 513 2.9%
Hispanic 286 9.7% 33 9.9% 2,098 12.1%
Native American 62 2.1% 1 0.3% 151 0.9%
Black non-Hispanic 115 3.9% 19 5.7% 910 5.2%
Two or More Races 123 4.2% 10 3.0% 663 3.8%
Total 2,950 100.0% 335 100.0% 17,404 100.0% Note. Counts include full-time and part-time students. Counts do not include nonresident aliens or students of unknown race/ethnicity. The race/ethnicity category ‘two or more races’ was an optional reporting category for enrollments reported for fall 2008 and fall 2009. Adoption of the category was mandatory beginning with data reported for fall 2010. Data source: National Center for Education Statistics, IPEDS fall 2006 through 2016 surveys.

Nebraska’s Coordinating Commission for Postsecondary Education – 2018 Progress Report 224
This page left blank intentionally.

Nebraska’s Coordinating Commission for Postsecondary Education – 2018 Progress Report 225
Appendix 8
Financial Aid Programs
Explanatory Note A8.1
Definitions of Federal and State Title IV Financial Aid Programs The following are definitions of the types of federal and Title IV financial aid programs available to Nebraska postsecondary students between 2006-2007 and 2016-2017: Academic Competitiveness Grant (ACG): Created under the Higher Education
Reconciliation Act of 2005, ACGs were need-based but limited to students who had demonstrated academic achievement. To receive an ACG, a student must have been a college freshman or sophomore, a U.S. citizen, Pell Grant-eligible, and have completed a program of rigorous high school course work as defined by their state and recognized by the U.S. Secretary of Education. ACGs provided additional funds of up to $750 for first-year college students and up to an additional $1,300 for second-year students who were enrolled full time and maintained a 3.0 GPA in college. Institutions began awarding these grants in the 2006-2007 academic year. This program was eliminated after the 2010-2011 academic year.
Federal Pell Grant: Federal Pell Grants are awarded to undergraduates who have not earned a bachelor’s degree and who demonstrate high financial need. Pell Grants do not have to be repaid. The award range for Pell Grants for the award year 2016-2017 was $598 to $5,815.
Federal Supplemental Educational Opportunity Grant (FSEOG): Undergraduate students
with exceptional need who have not received a bachelor’s degree are eligible to receive the FSEOG. FSEOG awards can range from $100 to $4,000 and do not have to be repaid, but awards are subject to the availability of funds at a student’s institution.
Federal Work-Study (FWS): The FWS provides on- and off-campus jobs for graduate and undergraduate students who demonstrate financial need. Work-study amounts awarded vary from institution to institution.
Iraq and Afghanistan Service Grant (IASG): The IASG provides money to college or career
school students to help pay for educational expenses. A student may be eligible to receive the IASG if the student’s parent or guardian was a member of the U.S. armed forces and died as a result of military service performed in Iraq or Afghanistan after the events of 9/11, and the student is not eligible for a Federal Pell Grant on the basis of the Expected Family Contribution but meets the remaining Federal Pell Grant eligibility requirements, and the student was under 24 years old or enrolled in college at least part time at the time of the parent’s or guardian’s death. The grant was awarded for the first time in Nebraska in 2013-2014. The grant award is equal to the amount of a maximum Federal Pell Grant for the award year but cannot exceed the student’s cost of attendance for that year.
Nebraska Opportunity Grant (NOG): State grants are awarded to Nebraska-resident students who demonstrate high financial need and who attend eligible Nebraska postsecondary institutions to assist with the students’ educational expenses. Funding for the grant comes from the state through the Nebraska Lottery and the state’s General Fund.
Continued on the next page.

Nebraska’s Coordinating Commission for Postsecondary Education – 2018 Progress Report 226
Explanatory Note A8.1 Continued
National Science and Mathematics Access to Retain Talent (SMART) Grant: Created under the Higher Education Reconciliation Act of 2005, SMART grants were need-based but limited to students majoring in specified fields who maintained B averages in college. To receive a SMART grant, a student must have been a third- or fourth-year college student; a U.S. citizen; Pell Grant-eligible; enrolled full time; majored in a designated science, technology, mathematics, or critical language; and maintained a 3.0 GPA. Students who met these criteria would receive up to $4,000 in additional financial aid. Institutions began awarding SMART grants in the 2006-2007 academic year. This program was eliminated after the 2010-2011 academic year.
Perkins Loans: Perkins Loans are fixed, low-interest (5%) loans available to graduate and undergraduate students with financial need. Undergraduate students may borrow up to $5,500 per year, and graduate students may borrow up to $8,000 per year, depending on the availability of funds at their institution.
PLUS Loans: PLUS loans are available to the parents of dependent undergraduate students.
These loans are not need-based. Parents may borrow up to the student’s cost of attendance, less any other financial aid received.
PLUS Loans for Graduate and Professional Degree Students (Grad PLUS): Graduate and professional degree students are eligible to borrow under the PLUS loan program up to their cost of attendance minus other estimated financial assistance. The terms and conditions applicable to PLUS also apply to GRAD PLUS. Applicants must apply for their annual loan maximum eligibility under the Federal Subsidized and Unsubsidized Loan Program before applying for a Graduate/Professional PLUS loan.
Subsidized (Sub) and Unsubsidized (Unsub) Stafford Loans: Sub and Unsub Loans are available to undergraduate and graduate students. Students must demonstrate financial need in order to qualify for a Subsidized Loan, where the federal government pays the interest while the student is in school. Unsubsidized Loans are available to all students, but borrowers are responsible for the interest while in school. Limits for Sub and Unsub Loans range from a maximum of $5,500 to $20,500 depending on grade level and dependency status.
Teacher Education Assistance for College and Higher Education (TEACH) Grant: The TEACH grant program was established under the College Cost Reduction and Access Act (CCRAA) to benefit current and prospective teachers. Beginning in 2008-2009, students may be awarded up to $4,000 per academic year. Undergraduate and post-baccalaureate students may receive up to a total of $16,000, while graduate students may receive up to $8,000. Eligible students must be currently completing or planning to complete coursework necessary to begin a career in teaching. There are, however, graduate degree alternatives for teachers or retirees with experience in a teacher shortage area. To be considered for a grant, a student must have a score above the 75th percentile on an admissions test, such as SAT, ACT or GRE and at least a 3.25 GPA. Students must sign a TEACH Grant Agreement to Serve in which the student agrees to teach in a high-need field, at an elementary school, secondary school, or educational service agency that service students from low-income families, for at least four complete academic years within eight years after completing (or ceasing enrollment in) the course of study for which the student received the grant. If service is not met, the grant must be repaid as an Unsubsidized Direct Stafford Loan with interest from the date(s) of original disbursement.
Students must demonstrate financial need to be considered for all aid programs listed except for the TEACH, the Unsubsidized Loan, the PLUS, and the GRAD PLUS. Financial need is the difference between the student’s costs to attend his or her respective institution and the ability of the family to contribute toward college costs. That ability is determined through completing the Free Application for Federal Student Aid (FAFSA). For example, if the cost of attendance is $8,000 and the student’s contribution is $1,000, the student demonstrates a need of $7,000.
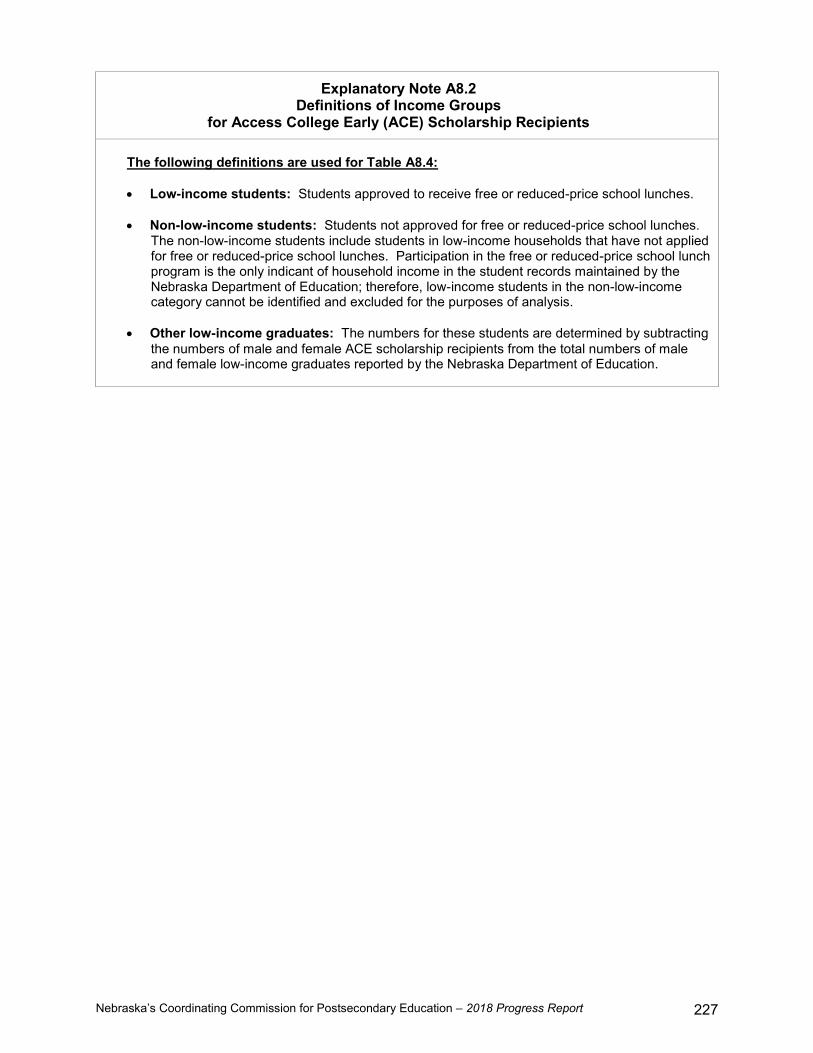
Nebraska’s Coordinating Commission for Postsecondary Education – 2018 Progress Report 227
Explanatory Note A8.2 Definitions of Income Groups
for Access College Early (ACE) Scholarship Recipients
The following definitions are used for Table A8.4:
Low-income students: Students approved to receive free or reduced-price school lunches.
Non-low-income students: Students not approved for free or reduced-price school lunches.
The non-low-income students include students in low-income households that have not applied for free or reduced-price school lunches. Participation in the free or reduced-price school lunch program is the only indicant of household income in the student records maintained by the Nebraska Department of Education; therefore, low-income students in the non-low-income category cannot be identified and excluded for the purposes of analysis.
Other low-income graduates: The numbers for these students are determined by subtracting the numbers of male and female ACE scholarship recipients from the total numbers of male and female low-income graduates reported by the Nebraska Department of Education.

Nebraska’s Coordinating Commission for Postsecondary Education – 2018 Progress Report 228
Table A8.1 Nebraska Opportunity Grants (NOG) Awarded by Sector
2016-2017 Compared to 2006-2007
2006-2007 2016-2017 % Change
Nebraska Public Institutions Number of NOG-Eligible Students 19,559 28,445 45.4%
Number of Students Awarded a NOG 7,967 9,318 17.0%
Percent of Eligible Students Awarded a NOG 40.7% 32.8% -19.6%
Total Amount Awarded $6,557,086 $12,632,146 92.6%
Average Amount Award $823 $1,356 64.7%
Independent Colleges & Universities Number of NOG-Eligible Students 3,819 4,971 30.2%
Number of Students Awarded a NOG 2,172 3,029 39.5%
Percent of Eligible Students Awarded a NOG 56.9% 60.9% 7.1%
Total Amount Awarded $1,951,878 $3,390,892 73.7%
Average Amount Award $899 $1,119 24.6%
For-Profit/Career Schools Number of NOG-Eligible Students 3,262 1,762 -46.0%
Number of Students Awarded a NOG 1,721 581 -66.2%
Percent of Eligible Students Awarded a NOG 52.8% 33.0% -37.5%
Total Amount Awarded $1,879,259 $866,711 -53.9%
Average Amount Award $1,092 $1,492 36.6%
Total Nebraska Opportunity Grants Awarded Number of NOG-Eligible Students 26,640 35,178 32.0%
Number of Students Awarded a NOG 11,860 12,928 9.0%
Percent of Eligible Students Awarded a NOG 44.5% 36.8% -17.5%
Total Amount Awarded $10,388,223 $16,889,748 62.6%
Average Amount Award $876 $1,306 49.2% Note. To be eligible for a NOG, the student must be a Nebraska resident, attend a Nebraska postsecondary institution, and have a minimum EFC as determined by completing the Free Application for Federal Student Aid (FAFSA). Students who would otherwise qualify for a NOG but do not complete the FAFSA are not included in the number of NOG-eligible students. Data source: Nebraska’s Coordinating Commission for Postsecondary Education, Nebraska Opportunity Grant Year-End Report, 2007 and 2017.

Nebraska’s Coordinating Commission for Postsecondary Education – 2018 Progress Report 229
Table A8.2 Nebraska Opportunity Grants (NOG) Awarded by Sector and Income of Recipient
2016-2017 Compared to 2006-2007
Income Level of NOG Recipients by Sector
2006-2007 2016-2017 % Change
in # of Recipients
# of Recipients
% of Recipients
# of Recipients
% of Recipients
Nebraska Public Institutions $0 to $19,999 3,566 44.8% 3,081 33.1% -13.6%
$20,000 to $39,999 3,013 37.8% 2,754 29.6% -8.6%
$40,000 or Higher 1,388 17.4% 3,483 37.4% 150.9%
Total 7,967 100.0% 9,318 100.0% 17.0%
Independent Colleges and Universities $0 to $19,999 926 42.6% 1,094 36.1% 18.1%
$20,000 to $39,999 842 38.8% 902 29.8% 7.1%
$40,000 or Higher 404 18.6% 1,033 34.1% 155.7%
Total 2,172 100.0% 3,029 100.0% 39.5%
For-Profit/Career Schools $0 to $19,999 1,467 85.2% 303 52.2% -79.3%
$20,000 to $39,999 197 11.4% 186 32.0% -5.6%
$40,000 or Higher 57 3.3% 92 15.8% 61.4%
Total 1,721 100.0% 581 100.0% -66.2%
Total Nebraska Opportunity Grants Awarded $0 to $19,999 5,959 50.2% 4,478 34.6% -24.9%
$20,000 to $39,999 4,052 34.2% 3,842 29.7% -5.2%
$40,000 or Higher 1,849 15.6% 4,608 35.6% 149.2%
Total 11,860 100.0% 12,928 100.0% 9.0% Data source: Nebraska’s Coordinating Commission for Postsecondary Education, Nebraska Opportunity Grant Year-End Report, 2007 and 2017.
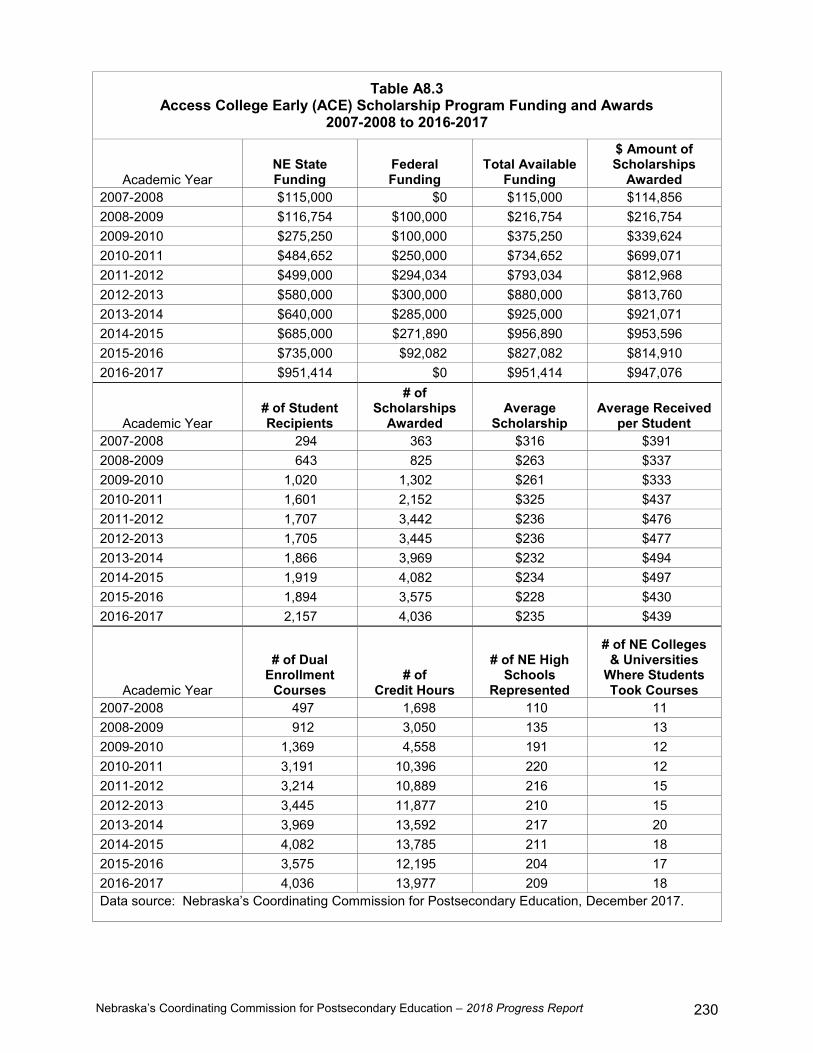
Nebraska’s Coordinating Commission for Postsecondary Education – 2018 Progress Report 230
Table A8.3 Access College Early (ACE) Scholarship Program Funding and Awards
2007-2008 to 2016-2017
Academic Year NE State Funding
Federal Funding
Total Available Funding
$ Amount of Scholarships
Awarded 2007-2008 $115,000 $0 $115,000 $114,856 2008-2009 $116,754 $100,000 $216,754 $216,754 2009-2010 $275,250 $100,000 $375,250 $339,624 2010-2011 $484,652 $250,000 $734,652 $699,071 2011-2012 $499,000 $294,034 $793,034 $812,968 2012-2013 $580,000 $300,000 $880,000 $813,760 2013-2014 $640,000 $285,000 $925,000 $921,071 2014-2015 $685,000 $271,890 $956,890 $953,596 2015-2016 $735,000 $92,082 $827,082 $814,910 2016-2017 $951,414 $0 $951,414 $947,076
Academic Year # of Student Recipients
# of Scholarships
Awarded Average
Scholarship Average Received
per Student 2007-2008 294 363 $316 $391 2008-2009 643 825 $263 $337 2009-2010 1,020 1,302 $261 $333 2010-2011 1,601 2,152 $325 $437 2011-2012 1,707 3,442 $236 $476 2012-2013 1,705 3,445 $236 $477 2013-2014 1,866 3,969 $232 $494 2014-2015 1,919 4,082 $234 $497 2015-2016 1,894 3,575 $228 $430 2016-2017 2,157 4,036 $235 $439
Academic Year
# of Dual Enrollment
Courses # of
Credit Hours
# of NE High Schools
Represented
# of NE Colleges & Universities
Where Students Took Courses
2007-2008 497 1,698 110 11 2008-2009 912 3,050 135 13 2009-2010 1,369 4,558 191 12 2010-2011 3,191 10,396 220 12 2011-2012 3,214 10,889 216 15 2012-2013 3,445 11,877 210 15 2013-2014 3,969 13,592 217 20 2014-2015 4,082 13,785 211 18 2015-2016 3,575 12,195 204 17 2016-2017 4,036 13,977 209 18 Data source: Nebraska’s Coordinating Commission for Postsecondary Education, December 2017.

Nebraska’s Coordinating Commission for Postsecondary Education – 2018 Progress Report 231
Table A8.4.a College Continuation Rates of
2007-2008 Access College Early (ACE) Scholarship Recipients
Part 1: College Continuation Rates of ACE Recipients by Gender and Type of High School Attended Type of
High School Attended
# HS Seniors Who Received
ACE Scholarships
# of Senior ACE Recipients Who Enrolled in College
College Continuation Rate
Males Public 74 63 85.1% Nonpublic (Private) 1 1 100.0% Home-schooled 0 0 Total 75 64 85.3%
Females Public 141 117 83.0% Nonpublic (Private) 4 4 100.0% Home-schooled 0 0 Total 145 121 83.4%
Total Public 215 180 83.7% Nonpublic (Private) 5 5 100.0% Home-schooled 0 0 Total 220 185 84.1% Part 2: College Continuation Rates of Public High School Recipients of ACE Scholarships and Other Public High School Graduates by Gender and Student Income Status
Student Category # HS Grads # of Grads
Enrolled in College College
Continuation Rate
Males ACE Scholarship Recipients 74 63 85.1% Other Low Income Graduates 2,082 986 43.0% Non-Low Income Graduates 7,803 5,536 70.9% Total 9,959 6,585 66.1%
Females ACE Scholarship Recipients 141 117 83.0% Other Low Income Graduates 2,282 1,216 53.3% Non-Low Income Graduates 7,654 5,913 77.3% Total 10,077 7,246 71.9%
Total ACE Scholarship Recipients 215 180 83.7% Other Low Income Graduates 4,364 2,202 50.5% Non-Low Income Graduates 15,457 11,449 74.1% Total 20,036 13,831 69.0% Note. The college continuation rate is the number 2007-08 high school graduates who enrolled in college on or before April 7, 2009, divided by the total number of students who graduated from Nebraska high schools in 2007-08. National Student Clearinghouse records do not include students who enrolled in small private not-for-profit colleges or for-profit colleges and career schools that do not submit enrollment records to the Clearinghouse. Data sources: Nebraska’s Coordinating Commission for Postsecondary Education (numbers of ACE recipients), July 2009; National Student Clearinghouse (college continuation data), April and July 2009; and Nebraska Department of Education (numbers of low-income and non-low-income graduates), April 2009.

Nebraska’s Coordinating Commission for Postsecondary Education – 2018 Progress Report 232
Table A8.4.b College Continuation Rates of
2008-2009 Access College Early (ACE) Scholarship Recipients
Part 1: College Continuation Rates of ACE Recipients by Gender and Type of High School Attended Type of
High School Attended
# HS Seniors Who Received
ACE Scholarships
# of Senior ACE Recipients Who Enrolled in College
College Continuation Rate
Males Public 123 98 79.7% Nonpublic (Private) 2 2 100.0% Home-schooled 0 0 Total 125 100 80.0%
Females Public 317 257 81.1% Nonpublic (Private) 10 10 100.0% Home-schooled 0 0 Total 327 267 81.7%
Total Public 440 355 80.7% Nonpublic (Private) 12 12 100.0% Home-schooled 0 0 Total 452 367 81.2% Part 2: College Continuation Rates of Public High School Recipients of ACE Scholarships and Other Public High School Graduates by Gender and Student Income Status
Student Category # HS Grads # of Grads
Enrolled in College College
Continuation Rate
Males ACE Scholarship Recipients 123 98 79.7% Other Low Income Graduates 2,200 1,032 46.9% Non-Low Income Graduates 7,354 5,314 72.3% Total 9,677 6,444 66.6%
Females ACE Scholarship Recipients 317 257 81.1% Other Low Income Graduates 2,180 1,204 55.2% Non-Low Income Graduates 7,320 5,769 78.8% Total 9,817 7,230 73.6%
Total ACE Scholarship Recipients 440 355 80.7% Other Low Income Graduates 4,380 2,236 51.1% Non-Low Income Graduates 14,674 11,083 75.5% Total 19,494 13,674 70.1% Note. The college continuation rate is the number 2008-09 high school graduates who enrolled in college on or before April 20, 2010, divided by the total number of students who graduated from Nebraska high schools in 2008-09. National Student Clearinghouse records do not include students who enrolled in small private not-for-profit colleges or for-profit colleges and career schools that do not submit enrollment records to the Clearinghouse. Data sources: Nebraska’s Coordinating Commission for Postsecondary Education (numbers of ACE recipients), April 2010 and February 2015 (corrected); National Student Clearinghouse (college continuation data), April 2010; and Nebraska Department of Education (numbers of low-income and non-low-income graduates), April 2010.

Nebraska’s Coordinating Commission for Postsecondary Education – 2018 Progress Report 233
Table A8.4.c College Continuation Rates of
2009-2010 Access College Early (ACE) Scholarship Recipients
Part 1: College Continuation Rates of ACE Recipients by Gender and Type of High School Attended Type of
High School Attended
# HS Seniors Who Received
ACE Scholarships
# of Senior ACE Recipients Who Enrolled in College
College Continuation Rate
Males Public 186 136 73.1% Nonpublic (Private) 11 11 100.0% Home-schooled 0 0 Total 197 147 74.6%
Females Public 368 293 79.6% Nonpublic (Private) 23 22 95.7% Home-schooled 1 1 100.0% Total 392 316 80.6%
Total Public 554 429 77.4% Nonpublic (Private) 34 33 97.1% Home-schooled 1 1 100.0% Total 589 463 78.6% Part 2: College Continuation Rates of Public High School Recipients of ACE Scholarships and Other Public High School Graduates by Gender and Student Income Status
Student Category # HS Grads # of Grads
Enrolled in College College
Continuation Rate
Males ACE Scholarship Recipients 186 136 73.1% Other Low Income Graduates 2,343 1,185 50.6% Non-Low Income Graduates 7,165 5,321 74.3% Total 9,694 6,642 68.5%
Females ACE Scholarship Recipients 368 293 79.6% Other Low Income Graduates 2,399 1,365 56.9% Non-Low Income Graduates 6,947 5,648 81.3% Total 9,714 7,306 75.2%
Total ACE Scholarship Recipients 554 429 77.4% Other Low Income Graduates 4,742 2,550 53.8% Non-Low Income Graduates 14,112 10,969 77.7% Total 19,408 13,948 71.9% Note. The college continuation rate is the number 2009-10 high school graduates who enrolled in college on or before March 25, 2011, divided by the total number of students who graduated from Nebraska high schools in 2009-10. National Student Clearinghouse records do not include students who enrolled in small private not-for-profit colleges or for-profit colleges and career schools that do not submit enrollment records to the Clearinghouse. Data sources: Nebraska’s Coordinating Commission for Postsecondary Education (numbers of ACE recipients), February 2015 (corrected); National Student Clearinghouse (college continuation data), March 2011; and Nebraska Department of Education (numbers of low-income and non-low-income graduates), March 2011.
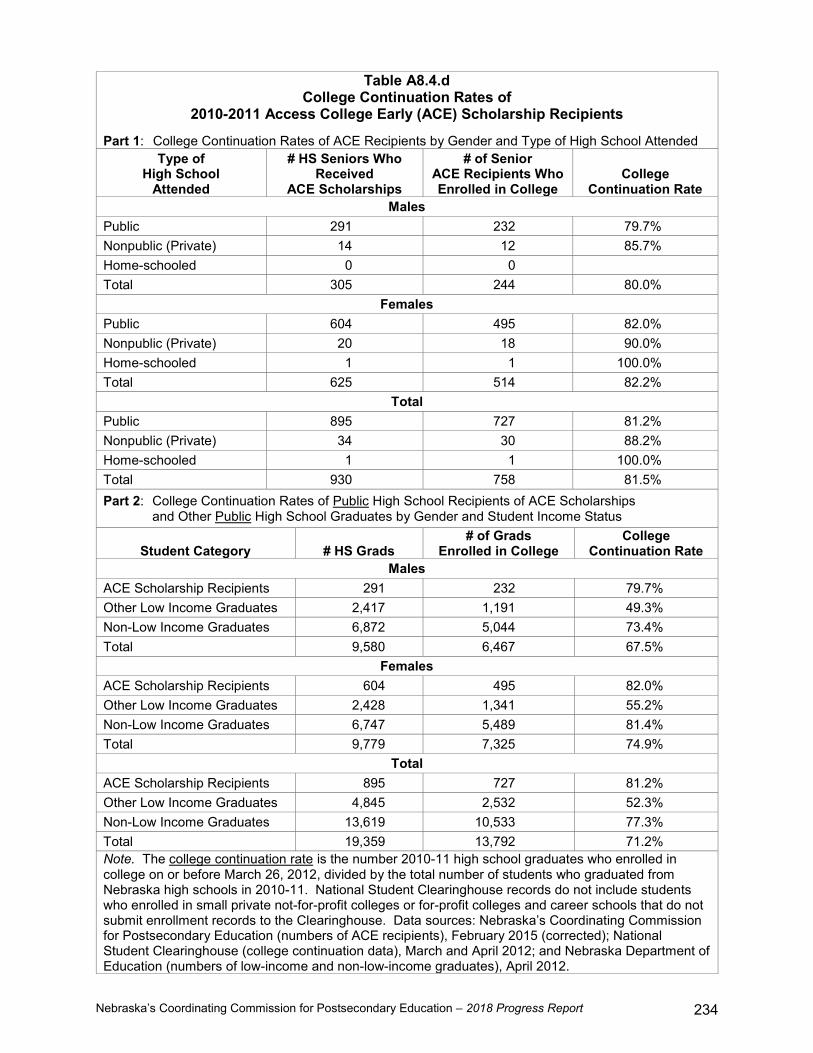
Nebraska’s Coordinating Commission for Postsecondary Education – 2018 Progress Report 234
Table A8.4.d College Continuation Rates of
2010-2011 Access College Early (ACE) Scholarship Recipients
Part 1: College Continuation Rates of ACE Recipients by Gender and Type of High School Attended Type of
High School Attended
# HS Seniors Who Received
ACE Scholarships
# of Senior ACE Recipients Who Enrolled in College
College Continuation Rate
Males Public 291 232 79.7% Nonpublic (Private) 14 12 85.7% Home-schooled 0 0 Total 305 244 80.0%
Females Public 604 495 82.0% Nonpublic (Private) 20 18 90.0% Home-schooled 1 1 100.0% Total 625 514 82.2%
Total Public 895 727 81.2% Nonpublic (Private) 34 30 88.2% Home-schooled 1 1 100.0% Total 930 758 81.5% Part 2: College Continuation Rates of Public High School Recipients of ACE Scholarships and Other Public High School Graduates by Gender and Student Income Status
Student Category # HS Grads # of Grads
Enrolled in College College
Continuation Rate
Males ACE Scholarship Recipients 291 232 79.7% Other Low Income Graduates 2,417 1,191 49.3% Non-Low Income Graduates 6,872 5,044 73.4% Total 9,580 6,467 67.5%
Females ACE Scholarship Recipients 604 495 82.0% Other Low Income Graduates 2,428 1,341 55.2% Non-Low Income Graduates 6,747 5,489 81.4% Total 9,779 7,325 74.9%
Total ACE Scholarship Recipients 895 727 81.2% Other Low Income Graduates 4,845 2,532 52.3% Non-Low Income Graduates 13,619 10,533 77.3% Total 19,359 13,792 71.2% Note. The college continuation rate is the number 2010-11 high school graduates who enrolled in college on or before March 26, 2012, divided by the total number of students who graduated from Nebraska high schools in 2010-11. National Student Clearinghouse records do not include students who enrolled in small private not-for-profit colleges or for-profit colleges and career schools that do not submit enrollment records to the Clearinghouse. Data sources: Nebraska’s Coordinating Commission for Postsecondary Education (numbers of ACE recipients), February 2015 (corrected); National Student Clearinghouse (college continuation data), March and April 2012; and Nebraska Department of Education (numbers of low-income and non-low-income graduates), April 2012.

Nebraska’s Coordinating Commission for Postsecondary Education – 2018 Progress Report 235
Table A8.4.e College Continuation Rates of
2011-2012 Access College Early (ACE) Scholarship Recipients
Part 1: College Continuation Rates of ACE Recipients by Gender and Type of High School Attended Type of
High School Attended
# HS Seniors Who Received
ACE Scholarships
# of Senior ACE Recipients Who Enrolled in College
College Continuation Rate
Males Public 341 276 80.9% Nonpublic (Private) 16 14 87.5% Home-schooled 1 1 100.0% Total 358 291 81.3%
Females Public 631 524 83.0% Nonpublic (Private) 21 21 100.0% Home-schooled 0 0 Total 652 545 83.6%
Total Public 972 800 82.3% Nonpublic (Private) 37 35 94.6% Home-schooled 1 1 100.0% Total 1,010 836 82.8% Part 2: College Continuation Rates of Public High School Recipients of ACE Scholarships and Other Public High School Graduates by Gender and Student Income Status
Student Category # HS Grads # of Grads
Enrolled in College College
Continuation Rate
Males ACE Scholarship Recipients 341 276 80.9% Other Low Income Graduates 2,606 1,247 47.9% Non-Low Income Graduates 6,687 4,820 72.1% Total 9,634 6,343 65.8%
Females ACE Scholarship Recipients 631 524 83.0% Other Low Income Graduates 2,609 1,495 57.3% Non-Low Income Graduates 6,501 5,355 82.4% Total 9,741 7,374 75.7%
Total ACE Scholarship Recipients 972 800 82.3% Other Low Income Graduates 5,215 2,742 52.6% Non-Low Income Graduates 13,188 10,175 77.2% Total 19,375 13,717 70.8% Note. The college continuation rate is the number 2011-12 high school graduates who enrolled in college on or before May 31, 2013, divided by the total number of students who graduated from Nebraska high schools in 2011-12. National Student Clearinghouse records do not include students who enrolled in small private not-for-profit colleges or for-profit colleges and career schools that do not submit enrollment records to the Clearinghouse. Data sources: Nebraska’s Coordinating Commission for Postsecondary Education (numbers of ACE recipients), February 2015 (corrected); National Student Clearinghouse (college continuation data), August and September 2013; and Nebraska Department of Education (numbers of low-income and non-low-income graduates), August 2013.

Nebraska’s Coordinating Commission for Postsecondary Education – 2018 Progress Report 236
Table A8.4.f College Continuation Rates of
2012-2013 Access College Early (ACE) Scholarship Recipients
Part 1: College Continuation Rates of ACE Recipients by Gender and Type of High School Attended Type of
High School Attended
# HS Seniors Who Received
ACE Scholarships
# of Senior ACE Recipients Who Enrolled in College
College Continuation Rate
Males Public 342 283 82.7% Nonpublic (Private) 12 11 91.7% Home-schooled 1 1 100.0% Total 355 295 83.1%
Females Public 609 536 88.0% Nonpublic (Private) 22 19 86.4% Home-schooled 3 2 66.7% Total 634 557 87.9%
Total Public 951 819 86.1% Nonpublic (Private) 34 30 88.2% Home-schooled 4 3 75.0% Total 989 852 86.1% Part 2: College Continuation Rates of Public High School Recipients of ACE Scholarships and Other Public High School Graduates by Gender and Student Income Status
Student Category # HS Grads # of Grads
Enrolled in College College
Continuation Rate
Males ACE Scholarship Recipients 342 283 82.7% Other Low Income Graduates 2,705 1283 47.4% Non-Low Income Graduates 6,689 4,921 73.6% Total 9,736 6,487 66.6%
Females ACE Scholarship Recipients 609 536 88.0% Other Low Income Graduates 2,766 1,534 55.5% Non-Low Income Graduates 6,342 5,208 82.1% Total 9,717 7,278 74.9%
Total ACE Scholarship Recipients 951 819 86.1% Other Low Income Graduates 5,471 2,817 51.5% Non-Low Income Graduates 13,031 10,129 77.7% Total 19,453 13,765 70.8% Note. The college continuation rate is the number 2012-13 high school graduates who enrolled in college on or before March 27, 2014, divided by the total number of students who graduated from Nebraska high schools in 2012-13. National Student Clearinghouse records do not include students who enrolled in small private not-for-profit colleges or for-profit colleges and career schools that do not submit enrollment records to the Clearinghouse. Data sources: Nebraska’s Coordinating Commission for Postsecondary Education (numbers of ACE recipients), June 2014; National Student Clearinghouse (college continuation data), March and April 2014; and Nebraska Department of Education (numbers of low-income and non-low-income graduates), April 2014.

Nebraska’s Coordinating Commission for Postsecondary Education – 2018 Progress Report 237
Table A8.4.g College Continuation Rates of
2013-2014 Access College Early (ACE) Scholarship Recipients
Part 1: College Continuation Rates of ACE Recipients by Gender and Type of High School Attended Type of
High School Attended
# HS Seniors Who Received
ACE Scholarships
# of Senior ACE Recipients Who Enrolled in College
College Continuation Rate
Males Public 394 301 76.4% Nonpublic (Private) 10 10 100.0% Home-schooled 1 1 100.0% Total 405 312 77.0%
Females Public 657 561 85.4% Nonpublic (Private) 28 23 82.1% Home-schooled 3 3 100.0% Total 688 587 85.3%
Total Public 1,051 862 82.0% Nonpublic (Private) 38 33 86.8% Home-schooled 4 4 100.0% Total 1,093 899 82.3% Part 2: College Continuation Rates of Public High School Recipients of ACE Scholarships and Other Public High School Graduates by Gender and Student Income Status
Student Category # HS Grads # of Grads
Enrolled in College College
Continuation Rate
Males ACE Scholarship Recipients 394 301 76.4% Other Low Income Graduates 2,730 1,345 49.3% Non-Low Income Graduates 6,568 4,852 73.9% Total 9,692 6,498 67.0%
Females ACE Scholarship Recipients 657 561 85.4% Other Low Income Graduates 2,780 1,608 57.8% Non-Low Income Graduates 6,400 5,303 82.9% Total 9,837 7,472 76.0%
Total ACE Scholarship Recipients 1,051 862 82.0% Other Low Income Graduates 5,510 2,953 53.6% Non-Low Income Graduates 12,968 10,155 78.3% Total 19,529 13,970 71.5% Note. The college continuation rate is the number 2013-14 high school graduates who enrolled in college on or before May 31, 2015, divided by the total number of students who graduated from Nebraska high schools in 2013-14. National Student Clearinghouse records do not include students who enrolled in small private not-for-profit colleges or for-profit colleges and career schools that do not submit enrollment records to the Clearinghouse. Data sources: Nebraska’s Coordinating Commission for Postsecondary Education (numbers of ACE recipients), August 2015; National Student Clearinghouse (college continuation data), August 2015; and Nebraska Department of Education (numbers of low-income and non-low-income graduates), August 2015.

Nebraska’s Coordinating Commission for Postsecondary Education – 2018 Progress Report 238
Table A8.4.h College Continuation Rates of
2014-2015 Access College Early (ACE) Scholarship Recipients
Part 1: College Continuation Rates of ACE Recipients by Gender and Type of High School Attended Type of
High School Attended
# HS Seniors Who Received
ACE Scholarships
# of Senior ACE Recipients Who Enrolled in College
College Continuation Rate
Males Public 426 336 78.9% Nonpublic (Private) 18 17 94.4% Home-schooled 0 0 Total 444 353 79.5%
Females Public 669 558 83.4% Nonpublic (Private) 14 11 78.6% Home-schooled 4 4 100.0% Total 687 573 83.4%
Total Public 1,095 894 81.6% Nonpublic (Private) 32 28 87.5% Home-schooled 4 4 100.0% Total 1,131 926 81.9% Part 2: College Continuation Rates of Public High School Recipients of ACE Scholarships and Other Public High School Graduates by Gender and Student Income Status
Student Category # HS Grads # of Grads
Enrolled in College College
Continuation Rate
Males ACE Scholarship Recipients 426 336 78.9% Other Low Income Graduates 2,780 1,328 47.8% Non-Low Income Graduates 6,549 4,806 73.4% Total 9,755 6,470 66.3%
Females ACE Scholarship Recipients 669 558 83.4% Other Low Income Graduates 2,767 1,534 55.4% Non-Low Income Graduates 6,445 5,379 83.5% Total 9,881 7,471 75.6%
Total ACE Scholarship Recipients 1,095 894 81.6% Other Low Income Graduates 5,547 2,862 51.6% Non-Low Income Graduates 12,994 10,185 78.4% Total 19,636 13,941 71.0% Note. The college continuation rate is the number 2014-15 high school graduates who enrolled in college on or before May 27, 2016, divided by the total number of students who graduated from Nebraska high schools in 2014-15. National Student Clearinghouse records do not include students who enrolled in small private not-for-profit colleges or for-profit colleges and career schools that do not submit enrollment records to the Clearinghouse. Data sources: Nebraska’s Coordinating Commission for Postsecondary Education (numbers of ACE recipients), May 2016; National Student Clearinghouse (college continuation data), May 2016; and Nebraska Department of Education (numbers of low-income and non-low-income graduates), April 2016.

Nebraska’s Coordinating Commission for Postsecondary Education – 2018 Progress Report 239
Table A8.4.i College Continuation Rates of
2015-2016 Access College Early (ACE) Scholarship Recipients
Part 1: College Continuation Rates of ACE Recipients by Gender and Type of High School Attended Type of
High School Attended
# HS Seniors Who Received
ACE Scholarships
# of Senior ACE Recipients Who Enrolled in College
College Continuation Rate
Males Public 379 292 77.0% Nonpublic (Private) 8 7 87.5% Home-schooled 0 0 Total 387 299 77.3%
Females Public 656 546 83.2% Nonpublic (Private) 20 20 100.0% Home-schooled 2 0 0.0% Total 678 566 83.5%
Total Public 1,035 838 81.0% Nonpublic (Private) 28 27 96.4% Home-schooled 2 0 0.0% Total 1,065 865 81.2% Part 2: College Continuation Rates of Public High School Recipients of ACE Scholarships and Other Public High School Graduates by Gender and Student Income Status
Student Category # HS Grads # of Grads
Enrolled in College College
Continuation Rate
Males ACE Scholarship Recipients 379 292 77.0% Other Low Income Graduates 2,911 1,448 49.7% Non-Low Income Graduates 6,662 4,878 73.2% Total 9,952 6,618 66.5%
Females ACE Scholarship Recipients 656 546 83.2% Other Low Income Graduates 2,740 1,556 56.8% Non-Low Income Graduates 6,484 5,353 82.6% Total 9,880 7,455 75.5%
Total ACE Scholarship Recipients 1,035 838 81.0% Other Low Income Graduates 5,651 3,004 53.2% Non-Low Income Graduates 13,146 10,231 77.8% Total 19,832 14,073 71.0% Note. The college continuation rate is the number 2015-16 high school graduates who enrolled in college on or before May 25, 2017, divided by the total number of students who graduated from Nebraska high schools in 2015-16. National Student Clearinghouse records do not include students who enrolled in small private not-for-profit colleges or for-profit colleges and career schools that do not submit enrollment records to the Clearinghouse. Data sources: Nebraska’s Coordinating Commission for Postsecondary Education (numbers of ACE recipients), May 2017; National Student Clearinghouse (college continuation data), May 2017; and Nebraska Department of Education (numbers of low-income and non-low-income graduates), October 2017.

Nebraska’s Coordinating Commission for Postsecondary Education – 2018 Progress Report 240
This page left blank intentionally.

Nebraska’s Coordinating Commission for Postsecondary Education – 2018 Progress Report 241
Appendix 9
IPEDS Freshmen Retention Rates
Explanatory Note A9.1 Information on Freshmen Retention Rates Based on Data
Obtained through the Integrated Postsecondary Education Data System (IPEDS)
Data collected through the Integrated Postsecondary Education Data System (IPEDS) are available from the National Center for Education Statistics to calculate freshmen retention rates. The retention rate for four-year institutions is the percentage of first-time bachelors (or equivalent) degree-seeking undergraduates from the previous fall who are again enrolled in the current fall. For all other institutions, this is the percentage of first-time degree/certificate-seeking students from the previous fall who either re-enrolled or successfully completed their program by the current fall. For fall 2006, institutions reported retention rates to IPEDS but did not report the number of students retained. For these years, the Commission estimated the number of students retained by multiplying the number of first-time freshmen by the reported retention rate. Beginning with fall 2007 data, the retention rate for an institution is determined by dividing the reported number of retained students by the adjusted fall cohort of first-time freshmen. A cohort may be reduced only by removing (deleting) students who leave the institution for any of the following reasons: death or total and permanent disability; service in the armed forces; service with a foreign aid service of the federal government, such as the Peace Corps; or service on official church missions. Otherwise, students remain in a cohort group even if they change their enrollment intensity (full time/part time), transfer to other institutions, or drop out of the institution permanently or temporarily. Beginning with 2016 retention data, cohorts are adjusted by adding inclusions to the adjusted freshmen cohort data. Inclusions to the freshmen cohort consist of first-time bachelor’s seeking study abroad students who were excluded from the first-time cohort but who have re-enrolled at the institution their second year. Computation and Comparison of Freshmen Retention Rates by Sector Fall 2006 freshmen retention rates for the non-public sectors of higher education are limited for the following reasons:
• CHI Health School of Radiologic Technology reported 13 full-time first-time freshmen in fall 2005 but did not report a full-time freshmen retention rate for fall 2006. • Doane University-Arts & Sciences reported they had no part-time first-time freshmen in fall 2005 but reported a part-time freshmen retention rate of 36.0% for fall 2006. • Midland University reported one part-time first-time freshmen in fall 2005 but did not report a part-time freshmen retention rate for fall 2006. • Omaha School of Massage and Healthcare of Herzing University reported 82 full-time first-time freshmen and 13 part-time first-time freshmen in fall 2005 but did not report freshmen retention rates for fall 2006.
Trend comparisons by sector and by institution are further limited for the following reasons:
• CHI Health School of Radiologic Technology no longer enrolls freshmen. • ITT Technical Institute-Omaha, Kaplan University-Lincoln Campus, Kaplan University-Omaha Campus, and The Creative Center can no longer report traditional freshmen retention rates. Since they are now four-year schools, they report retention rates only for bachelor-seeking students, even though all or most of their first-time freshmen register for associate-degree programs or programs of less than two years in length.

Nebraska’s Coordinating Commission for Postsecondary Education – 2018 Progress Report 242
Table A9.1 Nebraska Full-Time Freshmen Retention Rates
of Nebraska Postsecondary Institutions by Sector Fall 2016 Compared to Fall 2006
Sector of Nebraska Postsecondary
Education
Fall 2006 Fall 2016
No. of Full-Time, First-Time Freshmen Fall 2005
Estimated No. of
Students Retained Fall 2006
Full-Time Retention
Rate Fall 2006
No. of Full-Time, First-Time Freshmen Fall 2015
No. of Students Retained Fall 2016
Full-Time Retention
Rate Fall 2016
University of Nebraska 6,392 5,097 79.7% 7,227 5,860 81.1%
Nebraska State College System 1,072 737 68.8% 1,292 841 65.1%
Nebraska Community Colleges 4,174 2,639 63.2% 3,944 2,459 62.3%
Total All Public Institutions 11,638 8,473 72.8% 12,463 9,160 73.5%
Nebraska Independent Institutions
3,323 2,510 75.5% 3,391 2,591 76.4%
For-Profit/ Career Schools 1,342 Insufficient Data 220 174 79.1%
Nebraska State Retention Rate (Excluding For-Profit/ Career Schools)
14,961 10,983 73.4% 15,854 11,751 74.1%
Nebraska State Retention Rate (Including For-Profit/ Career Schools)
16,303 Insufficient Data 16,074 11,925 74.2%
Note. The schools in the for-profit/career school sector did not provide sufficient data to calculate full-time retention rates for the sector or for the state for fall 2006. See Explanatory Note A9.1 in Appendix 9 for more information on limitations of sector comparisons. Data source: National Center for Education Statistics, IPEDS fall 2005, fall 2006, and fall 2016 surveys.

Nebraska’s Coordinating Commission for Postsecondary Education – 2018 Progress Report 243
Table A9.2 Nebraska Part-Time Freshmen Retention Rates
of Nebraska Postsecondary Institutions by Sector Fall 2016 Compared to Fall 2006
Sector of Nebraska Postsecondary
Education
Fall 2006 Fall 2016
No. of Part-Time, First-Time Freshmen Fall 2005
Estimated No. of
Students Retained Fall 2006
Part-Time Retention
Rate Fall 2006
No. of Part-Time, First-Time Freshmen Fall 2015
No. of Students Retained Fall 2016
Part-Time Retention
Rate Fall 2016
University of Nebraska 124 64 51.6% 127 64 50.4%
Nebraska State College System 60 32 53.3% 17 7 41.2%
Nebraska Community Colleges 1,499 586 39.1% 1,538 570 37.1%
Total All Public Institutions 1,683 682 40.5% 1,682 641 38.1%
Nebraska Independent Institutions
88 Insufficient Data 25 11 44.0%
For-Profit/ Career Schools 162 Insufficient Data 6 6 100.0%
Nebraska State Retention Rate 1,933 Insufficient Data 1,713 658 38.4%
Note. The schools in the independent and for-profit/career school sectors did not provide sufficient data to calculate part-time retention rates for the sectors or for the state for fall 2006. See Explanatory Note A9.1 in Appendix 9 for more information on limitations of sector comparisons. Data source: National Center for Education Statistics, IPEDS fall 2005, fall 2006, and fall 2016 surveys.
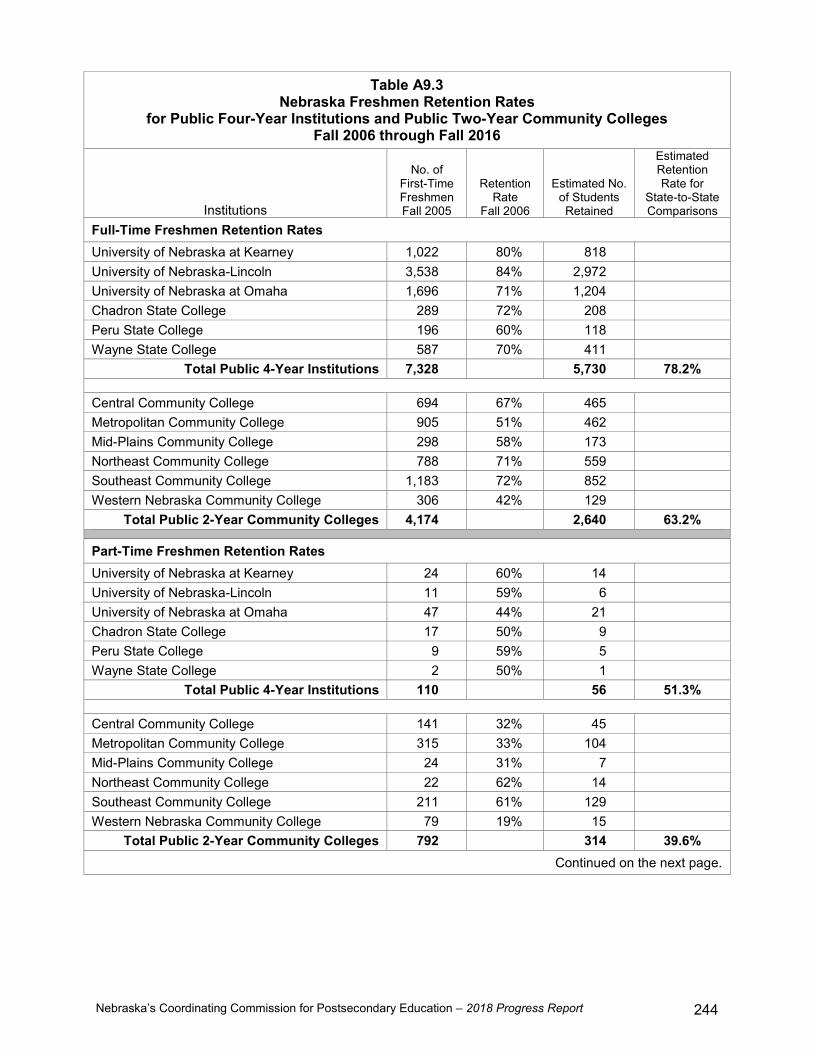
Nebraska’s Coordinating Commission for Postsecondary Education – 2018 Progress Report 244
Table A9.3 Nebraska Freshmen Retention Rates
for Public Four-Year Institutions and Public Two-Year Community Colleges Fall 2006 through Fall 2016
Institutions
No. of First-Time Freshmen Fall 2005
Retention Rate
Fall 2006
Estimated No. of Students Retained
Estimated Retention Rate for
State-to-State Comparisons
Full-Time Freshmen Retention Rates University of Nebraska at Kearney 1,022 80% 818 University of Nebraska-Lincoln 3,538 84% 2,972 University of Nebraska at Omaha 1,696 71% 1,204 Chadron State College 289 72% 208 Peru State College 196 60% 118 Wayne State College 587 70% 411
Total Public 4-Year Institutions 7,328 5,730 78.2%
Central Community College 694 67% 465 Metropolitan Community College 905 51% 462 Mid-Plains Community College 298 58% 173 Northeast Community College 788 71% 559 Southeast Community College 1,183 72% 852 Western Nebraska Community College 306 42% 129
Total Public 2-Year Community Colleges 4,174 2,640 63.2%
Part-Time Freshmen Retention Rates University of Nebraska at Kearney 24 60% 14 University of Nebraska-Lincoln 11 59% 6 University of Nebraska at Omaha 47 44% 21 Chadron State College 17 50% 9 Peru State College 9 59% 5 Wayne State College 2 50% 1
Total Public 4-Year Institutions 110 56 51.3%
Central Community College 141 32% 45 Metropolitan Community College 315 33% 104 Mid-Plains Community College 24 31% 7 Northeast Community College 22 62% 14 Southeast Community College 211 61% 129 Western Nebraska Community College 79 19% 15
Total Public 2-Year Community Colleges 792 314 39.6% Continued on the next page.

Nebraska’s Coordinating Commission for Postsecondary Education – 2018 Progress Report 245
Table A9.3 Continued
Fall 2007 Retention Rates
Institutions
No. of First-Time Freshmen Fall 2006
Retention Rate
Fall 2007
No. of Students Retained
Retention Rate for
State-to-State Comparisons
Full-Time Freshmen Retention Rates University of Nebraska at Kearney 937 79% 743 University of Nebraska-Lincoln 3,831 83% 3,176 University of Nebraska at Omaha 1,638 74% 1,208 Chadron State College 354 66% 234 Peru State College 214 50% 107 Wayne State College 606 75% 452
Total Public 4-Year Institutions 7,580 5,920 78.1%
Central Community College 744 63% 471 Metropolitan Community College 900 54% 488 Mid-Plains Community College 243 59% 143 Northeast Community College 679 70% 473 Southeast Community College 1,596 64% 1,021 Western Nebraska Community College 362 55% 198
Total Public 2-Year Community Colleges 4,524 2,794 61.8%
Part-Time Freshmen Retention Rates University of Nebraska at Kearney 56 77% 43 University of Nebraska-Lincoln 18 44% 8 University of Nebraska at Omaha 66 41% 27 Chadron State College 12 33% 4 Peru State College 3 33% 1 Wayne State College 5 20% 1
Total Public 4-Year Institutions 160 84 52.5%
Central Community College 235 33% 77 Metropolitan Community College 609 33% 203 Mid-Plains Community College 28 39% 11 Northeast Community College 74 65% 48 Southeast Community College 672 47% 316 Western Nebraska Community College 95 19% 18
Total Public 2-Year Community Colleges 1,713 673 39.3% Continued on the next page.

Nebraska’s Coordinating Commission for Postsecondary Education – 2018 Progress Report 246
Table A9.3 Continued
Fall 2008 Retention Rates
Institutions
No. of First-Time Freshmen Fall 2007
Retention Rate
Fall 2008
No. of Students Retained
Retention Rate for
State-to-State Comparisons
Full-Time Freshmen Retention Rates University of Nebraska at Kearney 915 79% 719 University of Nebraska-Lincoln 4,215 84% 3,521 University of Nebraska at Omaha 1,603 69% 1,108 Chadron State College 409 64% 260 Peru State College 198 64% 126 Wayne State College 654 65% 427
Total Public 4-Year Institutions 7,994 6,161 77.1%
Central Community College 706 65% 461 Metropolitan Community College 862 51% 436 Mid-Plains Community College 289 52% 149 Northeast Community College 744 68% 507 Southeast Community College 931 74% 689 Western Nebraska Community College 383 49% 189
Total Public 2-Year Community Colleges 3,915 2,431 62.1%
Part-Time Freshmen Retention Rates University of Nebraska at Kearney 57 65% 37 University of Nebraska-Lincoln 20 55% 11 University of Nebraska at Omaha 72 43% 31 Chadron State College 6 17% 1 Peru State College 8 100% 8 Wayne State College 7 0% 0
Total Public 4-Year Institutions 170 88 51.8%
Central Community College 160 35% 56 Metropolitan Community College 653 32% 206 Mid-Plains Community College 74 34% 25 Northeast Community College 60 33% 20 Southeast Community College 969 70% 678 Western Nebraska Community College 119 28% 33
Total Public 2-Year Community Colleges 2,035 1,018 50.0% Continued on the next page.

Nebraska’s Coordinating Commission for Postsecondary Education – 2018 Progress Report 247
Table A9.3 Continued
Fall 2009 Retention Rates
Institutions
No. of First-Time Freshmen Fall 2008
Retention Rate
Fall 2009
No. of Students Retained
Retention Rate for
State-to-State Comparisons
Full-Time Freshmen Retention Rates University of Nebraska at Kearney 1,019 83% 843 University of Nebraska-Lincoln 4,166 84% 3,494 University of Nebraska at Omaha 1,755 72% 1,256 Chadron State College 403 66% 264 Peru State College 209 63% 132 Wayne State College 653 67% 436
Total Public 4-Year Institutions 8,205 6,425 78.3%
Central Community College 756 62% 465 Metropolitan Community College 876 55% 485 Mid-Plains Community College 255 55% 141 Northeast Community College 685 68% 466 Southeast Community College 1,298 75% 974 Western Nebraska Community College 364 56% 205
Total Public 2-Year Community Colleges 4,234 2,736 64.6%
Part-Time Freshmen Retention Rates University of Nebraska at Kearney 8 38% 3 University of Nebraska-Lincoln 34 53% 18 University of Nebraska at Omaha 52 44% 23 Chadron State College 12 25% 3 Peru State College 8 100% 8 Wayne State College 7 29% 2
Total Public 4-Year Institutions 121 57 47.1%
Central Community College 189 43% 82 Metropolitan Community College 586 33% 193 Mid-Plains Community College 47 40% 19 Northeast Community College 61 46% 28 Southeast Community College 580 73% 423 Western Nebraska Community College 94 36% 34
Total Public 2-Year Community Colleges 1,557 779 50.0% Continued on the next page.
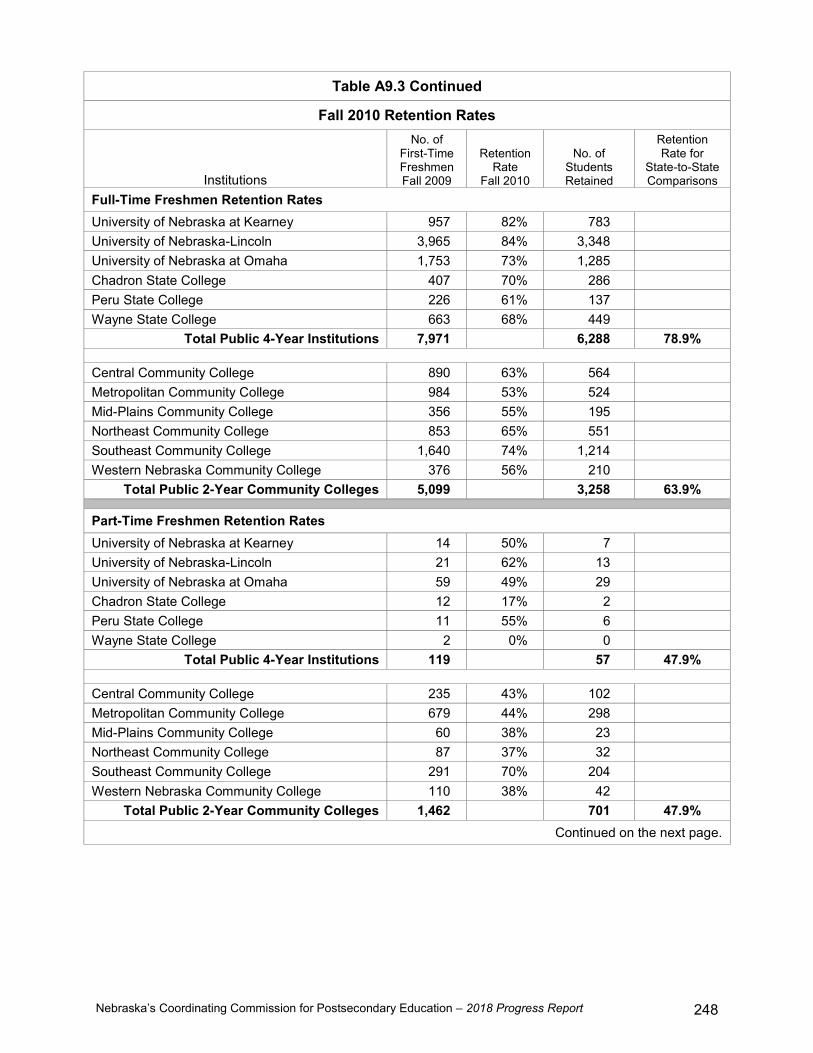
Nebraska’s Coordinating Commission for Postsecondary Education – 2018 Progress Report 248
Table A9.3 Continued
Fall 2010 Retention Rates
Institutions
No. of First-Time Freshmen Fall 2009
Retention Rate
Fall 2010
No. of Students Retained
Retention Rate for
State-to-State Comparisons
Full-Time Freshmen Retention Rates University of Nebraska at Kearney 957 82% 783 University of Nebraska-Lincoln 3,965 84% 3,348 University of Nebraska at Omaha 1,753 73% 1,285 Chadron State College 407 70% 286 Peru State College 226 61% 137 Wayne State College 663 68% 449
Total Public 4-Year Institutions 7,971 6,288 78.9%
Central Community College 890 63% 564 Metropolitan Community College 984 53% 524 Mid-Plains Community College 356 55% 195 Northeast Community College 853 65% 551 Southeast Community College 1,640 74% 1,214 Western Nebraska Community College 376 56% 210
Total Public 2-Year Community Colleges 5,099 3,258 63.9%
Part-Time Freshmen Retention Rates University of Nebraska at Kearney 14 50% 7 University of Nebraska-Lincoln 21 62% 13 University of Nebraska at Omaha 59 49% 29 Chadron State College 12 17% 2 Peru State College 11 55% 6 Wayne State College 2 0% 0
Total Public 4-Year Institutions 119 57 47.9%
Central Community College 235 43% 102 Metropolitan Community College 679 44% 298 Mid-Plains Community College 60 38% 23 Northeast Community College 87 37% 32 Southeast Community College 291 70% 204 Western Nebraska Community College 110 38% 42
Total Public 2-Year Community Colleges 1,462 701 47.9% Continued on the next page.

Nebraska’s Coordinating Commission for Postsecondary Education – 2018 Progress Report 249
Table A9.3 Continued
Fall 2011 Retention Rates
Institutions
No. of First-Time Freshmen Fall 2010
Retention Rate
Fall 2011
No. of Students Retained
Retention Rate for
State-to-State Comparisons
Full-Time Freshmen Retention Rates University of Nebraska at Kearney 1,124 77% 869 University of Nebraska-Lincoln 4,039 84% 3,378 University of Nebraska at Omaha 1,720 73% 1,254 Chadron State College 384 66% 254 Peru State College 243 53% 129 Wayne State College 677 68% 460
Total Public 4-Year Institutions 8,187 6,344 77.5%
Central Community College 853 59% 506 Metropolitan Community College 1,148 43% 491 Mid-Plains Community College 401 50% 200 Northeast Community College 865 63% 547 Southeast Community College 1,168 63% 732 Western Nebraska Community College 402 51% 204
Total Public 2-Year Community Colleges 4,837 2,680 55.4%
Part-Time Freshmen Retention Rates University of Nebraska at Kearney 8 25% 2 University of Nebraska-Lincoln 36 47% 17 University of Nebraska at Omaha 68 53% 36 Chadron State College 14 21% 3 Peru State College 5 20% 1 Wayne State College 4 25% 1
Total Public 4-Year Institutions 135 60 44.4%
Central Community College 206 39% 80 Metropolitan Community College 799 39% 314 Mid-Plains Community College 56 34% 19 Northeast Community College 120 31% 37 Southeast Community College 696 42% 289 Western Nebraska Community College 85 25% 21
Total Public 2-Year Community Colleges 1,962 760 38.7% Continued on the next page.
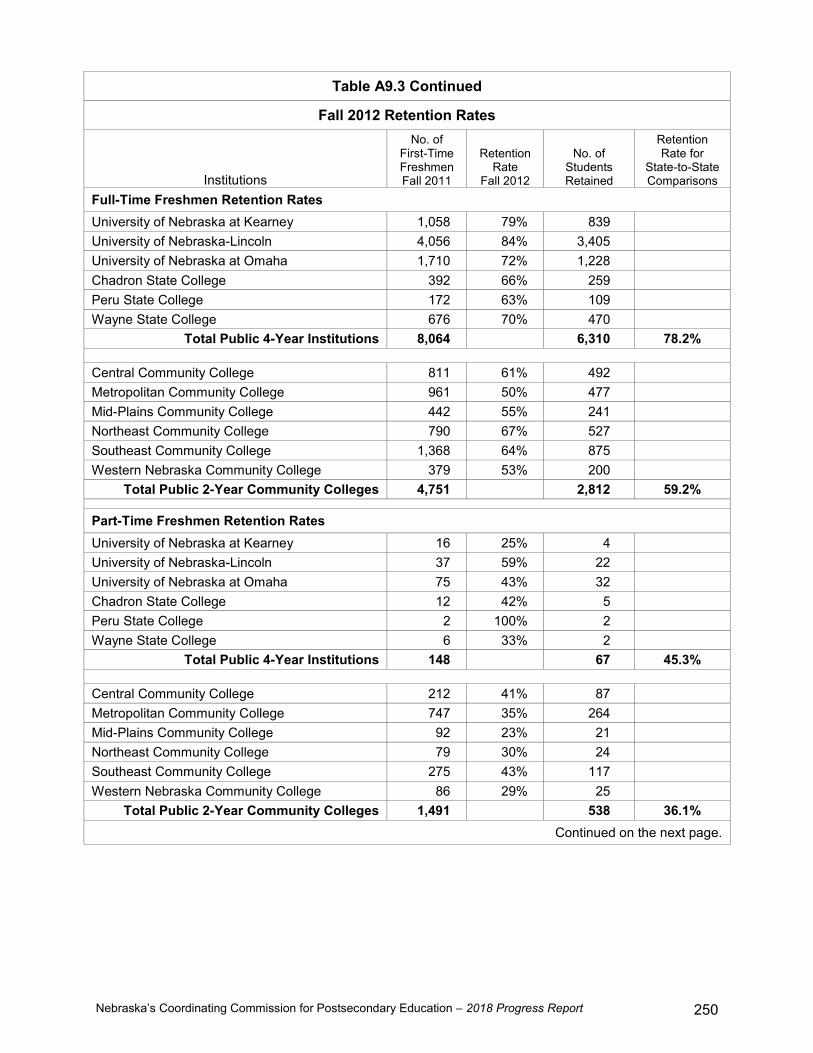
Nebraska’s Coordinating Commission for Postsecondary Education – 2018 Progress Report 250
Table A9.3 Continued
Fall 2012 Retention Rates
Institutions
No. of First-Time Freshmen Fall 2011
Retention Rate
Fall 2012
No. of Students Retained
Retention Rate for
State-to-State Comparisons
Full-Time Freshmen Retention Rates University of Nebraska at Kearney 1,058 79% 839 University of Nebraska-Lincoln 4,056 84% 3,405 University of Nebraska at Omaha 1,710 72% 1,228 Chadron State College 392 66% 259 Peru State College 172 63% 109 Wayne State College 676 70% 470
Total Public 4-Year Institutions 8,064 6,310 78.2%
Central Community College 811 61% 492 Metropolitan Community College 961 50% 477 Mid-Plains Community College 442 55% 241 Northeast Community College 790 67% 527 Southeast Community College 1,368 64% 875 Western Nebraska Community College 379 53% 200
Total Public 2-Year Community Colleges 4,751 2,812 59.2%
Part-Time Freshmen Retention Rates University of Nebraska at Kearney 16 25% 4 University of Nebraska-Lincoln 37 59% 22 University of Nebraska at Omaha 75 43% 32 Chadron State College 12 42% 5 Peru State College 2 100% 2 Wayne State College 6 33% 2
Total Public 4-Year Institutions 148 67 45.3%
Central Community College 212 41% 87 Metropolitan Community College 747 35% 264 Mid-Plains Community College 92 23% 21 Northeast Community College 79 30% 24 Southeast Community College 275 43% 117 Western Nebraska Community College 86 29% 25
Total Public 2-Year Community Colleges 1,491 538 36.1% Continued on the next page.

Nebraska’s Coordinating Commission for Postsecondary Education – 2018 Progress Report 251
Table A9.3 Continued
Fall 2013 Retention Rates
Institutions
No. of First-Time Freshmen Fall 2012
Retention Rate
Fall 2013
No. of Students Retained
Retention Rate for
State-to-State Comparisons
Full-Time Freshmen Retention Rates University of Nebraska at Kearney 1,123 76% 848 University of Nebraska-Lincoln 3,918 84% 3,277 University of Nebraska at Omaha 1,648 75% 1,232 Chadron State College 398 67% 268 Peru State College 194 58% 113 Wayne State College 693 62% 429
Total Public 4-Year Institutions 7,974 6,167 77.3%
Central Community College 740 63% 465 Metropolitan Community College 1,237 50% 624 Mid-Plains Community College 425 53% 225 Northeast Community College 800 68% 547 Southeast Community College 1,203 57% 691 Western Nebraska Community College 373 49% 181
Total Public 2-Year Community Colleges 4,778 2,733 57.2%
Part-Time Freshmen Retention Rates University of Nebraska at Kearney 13 46% 6 University of Nebraska-Lincoln 19 47% 9 University of Nebraska at Omaha 113 58% 66 Chadron State College 11 36% 4 Peru State College 14 29% 4 Wayne State College 2 0% 0
Total Public 4-Year Institutions 172 89 51.7%
Central Community College 199 39% 78 Metropolitan Community College 761 31% 238 Mid-Plains Community College 109 35% 38 Northeast Community College 83 34% 28 Southeast Community College 317 50% 158 Western Nebraska Community College 95 20% 19
Total Public 2-Year Community Colleges 1,564 559 35.7% Continued on the next page.

Nebraska’s Coordinating Commission for Postsecondary Education – 2018 Progress Report 252
Table A9.3 Continued
Fall 2014 Retention Rates
Institutions
No. of First-Time Freshmen Fall 2013
Retention Rate
Fall 2014
No. of Students Retained
Retention Rate for
State-to-State Comparisons
Full-Time Freshmen Retention Rates University of Nebraska at Kearney 1,007 80% 801 University of Nebraska-Lincoln 4,396 84% 3,693 University of Nebraska at Omaha 1,780 77% 1,378 Chadron State College 458 65% 298 Peru State College 272 58% 159 Wayne State College 690 68% 467
Total Public 4-Year Institutions 8,603 6,796 79.0%
Central Community College 710 65% 461 Metropolitan Community College 1,077 47% 509 Mid-Plains Community College 398 59% 236 Northeast Community College 749 69% 517 Southeast Community College 1,205 61% 736 Western Nebraska Community College 335 59% 198
Total Public 2-Year Community Colleges 4,474 2,657 59.4%
Part-Time Freshmen Retention Rates University of Nebraska at Kearney 15 33% 5 University of Nebraska-Lincoln 24 33% 8 University of Nebraska at Omaha 95 45% 43 Chadron State College 5 20% 1 Peru State College 6 0% 0 Wayne State College 1 100% 1
Total Public 4-Year Institutions 146 58 39.7%
Central Community College 194 44% 86 Metropolitan Community College 866 37% 317 Mid-Plains Community College 87 32% 28 Northeast Community College 78 29% 23 Southeast Community College 361 42% 153 Western Nebraska Community College 83 28% 23
Total Public 2-Year Community Colleges 1,669 630 37.7% Continued on the next page.

Nebraska’s Coordinating Commission for Postsecondary Education – 2018 Progress Report 253
Table A9.3 Continued
Fall 2015 Retention Rates
Institutions
No. of First-Time Freshmen Fall 2014
Retention Rate
Fall 2015
No. of Students Retained
Retention Rate for
State-to-State Comparisons
Full-Time Freshmen Retention Rates University of Nebraska at Kearney 985 80% 785 University of Nebraska-Lincoln 4,628 83% 3,820 University of Nebraska at Omaha 1,743 77% 1,344 Chadron State College 460 65% 298 Peru State College 259 54% 139 Wayne State College 680 72% 490
Total Public 4-Year Institutions 8,755 6,876 78.5%
Central Community College 622 69% 427 Metropolitan Community College 1,075 45% 489 Mid-Plains Community College 353 60% 211 Northeast Community College 785 75% 588 Southeast Community College 1,064 60% 635 Western Nebraska Community College 335 52% 174
Total Public 2-Year Community Colleges 4,234 2,524 59.6%
Part-Time Freshmen Retention Rates University of Nebraska at Kearney 5 40% 2 University of Nebraska-Lincoln 24 50% 12 University of Nebraska at Omaha 96 49% 47 Chadron State College 6 17% 1 Peru State College 9 22% 2 Wayne State College 5 40% 2
Total Public 4-Year Institutions 145 66 45.5%
Central Community College 182 44% 80 Metropolitan Community College 885 33% 295 Mid-Plains Community College 34 44% 15 Northeast Community College 94 38% 36 Southeast Community College 306 45% 139 Western Nebraska Community College 71 31% 22
Total Public 2-Year Community Colleges 1,572 587 37.3% Continued on the next page.

Nebraska’s Coordinating Commission for Postsecondary Education – 2018 Progress Report 254
Table A9.3 Continued
Fall 2016 Retention Rates
Institutions
No. of First-Time Freshmen Fall 2015
Retention Rate
Fall 2016
No. of Students Retained
Retention Rate for
State-to-State Comparisons
Full-Time Freshmen Retention Rates University of Nebraska at Kearney 931 84% 778 University of Nebraska-Lincoln 4,603 82% 3,784 University of Nebraska at Omaha 1,602 77% 1,240 Chadron State College 413 64% 265 Peru State College 249 63% 157 Wayne State College 630 67% 419
Total Public 4-Year Institutions 8,428 6,643 78.8%
Central Community College 611 68% 416 Metropolitan Community College 909 53% 485 Mid-Plains Community College 329 67% 221 Northeast Community College 768 70% 536 Southeast Community College 1,010 63% 633 Western Nebraska Community College 317 53% 168
Total Public 2-Year Community Colleges 3,944 2,459 62.3%
Part-Time Freshmen Retention Rates University of Nebraska at Kearney 7 57% 4 University of Nebraska-Lincoln 25 56% 14 University of Nebraska at Omaha 95 48% 46 Chadron State College 15 40% 6 Peru State College 1 100% 1 Wayne State College 1 0% 0
Total Public 4-Year Institutions 144 71 49.3%
Central Community College 197 48% 94 Metropolitan Community College 774 34% 263 Mid-Plains Community College 56 29% 16 Northeast Community College 79 39% 31 Southeast Community College 359 42% 151 Western Nebraska Community College 73 21% 15
Total Public 2-Year Community Colleges 1,538 570 37.1% Data source: National Center for Education Statistics, IPEDS fall 2005 through fall 2016 surveys.

Nebraska’s Coordinating Commission for Postsecondary Education – 2018 Progress Report 255
Table A9.4 Nebraska Full-Time Freshmen Retention Rates by Institution
Fall 2016 Compared to Fall 2006
Sector and Institution
% of Fall 2005 Full-Time Freshmen Enrolled Fall 2006
% of Fall 2015 Full-Time Freshmen
Enrolled Fall 2016
University of Nebraska Nebraska College of Technical Agriculture 76% 64% University of Nebraska at Kearney 80% 84% University of Nebraska-Lincoln 84% 82% University of Nebraska Medical Center NA NA University of Nebraska at Omaha 71% 77% Nebraska State College System Chadron State College 72% 64% Peru State College 60% 63% Wayne State College 70% 67% Nebraska Community Colleges Central Community College 67% 68% Metropolitan Community College 51% 53% Mid-Plains Community College 58% 67% Northeast Community College 71% 70% Southeast Community College 72% 63% Western Nebraska Community College 42% 53% Independent Colleges & Universities Bellevue University 64% 55% Bryan College of Health Sciences NA 88% Clarkson College 86% 77% College of Saint Mary 62% 70% Concordia University-Seward 72% 74% Creighton University 88% 89% Dana College 61% Not Open Doane University-Arts & Sciences 78% 71% Doane University-Graduate and Professional Studies NA 100% Grace University 55% 73% Hastings College 69% 65% Little Priest Tribal College 33% 37% Midland University 65% 64% Nebraska Christian College of Hope International University 71% 83% Nebraska Indian Community College 25% 47% Nebraska Methodist College of Nursing & Allied Health 78% 75% Nebraska Wesleyan University 80% 78% Summit Christian College 69% 100% Union College 71% 81% York College 71% 53%
Continued on the next page.
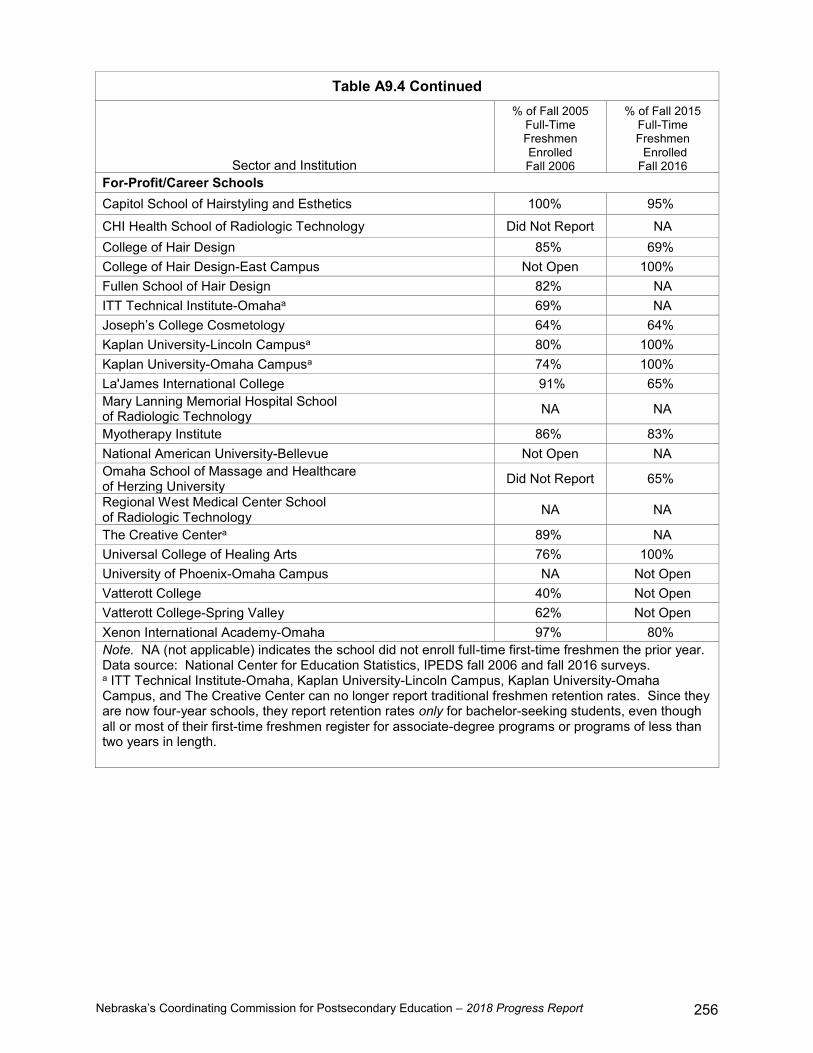
Nebraska’s Coordinating Commission for Postsecondary Education – 2018 Progress Report 256
Table A9.4 Continued
Sector and Institution
% of Fall 2005 Full-Time Freshmen Enrolled Fall 2006
% of Fall 2015 Full-Time Freshmen
Enrolled Fall 2016
For-Profit/Career Schools Capitol School of Hairstyling and Esthetics 100% 95% CHI Health School of Radiologic Technology Did Not Report NA College of Hair Design 85% 69% College of Hair Design-East Campus Not Open 100% Fullen School of Hair Design 82% NA ITT Technical Institute-Omahaa 69% NA Joseph’s College Cosmetology 64% 64% Kaplan University-Lincoln Campusa 80% 100% Kaplan University-Omaha Campusa 74% 100% La'James International College 91% 65% Mary Lanning Memorial Hospital School of Radiologic Technology NA NA
Myotherapy Institute 86% 83% National American University-Bellevue Not Open NA Omaha School of Massage and Healthcare of Herzing University Did Not Report 65%
Regional West Medical Center School of Radiologic Technology NA NA
The Creative Centera 89% NA Universal College of Healing Arts 76% 100% University of Phoenix-Omaha Campus NA Not Open Vatterott College 40% Not Open Vatterott College-Spring Valley 62% Not Open Xenon International Academy-Omaha 97% 80% Note. NA (not applicable) indicates the school did not enroll full-time first-time freshmen the prior year. Data source: National Center for Education Statistics, IPEDS fall 2006 and fall 2016 surveys. a ITT Technical Institute-Omaha, Kaplan University-Lincoln Campus, Kaplan University-Omaha Campus, and The Creative Center can no longer report traditional freshmen retention rates. Since they are now four-year schools, they report retention rates only for bachelor-seeking students, even though all or most of their first-time freshmen register for associate-degree programs or programs of less than two years in length.
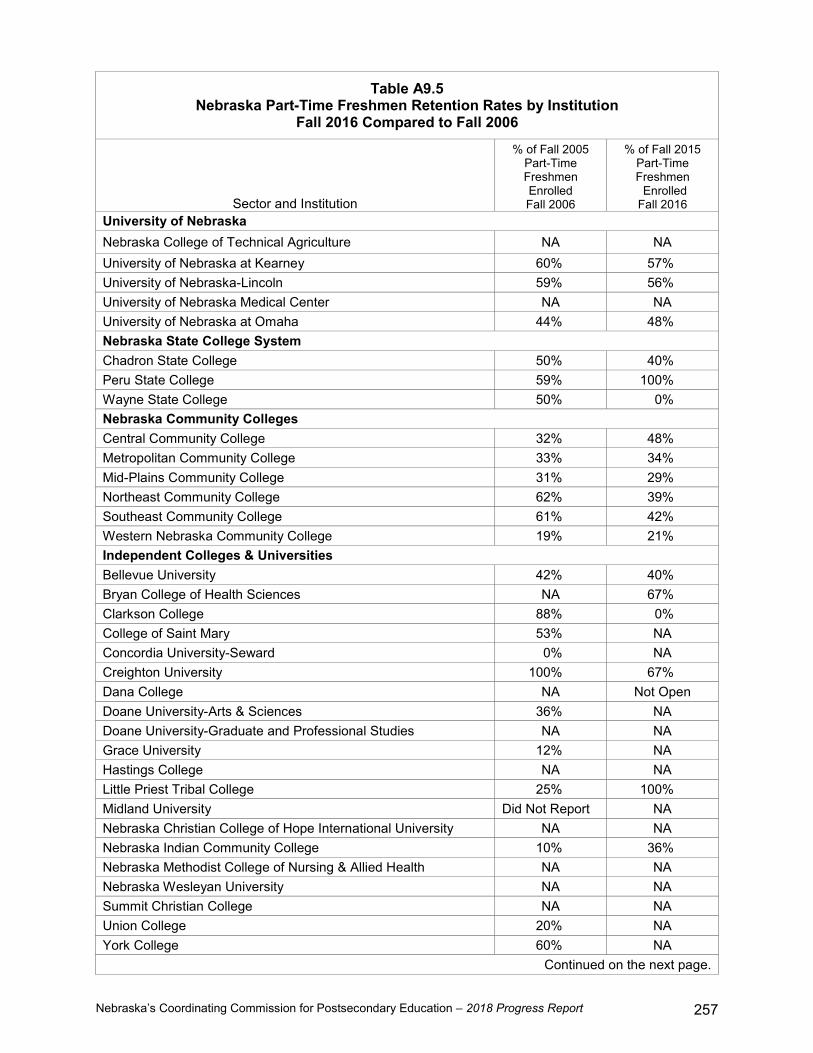
Nebraska’s Coordinating Commission for Postsecondary Education – 2018 Progress Report 257
Table A9.5 Nebraska Part-Time Freshmen Retention Rates by Institution
Fall 2016 Compared to Fall 2006
Sector and Institution
% of Fall 2005 Part-Time Freshmen Enrolled Fall 2006
% of Fall 2015 Part-Time Freshmen
Enrolled Fall 2016
University of Nebraska Nebraska College of Technical Agriculture NA NA University of Nebraska at Kearney 60% 57% University of Nebraska-Lincoln 59% 56% University of Nebraska Medical Center NA NA University of Nebraska at Omaha 44% 48% Nebraska State College System Chadron State College 50% 40% Peru State College 59% 100% Wayne State College 50% 0% Nebraska Community Colleges Central Community College 32% 48% Metropolitan Community College 33% 34% Mid-Plains Community College 31% 29% Northeast Community College 62% 39% Southeast Community College 61% 42% Western Nebraska Community College 19% 21% Independent Colleges & Universities Bellevue University 42% 40% Bryan College of Health Sciences NA 67% Clarkson College 88% 0% College of Saint Mary 53% NA Concordia University-Seward 0% NA Creighton University 100% 67% Dana College NA Not Open Doane University-Arts & Sciences 36% NA Doane University-Graduate and Professional Studies NA NA Grace University 12% NA Hastings College NA NA Little Priest Tribal College 25% 100% Midland University Did Not Report NA Nebraska Christian College of Hope International University NA NA Nebraska Indian Community College 10% 36% Nebraska Methodist College of Nursing & Allied Health NA NA Nebraska Wesleyan University NA NA Summit Christian College NA NA Union College 20% NA York College 60% NA
Continued on the next page.

Nebraska’s Coordinating Commission for Postsecondary Education – 2018 Progress Report 258
Table A9.5 Continued
Sector and Institution
% of Fall 2005 Part-Time Freshmen Enrolled Fall 2006
% of Fall 2015 Part-Time Freshmen
Enrolled Fall 2016
For-Profit/Career Schools Capitol School of Hairstyling and Esthetics 100% 100% CHI Health School of Radiologic Technology NA NA College of Hair Design NA NA College of Hair Design-East Campus Not Open NA Fullen School of Hair Design NA NA ITT Technical Institute-Omahaa 34% NA Joseph’s College Cosmetology NA NA Kaplan University-Lincoln Campusa 100% NA Kaplan University-Omaha Campusa 53% NA La'James International College NA NA Mary Lanning Memorial Hospital School of Radiologic Technology NA NA
Myotherapy Institute 100% NA National American University-Bellevue Not Open NA Omaha School of Massage and Healthcare of Herzing University Did Not Report NA
Regional West Medical Center School of Radiologic Technology NA NA
The Creative Centera NA NA Universal College of Healing Arts NA NA University of Phoenix-Omaha Campus NA Not Open Vatterott College NA Not Open Vatterott College-Spring Valley NA Not Open Xenon International Academy-Omaha 100% NA Note. NA (not applicable) indicates the school did not enroll part-time first-time freshmen the prior year. Data source: National Center for Education Statistics, IPEDS fall 2006 and fall 2016 surveys. a ITT Technical Institute-Omaha, Kaplan University-Lincoln Campus, Kaplan University-Omaha Campus, and The Creative Center can no longer report traditional freshmen retention rates. Since they are now four-year schools, they report retention rates only for bachelor-seeking students, even though all or most of their first-time freshmen register for associate-degree programs or programs of less than two years in length.

Nebraska’s Coordinating Commission for Postsecondary Education – 2018 Progress Report 259
Appendix 10
IPEDS College Graduation Rates within 150% of Normal Time
Explanatory Note A10.1 Information on Computed College Graduation Rates Based on Data
Obtained through the Integrated Postsecondary Education Data System (IPEDS)
Data collected through the Integrated Postsecondary Education Data System (IPEDS) are available from the National Center for Education Statistics to calculate the percentage of undergraduates who complete their degree programs within 150% of specified time periods. Students in four-year programs are considered to be “completers” if they graduate within six years from the time of their first enrollment. For two-year programs, the time frame for completion is three years. The graduation rate that is calculated for an institution using IPEDS data is typically based on a cohort of full-time, first-time, degree/certificate-seeking undergraduates who enrolled at the institution during the fall semester (or quarter) or the preceding summer. (A full-year cohort, rather than a fall cohort, is used by schools offering primarily occupational or vocational programs and operating on a continuous basis. In Nebraska, several for-profit/career schools operate on a continuous basis, qualifying them to use a full-year cohort. For all other institutions in Nebraska, a fall cohort is used in calculating graduation rates.) The rate is calculated by dividing the number of completers by the number of students in the adjusted cohort. The resulting percentage may be referred to as a “completion rate” or “graduation rate.” A cohort may be adjusted (reduced) only by removing (deleting) students who leave the institution for any of the following reasons: death or total and permanent disability; service in the armed forces; service with a foreign aid service of the federal government, such as the Peace Corps; or service on official church missions. Otherwise, students remain in a cohort group even if they become part-time students, transfer to other institutions, or drop out of the institution permanently or temporarily. With or without cohort adjustments, graduation rates based on IPEDS data are estimates of the percentage of full-time, first-time, degree/certificate-seeking students who complete their academic programs at the same institution where they were enrolled as freshmen. These rates historically do not estimate the percentage of all students who complete their degree programs after transferring to other institutions, who started their degree programs in the winter or spring, or who initially enrolled at the institution as part-time students. The recent addition of the IPEDS Outcome Measures Survey may yield usable data in the future for calculating the graduation rates over time for non-first-time students and part-time students.
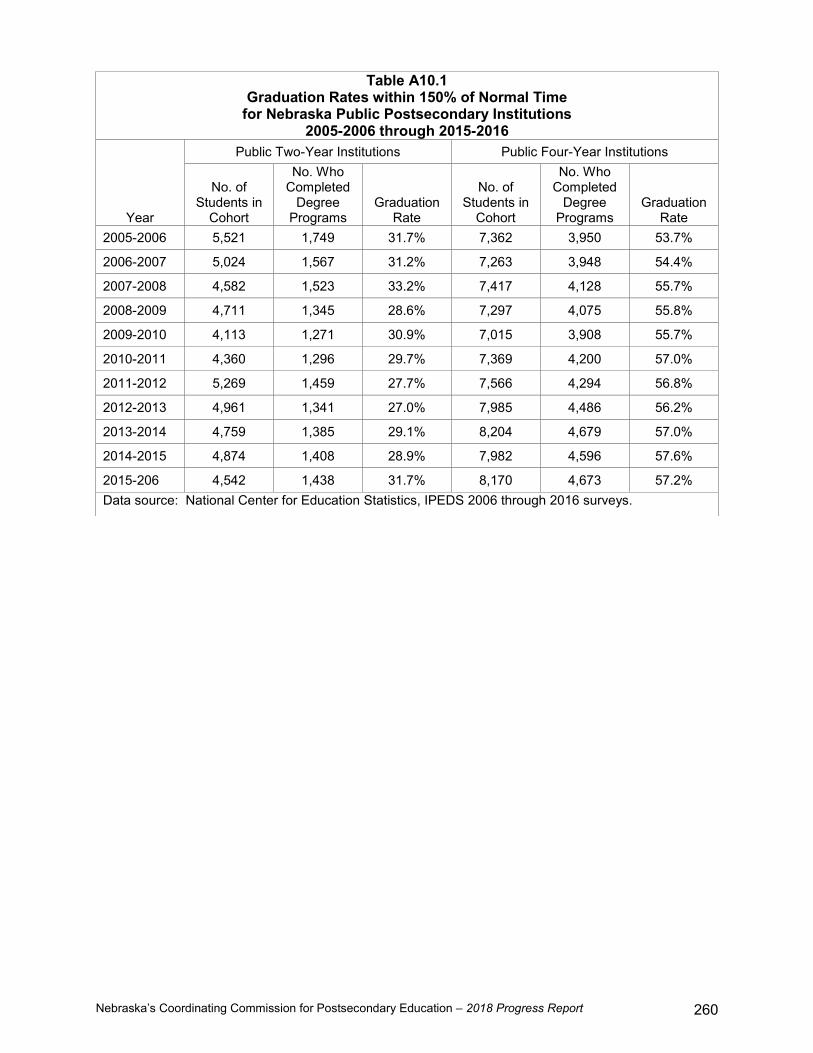
Nebraska’s Coordinating Commission for Postsecondary Education – 2018 Progress Report 260
Table A10.1 Graduation Rates within 150% of Normal Time
for Nebraska Public Postsecondary Institutions 2005-2006 through 2015-2016
Year
Public Two-Year Institutions Public Four-Year Institutions
No. of Students in
Cohort
No. Who Completed
Degree Programs
Graduation Rate
No. of Students in
Cohort
No. Who Completed
Degree Programs
Graduation Rate
2005-2006 5,521 1,749 31.7% 7,362 3,950 53.7%
2006-2007 5,024 1,567 31.2% 7,263 3,948 54.4%
2007-2008 4,582 1,523 33.2% 7,417 4,128 55.7%
2008-2009 4,711 1,345 28.6% 7,297 4,075 55.8%
2009-2010 4,113 1,271 30.9% 7,015 3,908 55.7%
2010-2011 4,360 1,296 29.7% 7,369 4,200 57.0%
2011-2012 5,269 1,459 27.7% 7,566 4,294 56.8%
2012-2013 4,961 1,341 27.0% 7,985 4,486 56.2%
2013-2014 4,759 1,385 29.1% 8,204 4,679 57.0%
2014-2015 4,874 1,408 28.9% 7,982 4,596 57.6%
2015-206 4,542 1,438 31.7% 8,170 4,673 57.2% Data source: National Center for Education Statistics, IPEDS 2006 through 2016 surveys.
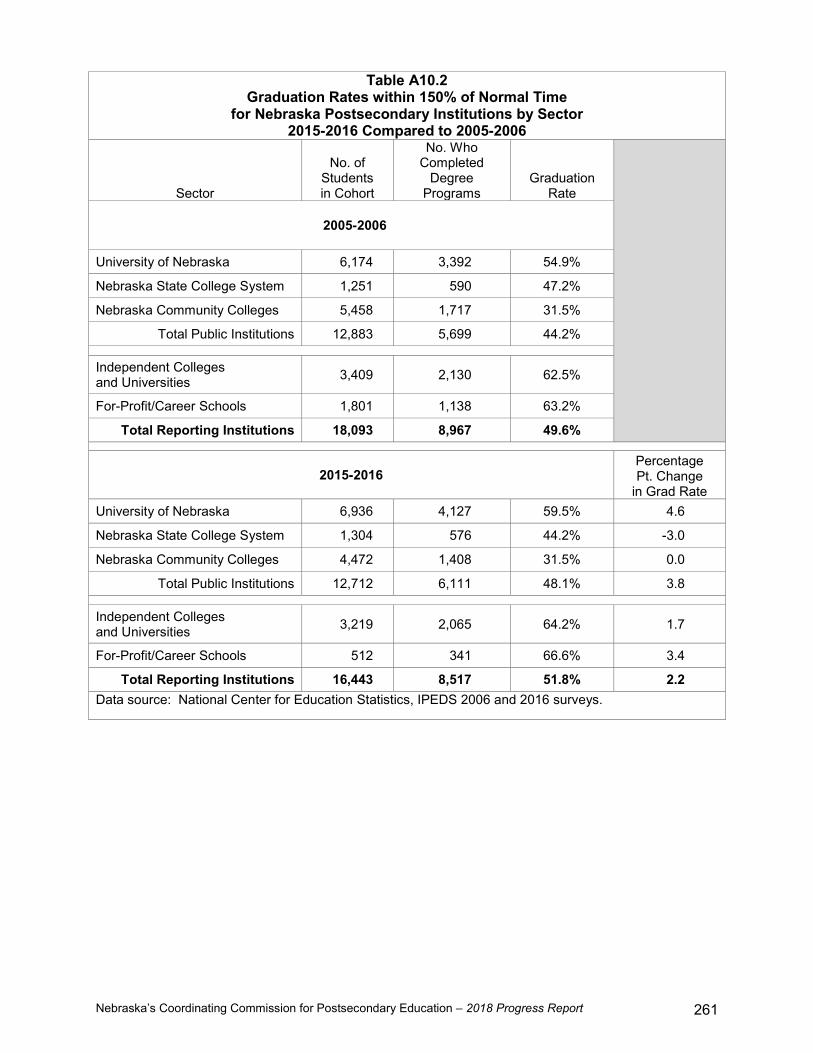
Nebraska’s Coordinating Commission for Postsecondary Education – 2018 Progress Report 261
Table A10.2 Graduation Rates within 150% of Normal Time
for Nebraska Postsecondary Institutions by Sector 2015-2016 Compared to 2005-2006
Sector
No. of Students in Cohort
No. Who Completed
Degree Programs
Graduation Rate
2005-2006
University of Nebraska 6,174 3,392 54.9%
Nebraska State College System 1,251 590 47.2%
Nebraska Community Colleges 5,458 1,717 31.5%
Total Public Institutions 12,883 5,699 44.2%
Independent Colleges and Universities 3,409 2,130 62.5%
For-Profit/Career Schools 1,801 1,138 63.2%
Total Reporting Institutions 18,093 8,967 49.6%
2015-2016 Percentage Pt. Change
in Grad Rate University of Nebraska 6,936 4,127 59.5% 4.6
Nebraska State College System 1,304 576 44.2% -3.0
Nebraska Community Colleges 4,472 1,408 31.5% 0.0
Total Public Institutions 12,712 6,111 48.1% 3.8
Independent Colleges and Universities 3,219 2,065 64.2% 1.7
For-Profit/Career Schools 512 341 66.6% 3.4
Total Reporting Institutions 16,443 8,517 51.8% 2.2 Data source: National Center for Education Statistics, IPEDS 2006 and 2016 surveys.

Nebraska’s Coordinating Commission for Postsecondary Education – 2018 Progress Report 262
Table A10.3 Graduation Rates within 150% of Normal Time
for Nebraska Postsecondary Institutions by Sector and Institution: 2015-2016 Compared to 2005-2006
Institution 2005-2006 Grad Rate
2015-2016 Grad Rate
University of Nebraska 54.9% 59.5% Nebraska College of Technical Agriculture 50.8% 42.9% University of Nebraska at Kearney 51.8% 56.9% University of Nebraska-Lincoln 62.1% 66.7% University of Nebraska Medical Center NA NA University of Nebraska at Omaha 40.1% 44.9%
Nebraska State College System 47.2% 44.2% Chadron State College 45.2% 43.2% Peru State College 36.3% 35.4% Wayne State College 52.0% 47.9%
Nebraska Community Colleges 31.5% 31.5% Central Community College 31.8% 37.7% Metropolitan Community College 10.8% 13.1% Mid-Plains Community College 41.3% 33.7% Northeast Community College 50.1% 53.0% Southeast Community College 32.1% 30.6% Western Nebraska Community College 22.8% 29.8%
Nebraska Independent Colleges and Universities 62.5% 64.2% Bellevue University 26.7% 12.5% Bryan College of Health Sciences NA 73.3% Clarkson College 71.4% 46.2% College of Saint Mary 46.1% 40.0% Concordia University-Seward 63.2% 67.4% Creighton University 73.8% 79.0% Dana College 49.5% NA Doane University-Arts & Sciences 70.3% 58.7% Doane University-Graduate and Professional Studies 61.5% NA Grace University 47.9% 66.1% Hastings College 62.5% 58.3% Little Priest Tribal College 17.6% 17.6% Midland University 61.1% 46.5% Nebraska Christian College of Hope International University 33.9% 63.0% Nebraska Indian Community College 11.4% 6.1% Nebraska Methodist College of Nursing & Allied Health 58.3% 59.0% Nebraska Wesleyan University 70.0% 70.0% Summit Christian College 18.8% 100.0% Union College 52.6% 43.1% York College 49.1% 48.9%
Total Nebraska Public and Independent Colleges and Universities 48.1% 51.3%
Continued on the next page.

Nebraska’s Coordinating Commission for Postsecondary Education – 2018 Progress Report 263
Table A10.3 Continued
Institution 2005-2006 Grad Rate
2015-2016 Grad Rate
For-Profit/Career Schools 63.2% 66.6% Capitol School of Hairstyling and Esthetics 100.0% 79.5% CHI Health School of Radiologic Technology NA NA College of Hair Design 81.9% 53.6% College of Hair Design-East Campus NA 85.1% Fullen School of Hair Design 68.3% NA ITT Technical Institute-Omaha 44.1% NA Joseph's College Cosmetology 60.5% 59.8% Kaplan University-Lincoln Campus 42.5% 22.2% Kaplan University-Omaha Campus 33.9% 36.7% La'James International College 95.7% 68.4% Mary Lanning Memorial Hospital School of Radiologic Technology NA NA Myotherapy Institute 100.0% 80.0% National American University-Bellevue NA NA Omaha School of Massage and Healthcare of Herzing University 87.3% 68.4% Paul Mitchell the School Lincoln NA 100.0% Regional West Medical Center School of Radiologic Technology NA NA The Creative Center 91.0% 74.3% Universal College of Healing Arts 0.0% 100.0% University of Phoenix-Omaha Campus NA NA Vatterott College 79.8% NA Vatterott College-Spring Valley 74.8% NA Xenon International Academy-Omaha 66.9% 77.5%
State Total 49.6% 51.8% Note. See Table A10.4 for supporting data. Data source: National Center for Education Statistics, IPEDS 2006 and 2016 surveys.

Nebraska’s Coordinating Commission for Postsecondary Education – 2018 Progress Report 264
Table A10.4 Graduation Rates within 150% of Normal Time
for Nebraska Postsecondary Institutions by Sector and Institution: 2005-2006 through 2015-2016
2005-2006 Graduation Rates
Institution
No. of Students in Cohort
No. Who Completed Degrees
2005-2006 Graduation
Rate University of Nebraska 6,174 3,392 54.9% Nebraska College of Technical Agriculture 63 32 50.8% University of Nebraska at Kearney 996 516 51.8% University of Nebraska-Lincoln 3,598 2,236 62.1% University of Nebraska Medical Center 0 0 NA University of Nebraska at Omaha 1,517 608 40.1%
Nebraska State College System 1,251 590 47.2% Chadron State College 427 193 45.2% Peru State College 201 73 36.3% Wayne State College 623 324 52.0%
Nebraska Community Colleges 5,458 1,717 31.5% Central Community College 371 118 31.8% Metropolitan Community College 825 89 10.8% Mid Plains Community College 419 173 41.3% Northeast Community College 742 372 50.1% Southeast Community College 2,763 888 32.1% Western Nebraska Community College 338 77 22.8%
Nebraska Independent Colleges and Universities 3,409 2,130 62.5% Bellevue University 60 16 26.7% Bryan College of Health Sciences 0 0 NA Clarkson College 70 50 71.4% College of Saint Mary 76 35 46.1% Concordia University-Seward 329 208 63.2% Creighton University 881 650 73.8% Dana College 182 90 49.5% Doane University-Arts & Sciences 300 211 70.3% Doane University-Graduate and Professional Studies 26 16 61.5% Grace University 119 57 47.9% Hastings College 269 168 62.5% Little Priest Tribal College 17 3 17.6% Midland University 270 165 61.1% Nebraska Christian College of Hope International University 62 21 33.9%
Nebraska Indian Community College 44 5 11.4% Nebraska Methodist College of Nursing & Allied Health 12 7 58.3% Nebraska Wesleyan University 423 296 70.0% Summit Christian College 16 3 18.8% Union College 137 72 52.6% York College 116 57 49.1%
Total Nebraska Public and Independent Colleges and Universities 16,292 7,829 48.1%
Continued on the next page.
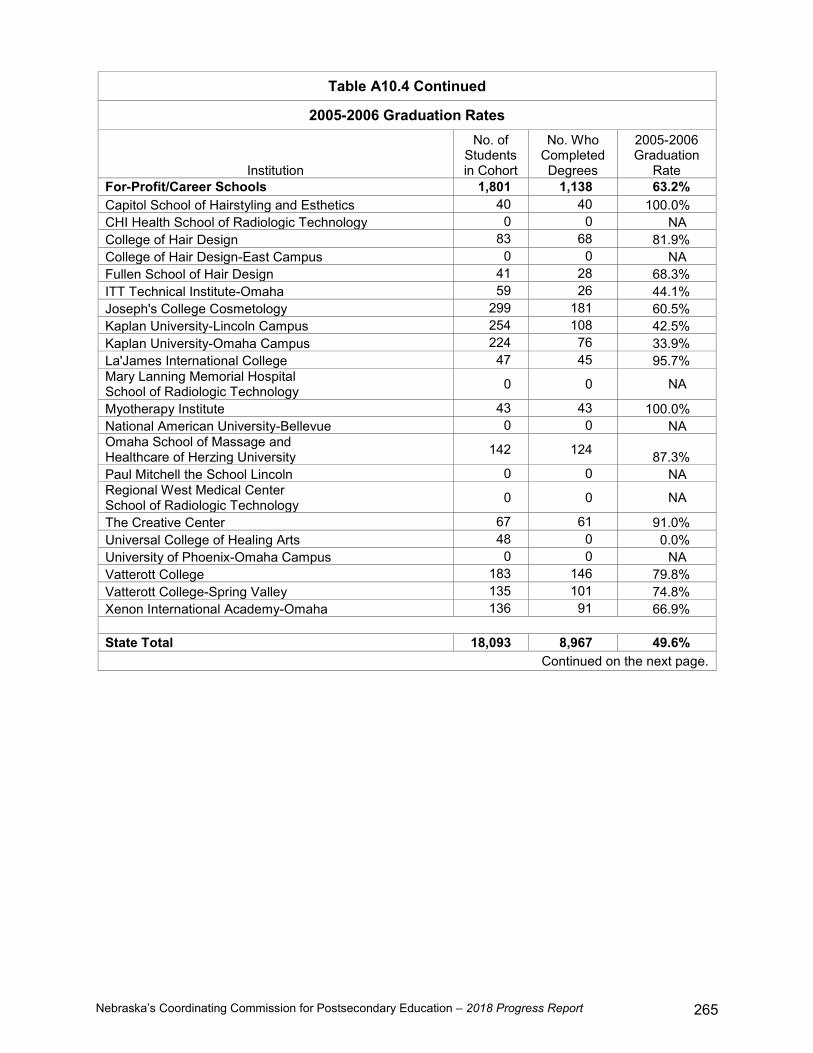
Nebraska’s Coordinating Commission for Postsecondary Education – 2018 Progress Report 265
Table A10.4 Continued
2005-2006 Graduation Rates
Institution
No. of Students in Cohort
No. Who Completed Degrees
2005-2006 Graduation
Rate For-Profit/Career Schools 1,801 1,138 63.2% Capitol School of Hairstyling and Esthetics 40 40 100.0% CHI Health School of Radiologic Technology 0 0 NA College of Hair Design 83 68 81.9% College of Hair Design-East Campus 0 0 NA Fullen School of Hair Design 41 28 68.3% ITT Technical Institute-Omaha 59 26 44.1% Joseph's College Cosmetology 299 181 60.5% Kaplan University-Lincoln Campus 254 108 42.5% Kaplan University-Omaha Campus 224 76 33.9% La'James International College 47 45 95.7% Mary Lanning Memorial Hospital School of Radiologic Technology 0 0 NA
Myotherapy Institute 43 43 100.0% National American University-Bellevue 0 0 NA Omaha School of Massage and Healthcare of Herzing University 142 124 87.3% Paul Mitchell the School Lincoln 0 0 NA Regional West Medical Center School of Radiologic Technology 0 0 NA
The Creative Center 67 61 91.0% Universal College of Healing Arts 48 0 0.0% University of Phoenix-Omaha Campus 0 0 NA Vatterott College 183 146 79.8% Vatterott College-Spring Valley 135 101 74.8% Xenon International Academy-Omaha 136 91 66.9%
State Total 18,093 8,967 49.6%
Continued on the next page.

Nebraska’s Coordinating Commission for Postsecondary Education – 2018 Progress Report 266
Table A10.4 Continued
2006-2007 Graduation Rates
Institution
No. of Students in Cohort
No. Who Completed Degrees
2006-2007 Graduation
Rate University of Nebraska 6,210 3,508 56.5% Nebraska College of Technical Agriculture 104 47 45.2% University of Nebraska at Kearney 1,038 599 57.7% University of Nebraska-Lincoln 3,480 2,206 63.4% University of Nebraska Medical Center 0 0 NA University of Nebraska at Omaha 1,588 656 41.3%
Nebraska State College System 1,157 487 42.1% Chadron State College 388 174 44.8% Peru State College 186 43 23.1% Wayne State College 583 270 46.3%
Nebraska Community Colleges 4,920 1,520 30.9% Central Community College 391 127 32.5% Metropolitan Community College 742 99 13.3% Mid Plains Community College 328 115 35.1% Northeast Community College 774 395 51.0% Southeast Community College 2,350 704 30.0% Western Nebraska Community College 335 80 23.9%
Nebraska Independent Colleges and Universities 3,200 1,916 59.9% Bellevue University 137 26 19.0% Bryan College of Health Sciences 0 0 NA Clarkson College 108 75 69.4% College of Saint Mary 80 37 46.3% Concordia University-Seward 265 153 57.7% Creighton University 760 570 75.0% Dana College 156 78 50.0% Doane University-Arts & Sciences 218 146 67.0% Doane University-Graduate and Professional Studies 0 0 NA Grace University 95 39 41.1% Hastings College 252 157 62.3% Little Priest Tribal College 26 2 7.7% Midland University 269 145 53.9% Nebraska Christian College of Hope International University 73 34 46.6%
Nebraska Indian Community College 23 2 8.7% Nebraska Methodist College of Nursing & Allied Health 18 14 77.8% Nebraska Wesleyan University 392 273 69.6% Summit Christian College 18 6 33.3% Union College 202 107 53.0% York College 108 52 48.1%
Total Nebraska Public and Independent Colleges and Universities 15,487 7,431 48.0%
Continued on the next page.

Nebraska’s Coordinating Commission for Postsecondary Education – 2018 Progress Report 267
Table A10.4 Continued
2006-2007 Graduation Rates
Institution
No. of Students in Cohort
No. Who Completed Degrees
2006-2007 Graduation
Rate For-Profit/Career Schools 1,462 897 61.4% Capitol School of Hairstyling and Esthetics 85 74 87.1% CHI Health School of Radiologic Technology 0 0 NA College of Hair Design 86 50 58.1% College of Hair Design-East Campus 0 0 NA Fullen School of Hair Design 13 13 100.0% ITT Technical Institute-Omaha 146 72 49.3% Joseph's College Cosmetology 268 146 54.5% Kaplan University-Lincoln Campus 222 96 43.2% Kaplan University-Omaha Campus 165 86 52.1% La'James International College 93 76 81.7% Mary Lanning Memorial Hospital School of Radiologic Technology 0 0 NA
Myotherapy Institute 41 41 100.0% National American University-Bellevue 0 0 NA Omaha School of Massage and Healthcare of Herzing University 66 58 87.9% Paul Mitchell the School Lincoln 0 0 NA Regional West Medical Center School of Radiologic Technology 0 0 NA
The Creative Center 74 56 75.7% Universal College of Healing Arts 40 32 80.0% University of Phoenix-Omaha Campus 0 0 NA Vatterott College 0 0 NA Vatterott College-Spring Valley 97 44 45.4% Xenon International Academy-Omaha 66 53 80.3%
State Total 16,949 8,328 49.1%
Continued on the next page.
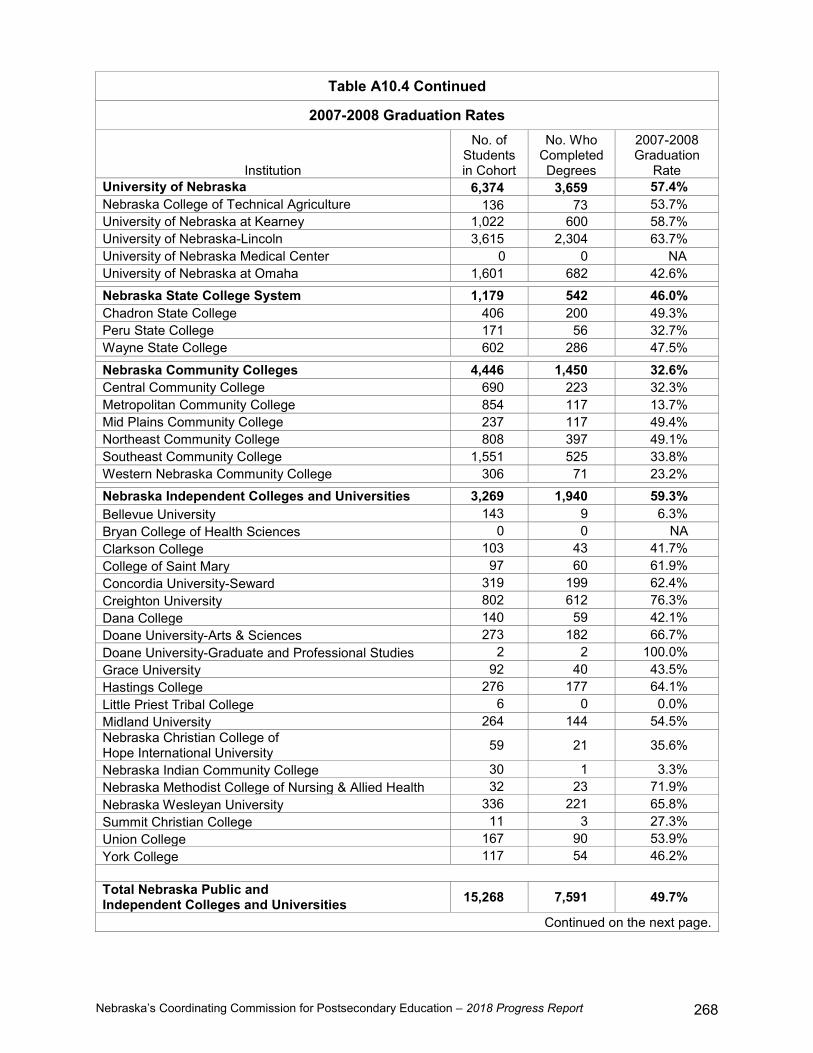
Nebraska’s Coordinating Commission for Postsecondary Education – 2018 Progress Report 268
Table A10.4 Continued
2007-2008 Graduation Rates
Institution
No. of Students in Cohort
No. Who Completed Degrees
2007-2008 Graduation
Rate University of Nebraska 6,374 3,659 57.4% Nebraska College of Technical Agriculture 136 73 53.7% University of Nebraska at Kearney 1,022 600 58.7% University of Nebraska-Lincoln 3,615 2,304 63.7% University of Nebraska Medical Center 0 0 NA University of Nebraska at Omaha 1,601 682 42.6%
Nebraska State College System 1,179 542 46.0% Chadron State College 406 200 49.3% Peru State College 171 56 32.7% Wayne State College 602 286 47.5%
Nebraska Community Colleges 4,446 1,450 32.6% Central Community College 690 223 32.3% Metropolitan Community College 854 117 13.7% Mid Plains Community College 237 117 49.4% Northeast Community College 808 397 49.1% Southeast Community College 1,551 525 33.8% Western Nebraska Community College 306 71 23.2%
Nebraska Independent Colleges and Universities 3,269 1,940 59.3% Bellevue University 143 9 6.3% Bryan College of Health Sciences 0 0 NA Clarkson College 103 43 41.7% College of Saint Mary 97 60 61.9% Concordia University-Seward 319 199 62.4% Creighton University 802 612 76.3% Dana College 140 59 42.1% Doane University-Arts & Sciences 273 182 66.7% Doane University-Graduate and Professional Studies 2 2 100.0% Grace University 92 40 43.5% Hastings College 276 177 64.1% Little Priest Tribal College 6 0 0.0% Midland University 264 144 54.5% Nebraska Christian College of Hope International University 59 21 35.6%
Nebraska Indian Community College 30 1 3.3% Nebraska Methodist College of Nursing & Allied Health 32 23 71.9% Nebraska Wesleyan University 336 221 65.8% Summit Christian College 11 3 27.3% Union College 167 90 53.9% York College 117 54 46.2%
Total Nebraska Public and Independent Colleges and Universities 15,268 7,591 49.7%
Continued on the next page.

Nebraska’s Coordinating Commission for Postsecondary Education – 2018 Progress Report 269
Table A10.4 Continued
2007-2008 Graduation Rates
Institution
No. of Students in Cohort
No. Who Completed Degrees
2007-2008 Graduation
Rate For-Profit/Career Schools 1,758 957 54.4% Capitol School of Hairstyling and Esthetics 113 88 77.9% CHI Health School of Radiologic Technology 0 0 NA College of Hair Design 79 53 67.1% College of Hair Design-East Campus 0 0 NA Fullen School of Hair Design 28 28 100.0% ITT Technical Institute-Omaha 54 27 50.0% Joseph's College Cosmetology 253 145 57.3% Kaplan University-Lincoln Campus 197 66 33.5% Kaplan University-Omaha Campus 381 73 19.2% La'James International College 89 69 77.5% Mary Lanning Memorial Hospital School of Radiologic Technology 0 0 NA
Myotherapy Institute 41 35 85.4% National American University-Bellevue 0 0 NA Omaha School of Massage and Healthcare of Herzing University 104 94 90.4%
Paul Mitchell the School Lincoln 0 0 NA Regional West Medical Center School of Radiologic Technology 0 0 NA
The Creative Center 57 45 78.9% Universal College of Healing Arts 30 27 90.0% University of Phoenix-Omaha Campus 0 0 NA Vatterott College 0 0 NA Vatterott College-Spring Valley 201 102 50.7% Xenon International Academy-Omaha 131 105 80.2%
State Total 17,026 8,548 50.2%
Continued on the next page.

Nebraska’s Coordinating Commission for Postsecondary Education – 2018 Progress Report 270
Table A10.4 Continued
2008-2009 Graduation Rates
Institution
No. of Students in Cohort
No. Who Completed Degrees
2008-2009 Graduation
Rate University of Nebraska 6,233 3,607 57.9% Nebraska College of Technical Agriculture 117 55 47.0% University of Nebraska at Kearney 1,012 599 59.2% University of Nebraska-Lincoln 3,639 2,298 63.1% University of Nebraska Medical Center 0 0 NA University of Nebraska at Omaha 1,465 655 44.7%
Nebraska State College System 1,181 523 44.3% Chadron State College 395 151 38.2% Peru State College 188 72 38.3% Wayne State College 598 300 50.2%
Nebraska Community Colleges 4,594 1,290 28.1% Central Community College 743 218 29.3% Metropolitan Community College 908 113 12.4% Mid Plains Community College 243 105 43.2% Northeast Community College 742 339 45.7% Southeast Community College 1,596 431 27.0% Western Nebraska Community College 362 84 23.2%
Nebraska Independent Colleges and Universities 3,488 2,146 61.5% Bellevue University 223 90 40.4% Bryan College of Health Sciences 56 44 78.6% Clarkson College 21 13 61.9% College of Saint Mary 78 35 44.9% Concordia University-Seward 222 135 60.8% Creighton University 933 697 74.7% Dana College 164 81 49.4% Doane University-Arts & Sciences 288 184 63.9% Doane University-Graduate and Professional Studies 0 0 NA Grace University 103 56 54.4% Hastings College 338 209 61.8% Little Priest Tribal College 16 2 12.5% Midland University 235 113 48.1% Nebraska Christian College of Hope International University 43 21 48.8%
Nebraska Indian Community College 13 0 0.0% Nebraska Methodist College of Nursing & Allied Health 42 35 83.3% Nebraska Wesleyan University 417 276 66.2% Summit Christian College 22 17 77.3% Union College 162 88 54.3% York College 112 50 44.6%
Total Nebraska Public and Independent Colleges and Universities 15,496 7,566 48.8%
Continued on the next page.

Nebraska’s Coordinating Commission for Postsecondary Education – 2018 Progress Report 271
Table A10.4 Continued
2008-2009 Graduation Rates
Institution
No. of Students in Cohort
No. Who Completed Degrees
2008-2009 Graduation
Rate For-Profit/Career Schools 2,503 1,295 51.7% Capitol School of Hairstyling and Esthetics 60 60 100.0% CHI Health School of Radiologic Technology 0 0 NA College of Hair Design 78 66 84.6% College of Hair Design-East Campus 0 0 NA Fullen School of Hair Design 42 35 83.3% ITT Technical Institute-Omaha 97 39 40.2% Joseph's College Cosmetology 464 252 54.3% Kaplan University-Lincoln Campus 595 202 33.9% Kaplan University-Omaha Campus 701 302 43.1% La'James International College 73 50 68.5% Mary Lanning Memorial Hospital School of Radiologic Technology 0 0 NA
Myotherapy Institute 32 32 100.0% National American University-Bellevue 0 0 NA Omaha School of Massage and Healthcare of Herzing University 42 39 92.9%
Paul Mitchell the School Lincoln 0 0 NA Regional West Medical Center School of Radiologic Technology 0 0 NA
The Creative Center 56 31 55.4% Universal College of Healing Arts 48 42 87.5% University of Phoenix-Omaha Campus 0 0 NA Vatterott College 0 0 NA Vatterott College-Spring Valley 91 48 52.7% Xenon International Academy-Omaha 124 97 78.2%
State Total 17,999 8,861 49.2%
Continued on the next page.
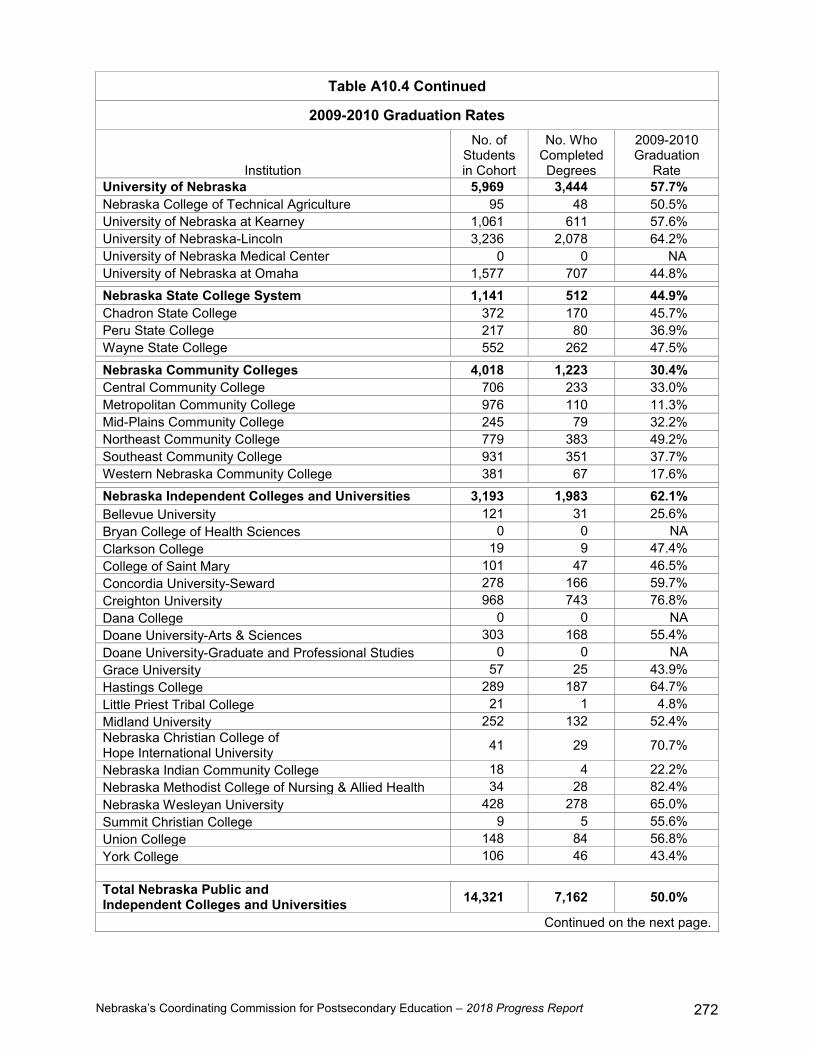
Nebraska’s Coordinating Commission for Postsecondary Education – 2018 Progress Report 272
Table A10.4 Continued
2009-2010 Graduation Rates
Institution
No. of Students in Cohort
No. Who Completed Degrees
2009-2010 Graduation
Rate University of Nebraska 5,969 3,444 57.7% Nebraska College of Technical Agriculture 95 48 50.5% University of Nebraska at Kearney 1,061 611 57.6% University of Nebraska-Lincoln 3,236 2,078 64.2% University of Nebraska Medical Center 0 0 NA University of Nebraska at Omaha 1,577 707 44.8%
Nebraska State College System 1,141 512 44.9% Chadron State College 372 170 45.7% Peru State College 217 80 36.9% Wayne State College 552 262 47.5%
Nebraska Community Colleges 4,018 1,223 30.4% Central Community College 706 233 33.0% Metropolitan Community College 976 110 11.3% Mid-Plains Community College 245 79 32.2% Northeast Community College 779 383 49.2% Southeast Community College 931 351 37.7% Western Nebraska Community College 381 67 17.6%
Nebraska Independent Colleges and Universities 3,193 1,983 62.1% Bellevue University 121 31 25.6% Bryan College of Health Sciences 0 0 NA Clarkson College 19 9 47.4% College of Saint Mary 101 47 46.5% Concordia University-Seward 278 166 59.7% Creighton University 968 743 76.8% Dana College 0 0 NA Doane University-Arts & Sciences 303 168 55.4% Doane University-Graduate and Professional Studies 0 0 NA Grace University 57 25 43.9% Hastings College 289 187 64.7% Little Priest Tribal College 21 1 4.8% Midland University 252 132 52.4% Nebraska Christian College of Hope International University 41 29 70.7%
Nebraska Indian Community College 18 4 22.2% Nebraska Methodist College of Nursing & Allied Health 34 28 82.4% Nebraska Wesleyan University 428 278 65.0% Summit Christian College 9 5 55.6% Union College 148 84 56.8% York College 106 46 43.4%
Total Nebraska Public and Independent Colleges and Universities 14,321 7,162 50.0%
Continued on the next page.
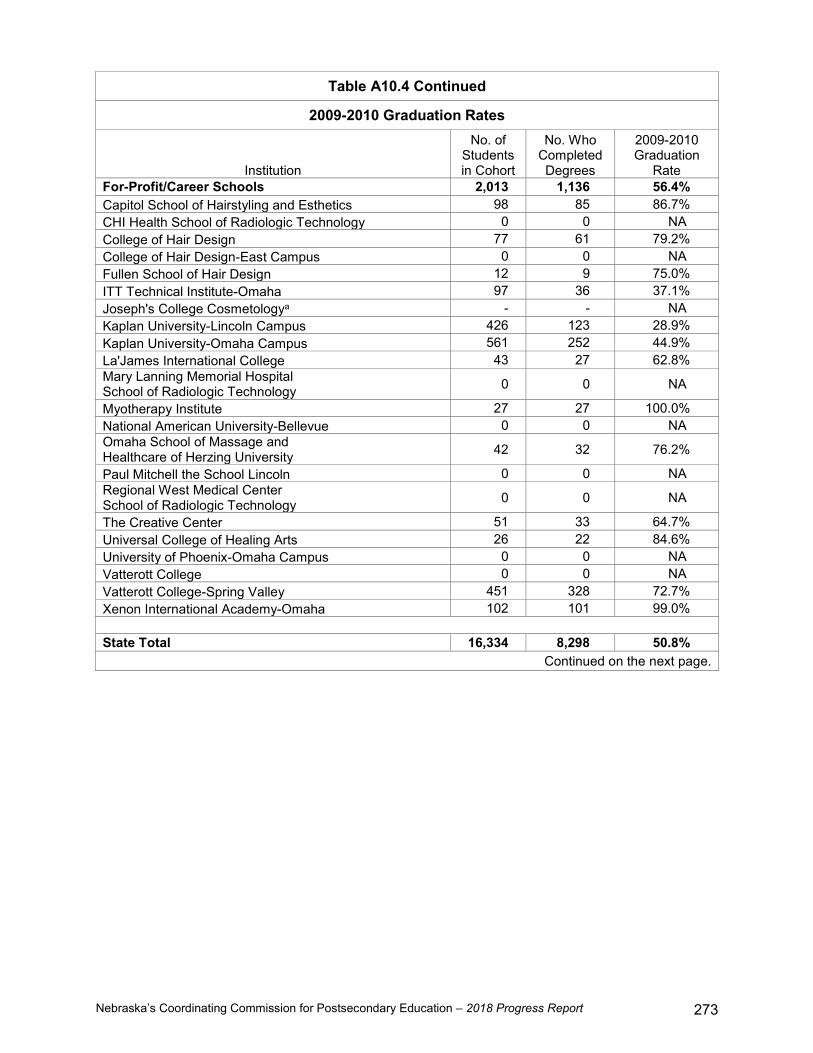
Nebraska’s Coordinating Commission for Postsecondary Education – 2018 Progress Report 273
Table A10.4 Continued
2009-2010 Graduation Rates
Institution
No. of Students in Cohort
No. Who Completed Degrees
2009-2010 Graduation
Rate For-Profit/Career Schools 2,013 1,136 56.4% Capitol School of Hairstyling and Esthetics 98 85 86.7% CHI Health School of Radiologic Technology 0 0 NA College of Hair Design 77 61 79.2% College of Hair Design-East Campus 0 0 NA Fullen School of Hair Design 12 9 75.0% ITT Technical Institute-Omaha 97 36 37.1% Joseph's College Cosmetologya - - NA Kaplan University-Lincoln Campus 426 123 28.9% Kaplan University-Omaha Campus 561 252 44.9% La'James International College 43 27 62.8% Mary Lanning Memorial Hospital School of Radiologic Technology 0 0 NA
Myotherapy Institute 27 27 100.0% National American University-Bellevue 0 0 NA Omaha School of Massage and Healthcare of Herzing University 42 32 76.2%
Paul Mitchell the School Lincoln 0 0 NA Regional West Medical Center School of Radiologic Technology 0 0 NA
The Creative Center 51 33 64.7% Universal College of Healing Arts 26 22 84.6% University of Phoenix-Omaha Campus 0 0 NA Vatterott College 0 0 NA Vatterott College-Spring Valley 451 328 72.7% Xenon International Academy-Omaha 102 101 99.0%
State Total 16,334 8,298 50.8%
Continued on the next page.

Nebraska’s Coordinating Commission for Postsecondary Education – 2018 Progress Report 274
Table A10.4 Continued
2010-2011 Graduation Rates
Institution
No. of Students in Cohort
No. Who Completed Degrees
2010-2011 Graduation
Rate University of Nebraska 6,327 3,751 59.3% Nebraska College of Technical Agriculture 91 57 62.6% University of Nebraska at Kearney 1,013 614 60.6% University of Nebraska-Lincoln 3,533 2,356 66.7% University of Nebraska Medical Center 0 0 NA University of Nebraska at Omaha 1,690 724 42.8%
Nebraska State College System 1,133 506 44.7% Chadron State College 333 152 45.6% Peru State College 213 55 25.8% Wayne State College 587 299 50.9%
Nebraska Community Colleges 4,269 1,239 29.0% Central Community College 755 252 33.4% Metropolitan Community College 876 115 13.1% Mid-Plains Community College 254 90 35.4% Northeast Community College 725 331 45.7% Southeast Community College 1,298 352 27.1% Western Nebraska Community College 361 99 27.4%
Nebraska Independent Colleges and Universities 3,092 1,884 60.9% Bellevue University 54 20 37.0% Bryan College of Health Sciences 0 0 NA Clarkson College 17 10 58.8% College of Saint Mary 79 32 40.5% Concordia University-Seward 289 152 52.6% Creighton University 970 750 77.3% Dana College 0 0 NA Doane University-Arts & Sciences 256 162 63.3% Doane University-Graduate and Professional Studies 0 0 NA Grace University 56 18 32.1% Hastings College 312 175 56.1% Little Priest Tribal College 21 0 0.0% Midland University 249 110 44.2% Nebraska Christian College of Hope International University 41 22 53.7%
Nebraska Indian Community College 17 2 11.8% Nebraska Methodist College of Nursing & Allied Health 37 29 78.4% Nebraska Wesleyan University 406 258 63.5% Summit Christian College 10 7 70.0% Union College 161 87 54.0% York College 117 50 42.7%
Total Nebraska Public and Independent Colleges and Universities 14,821 7,380 49.8%
Continued on the next page.
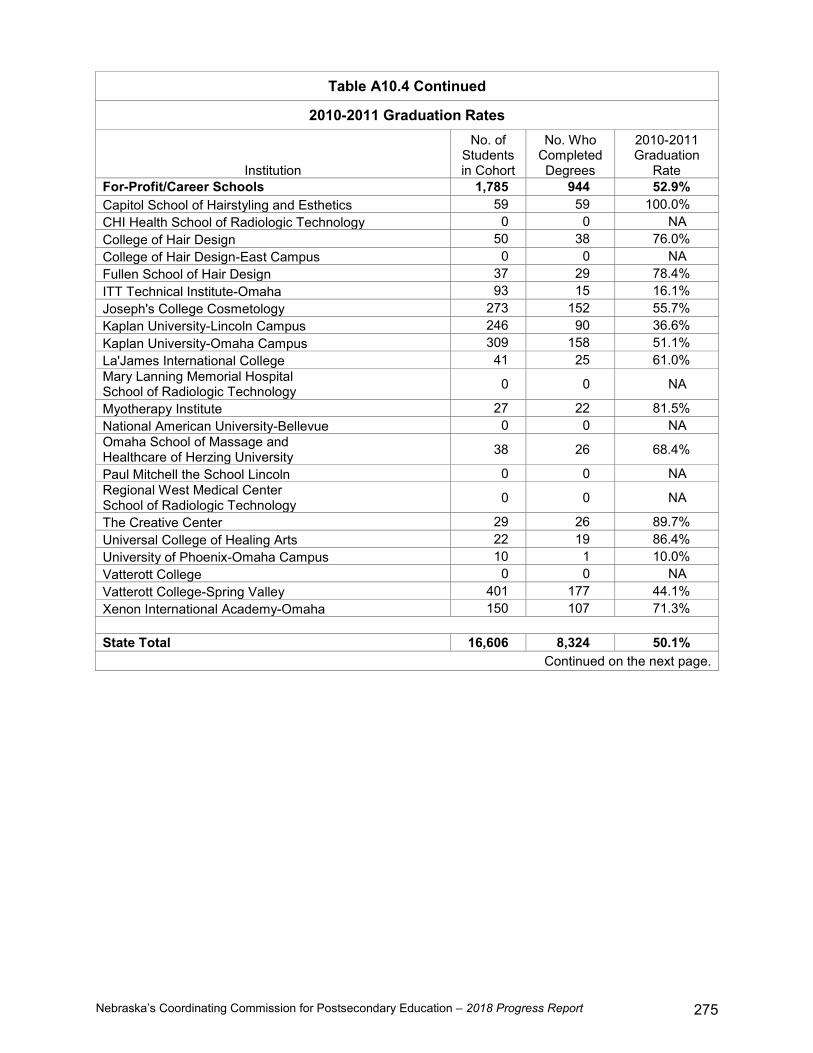
Nebraska’s Coordinating Commission for Postsecondary Education – 2018 Progress Report 275
Table A10.4 Continued
2010-2011 Graduation Rates
Institution
No. of Students in Cohort
No. Who Completed Degrees
2010-2011 Graduation
Rate For-Profit/Career Schools 1,785 944 52.9% Capitol School of Hairstyling and Esthetics 59 59 100.0% CHI Health School of Radiologic Technology 0 0 NA College of Hair Design 50 38 76.0% College of Hair Design-East Campus 0 0 NA Fullen School of Hair Design 37 29 78.4% ITT Technical Institute-Omaha 93 15 16.1% Joseph's College Cosmetology 273 152 55.7% Kaplan University-Lincoln Campus 246 90 36.6% Kaplan University-Omaha Campus 309 158 51.1% La'James International College 41 25 61.0% Mary Lanning Memorial Hospital School of Radiologic Technology 0 0 NA
Myotherapy Institute 27 22 81.5% National American University-Bellevue 0 0 NA Omaha School of Massage and Healthcare of Herzing University 38 26 68.4%
Paul Mitchell the School Lincoln 0 0 NA Regional West Medical Center School of Radiologic Technology 0 0 NA
The Creative Center 29 26 89.7% Universal College of Healing Arts 22 19 86.4% University of Phoenix-Omaha Campus 10 1 10.0% Vatterott College 0 0 NA Vatterott College-Spring Valley 401 177 44.1% Xenon International Academy-Omaha 150 107 71.3%
State Total 16,606 8,324 50.1%
Continued on the next page.

Nebraska’s Coordinating Commission for Postsecondary Education – 2018 Progress Report 276
Table A10.4 Continued
2011-2012 Graduation Rates
Institution
No. of Students in Cohort
No. Who Completed Degrees
2011-2012 Graduation
Rate University of Nebraska 6,518 3,808 58.4% Nebraska College of Technical Agriculture 116 56 48.3% University of Nebraska at Kearney 937 524 55.9% University of Nebraska-Lincoln 3,828 2,474 64.6% University of Nebraska Medical Center 0 0 NA University of Nebraska at Omaha 1,637 754 46.1%
Nebraska State College System 1,164 542 46.6% Chadron State College 354 148 41.8% Peru State College 204 71 34.8% Wayne State College 606 323 53.3%
Nebraska Community Colleges 5,153 1,403 27.2% Central Community College 888 283 31.9% Metropolitan Community College 1,021 124 12.1% Mid-Plains Community College 356 129 36.2% Northeast Community College 872 412 47.2% Southeast Community College 1,640 369 22.5% Western Nebraska Community College 376 86 22.9%
Nebraska Independent Colleges and Universities 3,131 1,869 59.7% Bellevue University 103 32 31.1% Bryan College of Health Sciences 0 0 NA Clarkson College 22 11 50.0% College of Saint Mary 92 33 35.9% Concordia University-Seward 302 189 62.6% Creighton University 965 719 74.5% Dana College 0 0 NA Doane University-Arts & Sciences 247 158 64.0% Doane University-Graduate and Professional Studies 0 0 NA Grace University 63 27 42.9% Hastings College 262 145 55.3% Little Priest Tribal College 15 0 0.0% Midland University 270 126 46.7% Nebraska Christian College of Hope International University 51 20 39.2%
Nebraska Indian Community College 28 5 17.9% Nebraska Methodist College of Nursing & Allied Health 22 14 63.6% Nebraska Wesleyan University 413 270 65.4% Summit Christian College 4 1 25.0% Union College 185 92 49.7% York College 87 27 31.0%
Total Nebraska Public and Independent Colleges and Universities 15,966 7,622 47.7%
Continued on the next page.

Nebraska’s Coordinating Commission for Postsecondary Education – 2018 Progress Report 277
Table A10.4 Continued
2011-2012 Graduation Rates
Institution
No. of Students in Cohort
No. Who Completed Degrees
2011-2012 Graduation
Rate For-Profit/Career Schools 1,662 877 52.8% Capitol School of Hairstyling and Esthetics 88 71 80.7% CHI Health School of Radiologic Technology 0 0 NA College of Hair Design 97 65 67.0% College of Hair Design-East Campus 59 48 81.4% Fullen School of Hair Design 33 26 78.8% ITT Technical Institute-Omaha 68 23 33.8% Joseph's College Cosmetology 150 87 58.0% Kaplan University-Lincoln Campus 220 77 35.0% Kaplan University-Omaha Campus 245 101 41.2% La'James International College 45 30 66.7% Mary Lanning Memorial Hospital School of Radiologic Technology 0 0 NA
Myotherapy Institute 23 20 87.0% National American University-Bellevue 0 0 NA Omaha School of Massage and Healthcare of Herzing University 37 20 54.1%
Paul Mitchell the School Lincoln 0 0 NA Regional West Medical Center School of Radiologic Technology 0 0 NA
The Creative Center 31 24 77.4% Universal College of Healing Arts 13 13 100.0% University of Phoenix-Omaha Campus 24 1 4.2% Vatterott College 0 0 NA Vatterott College-Spring Valley 401 186 46.4% Xenon International Academy-Omaha 128 85 66.4%
State Total 17,628 8,499 48.2%
Continued on the next page.

Nebraska’s Coordinating Commission for Postsecondary Education – 2018 Progress Report 278
Table A10.4 Continued
2012-2013 Graduation Rates
Institution
No. of Students in Cohort
No. Who Completed Degrees
2012-2013 Graduation
Rate University of Nebraska 6,853 4,040 59.0% Nebraska College of Technical Agriculture 128 67 52.3% University of Nebraska at Kearney 915 487 53.2% University of Nebraska-Lincoln 4,214 2,814 66.8% University of Nebraska Medical Center 0 0 NA University of Nebraska at Omaha 1,596 672 42.1%
Nebraska State College System 1,260 513 40.7% Chadron State College 409 136 33.3% Peru State College 197 79 40.1% Wayne State College 654 298 45.6%
Nebraska Community Colleges 4,833 1,274 26.4% Central Community College 852 212 24.9% Metropolitan Community College 1,148 143 12.5% Mid-Plains Community College 401 137 34.2% Northeast Community College 862 372 43.2% Southeast Community College 1,168 317 27.1% Western Nebraska Community College 402 93 23.1%
Nebraska Independent Colleges and Universities 3,152 1,914 60.7% Bellevue University 104 41 39.4% Bryan College of Health Sciences 9 5 55.6% Clarkson College 31 15 48.4% College of Saint Mary 93 39 41.9% Concordia University-Seward 264 168 63.6% Creighton University 947 719 75.9% Dana College 0 0 NA Doane University-Arts & Sciences 259 157 60.6% Doane University-Graduate and Professional Studies 2 0 0.0% Grace University 82 43 52.4% Hastings College 302 174 57.6% Little Priest Tribal College 24 1 4.2% Midland University 215 106 49.3% Nebraska Christian College of Hope International University 45 11 24.4%
Nebraska Indian Community College 23 3 13.0% Nebraska Methodist College of Nursing & Allied Health 50 34 68.0% Nebraska Wesleyan University 438 300 68.5% Summit Christian College 11 2 18.2% Union College 164 61 37.2% York College 89 35 39.3%
Total Nebraska Public and Independent Colleges and Universities 16,098 7,741 48.1%
Continued on the next page.

Nebraska’s Coordinating Commission for Postsecondary Education – 2018 Progress Report 279
Table A10.4 Continued
2012-2013 Graduation Rates
Institution
No. of Students in Cohort
No. Who Completed Degrees
2012-2013 Graduation
Rate For-Profit/Career Schools 1,329 714 53.7% Capitol School of Hairstyling and Esthetics 74 70 94.6% CHI Health School of Radiologic Technology 0 0 NA College of Hair Design 96 57 59.4% College of Hair Design-East Campus 75 56 74.7% Fullen School of Hair Design 21 17 81.0% ITT Technical Institute-Omaha 61 26 42.6% Joseph's College Cosmetology 105 71 67.6% Kaplan University-Lincoln Campus 166 66 39.8% Kaplan University-Omaha Campus 255 94 36.9% La'James International College 39 20 51.3% Mary Lanning Memorial Hospital School of Radiologic Technology 0 0 NA
Myotherapy Institute 38 33 86.8% National American University-Bellevue 0 0 NA Omaha School of Massage and Healthcare of Herzing University 22 14 63.6%
Paul Mitchell the School Lincoln 0 0 NA Regional West Medical Center School of Radiologic Technology 0 0 NA
The Creative Center 41 33 80.5% Universal College of Healing Arts 23 22 95.7% University of Phoenix-Omaha Campus 6 0 0.0% Vatterott College 0 0 NA Vatterott College-Spring Valley 244 93 38.1% Xenon International Academy-Omaha 63 42 66.7%
State Total 17,427 8,455 48.5%
Continued on the next page.

Nebraska’s Coordinating Commission for Postsecondary Education – 2018 Progress Report 280
Table A10.4 Continued
2013-2014 Graduation Rates
Institution
No. of Students in Cohort
No. Who Completed Degrees
2013-2014 Graduation
Rate University of Nebraska 7,023 4,176 59.5% Nebraska College of Technical Agriculture 85 37 43.5% University of Nebraska at Kearney 1,019 575 56.4% University of Nebraska-Lincoln 4,164 2,781 66.8% University of Nebraska Medical Center 0 0 NA University of Nebraska at Omaha 1,755 783 44.6%
Nebraska State College System 1,266 540 42.7% Chadron State College 403 146 36.2% Peru State College 210 77 36.7% Wayne State College 653 317 48.5%
Nebraska Community Colleges 4,674 1,348 28.8% Central Community College 811 267 32.9% Metropolitan Community College 887 121 13.6% Mid-Plains Community College 439 145 33.0% Northeast Community College 790 364 46.1% Southeast Community College 1,368 347 25.4% Western Nebraska Community College 379 104 27.4%
Nebraska Independent Colleges and Universities 3,015 1,913 63.4% Bellevue University 34 10 29.4% Bryan College of Health Sciences 25 20 80.0% Clarkson College 22 13 59.1% College of Saint Mary 76 37 48.7% Concordia University-Seward 273 181 66.3% Creighton University 984 766 77.8% Dana College 0 0 NA Doane University-Arts & Sciences 247 146 59.1% Doane University-Graduate and Professional Studies 0 0 NA Grace University 62 34 54.8% Hastings College 320 188 58.8% Little Priest Tribal College 27 4 14.8% Midland University 157 75 47.8% Nebraska Christian College of Hope International University 38 10 26.3%
Nebraska Indian Community College 30 1 3.3% Nebraska Methodist College of Nursing & Allied Health 56 37 66.1% Nebraska Wesleyan University 383 266 69.5% Summit Christian College 9 5 55.6% Union College 160 79 49.4% York College 112 41 36.6%
Total Nebraska Public and Independent Colleges and Universities 15,978 7,977 49.9%
Continued on the next page.

Nebraska’s Coordinating Commission for Postsecondary Education – 2018 Progress Report 281
Table A10.4 Continued
2013-2014 Graduation Rates
Institution
No. of Students in Cohort
No. Who Completed Degrees
2013-2014 Graduation
Rate For-Profit/Career Schools 1,219 625 51.3% Capitol School of Hairstyling and Esthetics 79 79 100.0% CHI Health School of Radiologic Technology 0 0 NA College of Hair Design 51 31 60.8% College of Hair Design-East Campus 78 64 82.1% Fullen School of Hair Design 32 25 78.1% ITT Technical Institute-Omaha 76 26 34.2% Joseph's College Cosmetology 111 67 60.4% Kaplan University-Lincoln Campus 170 49 28.8% Kaplan University-Omaha Campus 259 88 34.0% La'James International College 31 20 64.5% Mary Lanning Memorial Hospital School of Radiologic Technology 0 0 NA
Myotherapy Institute 22 19 86.4% National American University-Bellevue 0 0 NA Omaha School of Massage and Healthcare of Herzing University 22 12 54.5%
Paul Mitchell the School Lincoln 0 0 NA Regional West Medical Center School of Radiologic Technology 0 0 NA
The Creative Center 47 32 68.1% Universal College of Healing Arts 8 8 100.0% University of Phoenix-Omaha Campus 0 0 NA Vatterott College 0 0 NA Vatterott College-Spring Valley 134 39 29.1% Xenon International Academy-Omaha 99 66 66.7%
State Total 17,197 8,602 50.0%
Continued on the next page.

Nebraska’s Coordinating Commission for Postsecondary Education – 2018 Progress Report 282
Table A10.4 Continued
2014-2015 Graduation Rates
Institution
No. of Students in Cohort
No. Who Completed Degrees
2014-2015 Graduation
Rate University of Nebraska 6,782 4,066 60.0% Nebraska College of Technical Agriculture 96 51 53.1% University of Nebraska at Kearney 974 544 55.9% University of Nebraska-Lincoln 3,965 2,658 67.0% University of Nebraska Medical Center 0 0 NA University of Nebraska at Omaha 1,747 813 46.5%
Nebraska State College System 1,296 581 44.8% Chadron State College 406 172 42.4% Peru State College 227 83 36.6% Wayne State College 663 326 49.2%
Nebraska Community Colleges 4,778 1,357 28.4% Central Community College 740 234 31.6% Metropolitan Community College 1,236 166 13.4% Mid-Plains Community College 424 147 34.7% Northeast Community College 800 387 48.4% Southeast Community College 1,203 330 27.4% Western Nebraska Community College 375 93 24.8%
Nebraska Independent Colleges and Universities 3,005 1,926 64.1% Bellevue University 11 2 18.2% Bryan College of Health Sciences 28 22 78.6% Clarkson College 14 10 71.4% College of Saint Mary 105 50 47.6% Concordia University-Seward 288 169 58.7% Creighton University 1,052 828 78.7% Dana College 0 0 NA Doane University-Arts & Sciences 309 190 61.5% Doane University-Graduate and Professional Studies 1 0 0.0% Grace University 69 32 46.4% Hastings College 290 169 58.3% Little Priest Tribal College 6 1 16.7% Midland University 115 50 43.5% Nebraska Christian College of Hope International University 19 5 26.3%
Nebraska Indian Community College 22 2 9.1% Nebraska Methodist College of Nursing & Allied Health 49 36 73.5% Nebraska Wesleyan University 393 245 62.3% Summit Christian College 4 1 25.0% Union College 114 65 57.0% York College 116 49 42.2%
Total Nebraska Public and Independent Colleges and Universities 15,861 7,930 50.0%
Continued on the next page.

Nebraska’s Coordinating Commission for Postsecondary Education – 2018 Progress Report 283
Table A10.4 Continued
2014-2015 Graduation Rates
Institution
No. of Students in Cohort
No. Who Completed Degrees
2014-2015 Graduation
Rate For-Profit/Career Schools 1,111 517 46.5% Capitol School of Hairstyling and Esthetics 77 70 90.9% CHI Health School of Radiologic Technology 0 0 NA College of Hair Design 44 32 72.7% College of Hair Design-East Campus 41 34 82.9% Fullen School of Hair Design 12 12 100.0% ITT Technical Institute-Omaha 117 34 29.1% Joseph's College Cosmetology 43 23 53.5% Kaplan University-Lincoln Campus 138 35 25.4% Kaplan University-Omaha Campus 201 60 29.9% La'James International College 18 10 55.6% Mary Lanning Memorial Hospital School of Radiologic Technology 0 0 NA
Myotherapy Institute 18 16 88.9% National American University-Bellevue 0 0 NA Omaha School of Massage and Healthcare of Herzing University 29 22 75.9%
Paul Mitchell the School Lincoln 0 0 NA Regional West Medical Center School of Radiologic Technology 0 0 NA
The Creative Center 48 28 58.3% Universal College of Healing Arts 8 8 100.0% University of Phoenix-Omaha Campus 0 0 NA Vatterott College 0 0 NA Vatterott College-Spring Valley 220 69 31.4% Xenon International Academy-Omaha 97 64 66.0%
State Total 16,972 8,447 49.8%
Continued on the next page.

Nebraska’s Coordinating Commission for Postsecondary Education – 2018 Progress Report 284
Table A10.4 Continued
2015-2016 Graduation Rates
Institution
No. of Students in Cohort
No. Who Completed Degrees
2015-2016 Graduation
Rate University of Nebraska 6,936 4,127 59.5% Nebraska College of Technical Agriculture 70 30 42.9% University of Nebraska at Kearney 1,124 640 56.9% University of Nebraska-Lincoln 4,039 2,692 66.7% University of Nebraska Medical Center 0 0 NA University of Nebraska at Omaha 1,703 765 44.9%
Nebraska State College System 1,304 576 44.2% Chadron State College 384 166 43.2% Peru State College 243 86 35.4% Wayne State College 677 324 47.9%
Nebraska Community Colleges 4,472 1,408 31.5% Central Community College 710 268 37.7% Metropolitan Community College 1,077 141 13.1% Mid-Plains Community College 395 133 33.7% Northeast Community College 749 397 53.0% Southeast Community College 1,205 369 30.6% Western Nebraska Community College 336 100 29.8%
Nebraska Independent Colleges and Universities 3,219 2,065 64.2% Bellevue University 8 1 12.5% Bryan College of Health Sciences 30 22 73.3% Clarkson College 13 6 46.2% College of Saint Mary 90 36 40.0% Concordia University-Seward 276 186 67.4% Creighton University 1,010 798 79.0% Dana College 0 0 NA Doane University-Arts & Sciences 327 192 58.7% Doane University-Graduate and Professional Studies 0 0 NA Grace University 62 41 66.1% Hastings College 312 182 58.3% Little Priest Tribal College 17 3 17.6% Midland University 228 106 46.5% Nebraska Christian College of Hope International University 46 29 63.0%
Nebraska Indian Community College 33 2 6.1% Nebraska Methodist College of Nursing & Allied Health 39 23 59.0% Nebraska Wesleyan University 427 299 70.0% Summit Christian College 3 3 100.0% Union College 167 72 43.1% York College 131 64 48.9%
Total Nebraska Public and Independent Colleges and Universities 15,931 8,176 51.3%
Continued on the next page.

Nebraska’s Coordinating Commission for Postsecondary Education – 2018 Progress Report 285
Table A10.4 Continued
2015-2016 Graduation Rates
Institution
No. of Students in Cohort
No. Who Completed Degrees
2015-2016 Graduation
Rate For-Profit/Career Schools 512 341 66.6% Capitol School of Hairstyling and Esthetics 73 58 79.5% CHI Health School of Radiologic Technology 0 0 NA College of Hair Design 28 15 53.6% College of Hair Design-East Campus 47 40 85.1% Fullen School of Hair Design 0 0 NA ITT Technical Institute-Omaha 0 0 NA Joseph's College Cosmetology 92 55 59.8% Kaplan University-Lincoln Campus 27 6 22.2% Kaplan University-Omaha Campus 49 18 36.7% La'James International College 19 13 68.4% Mary Lanning Memorial Hospital School of Radiologic Technology 0 0 NA
Myotherapy Institute 10 8 80.0% National American University-Bellevue 0 0 NA Omaha School of Massage and Healthcare of Herzing University 38 26 68.4%
Paul Mitchell the School Lincoln 9 9 100.0% Regional West Medical Center School of Radiologic Technology 0 0 NA
The Creative Center 35 26 74.3% Universal College of Healing Arts 5 5 100.0% University of Phoenix-Omaha Campus 0 0 NA Vatterott College 0 0 NA Vatterott College-Spring Valley 0 0 NA Xenon International Academy-Omaha 80 62 77.5%
State Total 16,443 8,517 51.8% Data source: National Center for Education Statistics, IPEDS 2006 through 2016 surveys. a For 2009-2010, Josephs College Cosmetology originally reported 104 students in the cohort, 103 of whom completed degrees (99.0% graduation rate). These numbers were reported in versions of this report prior to 2014 and are incorrect. Due to problems with the college’s data system, which has been replaced, the correct rate is not known, but it probably is in the range of 55% to 60%. Since the correct numbers are unknown, Josephs’ students are not included in the 2009-2010 graduation rate table.

Nebraska’s Coordinating Commission for Postsecondary Education – 2018 Progress Report 286
Table A10.5 Graduation Rates within 150% of Normal Time
for Nebraska Postsecondary Institutions by Race/Ethnicity 2015-2016 Compared to 2005-2006
Race/Ethnicity
No. of Students in Cohort
No. Who Completed
Degree Programs Graduation
Rate
2005-2006
White non-Hispanic 15,586 7,972 51.1%
Asian/Pacific Islander 325 160 49.2%
Hispanic 455 180 39.6%
Native American 148 32 21.6%
Black non-Hispanic 708 224 31.6%
Two or More Races NA NA NA
Total Known Race/Ethnicity 17,222 8,568 49.8%
2015-2016 Percentage Pt.
Change in Grad Rate
White non-Hispanic 13,050 7,235 55.4% 4.3
Asian/Pacific Islander 345 199 57.7% 8.5
Hispanic 1,283 495 38.6% -1.0
Native American 137 24 17.5% -4.1
Black non-Hispanic 714 188 26.3% -5.3
Two or More Races 325 134 41.2% NA
Total Known Race/Ethnicity 15,854 8,275 52.2% 2.4 Note. The race/ethnicity category ‘two or more races’ was an optional reporting category for graduation rates reported for 2007-2008, 2008-2009, and 2009-2010. Adoption of the category was mandatory beginning with graduation rate data reported for 2010-2011. Counts do not include nonresident aliens or students of unknown race/ethnicity. As a result, the graduation rate of 49.8% for 2005-2006 is higher than the statewide rate of 49.6%, which is based on the total adjusted cohort, including nonresident aliens and students of unknown race/ethnicity. For 2015-2016, the graduation rate of 52.2% is higher than the statewide rates of 51.8%, which is based on the total adjusted cohort, including nonresident aliens and students of unknown race/ethnicity. Data source: National Center for Education Statistics, IPEDS 2006 and 2016 surveys.

Nebraska’s Coordinating Commission for Postsecondary Education – 2018 Progress Report 287
Table A10.6 Graduation Rates within 150% of Normal Time
for Nebraska Postsecondary Institutions by Race/Ethnicity 2005-2006 through 2015-2016
Year
White non-
Hispanic Asian/Pacific
Islander Hispanic Native
American
Black non-
Hispanic Two or
More Races 2005-2006 51.1% 49.2% 39.6% 21.6% 31.6% NA
2006-2007 50.8% 51.9% 32.5% 26.2% 32.4% NA
2007-2008 51.9% 54.5% 36.5% 25.0% 28.8% NA
2008-2009 51.2% 56.3% 33.5% 18.4% 32.8% 20.0%
2009-2010 52.9% 53.4% 35.2% 23.5% 32.1% 60.0%
2010-2011 52.5% 57.1% 36.3% 28.4% 32.8% 26.8%
2011-2012 50.4% 50.1% 36.8% 26.0% 31.4% 42.1%
2012-2013 51.5% 55.0% 36.9% 23.3% 27.0% 32.6%
2013-2014 53.4% 55.1% 38.9% 22.1% 26.5% 21.4%
2014-2015 53.6% 55.1% 37.4% 22.2% 22.7% 41.3%
2015-2016 55.4% 57.7% 38.6% 17.5% 26.3% 41.2% Note. The race/ethnicity category ‘two or more races’ was an optional reporting category for graduation rates reported for 2007-2008, 2008-2009, and 2009-2010. Adoption of the category was mandatory beginning with graduation rate data reported for 2010-2011. Data source: National Center for Education Statistics, IPEDS 2006 through 2016 surveys.

Nebraska’s Coordinating Commission for Postsecondary Education – 2018 Progress Report 288
Table A10.7 Graduation Rates within 150% of Normal Time
for Nebraska Postsecondary Institutions by Sector and Race/Ethnicity 2015-2016 Compared to 2005-2006
Race/Ethnicity
2005-2006 2015-2016
Cohort No. of
Graduates Grad Rate Cohort
No. of Graduates
Grad Rate
University of Nebraska White non-Hispanic 5,356 3,019 56.4% 5,778 3,588 62.1% Asian/Pacific Islander 130 67 51.5% 118 65 55.1% Hispanic 141 54 38.3% 420 205 48.8% Native American 24 8 33.3% 17 5 29.4% Black non-Hispanic 190 61 32.1% 223 79 35.4% Two or More Races NA NA NA 149 67 45.0%
Total Known Race/Ethnicity 5,841 3,209 6,705 4,009
Nebraska State College System
White non-Hispanic 1,142 567 49.6% 1,061 500 47.1% Asian/Pacific Islander 6 2 33.3% 9 3 33.3% Hispanic 20 5 25.0% 65 25 38.5% Native American 15 2 13.3% 18 4 22.2% Black non-Hispanic 25 2 8.0% 53 12 22.6% Two or More Races NA NA NA 16 3 18.8%
Total Known Race/Ethnicity 1,208 578 1,222 547
Nebraska Community Colleges
White non-Hispanic 4,766 1,600 33.6% 3,314 1,175 35.5% Asian/Pacific Islander 70 15 21.4% 68 15 22.1% Hispanic 163 42 25.8% 531 120 22.6% Native American 32 5 15.6% 31 3 9.7% Black non-Hispanic 178 16 9.0% 290 34 11.7% Two or More Races NA NA NA 64 9 14.1%
Total Known Race/Ethnicity 5,209 1,678 4,298 1,356
Nebraska Independent Colleges and Universities
White non-Hispanic 2,995 1,935 64.6% 2,509 1,699 67.7% Asian/Pacific Islander 105 66 62.9% 146 112 76.7% Hispanic 81 50 61.7% 206 111 53.9% Native American 68 12 17.6% 68 12 17.6% Black non-Hispanic 94 39 41.5% 108 42 38.9% Two or More Races NA NA NA 89 51 57.3%
Total Known Race/Ethnicity 3,343 2,102 3,126 2,027
Continued on the next page.

Nebraska’s Coordinating Commission for Postsecondary Education – 2018 Progress Report 289
Table A10.7 Continued
Race/Ethnicity
2005-2006 2015-2016
Cohort No. of
Graduates Grad Rate Cohort
No. of Graduates
Grad Rate
For-Profit/Career Schools White non-Hispanic 1,327 851 64.1% 388 273 70.4% Asian/Pacific Islander 14 10 71.4% 4 4 100.0% Hispanic 50 29 58.0% 61 34 55.7% Native American 9 5 55.6% 3 0 0.0% Black non-Hispanic 221 106 48.0% 40 21 52.5% Two or More Races NA NA NA 7 4 57.1%
Total Known Race/Ethnicity 1,621 1,001 503 336
Total Nebraska Postsecondary Institutions
White non-Hispanic 15,586 7,972 51.1% 13,050 7,235 55.4% Asian/Pacific Islander 325 160 49.2% 345 199 57.7% Hispanic 455 180 39.6% 1,283 495 38.6% Native American 148 32 21.6% 137 24 17.5% Black non-Hispanic 708 224 31.6% 714 188 26.3% Two or More Races NA NA NA 325 134 41.2%
Total Known Race/Ethnicity 17,222 8,568 15,854 8,275
Note. The race/ethnicity category ‘two or more races’ was an optional reporting category for graduation rates reported for 2007-2008, 2008-2009, and 2009-2010. Adoption of the category was mandatory beginning with graduation rate data reported for 2010-2011. Data source: National Center for Education Statistics, IPEDS 2006 and 2016 surveys.

Nebraska’s Coordinating Commission for Postsecondary Education – 2018 Progress Report 290
Table A10.8 Graduation Rates within 150% of Normal Time
for Two-Year Public Institutions by Financial Aid Received 2015-2016
Institution Cohort
No. Who Completed an
Award Graduation
Rate Neb. College of Technical Agriculture 70 30 42.9% Pell Grant Recipients 35 17 48.6% Subsidized Stafford Loan Recipienta 11 3 27.3% Did Not Receive a Pell Grant or Subsidized Stafford Loan 24 10 41.7%
Central Community College 710 268 37.7% Pell Grant Recipients 400 136 34.0% Subsidized Stafford Loan Recipienta 48 18 37.5% Did Not Receive a Pell Grant or Subsidized Stafford Loan 262 114 43.5%
Metropolitan Community College 1,077 141 13.1% Pell Grant Recipients 570 62 10.9% Subsidized Stafford Loan Recipienta 52 7 13.5% Did Not Receive a Pell Grant or Subsidized Stafford Loan 455 72 15.8%
Mid-Plains Community College 395 133 33.7% Pell Grant Recipients 190 49 25.8% Subsidized Stafford Loan Recipienta 19 6 31.6% Did Not Receive a Pell Grant or Subsidized Stafford Loan 186 78 41.9%
Northeast Community College 749 397 53.0% Pell Grant Recipients 392 177 45.2% Subsidized Stafford Loan Recipienta 100 58 58.0% Did Not Receive a Pell Grant or Subsidized Stafford Loan 257 162 63.0%
Southeast Community College 1,205 369 30.6% Pell Grant Recipients 639 159 24.9% Subsidized Stafford Loan Recipienta 80 38 47.5% Did Not Receive a Pell Grant or Subsidized Stafford Loan 486 172 35.4%
Western Neb. Community College 336 100 29.8% Pell Grant Recipients 162 36 22.2% Subsidized Stafford Loan Recipienta 24 5 20.8% Did Not Receive a Pell Grant or Subsidized Stafford Loan 150 59 39.3%
Total Two-Year Public Institutions 4,542 1,438 31.7% Pell Grant Recipients 2,388 636 26.6% Subsidized Stafford Loan Recipienta 334 135 40.4% Did Not Receive a Pell Grant or Subsidized Stafford Loan 1,820 667 36.6%
Note. Includes students who completed an award within 150% of normal time. Data source: National Center for Education Statistics, IPEDS 2006 through 2016 surveys. a Only includes recipients that did not receive a Pell Grant.

Nebraska’s Coordinating Commission for Postsecondary Education – 2018 Progress Report 291
Table A10.9 Graduation Rates within 150% of Normal Time
for Four-Year Public Institutions by Financial Aid Received 2015-2016
Institution Cohort
No. Who Completed a Bachelor’s or
Equivalent Graduation
Rate University of Nebraska at Kearney 1,124 640 56.9% Pell Grant Recipients 453 226 49.9% Subsidized Stafford Loan Recipienta 164 89 54.3% Did Not Receive a Pell Grant or Subsidized Stafford Loan 507 325 64.1%
University of Nebraska-Lincoln 4,039 2,692 66.7% Pell Grant Recipients 1,050 588 56.0% Subsidized Stafford Loan Recipienta 754 462 61.3% Did Not Receive a Pell Grant or Subsidized Stafford Loan 2,235 1,642 73.5%
University of Nebraska at Omaha 1,488 672 45.2% Pell Grant Recipients 475 193 40.6% Subsidized Stafford Loan Recipienta 197 79 40.1% Did Not Receive a Pell Grant or Subsidized Stafford Loan 816 400 49.0%
Chadron State College 384 166 43.2% Pell Grant Recipients 178 85 47.8% Subsidized Stafford Loan Recipienta 35 12 34.3% Did Not Receive a Pell Grant or Subsidized Stafford Loan 171 69 40.4%
Peru State College 243 86 35.4% Pell Grant Recipients 111 38 34.2% Subsidized Stafford Loan Recipienta 38 9 23.7% Did Not Receive a Pell Grant or Subsidized Stafford Loan 94 39 41.5%
Wayne State College 677 324 47.9% Pell Grant Recipients 288 119 41.3% Subsidized Stafford Loan Recipienta 121 56 46.3% Did Not Receive a Pell Grant or Subsidized Stafford Loan 268 149 55.6%
Total Four-Year Public Institutions 7,955 4,580 57.6% Pell Grant Recipients 2,555 1,249 48.9% Subsidized Stafford Loan Recipienta 1,309 707 54.0% Did Not Receive a Pell Grant or Subsidized Stafford Loan 4,091 2,624 64.1%
Note. Includes students who completed a bachelor’s or equivalent degree within 150% of normal time. Data source: National Center for Education Statistics, IPEDS 2006 through 2016 surveys. a Only includes recipients that did not receive a Pell Grant.
Nebraska’s Coordinating Commission for Postsecondary Education – 2018 Progress Report 292
This page left blank intentionally.
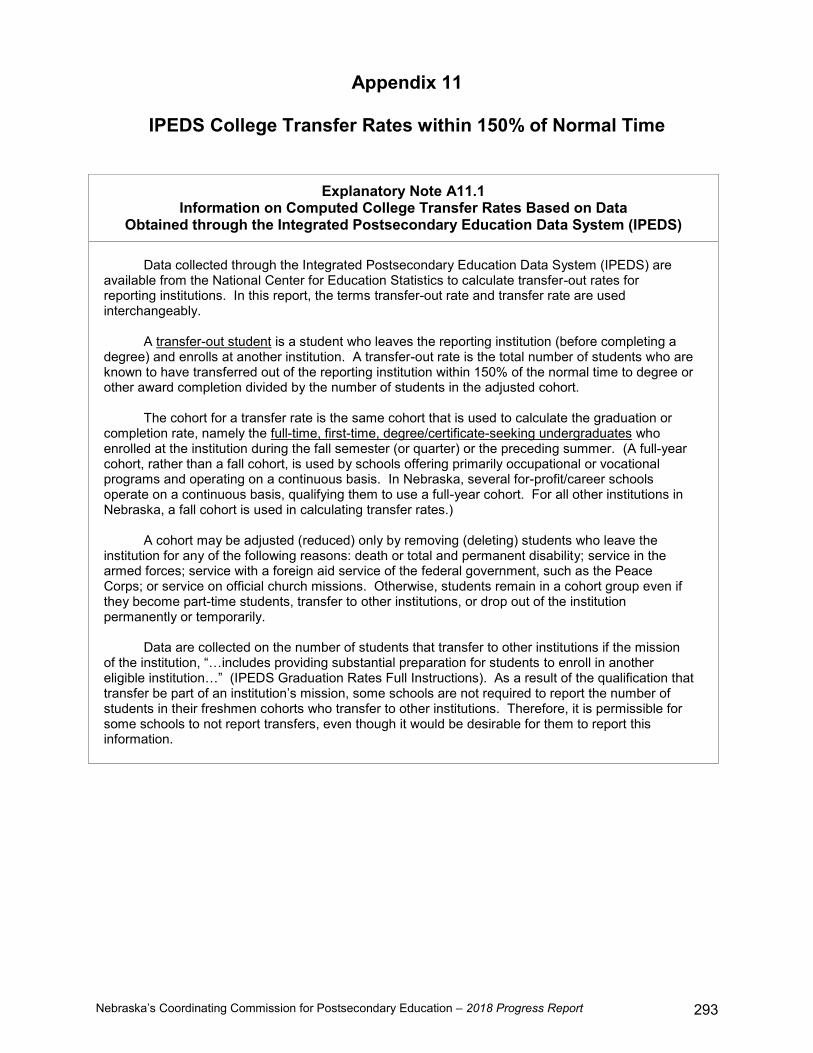
Nebraska’s Coordinating Commission for Postsecondary Education – 2018 Progress Report 293
Appendix 11
IPEDS College Transfer Rates within 150% of Normal Time
Explanatory Note A11.1 Information on Computed College Transfer Rates Based on Data
Obtained through the Integrated Postsecondary Education Data System (IPEDS) Data collected through the Integrated Postsecondary Education Data System (IPEDS) are available from the National Center for Education Statistics to calculate transfer-out rates for reporting institutions. In this report, the terms transfer-out rate and transfer rate are used interchangeably. A transfer-out student is a student who leaves the reporting institution (before completing a degree) and enrolls at another institution. A transfer-out rate is the total number of students who are known to have transferred out of the reporting institution within 150% of the normal time to degree or other award completion divided by the number of students in the adjusted cohort. The cohort for a transfer rate is the same cohort that is used to calculate the graduation or completion rate, namely the full-time, first-time, degree/certificate-seeking undergraduates who enrolled at the institution during the fall semester (or quarter) or the preceding summer. (A full-year cohort, rather than a fall cohort, is used by schools offering primarily occupational or vocational programs and operating on a continuous basis. In Nebraska, several for-profit/career schools operate on a continuous basis, qualifying them to use a full-year cohort. For all other institutions in Nebraska, a fall cohort is used in calculating transfer rates.) A cohort may be adjusted (reduced) only by removing (deleting) students who leave the institution for any of the following reasons: death or total and permanent disability; service in the armed forces; service with a foreign aid service of the federal government, such as the Peace Corps; or service on official church missions. Otherwise, students remain in a cohort group even if they become part-time students, transfer to other institutions, or drop out of the institution permanently or temporarily. Data are collected on the number of students that transfer to other institutions if the mission of the institution, “…includes providing substantial preparation for students to enroll in another eligible institution…” (IPEDS Graduation Rates Full Instructions). As a result of the qualification that transfer be part of an institution’s mission, some schools are not required to report the number of students in their freshmen cohorts who transfer to other institutions. Therefore, it is permissible for some schools to not report transfers, even though it would be desirable for them to report this information.

Nebraska’s Coordinating Commission for Postsecondary Education – 2018 Progress Report 294
Table A11.1 Transfer Rates within 150% of Normal Time
for Nebraska Community Colleges by Sector and Institution 2010-2011 through 2015-2016
Institution No. of Students
in Cohort
No. Who Transferred to
Other Institutions Transfer Rate 2010-2011
Nebraska Community Colleges 4,269 905 21.2% Central Community College 755 134 17.7% Metropolitan Community College 876 214 24.4% Mid Plains Community College 254 69 27.2% Northeast Community College 725 122 16.8% Southeast Community College 1,298 301 23.2% Western Nebraska Community College 361 65 18.0%
2011-2012 Nebraska Community Colleges 5,153 1,016 19.7% Central Community College 888 179 20.2% Metropolitan Community College 1,021 227 22.2% Mid Plains Community College 356 80 22.5% Northeast Community College 872 130 14.9% Southeast Community College 1,640 319 19.5% Western Nebraska Community College 376 81 21.5%
2012-2013 Nebraska Community Colleges 4,833 943 19.5% Central Community College 852 161 18.9% Metropolitan Community College 1,148 266 23.2% Mid Plains Community College 401 82 20.4% Northeast Community College 862 114 13.2% Southeast Community College 1,168 235 20.1% Western Nebraska Community College 402 85 21.1%
2013-2014 Nebraska Community Colleges 4,674 1,000 21.4% Central Community College 811 159 19.6% Metropolitan Community College 887 223 25.1% Mid Plains Community College 439 91 20.7% Northeast Community College 790 129 16.3% Southeast Community College 1,368 325 23.8% Western Nebraska Community College 379 73 19.3%
Continued on the next page.

Nebraska’s Coordinating Commission for Postsecondary Education – 2018 Progress Report 295
Table A11.1 Continued
Institution No. of Students
in Cohort
No. Who Transferred to
Other Institutions Transfer Rate 2014-2015
Nebraska Community Colleges 4,778 969 20.3% Central Community College 740 162 21.9% Metropolitan Community College 1,236 272 22.0% Mid Plains Community College 424 95 22.4% Northeast Community College 800 111 13.9% Southeast Community College 1,203 254 21.1% Western Nebraska Community College 375 75 20.0%
2015-2016 Nebraska Community Colleges 4,472 812 18.2% Central Community College 710 109 15.4% Metropolitan Community College 1,077 223 20.7% Mid Plains Community College 395 98 24.8% Northeast Community College 749 101 13.5% Southeast Community College 1,205 218 18.1% Western Nebraska Community College 336 63 18.8% Data source: National Center for Education Statistics, IPEDS 2011 through 2016 surveys.

Nebraska’s Coordinating Commission for Postsecondary Education – 2018 Progress Report 296
Table A11.2 Graduation Rates Plus Transfer Rates within 150% of Normal Time
for Nebraska Community Colleges by Sector and Institution 2010-2011 through 2015-2016
Institution No. of Students
in Cohort No. Graduates +
Transfers Graduation + Transfer Rate
2010-2011 Nebraska Community Colleges 4,269 2,144 50.2% Central Community College 755 386 51.1% Metropolitan Community College 876 329 37.6% Mid Plains Community College 254 159 62.6% Northeast Community College 725 453 62.5% Southeast Community College 1,298 653 50.3% Western Nebraska Community College 361 164 45.4%
2011-2012 Nebraska Community Colleges 5,153 2,466 47.9% Central Community College 888 509 57.3% Metropolitan Community College 1,021 351 34.4% Mid Plains Community College 356 209 58.7% Northeast Community College 872 542 62.2% Southeast Community College 1,640 688 42.0% Western Nebraska Community College 376 167 44.4%
2012-2013 Nebraska Community Colleges 4,833 2,217 45.9% Central Community College 852 373 43.8% Metropolitan Community College 1,148 409 35.6% Mid Plains Community College 401 219 54.6% Northeast Community College 862 486 56.4% Southeast Community College 1,168 552 47.3% Western Nebraska Community College 402 178 44.3%
2013-2014 Nebraska Community Colleges 4,674 2,348 50.2% Central Community College 811 426 52.5% Metropolitan Community College 887 344 38.8% Mid Plains Community College 439 236 53.8% Northeast Community College 790 493 62.4% Southeast Community College 1,368 672 49.1% Western Nebraska Community College 379 177 46.7%
Continued on the next page.

Nebraska’s Coordinating Commission for Postsecondary Education – 2018 Progress Report 297
Table A11.2 Continued
Institution No. of Students
in Cohort No. Graduates +
Transfers Graduation + Transfer Rate
2014-2015 Nebraska Community Colleges 4,778 2,326 48.7% Central Community College 740 396 53.5% Metropolitan Community College 1,236 438 35.4% Mid Plains Community College 424 242 57.1% Northeast Community College 800 498 62.3% Southeast Community College 1,203 584 48.5% Western Nebraska Community College 375 168 44.8%
2015-2016 Nebraska Community Colleges 4,472 2,220 49.6% Central Community College 710 377 53.1% Metropolitan Community College 1,077 364 33.8% Mid Plains Community College 395 231 58.5% Northeast Community College 749 498 66.5% Southeast Community College 1,205 587 48.7% Western Nebraska Community College 336 163 48.5% Data source: National Center for Education Statistics, IPEDS 2011 through 2016 surveys.

Nebraska’s Coordinating Commission for Postsecondary Education – 2018 Progress Report 298
This page left blank intentionally.
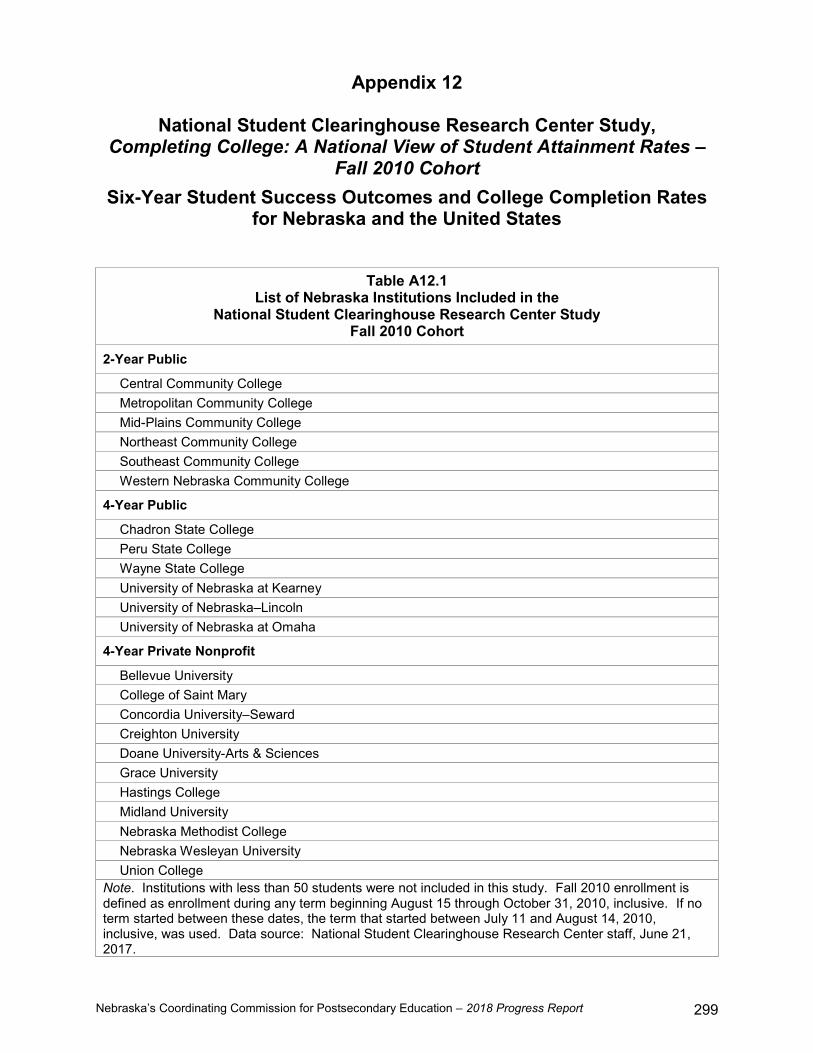
Nebraska’s Coordinating Commission for Postsecondary Education – 2018 Progress Report 299
Appendix 12
National Student Clearinghouse Research Center Study, Completing College: A National View of Student Attainment Rates –
Fall 2010 Cohort
Six-Year Student Success Outcomes and College Completion Rates for Nebraska and the United States
Table A12.1 List of Nebraska Institutions Included in the
National Student Clearinghouse Research Center Study Fall 2010 Cohort
2-Year Public
Central Community College Metropolitan Community College Mid-Plains Community College Northeast Community College Southeast Community College Western Nebraska Community College
4-Year Public
Chadron State College Peru State College Wayne State College University of Nebraska at Kearney University of Nebraska–Lincoln University of Nebraska at Omaha
4-Year Private Nonprofit
Bellevue University College of Saint Mary Concordia University–Seward Creighton University Doane University-Arts & Sciences Grace University Hastings College Midland University Nebraska Methodist College Nebraska Wesleyan University Union College
Note. Institutions with less than 50 students were not included in this study. Fall 2010 enrollment is defined as enrollment during any term beginning August 15 through October 31, 2010, inclusive. If no term started between these dates, the term that started between July 11 and August 14, 2010, inclusive, was used. Data source: National Student Clearinghouse Research Center staff, June 21, 2017.
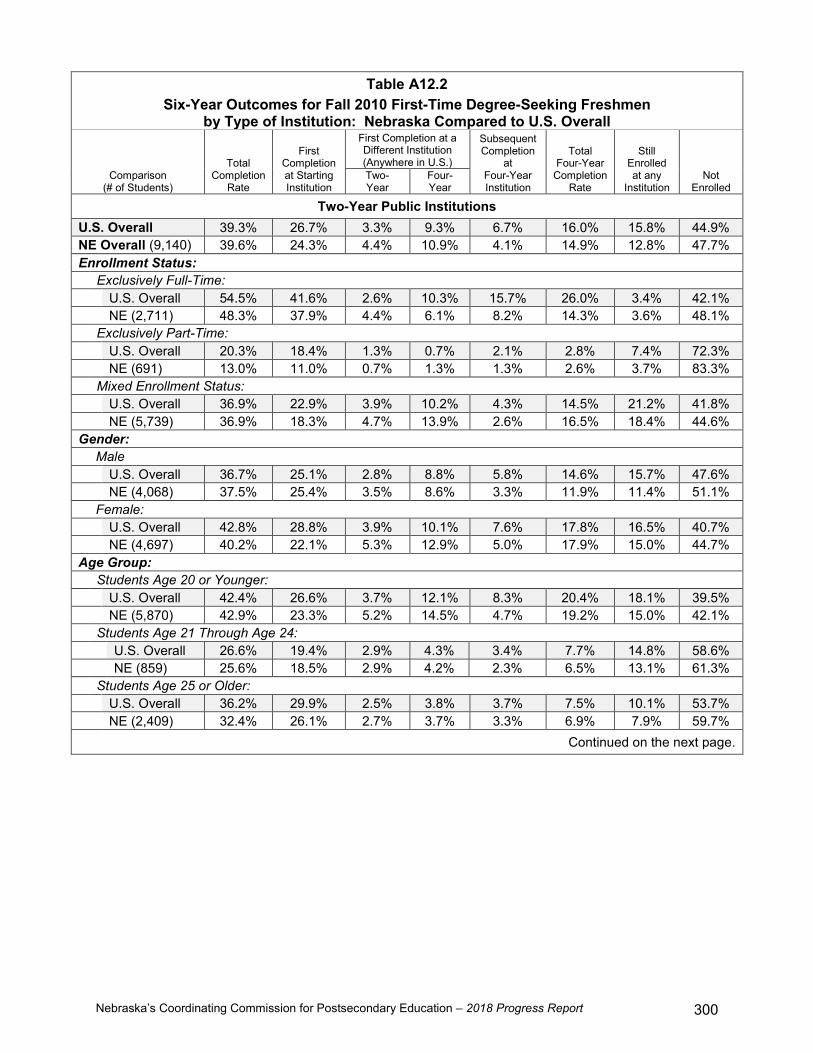
Nebraska’s Coordinating Commission for Postsecondary Education – 2018 Progress Report 300
Table A12.2 Six-Year Outcomes for Fall 2010 First-Time Degree-Seeking Freshmen
by Type of Institution: Nebraska Compared to U.S. Overall
Comparison (# of Students)
Total Completion
Rate
First Completion at Starting Institution
First Completion at a Different Institution (Anywhere in U.S.)
Subsequent Completion
at Four-Year Institution
Total Four-Year
Completion Rate
Still Enrolled at any
Institution Not
Enrolled Two- Year
Four-Year
Two-Year Public Institutions U.S. Overall 39.3% 26.7% 3.3% 9.3% 6.7% 16.0% 15.8% 44.9% NE Overall (9,140) 39.6% 24.3% 4.4% 10.9% 4.1% 14.9% 12.8% 47.7% Enrollment Status: Exclusively Full-Time: U.S. Overall 54.5% 41.6% 2.6% 10.3% 15.7% 26.0% 3.4% 42.1% NE (2,711) 48.3% 37.9% 4.4% 6.1% 8.2% 14.3% 3.6% 48.1%
Exclusively Part-Time: U.S. Overall 20.3% 18.4% 1.3% 0.7% 2.1% 2.8% 7.4% 72.3% NE (691) 13.0% 11.0% 0.7% 1.3% 1.3% 2.6% 3.7% 83.3%
Mixed Enrollment Status: U.S. Overall 36.9% 22.9% 3.9% 10.2% 4.3% 14.5% 21.2% 41.8% NE (5,739) 36.9% 18.3% 4.7% 13.9% 2.6% 16.5% 18.4% 44.6%
Gender: Male
U.S. Overall 36.7% 25.1% 2.8% 8.8% 5.8% 14.6% 15.7% 47.6% NE (4,068) 37.5% 25.4% 3.5% 8.6% 3.3% 11.9% 11.4% 51.1%
Female: U.S. Overall 42.8% 28.8% 3.9% 10.1% 7.6% 17.8% 16.5% 40.7% NE (4,697) 40.2% 22.1% 5.3% 12.9% 5.0% 17.9% 15.0% 44.7%
Age Group: Students Age 20 or Younger: U.S. Overall 42.4% 26.6% 3.7% 12.1% 8.3% 20.4% 18.1% 39.5% NE (5,870) 42.9% 23.3% 5.2% 14.5% 4.7% 19.2% 15.0% 42.1%
Students Age 21 Through Age 24: U.S. Overall 26.6% 19.4% 2.9% 4.3% 3.4% 7.7% 14.8% 58.6% NE (859) 25.6% 18.5% 2.9% 4.2% 2.3% 6.5% 13.1% 61.3% Students Age 25 or Older: U.S. Overall 36.2% 29.9% 2.5% 3.8% 3.7% 7.5% 10.1% 53.7% NE (2,409) 32.4% 26.1% 2.7% 3.7% 3.3% 6.9% 7.9% 59.7%
Continued on the next page.

Nebraska’s Coordinating Commission for Postsecondary Education – 2018 Progress Report 301
Table A12.2 Continued
Comparison (# of Students)
Total Completion
Rate
First Completion at Starting Institution
First Completion at a Different Institution (Anywhere in U.S.)
Subsequent Completion
at Four-Year Institution
Total Four-Year
Completion Rate
Still Enrolled at any
Institution Not
Enrolled Two- Year
Four-Year
Four-Year Public Institutions U.S. Overall 62.4% 49.5% 3.2% 9.8% 13.2% 24.3% NE Overall (9,516) 65.6% 45.4% 4.2% 15.9% 14.7% 19.7% Enrollment Status: Exclusively Full-Time: U.S. Overall 81.2% 71.4% 1.8% 7.9% 3.7% 15.2% NE (4,299) 82.5% 69.7% 2.9% 9.9% 3.3% 14.2%
Exclusively Part-Time: U.S. Overall 19.7% 16.7% 1.7% 1.4% 7.7% 72.7% NE (219) 20.6% 16.9% 1.8% 1.8% 8.3% 71.1%
Mixed Enrollment Status: U.S. Overall 50.7% 33.7% 4.7% 12.4% 22.4% 26.9% NE (4,998) 53.1% 25.9% 5.5% 21.7% 24.8% 22.1%
Gender: Male
U.S. Overall 58.3% 46.9% 2.9% 8.5% 14.7% 27.0% NE (4,300) 61.2% 43.8% 4.3% 13.1% 15.4% 23.5%
Female: U.S. Overall 66.3% 51.3% 3.7% 11.3% 12.5% 21.2% NE (4,669) 69.4% 45.9% 4.5% 19.1% 14.9% 15.7%
Age Group: Students Age 20 or Younger: U.S. Overall 65.6% 51.3% 3.5% 10.9% 13.8% 20.6% NE (8,714) 66.3% 44.8% 4.5% 17.0% 15.1% 18.6%
Students Age 21 Through Age 24: U.S. Overall 50.1% 43.4% 2.3% 4.3% 10.9% 39.0% NE (197) 51.8% 43.7% 3.6% 4.6% 11.3% 36.9% Students Age 25 or Older: U.S. Overall 44.8% 39.1% 1.8% 3.9% 10.4% 44.8% NE (605) 59.9% 54.8% 1.0% 4.0% 10.3% 29.9%
Continued on the next page.
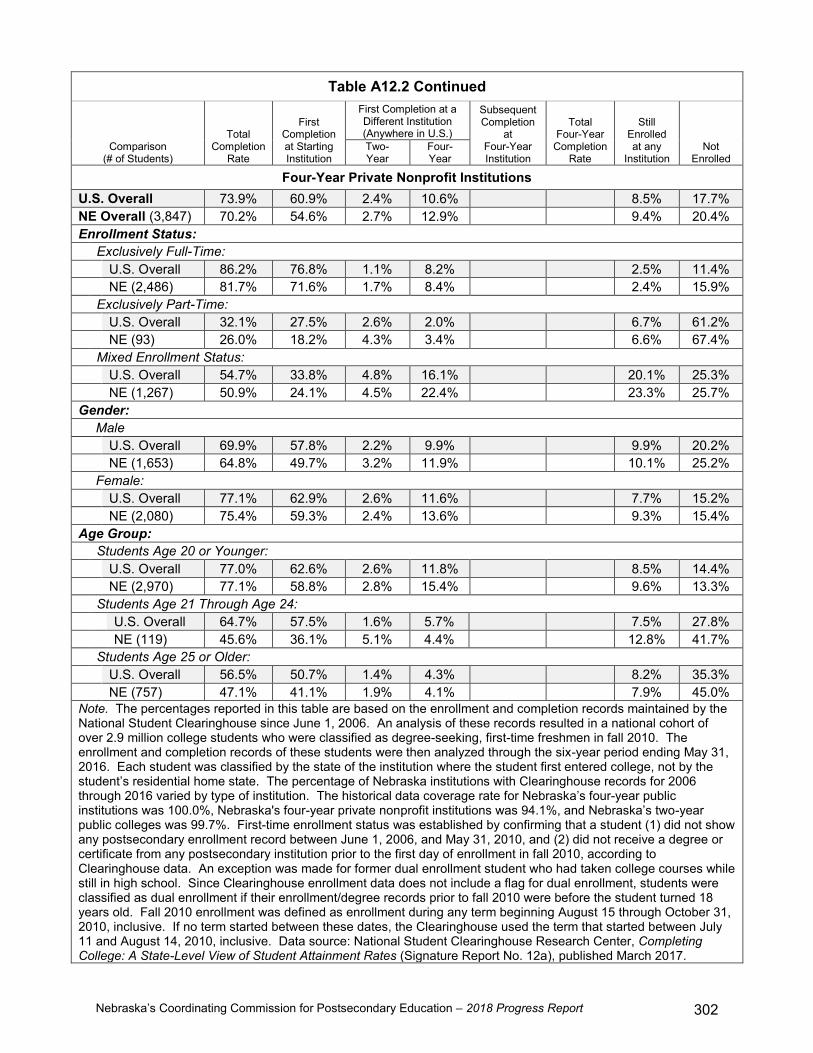
Nebraska’s Coordinating Commission for Postsecondary Education – 2018 Progress Report 302
Table A12.2 Continued
Comparison (# of Students)
Total Completion
Rate
First Completion at Starting Institution
First Completion at a Different Institution (Anywhere in U.S.)
Subsequent Completion
at Four-Year Institution
Total Four-Year
Completion Rate
Still Enrolled at any
Institution Not
Enrolled Two- Year
Four-Year
Four-Year Private Nonprofit Institutions U.S. Overall 73.9% 60.9% 2.4% 10.6% 8.5% 17.7% NE Overall (3,847) 70.2% 54.6% 2.7% 12.9% 9.4% 20.4% Enrollment Status: Exclusively Full-Time: U.S. Overall 86.2% 76.8% 1.1% 8.2% 2.5% 11.4% NE (2,486) 81.7% 71.6% 1.7% 8.4% 2.4% 15.9%
Exclusively Part-Time: U.S. Overall 32.1% 27.5% 2.6% 2.0% 6.7% 61.2% NE (93) 26.0% 18.2% 4.3% 3.4% 6.6% 67.4%
Mixed Enrollment Status: U.S. Overall 54.7% 33.8% 4.8% 16.1% 20.1% 25.3% NE (1,267) 50.9% 24.1% 4.5% 22.4% 23.3% 25.7%
Gender: Male
U.S. Overall 69.9% 57.8% 2.2% 9.9% 9.9% 20.2% NE (1,653) 64.8% 49.7% 3.2% 11.9% 10.1% 25.2%
Female: U.S. Overall 77.1% 62.9% 2.6% 11.6% 7.7% 15.2% NE (2,080) 75.4% 59.3% 2.4% 13.6% 9.3% 15.4%
Age Group: Students Age 20 or Younger: U.S. Overall 77.0% 62.6% 2.6% 11.8% 8.5% 14.4% NE (2,970) 77.1% 58.8% 2.8% 15.4% 9.6% 13.3%
Students Age 21 Through Age 24: U.S. Overall 64.7% 57.5% 1.6% 5.7% 7.5% 27.8% NE (119) 45.6% 36.1% 5.1% 4.4% 12.8% 41.7% Students Age 25 or Older: U.S. Overall 56.5% 50.7% 1.4% 4.3% 8.2% 35.3% NE (757) 47.1% 41.1% 1.9% 4.1% 7.9% 45.0%
Note. The percentages reported in this table are based on the enrollment and completion records maintained by the National Student Clearinghouse since June 1, 2006. An analysis of these records resulted in a national cohort of over 2.9 million college students who were classified as degree-seeking, first-time freshmen in fall 2010. The enrollment and completion records of these students were then analyzed through the six-year period ending May 31, 2016. Each student was classified by the state of the institution where the student first entered college, not by the student’s residential home state. The percentage of Nebraska institutions with Clearinghouse records for 2006 through 2016 varied by type of institution. The historical data coverage rate for Nebraska’s four-year public institutions was 100.0%, Nebraska's four-year private nonprofit institutions was 94.1%, and Nebraska’s two-year public colleges was 99.7%. First-time enrollment status was established by confirming that a student (1) did not show any postsecondary enrollment record between June 1, 2006, and May 31, 2010, and (2) did not receive a degree or certificate from any postsecondary institution prior to the first day of enrollment in fall 2010, according to Clearinghouse data. An exception was made for former dual enrollment student who had taken college courses while still in high school. Since Clearinghouse enrollment data does not include a flag for dual enrollment, students were classified as dual enrollment if their enrollment/degree records prior to fall 2010 were before the student turned 18 years old. Fall 2010 enrollment was defined as enrollment during any term beginning August 15 through October 31, 2010, inclusive. If no term started between these dates, the Clearinghouse used the term that started between July 11 and August 14, 2010, inclusive. Data source: National Student Clearinghouse Research Center, Completing College: A State-Level View of Student Attainment Rates (Signature Report No. 12a), published March 2017.

Nebraska’s Coordinating Commission for Postsecondary Education – 2018 Progress Report 303
Appendix 13
Estimated Nebraska Net Migration of 22- to 64-Year-Olds
Table A13.1 Nebraska Educational Attainment of 22- to 64-Year-Olds
Based on the 2007-2011 and 2012-2016 American Community Survey
Level of Education
Estimated Total Population 90% Confidence
Interval 90% Margin of Error (+/-) N %
2007-2011
High School Graduate or Below 342,463 34.0% [337,303, 347,623] 5,160 Some College or Associate’s 365,706 36.3% [360,306, 371,106] 5,400 Bachelor’s Degree or Higher 298,528 29.7% [293,774, 303,282] 4,754
Total 1,006,697
2012-2016
High School Graduate or Below 328,754 31.9% [323,908, 333,600] 4,846 Some College or Associate’s 366,922 35.6% [361,290, 372,554] 5,632 Bachelor’s Degree or Higher 334,170 32.4% [328,339, 340,001] 5,831
Total 1,029,846 Note. No conclusion can be drawn about a given estimate when the margin of error exceeds the absolute value of the point estimate itself at the stated confidence level. Data users should exercise caution when the margin of error is large relative to the estimate itself. Data source: U.S. Census Bureau, American Community Survey five-year Public Use Microdata Sample (PUMS) files, 2007-2011 and 2012-2016. Compiled by Dr. Duncan Hsu.

Nebraska’s Coordinating Commission for Postsecondary Education – 2018 Progress Report 304
Table A13.2 Nebraska Average Annual In-Migration, Out-Migration, and
Net Migration of 22- to 64-Year-Olds by Education Level Based on the 2007-2011 and 2012-2016 American Community Survey
Level of Education Estimated
In-Migration Estimated
Out-Migration Estimated
Net Migration 90% Margin of
Error (+/-) 2007-2011 High School Graduate or Below 10,923 8,758 2,165 1,574
Some College or Associate’s 10,597 8,943 1,654 1,804
Bachelor’s Degree or Higher 9,840 11,484 -1,644 1,556
Total Migration 31,360 29,185 2,175 3,194
2012-2016 High School Graduate or Below 7,734 7,490 244 1,260
Some College or Associate’s 9,146 8,486 660 1,804
Bachelor’s Degree or Higher 11,799 13,389 -1,590 1,764
Total Migration 28,679 29,365 -686 2,989 Note. No conclusion can be drawn about a given estimate when the margin of error exceeds the absolute value of the point estimate itself at the stated confidence level. Data users should exercise caution when the margin of error is large relative to the estimate itself. Data source: U.S. Census Bureau, American Community Survey five-year Public Use Microdata Sample (PUMS) files, 2007-2011 and 2012-2016. Compiled by Dr. Duncan Hsu.

Nebraska’s Coordinating Commission for Postsecondary Education – 2018 Progress Report 305
Table A13.3 Nebraska Average Annual Net Migration of 22- to 64-Year-Olds Confidence Intervals (Margin of Error at 90% Confidence Level)
Based on the 2007-2011 and 2012-2016 American Community Survey
Level of Education 2007-2011 2012-2016 High School Graduate or Below [591, 3,739] *
Some College or Associate’s * *
Bachelor’s Degree or Higher [-3,200, -88] *
Total Migration * * Note. Confidence intervals are shown based on 90% margin of error. * = margin of error exceeds estimate at the 90% confidence level. When the margin of error exceeds the absolute value of the point estimate, no conclusions should be drawn about the estimate. Table A13.1 shows that the 2007-2011 estimated annual net migration of -1,590 for those with a bachelor's degree or higher has a 90% margin of error of +/- 1,764. In other words, if one were to draw indefinite samples of the population, the annual net migration point estimate for those with a bachelor's degree or higher would fall between -3,200 and -88 90% of the time. Data source: U.S. Census Bureau, American Community Survey five-year Public Use Microdata Sample (PUMS) files, 2007-2011 and 2012-2016. Compiled by Dr. Duncan Hsu.


Nebraska’s Coordinating Commission for Postsecondary Education
P.O. Box 95005, Lincoln, NE 68509-5005 ● 140 N. 8th St., Suite 300, Lincoln, NE 68508 Phone: (402) 471-2847
The Commission’s reports are available online at ccpe.nebraska.gov/reports
Promoting high quality, ready access, and efficient use of resources in Nebraska higher education.