2018 eu-silc module assessment
TRANSCRIPT

2018 – Material deprivation, well-being and housing difficulties
Assessment of the implementation
March 2020

Table of Contents
0. Introduction .................................................................................................................................... 4
1. Main characteristics .......................................................................................................................... 4
1.1 Relevance ...................................................................................................................................... 4
1.2 List of supplementary target variables ............................................................................................ 6
1.3 Unit of analysis ............................................................................................................................... 7
1.4 Mode of data collection .................................................................................................................. 7
1.5 Reference period ............................................................................................................................ 7
1.6 Data transmission .......................................................................................................................... 8
2. Description of the definitions ........................................................................................................... 8
2.1 Material deprivation ........................................................................................................................ 8
2.2 Well-being ...................................................................................................................................... 8
2.3 Housing difficulties (OPTIONAL) .................................................................................................. 10
3. Availability of data .......................................................................................................................... 12
4. Analysis of the variables ................................................................................................................ 12
4.1 Variables ...................................................................................................................................... 12
HS070: Do you have a telephone (including mobile phone)? ......................................................................................... 12
HS080: Do you have a colour TV? ................................................................................................................................. 13
HS100: Do you have a washing machine? ..................................................................................................................... 14
PW010T: Overall life satisfaction .................................................................................................................................... 14
PW240T: Perceived social exclusion .............................................................................................................................. 15
PW040T: Material help ................................................................................................................................................... 16
PW110T: Non-material help ............................................................................................................................................ 17
PW030T: Satisfaction with financial situation ................................................................................................................. 18
PW160T: Satisfaction with personal relationships .......................................................................................................... 19
PW120T: Satisfaction with time use (amount of leisure time) ......................................................................................... 20
PW100T: Satisfaction with job ........................................................................................................................................ 21
PW190T: Trust in others ................................................................................................................................................. 22
PW230T: Feeling lonely .................................................................................................................................................. 23
PW050T: Being very nervous ......................................................................................................................................... 24
PW060T: Feeling down in the dumps ............................................................................................................................. 25
PW070T: Feeling calm and peaceful .............................................................................................................................. 26
PW080T: Feeling downhearted or depressed ................................................................................................................ 27
PW090T: Being happy .................................................................................................................................................... 28
PHD01T: Past experience of housing difficulties ............................................................................................................ 29
PHD02T: Duration of the most recent experience of housing difficulties ........................................................................ 30
PHD03T: Main reason for past housing difficulties ......................................................................................................... 30
PHD04T: Other reason for past housing difficulties ........................................................................................................ 31
PHD05T: Exit from housing difficulties............................................................................................................................ 32
4.2 Main points of the analysis of the frequencies .............................................................................. 33

2
5. Analysis of the questionnaires ...................................................................................................... 35
6. Analysis of the flags ....................................................................................................................... 36
6.1 Flag -1 “Missing” .......................................................................................................................... 37
6.2 Flag -2 “Not applicable if not performed any working task in PL031” ........................................... 46
6.3 Flag -3 “Non-selected respondent” ............................................................................................... 51
6.4 Flag -8 “Not collected information” ............................................................................................... 56
7. Conclusion ....................................................................................................................................... 57
8. Annexes ............................................................................................................................................ 58
Annex 1: Distribution of 'filled' values for each variable ...................................................................... 58
Annex 2: Frequency distribution of variable flags ............................................................................... 71

3
List of Tables
Table 1: HS070 - Descriptive statistics ..................................................................................................................................... 12
Table 2: HS080 - Descriptive statistics ..................................................................................................................................... 13
Table 3: HS100 - Descriptive statistics ..................................................................................................................................... 14
Table 4: PW010T - Descriptive statistics .................................................................................................................................. 15
Table 5: PW240T - Descriptive statistics .................................................................................................................................. 16
Table 6: PW040T - Descriptive statistics .................................................................................................................................. 17
Table 7: PW110T - Descriptive statistics .................................................................................................................................. 17
Table 8: PW030T - Descriptive statistics .................................................................................................................................. 18
Table 9: PW160T - Descriptive statistics .................................................................................................................................. 19
Table 10: PW120T - Descriptive statistics ................................................................................................................................ 20
Table 11: PW100T - Descriptive statistics ................................................................................................................................ 21
Table 12: PW190T - Descriptive statistics ................................................................................................................................ 22
Table 13: PW230T - Descriptive statistics ................................................................................................................................ 23
Table 14: PW050T - Descriptive statistics ................................................................................................................................ 24
Table 15: PW060T - Descriptive statistics ................................................................................................................................ 25
Table 16: PW070T - Descriptive statistics ................................................................................................................................ 26
Table 17: PW080T - Descriptive statistics ................................................................................................................................ 27
Table 18: PW090T - Descriptive statistics ................................................................................................................................ 28
Table 19: PHD01T - Descriptive statistics ................................................................................................................................ 29
Table 20: Distribution of the missing values for each variable ................................................................................................. 38
Table 21: Distribution of the missing values above 5 % ........................................................................................................... 39
Table 22: Share of flag -1 (missing) for each variable of Module 2018 by country .................................................................. 41
Table 23: Share of flag -2 (not applicable) for each variables of Module 2018 by country ....................................................... 46
Table 24: Share of flag -3, Non-selected respondent ............................................................................................................... 51
Table 25: Share of flag -8 (Not collected information) .............................................................................................................. 56
Abbreviations
EC European Commission
ESS European Statistical System
EU-SILC Statistics on Income and Living Conditions
ISCO International Standard Classification of Occupations
MS Member State

4
0. Introduction
This report presents the analyses of the data of the EU-SILC 2018 ad-hoc module on well-being, material deprivation and housing difficulties.
The variables were implemented according to the Commission regulation (EU) 2017/310 of 22 February 2017, implementing Regulation (EC) No 1177/2003 of the European Parliament and of the Council1 concerning Community statistics on income and living conditions (EU-SILC) as regards the list of target secondary variables on material deprivation, well-being and housing difficulties for 2018.
The module was divided into three parts:
Material deprivation.
Well-being.
Housing difficulties.
1. Main characteristics
1.1 Relevance
Ad-hoc modules are developed to complement the variables permanently collected in EU-SILC with supplementary variables highlighting unexplored aspects of social inclusion and also other characteristics.
The 2018 ad-hoc module, part of the cross-sectional component of EU-SILC, includes secondary variables on well-being, housing difficulties and material deprivation, as these areas have an impact on living conditions, income and social inclusion.
1 https://eur-lex.europa.eu/legal-content/EN/TXT/PDF/?uri=CELEX:32017R0310&from=EN

5
The 2018 SILC ad-hoc module variables:
The ad-hoc module’s section on well-being measures the perception of people being lonely, being very nervous, feeling down in the dumps, feeling calm and peaceful, feeling downhearted or depressed and being happy. The variables collect subjective information about the well-being and emotions/feelings of a person.
The ad-hoc module’s section on material deprivation deals with the inability to pay for or have durable goods such as a telephone (including mobile phone), washing machine, and colour television.
The ad-hoc module’s section on housing difficulties looks at the experience of persons having housing difficulties during their lifetime.
Material deprivation
Housing difficulties
Well-being

6
1.2 List of supplementary target variables
The ad-hoc module on well-being, material deprivation and housing difficulties was included in the 2018 EU-SILC data collection. It contains 23 variables: 3 variables collected at household level and 20 at personal level. The variables on housing difficulties (5 out of 23) were collected on a voluntary basis.
Compulsory items collected at household level
Social exclusion/Non-monetary material deprivation items:
HS070: Do you have a telephone (including mobile phone)?
HS080: Do you have a colour TV?
HS100: Do you have a washing machine?
Compulsory adult items collected at individual level
Well-being:
PW010T: Overall life satisfaction
PW240T: Perceived social exclusion
PW040T: Material help
PW110T: Non-material help
PW030T: Satisfaction with financial situation
PW160T: Satisfaction with personal relationships
PW120T: Satisfaction with time use (amount of leisure time)
PW100T: Satisfaction with job
PW190T: Trust in others
PW230T: Feeling lonely
PW050T: Being very nervous
PW060T: Feeling down in the dumps
PW070T: Feeling calm and peaceful
PW080T: Feeling downhearted or depressed
PW090T: Being happy

7
Voluntary items collected at individual level
Housing difficulties (OPTIONAL)
PHD01T: Past experience of housing difficulties
PHD02T: Duration of the most recent experience of housing difficulties
PHD03T: Main reason for past housing difficulties
PHD04T: Other reason for past housing difficulties
PHD05T: Exit from housing difficulties
1.3 Unit of analysis
The target variables relate to different units:
Information on well-being and housing difficulties is to be provided for each current private household member, or, if applicable, for all selected respondents aged 16 and over.
Information on material deprivation applies at household level and refers to the household as a whole.
Age refers to the person’s age at the end of the income reference period.
1.4 Mode of data collection
The information presented in the 2018 EU-SILC ad-hoc module was collected in the following ways:
For variables at household level, the mode of data collection was a personal interview with the household respondent.
For variables at individual level, the mode of data collection was a personal interview with all current household members aged 16 and over or, if applicable, with each selected respondent.
It was recommended to collect the information only through personal interviews. Proxy interviews were not allowed for variables concerning well-being and housing difficulties. However, proxy interviews for persons temporarily absent or incapacitated were allowed for material deprivation variables, as an exception.
1.5 Reference period
The target variables relate to different types of reference periods:
Current: used for the well-being variables and material deprivation.
Past four weeks: used for the five variables on emotional well-being and one variable on loneliness.
Lifetime: used for past experience of housing difficulties.

8
1.6 Data transmission
The target secondary variables were sent to the Commission (Eurostat) in the Household Data File (H-File), and in the Personal Data File (P-file) after the target primary variables.
2. Description of the definitions This section describes the definitions used for describing the variables in the 2018 ad-hoc module.
2.1 Material deprivation
Possession of telephone (including mobile phone): refers to the household level, whether the household has a telephone (including a mobile phone) or whether the household does not have a telephone because it cannot afford one (enforced lack2) or for other reasons. Possession of the item does not necessarily imply ownership: the item may be rented, leased or provided on loan. In the case of mobile telephones, the household is considered to be in possession of the item if any member has one.
Possession of colour TV: refers to the household level, whether the household has a colour TV or whether the household does not have a colour TV because it cannot afford one (enforced lack) or for other reasons. Possessing the item does not necessarily imply ownership: the item may be rented, leased, provided on loan or shared with other households in (e.g.) a complex apartment and not necessarily owned. If the item is shared between households, the answer is YES if there is adequate/easy access (i.e. household can use the durable whenever it wants) and NO otherwise. In the case of a colour television, the household is considered to be in possession of one if any member has one.
Possession of washing machine: refers to the household level, whether the household has a washing machine or whether the household does not have a washing machine because it cannot afford it (enforced lack) or for other reasons. Possessing the item does not necessarily imply ownership: the item may be rented, leased, provided on loan, or shared with other households in (e.g.) a complex apartment. If the item is shared between households, the answer is YES if there is adequate/easy access (i.e. household can use the durable whenever it wants) and NO otherwise. In the case of a washing machine, the household is considered to be in possession of one if any member has one.
2.2 Well-being
Overall life satisfaction: refers to all persons 16 years old or over, and assesses satisfaction with life as a whole. The synonyms are happiness, and subjective well-being. Life satisfaction represents a measure of how a respondent evaluates or assesses life, taken as a whole. The focus is to assess how people are
2 Enforced lack implies that the item is something that the household would like to have but cannot
afford.
9
feeling "these days", rather than specifying a longer or shorter time period. The intent is not to obtain the emotional state of the respondent at the given moment, but for them to make a reflective judgment on their level of satisfaction.
Perceived social exclusion: refers to all persons 16 years old or over and involves the lack of resources, rights, goods and services, and the inability to participate in normal relationships and activities, available to the majority of people in a society, whether in economic, social, cultural or political arenas. The definition implies both a lack of resources to participate, but also a feeling of rejection by society or certain groups. Usually, those identified as vulnerable to exclusion include: people in poverty, lone parents, unemployed people, disabled people, people facing discrimination on the grounds of gender, race, sexuality or disability, homeless people, people with ill health, children not doing well at school, people with few educational qualifications, people with low self-esteem, people with addiction problems and communities in areas of deprivation.
Material help: should be understood as concerning money or possessions (including consumer goods such as groceries, objects of daily use, etc.). The aim is to measure the quality of personal relationships between people, referring to the possibility of asking for and receiving material help from any relatives, friends, neighbours or other persons the respondent knows. It should be understood as the possibility of asking for help, whether the respondent needs it or not.
Non-material help: non-material help should be understood as help to do some activities or moral support. The aim is to measure the quality of personal relationships between people, referring to the possibility of asking for and receiving moral help or services from any relatives, friends, neighbours or other persons the respondent knows. It should be understood as the possibility of asking for help, whether the respondent needs it or not.
Satisfaction with financial situation: refers to the respondents’ opinion/feeling about their degree of satisfaction with the financial situation of household. The aim is to make a broad reflective assessment of all areas of the financial situation of households at a particular point in time (the current situation). To assess the financial situation, respondents should take into account adequacy of income, level of savings, capacity to pay back debt and money owed, the ability to meet large emergency expenses, and the level of assets for the entire household.
Satisfaction with personal relationships: refers to the respondent’s opinion/feeling of their relationships with people with whom they spend time (e.g. family, friends, colleagues from work, neighbours).
Satisfaction with time use (amount of leisure time): refers to the respondent’s broad, reflective appraisal of the amount of time they have currently to do the things they like to do (hobby, leisure, time off work).
Satisfaction with job: refers to the respondents’ opinion/feeling regarding their degree of satisfaction with their job. Respondents should make a broad, reflective assessment of all areas of their job at a particular point in time (current situation). The activity status is based on the persons’ own perception of their main activity. If a person has several jobs or courses of study at the same time, they should consider the current activity.

10
Trust in others: refers to respondents’ opinion/feeling about trust or belief in others. ‘Others’ are understood as people with whom the respondent is not acquainted (family, friends, neighbours etc. should be excluded).
Feeling lonely: is based on self-assessment or emotions of all persons aged over 16 years old, and the main aim is to measure psychological well-being. This refers to the extent to which the person has felt lonely during the past four weeks. Feelings of loneliness are not synonymous with being alone but instead involve feelings of isolation, feelings of disconnectedness and feelings of not belonging.
Being very nervous: is based on self-assessment of emotions of all persons 16 years and over, and the main aim is to measure psychological well-being, regarding the extent to which a person has felt very nervous during the past four weeks. "Being nervous" is a status characterised by or showing emotional tension, restlessness, and agitation.
Feeling down in the dumps: is based on self-assessment of emotions of all persons aged 16 and over regarding the extent to which they have felt down in the dumps during the past four weeks. “Down in the dumps” should be understood as being unhappy, low-spirited and pessimistic.
Feeling calm and peaceful: is based on self-assessment of emotions, and the main aim is to measure psychological well-being. This refers to the extent respondents have felt calm and peaceful during the past four weeks.
Feeling downhearted or depressed: is based on self-assessment of emotions, and the main aim is to measure psychological well-being. It refers to the feeling of all persons 16 years old and above, with regard to what extent they have felt downhearted or depressed during the past four weeks. “Downhearted or depressed” should be understood as: unhappy, despondent, and hopeless. Downhearted or depressed expresses a stronger feeling than “feeling down in the dumps”.
Being happy: is based on self-assessment of emotions, and the main aim is to measure psychological well-being. It refers to the feeling of all persons aged 16 years or over, with regard to what extent they have felt happy during the past four weeks.
2.3 Housing difficulties (OPTIONAL)
These variables are collected on a voluntary basis.
Past experience of housing difficulties (OPTIONAL): the aim is to measure the number of persons having experienced housing difficulties during their lifetime. Housing difficulties refers to any point in a person’s life at which they had no place of their own (either owned or rented) where they could live and therefore were forced to stay with friends/family, stay in emergency or other temporary accommodation, a place not intended as a permanent home or had to sleep in a public space.

11
If the respondent was forced to leave their home temporarily due to unforeseen events such as: risk of earthquake; fire in the neighbourhood; evacuation of the neighbourhood because of bomb defusal etc. but in general, had a place of their own (either owned or rented) to live in, then the respondent should not be considered to have had housing difficulties.
‘Staying with friends or relatives’ – should include situations when somebody was forced to move (back) to the family or friends as they did not have any other place to stay. Visits, staying for a limited time (e.g. during refurbishing of own flat) or living with family to save money, rather than due to an absolute need, should not be taken into consideration.
'Emergency or other temporary accommodation' should be understood as overnight shelter for people with no usual place of residence, accommodation for persons who have experienced domestic violence, and accommodation for immigrants due to their status.
Duration of the most recent experience of housing difficulties (OPTIONAL): the aim is to capture the length of time for which people experienced housing difficulties. Only the most recent experience is considered. However, if somebody for a longer period of time, continuously experienced housing difficulties but during this period changed their place of stay (e.g. from emergency accommodation moved to a place not intended as a permanent home and following this was 'sleeping rough'), the total duration is counted. The duration is counted in months (e.g. 2 years = 24 months, 2 weeks = 0.5 months). If a person experienced housing difficulties for a period shorter than 2 weeks, the value should be rounded up to 2 weeks (0.5 months).
Main reason for past housing difficulties (OPTIONAL): the aim is to capture the main cause of past housing difficulties. Housing difficulties are a complex, multidimensional issue and often a consequence of multiple events. Nevertheless, people are asked to select the main reason for them, meaning the one which, in their opinion, was the most important factor. If the respondent is currently experiencing housing difficulties, then they should indicate the main reason for them.
Other reason for past housing difficulties (OPTIONAL): if a person is currently experiencing housing difficulties, they should indicate the second reason (if applicable) for them. The aim is to find out whether there was more than one reason for previous housing difficulties. In cases where more than two factors caused the housing difficulties, the respondent should indicate the factor they consider to be the second most important.
Exit from housing difficulties (OPTIONAL): the aim is to obtain information regarding what enabled the persons who experienced housing difficulties to get out of them. In general, there may be more than one reason; nevertheless, respondents are asked to select the most important reason, in their opinion. For some persons, it could be the first thing which was a stepping stone which led to escaping housing difficulties and for others it could be the last thing.

12
3. Availability of data
This module was implemented according to the Commission Regulation, which means that obligatory variables were collected in all countries bound to the SILC legislation. These data were also collected by the two EFTA countries (Norway and Switzerland), as well as the four EU candidate countries (Albania, North Macedonia, Montenegro and Serbia).
All countries collected and sent data for individual-level variables collected for persons aged 16 years and above (PW010T, PW230T, PW030T, PW120T, PW160T, PW100T, PPW040T, PW110T, PW190T, PW050T, PW060T, PW070T, PW080T, PW090T and PW240T) and for material deprivation at household level (HS070T, HS080T and HS100T). Regarding the EFTA countries, Norway collected the well-being and material deprivation variables and Switzerland collected all variables. From the EU candidate countries, Albania collected and submitted data for well-being and housing difficulties while North Macedonia, Montenegro and Serbia collected and submitted data on well-being only.
4. Analysis of the variables
The analysis below describes each variable modality and flag used by the countries. The guidelines detail the definitions of the variables, reference periods, reference age, and flags as described here EU-SILC 2018 operation (version July 2019).
4.1 Variables
HS070: Do you have a telephone (including mobile phone)?
Values
1 Yes
2 No - cannot afford
3 No - other reason
Table 1: HS070 - Descriptive statistics
HS070 Mean Std Dev
Yes 99.7 0.3
No - cannot afford 0.1 0.1
No - other reason 0.3 0.2
13
Main results
The most frequent answer was the first modality ‘yes’ with an average of 99.7 % and a standard deviation of 0.3. The lowest frequency of answer for the modality ‘yes’ was reported for Austria (99.1 %).
Groupings:
Three countries have recorded a share of 100 % for the first modality ‘yes’: Switzerland, Norway, and Denmark.
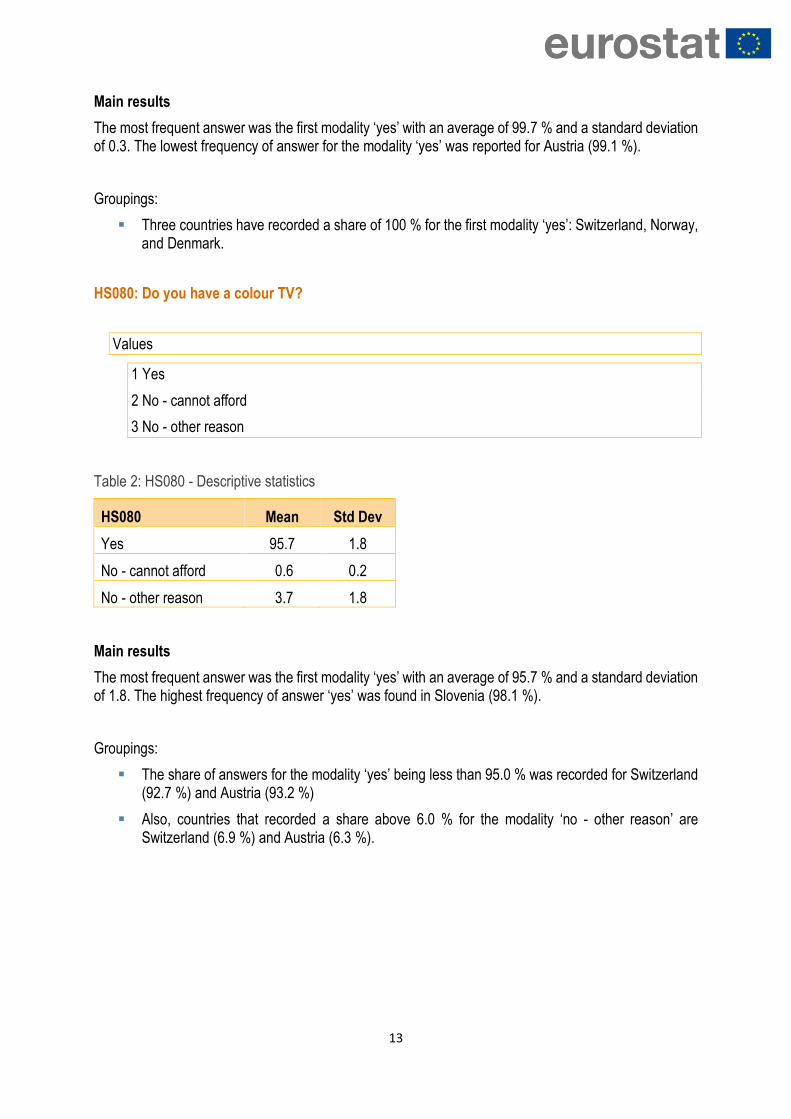
HS080: Do you have a colour TV?
Values
1 Yes
2 No - cannot afford
3 No - other reason
Table 2: HS080 - Descriptive statistics
HS080 Mean Std Dev
Yes 95.7 1.8
No - cannot afford 0.6 0.2
No - other reason 3.7 1.8
Main results
The most frequent answer was the first modality ‘yes’ with an average of 95.7 % and a standard deviation of 1.8. The highest frequency of answer ‘yes’ was found in Slovenia (98.1 %).
Groupings:
The share of answers for the modality ‘yes’ being less than 95.0 % was recorded for Switzerland (92.7 %) and Austria (93.2 %)
Also, countries that recorded a share above 6.0 % for the modality ‘no - other reason’ are Switzerland (6.9 %) and Austria (6.3 %).

14
HS100: Do you have a washing machine?
Values
1 Yes
2 No - cannot afford
3 No - other reason
Table 3: HS100 - Descriptive statistics
HS100 Mean Std Dev
Yes 97.5 2.5
No - cannot afford 0.6 0.6
No - other reason 1.9 1.9
Main results
The most frequent answer was the first modality ‘yes’ with an average of 97.5 % and a standard deviation of 2.5, while the least frequent answer, less than 1.0 %, was the answer modality ‘no - cannot afford’.
Groupings:
The highest frequency for the modality ‘yes’ was found in Switzerland (99.7 %) and the lowest in Belgium (92.9 %).
Countries that have recorded above 4 % of answer in modality ‘no - other reason’ are Belgium (5.4 %) and Denmark (4.1 %).
PW010T: Overall life satisfaction
Values
From 0 (Not at all satisfied) to 10 (Completely satisfied)
Do not know

15
Table 4: PW010T - Descriptive statistics
PW010T Mean Std Dev
0 1.0 0.8
1 0.7 0.6
2 1.7 1.6
3 3.1 2.7
4 3.9 3.1
5 11.7 5.9
6 9.6 3.8
7 17.2 3.2
8 26.3 8.1
9 12.9 6.0
10 11.0 6.2
Main results
The most frequent answer was found in the level of scale ‘8’ with an average of 26.3 % and a standard deviation of 8.1, while the least frequent answer, less than 1 % was found in the level ‘1’.
The disseminated data were presented by satisfaction categories according to these thresholds: 0-5 as ‘low’, 6-8 as ‘medium’ and 9 and 10 as ‘high’. The same classification was adopted for all other satisfaction items in this report.3
Groupings:
For most countries, the most common answer for this variable was the category ‘medium’ with the highest shares (above 65 %) recorded in the Netherlands, Belgium, as well in France and Italy, whereas the lowest shares within the same group were recorded in Bulgaria (33.7 %) and Serbia (41.9 %).
PW240T: Perceived social exclusion
Values
From 0 (Not at all satisfied) to 10 (Completely satisfied)
Do not know
3 This classification is based on a 20:60:20 distribution at European level for overall life satisfaction. That means having 20 % of answers in the lower part of
the scale, 60 % in the middle and 20 % in the higher part.

16
Table 5: PW240T - Descriptive statistics
PW240T Mean Std Dev
0 37.1 24.3
1 7.0 4.3
2 8.8 5.5
3 6.9 3.8
4 5.3 3.9
5 10.9 11.9
6 4.2 2.8
7 5.5 5.7
8 6.5 8.3
9 3.0 4.3
10 3.8 7.0
Main results
The most frequent answer was found in the first level of the scale ‘0’ with an average of 37.1 % and a standard deviation of 24.3, while the lowest frequency answer, less than 4 %, was found in the levels ‘9 and 10’.
Groupings:
The largest share for the group ‘high' was recorded for North Macedonia (10.4 %), Serbia (6.9 %), Hungary (5.6 %), Croatia (5.4 %) and Bulgaria (5.1 %).
The highest share within the group 'low’, for most countries (19 MS) were recorded as being greater than 80 %.
Sweden, Slovenia, Finland, and Denmark used ‘social inclusion’ rather than ‘social exclusion’, which may impact comparability. Additionally, Austria used a different scale (5-point vs 11).
PW040T: Material help
Values
1 Yes
2 No

17
Table 6: PW040T - Descriptive statistics
PW040T Mean Std Dev
Yes 80.6 7.2
No 19.4 7.2
Main results
The most frequent answer was the modality ‘yes’ with an average of 80.6 % and a standard deviation of 7.2.
Groupings:
The highest frequency of answer for the modality ‘yes’ was found in Sweden (92.1 %), Czechia (91.8 %) and Poland (91.5 %), while the highest frequency of answer for the modality ‘no’ was found in Albania (36.3 %) and North Macedonia (36.1 %).
PW110T: Non-material help
Values
1 Yes
2 No
Table 7: PW110T - Descriptive statistics
PW110T Mean Std Dev
Yes 90.5 6.2
No 9.5 6.2
Main results
The most frequent answer was the first modality ‘yes’ with an average of 90.5 % and a standard deviation of 6.2.
Groupings:
The highest frequency of answer above 20 % for the modality ‘no’ was found in Albania, North Macedonia and Bulgaria, while, the highest frequency of answer for modality ‘yes’ was found in Sweden and Finland.
18
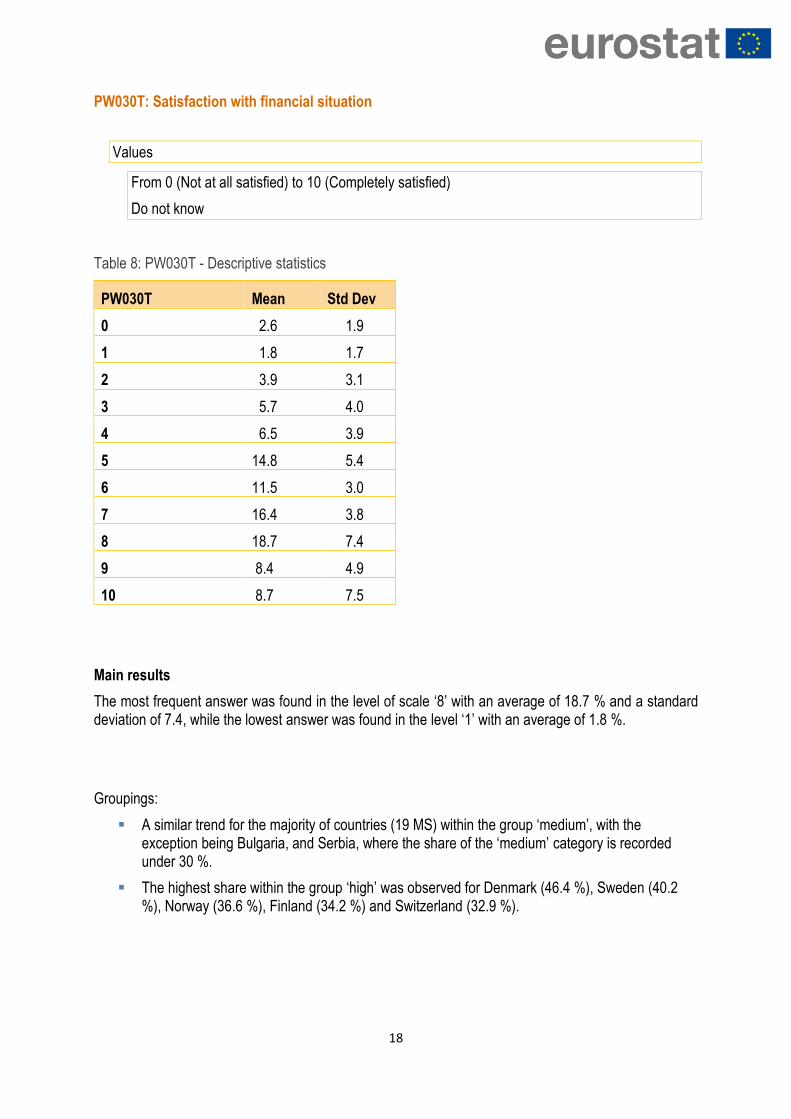
PW030T: Satisfaction with financial situation
Values
From 0 (Not at all satisfied) to 10 (Completely satisfied)
Do not know
Table 8: PW030T - Descriptive statistics
PW030T Mean Std Dev
0 2.6 1.9
1 1.8 1.7
2 3.9 3.1
3 5.7 4.0
4 6.5 3.9
5 14.8 5.4
6 11.5 3.0
7 16.4 3.8
8 18.7 7.4
9 8.4 4.9
10 8.7 7.5
Main results
The most frequent answer was found in the level of scale ‘8’ with an average of 18.7 % and a standard deviation of 7.4, while the lowest answer was found in the level ‘1’ with an average of 1.8 %.
Groupings:
A similar trend for the majority of countries (19 MS) within the group ‘medium’, with the exception being Bulgaria, and Serbia, where the share of the ‘medium’ category is recorded under 30 %.
The highest share within the group ‘high’ was observed for Denmark (46.4 %), Sweden (40.2 %), Norway (36.6 %), Finland (34.2 %) and Switzerland (32.9 %).

19
PW160T: Satisfaction with personal relationships
Values
From 0 (Not at all satisfied) to 10 (Completely satisfied)
Do not know
Table 9: PW160T - Descriptive statistics
PW160T Mean Std Dev
0 0.4 0.3
1 0.3 0.3
2 0.8 0.7
3 1.3 1.1
4 1.9 1.7
5 6.6 4.0
6 6.0 2.9
7 12.6 3.5
8 25.0 5.8
9 19.4 5.2
10 24.7 10.2
Main results
The most frequent answer was found in the level of scale ‘8’ with an average of 25.0 % and a standard deviation of 5.8 %, while the least frequent answer was found in the level ‘1’.
Groupings:
The highest share within the group ‘high’ was recorded for Malta, Austria, and Ireland while the lowest was recorded for Italy, followed by Bulgaria, and Romania. Furthermore, the mean value for the group ‘medium’ and ‘high’ showed only a small gap (i.e. less than 2 pp).

20
PW120T: Satisfaction with time use (amount of leisure time)
Values
From 0 (Not at all satisfied) to 10 (Completely satisfied)
Do not know
Table 10: PW120T - Descriptive statistics
PW120T Mean Std Dev
0 1.3 0.9
1 1.0 0.6
2 2.7 1.3
3 4.4 2.2
4 5.5 2.6
5 13.4 4.4
6 10.9 2.2
7 15.6 3.1
8 19.8 4.9
9 10.0 3.4
10 14.1 7.2
Main results
The most frequent answer was found in the level of scale ‘8’ with an average of 19.8 % and a standard deviation of 4.9, while the lowest was found in the levels ‘1 and 2’ (less than 2 %).
Groupings:
The majority of countries recorded the highest share within the group ‘medium’. The Netherlands, followed by Italy and Belgium exceeded 60 %, whereas the lowest share was found for Bulgaria, followed by Serbia and Greece.

21
PW100T: Satisfaction with job
Values
From 0 (Not at all satisfied) to 10 (Completely satisfied)
Do not know
Table 11: PW100T - Descriptive statistics
PW100T Mean Std Dev
0 0.7 0.4
1 0.6 0.4
2 1.5 1.0
3 2.6 2.0
4 3.8 2.9
5 10.3 4.8
6 10.3 3.3
7 18.0 2.7
8 25.3 6.0
9 14.0 4.8
10 12.1 5.2
Main results
The most frequent answer was found in the level of scale ‘8’ with an average of 25.3 % and a standard deviation of 6.0, while the lowest percentages (less than 4 %) were found in the levels ‘0 to 4’,.
Groupings:
Variation in the distribution of values within the group ‘medium’ was very small for the majority of countries regarding ‘satisfaction with job’.
The lowest share within the group ‘low’ was observed in Finland, followed by Switzerland, the Netherlands, Norway, Austria, and Belgium (10 % and below), whereas the highest share (above 30 %) within this group was found in Albania, Serbia, Bulgaria, North Macedonia and Greece.

22
PW190T: Trust in others
Values
From 0 (Not at all satisfied) to 10 (Completely satisfied)
Do not know
Table 12: PW190T - Descriptive statistics
PW190T Mean Std Dev
0 5.8 8.2
1 2.2 1.6
2 4.7 2.8
3 6.6 3.4
4 7.1 3.1
5 19.3 5.5
6 12.1 3.2
7 17.0 6.3
8 15.3 7.8
9 4.8 3.7
10 3.1 2.2
Main results
The most frequent answer was found in level ‘5’ with an average of 19.3 % and a standard deviation of 5.5, while the lowest was found in level ‘1’ with an average of 2.2 %.
Groupings:
The highest share within the group ‘medium’ was found for the Netherlands (77.3 %), while the highest share within the group ‘low’ (more than 80 %) was found in Cyprus. The mean value for the groups ‘medium’ and ‘low’ showed a small gap (i.e. 1 pp).

23
PW230T: Feeling lonely
Values
1 All of the time
2 Most of the time
3 Some of the time
4 A little of the time
5 None of the time
6 Do not know
Table 13: PW230T - Descriptive statistics
PW230T Mean Std Dev
All of the time 1.5 0.5
Most of the time 4.3 1.5
Some of the time 14.5 3.9
A little of the time 21.1 3.6
None of the time 57.0 8.8
Main results
The most frequent answer was the fifth modality ‘none of the time’ with an average of 57.0 % and a standard deviation of 8.8. The lowest frequency for the modality ‘all of the time’ was found with an average of 1.5 % and a standard deviation of 0.5.
Groupings:
The share of ‘none of the time’ answers exceeded 70 % in Cyprus, Norway, and Spain, whereas the share of ‘all of the time’ was greater than 2 % in Romania, Hungary, and Portugal.

24
PW050T: Being very nervous
Values
1 - All of the time
2 - Most of the time
3 - Some of the time
4 - A little of the time
5 - None of the time
6 - Do not know
Table 14: PW050T - Descriptive statistics
PW050T Mean Std Dev
All of the time 2.0 1.5
Most of the time 7.7 3.4
Some of the time 27.2 8.1
A little of the time 33.7 8.2
None of the time 27.9 13.7
Main results
The most frequent answer was the modality ‘a little of the time’ with an average of 33.7 % and a standard deviation of 8.2, while the lowest was found for the modality ‘all of the time’ with an average of 2.0 % and a standard deviation of 1.5.
Groupings:
The share of ‘none of the time’ answers in Norway and Ireland exceeded 60 %, whereas the share of ‘all of the time’ answers was greater than 7 % for both Portugal and France.

25
PW060T: Feeling down in the dumps
Values
1 - All of the time
2 - Most of the time
3 - Some of the time
4 - A little of the time
5 - None of the time
6 - Do not know
Table 15: PW060T - Descriptive statistics
PW060 Mean Std Dev
All of the time 1.2 0.7
Most of the time 5.2 2.4
Some of the time 20.0 7.5
A little of the time 29.2 7.3
None of the time 42.6 14.9
Main results
The most frequent answer was the modality ‘none of the time’ with an average of 42.6 % and a standard deviation of 14.9, while the lowest was found for the answer ‘all of the time’ with 1.2 % and a standard deviation of 0.7.
Groupings:
The share of ‘none of the time’ answers exceeded 60 % in Serbia, Switzerland, and Luxembourg, whereas the share of ‘all of the time’ answers was greater than 3 % for Portugal and France.

26
PW070T: Feeling calm and peaceful
Values
1 - All of the time
2 - Most of the time
3 - Some of the time
4 - A little of the time
5 - None of the time
6 - Do not know
Table 16: PW070T - Descriptive statistics
PW070 Mean Std Dev
All of the time 11.9 5.4
Most of the time 48.8 11.7
Some of the time 23.7 6.1
A little of the time 10.2 4.1
None of the time 3.9 9.4
Main results
The most frequent answer was the second modality ‘most of the time’ with an average 48.8 %, and a standard deviation of 11.7, while the least frequent answer was found for the modality ‘none of the time’ with an average 3.9 % and a standard deviation of 9.4.
Groupings:
The frequencies for the answers ‘most of the time’ exceeded more than 65 % in Finland, Poland, Germany and Austria, whereas the share of less than 4 % for ‘none of the time’ was found in Albania.

27
PW080T: Feeling downhearted or depressed
Values
1 - All of the time
2 - Most of the time
3 - Some of the time
4 - A little of the time
5 - None of the time
6 - Do not know
Table 17: PW080T - Descriptive statistics
PW080 Mean Std Dev
All of the time 1.2 0.9
Most of the time 5.5 5.1
Some of the time 18.4 8.0
A little of the time 28.0 8.0
None of the time 45.1 15.8
Main results
The most frequent answer was the fifth modality ‘none of the time’ with an average of 45.1 % and a standard deviation of 15.8, while the lowest was found for the modality ‘all of the time’ with an average of 1.2 % and standard deviation of 0.9.
Groupings:
The share of answers ‘none of the time’ exceeded more than 60 % in Norway, followed by Slovenia, and Serbia, whereas the share for ‘all of the time’ answers was greater than 2 % in Albania and Portugal.

28
PW090T: Being happy
Values
1 - All of the time
2 - Most of the time
3 - Some of the time
4 - A little of the time
5 - None of the time
6 - Do not know
Table 18: PW090T - Descriptive statistics
PW090 Mean Std Dev
All of the time 11.5 5.5
Most of the time 47.0 11.3
Some of the time 28.1 8.4
A little of the time 9.1 4.5
None of the time 2.2 1.4
Main results
The most frequent answer was the modality ‘most of the time’ with an average of 47.0 % and a standard deviation of 11.3. The lowest frequency was found for the modality ‘none of the time’ with an average of 2.2 % and a standard deviation of 1.4.
Groupings:
The share of ‘all of the time’ answers exceeded 17 % in Spain, Montenegro and Italy, whereas the share of ‘none of the time’ answers was greater than 4 % in Bulgaria, Greece and Latvia.

29
PHD01T: Past experience of housing difficulties
Values
1 - Yes, staying with friends and relatives temporarily
2 - Yes, staying in emergence or other temporary accommodation
3 - Yes, staying in place as not intended as a permanent home
4 - Yes, ‘sleeping rough’ or sleeping in public space
5 - No
Table 19: PHD01T- Descriptive statistics
Main results
The most frequent answer modality was ‘no’, with an average of 96.0 % and a standard deviation of 3.1, while the lowest share was found for the modality ‘yes, ‘sleeping rough’ or sleeping in public space’ with an average of 0.2 %.
Groupings:
The highest share of answers in the modality ‘no’ was found in Hungary (99.2 %), Albania (99.1 %) and Spain (98.3 %), while the highest share above 5.0 % within modality ‘yes, staying with friends and relatives temporarily’ was found in Denmark (9.9 %), Switzerland (7.3 %), and United Kingdom (5.5 %).
PHD01 Mean Std Dev
Yes, staying with friends and relatives temporarily 3.0 2.6
Yes, staying in emergence or other temporary accommodation 0.4 0.4
Yes, staying in place as not intended as a permanent home 0.4 0.3
Yes, ‘sleeping rough’ or sleeping in public space 0.2 0.1
No 96.0 3.1

30
PHD02T: Duration of the most recent experience of housing difficulties
Values
1 - Duration (number of months)
Table 20: PHD02T- Descriptive statistics4
PHD02 Mean Std Dev
up to 12 months (cumulative) 76.2 11.5
up to 24 months (cumulative) 11.5 5.8
more than 24 months (cumulative) 12.2 6.8
Main results
The most frequent answer on the duration of housing difficulties was within the first 12 months with an average above 75.0 % across the countries and standard deviation of 11.5. While for categories 13 to 24 months and more than 24 months the average was around (12.0 %) for each of these categories.
Groupings:
All countries followed this pattern except for Bulgaria, Spain and Slovakia where the duration of housing difficulties lasted longer than 12 months.
PHD03T: Main reason for past housing difficulties
Values
1 - Relationship or family problems
2 - Health problems
3 - Unemployment
4 - End of rental contract
5 - Uninhabitable accommodation
6 - Leaving an institution after a long stay and no home to go to
7 - Financial problems/Insufficient income
8 - Other
4 The variable PHD02 was collected on a continuous scale as it captures the length of time for which people experienced housing difficulties. Information on
the duration was transferred to Eurostat as a number of months (e.g. 2 years = 24 months, 2 weeks = 0.5 months). This resulted in up to 408 values. We
have collapsed the frequencies to 3 categories, i.e. up to 12 months, up to 24 months, more than 24 months duration of time.

31
Table 21: PHD03T - Descriptive statistics
PHD03 Mean Std Dev
Relationship or family problems 32.5 11.0
Health problems 3.1 1.5
Unemployment 6.6 5.3
End of rental contract 5.3 4.1
Uninhabitable accommodation 11.7 9.8
Leaving an institution after a long stay and no home to go to
1.6 1.5
Financial problems/Insufficient income 20.2 9.5
Other 20.7 9.0
Main results
The most frequent answer modality was ‘relationship or family problems’ with an average of 32.5 % and a standard deviation of 11.0, while the least frequent answer modality was ‘leaving an institution after a long stay and no home to go to’ with an average of 1.6 %.
Groupings:
The countries that recorded the highest share, i.e. above 45 % for the answer modality ‘relationship or family problems’ were Hungary and United Kingdom. The countries which recorded the highest share for the modality ‘leaving an institution after a long stay and no home to go’ were Hungary and Switzerland.
PHD04T: Other reason for past housing difficulties
Values
1 - Relationship or family problems
2 - Health problems
3 - Unemployment
4 - End of rental contract
5 - Uninhabitable accommodation
6 - Leaving an institution after a long stay and no home to go to
7 - Financial problems/Insufficient income
8 - Other
9 - No other reason

32
Table 22: PHD04T - Descriptive statistics
PHD04 Mean Std Dev
Relationship or family problems 9.9 7.6
Health problems 2.1 1.2
Unemployment 5.8 4.5
End of rental contract 2.2 2.1
Uninhabitable accommodation 4.1 5.6
Leaving an institution after a long stay and no home to go to
0.7 0.4
Financial problems/Insufficient income 15.7 12.9
Other 10.4 7.2
No other reason 54.3 26.6
Main results
The most frequent answer was for the modality ‘no other reason’ with an average of 54.3 % and a standard deviation of 26.6, while the lowest frequency was for the modality ‘leaving an institution after a long stay and no home to go to’ with an average of 0.7 %.
Groupings:
The highest share of answers above 70 % for the modality ‘no other reason’ was found in the United Kingdom (83.9 %), Portugal (82.2 %), Belgium (81.7 %) and Ireland (76.9 %). The highest share of answers for the modality ‘leaving an institution after a long stay and no home to go to’ was found in Romania and Hungary.
PHD05T: Exit from housing difficulties
Values
1 - Existing, new or renewed relationship with family or partner
2 - Addressed health problems
3 - Gained employment
4 - Moved into to social or subsided private housing
5 - Other
6 - Still experiencing housing difficulties

33
Table 23: PHD05T - Descriptive statistics
PHD05 Mean Std Dev
Existing, new, or renewed relationship with family or partner
22.0 12.0
Addressed health problems 2.0 2.0
Gained employment 18.0 9.0
Moved into to social or subsided private housing 14.0 10.0
Other 36.0 12.0
Still experiencing housing difficulties 8.0 7.0
Main results
The most frequent answer modality was ‘other’ with an average of 36.0 % and standard deviation of 12.0, while the least frequent answer modality was ‘addressed health problems’ with an average of 2.0 %.
Groupings:
The highest share of answers for the modality ‘other’ was found in Germany (61.9 %) and lowest share was in Albania (16.2 %).
4.2 Main points of the analysis of the frequencies
Six countries (Austria, Belgium, Denmark, Finland, Ireland and Slovenia) reported that more than 93 % of the population had access (by owning, renting or sharing with other households) to durables such as a telephone (including mobile phones), colour TV and washing machine. This was also true for the two EFTA countries: Norway and Switzerland.
Regarding the results on overall life satisfaction, on average, within the group ‘medium’, more than 50 % of the population across the participating countries declared that they were satisfied with life overall. The majority of people across the participating countries, on average 83.8 %, declared that they didn’t feel included in society (within the group ‘’low’’). Additionally, Finland, Sweden, Slovenia and Denmark used the term ‘inclusion’ and are therefore excluded from this measure. Also, France did not implement the recommended definition of exclusion and asked ‘How integrated do you feel in society?’, on a scale from 0 to 10. Moreover, Austria used a different scale (a 5-point scale, rather than 11) to measure social exclusion.
Almost half of the persons (46.6 %) across the participating countries reported being satisfied with their financial situation (within the group ‘medium’). Job satisfaction recorded slightly more than half (53.6 %) of people in the group ‘medium’. On average, 46.6 % of population across countries within the group ‘medium’ stated they were satisfied with how their time was used (amount of leisure time), while 43.6 % of the population were satisfied with their relationships.

34
Less than one tenth of the population (7.9 %) across the participating countries, had a ‘high’ trust in others, while 45.7 % of population reported ‘low’ trust in others.
For the data on material and non-material help, more than 80 % of the persons across the participating countries reported that they could receive material and non-material help from others, regardless of whether they needed it or not.
On average, more than half of the respondents (56.9 %), across the participating countries declared that they had been lonely ‘none of the time’.
Almost, one third (27.7 %) of persons across the participating countries declared that they had been nervous ‘none of the time’, and 42.6 % had felt down in the dumps ‘none of the time’. Moreover, 45.1 % of people across the participating countries reported that they were not downhearted or depressed.
Almost half of the respondents in the EU-27 countries declared that most of the time they felt happy (47.3 %), and calm and peaceful (50.5 %).
Most of the people (on average 96.0 %) in the following fifteen countries reported that they had not experienced housing difficulties in their lifetime (AL, BE, BG, CH, DE, DK, EL, ES, HU, IE, MT, PT, RO, SK, and UK).
It was observed that across the participating countries, people reported ‘relationship or family problems’ (32.5 %), and ‘financial problems/insufficient income’ (20.2 %) as the main reasons for housing difficulties.

35
5. Analysis of the questionnaires
This part of the report presents the qualitative analysis, i.e. the identification of possible deviations in the national questionnaires in general, and in the questions on well-being in particular.
Analysis of the implementation of the questions measuring psychological well-being shows that all countries used:
The reference period ‘current’ and ‘past four weeks’ as recommended in the guidelines.
Proxy interviews were not allowed for those questions and this was respected by all countries.
Most of the countries used the recommend modalities, except for six countries (BE, EE, ES, FI, FR, and SI), which did not have the answer ‘Do not know’ in their questionnaire.
Among the countries which used the option ‘Do not know’, Austria, Switzerland, Estonia and Norway reported a frequency of 0 percent for this modality.
Regarding the design of the questions for the variables PW050T, PW060T, PW070T, PW080T, PW090T and PW230, we can see slight variations in the way the countries asked about the frequency of the respondent’s feelings/emotions.
For the item PW240T (social exclusion), some countries used the term ‘social inclusion’ (e.g. Finland, Sweden, Slovenia, Denmark and France), while others used the term ‘social exclusion’. Moreover, Austria used a different scale to measure social exclusion.
The guidelines proposed asking ‘how much of the time over the past four weeks did you feel happy/lonely, depressed/nervous/calm and/or peaceful’. Some countries chose instead to use ‘how often did you feel happy/lonely, depressed/nervous/calm and/or peaceful’ (CH, IT, EE, ES, HR, HU, and PT) or ‘for how long did you feel happy/lonely, depressed/nervous/calm and/or peaceful’ (CY, LV, RO, and SI).
There are also slight variations in the type of modalities measuring the frequency in the national questionnaires. These differences can depend on the language translation, the cultural context and/or the implementing countries’ own interpretation. All this, and in combination with the fact that these questions are highly sensitive, can lead to a higher measurement error and a lesser degree of comparability.

36
6. Analysis of the flags
In this section, the flag variables used in the 2018 ad-hoc module on well-being, material deprivation, and household difficulties are analysed.
In the flag variables, several values were used: flag 1 (filled value), flag -1 (missing value), flag -2 (not applicable only for PW10T), flag -3 (not selected respondent) and -7 (for variables not implemented in ad-hoc modules). Data used for the analysis of the flags can be found in Annex 2: “Frequencies of flags 1, -1, -2, -3, and for each variable by country”.
HS070: Do you have a telephone (including mobile phone)? HS080: Do you have a colour TV? HS100: Do you have a washing machine?
PW010T: Overall life satisfaction PW240T: Perceived social exclusion PW030T: Satisfaction with financial situation PW160T: Satisfaction with personal relationship PW120T: Satisfaction with time use (amount of leisure time) PW040T: Material help PW110T: Non-material help PW190T: Trust in others PW230T: Felling lonely PW100T: Satisfaction with job
Flag value Flag name
1 Filled
-1 Missing
Flag value
Flag name
1 Filled
-1 Missing
-3 Not selected respondent
-7 Not applicable PB010 ≠2018
-8 Not applicable (variable not collected)

37
PW100T: Satisfaction with job
Flags for optional variables
PHD01T: Past experience of housing difficulties
PHD02T: Duration of the most recent experience of housing difficulties
PHD03T: Main reason for past housing difficulties
PHD04T: Other reason for past housing difficulties
PHD05T: Exit from housing difficulties
6.1 Flag -1 “Missing” This section analyses the flag -1 which is to be used when the variable is not filled, or the respective variable is missing. This is related with item non-response and presents the comparability among countries regarding the difficulties faced during implementation of this module.
The overall description of the list of non-response items is presented in the following tables and detailed for higher non-response by countries.
The “well-being” variables were collected for all countries and have the highest missing rates. In average, the “well-being” variables have percentages of missing values higher than 11 %. The “H” variables on material deprivation were collected from 8 countries (AT, BE, CH, DK, FI, IE, NO, and SI) and recorded the lowest percentage of missing values.
Flag value
Flag name
1 Filled
-1 Missing
-2 Not applicable if PL031 ≠ 1,2,3,4
-3 Not selected respondent
-7 Not applicable PB010 ≠2018
-8 Not applicable (variable not collected)
Flag value
Flag name
1 Filled
-1 Missing
-2 Not applicable PHD01T = NO
-3 Not selected respondent
-7 Not applicable PB010 ≠2018
-8 Not applicable (variable not collected)

38
The optional variables on ‘’housing difficulties’’ were implemented by 21 countries and recorded missing values between 6 and 7 %. The variables with the highest percentages of missing values are PW120, PW190, and PW240.
Table 20: Distribution of the missing values for each variable
Variables Percentage of missing values (%)
HS070 0.1
HS080 0.4
HS100 0.4
PW010T 12.3
PW240T 12.4
PW030T 11.7
PW160T 12.3
PW120T 12.4
PW100T 5.2
PW190T 12.4
PW230T 12.1
PW050T 12.1
PW060T 12.1
PW070T 12.1
PW080T 12.1
PW090T 12.1
PHD01T 7.4
PHD02T 6.0
PHD03T 7.0
PHD04T 7.6
PHD05T 6.5
39
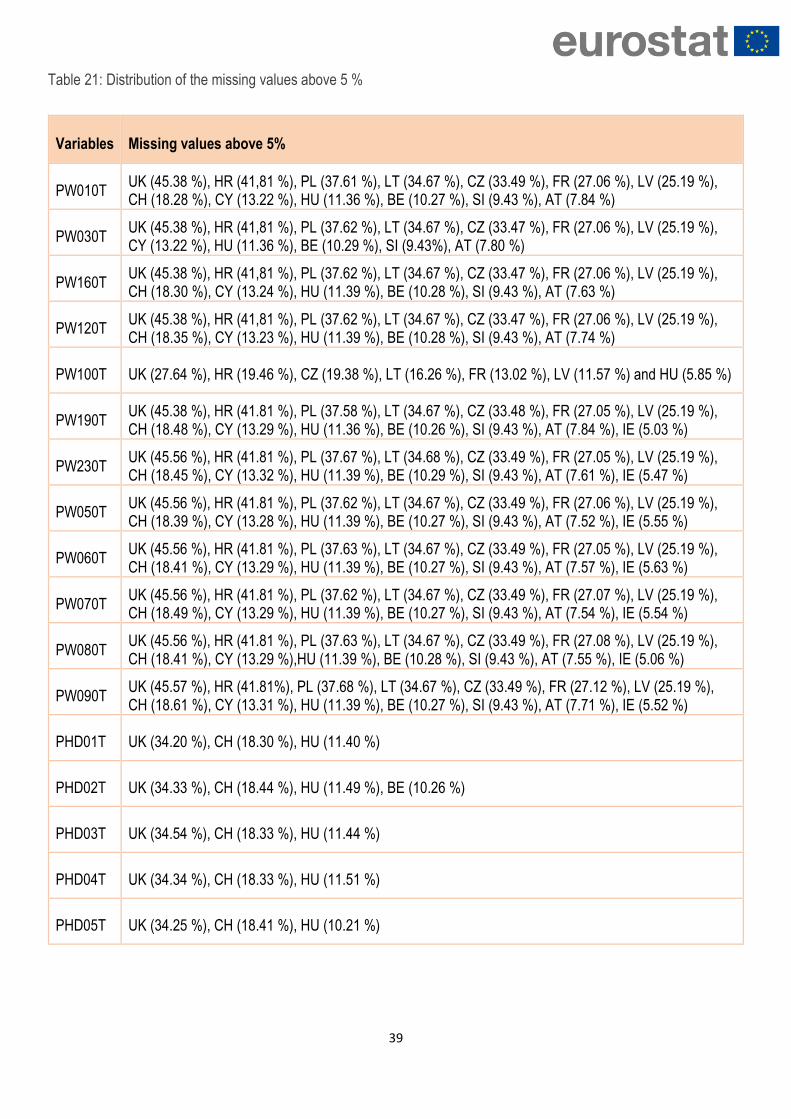
Table 21: Distribution of the missing values above 5 %
Variables Missing values above 5%
PW010T UK (45.38 %), HR (41,81 %), PL (37.61 %), LT (34.67 %), CZ (33.49 %), FR (27.06 %), LV (25.19 %), CH (18.28 %), CY (13.22 %), HU (11.36 %), BE (10.27 %), SI (9.43 %), AT (7.84 %)
PW030T UK (45.38 %), HR (41,81 %), PL (37.62 %), LT (34.67 %), CZ (33.47 %), FR (27.06 %), LV (25.19 %), CY (13.22 %), HU (11.36 %), BE (10.29 %), SI (9.43%), AT (7.80 %)
PW160T UK (45.38 %), HR (41,81 %), PL (37.62 %), LT (34.67 %), CZ (33.47 %), FR (27.06 %), LV (25.19 %), CH (18.30 %), CY (13.24 %), HU (11.39 %), BE (10.28 %), SI (9.43 %), AT (7.63 %)
PW120T UK (45.38 %), HR (41,81 %), PL (37.62 %), LT (34.67 %), CZ (33.47 %), FR (27.06 %), LV (25.19 %), CH (18.35 %), CY (13.23 %), HU (11.39 %), BE (10.28 %), SI (9.43 %), AT (7.74 %)
PW100T UK (27.64 %), HR (19.46 %), CZ (19.38 %), LT (16.26 %), FR (13.02 %), LV (11.57 %) and HU (5.85 %)
PW190T UK (45.38 %), HR (41.81 %), PL (37.58 %), LT (34.67 %), CZ (33.48 %), FR (27.05 %), LV (25.19 %), CH (18.48 %), CY (13.29 %), HU (11.36 %), BE (10.26 %), SI (9.43 %), AT (7.84 %), IE (5.03 %)
PW230T UK (45.56 %), HR (41.81 %), PL (37.67 %), LT (34.68 %), CZ (33.49 %), FR (27.05 %), LV (25.19 %), CH (18.45 %), CY (13.32 %), HU (11.39 %), BE (10.29 %), SI (9.43 %), AT (7.61 %), IE (5.47 %)
PW050T UK (45.56 %), HR (41.81 %), PL (37.62 %), LT (34.67 %), CZ (33.49 %), FR (27.06 %), LV (25.19 %), CH (18.39 %), CY (13.28 %), HU (11.39 %), BE (10.27 %), SI (9.43 %), AT (7.52 %), IE (5.55 %)
PW060T UK (45.56 %), HR (41.81 %), PL (37.63 %), LT (34.67 %), CZ (33.49 %), FR (27.05 %), LV (25.19 %), CH (18.41 %), CY (13.29 %), HU (11.39 %), BE (10.27 %), SI (9.43 %), AT (7.57 %), IE (5.63 %)
PW070T UK (45.56 %), HR (41.81 %), PL (37.62 %), LT (34.67 %), CZ (33.49 %), FR (27.07 %), LV (25.19 %), CH (18.49 %), CY (13.29 %), HU (11.39 %), BE (10.27 %), SI (9.43 %), AT (7.54 %), IE (5.54 %)
PW080T UK (45.56 %), HR (41.81 %), PL (37.63 %), LT (34.67 %), CZ (33.49 %), FR (27.08 %), LV (25.19 %), CH (18.41 %), CY (13.29 %),HU (11.39 %), BE (10.28 %), SI (9.43 %), AT (7.55 %), IE (5.06 %)
PW090T UK (45.57 %), HR (41.81%), PL (37.68 %), LT (34.67 %), CZ (33.49 %), FR (27.12 %), LV (25.19 %), CH (18.61 %), CY (13.31 %), HU (11.39 %), BE (10.27 %), SI (9.43 %), AT (7.71 %), IE (5.52 %)
PHD01T UK (34.20 %), CH (18.30 %), HU (11.40 %)
PHD02T UK (34.33 %), CH (18.44 %), HU (11.49 %), BE (10.26 %)
PHD03T UK (34.54 %), CH (18.33 %), HU (11.44 %)
PHD04T UK (34.34 %), CH (18.33 %), HU (11.51 %)
PHD05T UK (34.25 %), CH (18.41 %), HU (10.21 %)

40
Analyses
The UK and HR, recorded the highest missing values for all ‘P’ variables on well-being above 40 %.
CH, CY, and HU recorded missing values between 11 and 20 % for the ‘P’ variables.
The UK recorded the highest missing value above 25 % for variables PW100, while HR, LT, CZ, FR, and LV recorded between 11 - 20 %.
EE, RS, RO, and MK recorded no missing values for all ‘P’ variables, while RO, EL, and SK recorded no missing values for the optional variables:.
Missing values above 5 %
There are several countries that recorded more than 5 % of missing values for certain variables. These are:
The United Kingdom: PW010, PW030, PW120, PW160 (45.38 %), PW050, PW060, PW070, PW080, PW090 and PW230 (45.56 %), PW100 (27.64 %), PHD01 (34.20 %), PHD02 (34.33 %), PHD03 (34.54 %), PHD04 (34.34 %), PHD05 (34.25 %).
Croatia: PW010, PW030, PW120, PW160, PW050, PW060, PW070, PW080, PW090 and PW230 (41.81 %), and PW100 (19.46 %).
Poland: PW010 (37.61 %), PW030 (37.64 %), PW120 (37.62 %), PW160 (37.62 %), PW050 (37.62 %), PW060 (37.63 %), PW070 (37.61 %), PW080 (37.63 %), PW090 (37.68 %) and PW230 (37.67%).
Lithuania: PW010, PW030, PW120, PW160, PW050, PW060, PW070, PW080, PW090 (34.67 %), PW100 (16.26 %) and PW230 (34.68 %).
Czechia: PW010 (33.49 %), PW030 (33.48 %), PW120 (33.47 %) and PW160 (33.47 %), PW100 (19.38 %), and PW050, PW060, PW070, PW080, PW090, PW230 (33.49 %).
France: PW010 (27.06 %), PW030 (27.04 %), PW120 (27.06 %), PW160 (27.06 %), PW100 (13.02 %) and PW050 (27.06 %), PW060 (27.05 %), PW070 (27.07 %), PW080 (27.08 %), PW090 (27.12 %), PW230 (27.05 %).
Latvia: PW010, PW030, PW120, PW160, PW050, PW060, PW070, PW080, PW090, PW230 (25.19 %) and PW100 (11.57 %).
Switzerland: PW010 (18.28 %), PW120 (18.35 %), PW160 (18.30 %), and PW050 (18.39 %), PW060 (18.41 %), PW070 (18.49 %), PW080 (18.41 %), PW090 (18.61 %), PW230 (18.45 %), PHD01 (18.30 %), PHD02 (18.44 %), PHD03 and PHD04 (18.33 %) and PHD05 (18.41 %).
Hungary: PHD01 (11.40 %), PHD02 (11.49 %), PHD03 (11.44 %), HU (11.51 %) and PHD05 (10.21 %).

41
Table 22: Share of flag -1 (missing) for each variable of Module 2018 by country
% of flag -1 No. of
countries Countries
Compulsory adult items collected at household level:
HS070: Do you have a telephone (including mobile phone)?
0% 6 BE, CH, DK, IE, NO, SI
> 0 till .99 % 2 AT, FI
Between 1 and 10 %
Between 11 and 20 %
>= 25 %
HS080: Do you have a colour TV?
0% 3 AT, BE, SI
> 0 till .99 % 5 CH, DK, FI, IE, NO
Between 1 and 10 %
Between 11 and 20 %
>= 25 %
HS100: Do you have a computer?
0 % 2 BE, SI
> 0 till .99 % 6 AT, CH, DK, FI, IE, NO
Between 1 and 10 %
Between 11 and 20 %
>= 25 %
PW010T: Overall life satisfaction
0% 5 AL, EL, NL, ME, RO, RS, SK
> 0 till .99 % 8 DK, DE, NO, LU, BG, MK, PT, IT
Between 1 and 10 % 9 BE, SI, AT, IE, FI, ES, EE, MT, SE
Between 11 and 20 % 3 CH, CY, HU
>= 25 % 7 UK, HR, PL, LT, CZ, FR, LV
PW240T: Perceived social exclusion
0% 5 AL, EL, NL, ME, RO, RS, SK
> 0 till .99 % 8 NO, DK, DE, LU, BG, MK, PT, IT

42
% of flag -1 No. of
countries Countries
Between 1 and 10 % 9 BE, SI, AT, IE, FI, ES, EE, MT, ES, SE
Between 11 and 20 % 3 CH, CY, HU
>= 25 % 7 UK, HR, PL, LT, CZ, FR, LV
PW030T: Satisfaction with financial situation
0 % 5 AL, EL, NL, ME, RO, RS, SK
> 0 till .99 % 8 DK, NO, LU, BG, CH, MK, PT, IT
Between 1 and 10 % 10 BE, SI, AT, IE, FI, ES, EE, MT, DE, SE
Between 11 and 20 % 2 CY, HU
>= 25 % 7 UK, HR, PL, LT, CZ, FR, LV
PW160T: Satisfaction with personal relationships
0 % 5 AL, EL, NL, ME, RO, RS, SK
> 0 till .99 % 8 DK, DE, NO, LU, BG, MK, PT, IT
Between 1 and 10 % 9 BE, SI, AT, IE, FI, ES, EE, MT, SE
Between 11 and 20 % 3 CH, CY, HU
>= 25 % 7 UK, HR, PL, LT, CZ, FR, LV
PW120T: Satisfaction with time use (amount of leisure time)
0% 5 AL, EL, NL, ME, RO, RS, SK
> 0 till .99 % 8 DK, NO, LU, BG, MK, PT, IT
Between 1 and 10 % 9 BE, SI, AT, IE, FI, ES, EE, MT, SE, DE
Between 11 and 20 % 3 CH, CY, HU
>= 25 % 7 UK, HR, PL, LT, CZ, FR, LV
PW100T: Satisfaction with job
0 % 4 AL, EE, ME, MK, RO, RS
> 0 till .99 % 14 ES, DE, MT, DK, NL, SE, BG, NO, PL, LU, PT, EL, IT, SK
Between 1 and 10 % 8 HU, SI, CY, BE, AT, FI, IE, CH
Between 11 and 20 % 5 HR, LT, CZ, FR, LV
>= 25 % 1 UK
PW040T: Material help
0% 5 AL, EL, NL, ME, RO, RS, SK

43
% of flag -1 No. of
countries Countries
> 0 till .99 % 7 DK, NO, LU, BG, MK, PT, IT
Between 1 and 10 % 10 BE, SI, AT, IE, FI, ES, EE, MT, SE, DE
Between 11 and 20 % 3 CH, CY, HU
>= 25 % 7 UK, HR, PL, LT, CZ, FR, LV
PW110T: Non-material help
0 % 3 AL, EL, ME, RO, RS
> 0 till .99 % 9 NL, DK, ES, IT, NO, DE, BG, PT, MK
Between 1 and 10 % 10 BE, SI, AT, MT, IE, FI, EE, SK, LU, SE
Between 11 and 20 % 3 CH, CY, HU
>= 25 % 7 HR, UK, PL, LT, CZ, FR, LV
PW190T: Trust in others
0% 5 AL, EL, NL, ME, RO, RS, SK
> 0 till .99 % 8 NO, DK, DE, LU, BG, MK, PT, IT
Between 1 and 10 % 9 BE, SI, AT, IE, FI, EE, MT, ES, SE
Between 11 and 20 % 3 CH, CY, HU
>= 25 % 7 UK, HR, PL, LT, CZ, FR, LV
PW230T: Feeling lonely
0% 4 AL, EL, NL, ME, RO, RS
> 0 till .99 % 7 DK, NO, LU, BG, MK, PT
Between 1 and 10 % 11 BE, SI, AT, IE, FI, IT, SK, ES, EE, MT, SE, DE
Between 11 and 20 % 3 CH, CY, HU
>= 25 % 7 UK, HR, PL, LT, CZ, FR, LV
Compulsory adult items collected at individual level:
PW050T: Being very nervous
0 % 4 AL, EL, NL, ME, RO, RS
> 0 till .99 % 6 DK, NO, LU, BG, MK, PT
Between 1 and 10 % 12 BE, SI, AT, IE, FI, IT, SK, ES, EE, MT, SE, DE
Between 11 and 20 % 3 CH, CY, HU
>= 25 % 7 UK, HR, PL, LT, CZ, FR, LV

44
% of flag -1 No. of
countries Countries
PW060T: Feeling down in the dumps
0 % 4 AL, EL, NL, ME, RO, RS
> 0 till .99 % 6 DK, NO, LU, BG, MK, PT
Between 1 and 10 % 12 BE, SI, AT, IE, FI, IT, SK, ES, EE, MT, SE, DE
Between 11 and 20 % 3 CH, CY, HU
>= 25 % 7 UK, HR, PL, LT, CZ, FR, LV
PW070T: Feeling calm and peaceful
0 % 4 AL, EL, NL, ME, RO, RS
> 0 till .99 % 6 DK, NO, LU, BG, MK, PT
Between 1 and 10 % 12 BE, SI, AT, IE, FI, IT, SK, ES, EE, MT, SE, DE
Between 11 and 20 % 3 CH, CY, HU
>= 25 % 7 UK, HR, PL, LT, CZ, FR, LV
PW080T: Feeling downhearted or depressed
0 % 4 AL, EL, NL, ME, RO, RS
> 0 till .99 % 6 DK, NO, LU, BG, MK, PT
Between 1 and 10 % 12 BE, SI, AT, IE, FI, IT, SK, ES, EE, MT, SE, DE
Between 11 and 20 % 3 CH, CY, HU
>= 25 % 7 UK, HR, PL, LT, CZ, FR, LV
PW090T: Being happy
0 % 4 AL, EL, NL, ME, RO, RS
> 0 till .99 % 6 DK, NO, LU, BG, MK, PT
Between 1 and 10 % 12 BE, SI, AT, IE, FI, IT, SK, ES, EE, MT, SE, DE
Between 11 and 20 % 3 CH, CY, HU
>= 25 % 7 UK, HR, PL, LT, CZ, FR, LV
Housing difficulties variables (OPTIONAL)
PHD01T: Past experience of housing difficulties
0 % 3 AL, EL, SK, RO
> 0 till .99 % 6 ES, PT, BG, DE, MT, DK
Between 1 and 10 % 2 IE, BE

45
% of flag -1 No. of
countries Countries
Between 11 and 20 % 2 CH, HU
>= 25 % 1 UK
PHD02T: Duration of the most recent experience of housing difficulties
0 % 1 AL, RO
> 0 till .99 % 8 EL, PT, ES, SK, IE, BG, DE, MT
Between 1 and 10 % 2 BE, DK
Between 11 and 20 % 2 CH, HU
>= 25 % 1 UK
PHD03T: Main reason for past housing difficulties
0 % 3 AL, SK, RO, PT
> 0 till .99 % 7 EL, IE, ES, BG, DE, MT, DK
Between 1 and 10 % 1 BE
Between 11 and 20 % 2 CH, HU
>= 25 % 1 UK
PHD04T: Other reason for past housing difficulties
0 % 3 AL, SK, RO, PT
> 0 till .99 % 6 EL, IE, ES, BG, DE, MT
Between 1 and 10 % 1 BE
Between 11 and 20 % 2 CH, HU
>= 25 % 1 UK
PHD05T: Exit from housing difficulties
0 % 3 AL, SK, RO, PT
> 0 till .99 % 6 EL, IE, ES, BG, DE, MT
Between 1 and 10 % 1 BE
Between 11 and 20 % 2 CH, HU
>= 25 % 1 UK

46
6.2 Flag -2 “Not applicable if not performed any working task in PL031”
The flag -2 was applied only for variable PW100T:
The flag of the respective variable takes the code “-2” if respondents declared that they had not performed any
job in PL031.
Table 23: Share of flag -2 (not applicable) for each variables of Module 2018 by country
% of flag -2 No. of countries
Countries
PW010T: Overall life satisfaction
0 %
> 0 till .99 %
Between 1 and 10 %
Between 11 and 24 %
>= 25 % 1 IT
PW240T: Perceived social exclusion
0 %
> 0 till .99 %
Between 1 and 10 %
Between 11 and 24 %
>= 25 % 1 IT
PW030T: Satisfaction with financial situation
0 %
> 0 till .99 %
Between 1 and 10 %
Between 11 and 24 %
>= 25 % 1 IT
PW160T: Satisfaction with personal relationships
0 %
> 0 till .99 %
Between 1 and 10 %
Between 11 and 24 %
>= 25 % 1 IT

47
% of flag -2 No. of countries
Countries
PW120T: Satisfaction with time use (amount of leisure time)
0 %
> 0 till .99 %
Between 1 and 10 %
Between 11 and 24 %
>= 25 % 1 IT
PW100T: Satisfaction with job
0 %
> 0 till .99 %
Between 1 and 10 %
Between 11 and 24 % 3 FI, NO, SE
>= 25 % 29 AT, BE, BG, CH, CY, CZ, DE, DK, EE, EL, ES, FR, HR, HU, IE, IT, LT, LU, LV, MK, MT, NL, PL, PT, RO, RS, SI, SK, UK
PW040T: Material help
0 %
> 0 till .99 %
Between 1 and 10 %
Between 11 and 24 %
>= 25 % 1 IT
PW110T: Non-material help
0 %
> 0 till .99 %
Between 1 and 10 %
Between 11 and 24 %
>= 25 % 1 IT
PW190T: Trust in others
0 %
> 0 till .99 %
Between 1 and 10 %
Between 11 and 24 %

48
% of flag -2 No. of countries
Countries
>= 25 % 1 IT
PW230T: Feeling lonely
0 %
> 0 till .99 %
Between 1 and 10 %
Between 11 and 24 %
>= 25 % 1 IT
Compulsory adult items collected at individual level:
PW050T: Being very nervous
0 %
> 0 till .99 %
Between 1 and 10 %
Between 11 and 24 %
>= 25 % 1 IT
PW060T: Feeling down in the dumps
0 %
> 0 till .99 %
Between 1 and 10 %
Between 11 and 24 %
>= 25 % 1 IT
PW070T: Feeling calm and peaceful
0 %
> 0 till .99 %
Between 1 and 10 %
Between 11 and 24 %
>= 25 % 1 IT
PW080T: Feeling downhearted or depressed
0 %
> 0 till .99 %
Between 1 and 10 %

49
% of flag -2 No. of countries
Countries
Between 11 and 24 %
>= 25 % 1 IT
PW090T: Being happy
0 %
> 0 till .99 %
Between 1 and 10 %
Between 11 and 24 %
>= 25 % 1 IT
PHD01T: Past experience of housing difficulties (OPTIONAL)
Countries not implemented
0%
> 0 till .99 %
Between 1 and 10 %
Between 11 and 24 %
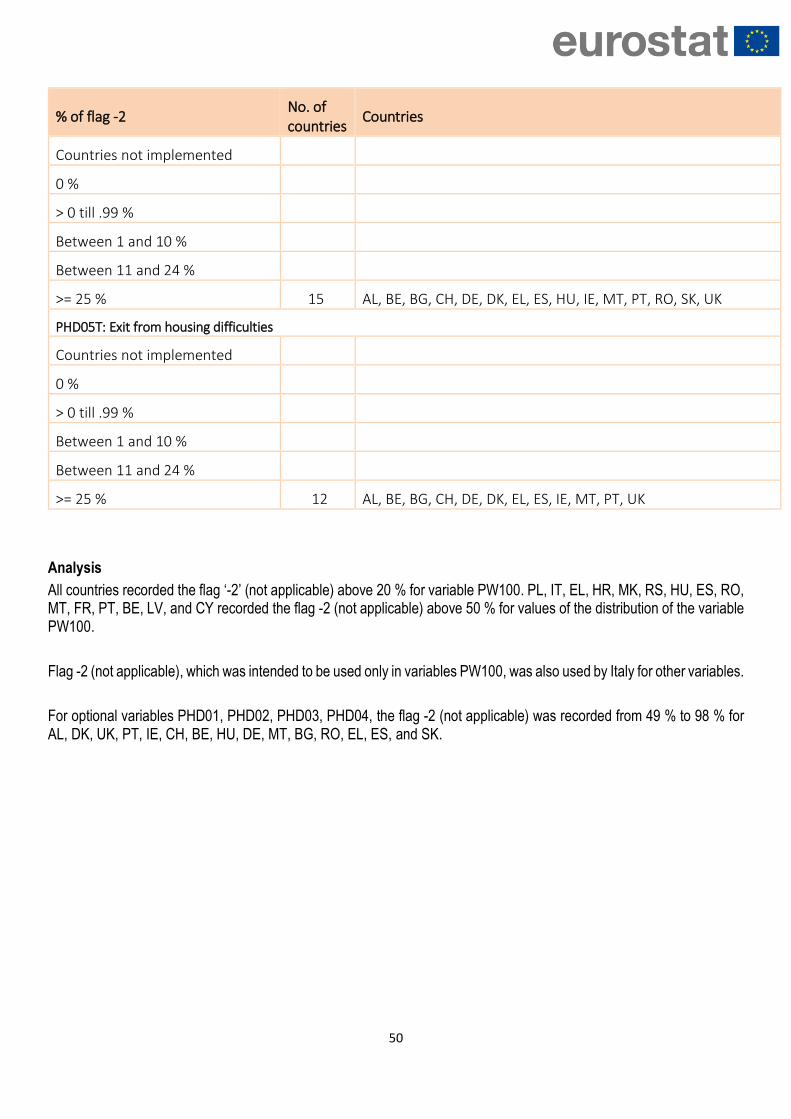
>= 25 % 15 AL, BE, BG, CH, DE, DK, EL, ES, HU, IE, MT, PT, RO, SK, UK
PHD02T: Duration of the most recent experience of housing difficulties
Countries not implemented
0 %
> 0 till .99 %
Between 1 and 10 %
Between 11 and 24 %
>= 25 % 15 AL, BE, BG, CH, DE, DK, EL, ES, HU, IE, MT, PT, RO, SK, UK
PHD03T: Main reason for past housing difficulties
Countries not implemented
0 %
> 0 till .99 %
Between 1 and 10 %
Between 11 and 24 %
>= 25 % 15 AL, BE, BG, CH, DE, DK, EL, ES, HU, IE, MT, PT, RO, SK, UK
PHD04T: Other reason for past housing difficulties
50
% of flag -2 No. of countries
Countries
Countries not implemented
0 %
> 0 till .99 %
Between 1 and 10 %
Between 11 and 24 %
>= 25 % 15 AL, BE, BG, CH, DE, DK, EL, ES, HU, IE, MT, PT, RO, SK, UK
PHD05T: Exit from housing difficulties
Countries not implemented
0 %
> 0 till .99 %
Between 1 and 10 %
Between 11 and 24 %
>= 25 % 12 AL, BE, BG, CH, DE, DK, EL, ES, IE, MT, PT, UK
Analysis
All countries recorded the flag ‘-2’ (not applicable) above 20 % for variable PW100. PL, IT, EL, HR, MK, RS, HU, ES, RO, MT, FR, PT, BE, LV, and CY recorded the flag -2 (not applicable) above 50 % for values of the distribution of the variable PW100.
Flag -2 (not applicable), which was intended to be used only in variables PW100, was also used by Italy for other variables.
For optional variables PHD01, PHD02, PHD03, PHD04, the flag -2 (not applicable) was recorded from 49 % to 98 % for AL, DK, UK, PT, IE, CH, BE, HU, DE, MT, BG, RO, EL, ES, and SK.

51
6.3 Flag -3 “Non-selected respondent”
The flag -3 was used in the variables collected at personal level and was used only by the selected respondent countries.
Table 24: Share of flag -3, Non-selected respondent
% of flag -3 No. of countries
Countries
PW010T: Overall life satisfaction
0 %
> 0 till .99 %
Between 1 and 10 % 1 RS
Between 11 and 20 %
>= 25 % 7 DK, FI, NL, NO, PT, SE, SI
PW240T: Perceived social exclusion
0 %
> 0 till .99 %
Between 1 and 10 % 1 RS
Between 11 and 20 %
>= 25 % 7 DK, FI, NL, NO, PT, SE, SI
PW030T: Satisfaction with financial situation
0 %
> 0 till .99 %
Between 1 and 10 % 1 RS
Between 11 and 20 %
>= 25 % 7 DK, FI, NL, NO, PT, SE, SI
PW160T: Satisfaction with personal relationships
0 %
> 0 till .99 %
Between 1 and 10 % 1 RS
Between 11 and 20 %
>= 25 % 7 DK, FI, NL, NO, PT, SE, SI

52
% of flag -3 No. of countries
Countries
PW120T: Satisfaction with time use (amount of leisure time)
0 %
> 0 till .99 %
Between 1 and 10 % 1 RS
Between 11 and 20 %
>= 25 % 7 DK, FI, NL, NO, PT, SE, SI
PW100T: Satisfaction with job
0%
> 0 till .99 % 1 RS
Between 1 and 10 %
Between 11 and 20 % 7 DK, FI, NL, NO, PT, SE, SI
>= 25 %
PW040T: Material help
0 %
> 0 till .99 %
Between 1 and 10 % 1 RS
Between 11 and 20 %
>= 25 % 7 DK, FI, NL, NO, PT, SE, SI
PW110T: Non-material help
0 %
> 0 till .99 %
Between 1 and 10 % 1 RS
Between 11 and 20 %
>= 25 % 7 DK, FI, NL, NO, PT, SE, SI
PW190T: Trust in others
0%
> 0 till .99 %
Between 1 and 10 % 1 RS
Between 11 and 20 %

53
% of flag -3 No. of countries
Countries
>= 25 % 7 DK, FI, NL, NO, PT, SE, SI
PW230T: Feeling lonely
0 %
> 0 till .99 %
Between 1 and 10 % 1 RS
Between 11 and 20 %
>= 25 % 7 DK, FI, NL, NO, PT, SE, SI
Compulsory adult items collected at individual level:
PW050T: Being very nervous
0%
> 0 till .99 %
Between 1 and 10 % 1 RS
Between 11 and 20 %
>= 25 % 7 DK, FI, NL, NO, PT, SE, SI
PW060T: Feeling down in the dumps
0 %
> 0 till .99 %
Between 1 and 10 % 1 RS
Between 11 and 20 %
>= 25 % 7 DK, FI, NL, NO, PT, SE, SI
PW070T: Feeling calm and peaceful
0 %
> 0 till .99 %
Between 1 and 10 % 1 RS
Between 11 and 20 %
>= 25 % 7 DK, FI, NL, NO, PT, SE, SI
PW080T: Feeling downhearted or depressed
0 %
> 0 till .99 %

54
% of flag -3 No. of countries
Countries
Between 1 and 10 % 1 RS
Between 11 and 20 %
>= 25 % 7 DK, FI, NL, NO, PT, SE, SI
PW090T: Being happy
0 %
> 0 till .99 %
Between 1 and 10 % 1 RS
Between 11 and 20 %
>= 25 % 7 DK, FI, NL, NO, PT, SE, SI
PHD01T: Past experience of housing difficulties (OPTIONAL)
Countries not implemented
0 %
> 0 till .99 %
Between 1 and 10 %
Between 11 and 20 %
>= 25 % 2 DK, PT
PHD02T: Duration of the most recent experience of housing difficulties
Countries not implemented
0 %
> 0 till .99 %
Between 1 and 10 %
Between 11 and 20 %
>= 25 % 2 DK, PT
PHD03T: Main reason for past housing difficulties
Countries not implemented
0 %
> 0 till .99 %
Between 1 and 10 %
Between 11 and 20 %

55
% of flag -3 No. of countries
Countries
>= 25 % 2 DK, PT
PHD04T: Other reason for past housing difficulties
Countries not implemented
0 %
> 0 till .99 %
Between 1 and 10 %
Between 11 and 20 %
>= 25 % 1 PT
PHD05T: Exit from housing difficulties
Countries not implemented
0 %
> 0 till .99 %
Between 1 and 10 %
Between 11 and 20 %
>= 25 % 1 PT
Analysis
DK, FI, NL, NO, SE, and SI recorded a high value of flag -3 (not selected respondent) as these countries used the selected respondent model. Also, PT and RS applied flag -3 above 10 %.
The share of non-selected respondents for the variables PW010, PW240, PW030, PW160, PW120, PW100, PW050, PW060, PW070, PW080, PW090, PW190, PW040, PW110, and PW230, are reported over 40 % for DK (43.77 %), FI (48.86 %), NL (45.95%), NO (48.59 %), and SE (48.87 %).
For the optional variables PHD01, PHD02, PHD03, flag -3 (not selected respondent) was applied from 31 % to 37 % for Denmark, Ireland and Portugal, while Denmark did not collect variables PHD04 and PHD05.

56
6.4 Flag -8 “Not collected information”
The flag -8 was used by countries which did not collect optional variables.
Table 25: Share of flag -8 (Not collected information)
% of flag -8 No. of countries
Countries which did not implement optional variables
PHD01T: Past experience of housing difficulties 19 AT, CY, CZ, EE, FI, FR, HR, IT, LT, LU, LV, ME, MK, NL, NO, PL, SE, SI, RS
PHD02T: Duration of the most recent experience of housing difficulties
19 AT, CY, CZ, EE, FI, FR, HR, IT, LT, LU, LV, ME, MK, NL, NO, PL, SE, SI, RS
PHD03T: Main reason for past housing difficulties 19 AT, CY, CZ, EE, FI, FR, HR, IT, LT, LU, LV, ME, MK, NL, NO, PL, SE, SI, RS
PHD04T: Other reason for past housing difficulties
19 AT, CY, CZ, EE, FI, FR, HR, IT, LT, LU, LV, ME, MK, NL, NO, PL, SE, SI, RS
PHD05T: Exit from housing difficulties 19 AT, CY, CZ, EE, FI, FR, HR, IT, LT, LU, LV, ME, MK, NL, NO, PL, SE, SI, RS
Analysis
In total, nineteen countries did not collect optional variables for ‘’Housing Difficulties”. Flag -8 (not collected information) was used by Cyprus, Czechia, Estonia, Finland, Luxembourg, Latvia, Netherland, Norway, Poland, Sweden, and Slovenia.
Austria, Croatia, France, Italy, and North Macedonia did not implement those optional variables and did not used flag -8. Serbia used flag -1 instead of using flag -8.

57
7. Conclusion
The countries which collected material deprivation variables (HS070, HS080, and HS100) showed the same trend for the value distributions.
The highest rate of missing values was observed for the variables measuring well-being, i.e. 25 % and above. These are reported for the United Kingdom, Croatia, Poland, Lithuania, Czechia, France, and Latvia, while for Switzerland, Cyprus, and Hungary it was between 11-19 %. Additionally, the level of item non-response was similar across items measuring psychological well-being in module AHM 2018, except for the item ‘satisfaction with the job’ (PW100T).
For 59 % of respondents in Albania, Hungary, Greece and Italy in variable PW100T was used the flag -2. Italy used flag -2 also for other well-being variables.
For item PW240T (Social Exclusion), some countries used the term ‘social inclusion’ (e.g. Finland, Sweden, Slovenia, Denmark), while others used the term ‘social exclusion’. Moreover, Austria used a different scale to measure social exclusion, on a 5 point scale rather than an 11 point scale.
For items PW050T, PW060T, PW070T, PW080T, PW090T, and PW230T, some countries used different expressions for modalities. The data indicates that countries faced difficulties to collect those variables following the guidelines in the regulation.
Proxies were not applied by countries for subjective items in AHM 2018. Flag -3 should be used only by countries using the selected respondent model. All Nordic countries (Sweden (SE), Finland (FI), Norway (NO), Denmark (DK)), and Slovenia (SI) used the flag -3 (not selected respondent) with a rate between 40 to 50 %. Two countries (Portugal and Serbia) used flag -3, which seems to be an error.
The answers for the modality “Do not know” are examined separately, since they do not provide a definite subjective opinion of the respondent. Such answers are also excluded from every statistical analysis performed on the module items. The share of “Do not know” answers by country and module item is small and generally homogenous (below 2 %), with the exception of BG, SK, LT, ES, and RO, where the share of answer “Do not know” is between 4-9 %.
Some countries (Austria, Croatia, France, Italy, Lithuania, and North Macedonia) did not collect optional variables and did not use flag -8.

58
8. Annexes
Annex 1: Distribution of 'filled' values for each variable
8.1 Distribution of filled values for each variable and country
HS070 AT BE CH DK FI IE NO SI
1. Yes 99.2 99.4 100.0 100.0 99.9 99.4 100.0 99.8
2. No - cannot afford 0.1 0.2 , , 0.0 0.3 , 0.1
3. No - other reason 0.7 0.4 , , 0.1 0.3 , 0.1
HS080AT BE CH DK FI IE NO SI
1. Yes 93.3 96.8 92.7 96.2 96.5 97.0 95.2 98.1
2. No - cannot 0.4 0.8 0.4 0.8 0.5 0.6 0.9 0.4
3. No - other reason 6.3 2.4 6.9 2.9 3.0 2.5 3.9 1.5
HS100 AT BE CH DK FI IE NO SI
1. Yes 98.3 93.0 99.8 94.4 98.5 97.8 99.2 99.2
2. No - cannot 0.3 1.6 0.0 1.5 0.4 0.6 0.1 0.3
3. No - other reason 1.4 5.4 0.2 4.2 1.2 1.7 0.7 0.6

59
PW010T: Overall life satisfaction
AL AT BE BG CH CY CZ DE DK EE EL ES FI FR HR HU IE IT LT LU LV ME MK MT NL NO PL PT RO RS SE SI SK UK
0 0.3 0.3 0.3 3.2 0.4 1.4 0.6 0.8 0.9 0.6 2.1 0.5 0.2 0.5 2.7 1.1 0.3 0.9 2.3 0.7 0.7 1.1 3.1 0.8 0.3 0.4 0.2 2.3 0.7 1.3 0.6 1.1 1.3 0.8
1 0.7 0.1 0.2 2.8 0.1 0.4 0.4 0.7 0.5 0.4 0.7 0.5 0.1 0.2 1.4 0.7 0.3 0.4 1.1 0.3 0.6 2.2 1.6 0.5 0.3 0.3 0.3 1.1 0.3 2.3 0.6 0.6 0.7 0.5
2 5.3 0.3 0.6 6.6 0.4 1.2 1.0 1.3 1.4 0.9 1.7 1.0 0.2 0.6 3.9 2.1 0.7 0.8 3.1 0.6 1.5 4.0 5.0 0.9 0.5 0.3 0.6 2.6 1.2 3.7 0.6 0.8 2.7 0.9
3 10.1 0.7 0.9 10.3 0.6 2.4 2.0 2.3 1.9 2.6 3.2 1.5 0.4 1.6 5.8 5.1 1.2 1.8 5.4 1.0 3.9 6.3 6.8 1.3 0.9 0.9 1.1 3.6 1.9 9.0 0.9 2.1 2.9 1.4
4 13.1 1.2 1.6 12.7 0.9 2.9 2.5 2.8 2.3 3.3 5.2 2.3 0.8 2.8 5.2 7.0 1.7 4.2 6.3 1.4 5.0 5.6 5.5 2.0 1.3 1.6 1.7 4.0 3.4 11.3 1.5 2.4 3.6 2.3
5 22.9 6.2 5.6 19.6 4.5 12.1 13.8 8.4 6.1 13.9 14.9 9.3 2.9 9.5 19.7 18.1 5.7 8.1 18.6 8.0 17.2 14.3 20.9 9.0 3.2 5.6 9.8 19.1 7.5 23.3 6.0 13.1 14.4 6.9
6 17.6 4.9 7.5 11.8 4.3 10.4 8.8 7.9 6.1 11.2 19.6 9.8 3.0 10.2 11.0 15.1 6.1 14.5 11.5 7.2 14.3 11.6 10.8 7.4 7.0 5.2 8.1 9.6 9.3 14.8 5.1 10.2 9.4 6.3
7 16.2 13.3 20.2 11.6 13.9 19.2 16.7 16.5 13.0 19.5 18.8 20.1 12.2 22.7 16.2 19.2 11.6 25.6 16.9 19.4 21.0 18.6 18.5 17.8 21.4 14.5 15.9 15.3 18.7 14.7 17.2 18.9 13.6 16.1
8 9.8 32.3 42.5 10.3 33.5 27.3 27.1 29.8 23.8 25.2 19.1 30.7 37.6 33.1 18.6 20.5 28.2 25.8 18.2 34.8 21.1 19.0 13.8 33.0 41.8 31.0 28.0 23.6 29.9 12.3 30.7 29.0 21.2 30.3
9 3.2 20.5 15.7 4.6 20.2 13.6 14.2 16.9 18.0 9.7 8.3 15.5 31.7 11.4 7.0 6.8 18.9 8.1 7.7 16.1 6.9 6.3 5.0 14.5 15.8 18.6 17.3 8.9 15.5 4.8 15.4 11.6 10.6 18.1
10 0.8 20.3 4.8 3.7 21.0 9.1 12.2 11.6 25.4 7.9 5.9 8.7 10.5 6.9 7.7 4.2 24.5 8.5 7.8 10.6 6.5 10.9 7.1 12.3 7.1 21.6 16.7 9.4 8.0 2.5 20.6 10.0 13.9 16.2
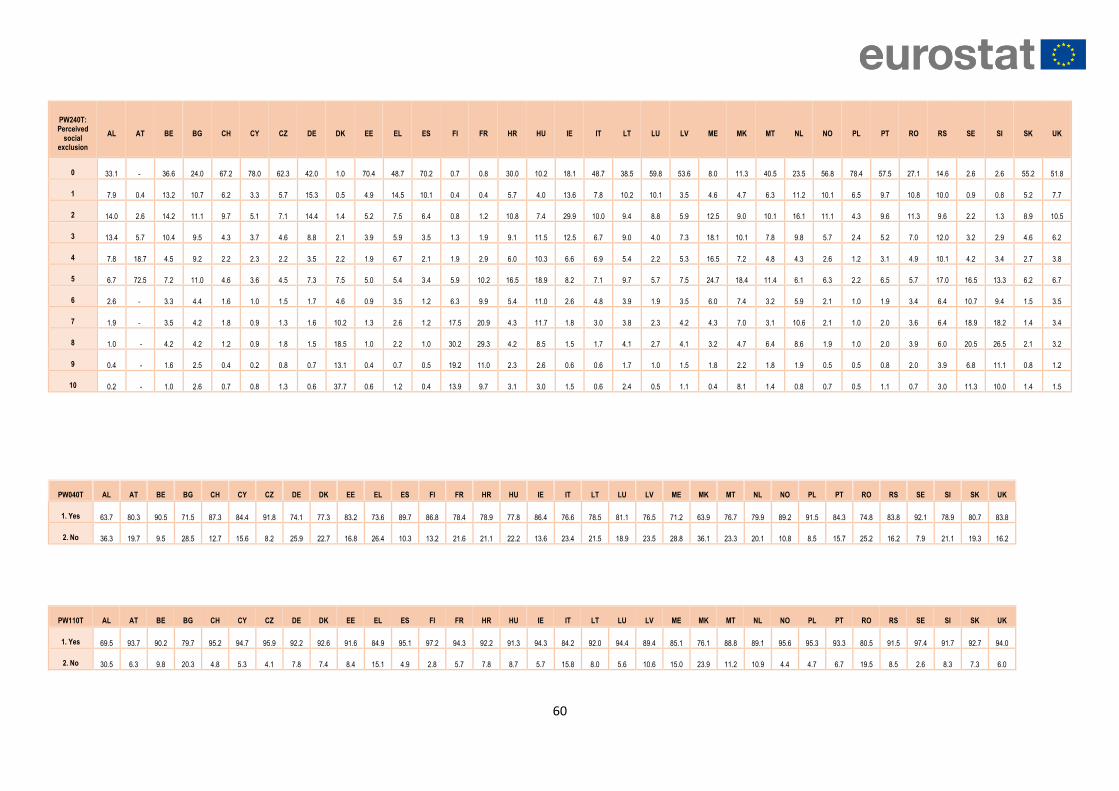
60
PW240T: Perceived
social exclusion
AL AT BE BG CH CY CZ DE DK EE EL ES FI FR HR HU IE IT LT LU LV ME MK MT NL NO PL PT RO RS SE SI SK UK
0 33.1 - 36.6 24.0 67.2 78.0 62.3 42.0 1.0 70.4 48.7 70.2 0.7 0.8 30.0 10.2 18.1 48.7 38.5 59.8 53.6 8.0 11.3 40.5 23.5 56.8 78.4 57.5 27.1 14.6 2.6 2.6 55.2 51.8
1 7.9 0.4 13.2 10.7 6.2 3.3 5.7 15.3 0.5 4.9 14.5 10.1 0.4 0.4 5.7 4.0 13.6 7.8 10.2 10.1 3.5 4.6 4.7 6.3 11.2 10.1 6.5 9.7 10.8 10.0 0.9 0.8 5.2 7.7
2 14.0 2.6 14.2 11.1 9.7 5.1 7.1 14.4 1.4 5.2 7.5 6.4 0.8 1.2 10.8 7.4 29.9 10.0 9.4 8.8 5.9 12.5 9.0 10.1 16.1 11.1 4.3 9.6 11.3 9.6 2.2 1.3 8.9 10.5
3 13.4 5.7 10.4 9.5 4.3 3.7 4.6 8.8 2.1 3.9 5.9 3.5 1.3 1.9 9.1 11.5 12.5 6.7 9.0 4.0 7.3 18.1 10.1 7.8 9.8 5.7 2.4 5.2 7.0 12.0 3.2 2.9 4.6 6.2
4 7.8 18.7 4.5 9.2 2.2 2.3 2.2 3.5 2.2 1.9 6.7 2.1 1.9 2.9 6.0 10.3 6.6 6.9 5.4 2.2 5.3 16.5 7.2 4.8 4.3 2.6 1.2 3.1 4.9 10.1 4.2 3.4 2.7 3.8
5 6.7 72.5 7.2 11.0 4.6 3.6 4.5 7.3 7.5 5.0 5.4 3.4 5.9 10.2 16.5 18.9 8.2 7.1 9.7 5.7 7.5 24.7 18.4 11.4 6.1 6.3 2.2 6.5 5.7 17.0 16.5 13.3 6.2 6.7
6 2.6 - 3.3 4.4 1.6 1.0 1.5 1.7 4.6 0.9 3.5 1.2 6.3 9.9 5.4 11.0 2.6 4.8 3.9 1.9 3.5 6.0 7.4 3.2 5.9 2.1 1.0 1.9 3.4 6.4 10.7 9.4 1.5 3.5
7 1.9 - 3.5 4.2 1.8 0.9 1.3 1.6 10.2 1.3 2.6 1.2 17.5 20.9 4.3 11.7 1.8 3.0 3.8 2.3 4.2 4.3 7.0 3.1 10.6 2.1 1.0 2.0 3.6 6.4 18.9 18.2 1.4 3.4
8 1.0 - 4.2 4.2 1.2 0.9 1.8 1.5 18.5 1.0 2.2 1.0 30.2 29.3 4.2 8.5 1.5 1.7 4.1 2.7 4.1 3.2 4.7 6.4 8.6 1.9 1.0 2.0 3.9 6.0 20.5 26.5 2.1 3.2
9 0.4 - 1.6 2.5 0.4 0.2 0.8 0.7 13.1 0.4 0.7 0.5 19.2 11.0 2.3 2.6 0.6 0.6 1.7 1.0 1.5 1.8 2.2 1.8 1.9 0.5 0.5 0.8 2.0 3.9 6.8 11.1 0.8 1.2
10 0.2 - 1.0 2.6 0.7 0.8 1.3 0.6 37.7 0.6 1.2 0.4 13.9 9.7 3.1 3.0 1.5 0.6 2.4 0.5 1.1 0.4 8.1 1.4 0.8 0.7 0.5 1.1 0.7 3.0 11.3 10.0 1.4 1.5
PW040T AL AT BE BG CH CY CZ DE DK EE EL ES FI FR HR HU IE IT LT LU LV ME MK MT NL NO PL PT RO RS SE SI SK UK
1. Yes 63.7 80.3 90.5 71.5 87.3 84.4 91.8 74.1 77.3 83.2 73.6 89.7 86.8 78.4 78.9 77.8 86.4 76.6 78.5 81.1 76.5 71.2 63.9 76.7 79.9 89.2 91.5 84.3 74.8 83.8 92.1 78.9 80.7 83.8
2. No 36.3 19.7 9.5 28.5 12.7 15.6 8.2 25.9 22.7 16.8 26.4 10.3 13.2 21.6 21.1 22.2 13.6 23.4 21.5 18.9 23.5 28.8 36.1 23.3 20.1 10.8 8.5 15.7 25.2 16.2 7.9 21.1 19.3 16.2
PW110T AL AT BE BG CH CY CZ DE DK EE EL ES FI FR HR HU IE IT LT LU LV ME MK MT NL NO PL PT RO RS SE SI SK UK
1. Yes 69.5 93.7 90.2 79.7 95.2 94.7 95.9 92.2 92.6 91.6 84.9 95.1 97.2 94.3 92.2 91.3 94.3 84.2 92.0 94.4 89.4 85.1 76.1 88.8 89.1 95.6 95.3 93.3 80.5 91.5 97.4 91.7 92.7 94.0
2. No 30.5 6.3 9.8 20.3 4.8 5.3 4.1 7.8 7.4 8.4 15.1 4.9 2.8 5.7 7.8 8.7 5.7 15.8 8.0 5.6 10.6 15.0 23.9 11.2 10.9 4.4 4.7 6.7 19.5 8.5 2.6 8.3 7.3 6.0

61
PW030T: Satisfaction
with financial situation
AL AT BE BG CH CY CZ DE DK EE EL ES FI FR HR HU IE IT LT LU LV ME MK MT NL NO PL PT RO RS SE SI SK UK
0 1.7 0.9 1.2 8.0 1.4 2.3 1.6 2.2 1.3 2.4 6.4 1.7 0.7 1.0 5.9 2.8 1.6 1.7 6.0 2.5 2.4 2.7 5.8 1.4 0.8 1.1 3.0 6.2 1.3 2.5 1.2 3.0 3.2 1.8
1 2.9 0.4 0.6 6.8 0.4 1.1 0.9 1.5 0.6 0.9 2.1 1.3 0.5 0.4 4.8 1.8 0.9 0.6 2.9 0.7 2.5 3.9 4.0 0.9 0.5 0.6 2.0 2.9 0.8 6.7 0.5 1.6 1.8 1.0
2 8.7 1.2 2.1 11.4 0.8 2.5 2.2 2.7 1.3 3.1 5.2 2.6 0.9 1.6 8.5 4.4 2.1 1.4 7.1 1.5 6.4 7.3 7.8 1.6 0.9 1.0 3.8 6.5 2.3 12.1 0.8 2.8 5.4 1.8
3 13.7 2.6 2.4 14.3 1.6 5.5 3.6 4.1 2.3 6.9 7.7 4.1 1.1 2.9 9.8 9.0 2.3 2.5 9.6 2.6 10.8 9.9 8.9 3.0 1.6 1.7 5.3 8.4 3.8 15.8 1.6 6.4 5.9 2.5
4 18.6 2.8 3.9 13.6 2.5 6.5 4.7 4.5 2.4 7.0 11.7 6.0 2.0 5.2 7.9 11.4 4.0 6.6 9.5 3.1 11.8 7.8 6.5 4.7 2.5 2.5 6.1 8.0 5.5 13.9 2.1 6.0 6.1 3.5
5 21.9 10.5 9.6 16.2 7.9 17.5 16.5 10.5 6.9 21.2 19.6 15.8 5.1 14.1 20.5 22.8 11.6 12.8 18.6 10.8 21.0 19.0 20.9 14.4 5.1 7.6 16.9 21.5 10.6 20.1 7.9 17.7 19.8 8.8
6 13.3 8.2 11.2 9.4 8.0 14.2 12.0 9.5 6.3 13.7 13.1 16.2 6.0 14.3 10.9 16.1 10.3 20.2 12.9 9.3 13.8 11.9 11.9 12.7 10.0 7.3 13.4 11.2 12.9 10.2 6.9 13.4 11.6 8.9
7 11.2 16.7 20.6 6.9 17.8 19.6 18.4 14.9 11.9 17.9 18.1 20.3 17.5 22.8 12.0 15.0 16.7 23.8 14.1 17.6 14.7 15.0 13.7 19.4 21.9 16.2 16.7 13.2 22.6 9.0 13.6 19.0 13.0 15.7
8 6.3 27.0 30.4 5.8 26.6 18.6 21.2 22.3 20.0 14.1 10.0 20.0 31.6 24.4 11.6 11.6 23.5 18.2 11.4 25.1 10.0 12.1 11.3 24.2 32.6 25.4 16.8 13.4 24.7 6.3 24.1 18.5 14.7 23.4
9 1.5 14.2 13.1 2.9 11.7 7.2 9.4 13.9 16.0 3.9 3.6 8.2 21.4 7.5 3.7 3.2 11.0 6.1 3.8 11.8 3.6 3.6 3.2 9.6 14.2 13.8 8.7 4.2 8.3 2.3 13.6 6.0 6.0 15.0
10 0.4 15.5 4.6 2.3 21.3 4.8 8.9 13.0 30.4 4.2 2.0 4.1 12.8 4.9 4.0 1.8 15.6 4.8 2.9 12.4 1.7 7.1 4.1 7.8 9.4 22.8 7.1 4.0 3.5 1.1 26.6 5.0 6.5 17.4

62
PW160T: Satisfaction
with personal
relationships
AL AT BE BG CH CY CZ DE DK EE EL ES FI FR HR HU IE IT LT LU LV ME MK MT NL NO PL PT RO RS SE SI SK UK
0 0.1 0.2 0.3 1.2 0.2 0.2 0.3 0.6 0.6 0.8 0.7 0.2 0.2 0.4 0.4 0.4 0.6 0.3 1.0 0.4 0.1 0.4 0.8 0.3 0.2 0.2 0.2 0.4 0.5 0.2 0.3 0.2 0.2 0.3
1 0.2 0.1 0.2 1.6 0.1 0.2 0.2 0.7 0.4 0.2 0.4 0.2 0.1 0.2 0.4 0.2 0.1 0.1 0.5 0.3 0.1 1.5 0.3 0.2 0.1 0.1 0.2 0.3 0.3 0.6 0.1 0.1 0.3 0.3
2 2.4 0.4 0.4 3.9 0.1 0.4 0.6 1.5 0.8 0.6 1.0 0.3 0.2 0.5 1.4 0.8 0.5 0.4 1.1 0.5 0.3 1.5 1.3 0.2 0.4 0.2 0.3 0.6 1.2 0.7 0.3 0.2 1.3 0.5
3 3.6 0.7 0.8 6.1 0.3 0.6 0.9 2.0 1.3 1.3 2.0 0.5 0.4 0.9 1.8 2.1 0.5 0.8 2.1 0.8 1.0 2.3 1.6 0.5 0.6 0.4 0.7 1.0 1.5 2.2 0.6 0.6 0.9 0.7
4 5.2 1.0 0.9 9.1 0.5 0.6 1.0 2.3 1.6 1.1 3.2 0.7 0.7 1.2 2.6 3.3 0.8 3.4 2.7 1.5 1.8 2.1 1.6 0.7 0.9 1.0 1.7 1.4 2.8 3.9 0.8 0.7 1.1 1.0
5 12.7 3.6 3.8 14.8 2.5 3.1 5.5 5.6 4.4 7.2 17.5 3.7 2.2 5.3 13.0 9.2 3.1 5.4 8.3 6.0 8.3 9.5 11.9 2.3 2.2 3.3 6.1 6.2 7.1 12.9 3.1 4.3 7.1 2.9
6 14.3 3.2 5.1 10.5 2.2 3.2 4.1 5.5 4.2 5.0 8.1 4.8 2.6 5.9 9.5 9.5 3.0 11.8 6.5 5.9 8.3 6.1 4.9 3.0 5.5 4.0 6.3 5.1 7.4 11.3 3.6 3.2 5.3 3.4
7 17.5 8.6 14.6 11.3 8.6 8.9 10.1 11.3 9.1 13.8 14.9 12.9 10.4 15.0 15.0 15.5 7.4 22.8 12.0 16.7 18.0 11.0 12.0 8.0 18.8 10.9 14.1 10.3 14.3 15.7 10.7 9.0 9.5 9.1
8 23.0 22.0 40.0 13.6 28.1 24.3 22.7 22.9 18.7 26.6 21.1 28.5 29.6 33.4 24.2 26.5 23.8 29.9 19.7 34.1 28.4 17.6 16.7 23.9 39.2 23.9 26.0 25.3 29.4 18.1 22.2 25.2 20.0 22.3
9 12.1 21.0 25.2 11.3 22.5 25.6 21.6 23.2 20.3 16.3 16.4 28.0 34.9 20.7 13.0 16.8 22.6 12.7 15.4 16.5 15.4 11.8 11.8 27.0 20.3 18.6 20.7 19.2 19.9 17.2 19.0 23.0 17.4 23.9
10 8.9 39.4 8.5 13.8 35.0 32.7 32.2 23.2 38.2 21.8 13.9 20.3 18.3 16.0 17.8 15.5 37.0 11.2 29.0 16.3 16.9 36.3 35.1 33.5 11.5 37.4 23.5 29.8 10.3 17.1 38.7 33.2 32.0 35.3

63
PW120T: Satisfaction
with time use
(amount of leisure time)
AL AT BE BG CH CY CZ DE DK EE EL ES FI FR HR HU IE IT LT LU LV ME MK MT NL NO PL PT RO RS SE SI SK UK
0 0.4 0.8 1.1 1.8 0.6 2.2 1.0 1.2 0.8 0.7 4.8 1.4 0.5 1.3 2.0 1.0 1.0 1.2 2.7 0.9 0.4 1.1 2.7 2.4 0.4 0.6 0.8 2.2 1.2 0.8 0.7 1.4 1.1 1.3
1 0.4 0.9 0.6 2.0 0.3 1.0 0.7 1.6 0.7 0.4 2.0 1.0 0.3 0.7 1.7 0.9 0.9 0.4 2.1 0.7 0.3 2.1 1.5 1.1 0.3 0.4 0.9 1.3 0.5 1.8 0.5 0.9 1.0 0.9
2 4.1 1.6 2.2 5.2 1.3 2.6 2.2 3.5 1.4 1.5 4.4 2.4 1.1 1.9 4.3 2.5 2.3 1.2 4.3 1.9 1.1 4.6 4.4 3.1 0.8 1.4 2.1 3.8 2.3 5.0 1.7 2.2 3.7 2.5
3 10.7 3.6 3.2 9.0 2.6 4.4 4.1 5.3 2.5 3.7 6.4 3.3 1.3 3.4 6.1 5.4 2.3 2.1 6.5 3.9 2.7 4.7 8.0 3.9 1.5 2.4 3.7 5.6 3.2 9.0 2.9 4.0 4.2 3.5
4 15.0 4.3 4.1 12.8 3.9 4.9 4.4 5.5 3.0 4.6 7.5 4.0 2.8 4.5 5.6 7.3 3.4 5.8 6.8 5.1 4.9 4.7 5.9 5.2 2.5 4.0 5.1 6.3 4.8 11.1 4.6 4.2 4.9 4.7
5 21.8 10.6 9.8 18.0 8.4 15.3 14.6 11.3 7.4 13.7 21.3 11.0 5.9 11.4 18.0 16.9 9.5 11.5 16.2 12.3 13.0 17.7 20.3 12.7 5.8 9.8 12.8 16.4 10.0 22.8 11.7 12.2 16.8 9.5
6 14.4 8.7 11.9 11.8 8.2 12.2 9.1 9.7 7.2 11.7 11.9 11.8 7.5 11.8 10.7 14.5 7.9 17.7 11.5 10.1 13.8 13.0 11.2 11.5 10.8 9.1 11.6 10.4 11.1 13.4 8.9 8.2 10.0 8.8
7 15.2 14.3 19.0 11.8 16.7 14.8 13.2 13.4 11.0 16.2 16.7 17.5 16.5 17.3 12.5 18.1 12.0 23.9 15.4 17.2 19.1 13.9 15.3 14.7 24.6 15.7 15.6 13.5 18.8 11.6 14.0 14.1 12.3 13.2
8 12.1 21.4 28.8 10.9 25.2 19.3 19.3 19.6 18.2 19.7 12.4 23.2 25.9 22.7 15.9 20.0 24.1 21.2 14.9 24.2 20.2 14.2 13.2 20.9 33.3 20.4 20.2 19.0 25.0 11.9 18.5 21.3 16.6 18.6
9 3.8 11.4 13.0 6.1 9.3 11.9 11.1 13.7 13.9 7.8 5.6 14.7 19.6 11.2 7.7 7.2 14.3 7.1 6.7 11.1 9.7 5.4 5.0 10.7 10.7 10.6 12.1 7.9 11.5 6.8 9.2 11.5 7.2 13.7
10 2.2 22.5 6.2 7.2 23.4 11.1 18.8 13.5 33.2 15.2 4.4 9.6 17.9 12.1 13.2 6.0 22.0 6.5 9.4 12.5 12.4 18.4 8.3 13.4 8.5 25.6 14.7 13.2 5.7 5.9 26.3 19.8 15.9 23.1

64
PW100T: Satisfaction
with job AL AT BE BG CH CY CZ DE DK EE EL ES FI FR HR HU IE IT LT LU LV ME MK MT NL NO PL PT RO RS SE SI SK UK
0 0.4 0.3 0.5 1.0 0.4 0.8 0.5 0.9 0.7 0.4 1.7 0.5 0.4 1.3 1.0 0.3 0.5 0.8 1.0 0.3 1.0 1.4 0.7 0.1 0.3 0.5 1.2 0.9 0.4 0.7 0.7 0.6 1.0
1 1.1 0.3 0.4 1.1 0.1 0.6 0.4 1.1 1.0 0.2 0.9 0.3 0.3 0.4 0.8 0.6 0.3 0.2 0.6 0.4 0.4 0.7 1.2 0.6 0.3 0.2 0.4 0.8 0.4 1.5 0.3 0.5 0.7 0.9
2 4.7 0.6 0.7 3.9 0.5 0.8 0.9 2.3 1.4 0.5 2.3 0.9 0.3 1.2 2.4 1.1 1.1 0.5 1.5 1.0 0.8 2.3 3.5 0.9 0.6 0.5 1.3 1.6 1.6 2.9 0.8 1.5 2.1 1.8
3 11.0 1.3 1.0 6.1 0.8 2.2 1.8 3.3 2.5 1.5 4.1 1.8 0.4 1.3 4.0 2.5 1.4 1.1 3.2 1.9 2.3 2.7 5.7 1.1 0.9 1.0 2.2 2.4 2.2 6.3 1.8 2.4 2.5 2.5
4 16.6 1.4 2.0 9.6 1.5 2.0 2.3 4.0 2.9 1.8 5.9 2.6 1.0 2.6 3.8 5.1 2.1 4.8 5.1 2.6 3.1 3.9 4.9 2.4 1.9 1.6 3.4 3.8 3.7 9.1 1.9 2.8 3.4 3.9
5 21.9 5.8 5.2 17.3 4.1 10.0 11.7 10.1 6.4 8.0 16.5 8.7 3.1 8.4 13.3 11.6 6.4 7.8 12.3 8.4 9.2 14.9 20.4 8.4 3.8 5.0 11.2 13.2 7.5 20.4 6.4 8.6 15.0 9.2
6 15.2 6.5 9.8 12.8 6.2 10.3 9.9 10.5 7.3 8.6 23.3 11.4 4.2 11.0 10.0 13.3 8.0 14.0 10.9 10.4 10.6 11.5 10.7 8.8 9.5 5.4 10.7 10.1 10.0 13.8 7.8 8.2 10.3 9.6
7 15.6 15.5 22.2 14.4 18.3 19.1 16.9 18.2 13.9 17.9 16.8 20.1 14.9 23.1 16.6 19.8 14.5 25.0 19.8 20.2 20.0 17.8 16.4 17.2 24.9 15.7 17.7 16.5 19.1 17.0 18.3 17.9 14.5 18.0
8 9.7 28.0 35.0 15.7 33.8 28.0 25.3 24.3 23.9 26.2 15.2 27.9 32.7 30.7 22.8 24.2 27.8 26.8 20.4 30.0 26.4 20.5 15.3 31.3 37.1 28.7 24.0 24.9 28.7 15.3 26.9 28.0 20.3 23.1
9 2.5 18.8 17.8 8.8 17.7 15.9 15.5 16.0 19.6 15.1 7.9 16.9 31.4 12.5 11.2 11.6 16.7 10.4 11.6 14.0 14.4 8.6 7.4 17.6 14.6 17.1 14.5 11.4 13.3 8.2 16.1 14.9 10.6 15.0
10 1.3 21.6 5.3 7.9 16.6 10.4 14.2 8.8 20.0 15.2 5.0 8.8 11.6 8.4 13.2 9.1 21.1 8.3 12.3 9.7 11.4 16.1 10.9 10.8 6.0 24.5 13.7 14.0 6.8 5.0 18.7 14.4 15.0 14.5
PW190: Trust in others
AL AT BE BG CH CY CZ DE DK EE EL ES FI FR HR HU IE IT LT LU LV ME MK MT NL NO PL PT RO RS SE SI SK UK
0 2.6 2.0 3.3 6.7 1.1 44.0 6.4 2.3 5.9 2.8 21.7 1.5 0.7 2.2 3.0 4.4 1.6 2.9 13.5 2.3 1.1 1.3 5.0 18.7 0.6 3.0 1.3 6.6 0.7 3.8 6.0 11.3 2.6 2.9
1 1.8 0.9 2.9 4.4 0.4 5.4 3.7 2.1 2.8 1.1 5.7 1.2 0.4 1.1 1.5 2.5 0.7 0.8 5.4 1.3 0.7 2.5 1.8 5.6 0.5 1.3 1.1 3.0 0.6 5.1 1.5 3.1 1.3 1.4
2 8.0 3.2 3.0 9.6 1.3 11.3 7.3 4.7 5.5 3.1 9.5 2.6 0.7 3.1 5.2 6.1 1.6 2.8 9.0 3.0 1.7 5.9 4.9 9.6 0.8 3.2 2.4 5.4 1.6 6.4 3.6 7.0 4.9 3.2
3 10.4 5.6 4.0 12.5 2.3 10.9 11.0 6.9 6.4 6.3 12.7 3.8 1.1 4.7 7.5 10.7 2.1 3.6 11.5 5.4 4.5 7.4 6.8 9.3 1.5 4.5 4.0 7.7 2.3 12.3 4.6 11.2 5.7 4.0
4 10.6 6.2 4.9 14.4 3.6 6.5 9.7 6.4 6.0 6.5 13.4 4.5 1.8 6.9 7.7 11.3 3.1 6.4 10.5 6.4 5.9 6.4 6.9 7.6 2.6 5.8 5.4 7.7 3.5 15.3 5.9 9.3 5.5 5.7
5 17.9 25.3 15.8 17.3 13.9 13.2 27.0 18.4 19.4 24.8 15.5 14.8 6.0 21.5 26.8 25.1 12.0 12.9 19.6 21.4 19.4 20.6 25.7 18.8 9.3 22.4 21.5 26.9 9.2 25.1 23.1 24.4 23.2 17.2
6 13.5 13.0 13.0 11.1 13.0 3.4 10.3 12.1 9.6 14.1 7.6 11.9 5.9 17.1 14.1 15.8 9.6 20.7 9.4 14.9 14.9 13.0 11.8 7.3 15.5 13.2 13.5 11.3 11.2 10.7 11.9 11.6 11.5 12.5
7 15.3 19.1 24.1 9.6 25.7 2.5 10.4 18.5 17.2 18.2 6.5 18.4 21.7 20.9 15.9 13.3 18.0 24.5 10.0 20.8 21.6 17.8 14.0 7.9 35.6 21.4 18.7 13.4 21.8 9.9 20.1 11.1 13.6 20.8
8 10.9 17.1 21.6 7.0 24.5 1.9 7.7 15.9 17.3 12.4 4.2 21.8 37.7 15.9 12.0 8.0 30.5 16.5 6.3 17.2 18.4 13.7 10.3 6.5 26.2 18.2 18.9 11.6 26.6 6.9 15.8 7.7 14.2 20.4
9 2.1 4.0 5.4 2.1 6.3 0.3 2.0 5.7 5.6 3.2 1.5 12.8 19.2 3.7 3.0 1.5 11.2 4.9 1.9 5.0 5.7 3.3 2.9 2.0 4.8 4.5 7.5 3.1 9.8 2.7 2.9 1.5 5.1 7.1
10 0.3 3.7 1.6 1.4 7.8 0.4 1.0 3.7 2.6 2.7 0.9 6.5 3.9 1.9 1.5 1.1 9.0 2.5 1.8 2.2 4.4 8.3 3.6 3.4 1.5 2.6 4.7 2.7 3.7 1.1 2.1 0.9 4.0 4.5

65
PW230T: Feeling lonely
AL AT BE BG CH CY CZ DE DK EE EL ES FI FR HR HU IE IT LT LU LV ME MK MT NL NO PL PT RO RS SE SI SK UK
1. All of the time 0.9 0.8 1.6 2.0 1.0 1.3 1.3 1.4 1.2 1.1 2.4 1.2 0.6 2.0 2.1 2.6 1.2 1.8 1.8 1.0 2.0 1.3 1.3 1.7 1.2 0.8 1.6 2.5 2.7 1.3 1.5 1.0 1.1 1.3
2. Most of the time 4.9 2.6 5.0 6.7 2.0 3.4 4.8 4.5 3.5 3.0 4.7 3.0 2.9 5.0 8.2 7.2 3.0 3.8 6.4 2.6 4.4 4.4 3.1 3.7 5.0 2.1 5.7 6.7 6.0 5.4 3.5 3.3 3.2 3.9
3. Some of the time 20.3 10.0 18.6 17.1 9.2 7.7 13.9 15.4 10.9 17.4 11.8 10.2 17.0 20.2 22.7 14.8 15.0 15.7 17.1 13.7 11.1 13.7 13.8 10.3 18.3 6.3 12.5 12.5 23.8 13.9 16.1 12.8 15.0 14.3
4. A little of the time 21.7 18.3 24.4 25.5 20.5 13.6 19.0 24.9 19.7 24.2 20.7 13.6 27.9 22.4 23.4 24.1 20.2 27.8 22.3 18.4 20.4 18.7 23.6 14.9 20.7 18.7 24.8 17.7 25.7 17.7 24.6 18.3 19.5 19.3
5. None of the time 49.2 68.2 50.3 43.5 67.2 73.9 59.0 52.0 64.1 49.9 58.9 72.0 51.3 50.1 42.4 50.9 60.5 50.0 48.6 61.4 60.6 58.6 53.7 68.4 54.1 72.1 54.4 60.3 35.8 61.4 53.8 64.2 54.3 61.1
PW050T: Being very nervous
AL AT BE BG CH CY CZ DE DK EE EL ES FI FR HR HU IE IT LT LU LV ME MK MT NL NO PL PT RO RS SE SI SK UK
1. All of the time 0.5 2.1 3.6 1.0 1.5 2.7 2.1 1.3 1.1 0.7 2.5 2.3 0.8 5.6 2.5 1.3 1.0 2.0 1.7 3.4 2.7 0.8 1.2 4.0 1.4 0.6 0.3 7.4 0.7 0.8 1.4 2.7 1.4 2.0
2. Most of the time 5.4 7.4 12.0 4.9 6.1 9.1 12.4 7.1 5.4 3.2 8.2 9.8 5.2 13.0 10.1 8.4 3.3 6.7 10.9 10.2 10.4 4.1 7.2 13.7 7.3 2.1 3.9 16.9 3.8 5.7 4.3 9.7 7.7 4.3
3. Some of the time 27.5 27.7 31.4 21.2 26.9 18.7 35.9 33.2 16.7 27.6 19.7 27.8 32.4 36.1 44.1 32.0 13.6 20.6 29.8 33.4 25.6 18.1 30.4 33.7 24.8 8.1 22.1 30.1 40.2 21.4 20.9 38.0 38.1 17.5
4. A little of the time 30.0 36.8 26.5 39.2 45.9 40.4 33.8 39.3 36.5 37.2 40.8 25.3 43.5 20.1 29.6 46.5 19.0 35.2 35.8 19.3 37.3 28.3 36.6 28.4 33.4 24.2 56.4 26.8 40.2 29.0 33.0 34.3 32.8 22.8
5. None of the time 33.7 26.1 26.5 25.0 19.6 28.9 13.8 17.1 39.8 27.1 27.5 34.8 17.7 24.9 11.9 11.6 63.0 34.6 17.4 31.8 22.8 44.9 21.1 19.6 32.5 65.0 16.6 18.6 11.4 42.7 39.9 15.2 14.0 53.2
PW060T: Feeling down in the dumps
AL AT BE BG CH CY CZ DE DK EE EL ES FI FR HR HU IE IT LT LU LV ME MK MT NL NO PL PT RO RS SE SI SK UK
1. All of the time 0.6 0.7 1.3 1.5 0.5 1.5 1.7 0.6 1.2 0.4 2.2 1.7 0.3 2.7 2.0 1.3 0.7 1.7 1.2 0.7 1.4 0.6 0.6 1.6 0.8 0.7 0.7 3.2 0.7 0.4 1.3 1.1 0.4 1.9
2. Most of the time 5.3 3.2 4.6 5.7 2.0 6.2 11.4 4.3 3.5 2.5 7.7 7.3 2.2 8.4 8.1 6.9 3.5 5.9 9.8 3.1 6.1 4.1 4.3 5.2 3.7 2.1 4.8 9.9 4.7 2.3 4.3 5.4 2.7 5.6
3. Some of the time 22.7 13.5 21.3 14.6 7.9 12.1 29.8 18.3 11.4 33.4 19.8 23.4 12.5 34.9 34.7 25.4 15.8 22.1 32.7 16.7 19.7 15.7 21.1 23.1 12.4 9.0 15.8 20.9 32.1 10.1 21.0 23.5 11.8 20.9
4. A little of the time 24.1 24.9 29.2 23.5 24.2 27.8 30.9 32.2 28.0 44.6 36.8 22.5 26.9 22.6 33.3 42.8 27.4 40.5 41.3 15.6 33.0 21.7 32.2 30.2 21.2 29.4 35.9 24.9 40.1 16.3 34.8 27.7 18.7 27.9
5. None of the time 44.1 57.7 43.5 46.2 65.4 52.1 24.2 42.8 55.4 15.0 32.1 45.0 57.6 31.0 19.9 23.3 52.4 28.8 11.0 61.5 38.2 48.7 37.5 39.2 61.0 58.9 41.8 40.8 18.1 70.5 38.1 42.0 59.9 43.6

66
PW070T: Feeling calm and peaceful
AL AT BE BG CH CY CZ DE DK EE EL ES FI FR HR HU IE IT LT LU LV ME MK MT NL NO PL PT RO RS SE SI SK UK
1. All of the time 0.4 15.0 13.1 7.1 12.6 9.5 6.7 5.8 15.5 8.5 10.2 22.2 10.8 8.9 4.3 9.7 16.3 19.8 21.4 13.6 11.0 22.9 8.3 5.5 16.9 20.7 13.6 13.8 6.3 9.5 17.1 8.8 9.2 11.3
2. Most of the time 3.9 61.0 49.0 30.4 60.9 46.2 51.8 63.3 51.2 59.3 45.8 41.0 66.8 40.8 38.3 55.8 53.2 40.1 52.8 50.0 41.9 37.6 55.4 44.5 58.6 48.8 63.7 36.8 56.1 42.9 57.3 51.4 56.3 47.6
3. Some of the time 17.6 14.5 24.0 38.3 19.7 26.7 28.1 17.4 18.8 20.5 22.0 23.3 15.6 28.3 37.5 23.7 19.7 29.3 17.2 21.1 33.3 28.8 25.8 26.2 16.8 19.8 17.1 25.6 22.9 33.9 16.5 28.5 21.3 25.7
4. A little of the time 17.1 7.9 10.3 17.5 5.8 14.7 10.3 10.6 10.4 6.4 16.8 10.1 5.5 15.9 15.2 9.6 7.1 8.2 4.0 10.4 11.3 5.9 6.5 17.3 5.0 8.8 4.7 18.9 10.2 10.9 6.6 9.5 7.2 10.9
5. None of the time 57.6 1.5 3.4 3.2 1.0 2.6 1.2 1.7 3.3 1.2 4.0 3.4 0.8 5.6 2.2 1.0 3.5 1.6 0.2 3.0 1.3 1.3 0.9 5.7 1.9 1.9 0.5 4.7 1.0 2.4 1.9 1.4 0.9 4.3
PW080T: Feeling downhearted or
depressed AL AT BE BG CH CY CZ DE DK EE EL ES FI FR HR HU IE IT LT LU LV ME MK MT NL NO PL PT RO RS SE SI SK UK
1. All of the time 5.1 0.6 1.6 1.8 0.6 1.6 0.7 0.8 1.2 0.5 1.5 1.8 0.4 1.7 1.8 1.5 0.7 1.4 1.4 0.9 0.7 0.7 0.6 1.3 0.9 0.8 0.5 3.0 0.8 0.4 1.1 0.6 0.4 1.7
2. Most of the time 32.0 3.8 5.7 9.6 2.2 6.6 3.5 4.9 3.5 2.3 5.3 6.5 2.9 5.0 7.5 5.0 2.7 4.3 9.6 4.3 3.2 3.2 4.0 4.0 5.6 2.2 4.4 11.3 4.7 2.9 3.7 2.6 2.5 5.1
3. Some of the time 46.5 18.3 21.4 21.6 11.6 15.6 9.5 23.9 11.4 11.7 17.3 20.0 17.6 20.5 30.7 13.6 11.8 17.1 36.2 20.5 10.5 13.4 19.5 12.8 22.4 5.9 20.1 25.6 28.0 13.9 15.5 13.7 12.1 15.8
4. A little of the time 9.5 40.9 27.1 35.2 31.0 36.7 21.9 40.9 28.0 21.6 31.9 21.7 36.9 20.9 32.8 23.8 22.2 37.7 37.3 21.9 23.3 20.2 32.4 19.4 27.7 19.5 42.8 32.1 37.5 20.4 32.7 18.6 20.3 23.8
5. None of the time 3.8 36.4 44.2 25.5 54.5 39.3 61.6 27.8 55.4 59.7 42.5 50.0 42.0 51.6 24.3 55.7 61.2 38.5 11.3 50.5 60.9 57.5 39.5 61.1 42.6 71.6 31.3 27.8 23.2 61.7 46.6 64.1 57.1 53.5
PW090T: Being happy
AL AT BE BG CH CY CZ DE DK EE EL ES FI FR HR HU IE IT LT LU LV ME MK MT NL NO PL PT RO RS SE SI SK UK
1. All of the time 5.3 14.4 16.7 6.1 13.9 8.6 6.4 6.0 15.5 6.1 10.3 28.2 11.7 15.3 5.1 9.0 16.7 17.5 7.2 15.0 3.6 23.0 6.2 5.4 15.2 12.5 15.0 14.8 4.5 10.8 12.7 9.6 9.7 13.4
2. Most of the time 25.7 62.4 58.3 26.8 64.4 45.9 42.8 58.8 54.4 42.3 36.5 42.4 65.3 53.3 35.3 45.7 61.8 31.9 36.4 60.3 24.8 36.2 44.2 54.3 59.4 53.6 49.7 39.7 41.3 40.8 53.5 46.9 46.7 57.8
3. Some of the time 51.5 16.8 18.6 36.7 17.1 31.7 35.8 23.0 19.1 34.8 29.4 21.1 17.3 23.3 41.2 29.9 15.9 37.4 34.6 17.1 39.1 30.1 37.3 26.4 19.4 25.2 24.1 27.4 31.8 35.9 23.6 33.4 28.5 21.7
4. A little of the time 11.2 5.5 5.0 20.4 3.7 11.7 9.2 8.5 8.0 9.2 16.2 6.3 4.2 5.4 13.6 12.8 4.0 9.7 13.7 3.7 22.1 5.6 7.4 10.0 3.7 7.8 8.4 14.2 12.4 9.8 6.9 7.5 6.6 5.5
5. None of the time 3.3 0.9 1.4 4.9 0.8 1.9 1.8 1.6 2.4 3.1 5.0 1.9 0.8 2.1 3.0 2.2 1.6 2.2 2.2 1.5 7.9 0.9 1.0 3.0 1.3 0.8 1.3 3.7 2.7 2.0 2.2 2.1 1.3 1.4

67
PHD01T: Past experience of
housing difficulties AL BE BG CH DE DK EL ES HU IE MT PT RO SK UK
1 6 2.3 1.4 7.4 2.8 9.9 1.2 1.4 0.5 3.3 1.5 4.1 1.4 1.3 5.6
2 0.0 0.7 0.1 0.4 0.7 0.6 0.2 0.1 0.1 0.8 0.4 0.5 0.1 0.3 1.7
3 0.3 0.3 0.4 0.3 0.1 0.7 0.3 0.1 0.1 1.2 0.4 0.5 0.4 0.1 1.0
4 0.1 0.2 0.0 0.1 0.1 0.3 0.0 0.1 0.1 0.2 0.1 0.4 0.1 0.0 0.5
5 99.1 96.5 98.2 91.9 96.3 88.5 98.3 98.4 99.2 94.5 97.6 94.5 98.1 98.4 91.2

68
PHD02: Duration of the most recent experience of housing difficulties
AL BE BG CH DE DK EL ES HU IE MT PT RO SK UK
1 10.6 18.5 5.9 30.4 13.7 13.6 10.8 16.3 25.8 29.6 14.4 33.1 16.1 5.1 15.9
2 1.9 8.7 5.9 10.9 13.6 14.3 9.7 8.9 11.8 7.7 11.4 6.2 29.2 7.0 9.5
3 8.1 12.4 7.4 17.3 14.9 16.7 7.8 6.1 11.8 13.1 11.9 8.3 17.8 4.7 9.9
4 3.1 4.6 1.8 5.2 6.5 5.3 6.6 5.4 3.2 3.0 3.5 3.7 9.4 2.8 5.3
5 3.1 3.8 4.4 2.6 4.5 4.5 6.5 1.1 7.5 3.7 11.0 2.2 6.4 3.7 2.8
6 3.1 11.3 8.1 13.1 11.5 15.1 10.9 8.9 8.6 10.4 12.4 8.0 10.1 11.6 14.4
7 0.6 1.5 3.7 0.6 2.6 1.9 0.8 0.7 1.1 1.7 1.0 0.9 0.7 0.5 1.4
8 4.4 3.5 1.5 1.1 2.2 1.3 2.1 1.5 3.2 2.0 2.0 1.4 4.4 4.2 3.2
9 0.6 2.6 0.4 1.1 2.3 1.1 0.5 1.3 , , , 1.2 2.0 , 2.9
10 1.3 1.2 2.9 0.3 3.0 1.4 3.0 1.1 , , 1.0 0.4 2.0 4.2 2.3
11 2.5 , , 0.1 0.9 0.3 , 0.2 , , 0.5 0.5 0.3 , 4.3
12 26.3 13.6 11.0 8.0 5.9 9.5 19.3 9.5 3.2 8.1 11.0 9.9 0.7 18.1 2.7
up to 12 months (cumulative) 65.7 81.5 52.9 90.6 81.6 85.1 78.0 60.9 76.4 79.5 80.1 75.7 99.0 61.9 74.6
13 , , , , 0.4 0.5 , 0.4 , 0.7 , , , , 1.7
14 , 0.3 0.7 , 0.5 0.5 0.4 1.1 1.1 0.7 , 0.1 , 0.9 1.2
15 1.9 , 0.7 , 1.0 0.6 1.2 0.7 1.1 0.7 , 0.4 , 0.5 0.5
16 0.6 0.3 1.8 , 0.9 0.3 0.1 , , 0.7 , 0.4 , , 0.2
17 0.6 , , , , 0.3 0.6 , , 0.7 1.0 0.3 , , 0.2
18 0.6 2.6 1.5 1.5 1.0 2.6 2.1 2.6 4.3 1.0 2.5 0.9 , 6.1 3.8
19 0.6 , , , 0.1 , , 0.2 , , , , , , 0.1
20 , , 0.4 0.3 0.5 0.6 0.6 , 1.1 , , 0.1 , , 0.3
21 , 0.3 , , 0.1 , , 0.9 , , , , , , 0.1
22 1.3 , , , 0.3 0.2 0.1 , , , , , , , ,
23 , , , , 0.3 0.3 , 0.4 , 1.0 , , , , 0.2
24 11.9 4.9 14.7 2.8 5.3 3.2 9.8 7.8 5.4 3.4 4.0 6.9 , 16.3 4.1
24 months 17.5 8.4 19.9 4.6 10.4 9.1 14.9 14.1 12.9 8.7 7.5 9.0 0.0 23.7 12.3
Up to 24 months (cumulative) 83.2 89.9 72.8 95.2 92.0 94.2 92.9 75.0 89.3 88.2 87.6 84.7 99.0 85.6 86.9
> more than 24 months (cumulative) 16.9 10.1 27.2 4.8 8.1 5.8 7.1 25.0 10.8 11.8 12.4 15.3 1.0 14.4 13.2

69
PHD03T: Main reason for past
housing difficulties AL BE BG CH DE DK EL ES HU IE MT PT RO SK UK
1 17.5 37.9 12.9 40.3 34.0 35.3 12.8 24.3 50.0 31.9 31.3 31.1 40.6 40.6 47.0
2 3.8 1.4 5.2 2.3 1.7 2.4 3.8 1.9 , 3.3 7.2 2.0 2.7 3.1 2.5
3 14.4 2.0 7.4 4.9 4.0 2.5 13.6 20.3 3.0 4.3 0.5 4.7 3.0 9.4 5.0
4 1.3 4.0 1.8 10.1 8.0 11.1 1.4 1.3 7.0 14.5 0.5 2.6 4.4 4.9 7.5
5 33.8 16.0 16.5 6.0 4.2 2.5 14.3 6.4 3.0 5.6 17.3 32.4 10.1 2.7 4.8
6 0.6 1.7 1.1 4.0 2.1 1.0 0.2 2.1 6.0 0.3 1.4 0.4 , 0.9 0.9
7 21.3 16.2 32.7 10.3 7.8 10.0 37.5 15.4 20.0 20.4 12.5 15.3 39.3 26.8 16.9
8 7.5 20.8 22.4 22.2 38.3 35.3 16.3 28.4 11.0 19.7 29.3 11.5 , 11.6 15.4
PHD04T: Other reason for past
housing difficulties AL BE BG CH DE DK EL ES HU IE MT PT RO SK UK
1 11.9 3.7 7.4 11.5 5.6 3.3 7.7 25.8 4.3 12.5 3.2 27.5 11.2 2.9 11.9
2 3.8 1.1 4.0 0.9 2.1 0.8 1.3 4.5 2.6 1.4 1.6 2.7 0.9 1.9 3.8
3 13.8 1.7 7.0 1.8 3.3 8.2 11.4 13.5 2.0 1.0 3.9 2.4 9.4 1.4 13.8
4 1.3 0.9 0.4 2.2 2.6 0.5 1.5 5.6 , , 0.5 7.4 2.7 1.3 1.3
5 21.9 0.6 5.2 0.7 1.9 2.0 2.8 3.4 1.3 3.9 0.8 9.1 , 0.5 21.9
6 1.3 0.9 1.1 1.2 0.8 0.2 1.3 1.1 0.3 1.0 0.1 0.3 0.5 0.4 1.3
7 33.1 7.4 27.9 6.6 10.6 13.0 9.0 24.7 7.6 5.8 6.8 50.3 11.2 5.3 33.1
8 8.1 2.0 17.3 10.9 21.0 6.6 18.2 21.4 5.0 16.4 1.0 , 5.4 2.4 8.1
9 5.0 81.8 29.8 64.2 52.2 65.3 46.9 , 76.9 58.2 82.2 0.3 58.9 83.9 5.0

70
PHD05T: Exit from housing difficulties
AL BE BG CH DE DK EL ES HU IE MT PT RO SK UK
1 21.9 26.2 12.1 26.5 13.5 6.2 15.1 48.5 9.9 15.4 19.7 37.9 38.4 13.8 21.9
2 2.5 1.4 2.9 1.0 1.4 2.6 1.3 1.0 5.3 6.3 2.1 3.0 3.1 1.1 2.5
3 21.3 10.0 24.6 22.3 7.6 37.2 27.9 12.1 12.2 1.4 20.8 20.8 22.8 11.9 21.3
4 13.1 23.9 7.7 4.2 14.0 5.7 7.5 12.1 32.2 9.6 14.3 5.4 7.1 38.6 13.1
5 16.3 35.0 37.1 44.4 62.0 42.6 30.5 25.3 32.6 55.8 40.1 32.9 20.1 32.2 16.3
6 25.0 3.4 15.4 1.7 1.6 5.8 17.7 1.0 7.9 11.5 3.0 , 8.5 2.4 25.0

71
Annex 2: Frequency distribution of variable flags
8.2: Frequencies of flags -1, -2, -3 and -8 for each variable by country
Flag -1 well-being variables*
Country
PW010T PW240T PW040T PW110T PW030T PW160T PW120T PW190T PW230T PW100T
-1 -1 -1 -1 -1 -1 -1 -1 -1 -1
AL , , , , , , , , , ,
AT 7.8 7.7 8.0 7.5 7.8 7.6 7.7 7.8 7.6 4.0
BE 10.3 10.3 10.3 10.3 10.3 10.3 10.3 10.3 10.3 4.1
BG 0.3 0.3 0.3 0.3 0.3 0.3 0.3 0.3 0.3 0.2
CH 18.3 18.5 18.9 18.4 0.1 18.3 18.4 18.5 18.5 2.1
CY 13.2 13.3 13.4 13.4 13.2 13.2 13.2 13.3 13.3 4.4
CZ 33.5 33.5 33.6 33.6 33.5 33.5 33.5 33.5 33.5 19.4
DE 0.5 0.5 0.5 0.4 1.0 0.6 1.0 0.4 0.9 0.5
DK 0.7 0.8 1.5 1.0 0.7 0.7 0.7 0.8 0.7 0.7
EE 1.9 1.9 3.5 2.5 1.9 1.9 1.9 1.9 1.9 54.7
EL , , , , , , , , , 0.0
ES 2.0 1.6 0.9 0.8 2.0 2.0 2.0 1.6 2.0 1.0
FI 3.6 3.6 4.6 3.8 3.6 3.6 3.6 3.6 3.6 2.6
FR 27.1 27.1 28.0 27.3 27.0 27.1 27.1 27.1 27.1 13.0
HR 41.8 41.8 49.1 46.0 41.8 41.8 41.8 41.8 41.8 19.5
HU 11.4 11.4 12.1 11.7 11.4 11.4 11.4 11.4 11.4 5.9
IE 4.4 4.8 4.9 4.7 4.8 5.0 4.8 5.0 5.5 2.3
IT 0.0 0.0 0.7 0.6 0.0 0.0 0.0 0.0 2.7 0.0
LT 34.7 34.7 34.7 34.7 34.7 34.7 34.7 34.7 34.7 16.3
LU 0.3 0.3 4.8 1.9 0.3 0.3 0.3 0.3 0.3 0.1
LV 25.2 25.2 25.3 25.3 25.2 25.2 25.2 25.2 25.2 11.6
ME , , , , , , , , , ,
MK 0.1 0.1 0.1 0.1 0.1 0.1 0.1 0.1 0.1 39.6
MT 1.5 1.6 10.1 5.3 1.5 1.5 1.6 1.6 1.6 0.6
NL , , 1.9 1.0 , , , , , 0.3
NO 0.5 1.0 0.7 0.7 0.6 0.5 0.6 1.0 0.6 0.1
PL 37.6 37.6 37.8 37.7 37.6 37.6 37.6 37.6 37.7 0.1
PT 0.1 0.1 0.2 0.1 0.1 0.1 0.1 0.1 0.1 0.0
RO , , , , , , , , , ,
RS , , , , , , , , , ,
SE 1.0 1.0 2.3 1.4 1.0 1.0 1.1 1.1 1.1 0.2
SI 9.4 9.4 9.7 9.6 9.4 9.4 9.4 9.4 9.4 4.8
SK , , 2.6 , , , , , 2.2 0.0
UK 45.4 45.4 45.9 45.7 45.4 45.4 45.4 45.4 45.6 27.6
*Unweighted distributions of flag -1

72
Flag -1 well-being variables*
Country PW050T PW060T PW070T PW080T PW090T
-1 -1 -1 -1 -1
AL , , , , ,
AT 7.5 7.6 7.5 7.6 7.7
BE 10.3 10.3 10.3 10.3 10.3
BG 0.3 0.3 0.3 0.3 0.3
CH 18.4 18.4 18.5 18.4 18.6
CY 13.3 13.3 13.3 13.3 13.3
CZ 33.5 33.5 33.5 33.5 33.5
DE 1.0 1.2 1.1 1.0 1.0
DK 0.7 0.7 0.7 0.7 0.7
EE 1.9 1.9 1.9 1.9 1.9
EL , , , , ,
ES 1.9 2.0 2.0 2.0 2.0
FI 3.6 3.6 3.6 3.6 3.6
FR 27.1 27.1 27.1 27.1 27.1
HR 41.8 41.8 41.8 41.8 41.8
HU 11.4 11.4 11.4 11.4 11.4
IE 5.6 5.6 5.5 5.1 5.5
IT 2.7 2.7 2.7 2.7 2.7
LT 34.7 34.7 34.7 34.7 34.7
LU 0.3 0.3 0.3 0.3 0.3
LV 25.2 25.2 25.2 25.2 25.2
ME , , , , ,
MK 0.1 0.1 0.1 0.1 0.1
MT 1.6 1.6 1.6 1.6 1.6
NL , , , , ,
NO 0.5 0.6 0.7 0.7 0.7
PL 37.6 37.6 37.6 37.6 37.7
PT 0.1 0.1 0.1 0.1 0.1
RO , , , , ,
RS , , , , ,
SE 1.0 1.0 1.1 1.1 1.1
SI 9.4 9.4 9.4 9.4 9.4
SK 2.2 2.2 2.2 2.2 2.2
UK 45.6 45.6 45.6 45.6 45.6
*Unweighted distributions of flag -1

73
Flag -1 material deprivation variables*
Country HS070 HS080 HS100
-1 -1 -1
AL
AT 0.0** 0.0**
BE 0.1
BG
CH 0.0** 0.0**
CY
CZ
DE
DK 0.4 0.4
EE
EL
ES
FI 0.1 0.1
FR
HR
HU
IE 0.0** 0.1
IT
LT
LU
LV
ME
MK
MT
NL
NO 1.5 1.5
PL
PT
RO
RS
SE
SI
SK
UK
*Unweighted distributions of flag ‘-1’ ** Value ‘0.0’ range from ‘0.01 to 0.08’
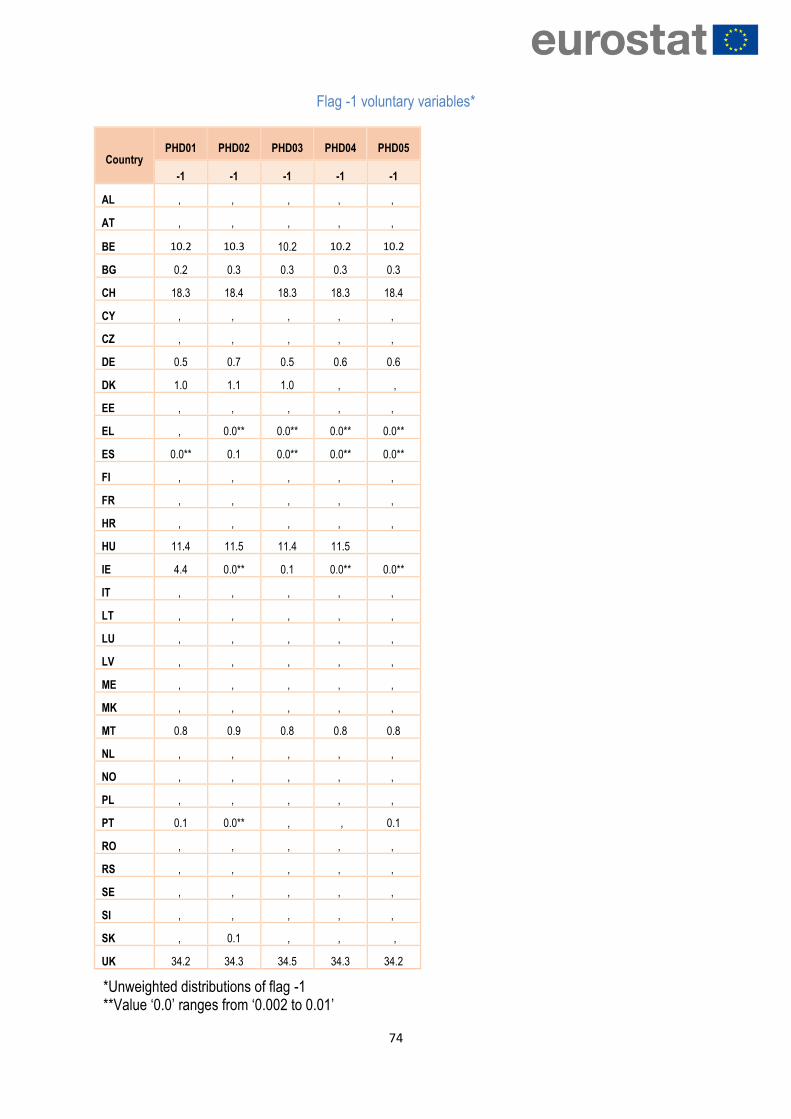
74
Flag -1 voluntary variables*
Country PHD01 PHD02 PHD03 PHD04 PHD05
-1 -1 -1 -1 -1
AL , , , , ,
AT , , , , ,
BE 10.2 10.3 10.2 10.2 10.2
BG 0.2 0.3 0.3 0.3 0.3
CH 18.3 18.4 18.3 18.3 18.4
CY , , , , ,
CZ , , , , ,
DE 0.5 0.7 0.5 0.6 0.6
DK 1.0 1.1 1.0 , ,
EE , , , , ,
EL , 0.0** 0.0** 0.0** 0.0**
ES 0.0** 0.1 0.0** 0.0** 0.0**
FI , , , , ,
FR , , , , ,
HR , , , , ,
HU 11.4 11.5 11.4 11.5
IE 4.4 0.0** 0.1 0.0** 0.0**
IT , , , , ,
LT , , , , ,
LU , , , , ,
LV , , , , ,
ME , , , , ,
MK , , , , ,
MT 0.8 0.9 0.8 0.8 0.8
NL , , , , ,
NO , , , , ,
PL , , , , ,
PT 0.1 0.0** , , 0.1
RO , , , , ,
RS , , , , ,
SE , , , , ,
SI , , , , ,
SK , 0.1 , , ,
UK 34.2 34.3 34.5 34.3 34.2
*Unweighted distributions of flag -1 **Value ‘0.0’ ranges from ‘0.002 to 0.01’
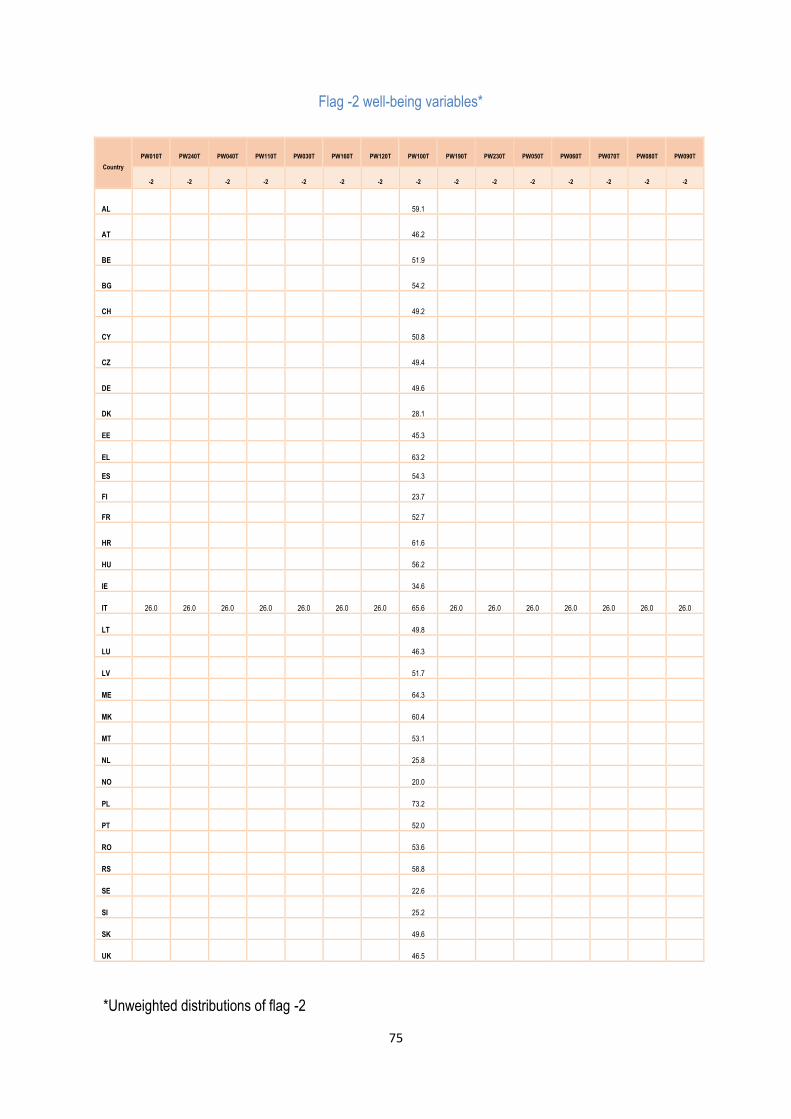
75
Flag -2 well-being variables*
Country
PW010T PW240T PW040T PW110T PW030T PW160T PW120T PW100T PW190T PW230T PW050T PW060T PW070T PW080T PW090T
-2 -2 -2 -2 -2 -2 -2 -2 -2 -2 -2 -2 -2 -2 -2
AL 59.1
AT 46.2
BE 51.9
BG 54.2
CH 49.2
CY 50.8
CZ 49.4
DE 49.6
DK 28.1
EE 45.3
EL 63.2
ES 54.3
FI 23.7
FR 52.7
HR 61.6
HU 56.2
IE 34.6
IT 26.0 26.0 26.0 26.0 26.0 26.0 26.0 65.6 26.0 26.0 26.0 26.0 26.0 26.0 26.0
LT 49.8
LU 46.3
LV 51.7
ME 64.3
MK 60.4
MT 53.1
NL 25.8
NO 20.0
PL 73.2
PT 52.0
RO 53.6
RS 58.8
SE 22.6
SI 25.2
SK 49.6
UK 46.5
*Unweighted distributions of flag -2

76
Flag -3 well-being variables*
Country
PW010T PW240T PW040T PW110T PW030T PW160T PW120T PW100T PW190T PW230T PW050T PW060T PW070T PW080T PW090T
-3 -3 -3 -3 -3 -3 -3 -3 -3 -3 -3 -3 -3 -3 -3
AL
AT
BE
BG
CH
CY
CZ
DE
DK 43.7 43.7 43.7 43.7 43.7 43.7 43.7 43.7 43.7 43.7 43.7 43.7 43.7 43.7 43.7
EE
EL
ES
FI 48.9 48.9 48.9 48.9 48.9 48.9 48.9 48.9 48.9 48.9 48.9 48.9 48.9 48.9 48.9
FR
HR
HU
IE
IT
LT
LU
LV
ME
MK
MT
NL 46.0 46.0 46.0 46.0 46.0 46.0 46.0 46.0 46.0 46.0 46.0 46.0 46.0 46.0 46.0
NO 48.6 48.6 48.6 48.6 48.6 48.6 48.6 48.6 48.6 48.6 48.6 48.6 48.6 48.6 48.6
PL
PT 35.9 35.9 35.9 35.9 35.9 35.9 35.9 17.7 35.9 35.9 35.9 35.9 35.9 35.9 35.9
RO
RS 10.8 10.8 10.8 10.8 10.8 10.8 10.8 10.8 10.8 10.8 10.8 10.8 10.8 10.8 10.8
SE 48.9 48.9 48.9 48.9 48.9 48.9 48.9 48.9 48.9 48.9 48.9 48.9 48.9 48.9 48.9
SI 51.0 51.0 51.0 51.0 51.0 51.0 51.0 51.0 51.0 51.0 51.0 51.0 51.0 51.0 51.0
SK
UK
*Unweighted distributions of flag -3

77
Optional variables in AHM 2018
Flag “-2” and “-3”
Country
PHD01 PHD02 PHD03 PHD04 PHD05 PHD01 PHD02 PHD03 PHD04 PHD05
-2 -2 -2 -2 -2 -3 -3 -3 -3 -3
AL 99.1 99.1 99.1 99.1
AT
BE 86.6 86.6 86.6 86.6
BG 97.9 97.9 97.9 97.9
CH 75.1 75.1 75.1 75.1
CY
CZ
DE 95.8 95.8 95.8 95.8
DK 49.0 49.0 43.7 43.7 43.7 43.7 43.7
EE
EL 98.3 98.3 98.3 98.3
ES 98.3 98.3 98.3 98.3
FI
FR
HR
HU 87.9 87.9 87.9
IE 61.0 61.0 61.0 61.0 31.1 35.5 35.5 35.5 35.5
IT
LT
LU
LV
ME
MK
MT 96.8 96.8 96.8 96.8
NL
NO
PL
PT 60.5 60.5 60.5 60.5 35.9 36.0 36.0 36.0 36.0
RO 98.1 98.1 98.1 98.1
RS
SE
SI
SK 98.4 98.4 98.4 98.4
UK 60.0 60.0 60.0 60.0

78
Country
PHD01 PHD02 PHD03 PHD04 PHD05
-8 -8 -8 -8 -8
AL
AT NA NA NA NA NA
BE
BG
CH
CY 100.0 100.0 100.0 100.0 100.0
CZ 100.0 100.0 100.0 100.0 100.0
DE
DK
EE 100.0 100.0 100.0 100.0 100.0
EL
ES
FI 100.0 100.0 100.0 100.0 100.0
FR NA NA NA NA NA
HR NA NA NA NA NA
HU
IE
IT NA NA NA NA NA
LT NA NA NA NA NA
LU 100.0 100.0 100.0 100.0 100.0
LV 100.0 100.0 100.0 100.0 100.0
ME NA NA NA NA NA
MK NA NA NA NA NA
MT
NL 100.0 100.0 100.0 100.0 100.0
NO 100.0 100.0 100.0 100.0 100.0
PL 100.0 100.0 100.0 100.0 100.0
PT
RO
RS NA NA NA NA NA
SE 100.0 100.0 100.0 100.0 100.0
SI 100.0 100.0 100.0 100.0 100.0
SK
UK