2018 child care market rate survey - arizona
TRANSCRIPT

ARIZONA DEPARTMENT OF ECONOMIC SECURITY DIVISION OF EMPLOYMENT AND REHABILITATION
SERVICES CHILD CARE ADMINISTRATION
2018 CHILD CARE MARKET RATE
SURVEY
– Prepared by –
BURNS & ASSOCIATES, INC. 3030 North Third Street, Suite 200
Phoenix, AZ 85012
(602) 241-8520

Arizona Department of Economic Security 2018 Child Care Market Rate Survey
TABLE OF CONTENTS Introduction ................................................................................................................................................... 1
Market Rate Determinants ........................................................................................................................ 2
Age of Children ..................................................................................................................................... 2
Provider Type ........................................................................................................................................ 2
Geographic Region ............................................................................................................................... 3
Frequency of Childcare ......................................................................................................................... 3
Survey Overview ...................................................................................................................................... 4
Section I – Licensed Centers ......................................................................................................................... 5
Licensed Centers - Market Rates .............................................................................................................. 6
Licensed Centers - Access and Quality ................................................................................................... 10
Section II – Approved Homes ..................................................................................................................... 15
Approved Homes - Market Rates ............................................................................................................ 16
Approved Homes - Access and Quality .................................................................................................. 20
Section III – Certified Group Homes .......................................................................................................... 25
Certified Group Homes - Market Rates .................................................................................................. 26
Certified Group Homes - Access and Quality......................................................................................... 30
Section IV – Unregulated Homes ............................................................................................................... 35
Unregulated Homes - Market Rates ........................................................................................................ 36
Unregulated Homes - Access and Quality .............................................................................................. 40
Appendix A - Methodology ...................................................................................................................... A-1
Step 1 – Identify contact population ..................................................................................................... A-1
Step 2 – Administer Survey .................................................................................................................. A-1
Step 3 – Evaluate Survey Results ......................................................................................................... A-3
Limitations to Analysis/ Results ........................................................................................................... A-4
Appendix B – Survey Instrument.............................................................................................................. B-1

Arizona Department of Economic Security 2018 Child Care Market Rate Survey
BURNS & ASSOCIATES, INC. Health Policy Consultants Introduction page 1
INTRODUCTION The Child Care and Development Block Grant Act (the Act) requires Agencies administering the Child Care Development Fund (CCDF) to set provider subsidy payment rates based on a valid market rate survey or alternative methodology, such as a cost estimation model.1 States choosing to utilize a market rate study as the basis for provider payment rates are required to administer the survey every three years.2
The Arizona Department of Economic Security (DES) Child Care Administration (CCA) establishes payment rates for Arizona’s child care subsidy program. CCA contracted with Burns & Associates, Inc., a Phoenix-based consulting firm that works with states on policy analysis, financial modeling, rate setting, program design, and stakeholder engagement, to conduct the 2018 Child Care Market Rate Survey.
As described in the Methodology in Appendix A, the survey was administered to 3,945 providers across four provider types, of which 2,512 (63.7 percent) completed the survey.3 Figure 1 summarizes the statewide market rate results for each provider type and children’s age group.
Figure 1: Statewide Market Rates Across all Provider Types by Age Group and Rate Type4 Rate Type
Age Group Quartile Licensed Centers
Approved Homes
Certified Group Homes
Unregulated Homes
Full-
Tim
e R
ates
Infants (Under 1) 25th percentile $35.00 $15.00 $25.36 $25.00 50th percentile $43.03 $20.00 $30.00 $25.00 75th percentile $48.05 $25.00 $34.50 $28.75
Toddlers (1-2 Years)
25th percentile $31.25 $15.00 $25.00 $23.00 50th percentile $38.00 $20.00 $28.00 $25.00 75th percentile $44.00 $25.00 $30.00 $28.00
Preschoolers (3-5 Years)
25th percentile $28.00 $15.00 $25.00 $21.51 50th percentile $33.00 $20.00 $28.00 $25.00 75th percentile $38.60 $25.00 $30.00 $25.00
School aged (6+ Years)
25th percentile $20.00 $15.00 $22.00 $20.00 50th percentile $28.00 $20.00 $25.00 $25.00 75th percentile $33.55 $25.00 $30.00 $25.00
Part-
Tim
e R
ates
Infants (Under 1) 25th percentile $28.00 $10.00 $19.00 $15.00 50th percentile $35.62 $15.00 $22.00 $15.00 75th percentile $44.00 $20.00 $28.00 $20.00
Toddlers (1-2 Years)
25th percentile $0.00 $10.00 $18.00 $14.14 50th percentile $30.00 $15.00 $20.00 $15.00 75th percentile $37.00 $20.00 $25.00 $20.00
Preschoolers (3-5 Years)
25th percentile $15.00 $10.00 $17.00 $13.13 50th percentile $24.86 $15.00 $20.00 $15.00 75th percentile $30.00 $20.00 $25.00 $20.00
School aged (6+ Years)
25th percentile $14.00 $10.00 $16.00 $13.00 50th percentile $18.17 $13.50 $20.00 $15.00 75th percentile $24.80 $20.00 $22.50 $20.00
1 45 CFR 98.45 2 81 Federal Register 67438. Published September 30, 2016. 3 Initially, the survey was administered to 4,470 providers. However, many contacts indicated they no longer provided child care, or it was determined that the contact information on file for a provider was incorrect. After removing these dispositions from the contact population, there were 3,945 remaining providers in the final contact population. 4 Figure 1 represents market rates at the 25th, 50th, and 75th percentile at the statewide level. District-level market rates are reported in the results section, and will better reflect rate variations based on geographic location. Additionally, where part-time rate variations followed a similar pattern to full-time rates, only full-time rate analyses are presented in the results sections of the report.

Arizona Department of Economic Security 2018 Child Care Market Rate Survey
BURNS & ASSOCIATES, INC. Health Policy Consultants Introduction page 2
Given the cost of child care across Arizona, many families struggle to access quality child care, and may even forego child care when no affordable option is available. For example, the annual cost of full-time care in a licensed center is nearly equivalent to the cost of tuition and fees at a public college.5 Accordingly, the DES child care subsidy is an important form of support for Arizona parents and guardians who may otherwise be forced to choose between working and staying home to care for their children in the absence of an affordable child care option.
Market Rate Determinants
The Act specifies that the child care market rate survey must reflect variations in the age of children, type of provider, and geographic service location. Payment rates may be further differentiated by providers offering services to children with disabilities or offering child care services during non-traditional hours, such as nights and weekends. The 2018 Child Care Market Rate Survey considers price variation based on these factors as well as the frequency of child care, as described below.
Age of Children
Child care rates vary with the age of the child, as infants and toddlers generally require more care than pre-school and school-aged children. Arizona regulations specify that providers must maintain specific staffing ratios when caring for children of different age groups.6 For example, providers must maintain a staff-to-child ratio of one-to-five for children under three years old. In contrast, the staffing ratio requirements for children between six and eleven years old is one-to-eight. For the purpose of administering the survey, the following four age groups were utilized to identify rate variations based on age grouping:
• Infants (0-1 year)
• Toddlers (1-2 years)
• Preschoolers (3-5 years)
• School aged (6+ years)
Provider Type
Child care is provided in a variety of center and home-based settings. In Arizona, child care providers are classified under one of four provider types:
• Licensed Centers – a child care facility licensed by the Arizona Department of Health Services (ADHS) that provides care to at least five children for periods of less than 24 hours per day
• Approved Homes – a provider certified by DES to provide child care in a home to a maximum of six children
• Certified Group Homes – a residential facility certified by the Department of Health Services in which child care is regularly provided for periods of less than twenty-four hours per day for between five and ten children
5 Child Care Aware® of America. (2014). Parents and the High Cost of Child Care: 2014 Report. Retrieved from https://www.ncsl.org/documents/cyf/2014_Parents_and_the_High_Cost_of_Child_Care.pdf. 6 Arizona Administrative Code, Title 6, Chapter 5, Section 7437.

Arizona Department of Economic Security 2018 Child Care Market Rate Survey
BURNS & ASSOCIATES, INC. Health Policy Consultants Introduction page 3
• Unregulated Homes – noncertified home-based providers that care for no more than four children at a time
Geographic Region
CCA designates six planning districts for the purpose of establishing subsidy rates. Each district is comprised of one or more counties, as illustrated in Figure 2.
Figure 2: CCA Planning Districts with County Boundaries
Frequency of Childcare
CCA designates part-time and full-time subsidy rates. A part-time unit consists of less than six hours of care in a day, while a full-time unit consists of six or more hours of care in a day.7
This report further differentiates provider rates by comparing providers that attributed the presence or absence of each of the following to their programs:
7 Arizona Administrative Code, Title 6, Chapter 5, Section 4918(E).

Arizona Department of Economic Security 2018 Child Care Market Rate Survey
BURNS & ASSOCIATES, INC. Health Policy Consultants Introduction page 4
• Accepts the DES child care subsidy
• Offers child care services to children with special needs, including physical disabilities, intellectual disabilities, and other special needs (e.g., behavioral disorders)
• Holds accreditation from at least one of eight national child care accrediting agencies
Survey Overview
B&A administered the 2018 Child Care Market Rate Survey to nearly 4,000 providers between April and June, 2018. Figure 3 illustrates the number of providers for which a survey was attempted, and the response rate by provider type.
Figure 3: Number of Providers and Response Rate by Provider Type
Provider Type Providers in Survey Population8
Providers Completing Survey
Response Rate
Licensed Centers 2,017 1,380 68.4% Approved Homes 1,339 704 52.6% Unregulated Homes 263 200 76.0% Certified Group Homes 326 228 69.9% Totals 3,945 2,512 63.7%
The survey was designed to capture information about provider rates for full and part-time care across each of the four age groups. Providers were also asked to report their licensed capacity, average daily attendance overall, and average daily attendance within each of the four age groups. In addition, the survey incorporated questions regarding access to child care, including the extent to which providers cared for children with special needs, offered care outside of normal working hours,9 or received accreditation through at least one of eight national accrediting agencies.
This report summarizes results from the survey for each provider type. The Methodology section in Appendix A details the specific analyses conducted to identify the provider population, administer the survey, and analyze the results for reporting. The survey instrument utilized throughout the survey is found in Appendix B.
8 See Appendix A for additional information about the providers counted in this population. 9 Normal working hours was defined in the survey as care provided Monday through Friday between 6:00 am and 6:30 pm.

Arizona Department of Economic Security 2018 Child Care Market Rate Survey
BURNS & ASSOCIATES, INC. Health Policy Consultants Introduction page 5
SECTION I – LICENSED CENTERS
The survey was administered to 2,017 licensed child care centers across Arizona. Figure 4 presents the response rate for licensed centers for each of the six CCA Districts, and at the Statewide level.
Figure 4: Licensed Center Response Rate by District District I District
II District
III District
IV District
V District
VI Statewide
Total Responses 857 253 83 93 45 49 1,380 Total Providers 1,297 320 158 116 66 60 2,017 Response Rate 66.1% 79.1% 52.5% 80.2% 68.2% 81.7% 68.4%
Highlights from the figures presented throughout this section include:
• The statewide median daily rates for full-time care in a licensed center was $43.03 for children under 1, $38.00 for 1-2-year olds, $33.00 for 3-5-year olds, and $28.00 for school aged children.
• There is not a meaningful difference in median daily rates for providers that accept the DES child care subsidy compared to providers that do not.
• Nearly 70 percent of the licensed centers responding to the survey across the state have been in operation for more than 10 years.
• Statewide, nearly 70 percent of licensed centers accept the DES child care subsidy.
• Providers that have been in operation for longer than 10 years charge a median rate that is, on average, 16 percent higher across all age groups than providers that reported being in operation for less than one year.
• Preschool-aged children (3-5 year olds) represent 53 percent of the average daily attendance for full-time care at a licensed center, and 46 percent of the average daily attendance for part-time care.
• Just over 13 percent of responding licensed centers reported holding an accreditation from a national accrediting organization.
• Licensed centers rarely offer care outside of normal hours; fewer than 3 percent reported offering child care services between 6:30 pm and 6:00 am.

Arizona Department of Economic Security 2018 Child Care Market Rate Survey
BURNS & ASSOCIATES, INC. Health Policy Consultants Licensed Centers page 6
Licensed Centers - Market Rates
Figure 5 presents the 25th, 50th (median) and 75th percentile rates for licensed centers in each district and each age group for full-time child care and part-time child care, respectively. Across all districts, the median daily rate for full-time care ranged from $24.50 to $45.00 per day while the median daily rate for part-time care ranged from $16.50 to $38.25. Rates were highest for infants in the two urban counties, District 1 (Maricopa County) and District II (Pima County).
Figure 5: Licensed Center Daily Rates for Full-Time and Part-Time Care Age Group
Rate Percentile District I
District II
District III
District IV
District V
District VI
Statewide
Scho
ol a
ged
(6+
Yea
rs)
Full-Time
25th Percentile $23.00 $9.56 $25.00 $20.50 $20.00 $21.45 $20.00 50th Percentile $30.00 $25.00 $28.00 $24.50 $25.00 $25.00 $28.00 75th Percentile $35.00 $32.00 $34.50 $26.00 $31.00 $33.75 $33.55
Part-Time
25th Percentile $12.11 $17.25 $14.09 $15.00 $17.00 $13.15 $14.00 50th Percentile $18.00 $20.00 $16.50 $18.00 $20.00 $17.00 $18.17 75th Percentile $25.00 $24.75 $20.00 $20.00 $25.00 $18.00 $24.80
Pres
choo
lers
(3-5
Y
ears
)
Full-Time
25th Percentile $29.00 $30.00 $25.05 $24.00 $25.14 $23.90 $28.00 50th Percentile $34.00 $33.47 $30.36 $25.00 $28.50 $25.00 $33.00 75th Percentile $40.80 $35.00 $35.00 $28.00 $32.80 $31.80 $38.60
Part-Time
25th Percentile $18.13 $18.17 $14.51 $16.55 $17.00 $13.75 $17.93 50th Percentile $26.00 $25.00 $21.00 $20.00 $20.00 $18.00 $24.86 75th Percentile $32.85 $29.00 $25.00 $22.63 $25.00 $21.50 $30.00
Todd
lers
(1-2
Y
ears
)
Full-Time
25th Percentile $33.41 $33.00 $29.00 $25.00 $28.60 $24.91 $31.25 50th Percentile $40.00 $38.25 $33.47 $28.00 $32.00 $27.55 $38.00 75th Percentile $46.15 $38.25 $38.00 $30.00 $35.00 $34.10 $44.00
Part-Time
25th Percentile $25.40 $22.00 $19.00 $18.15 $20.50 $16.61 $23.90 50th Percentile $31.80 $27.00 $24.00 $22.25 $25.50 $19.56 $30.00 75th Percentile $39.20 $32.60 $28.88 $25.00 $30.15 $30.50 $37.00
Infa
nts (
Und
er 1
)
Full-Time
25th Percentile $37.00 $39.00 $33.00 $27.25 $30.00 $26.25 $35.00 50th Percentile $45.00 $43.03 $36.00 $30.00 $35.00 $35.50 $43.03 75th Percentile $50.20 $43.03 $39.00 $34.00 $37.00 $38.25 $48.05
Part-Time
25th Percentile $30.00 $27.00 $24.25 $19.50 $24.75 $17.79 $28.00 50th Percentile $38.25 $33.00 $30.91 $25.00 $28.50 $27.50 $35.62 75th Percentile $46.00 $39.00 $34.80 $27.00 $31.75 $36.75 $44.00

Arizona Department of Economic Security 2018 Child Care Market Rate Survey
BURNS & ASSOCIATES, INC. Health Policy Consultants Licensed Centers page 7
The analysis explored the extent to which there is a difference in the median rate charged by providers that accept child care subsidies and those that do not. Of the 1,380 licensed centers providing a response to the survey, 1,367 (99.1 percent) responded to this question. Figure 6 illustrates the number of responding providers, by District, that accept and do not accept the DES child care subsidy.
Figure 6: Licensed Centers - Child Care Subsidy Acceptance by District District
I District
II District
III District
IV District
V District
VI Statewide
Accepts Subsidy 594 204 47 41 24 33 943 Does not Accept Subsidy 257 47 34 49 21 16 424 DES Subsidy Acceptance Rate 69.8% 81.3% 58.0% 45.6% 53.3% 67.3% 69.0%
As illustrated in Figure 6, there is not a consistent relationship the median daily rates and whether the provider accepts or does not accept the DES child care subsidy.
$0 $5 $10 $15 $20 $25 $30 $35 $40 $45 $50
<1 Year Old1-2 Years Old3-5 Years OldSchool Aged<1 Year Old
1-2 Years Old3-5 Years OldSchool Aged<1 Year Old
1-2 Years Old3-5 Years OldSchool Aged<1 Year Old
1-2 Years Old3-5 Years OldSchool Aged<1 Year Old
1-2 Years Old3-5 Years OldSchool Aged<1 Year Old
1-2 Years Old3-5 Years OldSchool Aged<1 Year Old
1-2 Years Old3-5 Years OldSchool Aged
Dis
trict
ID
istri
ct II
Dis
trict
IIID
istri
ct IV
Dis
trict
VD
istri
ct V
ISt
atew
ide
Median Daily Rate
Figure 6 - Full-Time Median Rate Comparison for Providers Accepting and Not Accepting the Child Care Subsidy
Does Not Accept Subsidy Accepts Subsidy

Arizona Department of Economic Security 2018 Child Care Market Rate Survey
BURNS & ASSOCIATES, INC. Health Policy Consultants Licensed Centers page 8
Figure 7 presents a comparison of full-time median provider rates for licensed centers that reported being accredited by a national organization and those that did not.10 Of 1,380 licensed providers responding to the survey, 1,351 (97.9 percent) responded to this question. Statewide, 177 of 1,351 responding providers (13.1 percent) reported accreditation from a national organization, with District accreditation rates ranging from 2.3 percent (District V) to 18.5 percent (District III). The results yielded an inconsistent relationship between a licensed center’s median daily rates and their accreditation status.
10 This question asked whether providers were accredited by one of eight national accrediting agencies, including the American Montessori Society, Association for Christian Schools International, Association for Early Learning Leaders, Council on Accreditation, National Association for the Education of Young Children, National Early Childhood Program Accreditation, Council for Professional Recognition, or National Association for Family Child Care.
$0 $10 $20 $30 $40 $50 $60
<1 Year Old1-2 Years Old3-5 Years OldSchool Aged<1 Year Old
1-2 Years Old3-5 Years OldSchool Aged<1 Year Old
1-2 Years Old3-5 Years OldSchool Aged<1 Year Old
1-2 Years Old3-5 Years OldSchool Aged<1 Year Old
1-2 Years Old3-5 Years OldSchool Aged<1 Year Old
1-2 Years Old3-5 Years OldSchool Aged<1 Year Old
1-2 Years Old3-5 Years OldSchool Aged
Dis
trict
ID
istri
ct II
Dis
trict
III
Dis
trict
IVD
istri
ct V
Dis
trict
VI
Stat
ewid
e
Median Daily Rate
Figure 7: Full-Time Median Rate Comparison for Accredited and Non-Accredited Providers
Is Not Accredited Is Accredited

Arizona Department of Economic Security 2018 Child Care Market Rate Survey
BURNS & ASSOCIATES, INC. Health Policy Consultants Licensed Centers page 9
Figure 8 illustrates the various discounts offered by licensed centers. The most common form of discount offered across the State was the additional sibling discount. The large majority of responding licensed centers did not offer an advanced payment or cash payment discount. However, more than a third offer other forms of discounted rates, such as corporate discounts, discounts to employees and their family members, or military discounts.
0.0%
10.0%
20.0%
30.0%
40.0%
50.0%
60.0%
70.0%
District I District II District III District IV District V District VI Statewide
Figure 8: Percentage of Licensed Centers Offering Discounts by Discount Type
Offers Additional Sibling Discount Offers Advanced Pay Discount
Offers Cash Payment Offers Other Discount

Arizona Department of Economic Security 2018 Child Care Market Rate Survey
BURNS & ASSOCIATES, INC. Health Policy Consultants Licensed Centers page 10
Licensed Centers - Access and Quality
Figure 9 highlights the distribution of providers for each district based on length of time in operation. Across all districts, at least 50% of licensed centers had been in operation for more than 10 years. Statewide, less than three percent of all providers responding to the survey question were in operation for less than one year, signaling a potentially stable and experienced market of licensed centers across the State.
Further, there appears to be a relationship between time in operation and median market rates for licensed centers. While only District I had a rate-based response for each age group and for each ‘time in operation’ grouping, there was a consistent increase in median daily rates as the age of a provider’s business increased. Figure 10 illustrates this for District I (Maricopa County).
Figure 10: District I Median Rates by Child Age Group and Provider Time in Operation
Infants (under 1)
Toddlers (1-2 years)
Preschoolers (3-5 years)
School Aged (6+ years)
Less than 1 year $40.00 $35.86 $30.00 $28.00 1-3 years $37.00 $35.00 $30.06 $27.50 4-5 years $46.50 $36.00 $31.54 $27.00 6-10 years $44.40 $40.00 $35.00 $27.00 More than 10 years $46.53 $40.60 $35.00 $31.00 Average Increase11 16% 13% 17% 11%
11 The average increase is calculated as the percent change in rate between providers in operation for less than 1 year and providers in operation for more than 10 years.
District I District II DistrictIII
DistrictIV District V District
VI Statewide
Less than 1 year 30 3 1 1 2 2 391-3 years 73 18 5 10 7 4 1174-5 years 50 10 3 10 4 4 816-10 years 124 27 20 8 7 5 191More than 10 years 561 192 53 64 26 37 933Total 838 250 82 93 46 52 1,361
- 100 200 300 400 500 600 700 800 900
1,000
Num
ber o
f Pro
vide
rs
Figure 9: Licensed Centers - Time in Operation

Arizona Department of Economic Security 2018 Child Care Market Rate Survey
BURNS & ASSOCIATES, INC. Health Policy Consultants Licensed Centers page 11
Figure 11 describes the average number of children cared for by licensed centers within each of the four age groupings, while figure 12 describes the range of children licensed centers are approved to care for across the State. Statewide, preschool-aged children (3 to 5 years old) account for 53 percent of full-day attendance and 46 percent of part-day attendance.
Figure 11: Total and Average Daily Attendance by Age Group and Attendance Frequency Age Group Attendance
Frequency District
I District
II District
III District
IV District
V District
VI Statewide
Infants (Under 1) – Average Daily Attendance
Full-time 10 5 8 9 11 3 8 Part-time 7 4 2 5 4 4 6
Infants (Under 1) – Total Daily Attendance
Full-time 3,194 659 135 163 107 78 4,336 Part-time 645 118 9 25 8 7 812
Toddlers (1-2 Years) – Average Daily Attendance
Full-time 23 13 13 19 15 8 19 Part-time 7 7 5 6 4 4 7
Toddlers (1-2 Years) – Total Daily Attendance
Full-time 10,366 2,131 602 718 270 222 14,309 Part-time 2,115 346 110 106 25 33 2,735
Preschool (3-5 years) - Average Daily Attendance
Full-time 38 27 28 30 28 19 33 Part-time 22 21 13 20 15 33 21
Preschool (3-5 years) - Total Daily Attendance
Full-time 23,097 5,407 1,862 2,223 922 789 34,300 Part-time 10,070 3,728 706 667 394 1,226 16,791
School Aged (6+ years) - Average Daily Attendance
Full-time 27 27 24 19 24 12 26 Part-time 30 29 15 18 18 7 27
School Aged (6+ years) - Total Daily Attendance
Full-time 9,120 1,538 549 487 355 108 12,157 Part-time 12,332 2,794 422 536 246 81 16,411
Total Full-Time Daily Attendance 45,777 9,735 3,148 3,591 1,654 1,197 65,102 Total Part-Time Daily Attendance 25,162 6,986 1,247 1,334 673 1,347 36,749
0
50
100
150
200
250
300
1-24 25-49 50-74 75-99 100-124 125-149 150-174 175-199 200 Plus
Statewide - Range of Approved Child Care Slots
Num
ber
of P
rovi
ders
Figure 12: Licensed Capacity for Licensed Centers

Arizona Department of Economic Security 2018 Child Care Market Rate Survey
BURNS & ASSOCIATES, INC. Health Policy Consultants Licensed Centers page 12
Figure 13 identifies the number of providers reporting accreditation by a national child care accrediting agency. Statewide, 13.1 percent of responding licensed centers reported having an accreditation from one of eight national agencies. The majority of providers (53 percent) that reported not having an accreditation felt the process was too costly or not worth the investment, while 29 percent indicated the process was too burdensome and 18 percent reported that their program did not meet the qualification criteria for accreditation.
-
200
400
600
800
1,000
1,200
1,400
1,600
District I District II District III District IV District V District VI Statewide
Figure 13: Licensed Center Accreditation
Accredited by a National Entity Not Accredited

Arizona Department of Economic Security 2018 Child Care Market Rate Survey
BURNS & ASSOCIATES, INC. Health Policy Consultants Licensed Centers page 13
Figure 14 identifies the volume of licensed centers providing child care to children with special needs. Statewide, more than 83 percent of licensed centers responding to the question reported providing child care to children with special needs, such as a physical disability, intellectual disability, or other special need, such as a behavioral disorder.
As demonstrated in Figure 15, providers that care for children with special needs generally charge higher rates when providing care to children with special needs.
Figure 15: Licensed Centers - Median Rate Differentials for Providing Care to Children with Special Needs Age Group Attendance Frequency District
I District
II District
III District
IV District
V District
VI Statewide
Infants (Under 1)
Provides Child Care to Special Needs Children $45.00 $43.03 $36.00 $30.00 $35.00 $35.50 $43.03
Does Not Provide Child Care to Special Needs Children $44.00 $36.00 $36.00 $23.00 $30.10 - $40.50
Toddlers (1-2 Years)
Provides Child Care to Special Needs Children $40.00 $38.25 $33.21 $28.00 $32.00 $30.00 $38.00
Does Not Provide Child Care to Special Needs Children $37.60 $34.00 $35.00 $24.00 $30.10 $24.62 $36.00
Preschoolers (3-5 Years)
Provides Child Care to Special Needs Children $35.00 $33.47 $30.36 $25.82 $30.00 $25.00 $33.47
Does Not Provide Child Care to Special Needs Children $31.08 $32.27 $30.34 $23.00 $25.00 $24.26 $30.17
School Aged (6+ Years)
Provides Child Care to Special Needs Children $30.00 $24.90 $28.00 $25.00 $25.00 $25.00 $28.00
Does Not Provide Child Care to Special Needs Children $28.44 $26.00 $28.50 $23.00 $28.00 $16.02 $27.50
-
200
400
600
800
1,000
1,200
1,400
1,600
District I District II District III District IV District V District VI Statewide
Figure 14: Licensed Centers - Special Needs Care
Does Not Provide Child Care to Special Needs Children
Provides Child Care to Special Needs Children

Arizona Department of Economic Security 2018 Child Care Market Rate Survey
BURNS & ASSOCIATES, INC. Health Policy Consultants Licensed Centers page 14
Figure 16 describes the percentage of licensed centers offering child care services outside of normal hours12 or flexible child care services, such as a “drop-in” service. Broadly speaking, licensed centers are less likely to offer flexible scheduling for parents and guardians seeking child care outside of normal licensed center hours than other provider types. For example, parents and guardians working night shifts between 6:30 pm and 6:00 am are strictly limited in their access to a licensed center for childcare, as fewer than 4 percent of licensed centers responding to this question offered these options. In comparison, more than 23 percent of approved homes offer child care services between 6:30 pm and 6:00 am, while 28 percent of certified group homes and more than 32 percent of unregulated homes responding to the survey question offered services between 6:30 pm and 6:00 am. Nearly a third of the licensed centers responding to the question offer a drop-in service, and of these, nearly 60 percent charge a premium rate for the drop-in service.
Figure 16: Percentage of Licensed Centers Offering Care Outside of Normal Hours and Other Flexible Options
District
I District
II District
III District
IV District
V District
VI Statewide Offers late night care (6:30 pm to midnight) 2.6% 1.6% 1.2% 5.4% 6.7% 6.1% 2.8%
Charges a premium rate for late night care 18.2% 25.0% 0.0% 20.0% 0.0% 33.3% 18.4% Offers all night care (midnight to 6:00 am) 0.8% 0.4% 0.0% 2.2% 4.4% 4.1% 1.0%
Charges a premium rate for all night care 14.3% 100.0% 0.0% 0.0% 0.0% 50.0% 21.4% Offers weekend care (Saturdays and Sundays) 2.6% 3.6% 1.2% 7.5% 4.4% 4.1% 3.1%
Charges a premium rate for weekend care 18.2% 22.2% 0.0% 0.0% 0.0% 100.0% 18.6% Offers extended care (12+ hours per day) 10.0% 4.0% 3.6% 8.6% 8.9% 8.2% 8.3%
Charges a premium rate for extended care 31.4% 90.0% 33.3% 37.5% 50.0% 75.0% 39.1% Offers a "Drop-in" service 35.6% 28.1% 20.5% 23.7% 22.2% 16.3% 31.4%
Charges a premium rate for drop-in service 61.0% 59.2% 47.1% 63.6% 60.0% 25.0% 59.6%
12 Normal working hours was defined in the survey as care provided Monday through Friday between 6:00 am and 6:30 pm.

Arizona Department of Economic Security 2018 Child Care Market Rate Survey
BURNS & ASSOCIATES, INC. Health Policy Consultants Approved Homes page 15
SECTION II – APPROVED HOMES
The survey was administered to 1,339 approved homes in Arizona. Figure 17 presents the response rate for approved homes for each of the six CCA Districts, and at the Statewide level.
Figure 17: Approved Home Response Rate by District District I District
II District
III District
IV District
V District
VI Statewide
Total Responses 346 116 21 151 27 43 704 Total Providers 651 221 39 289 57 82 1,339 Response Rate 53.1% 52.5% 53.8% 52.2% 47.4% 52.4% 52.6%
Highlights from the figures presented throughout this section include:
• The statewide median daily rates full-time care in an approved home was $20.00 for all ages.
• There is not a meaningful difference in median daily rates for providers that accept the DES child care subsidy compared to providers that do not, but approved homes are less likely to accept the DES child care subsidy than licensed centers.
• 36 percent of the approved homes responding to the survey across the state have been in operation for more than 10 years.
• Preschool-aged children (3-5 year olds) represent 36.4 percent of the average daily attendance for full-time care at an approved home, while school-aged children represent almost 75 percent of part-time attendance at an approved home.
• Fewer than 3 percent of responding approved homes reported holding an accreditation from a national organization. Most of the responding providers that offered a reason for not seeking accreditation felt the process was too costly or not worth the investment.
• Approved homes are much more likely to offer care outside of normal hours than licensed centers; more than 20 percent reported offering child care services between 6:30 pm and 6:00 am.

Arizona Department of Economic Security 2018 Child Care Market Rate Survey
BURNS & ASSOCIATES, INC. Health Policy Consultants Approved Homes page 16
Approved Homes - Market Rates
Figure 18 presents the 25th, 50th (median) and 75th percentile rates for approved homes in each district and each age group for full-time child care and part-time child care, respectively. Across all districts, the median daily rate for full-time care ranged from $15.00 to $27.00 per day while the median cost of part-time care ranged from $10.00 to $20.00 per day. Rates were highest for infants in District II (Pima County).
Figure 18: Approved Home Daily Rates for Full-Time and Part-Time Care Age Group
Rate Percentile
District I
District II
District III
District IV
District V
District VI
Statewide
Scho
ol a
ged
(6+
Yea
rs)
Full-Time
25th Percentile $15.00 $18.00 $20.00 $12.00 $20.00 $20.00 $15.00 50th Percentile $19.29 $22.86 $25.00 $15.00 $20.00 $20.00 $20.00 75th Percentile $25.00 $25.00 $26.00 $20.00 $25.50 $27.00 $25.00
Part-Time
25th Percentile $10.00 $12.00 $11.75 $10.00 $10.00 $10.00 $10.00 50th Percentile $15.00 $15.00 $15.00 $10.00 $13.50 $12.00 $13.50 75th Percentile $20.00 $21.43 $19.00 $14.82 $14.25 $13.50 $20.00
Pres
choo
lers
(3-5
Y
ears
)
Full-Time
25th Percentile $15.00 $20.00 $20.00 $13.00 $20.00 $20.00 $15.00 50th Percentile $20.00 $25.00 $25.00 $15.00 $24.00 $20.00 $20.00 75th Percentile $25.00 $25.00 $27.00 $20.00 $29.00 $26.50 $25.00
Part-Time
25th Percentile $10.00 $15.00 $12.50 $10.00 $9.50 $10.00 $10.00 50th Percentile $15.00 $20.00 $17.00 $11.43 $13.50 $12.75 $15.00 75th Percentile $21.25 $25.00 $19.00 $15.00 $18.75 $13.70 $20.00
Todd
lers
(1-2
Y
ears
)
Full-Time
25th Percentile $15.00 $20.00 $20.00 $14.82 $20.00 $20.00 $15.00 50th Percentile $20.00 $25.00 $25.00 $20.00 $27.00 $20.00 $20.00 75th Percentile $25.00 $25.00 $27.75 $20.00 $32.50 $26.00 $25.00
Part-Time
25th Percentile $10.00 $15.00 $15.00 $10.00 $9.50 $10.00 $10.00 50th Percentile $15.00 $20.00 $17.00 $12.50 $13.50 $12.75 $15.00 75th Percentile $25.00 $25.00 $20.00 $15.00 $18.75 $14.09 $20.00
Infa
nts (
Und
er 1
)
Full-Time
25th Percentile $15.00 $20.00 $20.00 $13.64 $20.00 $20.00 $15.00 50th Percentile $20.00 $25.00 $25.00 $20.00 $27.00 $20.00 $20.00 75th Percentile $29.50 $25.00 $28.25 $20.00 $35.00 $24.46 $25.00
Part-Time
25th Percentile $10.00 $15.00 $11.25 $10.00 $12.13 $10.00 $10.00 50th Percentile $15.00 $19.00 $16.00 $13.00 $18.00 $11.00 $15.00 75th Percentile $25.00 $20.71 $17.75 $15.00 $28.13 $13.50 $20.00

Arizona Department of Economic Security 2018 Child Care Market Rate Survey
BURNS & ASSOCIATES, INC. Health Policy Consultants Approved Homes page 17
Of the 704 approved homes providing a response to the survey, 696 (98.8 percent) responded to the question of whether or not they accepted the DES child care subsidy. Figure 19 illustrates the number of responding providers, by District, that accept and do not accept the DES child care subsidy. In comparison to licensed centers, of which nearly 70 percent of responding providers reported accepting the subsidy, less than half of responding approved homes across the State reported that they accepted the subsidy.
Figure 19: Approved Homes - Child Care Subsidy Acceptance by District District
I District
II District
III District
IV District
V District
VI Statewide
Accepts Subsidy 145 44 7 81 10 20 307 Does not Accept Subsidy 197 71 14 69 16 22 389 DES Subsidy Acceptance Rate 42.4% 38.3% 33.3% 54.0% 38.5% 47.6% 44.1%
The analysis explored the extent to which there is a difference in the median rate charged by approved homes that accept the DES child care subsidy and those that do not. As illustrated in Figure 20, there is not a consistent relationship the median daily rates and whether the provider accepts or does not accept the DES child care subsidy.
$0 $5 $10 $15 $20 $25 $30 $35
<1 Year Old1-2 Years Old3-5 Years OldSchool Aged<1 Year Old
1-2 Years Old3-5 Years OldSchool Aged<1 Year Old
1-2 Years Old3-5 Years OldSchool Aged<1 Year Old
1-2 Years Old3-5 Years OldSchool Aged<1 Year Old
1-2 Years Old3-5 Years OldSchool Aged<1 Year Old
1-2 Years Old3-5 Years OldSchool Aged<1 Year Old
1-2 Years Old3-5 Years OldSchool Aged
Dis
trict
ID
istri
ct II
Dis
trict
IIID
istri
ct IV
Dis
trict
VD
istri
ct V
ISt
atew
ide
Median Daily Rate
Figure 20: Full-Time Median Rate Comparison for Approved Homes Accepting and Not Accepting the DES Child Care Subsidy
Does Not Accept Subsidy Accepts Subsidy

Arizona Department of Economic Security 2018 Child Care Market Rate Survey
BURNS & ASSOCIATES, INC. Health Policy Consultants Approved Homes page 18
Of the 704 approved homes responding to the survey, 687 (97.6 percent) responded to the question of whether or not they were accredited by a national accrediting entity. 13 Statewide, 15 of the 687 responding providers (2.2 percent) reported being accredited, with District accreditation rates ranging from 0.0 percent (Districts V and VI) to 9.5 percent (District III). Because so few providers reported having an accreditation, there is no material difference in the median rates charged at the statewide level, as demonstrated in Figure 21.
13 This question asked whether providers were accredited by one of eight national accrediting agencies, including the American Montessori Society, Association for Christian Schools International, Association for Early Learning Leaders, Council on Accreditation, National Association for the Education of Young Children, National Early Childhood Program Accreditation, Council for Professional Recognition, or National Association for Family Child Care.
$0 $5 $10 $15 $20 $25 $30 $35 $40 $45
<1 Year Old1-2 Years Old3-5 Years OldSchool Aged<1 Year Old
1-2 Years Old3-5 Years OldSchool Aged<1 Year Old
1-2 Years Old3-5 Years OldSchool Aged<1 Year Old
1-2 Years Old3-5 Years OldSchool Aged<1 Year Old
1-2 Years Old3-5 Years OldSchool Aged<1 Year Old
1-2 Years Old3-5 Years OldSchool Aged<1 Year Old
1-2 Years Old3-5 Years OldSchool Aged
Dis
trict
ID
istri
ct II
Dis
trict
III
Dis
trict
IVD
istri
ct V
Dis
trict
VI
Stat
ewid
e
Median Daily Rate
Figure 21: Full-Time Median Rate Comparison for Accredited and Non-Accredited Providers
Is Not Accredited Is Accredited

Arizona Department of Economic Security 2018 Child Care Market Rate Survey
BURNS & ASSOCIATES, INC. Health Policy Consultants Approved Homes page 19
Figure 22 illustrates various discounts offered by approved homes and the extent to which they are offered. The most common form of discount offered across the State is the additional sibling discount. Compared to licensed centers (of which only 6.6 percent reported offering a cash payment discount), nearly 30 percent of approved homes across the State offer this discount.
0.0%
10.0%
20.0%
30.0%
40.0%
50.0%
60.0%
District I District II District III District IV District V District VI Statewide
Figure 22: Percentage of Approved Homes Offering Discounts by Discount Type
Offers Additional Sibling Discount Offers Advanced Pay Discount
Offers Cash Payment Offers Other Discount

Arizona Department of Economic Security 2018 Child Care Market Rate Survey
BURNS & ASSOCIATES, INC. Health Policy Consultants Approved Homes page 20
Approved Homes - Access and Quality
Figure 23 highlights the distribution of providers for each district based on length of time in operation. Across all districts, 36 percent of approved homes reported being in operation for more than 10 years, while fewer than 10 percent reported being in operation for less than one year.
District I DistrictII
DistrictIII
DistrictIV
DistrictV
DistrictVI
Statewide
Less than 1 year 25 7 1 29 1 2 651-3 years 82 29 1 53 7 8 1804-5 years 44 15 2 24 2 3 906-10 years 63 18 3 15 6 7 112More than 10 years 131 46 13 30 10 23 253Total 345 115 20 151 26 43 700
-
50
100
150
200
250
300
Num
ber o
f Pro
vide
rsFigure 23: Approved Homes Time in Operation

Arizona Department of Economic Security 2018 Child Care Market Rate Survey
BURNS & ASSOCIATES, INC. Health Policy Consultants Approved Homes page 21
Figure 24 describes the average number of children cared for by approved homes within each of the four age groupings, while figure 25 describes the range of slots providers are approved to care for across the State. Statewide, preschool-aged children (3 to 5 years old) account for the largest group of children receiving full-time care from an approved home (36.4 percent of the total) while school age children represent almost 75 percent of part-time attendance.
Figure 24: Total and Average Daily Attendance by Age Group and Attendance Frequency Age Group Attendance
Frequency District
I District
II District
III District
IV District
V District
VI Statewide
Infants (Under 1) – Average Daily Attendance
Full-time 1 1 1 1 1 1 1 Part-time 1 1 2 1 - 5 1
Infants (Under 1) – Total Daily Attendance
Full-time 106 27 12 31 6 13 195 Part-time 11 2 2 5 - 5 25
Toddlers (1-2 Years) – Average Daily Attendance
Full-time 2 2 2 2 1 2 2 Part-time 2 3 1 1 2 7 2
Toddlers (1-2 Years) – Total Daily Attendance
Full-time 318 115 19 88 23 33 596 Part-time 49 25 4 6 3 22 109
Preschool (3-5 years) - Average Daily Attendance
Full-time 2 2 3 2 2 2 2 Part-time 2 2 3 1 2 3 2
Preschool (3-5 years) - Total Daily Attendance
Full-time 432 144 42 155 45 38 856 Part-time 95 32 5 25 12 6 175
School Aged (6+ years) - Average Daily Attendance
Full-time 2 3 3 2 2 2 2 Part-time 3 3 2 3 3 2 3
School Aged (6+ years) - Total Daily Attendance
Full-time 336 115 36 144 28 46 705 Part-time 457 140 15 253 20 35 920
Total Full-Time Daily Attendance 1,192 401 109 418 102 130 2,352 Total Part-Time Daily Attendance 612 199 26 289 35 68 1,229
-
50
100
150
200
250
300
350
400
1 2 3 4 5 6 7 or more
Num
ber o
f Pro
vide
rs
Statewide- Range of Approved Child Care Slots
Figure 25: Licensed Capacity for Approved Homes

Arizona Department of Economic Security 2018 Child Care Market Rate Survey
BURNS & ASSOCIATES, INC. Health Policy Consultants Approved Homes page 22
Figure 26 identifies the number of providers reporting accreditation by a national child care accrediting agency. Statewide, only 2.2 percent of responding approved homes reported having an accreditation from one of eight national agencies, compared to 13.1 percent of the licensed centers (Statewide) that reported being accredited. The majority of approved homes (55 percent) that reported not having an accreditation felt the process was too costly or not worth the investment, while 29 percent indicated the process was too burdensome and 16 percent reported that their program did not meet the qualification criteria for accreditation.
-
100
200
300
400
500
600
700
800
District I District II District III District IV District V District VI Statewide
Figure 26: Approved Home Accreditation
Accredited by a National Entity Not Accredited

Arizona Department of Economic Security 2018 Child Care Market Rate Survey
BURNS & ASSOCIATES, INC. Health Policy Consultants Approved Homes page 23
Figure 27 identifies the volume of approved homes that reported providing child care to children with special needs. Statewide, fewer than a third of responding approved homes reported providing child care to children with special needs.
As demonstrated in Figure 28, providers that care for children with special needs generally, but do not always, charge higher daily median rates when providing this care.
Figure 28: Approved Homes - Median Rate Differentials for Providing Care to Children with Special Needs Age Group Attendance Frequency District
I District
II District
III District
IV District
V District
VI Statewide
Infants (Under 1)
Provides Child Care to Special Needs Children $25.00 $25.00 $25.00 $15.00 $35.00 $20.00 $24.00
Does Not Provide Child Care to Special Needs Children $20.00 $24.00 $20.00 $20.00 $25.00 $20.00 $20.00
Toddlers (1-2 Years)
Provides Child Care to Special Needs Children $20.00 $25.00 $25.00 $20.00 $27.00 $20.00 $22.00
Does Not Provide Child Care to Special Needs Children $20.00 $24.00 $20.00 $20.00 $26.00 $20.00 $20.00
Preschoolers (3-5 Years)
Provides Child Care to Special Needs Children $20.00 $25.00 $25.00 $15.00 $20.00 $20.00 $20.00
Does Not Provide Child Care to Special Needs Children $20.00 $24.50 $20.00 $15.00 $26.00 $20.00 $20.00
School Aged (6+ Years)
Provides Child Care to Special Needs Children $20.00 $20.00 $25.00 $15.00 $20.00 $25.00 $20.00
Does Not Provide Child Care to Special Needs Children $15.71 $24.00 $22.50 $15.00 $20.00 $20.00 $20.00
-
100
200
300
400
500
600
700
800
District I District II District III District IV District V District VI Statewide
Figure 27: Approved Homes - Special Needs Care
Does Not Provide Child Care to Special Needs Children
Provides Child Care to Special Needs Children

Arizona Department of Economic Security 2018 Child Care Market Rate Survey
BURNS & ASSOCIATES, INC. Health Policy Consultants Approved Homes page 24
Figure 29 describes the percentage of approved homes offering child care services outside of normal hours14 or flexible child care services, such as a “drop-in” service. Broadly speaking, approved homes are more likely to offer flexible scheduling for parents and guardians seeking child care outside of normal hours than licensed centers. For example, parents and guardians working night shifts between 6:30 pm and 6:00 am have better access to care during these hours through approved homes compared to licensed centers, as more than 20 percent of responding approved homes reported offering all night care, while more than 30 percent of approved homes reported offering late night care. In contrast, fewer than 3 percent of licensed centers statewide offered care during these hours.
Figure 29: Percentage of Approved Homes Offering Care Outside of Normal Hours and Other Flexible Options
District
I District
II District
III District
IV District
V District
VI Statewide Offers late night care (6:30 pm to midnight) 30.9% 38.8% 52.4% 27.2% 29.6% 41.9% 32.7%
Charges a premium rate for late night care 36.4% 28.9% 9.1% 22.0% 25.0% 16.7% 29.1% Offers all night care (midnight to 6:00 am) 21.1% 29.3% 38.1% 18.5% 25.9% 30.2% 23.2%
Charges a premium rate for all night care 39.7% 44.1% 0.0% 25.0% 28.6% 15.4% 33.7% Offers weekend care (Saturdays and Sundays) 51.2% 60.3% 57.1% 43.0% 59.3% 58.1% 51.8%
Charges a premium rate for weekend care 28.8% 28.6% 8.3% 23.1% 18.8% 20.0% 26.0% Offers extended care (12+ hours per day) 34.4% 41.4% 38.1% 35.1% 48.1% 46.5% 37.1%
Charges a premium rate for extended care 45.4% 52.1% 25.0% 32.1% 30.8% 20.0% 40.6% Offers a "Drop-in" service 36.7% 38.8% 52.4% 30.5% 44.4% 34.9% 36.4%
Charges a premium rate for drop-in service 36.2% 37.8% 18.2% 28.3% 33.3% 26.7% 33.6%
14 Normal working hours was defined in the survey as care provided Monday through Friday between 6:00 am and 6:30 pm.

Arizona Department of Economic Security 2018 Child Care Market Rate Survey
BURNS & ASSOCIATES, INC. Health Policy Consultants Certified Group Homes page 25
SECTION III – CERTIFIED GROUP HOMES
The survey was administered to 263 certified group homes in Arizona. Figure 30 presents the response rate for certified group homes for each of the six CCA Districts, and at the Statewide level.
Figure 30: Certified Group Homes Response Rate by District District I District
II District
III District
IV District
V District
VI Statewide
Total Responses 89 71 10 16 7 7 200 Total Providers 127 87 11 21 10 7 263 Response Rate 70.1% 81.6% 90.9% 76.2% 70.0% 100.0% 76.0%
Highlights from the figures presented throughout this section include:
• The statewide median daily rates full-time care in a certified group home was $30.03 for children under 1, $28.00 for 1-2-year olds, $28.00 for 3-5-year olds, and $25.00 for school aged children.
• There is not a meaningful difference in median daily rates for providers that accept the DES child care subsidy compared to providers that do not.
• 62 percent of the certified group homes responding to the survey across the state have been in operation for more than 10 years.
• Statewide, nearly 73 percent of certified group homes accept the DES child care subsidy.
• Providers that have been in operation for longer than 10 years charge a median rate that is an average of 16 percent higher across all age groups than providers that reported being in operation for less than one year.
• Preschool-aged children (3-5 year olds) represented the largest age group of children attending full-time child care at a certified group home with 42.9 percent of the average daily attendance across all age groups, while school aged children represent the largest age group attending part-time child care at a certified group home, with 37.6 percent of the average daily attendance for part-time care being attributed to this group.
• Statewide, 14.3 percent of responding certified group homes reported holding an accreditation from a national organization.
• Nearly 70 percent of responding certified group homes offer care to children with special needs, far exceeding the 31 percent rate reported by responding approved homes, but less than the 83.6 percent of licensed centers that reported providing this care.
Arizona Department of Economic Security 2018 Child Care Market Rate Survey
BURNS & ASSOCIATES, INC. Health Policy Consultants Certified Group Homes page 26
Certified Group Homes - Market Rates
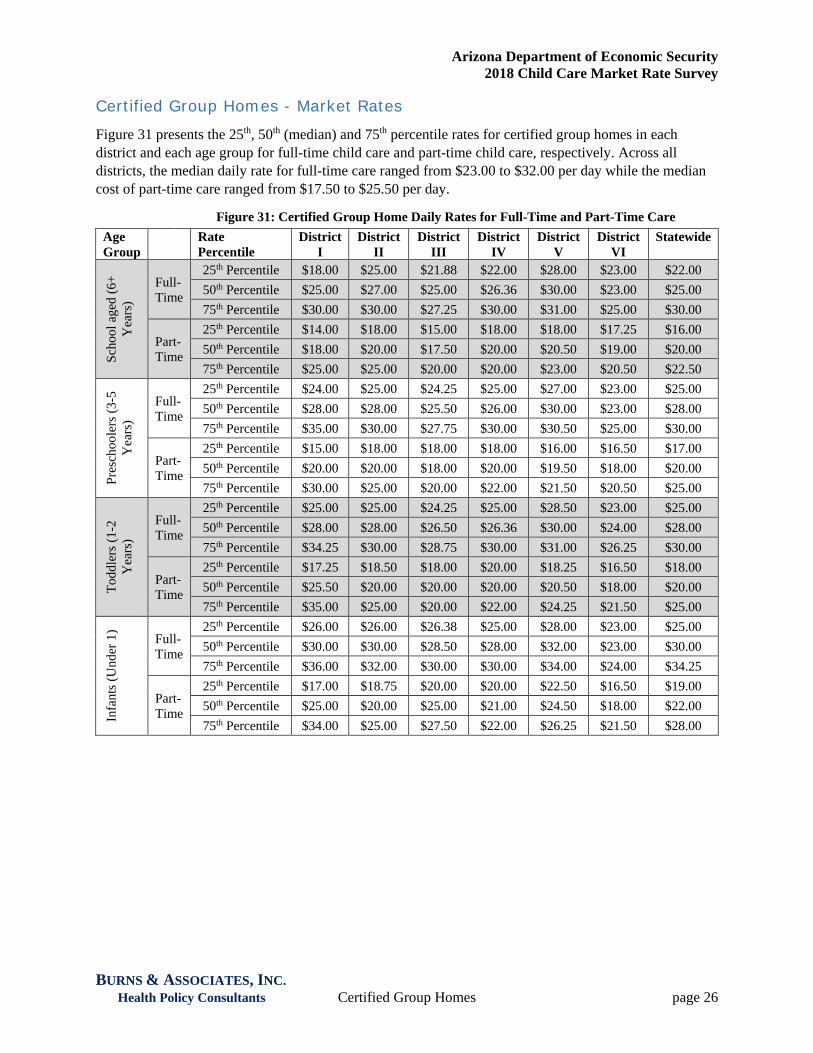
Figure 31 presents the 25th, 50th (median) and 75th percentile rates for certified group homes in each district and each age group for full-time child care and part-time child care, respectively. Across all districts, the median daily rate for full-time care ranged from $23.00 to $32.00 per day while the median cost of part-time care ranged from $17.50 to $25.50 per day.
Figure 31: Certified Group Home Daily Rates for Full-Time and Part-Time Care Age Group
Rate Percentile
District I
District II
District III
District IV
District V
District VI
Statewide
Scho
ol a
ged
(6+
Yea
rs)
Full-Time
25th Percentile $18.00 $25.00 $21.88 $22.00 $28.00 $23.00 $22.00 50th Percentile $25.00 $27.00 $25.00 $26.36 $30.00 $23.00 $25.00 75th Percentile $30.00 $30.00 $27.25 $30.00 $31.00 $25.00 $30.00
Part-Time
25th Percentile $14.00 $18.00 $15.00 $18.00 $18.00 $17.25 $16.00 50th Percentile $18.00 $20.00 $17.50 $20.00 $20.50 $19.00 $20.00 75th Percentile $25.00 $25.00 $20.00 $20.00 $23.00 $20.50 $22.50
Pres
choo
lers
(3-5
Y
ears
)
Full-Time
25th Percentile $24.00 $25.00 $24.25 $25.00 $27.00 $23.00 $25.00 50th Percentile $28.00 $28.00 $25.50 $26.00 $30.00 $23.00 $28.00 75th Percentile $35.00 $30.00 $27.75 $30.00 $30.50 $25.00 $30.00
Part-Time
25th Percentile $15.00 $18.00 $18.00 $18.00 $16.00 $16.50 $17.00 50th Percentile $20.00 $20.00 $18.00 $20.00 $19.50 $18.00 $20.00 75th Percentile $30.00 $25.00 $20.00 $22.00 $21.50 $20.50 $25.00
Todd
lers
(1-2
Y
ears
)
Full-Time
25th Percentile $25.00 $25.00 $24.25 $25.00 $28.50 $23.00 $25.00 50th Percentile $28.00 $28.00 $26.50 $26.36 $30.00 $24.00 $28.00 75th Percentile $34.25 $30.00 $28.75 $30.00 $31.00 $26.25 $30.00
Part-Time
25th Percentile $17.25 $18.50 $18.00 $20.00 $18.25 $16.50 $18.00 50th Percentile $25.50 $20.00 $20.00 $20.00 $20.50 $18.00 $20.00 75th Percentile $35.00 $25.00 $20.00 $22.00 $24.25 $21.50 $25.00
Infa
nts (
Und
er 1
)
Full-Time
25th Percentile $26.00 $26.00 $26.38 $25.00 $28.00 $23.00 $25.00 50th Percentile $30.00 $30.00 $28.50 $28.00 $32.00 $23.00 $30.00 75th Percentile $36.00 $32.00 $30.00 $30.00 $34.00 $24.00 $34.25
Part-Time
25th Percentile $17.00 $18.75 $20.00 $20.00 $22.50 $16.50 $19.00 50th Percentile $25.00 $20.00 $25.00 $21.00 $24.50 $18.00 $22.00 75th Percentile $34.00 $25.00 $27.50 $22.00 $26.25 $21.50 $28.00

Arizona Department of Economic Security 2018 Child Care Market Rate Survey
BURNS & ASSOCIATES, INC. Health Policy Consultants Certified Group Homes page 27
Of the 200 certified group homes providing a response to the survey, 198 (99.0 percent) responded to the question of whether or not they accepted the DES child care subsidy. Figure 32 illustrates the number of responding providers, by District, that accept and do not accept the DES child care subsidy. Similar to the child care subsidy acceptance rate of licensed centers, nearly 73 percent of responding certified group homes reported accepting the subsidy.
Figure 32: Certified Group Homes - Child Care Subsidy Acceptance by District District
I District
II District
III District
IV District
V District
VI Statewide
Accepts Subsidy 52 58 7 15 5 7 144 Does not Accept Subsidy 35 13 3 1 2 0 54 DES Subsidy Acceptance Rate 59.8% 81.7% 70.0% 93.8% 71.4% 100.0% 72.7%
The analysis explored the extent to which there is a difference in the median rate charged by providers that accept child care subsidies and those that do not. As illustrated in Figure 33, there is not a consistent relationship the median daily rates and whether the provider accepts or does not accept the DES child care subsidy.
$0 $5 $10 $15 $20 $25 $30 $35 $40 $45
<1 Year Old
3-5 Years Old
<1 Year Old
3-5 Years Old
<1 Year Old
3-5 Years Old
<1 Year Old
3-5 Years Old
<1 Year Old
3-5 Years Old
<1 Year Old
3-5 Years Old
<1 Year Old
3-5 Years Old
Dis
trict
ID
istri
ct II
Dis
trict
III
Dis
trict
IVD
istri
ct V
Dis
trict
VI
Stat
ewid
e
Median Daily Rate
Figure 33: Full-Time Median Rate Comparison for Certified Group Homes Accepting and Not Accepting the Child Care Subsidy
Does Not Accept Subsidy Accepts Subsidy

Arizona Department of Economic Security 2018 Child Care Market Rate Survey
BURNS & ASSOCIATES, INC. Health Policy Consultants Certified Group Homes page 28
Of the 200 certified group homes responding to the survey, 196 (98.0 percent) responded to the question of whether or not they were accredited by a national accrediting entity.15 Statewide, 28 of the 196 responding providers (14.3 percent) reported being accredited, with District accreditation rates ranging from 0.0 percent (District V) to 43.8 percent (District IV). Because so few providers reported having an accreditation, there is no material difference in the median rates charged at the statewide level, as demonstrated in Figure 34.
15 This question asked whether providers were accredited by one of eight national accrediting agencies, including American Montessori Society, Association for Christian Schools International, Association for Early Learning Leaders, Council on Accreditation, National Association for the Education of Young Children, National Early Childhood Program Accreditation, Council for Professional Recognition, and National Association for Family Child Care.
$0 $5 $10 $15 $20 $25 $30 $35
<1 Year Old1-2 Years Old3-5 Years OldSchool Aged<1 Year Old
1-2 Years Old3-5 Years OldSchool Aged<1 Year Old
1-2 Years Old3-5 Years OldSchool Aged<1 Year Old
1-2 Years Old3-5 Years OldSchool Aged<1 Year Old
1-2 Years Old3-5 Years OldSchool Aged<1 Year Old
1-2 Years Old3-5 Years OldSchool Aged<1 Year Old
1-2 Years Old3-5 Years OldSchool Aged
Dis
trict
ID
istri
ct II
Dis
trict
III
Dis
trict
IVD
istri
ct V
Dis
trict
VI
Stat
ewid
e
Median Daily Rate
Figure 34: Full-Time Median Rate Comparison for Accredited and Non-Accredited Providers
Is Not Accredited Is Accredited

Arizona Department of Economic Security 2018 Child Care Market Rate Survey
BURNS & ASSOCIATES, INC. Health Policy Consultants Certified Group Homes page 29
Figure 35 illustrates various discounts offered by certified group homes and the extent to which they are offered. The most common form of discount offered across the State is an additional sibling discount. Compared to licensed centers (of which only 6.6 percent reported offering a cash payment discount), more than 20 percent of certified group homes across the State offer this discount.
0.0%
10.0%
20.0%
30.0%
40.0%
50.0%
60.0%
District I District II District III District IV District V District VI Statewide
Figure 35: Percentage of Certified Group Homes Offering Discounts by Discount Type
Offers Additional Sibling Discount Offers Advanced Pay Discount
Offers Cash Payment Offers Other Discount

Arizona Department of Economic Security 2018 Child Care Market Rate Survey
BURNS & ASSOCIATES, INC. Health Policy Consultants Certified Group Homes page 30
Certified Group Homes - Access and Quality
Figure 36 highlights the distribution of certified group homes for each district based on length of time in operation. Across all districts, 62 percent of certified group homes reported being in operation for more than 10 years, while fewer than 6 percent reported being in operation for less than one year, signaling a potentially stable child care market for certified group homes.
District I District II DistrictIII
DistrictIV District V District
VI Statewide
Less than 1 year 6 1 1 1 - - 91-3 years 13 8 2 - 1 - 244-5 years 7 4 1 - 1 - 136-10 years 10 12 1 5 2 - 30More than 10 years 52 46 5 10 3 7 123Total 88 71 10 16 7 7 199
(10)
10
30
50
70
90
110
130
150
Num
ber o
f Pro
vide
rs
Figure 36: Certified Group Homes Time in Operation

Arizona Department of Economic Security 2018 Child Care Market Rate Survey
BURNS & ASSOCIATES, INC. Health Policy Consultants Certified Group Homes page 31
Figure 37 describes the average number of children cared for by certified group homes within each of the four age groupings, while figure 38 describes the number of children certified group homes are approved to care for across the State. Statewide, preschool-aged children (3 to 5 years old) account for the largest group of children receiving full-time care from certified group homes (42.9 percent of the total) while school age children represent 37.6 percent of part-time attendance.
Figure 37: Total and Average Daily Attendance by Age Group and Attendance Frequency Age Group Attendance
Frequency District
I District
II District
III District
IV District
V District
VI Statewide
Infants (Under 1) – Average Daily Attendance
Full-time 2 2 2 2 4 2 2 Part-time 9 9 1 1 - 10 7
Infants (Under 1) – Total Daily Attendance
Full-time 92 70 5 16 7 2 192 Part-time 34 35 1 1 - 10 81
Toddlers (1-2 Years) – Average Daily Attendance
Full-time 3 3 3 3 3 1 3 Part-time 4 4 3 - - 19 5
Toddlers (1-2 Years) – Total Daily Attendance
Full-time 214 167 34 47 20 1 483 Part-time 57 46 5 - - 38 146
Preschool (3-5 years) - Average Daily Attendance
Full-time 4 4 4 4 5 5 4 Part-time 7 6 2 1 - 19 7
Preschool (3-5 years) - Total Daily Attendance
Full-time 275 247 43 62 33 31 691 Part-time 127 68 2 1 - 38 236
School Aged (6+ years) - Average Daily Attendance
Full-time 4 3 3 2 - 6 3 Part-time 4 5 3 3 4 15 5
School Aged (6+ years) - Total Daily Attendance
Full-time 102 102 5 17 - 17 243 Part-time 68 134 11 16 4 46 279
Total Full-Time Daily Attendance 683 586 87 142 60 51 1,609 Total Part-Time Daily Attendance 286 283 19 18 4 132 742
-
20
40
60
80
100
120
140
160
180
8 or less 9 10 11 12 or more
Num
ber o
f Pro
vide
rs
Statewide- Range of Approved Child Care Slots
Figure 38: Licensed Capacity for Certified Group Homes

Arizona Department of Economic Security 2018 Child Care Market Rate Survey
BURNS & ASSOCIATES, INC. Health Policy Consultants Certified Group Homes page 32
Figure 39 identifies the number of providers reporting accreditation by a national child care accrediting agency. Statewide, 14.3 percent of responding certified group homes reported having an accreditation from one of eight national agencies, compared to 13.1 percent of the licensed centers (Statewide) that reported being accredited. The primary reasons certified group homes reported for not being accredited were that the process was either too burdensome (cited by 38 percent of responding providers) or too costly or not worth the investment (38 percent). An additional 24 percent indicated that their program did not meet the qualification criteria for accreditation.
-
20
40
60
80
100
120
140
160
180
200
District I District II District III District IV District V District VI Statewide
Figure 39: Certified Group Home Accreditation
Accredited by a National Entity Not Accredited

Arizona Department of Economic Security 2018 Child Care Market Rate Survey
BURNS & ASSOCIATES, INC. Health Policy Consultants Certified Group Homes page 33
Figure 40 identifies the volume of approved homes providing child care to children with special needs. Statewide, nearly 70 percent of responding certified group homes reported providing child care to children with special needs, a rate far exceeding the 31 percent of approved homes that reported providing child care to children with special needs, but less than the 83.6 percent of licensed centers that reported providing this care.
As demonstrated in Figure 41, certified group homes that care for children with special needs generally have lower median rates than certified group homes that reported not providing care to children with special needs.
Figure 41: Certified Group Homes - Median Rate Differentials for Providing Care to Children with Special Needs Age Group Attendance Frequency District
I District
II District
III District
IV District
V District
VI Statewide
Infants (Under 1)
Provides Child Care to Special Needs Children $29.00 $30.00 $28.25 $29.00 $31.00 $23.00 $30.00
Does Not Provide Child Care to Special Needs Children $33.50 $30.00 $29.00 $25.00 $32.00 - $30.00
Toddlers (1-2 Years)
Provides Child Care to Special Needs Children $26.00 $28.00 $26.50 $27.00 $29.50 $23.00 $28.00
Does Not Provide Child Care to Special Needs Children $30.00 $28.00 $26.50 $25.00 $32.00 $30.00 $29.00
Preschoolers (3-5 Years)
Provides Child Care to Special Needs Children $25.00 $28.00 $25.50 $26.50 $29.50 $23.00 $26.00
Does Not Provide Child Care to Special Needs Children $30.00 $28.00 $26.50 $25.00 $30.00 $30.00 $29.00
School Aged (6+ Years)
Provides Child Care to Special Needs Children $24.00 $27.50 $25.00 $26.36 $30.00 $23.00 $25.00
Does Not Provide Child Care to Special Needs Children $30.00 $25.00 $25.00 $26.00 - $30.00 $26.50
-
20
40
60
80
100
120
140
160
180
200
District I District II District III District IV District V District VI Statewide
Figure 40: Certified Group Homes - Special Needs Care
Does Not Provide Child Care to Special Needs Children
Provides Child Care to Special Needs Children

Arizona Department of Economic Security 2018 Child Care Market Rate Survey
BURNS & ASSOCIATES, INC. Health Policy Consultants Certified Group Homes page 34
Figure 42 describes the percentage of certified group homes offering child care services outside of normal hours,16 or flexible child care services, such as a “drop-in” service. Broadly speaking, certified group homes are more likely to offer flexible scheduling for parents and guardians seeking child care outside of normal hours than licensed centers. For example, parents and guardians working night shifts between 6:30 pm and 6:00 am have better access to care during these hours, as 28 percent of responding certified group homes reported offering all night care, while 36 percent of responding certified group homes reported offering late night care. In contrast, fewer than 3 percent of licensed centers across the State offered care during these hours.
Figure 42: Percentage of Certified Group Homes Offering Care Outside of Normal Hours and Other Flexible Options
District
I District
II District
III District
IV District
V District
VI Statewide Offers late night care (6:30 pm to midnight) 27.0% 53.5% 20.0% 31.3% 14.3% 28.6% 36.0%
Charges a premium rate for late night care 29.2% 13.2% 50.0% 0.0% 100.0% 0.0% 19.4% Offers all night care (midnight to 6:00 am) 20.2% 40.8% 20.0% 25.0% 14.3% 28.6% 28.0%
Charges a premium rate for all night care 27.8% 27.6% 100.0% 25.0% 0.0% 0.0% 28.6% Offers weekend care (Saturdays and Sundays) 24.7% 53.5% 20.0% 37.5% 42.9% 28.6% 36.5%
Charges a premium rate for weekend care 31.8% 21.1% 100.0% 0.0% 33.3% 0.0% 24.7% Offers extended care (12+ hours per day) 30.3% 31.0% 20.0% 18.8% 28.6% 42.9% 29.5%
Charges a premium rate for extended care 66.7% 86.4% 50.0% 100.0% 50.0% 33.3% 72.9% Offers a "Drop-in" service 47.2% 42.3% 40.0% 25.0% 57.1% 42.9% 43.5%
Charges a premium rate for drop-in service 50.0% 46.7% 25.0% 0.0% 25.0% 33.3% 43.7%
16 Normal working hours was defined in the survey as care provided Monday through Friday between 6:00 am and 6:30 pm.

Arizona Department of Economic Security 2018 Child Care Market Rate Survey
BURNS & ASSOCIATES, INC. Health Policy Consultants Unregulated Homes page 35
SECTION IV – UNREGULATED HOMES
The survey was administered to 326 unregulated homes in Arizona. Figure 43 presents the response rate for certified group homes for each of the six CCA Districts, and at the Statewide level.
Figure 43: Unregulated Homes Response Rate by District District I District
II District
III District
IV District
V District
VI Statewide
Total Responses 51 77 3 37 14 46 228 Total Providers 75 119 5 45 18 64 326 Response Rate 68.0% 64.7% 60.0% 82.2% 77.8% 71.9% 69.9%
Highlights from the figures presented throughout this section include:
• The statewide median daily rates for full-time care in unregulated homes was $25.00 for children of all ages.
• There is not a meaningful difference in median daily rates for providers that accept the DES child care subsidy compared to providers that do not.
• More than 51 percent of the unregulated homes responding to the survey across the state have been in operation for more than 10 years.
• Statewide, nearly 90 percent of unregulated homes accept the DES child care subsidy, which is the highest acceptance rate across the four provider types.
• Statewide, preschool-aged children (3 to 5 years old) account for the largest group of children receiving full-time care from unregulated homes (36.9 percent of the total) while school age children represent the largest age group of children receiving child care from an unregulated home part-time, with 57.2 percent of the total daily attendance being attributed to this group.
• Fewer than 11 percent of responding unregulated homes reported holding an accreditation from a national organization.

Arizona Department of Economic Security 2018 Child Care Market Rate Survey
BURNS & ASSOCIATES, INC. Health Policy Consultants Unregulated Homes page 36
Unregulated Homes - Market Rates
Figure 44 presents the 25th, 50th (median) and 75th percentile rates for unregulated homes in each district and each age group for full-time child care and part-time child care, respectively. Across all districts, the median daily rate for full-time care ranged from $21.71 to $30.00 per day while the median cost of part-time care ranged from $15.00 to $20.00 per day.
Figure 44: Unregulated Home Daily Rates for Full-Time and Part-Time Care Age Group
Rate Percentile
District I
District II
District III
District IV
District V
District VI
Statewide
Scho
ol a
ged
(6+
Yea
rs)
Full-Time
25th Percentile $18.50 $25.00 $23.00 $20.00 $25.00 $20.00 $20.00 50th Percentile $21.71 $25.00 $25.00 $25.00 $25.50 $25.00 $25.00 75th Percentile $25.00 $25.00 $27.50 $26.50 $30.00 $25.00 $25.00
Part-Time
25th Percentile $12.00 $14.14 $14.00 $15.00 $15.00 $12.00 $13.00 50th Percentile $15.00 $15.00 $15.00 $15.00 $18.00 $15.00 $15.00 75th Percentile $20.00 $18.00 $17.50 $18.00 $18.50 $20.00 $20.00
Pres
choo
lers
(3-5
Y
ears
)
Full-Time
25th Percentile $20.00 $25.00 $23.00 $22.00 $25.00 $20.00 $21.51 50th Percentile $24.50 $25.00 $25.00 $25.00 $25.50 $25.00 $25.00 75th Percentile $29.50 $25.00 $27.50 $25.00 $30.00 $26.00 $25.00
Part-Time
25th Percentile $12.00 $14.00 $14.00 $15.00 $16.50 $12.00 $13.13 50th Percentile $15.00 $15.00 $15.00 $16.00 $18.00 $15.00 $15.00 75th Percentile $20.00 $19.00 $17.50 $18.00 $19.00 $20.00 $20.00
Todd
lers
(1-2
Y
ears
)
Full-Time
25th Percentile $20.00 $25.00 $23.00 $22.00 $25.00 $25.00 $23.00 50th Percentile $25.00 $25.00 $25.00 $25.00 $30.00 $25.00 $25.00 75th Percentile $30.00 $25.00 $27.50 $25.00 $30.00 $28.00 $28.00
Part-Time
25th Percentile $12.00 $14.00 $14.75 $15.00 $15.75 $14.25 $14.14 50th Percentile $17.00 $15.00 $16.50 $17.00 $18.00 $15.00 $15.00 75th Percentile $20.00 $20.00 $18.25 $18.00 $18.00 $25.00 $20.00
Infa
nts (
Und
er 1
)
Full-Time
25th Percentile $21.43 $25.00 $23.25 $24.25 $28.50 $25.00 $25.00 50th Percentile $25.00 $25.00 $25.50 $25.00 $30.00 $25.00 $25.00 75th Percentile $30.00 $25.00 $27.75 $25.00 $30.00 $26.75 $28.75
Part-Time
25th Percentile $11.68 $14.00 $14.00 $15.00 $18.00 $15.00 $15.00 50th Percentile $17.50 $15.00 $15.00 $17.00 $20.00 $16.00 $15.00 75th Percentile $20.00 $20.00 $17.50 $18.00 $20.00 $25.00 $20.00

Arizona Department of Economic Security 2018 Child Care Market Rate Survey
BURNS & ASSOCIATES, INC. Health Policy Consultants Unregulated Homes page 37
Of the 228 unregulated homes providing a response to the survey, 226 (99.1 percent) responded to the question of whether or not they accepted the DES child care subsidy. Figure 45 illustrates the number of responding providers, by District, that accept and do not accept the DES child care subsidy. Nearly 90 percent of responding unregulated homes reported accepting the DES child care subsidy, which is the highest acceptance rate across the four provider types.
Figure 45: Unregulated Homes - Child Care Subsidy Acceptance by District District
I District
II District
III District
IV District
V District
VI Statewide
Accepts Subsidy 47 67 3 31 13 42 203 Does not Accept Subsidy 3 9 0 6 1 4 23 DES Subsidy Acceptance Rate 94.0% 88.2% 100.0% 83.8% 92.9% 91.3% 89.8%
The analysis explored the extent to which there is a difference in the median rate charged by providers that accept child care subsidies and those that do not. As illustrated in Figure 46, there is not a consistent relationship the median daily rates and whether the provider accepts or does not accept the DES child care subsidy.
$0 $5 $10 $15 $20 $25 $30 $35 $40 $45
<1 Year Old
3-5 Years Old
<1 Year Old
3-5 Years Old
<1 Year Old
3-5 Years Old
<1 Year Old
3-5 Years Old
<1 Year Old
3-5 Years Old
<1 Year Old
3-5 Years Old
<1 Year Old
3-5 Years Old
Dis
trict
ID
istri
ct II
Dis
trict
III
Dis
trict
IVD
istri
ct V
Dis
trict
VI
Stat
ewid
e
Median Daily Rate
Figure 46: Full-Time Median Rate Comparison for Unregulated Homes Accepting and Not Accepting the Child Care Subsidy
Does Not Accept Subsidy Accepts Subsidy

Arizona Department of Economic Security 2018 Child Care Market Rate Survey
BURNS & ASSOCIATES, INC. Health Policy Consultants Unregulated Homes page 38
Of the 228 unregulated homes responding to the survey, 222 (97.4 percent) responded to the question of whether or not they were accredited by a national accrediting entity.17 Statewide, 23 of the 222 responding providers (10.4 percent) reported being accredited, with District accreditation rates ranging from 7.1 percent (District V) to 33.3 percent (District III). Because so few providers reported having an accreditation, there is no material difference in the median rates charged at the statewide level, as demonstrated in Figure 47.
17 This question asked whether providers were accredited by one of eight national accrediting agencies, including American Montessori Society, Association for Christian Schools International, Association for Early Learning Leaders, Council on Accreditation, National Association for the Education of Young Children, National Early Childhood Program Accreditation, Council for Professional Recognition, and National Association for Family Child Care.
$0 $5 $10 $15 $20 $25 $30 $35
<1 Year Old1-2 Years Old3-5 Years OldSchool Aged<1 Year Old
1-2 Years Old3-5 Years OldSchool Aged<1 Year Old
1-2 Years Old3-5 Years OldSchool Aged<1 Year Old
1-2 Years Old3-5 Years OldSchool Aged<1 Year Old
1-2 Years Old3-5 Years OldSchool Aged<1 Year Old
1-2 Years Old3-5 Years OldSchool Aged<1 Year Old
1-2 Years Old3-5 Years OldSchool Aged
Dis
trict
ID
istri
ct II
Dis
trict
III
Dis
trict
IVD
istri
ct V
Dis
trict
VI
Stat
ewid
e
Median Daily Rate
Figure 47: Full-Time Median Rate Comparison for Accredited and Non-Accredited Providers
Is Not Accredited Is Accredited

Arizona Department of Economic Security 2018 Child Care Market Rate Survey
BURNS & ASSOCIATES, INC. Health Policy Consultants Unregulated Homes page 39
Figure 48 illustrates various discounts offered by unregulated homes and the extent to which they are offered.18 The most common form of discount offered across the State is the additional sibling discount. Compared to licensed centers (of which only 6.6 percent reported offering a cash payment discount), more than 40 percent of unregulated homes across the State offer this discount.
18 Unregulated homes (n=3) in District III reported offering no discounts.
0.0%
10.0%
20.0%
30.0%
40.0%
50.0%
60.0%
70.0%
80.0%
District I District II District IV District V District VI Statewide
Figure 48: Percentage of Unregulated Homes Offering Discounts by Discount Type
Offers Additional Sibling Discount Offers Advanced Pay Discount
Offers Cash Payment Offers Other Discount

Arizona Department of Economic Security 2018 Child Care Market Rate Survey
BURNS & ASSOCIATES, INC. Health Policy Consultants Unregulated Homes page 40
Unregulated Homes - Access and Quality
Figure 49 highlights the distribution of providers for each district based on length of time in operation. Across all districts, 51 percent of unregulated homes reported being in operation for more than 10 years, while fewer than 8 percent reported being in operation for less than one year, signaling a potentially stable child care market for unregulated homes, as 75 percent of responding unregulated homes had been in operation for at least four years.
District I DistrictII
DistrictIII
DistrictIV
DistrictV
DistrictVI
Statewide
Less than 1 year 7 4 - 2 - 3 161-3 years 7 17 1 8 1 6 404-5 years 8 4 - 5 - - 176-10 years 15 10 1 7 2 3 38More than 10 years 13 42 1 14 11 34 115Total 50 77 3 36 14 46 226
(10)
10
30
50
70
90
110
130
150
Num
ber o
f Pro
vide
rs
Figure 49: Unregulated Homes Time in Operation

Arizona Department of Economic Security 2018 Child Care Market Rate Survey
BURNS & ASSOCIATES, INC. Health Policy Consultants Unregulated Homes page 41
Figure 50 describes the average number of children cared for by unregulated homes within each of the four age groupings, while figure 51 describes the number of children unapproved homes are approved to care for across the State. Statewide, preschool-aged children (3 to 5 years old) account for the largest group of children receiving full-time care from unregulated homes (36.9 percent of the total) while school age children represent the largest age group of children receiving child care from an unregulated home part-time, with 57.2 percent of the total daily attendance being attributed to this group.
Figure 50: Total and Average Daily Attendance by Age Group and Attendance Frequency Age Group Attendance
Frequency District
I District
II District
III District
IV District
V District
VI Statewide
Infants (Under 1) – Average Daily Attendance
Full-time 2 1 - 2 1 1 1 Part-time - 6 15 1 - 1 4
Infants (Under 1) – Total Daily Attendance
Full-time 28 22 - 17 7 9 83 Part-time - 11 15 1 - 3 30
Toddlers (1-2 Years) – Average Daily Attendance
Full-time 2 2 2 2 2 2 2 Part-time 3 4 15 2 3 2 3
Toddlers (1-2 Years) – Total Daily Attendance
Full-time 57 80 4 56 25 43 265 Part-time 5 12 15 8 5 8 53
Preschool (3-5 years) - Average Daily Attendance
Full-time 2 2 5 2 3 2 2 Part-time 2 3 8 2 3 2 3
Preschool (3-5 years) - Total Daily Attendance
Full-time 64 104 9 47 26 54 304 Part-time 11 21 16 12 5 12 77
School Aged (6+ years) - Average Daily Attendance
Full-time 2 2 2 3 2 2 2 Part-time 2 2 1 2 2 2 2
School Aged (6+ years) - Total Daily Attendance
Full-time 53 61 4 18 8 28 172 Part-time 33 85 1 23 14 58 214
Total Full-Time Daily Attendance 202 267 17 138 66 134 824 Total Part-Time Daily Attendance 49 129 47 44 24 81 374
-
20
40
60
80
100
120
3 or less 4 5 6 or more
Num
ber o
f Pro
vide
rs
Statewide- Range of Approved Child Care Slots
Figure 51: Licensed Capacity for Unregulated Homes

Arizona Department of Economic Security 2018 Child Care Market Rate Survey
BURNS & ASSOCIATES, INC. Health Policy Consultants Unregulated Homes page 42
Figure 52 identifies the number of unregulated homes reporting accreditation by a national child care accrediting agency. Statewide, 10.4 percent of responding unregulated homes reported having an accreditation from one of eight national agencies.
The primary reason cited by unregulated homes for not being accredited was the process was either too costly or not worth the investment (67 percent), while 24 percent reported that the process was too burdensome, and 9 percent reported their program did not meet the qualification criteria for accreditation.
-
20
40
60
80
100
120
140
160
180
200
District I District II District III District IV District V District VI Statewide
Figure 52: Unregulated Home Accreditation
Accredited by a National Entity Not Accredited

Arizona Department of Economic Security 2018 Child Care Market Rate Survey
BURNS & ASSOCIATES, INC. Health Policy Consultants Unregulated Homes page 43
Figure 53 identifies the volume of unregulated homes providing child care to children with special needs. Statewide, more than half (50.4 percent) of responding unregulated homes reported providing child care to children with special needs, a rate far exceeding the 31 percent of approved homes that reported providing child care to children with special needs, but less than the 83.6 percent of licensed centers that reported providing this care.
As demonstrated in Figure 54, unregulated homes that care for children with special needs generally have median rates that are slightly greater than or approximately equal to unregulated homes that reported not providing care to children with special needs.
Figure 54: Unregulated Homes - Median Rate Differentials for Providing Care to Children with Special Needs Age Group Attendance Frequency District
I District
II District
III District
IV District
V District
VI Statewide
Infants (Under 1)
Provides Child Care to Special Needs Children $25.50 $25.00 $25.50 $25.00 $30.00 $26.00 $25.00
Does Not Provide Child Care to Special Needs Children $25.00 $25.00 - $25.00 $27.50 $25.00 $25.00
Toddlers (1-2 Years)
Provides Child Care to Special Needs Children $25.00 $25.00 $25.00 $25.00 $30.00 $25.00 $25.00
Does Not Provide Child Care to Special Needs Children $24.00 $25.00 - $25.00 $25.00 $25.00 $25.00
Preschoolers (3-5 Years)
Provides Child Care to Special Needs Children $25.00 $25.00 $25.00 $25.00 $30.00 $25.00 $25.00
Does Not Provide Child Care to Special Needs Children $22.21 $25.00 - $25.00 $25.00 $25.00 $25.00
School Aged (6+ Years)
Provides Child Care to Special Needs Children $25.00 $25.00 $25.00 $25.00 $30.00 $25.00 $25.00
Does Not Provide Child Care to Special Needs Children $20.00 $25.00 - $25.00 $25.00 $25.00 $25.00
- 20 40 60 80
100 120 140 160 180 200
District I District II District III District IV District V District VI Statewide
Figure 53: Unregulated Homes - Special Needs Care
Does Not Provide Child Care to Special Needs Children
Provides Child Care to Special Needs Children

Arizona Department of Economic Security 2018 Child Care Market Rate Survey
BURNS & ASSOCIATES, INC. Health Policy Consultants Unregulated Homes page 44
Figure 55 describes the percentage of unregulated homes offering child care services outside of normal hours19 or flexible child care services, such as a “drop-in” service. Broadly speaking, unregulated homes are more likely to offer flexible scheduling for parents and guardians seeking child care outside of normal hours than licensed centers. For example, parents and guardians working night shifts between 6:30 pm and 6:00 am have better access to care during these hours from an unregulated home compared to a licensed center, as nearly 33 percent of responding unregulated homes reported offering all night care, while almost half (49.1 percent) of responding unregulated homes reported offering late night care. In contrast, fewer than 3 percent of licensed centers across the State offered care during these hours.
Figure 55: Percentage of Unregulated Homes Offering Care Outside of Normal Hours and Other Flexible Options
District
I District
II District
III District
IV District
V District
VI Statewide Offers late night care (6:30 pm to midnight) 54.9% 58.4% 66.7% 13.5% 71.4% 47.8% 49.1%
Charges a premium rate for late night care 28.6% 20.0% 0.0% 20.0% 0.0% 22.7% 20.5% Offers all night care (midnight to 6:00 am) 41.2% 37.7% 0.0% 10.8% 35.7% 32.6% 32.5%
Charges a premium rate for all night care 19.0% 20.7% 0.0% 0.0% 20.0% 26.7% 20.3% Offers weekend care (Saturdays and Sundays) 54.9% 68.8% 33.3% 29.7% 85.7% 63.0% 58.8%
Charges a premium rate for weekend care 21.4% 20.8% 0.0% 27.3% 16.7% 17.2% 20.1% Offers extended care (12+ hours per day) 43.1% 41.6% 0.0% 18.9% 35.7% 43.5% 37.7%
Charges a premium rate for extended care 50.0% 53.1% 0.0% 57.1% 100.0% 45.0% 53.5% Offers a "Drop-in" service 52.9% 41.6% 66.7% 24.3% 28.6% 43.5% 41.2%
Charges a premium rate for drop-in service 40.7% 34.4% 0.0% 33.3% 75.0% 30.0% 36.2%
19 Normal working hours was defined in the survey as care provided Monday through Friday between 6:00 am and 6:30 pm.

Arizona Department of Economic Security 2018 Child Care Market Rate Survey
BURNS & ASSOCIATES, INC. Health Policy Consultants Appendix A - Methodology page A-1
APPENDIX A - METHODOLOGY Burns & Associates, Inc. (B&A) conducted the 2018 Child Care Market Rate Survey in accordance with an agreed-upon approach with the Arizona Department of Economic Security’s (DES), Child Care Administration (CCA), which was based on CCA’s previous market rate surveys and commonly employed methodologies in other states. The methodology included 3 primary steps.
Step 1 – Identify contact population
B&A obtained child care provider contact information from CCA, which included five data sets from sources including DES, the Arizona Department of Health Services (ADHS), and Child Care Resource & Referral (CCR&R). The data sources were combined into a single database, which contained 7,149 records as seen in Figure A-1.
Figure A-1: Sources and Record Counts of Child Care Provider Contact Listings Data Source Total Records ADHS Database of Licensed Centers and Certified Group Homes 2,502 ADHS Database of Licensed Centers 2,213 DES Database of Approved Homes20 1,569 CCR&R database of Unregulated Homes 367 ADHS Database of Certified Group Homes 276 DES Database of Approved Homes 222 Total Records Received 7,149
The database was evaluated to identify duplicate records, primarily based on address matches.21 After removing duplicates, the contact population included 4,470 unduplicated providers. Figure A-2 illustrates the distribution of the contact population across each of the four provider types.
Figure A-2: Final Contact Population by Provider Type Data Source Total Records % of Total Licensed Centers 2,129 47.6% Approved Homes 1,690 37.8% Unregulated Homes 362 8.1% Certified Group Homes 289 6.5% Total Records Received 4,470 100%
Step 2 – Administer Survey
B&A conducted the 2018 Child Care Market Rate Survey in English and Spanish between April 18, 2018 and June 22, 2018. The survey was initially administered through Survey Monkey to providers with a valid email address on file. B&A subsequently initiated contact with all providers, including those that did not have an email address on file, and those that did have an email address, but had not yet completed the survey via Survey Monkey. In some cases, providers supplied B&A with alternate email addresses to complete in Survey Monkey, or completed the survey by phone. In other cases, routine follow-up over an 8-week period was necessary in an attempt to reach the provider. Overall, B&A attempted to reach the contact population in excess of 25,000 times through a combination of over 16,690 emails and more than
20 Certified family homes are referred to as “Approved Homes” throughout the report. 21 Providers sharing a street address but in a different suite number were not combined.

Arizona Department of Economic Security 2018 Child Care Market Rate Survey
BURNS & ASSOCIATES, INC. Health Policy Consultants Appendix A - Methodology page A-2
8,300 phone calls to providers. Among the providers completing a survey, 48.2 percent completed the survey online, while 51.8 percent completed the survey by phone.
Figure A-3 provides a reconciliation of the 4,470 providers initially identified based on their ultimate disposition and the number of attempted contacts.
Figure A-3: Contact Attempts by Response Category Response Category
Total Sites % of Total
Number of Phone/ Email Contact Attempts
Total Attempts
Avg. Attempts
0 1 2 3 4 5+ Survey Complete
2,512 56.2% 4 144 615 217 304 1,228 13,552 5.4
Incomplete 658 14.7% - 1 2 2 179 474 6,083 9.2 Declined 775 17.3% - 163 151 61 41 359 4,043 5.2 No longer a provider
225 5.0% - 71 38 15 9 92 1,014 4.5
Wrong/ Disconnected Number
300 6.7% - 184 31 8 4 73 816 2.7
Total, All Statuses
4,470 100.0% 4 563 837 303 537 2,226 25,508 5.7
As seen in Figure A-3, 225 sites reported no longer providing child care services while 300 were affiliated with an incorrect or disconnected phone number. Excluding these sites, the final contact population upon which a survey could be administered included 3,945 providers. Of these, a total of 2,512 providers completed a survey, for a final response rate of 63.7 percent, with response rates by provider type ranging from 52.5 percent for approved homes to 76.0 percent for Certified Group Homes as reflected in Figure A-4.
Figure A-4: Final Response Rate by Provider Type
Response Category
Licensed Centers
Approved Homes
Certified Group Homes
Unregulated Homes
All Provider Types
Count % of Total
Count % of Total
Count % of Total
Count % of Total
Count % of Total
Survey Complete
1,380 68.4% 704 52.6% 200 76.0% 228 69.9% 2,512 63.7%
Incomplete 331 16.4% 232 17.3% 45 17.1% 50 15.3% 658 16.7% Declined 306 15.2% 403 30.1% 18 6.8% 48 14.7% 775 19.6% Total Sites 2,017 100.0% 1,339 100.0% 263 100.0% 326 100.0% 3,945 100.0%
As noted in Figure A-4, nearly 20 percent of the contact population declined to participate in the survey, with the highest declination rate attributed to Approved Homes (30.1 percent). For providers with a final contact status of Incomplete, the overall number of contact attempts by provider type is displayed in Figure A-5.

Arizona Department of Economic Security 2018 Child Care Market Rate Survey
BURNS & ASSOCIATES, INC. Health Policy Consultants Appendix A - Methodology page A-3
Figure A-5 Contact Attempts for Providers with an 'Incomplete' Disposition
Provider Type Total Providers
Total Contact Attempts
Avg. Attempts
Licensed Center 331 3,922 11.8 Approved Home 232 1,354 5.8 Certified Group Home 45 473 10.5 Unregulated Home 50 334 6.7 Total 'Incomplete' Providers 658 6,083 9.2
Step 3 – Evaluate Survey Results
After administering the survey, B&A compiled the results from both the English and Spanish surveys into a single dataset for analysis. In combining the results, B&A found that some providers submitted surveys both by phone with B&A staff members and electronically through Survey Monkey. Duplicated surveys were removed prior to conducting analysis of the survey response data.
Although the survey was completed by more than 2,500 providers, the response rate for each survey question varied because providers were allowed to skip questions, and in some cases, provided information that did not meet the criteria of a valid response. For example, the survey asked providers if they had received accreditation from one of eight national child care provider accrediting agencies. This question was accompanied by an ‘Other’ response, wherein providers were able to supply the name of additional accrediting agencies. However, some providers cited accrediting entities like the Better Business Bureau in their responses, which fell outside of the scope of the question. Responses like this were omitted, though valid responses to other questions were still integrated into the overall survey results when possible.
While the primary objective of the 2018 Child Care Market Rate Survey was to evaluate and report the market rates of child care across Arizona, some providers chose not to disclose their rates, or reported that they operated a free program. This was true for all Head Start programs in the survey, as well as several home-based providers that provided free child care for family members and neighbors. Figure A-6 illustrates the percentage of providers by license type that disclosed market rates in comparison to those that did not.
Figure A-6: Final Response Rate by Provider Type
Provider Type Rates Reported
No Rates Reported
Total Providers
% of Total w/ Rates
Licensed Center 1,128 252 1,380 81.7% Approved/Regulated Home
550 154 704 78.1%
Certified Group Home 187 13 200 93.5% Unregulated Home 211 17 228 92.5% Totals 1,128 252 1,380 81.7%
Providers that disclosed a child care rate were given the opportunity to set the rate frequency as daily, weekly (for a 5-day week), weekly (for a 7-day week), monthly, or ‘Other’ frequency accompanied by a free form field in which providers could specify a different rate frequency. Other time periods most commonly included hourly rates, weekly rates (for a 3-day week), and annual rates. To generate rate comparisons, all rate frequencies were converted to a ‘per day’ baseline rate, establishing a common

Arizona Department of Economic Security 2018 Child Care Market Rate Survey
BURNS & ASSOCIATES, INC. Health Policy Consultants Appendix A - Methodology page A-4
market rate measure. The specific conversions applied to rate frequencies reported by providers are described in Figure A-7.
Figure A-7: Rate Frequency Conversion Factors to a Standard Daily Rate Reported
Frequency Full-Time Conversion Factor to a Daily Rate
Part-Time Conversion Factor to a Daily Rate
Per hour Multiply by 9 Multiply by 4.5 Per day No conversion No conversion Per 3-day week N/A – none reported Divide by 3 Per 5-day week Divide by 5 Divide by 5 Per 7-day week Divide by 7 Divide by 7 Per month Divide by 20.916722 Divide by 20.9167 Per year Divide by 251 Divide by 251
After rate frequencies were converted to a standard daily rate, the market rates were computed by district, age level, provider type, and attendance frequency (full-time and part-time rates). Rates were calculated on a ‘site’ basis rather than weighting the rate by the number of approved slots, or average daily attendance by site. This method was employed because some providers disclosed a rate for an age group, but reported no children within the corresponding age group. Thus, weighting their response by attendance would have the effect of nullifying their market rate for the age group, though the rate is valid despite the absence of enrollees in the age group for the provider. In addition, all other reported results (such as caring for children with disabilities or offering extended care) were calculated by site rather than by slot.
Limitations to Analysis/ Results
While steps were taken to carefully plan the administration and analysis of survey results, certain limitations exist that may limit the accuracy of various analyses or not fairly represent the entire provider population. Specifically:
• Market rates were collected during a brief window of time (between April 18, 2018 and June 22, 2018). Therefore, the results presented throughout the report should be interpreted to only represent the information provided by responding providers during the survey period.
• Most survey responses represented single sites, while others represented a chain of sites. This was common with publicly-administered Head Start programs as well as school districts, which generally offer before and after school care. When a single survey was received for multiple sites, B&A attempted to confirm that the rates reported represented all sites, and requested providers to break approved slots and average daily attendance out by individual sites. However, B&A was unable to reach a majority of these sites in follow-up. Hence, it was assumed the reported rates applied to all sites, and approved slots and average daily attendance was divided by the number of sites represented in the survey. For example, one provider reported 795 approved slots for 23 sites. The 795 approved slots were sub-allocated to the 23 sites within the survey data, averaging about 35 approved slots per site.
• Most providers entered rates that corresponded with a pre-defined rate frequency (including ‘per day’, ‘per 5-day week’, ‘per 7-day week’, or ‘per month’), while others provided other rate
22 Child care providers were assumed to provide care Monday-Friday (business days), excluding holidays. In a standard 365-day calendar year, there are 261 business days, and 10 federal holidays that child care providers were assumed to be closed. Therefore, B&A assumed 251 child care days in a standard calendar year, and when 251 is divided by 12 (months), the result is 20.9167.

Arizona Department of Economic Security 2018 Child Care Market Rate Survey
BURNS & ASSOCIATES, INC. Health Policy Consultants Appendix A - Methodology page A-5
frequencies in a free-form field, such as hourly rates or annual rates. Some providers disclosed rate amounts, but failed to identify a rate frequency. In addition, when reviewing market rate results, B&A identified multiple rate outcomes that were likely reported in error, such as daily rates that calculated to more than $1,000 per day or less than $0.10 per day. In those cases, B&A attempted to follow-up with these providers to seek clarification or additional information, and in many cases, was able to resolve apparent discrepancies. However, some providers could not be reached for follow-up. For those providers that provided both a rate and rate frequency, their results are tabulated despite the possibility that their results were reported in error. For providers who reported a rate but did not supply a rate frequency, their rates are excluded from the analysis as the rate frequency could not be reliably assumed in the absence of additional information from the provider.
• Rate frequency conversions were completed, as described in Figure A-6 using logical assumptions. However, B&A recognizes that there may be a margin of error in certain assumptions that cannot be adequately estimated in the absence of specific details from each responding provider. For example, while it was logical to assume hourly rates for a full-time program would reasonably translate to a 9-hour day,23 hourly rates for a part-time program were converted to a day based on half of the full-day assumption (4.5 hours), though in actuality, the true conversion for each provider may have more variability.24
• Caution should be taken in interpreting results when analysis includes relatively few observations. Figure A-8 details the unique number of provider responses per District and by provider type.
Figure A-8: Unique Number of Provider Responses by District and Provider Type
Provider Type District
I District
II District
III District
IV District
V District
VI Statewide
Licensed Centers
Responses 857 253 83 93 45 49 1,380 Contact Population 1,297 320 158 116 66 60 2,017 Response Rate 66.1% 79.1% 52.5% 80.2% 68.2% 81.7% 68.4%
Approved Homes
Responses 346 116 21 151 27 43 704 Contact Population 651 221 39 289 57 82 1,339 Response Rate 53.1% 52.5% 53.8% 52.2% 47.4% 52.4% 52.6%
Certified Group Homes
Responses 89 71 10 16 7 7 200 Contact Population 127 87 11 21 10 7 263 Response Rate 70.1% 81.6% 90.9% 76.2% 70.0% 100.0% 76.0%
Unregulated Homes
Responses 51 77 3 37 14 46 228 Contact Population 75 119 5 45 18 64 326 Response Rate 68.0% 64.7% 60.0% 82.2% 77.8% 71.9% 69.9%
23 The 2014 Child Care Market Rate Study assumed an 8-hour full-time conversion rate. However, B&A assumed that a full day of care corresponded with a care taker’s full-time workday, which logically includes 8-hours of work, with a reasonable provision for a 30-minute drop-off and pick-up period, resulting in the final 9-hour assumption. 24 Arizona Administrative Code Title 6, Chapter 5, Section 4918(E)(3) defines a “part-day unit of Child Care Assistance” as any time period less than six hours per day.

Arizona Department of Economic Security 2018 Child Care Market Rate Survey
BURNS & ASSOCIATES, INC. Health Policy Consultants Appendix B – Survey Instrument page B-1
APPENDIX B – SURVEY INSTRUMENT This section collects basic information about your program 1. Business/Provider Name: 2. Business Zip Code: 3. State-issued facility or license identification number: 4. Contact First and Last Name: 5. Contact Phone Number: 6. Contact Email Address: 7. Type of child care facility:
☐ Licensed Center ☐ Certified Group Home ☐ Approved/ Regulated Home ☐ Unregulated Home
8. Does the child care program accept the DES child care subsidy?
☐ Yes ☐ No
9. How long has the child care program been in operation?
☐ Less than 1 year ☐ 1-3 years ☐ 4-5 years ☐ 6-10 years ☐ More than 10 years
10. Does the child care program care for children with (check all that apply)?
☐ Physical Disabilities ☐ Intellectual Disabilities ☐ Other special needs (e.g., behavioral disorders)
11. Is the child care program nationally accredited?
☐ Yes ☐ No

Arizona Department of Economic Security 2018 Child Care Market Rate Survey
BURNS & ASSOCIATES, INC. Health Policy Consultants Appendix B – Survey Instrument page B-2
12. If the child care program is accredited, from what organization has accreditation been received (check all that apply)?
☐ American Montessori Society ☐ Association for Christian Schools International
(formerly National Association of Child Care Professionals) ☐ Association for Early Learning Leaders ☐ Council on Accreditation
(formerly National AfterSchool Association) ☐ National Association for the Education of Young Children ☐ National Early Childhood Program Accreditation ☐ Council for Professional Recognition ☐ National Association for Family Child Care ☐ Other (please specify)
13. If the child care program is not accredited, please select the reason(s) that best explain why:
☐ Too costly/not worth the investment ☐ Too burdensome (e.g., too much paperwork) ☐ The child care program does not meet the qualification criteria for
accreditation ☐ Other (please specify)
This section collects information about your program size and operations 14. How many children is the child care program approved/licensed to care for? _____________ 15. How many children does the child care program care for on an average day? _____________ 16. On an average day, how many children in each of the following age groups does the child care program care for on a full-time basis (more than 6 hours in a day)?
Children under one 1 and 2 year olds 3 to 5 year olds School aged (6+)
17. What is the average rate for full-time child care for each of the following age groups (round to nearest dollar):
Frequency
Rate Day Week
(5-day) Week
(7-day) Month Children under one ☐ ☐ ☐ ☐ 1 and 2 year olds ☐ ☐ ☐ ☐ 3 to 5 year olds ☐ ☐ ☐ ☐ School aged (6+) ☐ ☐ ☐ ☐

Arizona Department of Economic Security 2018 Child Care Market Rate Survey
BURNS & ASSOCIATES, INC. Health Policy Consultants Appendix B – Survey Instrument page B-3
18. On an average day, how many children in each of the following age groups does the child care program care for on a part-time basis (less than 6 hours in a day)?
Children under one 1 and 2 year olds 3 to 5 year olds School aged (6+)
19. What is the average rate for part-time child care for each of the following age groups (round to nearest dollar):
Frequency
Rate Day Week
(5-day) Week
(7-day) Month Children under one ☐ ☐ ☐ ☐ 1 and 2 year olds ☐ ☐ ☐ ☐ 3 to 5 year olds ☐ ☐ ☐ ☐ School aged (6+) ☐ ☐ ☐ ☐
20. Does the child care program offer discounts for any of the following (answer “Yes” or “No” to each)?
☐ Additional child discount (e.g., sibling rate, same family rate, etc.)
☐ Advance pay ☐ Cash payment ☐ Other discounts (please specify)
21. Does the child care program offer late night care (6:30 pm to midnight)?
☐ Yes ☐ No
22. Is the rate charged for late night care higher than the rate for regular day care? ☐ Yes ☐ No
23. Does the child care program offer all night care (includes the hours between midnight and 6:00 am)?
☐ Yes ☐ No
24. Is the rate charged for all night care higher than the rate charged for regular day care? ☐ Yes ☐ No
25. Does the child care program offer weekend care (care on Saturdays and/or Sundays)?
☐ Yes ☐ No
26. Is the rate charged for weekend care higher than the rate charged for regular care? ☐ Yes

Arizona Department of Economic Security 2018 Child Care Market Rate Survey
BURNS & ASSOCIATES, INC. Health Policy Consultants Appendix B – Survey Instrument page B-4
☐ No 27. Does the child care program offer extended care (care for more than 12 hours in a day)?
☐ Yes ☐ No
28. Is the rate charged for extended care higher than the full day care rate? ☐ Yes ☐ No
29. Does the child care program offer a “Drop-in” service (e.g., care for children who do not regularly attend on a part-time or full-time basis)?
☐ Yes ☐ No
30. Is the rate charged for a “Drop-in” higher than the average rate charged for child care? ☐ Yes ☐ No
31. Please specify any additional premium services offered, or additional fees charged that have not been covered by previous questions (e.g., late pick-up fees, or fees for late payment)?