2008 ohio child care market rate survey analysis
TRANSCRIPT

Prepared for the
Ohio Department of Job and Family Services
by The Ohio State University Statistical Consulting Service
September 10, 2008
Final Report
2008 Ohio Child Care Market Rate Survey
Analysis

2
3
Table of Contents
Executive Summary.......................................................................................................................5 1. Project Background...............................................................................................................6 2. Study Design...........................................................................................................................7
2.1. Definition of the Sampling Frame ...................................................................................7 2.2. Survey Development and Preliminary Testing ................................................................7
3. The Survey Process ................................................................................................................9 4. Data Entry and Data Editing..............................................................................................10 5. Response Rate Analysis .......................................................................................................14 6. Analysis of the Accuracy of the Submitted Rate Data......................................................18 7. Market Rate Structure Analysis.........................................................................................24
7.1. Exploratory Analysis of Average County Rates............................................................25 7.2. Principal Components Analysis.....................................................................................26 7.3. Cluster Analysis on Average County Rates...................................................................27
8. Estimated Rate Distributions and Calculated Percentiles ...............................................31 9. Assessment of Random Sampling.......................................................................................45 Appendix A – Advance Letter, Licensed ...................................................................................48 Appendix B – Advance Letter, Certified and Registered.........................................................50 Appendix C – First Cover Letter, Licensed...............................................................................52 Appendix D – First Cover Letter, Certified and Registered....................................................54 Appendix E – Second Cover Letter, Licensed...........................................................................56 Appendix F – Second Cover Letter, Certified and Registered ................................................58 Appendix G – Survey Instrument, Licensed .............................................................................60 Appendix H – Survey Instrument, Certified and Registered ..................................................68 References.....................................................................................................................................76

4

5
Executive Summary The Ohio Department of Job and Family Services (ODJFS) and the Ohio State University Statistical Consulting Service (SCS) worked together to design, administer, and analyze the 2008 Ohio Child Care Market Rate Survey. The goal of the survey is to characterize the unsubsidized, or private pay, market rates for child care throughout the state. The 2008 Market rate survey was designed to determine the distribution of unsubsidized market rates for each of 15 child care service categories defined by five age categories (infants, toddlers, pre-school, school-age during the school year, and school-age during the summer) and three rate categories (full-time weekly, part-time weekly, and hourly). The survey was sent to 13,482 providers throughout the state. These providers consisted of licensed centers, type-A licensed providers, certified type-B home providers, and registered home providers. Non-certified type-B home providers were not included in the survey. Between the initial mailing of the survey on March 17, 2008 and the cut-off date of May 23, 2008, 4,515 surveys containing usable rate data were received. The overall response rate was 34.56%. The response rate for licensed centers was 50.48% and the response rate for certified providers was 27.35%. After entering the data into a statistical analysis database quality control analyses were conducted on the reported rate data. Overall, it was determined that 72.42% (919/1269) of the rate sheet rates reported matched the rates providers reported on their surveys. Most of the rates that did not match showed only a little bias, and the bias was not consistently low or high across categories. Following the methodology used to analyze the data for the 2006 Market Rate survey, counties were divided into six groups with similar rate structures. There was some movement of counties into different groups from the ones in which they were classified in 2006, but the majority stayed in the same grouping. Next, the 50th, 55th, 60th, 65th, 70th, 75th, 80th, 85th, 90th, and 95th percentiles were calculated for the unsubsidized rate distributions. The percentiles were calculated at the state-wide and county group levels for each of the 15 child care service categories. At the state-wide level, the percentiles were calculated for licensed centers only, licensed type-A providers only, all licensed providers combined, certified providers only, registered providers only, and certified and registered providers combined. At the county group level, the percentiles were calculated for all licensed providers combined and for certified and registered providers combined. In each case the percentiles were calculated using normal approximations to the rate distributions. Tables reporting these percentiles can be found in Section 8 of this report, starting on page 31. Finally, an analysis was performed to determine whether random sampling can be used for future market rate surveys rather than a full census. Because hourly rates were poorly estimated by random samples, the SCS recommends continuing to perform a full census.

6
1. Project Background The Ohio Department of Job and Family Services (ODJFS) develops and oversees programs designed to help Ohioans gain access to child care services. Part of this effort involves financial assistance to low-income families in the form of child care tuition subsidies. Federal regulations require that child care subsidy rate ceilings be based on the unsubsidized rates that child care providers charge parents around the state. The goal is to set subsidy rates high enough to ensure access to child care for low-income families but low enough that prices are not inflated and the cost to taxpayers is not excessive. Federal rules require that states conduct child care market rate surveys every two years as part of their program to ensure access to child care for low-income families. The primary goal of this project is to develop reasonable estimates of the distribution of unsubsidized rates that Ohio child care providers charge the general public. These rates are known to vary by the age of the child, the amount of time the child is being cared for, and the geographic location of the provider within the state. ODJFS has conducted market rate surveys every two years since 2000. The 2008 market rate survey was conducted during March, April, and May of 2008. The 2008 survey was similar to the one administered in 2006, although some changes were made in both the questionnaire and the execution of the survey. The purpose of these changes was to improve the quality of data reported by the providers and improve the response rate. The statistical methods used to analyze the 2008 survey are similar to those used to analyze the 2006 survey. This document is divided into nine main sections and eight appendixes. Sections 2 and 3 describe the design and administration of the survey. These sections include information on the total population of providers to which surveys were sent and the methodologies used for obtaining responses to the survey. The survey instruments and letters to providers can be found in the appendixes. Section 4 describes the data entry and data editing tasks that were conducted before the analysis of the data. Section 5 contains summaries of the response rates to the survey broken down geographically and by provider type. Section 6 discusses the results of the quality control component of the survey project. Section 7 describes the statistical methods that were used to analyze the rate data and put counties into groups. As was done in 2006, a principal components analysis and cluster analysis were used to group counties. That section describes the resulting grouping of the counties and shows changes from 2006. Next, Section 8 reports the market rate distributions and associated percentiles. Standard statistical techniques were employed to estimate the percentiles of the rate distributions within the child care service categories as reported in that section. Finally, Section 9 shows the results of an analysis performed to determine whether random sampling of providers could be used in the future instead of a full census of providers.

7
2. Study Design
2.1. Definition of the Sampling Frame The sampling frame was defined to be all child care providers that could be obtained from one of two sources. The first source was the State of Ohio child care provider database. This database contains the names and addresses of all licensed and type-B certified child care providers in the state of Ohio, so all providers in the database could be contacted directly. Contact information for non-certified type-B providers is not included in this database, so those providers could not be included in the survey. The second source was a database located at the local resource and referral agencies (R&Rs). There are 12 R&Rs throughout Ohio, and an effort was made to contact the providers registered with each of them. Since the databases from the R&Rs were not directly available, these providers were contacted indirectly using the R&Rs as intermediaries. The State of Ohio child care provider database contained a total of 12,656 providers that fall into the following categories:
• Type B Certified Home Providers – 8,431 providers. All of these providers received a survey; none were removed from this list for insufficient address information.
• Licensed Center Providers – 4,225 providers, including 203 type-A home providers. All
of these providers received a survey; none were removed from this list for insufficient address information.
The R&R databases contained a total of 826 registered providers.
2.2. Survey Development and Preliminary Testing Several tasks were completed to develop the survey instrument. Several meetings were held between SCS and ODJFS staff to discuss the design of the survey. Discussions focused on the definition of the child care service categories, the wording of the letters of introduction sent to the providers, and the design of survey instruments. Since the 2006 survey was considered successful, it was used as a basis for development of the 2008 survey. Some aspects of the survey were revamped, but the majority of the survey remained the same. In addition to these basic development activities, a series of five focus groups was held with SCS, ODJFS, and provider representatives throughout the state. Focus groups were held in the following cities:
• Columbus • Toledo • Cincinnati • Cleveland • Zanesville

8
Provider representatives were recruited through local resource and referral agencies with the assistance of OCCRRA. Provider representatives were paid $25 for their participation. Local R&R agencies hosted the sessions. At the sessions the provider representatives were given drafts of the survey letters and questionnaires. In addition they were given other information about the market rate survey process. The provider representatives were then asked to give feedback on the survey materials and process. Particular attention was paid to feedback relevant to increasing participation in the survey and making the questionnaire simpler. The survey letters and questionnaires were revised between focus group sessions so that each group saw and gave feedback on the latest versions of the survey materials. While the focus groups were useful for generating fresh ideas for revising the surveys, some modifications are recommended if focus groups are used in the future. First, the one focus group held in a rural environment (Zanesville) was very poorly attended. Future focus groups in rural locations will need to have additional effort put toward increasing attendance. Second, while the input from providers for revising the survey was insightful in many cases, it appears that individuals who attended the focus groups might have been more capable at interpreting the questions on the survey than the general public. Despite the fact that none of the providers at the focus groups indicated problems filling in the tables in Sections 1 through 5, several providers entered contradictory information in the tables during the full execution of the survey.

9
3. The Survey Process The survey was conducted using a mailed paper survey. A multiple-contact approach based on the Tailored Design Method [1] was used to increase the response rate. On March 17, 2008 each provider was mailed a notification letter that briefly explained the project and informed the provider that he would be receiving a survey within a few days. Survey packets were mailed on March 24, 2008. These packets contained a cover letter explaining the survey, a copy of the survey instrument with a tracking code printed on it, instructions for completing the survey, and a self-addressed, stamped business reply envelope for returning the survey. On March 31, 2008 each provider was mailed a postcard that acted as a “thank you” for those who had returned the survey and as reminder for those who had not returned the survey. On April 30, 2008 a second survey packet was mailed to those providers who had not responded to the initial mailing. This packet contained a cover letter that stressed the value of the provider’s participation, a copy of the survey instrument, instructions for completing the survey, and a self-addressed, stamped business reply envelope for returning the survey. For most of the providers in the database, the survey was executed without any difficulty. However, there were a number of providers that did not receive the first mailing of the survey due to difficulties in various postal offices. Although the reason these initial mailings were not delivered is still unknown, it may have been related to the use of “0000” as the 4-digit extension to some of the zip codes in the ODJFS database. For providers that did not receive the initial survey packet, some were immediately sent a replacement, and others were advised that a second mailing would occur in the next few weeks. For almost all of the providers included in the survey, questionnaires were mailed to the providers directly. However, there were some registered providers listed with the R&Rs for which direct mailing was not possible. For those providers listed with the R&Rs, mail surveys were instead sent to the R&Rs. The R&Rs then distributed the surveys to the individual providers. The completed surveys were returned directly to the SCS for this group just as with all of the other providers. Some of the providers who received the mailed paper survey were asked to provide their current rate sheets along with the completed survey. Random samples of 845 licensed providers, 1,688 certified providers, and 164 registered providers from the R&R databases were selected to provide this additional information. These collected rate sheets were then used by the SCS as a quality control check to determine the accuracy of the rates reported in the survey compared to the rates published in the provider rate sheets. The results of the quality control analysis are presented in Section 6.

10
4. Data Entry and Data Editing Completed surveys were accepted through May 23, 2008. As the surveys were received they were opened and reviewed for questionable data. Every survey received by the SCS was reviewed on an individual basis. When possible, the questionable data were corrected prior to submitting the survey to the data entry process. Rules for data editing were applied based on the questionnaire instructions. The following rules were applied to correct surveys:
• When multiple rates were given for a single question, the highest rate was marked for data entry because the questionnaire asked for undiscounted rates.
• If the total number of children in an age group (in the box at the top of the page) did not
match the sum of children listed in the table, either the table or the number in the box was corrected, depending on the apparent intention of the respondent.
• If a respondent entered a dollar amount that was clearly invalid for the third rate question
in each section, it was re-entered as a dollar per week value. For example, if an individual put $150.00 for all three questions, it would appear they did not read the third answer space closely to notice that it asked for dollars per hour rather than dollars per week.
• Entries of $0 for any rates were changed to missing values. • When multiple education levels were marked in Section 6 of the survey, only the highest
level of education was left as an intended mark.
• When “N/A” was entered in a box where a number of children should have been placed, it was converted to 0.
• If a respondent filled in numbers for the “subsidized children” column of the table but not
the “total number of children” column and the numbers of subsidized children listed summed to the number in the top box, the numbers in the “total number of children” column were filled in.
Out of the 13,482 questionnaires sent, 211 were returned for insufficient address information. Another small percentage of returned questionnaires were determined to be unusable. For example, some providers destroyed the identification number on the first page of the survey. This number is used to identify the geographic location of the provider and is required for the survey to be used in the statistical analysis. In all, 476 returned surveys were removed because they were either marked “N/A” by the respondent or were unusable. An outside vendor was contracted to perform the data entry process. The vendor used a double-entry method to eliminate data entry error. The data were submitted to the SCS in one comma-delimited ASCII file including both the licensed providers and the certified/registered providers.

11
Once the survey data file was made available by the vendor, a statistical analysis database was constructed by the SCS. To create this database, key provider demographic data were merged with the survey data. The following edits were made to the data.
• Several values entered for the third rate question in each of Sections 1 – 5 were corrected since it appeared that respondents did not notice that the request was for dollars per hour, not dollars per week. If a respondent entered a dollar amount that was more than 1/7th of the part time weekly rate, the value was re-entered as a dollar per week response. For example, if an individual put $140.00 for the part-time weekly rate and $130.00 for the hourly rate, it was considered a weekly rate for three hours of child care (rather than $130.00/hr).
• Entries of $0 for any rates were changed to missing values. • “N/A” entries were converted to 0 for any field related to a number of children.
• If a respondent had entries for the “subsidized children” fields but not the “total number
of children” fields and the numbers of subsidized children listed summed to the total number field, the numbers in the “total number of children” fields were filled in.
• For each rate and age category, the number of unsubsidized children was calculated by
subtracting the number of subsidized children from the total number of enrolled children. If either of these pieces of information was missing, no value was entered for the number of unsubsidized children.
• Wherever the weekly full-time rates were blank but information was provided in other
units, the rates were converted to full-time weekly rates using the following calculations.
For “other billing period” set to week, the weekly rate was divided by one. For “other billing period” set to multiple weeks (for example, 2 weeks), the rate
was divided by the number of weeks. For “other billing period” set to month, the monthly rate was divided by 4.28. For “other billing period” set to multiple months (for example, 9 months), the rate
was divided by the number of months and then divided by 4.28. For “other billing period” set to hour, the hourly rate was multiplied by 40. For “other billing period” set to multiple hours (for example, 5 hours), the rate
was first divided by the number of hours and then multiplied by 40. For “other billing period” set to day, the daily rate was multiplied by 5. For “other billing period” set to multiple days (for example, 2 days), the rate was
first divided by the number of days and then multiplied by 5. For “other billing period” set to year, the yearly rate was divided by 52. For “other billing period” set to multiple years (for example, 2 years), the rate was
first divided by the number of years and then divided by 52.

12
• Wherever the weekly part-time rates were blank but information was provided in other units, the rates were converted to part-time weekly rates using the following calculations.
For “other billing period” set to week, the weekly rate was divided by one. For “other billing period” set to multiple weeks (for example, 2 weeks), the rate
was divided by the number of weeks. For “other billing period” set to month, the monthly rate was divided by 4.28. For “other billing period” set to multiple months (for example, 9 months), the rate
was divided by the number of months and then divided by 4.28. For “other billing period” set to hour, the hourly rate was multiplied by 21. For “other billing period” set to multiple hours (for example, 5 hours), the rate
was first divided by the number of hours and then multiplied by 21. For “other billing period” set to day, the daily rate was multiplied by 3. For “other billing period” set to multiple days (for example, 2 days), the rate was
first divided by the number of days and then multiplied by 3. For “other billing period” set to year, the yearly rate was divided by 52. For “other billing period” set to multiple years (for example, 2 years), the rate was
first divided by the number of years and then divided by 52.
• Wherever the hourly rates were blank but information was provided in other units, the rates were converted to hourly rates using the following calculations.
For “other billing period” set to week, the weekly rate was divided by 3. For “other billing period” set to multiple weeks (for example, 2 weeks), the rate
was divided by the number of weeks and then divided by 3. For “other billing period” set to month, the monthly rate was divided by 4.28 and
then divided by 3. For “other billing period” set to multiple months (for example, 9 months), the rate
was first divided by the number of months, then divided by 4.28, and then divided by 3.
For “other billing period” set to hour, the hourly rate was divided by 1. For “other billing period” set to multiple hours (for example, 5 hours), the rate
was divided by the number of hours. For “other billing period” set to day, the daily rate was divided by 3. For “other billing period” set to multiple days (for example, 2 days), the rate was
first divided by the number of days and then divided by 3. For “other billing period” set to year, the yearly rate was divided by 52 and then
divided by 3. For “other billing period” set to multiple years (for example, 2 years), the rate was
first divided by the number of years, then divided by 52, and then divided by 3. Upon review of the data, some providers were found that should not be included in rate calculations. First, 369 Head Start programs were removed. Also, 308 Pre-School Only providers were removed from the database. A program was considered a pre-school only program if it provided rates for the pre-school section of the survey and reported zero children in every other section. Their records were removed from the market rate calculations but were kept in the response rate analysis (Section 5) since they had been originally surveyed. For future

13
surveys, these two provider types should be removed from the sample before administration of the survey. After making these adjustments to the rate data, dotplots of full-time weekly, part-time weekly, and hourly rates were created for each of the five age categories for licensed, certified, registered, and licensed type-A providers. From these dotplots, it was clear that some outliers needed to be removed prior to the statistical analysis. For the full-time weekly and part-time weekly rates, the average and standard deviation of the reported rates were calculated. Rates that were more than three standard deviations from the mean rate were considered outliers and were removed from the analysis. The data reported for the hourly rates was more problematic than the weekly rate data. For the hourly rate data an estimate of the standard deviation of rates was used rather than the true standard deviation since there were some large outliers that might otherwise bias the standard deviation calculation. This estimate was calculated using the interquartile range of the hourly rate data and dividing this number by 1.35. Once this estimate was obtained, rates that were more than three estimated standard deviations from the overall mean were removed.
14
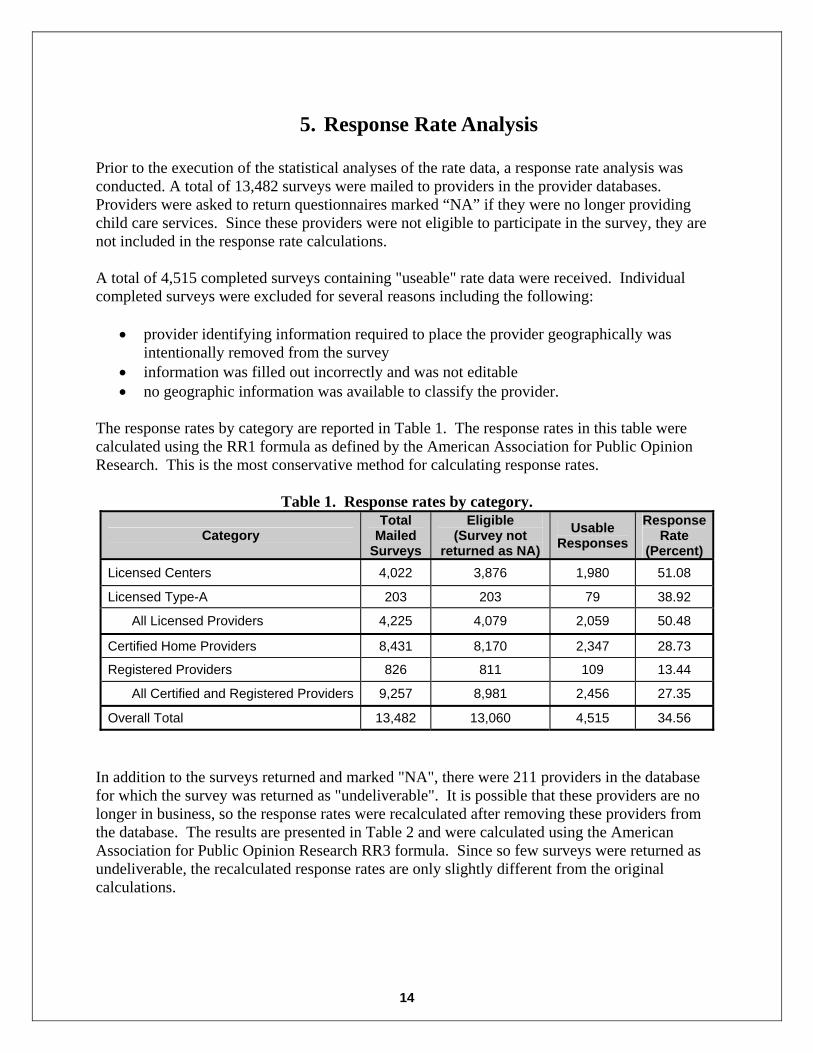
5. Response Rate Analysis Prior to the execution of the statistical analyses of the rate data, a response rate analysis was conducted. A total of 13,482 surveys were mailed to providers in the provider databases. Providers were asked to return questionnaires marked “NA” if they were no longer providing child care services. Since these providers were not eligible to participate in the survey, they are not included in the response rate calculations. A total of 4,515 completed surveys containing "useable" rate data were received. Individual completed surveys were excluded for several reasons including the following:
• provider identifying information required to place the provider geographically was intentionally removed from the survey
• information was filled out incorrectly and was not editable • no geographic information was available to classify the provider.
The response rates by category are reported in Table 1. The response rates in this table were calculated using the RR1 formula as defined by the American Association for Public Opinion Research. This is the most conservative method for calculating response rates.
Table 1. Response rates by category.
Category Total
Mailed Surveys
Eligible (Survey not
returned as NA) Usable
Responses Response
Rate (Percent)
Licensed Centers 4,022 3,876 1,980 51.08
Licensed Type-A 203 203 79 38.92
All Licensed Providers 4,225 4,079 2,059 50.48
Certified Home Providers 8,431 8,170 2,347 28.73
Registered Providers 826 811 109 13.44
All Certified and Registered Providers 9,257 8,981 2,456 27.35
Overall Total 13,482 13,060 4,515 34.56
In addition to the surveys returned and marked "NA", there were 211 providers in the database for which the survey was returned as "undeliverable". It is possible that these providers are no longer in business, so the response rates were recalculated after removing these providers from the database. The results are presented in Table 2 and were calculated using the American Association for Public Opinion Research RR3 formula. Since so few surveys were returned as undeliverable, the recalculated response rates are only slightly different from the original calculations.

15
Table 2. Response rates by category with providers with undeliverable addresses removed.
Category Total
Mailed Surveys
Eligible (Survey not
returned as NA nor undeliverable)
Usable Responses
Response Rate
(Percent)
Licensed Centers 4,022 3,800 1,980 52.11 Licensed Type-A 203 201 79 39.30
All Licensed Providers 4,225 4,001 2,059 51.46 Certified Home Providers 8,431 8,037 2,347 29.20 Registered Providers 826 811 109 13.44
All Certified and Registered Providers 9,257 8,848 2,456 27.76 Overall Total 13,482 12,849 4,515 35.14
The responses were also analyzed in terms of their geographic distribution across Ohio for the licensed providers, licensed type-A providers, certified home providers, and registered providers. For each of these groups, the providers in the provider database were grouped by counties, and the response rate in each county was calculated. The response rates are shown in the following figures: licensed providers (Figure 1), licensed type-A providers (Figure 2), certified home providers (Figure 3), and registered providers (Figure 4). As expected, only a few counties showed low response rates for licensed providers, suggesting that the licensed provider data can be considered representative of the state. The counties with lower response rates were generally more rural counties. For certified providers, a similar pattern emerged. For type-A and registered providers, response rates are widely variable. For the type-A providers, this is mostly due to the fact that there are so few providers – in many cases the single type-A provider in a county responded resulting in a response rate of 100% for that county. The response pattern for registered providers is the only one that causes any concern. Response rates for these providers were below 10% in many counties that have registered providers, suggesting that the R&Rs were inconsistent in their efforts to distribute the survey and to encourage responses to the survey.

16
Figure 1. Response rates for licensed centers.
Figure 2. Response rates for licensed type-A providers.

17
Figure 3. Response rates for certified home providers.
Figure 4. Response rates for registered providers.

18
6. Analysis of the Accuracy of the Submitted Rate Data A total of 845 licensed centers\Type A home providers, 1,688 certified home providers, and 164 registered providers were asked to include a copy of their current rate sheet along with their completed survey. Rate sheets were received from 144 licensed centers\type-A home providers, 70 certified home providers, and one registered provider. At the time of survey administration, all Head Start and Pre-School Only programs were included in the survey sample. However, due to their differences in pricing schemes in comparison to other types of providers, their records were removed from the analysis. After the Head Start and Pre-School Only programs were removed, the rate sheets received were from 123 licensed centers\type-A home providers, 69 certified home providers, and one registered provider. An analysis was conducted to assess the accuracy of the rates submitted on the survey by comparing rates published on rate sheets to the rates provided on the completed surveys. Rate sheets submitted by the providers were entered by the SCS into an analysis database. The provider’s Survey ID was then used to link the rate sheet information to the information provided on the completed survey. The accuracy of the survey rate data was assessed by calculating the percent error as shown below.
Error Rate = 100×[(survey rate/rate from the rate sheet) – 1] This error rate is a percentage error – values below 0% indicate under-reporting of rates relative to the rate sheets while values above 0% indicate over-reporting of rates relative to the rate sheets. The error rates were analyzed separately by provider type. All licensed\type-A home providers were combined, and all certified and registered providers were combined. The error rates for licensed providers are listed in Table 3. The overall mean error rate for licensed providers is -1.66 percent with a median of 0.00 percent. Among the 495 non-missing licensed provider rates, 372 rates matched exactly to the rate sheets while 42 rates were over-reported and 81 were under-reported compared to the rate sheets. For licensed providers, two of the individual age/rate categories had an error rate significantly different from zero. The average error rate for full-time weekly care for school-age children during the school year was -10.20 percent. Among the 52 responses for this category, 24 providers matched the rate sheets, 8 over-reported and 20 under-reported compared to the rate sheets. This age/rate category appears to be biased towards under-reporting (p-value = 0.036). The average error rate for part-time weekly care for school-age children during the school year was -9.71 percent. Among the 39 responses for this category, 11 providers matched the rate sheet, 8 over-reported and 20 under-reported compared to the rate sheets. This age/rate category appears to be biased towards under-reporting (p-value = 0.036). The error rates for certified/registered providers are listed in Table 5. The overall mean error rate for certified/registered providers is 3.11 percent with a median of 0.00 percent. Among the

19
774 non-missing certified/registered rates, 547 rates matched exactly to the rate sheets, while 121 rates were over-reported and 106 were under-reported compared to the rate sheets. For certified/registered providers, none of the individual age/rate categories had an error rate significantly different from zero.
18013590450-45-90
400
300
200
100
0
TOTAL ERROR LICENSED
Freq
uenc
y
Overall Error Rates for Licensed Centers/Type A Home Providers
Figure 5. Distribution of error rates for licensed centers/type-A home providers.

20
Table 3. Summary of licensed centers\type-A home provider error rates. Age/Rate Category
Number of Available
Rates
Number of Missing Rates
Mean Error Rate
Standard Error of the
Mean StandardDeviation
INFANT - Full Time Weekly 54 63 -0.112% 0.112 0.825 INFANT - Part Time Weekly 28 89 0.93% 5.15 27.23 INFANT - Hourly 5 112 0.000% 0.000 0.000 TODDLER - Full Time Weekly 69 48 -0.287% 0.781 6.491 TODDLER - Part Time Weekly 46 71 2.06% 2.55 17.27 TODDLER - Hourly 7 110 -0.023% 0.0228 0.0604 PRESCHOOL - Full Time Weekly 73 44 -0.945% 0.873 7.457 PRESCHOOL - Part Time Weekly 54 63 4.17% 4.83 35.5 PRESCHOOL - Hourly 7 110 0.000% 0.000 0.000 SCHOOLAGE - Full Time Weekly 52 65 -10.2% 3.99 28.77 SCHOOLAGE - Part Time Weekly 39 78 -9.71% 4.58 28.62 SCHOOLAGE - Hourly 9 108 -14.03% 7.28 21.85 SCHOOLAGE SUMMER – Full Time Weekly 32 85 -0.038% 0.306 1.73 SCHOOLAGE SUMMER – Part Time Weekly 15 102 -2.39% 2.16 8.38 SCHOOLAGE SUMMER - Hourly 5 112 0.000% 0.000 0.000
Table 4. Sign test for median error rate among licensed centers\type-A home providers. Age/Rate Category
Median Error Rate
Below Zero
Equal to Zero
Above Zero
p-value
INFANT - Full Time Weekly 0% 1 53 0 1.000 INFANT - Part Time Weekly 0% 5 20 3 0.727 INFANT - Hourly 0% 0 5 0 1.000 TODDLER - Full Time Weekly 0% 3 63 3 1.000 TODDLER - Part Time Weekly 0% 6 32 8 0.791 TODDLER - Hourly 0% 1 6 0 1.000 PRESCHOOL - Full Time Weekly 0% 8 61 4 0.388 PRESCHOOL - Part Time Weekly 0% 9 38 7 0.804 PRESCHOOL - Hourly 0% 0 7 0 1.000 SCHOOLAGE - Full Time Weekly 0% 20 24 8 0.036 SCHOOLAGE - Part Time Weekly -3.333% 20 11 8 0.036 SCHOOLAGE - Hourly 0% 3 6 0 0.25 SCHOOLAGE SUMMER – Full Time Weekly 0% 3 28 1 0.625 SCHOOLAGE SUMMER – Part Time Weekly 0% 2 13 0 0.50 SCHOOLAGE SUMMER - Hourly 0% 0 5 0 1.000

21
250200150100500-50
600
500
400
300
200
100
0
TOTAL ERROR CERTIFIED\REG
Freq
uenc
y
Overall Error Rates for Certified/Registered Providers
Figure 6. Distribution of error rates for certified/registered providers.

22
Table 5. Summary of certified/registered provider error rates.
Age/Rate Category
Number of Available
Rates
Number of Missing Rates
Mean Error Rate
Standard Error of
the Mean StandardDeviation
INFANT - Full Time Weekly 63 6 1.35% 1.76 13.98 INFANT - Part Time Weekly 60 9 -0.35% 2.22 17.16 INFANT - Hourly 44 25 4.76% 3.04 20.20 TODDLER - Full Time Weekly 59 10 1.28% 2.12 16.26 TODDLER - Part Time Weekly 55 14 0.36% 2.42 17.92 TODDLER - Hourly 43 26 8.68% 5.23 34.27 PRESCHOOL - Full Time Weekly 62 7 1.44% 1.71 13.50 PRESCHOOL - Part Time Weekly 58 11 2.69% 2.14 16.29 PRESCHOOL - Hourly 48 21 8.54% 4.70 32.54 SCHOOLAGE - Full Time Weekly 60 9 -0.4% 2.46 19.04 SCHOOLAGE - Part Time Weekly 59 10 2.57% 3.47 26.66 SCHOOLAGE - Hourly 45 24 8.14% 5.38 36.11 SCHOOLAGE SUMMER – Full Time Weekly 43 26 0.11% 2.20 14.44 SCHOOLAGE SUMMER – Part Time Weekly 42 27 -0.52% 2.29 14.87 SCHOOLAGE SUMMER - Hourly 33 36 16.23% 9.76 56.08
Table 6. Sign test for median error rate among certified/registered providers. Age/Rate Category
Median Error Rate
Below Zero
Equal to Zero
Above Zero
p-value
INFANT - Full Time Weekly 0% 7 46 10 0.629 INFANT - Part Time Weekly 0% 9 42 9 1.000 INFANT - Hourly 0% 4 32 8 0.388 TODDLER - Full Time Weekly 0% 8 40 11 0.648 TODDLER - Part Time Weekly 0% 9 40 6 0.607 TODDLER - Hourly 0% 6 29 8 0.791 PRESCHOOL - Full Time Weekly 0% 8 42 12 0.503 PRESCHOOL - Part Time Weekly 0% 9 43 6 0.607 PRESCHOOL - Hourly 0% 5 34 9 0.424 SCHOOLAGE - Full Time Weekly 0% 10 40 10 1.000 SCHOOLAGE - Part Time Weekly 0% 10 41 8 0.815 SCHOOLAGE - Hourly 0% 5 32 8 0.581 SCHOOLAGE SUMMER – Full Time Weekly 0% 5 32 6 1.000 SCHOOLAGE SUMMER – Part Time Weekly 0% 8 28 6 0.791 SCHOOLAGE SUMMER - Hourly 0% 3 26 4 1.000

23
The pattern of errors seems to indicate that providers, in general, understood the questions on the survey in the way that the writers of the survey intended. That fact that there is no consistent over-reporting or under-reporting in the majority of categories suggests that the questions did not mislead respondents. Despite the general accuracy of rates reported, rates for school-age children reported by licensed centers and type-A providers were biased low. This bias may have developed because school-age children fall into a wide variety of classes of care including before-school and after-school care. Providers with children attending one or both of these sessions may have had difficulty determining which rate was appropriate to enter for the various questions asked. During the development of the next ODJFS market rate survey, it is possible that these questions should be modified to more closely measure the types of care provided to school-age children.

24
7. Market Rate Structure Analysis The goal of the market rate analysis is to characterize the distribution of market rates across the state of Ohio within the 15 child care service categories. It is known that the market rates differ in important ways across the 15 child care categories and geographically across the state. In other words, it is known that providers tend to charge different rates for full-time, part-time, and hourly care. It is also known that providers charge different rates to care for children in different age groups. In addition to these two major factors that differentiate market rates, it is known that there are significant geographic differences in rates. Some counties have higher overall rate structures than other counties due to differences in population density and differences in economic conditions across the counties. These three factors (age category, rate category, and geographic location) have been used to rationally divide the rates into meaningfully interpretable groups. Within each of these groups the 50th, 55th, 60th, 65th, 70th, 75th, 80th, 85th, 90th, and 95th percentiles associated with the rate distribution have been calculated and are reported in the next section. The division of rates created by the 15 child care categories is straightforward, and the survey was purposely designed to obtain rate data for each of these categories. With respect to age, children are divided into five categories: infants (newborn through 17 months), toddlers (18 through 35 months), preschoolers (3 through 5 and not in school), school-age (5 through 12 and in school) during the regular year, and school-age during the summer. Within each of the age categories, the rates were divided into three categories: full-time (more than 25 hours/week), part-time (7 – 25 hours per week), and hourly (less than 7 hours per week). Each of the 15 child care categories is uniquely defined by the 15 possible combinations of age and rate. Dividing the providers into rational and interpretable groups, where the rate structure for the providers is similar within the group but different across the groups, is more complicated. Conceptually the provider grouping strategy can range from making each provider its own group (requiring over 10,000 groups) to simply grouping all providers together into one large group and using state-wide rates. One obvious compromise is to set the rate structures by county. This compromise would require the creation of 88 groups. This concept is appealing because of the known geographic differences in rate structures across the counties. However, this compromise is not completely satisfactory because it is still logistically difficult to manage 88 different rate structures for both the licensed and certified providers. When analyzing the data obtained in the 2006 market rate survey, another compromise method was devised. In this method, counties were used as the basic provider grouping factor and then counties were grouped together so that the rate structure for the counties is similar within the county group, but different across the county groups. For the 2008 market rate survey, this analysis was repeated, and the results were compared to the county groupings obtained in 2006.

25
The analysis methodology used to group counties into county groups is based on the concept of the rate structure established by each provider. The rate structure is considered to be the collection of the 10 child care rates defined by the following ten rate/age categories:
• Infants, full-time • Infants, part-time • Toddlers, full-time • Toddlers, part-time • Pre-school, full-time • Pre-school, part-time • School-age (school-year), full-time • School-age (school-year), part-time • School-age (summer), full-time • School-age (summer), part-time
The hourly rate data were not used in defining the rate structure for the purpose of grouping the counties because it was determined that there was a substantial amount of missing data associated with these rates. Inclusion of these rates would have significantly reduced the sample size available to perform the county grouping analysis thereby making it impossible to place several counties into groups. The formal statistical analysis methodology used to guide the clustering of the counties is known as principal components analysis. This statistical technique directly addresses the case of multiple, highly correlated, responses from each survey respondent (i.e. the 10 rates). It reduces, or summarizes, the information contained in the 10 rates to a smaller number of statistically independent responses that account for the majority of the variation observed in the original rate data while still having a direct interpretation within the context of the application. The reduction of the original rate data to a smaller subset of interpretable principal components is important to the practical execution of an effective and meaningful county clustering strategy. The following three sections describe exactly how the components used to cluster the counties were created and how the clustering analysis was performed.
7.1. Exploratory Analysis of Average County Rates The analysis began by calculating the average rate for each of the ten rate categories for each of the 88 Ohio counties. This calculation resulted in 88 sets of ten average rates. These averages were over the raw rates, unweighted by the number of unsubsidized children receiving the rate. Once the averages were obtained for each county, a matrix plot of all pairs of variables was constructed. Figure 7 shows this matrix plot. In this figure, the variable names correspond to the rate categories:
• INFANTFT_WK – The mean response to the rate question for full-time,
infants • INFANTPT_WK – Part-time, infants • TODDLERFT_WK – Full-time, toddlers

26
• TODDLERPT_WK – Part-time, toddlers • PRESCHOOLFT_WK – Full-time, preschool • PRESCHOOLPT_WK – Part-time, preschool • SCHOOLAGEFT_WK – Full-time, school-age (school-year) • SCHOOLAGEPT_WK – Part-time, school-age (school-year) • SCHOOLAGESUMMERFT_WK – Full-time, school-age (summer and
vacations) • SCHOOLAGESUMMERPT_WK – Part-time, school-age (summer and
vacations)
Figure 7. Matrix plot of county average values.
Examining the matrix plot, it can be seen that a high correlation exists among most of the values. This suggests the counties with lower rates are lower across all child care service categories while those with higher rates are higher across all the categories. Particularly strong correlations can be seen among the full-time rates and among the part-time rates.
7.2. Principal Components Analysis Next, a principal components analysis was conducted using the 88 sets of ten average rate values. For this analysis, one county, Paulding, could not be included because rates were not reported by any providers for several of the rate/age categories. The principal components analysis demonstrated that due to the strong statistical correlation structure among the ten
27
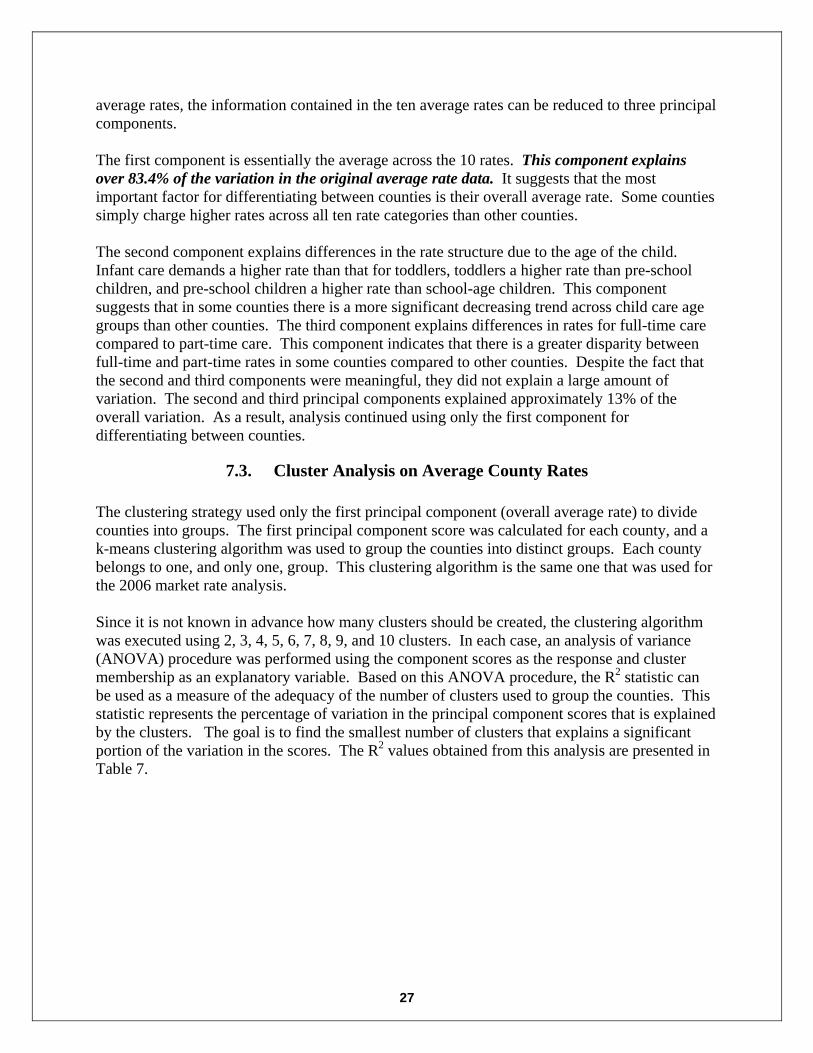
average rates, the information contained in the ten average rates can be reduced to three principal components. The first component is essentially the average across the 10 rates. This component explains over 83.4% of the variation in the original average rate data. It suggests that the most important factor for differentiating between counties is their overall average rate. Some counties simply charge higher rates across all ten rate categories than other counties. The second component explains differences in the rate structure due to the age of the child. Infant care demands a higher rate than that for toddlers, toddlers a higher rate than pre-school children, and pre-school children a higher rate than school-age children. This component suggests that in some counties there is a more significant decreasing trend across child care age groups than other counties. The third component explains differences in rates for full-time care compared to part-time care. This component indicates that there is a greater disparity between full-time and part-time rates in some counties compared to other counties. Despite the fact that the second and third components were meaningful, they did not explain a large amount of variation. The second and third principal components explained approximately 13% of the overall variation. As a result, analysis continued using only the first component for differentiating between counties.
7.3. Cluster Analysis on Average County Rates The clustering strategy used only the first principal component (overall average rate) to divide counties into groups. The first principal component score was calculated for each county, and a k-means clustering algorithm was used to group the counties into distinct groups. Each county belongs to one, and only one, group. This clustering algorithm is the same one that was used for the 2006 market rate analysis. Since it is not known in advance how many clusters should be created, the clustering algorithm was executed using 2, 3, 4, 5, 6, 7, 8, 9, and 10 clusters. In each case, an analysis of variance (ANOVA) procedure was performed using the component scores as the response and cluster membership as an explanatory variable. Based on this ANOVA procedure, the R2 statistic can be used as a measure of the adequacy of the number of clusters used to group the counties. This statistic represents the percentage of variation in the principal component scores that is explained by the clusters. The goal is to find the smallest number of clusters that explains a significant portion of the variation in the scores. The R2 values obtained from this analysis are presented in Table 7.

28
Table 7. R2 value for different numbers of clusters. Number of Clusters R2
2 70.27%3 82.68%4 91.73%5 93.61%6 96.49%7 97.15%8 97.79%9 98.03%
10 98.15%
Based on the results in Table 7 it was concluded that 6 clusters are most appropriate for dividing counties into groups since the increase in R2 becomes small at that point. The categorization of the counties into the six groups is shown in Figure 8 and reported in Table 8. In addition, Table 8 shows the cluster in which each county was classified in 2006. One county, Paulding, did not provide enough data in 2008 to be classified, so it is recommended to retain its classification in county group B. There was some movement of counties between clusters from 2006 to 2008. Nine of the 88 counties have moved to lower rate category county groupings (marked by † in the table). Most notably, Shelby county dropped two categories from group D to group B. Twenty-seven of the 88 counties have moved to higher rate category county groupings (marked by * in the table). Most notably, Monroe county moved from group B to group E.

29
Figure 8. County groupings using six clusters.

30
Table 8. County categorization.
Cou
nty
Clu
ster
M
embe
rshi
p
Prev
ious
C
lust
er
Cou
nty
Clu
ster
M
embe
rshi
p
Prev
ious
C
lust
er
Cou
nty
Clu
ster
M
embe
rshi
p
Prev
ious
C
lust
er
ADAMS† A B GUERNSEY* C B MORROW B B ALLEN D D HAMILTON F F MUSKINGUM B B ASHLAND B B HANCOCK C C NOBLE* B A ASHTABULA* E D HARDIN* C B OTTAWA* D C ATHENS D D HARRISON A A PERRY† B C AUGLAIZE† B C HENRY* D C PAULDING^ B B BELMONT B B HIGHLAND† B C PICKAWAY* C B BROWN* B A HOCKING C C PIKE* C B BUTLER F F HOLMES* D C PORTAGE† D E CARROLL† B C HURON* C B PREBLE B B CHAMPAIGN* B A JACKSON B B PUTNAM A A CLARK* D C JEFFERSON F F RICHLAND B B CLERMONT* F E KNOX D D ROSS C C CLINTON* C B LAKE E E SANDUSKY D D COLUMBIANA* D C LAWRENCE B B SCIOTO C C COSHOCTON B B LICKING D D SENECA* C B CRAWFORD* B A LOGAN C C SHELBY† B D CUYAHOGA E E LORAIN F F STARK D D DARKE A A LUCAS E E SUMMIT* F E DEFIANCE B B MADISON D D TRUMBULL* E D DELAWARE F F MAHONING F F TUSCARAWAS C C ERIE D D MARION C C UNION D D FAIRFIELD E E MEDINA* F E VAN WERT A A FAYETTE* D C MEIGS C C VINTON A A FRANKLIN F F MERCER B B WARREN* F E FULTON C C MIAMI C C WASHINGTON B B GALLIA* C B MONROE* E B WAYNE C C GEAUGA† E F MONTGOMERY* F E WILLIAMS† A B GREENE E E MORGAN* B A WOOD E E
WYANDOT† A B †Counties that moved to a county grouping with lower rates. *Counties that moved to a county grouping with higher rates. ^Paulding County did not provide enough data in 2008 to be classified; so it retained its B classification from 2006.

31
8. Estimated Rate Distributions and Calculated Percentiles The 50th, 55th, 60th, 65th, 70th, 75th, 80th, 85th, 90th, and 95th percentiles for the distribution of the rates for each of the 15 child care service categories were calculated both state-wide and for each of the six county groupings defined in Table 8. At the state-wide level, the percentiles were calculated separately for the following types of providers:
• All licensed providers together • Licensed center providers only • Licensed type-A providers only • All certified and registered providers together • Certified providers only • Registered providers only.
At the county grouping level, percentiles were calculated for the following two types of providers:
• All licensed providers together • All certified and registered providers together.
The percentile calculations were based on a weighting of the provider rates by the number of unsubsidized children. These percentile calculations were performed separately for each of the market rate distributions of interest. Thus, at the state-wide level 90 sets of percentiles were calculated (6 provider types × 15 child care service categories), and at the county group level 540 sets of percentiles were calculated (2 provider types × 15 child care service categories × 6 county groups). For each set of percentiles, the same methodology was used. This methodology can be made most clear by considering as an example the calculation for just one set of percentiles. As an example, consider the calculation of the state-wide percentiles for full-time weekly infant care for all licensed providers together. In this case the rate for full-time weekly infant care and the number of unsubsidized full-time weekly infants in care were captured for each licensed provider that responded to the survey. Using these rates and the numbers of unsubsidized children, a weighted mean rate and a weighted standard deviation for the rate were calculated using the number of unsubsidized children as the weighting factor. Essentially, these calculations are performed by replicating each rate by the number of children receiving that rate and then calculating the mean and standard deviation of that expanded set of numbers. This calculation was only performed if four or more providers in a given category responded to the survey with all of the needed information. If there were three of fewer providers responding the estimate of the variance was considered unreliable, so the rate distribution was not estimated. After obtaining the weighted mean and variance, the percentiles of the rate distribution were obtained using a normal approximation to the overall rate distribution.

32
The following tables report the percentiles of the estimated state-wide rate distributions across all 15 rate/age categories.
AGE/RATE CATEGORIES 50% 55% 60% 65% 70% 75% 80% 85% 90% 95%INFANT - Full Time Weekly $192.24 $197.55 $202.94 $208.51 $214.38 $220.71 $227.77 $235.99 $246.34 $261.67INFANT - Part Time Weekly $123.41 $128.04 $132.74 $137.60 $142.72 $148.25 $154.40 $161.58 $170.60 $183.98INFANT - Hourly $5.93 $6.18 $6.43 $6.68 $6.95 $7.25 $7.57 $7.95 $8.43 $9.14TODDLER - Full Time Weekly $170.93 $175.86 $180.87 $186.04 $191.50 $197.38 $203.94 $211.58 $221.19 $235.44TODDLER - Part Time Weekly $113.26 $118.05 $122.92 $127.95 $133.26 $138.98 $145.36 $152.79 $162.14 $176.00TODDLER - Hourly $8.99 $9.51 $10.04 $10.59 $11.17 $11.79 $12.49 $13.30 $14.32 $15.83PRESCHOOL - Full Time Weekly $147.79 $152.18 $156.63 $161.23 $166.08 $171.32 $177.15 $183.94 $192.49 $205.17PRESCHOOL - Part Time Weekly $84.87 $89.40 $94.00 $98.75 $103.76 $109.17 $115.19 $122.21 $131.04 $144.13PRESCHOOL - Hourly $5.81 $6.12 $6.43 $6.75 $7.09 $7.46 $7.87 $8.35 $8.95 $9.84SCHOOLAGE - Full Time Weekly $96.54 $101.55 $106.64 $111.90 $117.44 $123.43 $130.09 $137.86 $147.63 $162.11SCHOOLAGE - Part Time Weekly $65.15 $68.19 $71.29 $74.49 $77.87 $81.51 $85.56 $90.29 $96.24 $105.05SCHOOLAGE - Hourly $5.12 $5.44 $5.77 $6.11 $6.47 $6.86 $7.29 $7.79 $8.42 $9.36SCHOOLAGESUMMER - Full Time Weekly $137.00 $140.97 $145.00 $149.16 $153.55 $158.29 $163.56 $169.71 $177.45 $188.91SCHOOLAGESUMMER - Part Time Weekly $91.29 $94.92 $98.61 $102.42 $106.44 $110.77 $115.60 $121.23 $128.31 $138.80SCHOOLAGESUMMER - Hourly $5.49 $5.79 $6.10 $6.41 $6.74 $7.10 $7.50 $7.97 $8.56 $9.43
Statewide - Licensed (Centers and Type A Home Providers)
AGE/RATE CATEGORIES 50% 55% 60% 65% 70% 75% 80% 85% 90% 95%INFANT - Full Time Weekly $192.29 $197.59 $202.98 $208.55 $214.42 $220.76 $227.81 $236.03 $246.37 $261.71INFANT - Part Time Weekly $123.49 $128.13 $132.84 $137.71 $142.84 $148.38 $154.55 $161.74 $170.78 $184.18INFANT - Hourly $5.93 $6.18 $6.43 $6.68 $6.95 $7.25 $7.57 $7.95 $8.43 $9.14TODDLER - Full Time Weekly $171.09 $176.02 $181.04 $186.22 $191.68 $197.58 $204.14 $211.79 $221.42 $235.68TODDLER - Part Time Weekly $113.39 $118.20 $123.09 $128.14 $133.46 $139.20 $145.60 $153.05 $162.43 $176.34TODDLER - Hourly $9.05 $9.57 $10.10 $10.65 $11.23 $11.86 $12.55 $13.36 $14.38 $15.90PRESCHOOL - Full Time Weekly $147.87 $152.25 $156.71 $161.32 $166.18 $171.42 $177.25 $184.06 $192.61 $205.30PRESCHOOL - Part Time Weekly $84.83 $89.36 $93.97 $98.72 $103.74 $109.15 $115.17 $122.20 $131.04 $144.13PRESCHOOL - Hourly $5.81 $6.12 $6.43 $6.75 $7.10 $7.46 $7.87 $8.35 $8.95 $9.84SCHOOLAGE - Full Time Weekly $96.48 $101.50 $106.61 $111.88 $117.44 $123.43 $130.11 $137.89 $147.69 $162.20SCHOOLAGE - Part Time Weekly $65.12 $68.17 $71.27 $74.47 $77.85 $81.49 $85.55 $90.28 $96.23 $105.05SCHOOLAGE - Hourly $5.12 $5.44 $5.77 $6.12 $6.48 $6.86 $7.30 $7.80 $8.44 $9.38SCHOOLAGESUMMER - Full Time Weekly $137.05 $141.02 $145.05 $149.22 $153.61 $158.35 $163.63 $169.78 $177.52 $188.99SCHOOLAGESUMMER - Part Time Weekly $91.40 $95.03 $98.71 $102.52 $106.53 $110.86 $115.68 $121.30 $128.37 $138.85SCHOOLAGESUMMER - Hourly $5.49 $5.79 $6.10 $6.41 $6.74 $7.10 $7.50 $7.97 $8.56 $9.43
Statewide Percentiles - Licensed (Centers)

33
AGE/RATE CATEGORIES 50% 55% 60% 65% 70% 75% 80% 85% 90% 95%INFANT - Full Time Weekly $185.85 $191.32 $196.88 $202.63 $208.69 $215.23 $222.51 $231.00 $241.68 $257.51INFANT - Part Time Weekly $116.25 $120.27 $124.36 $128.58 $133.03 $137.83 $143.18 $149.41 $157.26 $168.88INFANT - Hourly $5.93 $6.18 $6.43 $6.68 $6.95 $7.25 $7.57 $7.95 $8.43 $9.14TODDLER - Full Time Weekly $148.41 $150.94 $153.52 $156.18 $158.99 $162.02 $165.39 $169.32 $174.27 $181.59TODDLER - Part Time Weekly $103.05 $106.30 $109.60 $113.02 $116.62 $120.50 $124.83 $129.87 $136.21 $145.61TODDLER - Hourly $9.05 $9.57 $10.10 $10.65 $11.23 $11.86 $12.55 $13.36 $14.38 $15.90PRESCHOOL - Full Time Weekly $131.12 $133.46 $135.83 $138.29 $140.88 $143.67 $146.78 $150.41 $154.97 $161.73PRESCHOOL - Part Time Weekly $96.61 $99.83 $103.10 $106.49 $110.05 $113.90 $118.18 $123.17 $129.45 $138.76PRESCHOOL - Hourly $5.81 $6.12 $6.43 $6.75 $7.10 $7.46 $7.87 $8.35 $8.95 $9.84SCHOOLAGE - Full Time Weekly $106.79 $108.26 $109.75 $111.30 $112.92 $114.68 $116.63 $118.91 $121.78 $126.03SCHOOLAGE - Part Time Weekly $76.25 $77.59 $78.96 $80.38 $81.87 $83.48 $85.27 $87.36 $89.99 $93.88SCHOOLAGE - Hourly $5.31 $5.41 $5.52 $5.63 $5.74 $5.87 $6.00 $6.16 $6.37 $6.67SCHOOLAGESUMMER - Full Time Weekly $125.19 $127.93 $130.73 $133.61 $136.66 $139.94 $143.59 $147.86 $153.22 $161.16SCHOOLAGESUMMER - Part Time Weekly $56.92 $59.07 $61.24 $63.49 $65.86 $68.42 $71.27 $74.60 $78.77 $84.97SCHOOLAGESUMMER - Hourly $5.49 $5.79 $6.10 $6.41 $6.74 $7.10 $7.50 $7.97 $8.56 $9.43
Statewide Percentiles - Licensed (Type A Home Providers)
AGE/RATE CATEGORIES 50% 55% 60% 65% 70% 75% 80% 85% 90% 95%INFANT - Full Time Weekly $139.36 $144.02 $148.75 $153.63 $158.79 $164.35 $170.54 $177.76 $186.84 $200.30INFANT - Part Time Weekly $85.42 $88.81 $92.26 $95.81 $99.56 $103.61 $108.12 $113.37 $119.98 $129.78INFANT - Hourly $4.65 $5.04 $5.44 $5.85 $6.28 $6.75 $7.27 $7.87 $8.64 $9.76TODDLER - Full Time Weekly $146.72 $151.03 $155.42 $159.95 $164.73 $169.88 $175.63 $182.32 $190.74 $203.22TODDLER - Part Time Weekly $87.83 $90.96 $94.14 $97.43 $100.90 $104.64 $108.81 $113.66 $119.78 $128.83TODDLER - Hourly $4.14 $4.39 $4.64 $4.90 $5.18 $5.47 $5.80 $6.18 $6.67 $7.38PRESCHOOL - Full Time Weekly $127.59 $131.44 $135.36 $139.41 $143.67 $148.27 $153.40 $159.37 $166.89 $178.03PRESCHOOL - Part Time Weekly $86.07 $89.03 $92.03 $95.14 $98.41 $101.94 $105.88 $110.46 $116.23 $124.78PRESCHOOL - Hourly $5.51 $5.93 $6.36 $6.80 $7.27 $7.77 $8.33 $8.98 $9.81 $11.02SCHOOLAGE - Full Time Weekly $109.81 $113.55 $117.35 $121.28 $125.42 $129.89 $134.87 $140.67 $147.97 $158.79SCHOOLAGE - Part Time Weekly $73.96 $77.27 $80.63 $84.11 $87.77 $91.73 $96.13 $101.26 $107.72 $117.29SCHOOLAGE - Hourly $4.04 $4.30 $4.57 $4.85 $5.15 $5.47 $5.82 $6.23 $6.75 $7.52SCHOOLAGESUMMER - Full Time Weekly $128.42 $133.31 $138.27 $143.40 $148.80 $154.63 $161.13 $168.70 $178.22 $192.34SCHOOLAGESUMMER - Part Time Weekly $84.49 $88.78 $93.14 $97.65 $102.40 $107.52 $113.22 $119.87 $128.24 $140.64SCHOOLAGESUMMER - Hourly $3.12 $3.31 $3.50 $3.70 $3.91 $4.14 $4.39 $4.69 $5.06 $5.61
Statewide Percentiles - Certified and Registered Home Providers

34
AGE/RATE CATEGORIES 50% 55% 60% 65% 70% 75% 80% 85% 90% 95%INFANT - Full Time Weekly $139.19 $143.89 $148.66 $153.59 $158.79 $164.40 $170.65 $177.93 $187.09 $200.66INFANT - Part Time Weekly $88.71 $92.06 $95.47 $98.99 $102.69 $106.70 $111.15 $116.35 $122.88 $132.57INFANT - Hourly $6.10 $6.57 $7.04 $7.53 $8.05 $8.61 $9.23 $9.95 $10.86 $12.21TODDLER - Full Time Weekly $147.49 $151.77 $156.13 $160.63 $165.37 $170.49 $176.19 $182.84 $191.20 $203.59TODDLER - Part Time Weekly $90.48 $93.42 $96.40 $99.49 $102.74 $106.25 $110.16 $114.72 $120.45 $128.95TODDLER - Hourly $4.43 $4.68 $4.94 $5.21 $5.49 $5.79 $6.13 $6.53 $7.03 $7.76PRESCHOOL - Full Time Weekly $127.94 $131.84 $135.80 $139.90 $144.22 $148.88 $154.06 $160.11 $167.72 $178.99PRESCHOOL - Part Time Weekly $84.87 $87.87 $90.91 $94.06 $97.38 $100.96 $104.95 $109.60 $115.45 $124.11PRESCHOOL - Hourly $5.83 $6.25 $6.69 $7.14 $7.62 $8.13 $8.70 $9.36 $10.20 $11.44SCHOOLAGE - Full Time Weekly $109.83 $113.59 $117.42 $121.37 $125.54 $130.03 $135.04 $140.87 $148.22 $159.10SCHOOLAGE - Part Time Weekly $74.20 $77.55 $80.95 $84.46 $88.17 $92.16 $96.61 $101.80 $108.33 $118.00SCHOOLAGE - Hourly $4.05 $4.31 $4.58 $4.86 $5.16 $5.48 $5.83 $6.25 $6.77 $7.54SCHOOLAGESUMMER - Full Time Weekly $129.11 $134.06 $139.09 $144.29 $149.77 $155.68 $162.26 $169.94 $179.59 $193.90SCHOOLAGESUMMER - Part Time Weekly $83.97 $88.32 $92.75 $97.31 $102.13 $107.33 $113.11 $119.86 $128.35 $140.92SCHOOLAGESUMMER - Hourly $2.69 $2.80 $2.91 $3.03 $3.16 $3.29 $3.44 $3.61 $3.83 $4.16
Statewide Percentiles - Certified Home Providers
AGE/RATE CATEGORIES 50% 55% 60% 65% 70% 75% 80% 85% 90% 95%INFANT - Full Time Weekly $140.61 $144.99 $149.44 $154.04 $158.88 $164.11 $169.94 $176.72 $185.26 $197.92INFANT - Part Time Weekly $68.53 $71.35 $74.22 $77.18 $80.29 $83.66 $87.41 $91.78 $97.27 $105.42INFANT - Hourly $3.20 $3.41 $3.62 $3.83 $4.06 $4.31 $4.58 $4.90 $5.31 $5.90TODDLER - Full Time Weekly $140.71 $145.23 $149.83 $154.58 $159.59 $164.99 $171.01 $178.02 $186.84 $199.92TODDLER - Part Time Weekly $70.95 $74.59 $78.28 $82.10 $86.12 $90.46 $95.29 $100.92 $108.01 $118.51TODDLER - Hourly $2.83 $2.96 $3.10 $3.23 $3.38 $3.54 $3.71 $3.91 $4.17 $4.55PRESCHOOL - Full Time Weekly $125.00 $128.51 $132.07 $135.75 $139.64 $143.83 $148.49 $153.93 $160.77 $170.91PRESCHOOL - Part Time Weekly $100.26 $101.91 $103.58 $105.30 $107.13 $109.09 $111.28 $113.83 $117.04 $121.79PRESCHOOL - Hourly $3.00 $3.18 $3.36 $3.54 $3.74 $3.95 $4.19 $4.47 $4.81 $5.33SCHOOLAGE - Full Time Weekly $109.00 $111.89 $114.83 $117.87 $121.07 $124.53 $128.38 $132.86 $138.50 $146.87SCHOOLAGE - Part Time Weekly $71.00 $73.97 $77.00 $80.12 $83.41 $86.96 $90.92 $95.53 $101.33 $109.92SCHOOLAGE - Hourly $3.95 $4.23 $4.52 $4.83 $5.14 $5.49 $5.87 $6.31 $6.87 $7.70SCHOOLAGESUMMER - Full Time Weekly $111.26 $113.04 $114.84 $116.71 $118.67 $120.79 $123.15 $125.91 $129.37 $134.50SCHOOLAGESUMMER - Part Time Weekly $87.72 $91.80 $95.95 $100.23 $104.75 $109.62 $115.04 $121.37 $129.32 $141.11SCHOOLAGESUMMER - Hourly $5.56 $5.84 $6.12 $6.41 $6.72 $7.05 $7.43 $7.86 $8.40 $9.21
Statewide Percentiles - Registered Home Providers

35
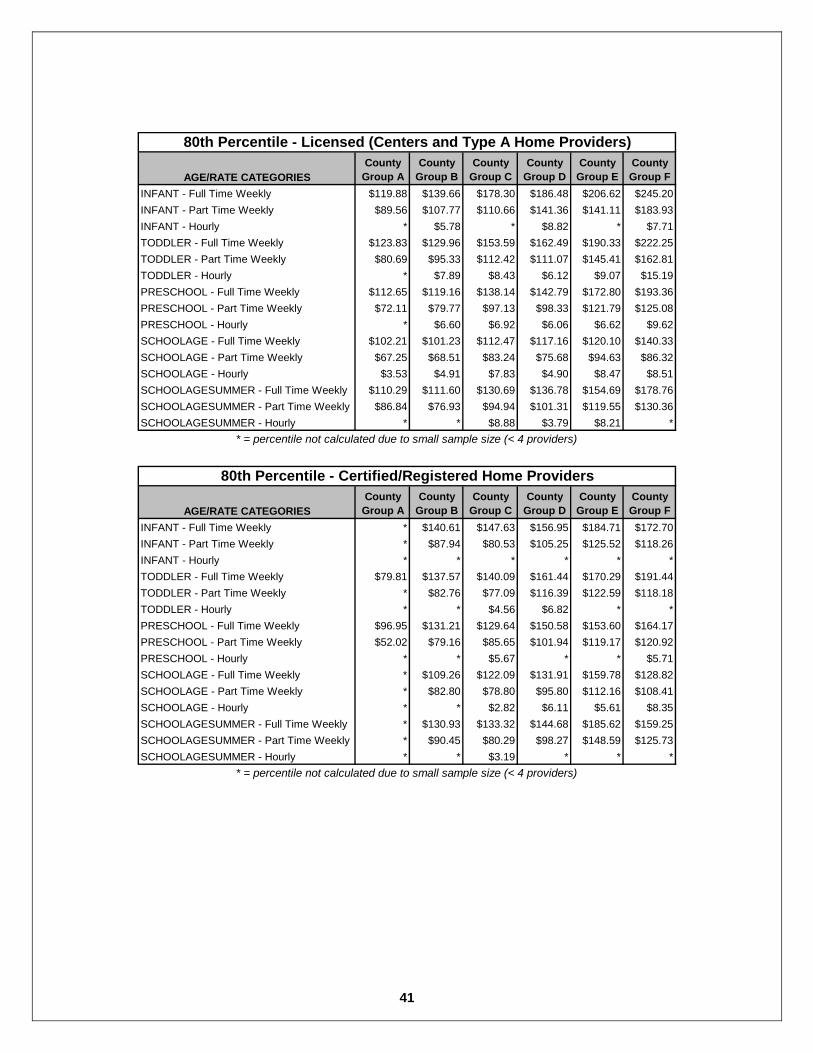
The following tables report the estimated percentiles of the rate distributions across all 15 rate/age categories and for all six county groups. The percentiles are reported in separate tables so that different groups can be compared easily at the same percentile.
AGE/RATE CATEGORIESCounty
Group ACounty
Group BCounty
Group CCounty
Group DCounty
Group ECounty Group F
INFANT - Full Time Weekly $114.56 $125.39 $152.79 $162.01 $182.81 $217.62INFANT - Part Time Weekly $80.13 $90.23 $96.97 $114.74 $124.62 $151.13INFANT - Hourly * $4.81 * $7.54 * $6.73TODDLER - Full Time Weekly $113.77 $116.77 $135.71 $140.38 $167.76 $193.54TODDLER - Part Time Weekly $73.89 $82.36 $94.21 $94.26 $116.52 $127.79TODDLER - Hourly * $5.64 $6.08 $5.80 $7.27 $13.28PRESCHOOL - Full Time Weekly $103.20 $106.26 $118.98 $124.18 $149.43 $167.12PRESCHOOL - Part Time Weekly $64.81 $67.67 $77.91 $77.05 $89.66 $90.31PRESCHOOL - Hourly * $4.87 $5.37 $4.39 $5.32 $7.42SCHOOLAGE - Full Time Weekly $80.62 $77.38 $80.91 $85.61 $91.95 $104.80SCHOOLAGE - Part Time Weekly $58.75 $45.83 $61.57 $57.25 $74.14 $67.82SCHOOLAGE - Hourly $3.22 $3.82 $5.29 $3.57 $6.36 $6.37SCHOOLAGESUMMER - Full Time Weekly $97.43 $98.94 $113.51 $118.75 $135.10 $153.60SCHOOLAGESUMMER - Part Time Weekly $72.94 $67.11 $78.29 $79.03 $99.26 $105.98SCHOOLAGESUMMER - Hourly * * $6.87 $2.93 $6.62 *
50th Percentile - Licensed (Centers and Type A Home Providers)
* = percentile not calculated due to small sample size (< 4 providers)
AGE/RATE CATEGORIESCounty
Group ACounty
Group BCounty
Group CCounty
Group DCounty
Group ECounty Group F
INFANT - Full Time Weekly * $126.49 $128.83 $143.74 $152.36 $137.11INFANT - Part Time Weekly * $76.35 $74.02 $86.82 $92.02 $110.12INFANT - Hourly * * * * * *TODDLER - Full Time Weekly $75.50 $120.42 $125.15 $139.99 $142.57 $164.09TODDLER - Part Time Weekly * $72.81 $69.37 $98.87 $98.14 $102.77TODDLER - Hourly * * $3.62 $4.71 * *PRESCHOOL - Full Time Weekly $84.69 $114.86 $116.06 $127.35 $129.83 $134.33PRESCHOOL - Part Time Weekly $44.00 $67.20 $74.14 $89.23 $103.74 $102.91PRESCHOOL - Hourly * * $4.11 * * $5.31SCHOOLAGE - Full Time Weekly * $92.72 $101.00 $111.99 $124.03 $108.49SCHOOLAGE - Part Time Weekly * $71.85 $64.16 $81.33 $82.44 $81.97SCHOOLAGE - Hourly * * $2.55 $4.34 $4.27 $6.75SCHOOLAGESUMMER - Full Time Weekly * $113.86 $115.53 $127.58 $138.85 $133.62SCHOOLAGESUMMER - Part Time Weekly * $77.13 $68.96 $82.28 $105.28 $106.62SCHOOLAGESUMMER - Hourly * * $2.78 * * *
50th Percentile - Certified/Registered Home Providers
* = percentile not calculated due to small sample size (< 4 providers)

36
AGE/RATE CATEGORIESCounty
Group ACounty
Group BCounty
Group CCounty
Group DCounty
Group ECounty Group F
INFANT - Full Time Weekly $115.35 $127.52 $156.60 $165.66 $186.37 $221.74INFANT - Part Time Weekly $81.54 $92.85 $99.01 $118.72 $127.08 $156.02INFANT - Hourly * $4.96 * $7.73 * $6.88TODDLER - Full Time Weekly $115.27 $118.74 $138.38 $143.68 $171.13 $197.83TODDLER - Part Time Weekly $74.91 $84.30 $96.93 $96.77 $120.83 $133.02TODDLER - Hourly * $5.97 $6.43 $5.84 $7.53 $13.56PRESCHOOL - Full Time Weekly $104.61 $108.18 $121.84 $126.96 $152.92 $171.04PRESCHOOL - Part Time Weekly $65.90 $69.47 $80.78 $80.23 $94.46 $95.50PRESCHOOL - Hourly * $5.13 $5.60 $4.64 $5.52 $7.75SCHOOLAGE - Full Time Weekly $83.84 $80.94 $85.63 $90.32 $96.15 $110.11SCHOOLAGE - Part Time Weekly $60.02 $49.21 $64.81 $60.01 $77.20 $70.58SCHOOLAGE - Hourly $3.27 $3.98 $5.67 $3.77 $6.68 $6.69SCHOOLAGESUMMER - Full Time Weekly $99.35 $100.83 $116.08 $121.44 $138.02 $157.35SCHOOLAGESUMMER - Part Time Weekly $75.02 $68.57 $80.77 $82.36 $102.29 $109.62SCHOOLAGESUMMER - Hourly * * $7.17 $3.06 $6.86 *
55th Percentile - Licensed (Centers and Type A Home Providers)
* = percentile not calculated due to small sample size (< 4 providers)
AGE/RATE CATEGORIESCounty
Group ACounty
Group BCounty
Group CCounty
Group DCounty
Group ECounty Group F
INFANT - Full Time Weekly * $128.60 $131.64 $145.71 $157.19 $142.42INFANT - Part Time Weekly * $78.08 $75.00 $89.57 $97.02 $111.34INFANT - Hourly * * * * * *TODDLER - Full Time Weekly $76.14 $122.98 $127.38 $143.20 $146.71 $168.17TODDLER - Part Time Weekly * $74.30 $70.52 $101.49 $101.79 $105.07TODDLER - Hourly * * $3.76 $5.03 * *PRESCHOOL - Full Time Weekly $86.52 $117.30 $118.09 $130.82 $133.38 $138.78PRESCHOOL - Part Time Weekly $45.20 $68.99 $75.85 $91.13 $106.05 $105.60PRESCHOOL - Hourly * * $4.34 * * $5.37SCHOOLAGE - Full Time Weekly * $95.19 $104.15 $114.97 $129.37 $111.52SCHOOLAGE - Part Time Weekly * $73.48 $66.34 $83.49 $86.88 $85.92SCHOOLAGE - Hourly * * $2.59 $4.60 $4.47 $6.99SCHOOLAGESUMMER - Full Time Weekly * $116.41 $118.18 $130.13 $145.83 $137.45SCHOOLAGESUMMER - Part Time Weekly * $79.12 $70.65 $84.67 $111.75 $109.48SCHOOLAGESUMMER - Hourly * * $2.85 * * *
55th Percentile - Certified/Registered Home Providers
* = percentile not calculated due to small sample size (< 4 providers)

37
AGE/RATE CATEGORIESCounty
Group ACounty
Group BCounty
Group CCounty
Group DCounty
Group ECounty Group F
INFANT - Full Time Weekly $116.16 $129.69 $160.47 $169.38 $189.98 $225.92INFANT - Part Time Weekly $82.97 $95.51 $101.09 $122.76 $129.58 $161.00INFANT - Hourly * $5.11 * $7.93 * $7.03TODDLER - Full Time Weekly $116.80 $120.74 $141.09 $147.03 $174.56 $202.18TODDLER - Part Time Weekly $75.94 $86.26 $99.70 $99.32 $125.22 $138.33TODDLER - Hourly * $6.31 $6.79 $5.89 $7.81 $13.85PRESCHOOL - Full Time Weekly $106.04 $110.14 $124.75 $129.79 $156.47 $175.02PRESCHOOL - Part Time Weekly $67.01 $71.31 $83.69 $83.45 $99.33 $100.78PRESCHOOL - Hourly * $5.39 $5.84 $4.89 $5.71 $8.08SCHOOLAGE - Full Time Weekly $87.12 $84.56 $90.41 $95.11 $100.42 $115.50SCHOOLAGE - Part Time Weekly $61.31 $52.65 $68.09 $62.80 $80.31 $73.39SCHOOLAGE - Hourly $3.31 $4.15 $6.06 $3.97 $7.00 $7.02SCHOOLAGESUMMER - Full Time Weekly $101.30 $102.75 $118.68 $124.17 $141.00 $161.17SCHOOLAGESUMMER - Part Time Weekly $77.13 $70.06 $83.30 $85.74 $105.37 $113.32SCHOOLAGESUMMER - Hourly * * $7.47 $3.19 $7.10 *
60th Percentile - Licensed (Centers and Type A Home Providers)
* = percentile not calculated due to small sample size (< 4 providers)
AGE/RATE CATEGORIESCounty
Group ACounty
Group BCounty
Group CCounty
Group DCounty
Group ECounty Group F
INFANT - Full Time Weekly * $130.74 $134.49 $147.72 $162.10 $147.82INFANT - Part Time Weekly * $79.84 $75.98 $92.37 $102.11 $112.57INFANT - Hourly * * * * * *TODDLER - Full Time Weekly $76.80 $125.58 $129.65 $146.45 $150.91 $172.32TODDLER - Part Time Weekly * $75.81 $71.69 $104.15 $105.50 $107.41TODDLER - Hourly * * $3.91 $5.35 * *PRESCHOOL - Full Time Weekly $88.38 $119.78 $120.15 $134.34 $136.99 $143.31PRESCHOOL - Part Time Weekly $46.41 $70.80 $77.60 $93.06 $108.39 $108.33PRESCHOOL - Hourly * * $4.58 * * $5.43SCHOOLAGE - Full Time Weekly * $97.70 $107.35 $117.99 $134.79 $114.61SCHOOLAGE - Part Time Weekly * $75.14 $68.57 $85.69 $91.39 $89.93SCHOOLAGE - Hourly * * $2.63 $4.87 $4.67 $7.23SCHOOLAGESUMMER - Full Time Weekly * $119.00 $120.88 $132.73 $152.93 $141.34SCHOOLAGESUMMER - Part Time Weekly * $81.14 $72.37 $87.09 $118.32 $112.38SCHOOLAGESUMMER - Hourly * * $2.91 * * *
60th Percentile - Certified/Registered Home Providers
* = percentile not calculated due to small sample size (< 4 providers)

38
AGE/RATE CATEGORIESCounty
Group ACounty
Group BCounty
Group CCounty
Group DCounty
Group ECounty Group F
INFANT - Full Time Weekly $117.00 $131.93 $164.47 $173.21 $193.71 $230.25INFANT - Part Time Weekly $84.45 $98.26 $103.24 $126.93 $132.17 $166.14INFANT - Hourly * $5.26 * $8.13 * $7.18TODDLER - Full Time Weekly $118.37 $122.81 $143.90 $150.50 $178.10 $206.69TODDLER - Part Time Weekly $77.00 $88.30 $102.55 $101.96 $129.75 $143.82TODDLER - Hourly * $6.67 $7.16 $5.94 $8.09 $14.15PRESCHOOL - Full Time Weekly $107.53 $112.17 $127.75 $132.70 $160.13 $179.13PRESCHOOL - Part Time Weekly $68.15 $73.21 $86.71 $86.79 $104.37 $106.23PRESCHOOL - Hourly * $5.66 $6.08 $5.15 $5.92 $8.43SCHOOLAGE - Full Time Weekly $90.50 $88.30 $95.36 $100.05 $104.84 $121.07SCHOOLAGE - Part Time Weekly $62.64 $56.21 $71.49 $65.69 $83.52 $76.29SCHOOLAGE - Hourly $3.36 $4.32 $6.45 $4.18 $7.33 $7.35SCHOOLAGESUMMER - Full Time Weekly $103.32 $104.74 $121.38 $127.00 $144.07 $165.12SCHOOLAGESUMMER - Part Time Weekly $79.31 $71.60 $85.91 $89.23 $108.55 $117.14SCHOOLAGESUMMER - Hourly * * $7.79 $3.33 $7.35 *
65th Percentile - Licensed (Centers and Type A Home Providers)
* = percentile not calculated due to small sample size (< 4 providers)
AGE/RATE CATEGORIESCounty
Group ACounty
Group BCounty
Group CCounty
Group DCounty
Group ECounty Group F
INFANT - Full Time Weekly * $132.96 $137.44 $149.79 $167.17 $153.40INFANT - Part Time Weekly * $81.66 $77.01 $95.26 $107.36 $113.85INFANT - Hourly * * * * * *TODDLER - Full Time Weekly $77.47 $128.27 $131.99 $149.81 $155.26 $176.61TODDLER - Part Time Weekly * $77.37 $72.90 $106.89 $109.33 $109.83TODDLER - Hourly * * $4.05 $5.68 * *PRESCHOOL - Full Time Weekly $90.30 $122.34 $122.28 $137.99 $140.71 $147.99PRESCHOOL - Part Time Weekly $47.67 $72.68 $79.41 $95.05 $110.81 $111.16PRESCHOOL - Hourly * * $4.82 * * $5.49SCHOOLAGE - Full Time Weekly * $100.29 $110.65 $121.11 $140.40 $117.80SCHOOLAGE - Part Time Weekly * $76.86 $70.86 $87.96 $96.05 $94.07SCHOOLAGE - Hourly * * $2.67 $5.15 $4.88 $7.48SCHOOLAGESUMMER - Full Time Weekly * $121.68 $123.67 $135.41 $160.26 $145.36SCHOOLAGESUMMER - Part Time Weekly * $83.23 $74.15 $89.60 $125.11 $115.37SCHOOLAGESUMMER - Hourly * * $2.97 * * *
65th Percentile - Certified/Registered Home Providers
* = percentile not calculated due to small sample size (< 4 providers)
39
AGE/RATE CATEGORIESCounty
Group ACounty
Group BCounty
Group CCounty
Group DCounty
Group ECounty Group F
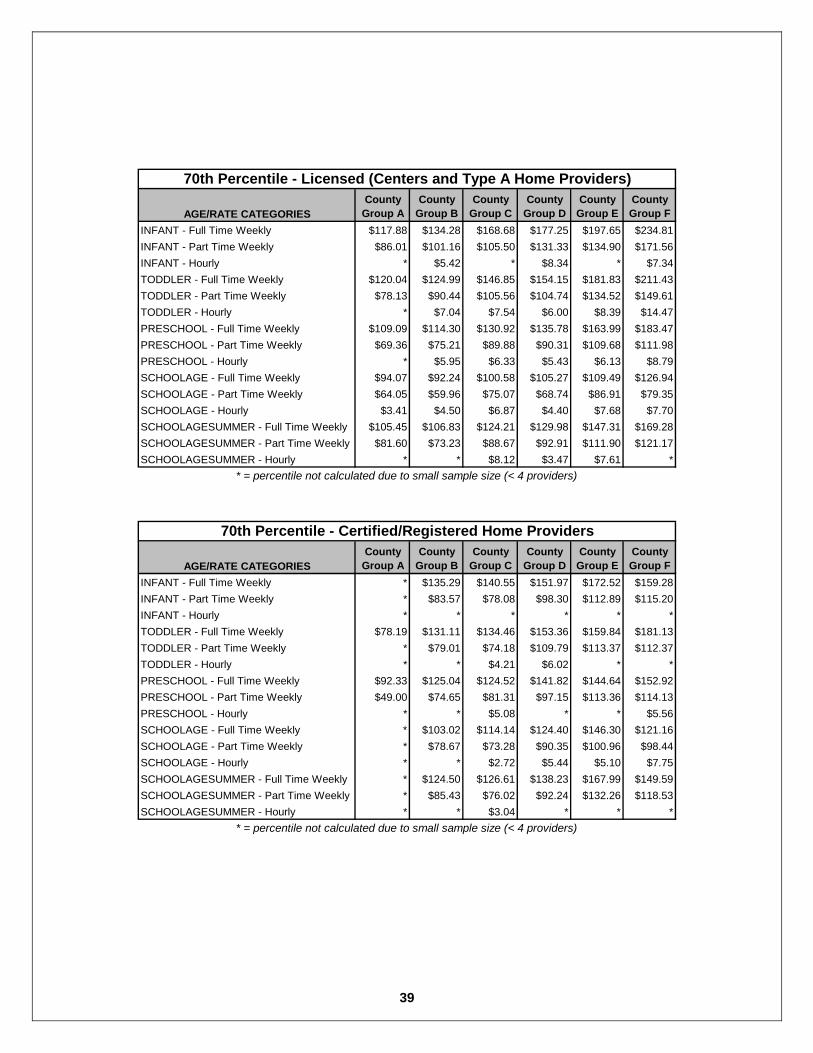
INFANT - Full Time Weekly $117.88 $134.28 $168.68 $177.25 $197.65 $234.81INFANT - Part Time Weekly $86.01 $101.16 $105.50 $131.33 $134.90 $171.56INFANT - Hourly * $5.42 * $8.34 * $7.34TODDLER - Full Time Weekly $120.04 $124.99 $146.85 $154.15 $181.83 $211.43TODDLER - Part Time Weekly $78.13 $90.44 $105.56 $104.74 $134.52 $149.61TODDLER - Hourly * $7.04 $7.54 $6.00 $8.39 $14.47PRESCHOOL - Full Time Weekly $109.09 $114.30 $130.92 $135.78 $163.99 $183.47PRESCHOOL - Part Time Weekly $69.36 $75.21 $89.88 $90.31 $109.68 $111.98PRESCHOOL - Hourly * $5.95 $6.33 $5.43 $6.13 $8.79SCHOOLAGE - Full Time Weekly $94.07 $92.24 $100.58 $105.27 $109.49 $126.94SCHOOLAGE - Part Time Weekly $64.05 $59.96 $75.07 $68.74 $86.91 $79.35SCHOOLAGE - Hourly $3.41 $4.50 $6.87 $4.40 $7.68 $7.70SCHOOLAGESUMMER - Full Time Weekly $105.45 $106.83 $124.21 $129.98 $147.31 $169.28SCHOOLAGESUMMER - Part Time Weekly $81.60 $73.23 $88.67 $92.91 $111.90 $121.17SCHOOLAGESUMMER - Hourly * * $8.12 $3.47 $7.61 *
70th Percentile - Licensed (Centers and Type A Home Providers)
* = percentile not calculated due to small sample size (< 4 providers)
AGE/RATE CATEGORIESCounty
Group ACounty
Group BCounty
Group CCounty
Group DCounty
Group ECounty Group F
INFANT - Full Time Weekly * $135.29 $140.55 $151.97 $172.52 $159.28INFANT - Part Time Weekly * $83.57 $78.08 $98.30 $112.89 $115.20INFANT - Hourly * * * * * *TODDLER - Full Time Weekly $78.19 $131.11 $134.46 $153.36 $159.84 $181.13TODDLER - Part Time Weekly * $79.01 $74.18 $109.79 $113.37 $112.37TODDLER - Hourly * * $4.21 $6.02 * *PRESCHOOL - Full Time Weekly $92.33 $125.04 $124.52 $141.82 $144.64 $152.92PRESCHOOL - Part Time Weekly $49.00 $74.65 $81.31 $97.15 $113.36 $114.13PRESCHOOL - Hourly * * $5.08 * * $5.56SCHOOLAGE - Full Time Weekly * $103.02 $114.14 $124.40 $146.30 $121.16SCHOOLAGE - Part Time Weekly * $78.67 $73.28 $90.35 $100.96 $98.44SCHOOLAGE - Hourly * * $2.72 $5.44 $5.10 $7.75SCHOOLAGESUMMER - Full Time Weekly * $124.50 $126.61 $138.23 $167.99 $149.59SCHOOLAGESUMMER - Part Time Weekly * $85.43 $76.02 $92.24 $132.26 $118.53SCHOOLAGESUMMER - Hourly * * $3.04 * * *
70th Percentile - Certified/Registered Home Providers
* = percentile not calculated due to small sample size (< 4 providers)

40
AGE/RATE CATEGORIESCounty
Group ACounty
Group BCounty
Group CCounty
Group DCounty
Group ECounty Group F
INFANT - Full Time Weekly $118.83 $136.83 $173.23 $181.62 $201.89 $239.72INFANT - Part Time Weekly $87.69 $104.28 $107.94 $136.07 $137.84 $177.41INFANT - Hourly * $5.59 * $8.57 * $7.52TODDLER - Full Time Weekly $121.83 $127.34 $150.04 $158.10 $185.85 $216.55TODDLER - Part Time Weekly $79.34 $92.76 $108.81 $107.73 $139.67 $155.86TODDLER - Hourly * $7.44 $7.96 $6.05 $8.71 $14.81PRESCHOOL - Full Time Weekly $110.77 $116.60 $134.34 $139.10 $168.16 $188.15PRESCHOOL - Part Time Weekly $70.66 $77.36 $93.31 $94.10 $115.41 $118.18PRESCHOOL - Hourly * $6.26 $6.61 $5.73 $6.36 $9.18SCHOOLAGE - Full Time Weekly $97.92 $96.49 $106.21 $110.89 $114.51 $133.28SCHOOLAGE - Part Time Weekly $65.56 $64.00 $78.93 $72.02 $90.56 $82.64SCHOOLAGE - Hourly $3.47 $4.69 $7.33 $4.63 $8.05 $8.08SCHOOLAGESUMMER - Full Time Weekly $107.74 $109.09 $127.28 $133.20 $150.80 $173.76SCHOOLAGESUMMER - Part Time Weekly $84.08 $74.98 $91.64 $96.88 $115.52 $125.52SCHOOLAGESUMMER - Hourly * * $8.48 $3.62 $7.89 *
75th Percentile - Licensed (Centers and Type A Home Providers)
* = percentile not calculated due to small sample size (< 4 providers)
AGE/RATE CATEGORIESCounty
Group ACounty
Group BCounty
Group CCounty
Group DCounty
Group ECounty Group F
INFANT - Full Time Weekly * $137.80 $143.90 $154.33 $178.29 $165.63INFANT - Part Time Weekly * $85.64 $79.24 $101.59 $118.87 $116.65INFANT - Hourly * * * * * *TODDLER - Full Time Weekly $78.96 $134.17 $137.12 $157.18 $164.78 $186.01TODDLER - Part Time Weekly * $80.78 $75.55 $112.91 $117.73 $115.12TODDLER - Hourly * * $4.37 $6.40 * *PRESCHOOL - Full Time Weekly $94.52 $127.96 $126.94 $145.97 $148.88 $158.24PRESCHOOL - Part Time Weekly $50.43 $76.78 $83.36 $99.42 $116.11 $117.35PRESCHOOL - Hourly * * $5.36 * * $5.63SCHOOLAGE - Full Time Weekly * $105.97 $117.90 $127.95 $152.68 $124.78SCHOOLAGE - Part Time Weekly * $80.62 $75.89 $92.92 $106.26 $103.16SCHOOLAGE - Hourly * * $2.77 $5.76 $5.34 $8.03SCHOOLAGESUMMER - Full Time Weekly * $127.54 $129.79 $141.28 $176.33 $154.16SCHOOLAGESUMMER - Part Time Weekly * $87.80 $78.04 $95.09 $139.99 $121.94SCHOOLAGESUMMER - Hourly * * $3.11 * * *
75th Percentile - Certified/Registered Home Providers
* = percentile not calculated due to small sample size (< 4 providers)
41
AGE/RATE CATEGORIESCounty
Group ACounty
Group BCounty
Group CCounty
Group DCounty
Group ECounty Group F
INFANT - Full Time Weekly $119.88 $139.66 $178.30 $186.48 $206.62 $245.20INFANT - Part Time Weekly $89.56 $107.77 $110.66 $141.36 $141.11 $183.93INFANT - Hourly * $5.78 * $8.82 * $7.71TODDLER - Full Time Weekly $123.83 $129.96 $153.59 $162.49 $190.33 $222.25TODDLER - Part Time Weekly $80.69 $95.33 $112.42 $111.07 $145.41 $162.81TODDLER - Hourly * $7.89 $8.43 $6.12 $9.07 $15.19PRESCHOOL - Full Time Weekly $112.65 $119.16 $138.14 $142.79 $172.80 $193.36PRESCHOOL - Part Time Weekly $72.11 $79.77 $97.13 $98.33 $121.79 $125.08PRESCHOOL - Hourly * $6.60 $6.92 $6.06 $6.62 $9.62SCHOOLAGE - Full Time Weekly $102.21 $101.23 $112.47 $117.16 $120.10 $140.33SCHOOLAGE - Part Time Weekly $67.25 $68.51 $83.24 $75.68 $94.63 $86.32SCHOOLAGE - Hourly $3.53 $4.91 $7.83 $4.90 $8.47 $8.51SCHOOLAGESUMMER - Full Time Weekly $110.29 $111.60 $130.69 $136.78 $154.69 $178.76SCHOOLAGESUMMER - Part Time Weekly $86.84 $76.93 $94.94 $101.31 $119.55 $130.36SCHOOLAGESUMMER - Hourly * * $8.88 $3.79 $8.21 *
80th Percentile - Licensed (Centers and Type A Home Providers)
* = percentile not calculated due to small sample size (< 4 providers)
AGE/RATE CATEGORIESCounty
Group ACounty
Group BCounty
Group CCounty
Group DCounty
Group ECounty Group F
INFANT - Full Time Weekly * $140.61 $147.63 $156.95 $184.71 $172.70INFANT - Part Time Weekly * $87.94 $80.53 $105.25 $125.52 $118.26INFANT - Hourly * * * * * *TODDLER - Full Time Weekly $79.81 $137.57 $140.09 $161.44 $170.29 $191.44TODDLER - Part Time Weekly * $82.76 $77.09 $116.39 $122.59 $118.18TODDLER - Hourly * * $4.56 $6.82 * *PRESCHOOL - Full Time Weekly $96.95 $131.21 $129.64 $150.58 $153.60 $164.17PRESCHOOL - Part Time Weekly $52.02 $79.16 $85.65 $101.94 $119.17 $120.92PRESCHOOL - Hourly * * $5.67 * * $5.71SCHOOLAGE - Full Time Weekly * $109.26 $122.09 $131.91 $159.78 $128.82SCHOOLAGE - Part Time Weekly * $82.80 $78.80 $95.80 $112.16 $108.41SCHOOLAGE - Hourly * * $2.82 $6.11 $5.61 $8.35SCHOOLAGESUMMER - Full Time Weekly * $130.93 $133.32 $144.68 $185.62 $159.25SCHOOLAGESUMMER - Part Time Weekly * $90.45 $80.29 $98.27 $148.59 $125.73SCHOOLAGESUMMER - Hourly * * $3.19 * * *
80th Percentile - Certified/Registered Home Providers
* = percentile not calculated due to small sample size (< 4 providers)

42
AGE/RATE CATEGORIESCounty
Group ACounty
Group BCounty
Group CCounty
Group DCounty
Group ECounty Group F
INFANT - Full Time Weekly $121.12 $142.97 $184.20 $192.14 $212.14 $251.59INFANT - Part Time Weekly $91.74 $111.83 $113.83 $147.52 $144.93 $191.52INFANT - Hourly * $6.01 * $9.12 * $7.94TODDLER - Full Time Weekly $126.16 $133.01 $157.73 $167.61 $195.56 $228.90TODDLER - Part Time Weekly $82.26 $98.34 $116.64 $114.96 $152.10 $170.92TODDLER - Hourly * $8.41 $8.97 $6.19 $9.49 $15.63PRESCHOOL - Full Time Weekly $114.83 $122.15 $142.58 $147.10 $178.21 $199.43PRESCHOOL - Part Time Weekly $73.80 $82.57 $101.58 $103.25 $129.23 $133.13PRESCHOOL - Hourly * $7.00 $7.27 $6.45 $6.92 $10.13SCHOOLAGE - Full Time Weekly $107.21 $106.75 $119.78 $124.46 $126.61 $148.56SCHOOLAGE - Part Time Weekly $69.22 $73.76 $88.25 $79.95 $99.38 $90.60SCHOOLAGE - Hourly $3.60 $5.16 $8.42 $5.20 $8.96 $9.00SCHOOLAGESUMMER - Full Time Weekly $113.27 $114.53 $134.66 $140.95 $159.23 $184.59SCHOOLAGESUMMER - Part Time Weekly $90.05 $79.20 $98.80 $106.46 $124.25 $136.00SCHOOLAGESUMMER - Hourly * * $9.34 $3.99 $8.57 *
85th Percentile - Licensed (Centers and Type A Home Providers)
* = percentile not calculated due to small sample size (< 4 providers)
AGE/RATE CATEGORIESCounty
Group ACounty
Group BCounty
Group CCounty
Group DCounty
Group ECounty Group F
INFANT - Full Time Weekly * $143.87 $151.98 $160.01 $192.20 $180.94INFANT - Part Time Weekly * $90.63 $82.04 $109.51 $133.27 $120.15INFANT - Hourly * * * * * *TODDLER - Full Time Weekly $80.81 $141.54 $143.55 $166.41 $176.70 $197.77TODDLER - Part Time Weekly * $85.06 $78.87 $120.44 $128.25 $121.74TODDLER - Hourly * * $4.77 $7.30 * *PRESCHOOL - Full Time Weekly $99.79 $134.99 $132.78 $155.96 $159.11 $171.08PRESCHOOL - Part Time Weekly $53.88 $81.92 $88.31 $104.88 $122.74 $125.09PRESCHOOL - Hourly * * $6.03 * * $5.80SCHOOLAGE - Full Time Weekly * $113.09 $126.97 $136.52 $168.05 $133.53SCHOOLAGE - Part Time Weekly * $85.33 $82.19 $99.14 $119.04 $114.52SCHOOLAGE - Hourly * * $2.88 $6.52 $5.92 $8.72SCHOOLAGESUMMER - Full Time Weekly * $134.88 $137.44 $148.63 $196.44 $165.18SCHOOLAGESUMMER - Part Time Weekly * $93.53 $82.92 $101.97 $158.61 $130.15SCHOOLAGESUMMER - Hourly * * $3.29 * * *
85th Percentile - Certified/Registered Home Providers
* = percentile not calculated due to small sample size (< 4 providers)

43
AGE/RATE CATEGORIESCounty
Group ACounty
Group BCounty
Group CCounty
Group DCounty
Group ECounty Group F
INFANT - Full Time Weekly $122.67 $147.12 $191.63 $199.26 $219.07 $259.62INFANT - Part Time Weekly $94.49 $116.94 $117.82 $155.27 $149.73 $201.07INFANT - Hourly * $6.29 * $9.50 * $8.23TODDLER - Full Time Weekly $129.09 $136.85 $162.94 $174.05 $202.13 $237.26TODDLER - Part Time Weekly $84.25 $102.11 $121.94 $119.86 $160.51 $181.12TODDLER - Hourly * $9.06 $9.65 $6.28 $10.01 $16.18PRESCHOOL - Full Time Weekly $117.58 $125.91 $148.16 $152.52 $185.01 $207.07PRESCHOOL - Part Time Weekly $75.93 $86.09 $107.18 $109.45 $138.59 $143.26PRESCHOOL - Hourly * $7.50 $7.72 $6.94 $7.30 $10.77SCHOOLAGE - Full Time Weekly $113.49 $113.70 $128.97 $133.64 $134.81 $158.90SCHOOLAGE - Part Time Weekly $71.70 $80.36 $94.56 $85.32 $105.34 $95.99SCHOOLAGE - Hourly $3.70 $5.48 $9.16 $5.59 $9.58 $9.62SCHOOLAGESUMMER - Full Time Weekly $117.02 $118.21 $139.66 $146.20 $164.94 $191.91SCHOOLAGESUMMER - Part Time Weekly $94.10 $82.06 $103.65 $112.95 $130.16 $143.10SCHOOLAGESUMMER - Hourly * * $9.93 $4.24 $9.03 *
90th Percentile - Licensed (Centers and Type A Home Providers)
* = percentile not calculated due to small sample size (< 4 providers)
AGE/RATE CATEGORIESCounty
Group ACounty
Group BCounty
Group CCounty
Group DCounty
Group ECounty Group F
INFANT - Full Time Weekly * $147.98 $157.46 $163.86 $201.63 $191.30INFANT - Part Time Weekly * $94.00 $83.94 $114.88 $143.03 $122.52INFANT - Hourly * * * * * *TODDLER - Full Time Weekly $82.07 $146.53 $147.90 $172.66 $184.77 $205.74TODDLER - Part Time Weekly * $87.95 $81.12 $125.55 $135.36 $126.23TODDLER - Hourly * * $5.05 $7.92 * *PRESCHOOL - Full Time Weekly $103.36 $139.75 $136.73 $162.72 $166.03 $179.77PRESCHOOL - Part Time Weekly $56.21 $85.41 $91.67 $108.58 $127.23 $130.33PRESCHOOL - Hourly * * $6.49 * * $5.92SCHOOLAGE - Full Time Weekly * $117.91 $133.11 $142.32 $178.46 $139.45SCHOOLAGE - Part Time Weekly * $88.52 $86.46 $103.36 $127.70 $122.22SCHOOLAGE - Hourly * * $2.96 $7.04 $6.31 $9.19SCHOOLAGESUMMER - Full Time Weekly * $139.85 $142.62 $153.61 $210.07 $172.64SCHOOLAGESUMMER - Part Time Weekly * $97.41 $86.22 $106.63 $171.22 $135.72SCHOOLAGESUMMER - Hourly * * $3.41 * * *
90th Percentile - Certified/Registered Home Providers
* = percentile not calculated due to small sample size (< 4 providers)

44
AGE/RATE CATEGORIESCounty
Group ACounty
Group BCounty
Group CCounty
Group DCounty
Group ECounty Group F
INFANT - Full Time Weekly $124.96 $153.29 $202.63 $209.82 $229.35 $271.53INFANT - Part Time Weekly $98.56 $124.51 $123.73 $166.76 $156.85 $215.23INFANT - Hourly * $6.71 * $10.05 * $8.65TODDLER - Full Time Weekly $133.43 $142.55 $170.66 $183.60 $211.88 $249.65TODDLER - Part Time Weekly $87.18 $107.71 $129.80 $127.11 $172.98 $196.24TODDLER - Hourly * $10.03 $10.67 $6.42 $10.79 $17.01PRESCHOOL - Full Time Weekly $121.66 $131.48 $156.43 $160.56 $195.10 $218.39PRESCHOOL - Part Time Weekly $79.08 $91.32 $115.47 $118.63 $152.46 $158.27PRESCHOOL - Hourly * $8.24 $8.39 $7.66 $7.86 $11.72SCHOOLAGE - Full Time Weekly $122.81 $123.99 $142.59 $147.26 $146.96 $174.24SCHOOLAGE - Part Time Weekly $75.37 $90.15 $103.92 $93.27 $114.19 $103.97SCHOOLAGE - Hourly $3.83 $5.95 $10.25 $6.16 $10.49 $10.54SCHOOLAGESUMMER - Full Time Weekly $122.57 $123.68 $147.08 $153.98 $173.40 $202.78SCHOOLAGESUMMER - Part Time Weekly $100.10 $86.30 $110.84 $122.56 $138.92 $153.63SCHOOLAGESUMMER - Hourly * * $10.80 $4.61 $9.72 *
95th Percentile - Licensed (Centers and Type A Home Providers)
* = percentile not calculated due to small sample size (< 4 providers)
AGE/RATE CATEGORIESCounty
Group ACounty
Group BCounty
Group CCounty
Group DCounty
Group ECounty Group F
INFANT - Full Time Weekly * $154.08 $165.58 $169.56 $215.59 $206.67INFANT - Part Time Weekly * $99.01 $86.75 $122.83 $157.49 $126.04INFANT - Hourly * * * * * *TODDLER - Full Time Weekly $83.93 $153.94 $154.34 $181.92 $196.74 $217.55TODDLER - Part Time Weekly * $92.24 $84.45 $133.11 $145.92 $132.88TODDLER - Hourly * * $5.45 $8.82 * *PRESCHOOL - Full Time Weekly $108.66 $146.81 $142.59 $172.75 $176.29 $192.65PRESCHOOL - Part Time Weekly $59.68 $90.57 $96.63 $114.06 $133.89 $138.11PRESCHOOL - Hourly * * $7.17 * * $6.09SCHOOLAGE - Full Time Weekly * $125.05 $142.21 $150.92 $193.89 $148.23SCHOOLAGE - Part Time Weekly * $93.25 $92.78 $109.60 $140.53 $133.63SCHOOLAGE - Hourly * * $3.07 $7.80 $6.88 $9.88SCHOOLAGESUMMER - Full Time Weekly * $147.22 $150.30 $160.99 $230.26 $183.70SCHOOLAGESUMMER - Part Time Weekly * $103.15 $91.11 $113.53 $189.92 $143.97SCHOOLAGESUMMER - Hourly * * $3.58 * * *
95th Percentile - Certified/Registered Home Providers
* = percentile not calculated due to small sample size (< 4 providers)
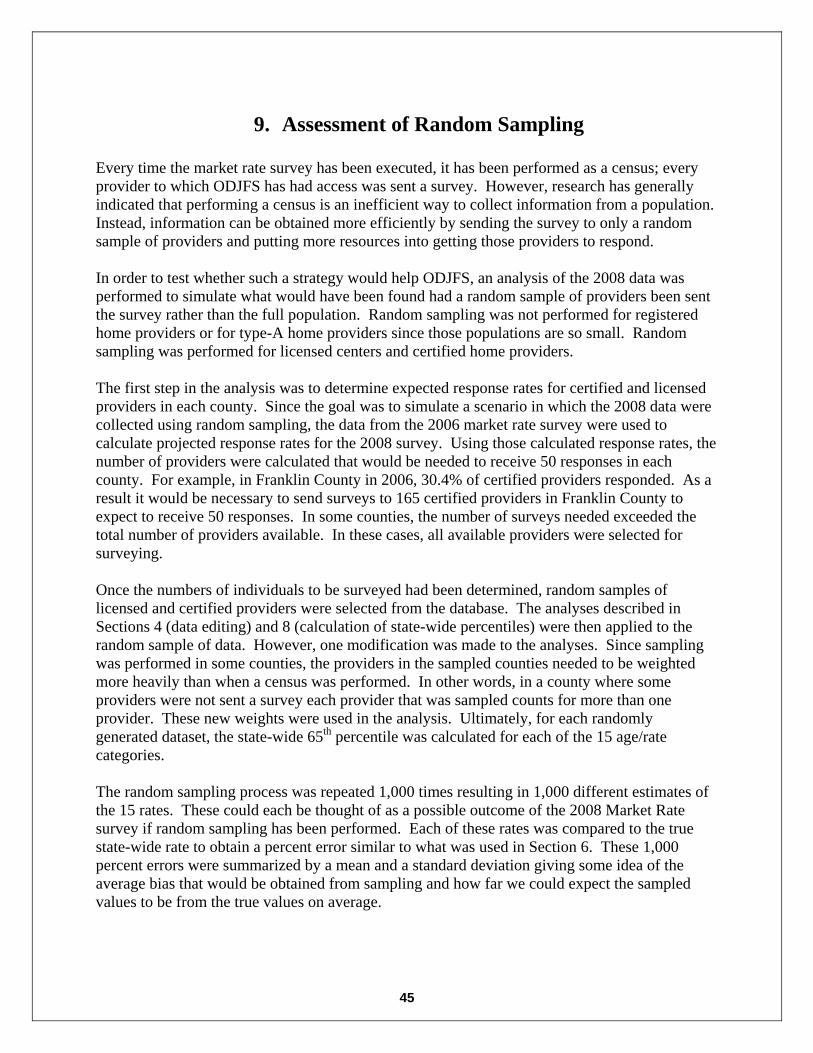
45
9. Assessment of Random Sampling Every time the market rate survey has been executed, it has been performed as a census; every provider to which ODJFS has had access was sent a survey. However, research has generally indicated that performing a census is an inefficient way to collect information from a population. Instead, information can be obtained more efficiently by sending the survey to only a random sample of providers and putting more resources into getting those providers to respond. In order to test whether such a strategy would help ODJFS, an analysis of the 2008 data was performed to simulate what would have been found had a random sample of providers been sent the survey rather than the full population. Random sampling was not performed for registered home providers or for type-A home providers since those populations are so small. Random sampling was performed for licensed centers and certified home providers. The first step in the analysis was to determine expected response rates for certified and licensed providers in each county. Since the goal was to simulate a scenario in which the 2008 data were collected using random sampling, the data from the 2006 market rate survey were used to calculate projected response rates for the 2008 survey. Using those calculated response rates, the number of providers were calculated that would be needed to receive 50 responses in each county. For example, in Franklin County in 2006, 30.4% of certified providers responded. As a result it would be necessary to send surveys to 165 certified providers in Franklin County to expect to receive 50 responses. In some counties, the number of surveys needed exceeded the total number of providers available. In these cases, all available providers were selected for surveying. Once the numbers of individuals to be surveyed had been determined, random samples of licensed and certified providers were selected from the database. The analyses described in Sections 4 (data editing) and 8 (calculation of state-wide percentiles) were then applied to the random sample of data. However, one modification was made to the analyses. Since sampling was performed in some counties, the providers in the sampled counties needed to be weighted more heavily than when a census was performed. In other words, in a county where some providers were not sent a survey each provider that was sampled counts for more than one provider. These new weights were used in the analysis. Ultimately, for each randomly generated dataset, the state-wide 65th percentile was calculated for each of the 15 age/rate categories. The random sampling process was repeated 1,000 times resulting in 1,000 different estimates of the 15 rates. These could each be thought of as a possible outcome of the 2008 Market Rate survey if random sampling has been performed. Each of these rates was compared to the true state-wide rate to obtain a percent error similar to what was used in Section 6. These 1,000 percent errors were summarized by a mean and a standard deviation giving some idea of the average bias that would be obtained from sampling and how far we could expect the sampled values to be from the true values on average.

46
In addition, this entire process was repeated with the goal of obtaining only 25 responses from certified and licensed providers in each county. The number of samples required for each of these strategies is summarized in Table 9. Clearly, it would be possible for ODJFS to reduce the cost of executing the survey using random sampling. With a goal of 50 responses per county for each type of provider, the total number of surveys to be sent drops by 36%, down to 8,143 from 12,805. Dropping the goal to 25 responses per county for each type of provider, the total number of surveys to be sent drops by 51%, down to 6,248 from 12,805.
Table 9. Number of surveys to send under different scenarios. Group
Sampled Full Census
(Current Method) Goal: Minimum 50
Responses per County Goal: Minimum 25
Responses per County Certified 8,409 4,851 3,524 Licensed 3,370 2,266 1,680 Licensed Type-A 201 201 201
Registered 825 825 825 Total 12,805 8,143 6,248 Despite these savings it appears that performing random sampling might lead to some difficulties with estimation. Table 10 summarizes the results of the analysis. In this table, the results are presented separately for licensed and certified providers, and, in each case, results are presented for the samples with a goal of 25 responses per county and 50 responses per county. The columns labeled “Average % Bias” give an idea of how biased the samples are expected to be on average, and the columns labeled “Standard Deviation for % Bias” indicate how far that percent bias moves in a single sample. An average % bias far from zero indicates that subsampling will most likely bias the rates. A standard deviation for % bias far from zero indicates that any given sample might be highly biased, even if they are, on average, accurate. Table 10 indicates that some rates could be extremely biased if random sampling is used. In particular, hourly rates will be difficult to estimate precisely if a census is not performed. As an example, for licensed centers the estimates of hourly rates for toddlers are biased low by 16.6% in the case where the goal is 25 responses per county and by 8.6% in the case where the goal is 50 responses per county. For certified providers, biases of a similar magnitude are observed for infant hourly rates, preschool hourly rates, school age hourly rates, and summer school age part time rates when the goal is 25 responses per county. Raising the goal to 50 responses per county ameliorates most of these problems, but the large standard deviations of the biases indicate that, by chance, the result could be very biased. At this time, the SCS recommends that ODJFS continue to perform a census to obtain the most accurate results possible. In the future, if ODJFS discontinues the use of hourly rates or if data collection of hourly rates is improved, the issue of sampling should be reconsidered.

47
Table 10. Sampling analysis results.
Licensed Centers Only Certified Providers Only Sample for 25
responses per county Sample for 50
responses per county Sample for 25
responses per county Sample for 50
responses per county AGE/RATE CATEGORIES 2008 65th Percentile
Market Rate
Average % Bias*
Standard Deviation for % Bias
Average % Bias
Standard Deviation for % Bias
2008 65th Percentile
Market Rate
Average % Bias
Standard Deviation for % Bias
Average % Bias
Standard Deviation for % Bias
INFANT - Full Time Weekly $208.55 -1.56 2.19 -0.04 1.90 $153.59 0.93 9.99 0.53 8.77
INFANT - Part Time Weekly $137.71 -1.03 5.17 -0.20 3.44 $98.99 -2.05 8.20 -1.02 6.59
INFANT - Hourly $6.68 -0.69 4.06 -0.26 2.61 $7.53 -18.77 35.00 -0.36 10.27
TODDLER - Full Time Weekly $186.22 -1.62 1.98 -1.25 1.34 $160.63 -3.14 6.71 -1.28 3.91
TODDLER - Part Time Weekly $128.14 -0.18 3.90 0.00 2.53 $99.49 -1.65 6.73 -0.87 5.61
TODDLER - Hourly $10.65 -16.58 23.62 -8.55 23.45 $5.21 -0.86 13.39 -0.01 1.94
PRESCHOOL - Full Time Weekly $161.32 -1.17 1.99 -0.18 1.35 $139.90 -3.24 4.29 -2.89 3.14
PRESCHOOL - Part Time Weekly $98.72 -0.43 5.15 -0.39 3.43 $94.06 -1.35 6.12 -0.59 4.73
PRESCHOOL - Hourly $6.75 -2.55 14.93 -1.24 10.68 $7.14 -18.41 12.66 0.00 0.37
SCHOOLAGE - Full Time Weekly $111.88 -0.97 5.81 -0.81 3.78 $121.37 0.04 7.88 -0.19 5.57
SCHOOLAGE - Part Time Weekly $74.47 -0.06 2.63 -0.01 1.61 $84.46 -3.75 8.55 -1.58 6.26
SCHOOLAGE - Hourly $6.12 -4.48 8.02 -1.86 6.47 $4.86 -15.34 14.93 -3.07 14.84
SCHOOLAGESUMMER - Full Time Weekly $149.22 -0.62 2.35 -0.11 1.39 $144.29 -5.39 8.09 -4.04 5.88
SCHOOLAGESUMMER - Part Time Weekly $102.52 -0.05 3.94 -0.02 2.40 $97.31 -11.70 8.02 -8.99 7.19
SCHOOLAGESUMMER - Hourly $6.41 -0.18 2.66 0.02 0.00 $3.03 -1.19 9.45 -0.43 5.27
*% Bias = ((subsample 65th percentile rate - all data 65th percentile rate) / all data 65th percentile rate) × 100

48
Appendix A – Advance Letter, Licensed

49
DATE Dear Child Care Provider: Soon you will get a chance to influence the rates ODJFS pays for child care. Every two years, data is collected to ensure subsidized child care reimbursement rates are comparable to current private pay child care rates in Ohio. In a few days you will receive a questionnaire asking for your current enrollments and child care rates. Information you provide about your enrollments will help us gauge the demand for subsidized services. Information you provide about the rates you charge your private clients will help to set subsidy rates for underprivileged children. We are asking all licensed centers and type A home providers to complete the questionnaire. Completing the questionnaire will not require you to participate in the ODJFS subsidized child care program. If you are no longer providing child care services, please write “NA” on the questionnaire and return it to us. We are sending questionnaires to business offices and not to center locations if these are different. We need the questionnaire completed for each center location, even if the rates are the same, to accurately assess rates for services around Ohio. Thank you for your time and consideration. Sincerely,
Sandra T. Holt Christopher H. Holloman, PhD Deputy Director Director Office for Children and Families Statistical Consulting Service Ohio Department of Job and Family Services The Ohio State University

50
Appendix B – Advance Letter, Certified and Registered

51
DATE Dear Child Care Provider: Soon you will get a chance to influence the rates ODJFS pays for child care. Every two years, data is collected to ensure subsidized child care reimbursement rates are comparable to current private pay child care rates in Ohio. In a few days you will receive a questionnaire asking for your current enrollments and child care rates. Information you provide about your enrollments will help us gauge the demand for subsidized services. Information you provide about the rates you charge your private clients will help to set subsidy rates for underprivileged children. We are asking all certified home child care providers and many private home child care providers registered with local child care resource and referral agencies to complete the questionnaire. Completing the questionnaire will not require private home child care providers to participate in the ODJFS subsidized child care program. If you are no longer providing child care services, please write “NA” on the questionnaire and return it to us. Thank you for your time and consideration. Sincerely,
Sandra T. Holt Christopher H. Holloman, PhD Deputy Director Director Office for Children and Families Statistical Consulting Service Ohio Department of Jobs and Family Services The Ohio State University

52
Appendix C – First Cover Letter, Licensed

53
Business Address: Center Location: This is your chance to influence the rates ODJFS pays for child care. We’re interested in receiving responses to the attached questionnaire from all child care providers, regardless of whether you provide subsidized care or not. Information you provide about your subsidized children will help us gauge the demand for subsidized services. Information you provide about the rates you charge your private clients will help to set subsidy rates for underprivileged children. We are asking all licensed centers and type A home providers to complete this questionnaire. Completing the questionnaire will not require you to participate in the subsidized care program. This questionnaire should take about 10 minutes to complete. Please return the questionnaire by April 25, 2008. Returning your questionnaire before this date will guarantee that your rates will be included in the analysis of responses. We have enclosed a self addressed, postage paid envelope so you can return the questionnaire at no cost to you. We need information about each location you operate to accurately determine the rates across Ohio. Please complete a questionnaire for each location, even if all locations have the same rates. Your individual responses to the survey will only be viewed by Ohio State University (not ODJFS). Names and addresses will be removed from the questionnaire when it is received. If you are no longer providing child care services at this location, please write “NA” on the questionnaire and return it to us. If you have questions about this project, please call the ODJFS Bureau of Child Care & Development at (614)466-1213 and ask to speak with Matthew J. Murray. You also may go to http://jfs.ohio.gov/cdc/marketrate2008.stm to learn more. We appreciate your response to this questionnaire. Sincerely,
Sandra T. Holt Christopher H. Holloman, PhD Deputy Director Director Office for Children and Families Statistical Consulting Service Ohio Department of Job and Family Services The Ohio State University

54
Appendix D – First Cover Letter, Certified and Registered

55
Dear Child Care Provider: This is your chance to influence the rates ODJFS pays for child care. We’re interested in receiving responses to the attached questionnaire from all child care providers, regardless of whether you provide subsidized care or not. Information you provide about your subsidized children will help us gauge the demand for subsidized services. Information you provide about the rates you charge your private clients will help to set subsidy rates for underprivileged children. We are asking all certified home care providers and many private home care providers registered with local child care resource and referral agencies to complete the questionnaire. Completing the questionnaire will not require you to participate in the subsidized care program. This questionnaire should take about 10 minutes to complete. Please return the questionnaire by April 25, 2008. Returning your questionnaire before this date will guarantee that your rates will be included in the analysis of responses. We have enclosed a self addressed, postage paid envelope so you can return the questionnaire at no cost to you. Your individual responses to the survey will only be viewed by Ohio State University (not ODJFS). Names and addresses will be removed from the questionnaire when it is received. If you are no longer providing child care services, please write “NA” on the questionnaire and return it to us. If you have further questions about this project, please call ODJFS Bureau of Child Care & Development at (614) 466-1213 and ask to speak with Matthew J. Murray. You also may go to http://jfs.ohio.gov/cdc/marketrate2008.stm to learn more. We appreciate your response to this questionnaire. Sincerely,
Sandra T. Holt Christopher H. Holloman, PhD Deputy Director Director Office for Children and Families Statistical Consulting Service Ohio Department of Job and Family Services The Ohio State University

56
Appendix E – Second Cover Letter, Licensed

57
Business Address: Center Location: About thee weeks ago we sent a questionnaire to you that asked about your enrollments and your rates for private child care. To the best of our knowledge, your questionnaire has not been returned. If you have recently returned the questionnaire, we thank you. If you have not yet returned the questionnaire, we ask that you do so. Your information is important to us because it will help us gauge the demand for subsidized services. Information you provide about the rates you charge your private clients will help to set subsidy rates for underprivileged children. We are asking all licensed centers and type A home providers to complete this questionnaire. Completing the questionnaire will not require you to participate in the subsidized care program. This questionnaire should take about 10 minutes to complete. Please return the questionnaire by May 9, 2008. Returning your questionnaire before this date will guarantee that your rates will be included in the analysis of responses. We have enclosed a self addressed, postage paid envelope so you can return the questionnaire at no cost to you. We need information about each location you operate to accurately determine the rates across Ohio. Please complete a questionnaire for each location, even if all locations have the same rates. If you are no longer providing child care services at this location, please write “NA” on the questionnaire and return it to us. If you have questions about this project, please call the ODJFS Bureau of Child Care & Development at (614)466-1213 and ask to speak with Matthew J. Murray. You also may go to http://jfs.ohio.gov/cdc/marketrate2008.stm to learn more. We appreciate your response to this questionnaire. Sincerely,
Sandra T. Holt Christopher H. Holloman, PhD Deputy Director Director Office for Children and Families Statistical Consulting Service Ohio Department of Job and Family Services The Ohio State University

58
Appendix F – Second Cover Letter, Certified and Registered
59
Dear Child Care Provider: About thee weeks ago we sent a questionnaire to you that asked about your enrollments and your rates for private child care. To the best of our knowledge, your questionnaire has not been returned. If you have recently returned the questionnaire, we thank you. If you have not yet returned the questionnaire, we ask that you do so. Your information is important to us because it will help us gauge the demand for subsidized services. Information you provide about the rates you charge your private clients will help to set subsidy rates for underprivileged children. We are asking all certified home care providers and many private home care providers registered with local child care resource and referral agencies to complete the questionnaire. Completing the questionnaire will not require you to participate in the subsidized care program. This questionnaire should take about 10 minutes to complete. Please return the questionnaire by May 9, 2008. Returning your questionnaire before this date will guarantee that your rates will be included in the analysis of responses. We have enclosed a self addressed, postage paid envelope so you can return the questionnaire at no cost to you. If you are no longer providing child care services for children, please write “NA” on the questionnaire and return it to us. If you have further questions about this project, please call ODJFS Bureau of Child Care & Development at (614) 466-1213 and ask to speak with Matthew J. Murray. You also may go to http://jfs.ohio.gov/cdc/marketrate2008.stm to learn more. We appreciate your response to this questionnaire. Sincerely,
Sandra T. Holt Christopher H. Holloman, PhD Deputy Director Director Office for Children and Families Statistical Consulting Service Ohio Department of Job and Family Services The Ohio State University

60
Appendix G – Survey Instrument, Licensed

61
2008 Ohio Child Care Questionnaire
This questionnaire was designed to collect information about enrollments and rates despite differences among providers in how they deliver their services. Please complete this questionnaire using enrollment and rate information for the location shown on the previous page. The questionnaire is divided into different sections by the age of children receiving care. The age groups in this questionnaire are:
• Ages newborn through 17 months (INFANT) • Ages 18 months through 35 months (TODDLER) • Ages 3 through 5 years not yet in kindergarten (PRE-SCHOOL) - Excluding ELI children • Ages 5 through 12 years enrolled in kindergarten or higher (SCHOOL-AGE)
In each section, you are asked to provide the following information:
• The total number of children enrolled in an age group at this location.
• The total number of children enrolled, broken down by the number of hours they are at your facility.
• The total number of subsidized children enrolled, broken down by the number of hours they are at your facility.
• The private-pay rates you would charge the general public in different situations. To determine the rate, consider how each request falls into your current private pay rate schedule.
All of the rate schedule questions have an answer space for “dollars per week” or “dollars per hour.” This is because many providers charge by the week or hour in these situations. If you charge by some other period (e.g., month or day), please use the second space to tell us what and how you charge. For example: $___________ per week….or…..$_200_ per _month_(billing period) OR … $___________ per week….or…..$_35_ per _day_(billing period) When answering the rate questions, please do not include any discounts in the rates. If you have sliding scales based on income, please tell us your maximum rates. For the purposes of this questionnaire, please consider all care to be delivered on weekdays between 6 a.m. and 6 p.m. Do not invent rates for these questions. You can skip ones that don’t apply to your location. For example, do not divide your weekly rate by 40 to obtain an hourly rate.

62
Section 1: Children ages newborn through 17 months old How many children in this age group are currently enrolled at this location? (In the box below, please enter the number of children. If no children in this age group are currently enrolled at this location, enter “0”) Then, if you entered…
“0” but you would accept a new child in this age group if one of your slots were available Skip to Section 1A below
“0” and you would not accept a new child in this age group even if one of your slots were available Skip to Section 2
A number other than “0” Complete the table and Section 1A below
Of those children enrolled at this location in this age group, how many children are:
Do not offer these services
at this location
Total Number of Children Enrolled
at this location
Number of Subsidized Children*
at this location
Enrolled 25 – 60 hours per week
Enrolled 7 – 24.9 hours per week
Enrolled 6.9 hours or less per week
*Please enter the number of children at this location who receive your services through JFS subsidized child care paid by an Ohio county or the state 1A. Using your rate schedule for private pay clients at this location, and considering only the rates charged to the general public, (Note: please only consider care provided on weekdays between 6 a.m. and 6 p.m.) What would you charge for a 9-month-old enrolled for 45 hours per week (for example, 9 hours per day, 5 days per week)? $___________ per week….or…..$_________ per __________(billing period) What would you charge for a 9-month-old enrolled for 21 hours per week (for example, 7 hours per day, 3 days per week)? $___________ per week….or…..$_________ per _________ (billing period) What would you charge for a 9-month-old in your care for 3 hours per week? $___________ per hour….or…..$_________ per _________ (billing period)

63
Section 2: Children ages 18 months through 35 months How many children in this age group are currently enrolled at this location? (In the box below, please enter the number of children. If no children in this age group are currently enrolled at this location, enter “0”) Then, if you entered…
“0” but you would accept a new child in this age group if one of your slots were available Skip to Section 2A below
“0” and you would not accept a new child in this age group even if one of your slots were available Skip to Section 3
A number other than “0” Complete the table and Section 2A below
Of those children enrolled at this location in this age group, how many children are:
Do not offer these services
at this location
Total Number of Children Enrolled
at this location
Number of Subsidized Children*
at this location
Enrolled 25 – 60 hours per week
Enrolled 7 – 24.9 hours per week
Enrolled 6.9 hours or less per week
*Please enter the number of children at this location who receive your services through JFS subsidized child care paid by an Ohio county or the state 2A. Using your rate schedule for private pay clients at this location, and considering only the rates charged to the general public, (Note: please only consider care provided on weekdays between 6 a.m. and 6 p.m.) What would you charge for a 27-month-old enrolled for 45 hours per week (for example, 9 hours per day, 5 days a week)? $___________ per week….or…..$_________ per ___________(billing period) What would you charge for a 27-month-old enrolled for 21 hours per week (for example, 7 hours per day, 3 days a week)? $___________ per week….or…..$_________ per ___________(billing period) What would you charge for a 27-month-old in your care for 3 hours per week? $___________ per hour….or…..$_________ per _________ (billing period)

64
Section 3: Children ages 3 through 5 years, not yet in kindergarten, and not enrolled in the Early Learning Initiative (ELI) program or a
public preschool How many children in this age group are currently enrolled at this location? (In the box below, please enter the number of children. If no children in this age group are currently enrolled at this location, enter “0”) Then, if you entered…
“0” but you would accept a new child in this age group if one of your slots were available Skip to Section 3A below
“0” and you would not accept a new child in this age group even if one of your slots were available Skip to Section 4
A number other than “0” Complete the table and Section 3A below
Of those children enrolled at this location in this age group, how many children are:
Do not offer these services
at this location
Total Number of Children Enrolled
at this location
Number of Subsidized Children*
at this location
Enrolled 25 – 60 hours per week
Enrolled 7 – 24.9 hours per week
Enrolled 6.9 hours or less per week
*Please enter the number of children at this location who receive your services through JFS subsidized child care paid by an Ohio county or the state (do not include ELI) 3A. Using your rate schedule for private pay clients at this location, and considering only the rates charged to the general public, (Note: please only consider care provided on weekdays between 6 a.m. and 6 p.m.) What would you charge for a 4-year-old enrolled for 45 hours per week (for example, 9 hours per day, 5 days per week)? $___________ per week….or…..$_________ per ___________(billing period) What would you charge for a 4-year-old enrolled for 21 hours per week (for example, 7 hours per day, 3 days per week)? $___________ per week….or…..$_________ per ___________(billing period) What would you charge for a 4-year-old in your care for 3 hours per week? $___________ per hour….or…..$_________ per _________ (billing period)

65
Section 4: Children ages 5 through 12 years who are in kindergarten or higher during the regular school-year
How many children in this age group are currently enrolled at this location? (In the box below, please enter the number of children. If no children in this age group are currently enrolled at this location, enter “0”) Then, if you entered…
“0” but you would accept a new child in this age group if one of your slots were available Skip to Section 4A below
“0” and you would not accept a new child in this age group even if one of your slots were available Skip to Section 5
A number other than “0” Complete the table and Section 4A below
Of those children enrolled at this location in this age group, how many children are:
Do not offer these services
at this location
Total Number of Children Enrolled
at this location
Number of Subsidized Children*
at this location
Enrolled 25 – 60 hours per week
Enrolled 7 – 24.9 hours per week
Enrolled 6.9 hours or less per week
*Please enter the number of children at this location who receive your services through JFS subsidized child care paid by an Ohio county or the state 4A. Using your rate schedule for private pay clients at this location, and considering only the rates charged to the general public, (Note: please only consider care provided on weekdays between 6 a.m. and 6 p.m.) What would you charge for a 7-year-old enrolled for 30 hours per week after school during the regular school year (for example, 6 hours per day, 5 days per week)? $___________ per week….or…..$_________ per ___________( billing period) What would you charge for a 7-year-old enrolled for 21 hours per week after school during the regular school year (for example, about 4.25 hours per day, 5 days per week)? $___________ per week….or…..$_________ per ___________(billing period) What would you charge for a 7-year-old in your care for 3 hours per week? $___________ per hour….or…..$_________ per _________ (billing period)

66
Section 5: Children ages 5 through 12 years who are in kindergarten or higher during summer and school-vacation periods
How many children in this age group are currently enrolled at this location? (In the box below, please enter the number of children. If no children in this age group are currently enrolled at this location, enter “0”) Then, if you entered… “0” but you would accept a new child in this age group
if one of your slots were available
Skip to Section 5A below
“0” and you would not accept a new child in this age group even if one of your slots were available
Skip to Section 6
A number other than “0” Complete the table and Section 5A below Of those children enrolled at this location in this age group, how many children are:
Do not offer these services
at this location
Total Number of Children Enrolled
at this location
Number of Subsidized Children*
at this location
Enrolled 25 – 60 hours per week
Enrolled 7 – 24.9 hours per week
Enrolled 6.9 hours or less per week
*Please enter the number of children at this location who receive your services through JFS subsidized child care paid by an Ohio county or the state 5A. Using your rate schedule for private pay clients at this location, and considering only the rates charged to the general public, (Note: please only consider care provided on weekdays between 6 a.m. and 6 p.m.) What would you charge for a 7-year-old enrolled for 45 hours per week during summer and school vacations (for example, 9 hours per day, 5 days per week)? $___________ per week….or…..$_________ per ___________(billing period) What would you charge for a 7-year-old enrolled for 21 hours per week during summer and school vacations (for example, 7 hours per day, 3 days per week)? $___________ per week….or…..$_________ per ___________(billing period) What would you charge for a 7-year-old in your care for 3 hours per week during summer and school vacations? $___________ per hour….or…..$_________ per _________ (billing period)

67
Section 6: Accreditations/Quality Markers Which, if any, of the following accreditations/quality markers does this location currently have? Some of these may not apply for the type of care you provide.
Accreditations/Quality Markers (Please check all that apply)
Association of Christian School International (ACSI)
Montessori Accreditation
National Association for the Education of Young Children (NAEYC)
National Early Childhood Program Accreditation (NECPA)
National Accreditation Commission for Early Care and Education Programs (NAC) (managed by the National Association of Child Care Providers (NACCP))
National Association for Family Child Care (NAFCC)
National Afterschool Association (NAA)
Step up to Quality (1, 2, or 3 star rated only)
Accreditation or Licensing from the Cincinnati Governing Board
Other Accreditation? (please specify) ______________________________________________________
Do you personally have a Child Development Association (CDA) accreditation? Yes No What is the highest level of education that your center’s director has received? (please check one) Did not finish High School Bachelor’s Degree in Early Childhood
Development, Nursing/Healthcare, or Business High School Diploma/GED Bachelor’s Degree in Another Field
Associate’s Degree in Early Childhood Development, Nursing/Healthcare, or Business Graduate Degree in Early Childhood
Development, Nursing/Healthcare, or Business Associate’s Degree in Another Field Graduate Degree in Another Field Please use the enclosed envelope to return this questionnaire at no cost to you. You may also mail the questionnaire to: Statistical Consulting Service 328 Cockins Hall 1958 Neil Ave. The Ohio State University Columbus OH 43210

68
Appendix H – Survey Instrument, Certified and Registered

69
2008 Ohio Child Care Questionnaire
This questionnaire was designed to collect information about enrollments and rates despite differences among providers in how they deliver their services. Please complete this questionnaire using enrollment and rate information for the location shown on the previous page. The questionnaire is divided into different sections by the age of children receiving care. The age groups in this questionnaire are:
• Ages newborn through 17 months (INFANT) • Ages 18 months through 35 months (TODDLER) • Ages 3 through 5 years not yet in kindergarten (PRE-SCHOOL) - Excluding ELI children • Ages 5 through 12 years enrolled in kindergarten or higher (SCHOOL-AGE)
In each section, you are asked to provide the following information:
• The total number of children enrolled in an age group at this location.
• The total number of children enrolled, broken down by the number of hours they are at your facility.
• The total number of subsidized children enrolled, broken down by the number of hours they are at your facility.
• The private-pay rates you would charge the general public in different situations. To determine the rate, consider how each request falls into your current private pay rate schedule.
All of the rate schedule questions have an answer space for “dollars per week” or “dollars per hour.” This is because many providers charge by the week or hour in these situations. If you charge by some other period (e.g., month or day), please use the second space to tell us what and how you charge. For example: $___________ per week….or…..$_200_ per _month_(billing period) OR … $___________ per week….or…..$_35_ per _day_(billing period) When answering the rate questions, please do not include any discounts in the rates. If you have sliding scales based on income, please tell us your maximum rates. For the purposes of this questionnaire, please consider all care to be delivered on weekdays between 6 a.m. and 6 p.m. Do not invent rates for these questions. You can skip ones that don’t apply to your location. For example, do not divide your weekly rate by 40 to obtain an hourly rate.

70
Section 1: Children ages newborn through 17 months old How many children in this age group are currently enrolled at this location? (In the box below, please enter the number of children. If no children in this age group are currently enrolled at this location, enter “0”) Then, if you entered…
“0” but you would accept a new child in this age group if one of your slots were available Skip to Section 1A below
“0” and you would not accept a new child in this age group even if one of your slots were available Skip to Section 2
A number other than “0” Complete the table and Section 1A below
Of those children enrolled at this location in this age group, how many children are:
Do not offer these services
at this location
Total Number of Children Enrolled
at this location
Number of Subsidized Children*
at this location
Enrolled 25 – 50 hours per week
Enrolled 7 – 24.9 hours per week
Enrolled 6.9 hours or less per week
*Please enter the number of children at this location who receive your services through JFS subsidized child care paid by an Ohio county or the state 1A. Using your rate schedule for private pay clients at this location, and considering only the rates charged to the general public, (Note: please only consider care provided on weekdays between 6 a.m. and 6 p.m.) What would you charge for a 9-month-old enrolled for 45 hours per week (for example, 9 hours per day, 5 days per week)? $___________ per week….or…..$_________ per __________(billing period) What would you charge for a 9-month-old enrolled for 21 hours per week (for example, 7 hours per day, 3 days per week)? $___________ per week….or…..$_________ per _________ (billing period) What would you charge for a 9-month-old in your care for 3 hours per week? $___________ per hour….or…..$_________ per _________ (billing period)

71
Section 2: Children ages 18 months through 35 months How many children in this age group are currently enrolled at this location? (In the box below, please enter the number of children. If no children in this age group are currently enrolled at this location, enter “0”) Then, if you entered…
“0” but you would accept a new child in this age group if one of your slots were available Skip to Section 2A below
“0” and you would not accept a new child in this age group even if one of your slots were available Skip to Section 3
A number other than “0” Complete the table and Section 2A below
Of those children enrolled at this location in this age group, how many children are:
Do not offer these services
at this location
Total Number of Children Enrolled
at this location
Number of Subsidized Children*
at this location
Enrolled 25 – 50 hours per week
Enrolled 7 – 24.9 hours per week
Enrolled 6.9 hours or less per week
*Please enter the number of children at this location who receive your services through JFS subsidized child care paid by an Ohio county or the state 2A. Using your rate schedule for private pay clients at this location, and considering only the rates charged to the general public, (Note: please only consider care provided on weekdays between 6 a.m. and 6 p.m.) What would you charge for a 27-month-old enrolled for 45 hours per week (for example, 9 hours per day, 5 days a week)? $___________ per week….or…..$_________ per ___________(billing period) What would you charge for a 27-month-old enrolled for 21 hours per week (for example, 7 hours per day, 3 days a week)? $___________ per week….or…..$_________ per ___________(billing period) What would you charge for a 27-month-old in your care for 3 hours per week? $___________ per hour….or…..$_________ per _________ (billing period)

72
Section 3: Children ages 3 through 5 years, not yet in kindergarten, and not enrolled in the Early Learning Initiative (ELI) program or a
public preschool How many children in this age group are currently enrolled at this location? (In the box below, please enter the number of children. If no children in this age group are currently enrolled at this location, enter “0”) Then, if you entered…
“0” but you would accept a new child in this age group if one of your slots were available Skip to Section 3A below
“0” and you would not accept a new child in this age group even if one of your slots were available Skip to Section 4
A number other than “0” Complete the table and Section 3A below
Of those children enrolled at this location in this age group, how many children are:
Do not offer these services
at this location
Total Number of Children Enrolled
at this location
Number of Subsidized Children*
at this location
Enrolled 25 – 50 hours per week
Enrolled 7 – 24.9 hours per week
Enrolled 6.9 hours or less per week
*Please enter the number of children at this location who receive your services through JFS subsidized child care paid by an Ohio county or the state (do not include ELI) 3A. Using your rate schedule for private pay clients at this location, and considering only the rates charged to the general public, (Note: please only consider care provided on weekdays between 6 a.m. and 6 p.m.) What would you charge for a 4-year-old enrolled for 45 hours per week (for example, 9 hours per day, 5 days per week)? $___________ per week….or…..$_________ per ___________(billing period) What would you charge for a 4-year-old enrolled for 21 hours per week (for example, 7 hours per day, 3 days per week)? $___________ per week….or…..$_________ per ___________(billing period) What would you charge for a 4-year-old in your care for 3 hours per week? $___________ per hour….or…..$_________ per _________ (billing period)

73
Section 4: Children ages 5 through 12 years who are in kindergarten or higher during the regular school-year
How many children in this age group are currently enrolled at this location? (In the box below, please enter the number of children. If no children in this age group are currently enrolled at this location, enter “0”) Then, if you entered…
“0” but you would accept a new child in this age group if one of your slots were available Skip to Section 4A below
“0” and you would not accept a new child in this age group even if one of your slots were available Skip to Section 5
A number other than “0” Complete the table and Section 4A below
Of those children enrolled at this location in this age group, how many children are:
Do not offer these services
at this location
Total Number of Children Enrolled
at this location
Number of Subsidized Children*
at this location
Enrolled 25 – 50 hours per week
Enrolled 7 – 24.9 hours per week
Enrolled 6.9 hours or less per week
*Please enter the number of children at this location who receive your services through JFS subsidized child care paid by an Ohio county or the state 4A. Using your rate schedule for private pay clients at this location, and considering only the rates charged to the general public, (Note: please only consider care provided on weekdays between 6 a.m. and 6 p.m.) What would you charge for a 7-year-old enrolled for 30 hours per week after school during the regular school year (for example, 6 hours per day, 5 days per week)? $___________ per week….or…..$_________ per ___________( billing period) What would you charge for a 7-year-old enrolled for 21 hours per week after school during the regular school year (for example, about 4.25 hours per day, 5 days per week)? $___________ per week….or…..$_________ per ___________(billing period) What would you charge for a 7-year-old in your care for 3 hours per week? $___________ per hour….or…..$_________ per _________ (billing period)
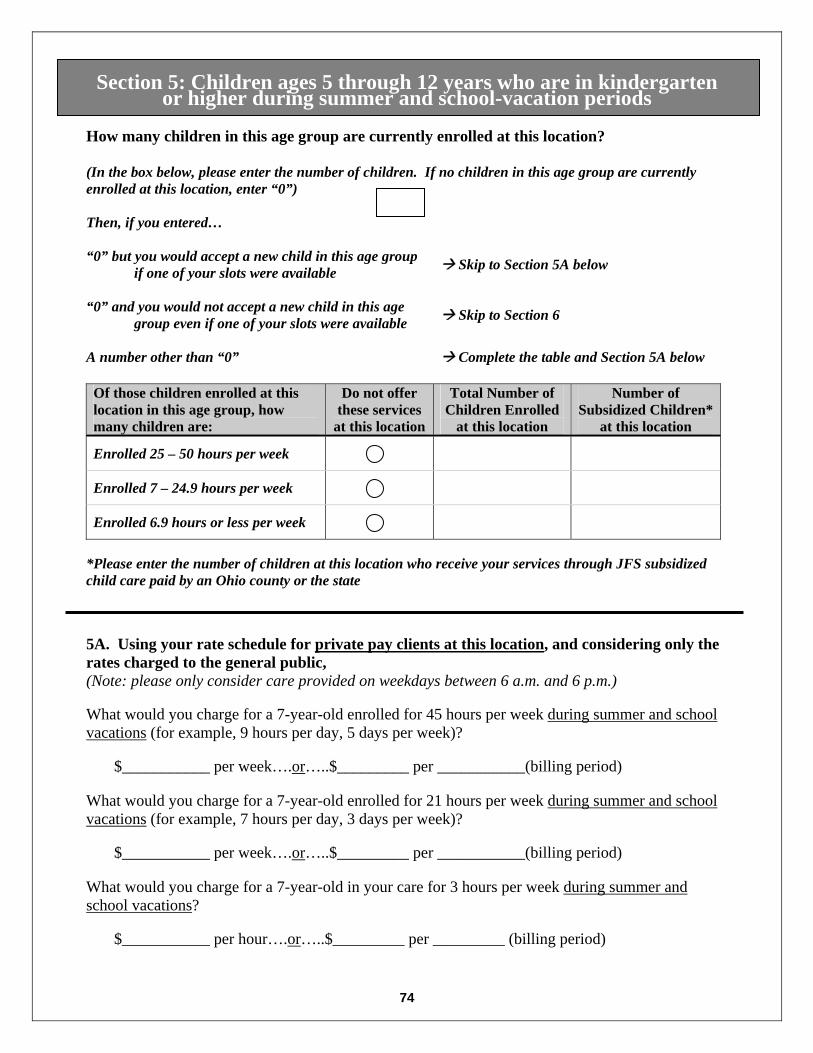
74
Section 5: Children ages 5 through 12 years who are in kindergarten or higher during summer and school-vacation periods
How many children in this age group are currently enrolled at this location? (In the box below, please enter the number of children. If no children in this age group are currently enrolled at this location, enter “0”) Then, if you entered… “0” but you would accept a new child in this age group
if one of your slots were available
Skip to Section 5A below
“0” and you would not accept a new child in this age group even if one of your slots were available
Skip to Section 6
A number other than “0” Complete the table and Section 5A below Of those children enrolled at this location in this age group, how many children are:
Do not offer these services
at this location
Total Number of Children Enrolled
at this location
Number of Subsidized Children*
at this location
Enrolled 25 – 50 hours per week
Enrolled 7 – 24.9 hours per week
Enrolled 6.9 hours or less per week
*Please enter the number of children at this location who receive your services through JFS subsidized child care paid by an Ohio county or the state 5A. Using your rate schedule for private pay clients at this location, and considering only the rates charged to the general public, (Note: please only consider care provided on weekdays between 6 a.m. and 6 p.m.) What would you charge for a 7-year-old enrolled for 45 hours per week during summer and school vacations (for example, 9 hours per day, 5 days per week)? $___________ per week….or…..$_________ per ___________(billing period) What would you charge for a 7-year-old enrolled for 21 hours per week during summer and school vacations (for example, 7 hours per day, 3 days per week)? $___________ per week….or…..$_________ per ___________(billing period) What would you charge for a 7-year-old in your care for 3 hours per week during summer and school vacations? $___________ per hour….or…..$_________ per _________ (billing period)

75
Section 6: Accreditations/Quality Markers Which, if any, of the following accreditations/quality markers does this location currently have? Some of these may not apply for the type of care you provide.
Accreditations/Quality Markers (Please check all that apply)
Association of Christian School International (ACSI)
Montessori Accreditation
National Association for the Education of Young Children (NAEYC)
National Early Childhood Program Accreditation (NECPA)
National Accreditation Commission for Early Care and Education Programs (NAC) (managed by the National Association of Child Care Providers (NACCP))
National Association for Family Child Care (NAFCC)
National Afterschool Association (NAA)
Step up to Quality (1, 2, or 3 star rated only)
Accreditation or Licensing from the Cincinnati Governing Board
Other Accreditation? (please specify) ______________________________________________________
Do you personally have a Child Development Association (CDA) accreditation? Yes No What is the highest level of education that you have received? (please check one) Did not finish High School Bachelor’s Degree in Early Childhood
Development, Nursing/Healthcare, or Business High School Diploma/GED Bachelor’s Degree in Another Field
Associate’s Degree in Early Childhood Development, Nursing/Healthcare, or Business Graduate Degree in Early Childhood
Development, Nursing/Healthcare, or Business Associate’s Degree in Another Field Graduate Degree in Another Field
Please use the enclosed envelope to return this questionnaire at no cost to you. You may also mail the questionnaire to: Statistical Consulting Service 328 Cockins Hall 1958 Neil Ave. The Ohio State University Columbus OH 43210

76
References [1] Dillman, Don A. (2000). Mail and Internet Surveys: The Tailored Design Method. New York: John Wiley & Sons.