2018 annual summary report · 2018 annual summary report, volume 36 ... healthcare professionals...
TRANSCRIPT
2018 ANNUAL SUMMARY REPORTNewborn Screening
Quality Assurance Program

2
Newborn Screening Quality Assurance Program 2018 Annual Summary Report, Volume 36
U.S. Department of Health and Human Services Centers for Disease Control and PreventionNational Center for Environmental HealthDivision of Laboratory Sciences

i
Note for accessibility: Explanations for Figure 2 and a general explanation for Figures 3–36 (bias plots) are located in Appendix for Accessibility Descriptions, page 42.
ContentsIntroduction ...................................................................................................................................................................................................................................................................................................................... 1
About NSQAP .................................................................................................................................................................................................................................................................................................................. 2
Countries Participating in NSQAP During 2018 .................................................................................................................................................................... 3
Filter Paper ........................................................................................................................................................................................................................................................................................................................... 5
Proficiency Testing ................................................................................................................................................................................................................................................................................................. 6
The Proficiency Testing Analytes ..................................................................................................................................................................................................................... 6
Proficiency Testing Materials and Methods .................................................................................................................................................................................... 7
Proficiency Testing Data Handling .................................................................................................................................................................................................................. 7
Proficiency Testing Errors ................................................................................................................................................................................................................................................ 7
Non-Web Reported Analytes ...............................................................................................................................................................................................................................11
Proficiency Testing Cutoff Values ...................................................................................................................................................................................................................14
Explanation of the NSQAP’s Grading Algorithm ................................................................................................................................................................23
2018 Bias Plots ..........................................................................................................................................................................................................................................................................................................24
Proficiency Testing Bias Plots ...............................................................................................................................................................................................................................24
Appendix for Accessibility Descriptions .....................................................................................................................................................................................................................42
References ........................................................................................................................................................................................................................................................................................................................42
Acknowlegments .................................................................................................................................................................................................................................................................................................43

1
NSQAP helps newborn screening
laboratories ensure that testing accurately detects
disorders, does not delay diagnoses, minimizes false-
positive reports, and sustains high-quality
performance.
IntroductionNewborn screening is one of the most successful preventative health programs in the United States. Healthcare professionals collect dried blood spot (DBS) specimens from more than 98% of all newborns shortly after birth in the United States. State and public health laboratories or their associated laboratories routinely screen these DBS specimens for certain genetic, metabolic, and endocrine disorders. The Centers for Disease Control and Prevention (CDC) Newborn Screening Quality Assurance Program (NSQAP) helps newborn screening laboratories with these testing processes.
NSQAP produces certified DBS materials for proficiency testing (PT) and quality control (QC) analysis, works to improve the quality and scope of laboratory services, and provides consultation to laboratories. State-operated and private newborn screening laboratories process thousands of DBS specimens daily. NSQAP helps newborn screening laboratories ensure that testing accurately detects disorders, does not delay
diagnoses, minimizes false-positive reports, and sustains high-quality performance.
CDC’s Newborn Screening and Molecular Biology Branch (NSMBB) has been granted International Organization for Standardization (ISO)/International Elecrotechnical Commission (IEC) 17043 accreditation by the American Association for Laboratory Accreditation (A2LA). Accreditation was achieved after a thorough review of its quality management system and competence to develop and administer specific PT protocols. The branch’s NSQAP web-based PT programs are included in the A2LA Scope of Accreditation. The scope of accreditation does not include testing for glucose-6-phosphate dehydrogenase (G6PD) and NSQAP non-web-based PT programs. Consult A2LA Certificate#4190.01 for a list of accredited NSMBB PT programs.

2
About NSQAPFor more than 40 years, NSQAP and its cosponsor the Association of Public Health Laboratories, have researched the development of DBS quality assurance materials for newborn screening tests and have assisted laboratories with DBS-related testing issues. NSQAP primarily supports U.S. newborn screening laboratories. Private and international laboratories may also enroll in the program. Participation is voluntary. NSQAP provides quality assurance services for the core (primary) and secondary conditions listed in the U.S. Recommended Uniform Screening Panel (RUSP) [1].
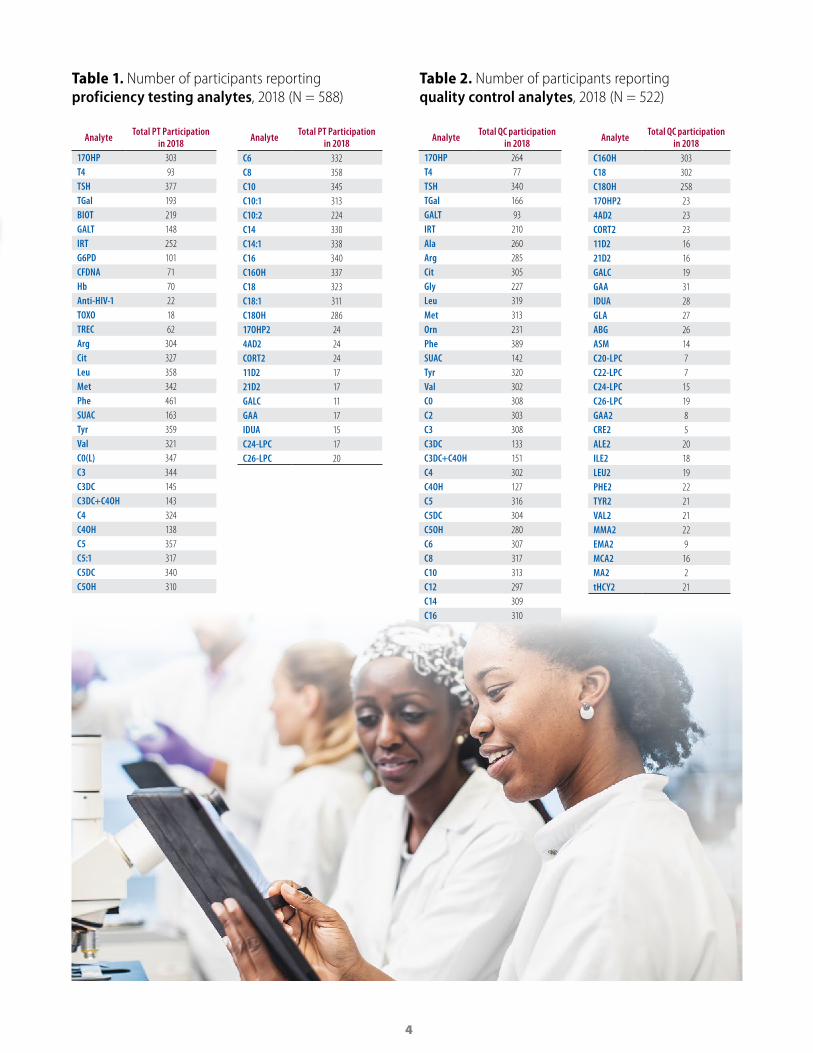
Over the years, NSQAP services and participation have grown substantially. In 2018, active program participants included 663 newborn screening laboratories in 85 countries (at least one laboratory per country) (Figure 1). Of these laboratories, 588 participated in PT (Table 1) and 522 in QC (Table 2). The program distributed DBS materials for 78 analytes to participating laboratories (Tables 1 and 2).
To offer more specialized services, NSQAP works with the Biochemical Mass Spectrometry Laboratory (BMSL) and the Molecular Quality Improvement Program (MQIP) in the Newborn Screening and Molecular Biology Branch.
BMSL offers newborn screening tandem mass spectrometry (MS/MS) services, education, and research opportunities. It also oversees the amino acids, acylcarnitines, biotinidase, total galactose (TGal), galactose-1-phosphate uridyltransferase (GALT), G6PD, Lysosomal Storage Disorders (LSD), and the filter paper evaluation programs.
MQIP oversees the Cystic Fibrosis DNA (CFDNA) and T-cell Receptor Excision Circle (TREC) PT programs and assists newborn screening laboratories with molecular testing. It also offers the Molecular Assessment Program (MAP) which conducts site visits to U.S. newborn screening laboratories that carry out molecular testing. These visits assess components of molecular testing and include program-tailored guidance for laboratory-specific needs and assistance in evaluating ongoing and future molecular testing procedures.

3
Figure 1. Eighty-five countries participated in the Newborn Screening Quality Assurance Program in 2018.
Countries Shown on World Map that Participated in NSQAP During 2018
ArgentinaArmeniaAustraliaAustriaBahrainBelgiumBoliviaBrazilBulgariaCanadaChileChinaColombiaCosta RicaCroatia
CubaCzech RepublicDenmarkEcuadorEgyptEl SalvadorEstoniaFinlandFranceGermanyGreeceGuatemalaHondurasHungaryIceland
IndiaIndonesiaIraqIrelandIsraelItalyJapanJordanKazakhstanKuwaitLatviaLebanonLithuaniaLuxembourgMacedonia
MalaysiaMaltaMexicoMongoliaMoroccoNetherlandsNew ZealandNigeriaNorwayOmanPakistanPanamaParaguayPeruPhilippines
PolandPortugalQatarRomaniaSaudi ArabiaSingaporeSlovak RepublicSloveniaSouth AfricaSouth KoreaSpainSri LankaSwedenSwitzerlandTaiwan
TanzaniaThailandTunisiaTurkeyUkraineUnited Arab EmiratesUnited KingdomUnited StatesUruguayVietnam
4
Figure 1. Eighty-five countries participated in the Newborn Screening Quality Assurance Program in 2018.Table 1. Number of participants reporting proficiency testing analytes, 2018 (N = 588)
Analyte Total PT Participation in 2018
17OHP 303T4 93TSH 377TGal 193BIOT 219GALT 148IRT 252G6PD 101CFDNA 71Hb 70Anti-HIV-1 22TOXO 18TREC 62Arg 304Cit 327Leu 358Met 342Phe 461SUAC 163Tyr 359Val 321C0(L) 347C3 344C3DC 145C3DC+C4OH 143C4 324C4OH 138C5 357C5:1 317C5DC 340C5OH 310
Analyte Total PT Participation in 2018
C6 332C8 358C10 345C10:1 313C10:2 224C14 330C14:1 338C16 340C16OH 337C18 323C18:1 311C18OH 28617OHP2 244AD2 24CORT2 2411D2 1721D2 17GALC 11GAA 17IDUA 15C24-LPC 17C26-LPC 20
Table 2. Number of participants reporting quality control analytes, 2018 (N = 522)
Analyte Total QC participation in 2018
17OHP 264T4 77TSH 340TGal 166GALT 93IRT 210Ala 260Arg 285Cit 305Gly 227Leu 319Met 313Orn 231Phe 389SUAC 142Tyr 320Val 302C0 308C2 303C3 308C3DC 133C3DC+C4OH 151C4 302C4OH 127C5 316C5DC 304C5OH 280C6 307C8 317C10 313C12 297C14 309C16 310
Analyte Total QC participation in 2018
C16OH 303C18 302C18OH 25817OHP2 234AD2 23CORT2 2311D2 1621D2 16GALC 19GAA 31IDUA 28GLA 27ABG 26ASM 14C20-LPC 7C22-LPC 7C24-LPC 15C26-LPC 19GAA2 8CRE2 5ALE2 20ILE2 18LEU2 19PHE2 22TYR2 21VAL2 21MMA2 22EMA2 9MCA2 16MA2 2tHCY2 21

5
Filter PaperNSQAP evaluates absorption characteristics of all filter paper lots approved by the Food and Drug Administration (FDA) as a newborn screening collection device [3]. Filter paper manufacturers must establish their own parallel evaluation. NSQAP’s evaluations are an impartial and voluntary service offered as a function of our QC program; they do not constitute endorsement of any product.
The disk punched from a DBS specimen gives a volumetric measurement that requires a high degree of uniformity among and within production lots. NSQAP uses an isotopic method developed at CDC to evaluate and compare filter paper lots. It equates mean counts per minute of added radioisotope-labeled thyroxine (T4) contained within a 3.2-mm disk with the serum absorption volume of the disks made from washed, intact red blood cells (RBCs). The latest version of Clinical Laboratory Standards Institute (CLSI) Standard NBS01-A6, Blood Collection on Filter Paper for Newborn Screening Programs, describes the method.
FDA-approved newborn screening filter paper manufacturers (GE Healthcare Biosciences Corporation and PerkinElmer Health Sciences) provide NSQAP with statistically valid sample sets of unprinted filter paper from each production lot. Tables 3 and 4 show serum absorption volumes from 10 most recent lots of these two filter paper sources. The published standardized acceptable serum absorption volume per 3.2-mm disk (mean value and 95% confidence interval) is 1.44 ± 0.20 µL of washed intact RBCs [3]. The testing results in Tables 3 and 4 are informational only. Each mean value is within the acceptable range for the matrix used. All lots are homogenous (i.e., the measured within-spot, within-sheet, and among-sheets variances were within acceptable limits). CDC used 903™ filter paper lots W152, W161, and W171 to produce the QC and PT specimens distributed in 2018.
Table 3. PerkinElmer 226 specimen collection filter paper absorption characteristics by lot number—intact red cells
Filter Paper
Lot No.
Date of Evaluation
Month/Year
Serum Volume (µL) per 3.2 mm (1/8") Punch
Average (StDev)
Absorption Time (sec)
Average (StDev)
Spot Diameter (mm)
Average (StDev)112147 Sept 2018 1.49 (0.11) 7.9 (0.9) 15.8 (0.6)
111064 July 2017 1.47 (0.20) 8.2 (1.0) 15.7 (0.5)
110092 July 2016 1.45 (0.09) 9.0 (1.2) 16.0 (0.7)
105617 May 2016 1.46 (0.08) 8.3 (1.8) 15.8 (0.5)
105616 Jan 2016 1.56 (0.11) 10.6 (2.0) 15.6 (0.5)
105178 Aug 2015 1.46 (0.09) 7.8 (1.1) 15.9 (0.6)
104568 March 2015 1.56 (0.10) 10.1 (2.1) 15.9 (0.7)
103649 March 2014 1.53 (0.10) 9.7 (3.1) 15.7 (0.7)
102928 Aug 2013 1.38 (0.09) 8.5 (0.9) 16.1 (0.5)
102277 Dec 2012 1.47 (0.11) 13.0 (4.9) 15.8 (0.6)

6
Table 4. 903™ specimen collection filter paper absorption characteristics by lot number— intact red cells
Filter Paper
Lot No.
Date of Evaluation
Month/Year
Serum Volume (µL) per 3.2 mm (1/8") Punch
Average (StDev)
Absorption Time (sec)
Average (StDev)
Spot Diameter (mm)
Average (StDev)W181 Sept 2018 1.42 (0.12) 16.1 (3.3) 16.2 (0.6)
W171 April 2017 1.39 (0.10) 19.7 (4.7) 16.0 (0.7)
W162 Jan 2017 1.43 (0.08) 12.9 (2.7) 16.0 (0.7)
W161 May 2016 1.41 (0.08) 14.8 (3.7) 16.2 (0.8)
W152 Aug 2015 1.37 (0.09) 15.8 (2.4) 16.2 (0.6)
W151 Aug 2015 1.39 (0.08) 15.2 (2.6) 16.2 (0.8)
W142 April 2015 1.46 (0.08) 11.0 (2.2) 16.0 (0.7)
W141 March 2014 1.53 (0.10) 13.8 (3.6) 15.9 (0.6)
W131 Aug 2013 1.40 (0.07) 10.4 (1.4) 16.1 (0.5)
W122 May 2013 1.41 (0.11) 14.8 (2.9) 16.3 (0.5)
Proficiency TestingNSQAP distributes PT materials at least three times per year. PT panels consist of five blind-coded 75µL DBS specimens. Specimen sets are packaged in a zip-closed, metalized plastic bag with desiccant. Instructions for
analysis and reporting data are located online at https://www.cdc.gov/labstandards/nsqap_resources.html. These specimens provide an independent, external assessment of each laboratory’s performance.
The Proficiency Testing Analytes AMINO ACIDS
■ arginine (Arg) ■ citrulline (Cit) ■ leucine (Leu) ■ methionine (Met) ■ phenylalanine (Phe) ■ succinylacetone (SUAC) ■ tyrosine (Tyr) ■ valine (Val)
ACYLCARNITINES ■ low free carnitine (C0(L)) ■ propionylcarnitine (C3) ■ malonylcarnitine (C3DC) ■ butyrylcarnitine (C4) ■ hydroxybutyrylcarnitine (C4OH)
■ isovalerylcarnitine (C5) ■ tiglylcarnitine (C5:1)
■ glutarylcarnitine (C5DC) hydroxyisovalerylcarnitine (C5OH)
■ hexanoylcarnitine (C6) ■ octanoylcarnitine (C8) ■ decanoylcarnitine (C10) ■ decenoylcarnitine (C10:1) ■ decadienoylcarnitine (C10:2) ■ myristoylcarnitine (C14) ■ tetradecenoylcarnitine (C14:1) ■ palmitoylcarnitine (C16) ■ hydroxypalmitoylcarnitine (C16OH)
■ stearoylcarnitine (C18) ■ oleoylcarnitine (C18:1) Hydroxystearoylcarnitine (C18OH)
OTHER ANALYTES ■ 17 α-hydroxyprogesterone (17OHP)
■ 24:0-lysophosphatidylcholine (C24-LPC)
■ 26:0-lysophosphatidylcholine (C26-LPC)
■ anti-HIV-1 Antibodies (HIV) ■ acid-α-glucosidase (GAA) ■ α-L-iduronidase (IDUA) ■ biotinidase (BIOT) ■ cystic fibrosis DNA (CFDNA) ■ Galactose-1-phosphate Uridyltransferase (GALT)
■ galactocerebrosidase (GALC) ■ glucose-6-phosphate dehydrogenase (G6PD)
■ immunoreactive trypsinogen (IRT)
■ Total Galactose (TGal)
■ second-tier 17 α -hydroxyprogesterone (17OHP2)
■ second-tier 4-androstenedione (4AD2)
■ second-tier cortisol (CORT2) ■ second-tier 11-deoxycortisol (11D2)
■ second-tier 21-deoxycortisol (21D2)
■ sickle cell and other hemoglobinopathies (Hb)
■ T-cell receptor excision circle (TREC)
■ Thyroid Stimulating Hormone (TSH)
■ thyroxine (T4) ■ anti-Toxoplasma Antibodies (TOXO)

7
Proficiency Testing Materials and MethodsNSQAP certifies PT specimens for homogeneity, accuracy, stability, and suitability for newborn screening assays. Most PT specimens are prepared from whole blood of 50% hematocrit. PT materials are produced from one of the following: using unaltered donor blood, enriching a single blood unit or pooling blood units.
Purified analytes are used for PT enrichments. Enrichments made with commercially available or custom-synthesized analytes are based on weight. Small variances in enrichments and recoveries might result from impurities in the purchased (synthesized) materials and endogenous analyte concentrations.
Congenital hypothyroid PT specimens are enriched with measured amounts of T4 and TSH after reconstituting washed RBCs with purchased T4-depleted charcoal-stripped serum.
IRT PT specimens are made from a washed, hematocrit-adjusted blood that is treated with a protease inhibitor then enriched with commercially-purchased IRT.
TGal materials are enriched with galactose and galactose-1-phosphate, allowing measurement of free galactose (galactose alone) and total galactose (free galactose plus galactose-1-phosphate).
Biotinidase PT specimens are made using heat-treated serum combined with compatible donor RBCs.
Deficient GALT PT specimens are made using a 50/50 saline/serum solution combined with compatible washed RBCs and then heat-treating the pool.
Low free carnitine (C0[L]) materials are produced by washing fresh RBCs at least six times then combining with charcoal-stripped serum.
CFDNA PT specimens are prepared using blood from anonymous cystic fibrosis patients, carriers, or unaffected individuals without hematocrit adjustment.
Hemoglobin specimens are made from hematocrit-adjusted individual umbilical cord blood units.
Anti-HIV-1 antibody PT specimens are prepared by mixing purchased donor serum reactive for HIV-1 antibodies and washed RBCs to achieve the desired reactivity.
T-cell receptor excision circle PT specimens are prepared from human blood, including cord blood from
unaffected persons and modified adult blood depleted of mononuclear cells or leukocytes.
Lysosomal storage disorder specimens are prepared from human blood, including cord blood from unaffected persons and leukodepleted adult blood restored with lymphoblast cell lines derived from patients with LSD.
Toxoplasma immunoglobulin G and M DBS specimens are prepared by combining human serum samples collected from patients exposed to Toxoplasma gondii with compatible washed RBCs.
Proficiency Testing Data HandlingParticipants submit PT data and clinical assessment through the NSQAP data reporting website or use an Excel data reporting form downloaded from the NSQAP section of the CDC website at https://www.cdc.gov/labstandards/nsqap_resources.html.
Laboratories that submit results before the data reporting deadline will receive an individual laboratory evaluation and their data are included in the data summary report.
Proficiency Testing ErrorsScreening programs are designed to minimize false-negative reports, but this precautionary approach could result in false-positive misclassifications. Laboratories should monitor false-positive misclassifications to keep them as low as possible.
Tables 5–7 show the PT errors reported in 2018 by domestic and international laboratories for qualitative assessments by disorder/analyte. Because of specific clinical assessment practices, presumptive clinical classifications (qualitative assessments) of some specimens might differ by participant. If participants provided their cutoff values, those values were applied in the final evaluation of the error judgment (Figure 2). The rates for false-positive misclassifications were based on the number of negative specimens tested. The rates for false-negative misclassifications were based on the number of positive specimens tested.
The results of some PT specimens were near the decision level for clinical assessment. This rigorously tested the ability of laboratories to make the expected cutoff decision. Most specimens near the mean cutoff value are classified as not-evaluated specimens. As such, they were not included in the error calculations.

8
Table 5. Summary of non-MS/MS proficiency test errors by domestic and international laboratories
Domestic
AnalytePositive
specimens assayed (N)
False negative errors (%)
Negative specimens assayed (N)
False positive errors (%)
Congenital adrenal hyperplasia 126 0.0% 504 0.0%
Biotinidase deficiency 215 1.4% 430 1.9%
G6PD deficiency 15 0.0% 30 3.3%
GALT deficiency 258 0.0% 387 0.0%
Immunoreactive trypsinogen 262 1.1% 393 0.0%
Congenital hypothyroidism 215 0.0% 430 0.2%
Galactosemia 92 0.0% 253 0.0%
International
AnalytePositive
specimens assayed (N)
False negative errors (%)
Negative specimens assayed (N)
False positive errors (%)
Congenital adrenal hyperplasia 658 1.7% 2637 0.7%
Biotinidase deficiency 752 1.7% 1493 2.0%
G6PD deficiency 404 2.5% 836 1.2%
GALT deficiency 548 2.4% 822 1.1%
Immunoreactive trypsinogen 1038 1.3% 1557 6.3%
Congenital hypothyroidism 1408 0.7% 2797 0.6%
Galactosemia 560 2.0% 1550 0.3%

9
Table 6. Summary of amino acid and acylcarnitine proficiency test errors by Domestic laboratories
Analyte
Positive specimens
assayed (N)
False negative errors (%)
Negative specimens
assayed (N)
False positive
errors (%)
Arginine screen 36 0.0% 504 0.0%
Citrulline screen 132 0.0% 528 0.0%
Leucine screen 89 0.0% 581 0.0%
Methionine screen 176 0.0% 484 0.0%
Phenylalanine screen 164 1.2% 656 1.2%
Succinylacetone screen 34 0.0% 486 0.0%
Tyrosine screen 100 0.0% 635 0.3%
Valine screen 90 3.3% 365 1.4%
C0(L) screen 0 0.0% 700 0.4%
C3 screen 96 1.0% 619 0.0%
C3DC screen 0 0.0% 280 0.0%
C3DC+C4OH screen 0 0.0% 320 0.0%
C4 screen 0 0.0% 645 0.5%
C4OH Screen 0 0.0% 270 0.0%
C5 screen 48 0.0% 667 0.0%
C5:1 screen 0 0.0% 700 0.1%
C5DC screen 93 1.1% 607 0.0%
C5OH screen 47 2.1% 653 0.3%
C6 screen 134 0.7% 536 0.0%
C8 screen 96 0.0% 619 0.2%
C10 screen 88 4.5% 567 0.0%
C10:1 screen 83 7.2% 532 0.0%
C10:2 screen 0 0.0% 405 0.0%
C14 screen 130 5.4% 525 0.0%
C14:1 screen 140 0.0% 570 0.0%
C16 screen 0 0.0% 675 0.0%
C16OH screen 47 0.0% 668 0.0%
C18 screen 0 0.0% 630 0.0%
C18:1 screen 0 0.0% 610 0.0%
C18OH screen 0 0.0% 545 0.2%

10
Table 7. Summary of amino acid and acylcarnitine proficiency test errors by International laboratories
Analyte
Positive specimens
assayed (N)
False negative errors (%)
Negative specimens
assayed (N)
False positive
errors (%)
Arginine screen 219 2.3% 3196 0.3%
Citrulline screen 733 1.9% 2932 0.6%
Leucine screen 554 2.7% 3486 0.4%
Methionine screen 1034 1.8% 2826 0.8%
Phenylalanine screen 1057 2.4% 4228 1.4%
Succinylacetone screen 91 0.0% 1424 0.4%
Tyrosine screen 508 0.8% 3492 1.9%
Valine screen 772 4.8% 2968 1.3%
C0(L) screen 0 0.0% 3950 1.4%
C3 screen 515 1.7% 3380 0.4%
C3DC screen 0 0.0% 1590 2.5%
C3DC+C4OH screen 0 0.0% 1465 0.5%
C4 screen 0 0.0% 3645 1.3%
C4OH screen 0 0.0% 1490 0.8%
C5 screen 281 6.4% 3784 0.1%
C5:1 screen 0 0.0% 3485 1.7%
C5DC screen 503 0.4% 3332 1.1%
C5OH screen 232 6.0% 3173 2.6%
C6 screen 750 0.9% 3000 0.8%
C8 screen 543 0.7% 3552 1.3%
C10 screen 526 4.2% 3439 0.8%
C10:1 screen 461 8.0% 3029 0.8%
C10:2 screen 0 0.0% 2455 0.6%
C14 screen 741 5.7% 2979 0.6%
C14:1 screen 759 1.3% 3041 0.4%
C16 screen 0 0.0% 3825 0.8%
C16OH screen 257 1.6% 3528 0.8%
C18 screen 0 0.0% 3640 0.3%
C18:1 screen 0 0.0% 3480 0.3%
C18OH screen 0 0.0% 3150 1.3%
11
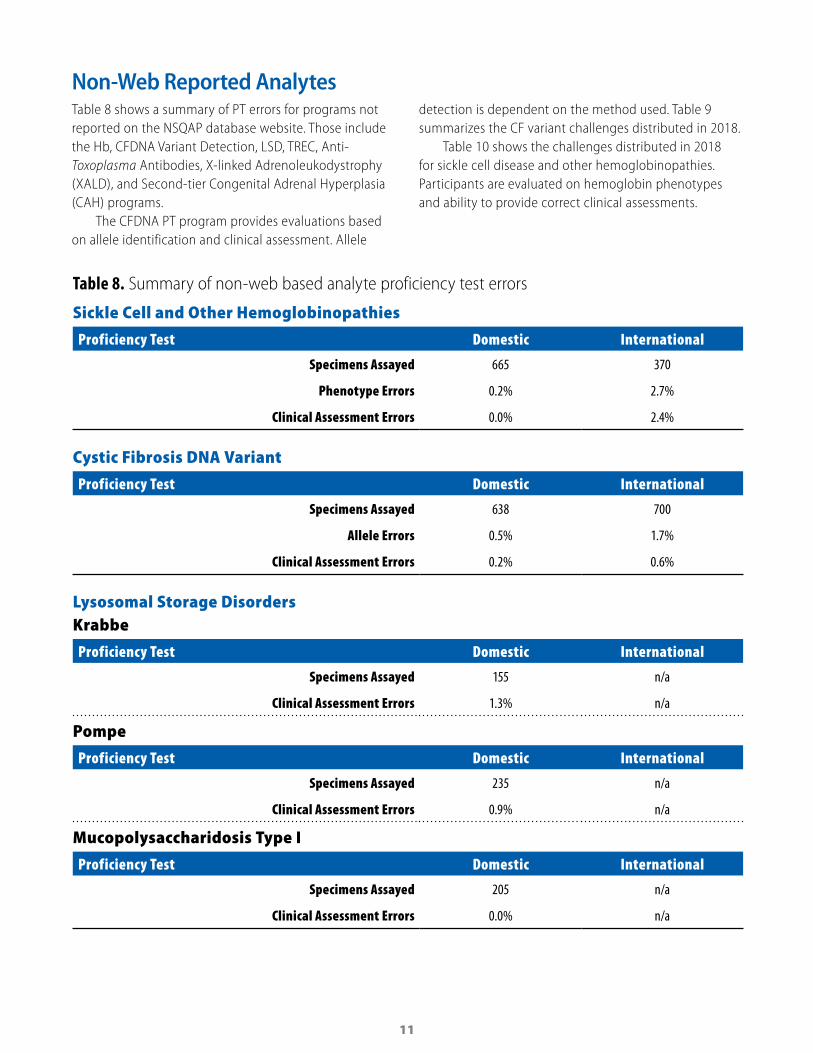
Non-Web Reported AnalytesTable 8 shows a summary of PT errors for programs not reported on the NSQAP database website. Those include the Hb, CFDNA Variant Detection, LSD, TREC, Anti-Toxoplasma Antibodies, X-linked Adrenoleukodystrophy (XALD), and Second-tier Congenital Adrenal Hyperplasia (CAH) programs.
The CFDNA PT program provides evaluations based on allele identification and clinical assessment. Allele
detection is dependent on the method used. Table 9 summarizes the CF variant challenges distributed in 2018.
Table 10 shows the challenges distributed in 2018 for sickle cell disease and other hemoglobinopathies. Participants are evaluated on hemoglobin phenotypes and ability to provide correct clinical assessments.
Table 8. Summary of non-web based analyte proficiency test errors
Sickle Cell and Other Hemoglobinopathies
Proficiency Test Domestic International
Specimens Assayed 665 370
Phenotype Errors 0.2% 2.7%
Clinical Assessment Errors 0.0% 2.4%
Cystic Fibrosis DNA Variant
Proficiency Test Domestic International
Specimens Assayed 638 700
Allele Errors 0.5% 1.7%
Clinical Assessment Errors 0.2% 0.6%
Lysosomal Storage DisordersKrabbe
Proficiency Test Domestic International
Specimens Assayed 155 n/a
Clinical Assessment Errors 1.3% n/a
Pompe
Proficiency Test Domestic International
Specimens Assayed 235 n/a
Clinical Assessment Errors 0.9% n/a
Mucopolysaccharidosis Type I
Proficiency Test Domestic International
Specimens Assayed 205 n/a
Clinical Assessment Errors 0.0% n/a

12
T-cell Receptor Excision Circle
Proficiency Test Domestic International
Total Specimens Assayed 1466 580
Clinical Assessment Errors 0.7% 3.3%
Second-tier Congenital Adrenal Hyperplasia
Proficiency Test Domestic International
Specimens Assayed 75 300
Clinical Assessment Errors 5.3% 9.7%
X-linked Adrenoleukodystrophy24:0 Lysophosphatidylcholine
Proficiency Test Domestic International
Specimens Assayed 165 60
Clinical Assessment Errors 1.2% 0.0%
26:0 Lysophosphatidylcholine
Proficiency Test Domestic International
Specimens Assayed 165 75
Clinical Assessment Errors 1.2% 0.0%

13
Table 9. Cystic Fibrosis DNA variant (CTFR gene) challenges distributed in 2018
Variant (Legacy name) Variant (HGVS nomenclature) Variants sent
F508del (c.1521_1523delCTT) 10
W1204X (c.3612G>A) 2
R1066C (c.3196C>T) 1
G551D (c.1652G>A) 1
2789+5G>A (c.2657+5G>A) 1
3876delA (c.3744delA) 1
R334W (c.1000C>T) 1
Y1092X (c.3276C>A) 1
1898+G>A (c.1766+1G>A) 1
3120+1G>A (c.2988+1G>A) 1
Q890X (c.2668C>T) 1
E60X (c.178G>T) 1
G542X (c.1624G>T) 1
3849+10kbC>T (c.3717+12191C>T) 1
2183AA>G (c.2051_2052delAAinsG) 1
Table 10. Hemoglobinopathies accepted presumptive phenotype distribution
Quarter Specimen 1 Specimen 2 Specimen 3 Specimen 4 Specimen 5
Quarter 1 FAS FA FAC Alpha Thal—Silent Carrier, FA FA
Quarter 3 FAS FAC FA FS, FSU FA
Quarter 4 FS FA FAC FAS FA
14
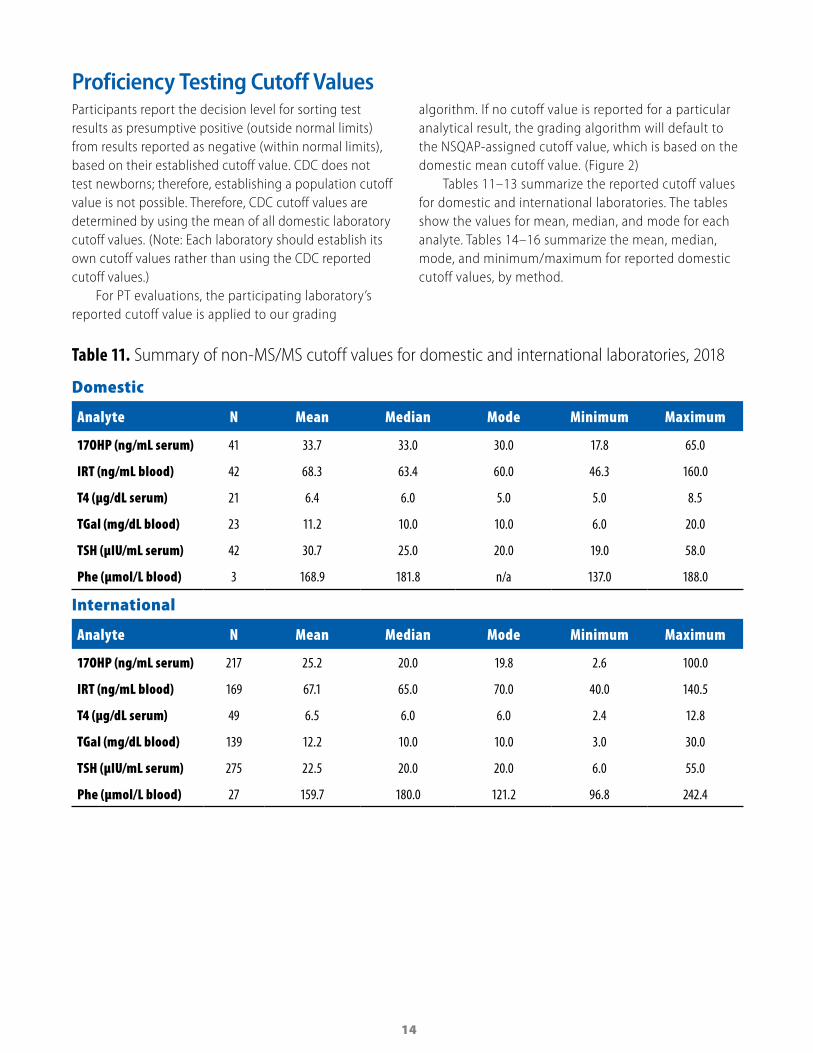
Proficiency Testing Cutoff ValuesParticipants report the decision level for sorting test results as presumptive positive (outside normal limits) from results reported as negative (within normal limits), based on their established cutoff value. CDC does not test newborns; therefore, establishing a population cutoff value is not possible. Therefore, CDC cutoff values are determined by using the mean of all domestic laboratory cutoff values. (Note: Each laboratory should establish its own cutoff values rather than using the CDC reported cutoff values.)
For PT evaluations, the participating laboratory’s reported cutoff value is applied to our grading
algorithm. If no cutoff value is reported for a particular analytical result, the grading algorithm will default to the NSQAP-assigned cutoff value, which is based on the domestic mean cutoff value. (Figure 2)
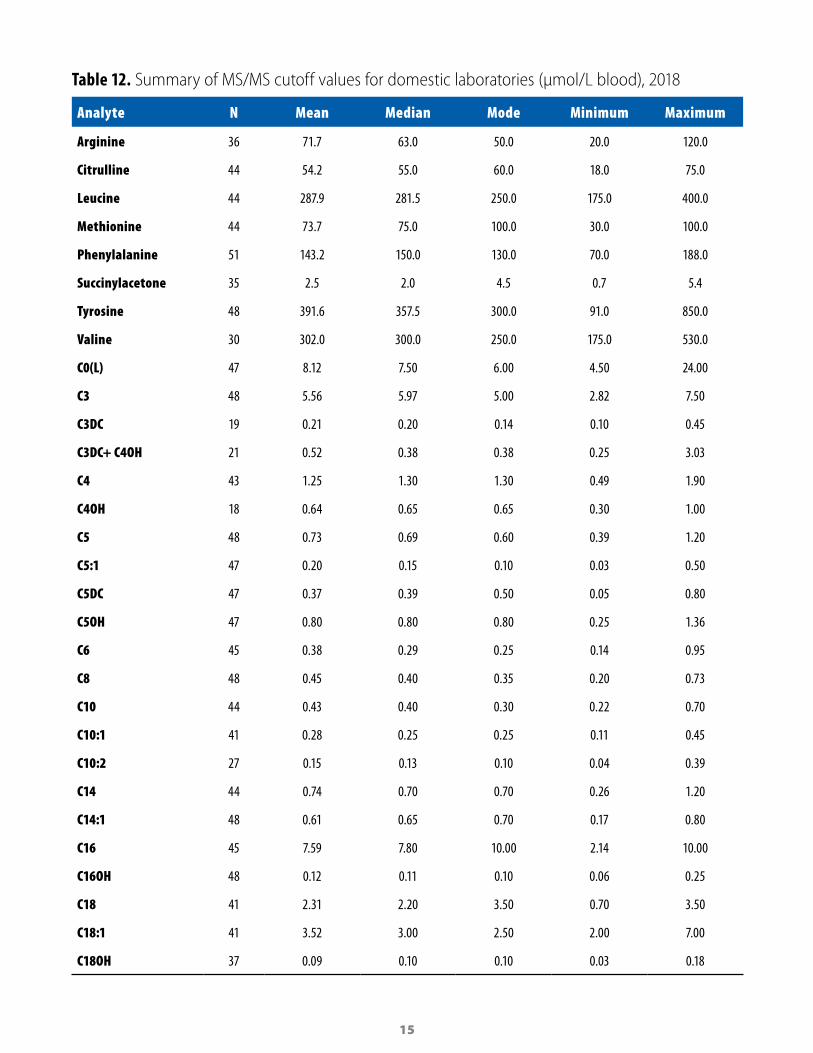
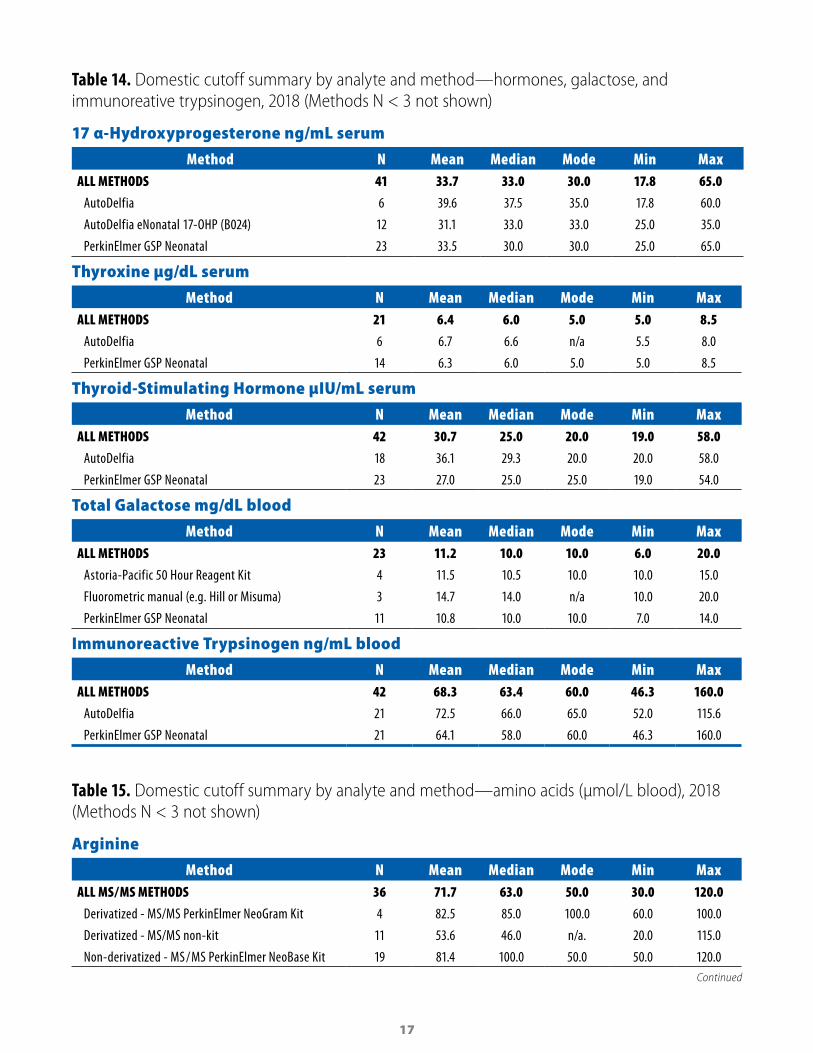
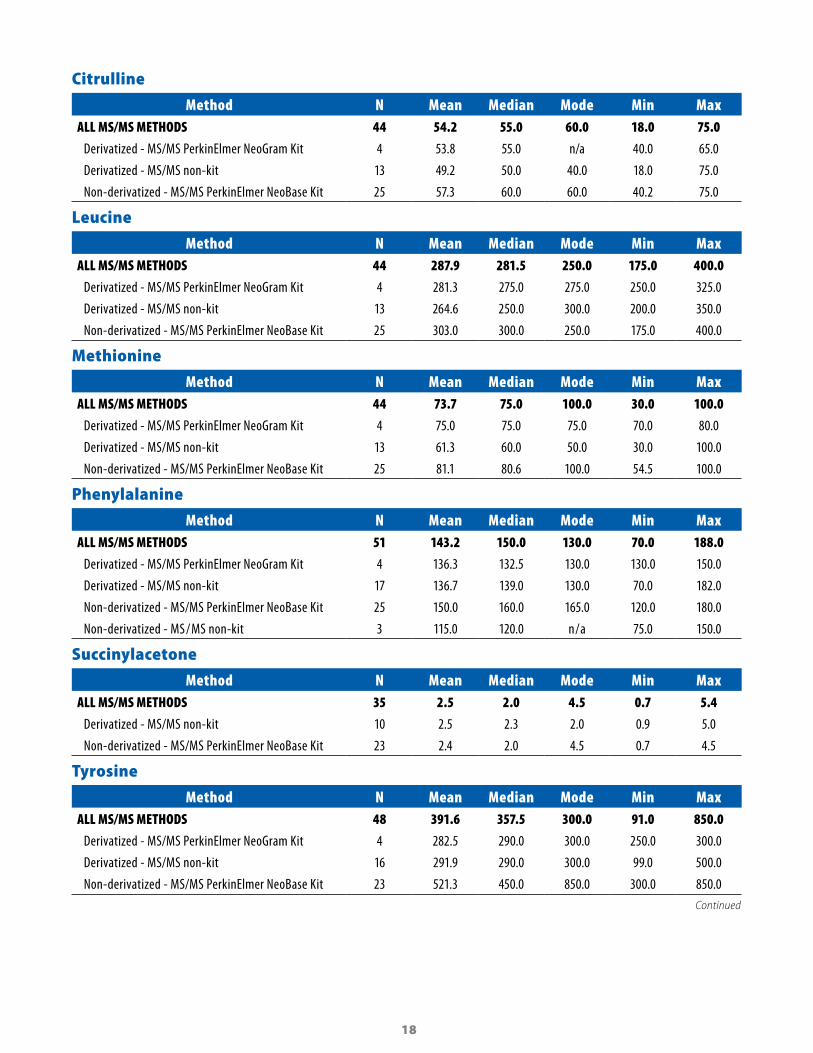
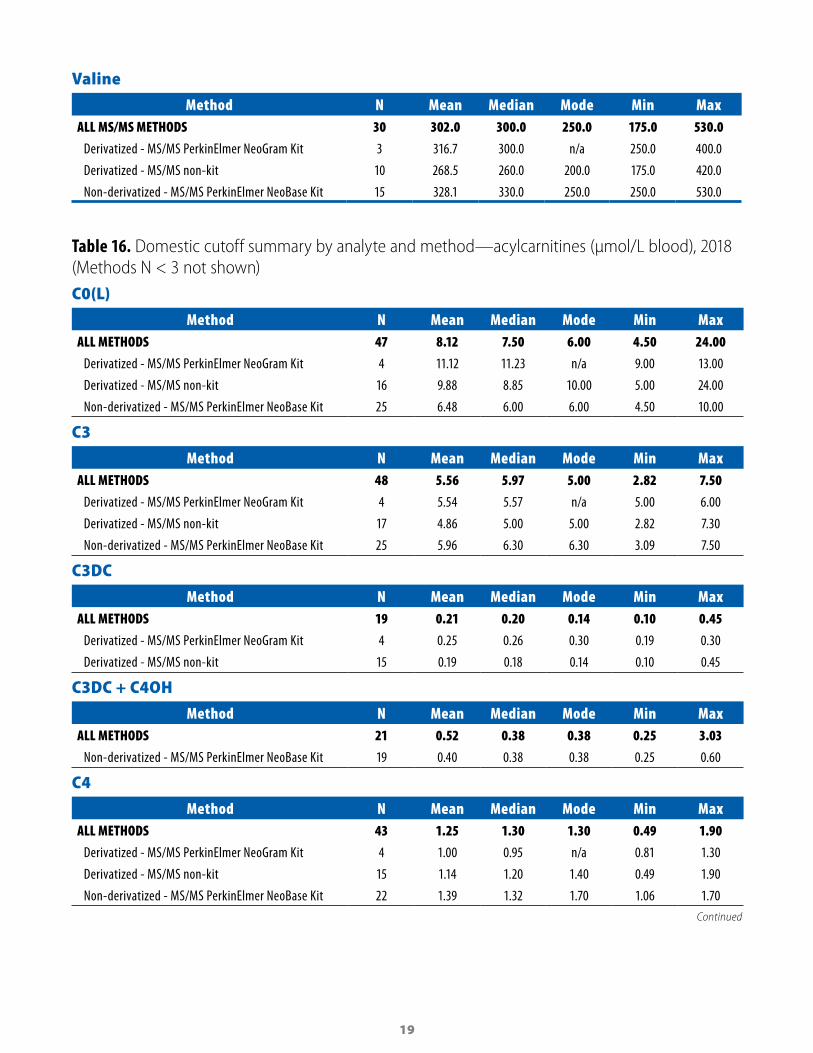
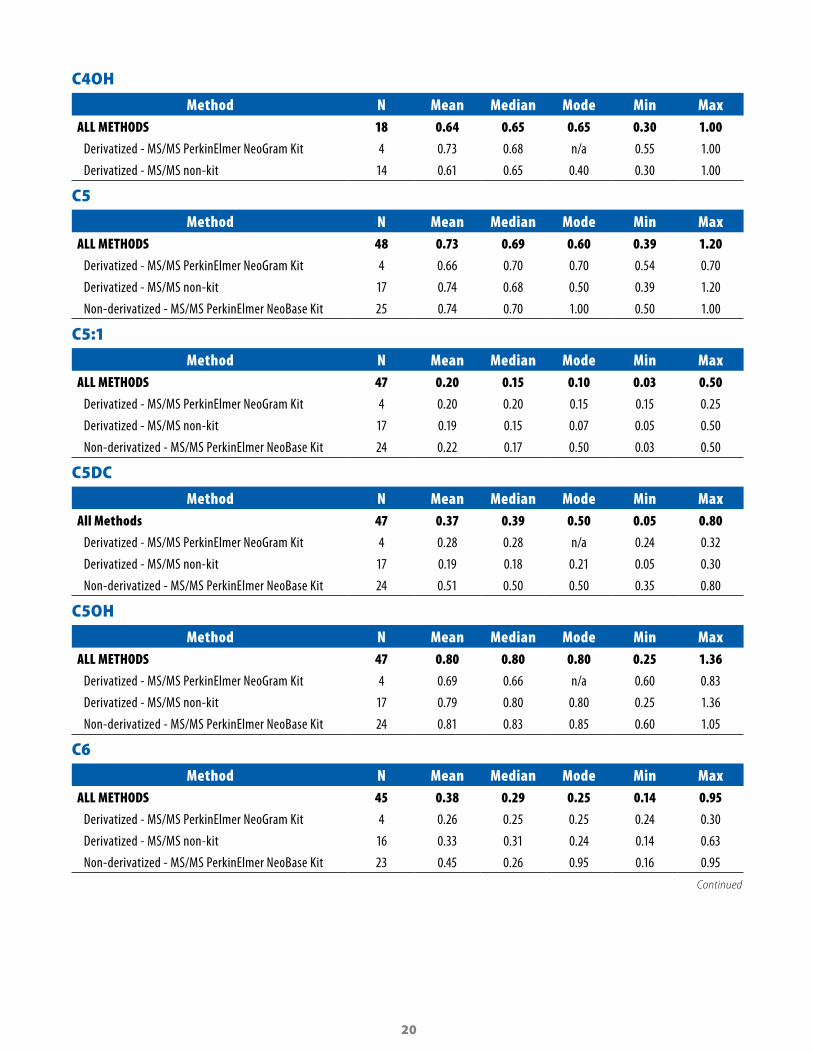
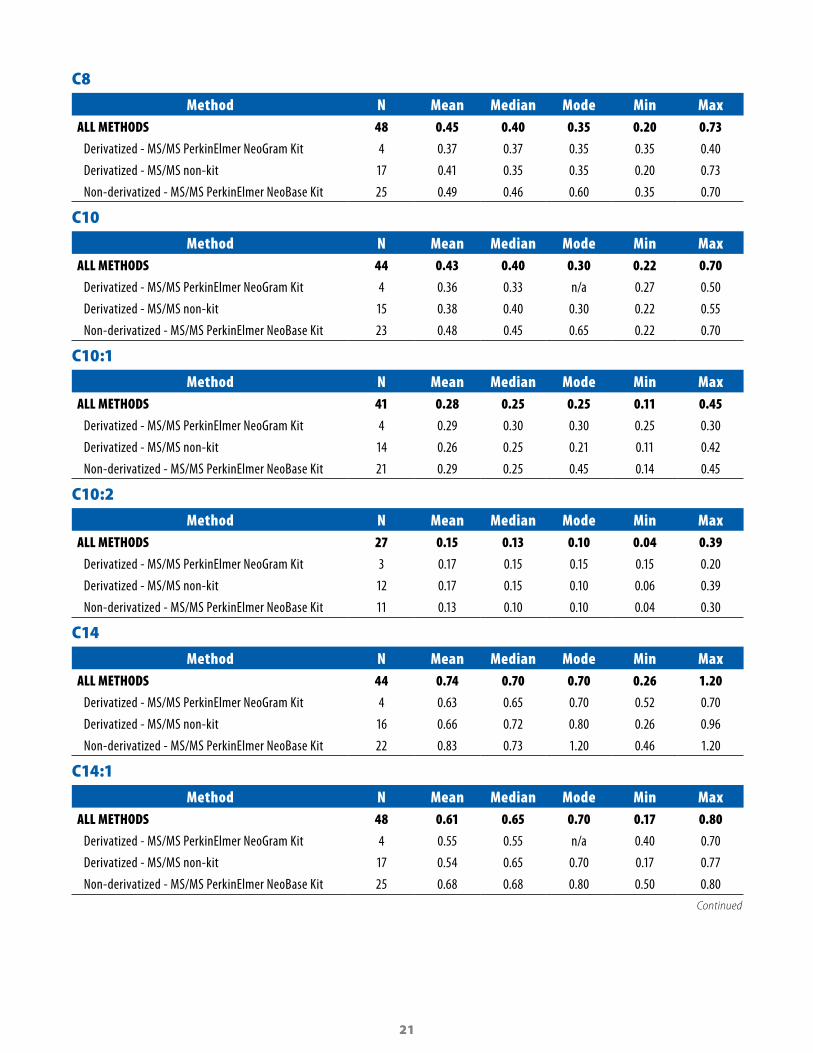
Tables 11–13 summarize the reported cutoff values for domestic and international laboratories. The tables show the values for mean, median, and mode for each analyte. Tables 14–16 summarize the mean, median, mode, and minimum/maximum for reported domestic cutoff values, by method.
Table 11. Summary of non-MS/MS cutoff values for domestic and international laboratories, 2018
Domestic
Analyte N Mean Median Mode Minimum Maximum
17OHP (ng/mL serum) 41 33.7 33.0 30.0 17.8 65.0
IRT (ng/mL blood) 42 68.3 63.4 60.0 46.3 160.0
T4 (µg/dL serum) 21 6.4 6.0 5.0 5.0 8.5
TGal (mg/dL blood) 23 11.2 10.0 10.0 6.0 20.0
TSH (µIU/mL serum) 42 30.7 25.0 20.0 19.0 58.0
Phe (µmol/L blood) 3 168.9 181.8 n/a 137.0 188.0
International
Analyte N Mean Median Mode Minimum Maximum
17OHP (ng/mL serum) 217 25.2 20.0 19.8 2.6 100.0
IRT (ng/mL blood) 169 67.1 65.0 70.0 40.0 140.5
T4 (µg/dL serum) 49 6.5 6.0 6.0 2.4 12.8
TGal (mg/dL blood) 139 12.2 10.0 10.0 3.0 30.0
TSH (µIU/mL serum) 275 22.5 20.0 20.0 6.0 55.0
Phe (µmol/L blood) 27 159.7 180.0 121.2 96.8 242.4
15
Table 12. Summary of MS/MS cutoff values for domestic laboratories (µmol/L blood), 2018
Analyte N Mean Median Mode Minimum Maximum
Arginine 36 71.7 63.0 50.0 20.0 120.0
Citrulline 44 54.2 55.0 60.0 18.0 75.0
Leucine 44 287.9 281.5 250.0 175.0 400.0
Methionine 44 73.7 75.0 100.0 30.0 100.0
Phenylalanine 51 143.2 150.0 130.0 70.0 188.0
Succinylacetone 35 2.5 2.0 4.5 0.7 5.4
Tyrosine 48 391.6 357.5 300.0 91.0 850.0
Valine 30 302.0 300.0 250.0 175.0 530.0
C0(L) 47 8.12 7.50 6.00 4.50 24.00
C3 48 5.56 5.97 5.00 2.82 7.50
C3DC 19 0.21 0.20 0.14 0.10 0.45
C3DC+ C4OH 21 0.52 0.38 0.38 0.25 3.03
C4 43 1.25 1.30 1.30 0.49 1.90
C4OH 18 0.64 0.65 0.65 0.30 1.00
C5 48 0.73 0.69 0.60 0.39 1.20
C5:1 47 0.20 0.15 0.10 0.03 0.50
C5DC 47 0.37 0.39 0.50 0.05 0.80
C5OH 47 0.80 0.80 0.80 0.25 1.36
C6 45 0.38 0.29 0.25 0.14 0.95
C8 48 0.45 0.40 0.35 0.20 0.73
C10 44 0.43 0.40 0.30 0.22 0.70
C10:1 41 0.28 0.25 0.25 0.11 0.45
C10:2 27 0.15 0.13 0.10 0.04 0.39
C14 44 0.74 0.70 0.70 0.26 1.20
C14:1 48 0.61 0.65 0.70 0.17 0.80
C16 45 7.59 7.80 10.00 2.14 10.00
C16OH 48 0.12 0.11 0.10 0.06 0.25
C18 41 2.31 2.20 3.50 0.70 3.50
C18:1 41 3.52 3.00 2.50 2.00 7.00
C18OH 37 0.09 0.10 0.10 0.03 0.18

16
Table 13. Summary of MS/MS cutoff values for international laboratories (µmol/L blood), 2018
Analyte N Mean Median Mode Minimum Maximum
Arginine 229 57.0 55.0 70.0 10.0 150.0
Citrulline 248 51.5 50.0 55.0 20.0 200.0
Leucine 272 304.3 294.5 300.0 145.0 600.0
Methionine 261 55.8 50.0 75.0 20.0 120.0
Phenylalanine 325 138.3 129.0 120.0 1.8 250.0
Succinylacetone 102 2.1 1.5 2.0 0.4 8.0
Tyrosine 269 293.6 280.0 350.0 79.9 600.0
Valine 254 268.3 265.0 300.0 44.0 470.0
C0(L) 262 16.47 9.00 10.00 2.00 100.00
C3 262 5.44 5.40 5.65 0.20 70.00
C3DC 105 0.28 0.25 0.25 0.04 1.82
C3DC+ C4OH 100 0.49 0.44 0.45 0.15 3.07
C4 245 0.96 0.92 1.30 0.29 3.80
C4OH 100 0.57 0.57 0.65 0.05 1.40
C5 271 0.68 0.60 0.70 0.20 2.00
C5:1 232 0.15 0.12 0.25 0.01 0.97
C5DC 256 0.33 0.30 0.35 0.07 0.90
C5OH 226 0.76 0.79 1.00 0.19 2.50
C6 247 0.29 0.25 0.20 0.05 1.00
C8 276 0.35 0.30 0.50 0.07 1.00
C10 261 0.47 0.37 0.45 0.07 25.00
C10:1 227 0.35 0.25 0.30 0.05 20.00
C10:2 158 0.15 0.12 0.15 0.01 2.00
C14 245 0.60 0.57 0.50 0.08 1.30
C14:1 251 0.45 0.40 0.60 0.04 2.50
C16 251 6.81 7.00 7.50 0.52 14.00
C16OH 251 0.30 0.10 0.10 0.02 48.00
C18 243 2.10 2.00 2.30 0.20 4.00
C18:1 230 3.01 3.00 3.50 0.16 8.00
C18OH 208 0.10 0.08 0.10 0.01 2.00
17
Table 14. Domestic cutoff summary by analyte and method—hormones, galactose, and immunoreative trypsinogen, 2018 (Methods N < 3 not shown)
17 α-Hydroxyprogesterone ng/mL serum
Method N Mean Median Mode Min MaxALL METHODS 41 33.7 33.0 30.0 17.8 65.0
AutoDelfia 6 39.6 37.5 35.0 17.8 60.0
AutoDelfia eNonatal 17-OHP (B024) 12 31.1 33.0 33.0 25.0 35.0
PerkinElmer GSP Neonatal 23 33.5 30.0 30.0 25.0 65.0
Thyroxine µg/dL serum
Method N Mean Median Mode Min MaxALL METHODS 21 6.4 6.0 5.0 5.0 8.5
AutoDelfia 6 6.7 6.6 n/a 5.5 8.0
PerkinElmer GSP Neonatal 14 6.3 6.0 5.0 5.0 8.5
Thyroid-Stimulating Hormone µIU/mL serum
Method N Mean Median Mode Min MaxALL METHODS 42 30.7 25.0 20.0 19.0 58.0
AutoDelfia 18 36.1 29.3 20.0 20.0 58.0
PerkinElmer GSP Neonatal 23 27.0 25.0 25.0 19.0 54.0
Total Galactose mg/dL blood
Method N Mean Median Mode Min MaxALL METHODS 23 11.2 10.0 10.0 6.0 20.0
Astoria-Pacific 50 Hour Reagent Kit 4 11.5 10.5 10.0 10.0 15.0
Fluorometric manual (e.g. Hill or Misuma) 3 14.7 14.0 n/a 10.0 20.0
PerkinElmer GSP Neonatal 11 10.8 10.0 10.0 7.0 14.0
Immunoreactive Trypsinogen ng/mL blood
Method N Mean Median Mode Min MaxALL METHODS 42 68.3 63.4 60.0 46.3 160.0
AutoDelfia 21 72.5 66.0 65.0 52.0 115.6
PerkinElmer GSP Neonatal 21 64.1 58.0 60.0 46.3 160.0
Table 15. Domestic cutoff summary by analyte and method—amino acids (µmol/L blood), 2018 (Methods N < 3 not shown)
Arginine
Method N Mean Median Mode Min MaxALL MS / MS METHODS 36 71.7 63.0 50.0 30.0 120.0
Derivatized - MS/MS PerkinElmer NeoGram Kit 4 82.5 85.0 100.0 60.0 100.0
Derivatized - MS/MS non-kit 11 53.6 46.0 n/a. 20.0 115.0
Non-derivatized - MS / MS PerkinElmer NeoBase Kit 19 81.4 100.0 50.0 50.0 120.0Continued
18
Citrulline
Method N Mean Median Mode Min MaxALL MS/MS METHODS 44 54.2 55.0 60.0 18.0 75.0
Derivatized - MS/MS PerkinElmer NeoGram Kit 4 53.8 55.0 n/a 40.0 65.0
Derivatized - MS/MS non-kit 13 49.2 50.0 40.0 18.0 75.0
Non-derivatized - MS/MS PerkinElmer NeoBase Kit 25 57.3 60.0 60.0 40.2 75.0
Leucine
Method N Mean Median Mode Min MaxALL MS/MS METHODS 44 287.9 281.5 250.0 175.0 400.0
Derivatized - MS/MS PerkinElmer NeoGram Kit 4 281.3 275.0 275.0 250.0 325.0
Derivatized - MS/MS non-kit 13 264.6 250.0 300.0 200.0 350.0
Non-derivatized - MS/MS PerkinElmer NeoBase Kit 25 303.0 300.0 250.0 175.0 400.0
Methionine
Method N Mean Median Mode Min MaxALL MS/MS METHODS 44 73.7 75.0 100.0 30.0 100.0
Derivatized - MS/MS PerkinElmer NeoGram Kit 4 75.0 75.0 75.0 70.0 80.0
Derivatized - MS/MS non-kit 13 61.3 60.0 50.0 30.0 100.0
Non-derivatized - MS/MS PerkinElmer NeoBase Kit 25 81.1 80.6 100.0 54.5 100.0
Phenylalanine
Method N Mean Median Mode Min MaxALL MS/MS METHODS 51 143.2 150.0 130.0 70.0 188.0
Derivatized - MS/MS PerkinElmer NeoGram Kit 4 136.3 132.5 130.0 130.0 150.0
Derivatized - MS/MS non-kit 17 136.7 139.0 130.0 70.0 182.0
Non-derivatized - MS/MS PerkinElmer NeoBase Kit 25 150.0 160.0 165.0 120.0 180.0
Non-derivatized - MS / MS non-kit 3 115.0 120.0 n / a 75.0 150.0
Succinylacetone
Method N Mean Median Mode Min MaxALL MS/MS METHODS 35 2.5 2.0 4.5 0.7 5.4
Derivatized - MS/MS non-kit 10 2.5 2.3 2.0 0.9 5.0
Non-derivatized - MS/MS PerkinElmer NeoBase Kit 23 2.4 2.0 4.5 0.7 4.5
Tyrosine
Method N Mean Median Mode Min MaxALL MS/MS METHODS 48 391.6 357.5 300.0 91.0 850.0
Derivatized - MS/MS PerkinElmer NeoGram Kit 4 282.5 290.0 300.0 250.0 300.0
Derivatized - MS/MS non-kit 16 291.9 290.0 300.0 99.0 500.0
Non-derivatized - MS/MS PerkinElmer NeoBase Kit 23 521.3 450.0 850.0 300.0 850.0Continued
19
Valine
Method N Mean Median Mode Min MaxALL MS/MS METHODS 30 302.0 300.0 250.0 175.0 530.0
Derivatized - MS/MS PerkinElmer NeoGram Kit 3 316.7 300.0 n/a 250.0 400.0
Derivatized - MS/MS non-kit 10 268.5 260.0 200.0 175.0 420.0
Non-derivatized - MS/MS PerkinElmer NeoBase Kit 15 328.1 330.0 250.0 250.0 530.0
Table 16. Domestic cutoff summary by analyte and method—acylcarnitines (µmol/L blood), 2018 (Methods N < 3 not shown)C0(L)
Method N Mean Median Mode Min MaxALL METHODS 47 8.12 7.50 6.00 4.50 24.00
Derivatized - MS/MS PerkinElmer NeoGram Kit 4 11.12 11.23 n/a 9.00 13.00
Derivatized - MS/MS non-kit 16 9.88 8.85 10.00 5.00 24.00
Non-derivatized - MS/MS PerkinElmer NeoBase Kit 25 6.48 6.00 6.00 4.50 10.00
C3
Method N Mean Median Mode Min MaxALL METHODS 48 5.56 5.97 5.00 2.82 7.50
Derivatized - MS/MS PerkinElmer NeoGram Kit 4 5.54 5.57 n/a 5.00 6.00
Derivatized - MS/MS non-kit 17 4.86 5.00 5.00 2.82 7.30
Non-derivatized - MS/MS PerkinElmer NeoBase Kit 25 5.96 6.30 6.30 3.09 7.50
C3DC
Method N Mean Median Mode Min MaxALL METHODS 19 0.21 0.20 0.14 0.10 0.45
Derivatized - MS/MS PerkinElmer NeoGram Kit 4 0.25 0.26 0.30 0.19 0.30
Derivatized - MS/MS non-kit 15 0.19 0.18 0.14 0.10 0.45
C3DC + C4OH
Method N Mean Median Mode Min MaxALL METHODS 21 0.52 0.38 0.38 0.25 3.03
Non-derivatized - MS/MS PerkinElmer NeoBase Kit 19 0.40 0.38 0.38 0.25 0.60
C4
Method N Mean Median Mode Min MaxALL METHODS 43 1.25 1.30 1.30 0.49 1.90
Derivatized - MS/MS PerkinElmer NeoGram Kit 4 1.00 0.95 n/a 0.81 1.30
Derivatized - MS/MS non-kit 15 1.14 1.20 1.40 0.49 1.90
Non-derivatized - MS/MS PerkinElmer NeoBase Kit 22 1.39 1.32 1.70 1.06 1.70Continued
20
C4OH
Method N Mean Median Mode Min MaxALL METHODS 18 0.64 0.65 0.65 0.30 1.00
Derivatized - MS/MS PerkinElmer NeoGram Kit 4 0.73 0.68 n/a 0.55 1.00
Derivatized - MS/MS non-kit 14 0.61 0.65 0.40 0.30 1.00
C5
Method N Mean Median Mode Min MaxALL METHODS 48 0.73 0.69 0.60 0.39 1.20
Derivatized - MS/MS PerkinElmer NeoGram Kit 4 0.66 0.70 0.70 0.54 0.70
Derivatized - MS/MS non-kit 17 0.74 0.68 0.50 0.39 1.20
Non-derivatized - MS/MS PerkinElmer NeoBase Kit 25 0.74 0.70 1.00 0.50 1.00
C5:1
Method N Mean Median Mode Min MaxALL METHODS 47 0.20 0.15 0.10 0.03 0.50
Derivatized - MS/MS PerkinElmer NeoGram Kit 4 0.20 0.20 0.15 0.15 0.25
Derivatized - MS/MS non-kit 17 0.19 0.15 0.07 0.05 0.50
Non-derivatized - MS/MS PerkinElmer NeoBase Kit 24 0.22 0.17 0.50 0.03 0.50
C5DC
Method N Mean Median Mode Min MaxAll Methods 47 0.37 0.39 0.50 0.05 0.80
Derivatized - MS/MS PerkinElmer NeoGram Kit 4 0.28 0.28 n/a 0.24 0.32
Derivatized - MS/MS non-kit 17 0.19 0.18 0.21 0.05 0.30
Non-derivatized - MS/MS PerkinElmer NeoBase Kit 24 0.51 0.50 0.50 0.35 0.80
C5OH
Method N Mean Median Mode Min MaxALL METHODS 47 0.80 0.80 0.80 0.25 1.36
Derivatized - MS/MS PerkinElmer NeoGram Kit 4 0.69 0.66 n/a 0.60 0.83
Derivatized - MS/MS non-kit 17 0.79 0.80 0.80 0.25 1.36
Non-derivatized - MS/MS PerkinElmer NeoBase Kit 24 0.81 0.83 0.85 0.60 1.05
C6
Method N Mean Median Mode Min MaxALL METHODS 45 0.38 0.29 0.25 0.14 0.95
Derivatized - MS/MS PerkinElmer NeoGram Kit 4 0.26 0.25 0.25 0.24 0.30
Derivatized - MS/MS non-kit 16 0.33 0.31 0.24 0.14 0.63
Non-derivatized - MS/MS PerkinElmer NeoBase Kit 23 0.45 0.26 0.95 0.16 0.95
Continued
21
C8
Method N Mean Median Mode Min MaxALL METHODS 48 0.45 0.40 0.35 0.20 0.73
Derivatized - MS/MS PerkinElmer NeoGram Kit 4 0.37 0.37 0.35 0.35 0.40
Derivatized - MS/MS non-kit 17 0.41 0.35 0.35 0.20 0.73
Non-derivatized - MS/MS PerkinElmer NeoBase Kit 25 0.49 0.46 0.60 0.35 0.70
C10
Method N Mean Median Mode Min MaxALL METHODS 44 0.43 0.40 0.30 0.22 0.70
Derivatized - MS/MS PerkinElmer NeoGram Kit 4 0.36 0.33 n/a 0.27 0.50
Derivatized - MS/MS non-kit 15 0.38 0.40 0.30 0.22 0.55
Non-derivatized - MS/MS PerkinElmer NeoBase Kit 23 0.48 0.45 0.65 0.22 0.70
C10:1
Method N Mean Median Mode Min MaxALL METHODS 41 0.28 0.25 0.25 0.11 0.45
Derivatized - MS/MS PerkinElmer NeoGram Kit 4 0.29 0.30 0.30 0.25 0.30
Derivatized - MS/MS non-kit 14 0.26 0.25 0.21 0.11 0.42
Non-derivatized - MS/MS PerkinElmer NeoBase Kit 21 0.29 0.25 0.45 0.14 0.45
C10:2
Method N Mean Median Mode Min MaxALL METHODS 27 0.15 0.13 0.10 0.04 0.39
Derivatized - MS/MS PerkinElmer NeoGram Kit 3 0.17 0.15 0.15 0.15 0.20
Derivatized - MS/MS non-kit 12 0.17 0.15 0.10 0.06 0.39
Non-derivatized - MS/MS PerkinElmer NeoBase Kit 11 0.13 0.10 0.10 0.04 0.30
C14
Method N Mean Median Mode Min MaxALL METHODS 44 0.74 0.70 0.70 0.26 1.20
Derivatized - MS/MS PerkinElmer NeoGram Kit 4 0.63 0.65 0.70 0.52 0.70
Derivatized - MS/MS non-kit 16 0.66 0.72 0.80 0.26 0.96
Non-derivatized - MS/MS PerkinElmer NeoBase Kit 22 0.83 0.73 1.20 0.46 1.20
C14:1
Method N Mean Median Mode Min MaxALL METHODS 48 0.61 0.65 0.70 0.17 0.80
Derivatized - MS/MS PerkinElmer NeoGram Kit 4 0.55 0.55 n/a 0.40 0.70
Derivatized - MS/MS non-kit 17 0.54 0.65 0.70 0.17 0.77
Non-derivatized - MS/MS PerkinElmer NeoBase Kit 25 0.68 0.68 0.80 0.50 0.80
Continued

22
C16
Method N Mean Median Mode Min MaxALL METHODS 45 7.59 7.80 10.00 2.14 10.00
Derivatized - MS/MS PerkinElmer NeoGram Kit 4 7.04 6.93 n/a 6.50 7.80
Derivatized - MS/MS non-kit 16 6.69 7.40 8.00 2.14 9.00
Non-derivatized - MS/MS PerkinElmer NeoBase Kit 23 8.25 8.00 10.00 5.00 10.00
C16OH
Method N Mean Median Mode Min MaxALL METHODS 48 0.12 0.11 0.10 0.06 0.25
Derivatized - MS/MS PerkinElmer NeoGram Kit 4 0.15 0.15 n/a 0.12 0.18
Derivatized - MS/MS non-kit 17 0.14 0.14 0.10 0.06 0.25
Non-derivatized - MS/MS PerkinElmer NeoBase Kit 25 0.11 0.10 0.10 0.06 0.20
C18
Method N Mean Median Mode Min MaxALL METHODS 41 2.31 2.20 3.50 0.70 3.50
Derivatized - MS/MS PerkinElmer NeoGram Kit 4 2.17 2.15 n/a 1.89 2.50
Derivatized - MS/MS non-kit 13 1.87 1.85 1.50 0.70 2.80
Non-derivatized - MS/MS PerkinElmer NeoBase Kit 22 2.59 2.48 3.50 1.55 3.50
C18:1
Method N Mean Median Mode Min MaxALL METHODS 41 3.52 3.00 2.50 2.00 7.00
Derivatized - MS/MS PerkinElmer NeoGram Kit 3 3.14 3.43 n/a 2.50 3.50
Derivatized - MS/MS non-kit 14 2.68 2.54 2.50 2.00 3.50
Non-derivatized - MS/MS PerkinElmer NeoBase Kit 22 4.14 3.33 7.00 2.00 7.00
C18OH
Method N Mean Median Mode Min MaxALL METHODS 37 0.09 0.10 0.10 0.03 0.18
Derivatized - MS/MS PerkinElmer NeoGram Kit 4 0.12 0.11 0.10 0.10 0.16
Derivatized - MS/MS non-kit 11 0.10 0.10 0.10 0.03 0.18
Non-derivatized - MS/MS PerkinElmer NeoBase Kit 20 0.09 0.10 0.10 0.03 0.16
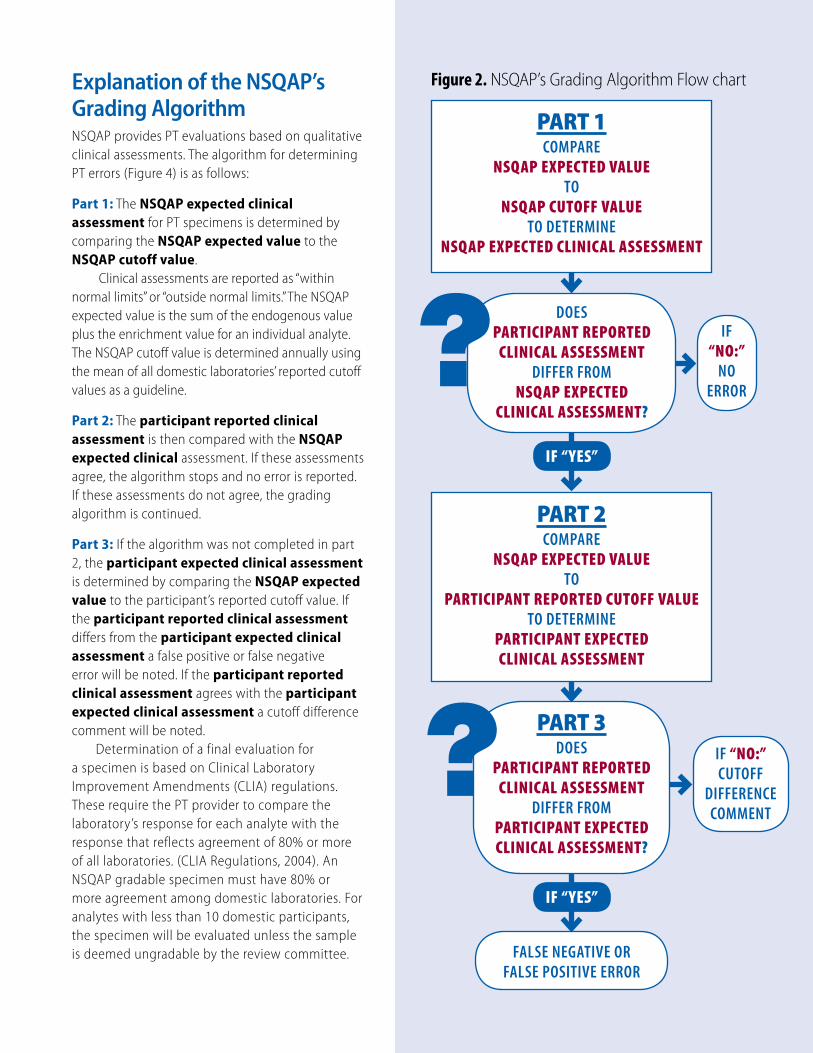
Explanation of the NSQAP’s Grading AlgorithmNSQAP provides PT evaluations based on qualitative clinical assessments. The algorithm for determining PT errors (Figure 4) is as follows:
Part 1: The NSQAP expected clinical assessment for PT specimens is determined by comparing the NSQAP expected value to the NSQAP cutoff value.
Clinical assessments are reported as “within normal limits” or “outside normal limits.” The NSQAP expected value is the sum of the endogenous value plus the enrichment value for an individual analyte. The NSQAP cutoff value is determined annually using the mean of all domestic laboratories’ reported cutoff values as a guideline.
Part 2: The participant reported clinical assessment is then compared with the NSQAP expected clinical assessment. If these assessments agree, the algorithm stops and no error is reported. If these assessments do not agree, the grading algorithm is continued.
Part 3: If the algorithm was not completed in part 2, the participant expected clinical assessment is determined by comparing the NSQAP expected value to the participant’s reported cutoff value. If the participant reported clinical assessment differs from the participant expected clinical assessment a false positive or false negative error will be noted. If the participant reported clinical assessment agrees with the participant expected clinical assessment a cutoff difference comment will be noted.
Determination of a final evaluation for a specimen is based on Clinical Laboratory Improvement Amendments (CLIA) regulations. These require the PT provider to compare the laboratory’s response for each analyte with the response that reflects agreement of 80% or more of all laboratories. (CLIA Regulations, 2004). An NSQAP gradable specimen must have 80% or more agreement among domestic laboratories. For analytes with less than 10 domestic participants, the specimen will be evaluated unless the sample is deemed ungradable by the review committee.
Figure 2. NSQAP’s Grading Algorithm Flow chart
PART 1 COMPARE
NSQAP EXPECTED VALUETO
NSQAP CUTOFF VALUETO DETERMINE
NSQAP EXPECTED CLINICAL ASSESSMENT
DOESPARTICIPANT REPORTED
CLINICAL ASSESSMENTDIFFER FROM
NSQAP EXPECTED CLINICAL ASSESSMENT?
IF “NO:”
NO ERROR
IF “YES”
PART 2 COMPARE
NSQAP EXPECTED VALUETO
PARTICIPANT REPORTED CUTOFF VALUETO DETERMINE
PARTICIPANT EXPECTED CLINICAL ASSESSMENT
PART 3 DOES
PARTICIPANT REPORTED CLINICAL ASSESSMENT
DIFFER FROMPARTICIPANT EXPECTED CLINICAL ASSESSMENT?
IF “NO:” CUTOFF
DIFFERENCE COMMENT
IF “YES”
FALSE NEGATIVE OR FALSE POSITIVE ERROR
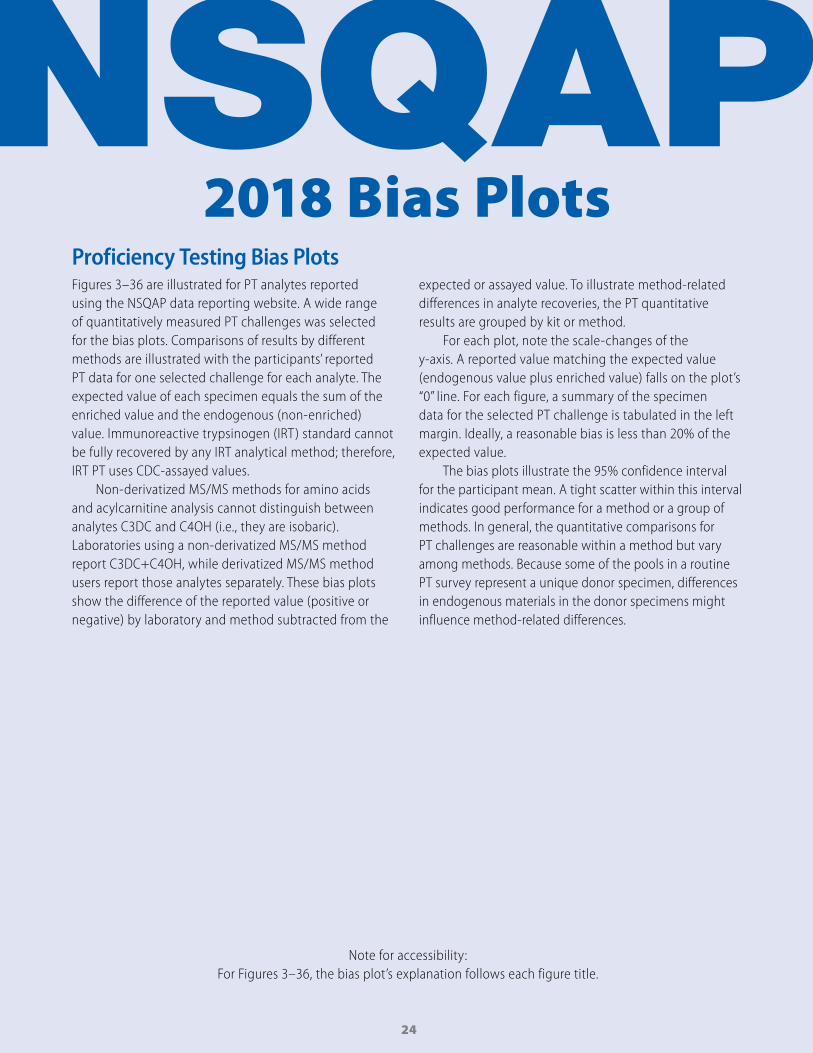
2018 Bias PlotsProficiency Testing Bias PlotsFigures 3–36 are illustrated for PT analytes reported using the NSQAP data reporting website. A wide range of quantitatively measured PT challenges was selected for the bias plots. Comparisons of results by different methods are illustrated with the participants’ reported PT data for one selected challenge for each analyte. The expected value of each specimen equals the sum of the enriched value and the endogenous (non-enriched) value. Immunoreactive trypsinogen (IRT) standard cannot be fully recovered by any IRT analytical method; therefore, IRT PT uses CDC-assayed values.
Non-derivatized MS/MS methods for amino acids and acylcarnitine analysis cannot distinguish between analytes C3DC and C4OH (i.e., they are isobaric). Laboratories using a non-derivatized MS/MS method report C3DC+C4OH, while derivatized MS/MS method users report those analytes separately. These bias plots show the difference of the reported value (positive or negative) by laboratory and method subtracted from the
expected or assayed value. To illustrate method-related differences in analyte recoveries, the PT quantitative results are grouped by kit or method.
For each plot, note the scale-changes of the y-axis. A reported value matching the expected value (endogenous value plus enriched value) falls on the plot’s “0” line. For each figure, a summary of the specimen data for the selected PT challenge is tabulated in the left margin. Ideally, a reasonable bias is less than 20% of the expected value.
The bias plots illustrate the 95% confidence interval for the participant mean. A tight scatter within this interval indicates good performance for a method or a group of methods. In general, the quantitative comparisons for PT challenges are reasonable within a method but vary among methods. Because some of the pools in a routine PT survey represent a unique donor specimen, differences in endogenous materials in the donor specimens might influence method-related differences.
Note for accessibility: For Figures 3–36, the bias plot’s explanation follows each figure title.
24

25
Figure 3. Reproducibility of Results:Bias Plot of 17 α-Hydroxyprogesterone (17OHP) Values by Method
Quarter 1, Specimen 11815Expected Value (EV) = 86.0 ng/mL serum
17OHP ng/mL serum
Quarter 1
Enriched—85.0
CDC Assayed—71.4
Participant Mean—79.3
Participant Bias—-6.7
The 17OHP bias plot shows units of measure on the y-axis ranging from 150 ng/mL serum to -150 ng/mL serum. The mean bias for this plot is -6.7 ng/mL serum. The data on this plot shows a tight scatter among all participants.
Figure 4. Reproducibility of Results:Thyroxine (T4) Values by Method
Quarter 1, Specimen 11811Expected Value (EV) = 1.6 µg/dL serum
T4 µg/dL serum
Quarter 1
Enriched—1.5
CDC Assayed—1.5
Participant Mean—1.6
Participant Bias—0.0
The T4 bias plot shows units of measure on the y-axis ranging from 2 μg/dL serum to -2 μg/dL serum. The mean bias for this plot is zero. The data on this plot shows a good agreement among participants.
95% UL
EV
95% LL
x Bias
-150
-100
-50
0
50
100
150
95% UL
EVx Bias
95% LL
-2
-1
0
1
2
T4
26
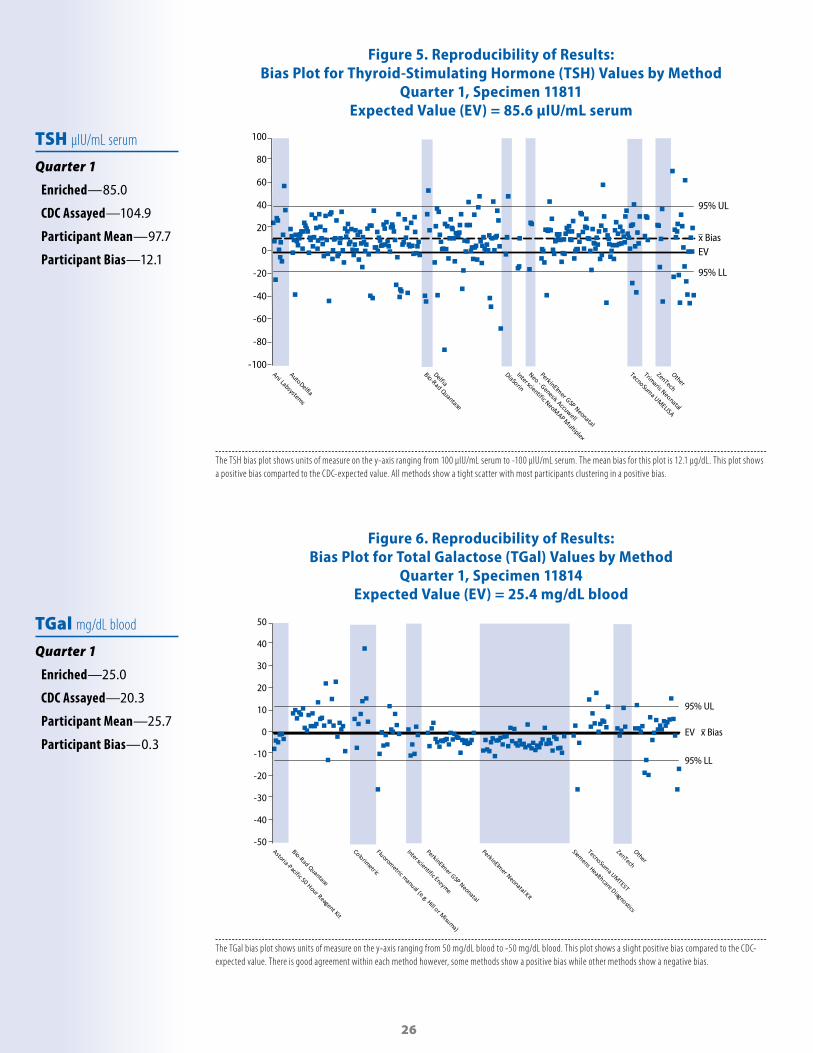
Figure 5. Reproducibility of Results:Bias Plot for Thyroid-Stimulating Hormone (TSH) Values by Method
Quarter 1, Specimen 11811Expected Value (EV) = 85.6 µIU/mL serum
TSH µIU/mL serum
Quarter 1
Enriched—85.0
CDC Assayed—104.9
Participant Mean—97.7
Participant Bias—12.1
The TSH bias plot shows units of measure on the y-axis ranging from 100 μIU/mL serum to -100 μIU/mL serum. The mean bias for this plot is 12.1 μg/dL. This plot shows a positive bias comparted to the CDC-expected value. All methods show a tight scatter with most participants clustering in a positive bias.
Figure 6. Reproducibility of Results:Bias Plot for Total Galactose (TGal) Values by Method
Quarter 1, Specimen 11814Expected Value (EV) = 25.4 mg/dL blood
TGal mg/dL blood
Quarter 1
Enriched—25.0
CDC Assayed—20.3
Participant Mean—25.7
Participant Bias—0.3
The TGal bias plot shows units of measure on the y-axis ranging from 50 mg/dL blood to -50 mg/dL blood. This plot shows a slight positive bias compared to the CDC-expected value. There is good agreement within each method however, some methods show a positive bias while other methods show a negative bias.
95% UL
EV
95% LL
x Bias
-100
-80
-60
-40
-20
0
20
40
60
80
100
95% UL
EV
95% LL
x Bias
-50
-40
-30
-20
-10
0
10
20
30
40
50
27
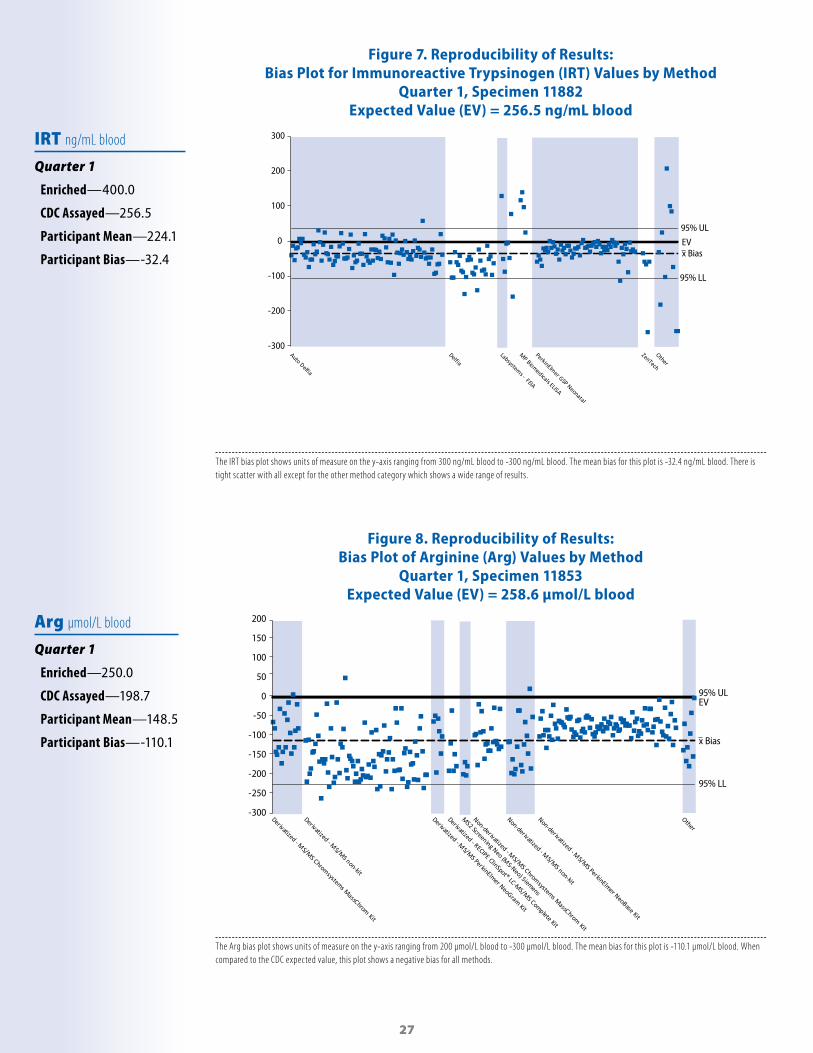
Figure 7. Reproducibility of Results:Bias Plot for Immunoreactive Trypsinogen (IRT) Values by Method
Quarter 1, Specimen 11882Expected Value (EV) = 256.5 ng/mL blood
IRT ng/mL blood
Quarter 1
Enriched—400.0
CDC Assayed—256.5
Participant Mean—224.1
Participant Bias—-32.4
The IRT bias plot shows units of measure on the y-axis ranging from 300 ng/mL blood to -300 ng/mL blood. The mean bias for this plot is -32.4 ng/mL blood. There is tight scatter with all except for the other method category which shows a wide range of results.
Figure 8. Reproducibility of Results:Bias Plot of Arginine (Arg) Values by Method
Quarter 1, Specimen 11853Expected Value (EV) = 258.6 µmol/L blood
Arg µmol/L blood
Quarter 1
Enriched—250.0
CDC Assayed—198.7
Participant Mean—148.5
Participant Bias—-110.1
The Arg bias plot shows units of measure on the y-axis ranging from 200 μmol/L blood to -300 μmol/L blood. The mean bias for this plot is -110.1 μmol/L blood. When compared to the CDC expected value, this plot shows a negative bias for all methods.
95% UL
EV
95% LL
x Bias
-300
-200
-100
0
100
200
300
EV95% UL
95% LL
x Bias
-300
-250
-200
-150
-100
-50
0
50
100
150
200

28
Figure 9. Reproducibility of Results:Bias Plot for Citrulline (Cit) Values by Method
Quarter 3, Specimen 31852Expected Value (EV) = 251.2 µmol/L blood
Cit µmol/L blood
Quarter 3
Enriched—239.2
CDC Assayed—230.3
Participant Mean—240.8
Participant Bias—-10.39
The Cit bias plot shows units of measure on the y-axis ranging from 300 μmol/L blood to -300 μmol/L blood. The mean bias for this plot is -10.39 μmol/L blood. The Cit bias plot shows a good agreement amoung methods.
Figure 10. Reproducibility of Results:Bias Plot for Leucine (Leu) Values by Method
Quarter 3, Specimen 31854Expected Value (EV) = 773.8 µmol/L blood
Leu µmol/L blood
Quarter 3
Enriched—748.8
CDC Assayed—770.3
Participant Mean—601.3
Participant Bias—- 172.5
The Leu bias plot shows units of measure on the y-axis ranging from 700 μmol/L blood to -700 μmol/L blood. The mean bias for this plot is -172.5 μmol/L blood. The bias plot shows distinct dif ferences between methods with some methods below the bias and some above.
-300
-200
-100
0
100
200
300
95% UL
EV
95% LL
x Bias
95% UL
EV
95% LL
x Bias
-700
-500
-300
-100
100
300
500
700

29
Figure 11. Reproducibility of Results:Bias Plot for Methionine (Met) Values by Method
Quarter 3, Specimen 31851Expected Value (EV) =204.4 µmol/L blood
Met µmol/L blood
Quarter 3
Enriched—200.4
CDC Assayed—195.6
Participant Mean—194.8
Participant Bias—- 9.6
The Met bias plot shows units of measure on the y-axis ranging from 200 μmol/L blood to -200 μmol/L blood. The mean bias for this plot is - 9.6 μmol/L blood. The data shows good scatter among all methods.
Figure 12. Reproducibility of Results:Phenylalanine (Phe) Values by Method
Quarter 1, Specimen 11851Expected Value (EV) = 285.0 µmol/L blood
Phe µmol/L blood
Quarter 1
Enriched—225.0
CDC Assayed—250.9
Participant Mean—257.0
Participant Bias—- 28.0
The Phe bias plot shows units of measure on the y-axis ranging from 300 µmol/L blood to -300 µmol/L blood. The bias for this plot is - 28.0 µmol/L blood. The Phe bias plot shows good agreement between and among methods.
95% UL
EV
95% LL
x Bias
-200
-150
-100
-50
0
50
100
150
200
95% UL
EV
95% LL
x Bias
-300
-200
-100
0
100
200
300
30
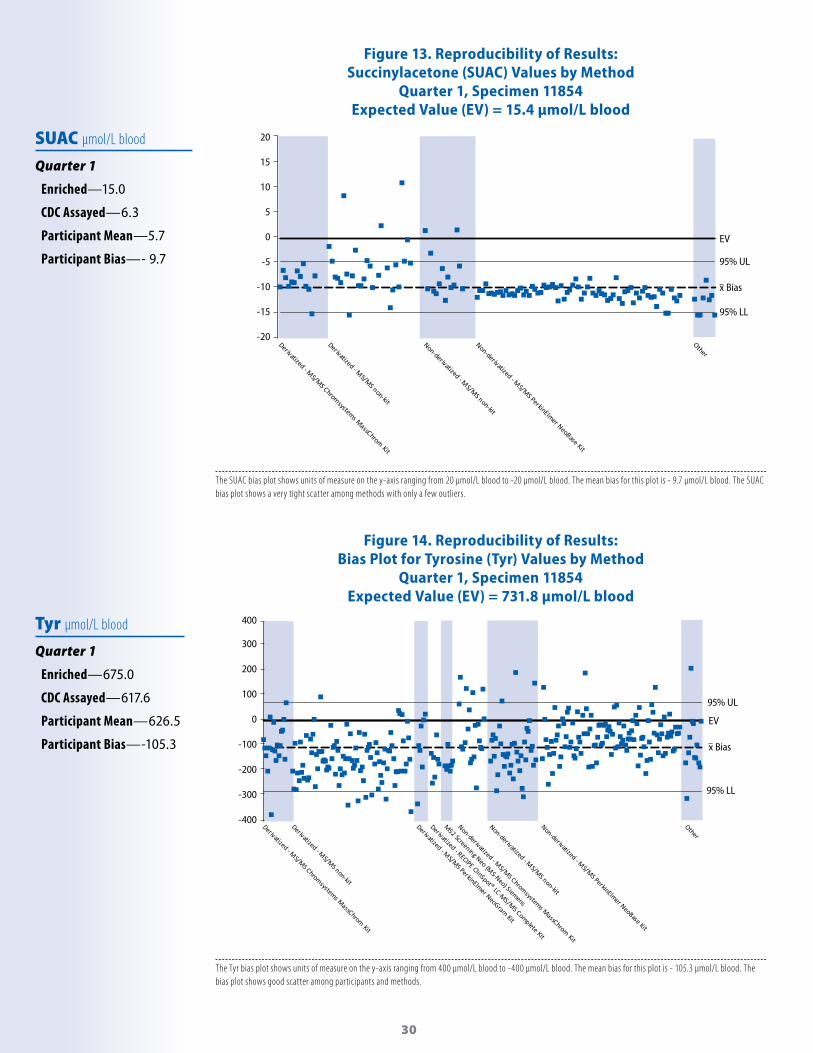
Figure 13. Reproducibility of Results:Succinylacetone (SUAC) Values by Method
Quarter 1, Specimen 11854Expected Value (EV) = 15.4 µmol/L blood
SUAC µmol/L blood
Quarter 1
Enriched—15.0
CDC Assayed—6.3
Participant Mean—5.7
Participant Bias—- 9.7
The SUAC bias plot shows units of measure on the y-axis ranging from 20 μmol/L blood to -20 μmol/L blood. The mean bias for this plot is - 9.7 μmol/L blood. The SUAC bias plot shows a very tight scatter among methods with only a few outliers.
Figure 14. Reproducibility of Results:Bias Plot for Tyrosine (Tyr) Values by Method
Quarter 1, Specimen 11854Expected Value (EV) = 731.8 µmol/L blood
Tyr µmol/L blood
Quarter 1
Enriched—675.0
CDC Assayed—617.6
Participant Mean—626.5
Participant Bias—-105.3
The Tyr bias plot shows units of measure on the y-axis ranging from 400 μmol/L blood to -400 μmol/L blood. The mean bias for this plot is - 105.3 μmol/L blood. The bias plot shows good scatter among participants and methods.
95% UL
EV
95% LL
x Bias
-20
-15
-10
-5
0
5
10
15
20
95% UL
EV
95% LL
x Bias
-400
-300
-200
-100
0
100
200
300
400

31
Figure 15. Reproducibility of Results:Bias Plot for Valine (Val) Values by Method
Quarter 3, Specimen 31854Expected Value (EV) = 629.1 µmol/L blood
Val µmol/L blood
Quarter 3
Enriched—604.1
CDC Assayed—646.3
Participant Mean—624.5
Participant Bias—- 4.61
The Val bias plot shows units of measure on the y-axis ranging from 400 μmol/L blood to -400 μmol/L blood. The mean bias for this plot is -4.61 μmol/L blood. The Val bias plot shows good scatter among all participants and methods.
Figure 16. Reproducibility of Results:Bias Plot of Free Carnitine(C0(L)) Values by Method
Quarter 3, Specimen 31865Expected Value (EV) = 41.51 µmol/L blood
C0(L) µmol/L blood
Quarter 3
Enriched—31.56
CDC Assayed—46.16
Participant Mean—40.97
Participant Bias—-0.54
The C0(L) bias plot shows units of measure on the y-axis ranging from 55 μmol/L blood to -55 μmol/L blood. The mean bias for this plot is - 0.54 μmol/L blood. The bias for this specimen is very close the to the CDC expected value and there is tight scatter among all methods.
95% UL
EV
95% LL
x Bias
-400
-300
-200
-100
0
100
200
300
400
EV
95% UL
95% LL
x Bias
-55.0
-45.0
-35.0
-25.0
-15.0
-5.0
5.0
15.0
25.0
35.0
45.0
55.0
32
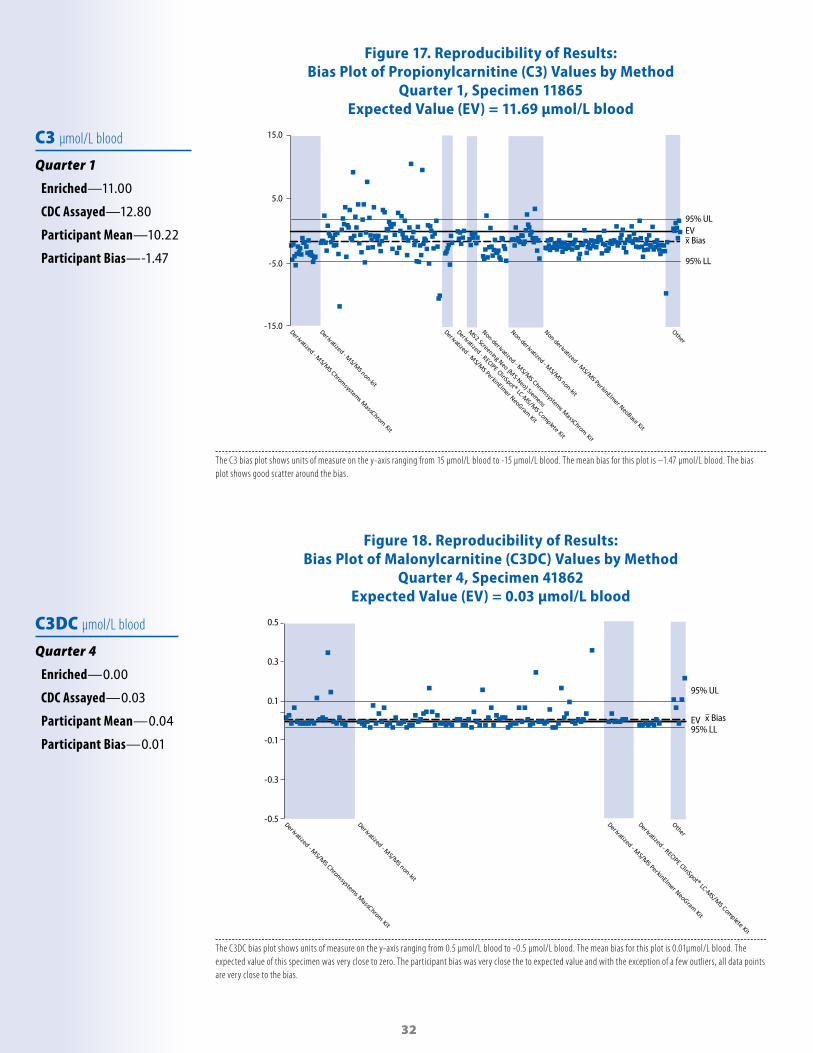
Figure 17. Reproducibility of Results:Bias Plot of Propionylcarnitine (C3) Values by Method
Quarter 1, Specimen 11865Expected Value (EV) = 11.69 µmol/L blood
C3 µmol/L blood
Quarter 1
Enriched—11.00
CDC Assayed—12.80
Participant Mean—10.22
Participant Bias—-1.47
The C3 bias plot shows units of measure on the y-axis ranging from 15 μmol/L blood to -15 μmol/L blood. The mean bias for this plot is –1.47 μmol/L blood. The bias plot shows good scatter around the bias.
Figure 18. Reproducibility of Results:Bias Plot of Malonylcarnitine (C3DC) Values by Method
Quarter 4, Specimen 41862Expected Value (EV) = 0.03 µmol/L blood
C3DC µmol/L blood
Quarter 4
Enriched—0.00
CDC Assayed—0.03
Participant Mean—0.04
Participant Bias—0.01
The C3DC bias plot shows units of measure on the y-axis ranging from 0.5 μmol/L blood to -0.5 μmol/L blood. The mean bias for this plot is 0.01µmol/L blood. The expected value of this specimen was very close to zero. The participant bias was very close the to expected value and with the exception of a few outliers, all data points are very close to the bias.
95% ULEV
95% LL
x Bias
-15.0
-5.0
5.0
15.0
C3DC
95% UL
EV95% LL
x Bias
-0.5
-0.3
-0.1
0.1
0.3
0.5
33
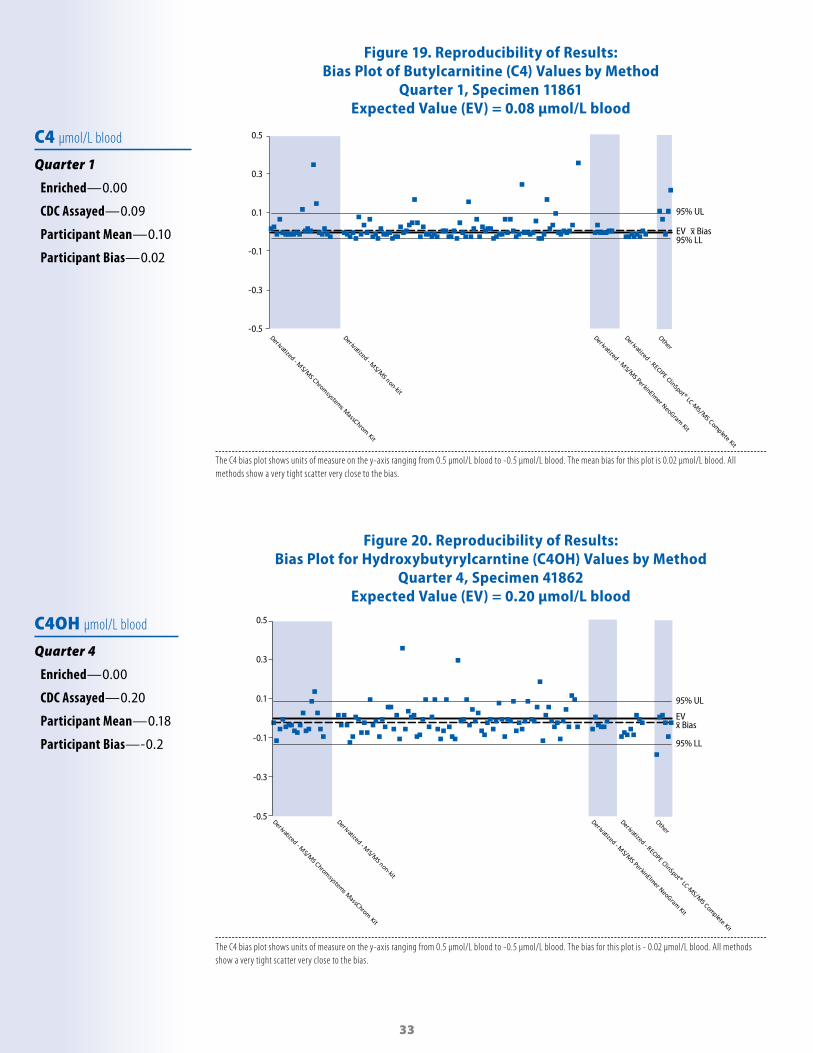
Figure 19. Reproducibility of Results:Bias Plot of Butylcarnitine (C4) Values by Method
Quarter 1, Specimen 11861Expected Value (EV) = 0.08 µmol/L blood
C4 µmol/L blood
Quarter 1
Enriched—0.00
CDC Assayed—0.09
Participant Mean—0.10
Participant Bias—0.02
The C4 bias plot shows units of measure on the y-axis ranging from 0.5 μmol/L blood to -0.5 μmol/L blood. The mean bias for this plot is 0.02 µmol/L blood. All methods show a very tight scatter very close to the bias.
Figure 20. Reproducibility of Results:Bias Plot for Hydroxybutyrylcarntine (C4OH) Values by Method
Quarter 4, Specimen 41862Expected Value (EV) = 0.20 µmol/L blood
C4OH µmol/L blood
Quarter 4
Enriched—0.00
CDC Assayed—0.20
Participant Mean—0.18
Participant Bias—-0.2
The C4 bias plot shows units of measure on the y-axis ranging from 0.5 μmol/L blood to -0.5 μmol/L blood. The bias for this plot is - 0.02 μmol/L blood. All methods show a very tight scatter very close to the bias.
95% UL
EV95% LL
x Bias
-0.5
-0.3
-0.1
0.1
0.3
0.5
95% UL
EV
95% LL
x Bias
-0.5
-0.3
-0.1
0.1
0.3
0.5

34
Figure 21. Reproducibility of Results:Bias Plot for Isovalerylcarnitine (C5) Values by Method
Quarter 3, Specimen 31863Expected Value (EV) = 2.99 µmol/L blood
C5 µmol/L blood
Quarter 3
Enriched—2.92
CDC Assayed—3.13
Participant Mean—2.78
Participant Bias—-0.21
The C5 bias plot shows units of measure on the y-axis ranging from 2 μmol/L blood to -2 μmol/L blood. The mean bias for this plot is -0.21 μmol/L blood. The C5 plot shows a good scatter close to the bias for all methods.
Figure 22. Reproducibility of Results:Bias Plot for Tiglylcarnitine (C5:1) Values by Method
Quarter 1, Specimen 11861Expected Value (EV) = 0.01 µmol/L blood
C5:1 µmol/L blood
Quarter 1
Enriched—0.00
CDC Assayed—0.01
Participant Mean—0.02
Participant Bias—0.01
The C5:1 bias plot shows units of measure on the y-axis ranging from 0.3 μmol/L blood to -0.3 μmol/L blood. The mean bias for this plot is 0.01 µmol/L blood. The expected value of this specimen was very close to zero. The participant bias was very close the to expected value and with the exception of a few outliers, all data points are very close to the bias.
95% UL
EV
95% LL
x Bias
-2.0
-1.0
0.0
1.0
2.0
95% UL
EV95% LLx Bias
-0.3
-0.1
0.1
0.3
35
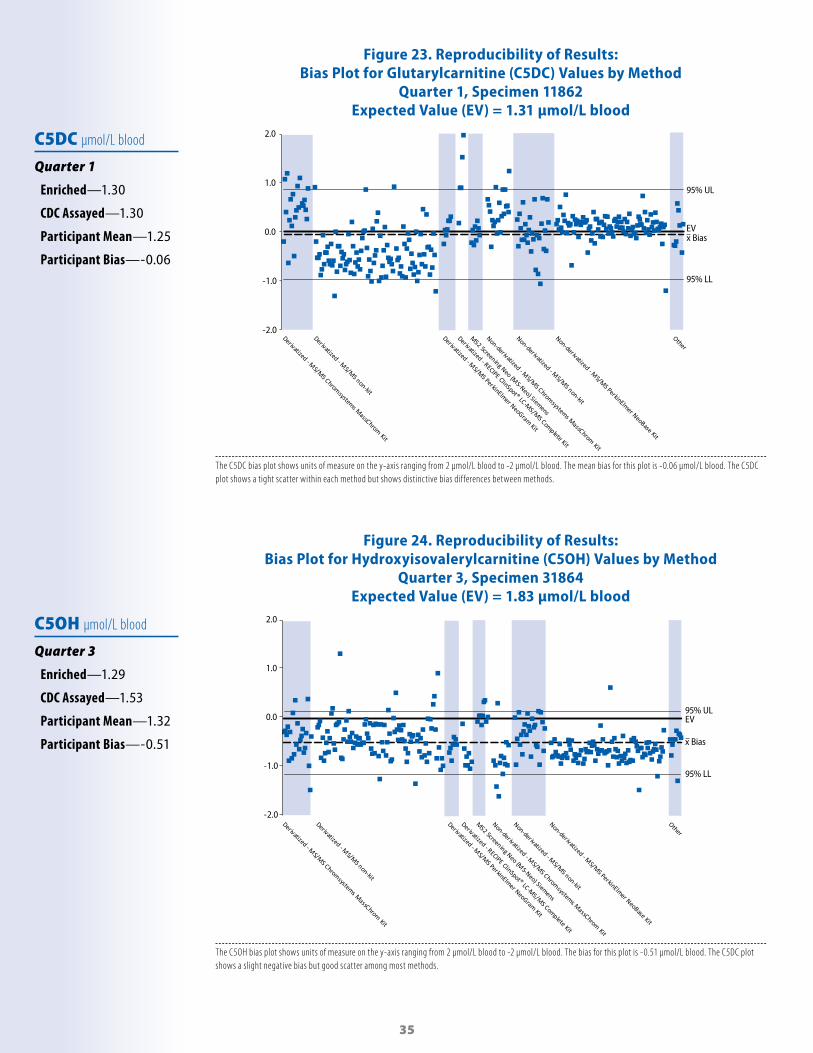
Figure 23. Reproducibility of Results:Bias Plot for Glutarylcarnitine (C5DC) Values by Method
Quarter 1, Specimen 11862Expected Value (EV) = 1.31 µmol/L blood
C5DC µmol/L blood
Quarter 1
Enriched—1.30
CDC Assayed—1.30
Participant Mean—1.25
Participant Bias—-0.06
The C5DC bias plot shows units of measure on the y-axis ranging from 2 μmol/L blood to -2 μmol/L blood. The mean bias for this plot is -0.06 μmol/L blood. The C5DC plot shows a tight scatter within each method but shows distinctive bias dif ferences between methods.
Figure 24. Reproducibility of Results:Bias Plot for Hydroxyisovalerylcarnitine (C5OH) Values by Method
Quarter 3, Specimen 31864Expected Value (EV) = 1.83 µmol/L blood
C5OH µmol/L blood
Quarter 3
Enriched—1.29
CDC Assayed—1.53
Participant Mean—1.32
Participant Bias—-0.51
The C5OH bias plot shows units of measure on the y-axis ranging from 2 μmol/L blood to -2 μmol/L blood. The bias for this plot is -0.51 μmol/L blood. The C5DC plot shows a slight negative bias but good scatter among most methods.
95% UL
EV
95% LL
x Bias
-2.0
-1.0
0.0
1.0
2.0
95% ULEV
95% LL
x Bias
-2.0
-1.0
0.0
1.0
2.0

36
Figure 25. Reproducibility of Results:Bias Plot for Hexanoylcarnitine (C6) Values by Method
Quarter 3, Specimen 31862Expected Value (EV) = 1.54 µmol/L blood
C6 µmol/L blood
Quarter 3
Enriched—1.53
CDC Assayed—1.33
Participant Mean—1.31
Participant Bias—-0.23
The C6 bias plot shows units of measure on the y-axis ranging from 2 µmol/L blood to -2 µmol/L blood. The bias for this plot is -0.23 µmol/L blood. The plot shows a negative participant bias with good scatter among methods.
Figure 26. Reproducibility of Results:Bias Plot for Octanylcarnitine (C8) Values by Method
Quarter 1, Specimen 11861Expected Value (EV) = 1.63 µmol/L blood
C8 µmol/L blood
Quarter 1
Enriched—1.60
CDC Assayed—1.66
Participant Mean—1.57
Participant Bias—-0.06
The C8 bias plot shows units of measure on the y-axis ranging from 2 µmol/L blood to -2 µmol/L blood. The bias for this plot is -0.06 µmol/L blood. The participant bias is very close to the CDC expected value and there is good scatter among methods.
95% UL
EV95% LL
x Bias
-2.0
-1.0
0.0
1.0
2.0
95% UL
EV
95% LL
x Bias
-2.0
-1.0
0.0
1.0
2.0

37
Figure 27. Reproducibility of Results:Bias Plot for Decanoylcarnitine (C10) Values by Method
Quarter 1, Specimen 11861Expected Value (EV) = 0.81 µmol/L blood
C10 µmol/L blood
Quarter 1
Enriched—0.00
CDC Assayed—0.80
Participant Mean—0.74
Participant Bias—-0.07
The C10 bias plot shows units of measure on the y-axis ranging from 2 µmol/L blood to -2 µmol/L blood. The bias for this plot is -0.07 µmol/L blood. One method shows a distinct negative bias. The other methods show good scatter around the bias.
Figure 28. Reproducibility of Results:Bias Plot for Decenoylcarnitine (C10:1) Values by Method
Quarter 1, Specimen 11861Expected Value (EV) = 0.52 µmol/L blood
C10:1 µmol/L blood
Quarter 1
Enriched—0.50
CDC Assayed—0.58
Participant Mean—0.49
Participant Bias—-0.03
The C10:1 bias plot shows units of measure on the y-axis ranging from 1 μmol/L blood to -1 μmol/L blood. The bias for this plot is -0.03 μmol/L blood. On the C10:1 bias plot, there is good agreement within methods but some methods show a positive bias and others show a negative bias.
95% ULEV
95% LL
x Bias
-2.0
-1.0
0.0
1.0
2.0
95% UL
EV
95% LL
x Bias
-1.0
0.0
1.0

38
Figure 29. Reproducibility of Results:Bias Plot of Decadienoylcarnitine (C10:2) Values by Method
Quarter 3, Specimen 31862Expected Value (EV) = 0.00 µmol/L blood
C10:2 µmol/L blood
Quarter 3
Enriched—0.00
CDC Assayed—0.00
Participant Mean—0.01
Participant Bias—0.01
The C10:2 bias plot shows units of measure on the y-axis ranging from 0.5 μmol/L blood to -0.5 μmol/L blood. The bias for this plot is 0.01 μmol/L blood. The expected value of this specimen was very close to zero and the participant bias was very close the to expected value. With the exception of a few outliers, all data points are very close to the bias.
Figure 30. Reproducibility of Results:Bias Plot for Myristoylcarnitine (C14) Values by Method
Quarter 1, Specimen 11864Expected Value (EV) = 1.34 µmol/L blood
C14 µmol/L blood
Quarter 1
Enriched—1.30
CDC Assayed—1.18
Participant Mean—1.11
Participant Bias—-0.23
The C14 bias plot shows units of measure on the y-axis ranging from 1 μmol/L blood to -1 μmol/L blood. The bias for this plot is -0.23 μmol/L blood. The C14 plot shows a slight negative bias and the majority of data points are below the bias.
95% UL
EV95% LL
x Bias
-0.5
0.5
-1.0
0.0
1.0
39
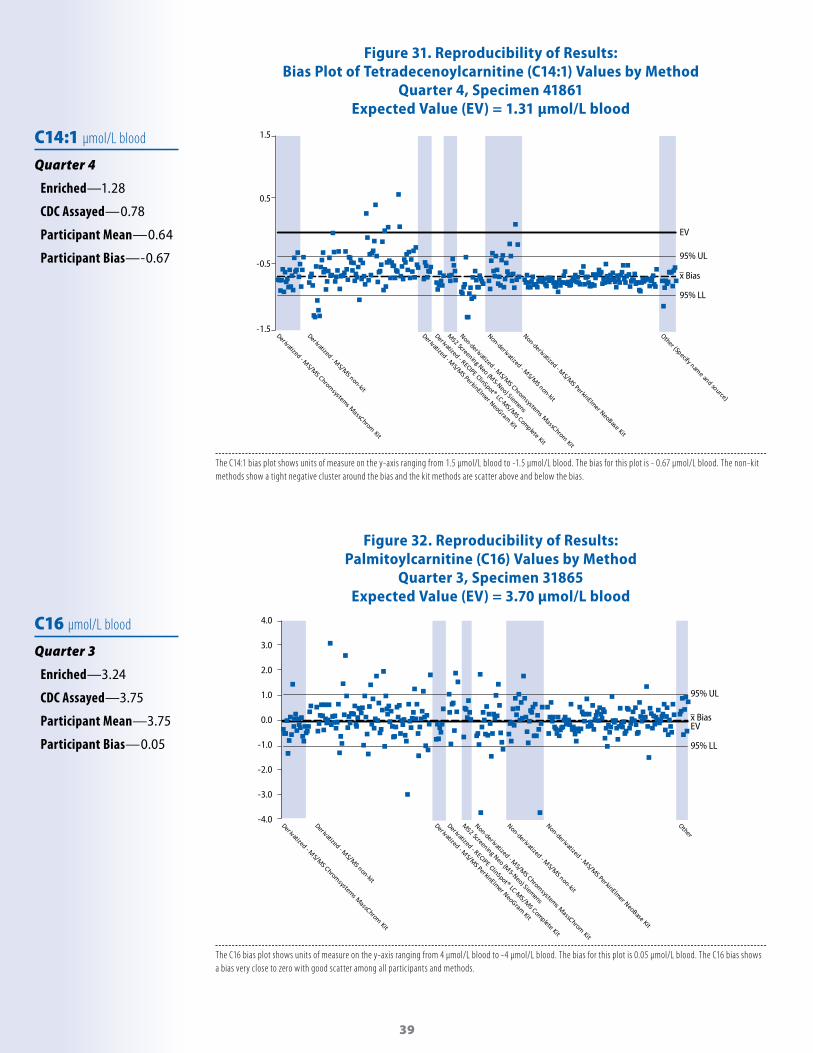
Figure 31. Reproducibility of Results:Bias Plot of Tetradecenoylcarnitine (C14:1) Values by Method
Quarter 4, Specimen 41861Expected Value (EV) = 1.31 µmol/L blood
C14:1 µmol/L blood
Quarter 4
Enriched—1.28
CDC Assayed—0.78
Participant Mean—0.64
Participant Bias—-0.67
The C14:1 bias plot shows units of measure on the y-axis ranging from 1.5 μmol/L blood to -1.5 μmol/L blood. The bias for this plot is - 0.67 μmol/L blood. The non-kit methods show a tight negative cluster around the bias and the kit methods are scatter above and below the bias.
Figure 32. Reproducibility of Results:Palmitoylcarnitine (C16) Values by Method
Quarter 3, Specimen 31865Expected Value (EV) = 3.70 µmol/L blood
C16 µmol/L blood
Quarter 3
Enriched—3.24
CDC Assayed—3.75
Participant Mean—3.75
Participant Bias—0.05
The C16 bias plot shows units of measure on the y-axis ranging from 4 μmol/L blood to -4 μmol/L blood. The bias for this plot is 0.05 μmol/L blood. The C16 bias shows a bias very close to zero with good scatter among all participants and methods.
95% UL
EV
95% LL
x Bias
-1.5
-0.5
0.5
1.5
95% UL
EV
95% LL
x Bias
-4.0
-3.0
-2.0
-1.0
0.0
1.0
2.0
3.0
4.0

40
Figure 33. Reproducibility of Results:Hydroxypalmitoycarnitine (C16OH) Values by Method
Quarter 4, Specimen 41861Expected Value (EV) = 1.40 µmol/L blood
C16OH µmol/L blood
Quarter 4
Enriched—1.39
CDC Assayed—1.39
Participant Mean—0.92
Participant Bias—-0.48
The C16OH bias plot shows units of measure on the y-axis ranging from 1.5 μmol/L blood to -1.5 μmol/L blood. The bias for this plot is - 0.48 μmol/L blood. The C16OH bias plot demonstrates scatter among all methods with most laboratories showing a negative bias.
Figure 34. Reproducibility of Results:Bias Plot for Stearoylcarnitine (C18) Values by Method
Quarter 3, Specimen 31865Expected Value (EV) = 1.73 µmol/L blood
C18 µmol/L blood
Quarter 3
Enriched—1.29
CDC Assayed—1.37
Participant Mean—1.40
Participant Bias—-0.33
The C18 bias plot shows units of measure on the y-axis ranging from 1.5 μmol/L blood to -1.5 μmol/L blood. The bias for this plot is -0.33 μmol/L blood. The C18 bias plot shows reasonable scatter of values within and among methods while showing a slight negative bias.
95% ULEV
95% LL
x Bias
-1.5
-0.5
0.5
1.5
95% UL
EV
95% LL
x Bias
-1.5
-0.5
0.5
1.5

41
Figure 35. Reproducibility of Results:Bias Plots for Oleoylcarnitine (C18:1) Values by Method
Quarter 1, Specimen 11865Expected Value (EV) = 0.84 µmol/L blood
C18:1 µmol/L blood
Quarter 1
Enriched—0.00
CDC Assayed—0.85
Participant Mean—0.78
Participant Bias—-0.06
The C18 bias plot shows units of measure on the y-axis ranging from 1 μmol/L blood to -1 μmol/L blood. The mean bias for this plot is -0.06 µmol/L blood. The C18 bias plot shows reasonable scatter of values within and among methods while showing a slight negative bias.
Figure 36. Reproducibility of Results:Bias Plot of Hydroxystearoylcarnitine (C18OH) Values by Method
Quarter 4, Specimen 41861Expected Value (EV) = 1.47 µmol/L blood
C18OH µmol/L blood
Quarter 4
Enriched—1.46
CDC Assayed—0.85
Participant Mean—0.83
Participant Bias—-0.64
The C18OH bias plot shows units of measure on the y-axis ranging from 2 µmol/L blood to -2 µmol/L blood. The bias for this plot is - 0.64 µmol/L blood. The C18OH plot shows a negative bias with all methods clustered around the bias.
95% UL
EV
95% LL
x Bias
C18OH
-2.0
-1.0
0.0
1.0
2.0
95% UL
EV
95% LL
x Bias
-1.0
0.0
1.0

42
Appendix for Accessibility DescriptionsFigure 2: NSQAP’s Grading Algorithm Flow chart.
1. PART 1 is in a square box and makes the statement, “COMPARE NSQAP EXPECTED VALUE TO NSQAP CUTOFF VALUE TO DETERMINE NSQAP EXPECTED CLINICAL ASSESSMENT”.
2. A down arrow points to an oval shape and asks the question, “DOES PARTICIPANT REPORTED CLINICAL ASSESSMENT DIFFER FROM NSQAP EXPECTED CLINICAL ASSESSMENT?”
3. A right side arrow from the oval points to a smaller oval with the statement, “IF “NO:” NO ERROR”4. A down arrow from the oval contains a solid oval within it, and the words, “IF ‘YES’”. The down arrow points to PART
2 in a square box that says “PART 2 COMPARE NSQAP EXPECTED VALUE TO PARTICIPANT REPORTED CUTOFF VALUE TO DETERMINE PARTICIPANT EXPECTED CLINICAL ASSESSMENT”
5. A down arrow points to PART 3 in an oval shape and asks the question, “DOES PARTICIPANT REPORTED CLINICAL ASSESSMENT DIFFER FROM PARTICIPANT EXPECTED CLINICAL ASSESSMENT?”
6. A right side arrow from the oval points to a smaller oval with the statement, “IF “NO:” CUTOFF DIFFERENCE COMMENT”
Figures 5–38, Bias Plots: Bias plots, which compare two measurements of the same variable, have been created to show a wide range of PT challenge specimens. The bias, which is calculated by subtracting the participant mean value from the CDC Expected Value (EV), is represented by the broken line. Expected Value is the sum of the endogenous plus the enrichment values. The solid line represents perfect agreement with the EV or zero bias. When comparing data scatter among figures, the scale (y-axis) might differ. We included the 95% confidence interval for the mean participant bias. A tight scatter within this interval indicates good performance for a method or a group of methods. To illustrate any method-related differences in analyte recoveries, we group the PT quantitative results by kit or method. Because some of the pools in a routine PT survey represent a unique donor specimen, differences in endogenous materials in the donor specimens might influence method-related differences. We show representative bias plots for all those analytes distributed in PT challenges that required a quantitative measurement to determine the presumptive clinical assessments.
References[1] Newborn Screening: Towards a Uniform Screening Panel and System.” Genetic Medicine 2006;8(5) Suppl: S12–S252, as authored by the American College of Medical Genetics and commissioned by the Health Resources and Services Administration.
[2] De Jesús VR, Mei JV, Cordovado SK, Cuthbert CD. The Newborn Screening Quality Assurance Program at the Centers for Disease Control and Prevention: Thirty-Five Year Experience Assuring Newborn Screening Laboratory Quality. International Journal of Newborn Screening 2015,1; 13-26.
[3] Clinical and Laboratory Standards Institute. Blood collection on filter paper for newborn screening programs: Approved Standard—Sixth Edition. CLSI Document NBS01-A6. Wayne, PA: Clinical and Laboratory Standards Institute; 2014.

43
AcknowlegmentsThis NEWBORN SCREENING QUALITY ASSURANCE PROGRAM report is an internal publication distributed to program participants and selected program colleagues. The laboratory quality assurance program is a project cosponsored by the Centers for Disease Control and Prevention (CDC) and the Association of Public Health Laboratories.
CENTERS FOR DISEASE CONTROL AND PREVENTION (CDC) ATLANTA, GA 30341
DirectorRobert R. Redfield, M.D. DirectorNational Center for Environmental HealthPatrick Breysse, Ph.D.
DirectorDivision of Laboratory SciencesJames L. Pirkle, M.D., Ph.D.ChiefNewborn Screening and Molecular Biology BranchCarla Cuthbert, Ph.D.
ContributorsCarter Asef, BSNicole Baird, Ph.DJohn Bernstein, MSQuan Bui, MSSuzanne Cordovado, Ph.DPaul Dantonio, MSKatherine Duneman, MSSharon Flores, MSChristopher Greene, Ph.D Elizabeth Hall, BSLaura Hancock, MSChristopher Haynes, Ph.DJessica Hendricks, MS
Miyono Hendrix, MSLaura C. Hildreth, BSDeborah Koontz, Ph.DFrancis Lee, Ph.DLiXia Li, Ph.DTim Lim, Ph.DDaniel Mandel, Ph.DJoanne Mei, Ph.DKristina Mercer, Ph.DStanimila Nikolova, Ph.DGyliann Pena, MSKostas Petritis, Ph.DC. Austin Pickens, Ph.D
Blanche Temate, Ph.DE. Shannon Torres, Ph.DRobert Vogt, Ph.DIrene Williams, MSSophia Winchester, BSGolriz Yazdanpanah, MSSherri Zobel, BS
ProductionVinay Anumula, MSKizzy StewartJoy Pressley
ASSOCIATION OF PUBLIC HEALTH LABORATORIES SILVER SPRING, MD 20910PresidentJoanne Bartkus, PhDChairman, Newborn Screening and Genetics in Public Health CommitteeMichele Caggana, Sc.D., FACMGChairman, Newborn Screening Quality Assurance Quality Control SubcommitteePatricia R. Hunt, B.A. and Joseph Orsini, Ph.D.Chairman, Newborn Screening Molecular SubcommitteeRachel Lee, Ph.D.
INQUIRIES TO:Sherri Zobel, EditorCenters for Disease Control and Prevention (CDC), Newborn Screening Quality Assurance Program—Mailstop F-194770 Buford Highway, N.E., Atlanta, GA 30341-3724E-mail: [email protected]

44
Notes:

45
CS 3
0923
5-A
For more information please contact Centers for Disease Control and Prevention
1600 Clifton Road NE, Atlanta, GA 33029-4027Telephone: 1-800-CDC-INFO (232-4636)
TTY: 1-888-232-6348E-mail: [email protected]
Web: https://www.cdc.gov/labstandards/nsqap.htmlPublication date: September 2019