2017 water quality - moncton.ca$!26+sewer/waterqualityreport.pdf · 2017 annual water quality...
TRANSCRIPT

WATERQUALITY
annual report
2017
PANTONE3025
PANTONE1807
PANTONE7407

TABLE OF CONTENTS
LIST OF TABLES AND FIGURES ............................................................................................. 0
EXECUTIVE SUMMARY ........................................... ERROR! BOOKMARK NOT DEFINED.
ACRONYMS USED IN REPORT ................................................................................................ 3
INTRODUCTION .......................................................................................................................... 4
1. WHERE DOES OUR WATER COME FROM? ................................................................... 4
2. HOW DO WE PROTECT OUR SOURCE WATER? .......................................................... 5
3. HOW DO WE TREAT OUR WATER? ................................................................................. 5
3.1 COAGULATION & CLARIFICATION .......................................................................................... 6 3.2 FILTRATION ............................................................................................................................ 6 3.3 SOLID HANDLING FACILITIES ................................................................................................ 6 3.4 DISINFECTION AND CORROSION CONTROL ............................................................................. 6
4. HOW DO WE KNOW OUR WATER IS SAFE? .................................................................. 7
4.1 BACTERIOLOGICAL TESTING .................................................................................................. 7 4.2 CHEMICAL AND PHYSICAL TESTING (INORGANIC) ................................................................ 9 4.3 ORGANIC TESTING ............................................................................................................... 11 4.4 CHLORINE RESIDUAL ........................................................................................................... 11
5. HOW WILL WATER QUALITY BE MAINTAINED IN THE FUTURE? ..................... 12
5.1 CORROSION CONTROL .......................................................................................................... 12 5.2 BACKFLOW PREVENTION ..................................................................................................... 12 5.3 REHABILITATION AND RENEWAL OF THE DISTRIBUTION SYSTEM ...................................... 13 5.4 WATER LOSS CONTROL/WATER CONSERVATION................................................................. 14
6. SUMMARY ............................................................................................................................. 16
LIST OF TABLES AND FIGURES
FIGURE 1: AERIAL VIEW OF THE TURTLE CREEK RESERVOIR ....................................................................... 4
FIGURE 2: MONCTON’S WATER TREATMENT PLANT PROCESS ..................................................................... 5
FIGURE 3: MONCTON WATER TREATMENT PLANT ....................................................................................... 7
TABLE 1: 2017 BACTERIA TEST RESULTS ..................................................................................................... 8
TABLE 2: 2017 INORGANIC TEST RESULTS ................................................................................................. 10
FIGURE 4: WATER QUALITY CONTROL ....................................................................................................... 11
TABLE 3: 2017 BACKFLOW PREVENTION DEVICES ..................................................................................... 13
FIGURE 5: WATERMAIN VALVE INSTALLATION .......................................................................................... 14
FIGURE 6: TRI-COMMUNITY WATER CONSUMPTION .................................................................................. 14
FIGURE 7: WATERMAIN BREAK HISTORY ................................................................................................... 15
FIGURE 8: WATER SERVICE LEAK HISTORY ............................................................................................... 15
APPENDIX 1: 2017 WATER FLOW REPORT ………………………………………………………………. 16

2017 Annual Water Quality Report Moncton/Riverview/Dieppe
1
EXECUTIVE SUMMARY
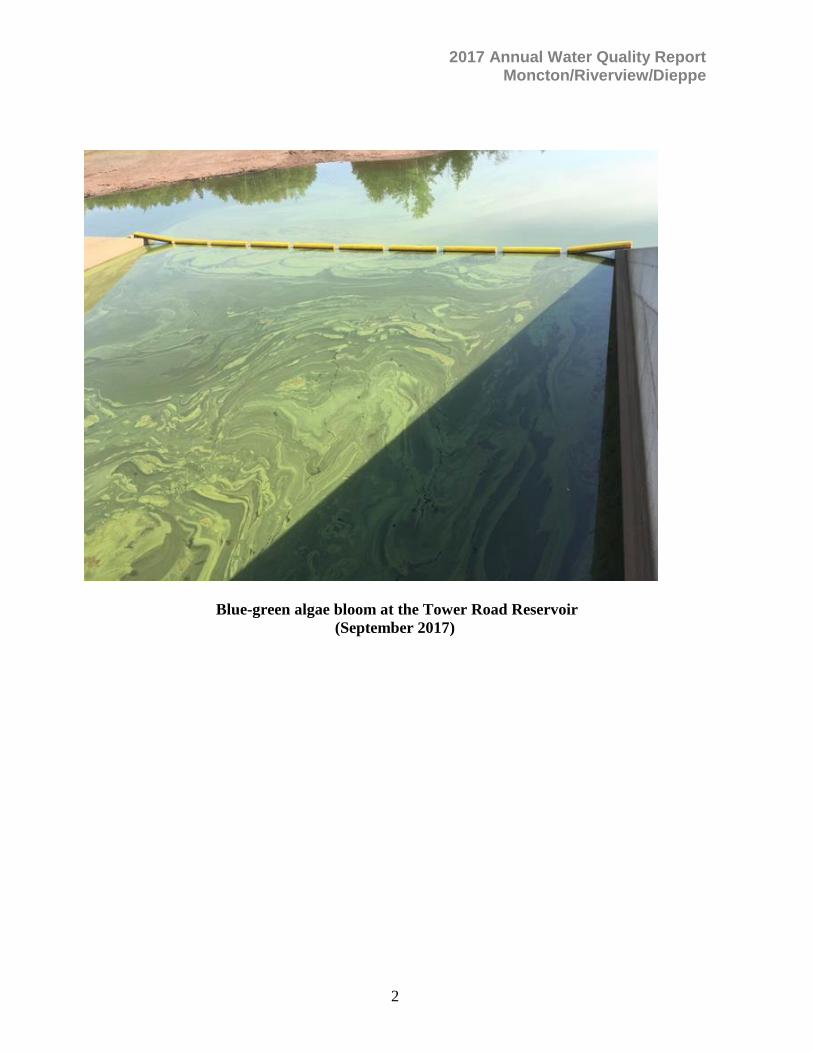
This report summarizes the 2017 water quality monitoring and testing by the City of Moncton utility staff for the Moncton/Riverview/Dieppe service area and outlines various initiatives designed for long term sustainability of the water supply and delivery system. The City of Moncton is dedicated to delivering high quality tap water to over 110,000 tri-community residences. Our treatment standards meet or exceed all Provincial and Federal health related guidelines. Included in this report is a summary of more than 1700 test results, showing that all guidelines were met or surpassed indicating the high quality and safety of our drinking water. In 2017, all water samples complied with the Guidelines for Canadian Drinking Water Quality. This past year, the Turtle Creek Reservoir and Moncton Water Treatment Plant supplied 16,122 million cubic metres of treated water to the tri-community; an average of 44,170 cubic metres per day, down about 1.6% from the 2016 production. No water shortage was experienced in 2017 despite a warm dry summer and fall. The Turtle Creek reservoir was maintained at a near full condition throughout the year in part to the upstream Tower Road reservoir which, by late September, was down almost 6 metres to 50% of its full capacity. The Mapleton Well Supply functioned very well in 2017 providing excellent quality water to the residents of Mapleton Place Subdivision. In order to provide the tri-community residents with the best water quality possible, Moncton, Riverview, Dieppe and the Water Treatment Plant are required to meet performance standards in the areas of system reliability, water quality and safety. All communities must operate under Certificates of Approval to Operate from the Provincial Department of Environment. Of 34 watermain breaks in 2017, there were 4 large diameter pipe failures, the worst of which was a longitudinal break on Edgett Avenue on January 10, 2017. This major break caused a significant loss of water pressure in the northwest boosted zone and resulted in a precautionary boil water advisory being issued for the entire zone. The City of Moncton’s infrastructure improvements continued in 2017 with the replacement/ rehabilitation of approximately 3.7 kilometres of watermain. On September 12, 2017 a bloom of blue-green algae was detected in the Tower Road Reservoir at Turtle Creek. This historically is the first such bloom on the Turtle Creek system and is a cause for concern as blue-green algae can release harmful toxins into the water that create challenges at the downstream water treatment plant. The situation was carefully monitored for a six week period at which point the algae died off and became non-detectable. Studies are on-going on how best to mitigate impacts of a similar or more severe occurrence in the future. The Tri-community Water Action Committee continues to meet semi-annually to discuss issues of mutual concern, initiate “best management practices” and exchange information with the provincial regulators.
2017 Annual Water Quality Report Moncton/Riverview/Dieppe
2
Blue-green algae bloom at the Tower Road Reservoir
(September 2017)

2017 Annual Water Quality Report Moncton/Riverview/Dieppe
3
ACRONYMS USED IN REPORT
E. coli – Escherichia coli TC - Total Coliform HPC – Heterotrophic Plate Count THM – Trihalomethane AO – Aesthetic Objective n/a – not applicable MDL – Method Detection Limit MAC – Maximum Acceptable Concentration NTU – Nephelometric Turbidity Units µS/cm – microsiemens per centimetre mg/l – milligrams per litre µg/l – micrograms per litre TCU – True Color Units ND – Not Detected AWWA – American Water Wastewater Association IWA – International Water Association

2017 Annual Water Quality Report Moncton/Riverview/Dieppe
4
INTRODUCTION
The City of Moncton is committed to providing clean, safe drinking water for the tri-community. The City in partnership with Dieppe, Riverview and the Moncton Water Treatment plant, utilize the “multi-barrier approach” to achieve this goal. The multi-barrier approach includes safeguards and redundancy on all processes and practices from the source to the consumer’s tap. Steps in the process include:
Source water protection
Excellent water treatment
Transmission and distribution security
Good operation and maintenance practices including adequate disinfection
Continuous monitoring and testing
A comprehensive backflow/cross-connection control program
All of these programs are aimed at protecting our drinking water for the health of our consumers.
1. WHERE DOES OUR WATER COME FROM?
The primary water supply for the tri-community comes from Turtle Creek, a surface water supply, located southwest of Moncton. Water from the Turtle Creek Reservoir is pumped to the Moncton Water Treatment Plant (WTP). Water then flows by gravity to the communities of Moncton, Riverview and Dieppe. Booster stations & storage tanks are required at several locations throughout the system to service higher elevations. The City of Moncton also operates a small well water system using UV (ultraviolet) disinfection as a treatment process. This small system supplies quality drinking water to the Mapleton Subdivision.
During 2017, the Turtle Creek Reservoir supplied an average of 44,170 cubic metres (9.7 million Imperial gallons) of water per day to the tri-community.
Figure 1: Aerial view of the Turtle Creek Reservoir

2017 Annual Water Quality Report Moncton/Riverview/Dieppe
5
2. HOW DO WE PROTECT OUR SOURCE WATER?
The Turtle Creek Reservoir is a designated watershed and protected under the N.B. Clean Water Act. The 17,000 hectares (42,500 acres or 170 km2) watershed is outside municipal boundaries; therefore, the Provincial Department of Environment and Local Government has the primary responsibility for its protection and to control activities within the watershed. The Greater Moncton District Planning Commission administers land use planning within the watershed. The City of Moncton has a reservoir caretaker and a forestry manager whose jobs include the protection of the watersheds. These employees manage activities within the watersheds, including filing reports of any violations of the Clean Water Act with the Department of Environment and Local Government for enforcement. The Turtle Creek Watershed Residents Committee, consisting of local residents, was established to open the lines of communication with the city and the province thus enabling discussion on issues of mutual concern, including preservation of water quality.
3. HOW DO WE TREAT OUR WATER?
The Moncton Water Treatment Plant is a class IV surface water treatment facility designed to provide an average daily flow of 68,200 cubic metres (15 million imperial gallons) a day. The peak capacity of the plant is 113,670 cubic metres (25 million Imperial gallons). Water from the Turtle Creek Reservoir passes through the plant, removing turbidity, colour, iron, and manganese and is then adjusted chemically so as to be less corrosive to metallic pipes.
Figure 2: Moncton’s Water Treatment Plant process
The Multi-stage treatment process is described in more detail in the following sub-sections.
Screens-removal of debris low lift pumping station Coagulation &
Clarification
Filtration Chlorination & Corrosion
Control
Treated Water delivered to tri-communities
distribution systems by gravity

2017 Annual Water Quality Report Moncton/Riverview/Dieppe
6
3.1 COAGULATION & CLARIFICATION
Before the raw water enters the plant, it flows through screens to remove any debris. The first stage of the process is to add lime and alum to the raw water to help with particle removal. This process is called Coagulation. Just like a magnet attracts iron, alum draws particles together to form larger particles called floc which are easier to remove from the water through filtration. Once the floc is formed, a polymer is added to strengthen the floc before removal in the clarifiers and filters. During the warmest months of the year, when the manganese and iron are at their highest, the raw water coming from the Turtle Creek Reservoir is first dosed with potassium permanganate. Potassium permanganate oxidizes iron and manganese from the water, so they can be physically removed by clarifiers and filters. This also oxidizes organics that can cause taste and odour. The water is then gravity-fed to the one of the four clarifiers, where it flows up through four feet of small plastic beads, where 90-95% of the floc is removed.
3.2 FILTRATION
The remaining floc is removed by filtration through gravity multi-media filters. The multi-media filters consist of three granular materials of different size and specific density, layered in such a way to produce a filter that is coarse near the top of the bed and becomes progressively finer towards the bottom.
3.3 SOLID HANDLING FACILITIES
All the backwash water from washing the clarifiers and the filters is sent to the solids handling facilities, which consists of two large storage lagoons. Each lagoon has a detention time of one month. During that period, the solids in the water settle to the bottom and the clarified water eventually flows back out to Turtle Creek. The solids accumulate in the lagoon for a period of 4 to 5 years, before removal and final disposal at the sanitary landfill.
3.4 DISINFECTION AND CORROSION CONTROL
After clarification and filtration, the water then enters the clearwell where the final stage of the treatment process takes place before the water is sent through the distribution system. Even with a very low turbidity, the water still needs to be disinfected against waterborne pathogens or infection- and disease-causing microorganisms. Chlorine is added as a disinfectant to address viruses and bacteria, which cause human illnesses. Enough chlorine is being added to maintain a chlorine residual of 0.20 mg/L at the extremities of the distribution system. As part of the on-going Corrosion Control Program started in 1998, a product called “Aquamag” is added to the water. Aquamag is a food grade ortho/polyphosphate blend that acts as a corrosion inhibitor in the distribution system. Also as part of corrosion control, sodium hydroxide is added to neutralize the pH of the water to about 7.2.

2017 Annual Water Quality Report Moncton/Riverview/Dieppe
7
Figure 3: Moncton Water Treatment Plant
4. HOW DO WE KNOW OUR WATER IS SAFE?
Employees of the water department monitor approximately 60 sites throughout the distribution systems to ensure chlorine levels meet the minimum requirement. Special attention is given to sites that have traditionally experienced low water flow or are in dead-end locations in the water network. At these sites, water can sit for long periods and its quality can deteriorate. Routine flushing of these watermains keeps the water fresh at these locations. More than 1,700 water samples are tested every year to monitor water quality, and make corrections and adjustments where required. Thirty-four designated sites, throughout Riverview, Moncton, and Dieppe are chosen to be representative of the various pressure zones. Samples from these sites are subjected to bacteriological testing at an accredited laboratory weekly. These tests monitor the presence and concentration of chlorine residual, turbidity, total coliform (bacteria), E-Coli bacteria, and heterotrophic plate count bacteria (HPC) in the water system. Also, employees of the Moncton Water Department carry out inorganic and organic testing twice a year and quarterly respectively. The following sub-sections summarize the 2017 results of these many water quality tests.
4.1 BACTERIOLOGICAL TESTING The City of Moncton’s bacteriological sampling plan conducted weekly includes testing for HPC, total coliform and E.coli. HPC and total coliform are indicator tests that report specific groups of bacteriological activity in a sample. HPC is a count of all heterotrophic micro-organisms and is a measure of bacterial re-growth through the distribution system. This is a good monitor of disinfection efficiency and treatment plant performance. Although not regulated, the City of Moncton considers HPC counts greater than 500 cfu/ml to be excessive warranting re-sampling and investigation into possible causes.

2017 Annual Water Quality Report Moncton/Riverview/Dieppe
8
Total Coliform Bacteria (TC): Testing for bacteria after disinfection confirms the effectiveness of the disinfection process. Total coliform bacteria, without E-Coli, serve as indicators of an environment that may be susceptible to contamination. The source of bacteria, after initial disinfection, can be re-growth of bacteria from suspended materials in the water pipes or intrusion into the distribution system from a watermain break or backflow event. The MAC (Maximum Allowable Concentration) of total coliform bacteria allowed in water leaving a treatment plant is 0 cfu/100mL (coliform forming units). Water utility staff follow stringent procedures in the event that bacteria are detected. E-coli: The presence of E-coli bacteria indicates that the water may be contaminated with human or animal waste. Slight amounts of these contaminants can cause diarrhea, cramps, nausea, headaches, or fatigue. Certain strains of E-coli in larger amounts can be fatal for sensitive sub-populations. The maximum acceptable concentration is 0 cfu/100ml. No E-coli should be present in any sample.
Total
Coliform Bacteria
E. coli Bacteria
Heterotrophic Plate Count Bacteria
# of Samples
Positive TC Tests
Positive E. Coli Tests
# of Samples
Positive HPC Tests >10
cfu/ml
Samples with HPC
>500
January 170 0 0 136 5 0
February 136 0 0
March 136 0 0
April 136 0 0 136 7 0
May 170 0 0
June 136 0 0
July 136 0 0 136 13 0
August 170 0 0
September 136 0 0
October 170 0 0 136 11 0
November 136 0 0
December 136 0 0
Total 1768 0 0 544 18 0
Detection %
0.00% 0.00% 3.30% 0.00%
Table 1: 2017 Bacteria Test Results

2017 Annual Water Quality Report Moncton/Riverview/Dieppe
9
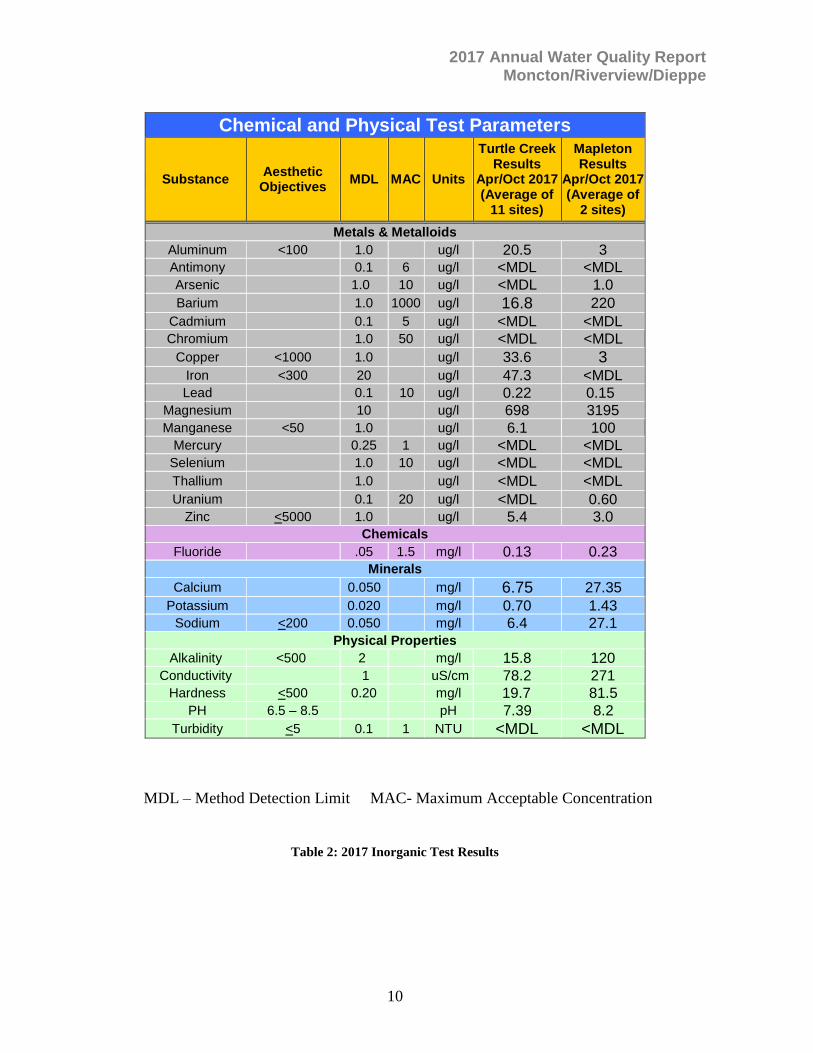
4.2 CHEMICAL AND PHYSICAL TESTING (INORGANIC)
Chemical and Physical Testing of the tri-community water is done twice each year. Table 2 shows the makeup of City water based on test results from April and October 2017. These are average results from eleven test sites. Turbidity: Turbidity levels in the reservoir at Turtle Creek are monitored regularly as the substances causing turbidity can shield bacteria from effective disinfection. Suspended matter such as clay, silt, finely divided organic and inorganic matter; soluble coloured organic compounds, plankton and other microscopic organisms cause turbidity in water. It is measured in NTU (Nephelometric Turbidity Units), which is a measure that relates to the optical property of water that causes light to be scattered and be absorbed rather than transmitted in straight lines through the sample. The maximum acceptable turbidity for water entering the distribution system is 0.3 NTU in at least 95% of measurements with no measurements exceeding 1.0 NTU. Control of turbidity in public drinking water supplies is important for both health and aesthetic reasons. Aesthetically, excessive turbidity detracts from the appearance of municipal water and has often been associated with unacceptable tastes and odours. From the public health aspect, these substances can serve as a source of nutrients for waterborne bacteria, viruses and protozoa. Turbidity can interfere with disinfection processes and the maintenance of chlorine residual.
The only method to reduce or eliminate turbidity is to filter the raw water. This is a primary role of the Moncton Water Treatment Plant. The finished water coming out of the water treatment plant and entering the distribution system has a turbidity of less than 0.1 NTU, well below the present maximum turbidity of 0.3 NTU. Besides improving water clarity and removing colour, filtration provides the added benefits of improved taste and odour while reducing chlorine requirements and tri-halomethane formation (organic compound described below). During 2017, turbidity levels were monitored weekly at 34 designated locations in the distribution systems. The average of over 1700 tests was 0.18 NTU. This very low turbidity indicates that high quality water is reaching consumers’ taps in all three communities.
2017 Annual Water Quality Report Moncton/Riverview/Dieppe
10
Chemical and Physical Test Parameters
Substance Aesthetic
Objectives MDL MAC Units
Turtle Creek Results
Apr/Oct 2017 (Average of
11 sites)
Mapleton Results
Apr/Oct 2017 (Average of
2 sites)
Metals & Metalloids
Aluminum <100 1.0 ug/l 20.5 3 Antimony 0.1 6 ug/l <MDL <MDL Arsenic 1.0 10 ug/l <MDL 1.0 Barium 1.0 1000 ug/l 16.8 220
Cadmium 0.1 5 ug/l <MDL <MDL Chromium 1.0 50 ug/l <MDL <MDL
Copper <1000 1.0 ug/l 33.6 3 Iron <300 20 ug/l 47.3 <MDL Lead 0.1 10 ug/l 0.22 0.15
Magnesium 10 ug/l 698 3195 Manganese <50 1.0 ug/l 6.1 100
Mercury 0.25 1 ug/l <MDL <MDL Selenium 1.0 10 ug/l <MDL <MDL Thallium 1.0 ug/l <MDL <MDL Uranium 0.1 20 ug/l <MDL 0.60
Zinc <5000 1.0 ug/l 5.4 3.0 Chemicals
Fluoride .05 1.5 mg/l 0.13 0.23 Minerals
Calcium 0.050 mg/l 6.75 27.35 Potassium 0.020 mg/l 0.70 1.43
Sodium <200 0.050 mg/l 6.4 27.1 Physical Properties
Alkalinity <500 2 mg/l 15.8 120 Conductivity 1 uS/cm 78.2 271 Hardness <500 0.20 mg/l 19.7 81.5
PH 6.5 – 8.5 pH 7.39 8.2 Turbidity <5 0.1 1 NTU <MDL <MDL
MDL – Method Detection Limit MAC- Maximum Acceptable Concentration
Table 2: 2017 Inorganic Test Results

2017 Annual Water Quality Report Moncton/Riverview/Dieppe
11
4.3 ORGANIC TESTING
Organic testing of the tri-community water is undertaken quarterly each year. Total Trihalomethanes (THMs): THMs are organic compounds formed in drinking water as a result of chlorination of organic matter present naturally in surface water supplies. The more organic matter, the more chlorine is needed to disinfect the water and the higher the likelihood of chlorination by-products, like THMs. To limit the development of THMs, the disinfection process is carefully controlled so that disinfection is effective, while keeping the levels of disinfection by-products as low as possible. The THM level is determined by using an annual running average based on quarterly samples. The MAC for THM’s is 0.1 milligrams per litre (mg/L). In 2017 the quarterly running average for 10 test locations was 0.043 mg/L which is less than half of the MAC. The construction of the Water Treatment Plant has had a positive effect on THM formation by removing the organic matter from the water and reducing the chlorine application rate. Regardless of the need to control the level of chlorination by-products such as THMs, Public Health authorities insist that water disinfection must never be compromised.
Figure 4: Water Quality Control
4.4 CHLORINE RESIDUAL
After filtration, chlorine is added at the Water Treatment Plant to kill any remaining harmful bacteria. Treated water leaving the plant has a chlorine concentration of approximately 1.2 mg/L. The chlorine concentration dissipates as the water travels through the distribution system to customers’ taps. Free chlorine residual, as it is called, protects the water from pathogenic bacteria which may find their way in the distribution system via leaks, water breaks, cross-connections, reservoirs and during construction and maintenance. Minimum chlorine residual is therefore essential in all parts of the distribution system to prevent bacteria from growing.
2017 Annual Water Quality Report Moncton/Riverview/Dieppe
12
When chlorine residuals are low (which occurs when chlorine is used by residues or sediments in the pipes or when the water sits in the system for longer than normal), a certain molecule that smells like household bleach can form. The objective of the water utility is to meet or exceed the Health Act requirement of 0.1 mg/L. On the other hand, an excess of chlorine residual may also lead to water with a chlorinous taste and odour, affecting the aesthetic quality of the water. Employees of the Moncton Water Department monitor the amount of chlorine residual at various parts of the system to ensure that the water is safe and meets the aesthetic objectives.
5. HOW WILL WATER QUALITY BE MAINTAINED IN THE FUTURE?
Moncton continues to monitor activities in the watershed in order to protect the source water. Several properties were purchased and cleaned up over the past year. Fine-tuning of water treatment at the Moncton Water Treatment Plant has resulted in consistent delivery of high quality drinking water to the tri-community. As an example, manganese removal efficiency was improved by relocating the potassium permanganate feed system from the water treatment plant to the low lift pumping station. The increased contact time has resulted in improved manganese removal. In the distribution system, a number of other significant efforts to improve water quality delivered to the consumer were initiated, enhanced or completed during 2017. They included:
Unidirectional flushing to clean and scour water lines
Enhanced programs to prevent pollutants from other sources - Backflow prevention and cross connection control program - Standard operating procedures for watermain repairs
Watermain renewals
5.1 CORROSION CONTROL
Filtering and treating the water at the reservoir is critically important to obtaining clean, clear water. Just as important is the cleaning and maintenance of the water pipes that distribute the water to homes and businesses. The corrosion control program reduces the contact water has with the interior lining of the pipes by producing a microscopically thin barrier on the inside of the pipes. It also neutralizes the acidic nature of the water, reducing its natural tendency to be corrosive. The program reduces leaching of metallic copper and lead from service lines and household plumbing as well as the oxidation of unlined iron water mains. On-going testing and monitoring verifies that corrosion has been reduced significantly.
5.2 BACKFLOW PREVENTION
A backflow event may occur when a pressure drop causes water to reverse in a service line to a customer. This reversed direction of water flow may allow contaminants to enter the drinking water system if cross-connections are present. In order to protect our municipal water supply from possible contamination, the City of Moncton has implemented a cross-connection control program. Its purpose is to identify existing or

2017 Annual Water Quality Report Moncton/Riverview/Dieppe
13
potential connections between the potable water system and any source of pollution or contamination. Once identified, the property owners and/or tenants are required to install an approved and testable device to prevent backflow. Properties are assessed on a risk basis, which in turn determines the priority in which action is required. Another aspect of the program is keeping records of all installed testable backflow prevention devices to ensure that they are tested on a yearly basis. The installation of backflow preventers on all known “severe” hazards has been completed. Moncton has now moved on to identifying moderate hazards. These include churches, apartment complexes, etc. Sprinkler systems in existing buildings are also being protected when renovations are undertaken. The following is an updated report on backflow devices installed:
Table 3: 2017 Backflow Prevention Devices
5.3 REHABILITATION AND RENEWAL OF THE DISTRIBUTION SYSTEM
The significant reduction of watermain breaks and service leaks that the City of Moncton has experienced in the last few years is attributed to the investment in replacing or repairing high-break-frequency water mains. In 2017, the City of Moncton upgraded approximately 3.7 km of existing water mains, including mains on Purdy Avenue, Albert Street, Lewis Street, Queen Street, and Winter Street,
Moncton Backflow Prevention Devices
Type of Device installed Percentage or # units installed in the City of
Moncton
Anti-Siphon Ball Cock 90% (of all toilets) Atmospheric Vacuum Breaker (Most Dishwashers)
Double Check Valve 2363
Flush Valve Vacuum Breaker 93% (commercial toilets &
urinals) Hose-Bibb Vacuum Breaker 80% Other Devices (Dual Check) 88% (pop machines, etc.) Pressure Vacuum Breaker 781 units
Reduced Pressure Backflow 2204 units Total Active Installed Devices 5348

2017 Annual Water Quality Report Moncton/Riverview/Dieppe
14
Figure 5: Watermain Valve Installation
5.4 WATER LOSS CONTROL/WATER CONSERVATION
Despite population growth, tri-community water consumption has been declining for a number of reasons. Water conservation initiatives, water saving appliances and fixtures, and smaller family sizes have all contributed to the reduction. In addition Moncton has seen several large commercial users reduce consumption for various reasons.
Figure 6: Tri-Community Water Consumption
02000400060008000
100001200014000160001800020000
Co
ns
um
pti
on
(cu
bic
me
ters
X
1,0
00
)
Year
Tri-community Water Consumption
Total Moncton Dieppe Riverview

2017 Annual Water Quality Report Moncton/Riverview/Dieppe
15
Over the past number of years, Moncton has accelerated its watermain replacement program by replacing “high break frequency” mains. The charts below show the history of annual number of watermain and water service breaks/leaks. These illustrate the effectiveness of the city’s watermain replacement/rehabilitation program.
Figure 7: Watermain Break History
Figure 8: Water Service Leak History
61 57
43 40 42
53 56
66
25 31
0
10
20
30
40
50
60
70
No
. o
f B
rea
ks
Year
Moncton Watermain Break History
80 81
61 57
51
73
54
65 59 61
0
10
20
30
40
50
60
70
80
90
# o
f R
ep
air
ed
Le
ak
s
Year
Moncton Water Service Leak Repair History

2017 Annual Water Quality Report Moncton/Riverview/Dieppe
16
In 2013, Moncton completed its second AWWA/IWA Water Audit and Balance which showed a significant reduction in water loss. This is an industry best practice, which helped to identify water losses both authorized and unauthorized. The completed study provided recommendations on how the city can control water losses into the future. Some of these recommendations have already been put in place and the city will continue with the implementation in 2018. Replacing aging infrastructure not only reduces water leakage but improves reliability and service to our customers. Conserving water reduces the quantity of wastewater requiring treatment. Customers play an important role in water efficiency by:
repairing leaking fixtures
replacing old appliances
minimizing duration of lawn watering
running full loads in your dishwasher and other appliances
turning off water when brushing teeth, etc. Visit www.moncton.ca for more tips on how to reduce your water consumption and therefore reduce your water bill.
6.0 SUMMARY
In summary, the former non-compliance areas of turbidity, bacteria, pH and trihalomethanes are now being addressed at the water treatment plant. Treatment has resulted in excellent quality water entering the distribution system. More permanent and/or long-term strategies presently being initiated with respect to cleaning, rehabilitation and replacement of the distribution system will help to ensure that the same quality water entering the system will be delivered at the customer's tap. Looking ahead to 2018, the City of Moncton has budgeted $3.0 million to make improvements to its water distribution system. The city will continue efforts to reduce water loss through district metering and leak detection on both the transmission and distribution systems. Additional information on drinking water quality is available from the Health Canada web site: www.hc-sc.gc.ca. For specific information on Moncton water, contact: Nicole Taylor, M.Eng., P.Eng Director of Utilities Ph: 506-859-2638 e-mail: [email protected]

2017 Annual Water Quality Report Moncton/Riverview/Dieppe
17
Appendix 1 – 2017 Flow Report
Month
Total
Flow
(X
1000
m3)
Daily
Avg.
(X
1000
m3)
Moncton
Gravity
(X 1000 m3)
Boosted Zones (X
1000 m3)
Moncton Total
(X 1000 m3) Dieppe(X 1000 m
3)Riverview (X 1000 m
3)
Maple
-ton
(X
1000
m3)
% HPSEdin-
burgh Total % Main
Harris-
villeTotal %
Cover-
daleSuffolk Total %
January 1,348 43.5 368 27.3% 409.0 173 582.0 857.0 63.6% 182.0 93.0 275.0 20.4% 164.0 52.0 216.0 16.0% 0.80
February 1,208 43.1 378 28.0% 325.0 161 486.0 776.0 64.2% 156.0 88.0 244.0 20.2% 143.0 45.0 188.0 15.6% 0.74
March 1,336 43.1 429 35.5% 351.0 176 527.0 860.0 64.4% 171.0 96.0 267.0 20.0% 159.0 50.0 209.0 15.6% 0.82
April 1,304 43.5 424 31.7% 331.0 171 502.0 834.0 64.0% 169.0 92.0 261.0 20.0% 158.0 51.0 209.0 16.0% 0.87
May 1,373 44.3 443 34.0% 368.0 184 552.0 895.0 65.2% 174.0 100.0 274.0 20.0% 158.0 46.0 204.0 14.9% 0.93
June 1,347 44.9 403 29.4% 376.0 196 572.0 874.0 64.9% 177.0 101.0 278.0 20.6% 150.0 45.0 195.0 14.5% 0.91
July 1,545 49.8 436 32.4% 450.0 207 657.0 954.0 61.7% 197.0 139.0 336.0 21.7% 195.0 60.0 255.0 16.5% 1.17
August 1,524 49.2 450 29.1% 423.0 202 625.0 940.0 61.7% 205.0 135.0 340.0 22.3% 190.0 54.0 244.0 16.0% 0.91
September 1,326 44.2 416 27.3% 374.0 176 550.0 855.0 64.5% 168.0 111.0 279.0 21.0% 151.0 41.0 192.0 14.5% 0.85
October 1,296 41.8 408 30.8% 352.0 175 527.0 837.0 64.6% 172.0 98.0 270.0 20.8% 148.0 41.0 189.0 14.6% 0.86
November 1,250 41.7 393 31.4% 340.0 173 513.0 818.0 65.4% 170.0 88.0 258.0 20.6% 138.0 36.0 174.0 13.9% 0.79
December 1,265 40.8 403 31.9% 321.0 176 497.0 816.0 64.5% 178.0 84.0 262.0 20.7% 143.0 44.0 187.0 14.8% 0.86
Total 16,122 4951 30.7% 4420 2170 6590 10,316 64.0% 2119 1225 3344 20.7% 1897 565 2462 15.3% 10.51
Daily Avg. 44.16 13.56 18.05 28.26 9.16 6.75 0.03