2017 full year results - bunzl/media/files/b/bunzl-plc/reports-and-presentations/... · financial...
TRANSCRIPT

FULL YEAR RESULTS FEBRUARY 2018
2017
2017 FULL YEAR RESULTS FEBRUARY 2018
INTRODUCTION: FRANK VAN ZANTEN CHIEF EXECUTIVE

HIGHLIGHTS
3
STRONG PICK UP IN ORGANIC GROWTH TO 4.3%
ADJUSTED EARNINGS PER SHARE* UP 13% AT ACTUAL EXCHANGE; 7% AT CONSTANT EXCHANGE
RECORD COMMITTED ACQUISITION SPEND OF £616m
* Before adjusting items (customer relationships amortisation and acquisition related items) and the associated taxation - see Appendix 2 and Appendix 3
DIVIDEND PER SHARE UP 10% 25 YEARS CONSECUTIVE GROWTH
2017 FULL YEAR RESULTS FEBRUARY 2018

4
FINANCIAL RESULTS: BRIAN MAY FINANCE DIRECTOR
2017 FULL YEAR RESULTS FEBRUARY 2018

7,8268,581
2,000
3,000
4,000
5,000
6,000
7,000
8,000
9,000
Revenue 2016* Organic growth Acquisitions Revenue 2017
£m
REVENUE GROWTH
Organic growth
4.3% Highest level since 2006
* At constant exchange rates
4.3% 5.3%
5
7.3%
2017 FULL YEAR RESULTS FEBRUARY 2018
9.6%

INCOME STATEMENT GROWTH
£m 2017 2016 REPORTED CONSTANT EXCHANGE
Revenue 8,580.9 7,429.1 16% 10%
Adjusted operating profit* 589.3 525.0 12% 6%
Operating margin* 6.9% 7.1%
Adjusting items◊ (133.3) (115.3)
Operating profit 456.0 409.7
Net finance expense (46.7) (46.8)
Adjusted profit before income tax* 542.6 478.2 13% 7%
Profit before income tax 409.3 362.9
* Before adjusting items (customer relationships amortisation and acquisition related items) – see Appendix 2 and Appendix 3 ◊ See Appendix 3
6 2017 FULL YEAR RESULTS FEBRUARY 2018

INCOME STATEMENT (CONTINUED)
GROWTH
£m 2017 2016 REPORTED CONSTANT EXCHANGE
Reported tax rate 24.1% 26.7%
Profit for the year 310.5 265.9
Basic earnings per share 94.2p 80.7p
Effective tax rate 27.5% 26.9%
Adjusted profit for the year* 393.4 349.6 13% 7%
Adjusted earnings per share* 119.4p 106.1p 13% 7%
Dividend per share 46.0p 42.0p 10%
* Before adjusting items (customer relationships amortisation and acquisition related items) and the associated taxation - see Appendix 2 and Appendix 3
7 2017 FULL YEAR RESULTS FEBRUARY 2018
2018 effective tax rate expected to be c. 24% (2017: 27.5%)

92 93 94 95 96 97 98 99 00 01 02 03 04 05 06 07 08 09 10 11 12 13 14 15 16 17
DIVIDEND PER SHARE (p)
of consecutive dividend increases
25 years
4.0
46.0
CAGR
> 10%
8 2017 FULL YEAR RESULTS FEBRUARY 2018

BALANCE SHEET
INTANGIBLES Increase from acquisitions of £557m partly offset by amortisation and exchange
WORKING CAPITAL Increase primarily from acquisitions, partly offset by exchange, with small underlying increase
NET DEBT Increase of £295m due to a net cash outflow of £334m, including £588m cash outflow on acquisitions, partly offset by gains from exchange translation of £39m
Return on average operating capital
53.1%
* See Appendix 4
£m DEC 17 DEC 16 Intangibles 2,351.7 1,947.6
Tangibles 125.2 123.3
Working capital 871.9 819.0
Other net liabilities (325.6) (264.7)
3,023.2 2,625.2
Pension deficit (51.0) (84.1)
Net debt* (1,523.6) (1,228.6)
Equity 1,448.6 1,312.5
Net debt : EBITDA 2.3x 2.0x
Return on average operating capital 53.1%
55.9%
9 2017 FULL YEAR RESULTS FEBRUARY 2018

CASH FLOW
Free cash flow
16%
* Before acquisition related items - see Appendix 5 ◊ Operating cash flow before acquisition related items to adjusted operating profit - see Appendix 2 and Appendix 5
£m 2017 2016 Operating cash flow* 569.7 521.9
Net interest (44.5) (43.2)
Tax (113.1) (123.2)
Free cash flow 412.1 355.5
Dividends (138.2) (125.4)
Acquisitions (588.5) (176.6)
Employee share schemes (19.4) (37.5)
Net cash flow (334.0) 16.0
Cash conversion◊ % 97% 99%
10 2017 FULL YEAR RESULTS FEBRUARY 2018

93% 95%92%
103%
92%
102%
93%
110%
93%
102%95% 97% 99% 97%
04 05 06 07 08 09 10 11 12 13 14 15 16 17
CASH CONVERSION
Average cash conversion*
97% TARGET 90%
* Operating cash flow before acquisition related items to adjusted operating profit – see Appendix 2 and Appendix 5 04 – 05 continuing operations only
11 2017 FULL YEAR RESULTS FEBRUARY 2018

USES OF FREE CASH FLOW 2004 – 2017
Consistently strong free cash flow supports long term growth
DIVIDENDS £1.1bn
6%†
ACQUISITIONS £3.0bn
14%†
DIVIDEND PER SHARE CAGR >10% STABLE DIVIDEND COVER c. 2.5x◊
151* ACQUISITIONS SINCE 2004 SELF-FUNDED
* Includes two acquisitions which were committed in 2017 but completed in January 2018 for which there was no cash outflow in 2017 ◊ Based on adjusted earnings per share
12 2017 FULL YEAR RESULTS FEBRUARY 2018

COMMITTED ACQUISITION SPEND
CASH CONVERSION**
DIVIDEND PER SHARE
ADJUSTED OPERATING PROFIT*
ORGANIC REVENUE GROWTH
FREE CASH FLOW
FINANCIAL SUMMARY
◊ At constant exchange rates * Before adjusting items (customer relationships amortisation and acquisition related items) and the associated taxation where relevant - see Appendix 2 and Appendix 3 ** Operating cash flow before acquisition related items to adjusted operating profit – see Appendix 2 and Appendix 5
REVENUE
16% 97% £616m
ADJUSTED EPS*
7%◊
13
10% 25 years of growth
10%◊
4.3% ◊ 6%◊ Highest in 11 years
2017 FULL YEAR RESULTS FEBRUARY 2018
ROACE
53.1%
Record level

BUSINESS REVIEW: FRANK VAN ZANTEN CHIEF EXECUTIVE
• Operations review • Prospects • Strategy
2017 FULL YEAR RESULTS FEBRUARY 2018

REVENUE BY CUSTOMER MARKETS
resilient Foodservice Grocery Cleaning & hygiene Healthcare
75%
Safety
3% 29%
27% 12%
12%
10%
7% Foodservice
Grocery
Retail
Other
Cleaning & hygiene
Healthcare
15 2017 FULL YEAR RESULTS FEBRUARY 2018

BUSINESS AREA ANALYSIS
Well diversified by geography and sector
* Adjusted operating profit - before adjusting items (customer relationships amortisation and acquisition related items) and corporate costs
REST OF WORLD 8% Revenue 9% Operating profit*
UK & IRELAND 14% Revenue 14% Operating profit*
CONTINENTAL EUROPE 19% Revenue 25% Operating profit*
NORTH AMERICA 59% Revenue 52% Operating profit*
16 2017 FULL YEAR RESULTS FEBRUARY 2018

HIGHLIGHTS
• North America – Improved organic revenue growth from significant additional grocery business, albeit at lower margins
• Continental Europe – Strong increases in revenue and operating profit with operating margin up 10 basis points to 9.4%
• UK & Ireland – Return to organic revenue growth with operating margin down 30 basis points principally due to higher import prices from weaker sterling
• Rest of the World – Good growth in revenue and operating profit with margins stable
17 2017 FULL YEAR RESULTS FEBRUARY 2018

GROWTH
£m 2017 2016 REPORTED CONSTANT EXCHANGE
Revenue 5,061.1 4,362.1 16% 10%
Adjusted operating profit* 318.3 289.6 10% 4%
Operating margin* 6.3% 6.6%
Return on operating capital 53.6% 57.8%
NORTH AMERICA
• Revenue growth driven by strong organic growth and impact of acquisitions
• Substantial revenue growth in grocery although margins lower
• Significant expansion in retail supplies through acquisition of DDS
• Redistribution growth from category management programmes
• Growth in safety from improving market conditions, boosted by acquisition of ML Kishigo
• Good progress in Canada
* Before adjusting items (customer relationships amortisation and acquisition related items)
18 2017 FULL YEAR RESULTS FEBRUARY 2018

GROWTH
£m 2017 2016 REPORTED CONSTANT EXCHANGE
Revenue 1,610.4 1,355.1 19% 12%
Adjusted operating profit* 151.1 126.6 19% 13%
Operating margin* 9.4% 9.3%
Return on operating capital 57.5% 58.8%
CONTINENTAL EUROPE
• Strong increases in revenue and profit with improved operating margin
• Significant acquisition of Hedis further strengthens position in France
• Good revenue and profit growth in the Netherlands from new customer wins, particularly in healthcare and retail
• Significant growth in Spain from organic growth and acquisition of Tecnopacking
• Expansion into safety in Italy through purchase of Neri
• Strong performance in Turkey and Israel with increased levels of profitability
* Before adjusting items (customer relationships amortisation and acquisition related items)
19 2017 FULL YEAR RESULTS FEBRUARY 2018

GROWTH
£m 2017 2016 REPORTED CONSTANT EXCHANGE
Revenue 1,190.8 1,087.8 9% 9%
Adjusted operating profit* 88.5 83.7 6% 5%
Operating margin* 7.4% 7.7%
Return on operating capital 90.0% 104.9%
UK & IRELAND
• Strong revenue growth with operating margin impacted by higher import prices from weaker sterling
• Trading in safety impacted by sluggish markets; good performance in cleaning & hygiene
• Growth in food retail; non-food retail strengthened by acquisition of Woodway and Lightning Packaging
• Growth in hospitality from contract wins and expansion of business with existing customers
• Healthcare held back by difficult market conditions
• Good growth in Ireland across all sectors
* Before adjusting items (customer relationships amortisation and acquisition related items)
20 2017 FULL YEAR RESULTS FEBRUARY 2018

GROWTH
£m 2017 2016 REPORTED CONSTANT EXCHANGE
Revenue 718.6 624.1 15% 5%
Adjusted operating profit* 53.9 46.6 16% 5%
Operating margin* 7.5% 7.5%
Return on operating capital 32.4% 30.2%
REST OF THE WORLD
• Latin America − Overall good performance, including improvement in Brazil − Entry into foodservice sector in Brazil with acquisition of Talge
• Australasia − Continued improvement in trading conditions − Acquisition of Interpath has enhanced healthcare presence
• Asia − Expansion in Asia through acquisitions in Singapore and China
* Before adjusting items (customer relationships amortisation and acquisition related items)
21 2017 FULL YEAR RESULTS FEBRUARY 2018

PROSPECTS Group – continued growth from strong competitive position, diversified and resilient businesses and ability to consolidate fragmented markets further
North America – revenue to increase with strong organic growth continuing in Q1, returning to more normal levels thereafter, together with the effect of acquisitions. Focus on mitigating higher operating costs through productivity and other improvements
Continental Europe – strong performance expected due to continued organic growth and purchase of Hedis in France and other acquisitions
UK & Ireland – should develop well despite ongoing uncertainty in some markets due to improved organic growth from account wins and the impact of acquisitions
Rest of the World – overall progress expected due to organic and acquisition growth
Acquisitions – promising pipeline; expect to complete further transactions as year progresses
22 2017 FULL YEAR RESULTS FEBRUARY 2018
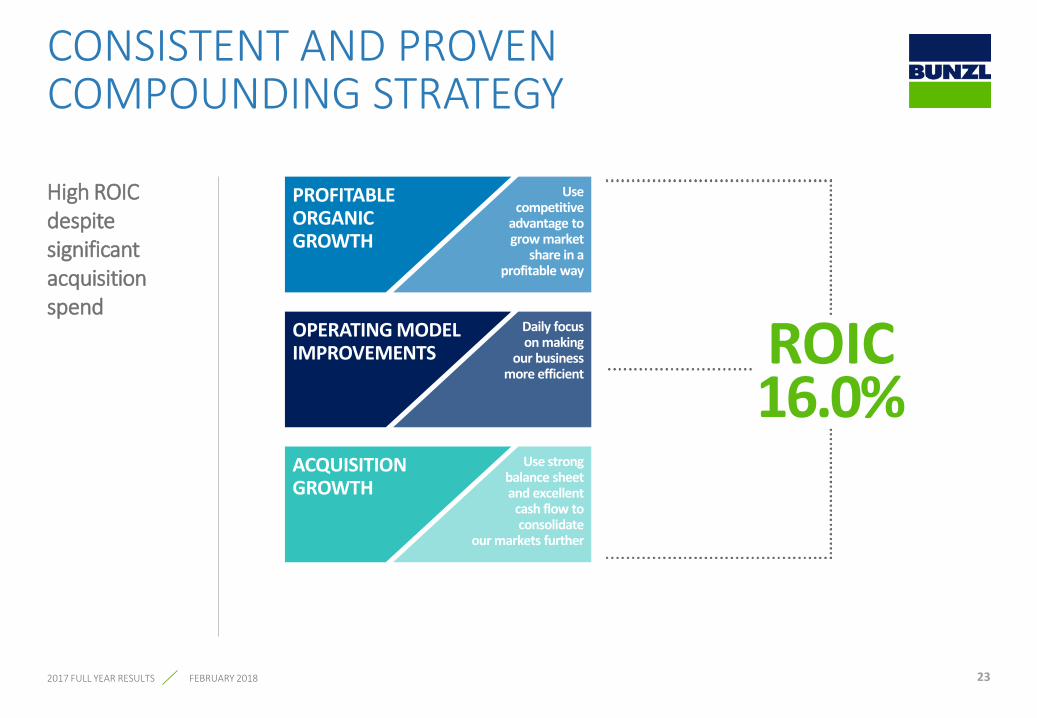
CONSISTENT AND PROVEN COMPOUNDING STRATEGY
High ROIC despite significant acquisition spend
PROFITABLE ORGANIC GROWTH
Use competitive
advantage to grow market
share in a profitable way
OPERATING MODEL IMPROVEMENTS
Daily focus on making
our business more efficient
ACQUISITION GROWTH
Use strong balance sheet and excellent
cash flow to consolidate
our markets further
ROIC 16.0%
23 2017 FULL YEAR RESULTS FEBRUARY 2018

2.4
8.6
04 05 06 07 08 09 10 11 12 13 14 15 16 17
FINANCIAL TRACK RECORD 2004-2017
Proven compounding growth strategy CAGR
* Before adjusting items (customer relationships amortisation and acquisition related items) and the associated taxation, where relevant - see Appendix 2 and Appendix 3 04-05 continuing operations only
REVENUE (£bn) ADJUSTED OPERATING PROFIT* (£m)
ADJUSTED EPS* (p) DIVIDEND PER SHARE (p) 04-12 restated on adoption of IAS 19 (revised 2011)
169
589
04 05 06 07 08 09 10 11 12 13 14 15 16 17
31.7
119.4
04 05 06 07 08 09 10 11 12 13 14 15 16 17
13.3
46.0
04 05 06 07 08 09 10 11 12 13 14 15 16 17
24
10%-11%
2017 FULL YEAR RESULTS FEBRUARY 2018

ACQUISITION GROWTH
Record level of acquisition spend
£616m
* Includes two committed acquisitions in 2017 which completed in January 2018 04-05 continuing operations only
2004 2005 2006 2007 2008 2009 2010 2011 2012 2013 2014 2015 2016 2017*
Number of acquisitions 7 7 9 8 7 2 9 10 13 11 17 22 14 15
Committed acquisition spend (£m)
302 129 162 197 123 6 126 185 277 295 211 327 184 616
Annualised acquisition revenue (£m)
430 270 386 225 151 27 154 204 518 281 223 324 201 621
25 2017 FULL YEAR RESULTS FEBRUARY 2018

NEW MARKETS
LSH Singapore Safety £5m January
Neri Italy Safety £41m March
HSESF China Safety £26m August
Talge* Brazil Foodservice £26m January 2018
ACQUISITION GROWTH 2017
£621m revenue acquired
26 * Acquisitions committed to during 2017 and completed in January 2018
EXISTING MARKETS
Business Country Sector Revenue Acquired
Packaging Film Sales USA Foodservice £5m January
ML Kishigo USA Safety £26m March
DDS USA Retail £242m May
AMFAS Canada Safety £6m May
Western Safety Canada Safety £4m May
Tecnopacking Spain Foodservice; Retail; Other £38m May
Pixel Inspiration UK Retail £7m June
Interpath Australia Healthcare £13m October
Hedis Group France Cleaning & hygiene; Foodservice £140m November
Lightning Packaging UK Retail £15m November
Aggora* UK Foodservice £27m January 2018
2017 FULL YEAR RESULTS FEBRUARY 2018

• Completed in May
• Based in Minneapolis, USA with revenue of £242m
• Supplies a wide range of packaging, consumables and operating store supplies to the retail sector, primarily in North America
• Complements existing retail business by providing additional merchandising and delivery capabilities to multi-channel retailers
ACQUISITION SNAPSHOT
Two larger acquisitions in existing markets with synergies
27 2017 FULL YEAR RESULTS FEBRUARY 2018
DDS
HEDIS GROUP
• Completed in November
• Based in France with revenue of £140m
• Strengthens position in cleaning & hygiene sector
• Entry into the catering equipment sector

NATIONAL DISTRIBUTORS
REGIONAL DISTRIBUTORS
LOCAL DISTRIBUTORS
BUNZL: MARKET LEADING SPECIALIST DISTRIBUTOR
28 2017 FULL YEAR RESULTS FEBRUARY 2018
SPECIALIST COMPETITORS IN OUR FIELD OTHER COMPETITORS
• FOOD DISTRIBUTORS •OFFICE SUPPLIES
DISTRIBUTORS • INDUSTRIAL
DISTRIBUTORS
SPECIALISTS IN OTHER
CATEGORIES
•GROCERY CUSTOMERS’ OWN SUPPLY CHAIN
GROCERY CUSTOMERS
•CASH AND CARRY •ONLINE SELLERS
GENERALISTS

GROCERY CUSTOMERS’ OWN SUPPLY CHAIN
SPECIALIST DISTRIBUTORS IN
OTHER CATEGORIES
FOOD OFFICE SUPPLIES
INDUSTRIAL
SPECIALIST DISTRIBUTORS
ONE SIZE FITS ALL CUSTOMISED SOLUTIONS
SPECIALIST IN OUR CATEGORIES
GENERALIST / FOCUS ON OTHER CATEGORIES
COMPETITIVE POSITIONING
29
Bunzl offers customised high service solutions across focused market sectors
2017 FULL YEAR RESULTS FEBRUARY 2018
GENERALISTS CASH AND CARRY ONLINE SELLERS

OWN BRAND
CUSTOMISED SOLUTIONS
30
BUNZL UNIQUE SERVICE OFFERING
FEBRUARY 2018
EXPERT KNOWLEDGE AND ADVICE
“QUASI MANUFACTURER”
OWN BRAND
EDI
PRODUCTS STOCKED IN
BUNZL WAREHOUSE
DELIVERY OPTIONS
OWN FLEET
INDIVIDUAL PRODUCT
KNOWLEDGE
CUSTOMISED MANAGEMENT INFORMATION
VALUE ALTERNATIVE OWN BRAND
APP
DEDICATED CALL CENTRES
MANUFACTURER BRANDED
LOCAL AND NATIONAL
DISTRIBUTION NETWORK
ONE ORDER ONE DELIVERY ONE INVOICE
ONE-STOP-SHOP ON-TIME IN-FULL
DELIVERY
DIRECT TO SITE
WAREHOUSE REPLENISHMENT
X DOCK
PRODUCT AVAILABILITY
DELIVERY BEYOND BACK
DOOR
FULL RANGE
STOCKED CUSTOMISED
DELIVERY SLOTS
HEALTH AND SAFETY
REQUIREMENTS
CONSUMPTION VS CUSTOMER
BUDGET
COMPLIANCE BY UNITS TO HEAD
OFFICE
WEBSHOP
NATIONAL FOOTPRINT
MULTIPLE DELIVERY
LOCATIONS
INNOVATION CENTRES
CONTRACT MOBILISATIONS
SHANGHAI SOURCING
OFFICE - QC/QA
DESIGN / INSTALLATION
SERVICES
RANGE RATIONALISATION
DIRECT DEALS WITH MANUFACTURERS
DELIVERED BY BUNZL
BULKY LOW VALUE
PRODUCTS
PRODUCT TRAINING
USAGE
EXCEED BUDGET ALERTS
CUSTOMISED DIGITAL
SOLUTIONS
BENEFIT OF BUNZL SCALE
EXCLUSIVE DISTRIBUTION
INDUSTRY LEADING
SPECIALISED SALES FORCE
MATERIAL CONSOLIDATION
VALUE ADDED SERVICES
ESSENTIAL ITEMS
COMPETITIVELY PRICED PRODUCTS
MARKET INTELLIGENCE
MINIMISE CUSTOMERS’
WORKING CAPITAL
BESPOKE / PRINTED PRODUCT
MANAGEMENT
INNOVATION CENTRES
2017 FULL YEAR RESULTS
RIGHT PRODUCT RIGHT PRICE
SUPPLY CHAIN
STUDIES
ECONOMIC DENSITY
ANALYSIS
LOCAL CUSTOMER
SERVICE SPECIALISTS

Typical customers
• Larger, representing 95% of revenue
• B2B
• Often multi-site
Typical customer requirements
• Innovative, customised solutions
• One-stop-shop: broad range of items essential to their operations
• On-time and in-full service
• Ease of doing business via digital solutions
• Support from 3,000 sales specialists and 2,500 locally based customer service specialists and own drivers
• Competitive prices
• Manufacturer branded and own brand products (with QA/QC)
BUNZL CUSTOMERS
31 2017 FULL YEAR RESULTS FEBRUARY 2018
of revenue generated by larger, service intensive customers with average annual spend of
of revenue generated from customers spending < £10,000 per annum
£180,000
95%
5%

FEBRUARY 2018 2017 FULL YEAR RESULTS
APPENDICES

2017 2016 Average rate
US$ 1.29 1.36
Euro 1.14 1.22
Canadian$ 1.67 1.80
Brazilian real 4.11 4.74
Australian$ 1.68 1.82
Closing rate
US$ 1.35 1.24
Euro 1.13 1.17
Canadian$ 1.69 1.66
Brazilian real 4.49 4.01
Australian$ 1.73 1.71
APPENDIX 1 EXCHANGE RATES
33 2017 FULL YEAR RESULTS FEBRUARY 2018
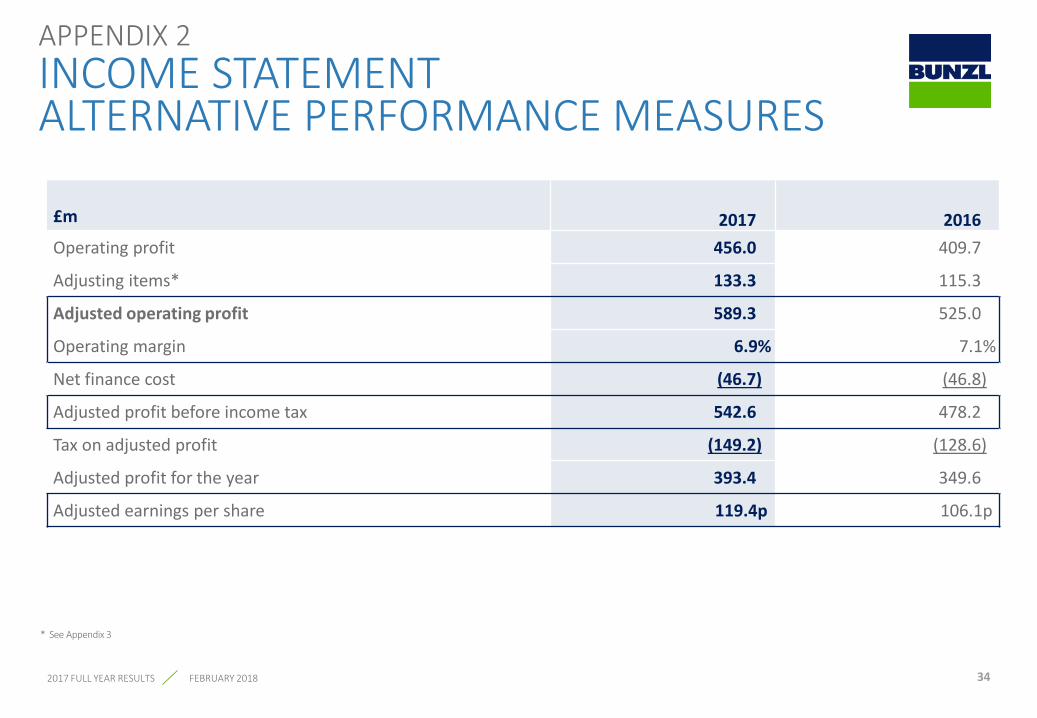
£m 2017 2016 Operating profit 456.0 409.7
Adjusting items* 133.3 115.3
Adjusted operating profit 589.3 525.0
Operating margin 6.9% 7.1%
Net finance cost (46.7) (46.8)
Adjusted profit before income tax 542.6 478.2
Tax on adjusted profit (149.2) (128.6)
Adjusted profit for the year 393.4 349.6
Adjusted earnings per share 119.4p 106.1p
APPENDIX 2 INCOME STATEMENT ALTERNATIVE PERFORMANCE MEASURES
34
* See Appendix 3
2017 FULL YEAR RESULTS FEBRUARY 2018

35
£m 2017 2016 Customer relationships amortisation (96.6) (81.3)
Deferred consideration payments (28.5) (29.6)
Transaction costs and expenses (12.1) (6.8)
Earn-out adjustments 3.9 2.4
Total adjusting items (133.3) (115.3)
APPENDIX 3 ADJUSTING ITEMS
2017 FULL YEAR RESULTS FEBRUARY 2018

£m 2017 2016 Opening net debt (1,228.6) (1,107.2)
Net cash (outflow) / inflow (334.0) 16.0
Exchange 39.0 (137.4)
Closing net debt (1,523.6) (1,228.6)
APPENDIX 4 NET DEBT
36 2017 FULL YEAR RESULTS FEBRUARY 2018

£m 2017 2016 Operating profit 456.0 409.7
Adjusting items 133.3 115.3
Adjusted operating profit* 589.3 525.0
Adjusted for:
Non-cash items 28.9 28.0
Working capital movement (15.6) (6.3)
Cash flow from operations◊ 602.6 546.7
Net capital expenditure (32.9) (24.8)
Operating cash flow◊ 569.7 521.9
Cash conversion** 97% 99%
APPENDIX 5 CASH FLOW AND CASH CONVERSION
* Before adjusting items (customer relationships amortisation and acquisition related items) – see Appendix 2 and Appendix 3 ◊ Before acquisition related items ** The ratio of operating cash flow before acquisition related items to adjusted operating profit
37 2017 FULL YEAR RESULTS FEBRUARY 2018

Leading revenue in year 04-05 continuing operations only * Includes two acquisitions committed to during 2017 which completed in January 2018
£m 2004 2005 2006 2007 2008 2009 2010 2011 2012 2013 2014 2015 2016 2017*
North America 115 198 103 15 - - 35 7 410 89 84 153 38 283
Continental Europe 301 61 7 100 52 - 115 96 23 5 46 98 87 219
UK & Ireland - 2 267 110 39 27 - 39 16 32 40 - 76 49
Rest of the World 14 9 9 - 60 - 4 62 69 155 53 73 - 70
Group 430 270 386 225 151 27 154 204 518 281 223 324 201 621
38 2017 FULL YEAR RESULTS FEBRUARY 2018
APPENDIX 6 ANNUALISED ACQUISITION REVENUE

APPENDIX 7 SIGNIFICANT OPPORTUNITIES TO GROW IN EXISTING COUNTRIES
COUNTRY FOODSERVICE GROCERY C&H SAFETY RETAIL HEALTHCARE
USA ●
Canada ●
Mexico ● ● ●
UK
Ireland
Germany ● ●
France ● ●
Italy ● ● ● ●
Spain ●
Netherlands
Belgium ●
Denmark ● ●
Switzerland
Austria ● ● ● ● ●
Czech Republic ● ● ● ●
COUNTRY FOODSERVICE GROCERY C&H SAFETY RETAIL HEALTHCARE
Hungary ● ●
Romania ● ● ●
Slovakia ● ● ● ●
Israel ● ● ● ● ●
Turkey ● ● ● ●
Brazil ● ●
Chile ● ● ● ●
Colombia ● ● ● ● ●
Argentina ● ● ● ● ●
Peru ● ● ● ● ●
Uruguay ● ● ● ● ●
Australia
New Zealand ●
China / Hong Kong ● ● ● ●
Singapore ● ● ● ● ●
● No existing presence
39 2017 FULL YEAR RESULTS FEBRUARY 2018

APPENDIX 8 HISTORICAL DATA
* Before adjusting items (customer relationships amortisation and acquisition related items) – see Appendix 2 and Appendix 3
£m 2004 2005 2006 2007 2008 2009 2010 2011 2012 2013 2014 2015 2016 2017
Revenue 2,439 2,924 3,333 3,582 4,177 4,649 4,830 5,109 5,359 6,098 6,157 6,490 7,429 8,581
Adjusted operating profit* 169 203 226 243 281 296 307 336 352 414 430 455 525 589
Operating margin* (%) 6.9 7.0 6.8 6.8 6.7 6.4 6.4 6.6 6.6 6.8 7.0 7.0 7.1 6.9
40 2017 FULL YEAR RESULTS FEBRUARY 2018

a
One-stop-shop for non-food consumables
41
SOU
RCE
CON
SOLD
ATE
DELI
VER
• Global suppliers • Low cost sources • Commodities • Own brands
INDIVIDUAL RANGES
CONSOLIDATED OFFER
Foodservice Grocery Cleaning & hygiene Safety Retail Healthcare
2017 FULL YEAR RESULTS FEBRUARY 2018
• Direct to site • Cross dock • Warehouse
replenishment
APPENDIX 9 BUSINESS MODEL

Outsourcing adds value for our customers
• In-house procurement and self-distribution is costly • Bunzl applies its resources and expertise to reduce or eliminate many of the "hidden" costs of
in-house procurement and self-distribution • The benefits to customers are a lower cost of doing business and reduced working capital and
carbon emissions
INVENTORY INVESTMENT CASH FLOW DIRECT LABOUR & OVERTIME INVENTORY FINANCE COST EXPEDITED ORDERS INBOUND FREIGHT PURCHASE ORDER ADMINISTRATION INVENTORY DAMAGE & SHRINKAGE ACCOUNTS PAYABLE ADMIN STORAGE SPACE CAPITAL EMPLOYED
PRODUCT COST
COST TO PROCESS
COST TO ACQUIRE
42 2017 FULL YEAR RESULTS FEBRUARY 2018
APPENDIX 10 VALUE PROPOSITION

43
Continued investment in digital offerings to improve both customer experience and operating efficiency
2017 FULL YEAR RESULTS FEBRUARY 2018
• c. 50% of customer orders received electronically following extensive investment in EDI and web technologies
• State-of-the-art e-Commerce tools implemented across all geographies (e.g. Insite, Intershop, and SAP Hybris) enabling business customers to have a compelling digital experience
• Examples of customised solutions: • mobile and tablet device support; • sensor technologies for auto order /
replenishment; and • data analytics
SUPPORTED BY CIRCA 5,500 SALES STAFF
APPENDIX 11 INTEGRATED DIGITAL SOLUTIONS

• Anchor − New geographies − New sectors
Disciplined approach to acquisitions
• Bolt-on − Existing geographies or sectors − Extending product range − Consolidating markets
FURTHER MARKET CONSOLIDATION AND SYNERGIES
RESILIENT AND GROWING MARKETS
FRAGMENTED CUSTOMER BASE
ATTRACTIVE FINANCIAL RETURNS (ROIC, ROACE)
SMALL % OF TOTAL CUSTOMER SPEND
OPPORTUNITY FOR OWN LABEL PRODUCTS
CONSOLIDATED PRODUCT OFFERING (ONE- STOP-SHOP)
B2B GOODS NOT FOR RESALE
44 2017 FULL YEAR RESULTS FEBRUARY 2018
APPENDIX 12 ACQUISITION PARAMETERS

151* acquisitions 2004 – 2017 SAY “NO” MANY TIMES
MORE THAN “YES” VERY SELECTIVE ABOUT
COUNTRIES AND SECTORS
THOROUGH DUE DILIGENCE
RETENTION OF MANAGEMENT AND CUSTOMERS IS KEY
TARGETS ARE IDENTIFIED BY BUSINESS AREA MANAGEMENT, IN-HOUSE CORPORATE DEVELOPMENT TEAM, EX-OWNERS AND EXTERNAL PARTIES
REVIEW PERFORMANCE VS INVESTMENT CASE
WITH BOARD
* Includes two acquisitions committed to in 2017 which completed in January 2018
45 2017 FULL YEAR RESULTS FEBRUARY 2018
APPENDIX 13 ACQUISITION DISCIPLINE

This presentation includes various performance measures defined under International Financial Reporting Standards (‘IFRS’) as well as a number of alternative performance measures (known as non-GAAP measures). The principal alternative performance measures used in this presentation are:
• adjusted operating profit;
• adjusted profit before income tax;
• adjusted profit for the year;
• adjusted earnings per share;
• cash conversion %;
• return on average operating capital %; and
• return on invested capital %
These measures exclude the charge for customer relationships amortisation, acquisition related items and any associated tax, where relevant. Acquisition related items comprise deferred consideration payments relating to the retention of former owners of businesses acquired, transaction costs and expenses and adjustments to previously estimated earn outs. Customer relationships amortisation, acquisition related items and any associated tax are items which are not taken into account by management when assessing the results of the business as they are considered by management to form part of the total spend on acquisitions or are non-cash items resulting from acquisitions and therefore do not relate to the underlying operating performance and distort comparability between businesses and reporting periods. Accordingly, these items are removed in calculating the profitability measures by which management assess the performance of the Group.
Other non-GAAP measures are based on or derived from the non-GAAP measures noted above. All alternative performance measures in this presentation have been calculated consistently with the methods applied and disclosed in the 2016 Annual Report.
APPENDIX 14 ALTERNATIVE PERFORMANCE MEASURES
46 2017 FULL YEAR RESULTS FEBRUARY 2018

This document has been prepared by Bunzl plc (the ‘Company’) solely for use at the presentation of the Company’s results announcement in respect of the year ended 31 December 2017. For the purposes of this disclaimer, “Presentation” shall mean this document, the oral presentation of the slides by the Company and related question-and-answer session and any materials distributed at, or in connection with, that presentation.
The Presentation does not constitute or form part of and should not be construed as, an offer to sell or issue, or the solicitation of an offer to buy or acquire, securities of the Company in any jurisdiction or an inducement to enter into investment activity. No part of this Presentation, nor the fact of its distribution, should form the basis of, or be relied on or in connection with, any contract or commitment or investment decision whatsoever.
The Presentation contains forward-looking statements. They are subject to risks and uncertainties that might cause actual results and outcomes to differ materially from the expectations expressed in them. You are cautioned not to place undue reliance on such forward-looking statements which speak only as of the date hereof. The Company undertakes no obligation to revise or update any such forward-looking statements.
The information and opinions contained in this Presentation do not purport to be comprehensive, are provided as at the date of the Presentation and are subject to change without notice. The Company is not under any obligation to update or keep current the information contained herein.
DISCLAIMER
47 2017 FULL YEAR RESULTS FEBRUARY 2018