2017 faith, food and fitness lesson 4 obesity trends
TRANSCRIPT

Faith, Food and Fitness, Lesson 4: Borlaug and the impact of GMOsSUMMER 2017

Agenda for Lesson 3
Prayer
Homework
Yan and Katie
Norman Borlaug
Wheat Belly
Obesity Trends

Storytime Yan and Katie:

Back to this…

Who is this guy?


He shared!

What he didn’t know
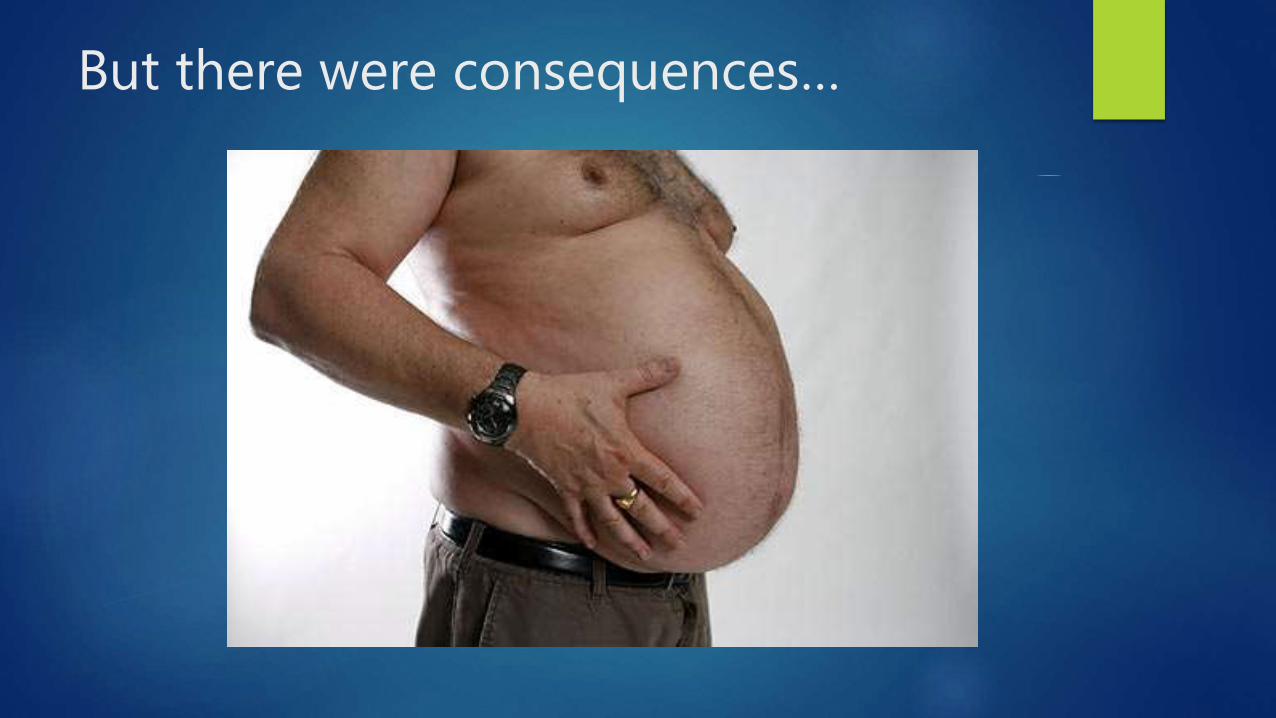
But there were consequences…

The culprit
Gluten via Borlaug’s wheat.
Wheatbellyblog.com front quote….
Insulin issues……

Definitions:
• Obesity: Body Mass Index (BMI) of 30 or higher.
• Body Mass Index (BMI): A measure of an adult’s weight in relation to his or her height, specifically the adult’s weight in kilograms divided by the square of his or her height in meters.
Obesity Trends Among U.S. Adults Between 1985 and 2010

Citations
• Mokdad AH, et al. The spread of the obesity epidemic in the United States, 1991–1998. JAMA 1999;282:16:1519–22.
• Mokdad AH, et al. The continuing epidemics of obesity and diabetes in the United States. JAMA 2001;286:10:1519–22.
• Mokdad AH, et al. Prevalence of obesity, diabetes, and obesity-related health risk factors, 2001. JAMA 2003;289:1:76–9.
• CDC. State-specific prevalence of obesity among adults —United States, 2005. MMWR 2006;55(36):985–8.
• CDC. State-specific prevalence of obesity among adults —United States, 2007. MMWR 2008;57(28):765–8.
• CDC. Vital signs: State-specific prevalence of obesity among adults — United States, 2009. MMWR 2010;59:1–5.

Source: Behavioral Risk Factor Surveillance System, CDC.
Obesity Trends* Among U.S. AdultsBRFSS, 1985
(*BMI ≥30, or ~ 30 lbs. overweight for 5’ 4” person)
No Data <10% 10%–14%

Source: Behavioral Risk Factor Surveillance System, CDC.
Obesity Trends* Among U.S. AdultsBRFSS, 1986
(*BMI ≥30, or ~ 30 lbs. overweight for 5’ 4” person)
No Data <10% 10%–14%

Source: Behavioral Risk Factor Surveillance System, CDC.
Obesity Trends* Among U.S. AdultsBRFSS, 1987
(*BMI ≥30, or ~ 30 lbs. overweight for 5’ 4” person)
No Data <10% 10%–14%
Source: Behavioral Risk Factor Surveillance System, CDC.
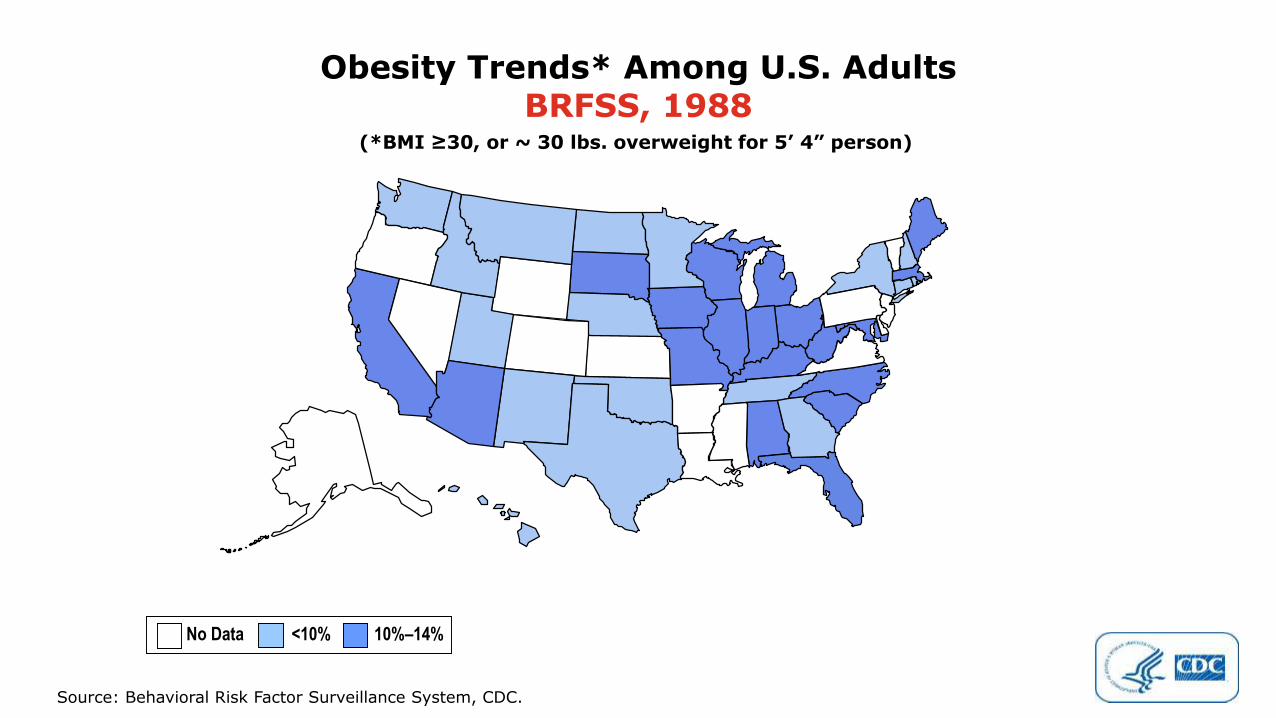
Obesity Trends* Among U.S. AdultsBRFSS, 1988
(*BMI ≥30, or ~ 30 lbs. overweight for 5’ 4” person)
No Data <10% 10%–14%

Source: Behavioral Risk Factor Surveillance System, CDC.
Obesity Trends* Among U.S. AdultsBRFSS, 1989
(*BMI ≥30, or ~ 30 lbs. overweight for 5’ 4” person)
No Data <10% 10%–14%
Source: Behavioral Risk Factor Surveillance System, CDC.
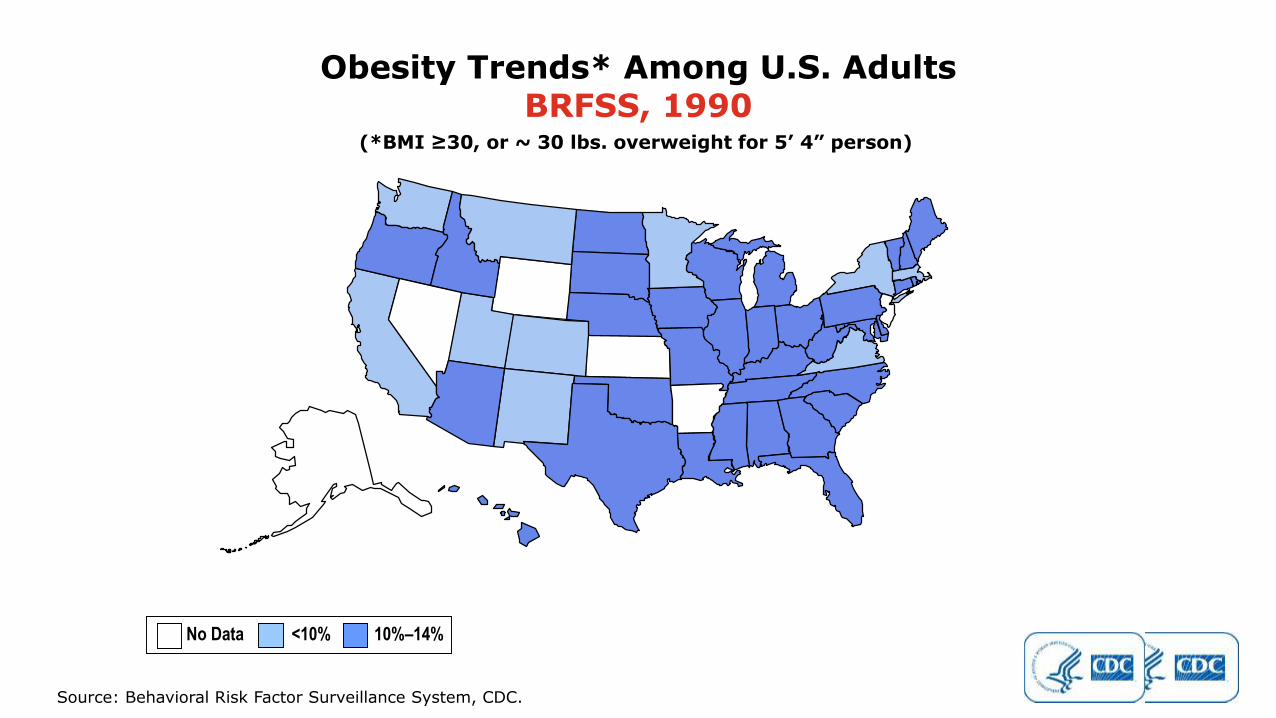
Obesity Trends* Among U.S. AdultsBRFSS, 1990
(*BMI ≥30, or ~ 30 lbs. overweight for 5’ 4” person)
No Data <10% 10%–14%

Source: Behavioral Risk Factor Surveillance System, CDC.
Obesity Trends* Among U.S. AdultsBRFSS, 1991
(*BMI ≥30, or ~ 30 lbs. overweight for 5’ 4” person)
No Data <10% 10%–14% 15%–19%
Source: Behavioral Risk Factor Surveillance System, CDC.
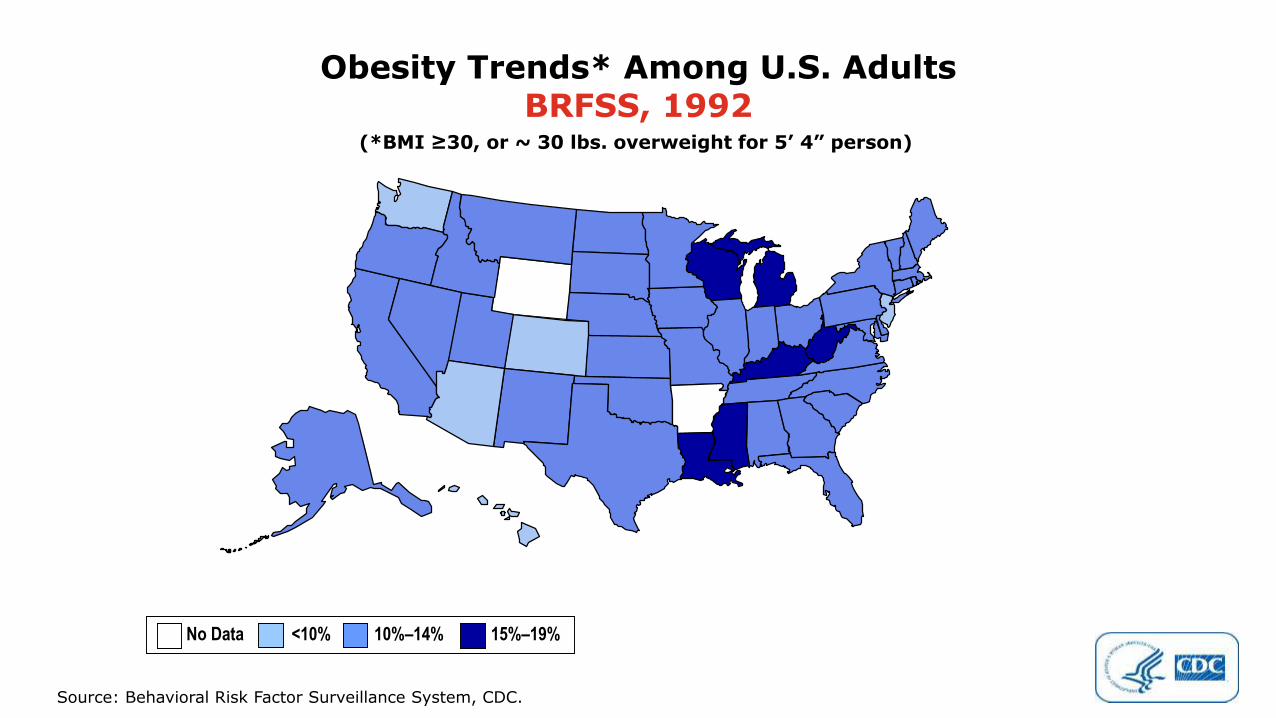
Obesity Trends* Among U.S. AdultsBRFSS, 1992
(*BMI ≥30, or ~ 30 lbs. overweight for 5’ 4” person)
No Data <10% 10%–14% 15%–19%

Source: Behavioral Risk Factor Surveillance System, CDC.
Obesity Trends* Among U.S. AdultsBRFSS, 1993
(*BMI ≥30, or ~ 30 lbs. overweight for 5’ 4” person)
No Data <10% 10%–14% 15%–19%

Source: Behavioral Risk Factor Surveillance System, CDC.
Obesity Trends* Among U.S. AdultsBRFSS, 1994
(*BMI ≥30, or ~ 30 lbs. overweight for 5’ 4” person)
No Data <10% 10%–14% 15%–19%

Source: Behavioral Risk Factor Surveillance System, CDC.
Obesity Trends* Among U.S. AdultsBRFSS, 1995
(*BMI ≥30, or ~ 30 lbs. overweight for 5’ 4” person)
No Data <10% 10%–14% 15%–19%

Source: Behavioral Risk Factor Surveillance System, CDC.
Obesity Trends* Among U.S. AdultsBRFSS, 1996
(*BMI ≥30, or ~ 30 lbs. overweight for 5’ 4” person)
No Data <10% 10%–14% 15%–19%

Source: Behavioral Risk Factor Surveillance System, CDC.
Obesity Trends* Among U.S. AdultsBRFSS, 1997
(*BMI ≥30, or ~ 30 lbs. overweight for 5’ 4” person)
No Data <10% 10%–14% 15%–19% ≥20%

Source: Behavioral Risk Factor Surveillance System, CDC.
Obesity Trends* Among U.S. AdultsBRFSS, 1998
(*BMI ≥30, or ~ 30 lbs. overweight for 5’ 4” person)
No Data <10% 10%–14% 15%–19% ≥20%

Source: Behavioral Risk Factor Surveillance System, CDC.
Obesity Trends* Among U.S. AdultsBRFSS, 1999
(*BMI ≥30, or ~ 30 lbs. overweight for 5’ 4” person)
No Data <10% 10%–14% 15%–19% ≥20%

Source: Behavioral Risk Factor Surveillance System, CDC.
Obesity Trends* Among U.S. AdultsBRFSS, 2000
(*BMI ≥30, or ~ 30 lbs. overweight for 5’ 4” person)
No Data <10% 10%–14% 15%–19% ≥20%

Source: Behavioral Risk Factor Surveillance System, CDC.
Obesity Trends* Among U.S. AdultsBRFSS, 2001
(*BMI ≥30, or ~ 30 lbs. overweight for 5’ 4” person)
No Data <10% 10%–14% 15%–19% 20%–24% ≥25%

Source: Behavioral Risk Factor Surveillance System, CDC.
(*BMI ≥30, or ~ 30 lbs. overweight for 5’ 4” person)
Obesity Trends* Among U.S. AdultsBRFSS, 2002
No Data <10% 10%–14% 15%–19% 20%–24% ≥25%

Source: Behavioral Risk Factor Surveillance System, CDC.
Obesity Trends* Among U.S. AdultsBRFSS, 2003
(*BMI ≥30, or ~ 30 lbs. overweight for 5’ 4” person)
No Data <10% 10%–14% 15%–19% 20%–24% ≥25%

Source: Behavioral Risk Factor Surveillance System, CDC.
Obesity Trends* Among U.S. AdultsBRFSS, 2004
(*BMI ≥30, or ~ 30 lbs. overweight for 5’ 4” person)
No Data <10% 10%–14% 15%–19% 20%–24% ≥25%

Source: Behavioral Risk Factor Surveillance System, CDC.
Obesity Trends* Among U.S. AdultsBRFSS, 2005
(*BMI ≥30, or ~ 30 lbs. overweight for 5’ 4” person)
No Data <10% 10%–14% 15%–19% 20%–24% 25%–29% ≥30%

Source: Behavioral Risk Factor Surveillance System, CDC.
Obesity Trends* Among U.S. AdultsBRFSS, 2006
(*BMI ≥30, or ~ 30 lbs. overweight for 5’ 4” person)
No Data <10% 10%–14% 15%–19% 20%–24% 25%–29% ≥30%

Source: Behavioral Risk Factor Surveillance System, CDC.
Obesity Trends* Among U.S. AdultsBRFSS, 2007
(*BMI ≥30, or ~ 30 lbs. overweight for 5’ 4” person)
No Data <10% 10%–14% 15%–19% 20%–24% 25%–29% ≥30%

Source: Behavioral Risk Factor Surveillance System, CDC.
Obesity Trends* Among U.S. AdultsBRFSS, 2008
(*BMI ≥30, or ~ 30 lbs. overweight for 5’ 4” person)
No Data <10% 10%–14% 15%–19% 20%–24% 25%–29% ≥30%

Source: Behavioral Risk Factor Surveillance System, CDC.
Obesity Trends* Among U.S. AdultsBRFSS, 2009
(*BMI ≥30, or ~ 30 lbs. overweight for 5’ 4” person)
No Data <10% 10%–14% 15%–19% 20%–24% 25%–29% ≥30%

Source: Behavioral Risk Factor Surveillance System, CDC.
Obesity Trends* Among U.S. AdultsBRFSS, 2010
(*BMI ≥30, or ~ 30 lbs. overweight for 5’ 4” person)
No Data <10% 10%–14% 15%–19% 20%–24% 25%–29% ≥30%

Source: Behavioral Risk Factor Surveillance System, CDC.
What about Europe?

Nutrient Timing:
When is at least as important as what!
Controlling your insulin response will save you time and money
You must take control of your life to get your health back

Sample Diet
Breakfast: go for it! Bacon, eggs, toast, yada, and lots of it. Eat early.
Snack 1: 150-300 calories of a blend of carbs, fats and protein
Snack 2: Same
Lunch: a meal! Complex Carb, protein and fruit or veggie
Snack 3: Same
Snack 4: Same, but make sure it has protein in it. NOT a good time for a banana, but better and egg or yoghurt
Dinner: Controlled carbs. HELL NO on the American wheat products.