2017 debt sustainability analysis - dsa report - dmo.gov.ng
TRANSCRIPT

2017REPORT OF THE
ANNUAL NATIONALDEBT SUSTAINABILITY ANALYSIS
(DSA)


iii
DEBT SUSTAINABILITY ANALYSIS (DSA) REPORT
TABLE OF CONTENTSList of Table ��������������������������������������������������������������������������������������������������������������� vList of Figures ����������������������������������������������������������������������������������������������������������� viList of Boxes ������������������������������������������������������������������������������������������������������������� viList of Annexures ������������������������������������������������������������������������������������������������������ viGLOSSARY ��������������������������������������������������������������������������������������������������������������� viiEXECUTIVE SUMMARY ����������������������������������������������������������������������������������������������� ix
CHAPTER ONE ������������������������������������������������������������������������������������������������������ 5INTRODUCTION �������������������������������������������������������������������������������������������������� 5
1�1 Policy Objectives ������������������������������������������������������������������������������������ 61�2 Methodology ����������������������������������������������������������������������������������������� 71�3 Scope of the 2017 DSA Data Coverage ���������������������������������������������������� 91�4 Benefits of 2017 DSA ��������������������������������������������������������������������������� 10
CHAPTER TWO ��������������������������������������������������������������������������������������������������� 11RECENT MACROECONOMIC DEVELOPMENTS ���������������������������������������������������� 11
2�1 External Developments ������������������������������������������������������������������������� 112�2 Domestic Developments ����������������������������������������������������������������������� 12
CHAPTER THREE ������������������������������������������������������������������������������������������������ 15PUBLIC DEBT PORTFOLIO REVIEW ������������������������������������������������������������������� 15
3�1 Nigeria’s Total Public Debt Outstanding �������������������������������������������������� 153�2 FGN’s Total Public Debt Service ������������������������������������������������������������� 173�3 Nigeria’s External Debt Stock ���������������������������������������������������������������� 183�4 Nigeria’s External Debt Service �������������������������������������������������������������� 193�5 Federal Government of Nigeria’s Domestic Debt Stock ���������������������������� 203�6 FGN’s Domestic Debt Service ���������������������������������������������������������������� 203�7 States’ & FCT’s Domestic Debt by Maturity Structure ������������������������������ 21
CHAPTER FOUR ������������������������������������������������������������������������������������������������� 23RISK ANALYSIS OF FGN’S TOTAL PUBLIC DEBT ����������������������������������������������� 23
4�1 Introduction ���������������������������������������������������������������������������������������� 234�2 Risk Analysis of FGN’s Total Public Debt Portfolio ������������������������������������ 23

iv
DEBT SUSTAINABILITY ANALYSIS (DSA) REPORT
4�3 Average Cost of FGN’s Portfolio ������������������������������������������������������������� 234�4 Interest Rate Risk �������������������������������������������������������������������������������� 234�5 Refinancing Risk ���������������������������������������������������������������������������������� 244�6 Redemption Profile ������������������������������������������������������������������������������� 244�7 Exchange Rate Risk ������������������������������������������������������������������������������ 254�8 Credit Risk (FGN’s On-lent Loans to MDAs) �������������������������������������������� 284�9 FGN’s Contingent Liabilities ������������������������������������������������������������������� 28
CHAPTER FIVE ��������������������������������������������������������������������������������������������������� 31UNDERLYING ASSUMPTIONS OF THE 2017 DSA ���������������������������������������������� 31
5�1 Baseline Scenario Assumptions ������������������������������������������������������������� 315�2 Optimistic Scenario Assumptions ����������������������������������������������������������� 345�3 Pessimistic Scenario Assumptions ��������������������������������������������������������� 36
CHAPTER SIX ����������������������������������������������������������������������������������������������������� 39RESULTS ANALYSIS ������������������������������������������������������������������������������������������� 39
6�0 Introduction ���������������������������������������������������������������������������������������� 396�1 Baseline Scenario ��������������������������������������������������������������������������������� 406�2 Optimistic Scenario ������������������������������������������������������������������������������ 426�3 Pessimistic Scenario ����������������������������������������������������������������������������� 436�4 Determination of Borrowing Limit for 2018 �������������������������������������������� 44
CHAPTER SEVEN ������������������������������������������������������������������������������������������������ 47SUMMARY OF KEY FINDINGS AND RECOMMENDATIONS �������������������������������� 47
6�1 Summary of Key Findings ��������������������������������������������������������������������� 476�1 Key Recommendations ������������������������������������������������������������������������� 47
THE DSA TECHNICAL TEAM ������������������������������������������������������������������������������� 59

v
DEBT SUSTAINABILITY ANALYSIS (DSA) REPORT
LIST OF TABLESTable 1: Summary of External Debt Sustainability Assessment ������������������������������� xiv
Table 2: Summary of Total Public Debt Sustainability Assessment (Federation – FGN, States and FCT) �������������������������������������������������������� xv
Table3: Summary of Total Public Debt Sustainability Assessment �������������������������� xvi
Table 4: Summary of Total Public Debt Sustainability Assessment �������������������������� xvi
Table 1�1: Fiscal and External Debts Thresholds ��������������������������������������������������������� 8
Table 2�1: Recent Macroeconomic Developments, 2012-2016 ������������������������������������ 12
Table 3�1: Nigeria’s Total Public Debt Outstanding, 2012-2016 ���������������������������������� 16
Table 3�2: FGN’s Total Public Debt Service, 2012-2016 (US$’ Million) ������������������������� 17
Table 3�3: External Debt Outstanding by Source, 2012-2016 (US$’ Million) ���������������� 19
Table 3�4: FGN’s External Debt Service, 2012-2016 (US$’ Million) ������������������������������ 20
Table 3�5 FGN’s Domestic Debt Outstanding by Instruments, 2015 & 2016 (N’ Billion) ��������������������������������������������������������������������������������������������� 20
Table 3�6: FGN’s Domestic Debt Service Payments, 2012 - 2016 (N’ Million) ��������������� 21
Table 3�7: States’& FCT’s Domestic Debt by Maturity, 2012-2016 (N’ Million) �������������� 22
Table 4�1: Cost and Risk Indicators of FGN’s Total Public Debt Portfolio as at December 31, 2016 �������������������������������������������������������������������������������� 23
Table 4�2: Currency Composition of External Reserves Assets as at December 31, 2016 �������������������������������������������������������������������������������� 26
Table 4�3: Composition of External Debt & Reserve Assets as at December 31, 2016 (in percent) ������������������������������������������������������������������������������������������������ 27
Table 4�4: FGN’s Contingent Liabilities, 2012-2016 (N’ Billion) ����������������������������������� 29
Table 6�1: External Debt Sustainability Indicators in Percent (2017-2037) (Baseline Scenario) �������������������������������������������������������������������������������� 40
Table 6� 2: Total Public Debt Sustainability Indicators in Percent (2017-2037) (Baseline Scenario) �������������������������������������������������������������������������������� 42
Table 6�3: Total Public Debt Sustainability Indicators in Percent (2017-2037) (Optimistic Scenario) ������������������������������������������������������������������������������ 43
Table 6�4: Total Public Debt Sustainability Indicators in Percent (2017-2037) (Pessimistic Scenario) ����������������������������������������������������������������������������� 44

vi
DEBT SUSTAINABILITY ANALYSIS (DSA) REPORT
LIST OF BOXESBox 5�1: Baseline Scenario Assumptions ������������������������������������������������������������������� 31Box 5�2: Optimistic Scenario Assumptions ����������������������������������������������������������������� 34Box 5�3: Pessimistic Scenario Assumptions ���������������������������������������������������������������� 36
LIST OF ANNEXURESAnnexure 1: Nigeria’s External Debt Sustainability Indicators Under Alternative Scenarios,
2017-2037 ��������������������������������������������������������������������������������������������� 51
Annexure 2: Total Public Debt Sustainability Under Alternative Scenarios, 2017-2037 ���� 52
Annexure 3: External Debt Sustainability Framework, Baseline scenario, 2014-2037 ����� 53
Annexure 4: Sensitivity Analysis for Key Indicators of Public and Publicly Guaranteed External Debt, 2017-2037 (continued) ����������������������������������������������������� 56
Annexure 5a: Public Sector Debt Sustainability Framework, Baseline Scenario, 2014-2037 ��������������������������������������������������������������������������������������������� 57
Annexure 5b: Sensitivity Analysis for Key Indicators of Public Debt 2017-2037 �������������� 58
LIST OF FIGURESFigure 3�1: Trend in Nigeria’s Total Public Debt Outstanding, 2012-2016 ��������������������� 17
Figure 3�2: Trends in FGN’s Total Debt Service, 2012-2016 ����������������������������������������� 18
Figure 3�3: Trends in FGN’s Domestic Debt Service Payments, 2012-2016 (N’ Billion) ��� 21
Figure 4�1: External Debt Redemption Profile (US$’ Million) ���������������������������������������� 24
Figure 4�2: Domestic Debt Redemption Profile (N’ Million) ������������������������������������������ 25
Figure 4�3: Currency Composition of External Debt as at December 31, 2016 �������������� 25
Figure 4�4: Currency Composition of External Reserves as at December 31, 2016 �������� 27

vii
DEBT SUSTAINABILITY ANALYSIS (DSA) REPORT
GLOSSARY
AMCON Asset Management Corporation of NigeriaASI All-Share IndexATM Average Time-to-MaturityATR Average Time-to-Re-FixingBDC Bureau De ChangeBOF Budget Office of the FederationCBN Central Bank of NigeriaCHF Swiss FrancCPIA Country Policy & Institutional AssessmentDDR Debt Data ReconstructionDSA Debt Sustainability AnalysisDSF-LICs Debt Sustainability Framework for Low Income CountriesDSF-MICs Debt Sustainability Framework for Middle Income CountriesDMO Debt Management OfficeECFA External Creditors’ Funding AccountFCT Federal Capital TerritoryFDIs Foreign Direct InvestmentsFEC Federal Executive CouncilFGN Federal Government of NigeriaFMBNP Federal Ministry of Budget and National PlanningFMF Federal Ministry of FinanceFX Foreign ExchangeGBP British Pound SterlingGDP Gross Domestic ProductGIFMIS Government Integrated Financial Management Information SystemGNI Gross National IncomeICM International Capital MarketIGR Internally Generated RevenueIMF International Monetary FundIPPIS Integrated Payroll and Personnel Information System

viii
DEBT SUSTAINABILITY ANALYSIS (DSA) REPORT
ISPO Irrevocable Standing Payment OrderJPY Japanese YenM2 Broad Money SupplyMACs Market Access CountriesMbpd Million Barrels Per DayMDAs Ministries, Departments and AgenciesMLT Medium to Long-TermMPR Monetary Policy RateMTDS Medium-Term Debt Management StrategyMTEF Medium-Term Expenditure FrameworkNASS National AssemblyNBS National Bureau of StatisticsNIRP National Industrial Revolution PlanNPV Net Present ValueNSE Nigerian Stock ExchangeNTBs Nigerian Treasury BillsOAGF Office of Accountant-General of the FederationPb Per barrelPENCOM Pension CommissionPIB Petroleum Industry BillPV Present ValueSEC Securities and Exchange CommissionSF Sinking FundSPV Special Purpose VehicleST Short-TermTSA Treasury Single AccountTTM Term-To-MaturityWAIFEM West African Institute for Financial and Economic ManagementWAMZ West African Monetary Zone
EXECUTIVE SUMMARY

ix
DEBT SUSTAINABILITY ANALYSIS (DSA) REPORT
I� Background
1� Nigeria undertakes the conduct of the Debt Sustainability Analysis (DSA) exercise on an annual basis� It is an exercise that takes into consideration a country’s ten-year historical macroeconomic data and twenty-year projected data to assess the level of risk of debt distress� The DSA Framework provides an objective assessment of debt sustainability in a given macroeconomic context, that outlines a country’s fiscal and monetary stance under certain assumptions and conditions�
The exercise ensures that the nation’s total Public Debt Portfolio is annually subjected to appropriate qualitative and quantitative analysis, by evaluating the country’s repayment capacity for its current and future debt obligations, in order to ascertain the level of risk of debt distress�
The DSA assessment is usually in two parts - External and Fiscal� The External DSA covers the External Debt of the central government (FGN), States and the Federal Capital Territory (FCT), including government agencies’ borrowings that are guaranteed by the FGN, and Private Sector External Debt (as may be available)� The Fiscal DSA covers Total Public Debt-External and Domestic of the FGN, and the States, including FCT� The DSA assessment also includes Stress Tests, which is an in-built mechanism that subjects some of the key assumptions in the Baseline Scenario to various shocks� These include: real GDP growth rate, Primary Balance, Export growth rate, Exchange Rate depreciation, etc�
2� The outcome of last year’s (2016) DSA exercise showed that Nigeria’s debt position experienced some deterioration and slipped from a Low-risk of debt distress to a Moderate risk of debt distress� Although, the level of Total Public Debt Stock remained low relative to the country’s Gross Domestic Product (GDP), the Debt Portfolio was largely vulnerable to significant decline in Revenue, Exports and substantial Currency Devaluation� The ratio of Total Public Debt-to-GDP rose from 13�02 percent in 2015 to 16�27 percent as at December 31, 2016, which was still within the Country’s specific Debt Limit of 19�39 percent in the medium-term (up to December 31, 2017), and far below the World Bank/IMF’s threshold of 56�00 percent for countries in Nigeria’s peer-group� The ratio of Public Debt Service-to-Revenue at 33�94 percent as at December 31, 2016, was relatively higher reflecting low government revenue, in the face of lower oil revenue�

x
DEBT SUSTAINABILITY ANALYSIS (DSA) REPORT
3� While Nigeria’s Total Public Debt Stock is relatively low vis-à-vis the country’s GDP, the increased funding requirements needed to sustain the Economic recovery, address the huge infrastructural deficit, as well as meet budget financing requirements, would entail enormous funding resources, including borrowing� Based on the Country’s Economic Blue Print – the Economic Recovery and Growth Plan (ERGP), 2017-2020, which was launched in April 2017, fiscal deficit for the period is projected to average at 1�93 percent of GDP, which is still within the 3 percent stipulated by the Fiscal Responsibility Act, 2017� The proposed debt financing is expected to be in line with the country’s Debt Management Strategy, 2016-2019, which aims at restructuring the debt portfolio, in such a way as to achieve an optimal mix of 60:40 (domestic to external), so as to also reduce overall Debt Servicing costs of the portfolio� Thus, the proposed funding plan in the current MTEF, 2018-2020, indicates a gradual increase in the share of foreign financing relative to domestic financing� This is expected to drastically reduce the overall cost of borrowing and also address the challenge of crowding out the private sector from the domestic debt market�
II� Methodology
4� The 2017 DSA exercise adopted the latest version of the joint World Bank/IMF Debt Sustainability Framework for Low-Income Countries (DSF-LICs), which was released in August, 2015�The DSF for low-income countries is used mainly by countries with greater funding from concessional sources� The DSF-LIC provides indicative debt thresholds that reflect the quality of a Country’s Policies and Institutions� It is based on the World Bank/IMF’s Country Policy and Institutional Assessment (CPIA) index ranking, with a scale of 1 to 6, and classifies countries into one of the three policy performance categories: Weak Policy (CPIA<3.25); Medium Policy (3.25≤CPIA≤3.75) and Strong Policy (CPIA >3�75), and applies different indicative debt thresholds, depending on the performance category� It is determined based on the quality of the country’s Policies and Institutions, using a three-year average of its scores�
5� Nigeria is currently classified as a Medium Performer on the CPIA index, with a score of 3�41, along with such African countries as Ghana, Ethiopia, Sierra Leone and Mozambique� With Nigeria’s recent reclassification as a Lower-Middle-Income country, with prospects of accessing more funding from the non-concessional windows including International Capital Market (ICM), it is expected to be assessed along with such countries as India, Indonesia, Morocco, Pakistan, Tunisia, Mauritania, Egypt and
xi
DEBT SUSTAINABILITY ANALYSIS (DSA) REPORT
Kenya� However, in view of the fact that the bulk of the country’s Total Public Debt portfolio is at present largely Concessional, it would still be reasonable to adopt the revised and robust LIC-DSF Template that incorporates an expanded debt coverage, including both Concessional and Non-Concessional borrowings with provisions for country-specific tools for addressing peculiar country’s circumstances, going forward� The new LIC Template is expected to be released in July, 2018�
6� The DSA framework classifies countries into four broad categories, according to their probability of Debt Distress� These are:
i� Low Risk: Where all the debt ratios under the Baseline scenario and Stress tests are well below their respective Thresholds�
ii� Moderate Risk: Where all the Debt Ratios under the Baseline Scenario are well below their respective Thresholds, but with just a breach in one of the Debt Ratios under the Stress test�
iii� High Risk: Where one or more Debt Ratios breach the Thresholds over a prolonged period under the Baseline Scenario and Stress tests�
iv� In Debt Distress: A situation where a country is already experiencing difficulties in servicing its debts, as evidenced, for example by the existence of arrears�
7� Relevant Ministries, Departments and Agencies (MDAs) were involved in the exercise and provided the required macroeconomic data used for the DSA� These data include the following:
i� Total Public Debt of the FGN, State Governments, and the FCT (External and Domestic) and the FGN’s Contingent Liabilities - Debt Management Office;
ii� Monetary Sector Statistics and Private Sector External Debts- Central Bank of Nigeria;
iii� Pipeline External Loans and Projects - Federal Ministry of Finance;
iv� GDP and Inflation rates (Actual) - National Bureau of Statistics;
v� National Accounts Statistics – GDP (Nominal and Real), GDP Growth Rates, Inflation Rates (projected) - Federal Ministry of Budget and National Planning;
vi� Fiscal Accounts (projected) - Budget Office of the Federation; and,
vii� Fiscal Accounts (Actual) - Office of the Accountant-General of the Federation�

xii
DEBT SUSTAINABILITY ANALYSIS (DSA) REPORT
8� The 2017 DSA considered three main Scenarios, namely: Baseline, Optimistic and Pessimistic:
i The Baseline Scenario is anchored on the 2017 Federal Government’s annual Budget and its assumptions;as well as the provisional Medium-Term Expenditure Framework (MTEF), 2018-2020 (as it was yet to be approved by the National Assembly, at the time of the exercise)�
ii The Optimistic Scenario is hinged on the Federal Government’s Economic Blue-Print – the Economic Recovery and Growth Plan (ERGP), with its ambitious growth prospects of 4�80% in 2018 and 7�00% by year 2020� The ERGP is expected to reverse and pull the economy out of recession, as well as re-launch it on the path of sustained growth, while stabilizing the Monetary, External and Fiscal environments�
iii The Pessimistic Scenario assumes a prolonged shock in crude oil price at about US$30pb in 2017, which is maintained through 2019 and oil production at about 1�4 mbpd in 2017 and 2018, which is expected to marginally pick up to about 1�5mbp in 2019 through 2037; a deterioration in fiscal and current account balances, as well as further depreciation of the Naira exchange rate�
Baseline Scenario
A� External Debt Sustainability
10� The External Debt analysis covers the external debt of the FGN and the 36 States, including the FCT� The outcome of the analysis under the Baseline Scenario reveals that Nigeria’s External Debt Portfolio remains at a Low Risk of Debt Distress� The debt ratios are well below all of their respective thresholds throughout the projection period as shown in Table 1� External borrowing is projected to rise marginally between 2017 and 2033 and given Nigeria’s current status as a Lower-Middle-Income country more funds are expected from the commercial sources, including the International Capital Market (ICM)� Economic activities as measured by the GDP and Exports are projected to grow with increases in oil prices and production levels, which would impact positively on the revenue to government� It is also expected that infrastructure investments and various structural reforms that the government is implementing in the key sectors of the economy, will support Exports and boost productivity and overall economic growth�

xiii
DEBT SUSTAINABILITY ANALYSIS (DSA) REPORT
11� The outcome of the Stress Tests, indicates that Nigeria’s External Debt position is generally robust in the medium-term, while the impact of the shocks would lead to a deterioration of the revenue-based indicators in the long-term, if adequate measures are not taken to improve revenue and boost exports, as well as shore up the level of other forms of non-debt creating flows, such as Foreign Direct Investment (FDI)� The most extreme stress tests are shown in Table 1� Over the period 2017–2027, a shock which combines lower GDP growth, weaker exports, a lower GDP deflator, and a fall in non-debt creating flows would weaken the export and revenue indicators� For instance, the ratio of External Debt-to-Exports moved upwards from 46�5 percent in 2017 to 188�5 percent in 2019� In the same manner, the ratio of External Debt-to-Revenue increased from 73�4 percent in 2017 to 157�4 percent in 2022� The ratios of External Debt Service-to-Exports and External Debt-Service-to-Revenue also deteriorated throughout the projection period� Thus, indicating that Nigeria’s Total Debt portfolio is highly susceptible to Revenue shocks� There is, therefore the need to sustain the on-going reforms and initiatives aimed at boosting non-oil revenue by Government,which include the broadening of the tax base, increasing tax revenue collection, blocking of leakages, and the diversification of the economy� Some of these initiatives include the Voluntary Assets and Income Declaration Scheme (VAIDS)-a scheme that gives tax defaulters, limited tax amnesty to enable them regularise within a specified period their tax status, without incurring charges, penalties and exemption from prosecution; Electronic Payment and Filing System (e-Services) to cover e-Payments, e-Filing, e-Registration, e-Stamp Duty; Upward review of the excise duty rates for Alcoholic Beverages and Tobacco; and a review of the Pioneer Status, as part of efforts towards diversifying the economy�

xiv
DEBT SUSTAINABILITY ANALYSIS (DSA) REPORT
Table 1: Summary of External Debt Sustainability AssessmentDetails Threshold 2017 2018 2019 2020 2021 2022 2027 2037
External Debt StockIn percent of GDP 40Baseline 4�9 5�2 5�5 5�8 5�9 6�1 6�1 3�7Combined shocks 4�9 6�8 9�5 9�9 10�1 10�3 9�5 4�9In percent of Exports 150Baseline 46�5 57�0 72,6 66�0 57�9 61�4 71�6 66�3Combined shocks 46�5 91�1 188�5 167�9 146�5 153�0 160�4 118�9In percent of Revenue 250Baseline 73�4 74�0 81�0 86�1 89�1 93�1 94�5 70�0Combined shocks 73�4 96�4 141�4 147�9 152�6 157�4 147�4 93�0
External Debt ServiceIn percent of Exports 20Baseline 2�2 3�9 3�4 4�0 5�3 5�1 8�0 10�0Combined shocks 2�2 4�7 6�6 9�1 10�6 11�8 18�9 20�3In percent of Revenue 20Baseline 3�4 5�0 3�8 5�3 8�2 7�7 10�6 10�5Combined shocks 3�4 5�3 5�4 8�3 11�8 12�5 17�2 15�2Source: 2017 DSANote: The Thresholds are determined periodically by the WB/IMF, based on the CPIA Rating Exercise�
B� Total Public Debt Sustainability - Fiscal Sustainability Analysis (The Federation – FGN, States and FCT)
14� The analysis of the Fiscal Sustainability of the Federation covers the Domestic and External debt of the FGN, States and FCT, as well as their respective Revenues, including Internally Generated Revenues (IGRs)� The Fiscal Sustainability has only one threshold for the ratio of Total Public Debt-to-GDP, which is set at 56 percent for countries in Nigeria’s peer group� The result shows that Total Public Debt-to-GDP ratio remains below its threshold throughout the projection period as shown in Table 2� Meanwhile, the Revenue indicators - Total Public Debt to Revenue and Total Debt Service to Revenue do not have international thresholds, but rose from 290�4 percent in 2017 to 345�0 percent in 2022 and 44�9 percent in 2017 to 62�8 percent in 2027,respectively, after which they trended downward to 280�9 percent and 55�0 percent in 2037� These suggest that these indicators are vulnerable to revenue shocks�
15� The most extreme shocks which combine lower GDP growth, weaker exports, a lower GDP deflator and a fall in non-debt creating flows such as Foreign Direct Investments

xv
DEBT SUSTAINABILITY ANALYSIS (DSA) REPORT
(FDIs), would weaken the ratios of Total Public Debt-to-Revenue and Total Debt Service-to-Revenue throughout the projection period� Relative to the Baseline, the ratios of Total Public Debt-to-Revenue and Total Debt Service-to-Revenue rose considerably from 290�4 percent and 44�9 percent in 2017 to 1113�0 percent and 252�1 percent in 2037, respectively� Thus, reinforcing the need to further expand the revenue base of the country as earlier highlighted�
Table 2: Summary of Total Public Debt Sustainability Assessment(Federation – FGN, States and FCT)
Details Threshold 2017 2018 2019 2020 2021 2022 2027 2037Total Public Debt Stock
In percent of GDP 56Baseline 19�8 20�9 21�2 21�9 22�5 22�9 22�8 15�0Combined shocks 19�8 30�9 32�1 33�8 35�6 37�3 44�7 59�4In Percent of Revenue NilBaseline 290�4 293�2 309�9 320�2 333�6 345�0 349�9 280�9Combined shocks 290�4 431�8 467�6 494�7 528�1 561�6 685�5 1113�0
Total Public Debt ServiceIn Percent of Revenue Nil Baseline 44�9 46�2 47�0 48�9 53�9 55�0 62�8 55�0Combined shocks 44�9 46�1 69�7 85�6 97�4 104�2 141�4 252�1
Source: 2017 DSANote: Under the Fiscal Sustainability, the WM/IMF threshold is only applicable to the Total Public Debt to GDP, which is set at 56 percent�
In the light of the foregoing, it is very evident that Nigeria’s Total Public Debt portfolio is highly susceptible to Revenue shocks� Therefore, there is the need for concerted efforts to ensure faithful and effective implementation of the various on-going initiatives and interventions aimed at diversifying the sources of Government’s revenue away from oil�
Optimistic Scenario
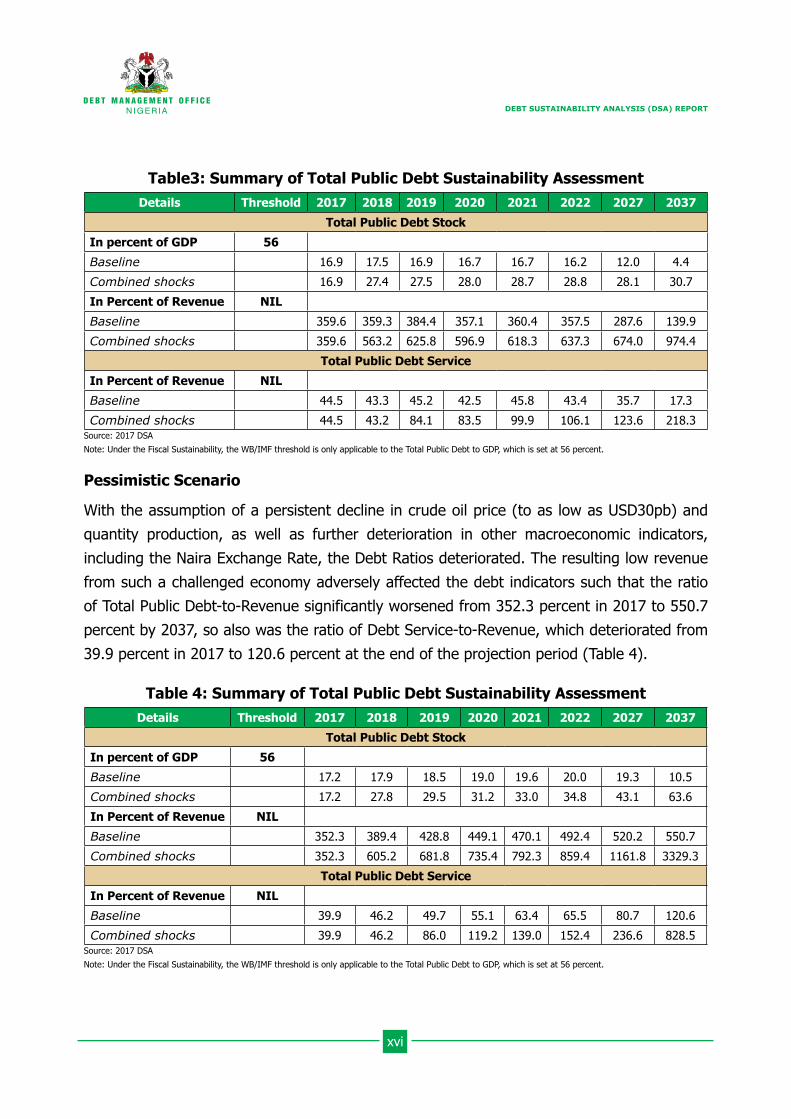
The Optimistic Scenario assumes the full implementation of the ERGP, the outcome of which resulted in a much stronger and robust Total Public debt ratios� The supposedly improved output and revenue favourably impacted on the debt indicators as the ratio of Total Public Debt-to-GDP declined steadily from 16�9 percent in 2017 to as low as 4�4 percent at the end of the projection period in 2037 (Table 3)� Similarly, the ratio of Total Debt Service-to-Revenue declined from 44�5 percent in 2017 to 17�3 percent in 2037�
xvi
DEBT SUSTAINABILITY ANALYSIS (DSA) REPORT
Table3: Summary of Total Public Debt Sustainability AssessmentDetails Threshold 2017 2018 2019 2020 2021 2022 2027 2037
Total Public Debt StockIn percent of GDP 56Baseline 16�9 17�5 16�9 16�7 16�7 16�2 12�0 4�4Combined shocks 16�9 27�4 27�5 28�0 28�7 28�8 28�1 30�7In Percent of Revenue NILBaseline 359�6 359�3 384�4 357�1 360�4 357�5 287�6 139�9Combined shocks 359�6 563�2 625�8 596�9 618�3 637�3 674�0 974�4
Total Public Debt ServiceIn Percent of Revenue NILBaseline 44�5 43�3 45�2 42�5 45�8 43�4 35�7 17�3Combined shocks 44�5 43�2 84�1 83�5 99�9 106�1 123�6 218�3
Source: 2017 DSANote: Under the Fiscal Sustainability, the WB/IMF threshold is only applicable to the Total Public Debt to GDP, which is set at 56 percent�
Pessimistic Scenario
With the assumption of a persistent decline in crude oil price (to as low as USD30pb) and quantity production, as well as further deterioration in other macroeconomic indicators, including the Naira Exchange Rate, the Debt Ratios deteriorated� The resulting low revenue from such a challenged economy adversely affected the debt indicators such that the ratio of Total Public Debt-to-Revenue significantly worsened from 352�3 percent in 2017 to 550�7 percent by 2037, so also was the ratio of Debt Service-to-Revenue, which deteriorated from 39�9 percent in 2017 to 120�6 percent at the end of the projection period (Table 4)�
Table 4: Summary of Total Public Debt Sustainability AssessmentDetails Threshold 2017 2018 2019 2020 2021 2022 2027 2037
Total Public Debt StockIn percent of GDP 56Baseline 17�2 17�9 18�5 19�0 19�6 20�0 19�3 10�5Combined shocks 17�2 27�8 29�5 31�2 33�0 34�8 43�1 63�6In Percent of Revenue NILBaseline 352�3 389�4 428�8 449�1 470�1 492�4 520�2 550�7Combined shocks 352�3 605�2 681�8 735�4 792�3 859�4 1161�8 3329�3
Total Public Debt ServiceIn Percent of Revenue NILBaseline 39�9 46�2 49�7 55�1 63�4 65�5 80�7 120�6Combined shocks 39�9 46�2 86�0 119�2 139�0 152�4 236�6 828�5
Source: 2017 DSANote: Under the Fiscal Sustainability, the WB/IMF threshold is only applicable to the Total Public Debt to GDP, which is set at 56 percent�
1
DEBT SUSTAINABILITY ANALYSIS (DSA) REPORT
Summary of Findings
a� The outcome of the analyses under the Baseline Scenario, revealed that Nigeria’s External Debt portfolio remained at a Low Risk of Debt Distress, as the debt ratios were well below all of their respective thresholds throughout the projection period�
b� The Fiscal Sustainability Analysis for the Federation (Federal, States and FCT) showed that the ratio of Total Public Debt-to-GDP remained below its threshold throughout the projection period� The ratio of Total Public Debt-to-GDP for 2017 was projected at 19�80 percent�
c� Both the External and Fiscal Sustainability Analyses showed that all the Revenue indicators (the ratios of Debt-to-Revenue and Debt Service-to-Revenue) deteriorated under varying shocks, suggesting that any prolonged shocks on the revenue would lead to Debt Distress in the medium to long-term, except other sources of revenue are speedily developed to enhance the revenue generation performance of the country
d� Under the Optimistic Scenario, the debt indicators showed remarkable improvements, while under the Pessimistic Scenario, all the indicators weakened throughout the projection period�
Conclusion
The result of the 2017 DSA exercise showed that Nigeria’s risk of debt distress remained Moderate, indicating a breach of the Threshold by just one of the Debt Portfolio Indicators (Total Public Debt Service to Revenue), when the portfolio is subjected to shocks (Stress Tests)� It further highlighted the vulnerability of the Debt Portfolio to shocks in Revenue and Exports, as well as substantial Currency devaluation�
Key Recommendations
The key policy recommendations of the 2017 DSA exercise are as follows:
Borrowing Limit
i� Considering the fact that the present Country-Specific threshold for Total Public Debt-to-GDP ratio of 19�39 percent elapses by December 31, 2017, even when the international threshold is 56 percent for countries in Nigeria’s peer group, it has become imperative that the self-imposed debt limit of 19�39 percent be

2
DEBT SUSTAINABILITY ANALYSIS (DSA) REPORT
reviewed upwards to a more prudent and optimal level of 25 percent in the medium-term of 2018-2020� The proposed new limit would afford the Government an ample room to mobilise additional resources to fund investment projects that would facilitate the turnaround of the economy, in line with the aspirations of the ERGP, without jeopardising the country’s debt sustainability�
ii� In order to estimate the borrowing limit for 2018, it requires the determination of the difference between the proposed Country-Specific Threshold of 25 percent and the end-period Total Public Debt-to-GDP ratio for 2017 for the Federation, projected at 19�80 percent� Therefore, the fiscal borrowing space left for the three-year period is 5�2 percent (i�e�25�00 percent less 19�80 percent), and based on the projected 2018 GDP of US$360�6 billion, the quantum of borrowing for 2018 will be 1�73 percent of US$360�6 billion, which translates to US$6�25 billion�Therefore, the maximum amount that could be borrowed (Domestic and External) for the fiscal year-2018 by the Government without violating the proposed Country-Specific Threshold of 25 percent up to 2020 would be US$6�25 billion or N1,906�37 billion (at N305/US$1)� Accordingly, for the fiscal year 2018, the maximum amount of US$6�25 billion that could be borrowed is proposed to be sourced equally (50:50) from the Domestic and External sources, respectively, as follows:
¾ New Domestic Borrowing US$3�125 billion (equivalent of about N953�18 billion); and,
¾ New External Borrowing: US$3�125 billion (equivalent of about N953�18billion)�
It is worthy to note that the borrowing space is a function of the size of the GDP, and these recommended limits are meant to provide a guide to Government’s borrowing activities for 2018, which would ensure that the self-imposed Debt Limit is not unduly breached�
Boosting Revenue Generation
iii� In line with the efforts at boosting non-oil revenue, Government is encouraged to sustain the on-going initiatives aimed at broadening the tax base and increasing tax revenue collection and blocking leakages, and diversification of the economy� Some of these initiatives have earlier been highlighted�
iv� Given that in the short to medium-term, oil would still remain a key revenue earner, the Federal Government is encouraged to further strengthen its machinery for achieving

3
DEBT SUSTAINABILITY ANALYSIS (DSA) REPORT
sustained peace and stability in the Niger Delta region of the country� This has become inevitable in view of the need to ensure steady and uninterrupted crude oil exploration and production in the region�
v� As part of the long-term initiatives for diversifying the economy and boosting non-oil revenue, the Federal Government is also encouraged to fast-track the implementation of its reforms in the Solid Minerals sector of the economy such as the establishment of the Solid Minerals Development Fund and to formalise Artisanal and Small-Scale Mining activities by automating Mining Cadastral Office operations etc� This will facilitate the opening up of this critical sector and make it more competitive, and revenue generating� It is expected that the increased revenue from this sector would favourably impact on public debt, by reducing Government borrowing needs and public debt stock in the long-term�
vi� In order to enable Government raise fresh funds to supplement its revenue for capital investments, Government is encouraged to privatise some of its viable enterprises and have them listed on The Nigerian Stock Exchange� Hence, the need for Government to sustain the on-going efforts aimed at reforming, restructuring and repositioning some of these enterprises for privatization or commercialization, including the Nigerian Postal Services (NIPOST), Nigerian Commodities Exchange, Lagos International Trade Fair Complex, National Stadia and Nigerian Security and Minting Company (NSPMC)� Aside saving government huge budgetary funds usually allocated for such entities annually, it will lead to wealth redistribution through public ownership of enterprises, as well as facilitate further deepening of the domestic capital market�
vii� As part of the on-going initiatives at attracting new investments into the economy and create new jobs, the Government is further encouraged to sustain its current efforts at implementing the Ease of Doing Business reforms, under the Presidential Enabling Business Environment Council (PEBEC)� This will help to boost non-debt creating investments such as FDIs, which will enhance the generation of tax revenue, and thus, a reduction in government borrowing in the long-term�
Optimizing Efficiency in Expenditure
viii� There is need to sustain Government’s initiatives at reducing wastages through plugging of leakages and fostering fiscal transparency, by strengthening the Efficiency Unit in the Federal Ministry of Finance� In addition, there is the need to fast-track the implementation of the Integrated Payroll and Personnel Information System (IPPIS)

4
DEBT SUSTAINABILITY ANALYSIS (DSA) REPORT
across the government MDAs to automate personnel records and salaries’ payment process�
ix� In view of the uncertainty around the resources accruing to all tiers of Government, as a result of the various shocks in the economy, State Governments need to be encouraged to implement effective fiscal reforms including the States’ 22-Point Fiscal Sustainability Plan (FSP), aimed at achieving improved accountability and transparency, increase public revenue, rationalise public expenditure, improve public financial management and manage debt sustainably at the sub-national level� This is expected to largely curtail the over-dependence on federal allocations and occasional Federal Government’s bail-outs�
Increase Investment in Critical Infrastructure to Promote the Development of the Real Sector
x� As part of efforts at mobilising additional financing for infrastructure development, there is need to encourage credible Private Sector entities, to invest in infrastructure through the issuance of Sovereign Guarantees to priority sector areas, with high-impact on the economy�
xi� There is also the need to creatively explore other alternative and viable sources of financing critical infrastructure projects, through Public-Private Partnership (PPP) arrangements – particularly Concessioning schemes to attract Private Sector to participate in the delivery of viable infrastructural projects, as well as the use of Project-tied Bonds such as Infrastructural Bonds and the Sukuk�
Upscale Capacity Building for Sub-nationals
xii� As part of efforts at enhancing overall public debt sustainability of the Federation (Federal and States), it is imperative to ensure the sustenance of the on-going DMO’s capacity building initiatives for the Sub-nationals (States), so as to upscale their technical competence and skills in public debt management� This would help to enhance public debt management practices at the sub-national level, and thus, help realise overall public debt sustainability�

5
DEBT SUSTAINABILITY ANALYSIS (DSA) REPORT
CHAPTER ONEINTRODUCTION
Nigeria undertakes the conduct of the Debt Sustainability Analysis (DSA) exercise on an annual basis� It is an exercise that takes into consideration a country’s ten-year historical macroeconomic data and twenty-year projected data to assess the level of risk of debt distress� The DSA Framework provides an objective assessment of debt sustainability in a given macroeconomic context, that outlines a country’s fiscal and monetary stance under certain assumptions and conditions�
The exercise ensures that the nation’s total Public Debt Portfolio is annually subjected to appropriate qualitative and quantitative analysis, by evaluating the country’s repayment capacity for its current and future debt obligations, in order to ascertain the level of risk of debt distress�
The outcome of last year’s (2016) DSA exercise showed that Nigeria’s debt position experienced some deterioration and slipped from a Low-risk of debt distress to a Moderate risk of debt distress� Although, the level of Total Public Debt Stock remained low relative to the country’s Gross Domestic Product (GDP), the Debt Portfolio was largely vulnerable to significant decline in Revenue, Exports and substantial Currency Devaluation� The ratio of Total Public Debt-to-GDP rose from 13�02 percent in 2015 to 16�27 percent as at December 31, 2016, which was still within the Country’s specific Debt Limit of 19�39 percent in the medium-term (up to December 31, 2017), and far below the World Bank/IMF’s threshold of 56�00 percent for countries in Nigeria’s peer-group� The ratio of Public Debt Service-to-Revenue at 33�94 percent as at December 31, 2016, was relatively higher reflecting low government revenue, in the face of lower oil revenue�
While Nigeria’s Total Public Debt Stock is relatively low vis-à-vis the country’s GDP, the increased funding requirements needed to sustain the Economic recovery, address the huge infrastructural deficit, as well as meet budget financing requirements, would entail enormous funding resources, including borrowing� Based on the Country’s Economic Blue Print – the Economic Recovery and Growth Plan (ERGP), 2017-2020, which was launched in April 2017, fiscal deficit for the period is projected to average at 1�93 percent of GDP, which is still within the 3 percent stipulated by the Fiscal Responsibility Act, 2017� The proposed debt financing is expected to be in line with the country’s Debt Management Strategy, 2016-2019, which aims at restructuring the debt portfolio, in such a way as to achieve an optimal mix of 60:40

6
DEBT SUSTAINABILITY ANALYSIS (DSA) REPORT
(domestic to external), so as to also reduce overall Debt Servicing costs of the portfolio� Thus, the proposed funding plan in the current MTEF, 2018-2020, indicates a gradual increase in the share of foreign financing relative to domestic financing� This is expected to drastically reduce the overall cost of borrowing and also address the challenge of crowding out the private sector from the domestic debt market�
The 2017 National Debt Sustainability Analysis (2017 DSA) Workshop was organised by the Debt Management Office (DMO) from August 21-30, 2017, in collaboration with relevant Ministries, Departments and Agencies (MDAs), namely: the Federal Ministry of Finance (FMF), Central Bank of Nigeria (CBN), Federal Ministry of Budget and National Planning (FMBNP), Budget Office of the Federation (BOF), National Bureau of Statistics (NBS), and the Office of the Accountant-General of the Federation (OAGF) and Securities and Exchange Commission (SEC)� The West African Institute for Financial and Economic Management (WAIFEM), as in the past, provided technical support�
The 2017 DSA considered three main scenarios, namely: Baseline, Optimistic and Pessimistic:
i� The Baseline Scenario is anchored on the 2017 Federal Government’s annual Budget and its assumptions; as well as the provisional Medium-Term Expenditure Framework (MTEF), 2018-2020 (as it was yet to be approved by the National Assembly, at the time of the exercise)�
ii� The Optimistic Scenario is hinged on the Federal Government’s Economic Blue-Print – the Economic Recovery and Growth Plan (ERGP), with its ambitious growth prospects of 4�80% in 2018 and 7�00% by year 2020� The ERGP is expected to reverse and pull the economy out of recession, as well as re-launch it on the path of sustained growth, while stabilizing the Monetary, External and Fiscal environments�
iii� The Pessimistic Scenario assumes a prolonged shock in crude oil price at about US$30pb in 2017, which is maintained through 2019 and oil production at about 1�4 mbpd in 2017 and 2018, which is expected to marginally pick up to about 1�5mbp in 2019 through 2037; a deterioration in fiscal and current account balances, as well as further depreciation of the Naira exchange rate�
1�1 Policy ObjectivesThe purpose of the 2017 DSA is to assess the country’s capacity to finance its policy objectives and service its current and future debt obligations, without unduly large adjustments, which

7
DEBT SUSTAINABILITY ANALYSIS (DSA) REPORT
may compromise its macroeconomic stability, growth and development� The policy objectives include, to:
i� update the 2016 DSA, in the light of the improvements recorded in the growth of oil revenue attributed to stabilizing commodities prices and foreign exchange risks;
ii� assess the current and future public debt portfolio of the country, in view of the anticipated borrowing by the present Administration to fund critical infrastructure;
iii� identify any vulnerabilities in the debt portfolio or government’s policy framework and proffer corrective measures;
iv� guide the government in its borrowing decisions, so as to ensure that the government’s financing needs and future repayment ability are taken into account;
v� advise the government on its borrowing limits and financing options for 2018;
vi� provide inputs into the national budget and information necessary for updating the Medium-Term Expenditure Framework (MTEF); and,
vii� align the 2017 DSA with the subsisting Debt Management Strategy, which aims at achieving strategic debt composition of 60:40 ratio for domestic and external debts, respectively, as well as attaining the domestic debt mix of 75:25 ratio for long to short-term debts, by the end of the strategy period in 2019�
1�2 MethodologyThe 2017 DSA exercise adopted the latest version of the joint World Bank/IMF Debt Sustainability Framework for Low-Income Countries (DSF-LICs), which was released in August, 2015� The DSF for low-income countries is used mainly by countries with greater funding from concessional sources� The DSF-LIC provides indicative debt thresholds that reflect the quality of a Country’s Policies and Institutions� It is based on the World Bank/IMF’s Country Policy and Institutional Assessment (CPIA) index ranking, with a scale of 1 to 6, and classifies countries into one of the three policy performance categories: Weak Policy (CPIA<3�25); Medium Policy (3.25≤CPIA≤3.75); and, Strong Policy (CPIA >3.75), and applies different indicative debt thresholds, depending on the performance category� It is determined based onthe quality of the country’s Policies and Institutions, using a three-year average of its scores�
Nigeria is currently classified as a Medium Performer on the CPIA index, with a score of 3�41, along with such African countries as Ghana, Ethiopia, Sierra Leone and Mozambique� With Nigeria’s recent reclassification as a Lower-Middle-Income country, with prospects of

8
DEBT SUSTAINABILITY ANALYSIS (DSA) REPORT
accessing more funding from the non-concessional windows including International Capital Market (ICM), it is expected to be assessed along with such countries as India, Indonesia, Morocco, Pakistan, Tunisia, Mauritania, Egypt and Kenya� However, in view of the fact that the bulk of the country’s Total Public Debt portfolio is at present largely Concessional, it would still be reasonable to adopt the revised and robust LIC-DSF Template that incorporates an expanded debt coverage, including both Concessional and Non-Concessional borrowings with provisions for country-specific tools for addressing peculiar country’s circumstances, going forward� The new LIC Template is expected to be released in July, 2018�
Accordingly, the debt burden thresholds comprise: one solvency threshold for the fiscal block (combined external and domestic debt), which is the: Present Value (PV) of Total Public Debt-to-GDP ratio set at 56 percent for countries in Nigeria’s peer group� In addition, there are five (5) Debt Burden Indicators in the external block – three (3) Solvency and two (2) Liquidity measures (Table 1�1)� The solvency measures comprise the PV of External Debt-to-GDP ratio, 40 percent; the PV of External Debt-to-Revenue ratio, 250 percent; and, the PV of External Debt-to-Exports ratio, 150 percent� The liquidity thresholds include the External Debt Service-to-Revenue ratio, 20 percent and the External Debt Service-to-Exports ratio, 20 percent�
Table 1�1: Fiscal and External Debts ThresholdsQualities of Policies
and Institutions (CPIA)
Solvency Ratios Liquidity RatiosFiscal External External External External External
NPV of Debt as a % of Debt Service as a % ofGDP GDP Revenue Export Revenue Export
Weak 38 30 200 100 25 15Medium 56 40 250 150 20 20Strong 74 50 300 200 35 25
Source: World Bank/IMF
In the 2017 DSA, the country’s debt sustainability was assessed based on the Baseline, Optimistic and Pessimistic scenarios for over a 20-year projection period, 2017-2037, under various assumptions� The outcomes of the exercise were used to compare the country’s debt sustainability indicators against internationally established debt burden thresholds, which measure the solvency and liquidity positions of the country�
The DSA framework classifies countries into four broad categories, according to their probability of Debt Distress� These are:

9
DEBT SUSTAINABILITY ANALYSIS (DSA) REPORT
i� Low Risk: Where all the debt ratios under the Baseline scenario and Stress tests are well below their respective Thresholds�
ii� Moderate Risk: Where all the Debt Ratios under the Baseline Scenario are well below their respective Thresholds, but with just a breach in one of the Debt Ratios under the Stress test�
iii� High Risk: Where one or more Debt Ratios breach the Thresholds over a prolonged period under the Baseline Scenario and Stress tests�
iv� In Debt Distress: A situation where a country is already experiencing difficulties in servicing its debts, as evidenced, for example by the existence of arrears�
1�3 Scope of the 2017 DSA Data CoverageThe scope of data coverage comprised Total Public Debt of the FGN, debt of the State Governments, including FCT (External and Domestic)� The FGN’s Contingent Liabilities and Private Sector external debts were also included, because of their wider implications for public debt sustainability� These data were incorporated in the analysis to further enhance the robustness of the 2017 DSA exercise� The domestic debt data of State Governments for 2016 was used in the baseline debt data� The analytical tool provided macroeconomic indicators and variables across the four sectors of the economy (Real, Fiscal, Monetary and External), which are as follows:
i� Total Public Debt of the FGN, State Governments, and the FCT (External and Domestic) and the FGN’s Contingent Liabilities - Debt Management Office;
ii� Monetary Sector Statistics and Private Sector External Debts- Central Bank of Nigeria; iii� Pipeline External Loans and Projects - Federal Ministry of Finance;iv� GDP and Inflation rates (Actual) - National Bureau of Statistics;v� National Accounts Statistics – GDP (Nominal and Real), GDP Growth Rates, Inflation
Rates (projected) - Federal Ministry of Budget and National Planning;vi� Fiscal Accounts (projected) - Budget Office of the Federation; and, Fiscal Accounts (Actual) - Office of the Accountant-General of the Federation
The analysis was conducted using 10-year historical data1, which was projected for twenty (20) years to 2037, using 2016 data as base year, and 2017 as the first year of projection�
1 Nigeria, like many low-income countries uses cash basis of accounting, which limits the DSA data to only actual cash flows, as against the accrual accounting principle that recognizes non-cash based assets� Hence, net-worth basis was not considered� However, relevant agencies of the FGN are understudying ways and means of IPAS application�

10
DEBT SUSTAINABILITY ANALYSIS (DSA) REPORT
This is based on the perspective that debt sustainability analysis is a forward-looking concept that requires long-term projections�
1�4 Benefits of 2017 DSAThe outcomes of the 2017 DSA exercise provide the status of the Nigeria’s debt sustainability compared to international thresholds and other debt and macroeconomic indicators� The benefits to be derived from conducting 2017 DSA, include the following:
i� to evaluate the solvency and liquidity status of the country’s total public debt portfolio, taking into account current and future debt service obligations;
ii� to determine the fiscal space available to the government for meeting its funding requirements with a view to determing the borrowing limit, given the current debt level;
iii� to guide the government on optimal funding options for its projects and programmes;
iv� to detect current and potentialfuture fiscal stress that might be caused by external shocks with a view to preventing and resolving the crises;
v� to evaluate the risks inherent with the current total debt portfolio and proffer mitigating measures; and,
vi� to examine the impact of on-going fiscal policy reforms of the present government and monetary policy objectives of the CBN on public debt management strategies and provide policy advice in these regards�
This Report is divided into seven chapters, with the introduction as chapter one� Chapter two presents the recent macroeconomic developments in the global and domestic economies, as well as provides the future outlook� Chapter three provides analyses of the country’s outstanding debt portfolio as at December 31, 2016, while chapter four reviews the risks associated with the total public debt portfolio of the FGN� Chapter five outlines the assumptions underpinning the Baseline, Optimistic and Pessimistic Scenarios used in the exercise� Chapter six analyses the results of the data simulation exercises, contains the determination of borrowing limit of the FGN for 2018, while Chapter seven presents the key findings and recommendations of the 2017 DSA exercise�

11
DEBT SUSTAINABILITY ANALYSIS (DSA) REPORT
CHAPTER TWORECENT MACROECONOMIC DEVELOPMENTS
2�1 External DevelopmentsThe global economy grew at the 3�2 percent in 2016, a slight improvement over the 3�1 percent in 2015� The lackluster performance in 2016 reflected the weaker-than-expected economic activity in the United States and slowdown in China, as well as the Brexit vote, which created economic, political and institutional uncertainties in the United Kingdom and the rest of the European Union� Growth in the emerging market and developing economies remained uneven and weak in 2016, as large economies in the sub-Saharan Africa such as Nigeria and Angola experienced recession, exacerbated by low commodity prices in conjunction with difficult domestic political and economic conditions�
Recovery is projected to pick up in 2017, as outlook improves for emerging market and developing economies and the U�S� economy continues to gain momentum� The global growth forecasts for 2017 and 2018 were projected at 3�5 and 3�6 percent, respectively (July 2017 IMF’s World Economic Outlook)� Economic activity for advanced economies was projected at 2�0 percent in 2017, up from 1�7 percent in 2016� The emerging market and developing economies are projected to grow from 4�3 percent in 2016 to 4�6 percent in 2017, and 4�8 perecent in 2018� The economies of emerging and developing Europe, is projected to pick up from 3�0 percent in 2016 to 3�5 percent in 2017, primarily driven by a higher growth forecast for Turkey and gradual recovery in Russia� The growth forecast for the U�S� economy for 2017 was projected at 2�1 percent, an increase of 0�5 percent over the 2016 growth rate, due to a moderate pick up in economic activity, while the Euro area economies is expected to record a modest growth of 1�9 percent in 2017, up from 1�8 percent 2016� China’s growth is expected to remain at 6�7 percent 2017, the same level as in 2016, reflecting a delay in the needed fiscal adjustment, especially the economy’s transition away from reliance from high public investment to greater dependence on consumption and services� In Sub-Saharan Africa, the outlook remains challenging as some of the big economies are emerging from recession� Growth is projected to rise from 1�3 percent in 2016 to 2�7 percent in 2017, and 3�5 in 2018, amid rebound in commodities prices, restoration of business confidence and reduced political uncertainties in the sub-region� Nigeria is forecast to emerge from recession and grow from -1�6 percent in 2016 to 0�8 percent in 2017 and 1�9 percent in 2018�

12
DEBT SUSTAINABILITY ANALYSIS (DSA) REPORT
2�2 Domestic DevelopmentsNigeria was in recession in 2016 with a negative growth rate of -1�58 percent, from a growth rate of 2�79 percent in 2015, as shown in Table 2�1� This development was attributed to some factors, which include the collapse in oil prices in the international oil market from an average price of over US$51�99 per barrel in 2015 to less than US$43�74 per barrel in 2016, banning of 41 items from official foreign exchange sources, continued slide in the Naira exchange rate and the high cost of production influenced by shortage of Premium Motor Spirit (PMS) and power outages� Other factors included oil production shock, slowdown in private sector credit growth, low capital budget releases and spending, decline in domestic demand and insurgency which suppressed economic activities� The slowed growth recorded in 2016 was driven by Non-Oil and the Oil sectors� In the non-oil sector, Manufacturing, Trade, Accommodation and Food Services, and Utilities sectors shrank during the review period� With the country’s population growth rate of about 3�2 percent per annum, the GDP per capita contracted from US$2,590�35 in 2015 to US$1,826�99 in 2016� The consumer price inflation rose from a single digit of 9�6 percent in 2015 to a double digit of 18�6 percent in 2016� This was attributed to the high cost of transportation induced by the effect of exchange rate pass-through to domestic prices and structural challenges, imported inflation, and food shortages associated with security challenges in the North East�
Table 2�1: Recent Macroeconomic Developments, 2012-2016Indicators 2012 2013 2014 2015 2016
Real GDP Growth Rate (%) 4�21 5�49 6�22 2�79 -1�58
Annual GDP Deflator (2010=100) (% Annual Change) 9�27 5�87 4�66 2�86 9�54
Headline Inflation Rate (%) 10�0 8�0 8�0 9�6 18�55
Actual Overall Fiscal Deficit (% of GDP) 2�4 1�4 0�94 1�64 2�37
End-Period Exchange Rate (N) 156�05 155�98 169�68 196�50 305
Current Account Position (US$’Billions)* 17�52 19�21 0�91* -15�44 2�72
Total Public Debt-to-GDP Ratio (%) 22�43 12�65** 12�65 13�02 16�27
External Reserve Stock (US$’Billion) 43�83 42�85 34�24 28�28 26�99Sources: NBS, CBN, OAGF, and DMONote: Total Public Debt-to-GDP ratio include States’ Domestic Debt stock *Revised figures from CBN**Total Public Debt-to-GDP ratio post-rebasing
The actual revenue and expenditure of the Federal Government for fiscal year 2016 were N2,856�55 billion and N5,259�93 billion, respectively, compared to N3,209�57 billion and N4,767�37 billion in 2015� The overall fiscal deficit was N2,403�38 billion in 2016, while the

13
DEBT SUSTAINABILITY ANALYSIS (DSA) REPORT
overall fiscal deficit-to-GDP ratio increased to 2�37 percent in 2016, from 1�64 percent in 2015� The revenue estimate of the 2016 Federal Government Budget was based on oil price benchmark of US$38 per barrel�
In the external sector, provisional figures revealed that the sector improved slightly and recorded an overall balance of payments deficit of 0�2 percent of GDP, occasioned by lower import bills arising from the structural reforms in the foreign exchange market, rebound in prices in the international oil market, reduced financial out-flows and sustained increase in remittances� The external reserves fell by 6�5 percent from US$28�28 billion in 2015 to US$26�99 billion as at end-December, 2016, due largely to demand pressure and was adequate to finance 9�2 months of import� The current account position swung from a deficit of 3�2 percent of GDP in 2015 to a surplus of 0�7 percent of GDP in 2016, driven largely by improved trade balance arising from lower non-oil imports�
Owing to intense pressure from excessive demand and capital reversal in the foreign exchange market, the CBN the discontinued sale of foreign exchange to Bureau-De-Change (BDC) operators in January 2016, and resumed foreign currency deposits in commercial banks in order to maintain relative stability in the foreign exchange market, and conserve external reserves� However, owing to the inability to curb the demand pressure, the Bank adopted a more flexible exchange rate system on June 20, 2016 with the merger of the inter-bank and the autonomous segments into a single foreign exchange market – the interbank market� The features of the system include: greater flexibility in the determination of exchange rate of the naira through a 2-way quote system; introduction of tenured derivatives futures and forwards of 1 month, 2 months, 3 months, 6 months, 9 months, 12 months, 18 months and 24 months tenors; and the introduction of foreign exchange primary dealers� In July 2016, the Bank directed all authorised dealers that serve as agents to approve International Money Transfer Operators (IMTOs) to sell foreign currency accruing from inward money remittances to licensed BDCs� Following the development, the exchange rate depreciated at both the Interbank and Bureau De Change (BDC) segments of the foreign exchange market� The average exchange rate of the naira at the interbank segment depreciated against the US dollar by 22�9 percent to N253�29 per US dollar in 2016� It also depreciated by 40�2 percent to N372�91 per US dollar at the BDC, compared with N222�79 in 2015� Thus, the premium between the annual average interbank and BDC rates in 2016 closed at 47�1 percent, exceeding the internationally accepted benchmark of 5�0 percent� In the monetary sector, provisional data for 2016 showed that Broad Money Supply (M2) increased by 18�4 percent as at end-December, 2016, in contrast to the growth of 5�9 percent in the corresponding period

14
DEBT SUSTAINABILITY ANALYSIS (DSA) REPORT
of 2015� The Monetary Policy Rate (MPR) was increased to 14�00 percent from 11�00 percent in the preceding year, reflecting the CBN’s contractionary monetary policy stance aimed at sustaining the stability of the financial system� The weighted average prime and maximum lending rates rose by 0�13 and 1�71 percentage points to 17�09 percent and 28�55 percent, respectively� In the Interbank money market, the weighted average inter-bank call rate rose to 15�67 percent from 12�15 percent as at end December, 2015, while the Open-Buy-Back (OBB) rate declined to 10�39 percent, from 12�69 percent�

15
DEBT SUSTAINABILITY ANALYSIS (DSA) REPORT
CHAPTER THREEPUBLIC DEBT PORTFOLIO REVIEW
3�1 Nigeria’s Total Public Debt OutstandingThe Nigeria’s total public debt outstanding as at December 31, 2016, was N17,360,009�57 million (US$57,391�43 million), compared to N12,603,705�28 million (US$65,428�53 million) in 2015, representing an increase of N4,756,304�30 million or 37�74 percent in Naira term, but a decrease of US$8,037�00 million or 12�00 percent in the dollar terms� The incongruence in the total debt stock between the two currencies reflected the difference in exchange rates for the periods� The increase in public debt stock was due to additional issuances for funding of the appropriated 2016 budget deficit, at a larger fiscal deficit of 2�14 percent of GDP compared to 1�09 percent in 2015 and refinancing/redeeming matured securities, as well as the depreciation of the Naira against the US Dollar as a result of the liberalization of the exchange rate system� The external debt was N3,478,915�40 million (US$11,406�28 million), or 20�04 percent, while domestic debt was N13,881,094�18 million (US$45,985�25 million), or 79�96 percent� The domestic debt stock comprised securitised Federal Government of Nigeria debt of N11,058,204�30 million (US$36,256�41 million) or 63�70 percent as at December 31, 2016, and domestic debt stock of N2,822,889�88 million (US$9,728�84 million) or 16�26 percent for the 36 States and the FCT, as at September 30, 2016, as the collation and validation of the States’ domestic data occur with some time lag�

16
DEBT SUSTAINABILITY ANALYSIS (DSA) REPORT
Table 3�1: Nigeria’s Total Public Debt Outstanding, 2012-20162012 2013 2014 2015 2016
FGN Debt Stock
External Debt Stock*
US$’ Million 6,527�07 8,821�90 9,711�45 10,718�43 11,406�28
NGN’ Million 1,016,721�69 1,373,569�83 1,631,523�60 2,111,530�71 3,478,915�40
% Share of Total 11.17 13.68 14.34 16.38 20.04
as % of GDP 2.50 1.73 1.81 2.13 3.23
FGN’s Domestic Debt Stock
US$’ Million 41,969�16 45,722�41 47,047�77 44,857�85 36,256�41
NGN’ Million 6,537,536�05 7,118,979�86 7,904,025�47 8,836,995�86 11,058,204�30
% Share of Total 71.79 70.88 69.47 68.56 63.70
as % of GDP 16.10 8.97 8.79 8.93 10.28
States’ Domestic Debt Stock
US$’ Million 9,961�16 9,965�64 10,967�06 9,852�25 9,728�84**
NGN’ Million 1,551,650�13 1,551,650�13 1,707,571�14 1,655,178�71 2,822,889�88**
% Share of Total 17.04 15.45 16.19 15.06 16.26
as % of GDP 3.82 1.95 2.05 1.96 2.76
Nigeria’s Total Public Debt Stock
US$’ Million 58,457�39 64,509�95 67,726�28 65,428�53 57,391�53
NGN’ Million 9,105,907�87 10,044,198�82 11,243,120�22 12,603,705�28 17,360,009�57
as % of GDP 22.43 12.65 12.65 13.02 16.27Source: DMO*External Debt includes States’ External Debt**Actual Domestic Debt Stock for 36 States & FCT as at end-September, 2016
Table 3�1 further shows that the ratio of Nigeria’s Total Public Debt-to-GDP was 16�27 percent in 2016, compared to 13�02 percent in 2015� This ratio was still within the Country’s specific limit of 19�39 percent in the medium-term, up to December 31, 2017, and far below the World Bank/IMF’s threshold of 56�00 percent for countries in Nigeria’s peer-group, as well as WAMZ convergence threshold of 70�00 percent� Figure 3�1 shows the trend in total public debt outstanding for a five-year period (2012-2016)�

17
DEBT SUSTAINABILITY ANALYSIS (DSA) REPORT
Figure 3�1: Trend in Nigeria’s Total Public Debt Outstanding, 2012-2016
Source: DMO
3�2 FGN’s Total Public Debt ServiceThe FGN’s Total Public Debt Service reduced from US$5,499�24 million in 2015 to US$4,381�82 million as at December 31, 2016 (Table 3�2)� The reduction by US$1,117�42 million or 20�32 percent was as a result of the decline in the FGN domestic debt stock from US$44,857�85 million in 2015 to US$36,256�41 million in 2016, which led to the significant decrease in domestic debt service by US$1,139�45 million or 22�05 percent� However, debt service payments on external debt marginally increased to US$353�09 million in 2016, from US$331�06 million in 2015, due to the additional disbursements on existing commitments during the year�
Table 3�2: FGN’s Total Public Debt Service, 2012-2016 (US$’ Million)2012 2013 2014 2015 2016
External Debt Service 293.00 297.32 346.72 331.06 353.09
% Share of Total (5.96) 5.39 (6.30) (6.02) (8.06)
Domestic Debt Service 4,625.72 5,223.35 5,153.63 5,168.18 4,028.73
% Share of Total (94.04) 94.61 (93.70) (93.98) (91.94)
Total 4,918.72 5,520.67 5,500.35 5,499.24 4,381.82Source: DMOOfficial CBN Exchange Rate of N305�00/US$1 as at 31/12/2016, was used for 2016
Figure 3�2 shows that the FGN’s total debt service payments witnessed an upward trend from 2012 to 2013� It stabilized from 2014 to 2015, before declining in 2016� Although external debt service increased in 2016 to US$353�09 million, from US$331�06 million in 2015, domestic debt service declined significantly from US$5,168�18 million in 2015 to US$4,028�73 million in

18
DEBT SUSTAINABILITY ANALYSIS (DSA) REPORT
2016� The high proportion of domestic debt service relative to external debt service was due to increased quantum of domestic borrowing used to finance budget deficit over the years�
Figure 3�2: Trends in FGN’s Total Debt Service, 2012-2016
Source: DMO
3�3 Nigeria’s External Debt StockNigeria’s external debt stock outstanding was US$11,406�28 million as at December 31, 2016, compared to US$10,718�43 million as at end of the corresponding period in 2015 (Table 3�3), representing an increase of US$687�85 million or 6�42 percent in the period under review� The increase was attributable to additional disbursements of multilateral and bilateral loans, as well as net adverse cross exchange rate movements among the different currencies in the external loan portfolio� The external debt stock maintained an upward trajectory, as Government continued to fund its external borrowing requirements from the concessional sources over the years�

19
DEBT SUSTAINABILITY ANALYSIS (DSA) REPORT
Table 3�3: External Debt Outstanding by Source, 2012-2016 (US$’ Million)SOURCE 2012 2013 2014 2015 2016
A� Official:1. Bilateral 703�03 1,025�70 1,412�07 1,658�00 1,918�062. Multilateral 5,267�42 6,275�20 6,799�36 7,560�43 7,988�22
Sub-Total 5,970�45 7,300�90 8,211�43 9,218�43 9,906�28B� Private:
1. Eurobonds 500�00 1,500�00 1,500�00 1,500�00 1,500�002. Other Commercial 56�63 21 0 0 0
Sub-Total 556�63 1,521�00 1,500�00 1,500�00 1,500�00Grand Total 6,527�07 8,821�90 9,711�45 10,718�43 11,406�28
Creditor Category as % of TotalA� Official:
1. Bilateral 10�77 11�63 14�54 15�47 16�822. Multilateral 80�70 71�13 70�01 70�54 70�03
Sub-Total 91�47 82�76 84�55 86�01 86�85B� Commercial:
1. Eurobonds 7�66 17 15�45 13�99 13�152. Other Commercials 0�87 0�24 0�00 0�00 0�00
Sub-Total 8�53 17�24 15�45 13�99 13�15Grand Total 100 100 100 100 100
Source: DMO Based on CBN Official Exchange Rate of $1 to N305 as at December 31, 2016
3�4 Nigeria’s External Debt ServiceThe external debt service was US$353�09 million as at December 31, 2016, compared to US$331�06 million as at December 31, 2015, representing an increase of US$22�03 million or 6�65 percent� Table 3�4 shows that a significant portion of external debt service payments were to the Multilateral creditors and holders of Eurobonds accounting for US$165�33 million or 46�82 percent and US$91�26 million or 25�85 percent of the total external debt service, respectively� The sum of US$63�38 million or 17�95 percent was paid to the Bilateral creditors, while the remaining US$33�12 million or 9�38 percent was payment made in respect of Oil Warrants and Agency Fees2� Table 3�4 shows the detailed breakdown of debt service by creditor category�
2 These are payments made in respect of the outstanding Oil Warrants associated with the Par Bonds of the London Club, which was exited in 2007, including the Legal Advisory Services for the transactions� The Oil Warrants originally consisted of 1,758,796 million units, worth US$400 million in value, with an annual service obligation of US$52�70 million� In 2007, the Federal Government repurchased 396,154 (20�98%) units of the Oil Warrants, leaving a balance of 1,390, 642 units� The annual debt service obligations in respect of the remaining 1,390, 642 units of Oil Warrants amounts to US$41�72 million� The Principal amount of the Bonds will be repaid by a single payment by November, 2020�

20
DEBT SUSTAINABILITY ANALYSIS (DSA) REPORT
Table 3�4: FGN’s External Debt Service, 2012-2016 (US$’ Million)Source 2012 2013 2014 2015 2016
A� Official 1. Bilateral 45�28 41�08 48�93 59�42 63�382. Multilateral 126�92 142�89 152�74 138�65 165�33
B� Commercial 1. Eurobonds 33�75 33�75 91�26 91�26 91�262. China Loans (Alcatel, ZTE, Omotosho) 45�32 37�88 12�06 0 0
C� Others 1. Oil Warrant 41�72 41�72 41�72 41�72 20�862. Agency Fees 0�01 0�01 0�01 0�01 12�26
Grand Total 293�00 297�33 346�72 331�06 353�09Source: DMO¹Outstanding Oil Warrants, which were associated with the London Club debt were exited in 2007�
3�5 Federal Government of Nigeria’s Domestic Debt StockThe securitized Federal Government’s domestic debt stock outstanding was N11,058�20 billion as at December 31, 2016, compare to N8,837�00 billion as at December 31, 2015, representing an increase of N2,221�21 billion or 25�14 percent� The growth in stock was as a result of more issuances of FGN bonds and Nigerian Treasury Bills used to finance the 2016 appropriated budget deficit and to refinance matured government securities� Table 3�5 shows that as at December 31, 2016, the FGN’s domestic debt stock comprised mainly: FGN bonds (68�41 percent), Nigerian Treasury Bills (NTBs) (29�64 percent) and Treasury Bonds (1�95 percent)�
Table 3�5 FGN’s Domestic Debt Outstanding by Instruments, 2015 & 2016 (N’ Billion)
Instrument 2015 2016
FGN Bonds 5,808�14 7,564�94(% share of Total) (65�73) (68�41)
Nigerian Treasury Bills 2,772�87 3,277�28(% share of total) (31�38) (29�64)Treasury Bonds 255�99 215�99(% share of total) (2�90) (1�95)
Total 8,837�00 11,058�21Source: DMO
3�6 FGN’s Domestic Debt ServiceThe FGN’s Domestic Debt Service for the year 2016, amounted to N1,228�76 billion compared to N1,018�13 billion in 2015, representing an increase of N210�63 billion or 20�69 percent

21
DEBT SUSTAINABILITY ANALYSIS (DSA) REPORT
(Table 3�6)� The debt service comprised principal repayment of N25�00 billion and interest payment of N1,203�76 billion� By instrument-type, FGN Bonds’ debt service accounted for 68�41 percent of the total debt service payment, while payments in respect of the Nigerian Treasury Bills (NTBs), and Treasury Bonds were 27�31 and 4�39 percent, respectively� The trend analysis shows a steady rise in FGN’s domestic debt service payments from 2012 to 2016, arising from the growth of domestic debt stock with higher interest rates (Figure 3�3)�
Table 3�6: FGN’s Domestic Debt Service Payments, 2012 - 2016 (N’ Million)Instruments 2012 2013 2014 2015 2016
NTBs 310,792�71 262,767,69 300,267�31 324,062�86 335,583�04FGN Bonds 354�078�61 482,415�75 511,778�24 635,432�78 839,179�67
Treasury Bonds 55,680�63 48,916�56 53,763�63 58,635�13 53,998�50
Development Stock 0�00 0�00 0�00 0�00 0�00Total Debt Service 720,549�95 794,104�93 865,809�18 1,018,130�76 1,228,761�21
Source: DMO
Figure 3�3: Trends in FGN’s Domestic Debt Service Payments, 2012-2016 (N’ Billion)
Source: DMO
3�7 States’ & FCT’s Domestic Debt by Maturity StructureThe Total Domestic Debt of the thirty-six (36) States and the FCT in 2016 was N2,822�89 billion compared to N1,655�18 billion in 2015, indicating an increase of N1,167�71 billion or 70�55 percent� Further analysis of the States’ and FCT’s domestic debt by maturity shows that the share of short-term debt (36 percent) and the share of the medium/long-term debt (64 percent) were maintained in 2016, when compared to the composition of 45:55 in 2015�

22
DEBT SUSTAINABILITY ANALYSIS (DSA) REPORT
Table 3�7: States’& FCT’s Domestic Debt by Maturity, 2012-2016 (N’ Million)Description 2012 2013 2014 2015 2016
Short-Term Debt (ST)¹ 682,726�06 522,740�29 893,796�50 893,796�50 1,016,240�36Medium/Long-Term Debt
(MLT)²868,924�07 1,014,731�16 761,382�20 761,382�20 1,806,649�52
Total 1,551,650�13 1,537,471�45 1,655,178�71 1,655,178�71 2,822,889�88ST as a % of Total 44 44 54 54 36
MLT as a % of Total 56 56 46 46 54Source: DMONotes: ¹ Debts with up to 1 year remaining maturity ² Debts with more than I year remaining maturity

23
DEBT SUSTAINABILITY ANALYSIS (DSA) REPORT
CHAPTER FOURRISK ANALYSIS OF FGN’S TOTAL PUBLIC DEBT
4�1 IntroductionThis chapter evaluates the costs and risks performance of the FGN’s Total Public Debt Portfolio as at December 31, 2016� These risks are Interest Rate, Refinancing, Exchange Rate, Credit and Contingent Liabilities risks�
4�2 Risk Analysis of FGN’s Total Public Debt PortfolioTable 4�1 summarizes the cost and risk indicators of the FGN’s total public debt portfolio as at December 31, 2016�
Table 4�1: Cost and Risk Indicators of FGN’s Total Public Debt Portfolio as atDecember 31, 2016
Cost and Risk Indicators External Debt Domestic Debt Total DebtPV of Debt (including States Domestic Debts) as % of GDP 3�26 13�01 16�27Cost of Debt Weighted Av� Interest Rate (%) 3�10 11�11 9�19Refinancing Risk ATM (years) 13�57 7�53 9�54
Debt Maturing in 1yr (% of Total) 0�27 35�35 23�86Interest Rate Risk ATR (years) 13�43 7�53 8�93
Debt Re-fixing in 1yr (% of Total) 16�61 35�35 29�12Fixed Rate Debt (% of Total) 84�19 100 94�74
FX Risk FX Debt (% of Total Debt) - - 19�79Source: DMO
4�3 Average Cost of FGN’s PortfolioThe higher cost of domestic debt at weighted average cost of 11�11 percent compared to the weighted average cost of external debt at 3�10 percent, reflected tight Monetary Policy stance of the CBN� The Monetary Policy Rate (MPR), was increased from 11�00 percent in 2015 to 14�00 percent in July, 2016, and retained up to the end-2016� (Table 4�1)� The cost of external debt was comparatively lower due to the high portion of concessional external debt in the public debt portfolio with average interest rates of about 1�25 percent per annum and average tenor of about 40 years, which helped to moderate the overall cost of debt�
4�4 Interest Rate RiskThe fixed interest rate debt portion of the total debt portfolio was high at 94�74 percent with ATR of 8�93 years and suggests that the portfolio is not prone to interest rate risk (Table 4�1)� However, domestic debt portfolio is significantly exposed to interest rate risk with a share of

24
DEBT SUSTAINABILITY ANALYSIS (DSA) REPORT
debt maturing in one year at 35�35 percent� This was attributed to the high proportion of short-term debt instruments (NTBs) in the portfolio, which matures in one year and subject to interest rate re-fixing�
4�5 Refinancing RiskWith the strategic benchmark of the minimum of 10 years, refinancing risk remained low for external debt with Average Time-to-Maturity (ATM) at 13�57 years, while it was high for domestic debt with ATM of 5�53 years and debt maturing in one year at 35�35 percent, which was above the benchmark of 20�00 percent (Table 4�1)� This indicates that the domestic debt portfolio was exposed to refinancing risk, and highlights the need to rebalance the debt portfolio by reducing the quantum of short-term debts in line with the country’s Debt Management Strategy, 2016-2019�
4�6 Redemption ProfileFigure 4�1 is the redemption profile of the external debt of the country beyond 2016, which shows some spikes in 2018, 2021 and 2023, attributable to the redemption of the three maturing Eurobonds, namely: the debut 6�75% JAN 2021 US$500 million (10-year Eurobond issued in 2011) and the US$1 billion dual-tranche Eurobonds: 5�125% JUL 2018 US$500 million (5-year) and 6�375% JUL 2023 US$500 million (10-year) issued in 2013� Similarly, the redemption profile for domestic debt (Figure 4�2) reflects a significant level of refinancing risk in 2017, attributed to the high proportion of NTBs in the domestic debt portfolio that would be required to be refinanced in 2017�
Figure 4�1: External Debt Redemption Profile (US$’ Million)
Source: DMO

25
DEBT SUSTAINABILITY ANALYSIS (DSA) REPORT
Figure 4�2: Domestic Debt Redemption Profile (N’ Million)
Source: DMO
4�7 Exchange Rate RiskThe FGN’s total debt portfolio as at December 31, 2016, had a minimal exposure to foreign exchange risk, due to the relatively high proportion of domestic currency debt in the portfolio at about 80�00 percent�
Figure 4�3: Currency Composition of External Debt as at December 31, 2016
Figure 4�3 further shows that external debt portfolio by currency compositon was denominated in various currencies, namely: Swiss Franc (CHF), Euro (EUR), British Pound Sterling (GBP),

26
DEBT SUSTAINABILITY ANALYSIS (DSA) REPORT
Islamic Dinar (ID), Japanese Yen (JPY), United States Dollar (US$), Special Drawing Rights3 (SDRs) and Naira4 (N), which was on account of debt sourced from the concessional window of the ADB� The respective shares of these currencies at 0�05, 4�97, 0�23, 0�15, 0�62, 33�94, 60�03 and 0�00003 percent, show that there was a minimal exchange rate risk arising from currency mismatch, given that the external debt service payment obligations are effected mainly in the convertible currencies in the basket� This has helped to hedge against foreign exchange risk associated with unfavourable trend in currency exchange rate movements� The funding of external debt service through the External Creditors’ Funding Account (ECFA), which is denominated in US Dollars, was a further cushion against exchange rate risk, as the currency composition of external debt was dominated by the US dollar�
Table 4�2: Currency Composition of External Reserves Assets as at December 31, 2016
Currency US$ Equivalent % of TotalUS Dollars 22,770,002,838.57 84.36
GB Pounds 219,356,275.01 0.81
Euro 128,983,463.29 0.48
Swiss Franc 1,385,161.23 0.01
Japanese Yen 8,148,016.37 0.03
Chinese Yuan (Renminbi) 1,852,214,206.21 6.86
Special Drawing Right (SDR) Allocation 2,009,621,186.02 7.45
Other Currencies 867,064.73 0.00
Total 26,990,578,211.43 100.00Source: CBN
3 Special Drawing Rights (SDRs) is a virtual currency, whose value is currently based on a basket of currencies (Yen, Euro, Pound, and Dollar)� It was created by IMF as an international reserve asset to supplement the existing official reserves of member countries� The International Development Association (IDA) of the World Bank extends loans to countries on amount equivalent to SDRs� The SDR remains the single largest share of the Nigeria’s external debt portfolio accounting for 60�03 percent or US$6,840�54 million as at December 31, 2016�4 The Naira component of the external debt portfolio is an ADF loan contracted in respect of the multi-currency project (Bamenda-Manfe-Abakaliki-Enugu Road Corridor), which is denominated in Fund Unit of Account and disbursed in various currencies, which include US dollar, Euro, GBP, and Naira� The Naira portion was disbursed in June, 2015�

27
DEBT SUSTAINABILITY ANALYSIS (DSA) REPORT
Figure 4�4: Currency Composition of External Reserves as at December 31, 2016
Table 4�2 and Figure 4�4 show the composition of the country’s external reserves position by currency as at December 31, 2016, with a total of US$26�99 billion� The proportion of currency components of the foreign reserve assets were US$ (84�36 percent), GBP (0�81 percent), Euro (0�48 percent), CHF (0�01 percent), JPY (0�03 percent), Chinese Yuan (6�86 percent), SDR (7�45 percent) and other currencies (0�0032 percent)� Comparing the currency composition of external debt portfolio and currency composition of the country’s external reserves, there was no currency mismatch to suggest potential exchange rate risk to the external debt portfolio (Table 4�3)� In addition, the composition of external reserves which was dominated by US Dollar and SDR, which are the major currencies of external debt portfolio highlights further hedge against exchange rate risk�
Table 4�3: Composition of External Debt & Reserve Assets as at December 31, 2016 (in percent)
Currencies US$ GBP EURO CHF IDB JPY Yuan SDR Naira Others
External Debt:Currency Composition
33�94 0�23 4�97 0�05 0�15 0�62 - 60�03 0�00003 -
External Reserve:Currency Composition
84�36 0�81 0�48 0�0051 - 0�03 6�86 7�45 - 0�0032
Source: DMO

28
DEBT SUSTAINABILITY ANALYSIS (DSA) REPORT
4�8 Credit Risk (FGN’s On-lent Loans to MDAs)The eleven (11) outstanding on-lent loans by the FGN to various MDAs amounted to N178�08 billion as at December 31, 2016, same amount as at end-2015� The loans were extended by the FGN to the MDAs to fund the development of projects in the key sectors of the economy, which include, Road and Railway, Agriculture, Transport and Education� Each of the On-lent loans was backed by Memorandum of Understanding (MOU) executed between the DMO and the MDAs, to ensure that the loans are repaid as and when due�
4�9 FGN’s Contingent LiabilitiesTable 4�4 shows that contingent liabilities decreased by N211�01 billion or 12�74 percent, from N1,656�47 billion in 2015 to N1,445�46 billion in 2016� The decrease was due to the reduction in the value of the liabilities of the Federal Mortgage Bank of Nigeria, Pension Arrears for MDAs, Local Contractors debts, and the restructuring of the FGN’s Guarantee in favour of Lekki Port LFTZ Enterprises, which is yet to be utilized� As a percentage of the GDP, the outstanding contingent liability of the FGN was 1�42 percent of GDP in 2016, compared to 1�72 percent in 2015�

29
DEBT SUSTAINABILITY ANALYSIS (DSA) REPORT
Table 4�4: FGN’s Contingent Liabilities, 2012-2016 (N’ Billion)S/N Liability Type 2012 2013 2014 2015 2016
1� AMCON Guarantee 1,742�00 1,742�00 - - -
2� Local Contractors Debts 233�942 233�942 233�942 233�942 159�287
3� Federal Mortgage Bank of Nigeria 32�00 32�00 32�00 6�91 5�24
4� Guarantee on Agriculture 174�707 - - - -
5� Nigerian Export-Import (NEXIM) Bank - - 39�40 39�40 61�00
6� FCDA – Katampe Infrastructure Project
- - - 7�441�00 7�441�00
7� Nigeria Mortgage Refinance Company Plc
- - - 8�00 8�00
8� Lekki Port LFTZ Enterprise – Lekki Deep Sea Port
- - 157�60 157�60 -
9� World Bank Partial-Risk Guarantee in support of Azura-Edo IPP
- - - 46�689 72�29
10� Pension Arrears for MDAs 1,322�427 1,271�062 1,231�035 1,156�49 1,132�21
Total 3,585�08 3,279�00 1,693�977 1,656�467 1,445�47Notes:1� The FGN Guarantee to AMCON in respect of the N1�742 trillion 3-year Zero-coupon AMCON Tradable Bond expired on December 31, 2013, following the
redemption of AMCON Bonds� The Guarantee did not crystallize�2� The FGN Guarantee was given to cover the N233,942,080,700�00 Face Value of the 5-year 2016/2017 Split Coupon Bonds issued by the Special Purpose Vehicle
(SPV) set up for the resolution of the Local Contractors Debts� The Sinking Fund Account is being funded from the annual budgets of the Federal Government of Nigeria (FGN)�
3� FGN Guarantee of FMBN Bond issued to enable the Bank raise funding from the capital market to refinance the sale of Federal Government non-essential houses under the monetization programme of the Government�
4� Unconditional guarantee to the financiers (Banks) to cover 70% of the loan principal payment under the Programme for financing the supply of seeds and fertilizers to farmers for the 2012 farming season� The Client was the Federal Ministry of Agriculture and Rural Development� The Guarantee expired in 2012 and did not crystallize
5� FGN Guarantee to NEXIM for the US$200 million Master Line of Credit from African Development Bank (AfDB)� Exchange rate: N305/$� The AfDB multi tranche line of credit is to finance part of the cost of the Export Oriented Small and Medium Enterprises financing programme of the Nigerian Export Import (NEXIM) Bank� The tenor is for 10 years� NEXIM Bank has opened Debt Service Reserve Account (DSRA) and maintains collection accounts for beneficiary clients for their operations from which the DSRA would be funded prior to maturing periods of interest and principal repayments� There is a lien on the DSRA which state that NEXIM cannot withdraw from the account without the consent of the DMO�
6� The Guarantee was issued, on behalf of the Federal Capital Development Authority (FCDA), in favour of FBN Capital Limited and FBN Trustees Limited, in respect of a bank facility granted to Deanshanger Projects Limited for the provision of integrated civil infrastructure to Katampe District, Abuja� The current outstanding amount confirmed by FCDA is N7,440,504,380�68, excluding accrued interest�
7� The Guarantee is to enable NMRC raise long-term funds from the capital market by issuing notes for the purpose of refinancing or purchasing mortgages created by Eligible Mortgage Lenders� N8 billion has been utilized out of the Guarantee� Total Guarantee available is N440 billion, with an initial limit of N100 billion, to be utilized in two tranches of N50 billion each, subject to further approvals based on a confirmation of Programme’s efficacy�
8� FGN Guarantee in favour of Lekki Port LFTZ Enterprise (Concessionaire) to cover the sum of US$800 million (N244,000,000,000�00 converted at N305/$) of the investment by the Concessionaire for the purpose of funding the construction of a Deep Sea Port at Lekki Lagos, Nigeria, on a Build, Own, Operate and Transfer basis, for a period of forty-five years, for and on behalf of the Nigerian Ports Authority� The Guarrantee is being restructured and has not been finalized and utilized�
9� World Bank Partial Risk Guarantees in the sum of US$237 million (N72,285,000,000�00 converted at N305/$), comprising Debt Mobilization Guarantee of US$117 million and a Liquidity Guarantee of US$120 million, in support of the 450 megawatts Azura-Edo Independent Power Project (IPP)� The Federal Government of Nigeria (FGN) entered into Indemnity Agreement with the International Bank for Reconstruction and Development (IBRD) - World Bank, in 2015, to unconditionally and irrevocably reimburse to the World Bank amounts paid by the Bank directly or indirectly in relation to or arising from the IBRD Guarantee and to undertake such other obligations to the Bank as are set forth in the Indemnity Agreement�
10� Data provided by PENCOM: Outstanding Retirement Benefits Liability of the FGN for certain categories of its employees� The last employee would be retiring in 2039�


31
DEBT SUSTAINABILITY ANALYSIS (DSA) REPORT
CHAPTER FIVEUNDERLYING ASSUMPTIONS OF THE 2017 DSA
5�1 Baseline Scenario AssumptionsThe Baseline Scenario is anchored on the moderate economic recovery from 2016 recession on the heels of a challenging macroeconomic environment; the 2017 Federal Government annual Budget; and, the provisional Medium-Term Expenditure Framework (MTEF), 2018-2020 (Box 5�1)�
Box 5�1: Baseline Scenario Assumptions
Real and Nominal GDP Growth Rates: The real and nominal GDP growth rates are projected to grow at 0�8 and 6�37 percent for 2017, respectively� The growth in the real GDP to 0�8 percent in 2017, up from -1�58 percent in 2016, is anchored on macroeconomic stability, investment in social infrastructure and job creation, diversification of the economy, food security through agriculture, development of physical infrastructure especially in power and fighting corruption and insecurity� Crude oil prices and production level are expected to continue to recover, leading to increase in revenue to the Government� In 2018, these conditions are expected to progress, with real and nominal GDP growth rates projected at 2�0 and 1�89 percent, respectively� The real and nominal GDP are expected to grow on average by 3�92 and 4�42 percent during 2017-2037, respectively�
Inflation Rate: Headline inflation on year-on-year basis is assumed at 16�00 percent in 2017 and expected to decline slightly to 15�00 percent in 2018� The decline in inflation rate in 2017and 2018 is based on the high expectations for productive bumper crop harvest by farmers as more Nigerians have embraced farming, N-Power-Agro, as well as the coming on stream of Dangote Refinery in 2018� With the envisaged improvement in food supply, availability of petroleum products and stability in exchange rate, inflation for 2017-2037, is expected to average 11�36 percent per annum�
Crude Oil Production: The crude oil production level of 1�90 million barrels per day (mbpd) assumed in 2017 is expected to increase to 2�0, 2�20 and 2�30 million barrels per day (mbpd), respectively in 2018, 2019 and 2020� Production is maintained at 2�40 in 2021 through 2037 and this is based on concerted Government efforts and engagement Niger-Delta stakeholders to address pipeline vandalism, renewed militancy in the Niger Delta, leakages and wastages, crude oil theft and illegal bunkering� It is also expected that the recent deregulation of the downstream oil sector will bring about new investment and increase crude production and productivity�
Crude Oil Benchmark Price: The 2017 oil price benchmark of US$43 per barrel (pb) is expected to increase to US$44(pb) in 2018, and up to US$45(pb) in 2019 through 2037� The projected increase in

32
DEBT SUSTAINABILITY ANALYSIS (DSA) REPORT
global oil prices is predicated on the likely economic recovery, especially in advanced economies and and emerging market and developing economies such as China and USA, respectively�
Export: Export is expected to grow during the projected period driven mainly by expected increase in crude oil price and production as a result of the relative improvement in the global economy, which is expected to boost demand; and the calmness in the Niger Delta region, respectively� In addition, the recent passage of the some components of the Petroleum Industry Bill (PIB), by the senate is expected to promote transparency and enhance investment in the sector� Government’s sustained effort to diversify the economy through policy measures in the agricultural, industrial and solid minerals sectors is expected to impact positively and drive non-oil export growth� Also, government effort towards achieving an improved domestic oil refining capacity and the relative stability in the foreign exchange market, arising from the adoption of a more market-determined exchange rate regime, are expected to enhance the competitiveness of non-oil export and increase its contribution to total trade�
Current Account Position: The improvement in the global economy; increase in crude oil prices at the international market occasioned by production cut by OPEC; gradual recovery of the domestic economy arising largely, from the demand management policies and the implementation of the economic recovery and growth plan; enhanced export competitiveness, and the sustained reforms in the foreign exchange market are expected to impact positively on the current account� The current account balance is therefore, expected to remain in surplus in the short-to-medium horizon� In the long-term, however, the current account is expected to revert to deficit, mainly as a result of growth in the importation of capital goods for economic development�
Foreign Direct Investments: Sustained political stability, improved macroeconomic conditions, infrastructural development drive, economic reforms particularly, in the oil and transportation sectors, the adoption of a more flexible exchange rate regime and the relative stability in the foreign exchange market are the major factors that would drive FDIs inflows in the short to medium-term� In addition, foreign investors’ continued quest for cheaper labour and lower cost of production in emerging economies, as well as ready demand in frontier economies is expected to impact positively and increase FDIs to Nigeria in the short to medium-term� The growth in the FDIs will, however, be dampened by the continued recovery in the advanced economies in the long-term horizon�
Remittances: The improved economic performance resulting from the sustained and effective implementation of government reforms in the public sector, political stability in the country and the flexible foreign exchange rate regime would serve as incentives for Nigerians in diaspora to remit more funds into the economy in both the short and long-term� Furthermore, the recovery in the global economy is expected to enhance the inflow of workers remittances�

33
DEBT SUSTAINABILITY ANALYSIS (DSA) REPORT
External Reserves: The sustained foreign exchange reforms, which has curbed spurious foreign exchange demand, fiscal discipline and improvement in both oil and non-oil export is expected drive steady accretion to external reserves throughout the period� The external reserve is expected to remain comfortably above the international benchmark of 3 months of import cover from the short to the long-term�
Fiscal Deficit: The fiscal deficit is projected at N2�356 trillion or 2�18 percent of GDP for 2017� This is expected to decline to N2�310 trillion or 1�99 percent in the medium-term (2018-2020)� Over the longer term, 2021-2037, the fiscal deficit is still projected to decline further, averaging N1�752 trillion or 0�97 percent of GDP� The projected level of deficit is based on a gradual increase in oil production due mainly to slow expansion of domestic oil extraction, as well as post 2030 base oil production, which is assumed to decline as depletion of aggregate global oil production rates in oil fields are expected due to post Peak Oil production� In addition, improvements in oil revenues, which increase availability of foreign exchange for Naira stabilization, increased investors’ confidence, and improvement in business environment are expected to increase economic growth, and hence, projected growth in non-oil revenues� Also, cost containment measures of Government, including through full implementation of the Integrated Payroll and Personnel Information System (IPPIS), as well as improved management of public expenditures�
Nominal Exchange Rate: The Nominal Exchange Rate is expected to remain stable both in the medium and long-term, as a result of the robust foreign exchange policy, which has resulted in a more market-determined exchange rate, deepened the foreign exchange market to accommodate all foreign exchange obligations and stemmed speculative demands� The introduction of special foreign exchange windows particularly the Investors and Exporters window (NAFEX) is expected to bring in more investments into the economy�
New Financing: New financing will entail the maximisation of available funding envelopes from concessional and semi-concessional external sources, taking into account what may be readily available within a given period before exploring other external funding sources, for the financing of key infrastructure projects, in line with the recommendations of Nigeria’s Debt Management Strategy, 2016-2019� The new financing will rely on long-term debt instruments for domestic borrowing and less expensive long-term external financing� The funding strategy supports the movement towards achieving the country’s strategic objective of 60:40 ratio for domestic and external debt portfolio, respectively, as well as, attaining the 75:25 ratio for long to short-term debt instruments in the domestic debt portfolio� This would minimise refinancing risk, with its associated debt servicing costs� With reclassification of Nigeria as a blend country, there would be a gradual move away from concessional financing and to non-concessional multilateral and commercial sources� The private sector is expected to play a major role in the domestic debt market by accessing more long-term funds for investments in the real sector, as the FGN gradually reduces its domestic debt issuances, to create more borrowing space for corporates�

34
DEBT SUSTAINABILITY ANALYSIS (DSA) REPORT
Box 5�2: Optimistic Scenario Assumptions
Real GDP Growth Rate: The real and nominal GDP growth rates are respectively assumed at 1�5 and 6�37 percent for 2017, with the vigorous diversification efforts of Government, on-going strategies to improve ease of doing business, massive investment in infrastrucuture, and leveraging power of the private sector through implementation of a number of public private partnership arrangements and capital budget releases, as well as improve access to loans to the real sector and SMEs through recapitalisation of the BOI, BOA and Development Bank of Nigeria� In 2018, the growth rate of 3�5 and 4�75 percent are assumed for real and nominal GDP in the oil and non oil sectors of the economy, respectively, because of the New JV arrangements, increased local refining coming into stream of Dangote Refinery in 2018, improved non-oil tax through automation, as well as efficient forex Management and Government effort in addressing insecurity in the North-East and the Niger-Delta� For the period 2017-2037, the real GDP growth is projected at 6�95 percent on average, while the average growth for the nominal GDP is projected at 7�45 percent, due to addition to the existing production capacity with the planned in investment in infrastructure and accelerated growth in oil and non-oil output during the period�
Inflation Rate: Inflation rate is projected at 15�74 percent on year-on-year basis by end-2017� Consumer prices are projected to decline to 12�42percent in 2018 and 9�21 percent on average for 2017-2037� This is based on the expected increase food production, and availability of petroleum products and stability in the exchange rate� The projection assumes that fiscal and monetary policies will be complementary during the period�
Crude Oil Production: Production is projected at 2�2 mbpd in 2017 and is expected to increase to 2�3 mbpd and further to 2�4 mbpd in 2018 and 2019, respectively� Crude oil production is maintained at 2�5 mbpd between 2020 and 2027 and also 2�7 mbpd in 2028 through 2037� Projection is premised on the fact that various efforts at reducing incidences of vandalism occasioned by the militancy in the Niger Delta, leakages and wastages from crude oil theft, illegal bunkering and investments in infrastructures in the sector would in the long-term impact positively on production�
Crude Oil Price: The price for crude oil at US$44�5 per barrel (pd) in 2017 is projected to US$48 per barrel in 2018 and further to US$53 in 2019� Projection is maintained at US$58 per barrel in 2020 through 2037� It is expected that favourable external environment in advanced and emerging market economies will increase the demand for oil�
5�2 Optimistic Scenario AssumptionsThe Optimistic Scenario is hinged on the full implementation of the Economic Recovery and Growth Plan (ERGP), which sets out to restore macroeconomic stability, pull the economy out of recession and to re-launch it on the path of sustained economic growth, while stabilizing the monetary, external and fiscal environments and reduce the rate of unemployment�
35
DEBT SUSTAINABILITY ANALYSIS (DSA) REPORT
Exports: Exports will continue to increase, driven largely by the non-oil exports, which are expected to be boosted by the diversification of the Nigerian economy both in the medium and long-term�
Current Account Position:Current account position will be in surpluses from the short to long-term owing to the expected growth in export and remittances� Also, the strategic policy geared towards increasing domestic refinery capacity is expected to lower imports, particularly crude oil and gas� Consequently, export is expected to grow faster than import throughout the projected period�
Foreign Direct Investments: The influx of foreign direct investments are expected to be sustained due to a more predictable macroeconomic environment, attractive real interest rate, friendlier business environment, relative political stability, improved security and infrastructure, robust external reserves and stable exchange rate, arising from a more flexible and market driven foreign exchange market�
External Reserves: The external reserves is expected to be robust throughout the projection period owing to significant accretion, arising from enhanced foreign exchange inflows from improved exports growth and capital inflows as well as exchange rate appreciation�
Fiscal Deficit: With strong growth recovery resulting from faster improvements in oil and non-oil sectors, a more diversified economy, macroeconomic stability, improved security, up tick in oil prices, and cost optimization initiatives, the fiscal deficit is projected at 2�03, 1�89 and 1�50 percent of GDP for 2018, 2019 and 2020, correspondingly compared to 2�18 percent of GDP for 2017� Oil prices are deemed to remain lower than the pre-June 2014 levels in view of the increasing role of shale oil and gas in global oil supply� However, it is expected that government revenue will be largely driven by the non-oil revenue over the forecast period as government intensifies its efforts at improving tax compliance, broadening the tax net using appropriate technology, introduction of tax on luxury items and other indirect taxes to capture a greater share of the non-formal economy, and introduce a single window to drive customs efficiencies among others� Consequently, deficit is projected at 0�68 percent of GDP on average between 2018 and 2037�
Nominal Exchange rate: The curbing of speculative attack and spurios demand for foreign exchange and expected enhanced foreign exchange inflows from higher exports will help to stabilize the Naira exchange with moderate appreciation from the short-long-term�
New Financing: It is assumed that government would access more long-term funds from bilateral and commercial sources, especially from the later to finance huge infrastructure deficit� More corporates, particularly deposit money banks, would take advantage of established sovereign benchmark to show strong presence in the ICM to access relatively less expensive foreign capital to enhance their capital structure and be in a better position to finance the real sector and infrastructural projects�

36
DEBT SUSTAINABILITY ANALYSIS (DSA) REPORT
Box 5�3: Pessimistic Scenario Assumptions
Real GDP Growth Rate: The real and nominal GDP growth rates are respectively assumed at 0�60 percent and 2�34 percent for 2017 because of the likelihood of unfavouravble external and internal factors giving the uncertain fiscal policies in the USA, uncertainties amidst Brexit and future of European Union, which could jeopardize Nigeria’s desired aspirations� The unlikelihood of meeting our revenue targets could negatively impact the ambitious implementation of a number of public-private-partnership arrangements and capital budget releases, as well as hinder access to loans to the real sector and SME� Growth is projected to be sluggish and the economy may possibly experience a relapse to recession�
Inflation Rate: Inflation rate is projected at 16�5 percent on year-on-year basis by end-2017 and slightly declines to 16 percent in 2018� Consumer prices are projected to average 13�05 percent for 2019-2037� This is based on continued structural challenges which could pose a risk to achieving the growth target envisaged in the ERGP, high cost of transportation and the expected rising interest rates and protectionism in advanced and emerging economies�
Crude Oil Price:The price for crude is assumed at about US$30�0 per barrel (pd) in 2017 is maintained through 2019� It is projected to slightly increase to US$45 per barrel in 2020 through 2037� The projection is premised on uncertainty about crude price due to US policies and movement towards electric vehicles and unfavourable external environment in other advanced and emerging market economies�
Crude Oil Production:Crude oil production is projected at 1�4mbpd in 2017 and 2018, which is expected to marginally pick up to about 1�5mbp in 2019 through 2037� The projection is premised on the incidence of pipline vandalism occasioned by the militancy in the Niger Delta leakages and wastages from crude oil theft, illegal bunkering and further production cut from OPEC�
Foreign Direct Investments: FDIs are expected to reduce due to subdued global trade, an unpredictable macroeconomic environment, weaker capital flows, unattractive real interest rate, harsh business environment, insecurity, detriorated infrastructure, external reserves depletion and and relative exchange rate instability, throughout the projection years�
Remittances: The unimpressive economic performance resulting from the failure to successfully implement government reforms in the public sector, exchange rate instability and general insecurity in the country will serve as disincentive for Nigerians in diaspora to remit funds into the economy�
5�3 Pessimistic Scenario AssumptionsThe Pessimistic Scenario assumes a persistent shock in crude oil price and oil production, deterioration in fiscal and current account balance, as well as further depreciation in the Naira exchange rate�

37
DEBT SUSTAINABILITY ANALYSIS (DSA) REPORT
External Reserves: It is expected that the external reserves will not be able to cover the required threshold of three (3) months of imports, due largely, to huge reserves depletion arising from spurious demand for foreign exchange, speculative attacks on the Naira, reduced foreign exchange inflows and fiscal indiscipline�
Fiscal Deficit: The level of deficit as a percentage of GDP, is projected at 2�62, 2�58 and 2�43 percent in 2018, 2019 and 2020, respectively, and may worsen further in the long-term due to lower revenue from both the oil and non-oil sectors� The deterioration in fiscal conditions would further increase the financing gap and give rise to higher level of public borrowing�
Nominal Exchange Rate: The Nominal Exchange Rate is expected to fluctuate mildly in the short to long–run, because of the of the set-back in the CBN’s recent reforms of a market-determined exchange rate regime in the inter-bank rate and other measures to stem speculative demands in the foreign exchange market, as well as, the inability to reduce demand for importation of fuel�
New Financing: It is assumed that government would access funds at high rates from the commercial sources as long-term funds from bilateral and multilateral sources begin to dry up�

39
DEBT SUSTAINABILITY ANALYSIS (DSA) REPORT
CHAPTER SIXRESULTS ANALYSIS
6�0 IntroductionThe 2017 debt sustainability analysis covers the Baseline, Optimistic and Pessimistic Scenarios� The Baseline Scenario is premised on the evaluation of some macroeconomic variables, current and projected fiscal data� The Optimistic Scenario is anchored on the successful implementation of the ERGP under the assumption of anticipated improvements in revenue and stable exchange rates among other variables, while the Pessimistic Scenario assumed deterioration in most of the macroeconomic variables, which include fall in revenue and volatility in exchange rates�
The analysis of external debt and fiscal sustainability for the various scenarios were subjected to stress tests� The WB/IMF DSF-LIC Analytical Template used in the exercise has an in-built shocking mechanisms (Standard Stress Tests) which are referred to as Alternative Tests (permanent shocks) and Bound Tests (temporary shocks)� These are automatic shocks which the Template applies on the variables provided by the various scenarios� The details of the automatic shocks (stress tests) are as outlined below:
A� Alternative Tests (Permanent Shocks)
A1� Key variables at their historical averages in 2017-2037
A2� New public sector loans on less favourable terms in 2017-2037
B Bound Tests (Temporary Shock)
B1� Real GDP growth at historical average minus one standard deviation in 2018-2019B2� Export value growth at historical average minus one standard deviation in 2018-2019B3� US dollar GDP deflator at historical average minus one standard deviation in 2018-
2019B4� Net non-debt creating flows at historical average minus one standard deviation in
2018-2019B5� Combination of B1-B4 using one-half standard deviation shocksB6� One-time 30 percent nominal depreciation relative to the baseline in 2018

40
DEBT SUSTAINABILITY ANALYSIS (DSA) REPORT
6�1 Baseline Scenario
A� External Debt Sustainability
The External Debt analysis covers the external debt of the FGN and the 36 States, including the FCT� The outcome of the analysis under the Baseline Scenario reveals that Nigeria’s External Debt Portfolio remains at a Low Risk of Debt Distress�The debt ratios are well below all of their respective thresholds throughout the projection period as shown in Table 1� External borrowing is projected to rise marginally between 2017 and 2033 and given Nigeria’s current status as a Lower-Middle-Income country more funds are expected from the commercial sources, including the International Capital Market (ICM)� Economic activities as measured by the GDP and Exports are projected to grow with increases in oil prices and production levels,which would impact positively on the revenue to government� It is also expected that infrastructure investments and various structural reforms that the government is implementing in the key sectors of the economy, will support Exports and boost productivity and overall economic growth� The details of the results are shown in Annexure 1 and 3�
Table 6�1: External Debt Sustainability Indicators in Percent (2017-2037)Details Threshold 2017 2018 2019 2020 2021 2022 2027 2037
External Debt StockIn percent of GDP 40Baseline 4�9 5�2 5�5 5�8 5�9 6�1 6�1 3�7Combined shocks 4�9 6�8 9�5 9�9 10�1 10�3 9�5 4�9In percent of Exports 150Baseline 46�5 57�0 72,6 66�0 57�9 61�4 71�6 66�3Combined shocks 46�5 91�1 188�5 167�9 146�5 153�0 160�4 118�9In percent of Revenue 250Baseline 73�4 74�0 81�0 86�1 89�1 93�1 94�5 70�0Combined shocks 73�4 96�4 141�4 147�9 152�6 157�4 147�4 93�0
External Debt ServiceIn percent of Exports 20Baseline 2�2 3�9 3�4 4�0 5�3 5�1 8�0 10�0Combined shocks 2�2 4�7 6�6 9�1 10�6 11�8 18�9 20�3In percent of Revenue 20Baseline 3�4 5�0 3�8 5�3 8�2 7�7 10�6 10�5Combined shocks 3�4 5�3 5�4 8�3 11�8 12�5 17�2 15�2
Source: 2017 DSANote: The Thresholds are determined periodically by the WB/IMF, based on the CPIA Rating Exercise�
41
DEBT SUSTAINABILITY ANALYSIS (DSA) REPORT
6.1.1 Analysis of the Standard Stress TestsThe outcome of the Stress Tests, indicates that Nigeria’s External Debt position is generally robust in the medium-term, while the impact of the shocks would lead to a deterioration of the revenue-based indicators in the long-term, if adequate measures are not taken to improve revenue and boost exports, as well as shore up the level of other forms of non-debt creating flows, such as Foreign Direct Investment (FDI)� The most extreme stress tests are shown in (Table 1) and Annexures 1 (a-f)� Over the period 2017–2027, a shock which combines lower GDP growth, weaker exports, a lower GDP deflator, and a fall in non-debt creating flows would weaken the export and revenue indicators� For instance, the ratio of External Debt-to-Exports moved upwards from 46�5 percent in 2017 to 188�5 percent in 2019 (Annexure 1c)� In the same manner, the ratio of External Debt-to-Revenue increased from 73�4 percent in 2017 to 157�4 percent in 2022 (Annexure 1d)� The ratios of External Debt Service-to-Exports and External Debt-Service-to-Revenue also deteriorated throughout the projection period (Annexure 1e and 1f)� Thus, indicating that Nigeria’s Total Debt portfolio is highly susceptible to Revenue shocks� There is, therefore the need to sustain the on-going reforms and initiatives aimed at boosting non-oil revenue by Government, which include the broadening of the tax base, increasing tax revenue collection, blocking of leakages, and the diversification of the economy� Some of these initiatives include the Voluntary Assets and Income Declaration Scheme (VAIDS)-a scheme that gives tax defaulters, limited tax amnesty to enable them regularise within a specified period their tax status, without incurring charges, penalties and exemption from prosecution; Electronic Payment and Filing System (e-Services) to cover e-Payments, e-Filing, e-Registration, e-Stamp Duty; Upward review of the excise duty rates for Alcoholic Beverages and Tobacco; and a review of the Pioneer Status, as part of efforts towards diversifying the economy� The details of the results are shown in Annexure 4�
B� Total Public Debt Sustainability - Fiscal Sustainability Analysis (The Federation – FGN, States and FCT)
The analysis of the Fiscal Sustainability of the Federation covers the Domestic and External debt of the FGN, States and FCT, as well as their respective Revenues, including Internally Generated Revenues (IGRs)� The Fiscal Sustainability has only one threshold for the ratio of Total Public Debt-to-GDP,which is set at 56 percent for countries in Nigeria’s peer group� The result shows that Total Public Debt-to-GDP ratio remains below its threshold throughout the projection period as shown in Table 6�2 and Annexures 2a and 5a� Meanwhile, the Revenue indicators - Total Public Debt to Revenue and Total Debt Service to Revenue do not have international thresholds but rose from 290�4 percent in 2017 to 345�0

42
DEBT SUSTAINABILITY ANALYSIS (DSA) REPORT
percent in 2022 and 44�9 percent in 2017 to 62�8 percent in 2027, respectively, after which they trended downward to 280�9 percent and 55�0 percent in 2037� These suggest that these indicators are vulnerable to revenue shocks (Annexure 2b and 2c)�
Table 6�2: Total Public Debt Sustainability Indicators in Percent (2017-2037)Details Threshold 2017 2018 2019 2020 2021 2022 2027 2037
Total Public Debt StockIn percent of GDP 56Baseline 19�8 20�9 21�2 21�9 22�5 22�9 22�8 15�0Combined shocks 19�8 30�9 32�1 33�8 35�6 37�3 44�7 59�4In Percent of Revenue NilBaseline 290�4 293�2 309�9 320�2 333�6 345�0 349�9 280�9Combined shocks 290�4 431�8 467�6 494�7 528�1 561�6 685�5 1113�0
Total Public Debt ServiceIn Percent of Revenue Nil Baseline 44�9 46�2 47�0 48�9 53�9 55�0 62�8 55�0Combined shocks 44�9 46�1 69�7 85�6 97�4 104�2 141�4 252�1
Source: 2017 DSANote: Under the Fiscal Sustainability, the WB/IMF threshold is only applicable to the Total Public Debt to GDP, which is set at 56 percent�
6.2.1 Analysis of the Standard Stress TestsThe most extreme shocks which combine lower GDP growth, weaker exports, a lower GDP deflator and a fall in non-debt creating flows such as Foreign Direct Investments (FDIs), would weaken the ratios of Total Public Debt-to-Revenue and Total Debt Service-to-Revenue throughout the projection period� Relative to the Baseline, the ratios of Total Public Debt-to-Revenue and Total Debt Service-to-Revenue rose considerably from 290�4 percent and 44�9 percent in 2017 to 1113�0 percent and 252�1 percent in 2037, respectively� Thus, reinforcing the need to further expand the revenue base of the country as earlier highlighted� The details of the results are shown in Annexure 5b�
In the light of the foregoing, it is very evident that Nigeria’s Total Debt portfolio is highly susceptible to Revenue shocks� Therefore, there is the need for concerted efforts to ensure faithful and effective implementation of the various on-going initiatives and interventions aimed at diversifying the sources of Government’s revenue away from oil�
6�2 Optimistic ScenarioThe Optimistic Scenario assumes the full implementation of the ERGP, the outcome of which resulted in a much stronger and robust total public debt ratios� The supposedly improved output and revenue favourably impacted on the debt indicators as the ratio of Total Public

43
DEBT SUSTAINABILITY ANALYSIS (DSA) REPORT
Debt-to-GDP declined steadily from 16�9 percent in 2017 to as low as 4�4 percent at the end of the projection period in 2037 (Table 6�3)� Similarly, the ratio of Total Debt Service-to-Revenue declined from 44�5 percent in 2017 to 17�3 percent in 2037�
Table 6�3: Total Public Debt Sustainability Indicators in Percent (2017-2037)Details Threshold 2017 2018 2019 2020 2021 2022 2027 2037
Total Public Debt StockIn percent of GDP 56Baseline 16�9 17�5 16�9 16�7 16�7 16�2 12�0 4�4Combined shocks 16�9 27�4 27�5 28�0 28�7 28�8 28�1 30�7In Percent of Revenue NILBaseline 359�6 359�3 384�4 357�1 360�4 357�5 287�6 139�9Combined shocks 359�6 563�2 625�8 596�9 618�3 637�3 674�0 974�4
Total Public Debt ServiceIn Percent of Revenue NILBaseline 44�5 43�3 45�2 42�5 45�8 43�4 35�7 17�3Combined shocks 44�5 43�2 84�1 83�5 99�9 106�1 123�6 218�3
Source: 2017 DSANote: Under the Fiscal Sustainability, the WB/IMF threshold is only applicable to the Total Public Debt to GDP, which is set at 56 percent�
6�3 Pessimistic ScenarioWith the assumption of a persistent decline in crude oil price (to as low as USD30pb) and quantity production, as well as further deterioration in other macroeconomic indicators, including the Naira Exchange Rate, the Debt Ratios deteriorated� The resulting low revenue from such a challenged economy adversely affected the debt indicators such that the ratio of Total Public Debt-to-Revenue significantly worsened from 352�3 percent in 2017 to 550�7 percent by 2037, so also was the ratio of Debt Service-to-Revenue, which deteriorated from 39�9 percent in 2017 to 120�6 percent at the end of the projection period (Table 6�4)�

44
DEBT SUSTAINABILITY ANALYSIS (DSA) REPORT
Table 6�4: Total Public Debt Sustainability Indicators in Percent (2017-2037)Details Threshold 2017 2018 2019 2020 2021 2022 2027 2037
Total Public Debt StockIn percent of GDP 56Baseline 17�2 17�9 18�5 19�0 19�6 20�0 19�3 10�5Combined shocks 17�2 27�8 29�5 31�2 33�0 34�8 43�1 63�6In Percent of Revenue NILBaseline 352�3 389�4 428�8 449�1 470�1 492�4 520�2 550�7Combined shocks 352�3 605�2 681�8 735�4 792�3 859�4 1161�8 3329�3
Total Public Debt ServiceIn Percent of Revenue NILBaseline 39�9 46�2 49�7 55�1 63�4 65�5 80�7 120�6Combined shocks 39�9 46�2 86�0 119�2 139�0 152�4 236�6 828�5
Source: 2017 DSANote: Under the Fiscal Sustainability, the WB/IMF threshold is only applicable to the Total Public Debt to GDP, which is set at 56 percent�
6�4 Determination of Borrowing Limit for 2018Considering the fact that the present Country-Specific threshold for Total Public Debt-to-GDP ratio of 19�39 percent elapses by December 31, 2017, even when the international threshold is 56 percent for countries in Nigeria’s peer group, it has become imperative that the self-imposed debt limit of 19�39 percent be reviewed upwards to a more prudent and optimal level of 25 percent in the medium-term of 2018-2020� The proposed new limit would afford the Government an ample room to mobilise additional resources to fund investment projects that would facilitate the turnaround of the economy, in line with the aspirations of the ERGP, without jeopardising the country’s debt sustainability�
In order to estimate the borrowing limit for 2018, it requires the determination of the difference between the proposed Country-Specific Threshold of 25 percent and the end-period Total Public Debt-to-GDP ratio for 2017 for the Federation, projected at 19�80 percent� Therefore, the fiscal borrowing space left for the three-year period is 5�2 percent (i�e� 25�00 percent less 19�80 percent), and based on the projected 2018 GDP of US$360�6 billion, the quantum of borrowing for 2018 will be 1�73 percent of US$360�6 billion, which translates to US$6�25 billion� Therefore, the maximum amount that could be borrowed (Domestic and External) for the fiscal year-2018 by the Government without violating the proposed Country-Specific Threshold of 25 percent up to 2020 would be US$6�25 billion or N1,906�37 billion (at N305/US$1)� Accordingly, for the fiscal year 2018, the maximum amount of US$6�25 billion that could be borrowed is proposed to be sourced equally (50:50) from the Domestic and External sources, respectively, as follows:
45
DEBT SUSTAINABILITY ANALYSIS (DSA) REPORT
� New Domestic Borrowing US$3�125 billion (equivalent of about N953�18 billion); and,
� New External Borrowing: US$3�125 billion (equivalent of about N953�18billion)�
It is worthy to note that the borrowing space is a function of the size of the GDP, and these recommended limits are meant to provide a guide to Government’s borrowing activities for 2018, which would ensure that the self-imposed Debt Limit is not unduly breached�
Conclusion
The result of the 2017 DSA exercise showed that Nigeria’s risk of debt distress remained Moderate, indicating a breach of the Threshold by just one of the Debt Portfolio indicators (Total Public Debt Service to Revenue), when the portfolio is subjected to shocks (Stress Tests)� It further highlighted the vulnerability of the Debt Portfolio to shocks in Revenue and Exports, as well as substantial Currency devaluation�


47
DEBT SUSTAINABILITY ANALYSIS (DSA) REPORT
CHAPTER SEVENSUMMARY OF KEY FINDINGS AND RECOMMENDATIONS
6�1 Summary of Key Findingsi� The outcome of the analyses under the Baseline Scenario, revealed that Nigeria’s
External Debt portfolio remained at a Low Risk of Debt Distress, as the debt ratios were well below all of their respective thresholds throughout the projection period�
ii� The Fiscal Sustainability Analysis for the Federation (Federal, States and FCT), showed that the ratio of Total Public Debt-to-GDP remained below its threshold throughout the projection period� The ratio of Total Public Debt-to-GDP for 2017 was projected at 19�80 percent�
iii� Both the External and Fiscal Sustainability Analyses showed that all the Revenue indicators (the ratios of Debt-to-Revenue and Debt Service-to-Revenue) deteriorated under varying shocks, suggesting that any prolonged shocks on the revenue would lead to Debt Distress in the medium to long-term, except other sources of revenue are speedily developed to enhance the revenue generation performance of the country
iv� Under the Optimistic Scenario, the debt indicators showed remarkable improvements, while under the Pessimistic Scenario, all the indicators weakened throughout the projection period�
The result of the 2017 DSA exercise therefore, showed that Nigeria’s risk of debt distress remained Moderate, indicating a breach of the Threshold by just one of the Debt Portfolio indicators (Total Public Debt Service to Revenue), when the portfolio is subjected to shocks (Stress Tests)� It further highlighted the vulnerability of the Debt Portfolio to shocks in Revenue and Exports, as well as substantial Currency devaluation�
6�1 Key RecommendationsThe key policy recommendations of the 2017 DSA exercise are as follows:
Borrowing Limit
i� Considering the fact that the present Country-Specific threshold for Total Public Debt-to-GDP ratio of 19�39 percent elapses by December 31, 2017, even when the international threshold is 56 percent for countries in Nigeria’s peer group, it has

48
DEBT SUSTAINABILITY ANALYSIS (DSA) REPORT
become imperative that the self-imposed debt limit of 19�39 percent be reviewed upwards to a more prudent and optimal level of 25 percent in the medium-term of 2018-2020� The proposed new limit would afford the Government an ample room to mobilise additional resources to fund investment projects that would facilitate the turnaround of the economy, in line with the aspirations of the ERGP, without jeopardising the country’s debt sustainability�
ii� In order to estimate the borrowing limit for 2018, it requires the determination of the difference between the proposed Country-Specific Threshold of 25 percent and the end-period Total Public Debt-to-GDP ratio for 2017 for the Federation, projected at 19�80 percent� Therefore, the fiscal borrowing space left for the three-year period is 5�2 percent (i�e� 25�00 percent less 19�80 percent), and based on the projected 2018 GDP of US$360�6 billion, the quantum of borrowing for 2018 will be 1�73 percent of US$360�6 billion, which translates to US$6�25 billion� Therefore, the maximum amount that could be borrowed (Domestic and External) for the fiscal year-2018 by the Government without violating the proposed Country-Specific Threshold of 25 percent up to 2020 would be US$6�25 billion or N1,906�37 billion (at N305/US$1)� Accordingly, for the fiscal year 2018, the maximum amount of US$6�25 billion that could be borrowed is proposed to be sourced equally (50:50) from the Domestic and External sources, respectively, as follows:
¾ New Domestic Borrowing US$3�125 billion (equivalent of about N953�18 billion); and,
¾ New External Borrowing: US$3�125 billion (equivalent of about N953�18billion)�
It is worthy to note that the borrowing space is a function of the size of the GDP, and these recommended limits are meant to provide a guide to Government’s borrowing activities for 2018, which would ensure that the self-imposed Debt Limit is not unduly breached�
Boosting Revenue Generation
iii� In line with the efforts at boosting non-oil revenue, Government is encouraged to sustain the on-going initiatives aimed at broadening the tax base and increasing tax revenue collection and blocking leakages, and diversification of the economy� Some of these initiatives have earlier been highlighted�
49
DEBT SUSTAINABILITY ANALYSIS (DSA) REPORT
iv� Given that in the short to medium-term, oil would still remain a key revenue earner, the Federal Government is encouraged to further strengthen its machinery for achieving sustained peace and stability in the Niger Delta region of the country� This has become inevitable in view of the need to ensure steady and uninterrupted crude oil exploration and production in the region�
v� As part of the long-term initiatives for diversifying the economy and boosting non-oil revenue, the Federal Government is also encouraged to fast-track the implementation of its reforms in the Solid Minerals sector of the economy such as the establishment of the Solid Minerals Development Fund and to formalise Artisanal and Small-Scale Mining activities by automating Mining Cadastral Office operations etc� This will facilitate the opening up of this critical sector and make it more competitive, and revenue generating� It is expected that the increased revenue from this sector would favourably impact on public debt, by reducing Government borrowing needs and public debt stock in the long-term�
vi� In order to enable Government raise fresh funds to supplement its revenue for capital investments, Government is encouraged to privatise some of its viable enterprises and have them listed on The Nigerian Stock Exchange� Hence, the need for Government to sustain the on-going efforts aimed at reforming, restructuring and repositioning some of these enterprises for privatization or commercialization, including the Nigerian Postal Services (NIPOST), Nigerian Commodities Exchange, Lagos International Trade Fair Complex, National Stadia and Nigerian Security and Minting Company (NSPMC)�Aside saving government huge budgetary funds usually allocated for such entities annually, it will lead to wealth redistribution through public ownership of enterprises, as well as facilitate further deepening of the domestic capital market�
vii� As part of the on-going initiatives at attracting new investments into the economy and create new jobs, the Government is further encouraged to sustain its current efforts at implementing the Ease of Doing Business reforms, under the Presidential Enabling Business Environment Council (PEBEC)� This will help to boost non-debt creating investments such as FDIs, which will enhance the generation of tax revenue, and thus, a reduction in government borrowing in the long-term�
Optimizing Efficiency in Expenditure
viii� There is need to sustain Government’s initiatives at reducing wastages through plugging of leakages and fostering fiscal transparency, by strengthening the Efficiency
50
DEBT SUSTAINABILITY ANALYSIS (DSA) REPORT
Unit in the Federal Ministry of Finance� In addition, there is the need to fast-track the implementation of the Integrated Payroll and Personnel Information System (IPPIS) across the government MDAs to automate personnel records and salaries’ payment process�
ix� In view of the uncertainty around the resources accruing to all tiers of Government, as a result of the various shocks in the economy, State Governments need to be encouraged to implement effective fiscal reforms including the States 22-Point Fiscal Sustainability Plan (FSP),aimed at achieving improved accountability and transparency, increase public revenue, rationalise public expenditure, improve public financial management and manage debt sustainably at the sub-national level� This is expected to largely curtail the over-dependence on federal allocations and occasional Federal Government’s bail-outs�
Increase Investment in Critical Infrastructure to Promote the Development of the Real Sector
x� As part of efforts at mobilising additional financing for infrastructure development, there is need to encourage credible Private Sector entities, to invest in infrastructure through the issuance of Sovereign Guarantees to priority sector areas, with high-impact on the economy�
xi� There is also the need to creatively explore other alternative and viable sources of financing critical infrastructure projects, through Public-Private Partnership (PPP) arrangements – particularly Concessioning schemes to attract Private Sector to participate in the delivery of viable infrastructural projects, as well as the use of Project-tied Bonds such as Infrastructural Bonds and the Sukuk�
Upscale Capacity Building for Sub-nationals
xii� As part of efforts at enhancing overall public debt sustainability of the Federation (Federal and States), it is imperative to ensure the sustenance of the on-going DMO’s capacity building initiatives for the Sub-nationals (States), so as to upscale their technical competence and skills in public debt management� This would help to enhance public debt management practices at the sub-national level, and thus, help realise overall public debt sustainability�

51
DEBT SUSTAINABILITY ANALYSIS (DSA) REPORT
Annexure 1: Nigeria’s External Debt Sustainability Indicators Under Alternative Scenarios, 2017-2037

52
DEBT SUSTAINABILITY ANALYSIS (DSA) REPORT
Annexure 2: Total Public Debt Sustainability Under AlternativeScenarios, 2017-2037

53
DEBT SUSTAINABILITY ANALYSIS (DSA) REPORT
Anne
xure
3: E
xter
nal D
ebt S
usta
inab
ility
Fra
mew
ork,
Bas
elin
e sc
enar
io, 2
014-
2037
1/
(I
n pe
rcen
t of G
DP, u
nles
s ot
herw
ise in
dica
ted)
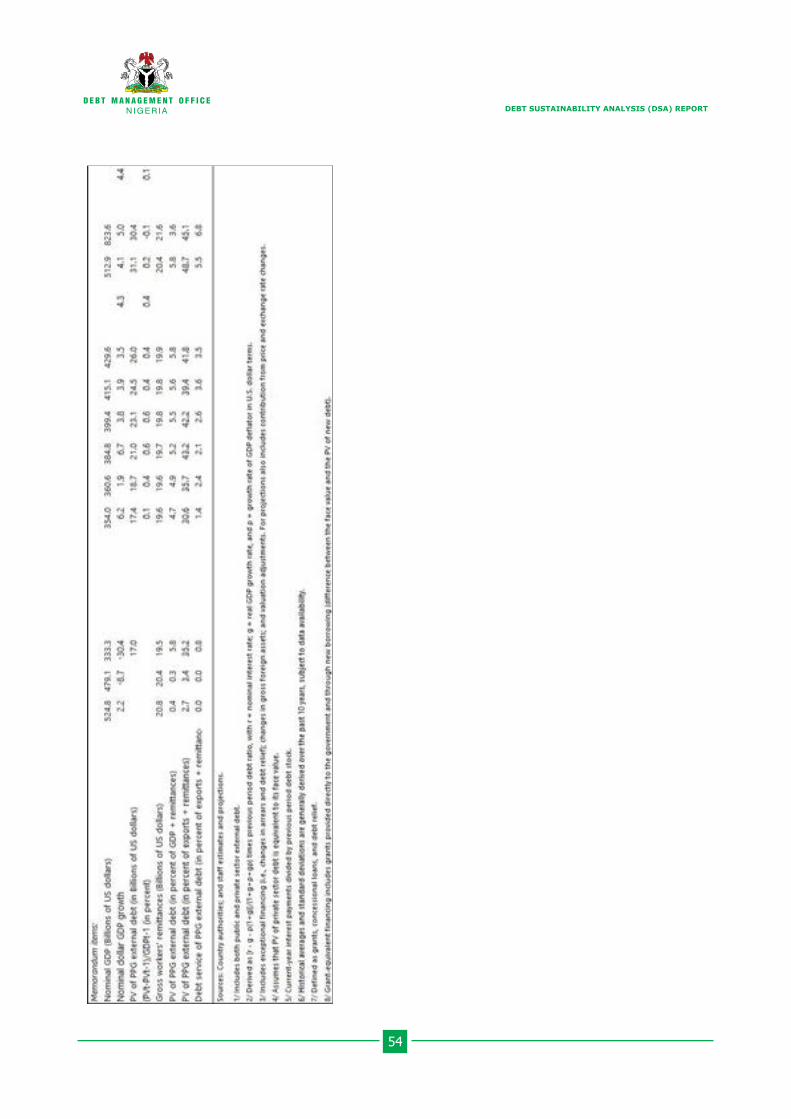
54
DEBT SUSTAINABILITY ANALYSIS (DSA) REPORT

55
DEBT SUSTAINABILITY ANALYSIS (DSA) REPORT
An
nex
ure
4:
Sen
siti
vity
An
alys
is f
or K
ey I
nd
icat
ors
of P
ub
lic a
nd
Pu
blic
ly G
uar
ante
ed
Exte
rnal
Deb
t, 2
01
7-2
03
7(I
n p
erce
nt)

56
DEBT SUSTAINABILITY ANALYSIS (DSA) REPORT
Anne
xure
4: S
ensi
tivity
Ana
lysi
s fo
r Key
Ind
icat
ors
of P
ublic
and
Pub
licly
Gua
rant
eed
Exte
rnal
Deb
t,
2017
-203
7 (c
ontin
ued)
(In
perc
ent)
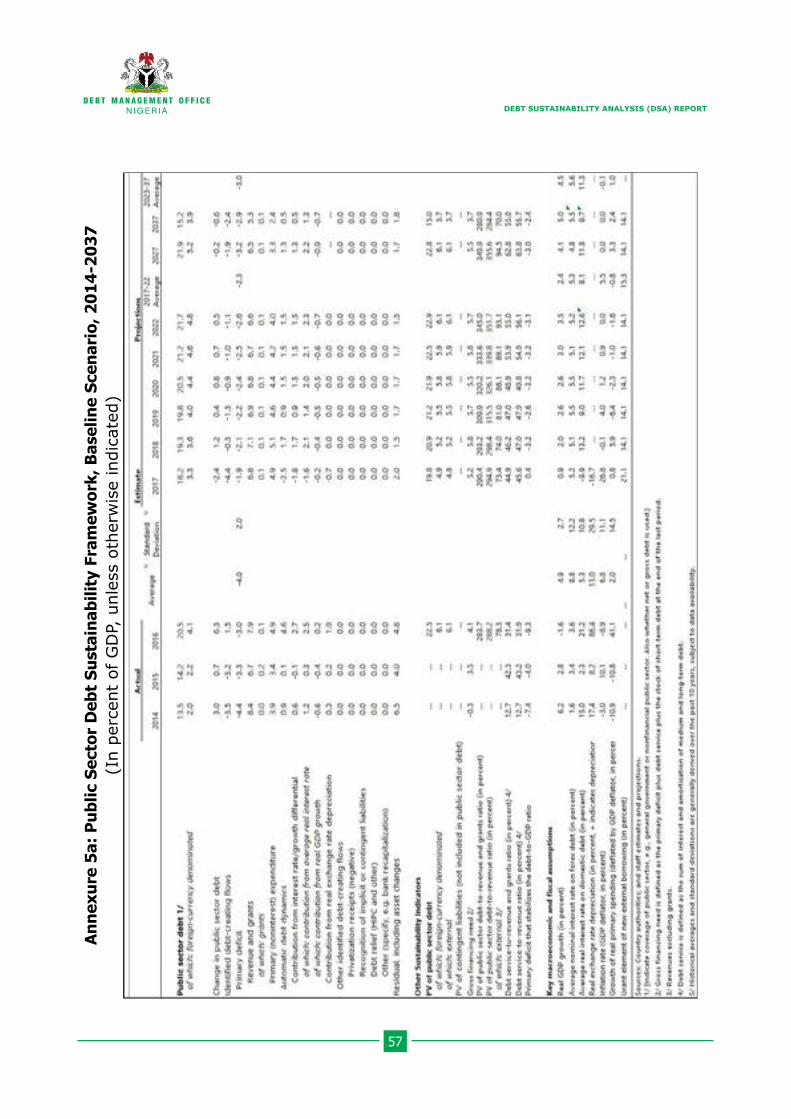
57
DEBT SUSTAINABILITY ANALYSIS (DSA) REPORT
Anne
xure
5a:
Pub
lic S
ecto
r Deb
t Sus
tain
abili
ty F
ram
ewor
k, B
asel
ine
Scen
ario
, 201
4-20
37(I
n pe
rcen
t of
GD
P, u
nles
s ot
herw
ise
indi
cate
d)

58
DEBT SUSTAINABILITY ANALYSIS (DSA) REPORT
Anne
xure
5b:
Sen
sitiv
ity A
naly
sis
for K
ey I
ndic
ator
s of
Pub
lic D
ebt 2
017-
2037
59
DEBT SUSTAINABILITY ANALYSIS (DSA) REPORT
THE DSA TECHNICAL TEAM
1� Joe Ugoala DMO2� Alfred Anukposi DMO3� Elizabeth Kwaghbulah DMO4� Johnson Amadi DMO5� Maraizu Nwankwo DMO6� Funmi Olasoji DMO7� Jummai Sa’id DMO8� Gregory Anowuru DMO 9� Bartholomew Aja DMO10� Felix Adeoye DMO11� Chinwe Nwogbo DMO12� Daniel Ajeh DMO13� Omolara Etim-Bassey DMO14� Lukman Popoola DMO15� Nura Adamu U� DMO16� Tunde Lawal FMBNP17� Jonah H� Mshelia FMBNP18� Musa Abdullahi CBN19� Ikenna-Ononugbo, A� A� CBN20� Zainab Sani CBN21� Uzor Okoye FMF22� Samuel Omenka BOF23� Ike Anayo A� BOF24� Umar Ahmed Bajoga OAGF25� Maureen Chinweokwu NBS Technical Adviser26� Baba Y� Musa WAIFEM