2017 annual report morningstar, inc. · · 2018-04-06data. we also widened pitchbook’s european...
TRANSCRIPT

2017Annual Report
Morningstar, Inc.
2017 Overview
3
3
3
3
3
3
3
Accomplishments
Our full-year results reflect successful execution across our key investment areas—Morningstar® Data, Morningstar DirectSM, Workplace Solutions, Morningstar® Managed PortfoliosSM, and Morningstar Credit Ratings. As a group, these areas had organic revenue growth of 11.7% in 2017. PitchBook, which is among our key areas of investment, is excluded from this figure because its growth became organic in December.
We celebrated a successful first year of integration with PitchBook and were pleased to see that increased investment in the sales organization supported growth that exceeded our expectations. We unveiled a new, expanded suite of fundamental equity data on the PitchBook Platform to provide comprehensive public-company data alongside PitchBook’s private market data. We also widened PitchBook’s European private equity and venture capital data sets, doubling our coverage to over 340,000 private companies.
In our data unit, we made great progress in the development and delivery of new and enhanced data sets in 2017. We added over 1,000 new data elements in equity data. We advanced our fixed-income capabilities, expanding portfolio-level data and adding new analytics for funds. We also strengthened our partnership with Sustainalytics, a leading global provider of environmental, social, and governance (ESG) research and ratings, with a new 40% ownership stake.
On the research front, we developed the Morningstar Quantitative RatingTM for funds, a model-driven, forward-looking rating that is designed to estimate what the Morningstar Analyst RatingTM would be for thousands of funds not covered by our manager research analysts. We also expanded our research coverage to health savings accounts (HSA).
We focused on developing new and innovative products like the Morningstar Best Interest Scorecard, a solution designed to help advisors act as fiduciaries for their clients. We expanded our proprietary risk model to help clients run scenario analyses to evaluate portfolio returns.
In Morningstar Credit Ratings, we expanded coverage of asset-backed securities. We also continued to enhance platforms and user interfaces in several key products, including Morningstar® Retirement ManagerSM. Importantly, we have a strong pipeline of new products as we enter 2018, including Morningstar OfficeSM Cloud, the launch of Morningstar proprietary mutual funds in the United States, and MiFID II solutions for European advisors.
We continued to invest in our people, increasing opportunities for Morningstar employees to acquire equity in the company. As we continued to focus on our diversity and inclusion initiatives, we were proud to be recognized by the Human Rights Campaign Foundation as a Best Place to Work by ing a top score of 100 on its 2018 Corporate Equality Index.
Challenges
Certain industry trends continued this year. Most notably, our clients are operating in a cost-conscious environment as they evaluate their businesses and strategies. We are growing in this environment by delivering even more value to our clients, supporting their efforts to digitize their businesses, meet enhanced regulatory requirements, and lower costs.
We experienced some business headwinds this year. Within Morningstar Investment Management, we continued our shift away from customized investment advisory to Morningstar-branded offerings. Our strong growth in Managed Portfolios was partially offset by declines in institutional asset management, reflecting choices we have made relating to areas of focus. In Morningstar Credit Ratings, while our overall number of new-issue ratings increased, our commercial mortgage-backed securities (CMBS) business performed
below our expectations. In Asia, growth lagged the rest of the company as we moved away from solutions requiring custom work, including investment management and enterprise components, to focus on our higher-margin, standard enterprise offerings. We continue to anticipate growth and future opportunities in our core offerings in the region.
We focused on our IT strategy and have commenced migrating our infrastructure to the cloud, which resulted in an impairment charge related to this strategic shift in the fourth quarter. We expect our cloud implementation to drive cost and operational efficiencies over time as well as reduce server and hardware needs. The migration will have some transitional effects on our level of capital expenditures and operating expenses and we expect to maintain certain redundant infrastructure prior to a full transition.
achiev-
3
3 3

1
$89.6 $82.1 $86.4 $98.4 $108.1 $123.5 $78.3 $132.6 $161.0 $136.9
$1.82 $1.65 $1.70 $1.92 $2.20 $2.66 $1.74 $3.00 $3.72 $3.18
$175.9 $110.0 $130.9 $174.5 $153.2 $192.6 $136.6 $241.5 $213.7 $250.1
(48.5) (12.4) (14.8) (23.3) (30.0) (33.6) (58.3) (57.3) (62.8) (66.6)
$127.4 $97.6 $116.1 $151.2 $123.2 $159.0 $78.3 $184.2 $150.9 $183.5
$297.6 $342.6 $365.4 $470.2 $321.4 $298.6 $224.6 $248.6 $304.0 353.3
179.8 236.6 254.6 336.3 213.5 173.5 97.0 105.5 177.1 206.6
803.9 919.1 1,086.3 1,167.0 1,038.3 1,026.8 1,010.3 1,029.0 1,350.9 1,405.7
130.3 127.1 146.3 155.5 146.0 149.2 146.0 140.7 165.4 185.5
39.8 45.8 52.2 39.4 54.0 66.0 62.1 84.0 359.2 277.6
530.2 665.8 781.4 857.0 726.9 691.3 654.4 640.6 696.8 804.9
(2)
(3)
Operating ResultsNet income attributable to Morningstar, Inc.
Diluted net income per share
Cash FlowsCash provided by operating activities
Capital expenditures
Free cash flow (5)
Balance Sheet DataCash, cash equivalents, and investments
Working capital
Total assets
Deferred revenue
Long-term liabilities
Total equity
2008 2009 2010 2011 2012 2013 2014 2015 2016 2017
(1) Operating income and free cash flow for 2014 include a $61.0 million litigation settlement expense and corresponding cash outflow.(2) Operating income for 2017 includes the negative impact of a $4.1 million impairment charge for certain software licenses due to the shift to our cloud-based strategy.(3) Net income and diluted net income per share for 2016 include a holding gain of $37.1 million, or 86 cents per share, in connection with the PitchBook acquisition.(4) Net income and diluted net income per share for 2017 include a provisional net benefit of $10.6 million, or 25 cents per share, to account for the estimated impact of U.S. Tax Reform, as well as a non-cash after-tax gain of $17.9 million, or 42 cents per share, in connection with the sale of HelloWallet.(5) Free cash flow, which we define as cash provided by operating activities less capital expenditures, is considered a non-GAAP financial measure. This measure is not equivalent to any measure required to be reported under U.S. generally accepted accounting principles (GAAP) and may not be comparable to similarly titled measures reported by other companies.
$138.9 $124.7
$127.4 $97.6
$121.1
$116.1
$138.4
$151.2Free Cash Flow (5)
Operating Income
Financial Highlights(in millions except per-share amounts)
18.7% –10.2% –2.9% 14.3%
–2.1%–23.3% –18.9%
30.2%
$150.7
8.9%
$123.2
–18.5%
13.3%
$170.7
–50.7%
$159.0
–38.1%
$105.6 (1)
29.1%
$78.3 (1)
80.5%
$190.6
135.2%
$184.2
–5.2%
$180.8
–18.1%
$150.9 $183.5
21.6%
–6.0%
$169.8
$502.5 $479.0 $555.4 $631.4Revenue
15.5%15.9%
13.7%
$658.3
4.3%
–4.7%
6.1%
$698.3
8.9%
$760.1
3.8%
$788.8
1.2%
$798.6 $911.7
14.2%
(4)

2
Dear Morningstar Shareholders,
Last year marked two significant personal milestones: I celebrated my 20th anniversary at Morningstar and became CEO. I joined our firm in 1997 as a data analyst. Back then, we collected data over the phone and through the fax machine, and we distributed our portfolio analysis software—Morningstar Principia®—via CD-ROM (trust me, it was cutting-edge). I doubt that all those CDs we sold, laid end to end, would even come close to the miles I logged walking (sometimes sprinting) the halls of Morningstar, learning the business inside and out over the past two decades. From CDs to the cloud, I’ve been privileged to participate in this special company’s development. We have an impactful mission, and I’m looking forward to sharing our future successes with you as we head into our next stage of innovation and growth.
In spring 2006, our chairman, Joe Mansueto, wrote his first shareholder letter, pledging to always provide a candid assessment of the business you own alongside us. In my first letter to you as CEO of Morningstar, I plan to keep that tradition going. I intend to make you a proud long-term partner in our business, and I’m thankful for your support and trust.
Joe and I feel good about our CEO transition and take special pride in the lack of drama surrounding it. Joe’s support and encouragement have allowed me and our executive team to focus on adding to our talented leadership team, double down on our data and research “engine,” continue to build a world-class investment management organization, and identify the next set of investor advocacy issues that we’re passionate about. We’re focused on making the appropriate investments to drive our business forward in a rapidly changing, digitally driven financial services landscape. The proliferation of artificial intelligence and Big Data has led to incredible efficiencies and opportunities within global financial markets; however, in other ways, indiscriminate use of technology can also contribute to unexpected financial outcomes and bad investment advice. Individual investors, financial advisors, and asset managers alike struggle in an environment of information overload. We’re helping them make sense of it all so that investors can experience the outcomes they deserve.
Investors are sometimes surprised when we refer to ourselves as a “fintech” company because Morningstar’s brand is often (rightfully) associated with independent investment

Morningstar, Inc. 2017 Annual Report 3
We’re doubling down on our data and research “engine.”

Letter to Shareholders
4
3Please refer to page 1 for a reconciliation to cash provided by operating activities.
research. That said, we’ve always considered ourselves to be one of the original fintech firms. Leveraging technology and design to find new ways to solve complex financial problems has been our core competency since the day Joe bought a newfangled personal computer to crunch mutual fund data in his Lincoln Park, Chicago apartment over 30 years ago. It’s an important part of my job to constantly seek fresh perspectives and challenge the status quo in an evolving fintech landscape, while at the same time protecting the elements of our culture that make Morningstar, Morningstar.
We continue to favor three straightforward financial metrics to assess the health of our business: revenue, operating income, and free cash flow. We’re lucky that our business has inherently good operating leverage. Once we make a fixed-cost investment, it costs very little to drive incremental sales. As long as revenue grows faster than operating expenses, we’ll be in a good place to keep generating the healthy profits and cash flows that give us the financial flexibility to invest in our business and ultimately support longer-term shareholder value.
We didn’t quite deliver on this goal in 2017, and there were some good reasons for it. Chief among them is that we saw opportunities to scale quickly, and we got behind them meaningfully. For instance, as our clients’ regulatory needs increased, we put more resources to work on building MiFID II solutions for advisors in Europe and best-interest solutions designed to help U.S. advisors act as fiduciaries for their clients. And in our first year of owning PitchBook, which provides data and technology covering the venture capital and private equity space, we invested aggressively to seize the sizable growth opportunities it presents. Meanwhile, in our investment management unit, we laid the groundwork to launch mutual funds in the United States in 2018 as we looked to reduce costs to investors in Morningstar® Managed PortfoliosSM by more than 20% and redesigned and rebuilt the platform we use to interact with advisors who use this service. Our retirement manager platform got an upgrade, too, and we have high expectations for it in the years ahead.
You can expect that we’ll begin harvesting these and other investments in 2018. It’s important, though, to recognize that we are focused on building long-term value and that we’ll trade short-term results for an even more positive long-term outcome when the appropriate opportunities present themselves.
Our Business

Morningstar, Inc. 2017 Annual Report 5
Revenue growth was stellar in 2017. We increased our revenue 14.2% to $911.7 million for the year, aided in part by the PitchBook acquisition. I’m thrilled that all of our key areas of investment drove this growth, resulting in a year when we exceeded our sales targets to achieve organic revenue growth of 7.6%. As a cohort, our key investment areas outside of PitchBook—Morningstar® Data, Morningstar DirectSM, Workplace Solutions, Morningstar® Managed PortfoliosSM, and Morningstar Credit Ratings—produced organic revenue growth of 11.7% in 2017.
We did fall short on operating income growth. On a reported basis, our operating income declined 6.0% to $169.8 million in 2017; however, in addition to the higher levels of investments for scale I discussed earlier, our reported results included three special items that increased the complexity of our financials and masked otherwise solid underlying performance. For example, in the fourth quarter, we recorded a $4.1 million impairment charge related to the write-down of third-party software licenses that we will no longer need as we migrate our infrastructure to the cloud.
Operating income growth was also impacted by higher commission expenses as sales growth accelerated in the fourth quarter. Kudos to our chief revenue officer, Danny Dunn, who joined Morningstar in late 2016 from IBM, for making an instant impact. Danny brought a renewed focus and rigor to our sales processes, which has raised my confidence in our ability to execute as we morph into a much larger organization. Even though he’s a seasoned sales pro, Danny wins my rookie of the year award at Morningstar.
Back to the numbers, as I’ve saved the best for last. Free cash flow increased almost 22% to $183.5 million in 2017 on higher cash provided by operating activities. We’re fortunate that growing our business does not require heavy levels of capital investment, and historically, we’ve managed to drive healthy levels of incremental cash flow on every dollar of fixed-cost investment. Happily, this year was no exception. In addition to driving our intrinsic valuation, strong free cash flow gives us the financial flexibility to either reinvest into the business or return cash to shareholders. In 2017, we chose to pay down $70 million of debt incurred for the PitchBook acquisition, we distributed $39.3 million in dividends, and repurchased $41.9 million of our own shares. In December, we were pleased to announce an 8.7% increase to our quarterly dividend and a new $500 million share repurchase program.
2017 Financial Highlights

Letter to Shareholders
6
In my view, Morningstar’s strategy should answer two very important questions: What are our core competencies and how can we leverage them to improve investor outcomes and create shareholder value? To illustrate, we’ve long recognized that our data and proprietary research set us apart, and in a world where everyone wants to be like Amazon, I think often about where we can maximize our scale. It is critical that we support and invest in our data and research engine, which produces the insights our clients use to make informed investment decisions. This is where we’ve built scale in our business. For example, in 2017, we covered over 580,000 public investment vehicles, including about 228,000 open-end mutual funds, almost 15,000 exchange-traded products, and over 40,000 stocks. And with PitchBook, we have coverage of close to 900,000 private companies.
Keeping our data and research engine humming is Haywood Kelly’s task, and he’s a busy man. In addition to overseeing our global equity and manager research operations, he’s also responsible for executing our growth strategy in Morningstar Credit Ratings, which is one of our key investment areas. One of the most intellectually curious people you’re likely to meet, Haywood does a terrific job ensuring that we’re expanding our moat every year. He has an eye for talent and continues to nurture and promote some of our highest potential future leaders from within his organization. As a shareholder, you have a lot riding on Haywood’s efforts.
We monetize our data and research in two main ways. We offer access to our insights through decision support tools for clients who perform their own investment research. Typically, these are sold via subscriptions or licenses, which set up the recurring revenue streams that contribute to our operating leverage. Each year, we add value to these tools by delivering even more data, research, and functionality to our clients. For example, in 2017, we ramped up database investments in equity fundamentals, fixed-income, and alternatives. We also partnered with Sustainalytics to expand our new environmental, social, and governance, or ESG, ratings. Assets in ESG-linked investments are climbing worldwide, so we’re investing in developing solutions that can help investors analyze their holdings through these lenses. I have a personal interest in ESG, too, and believe it will help create a new generation of young investors.
We’ve also been building up a strong quantitative research team that’s behind some recent innovations, such as our global risk model, which allows clients to run scenario analyses.
Strategy

Morningstar, Inc. 2017 Annual Report 7
We include this new functionality in Morningstar Direct, so users can perform more of their work within a single software engine. This team has also been tasked with innovating and evolving our ratings methodology, as we strive to move to forward-looking ratings across the board in the years ahead. For example, we recently launched the Morningstar Quantitative RatingTM for funds, which uses a machine-learning model to rate more than 10,000 funds representing more than 30,000 share classes in the United States.
We’re focused on ensuring that we maximize the value of the intellectual property we create by reimagining the interaction experiences investors have with our data and introducing new methods of data visualization. We’ve long prided ourselves on our ability to take complex financial concepts and break them down for investors in an easily digestible manner. You’ll see us doing more of that with ESG and the risk model this year under the leadership of David Williams, our chief design officer. We’re experimenting with some terrific new ways to display and interact with data in our software, for instance. David is a perfectionist and pushes all of us to deliver the best products possible. His ability to view things from the lens of the investor ensures that we aren’t just spitting out rows and rows of data devoid of context or signature touches.
The second way we monetize our data and research is by providing solutions to those who wish to outsource the investment management function. We typically collect basis points for assets under management in such arrangements. The investors we serve through these solutions are either users of our managed retirement accounts offering, or clients who use our Morningstar Managed Portfolios via financial advisors. We expect that over the next decade, a greater percentage of our overall revenue will be tied to fees associated with the assets we manage across our business.
In recent years, we’ve intentionally shifted our focus away from customized investment advisory to Morningstar-branded offerings, with the intent of leveraging our proprietary research to better scale this business, while helping advisors achieve better invest-ment outcomes for their clients. Managed Portfolios had a banner year, as strength in the global financial markets combined with strong net inflows grew AUM by 31.8%. But some of that success has been masked by our reduced focus on the customized investment advisory business, which has seen declines. Managed Portfolios now accounts for an
Letter to Shareholders
8
Industry Trends
increasing percentage of Morningstar Investment Management’s AUM, and we expect that this strategic choice will translate into stronger growth across the segment as a whole going forward. Shepherding this business is Daniel Needham, who serves as president and chief investment officer of Morningstar Investment Management. Daniel deserves immense credit for bringing focus and an institutional-caliber mindset to this business. He’s also aterrific investor who’s always ready for a good investment debate. If you’re looking for a place to park your clients’ money, we stack up well against the best and are only getting stronger. Take a look at advisor.mp.morningstar.com and be sure to check out Daniel’s thought-provoking investor letters.
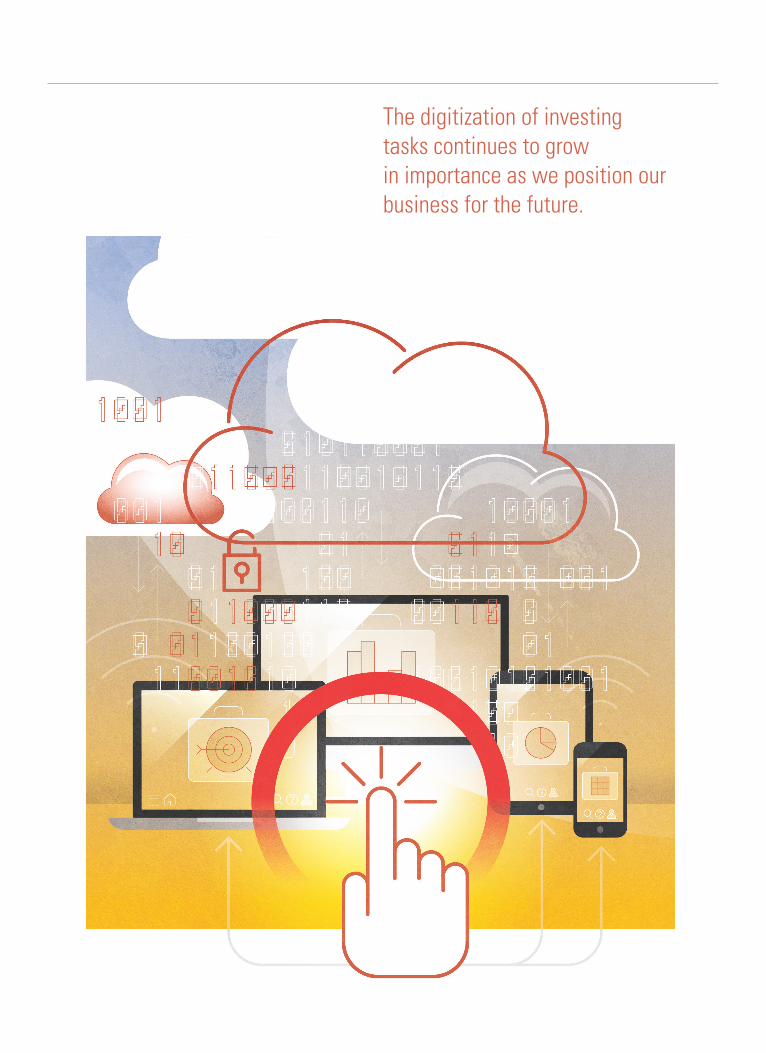
Three secular trends continue to grow in importance as we position our business for the future. First is the digitization of investing tasks. As an industry, we’ve only scratched the surface here, and the pressure on fees combined with clients’ rising demands for frictionless interactions with their money is only going to up the ante.
The second trend, global regulation, is gathering steam. The adoption of MiFID II in Europe, and the growing support for the adoption of best-interest solutions for advisors in markets such as the U.S., highlight the rising importance of transparency in global financial markets, especially in an era of information overload. Technology can either obscure or illuminate investing worldwide, and we are continuously advocating for the latter. We strongly believe that investors have a right to full transparency into their investments, including how much they’re paying for them. Having an independent, transparent business model, as we do, is just the solution that investors are demanding today.
Finally, the shift away from high-cost to low-cost investing is indeed the new normal. While we’ve experienced some fee compression as a result of this trend, we believe it has made investment managers more attentive to delivering value and the act of investing more accessible and cost-effective, both of which are good things. Our research and investment offerings reflect our continued belief that active and passive strategies each have a place in investors’ portfolios.
Morningstar, Inc. 2017 Annual Report 9
The digitization of investing tasks continues to grow in importance as we position our business for the future.

Letter to Shareholders
10
PitchBook
In light of these three big trends, we’ve identified six businesses that we believe are uniquely positioned to thrive in this dynamic environment: Morningstar® Data, Morningstar DirectSM, Workplace Solutions, Morningstar Managed Portfolios, Morningstar Credit Ratings, and PitchBook. These are the areas we’re investing in and that we expect to deliver the lion’s share of our growth over the next five years.
To do this, I’m relying on Tricia Rothschild, Morningstar’s chief product officer, to ensure that we get things done while also fostering a culture of innovation, client-focused inspiration, and continuous improvement. Tricia’s many years of experience at Morningstar have translated into a keen intuition for what our clients want and need, and she’s among the core group of people who have helped our business morph in response to market trends. Tricia has always been a staunch supporter of the industry moving toward solutions that take the best interest of clients into account. She’s a passionate believer in the value of advice and helping financial advisors in our joint mission of serving the end investor. Look for a number of our products to get a refresh under Tricia’s leadership in 2018.
We added PitchBook to our list of key investment areas in 2017, and I’m an unabashed fan and believer in the growth potential of this business. While we always prefer organic growth over acquisitions, we do purchase companies from time to time if it helps us add a complementary capability or improve speed to market. That was the case with PitchBook, a business I had gotten to know well while serving on its board. As more and more investors look outside the public markets for opportunities, we think that owning PitchBook’s core data set is a nice complement to our public equities database.
One year in, we’ve already achieved a significant milestone by integrating PitchBook’s private company equity data with Morningstar’s public company equity research reports and public company fundamentals data on the PitchBook platform. This is just the beginning of a series of public equity data and research rollouts that we believe will propel PitchBook toward becoming a premier provider of equity data solutions.
PitchBook embodies a culture that, in many ways, is simpatico with the rest of Morningstar. PitchBook’s founder and leader, John Gabbert, has built an amazing firm, and it’s been wonderful having John and his team within the Morningstar family. As a member
Key Investment Areas

Morningstar, Inc. 2017 Annual Report 11
Leadership Transitions
of Morningstar’s executive leadership team, John’s been traveling between Seattle and Chicago more than ever before, but he’s done it in a good-natured manner. I’m thrilled to have John as a partner and Morningstar shareholder. Our intent is to continue running PitchBook with relative independence, even as it leverages more of the great data and research we have access to at Morningstar. If you aren’t a PitchBook subscriber, you’re missing out.
In 2017, we decided to divest HelloWallet. We acquired it three years ago because of its strong mission, cultural alignment, shared commitment to independence, and focus on entrepreneurialism grounded in academic research. However, our theory that HelloWallet could help us drive growth in our managed accounts business didn’t pan out. Although financial wellness solutions resonated in retail banking, we determined that channel was off focus for us. The silver lining is that we had several talented people join our team, including Rob Pinkerton and Mitch Shue, our chief marketing officer and chief technology officer, respectively.
Rob is incredibly forward-thinking and has elevated discussions around how our brand, message, and impact is relevant to the investor of today. He’s also fast becoming Danny Dunn’s best friend as we continue to plow ahead with overhauling our digital lead generation process. This is a major area of focus for us in 2018, and we’re counting on Rob and his team to deliver a significant lift.
On the technology side, Mitch has been successfully executing our transition to the cloud. He’s invested significant personal time and energy in painting an exciting vision for our technology future—one dominated by APIs, components, and the cloud. Mitch is ably assisted by two stars—James Rhodes, our chief data officer, who will succeed Mitch in the CTO role later this year, and Mike Allen, our chief information officer. We keep asking more of this trio, and they respond by further raising the bar.
Almost four months to the day after I first interviewed him, in July 2017 we appointed Jason Dubinsky as our new chief financial officer, and I’m thrilled to partner with him to lead our business. Jason joined us from Walgreens Boots Alliance, where he served as senior vice president and chief financial officer of planning and central operations. He had
Divestiture

Letter to Shareholders
12
responsibility for Walgreens’ U.S.-based accounting and shared service functions, while also leading financial planning and analysis for the global business. I knew from the moment we first sat down together that his background and experience checked all the boxes. Aside from his obvious proficiency, though, I wanted to be sure that he would be the right cultural fit for Morningstar and that he could leverage his skill set in a manner that would boost the whole organization. In fairness, he wanted to kick our tires, too. But never mind the lengthy hiring process … I bet Jason is so happy that he started before the Tax Cuts and Jobs Act was signed into law. I’m confident that this added complexity to our 2017–18 financial reporting will make his first year with us memorable for all of the right reasons!
We also have a new director of investor relations, Barbara Noverini. Barbara joined Jason’s team after having spent nearly seven years as a Morningstar equity analyst. She is looking forward to meeting our shareholders, so please say hello at our Annual Investor Day, which is Friday, May 18, at our offices in Chicago.
While we welcomed Jason to Morningstar in 2017, Cathy Odelbo, our head of strategy, decided she would like to retire in 2018. Those of you who have followed us over the years likely know Cathy well and understand what she has meant to Morningstar’s culture, mission, and financial success over the years. Whether it’s providing unrelentingly candid opinions as an analyst, building up our individual investor business, getting us into equity research, or starting a strategy function at Morningstar, Cathy has been a champion for investors broadly and created tremendous value for shareholders in the process. Her impact at Morningstar is lasting and meaningful, and she remains a significant Morningstar shareholder. We wouldn’t be who we are or where we are without Cathy.
With Cathy’s retirement imminent, we promoted Mike Holt to our head of strategy. Mike led a large team of equity analysts as our global head of equity research, so I asked him to select a small group who could provide our management team with frank assessments of some of our business lines and the decisions we were making around them. He was so good and it—and enjoyed it so much—that with Cathy’s departure it seemed natural to have Mike step into the strategy role. As I hoped he would, Mike is already pushing ahead and asking all the right (tough!) questions.

Morningstar, Inc. 2017 Annual Report 13
Culture and Diversity
Speaking of tax reform … with the Tax Cuts and Jobs Act signed into law quite late in the year, our finance team spent countless hours understanding how the change would affect our company. Of course, there were the short-term implications. Our fourth-quarter and full-year financial results contained a net one-time benefit of $10.6 million, which boosted our net income per share by 25 cents for the fourth quarter and full year.
Going forward, we expect that there will be real cash benefits to us. Based on our current level of taxable income in the U.S., we estimate that the change in the corporate tax rate will result in approximately $15 million of incremental annual free cash flow. We’re currently evaluating opportunities for deploying this excess cash flow in a manner that benefits all of our stakeholders.
While it’s become fashionable for companies to talk about the importance of culture and diversity, these important topics have been a natural part of our DNA from the beginning. We strive to create an inclusive workplace that avoids groupthink, encourages debate, and emphasizes both impact and mutual respect. To assess our efforts in this area, in 2017 we began measuring the diversity of our workforce in traditional terms of gender, ethnicity, and sexual orientation. We learned that while honoring our differences comes naturally to Morningstar employees, the composition of our workforce doesn’t really look all that different from our peers in the financial services and technology industries, where women and minority groups have been historically underrepresented. In other words, we too have room for improvement. To establish accountability for our diversity goals, we shared a detailed census of our current state of diversity with all of our employees a few months ago and asked everyone to get more involved in fostering an environment of equality. We also recently began displaying diversity data on our corporate website, so our external stakeholders can follow our progress in this area. In addition, I am so proud that Morningstar was recently recognized by the Human Rights Campaign Foundation as a Best Place to Work by achieving a top score of 100 on its 2018 Corporate Equality Index.
But we’re always striving to get better, and nobody is more focused on this goal than Bevin Desmond, our head of talent and culture. In 2017, she pushed us to double down on our use of data and analytics to guide decision-making around our organizational initiatives. She’s also an unceasing advocate for her colleagues and led our efforts to roll out an equity
Tax Reform

Letter to Shareholders
14
From the beginning, culture and diversity have been a natural part of our DNA.

Morningstar, Inc. 2017 Annual Report 15
ownership plan in response to employees’ desire to invest more in Morningstar. This important initiative allows employees to become long-term owners of Morningstar stock should they desire to, which we believe reinforces our ownership-oriented, entrepreneurial culture. As shareholders, you should feel very good that Bevin is at the core of our talent decisions, constantly challenging our organization to evolve and transform itself for future success.
Rounding out our senior team is General Counsel Pat Maloney, who will tell you that one of his primary reasons for joining Morningstar was our workplace culture. Pat has had an immediate impact at Morningstar since his arrival a couple of years ago. Not only is he a skilled practitioner in his field, but he’s also pragmatic and partners well with our business leaders. An avid user of Morningstar products before his arrival here, he also has no issue challenging our analysts and product leaders. Pat and his team were key ingredients in our successful 2017, and we’ll be leaning on them more than ever with our coming launch of mutual funds in the U.S. later this year.
We’re only now beginning to write Morningstar’s next chapter, and it’ll be a good one. While the world is changing, it is coming around to where we’ve been for a long time. We are advocates for the investor, believers in independence and transparency, embracers of technology and design, and proponents of a patient, longer-term mindset. We take seriously the trust investors worldwide have placed in our organization as they look to gain financial freedom. That means that as their needs and wants change, so too will Morningstar.
Thanks again for your partnership. I look forward to seeing you at our shareholder meeting in Chicago on May 18.
Best regards,
Kunal Kapoor
Looking Ahead

Letter to Shareholders
16
17
UNITED STATESSECURITIES AND EXCHANGE COMMISSION
Washington D.C. 20549
� ANNUAL REPORT PURSUANT TO SECTION 13 OR 15(d) OF THE SECURITIES EXCHANGE ACT OF 1934
FOR THE FISCAL YEAR ENDED DECEMBER 31, 2017OR
� TRANSITION REPORT PURSUANT TO SECTION 13 OR 15(d) OF THE SECURITIES EXCHANGE ACT OF 1934
For the transition period from to Commission File Number: 000-51280
(Exact Name of Registrant as Specified in its Charter)
Illinois 22 West Washington Street 36-3297908(State or Other Jurisdiction of Chicago, Illinois 60602 (I.R.S. EmployerIncorporation or Organization) (Address of Principal Executive Offices) Identification Number)
(312) 696-6000(Registrant’s Telephone Number, Including Area Code)
Securities registered pursuant to Section 12(b) of the Act:
Title of Each Class Name of Each Exchange on Which RegisteredCommon stock, no par value The Nasdaq Stock Market LLC
Securities registered pursuant to Section 12(g) of the Act: None
Indicate by check mark if the Registrant is a well-known seasoned issuer, as defined in Rule 405 of the Securities Act. Yes � No �
Indicate by check mark if the Registrant is not required to file reports pursuant to Section 13 or Section 15(d) of the Act. Yes � No �
Indicate by check mark whether the Registrant (1) has filed all reports required to be filed by Section 13 or 15(d) of the Securities Exchange Act of 1934 during the preceding 12 months (orfor such shorter period that the Registrant was required to file such reports), and (2) has been subject to such filing requirements for the past 90 days. Yes � No �
Indicate by check mark whether the registrant has submitted electronically and posted on its corporate Web site, if any, every Interactive Data File required to be submitted and postedpursuant to Rule 405 of Regulation S-T (§232.405 of this chapter) during the preceding 12 months (or for such shorter period that the registrant was required to submit and post such files).Yes � No �
Indicate by check mark if disclosure of delinquent filers pursuant to Item 405 of Regulation S-K is not contained herein, and will not be contained, to the best of Registrant’s knowledge, indefinitive proxy or information statements incorporated by reference in Part III of this Form 10-K or any amendment to this Form 10-K. �
Indicate by check mark whether the registrant is a large accelerated filer, an accelerated filer, a non-accelerated filer, a smaller reporting company, or an emerging growth company. Seethe definitions of ‘‘large accelerated filer,’’ ‘‘accelerated filer,’’ ‘‘smaller reporting company,’’ and ‘‘emerging growth company’’ in Rule 12b-2 of the Exchange Act. (Check one):
Large accelerated filer � Accelerated filer � Non-accelerated filer � Smaller reporting company � Emerging growth company �(Do not check if a smaller reporting company)
If an emerging growth company, indicate by check mark if the registrant has elected not to use the extended transition period for complying with any new or revised financial accountingstandards provided pursuant to Section 13(a) of the Exchange Act. �
Indicate by check mark whether the Registrant is a shell company (as defined in Rule 12b-2 of the Exchange Act). Yes � No �
The aggregate market value of shares of common stock held by non-affiliates of the Registrant as of June 30, 2017 was $1.4 billion. As of February 16, 2018, there were 42,498,136shares of the Registrant’s common stock, no par value, outstanding.
DOCUMENTS INCORPORATED BY REFERENCE
Certain parts of the Registrant’s Definitive Proxy Statement for the 2018 Annual Meeting of Shareholders are incorporated into Part III of this Form 10-K.
Morningstar, Inc. 2017 Annual Report 17
FORM 10-K
MORNINGSTAR, INC.

18
2017 10-K: Part I
18

19
Table of Contents
Part I 20
Item 1. Business 20
Item 1A. Risk Factors 45
Item 1B. Unresolved Staff Comments 55
Item 2. Properties 55
Item 3. Legal Proceedings 56
Item 4. Mine Safety Disclosures 56
Part II 57
Item 5. Market for Registrant’s Common Equity, Related Stockholder Matters and Issuer Purchases 57
of Equity Securities
Item 6. Selected Financial Data 59
Item 7. Management’s Discussion and Analysis of Financial Condition and Results of Operations 61
Item 7A. Quantitative and Qualitative Disclosures about Market Risk 91
Item 8. Financial Statements and Supplementary Data 92
Item 9. Changes in and Disagreements with Accountants on Accounting and Financial Disclosure 132
Item 9A. Controls and Procedures 132
Item 9B. Other Information 133
Part III 134
Item 10. Directors, Executive Officers, and Corporate Governance 134
Item 11. Executive Compensation 134
Item 12. Security Ownership of Certain Beneficial Owners and Management and Related Stockholder Matters 134
Item 13. Certain Relationships and Related Transactions, and Director Independence 134
Item 14. Principal Accountant Fees and Services 134
Part IV. 135
Item 15. Exhibits and Financial Statement Schedules 135
Item 16. Form 10-K Summary 137
Morningstar, Inc. 2017 Annual Report 19

20
2017 10-K: Part I
Morningstar, Inc. is a leading provider of independent investment research in North America, Europe, Australia, and Asia. Thecompany offers an extensive line of products and services for individual investors, financial advisors, asset managers, retirementplan providers and sponsors, and institutional investors in the private capital markets.
We currently serve approximately 255,000 financial advisors, 1,500 asset management firms, 31 retirement plan providers,285,000 retirement plan sponsors, and 11.9 million individual investors. We also provide data on the private capital markets toapproximately 2,700 institutional clients.
Our data and research are core assets that we seek to leverage to build Morningstar’s long-term value. Morningstar providesextensive data and research insights on a wide range of investment offerings, including managed investment products, publiclylisted companies, fixed income securities, private capital markets, and real-time global market data.
We’ve been providing independent analyst research on mutual funds and other investment vehicles since the mid-1980s. We usethis analyst research to provide a qualitative, forward-looking Morningstar Analyst Rating for funds. We now provide researchreports and Morningstar Analyst Ratings for approximately 5,100 funds globally, including active, passive, multi-asset, ETF, andclosed-end fund strategies. We also offer qualitative research and ratings on alternative funds, state-sponsored college savingsplan portfolios, target-date funds, and ETFs. Our data and proprietary analytical tools such as the Morningstar Rating for mutualfunds, which rates past performance based on risk- and cost-adjusted returns, and the Morningstar Style Box, which provides avisual summary of a mutual fund’s underlying investment style, have become important tools that millions of investors andadvisors use in making investment decisions. Other tools, such as the Ownership Zone, Sector Delta, and Market Barometer, allowinvestors to see how different investments work together to form a portfolio and to track its progress.
The Morningstar Sustainability Rating helps investors evaluate funds based on environmental, social, and governance (ESG)factors. Morningstar now provides Sustainability Ratings for approximately 36,000 investment vehicles. Sustainability ratings formutual funds and ETFs encompass $21 trillion in assets under management, or more than half of fund assets globally.
As part of our research efforts on individual stocks, we popularized the concepts of economic moat, a measure of competitiveadvantage originally developed by Warren Buffett, and margin of safety, which reflects the size of the discount in a stock’s pricerelative to its estimated value. The Morningstar Rating for stocks is based on the stock’s current price relative to our analyst-generated fair value estimates, as well as the company’s level of business risk and economic moat. Our analysts coverapproximately 1,500 stocks using a consistent, proprietary methodology that focuses on fundamental analysis, competitiveadvantage assessment, and intrinsic value estimation.
In addition to our analyst-driven coverage, we provide quantitative ratings and reports for approximately 56,000 companiesglobally. These equity ratings draw on the fundamental research of our equity analyst team and provide a forward-lookingstatistical view of the valuation, competitive advantage, and level of uncertainty for stocks that are often under-followed by otherresearch firms.
PitchBook, which we acquired in December 2016, provides venture capital and private equity firms, corporate development teams,investment banks, limited partners, lenders, law firms, and accounting firms with a robust, all-in-one workstation that focuses on
20
Part I
Item 1. Business
Overview

21
private capital markets. Morningstar’s in-depth public company fundamental data and institutional equity research wereintegrated into the platform in 2017, allowing institutional investors to better capitalize on opportunities in both public and privatemarkets.
Through our Morningstar Credit Ratings, LLC subsidiary, which is a Nationally Recognized Statistical Rating Organization (NRSRO),we provide new issue and surveillance ratings and analysis for commercial mortgage-backed securities (CMBS), residentialmortgage-backed securities (RMBS), and other types of asset-backed securities. In 2017, the National Association of InsuranceCommissioners (NAIC) extended Morningstar Credit Ratings’ designation on its NAIC Credit Rating Provider list to include financialinstitutions, brokers, and dealers, as well as corporate issuers. Morningstar Credit Ratings also announced the launch of its RealEstate Investment Trust (REIT) ratings initiative in 2017.
In our investment management business, we’ve developed in-depth advice on asset allocation, portfolio construction, and securityselection to meet the needs of investors and professionals looking for integrated portfolio solutions. We’ve published research on‘‘Gamma,’’ an innovative measure that quantifies how much additional retirement income investors can generate by making betterfinancial planning decisions. We use the concept of human capital-or potential future earning ability-to provide a more completepicture of an investor’s financial worth and optimize a portfolio’s asset mix.
We believe investors rely on these tools because they offer a useful framework for comparing potential investments and makingdecisions. Our independence and our history of innovation make us a trusted resource for investors.
Morningstar, Inc. 2017 Annual Report 21

8MAR201808292342
22
2017 10-K: Part I
Canada Index
Day Change
Last Value2,103.11
Open Value2,148.86
Last Close2,154.10
50.99 | 2.37 %
—1.25 +1.250
The Morningstar Style Box
The Morningstar Style Box is a nine-square grid that illustrates
the “investment style” of stocks and mutual funds. It classifies
securities based on their market capitalization (the vertical axis)
and growth and value factors (the horizontal axis).
The Morningstar Rating
We provide Morningstar ratings for funds (based on historical
risk and returns) and stocks (based on our fair value estimates).
The Morningstar Analyst Rating
The Morningstar Analyst Rating for funds is a global, qualitative
measure based on our assessment of five key pillars: process,
performance, people, parent, and price.
Economic Moat
Our analysts assign Economic Moat ratings of Wide,
Narrow, or None based on our view of the company’s sustainable
competitive advantage.
Value Blend Growth
Smal
lM
idLa
rge
Price vs. Fair Value
Morningstar’s signature Price vs. Fair Value graph compares
a stock’s market price with our estimate of the company’s
intrinsic value, as well as how our ratings and the stock’s share
price have changed over time.
Global Market Barometer
The Global Market Barometer is a current snapshot
of the world’s equity markets based on price trends in the
Morningstar Indexes.
Wide Narrow None
Valuation
Economic Moat
Fair ValuePrice
2016201520142013201220112010
Wide
Narrow
None
22

8MAR201808292486
23
Morningstar Sustainability Rating
The Morningstar Sustainability Rating for funds helps investors
evaluate mutual funds and exchange-traded funds
based on environmental, social, and governance (ESG) factors.
Gamma Methodology
Our research on Gamma quantifies the value of financial
planning and incorporates several key components that can
improve investor outcomes.
Portfolio X-RayAsset Allocation
U.S. Stocks
51.42Non-U.S. Stocks 38.65
% Net
17.152.412.000.44
BondCashOtherNot classified
Stock RegionsAmericas
50.27 % Weight
North America 33.437.81Latin America
Human Capital
We use the concept of human capital—or potential future
earning ability—to provide a more complete picture of
an investor’s financial worth and optimize the asset mix for
retirement portfolios.
Human Capital
$$$$
$$$
$$
$
Financial Capital
Retirement Age
45 65 85
100
80
60
40
20
0
25 35 45 55 65 75 85 95
Real Estate
Age
Rela
tive
Wei
ght (
%)
Financial Capital Pension Wealth Human Capital
Portfolio X-Ray
Our popular Portfolio X-Ray tool helps investors reduce risk
and understand the key characteristics of their portfolios based
on nine different factors.
Total Wealth Approach
Our Total Wealth Approach provides a more complete
view of all sources of an investor’s wealth, including financial
capital, human capital, housing assets, and retirement
and pension benefits.
GammaAsset Location and Withdrawal SourcingLiability Relative OptimizationDynamic Withdrawal StrategyAnnuity AllocationTotal Wealth Asset Allocation
Morningstar, Inc. 2017 Annual Report 23

24
2017 10-K: Part I
Our strategy is to widen our economic moat, or sustainable competitive advantage, and build shareholder value by focusing on ourthree key objectives, which we describe in more detail below.
We believe the quality and scope of our independent investment research offers a competitive advantage that would be difficultfor competitors to replicate. Our goal is to leverage our proprietary research and intellectual property to help investors with bothdecision support (via Morningstar Direct and PitchBook) and outsourced investment management.
We’re focusing our research efforts on several different areas, as described below.
� Manager research (including mutual funds, ETFs, separate accounts, and other vehicles)
Our goal for manager research is to improve investor outcomes through ratings efficacy, coverage expansion, and innovation. Ouranalyst team qualitatively assesses thousands of managed investments using a structured and uniform approach. With therelease of the Morningstar Quantitative Rating for Funds in the U.S., we have used machine-learning techniques to extend thequalitative Analyst Rating to thousands of funds that our analysts don’t cover. In addition, our analysts contribute to research anddata innovations that we surface in the products and services we offer and oversee other ratings systems and tools that we offerto help investors make more-informed decisions when selecting securities, constructing portfolios, or measuring risk.
As of December 31, 2017, we had about 120 manager research analysts, including teams in North America, Europe, Australia, andAsia.
� Equity research
Our analysts follow a rigorous methodology that emphasizes a bottom-up, long-term, fundamentals-based valuation approach. Webelieve that our deep industry knowledge and Economic MoatTM Ratings, which identify sustainable competitive advantages,differentiate our equity research and help investors achieve better investment outcomes.
As of December 31, 2017, we had about 100 equity analysts globally, making us one of the largest providers of independent equityresearch.
� Credit ratings
Morningstar Credit Ratings, LLC, our credit ratings subsidiary, is a Nationally Recognized Statistical Rating Organization (NRSRO)that is focused on structured finance and credit ratings for corporate issuers and financial institutions. We bring transparency,unique perspectives, and superior client service to investors across the fixed-income markets.
As of December 31, 2017, we had about 100 credit analysts globally.
� Portfolio advice methodologies (including our research on Gamma and the Total Wealth Approach)
Over the past several years, we’ve developed new research tools that provide a more holistic approach to investing and assetallocation. Whereas traditional asset allocation methodologies focus solely on financial assets (such as stocks and bonds), we’ve
24
Strategy and Key Objectives
1. Produce the most effective investment data, research, and ratings to help investors reach their financial goals.

25
developed methodologies that provide a more complete view of all sources of wealth, including financial capital, human capital,housing assets, and retirement and pension benefits.
In 2017, we continued to develop the next-generation version of Morningstar Direct, our institutional investment researchplatform.
The new software is designed to be more intuitive, elegant, and easy-to-use. It provides a more consistent, cohesive experiencewith a strong emphasis on Morningstar’s proprietary research and tools. We also improved the underlying technology, including amore streamlined development process for commonly used Morningstar capabilities such as portfolio management tools.
The new software is fully web-based, which eliminates the need for desktop software installations and allows immediate accessto new features. It allows to us innovate more rapidly and more easily configure our software solutions to meet client needs. Italso addresses the growing need for mobile-optimized capabilities to extend the desktop experience onto mobile devices.
Over the past several years, we’ve started migrating many of our core software capabilities to Morningstar Direct, which willserve as our main platform for clients seeking information to support the investment decisions they make on their own or tovalidate investment recommendations from another party. We’re also continuing to expand the user base for Morningstar Directby enhancing capabilities for our existing asset management clients and adding workflows for new types of clients, such asfinancial advisors.
The PitchBook Platform is an all-in-one web-based research and analysis workstation centered on the private capital markets,including venture capital, private equity, and mergers and acquisitions. The PitchBook Platform also offers a mobile application,Excel plug-in, Chrome extension and optional CRM integrations, all designed to help users source deals, raise funds, build buyerlists, create benchmarks, network, and more.
In 2017, we introduced several high-impact data and technology enhancements. Morningstar’s in-depth public companyfundamental data and institutional equity research were integrated into the platform, which when combined with PitchBook’sbest-in-class private market data, offers seamless access to cross-market insights, allowing institutional investors to bettercapitalize on opportunities in both public and private markets. We also doubled our private European company coverage.
In 2017, PitchBook also launched a new interface and user experience, creating a more scalable product and helping users quicklyuncover trends and opportunities. For example, the new Chrome extension allows users to instantly view hard-to-find companydata while browsing other web content, thereby creating efficiency and value for users in their research.
We leverage our innovative, proprietary research by building world-class investment management solutions that help investorsachieve better outcomes. Leveraging our existing capabilities, we create holistic solutions that help financial advisors, assetmanagers, and individual investors with portfolio construction, monitoring, security selection, and implementation.
Our investment management solutions include Morningstar Managed Portfolios, which had $39.8 billion in assets undermanagement and advisement as of December 31, 2017, and Workplace Solutions (formerly Retirement Solutions), which had atotal of $128.1 billion in assets under management and advisement.
Morningstar, Inc. 2017 Annual Report 25
2. Develop Morningstar Direct and PitchBook as our key decision support platforms.
3. Build world-class investment management solutions based on our proprietary research.

8MAR201808292027
26
2017 10-K: Part I
We also expect to expand the investment management solutions we offer through our index business. We currently offer morethan 580 investment indexes that can be used for both benchmarking and product creation.
Morningstar’s Key Objectives and Major Customer Groups
Develop Morningstar Directand PitchBook as our key
decision support platforms
Produce the most effective investment
data, research, and ratings
Build world-class investment management
solutions based on our proprietary research
.....
IndividualInvestor
AssetManagement
Workplace/Retirement
Advisor InstitutionalInvestor
Given the core capabilities discussed above, we’re focusing on five primary customer groups:
� Advisor (including independent financial advisors as well as those affiliated with broker-dealers or other intermediaries);� Asset management (including fund companies, insurance companies, and other companies that build and manage portfolios of
securities for their clients);� Workplace/retirement (including retirement plan providers and plan sponsors);� Individual investor; and� Institutional investor.
Financial advisors work with individual investors to help them reach their financial goals. This customer group includesindependent advisors at registered investment advisor (RIA) firms, advisors affiliated with independent broker-dealers, duallyregistered advisors, and ‘‘captive’’ advisors who are employees of a broker-dealer. Such broker-dealers include wirehouses,regional broker-dealers, and banks. The advisor landscape is broad in both the United States, and in other parts of the worldwhere we focus. The U.S. is our largest market, and in total, Cerulli Associates estimates there were approximately 313,000financial advisors in the U.S. as of the end of 2017.
We believe our deep understanding of individual investors’ needs allows us to work with advisors to help them make moreefficient use of their time and deliver better investment outcomes for their clients. Our advisor solutions also draw onMorningstar’s proprietary investment research methodologies and research insights.
We sell our advisor-related solutions both directly to independent financial advisors and through enterprise licenses, which allowfinancial advisors associated with the licensing firm to use our products.
26
Major Customer Groups
Advisor

27
We’re expanding the range of services we offer to help financial advisors with all aspects of their daily workflow needs, includinginvestment decision-making, portfolio construction, client monitoring and reporting, practice management, portfolio rebalancingthat connects with custodial and trading interfaces, and financial planning. Because advisors are increasingly outsourcinginvestment management, we’re continuing to enhance Morningstar Managed Portfolios to help advisors save time and reducecompliance risk.
Our main products for financial advisors are Morningstar Advisor Workstation (including Morningstar Office) and MorningstarManaged Portfolios.
Asset management firms manage and distribute investment portfolios. We estimate that there are more than 3,000 assetmanagement firms globally, ranging from large, global firms to firms with small fund lineups and operations in a single market orregion. The asset management customer group includes individuals involved in sales, marketing, product development, anddistribution, as well as investment management (often referred to as the ‘‘buy side’’), which includes portfolio management andresearch.
Our asset management offerings help companies connect with their clients because of Morningstar’s strong brand presence withboth financial advisors and individual investors. We offer a global reach and have earned investors’ trust in our unbiasedapproach, investor-centric mission, and thought leadership.
The key products we offer for asset management firms include Morningstar Direct, Morningstar Data, and Morningstar Indexes.For the buy side, key products include Morningstar Research, Morningstar Credit Ratings, Morningstar Data, and MorningstarDirect.
In the U.S. workplace (also known as retirement) market, millions of investors are now charged with planning for their ownretirement, mainly through self-directed retirement plans such as 401(k) plans in the United States. Assets in 401(k) plans totaledan estimated $5.6 trillion as of December 31, 2017, based on data from Cerulli Associates. In the wake of the financial crisis of2008 and 2009, we believe individual investors, financial advisors, employers, and government organizations have all becomemore aware of the need for advice and guidance that helps individuals build assets for retirement and beyond.
Our retirement offerings help retirement plan participants of all ages plan and invest for retirement. We offer these services boththrough retirement plan providers (typically third-party asset management companies that provide administrative and record-keeping services) and directly to plan sponsors (employers that offer retirement plans to their employees).
Our main product offerings for the workplace/retirement customer group include retirement advice and managed accounts,fiduciary services, and custom models.
We offer products for individual investors who invest to build wealth and save for other goals, such as retirement or collegetuition. A Gallup survey released in April 2017 found that approximately 54% of individuals in the United States invest in the stockmarket either directly or through mutual funds or self-directed retirement plans.
Morningstar, Inc. 2017 Annual Report 27
Asset management
Workplace/retirement
Individual investor

28
2017 10-K: Part I
We design most of our products for individual investors who are actively involved in the investing process and want to take chargeof their own investment decisions. We also reach individuals who want to learn more about investing or want to validate theadvice they receive from brokers or financial advisors.
Our main product for individual investors is Morningstar.com, which includes both paid Premium Memberships and free contentavailable to registered users and visitors. We also reach individual investors through investment newsletters, iPad and mobileapplications, and through licensing our content to other websites, such as Yahoo Finance, MSN Money, and Google Finance.
Through PitchBook Data, Inc. (PitchBook), which we acquired in December 2016, we reach approximately 2,700 investment andresearch firms and their service providers, including venture capital and private equity firms, corporate development teams,investment banks, limited partners, lenders, law firms, and accounting firms. These clients use PitchBook’s platform to accessdata, discover new connections, and conduct research on potential investment opportunities.
PitchBook covers the full lifecycle of venture capital, private equity, and mergers and acquisitions (M&A), including the limitedpartners, investment funds, and service providers involved. Our main product for this customer group is the PitchBook Platform, anall-in-one research and analysis workstation for sophisticated investment and business professionals.
Since our founding in 1984, we’ve supported our organic growth by introducing new products and services and expanding ourexisting offerings. From 2006 through 2017, we also completed 30 acquisitions to support our growth objectives. In July 2017, weacquired a minority stake in Sustainalytics Holding B.V., an independent ESG and corporate governance research, ratings, andanalysis firm supporting investors around the world with the development and implementation of responsible investmentstrategies. In June 2017, we sold HelloWallet.
For more information about our acquisitions, refer to Note 7 of the Notes to our Consolidated Financial Statements. For moreinformation about our investments in unconsolidated entities, refer to Note 9 of the Notes to our Consolidated FinancialStatements. For more information about our divestiture, refer to Note 8 of the Notes to our Consolidated Financial Statements.
The section below describes some of our major products and services (ranked in order of size based on each product’s 2017revenue).
Morningstar Data gives institutions access to a full range of investment data spanning numerous investment databases, includingreal-time pricing and market data. We offer licenses and data feeds for our proprietary statistics, such as the Morningstar StyleBox and Morningstar Rating, and a wide range of other data, including information on investment performance, risk, portfolios,operations data, fees and expenses, cash flows, and ownership. Institutions can use Morningstar Data in a variety of investorcommunications, including websites, print publications, and marketing fact sheets, as well as for internal research and productdevelopment.
We also offer Morningstar Data for equities, including financial statement data, consolidated industry statistics, stock ownershipinformation, and proprietary Morningstar statistics.
28
Institutional investor
Acquisitions and Divestitures
Major Products and Services
Morningstar Data

29
In 2017, we added several new sets of data to our suite of offerings, including the expansion of our equity data, which added over1,000 new data elements. We also advanced our fixed income capabilities, expanding portfolio level data and new analytics forfunds. We’ve continued developing our data delivery platforms, including application programming interfaces (APIs), which allowfor faster and more flexible client access to large groups of data files. We’ve expanded the number of data sets that are availablethrough APIs and expanded the scope of data provided at the request of our clients.
Pricing for Morningstar Data is based on the number of investment vehicles covered, the amount of information provided for eachsecurity, the frequency of updates, the method of delivery, the size of the licensing firm, and the level of distribution.
Our main competitors for Morningstar Data include Activ Financial, Bloomberg, FactSet, Financial Express, Interactive Data, S&PGlobal, Thomson Reuters, and Xignite.
Morningstar Data is our largest product based on revenue and accounted for 17.9%, 19.0%, and 18.3% of our consolidatedrevenue in 2017, 2016, and 2015, respectively.
Morningstar Direct is an institutional investment research platform that includes data and advanced analytical tools on thecomplete range of securities in Morningstar’s global database, as well as privately held investments and data from third-partyproviders. It helps portfolio managers, investment consultants, financial product managers, wealth managers, and otherprofessionals develop, select, and monitor investments. Users can create advanced performance comparisons and in-depthanalyses of an investment’s underlying investment style, as well as custom-branded reports and presentations.
In 2017, we further developed Morningstar Direct Cloud (the next-generation version of Morningstar Direct). These ongoingdevelopment efforts include rebuilding the platform to make it purely web-based and retooling existing capabilities to supportusers’ daily workflow needs.
We also enhanced the data and research capabilities offered in Morningstar Direct during the year. For example, we expanded theMorningstar Sustainability Rating for funds, which helps investors evaluate mutual funds and ETFs based on how well thecompanies held in their portfolios are managing their environmental, social, and governance (ESG) risks and opportunities. Wealso introduced a new Global Risk Model into Direct Cloud, which helps investors understand and visualize the underlying factorsthat can drive the risk of a stock or portfolio and run scenario analysis to analyze returns.
Morningstar Direct’s primary competitors are Bloomberg, eVestment Alliance, FactSet Research Systems, Thomson Reuters, andZephyr Associates.
Morningstar Direct had approximately 13,900 licensed users worldwide as of December 31, 2017.
Pricing for Morningstar Direct is based on the number of licenses purchased. For clients in the United States, we generally chargean annual fee of $18,000 for the first user, $11,500 for the second user, and $9,800 for each additional user.
Morningstar Direct is our second-largest product based on revenue and accounted for 13.6%, 13.8%, and 12.9% of ourconsolidated revenue in 2017, 2016, and 2015, respectively.
Morningstar, Inc. 2017 Annual Report 29
Morningstar Direct

15MAR201805161869
30
2017 10-K: Part I
Morningstar Direct Licenses
U.S.
Non-U.S.
11,42812,492
8,514
2015
13,884
2016 201720142013
10,055
4,830
3,684
5,782
4,273
6,527
4,901
6,972
5,520
7,678
6,206
This product line includes several different offerings, including Morningstar Managed Portfolios, as well as services forinstitutional asset management, asset allocation, and manager selection.
Morningstar Managed Portfolios are widely available as strategist models on third-party managed account platforms and througha fee-based discretionary asset management service also known as a turn-key asset management program (TAMP). In the UnitedStates, we offer this service through Morningstar Investment Services LLC, a registered investment advisor, registered broker/dealer, member of the Financial Industry Regulatory Authority, Inc. (FINRA), and wholly owned subsidiary of Morningstar, Inc. Ourportfolios are built using mutual funds, ETFs, and equities and tailored to meet specific investment time horizons, risk levels, andoutcomes. We offer Morningstar Managed Portfolios mainly through fee-based independent financial advisors. These advisors areoften affiliated with independent or insurance-related broker-dealers. Morningstar Managed Portfolios are also available inAustralia, South Africa, and the United Kingdom.
We also provide other institutional asset management services for asset management firms, broker-dealers, and insuranceproviders, which we offer through a variety of registered entities in Australia, Canada, Dubai, France, Hong Kong, India, Japan,South Africa, the United Kingdom, and the United States. All of these entities are wholly owned or majority-owned subsidiaries ofMorningstar, Inc., and are authorized to provide investment advisory services by the appropriate regulatory agency in theirapplicable jurisdictions.
These services include institutional asset management, asset allocation, and manager selection services, which are investmentrecommendations delivered as select lists, based on a process that draws on our rated universe and manager selectionmethodology.
In 2017, we continued migrating functionality to the new Morningstar Managed Portfolios website from our legacy platform. Wealso launched a new portfolio series, U.S. Real Return, as part of our outcome-based lineup. These diversified, multi-assetportfolios align their valuation-driven and best-ideas investment approach with the investors’ financial planning needs and goals.
30
Morningstar Investment Management

31
We charge asset-based fees for Morningstar Managed Portfolios, which are typically based on the type of service (i.e., TAMP vs.strategist models) and the products contained within the portfolios. Fees for our mutual fund and ETF portfolios generally rangefrom 20 to 40 basis points. We charge 40 to 55 basis points for Equity Portfolios, which are customizable stock portfolios based onMorningstar’s proprietary equity research. We use third-party custodians for Morningstar Managed Portfolios and do not hold theassets in custody.
We base pricing for our other investment management services on the scope of work, our degree of investment discretion, and thelevel of service required. In the majority of our contracts, we receive asset-based fees, reflecting our work as a portfolioconstruction manager or subadvisor for multimanager portfolios.
For Morningstar Managed Portfolios offered through our TAMP, our primary competitors are AssetMark, Brinker Capital, and SEIInvestments. Our primary strategist offering competitors are Blackrock, Vanguard, Envestnet PMC and Russell. We also competewith in-house research teams at independent broker-dealers who build proprietary portfolios for use on brokerage firm platforms,as well other registered investment advisors that provide investment strategies or models on these platforms. In our otherinvestment management services, we compete with consulting firms such as Mercer, Callan, and Wilshire Associates, as well asvarious in-house providers of investment management services.
Morningstar Investment Management is our third-largest product based on revenue and made up 11.6%, 12.3%, and 12.5% of ourconsolidated revenue in 2017, 2016, and 2015, respectively.
Morningstar Advisor Workstation, a web-based investment planning system, provides financial advisors with a comprehensive setof tools for conducting their core business-including investment research, planning, and presentations. It allows advisors to buildand maintain a client portfolio database that can be fully integrated with the firm’s back-office technology and resources.Moreover, it helps advisors create customized reports for client portfolios that combine different types of investments.
Morningstar Advisor Workstation is available in two versions: Morningstar Office for independent financial advisors and anenterprise version for financial advisors affiliated with larger firms. As of December 31, 2017, approximately 4,300 financialadvisors in the United States were licensed to use Morningstar Office, and approximately 180 companies held licenses for theenterprise version of Morningstar Advisor Workstation.
In 2017, we continued to enhance integrations with several leading third-party platforms to help advisors with all aspects of theirdaily workflows. We advanced Morningstar Office CloudSM, our cloud-based practice and portfolio management platform foradvisors. We also launched our Best Interest Scorecard, a solution designed to help advisors act as fiduciaries for their clients.
Pricing for Morningstar Advisor Workstation varies based on the number of users, as well as the number of databases licensedand level of functionality. We typically charge annual fees of about $3,500 per licensed user for a base configuration ofMorningstar Advisor Workstation, but pricing varies significantly based on the scope of the license. We generally charge $8,000per firm, on average, for an annual license for Morningstar Office. This average includes a mix of ‘‘per account’’ and ‘‘per seat’’pricing for access. With the release of our cloud-based platform, we will be more focused on pricing on an account basis versuspricing per user.
Competitors for Morningstar Advisor Workstation and Morningstar Office include Black Diamond, Envestnet, Orion AdvisorServices, S&P Global, and Thomson Reuters.
Morningstar, Inc. 2017 Annual Report 31
Morningstar Advisor Workstation

8MAR201806503769
32
2017 10-K: Part I
Morningstar Advisor Workstation is our fourth-largest product based on revenue and made up 9.6%, 10.3%, and 10.3% of ourconsolidated revenue in 2017, 2016, and 2015, respectively.
Morningstar Advisor Workstation Clients/Licenses (U.S.)
4,2864,073 4,268
MorningstarOffice Licenses
MorningstarAdvisor WorkstationClients
4,342
2013
175
4,330
182162
2014 2015
181
2016 2017
189
This product line includes several different offerings, including retirement advice and managed accounts, fiduciary services andcustom models.
Our advice and managed accounts program, delivered primarily through Morningstar Retirement Manager, helps retirement planparticipants with their retirement goals. As part of this service, we deliver personalized recommendations for a target savingsgoal, a recommended contribution rate to help achieve that goal, a portfolio mix based on risk tolerance, and specific investmentrecommendations. Participants can build their own portfolios based on our recommendations or elect to have their accountsmanaged by us through our managed retirement account offering. We also offer Advisor Managed Accounts, a program thatallows financial advisors to specify the portfolios that are used in an employer’s managed account offering. We do not hold assetsin custody for the managed retirement accounts we provide.
In our fiduciary services offering, we work with retirement plan providers and sponsors to help them meet their fiduciaryobligations by selecting and monitoring a broad range of diversified plan options. With our custom models, we work withretirement plan providers to design solutions for their investment lineups, including target maturity models and risk-based models.
We also serve as a non-discretionary subadvisor and index provider for the Morningstar Lifetime Allocation Funds, a series oftarget-date collective investment trust funds (CITs) offered by UBS Asset Management to retirement plan sponsors. Retirementplan sponsors can select a conservative, moderate, or growth version of the funds based on the needs of participants in the plan.
32
Workplace Solutions

15MAR201805162181
33
In 2017, we further redesigned the user interface of Retirement Manager and transitioned many of our provider clients to the newversion.
Pricing for Workplace Solutions depends on several different factors, including the level of services offered (including whether theservices involve acting as a fiduciary under the Employee Retirement Income Security Act, or ERISA), the number of participants,the level of systems integration required, and the availability of competing products.
Our main competitors for Workplace Solutions are Financial Engines and Guided Choice as well as companies that provideautomated investment advice, such as Betterment and Wealthfront. For the Lifetime Allocation Funds, we compete with otherproviders of target-date funds, such as Vanguard, Fidelity, and T. Rowe Price.
Workplace Solutions is our fifth-largest product based on revenue and made up 8.1% of revenue in 2017, compared with 8.9% in2016 and 8.4% in 2015.
Workplace Solutions Assets under Management/Advisement ($bil)
Managed retirement accounts
Custom models
Fiduciary services
104.4
89.7
65.6
46.9
23.2
34.3
128.1
57.6
28.0
42.5
40.3
18.7
30.7
36.8
13.3
26.7
31.7
11.0
22.9
76.8
2015 2016 201720142013
PitchBook Data, Inc., which Morningstar acquired in December 2016, provides data, research, and technology covering the privatecapital markets, including venture capital, private equity, and M&A. PitchBook’s main product is the PitchBook Platform, anall-in-one research and analysis workstation for sophisticated investment and research professionals. Close to 14,000professionals use this software to source deals, raise funds, build buyer lists, create benchmarks, network, and more. Toaccommodate their diverse needs, the platform offers advanced search functionality, a fully customizable dashboard and emailalerts that help users discover and monitor relevant information.
PitchBook also offers a mobile application, Excel plug-in, data feeds, and flexible, a la carte data solutions that allow clients toaccess a variety of data points on demand.
Morningstar, Inc. 2017 Annual Report 33
PitchBook Data

34
2017 10-K: Part I
In 2017, we integrated Morningstar’s in-depth fundamental data and equity research into PitchBook and we now providecomprehensive data coverage and information for publicly traded companies worldwide. PitchBook also significantly expanded itsEuropean data sets, doubling private European company coverage to over 340,000 companies. We also launched a new interfacefor the platform, creating a more scalable and intuitive product to enhance the user experience.
PitchBook’s main competitors are CB Insights, Dow Jones VentureSource, Prequin, S&P Capital IQ, and Thomson Reuters.
Pricing for the PitchBook Platform is based on the number of seats, with the standard base license generally priced at $32,500 forthe first five seats, and pricing for additional seats generally priced at $6,500 per user, with customized prices for largeenterprises, boutiques, and startup firms.
PitchBook is our sixth-largest product based on revenue and made up 7% of revenue in 2017, compared with 0.5% in 2016.Because the PitchBook acquisition closed in December, PitchBook contributed approximately one month of revenue in 2016.
Our largest website, Morningstar.com, helps individual investors discover, evaluate, and monitor stocks and funds; build andmonitor portfolios; and monitor the markets. Revenue is generated from paid memberships through Morningstar Premium andInternet advertising sales, which respectively made up approximately 53% and 47% of Morningstar.com’s total revenue in 2017.
Our Morningstar Premium offering is focused on bringing clarity and confidence to investment decisions. Members have access toproprietary Morningstar research, ratings, data and tools, including analyst reports, portfolio management tools (such as PortfolioX-Ray), and premium stock and fund screeners.
We currently offer Premium Membership services in Australia, Canada, Italy, the United Kingdom, and the United States.
In 2017, we continued to build out and optimize our redesigned site. The site features a new user interface focused on helpingindividual investors select and monitor investments. We plan to complete the rollout of the new site during 2018, including a newfund report page and new portfolio and screener experiences.
Morningstar.com primarily competes with The Motley Fool, Seeking Alpha, TheStreet.com, and Yahoo! Finance, as well as otherfinance and brokerage sites.
As of December 31, 2017, Morningstar.com had about 11.9 million registered free members worldwide. We also hadapproximately 118,000 paid Premium members in the United States plus an additional 11,000 Premium members across otherglobal markets. We currently charge $23.95 for a monthly subscription, $199 for an annual subscription, $339 for a two-yearsubscription, and $439 for a three-year subscription for Morningstar.com’s Premium Membership service.
34
Morningstar.com

8MAR201806504398
35
Morningstar.com Premium Memberships (U.S.)
124,027
2013
123,274 118,339
2014 2016
118,462
2017
120,557
2015
Morningstar Enterprise Components is a set of tools and capabilities that help institutional clients build customized websites orenhance their existing solutions. We offer a series of API components, editorial content, and reports that investment firms canlicense to build or enhance their websites for financial advisors and individual investors. We also offer licenses for investmentresearch, editorial content, and portfolio analysis and comparison tools that allow users to drill down into the underlying datawhen researching a potential investment.
In 2017, we continued to roll out the new Morningstar Developer platform, now known as Morningstar as a Service, whichprovides clients with direct access to our tools, components, data, calculation engines, and APIs. The site empowers clients bygiving them the flexibility to develop their own solutions using Morningstar components.
For Enterprise Components, our primary competitors include Factset, Financial Express, Interactive Data Corporation, Markit onDemand, and Thomson Reuters.
Pricing for Enterprise Components consists of both ongoing license fees and one-time development fees and depends on thesolution being offered, the number of users and level of distribution, and the amount of client integration involved.
We offer Morningstar Research, including Equity Research and Manager Research, through Morningstar Research Services LLCand a variety of other subsidiaries outside the United States. We offer Equity Research to institutional investors who use it tosupplement their own research, as well as to broker-dealers who provide our research to their affiliated financial advisors orindividual investor clients. Our Manager Research services help institutional investors and manager research due diligence teamsevaluate funds, investment strategies, and asset management firms.
During 2017, we continued to evolve our manager research solutions, which help wealth management firms evaluate managedinvestments and perform due diligence on the products they offer to clients. We also progressed our Morningstar QuantitativeRating, a forward-looking rating assigned by a model that is designed to estimate what the Morningstar Analyst Rating would beon managed products not covered by our manager research analysts.
Morningstar, Inc. 2017 Annual Report 35
Morningstar Enterprise Components
Morningstar Research

36
2017 10-K: Part I
Our Equity Research services compete with CFRA Research (formerly S&P Capital IQ Equity Research) and Zack’s InvestmentResearch, as well as sell-side firms, internal providers, and smaller boutique firms. Our Manager Research services mainlycompete with Mercer, Willis Towers Watson, and Wilshire Associates.
Pricing for Morningstar Research varies based on the level of distribution, the type of investors who are using our research, thenumber of securities or investment strategies covered, the amount of custom coverage and client support required, and the lengthof the contract term.
Morningstar Credit Ratings, LLC is an NRSRO that provides timely new issue and surveillance ratings and analysis for structuredcredits, as well as operational risk assessment services. We provide ratings on a broad range of structured finance securities,including commercial mortgage-backed securities, residential mortgage-backed securities, single-family rental securities, andasset-backed securities. We also provide ratings for corporate issuers and financial institutions.
In 2017, we expanded our research and ratings, most notably in asset-backed securities, which had a positive impact on financialperformance.
Our business competes with several other firms, including DBRS, Fitch, Kroll Bond Ratings, Moody’s, and S&P Global Ratings.
We charge annual fees for our subscription-based CMBS surveillance software and data services, which are paid for by the user.Pricing for these services varies depending on the solution and the level of access within a client organization. For new-issueratings, we charge one-time fees to the issuer based on the type of security, the size of the transaction, and the complexity of theissue. In addition to the initial rating fee, clients pay annual surveillance fees that continue until the securities mature.
We offer an extensive set of investment indexes that can be used to benchmark the market and create investment products,including indexes that track the global equity markets, sector, and investment style; strategic beta indexes; dividend indexes;active equity indexes based on Morningstar’s equity research; bond indexes; commodity indexes; hedge fund indexes; assetallocation indexes; and a family of sustainability indexes.
In 2017, we globalized our strategic beta indexes, which included a family of dividend-based indexes and moat-focused indexesthat draw upon our proprietary research. We also further developed our Global Sustainability Indexes, which incorporateenvironmental, social and governance factors into the investment process.
We expanded the Morningstar Open Indexes Project, offering asset managers and other firms the ability to benchmark theirinvestments against more than 100 Morningstar global equity indexes for free. The goal of the project is to lower benchmarkingcosts for the industry and improve outcomes for investors in response to the escalating cost of market-cap-weighted equityindexes. Participants receive price return, total return, net return, and month-end constituent data for indexes included in theproject.
We currently license Morningstar Indexes to numerous institutions that offer ETFs and exchange-traded notes based on theindexes. Firms license Morningstar Indexes for both product creation (where we typically receive the greater of a minimum fee orbasis points tied to assets under management) and data licensing (where we typically receive annual licensing fees). In bothcases, our pricing varies based on the level of distribution, the type of user, and the specific indexes licensed.
36
Morningstar Credit Ratings
Morningstar Indexes

37
Major competitors for Morningstar Indexes include FTSE Russell, MSCI, and S&P Dow Jones Indices (offered through S&P Global).
We conduct our business operations outside of the United States through wholly owned or majority-owned operating subsidiariesbased in each of the following 26 countries: Australia, Brazil, Canada, Chile, Denmark, France, Germany, India, Italy, Japan,Luxembourg, Mexico, the Netherlands, New Zealand, Norway, People’s Republic of China (both Hong Kong and the mainland),Singapore, South Africa, South Korea, Spain, Sweden, Switzerland, Taiwan, Thailand, United Arab Emirates, and the UnitedKingdom. See Note 5 of the Notes to our Consolidated Financial Statements for additional information concerning revenue fromcustomers and long-lived assets from our business operations outside the United States.
We treat our brand name and logo, product names, databases and related content, software, technology, know-how, and the likeas proprietary. We seek to protect this intellectual property by using: (i) trademark, copyright, patent and trade secrets laws;(ii) licensing and nondisclosure agreements; and (iii) other security and related technical measures designed to restrictunauthorized access and use. For example, we generally provide our intellectual property to third parties through the use ofstandard licensing agreements, which define the extent and duration of any third-party usage rights and provide for our continuedownership in any intellectual property furnished.
Because of the value of our brand name and logo, we generally seek to register one or both of them as trademarks in all relevantinternational classes in any jurisdiction in which we have business offices or significant operations. We have registered theMorningstar name and/or logo in approximately 50 jurisdictions, including the European Union, and currently have registrationspending in several others. In some jurisdictions, we may also choose to register one or more product names.
‘‘Morningstar’’ and the Morningstar logo are both registered marks of Morningstar in the United States. The table below includessome of the trademarks and service marks referenced in this report:
Morningstar� Advisor WorkstationSM Morningstar� Portfolio X-Ray�. . . . . . . . . . . . . . . . . . . . . . . . . . . . . . . . . . . . . . . . . . . . . . . . . . . . . . . . . . . . . . . . . . . . . . . . . . . . . . . . . . . . . . . . . . . . . . . . . . . . . . . . . . . . . . . . . . . . . . . . . . . . . . . . . . . . . . . . . . . . . . . . . . . . . . . . . . . . . . . . . . . . . . .
Morningstar Analyst RatingTM Morningstar RatingTM
. . . . . . . . . . . . . . . . . . . . . . . . . . . . . . . . . . . . . . . . . . . . . . . . . . . . . . . . . . . . . . . . . . . . . . . . . . . . . . . . . . . . . . . . . . . . . . . . . . . . . . . . . . . . . . . . . . . . . . . . . . . . . . . . . . . . . . . . . . . . . . . . . . . . . . . . . . . . . . . . . . . . . . .
Morningstar� ByAllAccounts� Morningstar� Retirement ManagerSM
. . . . . . . . . . . . . . . . . . . . . . . . . . . . . . . . . . . . . . . . . . . . . . . . . . . . . . . . . . . . . . . . . . . . . . . . . . . . . . . . . . . . . . . . . . . . . . . . . . . . . . . . . . . . . . . . . . . . . . . . . . . . . . . . . . . . . . . . . . . . . . . . . . . . . . . . . . . . . . . . . . . . . . .
Morningstar� Data Morningstar� Stewardship GradeSM
. . . . . . . . . . . . . . . . . . . . . . . . . . . . . . . . . . . . . . . . . . . . . . . . . . . . . . . . . . . . . . . . . . . . . . . . . . . . . . . . . . . . . . . . . . . . . . . . . . . . . . . . . . . . . . . . . . . . . . . . . . . . . . . . . . . . . . . . . . . . . . . . . . . . . . . . . . . . . . . . . . . . . . .
Morningstar DirectSM Morningstar Style BoxTM
. . . . . . . . . . . . . . . . . . . . . . . . . . . . . . . . . . . . . . . . . . . . . . . . . . . . . . . . . . . . . . . . . . . . . . . . . . . . . . . . . . . . . . . . . . . . . . . . . . . . . . . . . . . . . . . . . . . . . . . . . . . . . . . . . . . . . . . . . . . . . . . . . . . . . . . . . . . . . . . . . . . . . . .
Morningstar� Enterprise ComponentsSM Morningstar Sustainability RatingTM
. . . . . . . . . . . . . . . . . . . . . . . . . . . . . . . . . . . . . . . . . . . . . . . . . . . . . . . . . . . . . . . . . . . . . . . . . . . . . . . . . . . . . . . . . . . . . . . . . . . . . . . . . . . . . . . . . . . . . . . . . . . . . . . . . . . . . . . . . . . . . . . . . . . . . . . . . . . . . . . . . . . . . . .
Morningstar� Managed PortfoliosSM Morningstar.com�. . . . . . . . . . . . . . . . . . . . . . . . . . . . . . . . . . . . . . . . . . . . . . . . . . . . . . . . . . . . . . . . . . . . . . . . . . . . . . . . . . . . . . . . . . . . . . . . . . . . . . . . . . . . . . . . . . . . . . . . . . . . . . . . . . . . . . . . . . . . . . . . . . . . . . . . . . . . . . . . . . . . . . .
Morningstar Market BarometerSM PitchBook�. . . . . . . . . . . . . . . . . . . . . . . . . . . . . . . . . . . . . . . . . . . . . . . . . . . . . . . . . . . . . . . . . . . . . . . . . . . . . . . . . . . . . . . . . . . . . . . . . . . . . . . . . . . . . . . . . . . . . . . . . . . . . . . . . . . . . . . . . . . . . . . . . . . . . . . . . . . . . . . . . . . . . . .
Morningstar OfficeSM. . . . . . . . . . . . . . . . . . . . . . . . . . . . . . . . . . . . . . . . . . . . . . . . . . . . . . . . . . . . . . . . . . . . . . . . . . . . . . . . . . . . . . . . . . . . . . . . . . . . . . . . . . . . . . . . . . . . . . . . . . . . . . . . . . . . . . . . . . . . . . . . . . . . . . . . . . . . . . . . . . . . . . .
In addition to trademark registrations, we currently hold several patents in the United States, including a recently issued patent fora coordinate-based document processing system and several patents held by our wholly owned subsidiary, MorningstarInvestment Management LLC, for lifetime asset allocation and asset allocation with annuities.
Morningstar, Inc. 2017 Annual Report 37
International Operations
Intellectual Property and Other Proprietary Rights

38
2017 10-K: Part I
We license our products and related intellectual property to our customers, generally for a fee. As a rule, we use our standardagreement forms and we do not provide our products and services to customers or other users without having an agreement inplace.
We maintain licensing agreements with most of our larger Morningstar operating companies around the world to allow them toaccess and use our intellectual property, including, without limitation, our products, trademarks, databases and content,technology, and know-how. We put these agreements in place to allow our operating companies to both market standardMorningstar products and services in their operating territories and to develop and sell territory-specific variants of those productsunder the Morningstar name in their specific territories.
In the ordinary course of our business, we obtain and use intellectual property from a wide variety of sources, including licensing itfrom third-party providers, developing it internally, and gathering it through publicly available sources (e.g., regulatory filings).
We believe our business has a minimal amount of seasonality. Some of our smaller products, such as our annual investmentconference in Chicago, generate the majority of their revenue in the first or second quarter of the year. We sell most of ourproducts with subscription or license terms of at least one year, though, and we recognize revenue ratably over the term of eachsubscription or license agreement. This tends to offset most of the seasonality in our business.
We believe market movements generally have more influence on our performance than seasonality. The revenue we earn fromasset-based fees depends on the value of assets on which we provide advisory services, and the size of our asset base canincrease or decrease along with trends in market performance.
In 2017, our largest customer accounted for less than 2% of our consolidated revenue.
The economic and financial information industry includes a few large firms as well as numerous smaller companies, includingstartup firms. Some of our main competitors include Bloomberg, S&P Global, and Thomson Reuters. These companies havefinancial resources that are significantly greater than ours. We also compete with a variety of other companies in specific areas ofour business. We discuss some of the key competitors in each area in the Major Products and Services section of this report.
We believe the most important competitive factors in our industry are brand and reputation, data accuracy and quality, technology,breadth of data coverage, quality of investment research and analytics, design, product reliability, and value of the products andservices provided.
A key aspect of our growth strategy is to expand our investment research capabilities and enhance our existing products andservices. We strive to adopt new technology that can improve our products and services. As a general practice, we manage ourown websites and build our own software rather than relying on outside vendors. This allows us to control our technologydevelopment and better manage costs, enabling us to respond quickly to market changes and to meet customer needs efficiently.As of December 31, 2017, our technology team consisted of approximately 1,310 programmers and technology and infrastructureprofessionals.
38
License Agreements
Seasonality
Largest Customer
Competitive Landscape
Research and Development
39
Investment advisory and broker-dealer businesses are subject to extensive regulation in the United States at both the federal andstate level, as well as by self-regulatory organizations. Financial services companies are among the nation’s most extensivelyregulated. The SEC is responsible for enforcing the federal securities laws and oversees federally registered investment advisorsand broker-dealers.
Three of our subsidiaries, Morningstar Investment Management LLC, Morningstar Investment Services LLC, and MorningstarResearch Services LLC, are registered as investment advisors with the SEC under the Investment Advisers Act of 1940 (AdvisersAct). As registered investment advisors, these companies are subject to the requirements and regulations of the Advisers Act.These requirements relate to, among other things, record-keeping, reporting, and standards of care, as well as general anti-fraudprohibitions. As registered investment advisors, these subsidiaries are subject to on-site examination by the SEC.
In addition, in cases where these subsidiaries provide investment advisory services to retirement plans and their participants, theymay be acting as fiduciaries under the Employee Retirement Income Security Act of 1974 (ERISA). As fiduciaries under ERISA, theyhave duties of loyalty and prudence, as well as duties to diversify investments and to follow plan documents to comply with theapplicable portions of ERISA.
Morningstar Investment Services is a broker-dealer registered under the Securities Exchange Act of 1934 (Exchange Act) and amember of FINRA. The regulation of broker-dealers has, to a large extent, been delegated by the federal securities laws toself-regulatory organizations, including FINRA. Subject to approval by the SEC, FINRA adopts rules that govern its members.FINRA and the SEC conduct periodic examinations of the brokerage operations of Morningstar Investment Services.
Broker-dealers are subject to regulations that cover all aspects of the securities business, including sales, capital structure,record-keeping, and the conduct of directors, officers, and employees. Violation of applicable regulations can result in therevocation of a broker-dealer license, the imposition of censures or fines, and the suspension or expulsion of a firm or its officersor employees. As a registered broker-dealer, Morningstar Investment Services is subject to certain net capital requirements underthe Exchange Act. These requirements are designed to regulate the financial soundness and liquidity of broker-dealers.
Morningstar Credit Ratings, LLC is registered with the SEC as a Nationally Recognized Statistical Rating Organization (NRSRO)specializing in rating structured finance investments, corporate credit issuers, and financial institutions. As an NRSRO,Morningstar Credit Ratings is subject to certain requirements and regulations under the Exchange Act. These requirements relateto, among other things, record-keeping, reporting, governance, and conflicts of interest. As part of its NRSRO registration,Morningstar Credit Ratings is subject to annual examination by the SEC.
Our subsidiaries that provide financial information services and advice in Australia, Morningstar Australasia Pty Limited andMorningstar Investment Management Australia Ltd., are registered under an Australian Financial Services license and are subjectto oversight by the Australian Securities and Investments Commission (ASIC). This license requires them to, among other things,maintain positive net asset levels and sufficient cash resources to cover three months of expenses and to comply with the auditrequirements of the ASIC.
Morningstar, Inc. 2017 Annual Report 39
Government Regulation
United States
Australia

40
2017 10-K: Part I
Morningstar Investment Management Europe Limited is authorized and regulated by the Financial Conduct Authority (FCA) toprovide advisory services in the United Kingdom. As an authorized firm, Morningstar Investment Management Europe Limited issubject to the requirements and regulations of the FCA. Such requirements relate to, among other things, financial reporting andother reporting obligations, record-keeping, and cross-border requirements.
In addition, our index business, as a non-European Union administrator of indexes, will be seeking recognition from the FCA underEU benchmark regulations that have recently become effective to administer indexes in the EU. Morningstar InvestmentManagement Europe Limited will act as our legal representative for this purpose in the EU. Compliance with these regulations willrequire us to, among other things, comply with the IOSCO Principles for Financial Benchmarks and related certificationrequirements.
We have a variety of other entities (including in Canada, France, Hong Kong, India, Japan, Korea, and South Africa) that areregistered with their respective regulatory bodies; however, the amount of business conducted by these entities related to theregistration is relatively small.
Additional legislation and regulations, including those relating to the activities of investment advisors and broker-dealers, changesin rules imposed by the SEC or other U.S. or non-U.S. regulatory authorities and self-regulatory organizations, or changes in theinterpretation or enforcement of existing laws and rules may adversely affect our business and profitability.
We had 4,920 employees globally as of December 31, 2017, including approximately 1,050 data analysts, 80 designers, 460investment analysts (including consulting and quantitative research analysts), 1,310 programmers and technology staff, and 530sales and marketing professionals. Our U.S.-based employees are not represented by any unions, and we have never experienceda walkout or strike.
40
United Kingdom
Other Regions
Employees

41
As of March 1, 2018, we had nine executive officers. The table below summarizes information about each of these officers.
Name Age Position
Joe Mansueto 61 Executive Chairman. . . . . . . . . . . . . . . . . . . . . . . . . . . . . . . . . . . . . . . . . . . . . . . . . . . . . . . . . . . . . . . . . . . . . . . . . . . . . . . . . . . . . . . . . . . . . . . . . . . . . . . . . . . . . . . . . . . . . . . . . . . . . . . . . . . . . . . . . . . . . . . . . . . . . . . . . . . . . . . . . . . . . . .
Kunal Kapoor 42 Chief Executive Officer. . . . . . . . . . . . . . . . . . . . . . . . . . . . . . . . . . . . . . . . . . . . . . . . . . . . . . . . . . . . . . . . . . . . . . . . . . . . . . . . . . . . . . . . . . . . . . . . . . . . . . . . . . . . . . . . . . . . . . . . . . . . . . . . . . . . . . . . . . . . . . . . . . . . . . . . . . . . . . . . . . . . . . .
Jason Dubinsky 44 Chief Financial Officer. . . . . . . . . . . . . . . . . . . . . . . . . . . . . . . . . . . . . . . . . . . . . . . . . . . . . . . . . . . . . . . . . . . . . . . . . . . . . . . . . . . . . . . . . . . . . . . . . . . . . . . . . . . . . . . . . . . . . . . . . . . . . . . . . . . . . . . . . . . . . . . . . . . . . . . . . . . . . . . . . . . . . . .
Bevin Desmond 51 Head of Talent and Culture. . . . . . . . . . . . . . . . . . . . . . . . . . . . . . . . . . . . . . . . . . . . . . . . . . . . . . . . . . . . . . . . . . . . . . . . . . . . . . . . . . . . . . . . . . . . . . . . . . . . . . . . . . . . . . . . . . . . . . . . . . . . . . . . . . . . . . . . . . . . . . . . . . . . . . . . . . . . . . . . . . . . . . .
Danny Dunn 42 Chief Revenue Officer. . . . . . . . . . . . . . . . . . . . . . . . . . . . . . . . . . . . . . . . . . . . . . . . . . . . . . . . . . . . . . . . . . . . . . . . . . . . . . . . . . . . . . . . . . . . . . . . . . . . . . . . . . . . . . . . . . . . . . . . . . . . . . . . . . . . . . . . . . . . . . . . . . . . . . . . . . . . . . . . . . . . . . .
Haywood Kelly 49 Head of Global Research. . . . . . . . . . . . . . . . . . . . . . . . . . . . . . . . . . . . . . . . . . . . . . . . . . . . . . . . . . . . . . . . . . . . . . . . . . . . . . . . . . . . . . . . . . . . . . . . . . . . . . . . . . . . . . . . . . . . . . . . . . . . . . . . . . . . . . . . . . . . . . . . . . . . . . . . . . . . . . . . . . . . . . .
Pat Maloney 60 General Counsel. . . . . . . . . . . . . . . . . . . . . . . . . . . . . . . . . . . . . . . . . . . . . . . . . . . . . . . . . . . . . . . . . . . . . . . . . . . . . . . . . . . . . . . . . . . . . . . . . . . . . . . . . . . . . . . . . . . . . . . . . . . . . . . . . . . . . . . . . . . . . . . . . . . . . . . . . . . . . . . . . . . . . . .
Daniel Needham 39 President and Chief Investment Officer, Investment Management. . . . . . . . . . . . . . . . . . . . . . . . . . . . . . . . . . . . . . . . . . . . . . . . . . . . . . . . . . . . . . . . . . . . . . . . . . . . . . . . . . . . . . . . . . . . . . . . . . . . . . . . . . . . . . . . . . . . . . . . . . . . . . . . . . . . . . . . . . . . . . . . . . . . . . . . . . . . . . . . . . . . . . .
Tricia Rothschild 51 Chief Product Officer. . . . . . . . . . . . . . . . . . . . . . . . . . . . . . . . . . . . . . . . . . . . . . . . . . . . . . . . . . . . . . . . . . . . . . . . . . . . . . . . . . . . . . . . . . . . . . . . . . . . . . . . . . . . . . . . . . . . . . . . . . . . . . . . . . . . . . . . . . . . . . . . . . . . . . . . . . . . . . . . . . . . . . .
Joe Mansueto founded Morningstar in 1984 and became executive chairman in 2017. He has served as chairman of the boardsince the company’s inception. He served as our chief executive officer from 1984 to 1996 and again from 2000 to 2016.
Under Joe’s leadership, Morningstar has been named twice to Fortune magazine’s ‘‘100 Best Companies to Work For’’ list, in 2011and 2012. The Chicago Tribune recognized Morningstar as one of the top 100 workplaces in the Chicago area in 2010, 2011, and2012, and Crain’s Chicago Business listed Morningstar in its Fast Fifty feature in 2007, 2008, 2009, and 2011. Morningstar won the2010 AIGA Chicago Chapter Corporate Design Leadership Award, which recognizes forward-thinking organizations that haveadvanced design by promoting it as a meaningful business policy.
In December 2016, InvestmentNews named Joe to its list of 20 Icons & Innovators. MutualFundWire.com recognized Joe as one ofthe 10 most influential individuals in the mutual fund industry in 2015, and he was the recipient of PLANSPONSOR’s LifetimeAchievement Award in 2013. In 2010, Joe received the Tiburon CEO Summit award, MutualFundWire.com named him ninth on itslist of the 100 Most Influential People of the year, and Chicago magazine listed Joe among its top 40 Chicago pioneers over thepast four decades. In 2007, SmartMoney magazine recognized him in the ‘‘SmartMoney Power 30,’’ its annual list of the 30 mostpowerful forces in business and finance. He received the Distinguished Entrepreneurial Alumnus Award from the University ofChicago Booth School of Business in 2000.
Joe holds a bachelor’s degree in business administration from The University of Chicago and a master’s degree in businessadministration from The University of Chicago Booth School of Business.
Morningstar, Inc. 2017 Annual Report 41
Executive Officers
Joe Mansueto

42
2017 10-K: Part I
Kunal Kapoor is chief executive officer of Morningstar and a member of our board of directors. Before assuming his current role in2017, he served as president, responsible for product development and innovation, sales and marketing, and driving strategicprioritization across the firm.
Before becoming president in 2015, Kunal was head of global products and client solutions. Kunal became head of our globalclient solutions group in 2013 and took on additional responsibility for the products group in February 2014. For part of 2013, hewas president of our Data Division, and from 2010 until 2012, he was president of Equity and Market Data/Software. In 2009 and2010, he was president of Individual Software. Kunal joined Morningstar in 1997.
He holds a bachelor’s degree in economics and environmental policy from Monmouth College and a master’s degree in businessadministration from The University of Chicago Booth School of Business. He also holds the Chartered Financial Analyst (CFA)designation.
Jason Dubinsky is chief financial officer for Morningstar, responsible for controllership, tax, treasury, internal audit, financialplanning and analysis, and investor relations.
Before joining Morningstar in 2017, Jason served as senior vice president and chief financial officer of planning and centraloperations for Walgreens Boots Alliance, Inc., where he was responsible for accounting and shared service functions forWalgreens’ U.S. operations and led the financial planning and analysis function for the global business. Prior to the merger ofWalgreens and Alliance Boots in 2014, he was Walgreens’ vice president of finance and treasurer, with responsibility for businessunit finance, treasury operations, risk management, and investor relations. Before joining Walgreens in 2009, he served as vicepresident of investment banking at Goldman Sachs and Lehman Brothers, where he led mergers and acquisitions and corporatefinance activity for clients across various industries.
Jason holds a bachelor’s degree in business administration from the University of Michigan and a master’s degree in businessadministration from New York University’s Stern School of Business.
Bevin Desmond is head of talent and culture, a role she has held since 2010. She is responsible for overseeing talent and culturefor all of Morningstar’s global operations. Previously, she was head of global markets from 2010 to 2017 and head of internationaloperations from 2001 until 2010. She joined Morningstar in 1993.
Bevin holds a bachelor’s degree in psychology from St. Mary’s College.
Danny Dunn is chief revenue officer for Morningstar. He is responsible for sales philosophy, strategy, and execution in order todrive revenue growth.
Before joining Morningstar in 2016, Danny was vice president of the Midwest enterprise unit for IBM, a global informationtechnology firm. He was responsible for marketing, strategy, sales, channels, and customer service for the complete IBM portfolio,including Cloud, Software, Services, Systems, and IBM Credit, LLC in the region. Prior to that, he was regional director for IBM’sChicago enterprise unit in 2013 and 2014, territory director for IBM’s Wisconsin business unit from 2011 until June 2013, and
42
Kunal Kapoor
Jason Dubinsky
Bevin Desmond
Danny Dunn

43
territory sales leader for IBM Global Services from 2009 until July 2011. Before joining IBM in 2007, he led sales, accountmanagement, and client service at Neology, a software and technology consulting division of SmithBucklin Corporation.
Danny holds a bachelor’s degree from the University of Vermont and a master’s degree in business administration, withconcentrations in marketing, strategy, and managerial economics, from the Kellogg School of Management at NorthwesternUniversity.
Haywood Kelly is head of global research for Morningstar and oversees our global fund, equity, and credit research and dataoperations. Before taking on his current role in January 2014, he was head of equity and credit research since 2009 and took onadditional responsibility for equity data in 2013. Haywood joined Morningstar in 1991.
He holds a bachelor’s degree in economics from The University of Chicago, where he graduated as a member of Phi Beta Kappa.He also holds the CFA designation.
Pat Maloney is general counsel for Morningstar. He is responsible for directing Morningstar’s legal department and managing itsrelationships with outside counsel. He also oversees Morningstar’s compliance department.
Before joining Morningstar in June 2016, Pat was a partner at Sheppard Mullin Richter & Hampton LLP from July 2012 throughApril 2016 in the firm’s corporate and securities practice. Previously, he was a partner at K&L Gates LLP and its legacy predecessorfirm, Bell, Boyd & Lloyd LLP. Early in his career, he was an associate with the New York law firm of Dewey Ballantine and anAssistant General Counsel with the Prudential Insurance Company of America.
Pat holds a bachelor’s degree with honors from The University of Chicago and a juris doctor degree with honors from TheUniversity of Chicago Law School. He is admitted to practice law in Illinois and New York.
Daniel Needham is president and chief investment officer (CIO) of Morningstar Investment Management and is responsible forbuilding world-class investment management solutions based on our proprietary research. Before taking on his current role inFebruary 2015, he served as CIO for Morningstar Investment Management, and was previously managing director and CIO forMorningstar Investment Management’s Asia-Pacific Operations. He joined our company when Morningstar acquired Intech Pty Ltd(now Ibbotson Associates Australia) in 2009, where he served as chief investment officer. Before joining Intech in 2002, Danielworked for Zurich Financial Services in Sydney.
He holds a bachelor’s degree in commerce with a major in finance and economics from the University of Sydney. He also holds theCFA designation.
Tricia Rothschild is chief product officer for Morningstar. She is responsible for product strategy, innovation, development, andexecution for the solutions delivered to clients.
Before taking on her current role in January 2017, Tricia was head of global advisor solutions for Morningstar, setting the strategicdirection for our wealth management and online brokerage business and overseeing priorities for this customer group. From
Morningstar, Inc. 2017 Annual Report 43
Haywood Kelly
Pat Maloney
Daniel Needham
Tricia Rothschild

44
2017 10-K: Part I
September 2012 until February 2013, Tricia was senior vice president of advisor software for Morningstar. Previously, she servedas senior vice president for Morningstar’s equity research business and held a variety of research and product management rolesafter joining Morningstar in 1993.
Tricia holds a bachelor’s degree from Northwestern University and a master’s degree in Russian and Central European economicsfrom Indiana University. She also holds the CFA designation.
We were incorporated in Illinois on May 16, 1984. Our corporate headquarters are located at 22 West Washington Street,Chicago, Illinois, 60602.
We maintain a website at http://www.morningstar.com/company. Our annual report on Form 10-K, quarterly reports on Form 10-Q,current reports on Form 8-K, and amendments to any of these documents are available free of charge on this site as soon asreasonably practicable after the reports are filed with or furnished to the SEC. We also post quarterly press releases on ourfinancial results and other documents containing additional information related to our company on this site. We provide thiswebsite and the information contained in or connected to it for informational purposes only. That information is not part of thisAnnual Report on Form 10-K.
44
Company Information

45
You should carefully consider the risks described below and all of the other information included in this Form 10-K when decidingwhether to invest in our common stock or otherwise evaluating our business. If any of the following risks materialize, ourbusiness, financial condition, or operating results could suffer. In this case, the trading price of our common stock could decline,and you may lose all or part of your investment.
Three of our subsidiaries, Morningstar Investment Management LLC, Morningstar Investment Services LLC, and MorningstarResearch Services LLC, are registered as investment advisors with the SEC under the Investment Advisers Act of 1940, asamended. As registered investment advisors, these companies are subject to the requirements and regulations of the AdvisersAct. These requirements relate to, among other things, record-keeping, reporting, and standards of care, as well as generalanti-fraud prohibitions. As registered investment advisors, these subsidiaries are subject to on-site examination by the SEC.
In addition, in cases where these subsidiaries provide investment advisory services to retirement plans and their participants, theymay be acting as fiduciaries under the Employee Retirement Income Security Act of 1974. As fiduciaries under ERISA, they haveobligations to act in the best interest of their clients. They also have duties of loyalty and prudence, as well as duties to diversifyinvestments and to follow plan documents to comply with the applicable portions of ERISA.
Our subsidiaries outside the United States that have investment advisory operations are subject to similar requirements.
We may face liabilities for actual or claimed breaches of our fiduciary duties, particularly in areas where we provide retirementadvice and managed retirement accounts. In some of our retirement contracts, we act as an ERISA fiduciary by, for example,selecting and monitoring a broad range of diversified plan options. We also provide a managed account service for retirement planparticipants who elect to have their accounts managed by our programs. Such activities have been the subject of increasing classaction litigation in recent years. For example, in 2017, a participant in a pension plan filed a putative class action proceedingagainst us alleging that we, together with other defendant parties, violated the Racketeer Influenced and Corrupt OrganizationsAct by allegedly engaging in actions to steer plan participants into high-cost investments that pay unwarranted fees to thedefendants. We are vigorously contesting this proceeding, which is described in more detail in Item 3 of this Form 10-K underLegal Proceedings. As of December 31, 2017, we had $57.6 billion in assets under management in our managed retirementaccounts. We could face substantial liabilities related to our management of these assets.
We rely on automated investment technology for our retirement advice and managed retirement accounts services. The WealthForecasting Engine is our core advice and managed accounts engine that determines appropriate asset allocations for retirementplan participants and assigns individuals to portfolios. We also rely on automated portfolio construction tools. Problems couldarise if these programs assigned retirement plan participants to the wrong portfolios, particularly if we failed to detect programerrors over an extended period. Clients may take legal action against us for an actual or claimed breach of a fiduciary duty. If wemake an error, we may be subject to potentially large liabilities for make-whole payments and/or litigation. We cannot quantifythe potential size of these liabilities with any level of precision.
In addition, we may face other legal liabilities based on the quality and outcome of our investment advisory recommendations,even in the absence of an actual or claimed breach of fiduciary duty, or based on our investment management fees and expenses.
Morningstar, Inc. 2017 Annual Report 45
Item 1A. Risk Factors
Our investment management operations may subject us to liability for any losses that result from a breach of ourfiduciary duties.

46
2017 10-K: Part I
In total, we provided investment advisory and management services on approximately $195 billion in assets as of December 31,2017. We could face substantial liabilities related to our work on these assets.
We believe independence is at the core of our business, and our reputation is our greatest corporate asset. We rely on ourreputation for integrity and high-caliber products and services. Any failure to uphold our high ethical standards and ensure that ourcustomers have a consistently positive experience with us could damage our reputation as an objective, honest, and crediblesource for investment research and information. Allegations of improper conduct, whether the ultimate outcome is favorable orunfavorable to us, as well as any negative publicity or media reports about Morningstar, whether valid or not, may harm ourreputation and damage our business. For instance, in October 2017, The Wall Street Journal ran an article critical of our fund starand analyst ratings. We publicly and comprehensively disputed the assertions made in the article, but the publication of such anarticle illustrates the risks of negative publicity to our business.
We provide ratings, analyst research, and investment recommendations on mutual funds and other investment products offered byour institutional clients. We also provide investment advisory and investment management services. In some cases, we makeinvestment recommendations (such as Select Lists) within the framework of client constraints. While we don’t charge assetmanagement firms for their products to be rated, we do charge licensing fees for the use of our ratings. We also receive paymentsfrom issuers for our new-issue ratings on various types of asset-backed securities and corporate bond issues. These paymentsmay create the perception that our ratings, research, and recommendations are not impartial.
This perception may undermine the confidence of our customers and potential customers in our reputation as a provider ofindependent research. Any such loss of confidence or damage to our reputation could hurt our business.
Our reputation may also be harmed by factors outside of our control, such as news reports about our clients or adverse publicityabout certain investment products. Our reputation could also suffer if we fail to produce competitive performance in ourinvestment management offerings.
We attribute much of our company’s success over the past 34 years to our ability to develop innovative, proprietary research tools,such as the Morningstar Rating, Morningstar Style Box, Ownership Zone, and Portfolio X-Ray. More recently, we’ve developedunique concepts and tools such as the Wealth Forecasting Engine, Gamma, Total Wealth Approach, and Best Interest Scorecard.We believe these innovations set us apart because most of our competitors focus on providing data or software rather thancreating their own proprietary research frameworks. We also believe our ability to develop innovative, proprietary research toolsis at the core of what drives Morningstar’s value for all of our customer groups.
If we fail to continuously innovate and develop new tools to meet the needs of our customers, our competitive position andbusiness results may suffer. In addition, our reputation could be harmed if we’re perceived as not moving quickly enough to meetthe changing needs of investors. Clients may also delay purchases of our currently offered research tools in anticipation of usoffering new products or enhanced versions of existing products. Our competitive position and business results may also suffer ifother companies are able to successfully introduce innovative, proprietary research tools that gain attention from our clients. Webelieve lower technology costs, the growth of open software platforms, and cloud computing technologies have lowered the
46
Failing to maintain and protect our brand, independence, and reputation may harm our business. Our reputationand business may also be harmed by allegations made about possible conflicts of interest or by other negativepublicity or media reports.
Failing to differentiate our products and continuously create innovative, proprietary research tools may harm ourcompetitive position and business results.

47
barriers to entry for new competitors, making it easier for new players to enter the market. Smaller companies, including startupfirms funded by private equity and venture capital, may be able to move more quickly to develop research and tools that gain awide following.
In addition, the value of our data, research and software tools may be negatively affected by the increasing amount of informationand tools that are available for free, or at low cost, through internet sources or other low-cost delivery systems. Although webelieve our products and services contain value-added features and functionality that deeply embed them in our customers’workflows, such developments may over time reduce the demand for, or customers’ willingness to pay for, certain of our productsand services.
If we fail to introduce innovative, proprietary research tools and frameworks, we may not generate enough interest from potentialclients to win new business. We cannot guarantee that we will successfully develop new product features and tools thatdifferentiate our product offerings from those of our competitors.
In addition, we must make long-term investments and commit significant resources often before knowing whether suchinvestments will result in products or services that satisfy our clients’ needs or generate revenues sufficient to justify suchinvestments. In addition, from time to time, we also incur costs to transition clients to new or enhanced products or services. Suchtransitions can involve material execution risks and challenges. If we are unable to manage these investments and transitionssuccessfully, our business, financial condition, and results of operations could be materially adversely affected.
We believe the technology landscape has been changing at an accelerating rate over the past several years. Changes intechnology are fundamentally changing the ways investors access data and content. Examples include the shift from local networkcomputing to cloud-based systems, the proliferation of wireless mobile devices, and rapid acceleration in the use of social mediaplatforms.
Our software development process is based on frequently rolling out new features so that we can quickly incorporate userfeedback. While some changes in technology may offer opportunities for Morningstar, we cannot guarantee that we willsuccessfully adapt our product offerings to meet evolving customer needs. If we fail to develop and implement new technologyrapidly enough, we may sacrifice new business opportunities or renewals from existing customers. We may also incur additionaloperating expense if major software projects take longer than anticipated. Our competitive position and business results maysuffer if we fail to develop new technologies to meet client demands, if our execution speed is too slow, or if we adopt atechnology strategy that doesn’t align with changes in the market.
We generate a significant portion of our revenue from products and services related to mutual funds, and part of our growth since1984 can be attributed to favorable industry trends. The mutual fund industry has experienced substantial growth over the past 30to 40 years, but suffered during the market downturn of 2008 and 2009. Since then, fund assets have increased, but at a slowerrate than in previous years. Some of that slower growth is attributable to the growth of ETFs as a mutual fund alternative, and wehave accordingly expanded our research coverage and analyst ratings to include ETFs. However, ETFs generally track passiveinvesting strategies and charge lower management fees than active strategies, which may affect both the profitability of assetmanagers, on whose success we in part depend, and the perceived value of our research regarding ETFs.
Morningstar, Inc. 2017 Annual Report 47
Failing to respond to technological change, keep pace with new technology developments, or adopt a successfultechnology strategy may negatively affect our competitive position and business results.
Our results could suffer if the mutual fund industry continues to experience slower growth, if actively managedequity funds continue to attract less investor attention, or if the industry continues to meaningfully consolidate.

48
2017 10-K: Part I
A significant portion of our fund research has historically focused on equity-related funds. In addition, we are best-known for ourdata and analyst research on actively managed equity funds. Over the past 15 years, passively managed index funds have seengreater investor interest, and this trend has accelerated in recent years. In 2017, actively managed mutual funds suffered about$7 billion in net outflows, compared with net inflows of more than $690 billion for passively managed funds. Overall, we estimatethat passively managed portfolios now account for more than one-third of combined mutual fund and ETF assets. The growth ofonline wealth management tools that provide automated, algorithm-based portfolio management advice, sometimes calledrobo-advice, may further accelerate the adoption of passively managed portfolios and reduce demand for our data and analystresearch.
The growth of the mutual fund industry is also being affected by increasing merger and acquisition activity within the assetmanagement industry, which is reducing the number of asset managers offering mutual funds and ETFs, the pruning by somemutual fund and ETF platforms of the number of funds available for purchase, and the continuing impacts of regulation, such asMiFID II’s requirement that asset managers pay banks and brokers for investment research, which may be a competitive advantagefor larger asset managers better able to absorb such costs.
Prolonged downturns or volatility in the financial markets, increased investor interest in other investment vehicles, or a lack ofinvestor confidence could continue to reduce investor interest and investment activity. In addition, a continued lessening ofinvestor interest in actively managed equity funds could decrease demand for our products, including our software, data, andanalyst research.
We have approximately 1,360 employees working at our corporate headquarters in Chicago, Illinois. These include most of ourexecutive leadership team as well as substantial numbers of employees involved in the delivery of most of our major products andservices. If our headquarters were to become unusable due to a natural disaster, a violent incident or another dangerousemergency, we might not be able to continue business operations at an acceptable level that would meet all our legal andcontractual commitments. Our failure to successfully implement and deploy a business continuity plan, either at an enterpriselevel or with respect to particular business centers, could materially affect our business operations and have a material adverseeffect on our financial condition and results of operations.
We now have approximately 950 employees working in our data and technology development center in Shenzhen, China. We relyon these employees to maintain and update our mutual fund database and work on other projects. Because China has a restrictivegovernment under centralized control and the relationship between the United States and China is experiencing a period ofincreased political, military, and commercial tensions, our operations are subject to political and regulatory risk, which isinherently unpredictable. Laws and regulations relating to data privacy, security, and protection of intellectual property rights inChina, as well as the enforcement environment for such laws and regulations, are in certain cases uncertain and evolving. Inaddition, this facility is subject from time to time to extreme weather events. The concentration of certain types of developmentand data work carried out at this facility also involves operational risks for parts of our network infrastructure. While we haveshort-term backup plans in place, it would be difficult for us to maintain and update our mutual fund database if we were unableto access our Shenzhen operations for an extended period of time. Any difficulties that we face in continuing to operate ourdevelopment center in China may harm our business and have a negative impact on the products and services we provide.
48
Our business continuity program may not be adequate in the event of a material emergency affecting one or moreof our United States or offshore business centers or adverse political or regulatory developments in countries inwhich we have significant data and development operations.

49
We have approximately 935 employees who work at our data collection, technology and operational center in Mumbai, India.These employees maintain and update our equity database and provide shared services to many of our operations. This location issubject to extreme weather events and political unrest, including public protests which can disrupt transportation and make itdifficult for employees to commute to and from work. The electrical infrastructure of Mumbai is also subject to more frequentinterruptions than are experienced at our other major facilities. In addition, Mumbai has experienced and may in the futureexperience terrorist attacks. While we have short-term backup plans in place to address such business continuity issues, it wouldbe challenging for us to maintain and update our equity database or continue to provide certain shared services to our worldwideoperations if we were unable to access our Mumbai operations for an extended period of time.
PitchBook, which we acquired in December 2016, has approximately 230 contract employees based in Calcutta and Pune, Indiawho support its data and research operations and approximately 100 contract employees based in Ukraine who work on softwaredevelopment. Ukraine has been subject to significant political unrest and military incursions. Any disruption to PitchBook’scontract operations in these locations would make it difficult for PitchBook to meet its operating goals.
Customers routinely enter personal investment and financial information, including portfolio holdings, account numbers, and creditcard information, on our websites. In addition, we handle increasing amounts of personally identifiable information in areas suchas Morningstar Retirement Manager, Morningstar Managed Portfolios, ByAllAccounts, Morningstar Office, Enterprise DataManagement, and Morningstar.com. ByAllAccounts uses technology to collect, consolidate, and transform financial account dataand deliver it to any platform, and accordingly handles a large volume of personally identifiable information as part of its normalbusiness operations.
Any failure to safeguard this information could damage our reputation and business results. We must continuously invest insystems, processes, and controls to guard against the risk of improper access to this information, which could be disclosedthrough employee errors, other inadvertent release, social engineering, failure to restrict access, or failure to properly purge andprotect data. We may suffer malicious attacks by individuals or groups seeking to attack our products and services or penetrateour network and databases to gain access to personal data or to launch or coordinate distributed denial of service attacks. Theseattacks have become increasingly frequent, sophisticated, and difficult to detect.
Contractual commitments to customers as well as laws and industry regulations related to data protection, system availability,and privacy require us to safeguard critical data. We are also required to take appropriate steps to safeguard credit card numbers,Social Security numbers, and other information about individuals or their accounts. In the European Union, the General DataProtection Regulation (GDPR), which will become effective in May 2018, will among other things impose stringent additionalrequirements regarding the information to be provided to, and the consents required from, individuals to justify a business usingtheir personal data, as well as new rights of data subjects to be forgotten, data portability rights and the right to object to certainautomated decision-making processes. Given the growing concern over data privacy and identity theft, we have been and expectto continue to be subject to increased scrutiny by clients and regulators. We could be subject to liability if we were toinappropriately collect, retain, or disclose any user’s personal information or if third parties were able to penetrate our networksecurity or otherwise gain access to any user’s name, address, Social Security number, account numbers, portfolio holdings, creditcard information, or other personal information. We could also be subject to liability if we fail to meet the requirements of lawsand regulations such as the GDPR, which contemplate substantial enterprise-level penalties for non-compliance, in a timely orthorough manner.
Morningstar, Inc. 2017 Annual Report 49
We could face liability related to our storage of personal information about individuals as well as portfolio andaccount-level information.

50
2017 10-K: Part I
Our investment management operations are a growing part of our overall business. The securities laws and other laws that governour investment advisory activities are complex. The activities of our investment advisory operations are subject to provisions ofthe Advisers Act and ERISA. In addition, Morningstar Investment Services is a broker-dealer registered under the Exchange Actand is subject to the rules of FINRA. We also provide investment advisory services in other areas around the world, and ouroperations are subject to additional regulations in markets outside the United States. If we fail to comply with securities laws andother regulatory requirements, we may be subject to fines or other events that could have a negative effect on our business.
Over the past several years, we have also made significant investments in our credit rating business. Our Morningstar CreditRatings, LLC subsidiary is an NRSRO that specializes in structured finance, corporate credit issuers, and financial institutions.Credit rating and research providers continue to be subject to intensive regulatory scrutiny. As an NRSRO, Morningstar CreditRatings is subject to various requirements and regulations under the Exchange Act relating to, among other things, record-keeping, reporting, governance, and conflicts of interest. As part of its NRSRO registration, Morningstar Credit Ratings is subjectto annual examination by the SEC, as well as periodic investigations by the SEC and other governmental authorities relating tomatters of regulatory interest such as industry practices and personnel matters. The cost and management distraction resultingfrom such examinations and investigations may have a negative effect on our credit rating business.
Our index business could be negatively affected by increased regulation of benchmarks generally, which could increase the costsand risks of producing and administering indexes. Such regulations may discourage market participants from continuing to use,administer or contribute to indexes, trigger changes in the rules or methodologies relating indexes, and/or lead to decliningdemand for indexes.
The laws, rules, and regulations, and their interpretations, applicable to our business may change in the future, and we may not beable to comply with these changes without extensive changes to our business practices. In addition, the broad scope of ourbusiness operations makes it more difficult to monitor areas that may be subject to regulatory and compliance risk. If we fail tocomply with any applicable law, rule, or regulation, we could be fined, sanctioned, or barred from providing investment advisory,credit rating or index services in the future, which could adversely affect our business.
The success of our business depends upon our ability to deliver time-sensitive, up-to-date data and information. We rely primarilyon our computer equipment, database storage facilities, and other network equipment, which is located across multiple facilitiesin the United States. We also have extensive information systems outside the United States. Our mission-critical databases andnetworks are complex and interdependent, which increases the risk of failure. Problems in our network systems may lead tocascading effects involving product downtime, overloading of third-party data centers, and other issues that may affect ourclients. Many of our client contracts contain service-level agreements that require us to meet certain obligations for deliveringtime-sensitive, up-to-date data and information. We may not be able to meet these obligations in the event of failure or downtimein our information systems.
Our operations and those of our suppliers and customers are vulnerable to interruption by fire, earthquake, power loss,telecommunications failure, terrorist attacks, wars, computer viruses, and other events beyond our control. Our database andnetwork facilities may also be vulnerable to external attacks that misappropriate our data, corrupt our databases, or limit access
50
Compliance failures, regulatory action, or changes in laws applicable to our investment advisory or credit ratingoperations could adversely affect our business.
An outage of our database, technology-based products and services, or network facilities could result in reducedrevenue and the loss of customers, and our movement of parts of our technological infrastructure to the publiccloud could expose us to various third party provider risks

51
to our information systems. To defend against these threats, we implement a series of controls focusing on both prevention anddetection, including firewalls, intrusion detection systems, automated scanning and testing, server hardening, anti-virus software,training, and patch management. We make significant investments in servers, storage, and other network infrastructure to preventincidents of network failure and downtime, but we cannot guarantee that these efforts will work as planned.
Most of our products and services currently depend heavily on our electronic delivery systems and the Internet, although we areshifting the delivery of several of our products and services to cloud-based delivery systems. Our ability to deliver informationusing the Internet may be impaired because of infrastructure failures, service outages at third-party Internet providers, maliciousattacks, or other factors. If disruptions, failures, or slowdowns of our electronic delivery systems or the Internet occur, our abilityto distribute our products and services effectively and to serve our customers may be impaired.
We maintain off-site back-up facilities for our data, but we cannot guarantee that these facilities will operate as expected duringan interruption that affects our headquarters. There may be single points of failure that affect our core databases, data transferinterfaces, or storage area networks. We may not be able to fully recover data or information lost during a database or networkfacility outage. Any losses, service disruption, or damages incurred by us could have a material adverse effect on our business,operating results, or financial condition.
Our gradual movement of parts of our technological infrastructure to the public cloud and software as a service (SaaS) solutionspresents a variety of additional risks, including risks relating to sharing the same computing resources with other users, the use bycloud and SaaS providers of virtualization products and various security issues relating thereto, reliance on cloud and SaaSproviders’ authentication, authorization and access control mechanisms, a lack of control over cloud and SaaS providers’redundancy systems and fault tolerances, and a reduced ability to directly address client concerns over data security and privacy.Any disruption of or interference with our use of the public cloud or SaaS solutions, or any information security breach at any cloudor SaaS provider, could materially impact our operations and have an adverse effect on our business. Over time, a growingdependence of our technology infrastructure on the public cloud and SaaS solutions also risks us becoming overly dependent onparticular suppliers, which could adversely affect the pricing we receive from such suppliers and limit our ability to transition awayfrom such suppliers in the event of service-quality issues.
Our business results are partly driven by factors outside of our control, including general economic and financial market trends.Any unfavorable changes in the environment we operate in could cause a corresponding negative effect on our business results.As a result, we may experience lower revenue, operating income, and other financial results in the event of a market downturn.
Many of our customers are asset management firms and other financial services companies, which are also subject to externaltrends and changes. For example, the financial crisis of 2008 and 2009 led to spending cutbacks among many of the companies towhich we sell. Some institutional clients have implemented additional review processes for new contracts or started providingcertain services, such as investment management, in-house rather than hiring outside service providers. Some institutional clientshave also reduced the scope of their operations, and merger and acquisition activity in the asset management sector has in thepast, and may in the future, reduce the number of potential asset management clients.
Many companies in the financial services industry have also been subject to increasing government regulation and pressure toreduce fees. In turn, many of these firms have sought to reduce their operating costs by working with fewer service providersand/or negotiating lower fees for services they purchase.
Morningstar, Inc. 2017 Annual Report 51
Downturns in the financial sector, global financial markets, and global economy may hurt our results, resulting inlower revenue from asset-based fees, transaction-based revenue, or other parts of our business.

52
2017 10-K: Part I
In addition, our revenue from asset-based fees may be adversely affected by market declines, cash outflows from portfolios thatwe help manage, and the industry-wide trend toward lower asset-based fees.
In 2017, asset-based revenue made up approximately 21% of our consolidated revenue. The amount of asset-based revenue weearn primarily depends on the value of assets on which we provide advisory services, and the size of our asset base can increaseor decrease along with trends in market performance. In 2017, the U.S. and many international markets experienced substantialvaluation increases. These market trends were highly favorable in terms of the value of assets we have under management oradvisement, but there can be no assurance that these trends will continue and, if they do not, our asset-based revenue may benegatively affected.
Asset levels can also be affected if net inflows into the portfolios on which we provide investment advisory services drop or ifthese portfolios experience redemptions. A drop in net inflows or an increase in redemptions can result from a variety of factors,including overall market conditions and volatility or a decline in investment performance. If the level of assets on which weprovide investment advisory or investment management services goes down, we expect our fee-based revenue to show acorresponding decline.
Our business results may also be hurt by negative trends in Internet advertising sales, which made up about 3% of consolidatedrevenue in 2017. Many advertisers have shifted some of their advertising spend to programmatic buying platforms that targetusers on other sites, which has from time to time had a negative effect on advertising revenue for our website for individualinvestors, Morningstar.com. We are uncertain whether this trend will continue.
Our structured credit rating business, which made up about 3% of consolidated revenue in 2017, is subject to volatility from trendsin new issuance of commercial mortgage-backed securities and other structured credits. If industry-wide issuance for suchsecurities declines, our revenue associated with this line of business may also go down. We have also expanded our coverage toinclude corporate credit issuers and financial institutions, which are also subject to volatility in issuance patterns based on marketconditions.
Our PitchBook Data business may also be subject to cyclical trends. Many of PitchBook’s clients are investment banks and otherparticipants in the capital and merger and acquisition markets, which are subject to periodic business downturns driven bychanges in such markets. During these downturns, they often seek to reduce spending on third-party services as well as thenumber of employees, which would directly affect the number of prospective clients for PitchBook. As a data and researchprovider focusing on the private capital markets (including venture capital, private equity, and M&A), PitchBook may also besubject to volatility based on the amount of activity and market interest in these areas.
We’ve completed numerous acquisitions over the past 10 years. In 2016, we acquired PitchBook. This acquisition presents severalpotential challenges and risks. We may not achieve the growth targets that we established for PitchBook at the time of theacquisition. The process of integration may require more resources than we anticipated. We may assume unintended liabilities orexperience operating difficulties or costs that we did not anticipate. We may also fail to retain key personnel of the acquiredbusiness, including PitchBook founder and chief executive officer John Gabbert, which would make it difficult to follow through onour operating goals for the acquisition. If our acquisition of PitchBook does not generate the results we anticipate, it could have amaterial adverse effect on our business, financial condition, and results of operations. We may also fail to generate enoughrevenue or profits from this acquisition to earn a positive return on the associated purchase price.
52
Our acquisitions and other investments may not produce the results we anticipate. We have also incurred debt inconnection with acquisitions, which may limit our financial flexibility.

53
To fund this acquisition, we increased the principal amount available for borrowing under our existing revolving credit facility to$300.0 million and extended the term of this facility to three years. Under the terms of our agreement with the lender, we are nowsubject to certain restrictions and financial covenants, which may limit our financial flexibility. As of December 31, 2017,borrowings in the principal amount of $180.0 million remain outstanding under such facility.
In 2017, we purchased a 40% interest in Sustainalytics Holding B.V. (Sustainalytics), a leading global provider of environmental,social and governance (ESG) research and ratings. While we obtained various rights in connection with that investment, includingrepresentation on Sustainalytics’ Board of Directors, we do not own a controlling interest in Sustainalytics and the future value ofour investment is highly dependent on the management skill of the managers of Sustainalytics.
We expect to continue making acquisitions and establishing investments and joint ventures as part of our long-term businessstrategy. Acquisitions, investments, and joint ventures involve a number of risks. They can be time-consuming and may divertmanagement’s attention from day-to-day operations, particularly if numerous acquisitions are in process at the same time.Financing an acquisition could result in dilution from issuing equity securities, reduce our financial flexibility because of reductionsin our cash balance, or result in a weaker balance sheet from incurring debt.
We experience competition for analysts, technology experts, and other employees from other companies and organizations.Competition for these employees is intense, and we may not be able to retain our existing employees or be able to recruit andretain other highly qualified personnel in the future.
Our future success also depends on the continued service of our executive officers, including Joe Mansueto, our executivechairman and controlling shareholder. At the end of 2016, Joe changed his role to focus less on our day-to-day businessoperations, but he remains heavily involved our strategy and overall company direction. The loss of Joe, our chief executive officer,Kunal Kapoor, or other executive officers could hurt our business, operating results, or financial condition. We do not haveemployment agreements, non-compete agreements, or life insurance policies in place with any of our executive officers. They mayleave us and work for our competitors or start their own competing businesses.
Our operations outside of the United States generated $224.7 million in revenue in 2017, or about 25% of our consolidatedrevenue. There are risks inherent in doing business outside the United States, including challenges in reaching new marketsbecause of established competitors and limited brand recognition; difficulties in staffing, managing, and integrating non-U.S.operations; difficulties in coordinating and sharing information globally; differences in laws and policies from country to country;exposure to varying legal standards, including intellectual property protection laws; potential tax exposure related to transferpricing and other issues; heightened risk of fraud and noncompliance; and currency exchange rates and exchange controls. Theserisks could hamper our ability to expand around the world, which may hurt our financial performance and ability to grow.
We don’t engage in currency hedging or have any positions in derivative instruments to hedge our currency risk. Our reportedrevenue could suffer if certain foreign currencies decline relative to the U.S. dollar, although the impact on operating income maybe offset by an opposing currency impact on locally based operating expense.
Morningstar, Inc. 2017 Annual Report 53
Our future success depends on our ability to recruit, develop, and retain qualified employees.
Our operations outside of the United States involve additional challenges that we may not be able to meet.

54
2017 10-K: Part I
We may be subject to claims for securities law violations, defamation (including libel and slander), negligence, or other claimsrelating to the information we publish, including our research and ratings on issuers of structured credits and corporate credits. Forexample, investors may take legal action against us if they rely on published information that contains an error, or a company mayclaim that we have made a defamatory statement about it or its employees. Clients of our software products used by advisors orasset managers or governmental regulation of such clients may make claims against us based on software or data errors thataffect investment reporting or client billing. Even though most of our contracts for such products contain limitations of our liabilityin such cases, we may be required to make such clients or their customers whole for any losses in order to maintain our businessrelationships. We could also be subject to claims based on the content that is accessible from our website through links to otherwebsites.
We rely on a variety of outside parties as the original sources for the information we use in our published data. These sourcesinclude securities exchanges, fund companies, hedge funds, transfer agents, and other data providers. We also incorporate datafrom a variety of third-party sources for PitchBook Data. Accordingly, in addition to possible exposure for publishing incorrectinformation that results directly from our own errors, we could face liability based on inaccurate data provided to us by others.
We could be subject to claims by providers of publicly available data and information we compile from websites and other sourcesthat we have improperly obtained that data in violation of the source’s copyrights or terms of use, or based on the provisions ofnew legislation such as GDPR that limits the bases on which businesses can collect personal information from and aboutindividuals. We could also be subject to claims from third parties from which we license data and information that we have usedor re-distributed the data or information in ways not permitted by our license rights. Defending claims based on the informationwe publish could be expensive and time-consuming and could adversely impact our business, operating results, and financialcondition.
The steps we have taken to protect our intellectual property may not be adequate to safeguard our proprietary information. Werely primarily on patent, trademark, copyright and trade secret rights, as well as contractual protections and technical safeguards,to protect our intellectual property rights and proprietary information. Despite these efforts, third parties may still attempt tochallenge, invalidate or circumvent our rights or improperly obtain our proprietary information. Further, effective trademark,copyright, and trade secret protection may not be available in every country in which we offer our services. Failure to adequatelyprotect our intellectual property could harm our brand, devalue our proprietary content, and affect our ability to compete in themarketplace.
From time to time, we encounter jurisdictions in which one or more third parties have a pre-existing trademark registration incertain relevant international classes that may prevent us from registering our own marks in those jurisdictions. Our continuedability to use the ‘‘Morningstar’’ name or logo, either on a stand-alone basis or in association with certain products or services,could be compromised in those jurisdictions because of these pre-existing registrations. Similarly, from time to time, we encountersituations in certain jurisdictions where one or more third parties are already using the Morningstar name, either as part of aregistered corporate name, a registered domain name or otherwise. Our ability to effectively market certain products and/orservices in those locations could be adversely affected by these pre-existing usages.
54
We could face liability for the information we publish or the reports and other documents produced by oursoftware products, including information, reports and documents based on data we obtain from other parties.
Failure to protect our intellectual property rights, or claims of intellectual property infringement against us, couldharm our brand and ability to compete effectively.

55
We have from time to time been subject to claims by third parties alleging infringement of their intellectual property rights. Suchclaims can also be alleged against clients, customers, or distributors of our products or services whom we have agreed toindemnify against third party claims of infringement. The defense of such claims can be costly and consume valuable managementtime and attention. We may be forced to settle such claims on unfavorable terms, which can include the payment of damages, theentry into royalty or licensing arrangements on commercially unfavorable terms, or the suspension of our ability to offer affectedproducts or services. If litigation were to arise from any such claim, there can be no certainty we would prevail in it. If any of theserisks were to materialize, it could have a material adverse effect on our business, financial condition or results of operations.
As of December 31, 2017, Joe Mansueto, our executive chairman, owned approximately 57% of our outstanding common stock.As a result, he has the ability to control substantially all matters submitted to our shareholders for approval, including the electionand removal of directors and any merger, consolidation, or sale of our assets. He also has the ability to control our managementand affairs. This concentration of ownership may delay or prevent a change in control; impede a merger, consolidation, takeover,or other business combination involving Morningstar; discourage a potential acquirer from making a tender offer or otherwiseattempting to obtain control of the company; or result in actions that may be opposed by other shareholders.
We believe our business has relatively large fixed costs and low variable costs, which magnify the impact of revenue fluctuationson our operating results. As a result, a decline in our revenue may lead to a larger decline in operating income. In addition,because we manage our business with a long-term perspective, we generally don’t make significant adjustments to our strategyor cost structure in response to short-term factors. As a result, our operating results may suffer in the short term. In addition, wedo not provide earnings guidance or hold one-on-one meetings with institutional investors and research analysts. Because of thispolicy and limited analyst coverage on our stock, our stock price may not always reflect the intrinsic value of our business andassets. If our operating results or other operating metrics fail to meet the expectations of outside research analysts and investors,the market price of our common stock may decline.
If our shareholders sell substantial amounts of our common stock, the market price of our common stock could fall. A reduction inownership by Joe Mansueto or any other large shareholder could cause the market price of our common stock to fall. In addition,the average daily trading volume in our stock is relatively low. The lack of trading activity in our stock may lead to greaterfluctuations in our stock price. Low trading volume may also make it difficult for shareholders to make transactions in a timelyfashion.
We do not have any unresolved comments from the Staff of the Securities and Exchange Commission regarding our periodic orcurrent reports under the Exchange Act.
As of December 31, 2017, we leased approximately 457,000 square feet of office space for our U.S. operations, primarily for ourcorporate headquarters located in Chicago, Illinois. We also lease another 435,000 square feet of office space in 26 other
Morningstar, Inc. 2017 Annual Report 55
Control by a principal shareholder could adversely affect our other shareholders.
Fluctuations in our operating results may negatively affect our stock price.
The future sale of shares of our common stock may negatively affect our stock price.
Item 1B. Unresolved Staff Comments
Item 2. Properties
56
2017 10-K: Part I
countries around the world, including approximately 141,000 square feet in Shenzhen, China. We believe that our existing andplanned office facilities are adequate for our needs and that additional or substitute space is available to accommodate growthand expansion.
In August 2017, Michael D. Green, individually and purportedly on behalf of all others similarly situated, filed a complaint in theUnited States District Court for the Northern District of Illinois. The complaint names as defendants Morningstar, Inc., PrudentialInvestment Management Services LLC, and Prudential Retirement Insurance and Annuity Co., and contains one count allegingviolation of the Racketeer Influenced and Corrupt Organizations Act (RICO). Plaintiff, a participant in a pension plan, alleges thatthe defendants engaged in concerted racketeering actions to steer plan participants into high-cost investments that payunwarranted fees to the defendants. The complaint seeks unspecified compensatory damages for plaintiff and the members of theputative class, treble damages, injunctive relief, costs, and attorneys’ fees. Morningstar has filed a motion to dismiss thecomplaint, which is fully briefed and under advisement by the court. Although Morningstar is vigorously contesting the claimasserted, we cannot predict the outcome of the proceeding.
We are involved from time to time in legal proceedings and litigation that arise in the normal course of our business. While it isdifficult to predict the outcome of any particular proceeding, we do not believe the result of any of these matters will have amaterial adverse effect on our business, operating results, or financial position.
Not applicable.
56
Item 3. Legal Proceedings
Michael D. Green
Other Matters
Item 4. Mine Safety Disclosures

57
Our common stock is listed on the Nasdaq Global Select Market under the symbol MORN.
The following table shows the high and low price per share of our common stock for the periods indicated, as reported on theNasdaq Global Select Market:
2017 2016
High Low High Low
First Quarter $ 81.97 $ 72.85 $ 88.66 $ 74.78Second Quarter 79.55 68.43 89.44 76.57Third Quarter 85.58 77.46 85.49 73.84Fourth Quarter 99.11 82.64 79.30 67.74
As of February 16, 2018, the last reported sale price on the Nasdaq Global Select Market for our common stock was $96.55 pershare, and there were 1,164 shareholders of record of our common stock.
See Note 12 of the Notes to our Consolidated Financial Statements for a description of our equity compensation plans.
The following table shows dividends declared and paid for the periods indicated:
2017 2016
Dividends Dividends Dividends Dividendsdeclared paid declared paid
First Quarter $ 0.23 $ 0.23 $ 0.22 $ 0.22Second Quarter 0.23 0.23 0.22 0.22Third Quarter — 0.23 0.22 0.22Fourth Quarter 0.48 0.23 0.23 0.22
We paid four dividends during 2017. Due to timing, we declared two dividends during the fourth quarter of 2017, one at 23 centsper share and one at 25 cents per share. While subsequent dividends will be subject to board approval, we expect to pay a regularquarterly dividend of 25 cents per share in 2018.
Any determination to pay dividends in the future will be at the discretion of our board of directors and will be dependent upon ourresults of operations, financial condition, contractual restrictions, restrictions imposed by applicable law, and other factorsdeemed relevant by the board of directors. Future indebtedness and loan facilities could also prohibit or restrict our ability to paydividends and make distributions to our shareholders.
Subject to applicable law, we may repurchase shares at prevailing market prices directly on the open market or in privatelynegotiated transactions in amounts that we deem appropriate.
We had an ongoing authorization, originally approved by our board of directors in September 2010, and subsequently amended, torepurchase up to $1.0 billion in shares of our outstanding common stock. The authorization expired on December 31, 2017. OnDecember 8, 2017, the board of directors approved a new share repurchase program that authorizes the company to repurchase up
Morningstar, Inc. 2017 Annual Report 57
Part II
Item 5. Market for Registrant’s Common Equity, Related Stockholder Matters and IssuerPurchases of Equity Securities
Issuer Purchases of Equity Securities
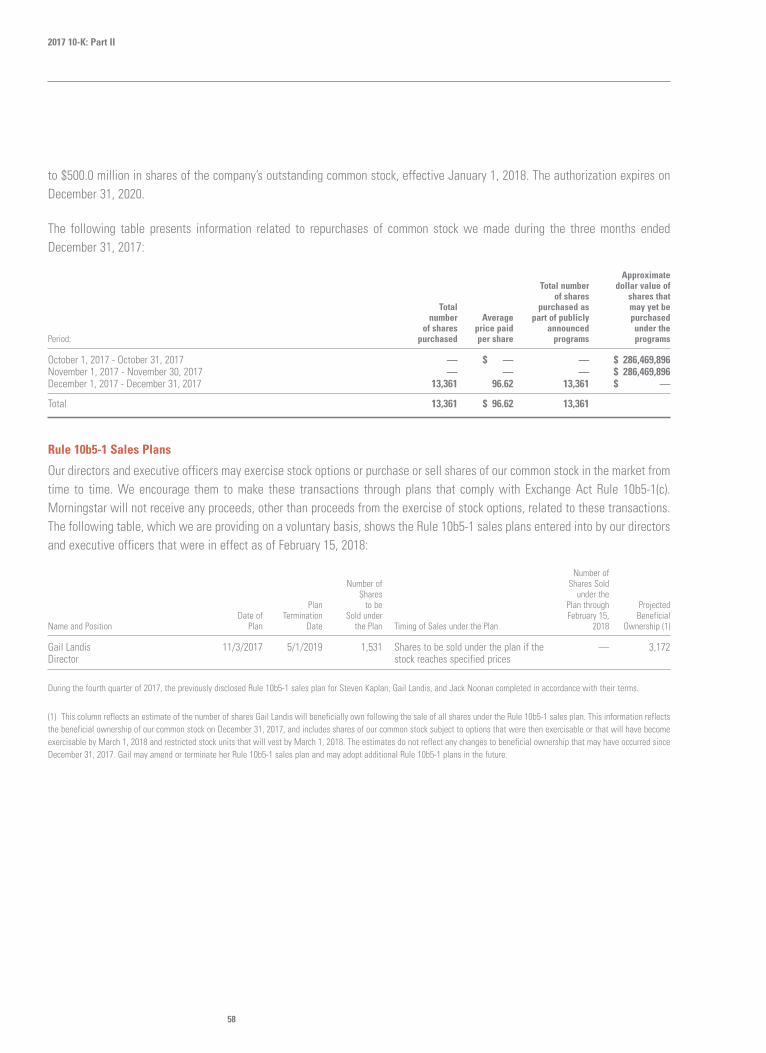
58
2017 10-K: Part II
to $500.0 million in shares of the company’s outstanding common stock, effective January 1, 2018. The authorization expires onDecember 31, 2020.
The following table presents information related to repurchases of common stock we made during the three months endedDecember 31, 2017:
ApproximateTotal number dollar value of
of shares shares thatTotal purchased as may yet be
number Average part of publicly purchasedof shares price paid announced under the
Period: purchased per share programs programs
October 1, 2017 - October 31, 2017 — $ — — $ 286,469,896November 1, 2017 - November 30, 2017 — — — $ 286,469,896December 1, 2017 - December 31, 2017 13,361 96.62 13,361 $ —
Total 13,361 $ 96.62 13,361
Our directors and executive officers may exercise stock options or purchase or sell shares of our common stock in the market fromtime to time. We encourage them to make these transactions through plans that comply with Exchange Act Rule 10b5-1(c).Morningstar will not receive any proceeds, other than proceeds from the exercise of stock options, related to these transactions.The following table, which we are providing on a voluntary basis, shows the Rule 10b5-1 sales plans entered into by our directorsand executive officers that were in effect as of February 15, 2018:
Number ofNumber of Shares Sold
Shares under thePlan to be Plan through Projected
Date of Termination Sold under February 15, BeneficialName and Position Plan Date the Plan Timing of Sales under the Plan 2018 Ownership (1)
Gail Landis 11/3/2017 5/1/2019 1,531 Shares to be sold under the plan if the — 3,172Director stock reaches specified prices
During the fourth quarter of 2017, the previously disclosed Rule 10b5-1 sales plan for Steven Kaplan, Gail Landis, and Jack Noonan completed in accordance with their terms.
(1) This column reflects an estimate of the number of shares Gail Landis will beneficially own following the sale of all shares under the Rule 10b5-1 sales plan. This information reflectsthe beneficial ownership of our common stock on December 31, 2017, and includes shares of our common stock subject to options that were then exercisable or that will have becomeexercisable by March 1, 2018 and restricted stock units that will vest by March 1, 2018. The estimates do not reflect any changes to beneficial ownership that may have occurred sinceDecember 31, 2017. Gail may amend or terminate her Rule 10b5-1 sales plan and may adopt additional Rule 10b5-1 plans in the future.
58
Rule 10b5-1 Sales Plans

59
The selected historical financial data shown below should be read in conjunction with Management’s Discussion and Analysis ofFinancial Condition and Results of Operations and our Consolidated Financial Statements and related notes included elsewhere inthis Annual Report on Form 10-K. We have derived our Consolidated Statements of Income Data and Consolidated Cash Flow Datafor the years ended December 31, 2017, 2016, and 2015 and Consolidated Balance Sheet Data as of December 31, 2017 and 2016from our audited Consolidated Financial Statements included elsewhere in this Annual Report on Form 10-K. The ConsolidatedStatements of Income Data and Consolidated Cash Flow Data for the years ended December 31, 2014 and 2013 and ConsolidatedBalance Sheet Data as of December 31, 2015, 2014, and 2013 were derived from our audited Consolidated Financial Statementsthat are not included in this Annual Report on Form 10-K.
(in millions except per share amounts) 2013 2014 2015 2016 2017
Revenue $ 698.3 $ 760.1 $ 788.8 $ 798.6 $ 911.7Operating expense 527.6 654.5 (1) 598.2 617.8 741.9
Operating income 170.7 105.6 (1) 190.6 180.8 169.8Non-operating income, net 7.3 8.4 3.1 44.1 (2) 11.3 (2)
Income before income taxes and equity in net income of unconsolidatedentities 178.0 114.0 193.7 224.9 181.1
Equity in net income (loss) of unconsolidated entities 1.4 — 1.8 (0.2) (1.3)Income tax expense 56.0 35.7 62.7 63.7 42.9
Consolidated net income 123.4 78.3 132.8 161.0 136.9Net (income) loss attributable to noncontrolling interests 0.1 — (0.2) — —
Net income attributable to Morningstar, Inc. $ 123.5 $ 78.3 $ 132.6 $ 161.0 $ 136.9
Net income per share attributableto Morningstar, Inc.:
Basic:Continuing operations $ 2.68 $ 1.75 $ 3.00 $ 3.74 $ 3.21
Diluted:Continuing operations $ 2.66 $ 1.74 $ 3.00 $ 3.72 $ 3.18
Dividends per common share:Dividends declared per common share $ 0.545 $ 0.700 $ 0.790 $ 0.890 $ 0.940Dividends paid per common share $ 0.375 $ 0.680 $ 0.760 $ 0.880 $ 0.920
Weighted average common shares outstanding:Basic 46.2 44.7 44.2 43.0 42.7Diluted 46.5 44.9 44.3 43.3 43.0
Morningstar, Inc. 2017 Annual Report 59
Item 6. Selected Financial Data
Consolidated Statements of Income Data

60
2017 10-K: Part II
(in millions) 2013 2014 2015 2016 2017
Cash provided by operating activities $ 192.6 $ 136.6 (1) $ 241.5 $ 213.7 $ 250.1Capital expenditures (33.6) (58.3) (57.3) (62.8) (66.6)
Free cash flow (3) $ 159.0 $ 78.3 (1) $ 184.2 $ 150.9 $ 183.5
Cash provided by (used for) investing activities (4) $ (14.9) $ (31.2) $ (79.5) $ (274.2) $ (60.8)Cash provided by (used for) financing activities (5) $ (172.3) $ (76.1) $ (127.5) $ 123.7 $ (157.5)
As of December 31 (in millions) 2013 2014 2015 2016 2017
Cash, cash equivalents, and investments $ 298.6 $ 224.6 $ 248.6 $ 304.0 $ 353.3Working capital 173.5 97.0 105.5 177.1 206.6Total assets 1,026.8 1,010.3 1,029.0 1,350.9 1,405.7Deferred revenue (6) 149.2 146.0 152.0 179.5 185.5Long-term liabilities 66.0 62.1 84.0 359.2 (7) 277.6 (7)Total equity 691.3 654.4 640.6 696.8 804.9
(1) Operating income and free cash flow for 2014 included a $61.0 million litigation settlement expense and corresponding cash outflow.
(2) Non-operating income in 2016 included a $37.1 million holding gain related to the purchase of the remaining ownership interest in PitchBook, which was previously a minorityinvestment. Non-operating income in 2017 includes a $16.7 million gain related to the sale of HelloWallet.
(3) Free cash flow is considered a non-GAAP financial measure under SEC regulations. We present this measure as supplemental information to help investors better understand trendsin our business results over time. Our management team uses free cash flow to evaluate our business. Free cash flow is not equivalent to any measure required to be reported underGAAP, nor should this data be considered an indicator of liquidity. Moreover, the free cash flow definition we use may not be comparable to similarly titled measures reported by othercompanies.
(4) Cash provided by (used for) investing activities consists primarily of cash used for acquisitions, purchases of investments, net of proceeds from the sale of investments, capitalexpenditures, purchases of equity and cost- method investments, and proceeds from the sale of businesses. The level of investing activities can vary from period to period depending onthe level of activity in these categories. Refer to Item 7—Management’s Discussion and Analysis of Financial Condition and Results of Operations—Liquidity and Capital Resources formore information concerning cash used for investing activities.
(5) Cash provided by (used for) financing activities consists primarily of cash used to repurchase outstanding common stock through our share repurchase program and dividendpayments. These cash outflows are partially offset by proceeds from our revolving credit facility, stock option exercises, and excess tax benefits. Refer to Item 7—Management’sDiscussion and Analysis of Financial Condition and Results of Operations—Liquidity and Capital Resources for more information concerning cash used for financing activities.
(6) We frequently invoice or collect cash in advance of providing services or fulfilling subscriptions for our customers and record these balances as deferred revenue. These amountsrepresent both current and non-current deferred revenue.
(7) Long-term liabilities in 2016 and 2017 includes $250.0 million and $180.0 million of long-term debt, respectively.
60
Consolidated Cash Flow Data
Consolidated Balance Sheet Data

61
The discussion included in this section, as well as other sections of this Annual Report on Form 10-K, contains forward-lookingstatements as that term is used in the Private Securities Litigation Reform Act of 1995. These statements are based on our currentexpectations about future events or future financial performance. Forward-looking statements by their nature address matters thatare, to different degrees, uncertain, and often contain words such as ‘‘may,’’ ‘‘could,’’ ‘‘expect,’’ ‘‘intend,’’ ‘‘plan,’’ ‘‘seek,’’‘‘anticipate,’’ ‘‘believe,’’ ‘‘estimate,’’ ‘‘predict,’’ ‘‘potential,’’ or ‘‘continue.’’ These statements involve known and unknown risksand uncertainties that may cause the events we discuss not to occur or to differ significantly from what we expect. For us, theserisks and uncertainties include, among others:
� liability for any losses that result from an actual or claimed breach of our fiduciary duties;� failing to maintain and protect our brand, independence, and reputation;� failing to differentiate our products and continuously create innovative, proprietary research tools;� failing to respond to technological change, keep pace with new technology developments, or adopt a successful technology
strategy;� trends in the asset management industry, including the increasing popularity of passively managed investment vehicles;� inadequacy in our business continuity program in the event of a material emergency or adverse political or regulatory
developments;� liability related to the storage of personal information related to individuals as well as portfolio and account-level information;� compliance failures, regulatory action, or changes in laws applicable to our investment advisory or credit rating operations;� an outage of our database, technology-based products and services, or network facilities or the movement of parts of our
technology infrastructure to the public cloud;� downturns in the financial sector, global financial markets, and global economy;� the effect of market volatility on revenue from asset-based fees;� the failure of acquisitions and other investments to produce the results we anticipate;� the failure to recruit, develop, and retain qualified employees;� challenges faced by our non-U.S. operations, including the concentration of data and development work at our offshore
facilities in China and India;� liability relating to the acquisition or redistribution of data or information we acquire or errors included therein; and� the failure to protect our intellectual property rights or claims of intellectual property infringement against us.
A more complete description of these risks and uncertainties can be found in Item 1A—Risk Factors of this Annual Report onForm 10-K. If any of these risks and uncertainties materialize, our actual future results may vary significantly from what weexpected. We do not undertake to update our forward-looking statements as a result of new information or future events.
All dollar and percentage comparisons, which are often accompanied by words such as ‘‘increase,’’ ‘‘decrease,’’ ‘‘grew,’’‘‘declined,’’ ‘‘was up,’’ ‘‘was down,’’ ‘‘was flat,’’ or ‘‘was similar’’ refer to a comparison with the same period in the prior yearunless otherwise stated.
Morningstar, Inc. 2017 Annual Report 61
Item 7. Management’s Discussion and Analysis of Financial Condition and Resultsof Operations
62
2017 10-K: Part II
Our mission is to create great products that help investors reach their financial goals. We offer an extensive line of products andservices for individual investors, financial advisors, asset managers, retirement plan providers and sponsors, and institutionalinvestors in the private capital markets. Many of our products are sold through subscriptions or license agreements. As a result,we typically generate recurring revenue.
We generate revenue by selling a variety of investment-related products and services. We sell many of our products and services,including Morningstar Data, Morningstar Advisor Workstation, Morningstar Direct, Morningstar Research, and PitchBook Data,through license agreements. Our license agreements typically range from one to three years. We sell some of our other products,such as Premium Membership service on Morningstar.com, via subscriptions. These subscriptions are mainly offered for aone-year term, although we offer terms ranging from one month to three years. We also sell advertising on our websitesthroughout the world. In our credit ratings business, we generate transaction-based revenue for our ratings on new issues ofcommercial mortgage-backed securities and other structured credits.
Our investment management business has multiple fee structures, which vary by client and region. In general, we seek to receiveasset-based fees for any work we perform that involves managing investments or acting as a subadvisor to investment portfolios.For any individual contract, we may receive flat fees, variable asset-based fees, or a combination of the two. Some of ourcontracts include minimum fee levels that provide us with a flat payment up to a specified asset level, above which we alsoreceive variable asset-based fees. In the majority of our contracts that include variable asset-based fees, we bill clients quarterlyin arrears based on average assets for the quarter. Other contracts may include provisions for monthly billing or billing based onassets as of the last day of the billing period rather than on average assets.
In our Workplace Solutions area, our contracts may include one-time setup fees, technology licensing fees, asset-based fees formanaged retirement accounts, fixed and variable fees for advice and guidance, or a combination of these fee structures. We alsooffer plan sponsor advice and custom target-date consulting arrangements. Fees for these services may be based on the level ofassets under advisement.
For Morningstar Managed Portfolios, we charge asset-based fees, which are based on a tiered schedule that depends on theclient’s account balance.
We invoice some of our clients and collect cash in advance of providing services or fulfilling subscriptions for our customers. Weuse some of this cash to fund our operations and invest in new product development. Deferred revenue is the largest liability onour Consolidated Balance Sheets and, at the end of 2017, totaled $185.5 million (of which $171.3 million was classified as acurrent liability with an additional $14.2 million included in other long-term liabilities). At the end of 2016, the amount of deferredrevenue was $179.5 million (of which $165.4 million was classified as a current liability with an additional $14.1 million includedin other long-term liabilities). We expect to recognize this deferred revenue in future periods as we fulfill the service obligationsunder our subscription, license, and service agreements.
In recent years, our deferred revenue balance has increased at a more moderate rate, partly because we’ve been issuing morequarterly and monthly invoices versus up-front, annual invoices. In addition, as we’ve discontinued some subscription-based
62
Understanding Our Company
Key Business Characteristics
Revenue
Deferred Revenue

63
products, we have less subscription-based revenue contributing to the deferred revenue balance. Our acquisition of PitchBook in2016 also contributed to the increase in deferred revenue.
Our business requires significant investments to create and maintain proprietary software, databases, and content. While thefixed costs of the investments we make in our business are relatively high, the variable cost of adding customers is relatively low.This reflects our business focus on Internet-based platforms and assets under management. At times, we may make investmentsin building our databases and content that cause weaker short-term operating results. During other periods, our profitability mayimprove because we’re able to increase revenue without increasing our cost base at the same rate. When revenue decreases,however, we may not be able to adjust our cost base at a corresponding rate.
We classify our operating expense into separate categories for cost of revenue, sales and marketing, general and administrative,and depreciation and amortization, as described below. We include stock-based compensation expense, as appropriate, in each ofthese categories.
� Cost of revenue. This category includes compensation expense for employees who produce the products and services wedeliver to our customers. For example, this category covers production teams and analysts who write investment researchreports. It also includes compensation expense for programmers, designers, and other employees who develop new productsand enhance existing products. In some cases, we capitalize the compensation costs associated with certain softwaredevelopment projects. This reduces the expense that we would otherwise report in this category. Cost of revenue also includesother expense such as third-party data purchases and data lines.
� Sales and marketing. This category includes compensation expense for our sales teams, product managers, and marketingprofessionals. We also include the cost of advertising, direct mail campaigns, and other marketing and promotion efforts in thiscategory.
� General and administrative. This category includes compensation expense for our management team and other corporatefunctions, including employees in our compliance, finance, human resources, and legal departments. It also includes costs forcorporate systems and facilities.
� Depreciation and amortization. Our capital expenditures are mainly for capitalized software development costs, informationtechnology equipment, and leasehold improvements. We depreciate property and equipment primarily using the straight-linemethod based on the useful lives of the assets, which range from three to seven years. We amortize leasehold improvementsover the lease term or their useful lives, whichever is shorter. We amortize capitalized software development costs over theirestimated economic life, generally three years. We also include amortization related to identifiable intangible assets, which ismainly driven by acquisitions, in this category. We amortize intangible assets using the straight-line method over theirestimated economic useful lives, which range from one to 25 years.
As of December 31, 2017, we had majority-owned operations in 26 countries outside of the United States and included theirresults of operations and financial condition in our consolidated financial statements. We account for certain minority-ownedinvestments, including Morningstar Japan K.K. (MJKK), using the equity method.
Morningstar, Inc. 2017 Annual Report 63
Significant Operating Leverage
Operating Expense
International Operations

64
2017 10-K: Part II
When our analysts evaluate a stock, they focus on assessing the company’s estimated intrinsic value, which is based on estimatedfuture cash flows, discounted to their value in today’s dollars. Our approach to evaluating our own business works the same way.
Our goal is to increase the intrinsic value of our business over time, which we believe is the best way to create value for ourshareholders. We do not make public financial forecasts for our business because we want to avoid creating any incentives for ourmanagement team to make speculative statements about our financial results that could influence our stock price or take actionsthat help us meet short-term forecasts but may not build long-term shareholder value.
We provide three specific measures that can help investors generate their own assessment of how our intrinsic value has changedover time:
� Revenue (including organic revenue);� Operating income (loss); and� Free cash flow
Organic revenue and free cash flow are not measures of performance set forth under GAAP (generally accepted accountingprinciples).
We define organic revenue as consolidated revenue excluding acquisitions, divestitures, and foreign currency translations. Wepresent organic revenue because we believe it helps investors better compare our period-to-period results, and our managementteam uses this measure to evaluate the performance of our business. We exclude revenue from businesses acquired or divestedfrom organic revenue for a period of 12 months after we complete the acquisition or divestiture. Organic revenue is not equivalentto any measure required under GAAP and may not be comparable to similarly titled measures reported by other companies.
We define free cash flow as cash provided by or used for operating activities less capital expenditures. We present free cash flowas supplemental information to help investors better understand trends in our business results over time. Our management teamuses free cash flow to evaluate our business. Free cash flow is not equivalent to any measure required under GAAP and should notbe considered an indicator of liquidity. Moreover, the free cash flow definition we use may not be comparable to similarly titledmeasures reported by other companies.
To evaluate how successful we’ve been in maintaining existing business for products and services that have renewable revenue,we calculate retention and renewal rates using two different methods. For subscription-based products, we calculate a retentionrate based on the number of subscriptions retained during the year as a percentage of the number of subscriptions up for renewal.For products sold through contracts and licenses, we use the contract value method, which is based on tracking the dollar value ofrenewals compared with the total dollar value of contracts up for renewal during the period. We include changes in the contractvalue in the renewal amount, unless the change specifically results from adding a new product that we can identify. We alsoinclude variable-fee contracts in this calculation and use the previous quarter’s actual revenue as the base rate for calculating therenewal percentage. The renewal rate excludes setup and customization fees, migrations to other Morningstar products, andcontract renewals that were pending as of January 31, 2018.
64
How We Evaluate Our Business
65
We monitor developments in the economic and financial information industry on an ongoing basis. We use these insights to helpinform our company strategy, product development plans, and marketing initiatives.
2017 was a strong year for equities. With the bull market in U.S. equities fast approaching its nine-year anniversary, we’ve seen agrowing tendency for diversification outside of the United States. Morningstar’s U.S. Market Index, a broad market benchmark,ended the year with a robust 21.5% gain; however, international equities as a group fared slightly better. Morningstar’s GlobalMarkets ex-U.S. Index finished the year up 28.0%, with the Developed Markets ex-U.S. Index up 25.5% and the Emerging MarketsIndex up almost 36.0%.
The Federal Reserve raised short-term interest rates three times in 2017. However, all bond categories were still able to deliverhealthy returns because the long end of the yield curve was relatively flat in the last year.
Based on Morningstar Asset Flows data, total U.S. mutual fund assets edged up to $18.1 trillion as of December 31, 2017,compared with $15.1 trillion as of December 31, 2016. ETFs continued to increase in popularity relative to traditional mutual funds.The U.S. ETF industry closed out 2017 with $3.4 trillion in assets under management based on Morningstar Asset Flows data, upfrom about $2.5 trillion as of December 2016.
Based on our analysis of fund flow trends, long-term mutual funds and exchange traded products had aggregate net inflows ofabout $680 billion in 2017, up significantly from about $160 billion in 2016, and outpacing the most recent record of $460 billionset in 2014. Net outflows in actively managed mutual funds slowed to $7 billion in 2017 versus $340 billion in 2016. Nevertheless,the overall decline remains consistent with the trend of investor preference for passively managed funds, which experienced over$690 billion in net inflows in 2017.
In addition to industry developments in 2017, there are several longer-term trends we consider relevant to our business, asoutlined below.
In the wake of the financial crisis of 2008 and 2009, regulators have continued to implement new frameworks for financialservices companies globally. Many of these rules relate to financial advisor compensation, fees and expenses, investor disclosure,and the use of hedge funds and alternative investments.
In the United Kingdom, for example, the Retail Distribution Review (RDR), which emphasizes increased regulation of advisory fees,higher professional standards for financial advisors, and ‘‘whole of market’’ investment solutions, became effective in January2013. The RDR also restricted the use of commission payments for products sold to individual investors, although UK regulatorsare reportedly considering changes to this restriction. The UK regulator is monitoring the implementation of RDR and is scheduledto publish a review of its findings in 2019. In addition to the RDR, the UK regulator and Her Majesty’s Treasury (HMT) launched theFinancial Advice Market Review (FAMR) in 2015 in light of concerns that the market for financial advice was not working well forconsumers. FAMR aimed to explore ways in which the government, industry, and regulators could take collective steps tostimulate the development of a market which delivers affordable and accessible financial advice and guidance to everyone.FAMR’s final report, published in March 2016, set out 28 recommendations intended to tackle barriers to consumers accessingadvice. The FCA and HMT will review the outcomes of FAMR in 2019.
Morningstar, Inc. 2017 Annual Report 65
The Year 2017 in Review
Longer-Term Trends and Regulatory Environment

66
2017 10-K: Part II
In the European Union, the new version of the Markets in Financial Instruments Directive, also known as MiFID II, becameeffective in January 2018. The main provisions include, among other things, limits on portfolio managers’ use of third-partyresearch, quality and organizational rules regarding the provision of advice, additional governance requirements for themanufacturing and distribution of financial instruments and structured deposits, requirements for firms to provide clients withdetails of all costs and charges related to their investments, and new rules for disclosing the cumulative effect of costs on investorreturns.
With respect to indexes, European Union Benchmarks Regulation 2016/1011 came into force on June 30, 2016 with a majority ofits provisions having a compliance date of January 1, 2018. The principal objective of the Regulation is to ensure benchmarks usedin financial instruments and financial contracts or to measure the performance of investment funds (e.g., a tracking index of a ETF)are free of conflicts of interest, are used appropriately and reflect the actual market or economic reality they are intended tomeasure. This Regulation applies to Morningstar’s index group as a result of making available its indexes to European investableproduct sponsors (e.g., ETF sponsors) as the tracking index for their investable product.
In Australia, in an effort to improve trust and confidence in the financial services industry, the government has announced manyregulatory reforms and inquiries ranging from enhanced enforcement powers for the Australian Securities and InvestmentsCommission (ASIC), new reforms to significantly raise the professional, educational and ethical standards of financial advisors,and a Royal Commission into the alleged misconduct of Australia’s banks and other financial services entities with broad terms ofreference and the potential to impact many aspects of the financial services industry. ASIC has been actively enforcing the Futureof Financial Advice reforms that began in July 2013 with actions against financial advisors who failed to act in the best interest ofclients and a review of the five largest vertically integrated financial institutions and their management of conflicts of interest.The fund management industry also continues to be an area of regulatory reform with the introduction of the Asia Region FundsPassport and Corporate Collective Investment Schemes, the implementation of new costs and fee disclosure for managedinvestment and superannuation funds, and a proposed update and overhaul of regulatory guidance for fund managers.
In the United States, the U.S. Department of Labor (DOL) published a final version of a new fiduciary standard that would expandthe definition of a fiduciary for certain financial advisors who provide advice related to retirement planning. The new rule waspreviously scheduled to go into effect in April 2017. Parts of the rule went into effect in June 2017 but full implementation of therule has been pushed back to July 2019. The SEC is also considering possible rulemaking in this area. In December 2017, the SECreleased its updated agenda of regulatory priorities in 2018 and beyond, which listed rulemaking regarding a PersonalizedInvestment Advice Standard of Conduct (i.e., a fiduciary standard) as being at the shorter-term proposed rulemaking stage.
Despite this uncertainty, we believe recent shifts, such as a greater emphasis on serving investors’ interests and lowering fees,are fundamental changes that will continue. We’ve introduced several new product offerings and bundled solutions to helpfinancial advisors determine, demonstrate, and document that their advice is in the best interest of the investor. We believeMorningstar is well-positioned to help our clients adapt to this new landscape and have had many positive discussions withfinancial advisors and asset managers about the solutions we can provide. In particular, we’ve increased our manager researchcoverage in response to growing demand for information that helps financial advisors show investors the thought process behindtheir investment recommendations.
66

67
The tables below summarize our key product metrics and other supplemental data.
As of December 31,
Our business 2017 2016 2015 2017 Change 2016 Change
Morningstar.com Premium Membership subscriptions (U.S.) 118,462 118,339 120,557 0.1% (1.8)%Morningstar.com average monthly unique users (U.S.) 9,829,527 8,892,203 8,529,792 10.5% 4.2%Advisor Workstation clients (U.S.) 182 175 189 4.0% (7.4)%Morningstar Office licenses (U.S.) 4,330 4,286 4,342 1.0% (1.3)%Morningstar Direct licenses 13,884 12,492 11,428 11.1% 9.3%PitchBook Platform licenses 13,908 9,723 (1) 6,700 (1) 43.0% 45.1%Assets under management and advisement (approximate)
($bil) (2)Workplace Solutions (Retirement)
Managed Accounts (3) 57.6 46.9 40.3 22.8% 16.4%Fiduciary Services (4) 42.5 34.3 30.7 23.9% 11.7%Custom Models 28.0 23.2 18.7 20.7% 24.1%
Workplace Solutions (total) $ 128.1 $ 104.4 $ 89.7 22.7% 16.4%Morningstar Investment Management
Morningstar Managed Portfolios 39.8 30.2 (5) 25.8 (5) 31.8% 17.1%Institutional Asset Management 17.6 (6) 58.0 59.4 (69.7)% (2.4)%Asset Allocation Services 9.5 7.2 7.6 31.9% (5.3)%Manager Selection Services 1.4 1.2 2.1 16.7% (42.9)%
Morningstar Investment Management (total) $ 68.3 $ 96.6 $ 94.9 (29.3)% 1.8%
Average assets under management and advisement ($bil) $ 207.9 $ 192.8 $ 179.9 7.8% 7.2%Number of new-issue ratings completed (7) 97 70 90 38.6% (22.2)%Asset value of new-issue ratings ($bil) (7) $ 39.0 $ 30.7 $ 59.8 27.0% (48.7)%
Our employees (approximate)
Worldwide headcount 4,920 4,550 (8) 3,880 (8) 8.1% 17.3%
Year ended December 31,
Key product and investment area revenue (9) (in millions) 2017 2016 2015 2017 Change 2016 Change
Morningstar Data $ 162.9 $ 152.1 $ 144.5 7.2% 5.3%Morningstar Direct 124.4 110.5 101.7 12.6% 8.7%Morningstar Investment Management 106.0 98.4 98.8 7.7% (0.4)%Morningstar Advisor Workstation 87.3 82.4 81.4 (10) 6.0% 1.2%Workplace Solutions 73.5 71.3 66.6 3.2% (11) 7.0%PitchBook Data 63.6 4.1 — 1,447.9% NMFMorningstar Credit Ratings 31.4 26.4 37.7 18.8% (30.1)%
Revenue by Type (9) 2017 2016 2015 2017 Change 2016 Change
License-based (12) $ 662.9 $ 573.4 $ 552.3 15.6% 3.8%Asset-based (13) 187.3 169.8 163.6 10.3% 3.8%Transaction-based (14) 61.5 55.4 72.9 11.1% (24.1)%
(1) Included for informational purposes only; Morningstar did not acquire full ownership of PitchBook until December 2016.
(2) The asset totals shown above (including assets we either manage directly or for which we provide consulting or subadvisory work) only include assets for which we receive basis-point fees. Some of our client contracts include services for which we receive a flat fee, but we do not include those assets in the total reported above.
Morningstar, Inc. 2017 Annual Report 67
Supplemental Operating Metrics (Unaudited)

68
2017 10-K: Part II
Excluding changes related to new contracts and cancellations, changes in the value of assets under advisement can come from two primary sources: gains or losses related to overalltrends in market performance, and net inflows or outflows caused when investors add to or redeem shares from these portfolios.
Except for Morningstar Managed Portfolios, it’s difficult for our Investment Management business to quantify these cash inflows and outflows. The information we receive from most ofour clients does not separately identify the effect of cash inflows and outflows on asset balances for each period. We also cannot specify the effect of market appreciation or depreciationbecause the majority of our clients have discretionary authority to implement their own portfolio allocations.
(3) Many factors can cause changes in assets under management and advisement for our managed retirement accounts, including employer and employee contributions, planadministrative fees, market movements, and participant loans and hardship withdrawals. The information we receive from the plan providers does not separately identify thesetransactions or the changes in balances caused by market movement.
(4) Formerly Plan Sponsor Advice.
(5) Revised to include assets from South Africa.
(6) Decline due to client losses related to a strategic shift away from our customized investment management offerings to Managed Portfolios.
(7) Includes commercial mortgage-backed securities, residential mortgage-backed securities, other asset-backed securities, and corporate and financial institutions.
(8) Revised to exclude temporary employees and part-time employees who work less than 30 hours a week.
(9) Key product and investment area revenue and revenue by type includes the effect of foreign currency translations.
(10) Revised to exclude Morningstar Office.
(11) Excluding the negative 6.5 percentage point impact of the HelloWallet divestiture, revenue increased by 9.7% for the full year.
(12) License-based revenue includes Morningstar Data, Morningstar Direct, Morningstar Advisor Workstation, Morningstar Enterprise Components, Morningstar Research, PitchBookData, and other similar products.
(13) Asset-based revenue includes Morningstar Investment Management, Workplace Solutions, and Morningstar Indexes.
(14) Transaction-based revenue includes Morningstar Credit Ratings, Internet advertising sales, and Conferences.
68

69
Key Metrics (in millions) 2017 2016 2015 2017 Change 2016 Change
Revenue $ 911.7 $ 798.6 $ 788.8 14.2% 1.2%Operating income $ 169.8 $ 180.8 $ 190.6 (6.0)% (5.2)%Operating margin 18.6% 22.6% 24.2% (4.0) pp (1.6) pp
Cash used for investing activities $ (60.8) $ (274.2) $ (79.5) (77.8)% 244.9%Cash provided by (used for) financing activities $ (157.5) $ 123.7 $ (127.5) (227.3)% 197.0%
Cash provided by operating activities $ 250.1 $ 213.7 $ 241.5 17.0% (11.5)%Capital expenditures (66.6) (62.8) (57.3) 6.1% 9.6%
Free cash flow $ 183.5 $ 150.9 $ 184.2 21.6% (18.1)%
pp—percentage points
We define free cash flow as cash provided by or used for operating activities less capital expenditures. Please refer to the discussion in How We Evaluate our Business for more detail.
(in millions) 2017 2016 2015 2017 Change 2016 Change
Consolidated revenue $ 911.7 $ 798.6 $ 788.8 14.2% 1.2%
In 2017 and 2016, our consolidated revenue rose 14.2% and 1.2%, respectively. Our acquisition of PitchBook Data, Inc. (PitchBook)in December 2016 contributed $57.2 million of revenue growth during 2017. Foreign currency movements had no net materialimpact on revenue in 2017 and reduced revenue by $9.5 million in 2016.
We experienced strong revenue growth across all revenue types during 2017.
License-based revenue grew 15.6% during 2017. We experienced stronger growth rates for license-based products such asMorningstar Direct and Morningstar Data. Revenue from Morningstar Direct was the biggest contributor to growth in both 2017and 2016, with revenue increasing by $13.9 million in 2017 and $8.8 million in 2016. The number of licenses for Morningstar Directincreased to 13,884 worldwide at the end of 2017, compared with 12,492 at the end of 2016 and 11,428 at the end of 2015, withmodest growth in both the United States and internationally. Growth in Morningstar Direct reflects additional licenses for bothnew and existing clients.
Morningstar Data revenue increased $10.9 million in 2017, mainly reflecting new contracts and renewals for managed productsdata and our market data business.
Asset-based revenue increased 10.3% during 2017. Morningstar Managed Portfolios and Workplace Solutions were the primarydrivers of the increase. The asset-based fees we earn are generally based on average asset levels during each quarter. Averageassets under management and advisement (calculated based on available average quarterly or monthly data) were approximately$207.9 billion in 2017, compared with $192.8 billion in 2016 and $179.9 billion in 2015.
Morningstar, Inc. 2017 Annual Report 69
Consolidated Results
Consolidated Revenue

70
2017 10-K: Part II
Transaction-based revenue grew 11.1% during 2017. Revenue from Morningstar Credit Ratings (our structured credit ratingsbusiness) increased $5.0 million during the year, primarily due to new-issue growth in asset-backed securities partially offset by aslight decrease in ratings on commercial mortgage-backed securities.
Some of the main contributors to the 2016 revenue increase were Morningstar Direct, Morningstar Data, and WorkplaceSolutions. Positive results for these products were partially offset by decreases in Morningstar Credit Ratings and Internetadvertising sales on Morningstar.com.
In December 2016, we acquired the remaining interest in PitchBook, which contributed $4.1 million of revenue during theone-month period that PitchBook was included in our consolidated results for 2016.
To make it easier to compare our results in different periods, we provide information about organic revenue, which reflects ourunderlying business excluding acquisitions, divestitures, and the effect of foreign currency translations. In 2017, we divestedHelloWallet and did not make any acquisitions. During 2016, we acquired Requisight, LLC (RightPond), InvestSoft Technology, Inc.(InvestSoft), and PitchBook Data, Inc. (PitchBook). We did not divest any businesses in 2016.
We exclude revenue from acquired businesses from our organic revenue growth calculation for a period of 12 months after wecomplete the acquisition. Contribution from PitchBook was treated as acquired revenue through November 2017 and wasincorporated into organic growth statistics after December 1, 2017. For divestitures, we exclude revenue in the prior period forwhich there is no comparable revenue in the current period. Because HelloWallet was divested in the second quarter of 2017, weexcluded HelloWallet’s last six months of 2016 revenue from our organic revenue growth calculation.
In 2017, we had $57.5 million in incremental revenue from acquisitions, primarily from PitchBook. Revenue in 2016 included$4.4 million of revenue from HelloWallet, which we divested in the second quarter of 2017, and that did not recur in the secondhalf of 2017. In addition, foreign currency translations had no net material impact on revenue in 2017. Excluding acquisitions,divestitures, and foreign currency translations, organic revenue was up 7.6% in 2017.
In 2016, we had $5.5 million in incremental revenue from acquisitions, primarily from PitchBook. In addition, foreign currencytranslations reduced revenue by about $9.5 million in 2016, mainly because of the weaker British pound and Canadian dollar.Excluding acquisitions, divestitures, and foreign currency translations, organic revenue was up 1.7% in 2016.
70
Organic revenue
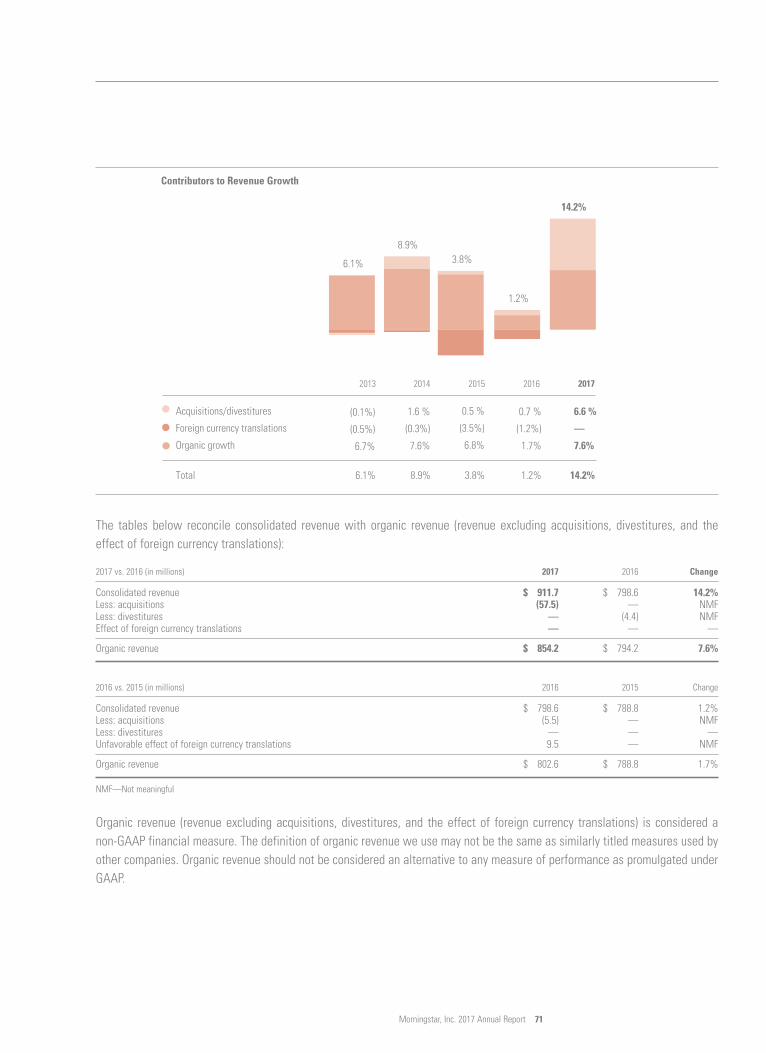
8MAR201808292195
71
Contributors to Revenue Growth
(0.1%)
(0.5%)
6.7%
Acquisitions/divestitures
Foreign currency translations
Organic growth
6.1%
0.7 %
(1.2%)
1.7%
6.6 %
—
7.6%
1.2% 14.2%
1.6 %
(0.3%)
7.6%
8.9%Total
8.9%
6.1%
1.2%
14.2%
0.5 %
(3.5%)
6.8%
3.8%
3.8%
2015 2016 201720142013
The tables below reconcile consolidated revenue with organic revenue (revenue excluding acquisitions, divestitures, and theeffect of foreign currency translations):
2017 vs. 2016 (in millions) 2017 2016 Change
Consolidated revenue $ 911.7 $ 798.6 14.2%Less: acquisitions (57.5) — NMFLess: divestitures — (4.4) NMFEffect of foreign currency translations — — —
Organic revenue $ 854.2 $ 794.2 7.6%
2016 vs. 2015 (in millions) 2016 2015 Change
Consolidated revenue $ 798.6 $ 788.8 1.2%Less: acquisitions (5.5) — NMFLess: divestitures — — —Unfavorable effect of foreign currency translations 9.5 — NMF
Organic revenue $ 802.6 $ 788.8 1.7%
NMF—Not meaningful
Organic revenue (revenue excluding acquisitions, divestitures, and the effect of foreign currency translations) is considered anon-GAAP financial measure. The definition of organic revenue we use may not be the same as similarly titled measures used byother companies. Organic revenue should not be considered an alternative to any measure of performance as promulgated underGAAP.
Morningstar, Inc. 2017 Annual Report 71

72
2017 10-K: Part II
Year ended December 31
(in millions) 2017 2016 2015 2017 Change 2016 Change
United States $ 687.0 $ 590.5 $ 585.1 16.3% 0.9%
United Kingdom 64.7 61.1 64.2 5.9% (4.8)%Continental Europe 69.9 62.6 58.8 11.7% 6.5%Australia 34.6 32.2 30.5 7.5% 5.6%Canada 29.4 28.2 27.9 4.3% 1.1%Asia 21.2 20.0 18.5 6.0% 8.1%Other 4.9 4.0 3.8 22.5% 5.3%
Total International 224.7 208.1 203.7 8.0% 2.2%
Consolidated revenue $ 911.7 $ 798.6 $ 788.8 14.2% 1.2%
International revenue made up about 25% of our consolidated revenue in 2017, compared with 26% in both 2016 and 2015. About60% of our international revenue is from Continental Europe and the United Kingdom. We also have a fairly large revenue base inAustralia and Canada.
Revenue from international operations increased $16.6 million, or 8.0%, in 2017 and international organic revenue increased8.0%.
In 2016, revenue from international operations increased 2.2% and international organic revenue increased 6.8%.
The tables below present a reconciliation from international revenue to international organic revenue (international revenueexcluding acquisitions, divestitures, and the effect of foreign currency translations):
2017 vs. 2016 (in millions) 2017 2016 Change
International revenue $ 224.7 $ 208.1 8.0%Less: acquisitions — — —Less: divestitures — — —Effect of foreign currency translations — — —
International organic revenue $ 224.7 $ 208.1 8.0%
2016 vs. 2015 (in millions) 2016 2015 Change
International revenue $ 208.1 $ 203.7 2.2%Less: acquisitions — — —Less: divestitures — — —Unfavorable effect of foreign currency translations 9.5 — NMF
International organic revenue $ 217.6 $ 203.7 6.8%
International revenue as a percentage of consolidated revenue has been relatively flat the past few years, partly reflectingnegative effects of foreign currency translations.
International organic revenue (international revenue excluding acquisitions, divestitures, and the effect of foreign currencytranslations) is considered a non-GAAP financial measure. The definition of international organic revenue we use may not be the
72
Revenue by region

15MAR201805162025
73
same as similarly titled measures used by other companies. International organic revenue should not be considered an alternativeto any measure of performance as promulgated under GAAP.
As discussed in How We Evaluate Our Business, we calculate retention and renewal rates to help measure how successful we’vebeen in maintaining existing business for products and services that have renewable revenue. The graph below illustrates thesetwo metrics over the past five years:
Renewal(contract-based products)
Retention(subscription-based products)
Retention and Renewal Rates
2013
71%
96%
2014
95%
2013
94%
2016
67%
2015 2016 2017
102%
2017
99%
20152014
69% 66% 66%
For contract-based products and services (such as Morningstar Data including PitchBook, Investment Advisory services,Morningstar Direct, and Morningstar Advisor Workstation), we estimate that our weighted average annual renewal rate wasapproximately 102% in 2017, compared with 96% in 2016. The increase mainly reflects higher renewal rates for some largerproducts, including Morningstar Direct, Morningstar Investment Management, Workplace Solutions, Morningstar Research, andPitchBook. The figure for contract-based products includes the effect of price changes; increasing client bases upon contractrenewal; changes to the contract value upon renewal (such as increased users); and changes in the value of variable-fee contracts.These factors, therefore, can lead to a renewal rate percentage over 100%.
In 2017, we estimate that our annual retention rate for subscription-based products, including Morningstar.com’s PremiumMembership service, Morningstar Office, and newsletter products, was approximately 66%, which was unchanged from 2016.
Retention and Renewal Rates
Morningstar, Inc. 2017 Annual Report 73

74
2017 10-K: Part II
(in millions) 2017 2016 2015 2017 Change 2016 Change
Cost of revenue $ 386.6 $ 344.3 $ 330.1 12.3% 4.3%% of revenue 42.4% 43.1% 41.9% (0.7) pp 1.2 pp
Sales and marketing 134.3 97.6 96.6 37.6% 1.0%% of revenue 14.7% 12.2% 12.2% 2.5 pp — pp
General and administrative 129.8 105.2 107.1 23.3% (1.7)%% of revenue 14.2% 13.2% 13.6% 1.0 pp (0.4) pp
Depreciation and amortization 91.2 70.7 64.4 28.9% 9.9%% of revenue 10.0% 8.9% 8.2% 1.1 pp 0.7 pp
Total operating expense $ 741.9 $ 617.8 $ 598.2 20.1% 3.3%
% of revenue 81.4% 77.4% 75.8% 4.0 pp 1.6 pp
In 2017, our operating expense was up $124.1 million, or 20.1%. Foreign currency translations reduced our operating expense by$0.6 million in 2017.
Our acquisition of PitchBook contributed $76.0 million of operating expense, primarily for salaries, amortization expense,professional fees, commission expense, and management bonus expense during the year. PitchBook expenses exceeded revenuein 2017, primarily due to $10.6 million of deal-related intangible amortization and $7.9 million of vesting of performance shareawards associated with the acquisition. PitchBook also had $4.6 million of capitalized labor during 2017.
The remaining increase was primarily a result of higher compensation expense (including salaries, bonus, and other company-sponsored benefits), depreciation expense, professional fees, and production expense, which includes third-party data andinfrastructure hosting.
Excluding PitchBook, compensation expense (including salaries and other company-sponsored benefits) increased $16.2 million in2017. Bonus expense also increased $14.5 million in 2017. Bonus expense was higher due to stronger performance against ourinternal targets.
Depreciation expense in 2017 includes a $4.1 million impairment charge for certain software licenses due to a shift toward acloud-based strategy.
Partially offsetting our total operating expense increase was an increase in internally developed capitalized software. We haveaccelerated development of our major software platforms, resulting in an increase in capitalized software development, whichreduced operating expense. In 2017, we capitalized $41.7 million, which excludes the PitchBook capitalized labor noted above,associated with software development activities, mainly related to Morningstar Data, Workplace Solutions, and additionalenhancements to reporting, financial planning, and other capabilities in our products. In comparison, we capitalized $28.2 millionof software development expense in 2016.
We had approximately 4,920 employees worldwide at the end of 2017, compared with 4,550 in 2016. This increase reflectscontinued investment in our key growth initiatives, including data operations in India and China and PitchBook in the United Statesand Europe.
74
Consolidated Operating Expense

75
In 2016, our operating expense was up $19.6 million, or 3.3%. Due to the strength of the U.S. dollar, foreign currency translationsreduced our operating expense by $11.5 million in 2016.
Compensation expense (including salaries and other company-sponsored benefits) increased $26.2 million in 2016. We hadapproximately 4,550 employees worldwide at the end of 2016, compared with 3,880 in 2015. This increase reflects continuedinvestment in our key growth initiatives and mainly includes technology, sales, and analyst roles in the United States, India, andChina. The growth in compensation expense was partially offset by a $13.1 million reduction in bonus expense during 2016compared to 2015. Bonus expense was lower mainly because we did not meet our internal targets for revenue growth during2016.
Depreciation expense, professional fees, and production expense also increased during 2016 as we continued to invest in ourbusiness. We have also accelerated development of our major software platforms and therefore had an increase in capitalizedsoftware development, which reduced operating expense.
In 2016, we capitalized $28.2 million of software development expense for ongoing enhancements of key platforms and newdevelopment of upgraded software platforms. In comparison, we capitalized $21.8 million of software development expense in2015.
Sales commission expense decreased $2.8 million in 2016, reflecting declines in new sales closed.
Our acquisition of PitchBook contributed $7.5 million of operating expense, primarily for salaries, professional fees, andamortization expense during the one-month period that PitchBook was included in our consolidated results for 2016.
Cost of revenue is our largest category of operating expense, representing about one-half of our total operating expense. Ourbusiness relies heavily on human capital, and cost of revenue includes the compensation expense for employees who produce ourproducts and services. We include compensation expense for approximately 80% of our employees in this category.
Cost of revenue increased $42.3 million, or 12.3%, in 2017. Our acquisition of PitchBook contributed $14.0 million of operatingexpense in this cost category, primarily for professional fees, salary expense, and capitalized labor during 2017. The remainingincrease was largely due to higher salary expense of $13.6 million, mainly driven by additional headcount. Higher bonus expense,professional fees, and production expense also contributed to the increase in this category.
Partially offsetting these increases was an increase in internally developed capitalized software. We have accelerateddevelopment of our major software platforms, resulting in an increase in capitalized software development, which reducedoperating expense. During 2017, we capitalized $41.7 million, which excludes the PitchBook capitalized labor noted above,associated with software development activities, mainly related to Morningstar Data, Workplace Solutions, and additionalenhancements to reporting, financial planning, and other capabilities in our products. In comparison, we capitalized $28.2 millionin 2016.
Cost of revenue increased $14.2 million in 2016. Higher salary expense of $19.9 million was the largest contributor to the increaseand was mainly driven by additional headcount. Higher company-sponsored benefits and software subscriptions also contributedto the growth in this category.
Morningstar, Inc. 2017 Annual Report 75
Cost of revenue

76
2017 10-K: Part II
Partially offsetting these increases was a $9.1 million decrease in bonus expense, as well as an increase in capitalized softwaredevelopment. As mentioned above, we capitalized $28.2 million associated with software development activities in 2016,compared with $21.8 million included in 2015.
PitchBook contributed $1.3 million of operating expense in this cost category, primarily for salary expense during the one-monthperiod that PitchBook was included in our consolidated results for 2016.
As a percentage of revenue, cost of revenue decreased 0.7 percentage points in 2017 and increased 1.2 percentage points in2016.
Sales and marketing expense increased $36.7 million, or 37.6%, in 2017. Our acquisition of PitchBook contributed $34.9 million ofoperating expense in this cost category, primarily for salary and sales commission expense in 2017.
The remaining increase was due to an increase in sales commission expense of $3.7 million, partially offset by decreases incompensation expense (including salaries and other company-sponsored benefits), advertising and marketing spend, andprofessional fees.
Sales and marketing expense increased $1.0 million in 2016, reflecting a $2.7 million increase in compensation expense (includingsalaries and other company-sponsored benefits) and a $1.0 million increase in advertising and marketing spend. Partly offsettingthese increases were decreases in sales commission expense of $1.9 million and bonus expense of $1.0 million.
Our acquisition of PitchBook contributed $2.7 million during the one-month period that PitchBook was included in our consolidatedresults for 2016.
As a percentage of revenue, sales and marketing expense increased 2.5 percentage points in 2017 and was unchanged in 2016compared to 2015.
General and administrative expense increased $24.6 million, or 23.3%, during 2017. Our acquisition of PitchBook contributed$16.1 million of operating expense in this cost category, primarily for management bonus plan expense and salary expense during2017. Bonus expense, software subscriptions, and rent expense contributed to the remaining increase in 2017.
General and administrative expense decreased $1.9 million in 2016, mainly because of a $3.0 million decline in bonus expenseand a $2.0 million decline in stock-based compensation expense. Partially offsetting these decreases was an increase of$3.8 million in professional fees in connection with legal and compliance and other company initiatives. Compensation expense(including salaries and other company-sponsored benefits) also increased $0.9 million.
PitchBook contributed $2.5 million in 2016, primarily for salary expense, professional fees, and management bonus plan expenseduring the one-month period that PitchBook was included in our consolidated results for 2016.
General and administrative expense as a percentage of revenue was up 1.0 percentage points in 2017 and down 0.4 percentagepoints in 2016.
76
Sales and marketing
General and administrative

77
Overall, depreciation and amortization increased $20.5 million, or 28.9%, in 2017 and $6.3 million, or 9.9%, in 2016.
Our acquisition of PitchBook contributed $11.0 million of operating expense in this cost category in 2017 and $0.9 million in 2016,primarily for intangible amortization expense related to the acquisition.
Depreciation expense rose $16.3 million in 2017, mainly driven by depreciation expense related to capitalized softwaredevelopment and computer equipment incurred over the past several years. Depreciation expense during 2017 also includes a$4.1 million impairment charge for certain software licenses due to a shift toward a cloud- based strategy. Intangible amortizationexpense increased $4.2 million in 2017 due to additional amortization expense for the intangible assets of PitchBook offset bycertain intangible assets from some previous acquisitions that are now fully amortized.
Depreciation expense rose $8.9 million in 2016, mainly driven by higher capital expenditures for computer equipment andadditional depreciation expense for capitalized software development. Intangible amortization expense decreased $2.6 million in2016 as certain intangible assets from some previous acquisitions are now fully amortized.
We expect that amortization of intangible assets will be an ongoing cost. We estimate that this expense will total approximately$20.7 million in 2018. Our estimates of future amortization expense for intangible assets may be affected by additionalacquisitions, divestitures, changes in the estimated average useful lives, and foreign currency translation.
(in millions) 2017 2016 2015
Operating income $ 169.8 $ 180.8 $ 190.6% change (6.0)% (5.2)% 80.5%. . . . . . . . . . . . . . . . . . . . . . . . . . . . . . . . . . . . . . . . . . . . . . . . . . . . . . . . . . . . . . . . . . . . . . . . . . . . . . . . . . . . . . . . . . . . . . . . . . . . . . . . . . . . . . . . . . . . . . . . . . . . . . . . . . . . . . . . . . . . . . . . . . . . . . . . . . . . . . . . . . . . . . . . . . .
Operating margin 18.6% 22.6% 24.2%Change (4.0) pp (1.6) pp 10.3 pp
Consolidated operating income decreased $11.0 million in 2017 as revenue increased $113.1 million and operating expenseincreased $124.1 million. Operating margin was 18.6%, down 4.0 percentage points compared with 2016.
Morningstar, Inc. 2017 Annual Report 77
Depreciation and amortization
Consolidated Operating Income and Operating Margin

8MAR201806504244
78
Consolidated operating income decreased $9.8 million in 2016 as revenue increased $9.8 million and operating expense increased$19.6 million. Operating margin was 22.6%, down 1.6 percentage points compared with 2015.
Key Metrics ($mil)
Operating income
Consolidated revenue
Free cash flow
10,0554,773 6,134 7,388
169.8
911.7
183.5
180.8
798.6
150.9
105.6
760.1
78.3
170.7
698.3
159.0
8,514
190.6
788.8
184.2
Free cash flow 159.0 183.5
*
*
*Operating income and free cash flow for 2014 include a $61.0 million litigation settlement expense and corresponding cash outflow.
2015 2016 201720142013
We reported adjusted operating income, which excludes PitchBook, of $182.2 million in 2017 and $184.1 million for 2016.Adjusted operating income is a non-GAAP measure; the table below shows a reconciliation to the comparable GAAP measure.
($000) 2017 2016 2015 2017 Change 2016 Change
Operating income $ 169.8 $ 180.8 $ 190.6 (6.0)% (5.2)%Add back: management bonus plan expense 7.9 0.6 — NMF —Add back: intangible amortization expense 10.6 0.9 — NMF —Deduct: capitalized labor benefit (4.6) — — NMF —Add back (deduct): other operating (income) loss, net for PitchBook (1.5) 1.8 — NMF —
Adjusted operating income $ 182.2 $ 184.1 $ 190.6 (1.1)% (3.4)%
We present adjusted operating income (operating income excluding PitchBook) to show the effect of this acquisition, to betterreflect period-over-period comparisons, and improve overall understanding of our current and future financial performance.
2017 10-K: Part II
78

79
We reported an adjusted operating margin, which excludes PitchBook, of 21.5% in 2017 and 23.2% in 2016. Adjusted operatingmargin is a non-GAAP measure; the table below shows a reconciliation to the comparable GAAP measure.
($000) 2017 2016 2015 2017 Change 2016 Change
Operating margin 18.6% 22.6% 24.2% (4.0) pp (1.6) ppAdd back: management bonus plan expense 0.7% 0.1% —% 0.6 pp 0.1 ppAdd back: intangible amortization expense 1.1% 0.1% —% 1.0 pp 0.1 ppDeduct: capitalized labor benefit (0.2)% —% —% (0.2) pp — ppAdd back (deduct): other operating (income) loss, net for PitchBook 1.3% 0.4% —% 0.9 pp 0.4 pp
Adjusted operating margin 21.5% 23.2% 24.2% (1.7) pp (1.0) pp
We present adjusted operating margin (operating margin excluding PitchBook) to show the effect of this acquisition, better reflectperiod-over-period comparisons, and improve overall understanding of our current and future financial performance.
The following table presents the components of non-operating income, net:
(in millions) 2017 2016 2015
Interest income $ 1.9 $ 1.8 $ 1.8Interest expense (5.5) (1.5) (0.5)Gain on sale of investments, net 3.2 0.6 0.6Gain on sale of business 16.7 — —Holding gain upon acquisition of additional ownership of equity-method investments — 37.1 —Other income (expense), net (5.0) 6.1 1.2
Non-operating income, net $ 11.3 $ 44.1 $ 3.1
Interest income mainly reflects interest from our investment portfolio. Interest expense mainly relates to the outstanding principalbalance of the credit facility we established in 2014. Gain on sale of business relates to our sale of HelloWallet in June 2017.
Non-operating income in 2016 includes the $37.1 million gain we recorded with the purchase of the remaining ownership interestin PitchBook, which was previously a minority investment.
Other income (expense), net primarily includes foreign currency exchange gains and losses arising from resulting from U.S. dollardenominated short-term investments held in non-U.S. jurisdictions.
(in millions) 2017 2016 2015
Equity in net income (loss) of unconsolidated entities $ (1.3) $ (0.2) $ 1.8
Equity in net income (loss) of unconsolidated entities primarily reflects income from Morningstar Japan K.K. (MJKK) offset bylosses in our other equity method investments.
Non-Operating Income, Equity in Net Income (Loss) of Unconsolidated Entities, and EffectiveTax Rate and Income Tax Expense
Non-Operating Income
Equity in Net Income (Loss) of Unconsolidated Entities
Morningstar, Inc. 2017 Annual Report 79
80
2017 10-K: Part II
We describe our investments in unconsolidated entities in more detail in Note 9 of the Notes to our Consolidated FinancialStatements.
The following table summarizes the components of our effective tax rate:
(in millions) 2017 2016 2015
Income before income taxes and equity in net income (loss) of unconsolidated entities $ 181.1 $ 224.9 $ 193.7Equity in net income (loss) of unconsolidated entities (1.3) (0.2) 1.8Net income attributable to the noncontrolling interest — — (0.2)
Total $ 179.8 $ 224.7 $ 195.3
Income tax expense $ 42.9 $ 63.7 $ 62.7Effective tax rate 23.9% 28.3% 32.1%
On December 22, 2017, the United States enacted tax reform legislation that included a broad range of business tax provisions,including but not limited to a reduction in the U.S. federal tax rate from 35% to 21% as well as provisions that limit or eliminatevarious deductions or credits. The legislation also causes U.S. allocated expenses (e.g. interest and general administrativeexpenses) to be taxed and imposes a new tax on U.S. cross-border payments. Furthermore, the legislation includes a one-timetransition tax on accumulated foreign earnings and profits.
In response to the enactment of U.S. tax reform, the SEC issued guidance to address the complexity in accounting for this newlegislation. When the initial accounting for items under the new legislation is incomplete, the guidance allows us to recognizeprovisional amounts when reasonable estimates can be made or to continue to apply the prior tax law if a reasonable estimate ofthe impact cannot be made. The SEC has provided up to a one-year window for companies to finalize the accounting for theimpacts of this new legislation and we anticipate finalizing our accounting during 2018.
While our accounting for the new U.S. tax legislation is not complete, we have made reasonable estimates for some provisionsand recognized a $10.6 million discrete net tax benefit in our 2017 Consolidated Financial Statements. This net benefit is primarilycomprised of a $14.7 million provisional deferred tax benefit from revaluing our net U.S. deferred tax liabilities to reflect the newU.S. corporate tax rate. We have also recorded a provisional tax charge of $7.5 million payable over 8 years. This tax expense isoffset by the provisional tax benefit of a $6.4 million reduction of a deferred tax liability previously recorded for our foreign equitymethod investments. We have also recorded a provisional expense of $3.0 million for the establishment of a deferred tax liabilityrelated to changes in our indefinite reinvestment assertion. However, as of the date of this Form 10-K, we are evaluating theaccounting impacts of the legislation. As part of our evaluation, we will continue to assemble and analyze all of the informationrequired to quantify the effects of the legislation. The ultimate impact may differ from these provisional amounts, possiblymaterially, due to, among other things, additional analysis, changes in interpretations and assumptions we have made, additionalregulatory guidance that may be issued, and actions we may take. See Note 14 of the Notes to our Consolidated FinancialStatements for further details on the impacts of U.S. tax reform.
For a reconciliation of the U.S. federal tax rate to our effective income tax rate, refer to Note 14 of the Notes to our ConsolidatedFinancial Statements.
Our effective tax rate in 2017 was 23.9%, a decrease of 4.4 percentage points compared with 28.3% in 2016, primarily because ofthe provisional tax impacts of the new U.S. tax legislation detailed above.
80
Effective Tax Rate and Income Tax Expense
U.S. Tax Reform

8MAR201806503929
81
Our effective tax rate in 2016 was 28.3%, a decrease of 3.8 percentage points compared with 32.1% in 2015, mainly because the$37.1 million holding gain recorded in connection with the December 2016 purchase of the remaining ownership interest inPitchBook was not taxable.
As of December 31, 2017, we had cash, cash equivalents, and investments of $353.3 million, up $49.3 million from the end of2016. The increase reflects cash provided by operating activities and proceeds of $23.7 million related to the sale of HelloWallet.These items were partially offset by $70.0 million of repayments of long-term debt, $66.6 million of capital expenditures, and$42.3 million used to repurchase common stock under our share repurchase program, of which $0.7 million was repurchased in thefourth quarter of 2016 but settled and paid early in the first half of 2017. Dividends paid of $39.3 million and purchases of equity-method investments of $24.8 million also offset the cash inflows.
Cash, Cash Equivalents, and Investments ($mil)
Cash and cash equivalents
Investments
% Change
353.3
298.6
224.6
207.1
41.5
10.7%
308.2
45.1
16.2%
304.0
259.1
44.9
22.3%
185.2
39.4
(24.8%)
168.2
130.4
(7.1%)
248.6
2015 2016 201720142013
Cash provided by operating activities is our main source of cash. In 2017, cash provided by operating activities was $250.1 million,reflecting $226.8 million of net income, adjusted for non-cash items and $23.3 million in positive changes from our net operatingassets and liabilities.
In November 2016, we amended our credit agreement to provide us with a three-year credit facility with a borrowing capacity ofup to $300.0 million. We had an outstanding principal balance of $180.0 million as of December 31, 2017, leaving borrowingavailability of $120.0 million. The credit agreement also contains financial covenants under which we: (i) may not exceed amaximum consolidated leverage ratio of 3.00 to 1.00 and (ii) are required to maintain a minimum consolidated interest coverageratio of not less than 3.00 to 1.00. We were in compliance with the financial covenants at December 31, 2017.
Morningstar, Inc. 2017 Annual Report 81
Liquidity and Capital Resources

8MAR201806504862
82
2017 10-K: Part II
Short- and Long-Term Debt ($mil)
Short-term debt
Long-term debt
Total
250.0
30.0
35.0
—
35.0
—
250.0
250.0
30.0
—
30.0
—
—
n/a
35.0
180.0
—
180.0
180.0
2015 2016 201720142013
We believe our available cash balances and investments, along with cash generated from operations and our line of credit, will besufficient to meet our operating and cash needs for at least the next 12 months. We invest our cash reserves in cash equivalentsand investments. We maintain a conservative investment policy for our investments. We invest a portion of our investmentbalance (approximately $23.1 million, or 51% of our total investments balance as of December 31, 2017) in stocks, bonds, options,mutual funds, money market funds, or exchange-traded products that replicate the model portfolios and strategies created byMorningstar. These investment accounts may also include exchange-traded products where Morningstar is an index provider.
Approximately 69% of our cash, cash equivalents, and investments as of December 31, 2017 was held by our operations outsidethe United States, down from about 71% as of December 31, 2016.
We intend to use our cash, cash equivalents, and investments for general corporate purposes, including working capital andfunding future growth.
In December 2015, our board of directors approved a $300.0 million increase to our share repurchase program, bringing the totalamount authorized under the program to $1.0 billion. The authorization expired on December 31, 2017. On December 8, 2017, theboard of directors approved a new share repurchase program that authorizes the company to repurchase up to $500.0 million inshares of the company’s outstanding common stock, effective January 1, 2018. The authorization expires on December 31, 2020.
In 2017, we repurchased a total of approximately 0.5 million shares for $41.9 million. As of December 31, 2017, we hadrepurchased a total of 10.6 million shares for $714.8 million since we announced the share repurchase program in September2010.
In 2017, we also paid dividends of $39.3 million. In February 2018, our board of directors declared a quarterly dividend of 25 centsper share. The dividend is payable on April 27, 2018 to shareholders of record as of April 6, 2018. We expect to make regularquarterly dividend payments of 25 cents per share in 2018.
82

83
We expect to continue making capital expenditures in 2018, primarily for computer hardware and software, internally developedsoftware, and leasehold improvements for new and existing office locations. We have commenced migrating our infrastructure tothe cloud. The migration will have some transitional effects on our level of capital expenditures and operating expenses and weexpect to maintain certain redundant infrastructure prior to a full transition.
We also expect to use a portion of our cash and investments balances in the first quarter of 2018 to make annual bonus paymentsof approximately $48.2 million related to the 2017 bonus compared to $38.0 million in 2016.
As described in more detail above, we define free cash flow as cash provided by or used for operating activities less capitalexpenditures. We present free cash flow solely as supplemental disclosure to help investors better understand how much cash isavailable after we spend money to operate our business. Our management team uses free cash flow to evaluate our business.Free cash flow is not a measure of performance set forth under GAAP. Also, the free cash flow definition we use may not becomparable to similarly titled measures used by other companies.
(in millions) 2017 2016 2015 2017 Change 2016 Change
Cash provided by operating activities $ 250.1 $ 213.7 $ 241.5 17.0% (11.5)%Capital expenditures (66.6) (62.8) (57.3) 6.1% 9.6%
Free cash flow $ 183.5 $ 150.9 $ 184.2 21.6% (18.1)%
We generated free cash flow of $183.5 million in 2017, an increase of $32.6 million versus 2016. The change reflects a$36.4 million increase in cash provided by operating activities as well as a $3.8 million increase in capital expenditures.
We generated free cash flow of $150.9 million in 2016, a decrease of $33.3 million versus 2015. The change reflects a$27.8 million decrease in cash provided by operating activities as well as a $5.5 million increase in capital expenditures.
We paid a total of $203.7 million, less cash acquired, related to acquisitions over the past three years. We describe theseacquisitions in Note 7 of the Notes to our Consolidated Financial Statements.
We paid a total of $47.5 million related to purchasing additional investments in unconsolidated entities over the past three years.We describe these investments in Note 9 of the Notes to our Consolidated Financial Statements.
We sold HelloWallet in 2017 and received a total of $23.7 million related to this sale. For more information, please see Note 8 ofthe Notes to our Consolidated Financial Statements.
Morningstar, Inc. 2017 Annual Report 83
Consolidated Free Cash Flow
Acquisitions
Divestitures

84
2017 10-K: Part II
Our discussion and analysis of our financial condition and results of operations are based on our Consolidated FinancialStatements, which have been prepared in accordance with GAAP. We discuss our significant accounting policies in Note 2 of theNotes to our Consolidated Financial Statements. The preparation of financial statements in accordance with GAAP requires ourmanagement team to make estimates and assumptions that affect the reported amounts of assets, liabilities, revenue, expense,and related disclosures included in our Consolidated Financial Statements.
We evaluate our estimates on an ongoing basis. We base our estimates on historical experience and various other assumptionsthat we believe are reasonable. Based on these assumptions and estimates, we make judgments about the carrying values ofassets and liabilities that are not readily apparent from other sources. Our actual results could vary from these estimates andassumptions. If actual amounts are different from previous estimates, we include revisions in our results of operations for theperiod in which the actual amounts become known.
We believe the following critical accounting policies reflect the significant judgments and estimates used in the preparation of ourConsolidated Financial Statements:
Much of our revenue comes from the sale of subscriptions or licenses for data, software, and Internet-based products andservices. We recognize this revenue in equal amounts over the term of the subscription or license, which generally ranges fromone to three years. We also provide research, investment management, retirement advice, and other services. We recognize thisrevenue when the service is provided or during the service obligation period defined in the contract.
We make significant judgments related to revenue recognition, including whether fees are fixed or determinable and whether thecollection of payment is probable. For contracts that combine multiple products and services, we make judgments regarding thevalue of each element in the arrangement based on selling prices of the items when sold separately. Delivery of our products andservices is a prerequisite to the recognition of revenue. If arrangements include an acceptance provision, we begin recognizingrevenue upon the receipt of customer acceptance.
We make judgments at the beginning of an arrangement regarding whether or not collection is probable. We typically sell toinstitutional customers with whom we have a history of successful collections and assess the probability of collection on acase-by-case basis.
Deferred revenue is the amount invoiced or collected in advance for subscriptions, licenses, or services that has not yet beenrecognized as revenue. Deferred revenue is the second largest liability on our Consolidated Balance Sheets and, at the end of2017, totaled $185.5 million (of which $171.3 million was classified as a current liability with an additional $14.2 million includedin other long-term liabilities). We expect to recognize this deferred revenue in future periods as we fulfill our service obligationsunder our subscription, license, and service agreements.
The amount of deferred revenue may increase or decrease based on the mix of contracted products and services and the volume ofnew and renewal subscriptions. The timing of future revenue recognition may change depending on the terms of the licenseagreements and the timing of fulfilling our service obligations. We believe that the estimate related to revenue recognition is acritical accounting estimate, and to the extent that there are material differences between our determination of deferred revenueand actual results, our financial condition or results of operations may be affected.
84
Application of Critical Accounting Policies and Estimates
Revenue Recognition

85
Our financial statements reflect the operations of an acquired business starting from the completion of the transaction. We recordthe estimated fair value of assets acquired and liabilities assumed as of the date of acquisition.
Allocating the purchase price to the acquired assets and liabilities involves management judgment. We base the fair valueestimates on available historical information and on future expectations and assumptions that we believe are reasonable, butthese estimates are inherently uncertain.
Determining the fair value of intangible assets requires significant management judgment in each of the following areas:
� Identify the acquired intangible assets: For each acquisition, we identify the intangible assets acquired. These intangible assetsgenerally consist of customer relationships, trademarks and trade names, technology-related intangibles (including internallydeveloped software and databases), and non-compete agreements.
� Estimate the fair value of these intangible assets: We consider various approaches to value the intangible assets. Theseinclude the cost approach, which measures the value of an asset based on the cost to reproduce it or replace it with anotherasset of like utility; the market approach, which values the asset through an analysis of sales and offerings of comparableassets; and the income approach, which measures the value of an asset based on the present value of the economic benefits itis expected to produce.
� Estimate the remaining useful life of the assets: For each intangible asset, we use judgment and assumptions to establish theremaining useful life of the asset. For example, for customer relationships, we determine the estimated useful life withreference to observed customer attrition rates. For technology-related assets such as databases, we make judgments about thedemand for current data and historical metrics in establishing the remaining useful life. For internally developed software, weestimate an obsolescence factor associated with the software.
We record any excess of the purchase price over the estimated fair values of the net assets acquired as goodwill, which is notamortized. Instead, it is subject to an impairment test annually, or whenever indicators of impairment exist, based on a discountedcash-flow model. We review the carrying value of goodwill for impairment at least annually based on the estimated fair value ofour reporting unit. If we determine that goodwill is impaired, we reduce the goodwill balance to reflect the revised fair value.
For purposes of performing the impairment test, we determine fair values based on a discounted cash-flow methodology. Thisrequires significant judgments including estimation of future cash flows, which, among other factors, is dependent on internalforecasts, long-term growth estimates, and determination of weighted average cost of capital.
We believe the accounting estimates related to purchase price allocations and subsequent goodwill impairment testing arecritical accounting estimates because changes in these assumptions could materially affect the amounts and classifications ofassets and liabilities presented in our Consolidated Balance Sheets, as well as the amount of amortization and depreciationexpense, if any, recorded in our Consolidated Statements of Income.
We include stock-based compensation expense in each of our operating expense categories. Our stock-based compensationexpense primarily reflects grants of restricted stock units, restricted stock, performance share awards, and market stock units.
Morningstar, Inc. 2017 Annual Report 85
Acquisitions, Goodwill, and Other Intangible Assets
Stock-Based Compensation

86
2017 10-K: Part II
We measure stock-based compensation expense at the grant date based on the fair value of the award and recognize the expenseratably over the award’s vesting period. We measure the fair value of our restricted stock units on the date of grant based on themarket price of the underlying common stock as of the close of trading on the day before the grant. We estimate expectedforfeitures of stock-based awards at the grant date and recognize compensation cost only for those awards expected to vest. Welater adjust this forfeiture assumption to the actual forfeiture rate. Therefore, changes in the forfeiture assumptions do not changethe total amount of expense ultimately recognized over the vesting period. Instead, different forfeiture assumptions would onlyaffect the timing of expense recognition over the vesting period.
We adjust the stock-based compensation expense to reflect those awards that ultimately vested and update our estimate of theforfeiture rate that will be applied to awards not yet vested.
We believe the estimates related to stock-based compensation expense are critical accounting estimates because theassumptions used could significantly impact the timing and amount of stock-based compensation expense recorded in ourConsolidated Financial Statements.
On December 22, 2017, the United States enacted tax reform legislation that included a broad range of business tax provisions. Asa result of the U.S. tax reform and the related SEC guidance, we included provisional estimates in our consolidated financialstatements for some impacts of the new tax legislation. See Note 14 of the Notes to our Consolidated Financial Statements forfurther discussion of the provisional amounts related to U.S. tax reform included in our Consolidated Financial Statements.
Our effective tax rate is based on the mix of income and losses in our U.S. and non-U.S. operations, statutory tax rates, andtax-planning opportunities available to us in the various jurisdictions in which we operate. Significant judgment is required toevaluate our tax positions.
Because of timing differences required by tax law, the effective tax rate reflected in our Consolidated Financial Statements isdifferent from the tax rate reported on our tax return (our cash tax rate). Some of these differences, such as expenses that are notdeductible in our tax return, are permanent. Other differences, such as depreciation expense, reverse over time. These timingdifferences create deferred tax assets and liabilities. We determine our deferred tax assets and liabilities based on temporarydifferences between the financial reporting and the tax basis of assets and liabilities.
As of December 31, 2017, we had gross deferred tax assets of $34.5 million and gross deferred tax liabilities of $56.1 million. Thedeferred tax assets include $3.1 million of deferred tax assets related to $14.8 million of net operating losses (NOLs) of ournon-U.S. operations. In assessing the realizability of our deferred tax assets, we consider whether it is more likely than not thatsome portion or all of the deferred tax assets will not be realized. We have recorded a valuation allowance against all butapproximately $5.4 million of the non-U.S. NOLs, reflecting the likelihood that the benefit of the NOLs will not be realized. Wehave not recorded a valuation allowance against the U.S. federal NOLs of $9.1 million because we expect the benefit of the U.S.federal NOLs to be fully utilized before expiration.
In assessing the need for a valuation allowance, we consider both positive and negative evidence, including tax planningstrategies, projected future taxable income, and recent financial performance. If we determine a lower allowance is required atsome point in the future, we would record a reduction to our tax expense and valuation allowance. These adjustments would bemade in the same period we determined the change in the valuation allowance was needed. This would cause our income taxexpense, effective tax rate, and net income to fluctuate.
86
Income Taxes
87
We use judgment to identify, recognize, and measure the amounts of uncertain tax positions to be recorded in the financialstatements related to tax positions taken or expected to be taken in a tax return. We recognize liabilities to represent our potentialfuture obligations to taxing authorities for the benefits taken in our tax returns. We adjust these liabilities, including any impact ofthe related interest and penalties, in light of changing facts and circumstances such as the progress of a tax audit. A number ofyears may elapse before a particular matter for which we have established a reserve is audited and finally resolved. The numberof years with open tax audits varies depending on the tax jurisdiction.
We use judgment to classify unrecognized tax benefits as either current or noncurrent liabilities in our Consolidated BalanceSheets. Settlement of any particular issue would usually require the use of cash. We generally classify liabilities associated withunrecognized tax benefits as noncurrent liabilities. It typically takes several years between our initial tax return filing and the finalresolution of any uncertain tax positions with the tax authority. We recognize favorable resolutions of tax matters for which wehave previously established reserves as a reduction to our income tax expense when the amounts involved become known.
Assessing the future tax consequences of events that have been recognized in our Consolidated Financial Statements or taxreturns requires judgment. Variations in the actual outcome of these future tax consequences could materially impact our financialposition, results of operations, or cash flows.
We are subject to various claims and contingencies related to legal proceedings and investigations. These legal proceedingsinvolve inherent uncertainties including, but not limited to, court rulings, negotiations between affected parties, and governmentactions. Assessing the probability of loss for such contingencies and determining how to accrue the appropriate liabilities requiresjudgment. If actual results differ from our assessments, our financial position, results of operations, or cash flows would beaffected.
On May 28, 2014, the FASB issued ASU No. 2014-09, Revenue from Contracts with Customers, which requires an entity torecognize the amount of revenue to which it expects to be entitled for the transfer of promised goods or services to customers. TheASU will replace most existing revenue recognition guidance in U.S. GAAP when it becomes effective. The original effective datefor ASU No. 2014-09 would have required us to adopt it beginning on January 1, 2017. In August 2015, the FASB issuedASU No. 2015-14, Revenue from Contracts with Customers—Deferral of the Effective Date, which defers the effective date ofASU No. 2014-09 for one year and permits early adoption as early as the original effective date of ASU No. 2014-09. We electedthe deferral, and the new standard is effective for us on January 1, 2018.
We have obtained an understanding of ASU No. 2014-09 and have substantially completed our analysis of the impact of the newstandard on our financial results. We have completed a high-level assessment of the attributes within our contracts for our majorproducts and services, and we have assessed the impacts to our internal processes, control environment, and disclosures. Wehave determined that the adoption of ASU No. 2014-09 will not result in a material change to the timing of when revenue isrecognized and we intend to retain similar accounting treatment used to recognize revenue under current practices. We haveidentified that there will be certain changes in accounting treatment related to delivery of third-party content (principal vs. agent)and costs to obtain contracts (e.g., sales commissions).
Morningstar, Inc. 2017 Annual Report 87
Contingencies
Recently Issued Accounting Pronouncements

88
2017 10-K: Part II
The change related to delivery of third-party content (principal vs. agent) is expected to result in no impact on our consolidatedoperating income; however it will result in a increase in both revenue and cost of revenue versus prior periods of approximately$6 million to $7 million as revenue will be recognized on a gross rather than net basis for certain arrangements.
The change related to the capitalization of cost to obtain contracts is expected to result in an increase to retained earnings ofapproximately $25 million to $30 million for commission expenses which were previously expensed. We expected to amortize thisadjustment over a period not to exceed three years and expect 2018 commission expense resulting from this change will rangebetween $14 million and $16 million. Additionally, in 2018 we will expense any discretionary payments made under ourcommission plans as well as pro-rata portions of any new commission amounts paid in 2018.
The standard allows for both retrospective and modified retrospective methods of adoption. We plan to adopt using the modifiedretrospective transition method applied to those contracts which were not completed as of January 1, 2018. Upon adoption, wewill recognize the cumulative effect of adopting this guidance as an adjustment to our opening balance of retained earnings asnoted above. Prior periods will not be retrospectively adjusted and we will discuss the comparability of these adjustments withinour 2018 results against the prior periods.
We are continuing to evaluate the effect that ASU No. 2014-09 will have on our consolidated financial statement presentation andrelated disclosures. We expect expanded disclosures related to the revenue recognized in the reporting period that was includedin the contract liability (i.e., deferred revenue) balance at the beginning of the period. We also plan to provide additionaldisclosures on our unsatisfied performance obligations at the end of the period and expected timing of when that contract liabilitywill be recognized into revenue.
On March 17, 2016, the FASB issued ASU No. 2016-08, Revenue from Contracts with Customers: Principal versus AgentConsiderations (Reporting Revenue Gross versus Net), which provides guidance on assessing whether an entity is a principal or anagent in a revenue transaction and whether an entity reports revenue on a gross or net basis. On April 14, 2016, the FASB issuedASU No. 2016-10, Revenue from Contracts with Customers: Identifying Performance Obligations and Licensing, which providesguidance on identifying performance obligations and accounting for licenses of intellectual property. On May 6, 2016, the FASBissued ASU No. 2016-11, Revenue Recognition and Derivatives and Hedging: Rescission of SEC guidance because ofASU No. 2014-09 and ASU No. 2014-16 pursuant to staff announcements at the March 3, 2016 EITF Meeting, which rescinds thefollowing SEC Staff Observer comments from ASC 605, Revenue Recognition, upon an entity’s early adoption of ASC 606, Revenuefrom Contracts with Customers: Revenue and expense recognition for freight services in process, accounting for shipping andhandling fees and costs, and accounting for consideration given by a vendor to a customer (including a reseller of the vendor’sproducts). On May 9, 2016, the FASB issued ASU No. 2016-12, Revenue from Contracts with Customers: Narrow-ScopeImprovements and Practical Expedients, which makes narrow-scope amendments to ASU No. 2014-09 and provides practicalexpedients to simplify the transition to the new standard and clarify certain aspects of the standard. On December 21, 2016, theFASB issued ASU No. 2016-20, Technical Corrections and Improvements to Topic 606, Revenue from Contracts with Customers,which makes narrow-scope amendments to ASU No. 2014-09.
The effective date and transition requirements for ASU No. 2016-08, ASU No. 2016-10, ASU No. 2016-11, ASU No. 2016-12, andASU No. 2016-20 are the same as the effective date and transition requirements of ASU No. 2014-09. We are evaluating theeffect that ASU No. 2016-08, ASU No. 2016-10, ASU No. 2016-11, ASU No. 2016-12, and ASU No. 2016-20 will have on ourconsolidated financial statements and related disclosures.
88

89
On February 25, 2016, the FASB issued ASU No. 2016-02, Leases, which will require lessees to recognize almost all leases on theirbalance sheet as a right-of-use asset and a lease liability. The new standard is effective for us on January 1, 2019. The newstandard must be adopted using a modified retrospective transition and provides for certain practical expedients. Transition willrequire application of the new guidance at the beginning of the earliest comparative period presented. We are evaluating theeffect that ASU No. 2016-02 will have on our consolidated financial statements and related disclosures.
On August 26, 2016, the FASB issued ASU No. 2016-15, Statement of Cash Flows: Classification of Certain Cash Receipts andCash Payments, which reduces diversity in practice of how certain transactions are classified in the statement of cash flows. Thenew guidance clarifies the classification of cash activities related to debt prepayment or debt extinguishment costs, settlement ofzero-coupon debt instruments, contingent consideration payments made after a business combination, proceeds from thesettlement of insurance claims, proceeds from the settlement of corporate and bank-owned life insurance policies, distributionsreceived from equity-method investments, and beneficial interests in securitization transactions. The guidance also describes apredominance principle in which cash flows with aspects of more than one class that cannot be separated should be classifiedbased on the activity that is likely to be the predominant source or use of cash flow.
The new standard is effective for us on January 1, 2018. Early adoption is permitted, including adoption in an interim period, butrequires all elements of the amendments to be adopted at once rather than individually. The new standard must be adopted usinga retrospective transition method. We are evaluating the effect that ASU No. 2016-15 will have on our consolidated financialstatements and related disclosures.
On January 5, 2017, the FASB issued ASU No. 2017-01, Business Combinations: Clarifying the Definition of a Business, whichrevises the definition of a business. When substantially all of the fair value of gross assets acquired is concentrated in a singleasset (or a group of similar assets), the assets acquired would not represent a business. To be considered a business, anacquisition would have to include an input and a substantive process that together significantly contribute to the ability to createoutputs. The new guidance provides a framework to evaluate when an input and substantive process are present (including forearly-stage companies that have not generated outputs). To be a business without outputs, there will now need to be an organizedworkforce. The new guidance also narrows the definition of the term outputs to be consistent with how it is described inTopic 606, Revenue from Contracts with Customers. The new standard is effective for us on January 1, 2018. Early adoption ispermitted. We are evaluating the effect that ASU No. 2017-01 will have on our consolidated financial statements and relateddisclosures.
On January 26, 2017, the FASB issued ASU No. 2017-04, Intangibles—Goodwill and Other, which simplifies the accounting forgoodwill impairment. The guidance removes Step 2 of the goodwill impairment test, which requires a hypothetical purchase priceallocation. A goodwill impairment will now be the amount by which a reporting unit’s carrying value exceeds its fair value, not toexceed the carrying amount of goodwill. All other goodwill impairment guidance will remain largely unchanged. Entities willcontinue to have the option to perform a qualitative assessment to determine if a quantitative impairment test is necessary. Thesame one-step impairment test will be applied to goodwill at all reporting units, even those with zero or negative carryingamounts. Entities will be required to disclose the amount of goodwill at reporting units with zero or negative carrying amounts.The new standard is effective for us on January 1, 2020. The new standard should be applied prospectively. Early adoption ispermitted for any impairment tests performed after January 1, 2017. We are evaluating the effect that ASU No. 2017-04 will haveon our consolidated financial statements and related disclosures.
On May 10, 2017, the FASB issued ASU No. 2017-09, Compensation—Stock Compensation: Scope of Modification Accounting,which clarifies when to account for a change to the terms or conditions of a share-based payment award as a modification. Under
Morningstar, Inc. 2017 Annual Report 89

90
2017 10-K: Part II
the new guidance, modification accounting is required only if the fair value, the vesting conditions, or the classification of theaward (as equity or liability) changes as a result of the change in terms or conditions. The new standard is effective for us onJanuary 1, 2018. The new standard should be applied prospectively. Early adoption is permitted. We are evaluating the effect thatASU No. 2017-09 will have on our consolidated financial statements and related disclosures.
The table below shows our known contractual obligations as of December 31, 2017 and the expected timing of cash paymentsrelated to these contractual obligations:
(in millions) 2018 2019 2020 2021 2022 Thereafter Total
Minimum commitments on non-cancelable operating lease obligations (1) $ 26.8 $ 30.4 $ 32.5 $ 29.8 $ 19.1 $ 54.9 $ 193.5Minimum payments related to long-term financing agreements 3.3 0.6 0.1 — — — 4.0Minimum payments on credit facility (2) 4.6 183.9 — — — — 188.5Unrecognized tax benefits (3) 8.7 — — — — — 8.7Deemed mandatory repatriation (4) 0.6 0.6 0.6 0.6 0.6 4.5 7.5
Total $ 44.0 $ 215.5 $ 33.2 $ 30.4 $ 19.7 $ 59.4 $ 402.2
(1) The non-cancelable operating lease obligations are mainly for office space.
(2) The minimum payments on the credit facility reflect the current outstanding principal balance of $180.0 million and an estimate for interest and commitment fees.
(3) Represents unrecognized tax benefits (including penalties and interest, less the impact of any associated tax benefits). The amount included in the table represents items that may beresolved through settlement of tax audits or for which the statutes of limitations are expected to lapse during 2018. The table excludes $7.0 million of unrecognized tax benefits, includedas a long-term liability in our Consolidated Balance Sheet as of December 31, 2017, for which we cannot make a reasonably reliable estimate of the period of payment.
(4) U.S. federal income tax on deemed mandatory repatriation is payable over 8 years pursuant to the Tax Reform Act.
90
Contractual Obligations

91
Our investment portfolio is actively managed and may suffer losses from fluctuating interest rates, market prices, or adversesecurity selection. These accounts may consist of stocks, bonds, options, mutual funds, money market funds, or exchange-tradedproducts that replicate the model portfolios and strategies created by Morningstar. These investment accounts may also includeexchange-traded products where Morningstar is an index provider. As of December 31, 2017, our cash, cash equivalents, andinvestments balance was $353.3 million. Based on our estimates, a 100 basis-point change in interest rates would not have amaterial effect on the fair value of our investment portfolio.
We are subject to risk from fluctuations in the interest rates related to our long-term debt. The interest rates are based upon theapplicable LIBOR rate plus an applicable margin for such loans or the lender’s base rate plus an applicable margin for such loans.On an annualized basis, based on December 31, 2017 estimated LIBOR rates, we estimate a 100 basis-point change in the LIBORrate would have a $1.8 million impact.
We are subject to risk from fluctuations in foreign currencies from our operations outside of the United States. To date, we havenot engaged in currency hedging, and we do not currently have any positions in derivative instruments to hedge our currency risk.
The table below shows our exposure to foreign currency denominated revenue and operating income for the year endedDecember 31, 2017:
British Australian Other Foreign(in millions, except foreign currency rates) Euro Pound Dollar Currencies
Foreign currency rate in U.S. dollars as of December 31, 2017 1.1980 1.3494 0.7807 —Foreign denominated percentage of revenue 5.0% 7.1% 3.7% 8.9%Foreign denominated percentage of operating income 10.1% (1.8)% 2.2% (13.2)%Estimated effect of a 10% adverse currency fluctuation on revenue $ (2.1) $ (3.8) $ (2.8) $ (6.2)Estimated effect of a 10% adverse currency fluctuation on operating income $ (0.8) $ 0.3 $ (0.3) $ 1.7
The table below shows our net investment exposure in foreign currencies as of December 31, 2017:
British Australian Other Foreign(in millions) Euro Pound Dollar Currencies
Assets, net of unconsolidated entities $ 111.8 $ 123.8 $ 88.9 $ 173.3Liabilities 58.5 15.6 64.5 63.6
Net currency position $ 53.3 $ 108.2 $ 24.4 $ 109.7
Estimated effect of a 10% adverse currency fluctuation on equity $ (5.3) $ (10.8) $ (2.4) $ (11.0)
Morningstar, Inc. 2017 Annual Report 91
Item 7A. Quantitative and Qualitative Disclosures about Market Risk

92
2017 10-K: Part II
The Board of Directors and ShareholdersMorningstar, Inc.:
We have audited the accompanying consolidated balance sheets of Morningstar, Inc. and subsidiaries (the Company) as ofDecember 31, 2017 and 2016, the related consolidated statements of income, comprehensive income, equity, and cash flows foreach of the years in the three-year period ended December 31, 2017, and the related notes and financial statement Schedule II—Valuation and Qualifying Accounts (collectively, the consolidated financial statements). In our opinion, the consolidated financialstatements present fairly, in all material respects, the financial position of the Company as of December 31, 2017 and 2016, andthe results of its operations and its cash flows for each of the years in the three-year period ended December 31, 2017, inconformity with U.S. generally accepted accounting principles.
We also have audited, in accordance with the standards of the Public Company Accounting Oversight Board (United States)(PCAOB), the Company’s internal control over financial reporting as of December 31, 2017, based on criteria established in InternalControl—Integrated Framework (2013) issued by the Committee of Sponsoring Organizations of the Treadway Commission, andour report dated March 1, 2018, expressed an unqualified opinion on the effectiveness of the Company’s internal control overfinancial reporting.
These consolidated financial statements are the responsibility of the Company’s management. Our responsibility is to express anopinion on these consolidated financial statements based on our audits. We are a public accounting firm registered with thePCAOB and are required to be independent with respect to the Company in accordance with the U.S. federal securities laws andthe applicable rules and regulations of the Securities and Exchange Commission and the PCAOB.
We conducted our audits in accordance with the standards of the PCAOB. Those standards require that we plan and perform theaudit to obtain reasonable assurance about whether the consolidated financial statements are free of material misstatement,whether due to error or fraud. Our audits included performing procedures to assess the risks of material misstatement of theconsolidated financial statements, whether due to error or fraud, and performing procedures that respond to those risks. Suchprocedures included examining, on a test basis, evidence regarding the amounts and disclosures in the consolidated financialstatements. Our audits also included evaluating the accounting principles used and significant estimates made by management,as well as evaluating the overall presentation of the consolidated financial statements. We believe that our audits provide areasonable basis for our opinion.
/s/ KPMG LLP
We have served as the Company’s auditor since 2011.
Chicago, IllinoisMarch 1, 2018
92
Item 8. Financial Statements and Supplementary Data
Report of Independent Registered Public Accounting Firm
Opinion on the Consolidated Financial Statements
Basis for Opinion

93
To the Board of Directors and ShareholdersMorningstar, Inc.:
We have audited Morningstar, Inc.’s and subsidiaries’ (the Company) internal control over financial reporting as of December 31,2017, based on criteria established in Internal Control—Integrated Framework (2013) issued by the Committee of SponsoringOrganizations of the Treadway Commission. In our opinion, the Company maintained, in all material respects, effective internalcontrol over financial reporting as of December 31, 2017, based on criteria established in Internal Control—Integrated Framework(2013) issued by the Committee of Sponsoring Organizations of the Treadway Commission.
We also have audited, in accordance with the standards of the Public Company Accounting Oversight Board (United States)(PCAOB), the consolidated balance sheets of the Company as of December 31, 2017 and 2016, the related consolidatedstatements of income, comprehensive income, equity, and cash flows for each of the years in the three-year period endedDecember 31, 2017, and the related notes and financial statement Schedule II—Valuation and Qualifying Accounts (collectively,the consolidated financial statements), and our report dated March 1, 2018, expressed an unqualified opinion on thoseconsolidated financial statements.
The Company’s management is responsible for maintaining effective internal control over financial reporting and for itsassessment of the effectiveness of internal control over financial reporting, included in the accompanying Management’s Reporton Internal Control Over Financial Reporting. Our responsibility is to express an opinion on the Company’s internal control overfinancial reporting based on our audit. We are a public accounting firm registered with the PCAOB and are required to beindependent with respect to the Company in accordance with the U.S. federal securities laws and the applicable rules andregulations of the Securities and Exchange Commission and the PCAOB.
We conducted our audit in accordance with the standards of the PCAOB. Those standards require that we plan and perform theaudit to obtain reasonable assurance about whether effective internal control over financial reporting was maintained in allmaterial respects. Our audit of internal control over financial reporting included obtaining an understanding of internal control overfinancial reporting, assessing the risk that a material weakness exists, and testing and evaluating the design and operatingeffectiveness of internal control based on the assessed risk. Our audit also included performing such other procedures as weconsidered necessary in the circumstances. We believe that our audit provides a reasonable basis for our opinion.
A company’s internal control over financial reporting is a process designed to provide reasonable assurance regarding thereliability of financial reporting and the preparation of financial statements for external purposes in accordance with generallyaccepted accounting principles. A company’s internal control over financial reporting includes those policies and procedures that(1) pertain to the maintenance of records that, in reasonable detail, accurately and fairly reflect the transactions and dispositionsof the assets of the company; (2) provide reasonable assurance that transactions are recorded as necessary to permit preparationof financial statements in accordance with generally accepted accounting principles, and that receipts and expenditures of thecompany are being made only in accordance with authorizations of management and directors of the company; and (3) providereasonable assurance regarding prevention or timely detection of unauthorized acquisition, use, or disposition of the company’sassets that could have a material effect on the financial statements.
Morningstar, Inc. 2017 Annual Report 93
Report of Independent Registered Public Accounting Firm
Opinion on Internal Control Over Financial Reporting
Basis for Opinion
Definition and Limitations of Internal Control Over Financial Reporting

94
2017 10-K: Part II
Because of its inherent limitations, internal control over financial reporting may not prevent or detect misstatements. Also,projections of any evaluation of effectiveness to future periods are subject to the risk that controls may become inadequatebecause of changes in conditions, or that the degree of compliance with the policies or procedures may deteriorate.
/s/ KPMG LLP
Chicago, IllinoisMarch 1, 2018
94
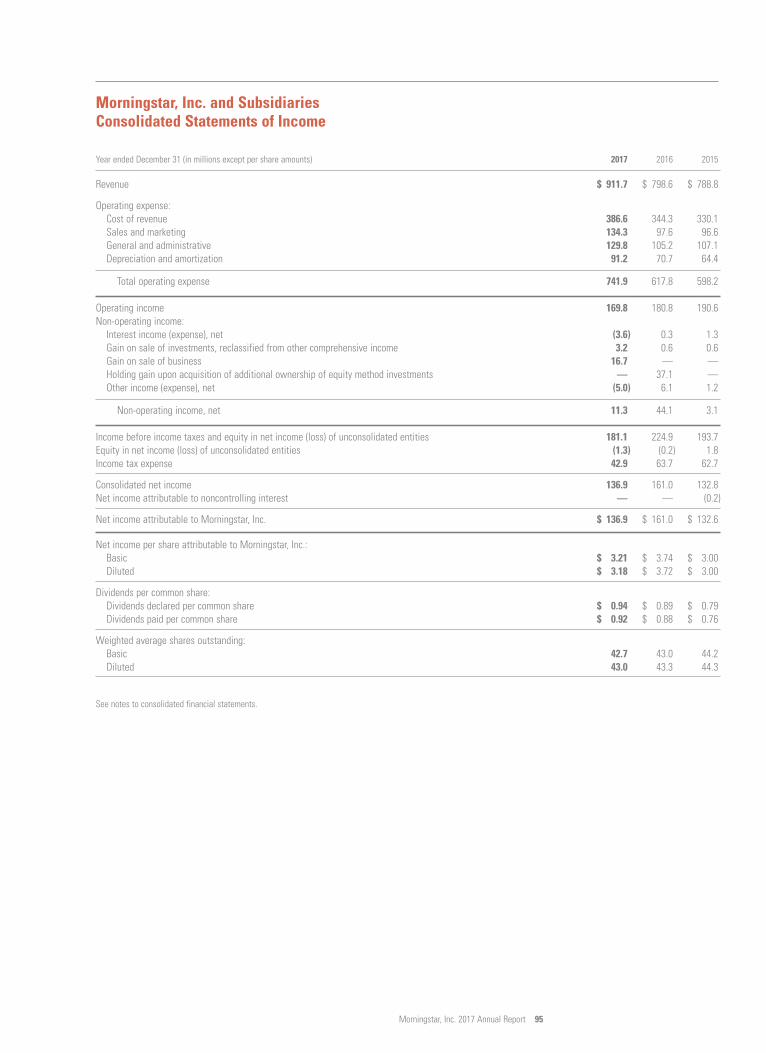
95
Year ended December 31 (in millions except per share amounts) 2017 2016 2015
Revenue $ 911.7 $ 798.6 $ 788.8
Operating expense:Cost of revenue 386.6 344.3 330.1Sales and marketing 134.3 97.6 96.6General and administrative 129.8 105.2 107.1Depreciation and amortization 91.2 70.7 64.4
Total operating expense 741.9 617.8 598.2
Operating income 169.8 180.8 190.6Non-operating income:
Interest income (expense), net (3.6) 0.3 1.3Gain on sale of investments, reclassified from other comprehensive income 3.2 0.6 0.6Gain on sale of business 16.7 — —Holding gain upon acquisition of additional ownership of equity method investments — 37.1 —Other income (expense), net (5.0) 6.1 1.2
Non-operating income, net 11.3 44.1 3.1
Income before income taxes and equity in net income (loss) of unconsolidated entities 181.1 224.9 193.7Equity in net income (loss) of unconsolidated entities (1.3) (0.2) 1.8Income tax expense 42.9 63.7 62.7
Consolidated net income 136.9 161.0 132.8Net income attributable to noncontrolling interest — — (0.2)
Net income attributable to Morningstar, Inc. $ 136.9 $ 161.0 $ 132.6
Net income per share attributable to Morningstar, Inc.:Basic $ 3.21 $ 3.74 $ 3.00Diluted $ 3.18 $ 3.72 $ 3.00
Dividends per common share:Dividends declared per common share $ 0.94 $ 0.89 $ 0.79Dividends paid per common share $ 0.92 $ 0.88 $ 0.76
Weighted average shares outstanding:Basic 42.7 43.0 44.2Diluted 43.0 43.3 44.3
See notes to consolidated financial statements.
Morningstar, Inc. 2017 Annual Report 95
Morningstar, Inc. and SubsidiariesConsolidated Statements of Income
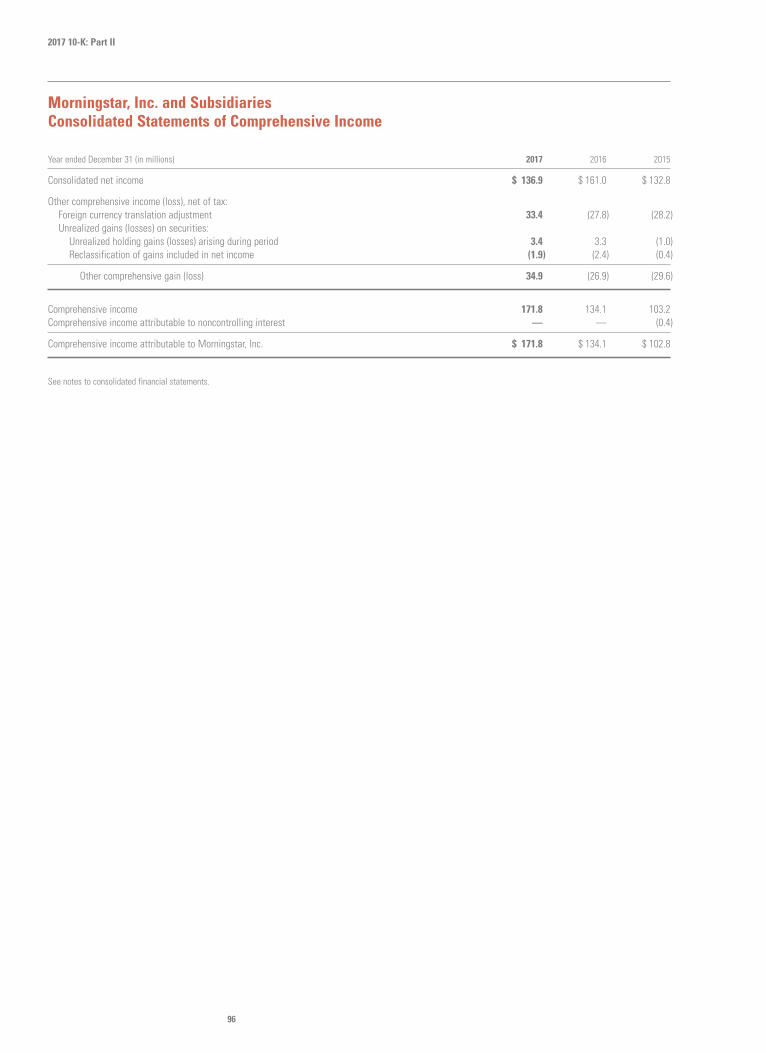
96
2017 10-K: Part II
Year ended December 31 (in millions) 2017 2016 2015
Consolidated net income $ 136.9 $ 161.0 $ 132.8
Other comprehensive income (loss), net of tax:Foreign currency translation adjustment 33.4 (27.8) (28.2)Unrealized gains (losses) on securities:
Unrealized holding gains (losses) arising during period 3.4 3.3 (1.0)Reclassification of gains included in net income (1.9) (2.4) (0.4)
Other comprehensive gain (loss) 34.9 (26.9) (29.6)
Comprehensive income 171.8 134.1 103.2Comprehensive income attributable to noncontrolling interest — — (0.4)
Comprehensive income attributable to Morningstar, Inc. $ 171.8 $ 134.1 $ 102.8
See notes to consolidated financial statements.
96
Morningstar, Inc. and SubsidiariesConsolidated Statements of Comprehensive Income

97
As of December 31 (in millions except share amounts) 2017 2016
AssetsCurrent assets:
Cash and cash equivalents $ 308.2 $ 259.1Investments 45.1 44.9Accounts receivable, less allowance of $3.2 and $2.1, respectively 148.2 145.8Other 28.3 22.2
Total current assets 529.8 472.0
Property, equipment, and capitalized software, net 147.4 152.1Investments in unconsolidated entities 62.0 40.3Goodwill 564.9 556.8Intangible assets, net 95.4 120.9Other assets 6.2 8.8
Total assets $ 1,405.7 $ 1,350.9
Liabilities and equityCurrent liabilities:
Accounts payable and accrued liabilities $ 49.2 $ 44.6Accrued compensation 92.0 71.7Deferred revenue 171.3 165.4Other current liabilities 10.7 13.2
Total current liabilities 323.2 294.9
Accrued compensation 11.7 10.3Deferred tax liability, net 23.6 38.2Long-term debt 180.0 250.0Deferred rent 26.9 24.8Other long-term liabilities 35.4 35.9
Total liabilities 600.8 654.1
Equity:Morningstar, Inc. shareholders’ equity:
Common stock, no par value, 200,000,000 shares authorized, of which 42,547,707 and 42,932,994 shares wereoutstanding as of December 31, 2017 and December 31, 2016, respectively — —
Treasury stock at cost, 10,633,637 and 10,106,249 shares as of December 31, 2017 and December 31, 2016,respectively (708.2) (667.9)
Additional paid-in capital 601.0 584.0Retained earnings 958.7 861.9
Accumulated other comprehensive loss:Currency translation adjustment (47.9) (81.3)Unrealized gain (loss) on available-for-sale investments 1.3 (0.2)
Total accumulated other comprehensive loss (46.6) (81.5)
Total Morningstar, Inc. shareholders’ equity 804.9 696.5Noncontrolling interest — 0.3
Total equity 804.9 696.8
Total liabilities and equity $ 1,405.7 $ 1,350.9
See notes to consolidated financial statements.
Morningstar, Inc. 2017 Annual Report 97
Morningstar, Inc. and SubsidiariesConsolidated Balance Sheets

98
2017 10-K: Part II
Morningstar, Inc. Shareholders’ EquityAccumulatedCommon Stock Additional Other Non
Shares Par Treasury Paid-in Retained Comprehensive Controlling Total(in millions, except share amounts) Outstanding Value Stock Capital Earnings Loss Interest Equity
Balance as of December 31, 2014 44,345,763 $ — $ (524.3) $ 561.1 $ 641.5 $ (24.8) $ 0.9 $ 654.4
Net income — — — 132.6 — 0.2 132.8Other comprehensive income (loss):
Unrealized loss on available-for-saleinvestments, net of tax of $0.4 — — — — (1.0) — (1.0)
Reclassification of adjustments for gainsincluded in net income, net of incometax of $0.1 — — — — (0.4) — (0.4)
Foreign currency translation adjustment, net — — — — (28.4) 0.2 (28.2)
Other comprehensive income (loss), net — — — — (29.8) 0.2 (29.6)
Issuance of common stock related to stock-option exercises and vesting of restrictedstock units, net 298,435 — 1.5 (3.2) — — — (1.7)
Stock-based compensation—restricted stock units — — 16.1 — — — 16.1
Stock-based compensation—restricted stock — — 0.1 — — — 0.1Stock-based compensation—
performance share awards — — 1.0 — — — 1.0Stock-based compensation—stock options — — 0.2 — — — 0.2Excess tax benefit derived from stock-option
exercises and vesting of restricted stock units — — 2.6 — — — 2.6Common shares repurchased (1,241,122) — (97.0) — — — — (97.0)Dividends declared—
common shares outstanding — — — (34.8) — — (34.8)Dividends declared—restricted stock units — — — (0.1) — — (0.1)Purchase of remaining interest in
majority-owned investment — — (2.4) — — (1.0) (3.4)
Balance as of December 31, 2015 43,403,076 — (619.8) 575.5 739.2 (54.6) 0.3 640.6
Net income — — — 161.0 — — 161.0Other comprehensive loss:
Unrealized gain on available-for-saleinvestments, net of tax of $1.3 — — — — 3.3 — 3.3
Reclassification of adjustments for gainsincluded in net income, net of incometax of $1.8 — — — — (2.4) — (2.4)
Foreign currency translation adjustment, net — — — — (27.8) — (27.8)
Other comprehensive loss, net — — — — (26.9) — (26.9)
98
Morningstar, Inc. and SubsidiariesConsolidated Statements of Equity

99
Morningstar, Inc. Shareholders’ EquityAccumulatedCommon Stock Additional Other Non
Shares Par Treasury Paid-in Retained Comprehensive Controlling Total(in millions, except share amounts) Outstanding Value Stock Capital Earnings Loss Interest Equity
Issuance of common stock related to stock-option exercises and vesting of restrictedstock units, net 174,911 — 1.4 (6.0) — — — (4.6)
Stock-based compensation—restricted stock units — — 14.6 — — — 14.6
Stock-based compensation—performanceshare awards — — (0.1) — — — (0.1)
Common shares repurchased (644,993) — (49.5) — — — — (49.5)Dividends declared—
common shares outstanding — — — (38.3) — — (38.3)Dividends declared—restricted stock units — — — — — — —
Balance as of December 31, 2016 42,932,994 — (667.9) 584.0 861.9 (81.5) 0.3 696.8
Net income — — — 136.9 — — 136.9Other comprehensive income:Unrealized gain on available-for-sale
investments, net of income tax of $1.8 — — — — 3.4 — 3.4Reclassification of adjustments for gains
included in net income, net of incometax of $1.2 — — — — (1.9) — (1.9)Foreign currency translation adjustment, net — — — — 33.4 — 33.4
Other comprehensive income, net — — — — 34.9 — 34.9
Issuance of common stock related to stock-option exercises and vesting of restrictedstock units, net 161,445 — 1.6 (6.2) — — — (4.6)
Stock-based compensation—restrictedstock units — — 16.5 — — — 16.5
Stock-based compensation—performanceshare awards — — 7.1 — — — 7.1
Stock-based compensation—market stock units — — 0.5 — — — 0.5Common shares repurchased (546,732) — (41.9) — — — — (41.9)Dividends declared—
common shares outstanding — — — (40.1) — — (40.1)Purchase of additional interest in
majority-owned investment — — (0.9) — — (0.3) (1.2)
Balance as of December 31, 2017 42,547,707 $ — $ (708.2) $ 601.0 $ 958.7 $ (46.6) $ — $ 804.9
See notes to consolidated financial statements.
Morningstar, Inc. 2017 Annual Report 99
Morningstar, Inc. and SubsidiariesConsolidated Statements of Equity

100
2017 10-K: Part II
Year ended December 31 (in millions) 2017 2016 2015
Operating activitiesConsolidated net income $ 136.9 $ 161.0 $ 132.8Adjustments to reconcile consolidated net income to net cash flows from operating activities:
Depreciation and amortization 91.2 70.7 64.4Deferred income taxes (14.1) 4.7 2.9Stock-based compensation expense 24.1 14.5 17.4Provision for bad debt 2.3 1.3 0.5Equity in net (income) loss of unconsolidated entities 1.3 0.2 (1.8)Gain on sale of business (16.7) — —Holding gain upon acquisition of additional ownership of equity-method investments — (37.1) —Other, net 1.8 (6.8) (1.1)
Changes in operating assets and liabilities, net of effects of acquisitions:Accounts receivable (1.2) (0.1) (6.9)Other assets (7.8) 1.1 0.7Accounts payable and accrued liabilities 0.7 3.4 4.7Accrued compensation 20.2 (8.8) 7.0Income taxes—current 9.7 1.0 10.1Deferred revenue 2.5 6.7 10.6Deferred rent 2.6 (2.9) (0.3)Other liabilities (3.4) 4.8 0.5
Cash provided by operating activities 250.1 213.7 241.5
Investing activitiesPurchases of investments (34.9) (32.0) (34.7)Proceeds from maturities and sales of investments 42.2 28.6 30.0Capital expenditures (66.6) (62.8) (57.3)Acquisitions, net of cash acquired (1.0) (191.6) (11.1)Proceeds from sale of a business, net 23.7 — —Purchases of equity- and cost-method investments (24.8) (16.5) (6.2)Other, net 0.6 0.1 (0.2)
Cash used for investing activities (60.8) (274.2) (79.5)
Financing activitiesCommon shares repurchased (42.3) (48.8) (97.0)Dividends paid (39.3) (37.9) (33.7)Proceeds from short-term debt — 40.0 50.0Repayment of short-term debt — (15.0) (45.0)Proceeds from long-term debt — 190.0 —Repayment of long-term debt (70.0) — —Proceeds from stock-option exercises 0.2 0.4 3.9Employee taxes withheld for restricted stock units (4.8) (5.0) (5.6)Other, net (1.3) — (0.1)
Cash provided by (used for) financing activities (157.5) 123.7 (127.5)
Effect of exchange rate changes on cash and cash equivalents 17.3 (11.2) (12.6)
Net increase in cash and cash equivalents 49.1 52.0 21.9Cash and cash equivalents—beginning of period 259.1 207.1 185.2
Cash and cash equivalents—end of period $ 308.2 $ 259.1 $ 207.1
2017 2016 2015
Supplemental disclosure of cash flow information:Cash paid for income taxes $ 47.1 $ 58.0 $ 50.1Cash paid for interest $ 5.4 $ 1.2 $ 0.4
Supplemental information of non-cash investing and financing activities:Unrealized gain (loss) on available-for-sale investments $ 2.0 $ 1.2 $ (2.0)Software and equipment obtained under long-term financing arrangement $ 0.6 $ 9.0 $ 5.3
See notes to consolidated financial statements.
100
Morningstar, Inc. and SubsidiariesConsolidated Statements of Cash Flows

101
Morningstar, Inc. and its subsidiaries (Morningstar, we, our, the company), provides independent investment research for investorsaround the world. We offer an extensive line of products and services for individual investors, financial advisors, asset managers,retirement plan providers and sponsors, and institutional investors in the private capital markets. We have operations in27 countries.
The acronyms that appear in these Notes to our Consolidated Financial Statements refer to the following:
ASC Accounting Standards CodificationASU Accounting Standards UpdateEITF Emerging Issues Task ForceFASB Financial Accounting Standards BoardSEC Securities and Exchange Commission
Principles of Consolidation. We conduct our business operations through wholly owned or majority-owned operating subsidiaries.The accompanying consolidated financial statements include the accounts of Morningstar, Inc. and our subsidiaries. Weconsolidate assets, liabilities, and results of operations of subsidiaries in which we have a controlling interest and eliminate allsignificant intercompany accounts and transactions.
We account and report the noncontrolling (minority) interest in our Consolidated Financial Statements in accordance with FASBASC 810, Consolidation. A noncontrolling interest is the portion of equity (net assets) in a subsidiary not attributable, directly orindirectly, to the parent company. We report the noncontrolling interest in our Consolidated Balance Sheet within equity separatefrom the shareholders’ equity attributable to Morningstar, Inc. In addition, we present the net income (loss) and comprehensiveincome (loss) attributable to Morningstar, Inc.’s shareholders and the noncontrolling interest in our Consolidated Statements ofIncome, Consolidated Statements of Comprehensive Income, and Consolidated Statements of Equity.
We account for investments in entities in which we exercise significant influence, but do not control, using the equity method.
As part of our investment management operations, we manage certain funds outside of the United States that are consideredvariable interest entities. For the majority of these variable interest entities, we do not have a variable interest in them. In caseswhere we do have a variable interest, we are not the primary beneficiary. Accordingly, we do not consolidate any of these variableinterest entities.
Use of Estimates. The preparation of financial statements in conformity with accounting principles generally accepted in theUnited States requires us to make estimates and assumptions that affect the reported amounts of assets, liabilities, revenues, andexpenses during the reporting period. Actual results may differ from these estimates.
Cash and Cash Equivalents. Cash and cash equivalents consists of cash and investments with original maturities of three monthsor less. We state them at cost, which approximates fair value. We state the portion of our cash equivalents that are invested inmoney market funds at fair value, as these funds are actively traded and have quoted market prices.
Morningstar, Inc. 2017 Annual Report 101
Morningstar, Inc. and Subsidiaries
Notes to Consolidated Financial Statements
1. Description of Business
2. Summary of Significant Accounting Policies

102
2017 10-K: Part II
Investments. We account for our investments in accordance with FASB ASC 320, Investments—Debt and Equity Securities. Weclassify our investments into three categories: held-to-maturity, trading, and available-for-sale.
� Held-to-maturity: We classify certain investments, primarily certificates of deposit, as held-to-maturity securities, based on ourintent and ability to hold these securities to maturity. We record held-to-maturity investments at amortized cost in ourConsolidated Balance Sheets.
� Trading: We classify certain other investments, primarily equity securities, as trading securities as these relate mainly toinvestments tracking the strategies of our newsletter portfolios. We include realized and unrealized gains and lossesassociated with these investments as a component of our operating income in our Consolidated Statements of Income. Werecord these securities at their fair value in our Consolidated Balance Sheets.
� Available-for-sale: Investments not considered held-to-maturity or trading securities are classified as available-for-salesecurities. Available-for-sale securities primarily consist of equity securities, exchange-traded funds, and mutual funds. Wereport unrealized gains and losses for available-for-sale securities as other comprehensive income (loss), net of related incometaxes. We record these securities at their fair value in our Consolidated Balance Sheets.
Fair Value Measurements. We follow FASB ASC 820, Fair Value Measurements. FASB ASC 820 defines fair value, establishes aframework for measuring fair value, and expands disclosures about fair value measurements. Under FASB ASC 820, fair value isdefined as the price that would be received to sell an asset or paid to transfer a liability in an orderly transaction between marketparticipants as of the measurement date. The standard applies whenever other standards require (or permit) assets or liabilities tobe measured at fair value. The standard does not expand the use of fair value in any new circumstances and does not require anynew fair value measurements.
FASB ASC 820 uses a fair value hierarchy based on three broad levels of valuation inputs:
� Level 1: Valuations based on quoted prices in active markets for identical assets or liabilities that the company has the abilityto access.
� Level 2: Valuations based on quoted prices in markets that are not active or for which all significant inputs are observable,either directly or indirectly.
� Level 3: Valuations based on inputs that are unobservable and significant to the overall fair value measurement.
We provide additional information about our cash equivalents and investments that are subject to valuation under FASB ASC 820in Note 6.
Concentration of Credit Risk. No single customer is large enough to pose a significant credit risk to our operations or financialcondition. For the years ended December 31, 2017, 2016, and 2015, no single customer represented 5% or more of ourconsolidated revenue. If receivables from our customers become delinquent, we begin a collections process. We maintain anallowance for doubtful accounts based on our estimate of the probable losses of accounts receivable.
Property, Equipment, and Depreciation. We state property and equipment at historical cost, net of accumulated depreciation. Wedepreciate property and equipment primarily using the straight-line method based on the useful life of the asset, which generallyis three years. We amortize leasehold improvements over the lease term or their useful lives, whichever is shorter.
102

103
Computer Software and Internal Product Development Costs. We capitalize certain costs in accordance with FASB ASC 350-40,Internal-Use Software, FASB ASC 350-50, Website Development Costs, and FASB ASC 985, Software. Internal productdevelopment costs mainly consist of employee costs for developing new web-based products and certain major enhancements ofexisting products. We amortize these costs on a straight-line basis over the estimated economic life, which is generally three tofive years. We include capitalized software development costs related to projects that have not been placed into service in ourconstruction in progress balance.
The table below summarizes our depreciation expense related to internally developed software for the past three years:
(in millions) 2017 2016 2015
Internally developed software depreciation expense $ 30.6 $ 20.0 $ 13.0
The table below summarizes our capitalized software development costs for the past three years:
(in millions) 2017 2016 2015
Capitalized software development costs $ 46.3 $ 28.2 $ 21.8
Business Combinations. When we make acquisitions, we allocate the purchase price to the assets acquired, liabilities assumed,and goodwill. We follow FASB ASC 805, Business Combinations. We recognize and measure the fair value of the acquiredoperation as a whole, as well as the assets acquired and liabilities assumed, at their full fair values as of the date we obtaincontrol, regardless of the percentage ownership in the acquired operation or how the acquisition was achieved. We expensedirect costs related to the business combination, such as advisory, accounting, legal, valuation, and other professional fees, asincurred. We recognize restructuring costs, including severance and relocation for employees of the acquired entity, aspost-combination expenses unless the target entity meets the criteria of FASB ASC 420, Exit or Disposal Cost Obligations, on theacquisition date.
As part of the purchase price allocation, we follow the requirements of FASB ASC 740, Income Taxes. This includes establishingdeferred tax assets or liabilities reflecting the difference between the values assigned for financial statement purposes andincome tax purposes. In certain acquisitions, the goodwill resulting from the purchase price allocation may not be deductible forincome tax purposes. FASB ASC 740 prohibits recognition of a deferred tax asset or liability for temporary differences in goodwillif goodwill is not amortizable and deductible for tax purposes.
Goodwill. Changes in the carrying amount of our recorded goodwill are mainly the result of business acquisitions, divestitures, andthe effect of foreign currency translations. In accordance with FASB ASC 350, Intangibles—Goodwill and Other, we do notamortize goodwill; instead, goodwill is subject to an impairment test annually, or whenever indicators of impairment exist. Animpairment would occur if the carrying amount of a reporting unit exceeded the fair value of that reporting unit. We performedannual impairment reviews in the fourth quarter of 2017 and 2016. We did not record any impairment losses in 2017 and 2016.
Intangible Assets. We amortize intangible assets using the straight-line method over their estimated useful lives, which rangefrom one to 25 years. We have no intangible assets with indefinite useful lives. In accordance with FASB ASC 360-10-35,Subsequent Measurement—Impairment or Disposal of Long-Lived Assets, we review intangible assets for impairment wheneverevents or changes in circumstances indicate that the carrying value may not be recoverable. If the value of future undiscountedcash flows is less than the carrying amount of an asset group, we record an impairment loss based on the excess of the carryingamount over the fair value of the asset group. We did not record any impairment losses in 2017 and 2016.
Morningstar, Inc. 2017 Annual Report 103

104
2017 10-K: Part II
Revenue Recognition. We recognize revenue in accordance with SEC SAB Topic 13, Revenue Recognition, ASC 605-25, RevenueRecognition: Multiple Element Arrangements, and ASC 985-605, Software: Revenue Recognition.
We recognize revenue when all of the following conditions are met:
� There is persuasive evidence of an arrangement, as evidenced by a signed contract;
� Delivery of our products and services has taken place. If arrangements include an acceptance provision, we generally beginrecognizing revenue when we receive customer acceptance;
� The amount of fees to be paid by the customer is fixed or determinable; and
� The collectibility of the fees is reasonably assured.
We generate revenue through sales of Morningstar Data, Morningstar Advisor Workstation (including Morningstar Office),Morningstar Direct, Morningstar Research, Premium Membership subscriptions for Morningstar.com, our structured credit ratingsofferings, and a variety of other investment-related products and services. We generally structure the revenue agreements forthese offerings as licenses or subscriptions. We recognize revenue from licenses and subscription sales ratably as we deliver theproduct or service and over the service obligation period defined by the terms of the customer contract. For new-issue ratings andanalysis for commercial mortgage-backed securities (CMBS), residential mortgage-backed securities (RMBS), other asset-backedsecurities (ABS), and corporate and financial institutions, we charge asset-based fees that are paid by the issuer on the ratedbalance of the transaction and recognize the revenue immediately upon issuance.
We also generate revenue from Internet advertising, primarily from ‘‘impression-based’’ contracts. For advertisers who use ourcost-per-impression pricing, we charge fees each time we display their ads on our site.
Our Investment Management business includes a broad range of services. Pricing for consulting services is based on the scope ofwork and the level of service provided and includes asset-based fees for work we perform that involves investment managementor acting as a subadvisor to investment portfolios. In arrangements that involve asset-based fees, we generally invoice clientsquarterly in arrears based on average assets for the quarter. We recognize asset-based fees once the fees are fixed ordeterminable assuming all other revenue recognition criteria are met.
Our Workplace Solutions offerings help retirement plan participants plan and invest for retirement. We offer these services boththrough retirement plan providers (typically third-party asset management companies that provide administrative and record-keeping services) and directly to plan sponsors (employers that offer retirement plans to their employees). For our WorkplaceSolutions offerings, we provide both a hosted solution as well as proprietary installed software advice solution. Clients canintegrate the installed customized software into their existing systems to help investors accumulate wealth, transition intoretirement, and manage income during retirement.
The revenue arrangements for Workplace Solutions generally extend over multiple years. Our contracts may include one-timesetup fees, implementation fees, technology licensing and maintenance fees, asset-based fees for managed retirement accounts,fixed and variable fees for advice and guidance, or a combination of these fee structures. Upon customer acceptance, werecognize revenue ratably over the term of the agreement. We recognize asset-based fees and variable fees in excess of anyminimum once the value is fixed or determinable.
104

105
Some of our revenue arrangements combine multiple products and services. These products and services may be provided atdifferent points in time or over different time periods within the same arrangement. We allocate fees to the separate deliverablesbased on the deliverables’ relative selling price, which is generally based on the price we charge when the same deliverable issold separately.
We record taxes imposed on revenue-producing transactions (such as sales, use, value-added, and some excise taxes) on a netbasis; therefore, we exclude such taxes from revenue in our Consolidated Statements of Income.
Deferred revenue represents the portion of licenses or subscriptions billed or collected in advance of the service being providedwhich we expect to recognize as revenue in future periods. Certain arrangements may have cancellation or refund provisions. Ifwe make a refund, it typically reflects the amount collected from a customer for which we have not yet provided services. Therefund therefore results in a reduction of deferred revenue.
Sales Commissions. Through December 31, 2013, we paid sales commissions based on a formula driven by the total contract valueof sales opportunities closed, with any subsequent adjustments (such as clawbacks for contract cancellations) reflected in futurecommission payouts. We considered the corresponding commission expense an incremental direct acquisition cost and treated itas a deferred charge, which we expensed over the term of the underlying sales contracts.
In the first quarter of 2014, we modified our sales incentive plan. The revised plan is based on a combination of net new sales andspecific business objectives not solely tied to revenue growth. Because of this new structure and the discretion involved indetermining the related incentives, we started expensing sales commissions as incurred instead of amortizing them over thecontract terms.
However, we continued to amortize the deferred charge capitalized in connection with sales commissions paid in 2013 andprevious periods as part of the previous incentive plan. This amortization added $0.2 million, $0.6 million, and $3.5 million of salescommission cost in 2017, 2016, and 2015, respectively.
Advertising Costs. Advertising costs include expenses incurred for various print and Internet ads, search engine fees, and directmail campaigns. We expense advertising costs as incurred. The table below summarizes our advertising expense for the pastthree years:
(in millions) 2017 2016 2015
Advertising expense $ 7.0 $ 7.6 $ 8.3
Stock-Based Compensation Expense. We account for our stock-based compensation expense in accordance with FASB ASC 718,Compensation—Stock Compensation. Our stock-based compensation expense reflects grants of restricted stock units, restrictedstock, performance share awards, market stock units, and stock options. We measure the fair value of our restricted stock units,restricted stock, and performance share awards on the date of grant based on the closing market price of Morningstar’s commonstock on the day prior to grant. For market stock units, we estimate the fair value of the awards using a Monte Carlo valuationmodel. For stock options, we estimate the fair value of our stock options on the date of grant using a Black-Scholes option-pricingmodel. We amortize the fair values to stock-based compensation expense, net of estimated forfeitures, ratably over the vestingperiod.
Morningstar, Inc. 2017 Annual Report 105

106
2017 10-K: Part II
We estimate expected forfeitures of all employee stock-based awards and recognize compensation cost only for those awardsexpected to vest. We determine forfeiture rates based on historical experience and adjust the estimated forfeitures to actualforfeiture experience as needed.
Liability for Sabbatical Leave. In some of our operations, we offer employees a sabbatical leave. Although the sabbatical policyvaries by region, Morningstar’s full-time employees are generally eligible for six weeks of paid time off after four years ofcontinuous service. We account for our sabbatical liability in accordance with FASB ASC 710-10-25, Compensated Absences. Werecord a liability for employees’ sabbatical benefits over the period employees earn the right for sabbatical leave and include thisliability in Accrued Compensation in our Consolidated Balance Sheet.
Income Taxes. We record deferred income taxes for the temporary differences between the carrying amount of assets andliabilities for financial statement purposes and tax purposes in accordance with FASB ASC 740, Income Taxes. FASB ASC 740prescribes the minimum recognition threshold a tax position is required to meet before being recognized in the financialstatements. It also provides guidance on derecognition, measurement, classification, interest and penalties, accounting in interimperiods, and disclosure for uncertain tax positions.
We recognize interest and penalties related to unrecognized tax benefits as part of income tax expense in our ConsolidatedStatements of Income. We classify liabilities related to unrecognized tax benefits as either current or long-term liabilities in ourConsolidated Balance Sheet, depending on when we expect to make payment.
In November 2016, we amended our credit agreement to provide us with a three-year credit facility with a borrowing capacity ofup to $300.0 million. The credit agreement also provides for issuance of up to $25.0 million of letters of credit under the revolvingcredit facility.
The interest rate applicable to any loan under the credit agreement is, at our option, either: (i) the applicable London interbankoffered rate (LIBOR) plus an applicable margin for such loans, which ranges between 1.00% and 1.75%, based on our consolidatedleverage ratio or (ii) the lender’s base rate plus the applicable margin for such loans, which ranges between 2.00% and 2.75%,based on our consolidated leverage ratio.
The credit agreement also contains financial covenants under which we: (i) may not exceed a maximum consolidated leverageratio of 3.00 to 1.00 and (ii) are required to maintain a minimum consolidated interest coverage ratio of not less than 3.00 to 1.00.We were in compliance with the financial covenants as of December 31, 2017.
We had an outstanding principal balance of $180.0 million at a one-month LIBOR interest rate plus 100 basis points as ofDecember 31, 2017, leaving borrowing availability of $120.0 million.
106
3. Credit Arrangements

107
The following table shows how we reconcile our net income and the number of shares used in computing basic and diluted incomeper share:
(in millions, except per share amounts) 2017 2016 2015
Basic net income per share attributable to Morningstar, Inc.:Net income attributable to Morningstar, Inc. $ 136.9 $ 161.0 $ 132.6Weighted average common shares outstanding 42.7 43.0 44.2Basic net income per share attributable to Morningstar, Inc. $ 3.21 $ 3.74 $ 3.00
Diluted net income per share attributable to Morningstar, Inc.:Net income attributable to Morningstar, Inc. $ 136.9 $ 161.0 $ 132.6Weighted average common shares outstanding 42.7 43.0 44.2Net effect of dilutive stock options and restricted stock units 0.3 0.3 0.1
Weighted average common shares outstanding for computing diluted income per share 43.0 43.3 44.3
Diluted net income per share attributable to Morningstar, Inc. $ 3.18 $ 3.72 $ 3.00
The number of weighted average restricted stock units, performance share awards, and market stock units excluded from ourcalculation of diluted earnings per share because their inclusion would have been anti-dilutive was immaterial during the periodspresented.
We report our results in a single reportable segment, which reflects how our chief operating decision maker allocates resourcesand evaluates our financial results.
Because we have a single reportable segment, all required financial segment information can be found directly in theConsolidated Financial Statements.
The accounting policies for our reportable segment are the same as those described in Note 2. We evaluate the performance ofour reporting segment based on revenue and operating income.
The tables below summarize our revenue and long-lived assets by geographical area:
Year ended December 31
(in millions) 2017 2016 2015
United States $ 687.0 $ 590.5 $ 585.1
United Kingdom 64.7 61.1 64.2Continental Europe 69.9 62.6 58.8Australia 34.6 32.2 30.5Canada 29.4 28.2 27.9Asia 21.2 20.0 18.5Other 4.9 4.0 3.8
Total International 224.7 208.1 203.7
Consolidated revenue $ 911.7 $ 798.6 $ 788.8
Morningstar, Inc. 2017 Annual Report 107
4. Income Per Share
5. Segment and Geographical Area Information
Segment Information
Geographical Area Information
External revenue by geographical area

108
2017 10-K: Part II
As of December 31
(in millions) 2017 2016
United States $ 131.9 $ 139.1
United Kingdom 6.0 6.6Continental Europe 1.7 1.9Australia 2.3 0.6Canada 0.2 0.4Asia 5.2 3.4Other 0.1 0.1
Total International 15.5 13.0
Consolidated property, equipment, and capitalized software, net $ 147.4 $ 152.1
We classify our investments into three categories: available-for-sale, held-to-maturity, and trading. Our investment portfolioconsists of stocks, bonds, options, mutual funds, money market funds, or exchange-traded products that replicate the modelportfolios and strategies created by Morningstar. These investment accounts may also include exchange-traded products whereMorningstar is an index provider. We classify our investment portfolio as shown below:
As of December 31
(in millions) 2017 2016
Available-for-sale $ 21.5 $ 27.7Held-to-maturity 21.9 15.7Trading securities 1.7 1.5
Total $ 45.1 $ 44.9
The following table shows the cost, unrealized gains (losses), and fair values related to investments classified asavailable-for-sale and held-to-maturity:
As of December 31, 2017 As of December 31, 2016
Unrealized Unrealized Fair Unrealized Unrealized Fair(in millions) Cost Gain Loss Value Cost Gain Loss Value
Available-for-sale:Equity securities and exchange-traded funds $ 17.1 $ 2.4 $ (0.6) $ 18.9 $ 25.6 $ 1.3 $ (1.5) $ 25.4Mutual funds 2.4 0.2 — 2.6 2.2 0.1 — 2.3
Total $ 19.5 $ 2.6 $ (0.6) $ 21.5 $ 27.8 $ 1.4 $ (1.5) $ 27.7
Held-to-maturity:Certificates of deposit $ 19.9 $ — $ — $ 19.9 $ 13.8 $ — $ — $ 13.8Convertible note 2.0 — — 2.0 1.9 — — 1.9
Total $ 21.9 $ — $ — $ 21.9 $ 15.7 $ — $ — $ 15.7
As of December 31, 2017 and December 31, 2016, investments with unrealized losses for greater than a 12-month period were notmaterial to the Consolidated Balance Sheets and were not deemed to have other than temporary declines in value.
108
Long-lived assets by geographical area
6. Investments and Fair Value Measurements

109
The table below shows the cost and fair value of investments classified as available-for-sale and held-to-maturity based on theircontractual maturities as of December 31, 2017 and December 31, 2016.
As of December 31, 2017 As of December 31, 2016
Fair Fair(in millions) Cost Value Cost Value
Available-for-sale:Equity securities, exchange-traded funds, and mutual funds $ 19.5 $ 21.5 $ 27.8 $ 27.7
Total $ 19.5 $ 21.5 $ 27.8 $ 27.7
Held-to-maturity:Due in one year or less $ 19.7 $ 19.7 $ 13.8 $ 13.8Due in one to three years 2.2 2.2 1.9 1.9
Total $ 21.9 $ 21.9 $ 15.7 $ 15.7
The following table shows the realized gains and losses arising from sales of our investments classified as available-for-salerecorded in our Consolidated Statements of Income:
(in millions) 2017 2016 2015
Realized gains $ 3.4 $ 1.6 $ 1.3Realized losses (0.2) (1.0) (0.7)
Realized gains, net $ 3.2 $ 0.6 $ 0.6
We determine realized gains and losses using the specific identification method.
The following table shows the net unrealized gains (losses) on trading securities as recorded in our Consolidated Statements ofIncome:
(in millions) 2017 2016 2015
Unrealized gains (losses), net $ 0.1 $ — $ (0.8)
The table below shows the fair value of our assets subject to fair value measurements that are measured at fair value on arecurring basis using a fair value hierarchy:
Level 1: Valuations based on quoted prices in active markets for identical assets or liabilities that we have the ability toaccess.
Level 2: Valuations based on quoted prices in markets that are not active or for which all significant inputs are observable,either directly or indirectly.
Level 3: Valuations based on inputs that are unobservable and significant to the overall fair value measurement.
Morningstar, Inc. 2017 Annual Report 109

110
2017 10-K: Part II
Fair Value Measurements as of December 31, 2017Using Fair Value HierarchyFair Value as of
(in millions) December 31, 2017 Level 1 Level 2 Level 3
Available-for-sale investmentsEquity securities and exchange-traded funds $ 18.9 $ 18.9 $ — $ —Mutual funds 2.6 2.6 — —
Trading securities 1.7 1.7 — —Cash equivalents 0.5 0.5 — —
Total $ 23.7 $ 23.7 $ — $ —
Fair Value Measurements as of December 31, 2016Using Fair Value HierarchyFair Value as of
(in millions) December 31, 2016 Level 1 Level 2 Level 3
Available-for-sale investmentsEquity securities and exchange-traded funds $ 25.4 $ 25.4 $ — $ —Mutual funds 2.3 2.3 — —
Trading securities 1.5 1.5 — —Cash equivalents 0.2 0.2 — —
Total $ 29.4 $ 29.4 $ — $ —
Based on our analysis of the nature and risks of our investments in equity securities and mutual funds, we have determined thatpresenting each of these investment categories in the aggregate is appropriate.
We measure the fair value of money market funds, mutual funds, equity securities, and exchange-traded funds based on quotedprices in active markets for identical assets or liabilities. We did not hold any securities categorized as Level 2 or Level 3 as ofDecember 31, 2017 and December 31, 2016.
We did not complete any acquisitions in 2017.
In December 2016, we acquired an additional 78% interest in PitchBook Data, Inc. (PitchBook), increasing our ownership to 100%from 22%. PitchBook delivers data, research, and technology covering the private capital markets, including venture capital,private equity, and mergers and acquisitions. We began consolidating the financial results of this acquisition in our ConsolidatedFinancial Statements on December 1, 2016. PitchBook contributed $4.1 million of revenue and $7.5 million of operating expenseduring the one-month period that PitchBook was included in our consolidated results for 2016.
PitchBook’s total estimated fair value of $235.1 million includes $188.2 million in cash paid to acquire the remaining 78% interestin PitchBook as well as a $46.9 million fair value related to our previous 22% ownership interest. The book value of this ownershipimmediately prior to the acquisition date was $9.8 million, and we recorded a non-cash holding gain of $37.1 million for thedifference between the fair value and the book value of our previously held investment. We used the income approach and adiscounted cash flow analysis of PitchBook’s projected revenue, operating expense, and other amounts to arrive at the estimatedfair value. The gain is classified as ‘‘Holding gain upon acquisition of additional ownership of equity-method investments’’ in ourConsolidated Statement of Income for the year ended December 31, 2016.
110
7. Acquisitions, Goodwill, and Other Intangible Assets
2017 Acquisitions
2016 Acquisitions
Increased Ownership Interest in PitchBook Data, Inc. (PitchBook)

111
The transaction has been accounted for using the acquisition method of accounting, which requires that assets acquired andliabilities assumed be recognized at their fair values as of the acquisition date.
Adjustments recorded in the measurement period to the purchase price allocation were not significant. The following tablesummarizes our allocation of the estimated fair values of the assets acquired and liabilities assumed at the date of acquisition:
(in millions)
Cash and cash equivalents $ 12.4Accounts receivable 10.8Other current and non-current assets 3.2Intangible assets 60.7Goodwill 192.0Deferred revenue (22.0)Deferred tax liability, net (12.3)Other current and non-current liabilities (9.7)
Total fair value of PitchBook $ 235.1
Accounts receivable acquired were recorded at gross contractual amounts receivable, which approximates fair value.
The allocation includes $60.7 million of acquired intangible assets, as follows:
WeightedAverage
Useful Life(in millions) (years)
Customer-related assets $ 17.1 10Technology-based assets 40.8 5Intellectual property (trademarks and trade names) 2.8 4
Total intangible assets $ 60.7 6
We recognized a net deferred tax liability of $12.3 million mainly because the amortization expense related to certain intangibleassets is not deductible for income tax purposes.
Goodwill of $192.0 million represents the excess over the fair value of the net tangible and intangible assets acquired with thisacquisition. We paid this premium for a number of reasons, including the opportunity to offer comprehensive data coverage acrossthe full life cycle of private market transactions. The goodwill is not deductible for income tax purposes.
The following unaudited pro forma information presents a summary of our Consolidated Statements of Income for the years endedDecember 31, 2016 and 2015 as if we had completed the PitchBook acquisition as of January 1, 2015.
This unaudited pro forma information is presented for illustrative purposes and is not intended to represent or be indicative of theactual results of operations of the combined company that would have been achieved had the acquisition occurred at thebeginning of the earliest period presented, nor is it intended to represent or be indicative of future results of operations.
In calculating the pro forma information below, we included an estimate of amortization expense related to the intangible assetsacquired, stock-based compensation expense related to the PitchBook bonus plan (see Note 12 for additional information), and
Morningstar, Inc. 2017 Annual Report 111
Unaudited Pro Forma Information for PitchBook Acquisition

112
2017 10-K: Part II
interest expense incurred on the long-term debt. The 2016 pro forma net income excludes the $37.1 million non-cash holding gaingenerated in connection with the transaction.
Unaudited Pro Forma Financial Information (in millions) 2016 2015
Revenue $ 834.1 $ 813.3Operating income $ 157.7 $ 170.0Net income $ 105.5 $ 117.1
Basic net income per share attributable to Morningstar, Inc. $ 2.45 $ 2.65Diluted net income per share attributable to Morningstar, Inc. $ 2.44 $ 2.65
On March 31, 2016, we acquired RequiSight, LLC, which does business as RightPond, a provider of business intelligence data andanalytics on defined contribution and defined benefit plans for financial services firms. We began consolidating the financialresults of RightPond in our Consolidated Financial Statements on March 31, 2016.
On May 31, 2016, we acquired InvestSoft Technology, Inc. (InvestSoft), a provider of fixed-income analytics. We beganconsolidating the financial results of InvestSoft in our Consolidated Financial Statements on May 31, 2016.
In July 2015, we acquired an additional 28.9% interest in Ibbotson Associates Japan K.K. (IAJ), increasing our ownership to 100%from 71.1%. Because we previously owned more than 50% of the company, IAJ’s financial results were consolidated in ourConsolidated Financial Statements prior to acquiring the remaining interest.
In November 2015, we acquired Total Rebalance Expert (tRx), an automated, tax-efficient investment portfolio rebalancingplatform for financial advisors. tRx streamlines the rebalancing process for advisors and automates the complexities involved inrebalancing and managing portfolios. We began consolidating the financial results of tRx in our Consolidated FinancialStatements on November 2, 2015.
The following table shows the changes in our goodwill balances from January 1, 2016 to December 31, 2017:
(in millions)
Balance as of January 1, 2016 $ 364.2Acquisition of PitchBook 193.6Other acquisitions and foreign currency translation (1.0)
Balance as of December 31, 2016 $ 556.8Divestiture of HelloWallet (See Note 8) (2.4)Foreign currency translation and adjustments to purchase price allocation 10.5
Balance as of December 31, 2017 $ 564.9
We did not record any impairment losses in 2017 and 2016 as the estimated fair values of our reporting unit exceeded its carryingvalue. We perform our annual impairment testing during the fourth quarter of each year.
112
RequiSight, LLC (RightPond)
InvestSoft Technology, Inc. (InvestSoft)
2015 Acquisitions
Increased Ownership Interest in Ibbotson Associates Japan K.K. (IAJ)
Total Rebalance Expert (tRx)
Goodwill

113
The following table summarizes our intangible assets:
As of December 31, 2017 As of December 31, 2016
Weighted WeightedAverage Average
Accumulated Useful Life Accumulated Useful Life(in millions) Gross Amortization Net (years) Gross Amortization Net (years)
Intellectual property $ 31.5 $ (28.9) $ 2.6 9 $ 30.9 $ (27.4) $ 3.5 9Customer-related assets 156.6 (108.1) 48.5 12 152.0 (97.7) 54.3 12Supplier relationships 0.2 (0.1) 0.1 20 0.2 (0.1) 0.1 20Technology-based assets 127.9 (84.2) 43.7 7 133.2 (72.1) 61.1 7Non-competition agreements 2.5 (2.0) 0.5 5 5.0 (3.1) 1.9 5
Total intangible assets $ 318.7 $ (223.3) $ 95.4 10 $ 321.3 $ (200.4) $ 120.9 10
The following table summarizes our amortization expense related to intangible assets:
(in millions) 2017 2016 2015
Amortization expense $ 23.6 $ 19.4 $ 22.0
We did not record any impairment losses involving intangible assets in 2017 and 2016.
We amortize intangible assets using the straight-line method over their expected economic useful lives.
Based on acquisitions and divestitures completed through December 31, 2017, we expect intangible amortization expense for2018 and subsequent years to be as follows:
(in millions)
2018 $ 20.72019 19.32020 16.32021 13.02022 5.2Thereafter 20.9
Our estimates of future amortization expense for intangible assets may be affected by additional acquisitions, divestitures,changes in the estimated average useful life, and foreign currency translation.
In June 2014, we acquired the remaining 81.3% interest in HelloWallet Holdings, Inc. (HelloWallet), increasing our ownership to100%. This valued HelloWallet at $54.0 million, an amount that included $39.2 million of goodwill and $9.5 million of intangibleassets.
On June 30, 2017, we sold HelloWallet to KeyBank National Association, a bank-based financial services company. We recorded anoncash gain on the sale of $16.7 million. This gain mainly represents the sale proceeds of $23.7 million less $2.4 million ofgoodwill and the write-off of the remaining net book value on the acquired intangible assets. As some aspects of HelloWallet hadbeen integrated into Morningstar’s single reporting unit, the goodwill attributable to this transaction was calculated using arelative fair value allocation method.
Morningstar, Inc. 2017 Annual Report 113
Intangible Assets
8. Divestiture

114
2017 10-K: Part II
The sale of HelloWallet did not meet the criteria to be classified as a discontinued operation because the divestiture did notrepresent a strategic shift that has, or will have, a major effect on our operations and financial results.
The following table summarizes the amounts included in the gain on sale of business for the year ended December 31, 2017:
Year ended December 31
(in millions) 2017
Proceeds received $ 23.7Intangibles and internally developed software (4.5)Goodwill (2.4)Other assets and liabilities (0.1)
Total gain on sale of business $ 16.7
Our investments in unconsolidated entities consist primarily of the following:
As of December 31
(in millions) 2017 2016
Investment in MJKK $ 26.4 $ 25.1Investment in Sustainalytics 20.7 —Other-equity method investments 12.6 13.5Investments accounted for using the cost method 2.3 1.7
Total investments in unconsolidated entities $ 62.0 $ 40.3
Morningstar Japan K.K. Morningstar Japan K.K. (MJKK) develops and markets products and services customized for the Japanesemarket. MJKK’s shares are traded on the Tokyo Stock Exchange under the ticker 47650. We account for our investment in MJKKusing the equity method. The following table summarizes our ownership percentage in MJKK and the market value of thisinvestment based on MJKK’s publicly quoted share price:
As of December 31
2017 2016
Morningstar’s approximate ownership of MJKK 34% 34%Approximate market value of Morningstar’s ownership in MJKK:Japanese yen (¥ in millions) ¥ 10,649.6 ¥ 8,558.2Equivalent U.S. dollars ($ in millions) $ 94.6 $ 73.2
Sustainalytics Holding B.V. In July 2017, we acquired a minority stake in Sustainalytics Holding B.V. (Sustainalytics), which is anindependent ESG and corporate governance research, ratings, and analysis firm supporting investors around the world with thedevelopment and implementation of responsible investment strategies. Our ownership in Sustainalytics as of December 31, 2017was 40%.
Other Equity Method Investments. As of December 31, 2017 and December 31, 2016, other equity method investments consist ofour investment in Ellevate Financial, Inc. (Ellevest), United Income, Inc. (United Income), and YCharts, Inc. (YCharts). Ellevestprovides an engaging investing experience to help women meet their financial goals. Our ownership interest in Ellevest wasapproximately 17% as of December 31, 2017 and 22% as of December 31, 2016. United Income helps investors transition toretirement and manage their retirement income. Our ownership interest in United Income was approximately 35% as of
114
9. Investments in Unconsolidated Entities

115
December 31, 2017 and 38% as of December 31, 2016. YCharts is a technology company that provides stock research andanalysis. Our ownership interest in YCharts was approximately 22% as of December 31, 2017 and 2016.
As of December 31, 2016, other equity method investments also includes our investment in Inquiry Financial Europe AB (InquiryFinancial). Inquiry Financial is a provider of sell-side consensus estimate data. Our ownership interest in Inquiry Financial wasapproximately 34% as of December 31, 2016. During 2017, we sold our stake in Inquiry Financial.
In December 2016, we purchased the remaining ownership interest in PitchBook. See Note 7 for additional information concerningour acquisition of PitchBook.
The following table shows our property, equipment, and capitalized software summarized by major category:
As of December 31
(in millions) 2017 2016
Computer equipment $ 81.6 $ 70.1Capitalized software 239.2 189.8Furniture and fixtures 27.6 26.0Leasehold improvements 72.5 69.0Telephone equipment 2.3 2.1Construction in progress 8.9 9.9
Property, equipment, and capitalized software, at cost 432.1 366.9Less accumulated depreciation (284.7) (214.8)
Property, equipment, and capitalized software, net $ 147.4 $ 152.1
The following table summarizes our depreciation expense:
(in millions) 2017 2016 2015
Depreciation expense $ 67.6 $ 51.3 $ 42.4
Depreciation expense in 2017 includes a $4.1 million impairment charge for certain software licenses due to a shift toward acloud-based strategy.
The following table shows our minimum future rental commitments due in each of the next five years and thereafter for allnon-cancelable operating leases, consisting primarily of commitments for office space:
Minimum Future Rental Commitments (in millions)
2018 $ 26.82019 30.42020 32.52021 29.82022 19.1Thereafter 54.9
Total $ 193.5
Morningstar, Inc. 2017 Annual Report 115
10. Property, Equipment, and Capitalized Software
11. Operating Leases
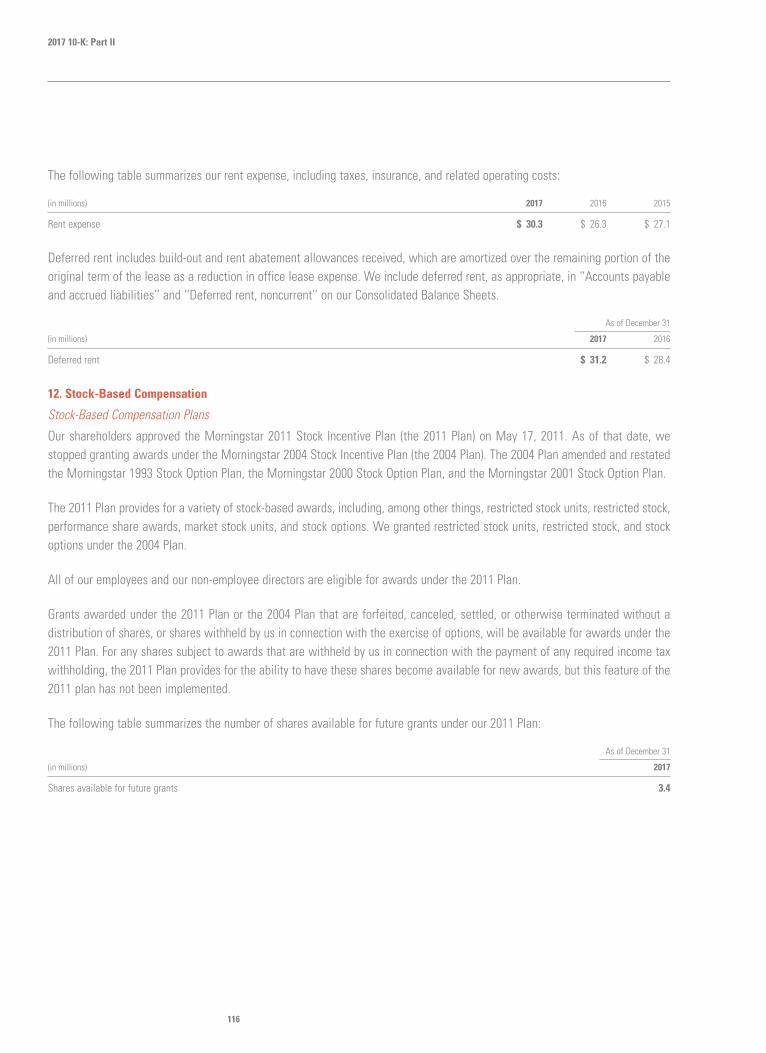
116
2017 10-K: Part II
The following table summarizes our rent expense, including taxes, insurance, and related operating costs:
(in millions) 2017 2016 2015
Rent expense $ 30.3 $ 26.3 $ 27.1
Deferred rent includes build-out and rent abatement allowances received, which are amortized over the remaining portion of theoriginal term of the lease as a reduction in office lease expense. We include deferred rent, as appropriate, in ‘‘Accounts payableand accrued liabilities’’ and ‘‘Deferred rent, noncurrent’’ on our Consolidated Balance Sheets.
As of December 31
(in millions) 2017 2016
Deferred rent $ 31.2 $ 28.4
Our shareholders approved the Morningstar 2011 Stock Incentive Plan (the 2011 Plan) on May 17, 2011. As of that date, westopped granting awards under the Morningstar 2004 Stock Incentive Plan (the 2004 Plan). The 2004 Plan amended and restatedthe Morningstar 1993 Stock Option Plan, the Morningstar 2000 Stock Option Plan, and the Morningstar 2001 Stock Option Plan.
The 2011 Plan provides for a variety of stock-based awards, including, among other things, restricted stock units, restricted stock,performance share awards, market stock units, and stock options. We granted restricted stock units, restricted stock, and stockoptions under the 2004 Plan.
All of our employees and our non-employee directors are eligible for awards under the 2011 Plan.
Grants awarded under the 2011 Plan or the 2004 Plan that are forfeited, canceled, settled, or otherwise terminated without adistribution of shares, or shares withheld by us in connection with the exercise of options, will be available for awards under the2011 Plan. For any shares subject to awards that are withheld by us in connection with the payment of any required income taxwithholding, the 2011 Plan provides for the ability to have these shares become available for new awards, but this feature of the2011 plan has not been implemented.
The following table summarizes the number of shares available for future grants under our 2011 Plan:
As of December 31
(in millions) 2017
Shares available for future grants 3.4
116
12. Stock-Based Compensation
Stock-Based Compensation Plans

117
The following table summarizes our stock-based compensation expense and the related income tax benefit we recorded in thepast three years:
Year ended December 31
(in millions) 2017 2016 2015
Restricted stock units $ 16.5 $ 14.6 $ 16.1Restricted stock — — 0.1Performance share awards 7.1 (0.1) 1.0Market stock units 0.5 — —Stock options — — 0.2
Total stock-based compensation expense $ 24.1 $ 14.5 $ 17.4
Income tax benefit related to the stock-based compensation expense $ 7.8 $ 4.3 $ 5.0
The following table summarizes the stock-based compensation expense included in each of our operating expense categories forthe past three years:
Year ended December 31
(in millions) 2017 2016 2015
Cost of revenue $ 9.6 $ 7.5 $ 8.1Sales and marketing 3.0 1.9 2.2General and administrative 11.5 5.1 7.1
Total stock-based compensation expense $ 24.1 $ 14.5 $ 17.4
The following table summarizes the amount of unrecognized stock-based compensation expense as of December 31, 2017 and theexpected number of months over which the expense will be recognized:
Unrecognizedstock-based Weighted average
compensation expectedexpense amortization
(in millions) period (months)
Restricted stock units $ 36.5 35Performance share awards — 12Market stock units 2.8 32
Total unrecognized stock-based compensation expense $ 39.3 35
In accordance with FASB ASC 718, Compensation—Stock Compensation, we estimate forfeitures of employee stock-basedawards and recognize compensation cost only for those awards expected to vest. Most of our larger annual equity grants typicallyhave vesting dates in the second quarter. We adjust the stock-based compensation expense annually in the third quarter to reflectthose awards that ultimately vested and update our estimate of the forfeiture rate that will be applied to awards not yet vested.
Restricted stock units represent the right to receive a share of Morningstar common stock when that unit vests. Restricted stockunits granted to employees vest ratably over a four-year period. Restricted stock units granted to non-employee directors vestratably over a three-year period.
Morningstar, Inc. 2017 Annual Report 117
Accounting for Stock-Based Compensation Awards
Restricted Stock Units

118
2017 10-K: Part II
We measure the fair value of our restricted stock units on the date of grant based on the closing market price of the underlyingcommon stock on the day prior to grant. We amortize that value to stock-based compensation expense, net of estimatedforfeitures, ratably over the vesting period.
The following table summarizes restricted stock unit activity during the past three years:
WeightedAverage
Grant DateVested but Value per
Restricted Stock Units (RSUs) Unvested Deferred Total RSU
RSUs Outstanding—December 31, 2014 655,934 14,778 670,712 $ 67.51Granted 235,213 — 235,213 77.17Dividend equivalents 1,409 146 1,555 56.42Vested (253,038) — (253,038) 64.65Forfeited (66,992) — (66,992) 53.61
RSUs Outstanding—December 31, 2015 572,526 14,924 587,450 $ 72.14Granted 241,609 — 241,609 77.82Dividend equivalents 370 136 506 56.52Vested (225,590) — (225,590) 69.39Issued — (5,312) (5,312) 44.47Forfeited (47,670) — (47,670) 74.45
RSUs Outstanding—December 31, 2016 541,245 9,748 550,993 $ 75.77Granted 331,470 — 331,470 78.33Dividend equivalents — 78 78 60.99Vested (212,005) — (212,005) 75.38Issued — (6,547) (6,547) 49.40Forfeited (55,831) — (55,831) 76.49
RSUs Outstanding—December 31, 2017 604,879 3,279 608,158 $ 77.52
In March 2015 and 2016, executive officers, other than Joe Mansueto, and certain other employees, were granted performanceshare awards. These awards entitle the holder to a number of shares of Morningstar common stock equal to the number ofnotional performance shares that become vested. Each award specifies a number of performance shares that will vest ifpre-established target performance goals are attained. The number of performance shares that actually vest may be more or lessthan the specified number of performance shares to the extent Morningstar exceeds or fails to achieve, respectively, the targetperformance goals over a three-year performance period.
We base the grant date fair value for these awards on the closing market price of the underlying common stock on the day prior tothe grant date. We amortize that value to stock-based compensation expense ratably over the vesting period based on thesatisfaction of the performance condition that is most likely to be satisfied over the three-year performance period.
The table below shows target performance share awards granted and shares that would be issued at current performance levelsfor performance share awards granted as of December 31, 2017:
As of December 31, 2017
Target performance share awards granted 93,701Weighted average fair value per award $ 77.55Number of shares that would be issued based on current performance levels —Unamortized expense, based on current performance levels (in millions) $ —
118
Performance Share Awards

119
In May and November 2017, executive officers, other than Joe Mansueto, and certain other employees, were granted marketstock units. These market stock units represent the right to receive a target number of shares that will vest at the end of athree-year performance period depending on the company’s total shareholder return over that three-year period.
We measure the fair value of our market stock units on the date of grant using a Monte Carlo valuation model. We amortize thatvalue to stock-based compensation expense ratably over the vesting period.
We used the following assumptions to estimate the fair value of our market stock units during 2017:
Assumptions for Monte Carlo Valuation Model
Expected Dividend Risk-freeGrant Date volatility yield interest rate
May 15, 2017 17.4% 1.20% 1.49%November 15, 2017 17.7% 1.04% 1.79%
The table below shows market stock units granted and target market stock units outstanding as of December 31, 2017:
As of December 31, 2017
Market stock units granted 45,663Weighted average fair value per award $ 72.29Number of target market stock units outstanding 44,606Unamortized expense, based on current performance levels (in millions) $ 2.8
In connection with our acquisition of PitchBook, we adopted a management bonus sub-plan under the 2011 Plan for certainemployees of PitchBook (the PitchBook Plan). Pursuant to the terms of the PitchBook Plan, awards having an aggregate targetvalue equal to $30.0 million will be available for issuance with annual grants of $7.5 million for 2017, $7.5 million in 2018, and$15.0 million in 2019.
Each grant will consist of performance-based share unit awards which will vest over a one-year period and will be measuredprimarily based on the achievement of certain annual revenue targets specifically related to PitchBook’s business. Uponachievement of these targets, earned performance units will be settled in shares of our common stock on a one-for-one basis. IfPitchBook exceeds certain performance conditions, the PitchBook Plan participants may receive payment for performance units inexcess of the aggregate target values described above. If PitchBook fails to meet threshold performance conditions, the PitchBookPlan participants will not be entitled to receive payment for any performance units. In certain circumstances, the PitchBook Planparticipants may be able to receive a catch-up award with respect to 2017 or 2018 if certain additional performance conditions aremet in a subsequent year.
The table below shows target performance share awards granted and shares that will be issued based on final performance levelsfor performance share awards granted as of December 31, 2017:
As of December 31, 2017
Target performance share awards granted 100,924Weighted average fair value per award $ 74.31Number of shares that will be issued based on final 2017 performance levels 113,941Unamortized expense, based on current performance levels (in millions) $ —
Morningstar, Inc. 2017 Annual Report 119
Market Stock Units
PitchBook Bonus Plan

120
2017 10-K: Part II
Stock options granted to employees vest ratably over a four-year period. Grants to our non-employee directors vest ratably over athree-year period. All grants expire 10 years after the date of grant.
In May 2011, we granted 86,106 stock options under the 2004 Stock Incentive Plan. In November 2011, we granted 6,095 stockoptions under the 2011 Plan. All options granted in 2011 have an exercise price equal to the fair market value on the grant date.We estimated the fair value of the options on the grant date using a Black-Scholes option-pricing model. The weighted averagefair value of options granted during 2011 was $23.81 per share, based on the following assumptions:
Assumptions for Black-Scholes Option Pricing Model
Expected life (years): 7.4Volatility factor: 35.1%Dividend yield: 0.35%Interest rate: 2.87%
The following table summarizes stock option activity in the past three years for our various stock option grants:
2017 2016 2015
Weighted Weighted WeightedAverage Average Average
All Other Option Grants, Excluding Activity Underlying Exercise Underlying Exercise Underlying ExerciseShown Above Shares Price Shares Price Shares Price
Options outstanding—beginning of year 46,001 $ 57.28 52,096 $ 57.52 169,810 $ 40.20Granted — — — — — —Canceled — — — — — —Exercised (4,316) 57.28 (6,095) 59.35 (117,714) 32.91
Options outstanding—end of year 41,685 $ 57.28 46,001 $ 57.28 52,096 $ 57.52
Options exercisable—end of year 41,685 $ 57.28 46,001 $ 57.28 52,096 $ 57.52
The following table summarizes the total intrinsic value (difference between the market value of our stock on the date of exerciseand the exercise price of the option) of options exercised:
(in millions) 2017 2016 2015
Intrinsic value of options exercised $ 0.1 $ 0.1 $ 5.1
120
Stock Options

121
The table below shows additional information for options outstanding and exercisable as of December 31, 2017:
Options Outstanding Options Exercisable
Weighted WeightedAverage Weighted Aggregate Average Weighted Aggregate
Remaining Average Intrinsic Remaining Average IntrinsicNumber of Contractual Exercise Value Exercisable Contractual Exercise Value
Range of Exercise Prices Options Life (years) Price (in millions) Shares Life (years) Price (in millions)
$57.28 41,685 3.37 $ 57.28 $ 1.7 41,685 3.37 $ 57.28 $ 1.7
Vested or Expected to Vest$57.28 41,685 3.37 $ 57.28 $ 1.7
The aggregate intrinsic value in the table above represents the total pretax intrinsic value all option holders would have received ifthey had exercised all outstanding options on December 31, 2017. The intrinsic value is based on our closing stock price of $96.97on December 29, 2017.
We sponsor a defined contribution 401(k) plan, which allows our U.S.-based employees to voluntarily contribute pre-tax dollars upto a maximum amount allowable by the U.S. Internal Revenue Service. In 2017, 2016, and 2015, we made matching contributionsto our 401(k) plan in the United States in an amount equal to 75 cents for every dollar of an employee’s contribution, up to amaximum of 7% of the employee’s compensation in the pay period.
The following table summarizes our matching contributions:
(in millions) 2017 2016 2015
401(k) matching contributions $ 10.4 $ 9.0 $ 8.3
The following table shows our income tax expense and our effective tax rate for the years ended December 31, 2017, 2016, and2015:
(in millions) 2017 2016 2015
Income before income taxes and equity in net income (loss) of unconsolidated entities $ 181.1 $ 224.9 $ 193.7Equity in net income (loss) of unconsolidated entities (1.3) (0.2) 1.8Net income attributable to the noncontrolling interest — — (0.2)
Total $ 179.8 $ 224.7 $ 195.3
Income tax expense $ 42.9 $ 63.7 $ 62.7Effective tax rate 23.9% 28.3% 32.1%
On December 22, 2017, the President of the United States signed into law the Tax Cuts and Jobs Act (‘‘Tax Reform Act’’). Thelegislation significantly changes U.S. tax law by, among other things, lowering corporate income tax rates, changing to a territorialtax system and imposing a transitional tax on deemed repatriated earnings of foreign subsidiaries. The Tax Reform Actpermanently reduces the U.S. corporate income tax rate from a maximum of 35% to a flat 21% rate, effective January 1, 2018.
On December 22, 2017, the SEC staff issued Staff Accounting Bulletin No. 118 (‘‘SAB 118’’) to address the application ofU.S. GAAP in situations when a registrant does not have the necessary information available, prepared, or analyzed (including
Morningstar, Inc. 2017 Annual Report 121
13. Defined Contribution Plan
14. Income Taxes
Income Tax Expense and Effective Tax Rate
122
2017 10-K: Part II
computations) in reasonable detail to complete the accounting for certain income tax effects of the Tax Reform Act. We haverecognized the provisional tax impacts related to the changes under the Tax Reform Act and have included these amounts in ourconsolidated financial statements for the year ended December 31, 2017. The ultimate impact may differ from these provisionalamounts, possibly materially, due to, among other things, additional analysis, changes in interpretations and assumptions that wehave made, additional regulatory guidance that may be issued, and actions that we may take as a result of the Tax Reform Act.The accounting is expected to be complete when our 2017 U.S. corporate income tax return is filed in 2018.
We use the asset and liability method of accounting for income taxes. Under this method, deferred tax assets and liabilities arerecognized for the future tax consequences attributable to differences between the financial statement carrying amounts ofexisting assets and liabilities and their respective tax basis. Deferred tax assets and liabilities are measured using enacted taxrates expected to apply to taxable income in the years in which those temporary differences are expected to reverse. As a result ofthe reduction in the U.S. corporate income tax rate from 35% to 21% under the Tax Reform Act, we revalued our ending netdeferred tax liabilities at December 31, 2017 and recognized a provisional $14.7 million tax benefit in our Consolidated Statementof Income for the year ended December 31, 2017.
With respect to the transitional tax related to the change to a territorial system, the Tax Reform Act provided for a one-timedeemed mandatory repatriation of post-1986 undistributed foreign subsidiary earnings and profits (‘‘E&P’’) through the year endedDecember 31, 2017. We had an estimated $183.7 million of undistributed foreign E&P subject to the deemed mandatoryrepatriation. After the utilization of corresponding tax credits, we have recorded a provisional tax charge of $7.5 million on thedeemed mandatory repatriation of earnings of our foreign subsidiaries payable over 8 years. We have also recorded a provisionalreduction of a deferred tax liability of $6.4 million previously recorded for our foreign equity method investments. The transitionaltax charge of $7.5 million offset by the reduction of the $6.4 million deferred tax liability results in a net tax expense of$1.1 million on the deemed mandatory repatriation of earnings of our foreign affiliates.
We are continuing to assess our indefinite reinvestment assertion as a result of the Tax Reform Act. We have recorded aprovisional estimate of deferred taxes in the amount of $3.0 million for foreign withholding taxes that would be due uponremittance of dividends from certain of our foreign affiliates. We are still evaluating whether to change our overall indefinitereinvestment assertion in light of the Tax Reform Act and consider our conclusion to be incomplete under SAB 118. Accordingly,we consider that most of our remaining foreign outside basis differences to be indefinitely reinvested. Accordingly, we have notrecorded deferred taxes on those outside basis differences. As part of our continuing evaluation, we will need to gather additionalinformation to compute outside basis differences for our foreign affiliates in order to assess whether any new deferred taxesshould be recorded. We will also need to account for any prospective interpretive guidance issued on the Tax Reform Act as part ofour evaluation. If we subsequently change our assertion during the measurement period allowed under SAB 118, we will accountfor a change in assertion as part of our accounting for the Tax Reform Act.
The Tax Reform Act also establishes other provisions that may affect our 2018 results, including but not limited to, the creation ofa new minimum tax called the base erosion anti-abuse tax (BEAT); a new provision that taxes U.S. allocated expenses(e.g. interest and general administrative expenses) as well as currently taxes certain income from foreign operations (GlobalIntangible Low-Tax Income, or ‘‘GILTI’’); a new limitation on deductible interest expense; the repeal of the domestic manufacturingdeduction; and limitations on the deductibility of certain employee compensation.
The BEAT provisions in the Tax Reform Act eliminate the deduction of certain base-erosion payments made to related foreigncorporations and impose a minimum tax if greater than regular tax. We are still evaluating the BEAT provisions which areapplicable after December 31, 2017.
122

123
While the Tax Reform Act generally eliminates U.S. federal income tax on dividends from foreign subsidiaries going forward,certain income earned by certain subsidiaries may be included in our U.S. taxable income under the new GILTI inclusion rules (as aresult of U.S. expense allocation rules). Because of the complexity of the new GILTI tax rules, we are continuing to evaluate thisprovision of the Tax Reform Act and the application of U.S. GAAP. Under U.S. GAAP, we are allowed to make an accounting policyelection and either treat taxes due from GILTI as a current-period expense when they are incurred or factor such amounts into ourmeasurement of deferred taxes. Our selection of an accounting policy with respect to the new GILTI rules will depend in part onanalyzing our global income to determine whether we expect to have future U.S. inclusions in taxable income related to GILTI, andif so, what the impact is expected to be. We have not yet computed a reasonable estimate of the effect of this provision, andtherefore, we have not made a policy decision regarding whether to record deferred taxes related to GILTI nor have we made anyadjustments related to GILTI tax in our year-end financial statements.
The following table reconciles our income tax expense at the U.S. federal income tax rate of 35% to income tax expense asrecorded:
2017 2016 2015
(in millions, except percentages) Amount % Amount % Amount %
Income tax expense at U.S. federal rate $ 63.0 35.0% $ 78.6 35.0% $ 68.4 35.0%State income taxes, net of federal income tax benefit 3.0 1.7 4.5 2.0 6.6 3.4Change in U.S. tax rate (14.7) (8.2) — — — —Deemed mandatory repatriation 7.5 4.2 — — — —Reduction of deferred tax liabilities for foreign equity method investments (6.4) (3.6) — — — —Withholding tax—repatriation 3.0 1.7 — — — —Stock-based compensation activity 0.3 0.2 (0.6) (0.3) 0.4 0.2Equity in net income of unconsolidated subsidiaries (including holding gains upon
acquisition) 1.2 0.7 (12.1) (5.4) — —Book gain over tax gain on sale of HelloWallet (6.8) (3.8) — — — —Net change in valuation allowance related to non-U.S. deferred tax assets, primarily net
operating losses 0.1 0.1 (0.1) — (2.0) (1.0)Difference between U.S. federal statutory and foreign tax rates (5.2) (2.9) (5.3) (2.4) (4.4) (2.3)Change in unrecognized tax benefits 1.2 0.7 2.6 1.2 (1.4) (0.7)Credits and incentives (3.7) (2.1) (3.7) (1.6) (5.1) (2.6)Other—net 0.4 0.2 (0.2) (0.1) 0.2 0.1
Total income tax expense $ 42.9 23.9% $ 63.7 28.3% $ 62.7 32.1%
Morningstar, Inc. 2017 Annual Report 123

124
2017 10-K: Part II
Income tax expense consists of the following:
Year ended December 31
(in millions) 2017 2016 2015
Current tax expense:U.S.
Federal $ 40.3 $ 42.8 $ 42.8State 6.6 6.5 8.3
Non-U.S. 9.9 9.7 8.7
Current tax expense 56.8 59.0 59.8
Deferred tax expense (benefit):U.S.
Federal (10.9) 5.1 4.3State (1.9) 0.4 1.8
Non-U.S. (1.1) (0.8) (3.2)
Deferred tax expense, net (13.9) 4.7 2.9
Income tax expense $ 42.9 $ 63.7 $ 62.7
The following table provides our income before income taxes and equity in net income (loss) of unconsolidated entities, generatedby our U.S. and non-U.S. operations:
Year ended December 31
(in millions) 2017 2016 2015
U.S. $ 143.5 $ 186.5 $ 160.6Non-U.S. 37.6 38.4 33.1
Income before income taxes and equity in net income (loss) of unconsolidated entities $ 181.1 $ 224.9 $ 193.7
124

125
We recognize deferred income taxes for the temporary differences between the carrying amount of assets and liabilities forfinancial statement purposes and their tax basis. The tax effects of the temporary differences that give rise to the deferred incometax assets and liabilities are as follows:
As of December 31
(in millions) 2017 2016
Deferred tax assets:Stock-based compensation expense $ 3.7 $ 2.6Accrued liabilities 14.2 19.0Deferred revenue 3.5 5.1Net operating loss carryforwards-U.S. federal and state 1.9 12.9Net operating loss carryforwards-Non-U.S. 3.1 3.0Credits and incentive carryforwards 0.3 0.6Deferred royalty revenue 0.2 0.3Allowance for doubtful accounts 1.1 1.2Deferred rent 6.2 10.3Other 0.3 —
Total deferred tax assets 34.5 55.0
Deferred tax liabilities:Acquired intangible assets (18.6) (34.3)Property, equipment, and capitalized software (24.6) (37.6)Unrealized exchange gains, net (0.6) (0.1)Prepaid expenses (3.9) (5.3)Investments in unconsolidated entities (5.4) (14.0)Withholding tax-foreign dividends (3.0) —Other — (0.3)
Total deferred tax liabilities (56.1) (91.6)
Net deferred tax liability before valuation allowance (21.6) (36.6)Valuation allowance (2.0) (1.6)
Deferred tax liability, net $ (23.6) $ (38.2)
The deferred tax assets and liabilities are presented in our Consolidated Balance Sheets as follows:
As of December 31
(in millions) 2017 2016
Deferred tax liability, net $ (23.6) $ (38.2)
The following table summarizes our U.S. net operating loss (NOL) carryforwards:
As of December 31
(in millions) 2017 2016
Expiration Dates Expiration Dates
U.S. federal NOLs subject to expiration dates $ 9.1 2023-2036 $ 36.9 2023-2036
The net decrease in the U.S. federal NOL carryforwards as of December 31, 2017 compared with 2016 primarily reflects theutilization of U.S. federal NOLs. We have not recorded a valuation allowance against the U.S. federal NOLs of $9.1 millionbecause we expect the benefit of the U.S. federal NOLs to be fully utilized before expiration.
Morningstar, Inc. 2017 Annual Report 125
Deferred Tax Assets and Liabilities

126
2017 10-K: Part II
The following table summarizes our NOL carryforwards for our non-U.S. operations:
As of December 31
(in millions) 2017 2016
Non-U.S. NOLs subject to expiration dates from 2019 through 2037 $ 5.7 $ 3.8Non-U.S. NOLs with no expiration date 9.1 10.8
Total $ 14.8 $ 14.6
Non-U.S. NOLs not subject to valuation allowances $ 5.4 $ 6.8
The change in non-U.S. NOL carryforwards as of December 31, 2017 compared with 2016 primarily reflects the use of NOLcarryforwards offset by NOLs generated.
In assessing the realizability of our deferred tax assets, we consider whether it is more likely than not that some portion or all ofthe deferred tax assets will not be realized. We have recorded a valuation allowance against all but approximately $5.4 million ofthe non-U.S. NOLs, reflecting the likelihood that the benefit of these NOLs will not be realized.
We conduct business globally and as a result, we file income tax returns in U.S. federal, state, local, and foreign jurisdictions. Inthe normal course of business, we are subject to examination by tax authorities throughout the world. The open tax years for ourU.S. Federal tax returns and most state tax returns include the years 2008 to the present.
We are currently under audit by federal, state and local tax authorities in the United States as well as tax authorities in certainnon-U.S. jurisdictions. It is likely that the examination phase of some of these U.S. federal, state, local, and non-U.S. audits willconclude in 2018. It is not possible to estimate the effect of current audits on previously recorded unrecognized tax benefits.
As of December 31, 2017, our Consolidated Balance Sheet included a current liability of $8.7 million and a non-current liability of$7.0 million for unrecognized tax benefits. As of December 31, 2016, our Consolidated Balance Sheet included a current liability of$8.9 million and a non-current liability of $5.4 million for unrecognized tax benefits. These amounts include interest and penalties,less any associated tax benefits.
The table below reconciles the beginning and ending amount of the gross unrecognized tax benefits as follows:
(in millions) 2017 2016
Gross unrecognized tax benefits—beginning of the year $ 18.4 $ 14.5Increases as a result of tax positions taken during a prior-year period 1.4 2.2Decreases as a result of tax positions taken during a prior-year period (0.4) (0.1)Increases as a result of tax positions taken during the current period 1.9 2.4Decreases relating to settlements with tax authorities — —Reductions as a result of lapse of the applicable statute of limitations (2.6) (0.6)
Gross unrecognized tax benefits—end of the year $ 18.7 $ 18.4
In 2017, we recorded a net increase of $2.9 million of gross unrecognized tax benefits before settlements and lapses of statutes oflimitations, of which $2.9 million increased our income tax expense by $3.1 million. In addition, we reduced our unrecognized taxbenefits by $2.6 million for settlements and lapses of statutes of limitations, of which $2.6 million decreased our income taxexpense by $2.2 million.
126
Uncertain Tax Positions

127
As of December 31, 2017, we had $18.7 million of gross unrecognized tax benefits, of which $15.0 million, if recognized, wouldreduce our effective income tax rate and decrease our income tax expense by $14.4 million.
We record interest and penalties related to uncertain tax positions as part of our income tax expense. The following tablesummarizes our gross liability for interest and penalties:
As of December 31
(in millions) 2017 2016
Liabilities for interest and penalties $ 1.7 $ 1.6
We recorded the increase in the liabilities for penalties and interest, net of any tax benefits, to income tax expense in ourConsolidated Statement of Income in 2017.
In August 2017, Michael D. Green, individually and purportedly on behalf of all others similarly situated, filed a complaint in theUnited States District Court for the Northern District of Illinois. The complaint names as defendants Morningstar, Inc., PrudentialInvestment Management Services LLC, and Prudential Retirement Insurance and Annuity Co., and contains one count allegingviolation of the Racketeer Influenced and Corrupt Organizations Act (RICO). Plaintiff, a participant in a pension plan, alleges thatthe defendants engaged in concerted racketeering actions to steer plan participants into high-cost investments that payunwarranted fees to the defendants. The complaint seeks unspecified compensatory damages for plaintiff and the members of theputative class, treble damages, injunctive relief, costs, and attorneys’ fees. Morningstar has filed a motion to dismiss thecomplaint, which is fully briefed and under advisement by the court. Although Morningstar is vigorously contesting the claimasserted, we cannot predict the outcome of the proceeding.
We are involved from time to time in legal proceedings and litigation that arise in the normal course of our business. While it isdifficult to predict the outcome of any particular proceeding, we do not believe the result of any of these matters will have amaterial adverse effect on our business, operating results, or financial position.
We had an ongoing authorization, originally approved by our board of directors in September 2010 and subsequently amended, torepurchase up to $1.0 billion in shares of our outstanding common stock. The authorization expired on December 31, 2017.
As of December 31, 2017, we had repurchased a total of 10,574,857 shares for $714.8 million under this authorization, leaving noshares available for future repurchases as the plan expired on December 31, 2017. On December 8, 2017, the board of directorsapproved a new share repurchase program that authorizes the company to repurchase up to $500.0 million in shares of thecompany’s outstanding common stock, effective January 1, 2018. The authorization expires on December 31, 2020. We mayrepurchase shares from time to time at prevailing market prices on the open market or in private transactions in amounts that wedeem appropriate.
Morningstar, Inc. 2017 Annual Report 127
15. Contingencies
Michael D. Green
Other Matters
16. Share Repurchase Program

128
2017 10-K: Part II
On May 28, 2014, the FASB issued ASU No. 2014-09, Revenue from Contracts with Customers, which requires an entity torecognize the amount of revenue to which it expects to be entitled for the transfer of promised goods or services to customers. TheASU will replace most existing revenue recognition guidance in U.S. GAAP when it becomes effective. The original effective datefor ASU No. 2014-09 would have required us to adopt it beginning on January 1, 2017. In August 2015, the FASB issued ASUNo. 2015-14, Revenue from Contracts with Customers—Deferral of the Effective Date, which defers the effective date of ASUNo. 2014-09 for one year and permits early adoption as early as the original effective date of ASU No. 2014-09. We elected thedeferral, and the new standard is effective for us on January 1, 2018.
We have obtained an understanding of ASU No. 2014-09 and have substantially completed our analysis of the impact of the newstandard on our financial results. We have completed a high-level assessment of the attributes within our contracts for our majorproducts and services, and we have assessed the impacts to our internal processes, control environment, and disclosures. Wehave determined that the adoption of ASU No. 2014-09 will not result in a material change to the timing of when revenue isrecognized and we intend to retain similar accounting treatment used to recognize revenue under current practices. We haveidentified that there will be certain changes in accounting treatment related to delivery of third-party content (principal vs. agent)and costs to obtain contracts (e.g., sales commissions).
The change related to delivery of third-party content (principal vs. agent) is expected to result in no impact on our consolidatedoperating income; however it will result in a increase in both revenue and cost of revenue versus prior periods of approximately$6 million to $7 million as revenue will be recognized on a gross rather than net basis for certain arrangements.
The change related to the capitalization of cost to obtain contracts is expected to result in an increase to retained earnings ofapproximately $25 million to $30 million for commission expenses which were previously expensed. We expected to amortize thisadjustment over a period not to exceed three years and expect 2018 commission expense resulting from this change will rangebetween $14 million and $16 million. Additionally, in 2018 we will expense any discretionary payments made under ourcommission plans as well as pro-rata portions of any new commission amounts paid in 2018.
The standard allows for both retrospective and modified retrospective methods of adoption. We plan to adopt using the modifiedretrospective transition method applied to those contracts which were not completed as of January 1, 2018. Upon adoption, wewill recognize the cumulative effect of adopting this guidance as an adjustment to our opening balance of retained earnings asnoted above. Prior periods will not be retrospectively adjusted and we will discuss the comparability of these adjustments withinour 2018 results against the prior periods.
We are continuing to evaluate the effect that ASU No. 2014-09 will have on our consolidated financial statement presentation andrelated disclosures. We expect expanded disclosures related to the revenue recognized in the reporting period that was includedin the contract liability (i.e., deferred revenue) balance at the beginning of the period. We also plan to provide additionaldisclosures on our unsatisfied performance obligations at the end of the period and expected timing of when that contract liabilitywill be recognized into revenue.
On March 17, 2016, the FASB issued ASU No. 2016-08, Revenue from Contracts with Customers: Principal versus AgentConsiderations (Reporting Revenue Gross versus Net), which provides guidance on assessing whether an entity is a principal or anagent in a revenue transaction and whether an entity reports revenue on a gross or net basis. On April 14, 2016, the FASB issuedASU No. 2016-10, Revenue from Contracts with Customers: Identifying Performance Obligations and Licensing, which providesguidance on identifying performance obligations and accounting for licenses of intellectual property. On May 6, 2016, the FASB
128
17. Recently Issued Accounting Pronouncements

129
issued ASU No. 2016-11, Revenue Recognition and Derivatives and Hedging: Rescission of SEC guidance because of ASUNo. 2014-09 and ASU No. 2014-16 pursuant to staff announcements at the March 3, 2016 EITF Meeting, which rescinds thefollowing SEC Staff Observer comments from ASC 605, Revenue Recognition, upon an entity’s early adoption of ASC 606, Revenuefrom Contracts with Customers: Revenue and expense recognition for freight services in process, accounting for shipping andhandling fees and costs, and accounting for consideration given by a vendor to a customer (including a reseller of the vendor’sproducts). On May 9, 2016, the FASB issued ASU No. 2016-12, Revenue from Contracts with Customers: Narrow-ScopeImprovements and Practical Expedients, which makes narrow-scope amendments to ASU No. 2014-09 and provides practicalexpedients to simplify the transition to the new standard and clarify certain aspects of the standard. On December 21, 2016, theFASB issued ASU No. 2016-20, Technical Corrections and Improvements to Topic 606, Revenue from Contracts with Customers,which makes narrow-scope amendments to ASU No. 2014-09.
The effective date and transition requirements for ASU No. 2016-08, ASU No. 2016-10, ASU No. 2016-11, ASU No. 2016-12, andASU No. 2016-20 are the same as the effective date and transition requirements of ASU No. 2014-09. We are evaluating theeffect that ASU No. 2016-08, ASU No. 2016-10, ASU No. 2016-11, ASU No. 2016-12, and ASU No. 2016-20 will have on ourconsolidated financial statements and related disclosures.
On February 25, 2016, the FASB issued ASU No. 2016-02, Leases, which will require lessees to recognize almost all leases on theirbalance sheet as a right-of-use asset and a lease liability. The new standard is effective for us on January 1, 2019. The newstandard must be adopted using a modified retrospective transition and provides for certain practical expedients. Transition willrequire application of the new guidance at the beginning of the earliest comparative period presented. We are evaluating theeffect that ASU No. 2016-02 will have on our consolidated financial statements and related disclosures.
On August 26, 2016, the FASB issued ASU No. 2016-15, Statement of Cash Flows: Classification of Certain Cash Receipts andCash Payments, which reduces diversity in practice of how certain transactions are classified in the statement of cash flows. Thenew guidance clarifies the classification of cash activities related to debt prepayment or debt extinguishment costs, settlement ofzero-coupon debt instruments, contingent consideration payments made after a business combination, proceeds from thesettlement of insurance claims, proceeds from the settlement of corporate and bank-owned life insurance policies, distributionsreceived from equity-method investments, and beneficial interests in securitization transactions. The guidance also describes apredominance principle in which cash flows with aspects of more than one class that cannot be separated should be classifiedbased on the activity that is likely to be the predominant source or use of cash flow.
The new standard is effective for us on January 1, 2018. Early adoption is permitted, including adoption in an interim period, butrequires all elements of the amendments to be adopted at once rather than individually. The new standard must be adopted usinga retrospective transition method. We are evaluating the effect that ASU No. 2016-15 will have on our consolidated financialstatements and related disclosures.
On January 5, 2017, the FASB issued ASU No. 2017-01, Business Combinations: Clarifying the Definition of a Business, whichrevises the definition of a business. When substantially all of the fair value of gross assets acquired is concentrated in a singleasset (or a group of similar assets), the assets acquired would not represent a business. To be considered a business, anacquisition would have to include an input and a substantive process that together significantly contribute to the ability to createoutputs. The new guidance provides a framework to evaluate when an input and substantive process are present (including forearly-stage companies that have not generated outputs). To be a business without outputs, there will now need to be an organizedworkforce. The new guidance also narrows the definition of the term outputs to be consistent with how it is described inTopic 606, Revenue from Contracts with Customers. The new standard is effective for us on January 1, 2018. Early adoption is
Morningstar, Inc. 2017 Annual Report 129

130
2017 10-K: Part II
permitted. We are evaluating the effect that ASU No. 2017-01 will have on our consolidated financial statements and relateddisclosures.
On January 26, 2017, the FASB issued ASU No. 2017-04, Intangibles—Goodwill and Other, which simplifies the accounting forgoodwill impairment. The guidance removes Step 2 of the goodwill impairment test, which requires a hypothetical purchase priceallocation. A goodwill impairment will now be the amount by which a reporting unit’s carrying value exceeds its fair value, not toexceed the carrying amount of goodwill. All other goodwill impairment guidance will remain largely unchanged. Entities willcontinue to have the option to perform a qualitative assessment to determine if a quantitative impairment test is necessary. Thesame one-step impairment test will be applied to goodwill at all reporting units, even those with zero or negative carryingamounts. Entities will be required to disclose the amount of goodwill at reporting units with zero or negative carrying amounts.The new standard is effective for us on January 1, 2020. The new standard should be applied prospectively. Early adoption ispermitted for any impairment tests performed after January 1, 2017. We are evaluating the effect that ASU No. 2017-04 will haveon our consolidated financial statements and related disclosures.
On May 10, 2017, the FASB issued ASU No. 2017-09, Compensation—Stock Compensation: Scope of Modification Accounting,which clarifies when to account for a change to the terms or conditions of a share-based payment award as a modification. Underthe new guidance, modification accounting is required only if the fair value, the vesting conditions, or the classification of theaward (as equity or liability) changes as a result of the change in terms or conditions. The new standard is effective for us onJanuary 1, 2018. The new standard should be applied prospectively. Early adoption is permitted. We are evaluating the effect thatASU No. 2017-09 will have on our consolidated financial statements and related disclosures.
130

131
2016 2017
(in millions except per share amounts) Q1 Q2 Q3 Q4 Q1 Q2 Q3 Q4
Revenue $ 192.1 $ 198.2 $ 196.1 $ 212.2 $ 209.5 $ 229.2 $ 229.9 $ 243.1Total operating expense 149.8 153.8 151.9 162.3 181.1 183.2 177.1 200.5
Operating income 42.3 44.4 44.2 49.9 28.4 46.0 52.8 42.6Non-operating income (expense),
net 0.5 3.0 2.1 38.5 (1) (1.3) 15.3 (2) (2.0) (0.7)
Income before income taxes andequity in net income (loss) ofunconsolidated entities 42.8 47.4 46.3 88.4 27.1 61.3 50.8 41.9
Equity in net income (loss) ofunconsolidated entities 0.5 (0.2) 0.4 (0.9) (0.8) (0.2) — (0.3)
Income tax expense 14.6 15.4 16.5 17.2 8.3 15.0 16.9 2.7 (3)
Consolidated net income $ 28.7 $ 31.8 $ 30.2 $ 70.3 $ 18.0 $ 46.1 $ 33.9 $ 38.9
Net income per share:Basic $ 0.67 $ 0.74 $ 0.70 $ 1.63 $ 0.42 $ 1.07 $ 0.80 $ 0.91Diluted $ 0.67 $ 0.73 $ 0.70 $ 1.63 $ 0.42 $ 1.07 $ 0.79 $ 0.91
Dividends per common share:Dividends declared per common
share $ 0.22 $ 0.22 $ 0.22 $ 0.23 $ 0.23 $ 0.23 $ — $ 0.48Dividends paid per common
share $ 0.22 $ 0.22 $ 0.22 $ 0.22 $ 0.23 $ 0.23 $ 0.23 $ 0.23
Weighted average sharesoutstanding:
Basic 43.0 43.0 43.1 43.0 42.9 42.9 42.5 42.5Diluted 43.1 43.3 43.3 43.2 43.2 43.1 42.8 42.9
(1) Non-operating income in the fourth quarter of 2016 included a $37.1 million holding gain related to the purchase of the remaining ownership interest in PitchBook, which waspreviously a minority investment.
(2) Non-operating income in the second quarter of 2017 included a $17.5 million gain on the sale of HelloWallet. We recorded an immaterial adjustment to this gain in the fourth quarterof 2017.
(3) Tax expense in the fourth quarter of 2017 includes a net benefit of $10.6 million related to the impact of the Tax Reform Act.
Morningstar, Inc. 2017 Annual Report 131
18. Selected Quarterly Financial Data (unaudited)

132
2017 10-K: Part II
Not applicable.
We design disclosure controls and procedures to reasonably assure that information required to be disclosed in the reports filed orsubmitted under the Exchange Act is recorded, processed, summarized, and reported within the time periods specified in the SEC’srules and forms. Disclosure controls and procedures include, without limitation, controls and procedures designed to reasonablyassure that information required to be disclosed in the reports filed under the Exchange Act is accumulated and communicated tomanagement, including the chief executive officer and chief financial officer, as appropriate, to allow timely decisions regardingrequired disclosure.
We carried out an evaluation of the effectiveness of the design and operation of our disclosure controls and procedures, asdefined in Rules 13a-15(e) and 15d-15(e) of the Exchange Act, as of December 31, 2017. Management, including our chiefexecutive officer and chief financial officer, participated in and supervised this evaluation. Based on that evaluation, our chiefexecutive officer and chief financial officer concluded that our disclosure controls and procedures are effective to providereasonable assurance that information required to be disclosed in the reports we file or submit under the Exchange Act meets therequirements listed above.
Our management is responsible for establishing and maintaining adequate internal control over financial reporting. Our internalcontrol over financial reporting is a process designed to provide reasonable assurance regarding the reliability of financialreporting and the preparation of financial statements for external purposes in accordance with U.S. generally accepted accountingprinciples.
We carried out an evaluation, under the supervision and with the participation of our management, including our chief executiveofficer and chief financial officer, of the effectiveness of our internal control over financial reporting based on the framework setforth in Internal Control—Integrated Framework (2013) issued by the Committee of Sponsoring Organizations of the TreadwayCommission.
Based on that evaluation, our management concluded that our internal control over financial reporting was effective as ofDecember 31, 2017.
KPMG LLP, our independent registered public accounting firm, has issued its report on the effectiveness of our internal control overfinancial reporting, which is included in Part II, Item 8 of this Form 10-K under the caption ‘‘Financial Statements andSupplementary Data’’ and incorporated herein by reference.
There were no changes in our internal control over financial reporting during the quarter ended December 31, 2017 that havematerially affected, or are reasonably likely to materially affect, our internal control over financial reporting. Internal control over
132
Item 9. Changes in and Disagreements with Accountants on Accountingand Financial Disclosure
Item 9A. Controls and Procedures
(a) Evaluation of Disclosure Controls and Procedures
(b) Management’s Report on Internal Control Over Financial Reporting
(c) Changes in Internal Control Over Financial Reporting

133
financial reporting now includes the internal controls of PitchBook Data, Inc., which was not included in our assessment as ofDecember 31, 2016.
There is no information that was required to be disclosed in a report on Form 8-K during the fourth quarter of the year covered bythis Annual Report on Form 10-K that was not reported.
Morningstar, Inc. 2017 Annual Report 133
Item 9B. Other Information
134
2017 10-K: Part III
The information contained under the headings Proposal 1—Election of Directors, Board of Directors and Corporate Governance—Independent Directors, Board of Directors and Corporate Governance—Board Committees and Charters, and Section 16(a)Beneficial Ownership Reporting Compliance in the definitive proxy statement for our 2018 Annual Meeting of Shareholders (theProxy Statement) and the information contained under the heading Executive Officers in Part I of this report is incorporated hereinby reference in response to this item.
We have adopted a code of ethics, which is posted in the Investor Relations area of our corporate website athttps://shareholders.morningstar.com in the Governance section. We intend to include on our website any amendments to, orwaivers from, a provision of the code of ethics that apply to our principal executive officer, principal financial officer, principalaccounting officer, or controller that relates to any element of the code of ethics definition contained in Item 406(b) of SECRegulation S-K. Shareholders may request a free copy of these documents by sending an e-mail to [email protected].
The information contained under the headings Board of Directors and Corporate Governance—Directors’ Compensation,Compensation Discussion and Analysis, Compensation Committee Report, Compensation Committee Interlocks and InsiderParticipation, and Executive Compensation in the Proxy Statement is incorporated herein by reference in response to this item.
The information contained under the headings Security Ownership of Certain Beneficial Owners and Management and EquityCompensation Plan Information in the Proxy Statement is incorporated herein by reference in response to this item.
The information contained under the headings Certain Relationships and Related Party Transactions and Board of Directors andCorporate Governance—Independent Directors in the Proxy Statement is incorporated herein by reference in response to thisitem.
The information contained under the headings Audit Committee Report and Principal Accounting Firm Fees in the Proxy Statementis incorporated herein by reference in response to this item.
134
Part III
Item 10. Directors, Executive Officers, and Corporate Governance
Item 11. Executive Compensation
Item 12. Security Ownership of Certain Beneficial Owners and Management and RelatedStockholder Matters
Item 13. Certain Relationships and Related Transactions, and Director Independence
Item 14. Principal Accountant Fees and Services

135
The following documents are filed as part of this Annual Report on Form 10-K under Item 8—Financial Statements andSupplementary Data:
Report of KPMG LLP, Independent Registered Public Accounting Firm
Financial Statements:Consolidated Statements of Income—Years ended December 31, 2017, 2016, and 2015Consolidated Statements of Comprehensive Income—Years ended December 31, 2017, 2016, and 2015Consolidated Balance Sheets—December 31, 2017 and 2016Consolidated Statements of Equity—Years ended December 31, 2017, 2016, and 2015Consolidated Statements of Cash Flows—Years ended December 31, 2017, 2016, and 2015Notes to Consolidated Financial Statements
The report of KPMG LLP dated March 1, 2018 concerning the Financial Statement Schedule II, Morningstar, Inc., and subsidiariesValuation and Qualifying Accounts, is included at the beginning of Part II, Item 8 of this Annual Report on Form 10-K for the yearsended December 31, 2017, December 31, 2016, and December 31, 2015.
The following financial statement schedule is filed as part of this Annual Report on Form 10-K:
Schedule II: Valuation and Qualifying Accounts
All other schedules have been omitted as they are not required, not applicable, or the required information is otherwise included.
AdditionsCharged (Deductions)
Balance at (Credited) to IncludingBeginning of Costs & Currency Balance at End
(in millions) Year Expenses Translations of Year
Allowance for doubtful accounts:Year ended December 31,2017 $ 2.1 $ 2.3 $ (1.2) $ 3.22016 1.8 1.3 (1.0) 2.12015 1.5 0.5 (0.2) 1.8
Morningstar, Inc. 2017 Annual Report 135
Part IV
Item 15. Exhibits and Financial Statement Schedules
(a)
1. Consolidated Financial Statements
2. Financial Statement Schedules
Report of Independent Registered Public Accounting Firm

136
2017 10-K: Part IV
Exhibit Description
3.1 Amended and Restated Articles of Incorporation of Morningstar are incorporated by reference to Exhibit 3.1 to our RegistrationStatement on Form S-1, as amended, Registration No. 333-115209 (the Registration Statement).
3.2 By-laws of Morningstar, as in effect on February 27, 2018, are incorporated by reference to Exhibit 3.1 to our Current Report onForm 8-K that we filed with the SEC on February 28, 2018.
4.1 Specimen Common Stock Certificate is incorporated by reference to Exhibit 4.1 to the Registration Statement.10.1* Form of Indemnification Agreement is incorporated by reference to Exhibit 10.1 to the Registration Statement.10.2* Morningstar Incentive Plan, as amended and restated effective January 1, 2014, is incorporated by reference to Exhibit 10.2 to our
Annual Report on Form 10-K for the year ended December 31, 2013.10.3* Morningstar 2004 Stock Incentive Plan, as amended and restated effective as of July 24, 2009, is incorporated by reference to
Exhibit 10.1 to our Quarterly Report on Form 10-Q for the quarter ended June 30, 2009.10.4* Morningstar 2011 Stock Incentive Plan is incorporated by reference to Exhibit 10.1 to our Current Report on Form 8-K that we filed
with the SEC on May 18, 2011.10.5* Form of Morningstar 2004 Stock Incentive Plan Stock Option Agreement for awards made on May 15, 2011 is incorporated by
reference to Exhibit 10.1 to our Quarterly Report on Form 10-Q for the quarter ended June 30, 2011 (the June 2011 10-Q).10.6* Form of Morningstar 2004 Stock Incentive Plan Director Stock Option Agreement for awards made on May 15, 2011 is incorporated
by reference to Exhibit 10.2 to the June 2011 10-Q.10.7* Form of Morningstar 2011 Stock Incentive Plan Restricted Stock Award Agreement for awards made on and after May 15, 2013 is
incorporated by reference to Exhibit 10.1 to our Quarterly Report on Form 10-Q for the quarter ended June 30, 2013 (the June 201310-Q).
10.8* Form of Morningstar 2011 Stock Incentive Plan Director Restricted Stock Unit Award Agreement, as amended and restatedeffective December 3, 2015 is incorporated by reference to Exhibit 10.12 to our Annual Report on Form 10-K for the year endedDecember 31, 2015 (the 2015 10-K).
10.9* Form of Morningstar 2011 Stock Incentive Plan Performance Share Award Agreement, as amended and restated effectiveDecember 3, 2015, for awards made on and after March 15, 2015 is incorporated by reference to Exhibit 10.14 to the 2015 10-K.
10.10* Form of Morningstar 2011 Stock Incentive Plan CEO Restricted Stock Unit Award Agreement for award made on January 3, 2017 isincorporated by reference to Exhibit 10.11 to our Annual Report on Form 10-K for the year ended December 31, 2016.
10.11* Form of Morningstar 2011 Stock Incentive Plan Market Stock Unit Award Agreement for awards made on May 15, 2017 isincorporated by reference to Exhibit 10.1 to our Quarterly Report on Form 10-Q for the quarter ended June 30, 2017.
10.12*† Form of Morningstar 2011 Stock Incentive Plan Market Stock Unit Award Agreement for awards made on and after November 15,2017
10.13*† Form of Morningstar 2011 Stock Incentive Plan Restricted Stock Unit Award Agreement for awards made on and afterNovember 15, 2017.
10.14*† Form of Morningstar 2011 Stock Incentive Plan CFO Restricted Stock Unit Award Agreement for award made on November 15,2017.
10.15 Amended and Restated Credit Agreement dated as of November 4, 2016 among Morningstar, Inc., certain subsidiaries ofMorningstar, Inc., and Bank of America, N.A. is incorporated by reference to Exhibit 10.1 to our Current Report on Form 8-K that wefiled with the SEC on November 8, 2016.
21.1† Subsidiaries of Morningstar.23.1† Consent of KPMG LLP.31.1† Certification of Chief Executive Officer pursuant to Rule 13a-14(a) and 15d-14(a) of the Securities Exchange Act of 1934, as
amended.31.2† Certification of Chief Financial Officer pursuant to Rule 13a-14(a) and 15d-14(a) of the Securities Exchange Act of 1934, as
amended.32.1† Certification of Chief Executive Officer pursuant to 18 U.S.C. 1350, as adopted pursuant to Section 906 of the Sarbanes-Oxley Act
of 2002.32.2† Certification of Chief Financial Officer pursuant to 18 U.S.C. 1350, as adopted pursuant to Section 906 of the Sarbanes-Oxley Act
of 2002.
136
3. Exhibits

137
Exhibit Description
101† The following financial information from Morningstar Annual Report on Form 10-K for the year ended December 31, 2017, filedwith the SEC on March 1, 2018, formatted in XBRL: (i) Consolidated Statements of Income, (ii) Consolidated Statements ofComprehensive Income, (iii) Consolidated Balance Sheets, (iv) Consolidated Statements of Equity, (v) Consolidated Statements ofCash Flows and (vi) the Notes to Consolidated Financial Statements.
* Management contract with a director or executive officer or a compensatory plan or arrangement in which directors or executive officers are eligible to participate.
† Filed or furnished herewith.
None.
Morningstar, Inc. 2017 Annual Report 137
Item 16. Form 10-K Summary

138
2017 10-K: Part I
Pursuant to the requirements of Section 13 or 15(d) of the Securities Exchange Act of 1934, the registrant has duly caused thisreport to be signed on its behalf by the undersigned thereunto duly authorized on March 1, 2018.
MORNINGSTAR, INC.By: /s/ Kunal Kapoor
Kunal KapoorTitle: Chief Executive Officer
Pursuant to the requirements of the Securities Exchange Act of 1934, this report has been signed below by the following personson behalf of the registrant and in the capacities and on the dates indicated.
Signature Title Date
/s/ Kunal Kapoor Chief Executive Officer March 1, 2018Kunal Kapoor (principal executive officer) and Director. . . . . . . . . . . . . . . . . . . . . . . . . . . . . . . . . . . . . . . . . . . . . . . . . . . . . . . . . . . . . . . . . . . . . . . . . . . . . . . . . . . . . . . . . . . . . . . . . . . . . . . . . . . . . . . . . . . . . . . . . . . . . . . . . . . . . . . . . . . . . . . . . . . . . . . . . . . . . . . . . . . . . . .
/s/ Jason Dubinsky Chief Financial Officer March 1, 2018Jason Dubinsky (principal financial and accounting officer). . . . . . . . . . . . . . . . . . . . . . . . . . . . . . . . . . . . . . . . . . . . . . . . . . . . . . . . . . . . . . . . . . . . . . . . . . . . . . . . . . . . . . . . . . . . . . . . . . . . . . . . . . . . . . . . . . . . . . . . . . . . . . . . . . . . . . . . . . . . . . . . . . . . . . . . . . . . . . . . . . . . . . .
/s/ Joe Mansueto Chairman of the Board March 1, 2018Joe Mansueto. . . . . . . . . . . . . . . . . . . . . . . . . . . . . . . . . . . . . . . . . . . . . . . . . . . . . . . . . . . . . . . . . . . . . . . . . . . . . . . . . . . . . . . . . . . . . . . . . . . . . . . . . . . . . . . . . . . . . . . . . . . . . . . . . . . . . . . . . . . . . . . . . . . . . . . . . . . . . . . . . . . . . . .
/s/ Robin Diamonte Director March 1, 2018Robin Diamonte. . . . . . . . . . . . . . . . . . . . . . . . . . . . . . . . . . . . . . . . . . . . . . . . . . . . . . . . . . . . . . . . . . . . . . . . . . . . . . . . . . . . . . . . . . . . . . . . . . . . . . . . . . . . . . . . . . . . . . . . . . . . . . . . . . . . . . . . . . . . . . . . . . . . . . . . . . . . . . . . . . . . . . .
/s/ Cheryl Francis Director March 1, 2018Cheryl Francis. . . . . . . . . . . . . . . . . . . . . . . . . . . . . . . . . . . . . . . . . . . . . . . . . . . . . . . . . . . . . . . . . . . . . . . . . . . . . . . . . . . . . . . . . . . . . . . . . . . . . . . . . . . . . . . . . . . . . . . . . . . . . . . . . . . . . . . . . . . . . . . . . . . . . . . . . . . . . . . . . . . . . . .
/s/ Steven Kaplan Director March 1, 2018Steven Kaplan. . . . . . . . . . . . . . . . . . . . . . . . . . . . . . . . . . . . . . . . . . . . . . . . . . . . . . . . . . . . . . . . . . . . . . . . . . . . . . . . . . . . . . . . . . . . . . . . . . . . . . . . . . . . . . . . . . . . . . . . . . . . . . . . . . . . . . . . . . . . . . . . . . . . . . . . . . . . . . . . . . . . . . .
/s/ Gail Landis Director March 1, 2018Gail Landis. . . . . . . . . . . . . . . . . . . . . . . . . . . . . . . . . . . . . . . . . . . . . . . . . . . . . . . . . . . . . . . . . . . . . . . . . . . . . . . . . . . . . . . . . . . . . . . . . . . . . . . . . . . . . . . . . . . . . . . . . . . . . . . . . . . . . . . . . . . . . . . . . . . . . . . . . . . . . . . . . . . . . . .
/s/ Bill Lyons Director March 1, 2018Bill Lyons. . . . . . . . . . . . . . . . . . . . . . . . . . . . . . . . . . . . . . . . . . . . . . . . . . . . . . . . . . . . . . . . . . . . . . . . . . . . . . . . . . . . . . . . . . . . . . . . . . . . . . . . . . . . . . . . . . . . . . . . . . . . . . . . . . . . . . . . . . . . . . . . . . . . . . . . . . . . . . . . . . . . . . .
/s/ Jack Noonan Director March 1, 2018Jack Noonan. . . . . . . . . . . . . . . . . . . . . . . . . . . . . . . . . . . . . . . . . . . . . . . . . . . . . . . . . . . . . . . . . . . . . . . . . . . . . . . . . . . . . . . . . . . . . . . . . . . . . . . . . . . . . . . . . . . . . . . . . . . . . . . . . . . . . . . . . . . . . . . . . . . . . . . . . . . . . . . . . . . . . . .
/s/ Caroline Tsay Director March 1, 2018Caroline Tsay. . . . . . . . . . . . . . . . . . . . . . . . . . . . . . . . . . . . . . . . . . . . . . . . . . . . . . . . . . . . . . . . . . . . . . . . . . . . . . . . . . . . . . . . . . . . . . . . . . . . . . . . . . . . . . . . . . . . . . . . . . . . . . . . . . . . . . . . . . . . . . . . . . . . . . . . . . . . . . . . . . . . . . .
/s/ Hugh Zentmyer Director March 1, 2018Hugh Zentmyer. . . . . . . . . . . . . . . . . . . . . . . . . . . . . . . . . . . . . . . . . . . . . . . . . . . . . . . . . . . . . . . . . . . . . . . . . . . . . . . . . . . . . . . . . . . . . . . . . . . . . . . . . . . . . . . . . . . . . . . . . . . . . . . . . . . . . . . . . . . . . . . . . . . . . . . . . . . . . . . . . . . . . . .
138
Signatures
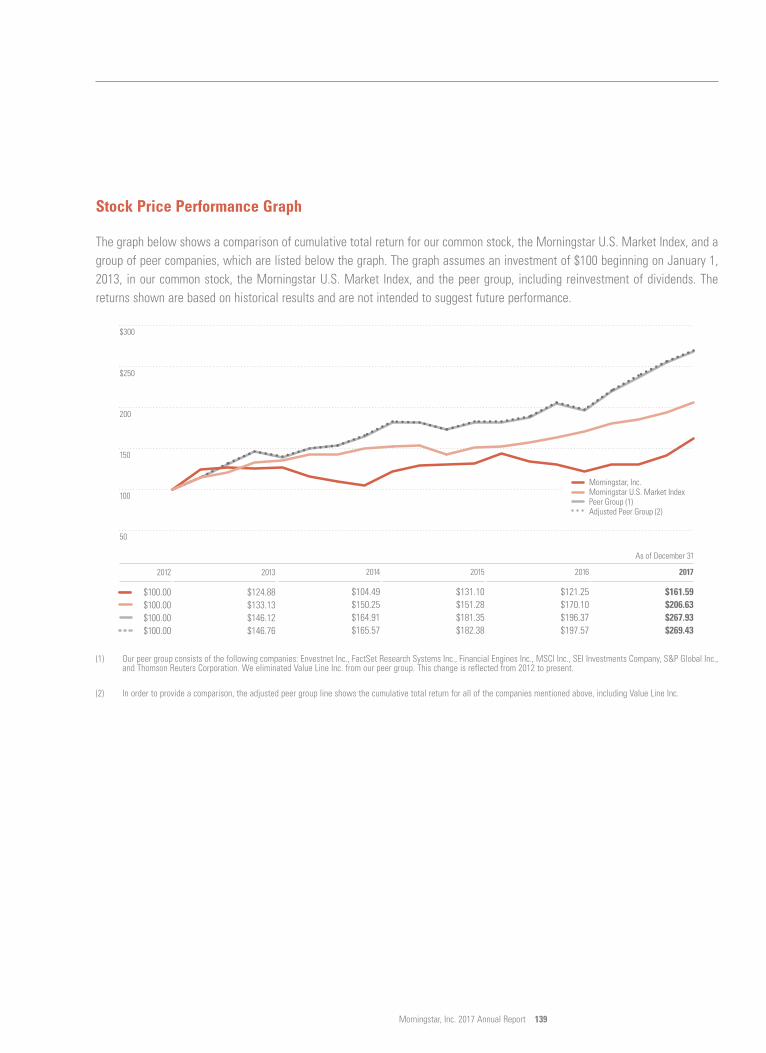
19MAR201813055730
139
The graph below shows a comparison of cumulative total return for our common stock, the Morningstar U.S. Market Index, and agroup of peer companies, which are listed below the graph. The graph assumes an investment of $100 beginning on January 1,2013, in our common stock, the Morningstar U.S. Market Index, and the peer group, including reinvestment of dividends. Thereturns shown are based on historical results and are not intended to suggest future performance.
2012
$100.00$100.00$100.00$100.00
2013
$124.88$133.13$146.12$146.76
2014
$104.49$150.25$164.91$165.57
2017
$161.59$206.63$267.93$269.43
2015
$131.10$151.28$181.35$182.38
2016
$121.25$170.10$196.37$197.57
100
150
50
200
$250
$300
Morningstar, Inc.Morningstar U.S. Market Index Peer Group (1)Adjusted Peer Group (2)
(1) Our peer group consists of the following companies: Envestnet Inc., FactSet Research Systems Inc., Financial Engines Inc., MSCI Inc., SEI Investments Company, S&P Global Inc.,and Thomson Reuters Corporation. We eliminated Value Line Inc. from our peer group. This change is reflected from 2012 to present.
(2) In order to provide a comparison, the adjusted peer group line shows the cumulative total return for all of the companies mentioned above, including Value Line Inc.
Morningstar, Inc. 2017 Annual Report 139
Stock Price Performance Graph

13MAR20181320445813MAR201813204742
13MAR20181320445813MAR201813204603
13MAR20181320474213MAR201813204603
13MAR20181320445813MAR201813204742
13MAR20181320474213MAR201813204603
13MAR20181320445813MAR201813204603
13MAR20181320445813MAR201813204742
13MAR20181320445813MAR201813204603
13MAR20181320445813MAR20181320460313MAR201813204742
140
Additional Information
Board of Directors Executive OfficersCorporate HeadquartersMorningstar, Inc., 22 West Washington Street, Chicago, Illinois 60602, Bevin DesmondRobin Diamonte+1 312 696-6000 Head of Talent and CultureVice President and Chief
Investment Officer, UnitedTechnologies Corp.Transfer Agent and Registrar Jason Dubinsky
Chief Financial OfficerComputershare Investor Services LLC, 2 North LaSalle Street, Chicago,Cheryl Francis
Illinois 60602, +1 866 303-0659 (toll free) Co-Chairman, CorporateDanny DunnLeadership CenterChief Revenue OfficerEthics Hotline
Steve KaplanMorningstar has established a confidential Ethics Hotline that anyone mayNeubauer Family Professor of Kunal Kapooruse to report complaints or concerns about ethics violations, including Entrepreneurship and Finance, Chief Executive Officer
accounting irregularities, financial misstatements, problems with internal University of Chicago Boothaccounting controls, or noncompliance with external rules and regulations. School of Business Haywood Kelly
Head of Global ResearchKunal KapoorThe Morningstar Ethics Hotline is operated by NAVEX Global, an independent Chief Executive Officercompany that is not affiliated with Morningstar. The hotline is available Pat Maloney
Gail Landis General Counsel24 hours a day, seven days a week.Former Managing Principal,Evercore Asset Management, LLC Joe MansuetoAnyone may make a confidential, anonymous report by calling the hotline toll
Executive Chairmanfree at: +1 800 555-8316. William LyonsFormer President and Chief
Daniel NeedhamExecutive Officer, AmericanAnnual Meeting President and ChiefCentury Companies, Inc.Morningstar’s annual meeting of shareholders will be held at 9 a.m. on Investment Officer,
Joe MansuetoFriday, May 18, 2018 at our corporate headquarters, 22 West Washington Investment ManagementExecutive Chairman,Street, Chicago, Illinois 60602.Morningstar, Inc.
Tricia RothschildChief Product OfficerInvestor Questions Jack Noonan
Former Chairman, President andWe encourage all interested parties—including securities analysts, potentialChief Executive Officer, SPSS Inc.shareholders, and others—to submit questions to us in writing. We publish
responses to these questions on our website and in Form 8-Ks furnished to Caroline Tsaythe SEC, generally on the first Friday of every month. If you have a question Chief Executive Officer, Computeabout our business, please send it to [email protected]. Software, Inc.
Hugh ZentmyerFormer Executive Vice President,Illinois Tool Works Inc.
Member of audit committee
Member of compensation committee
Member of nominating/governance committee
140

Denmark
France
Germany
Italy
Luxembourg
The Netherlands
Norway
Spain
South Africa
Sweden
Switzerland
United Kingdom
Australia
New Zealand
Canada
United States
Mexico
Brazil
Chile
China
India
Japan
Singapore
South Korea
Taiwan
Thailand
United Arab Emirates

3
3