8 11 14 - valuewalk.com · most recent quarter ended. pitchbook’s most recent fund returns data...
TRANSCRIPT
Shortest closing time for PE funds since 2008
Second-highest VC total raised
for the decade
76% of VC funds in 2015
outmatched predecessor
in size
PE fundraising
adapting to current
environment85 11 14

Credits & ContactPitchBook Data, Inc.
JOHN GABBERT Founder, CEO
ADLEY BOWDEN Vice President,
Market Development & Analysis
ContentGARRETT JAMES BLACK Senior Analyst
NIZAR TARHUNI Analyst
BRIAN LEE Data Analyst
JENNIFER SAM Senior Graphic Designer
JESS CHAIDEZ Graphic Designer
Contact PitchBook pitchbook.com
RESEARCH
EDITORIAL
SALES
COPYRIGHT © 2016 by PitchBook Data, Inc. All rights reserved. No part of this publication may be reproduced in any form or by any means—graphic, electronic, or mechanical, including photocopying, recording, taping, and information storage and retrieval systems—without the express written permission of PitchBook Data, Inc. Contents are based on information from sources believed to be reliable, but accuracy and completeness cannot be guaranteed. Nothing herein should be construed as any past, current or future recommendation to buy or sell any security or an offer to sell, or a solicitation of an offer to buy any security. This material does not purport to contain all of the information that a prospective investor may wish to consider and is not to be relied upon as such or used in substitution for the exercise of independent judgment.
Introduction 3
PE Fundraising Overview 4–5
PE Fundraising by Fund Size 6-7
PE Closing Times 8
PE Capital Overhang 9
Secondaries 10
VC Fundraising Overview 11-12
VC Fundraising by Fund Size 13-14
Micro VC Funds 15
Venture Capital Overhang 16
Select Open U.S. Funds 17
Methodology 18
Contents
2 PITCHBOOK 2015 ANNUAL PE & VC FUNDRAISING & CAPITAL OVERHANG REPORT

How is fundraising evolving?Introduction
Investors’ perception of risk matters as much as the degree to which risk has
materialized. Over the past month, we’ve detailed how the private equity and
venture capital investment landscapes have been evolving in response to macro
concerns, volatility and corrections in public markets and more. Yet, when
we come to fundraising for PE and VC, we must consider the perspectives of
both fund investors and managers and how they are adapting to the current
environment.
In some ways, PE fund managers have become victims of their own success.
They must contend with an immense overhang of dry powder in a competitive
dealmaking environment, generated by the vast number of commitments
collected over the past few years from limited partners drawn by the asset class’s
strong historical performance. To assess how PE fundraisers have responded
to not only that overhang’s impetus to invest, but also investment trends, we
examine multiple datasets ranging from fundraising across different fund types
to fund size metrics.
When it comes to VC, currently, there is a general consensus that the venture
industry is experiencing the onset of cooling after overheating to the point of
overexuberance, with investors scrutinizing the fundamentals of startups more
closely than in years prior, primarily in response to concerns about liquidity
and growth. Venture fundraisers have had a stellar run as of late, judging by
the number of vehicles and sums of capital raised, yet how will they respond
to the cooling of the investment climate? In the following pages, we explore
trends across the venture fundraising market, particularly the micro fundraising
segment, given its especially rapid development in the past few years, to analyze
the nature of their potential responses.
One last thing to note: We have included brand-new datasets in this report,
including breakdowns of capital called compared to capital raised across both
PE and VC, among others. We hope this helps inform your decision-making in
the coming months, and feel free to reach out with any questions.
GARRETT JAMES BLACK
Senior Analyst
MAKE WAY FOR
SMARTER, ON-THE-FLY MEETING PREP
US +1 206.623.1986
UK +44 (0)207.190.9809
pitchbook.com
Introducing PitchBook
Mobile. The same
excellent data, technology
and service from the
PitchBook Platform, now
available on a mobile
device.
Search:
“PitchBook”
Available for
3 PITCHBOOK 2015 ANNUAL PE & VC FUNDRAISING & CAPITAL OVERHANG REPORT

A shifting environmentPE fundraising overview
In an environment where cheap
debt contributed to a significant
rise in activity and LPs flocked to GPs
to reap outsized returns, PE managers
have amassed an enormous war chest
of capital over recent years. With
too much capital chasing a limited
amount of transactions, competition
has become fierce, with strategics
often able to win out in auction
processes. As dry powder levels have
continued to grow, 2015 finally saw
the fundraising trail begin to slow. The
massive vehicles raised just prior to the
financial crisis weren’t able to deploy
their forecasted amount of capital
during their respective investment
periods, leading to lagging returns, an
outcome that GPs and LPs alike are
working fervently to avoid in present
day.
Last year saw a divergence between capital raised and called
U.S. PE capital raised versus capital contributed by year
U.S. PE fundraising (#) by fund type U.S. PE fundraising ($) by fund type
Source: PitchBook
2015 saw GPs close on just over $185
billion in committed capital across
281 vehicles, a year-over-year decline
of near 7% and 14%, respectively.
On a historical basis, these figures
are certainly still strong, yet they fall
short of what we’ve seen in in the past
couple of years.
Given the shifting deal environment,
GP fundraising efforts were also
driven by evolving strategies last year
as more niche vehicles were raised
to focus on emerging opportunities
including distress, direct lending and
energy. The broader syndicated loan
market has seen a bit of a crunch, and
-$100
-$50
$0
$50
$100
$150
$200
$250
$300
$350
2006 2007 2008 2009 2010 2011 2012 2013 2014 2015
Net PE capital Contributions ($B) Capital raised ($B)
Source: PitchBook
0%
20%
40%
60%
80%
100%
2006
2007
2008
2009
2010
2011
2012
2013
2014
2015
0%
20%
40%
60%
80%
100%
2006
2007
2008
2009
2010
2011
2012
2013
2014
2015
OtherEnergy Mezzanine Restructuring Co-Investment PE growthBuyout
Note: The LP reporting cycle is two quarters behind the
most recent quarter ended. PitchBook’s most recent
fund returns data is through 2Q 2015, with capital
raised figures through the end of 2015.
4 PITCHBOOK 2015 ANNUAL PE & VC FUNDRAISING & CAPITAL OVERHANG REPORT
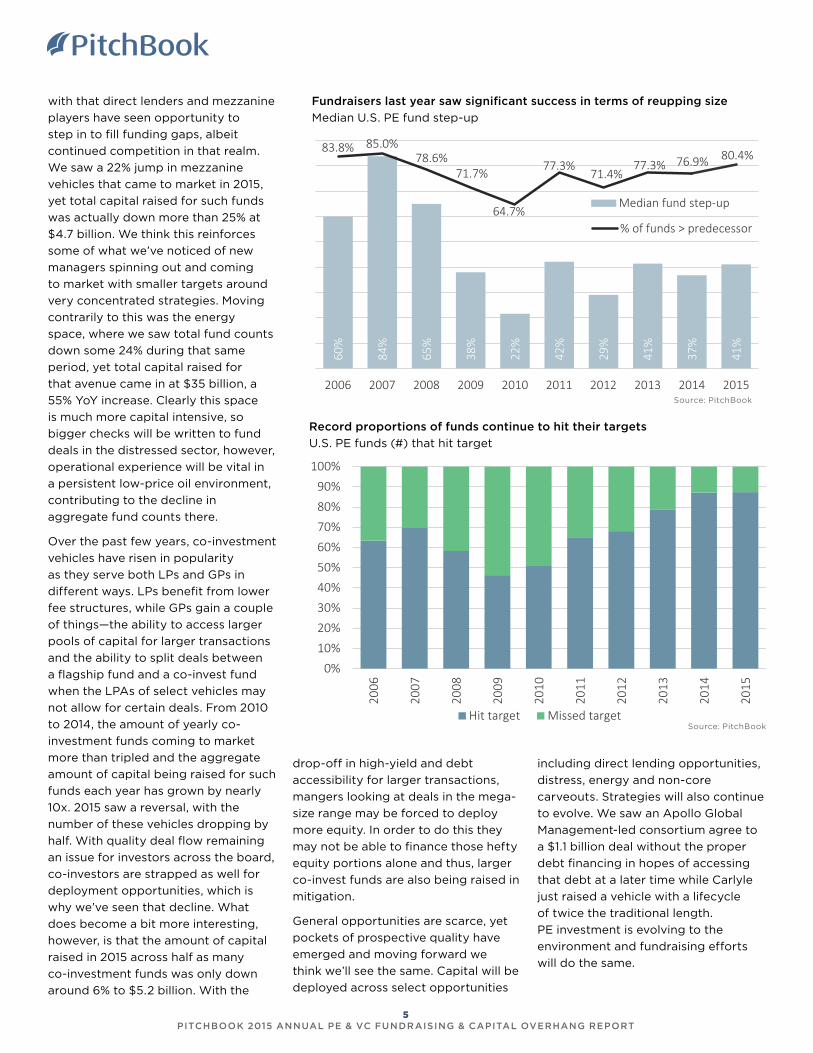
Fundraisers last year saw significant success in terms of reupping size
Median U.S. PE fund step-up
Record proportions of funds continue to hit their targets
U.S. PE funds (#) that hit target
60%
84%
65%
38%
22%
42%
29%
41%
37%
41%
83.8% 85.0%78.6%
71.7%
64.7%
77.3%71.4%
77.3% 76.9% 80.4%
2006 2007 2008 2009 2010 2011 2012 2013 2014 2015
Median fund step-up
% of funds > predecessor
Source: PitchBook
0%10%20%30%40%50%60%70%80%90%
100%
2006
2007
2008
2009
2010
2011
2012
2013
2014
2015
Hit target Missed targetSource: PitchBook
with that direct lenders and mezzanine
players have seen opportunity to
step in to fill funding gaps, albeit
continued competition in that realm.
We saw a 22% jump in mezzanine
vehicles that came to market in 2015,
yet total capital raised for such funds
was actually down more than 25% at
$4.7 billion. We think this reinforces
some of what we’ve noticed of new
managers spinning out and coming
to market with smaller targets around
very concentrated strategies. Moving
contrarily to this was the energy
space, where we saw total fund counts
down some 24% during that same
period, yet total capital raised for
that avenue came in at $35 billion, a
55% YoY increase. Clearly this space
is much more capital intensive, so
bigger checks will be written to fund
deals in the distressed sector, however,
operational experience will be vital in
a persistent low-price oil environment,
contributing to the decline in
aggregate fund counts there.
Over the past few years, co-investment
vehicles have risen in popularity
as they serve both LPs and GPs in
different ways. LPs benefit from lower
fee structures, while GPs gain a couple
of things—the ability to access larger
pools of capital for larger transactions
and the ability to split deals between
a flagship fund and a co-invest fund
when the LPAs of select vehicles may
not allow for certain deals. From 2010
to 2014, the amount of yearly co-
investment funds coming to market
more than tripled and the aggregate
amount of capital being raised for such
funds each year has grown by nearly
10x. 2015 saw a reversal, with the
number of these vehicles dropping by
half. With quality deal flow remaining
an issue for investors across the board,
co-investors are strapped as well for
deployment opportunities, which is
why we’ve seen that decline. What
does become a bit more interesting,
however, is that the amount of capital
raised in 2015 across half as many
co-investment funds was only down
around 6% to $5.2 billion. With the
drop-off in high-yield and debt
accessibility for larger transactions,
mangers looking at deals in the mega-
size range may be forced to deploy
more equity. In order to do this they
may not be able to finance those hefty
equity portions alone and thus, larger
co-invest funds are also being raised in
mitigation.
General opportunities are scarce, yet
pockets of prospective quality have
emerged and moving forward we
think we’ll see the same. Capital will be
deployed across select opportunities
including direct lending opportunities,
distress, energy and non-core
carveouts. Strategies will also continue
to evolve. We saw an Apollo Global
Management-led consortium agree to
a $1.1 billion deal without the proper
debt financing in hopes of accessing
that debt at a later time while Carlyle
just raised a vehicle with a lifecycle
of twice the traditional length.
PE investment is evolving to the
environment and fundraising efforts
will do the same.
5 PITCHBOOK 2015 ANNUAL PE & VC FUNDRAISING & CAPITAL OVERHANG REPORT
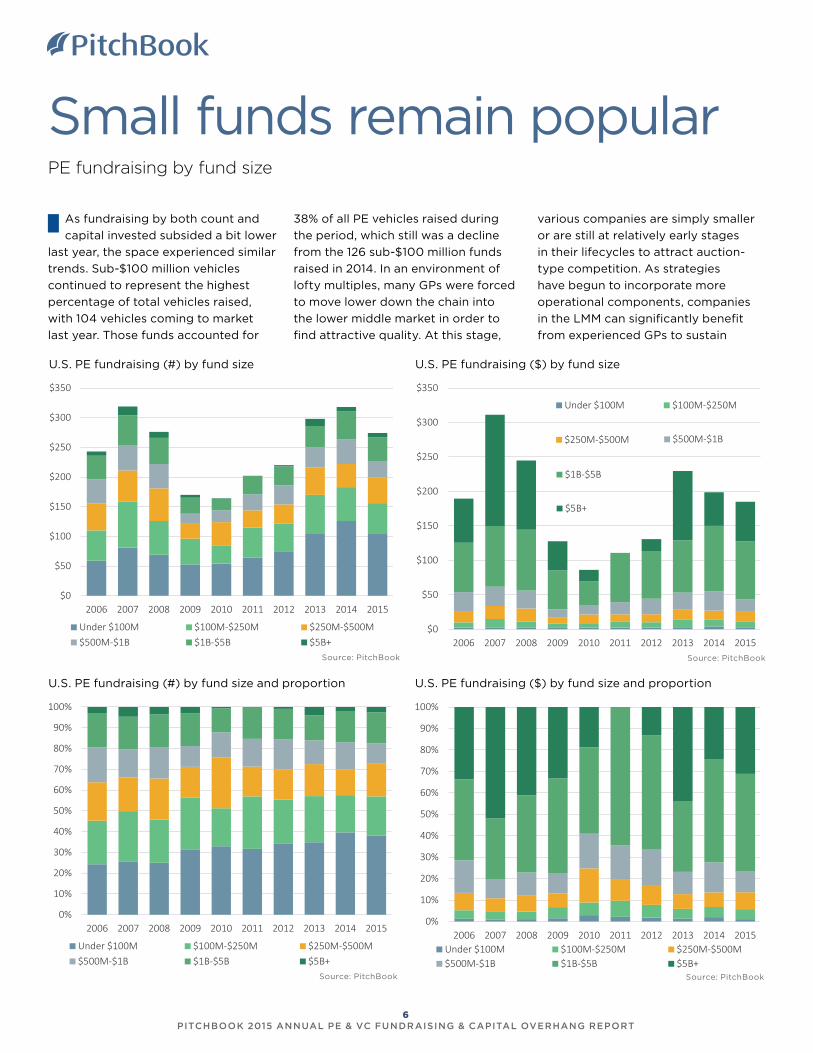
U.S. PE fundraising (#) by fund size U.S. PE fundraising ($) by fund size
Small funds remain popularPE fundraising by fund size
As fundraising by both count and
capital invested subsided a bit lower
last year, the space experienced similar
trends. Sub-$100 million vehicles
continued to represent the highest
percentage of total vehicles raised,
with 104 vehicles coming to market
last year. Those funds accounted for
Source: PitchBook Source: PitchBook
U.S. PE fundraising (#) by fund size and proportion U.S. PE fundraising ($) by fund size and proportion
$0
$50
$100
$150
$200
$250
$300
$350
2006 2007 2008 2009 2010 2011 2012 2013 2014 2015
Under $100M $100M-$250M
$250M-$500M $500M-$1B
$1B-$5B
$5B+
$0
$50
$100
$150
$200
$250
$300
$350
2006 2007 2008 2009 2010 2011 2012 2013 2014 2015
Under $100M $100M-$250M $250M-$500M$500M-$1B $1B-$5B $5B+
0%
10%
20%
30%
40%
50%
60%
70%
80%
90%
100%
2006 2007 2008 2009 2010 2011 2012 2013 2014 2015
Under $100M $100M-$250M $250M-$500M$500M-$1B $1B-$5B $5B+
0%
10%
20%
30%
40%
50%
60%
70%
80%
90%
100%
2006 2007 2008 2009 2010 2011 2012 2013 2014 2015Under $100M $100M-$250M $250M-$500M$500M-$1B $1B-$5B $5B+
38% of all PE vehicles raised during
the period, which still was a decline
from the 126 sub-$100 million funds
raised in 2014. In an environment of
lofty multiples, many GPs were forced
to move lower down the chain into
the lower middle market in order to
find attractive quality. At this stage,
various companies are simply smaller
or are still at relatively early stages
in their lifecycles to attract auction-
type competition. As strategies
have begun to incorporate more
operational components, companies
in the LMM can significantly benefit
from experienced GPs to sustain
Source: PitchBook Source: PitchBook
6 PITCHBOOK 2015 ANNUAL PE & VC FUNDRAISING & CAPITAL OVERHANG REPORT
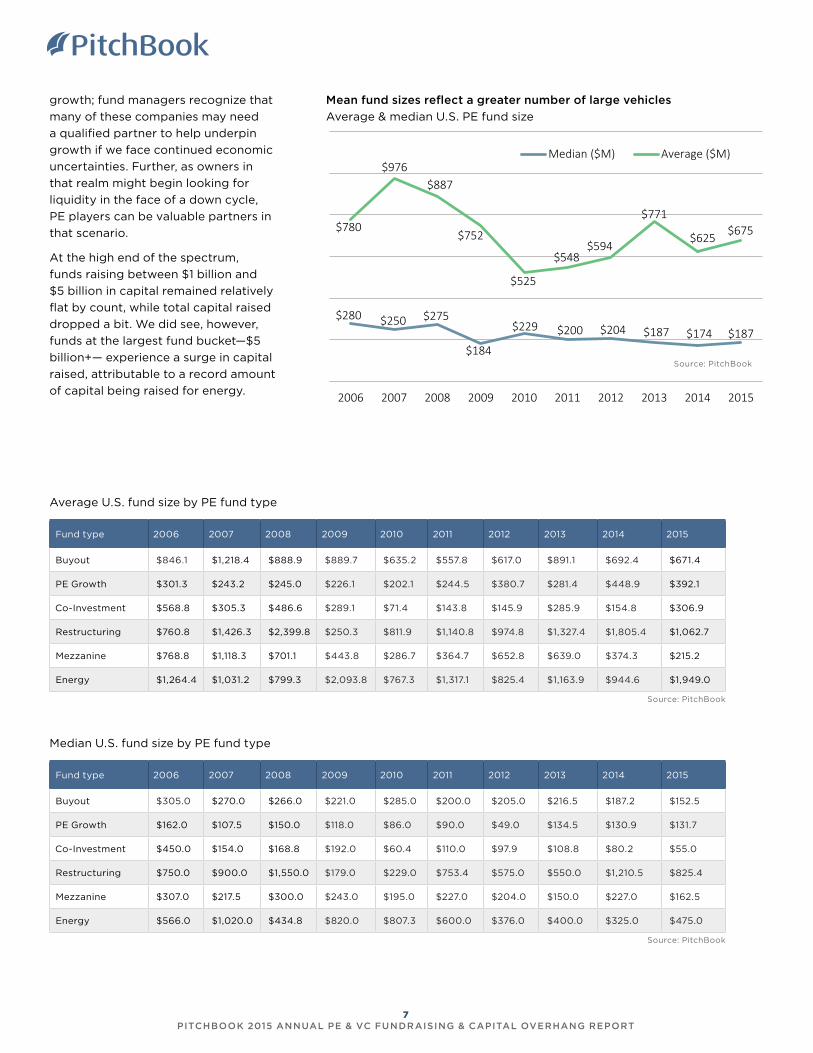
Average U.S. fund size by PE fund type
Mean fund sizes reflect a greater number of large vehicles
Average & median U.S. PE fund size
$280 $250 $275
$184
$229 $200 $204 $187 $174 $187
$780
$976$887
$752
$525
$548$594
$771
$625 $675
2006 2007 2008 2009 2010 2011 2012 2013 2014 2015
Median ($M) Average ($M)
Source: PitchBook
Fund type 2006 2007 2008 2009 2010 2011 2012 2013 2014 2015
Buyout $846.1 $1,218.4 $888.9 $889.7 $635.2 $557.8 $617.0 $891.1 $692.4 $671.4
PE Growth $301.3 $243.2 $245.0 $226.1 $202.1 $244.5 $380.7 $281.4 $448.9 $392.1
Co-Investment $568.8 $305.3 $486.6 $289.1 $71.4 $143.8 $145.9 $285.9 $154.8 $306.9
Restructuring $760.8 $1,426.3 $2,399.8 $250.3 $811.9 $1,140.8 $974.8 $1,327.4 $1,805.4 $1,062.7
Mezzanine $768.8 $1,118.3 $701.1 $443.8 $286.7 $364.7 $652.8 $639.0 $374.3 $215.2
Energy $1,264.4 $1,031.2 $799.3 $2,093.8 $767.3 $1,317.1 $825.4 $1,163.9 $944.6 $1,949.0
Median U.S. fund size by PE fund type
Fund type 2006 2007 2008 2009 2010 2011 2012 2013 2014 2015
Buyout $305.0 $270.0 $266.0 $221.0 $285.0 $200.0 $205.0 $216.5 $187.2 $152.5
PE Growth $162.0 $107.5 $150.0 $118.0 $86.0 $90.0 $49.0 $134.5 $130.9 $131.7
Co-Investment $450.0 $154.0 $168.8 $192.0 $60.4 $110.0 $97.9 $108.8 $80.2 $55.0
Restructuring $750.0 $900.0 $1,550.0 $179.0 $229.0 $753.4 $575.0 $550.0 $1,210.5 $825.4
Mezzanine $307.0 $217.5 $300.0 $243.0 $195.0 $227.0 $204.0 $150.0 $227.0 $162.5
Energy $566.0 $1,020.0 $434.8 $820.0 $807.3 $600.0 $376.0 $400.0 $325.0 $475.0
Source: PitchBook
Source: PitchBook
growth; fund managers recognize that
many of these companies may need
a qualified partner to help underpin
growth if we face continued economic
uncertainties. Further, as owners in
that realm might begin looking for
liquidity in the face of a down cycle,
PE players can be valuable partners in
that scenario.
At the high end of the spectrum,
funds raising between $1 billion and
$5 billion in capital remained relatively
flat by count, while total capital raised
dropped a bit. We did see, however,
funds at the largest fund bucket—$5
billion+— experience a surge in capital
raised, attributable to a record amount
of capital being raised for energy.
7 PITCHBOOK 2015 ANNUAL PE & VC FUNDRAISING & CAPITAL OVERHANG REPORT

Niche strategies succeedingPE fund closing times
In what may seem counterintuitive
given an increasingly sluggish deal
environment, GPs coming to market
with new vehicles in 2015 found
success in terms of the time it took
to hold final closes on those funds.
Median and average fund sizes were
up relative to what we saw in 2014,
yet at $187.4 million, the median U.S.
PE fund size came in fairly low on a
historical basis. Further, only growth
and energy vehicles posted increases
in YoY median fund sizes, highlighting
a dataset that was skewed by the 14%
decline in the population of vehicles
coming to market.
The median close time for vehicles
completing raises in 2015 came in at
12.8 months, the lowest figure we’ve
seen since 2008, which saw GPs able
to close in just 12 months. With a
PE firms have had little need to raise quickly, given the
amount of dry powder
Time between U.S. PE funds (years)
Fundraisers have enjoyed fairly rapid closes to new
vehicles as of late
Average & median U.S. PE fund time to close
12.011.0
12.014.0
20.0
15.2 14.0 14.6 14.512.8
14.3
12.6
14.215.9
18.016.5 16.3
18.2
14.8
2006 2007 2008 2009 2010 2011 2012 2013 2014 2015
Median (months) Average (months)
Source: PitchBook
4.6
3.2
3.3
3.4
4.1
4.5
4.2
4.7
4.3
5.4
4.5
4.0
4.0
3.9
4.5
4.6
4.3
4.3
4.4
5.6
2006 2007 2008 2009 2010 2011 2012 2013 2014 2015
Median Average
Source: PitchBook
record amount of capital being raised
that year, those fund IRRs are under
significant pressure stemming from
the recession and, subsequently, GPs
coming to market in the few years
following had faced some difficulties
in persuading various LPs. In light
of scarce deal flow, we think that
GPs were able to find success in
rounding up capital quickly last year
due to niche and targeted strategies,
as well as a greater focus on the
process they employed to chase LP
dollars. As LPs have become more
sophisticated, the opportunities that
have presented themselves in light
of a global slowdown across equities
and fixed income have made certain
PE strategies fairly attractive. LPs are
certainly aware of the profits that can
be realized when deploying capital in
a downturn, and the long-term horizon
these investors employ match well with
the investment strategy of new, niche
managers. Further, GPs have been able
to increase the amount of targeted
investor relations campaigns they
utilize to court LPs, which becomes
a vital component of the fundraising
trail during a period where LPs have
also begun shrinking the number
of managers they work with and
instead writing bigger checks to fewer
managers.
The median time between funds
rose significantly in 2015 to 5.4 years
from just 4.3 years in 2014, a further
testament to the difficulty managers
have faced in deploying ample
amounts of legacy dry powder.
8 PITCHBOOK 2015 ANNUAL PE & VC FUNDRAISING & CAPITAL OVERHANG REPORT

Peak overhang?U.S. PE capital overhang
PE capital overhang remains
an issue for the industry, with
cumulative dry powder growing
nearly 2% in 2015 to $543.4 billion.
In an uncertain environment, we
think that GPs continued to come to
market to insure they could access
capital before an adverse series of
events may dry up the amount of LP
commitments available. While we
understand that the PE asset class
still remains highly sought, the newer
strategies we’ve seen from GPs can
take a considerable amount of time
before the opportunities are ripe for
capital deployment, slightly inflating
the amount of dry powder remaining in
PE coffers. Although the energy sector
has raised by far the most amount of
capital in 2015 outside of traditional
buyout vehicles, we’ve seen slim deal
flow in the space. As GPs continue
U.S. PE capital overhang ($B) by year
to wait for the opportune moment
and potential bankruptcies, not much
capital has been called down on that
front. Given the capital-heavy nature of
those transactions, we think we’ll see
overhang begin to slip over the next
12 to 18 months as more opportunities
arise. Interestingly, 2012 vintages hold
at minimum 103%—in the $100 million
to $250 million range—more dry
powder than 2011 vintages, with mega
funds that raised over $5 billion sitting
on 337% more unused capital than
funds making their first investment in
2011. That discrepancy appears fairly
uncharacteristic, which is likely due to
distributions being recycled back into
those vehicles. 2013 saw capital raised
jump 76%, while the median time to
close came in at nearly 15 months,
again highlighting redistributions
as LPs began committing capital to
$426
$539$509 $501
$470 $474$499
$530 $533 $543
$0
$100
$200
$300
$400
$500
$600
2006 2007 2008 2009 2010 2011 2012 2013 2014 2015*
2016
2015
2014
2013
2012
2011
2010
2009
2008
CUMULATIVEOVERHANG
OVERHANG BY VINTAGE
Source: PitchBook
*As of 6/30/15
Note: The LP reporting cycle is two quarters behind the
most recent quarter ended. PitchBook’s most recent
fund returns data is through 2Q 2015. 2H 2015 and 2016
numbers are from vehicles that have begun reporting
yet have not fully closed.
many funds that closed in 2013 at least
a year prior. Lastly, with the ability
to overcome stretched valuations
becoming an issue for various GPs
last year, buyer-to-seller discrepancies
became more pronounced, in turn
dragging deals out longer. Our
overhang datasets are lagged by
two quarters, and thus, transactions
that close after that lag aren’t yet
subtracted from our reported dry
powder number. As our data continues
to roll in, the next iteration of this
report will give the most complete
snapshot of 2015 aggregate PE capital
overhang.
9 PITCHBOOK 2015 ANNUAL PE & VC FUNDRAISING & CAPITAL OVERHANG REPORT
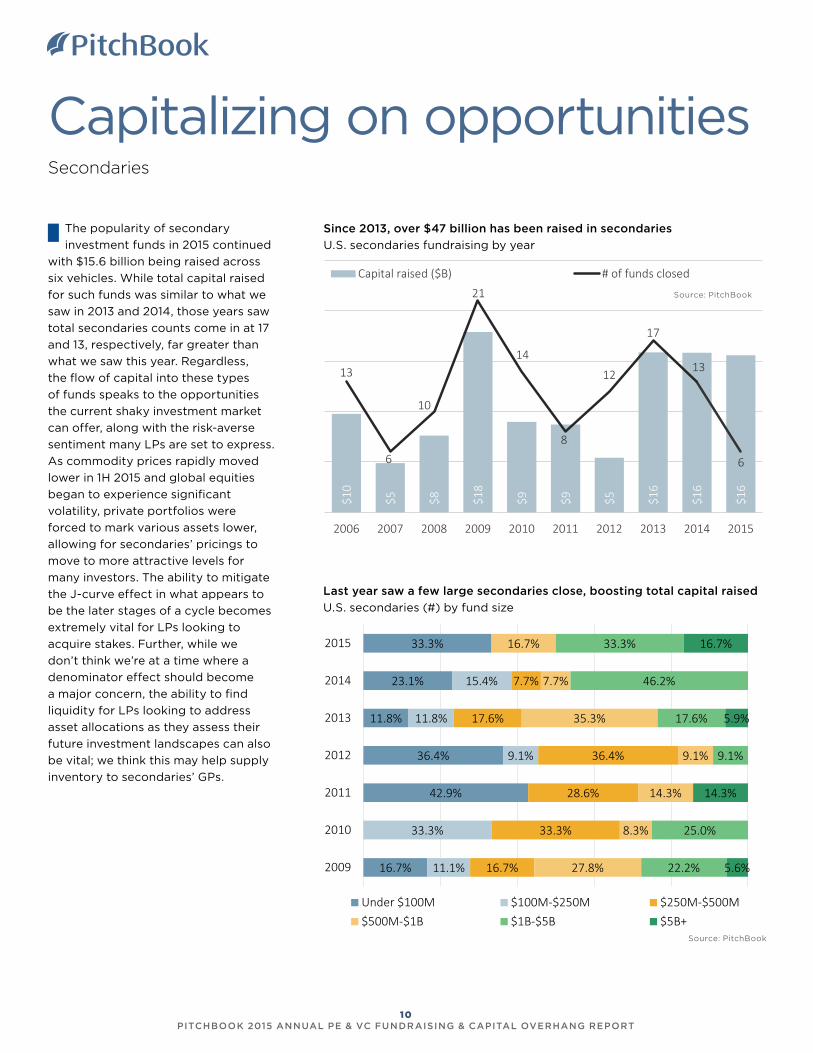
Capitalizing on opportunitiesSecondaries
The popularity of secondary
investment funds in 2015 continued
with $15.6 billion being raised across
six vehicles. While total capital raised
for such funds was similar to what we
saw in 2013 and 2014, those years saw
total secondaries counts come in at 17
and 13, respectively, far greater than
what we saw this year. Regardless,
the flow of capital into these types
of funds speaks to the opportunities
the current shaky investment market
can offer, along with the risk-averse
sentiment many LPs are set to express.
As commodity prices rapidly moved
lower in 1H 2015 and global equities
began to experience significant
volatility, private portfolios were
forced to mark various assets lower,
allowing for secondaries’ pricings to
move to more attractive levels for
many investors. The ability to mitigate
the J-curve effect in what appears to
be the later stages of a cycle becomes
extremely vital for LPs looking to
acquire stakes. Further, while we
don’t think we’re at a time where a
denominator effect should become
a major concern, the ability to find
liquidity for LPs looking to address
asset allocations as they assess their
future investment landscapes can also
be vital; we think this may help supply
inventory to secondaries’ GPs.
Since 2013, over $47 billion has been raised in secondaries
U.S. secondaries fundraising by year
Last year saw a few large secondaries close, boosting total capital raised
U.S. secondaries (#) by fund size
$10
$5 $8 $18
$9 $9 $5 $16
$16
$16
13
6
10
21
14
8
12
17
13
6
2006 2007 2008 2009 2010 2011 2012 2013 2014 2015
Capital raised ($B) # of funds closed
Source: PitchBook
16.7%
42.9%
36.4%
11.8%
23.1%
33.3%
11.1%
33.3%
9.1%
11.8%
15.4%
16.7%
33.3%
28.6%
36.4%
17.6%
7.7%
27.8%
8.3%
14.3%
9.1%
35.3%
7.7%
16.7%
22.2%
25.0%
9.1%
17.6%
46.2%
33.3%
5.6%
14.3%
5.9%
16.7%
2009
2010
2011
2012
2013
2014
2015
Under $100M $100M-$250M $250M-$500M$500M-$1B $1B-$5B $5B+
Source: PitchBook
10 PITCHBOOK 2015 ANNUAL PE & VC FUNDRAISING & CAPITAL OVERHANG REPORT
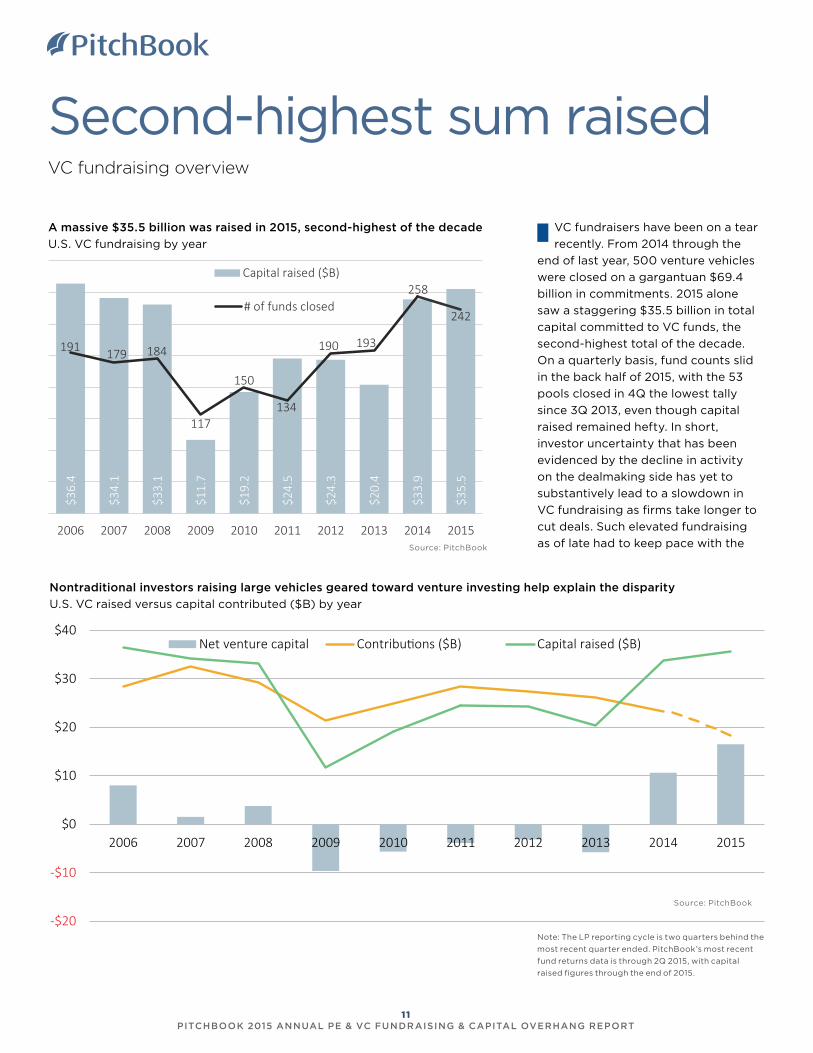
Second-highest sum raisedVC fundraising overview
Nontraditional investors raising large vehicles geared toward venture investing help explain the disparity
U.S. VC raised versus capital contributed ($B) by year
A massive $35.5 billion was raised in 2015, second-highest of the decade
U.S. VC fundraising by year
VC fundraisers have been on a tear
recently. From 2014 through the
end of last year, 500 venture vehicles
were closed on a gargantuan $69.4
billion in commitments. 2015 alone
saw a staggering $35.5 billion in total
capital committed to VC funds, the
second-highest total of the decade.
On a quarterly basis, fund counts slid
in the back half of 2015, with the 53
pools closed in 4Q the lowest tally
since 3Q 2013, even though capital
raised remained hefty. In short,
investor uncertainty that has been
evidenced by the decline in activity
on the dealmaking side has yet to
substantively lead to a slowdown in
VC fundraising as firms take longer to
cut deals. Such elevated fundraising
as of late had to keep pace with the
$36.
4
$34.
1
$33.
1
$11.
7
$19.
2
$24.
5
$24.
3
$20.
4
$33.
9
$35.
5
191 179 184
117
150
134
190 193
258
242
2006 2007 2008 2009 2010 2011 2012 2013 2014 2015
Capital raised ($B)
# of funds closed
Source: PitchBook
Source: PitchBook
-$20
-$10
$0
$10
$20
$30
$40
2006 2007 2008 2009 2010 2011 2012 2013 2014 2015
Net venture capital Contributions ($B) Capital raised ($B)
Note: The LP reporting cycle is two quarters behind the
most recent quarter ended. PitchBook’s most recent
fund returns data is through 2Q 2015, with capital
raised figures through the end of 2015.
11 PITCHBOOK 2015 ANNUAL PE & VC FUNDRAISING & CAPITAL OVERHANG REPORT
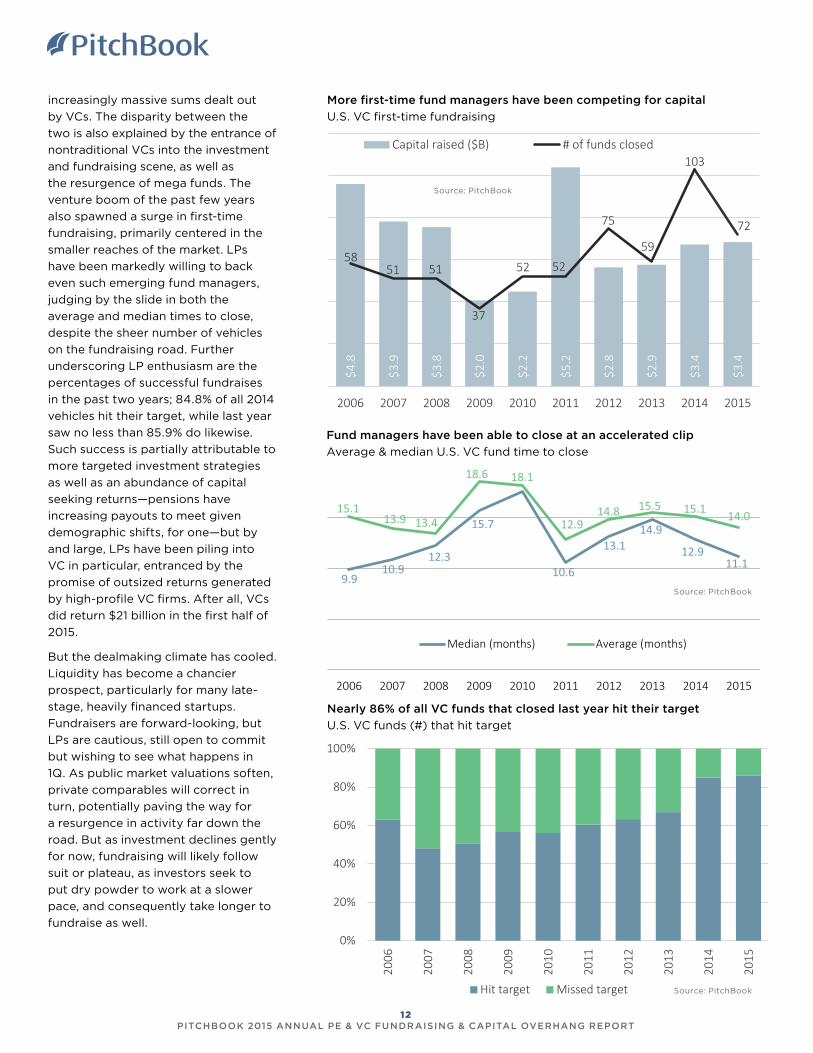
More first-time fund managers have been competing for capital
U.S. VC first-time fundraising
Fund managers have been able to close at an accelerated clip
Average & median U.S. VC fund time to close
Nearly 86% of all VC funds that closed last year hit their target
U.S. VC funds (#) that hit target
$4.8
$3.9
$3.8
$2.0
$2.2
$5.2
$2.8
$2.9
$3.4
$3.4
5851 51
37
52 52
75
59
103
72
2006 2007 2008 2009 2010 2011 2012 2013 2014 2015
Capital raised ($B) # of funds closed
Source: PitchBook
9.910.9
12.3
15.7
10.6
13.114.9
12.911.1
15.113.9 13.4
18.6 18.1
12.914.8 15.5 15.1 14.0
2006 2007 2008 2009 2010 2011 2012 2013 2014 2015
Median (months) Average (months)
Source: PitchBook
0%
20%
40%
60%
80%
100%
2006
2007
2008
2009
2010
2011
2012
2013
2014
2015
Hit target Missed target Source: PitchBook
increasingly massive sums dealt out
by VCs. The disparity between the
two is also explained by the entrance of
nontraditional VCs into the investment
and fundraising scene, as well as
the resurgence of mega funds. The
venture boom of the past few years
also spawned a surge in first-time
fundraising, primarily centered in the
smaller reaches of the market. LPs
have been markedly willing to back
even such emerging fund managers,
judging by the slide in both the
average and median times to close,
despite the sheer number of vehicles
on the fundraising road. Further
underscoring LP enthusiasm are the
percentages of successful fundraises
in the past two years; 84.8% of all 2014
vehicles hit their target, while last year
saw no less than 85.9% do likewise.
Such success is partially attributable to
more targeted investment strategies
as well as an abundance of capital
seeking returns—pensions have
increasing payouts to meet given
demographic shifts, for one—but by
and large, LPs have been piling into
VC in particular, entranced by the
promise of outsized returns generated
by high-profile VC firms. After all, VCs
did return $21 billion in the first half of
2015.
But the dealmaking climate has cooled.
Liquidity has become a chancier
prospect, particularly for many late-
stage, heavily financed startups.
Fundraisers are forward-looking, but
LPs are cautious, still open to commit
but wishing to see what happens in
1Q. As public market valuations soften,
private comparables will correct in
turn, potentially paving the way for
a resurgence in activity far down the
road. But as investment declines gently
for now, fundraising will likely follow
suit or plateau, as investors seek to
put dry powder to work at a slower
pace, and consequently take longer to
fundraise as well.
12 PITCHBOOK 2015 ANNUAL PE & VC FUNDRAISING & CAPITAL OVERHANG REPORT
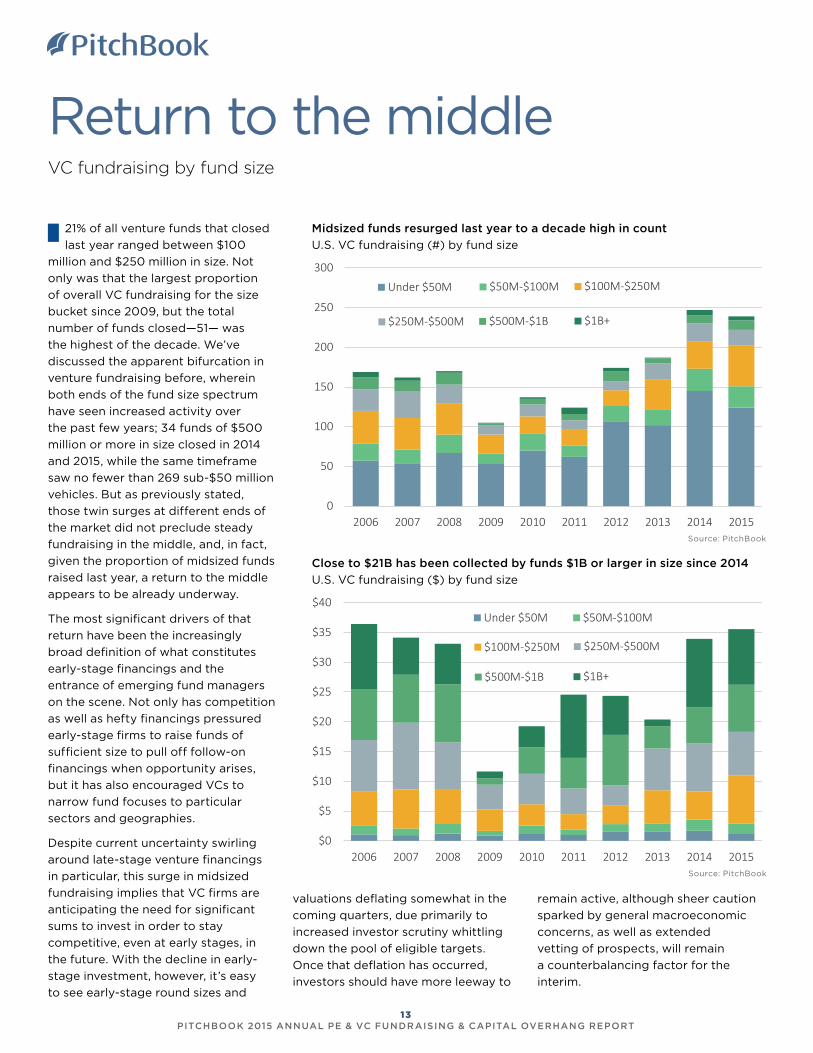
Midsized funds resurged last year to a decade high in count
U.S. VC fundraising (#) by fund size
Close to $21B has been collected by funds $1B or larger in size since 2014
U.S. VC fundraising ($) by fund size
21% of all venture funds that closed
last year ranged between $100
million and $250 million in size. Not
only was that the largest proportion
of overall VC fundraising for the size
bucket since 2009, but the total
number of funds closed—51— was
the highest of the decade. We’ve
discussed the apparent bifurcation in
venture fundraising before, wherein
both ends of the fund size spectrum
have seen increased activity over
the past few years; 34 funds of $500
million or more in size closed in 2014
and 2015, while the same timeframe
saw no fewer than 269 sub-$50 million
vehicles. But as previously stated,
those twin surges at different ends of
the market did not preclude steady
fundraising in the middle, and, in fact,
given the proportion of midsized funds
raised last year, a return to the middle
appears to be already underway.
The most significant drivers of that
return have been the increasingly
broad definition of what constitutes
early-stage financings and the
entrance of emerging fund managers
on the scene. Not only has competition
as well as hefty financings pressured
early-stage firms to raise funds of
sufficient size to pull off follow-on
financings when opportunity arises,
but it has also encouraged VCs to
narrow fund focuses to particular
sectors and geographies.
Despite current uncertainty swirling
around late-stage venture financings
in particular, this surge in midsized
fundraising implies that VC firms are
anticipating the need for significant
sums to invest in order to stay
competitive, even at early stages, in
the future. With the decline in early-
stage investment, however, it’s easy
to see early-stage round sizes and
Return to the middleVC fundraising by fund size
0
50
100
150
200
250
300
2006 2007 2008 2009 2010 2011 2012 2013 2014 2015
Under $50M $50M-$100M $100M-$250M
$250M-$500M $500M-$1B $1B+
$0
$5
$10
$15
$20
$25
$30
$35
$40
2006 2007 2008 2009 2010 2011 2012 2013 2014 2015
Under $50M $50M-$100M
$100M-$250M $250M-$500M
$500M-$1B $1B+
Source: PitchBook
Source: PitchBook
valuations deflating somewhat in the
coming quarters, due primarily to
increased investor scrutiny whittling
down the pool of eligible targets.
Once that deflation has occurred,
investors should have more leeway to
remain active, although sheer caution
sparked by general macroeconomic
concerns, as well as extended
vetting of prospects, will remain
a counterbalancing factor for the
interim.
13 PITCHBOOK 2015 ANNUAL PE & VC FUNDRAISING & CAPITAL OVERHANG REPORT
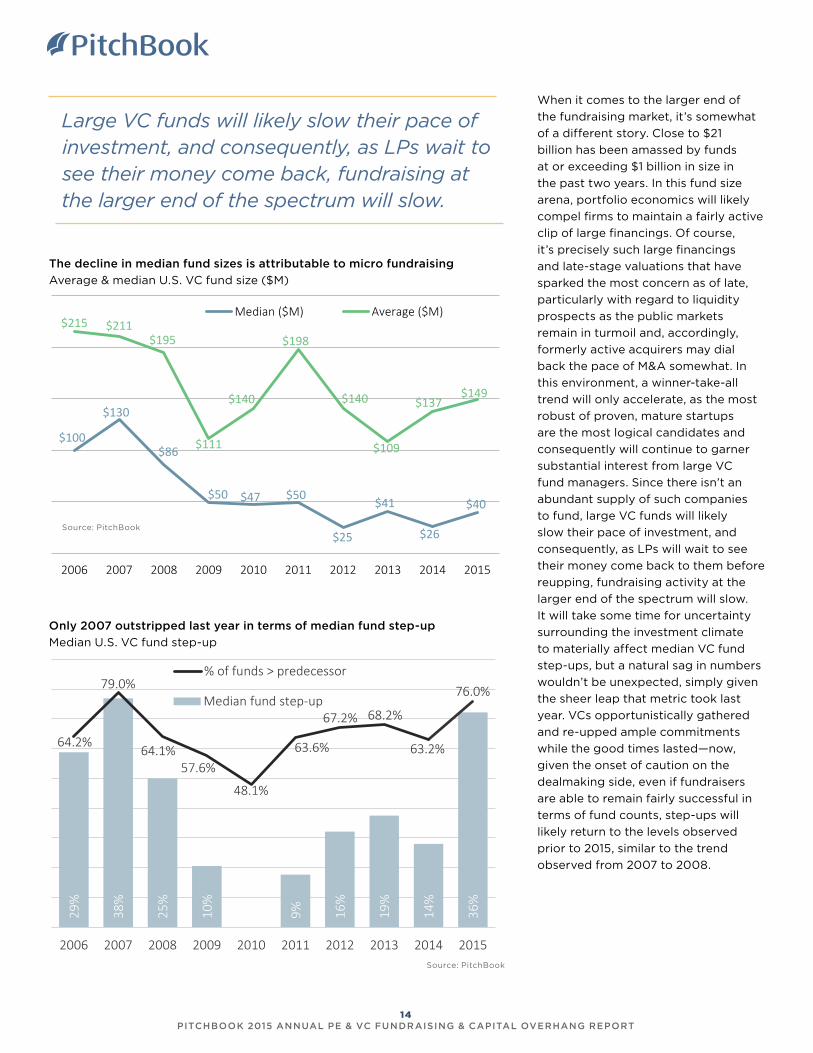
The decline in median fund sizes is attributable to micro fundraising
Average & median U.S. VC fund size ($M)
Only 2007 outstripped last year in terms of median fund step-up
Median U.S. VC fund step-up
$100
$130
$86
$50 $47 $50
$25
$41
$26
$40
$215 $211$195
$111
$140
$198
$140
$109
$137$149
2006 2007 2008 2009 2010 2011 2012 2013 2014 2015
Median ($M) Average ($M)
Source: PitchBook
29%
38%
25%
10%
0% 9% 16%
19%
14%
36%
64.2%
79.0%
64.1%57.6%
48.1%
63.6%
67.2% 68.2%
63.2%
76.0%
2006 2007 2008 2009 2010 2011 2012 2013 2014 2015
Median fund step-up
% of funds > predecessor
Source: PitchBook
Large VC funds will likely slow their pace of investment, and consequently, as LPs wait to see their money come back, fundraising at the larger end of the spectrum will slow.
When it comes to the larger end of
the fundraising market, it’s somewhat
of a different story. Close to $21
billion has been amassed by funds
at or exceeding $1 billion in size in
the past two years. In this fund size
arena, portfolio economics will likely
compel firms to maintain a fairly active
clip of large financings. Of course,
it’s precisely such large financings
and late-stage valuations that have
sparked the most concern as of late,
particularly with regard to liquidity
prospects as the public markets
remain in turmoil and, accordingly,
formerly active acquirers may dial
back the pace of M&A somewhat. In
this environment, a winner-take-all
trend will only accelerate, as the most
robust of proven, mature startups
are the most logical candidates and
consequently will continue to garner
substantial interest from large VC
fund managers. Since there isn’t an
abundant supply of such companies
to fund, large VC funds will likely
slow their pace of investment, and
consequently, as LPs will wait to see
their money come back to them before
reupping, fundraising activity at the
larger end of the spectrum will slow.
It will take some time for uncertainty
surrounding the investment climate
to materially affect median VC fund
step-ups, but a natural sag in numbers
wouldn’t be unexpected, simply given
the sheer leap that metric took last
year. VCs opportunistically gathered
and re-upped ample commitments
while the good times lasted—now,
given the onset of caution on the
dealmaking side, even if fundraisers
are able to remain fairly successful in
terms of fund counts, step-ups will
likely return to the levels observed
prior to 2015, similar to the trend
observed from 2007 to 2008.
14 PITCHBOOK 2015 ANNUAL PE & VC FUNDRAISING & CAPITAL OVERHANG REPORT
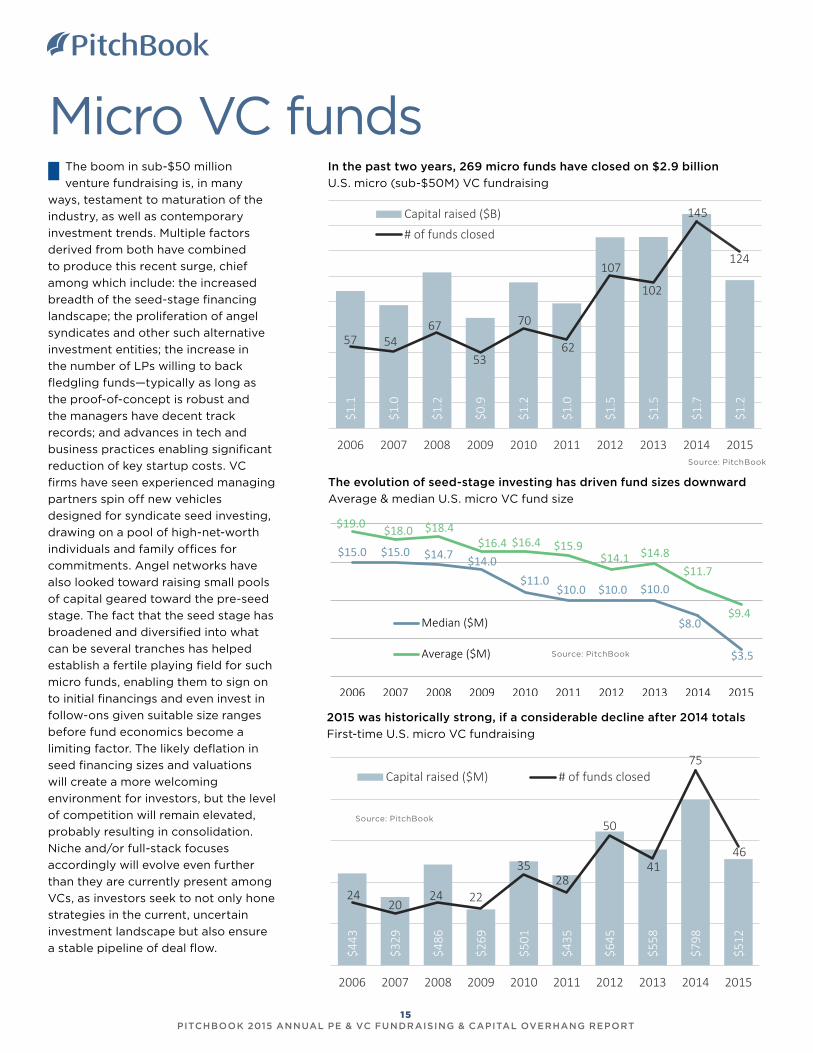
In the past two years, 269 micro funds have closed on $2.9 billion
U.S. micro (sub-$50M) VC fundraising
The evolution of seed-stage investing has driven fund sizes downward
Average & median U.S. micro VC fund size
The boom in sub-$50 million
venture fundraising is, in many
ways, testament to maturation of the
industry, as well as contemporary
investment trends. Multiple factors
derived from both have combined
to produce this recent surge, chief
among which include: the increased
breadth of the seed-stage financing
landscape; the proliferation of angel
syndicates and other such alternative
investment entities; the increase in
the number of LPs willing to back
fledgling funds—typically as long as
the proof-of-concept is robust and
the managers have decent track
records; and advances in tech and
business practices enabling significant
reduction of key startup costs. VC
firms have seen experienced managing
partners spin off new vehicles
designed for syndicate seed investing,
drawing on a pool of high-net-worth
individuals and family offices for
commitments. Angel networks have
also looked toward raising small pools
of capital geared toward the pre-seed
stage. The fact that the seed stage has
broadened and diversified into what
can be several tranches has helped
establish a fertile playing field for such
micro funds, enabling them to sign on
to initial financings and even invest in
follow-ons given suitable size ranges
before fund economics become a
limiting factor. The likely deflation in
seed financing sizes and valuations
will create a more welcoming
environment for investors, but the level
of competition will remain elevated,
probably resulting in consolidation.
Niche and/or full-stack focuses
accordingly will evolve even further
than they are currently present among
VCs, as investors seek to not only hone
strategies in the current, uncertain
investment landscape but also ensure
a stable pipeline of deal flow.
Micro VC funds
$1.1
$1.0
$1.2
$0.9
$1.2
$1.0
$1.5
$1.5
$1.7
$1.2
57 5467
53
70
62
107
102
145
124
2006 2007 2008 2009 2010 2011 2012 2013 2014 2015
Capital raised ($B)
# of funds closed
Source: PitchBook
$15.0 $15.0 $14.7 $14.0$11.0
$10.0 $10.0 $10.0
$8.0
$3.5
$19.0 $18.0 $18.4$16.4 $16.4 $15.9
$14.1 $14.8$11.7
$9.4
2006 2007 2008 2009 2010 2011 2012 2013 2014 2015
Median ($M)
Average ($M) Source: PitchBook
2015 was historically strong, if a considerable decline after 2014 totals
First-time U.S. micro VC fundraising
$443
$329
$486
$269
$501
$435
$645
$558
$798
$512
2420
24 22
3528
50
41
75
46
2006 2007 2008 2009 2010 2011 2012 2013 2014 2015
Capital raised ($M) # of funds closed
Source: PitchBook
15 PITCHBOOK 2015 ANNUAL PE & VC FUNDRAISING & CAPITAL OVERHANG REPORT
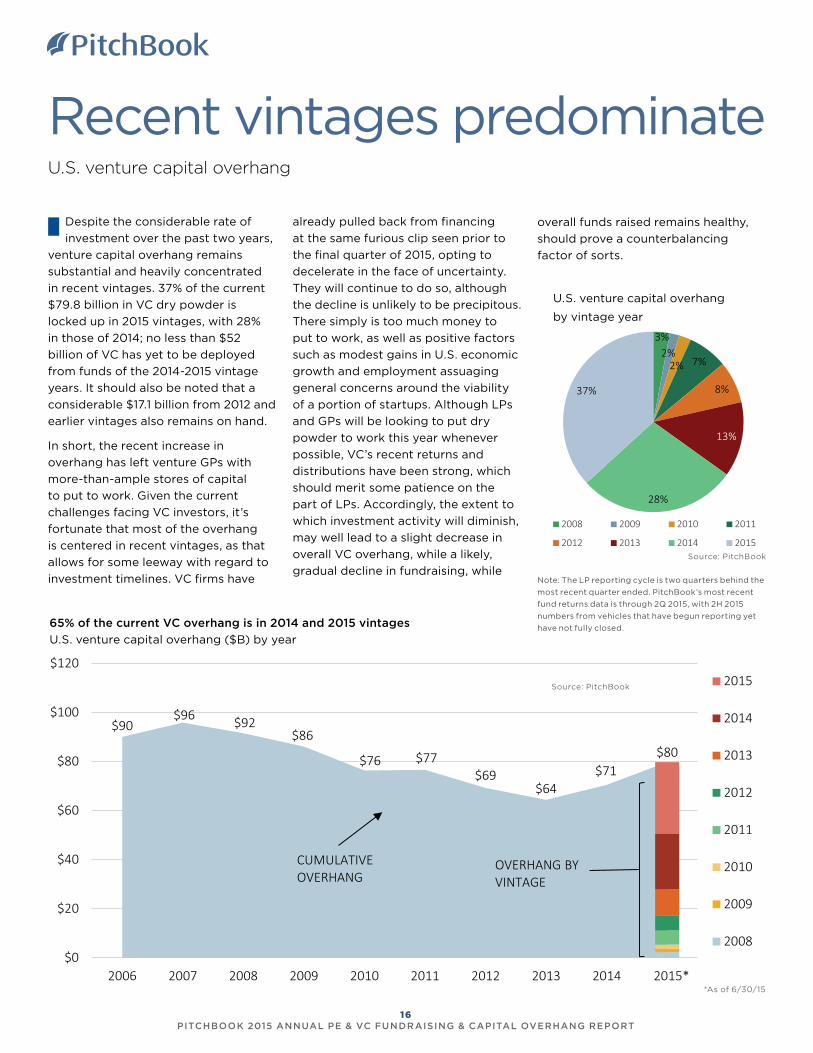
Recent vintages predominateU.S. venture capital overhang
Despite the considerable rate of
investment over the past two years,
venture capital overhang remains
substantial and heavily concentrated
in recent vintages. 37% of the current
$79.8 billion in VC dry powder is
locked up in 2015 vintages, with 28%
in those of 2014; no less than $52
billion of VC has yet to be deployed
from funds of the 2014-2015 vintage
years. It should also be noted that a
considerable $17.1 billion from 2012 and
earlier vintages also remains on hand.
In short, the recent increase in
overhang has left venture GPs with
more-than-ample stores of capital
to put to work. Given the current
challenges facing VC investors, it’s
fortunate that most of the overhang
is centered in recent vintages, as that
allows for some leeway with regard to
investment timelines. VC firms have
65% of the current VC overhang is in 2014 and 2015 vintages
U.S. venture capital overhang ($B) by year
U.S. venture capital overhang
by vintage year
Source: PitchBook
3%2%
2% 7%
8%
13%
28%
37%
2008 2009 2010 2011
2012 2013 2014 2015
$90$96 $92
$86
$76 $77$69
$64$71
$80
$0
$20
$40
$60
$80
$100
$120
2006 2007 2008 2009 2010 2011 2012 2013 2014 2015*
2015
2014
2013
2012
2011
2010
2009
2008
CUMULATIVEOVERHANG
OVERHANG BY VINTAGE
Source: PitchBook
already pulled back from financing
at the same furious clip seen prior to
the final quarter of 2015, opting to
decelerate in the face of uncertainty.
They will continue to do so, although
the decline is unlikely to be precipitous.
There simply is too much money to
put to work, as well as positive factors
such as modest gains in U.S. economic
growth and employment assuaging
general concerns around the viability
of a portion of startups. Although LPs
and GPs will be looking to put dry
powder to work this year whenever
possible, VC’s recent returns and
distributions have been strong, which
should merit some patience on the
part of LPs. Accordingly, the extent to
which investment activity will diminish,
may well lead to a slight decrease in
overall VC overhang, while a likely,
gradual decline in fundraising, while
overall funds raised remains healthy,
should prove a counterbalancing
factor of sorts.
*As of 6/30/15
Note: The LP reporting cycle is two quarters behind the
most recent quarter ended. PitchBook’s most recent
fund returns data is through 2Q 2015, with 2H 2015
numbers from vehicles that have begun reporting yet
have not fully closed.
16 PITCHBOOK 2015 ANNUAL PE & VC FUNDRAISING & CAPITAL OVERHANG REPORT
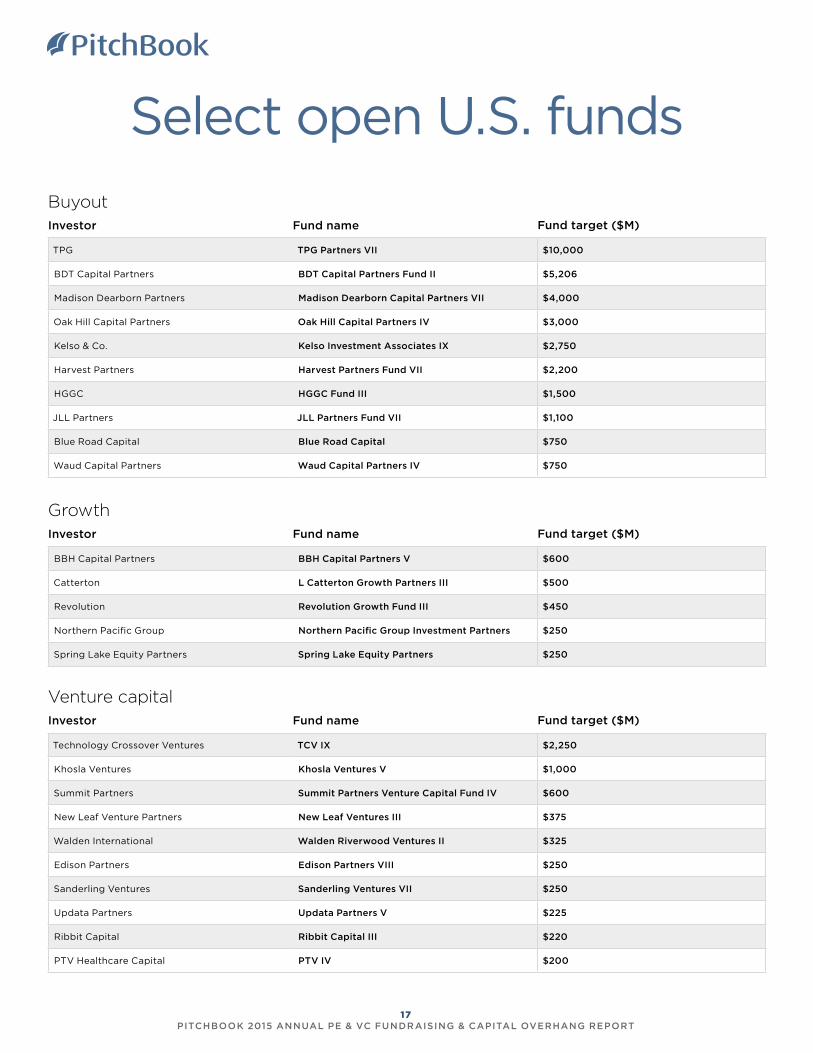
Select open U.S. funds
TPG TPG Partners VII $10,000
BDT Capital Partners BDT Capital Partners Fund II $5,206
Madison Dearborn Partners Madison Dearborn Capital Partners VII $4,000
Oak Hill Capital Partners Oak Hill Capital Partners IV $3,000
Kelso & Co. Kelso Investment Associates IX $2,750
Harvest Partners Harvest Partners Fund VII $2,200
HGGC HGGC Fund III $1,500
JLL Partners JLL Partners Fund VII $1,100
Blue Road Capital Blue Road Capital $750
Waud Capital Partners Waud Capital Partners IV $750
Investor Fund name Fund target ($M)
Buyout
Growth
Venture capital
BBH Capital Partners BBH Capital Partners V $600
Catterton L Catterton Growth Partners III $500
Revolution Revolution Growth Fund III $450
Northern Pacific Group Northern Pacific Group Investment Partners $250
Spring Lake Equity Partners Spring Lake Equity Partners $250
Investor Fund name Fund target ($M)
Technology Crossover Ventures TCV IX $2,250
Khosla Ventures Khosla Ventures V $1,000
Summit Partners Summit Partners Venture Capital Fund IV $600
New Leaf Venture Partners New Leaf Ventures III $375
Walden International Walden Riverwood Ventures II $325
Edison Partners Edison Partners VIII $250
Sanderling Ventures Sanderling Ventures VII $250
Updata Partners Updata Partners V $225
Ribbit Capital Ribbit Capital III $220
PTV Healthcare Capital PTV IV $200
Investor Fund name Fund target ($M)
17 PITCHBOOK 2015 ANNUAL PE & VC FUNDRAISING & CAPITAL OVERHANG REPORT

MethodologyPRIVATE EQUITY FUNDS
The following fund types are used in PitchBook’s PE fundraising data: buyout, co-investment, mezzanine,
restructuring/distressed situations, energy and PE growth/expansion. This report only includes U.S.-based
funds that have held their final close. Note: for U.S. PE and VC contributions versus capital raised, the
contributions are the sums called down in the U.S. from limited partners by general partners, compared to
overall capital raised, in a given timeframe.
VENTURE CAPITAL FUNDS
In addition to traditional VC funds, PitchBook also includes corporate VC funds and seed-stage funds in our
VC fundraising total. Funds that identify themselves as growth-stage vehicles are classified as PE funds in
this report. Only U.S.-based funds that have held their final close are included in the fundraising numbers.
CLOSE DATE AND VINTAGE
Unless otherwise noted, the fundraising data in this report is based on a fund’s close date. The vintage year
is based on the vintage year reported by the GP and LPs, otherwise the year in which a fund holds its final
close is used.
CAPITAL OVERHANG
Calculated using the most recently available fund cashflow data, the capital overhang in this report is
updated through June 30, 2015. The capital overhang is based on vintage year and only capital that is held
in closed funds is considered (i.e. evergreen funds are not counted). If a fund closed on July 1, 2015 or later,
it is only included in the dry powder figure if it previously held a first close and has cashflow data available.
FUND LOCATION
A fund’s location is determined by the country or region where the majority of its investments have been, or
will be, made. Only U.S.-based funds are included in this report.
18 PITCHBOOK 2015 ANNUAL PE & VC FUNDRAISING & CAPITAL OVERHANG REPORT

Contact PitchBook
pitchbook.com
RESEARCH [email protected]
EDITORIAL [email protected]
SALES [email protected]

The data you need to be a better VC investor
With data on:
Companies
Investors
Deals
M&A
Limited partners
Funds
Financials
Advisors
People
Request a free trial
US +1 206.623.1986
UK +44 (0)207.190.9809
pitchbook.com
The PitchBook Platform for venture capital
• Know everything that happens in the venture space
• Make smarter investments
• Find LPs & raise funds faster
• Elevate your firm with kick-ass technology