2017 - aker bp asa 2017 24 october: aker bp entered into an agreement ... aker bp reported...
TRANSCRIPT

FORNEBU, 2 FEBRUARY 2018
Q42017
QUARTERLY REPORT FOR AKER BP ASA

2QUARTERLY REPORT Q4 2017
KEY EVENTS IN
Q4 2017
24 October: Aker BP entered into an agreement to acquire Hess Norge27 October: The Board declared a quarterly dividend of USD 0.185 per share to be paid in November 31 October: A private placement of 22.4 million new shares was successfully completed, raising gross proceeds of NOK 4.1 billion4 December: Aker BP entered into an agreement to sell 10 percent interest in the Valhall andHodfieldstoPandionEnergy15 December: On behalf of the respective partnerships, Aker BP submitted PDOs for the fieldsÆrfugl,ValhallFlankWestandSkogultoNorwegianauthorities22 December: The transactions with Hess and Pandion were completed, and a new USD 1.5billionbankfacilitywastappedaspartofthefinancingarrangements
KEY EVENTS AFTER THE QUARTER
15 January: Aker BP reported preliminary year end 2P reserves of 913 mmboe and best estimate contingent resources of 785 mmboe15 January: The Board proposed USD 450 million in dividends for 2018 and stated a clear ambition to grow dividends by USD 100 million per year to 202116 January: Aker BP was offered 23 new licences in the APA 2017 licensing round

3
Unit Q4 2017 Q4 2016 2017 2016
Operating income USDm 726 656 2 563 1 364
EBITDA USDm 509 485 1 786 968
Net result USDm 34 -67 275 35
Earningspershare(EPS) USD 0.10 -0.20 0.81 0.15
Production cost per barrel USD/boe 12 10 10 8
Depreciation per barrel USD/boe 15 14 14 18
Cashflowfromoperations USDm 543 320 2 155 896
Cashflowfrominvestments USDm -2 192 -313 -3 059 -705
Total assets USDm 12 019 9 255 12 019 9 255
Netinterest-bearingdebt(bookvalue) USDm 3 156 2 425 3 156 2 425
Cash and cash equivalents USDm 233 115 233 115
Unit Q4 2017 Q4 2016 2017 2016
Alvheim(65%) boepd 42 281 53 683 53 849 43 290
Bøyla(65%) boepd 3 680 6 470 4 357 7 411
GinaKrog(3.3%) boepd 1 712 - 798 -
Hod(37.5%) boepd 472 596 530 150
IvarAasen(34.8%) boepd 23 489 838 18 100 211
Skarv(23.8%) boepd 21 403 30 040 26 680 7 551
Tambar/TambarEast(55.0%/46.2%) boepd 949 2 070 1 941 520
Ula(80%) boepd 5 982 5 057 6 466 1 271
Valhall(36.0%) boepd 14 449 17 505 13 357 4 400
Vilje(46.9%) boepd 4 767 6 221 5 304 6 599
Volund(65%) boepd 16 292 3 462 7 342 5 027
Other boepd 78 582 103 1 010
SUM boepd 135 554 126 524 138 825 77 441
Oil price USD/bbl 65 52 56 47
Gas price USD/scm 0.26 0.19 0.21 0.18
SUMMARY OF FINANCIAL RESULTS
SUMMARY OF PRODUCTION

4QUARTERLY REPORT Q4 2017
SUMMARY OF THE QUARTER
AkerBPASA(“thecompany”or“AkerBP”)reportedtotalincomeofUSD726(656)millioninthefourthquarter of 2017. Production in the period was 135.6 (126.5) thousandbarrelsofoil equivalentperday(“mboepd”),realisinganaverageoilpriceofUSD65(52)perbarrel,whilegasrevenueswererecognizedatmarketvalueofUSD0.26(0.19)perstandardcubicmetre(scm).Productioncostperbarrelofoilequivalents(“boe”)wasUSD11.8(10.4).
EBITDAamountedtoUSD509(485)millioninthequarterandEBITwasUSD305(281)million.NetprofitforthequarterwasUSD34(-67)million,translatingintoanEPSofUSD0.10(-0.20).Netinterest-bearingdebtamountedtoUSD3,156(2,425)millionper31December 2017.
The offshore activity level remained high in the fourth quarter, both with regards to drilling, maintenance andmodifications.Overall,productionwasstable.IvarAasencontributedpositivelyandreachedplateauproduction level, one year ahead of original plan. Skarv production was negatively impacted by three shut-in wells, of which one was reinstated towards the end of the quarter, and by a pressure build-up test on the Ærfugltestproducer.
On 7 December, a fatal accident took place on the drilling rigMaerskInterceptorwhileoperatingontheTambarfield.Therootcausesfromthistragicaccidentwillbeduly followed up, learnings will be implemented and also shared with the industry.
On 15 December, the company submitted three Plans for DevelopmentandOperations(“PDO”)totheNorwegianauthoritiesfortheÆrfugl,ValhallFlankWestandSkoguldevelopments, with increased volumes and reduced CAPEXestimatescomparedtoconceptselection.
During the fourth quarter, Aker BP acquired Hess NorgeAS(“HessNorge”)foracashconsiderationofUSD 2.0 billion, plus working capital adjustments. The transaction included Hess Norge’s interests in the ValhallandHodfields,andataxlosscarryforwardwithanominalaftertaxvalueofUSD1.5billion.AkerBPalsosold10percentofValhallandHodtoPandionEnergy.Followingthesetransactions,AkerBPhas90percentinterestinbothfields.InconnectionwiththeHessNorgeacquisition,thecompanyraisedapproximatelyUSD 500 million in new equity and secured a bank term loan for USD 1.5 billion. This loan will be repaid whenthetaxlossfromHessNorgeisdisbursed,whichisexpectedinthesecondhalfof2018.
InNovember,thecompanypaidaquarterlydividendof USD 0.185 per share.
Forward-looking statements in this report reflect current views about future events and are, by their nature, subject to significant risks and uncertainties because they relate
to events and depend on circumstances that will occur in the future.
All figures are presented in USD unless otherwise stated, and figures in brackets apply to the corresponding period in the previous year. The full-year figures for 2016 are not directly comparable
to 2017 as the merger with BP Norge AS was completed on 30 September 2016.
5
FINANCIAL REVIEW
(USD million) Q4 2017 Q4 2016
Operating income 726 656
EBITDA 509 485
EBIT 305 281
Pre-taxprofit/loss 248 210
Netprofit 34 -67
EPS(USD) 0.10 -0.20
(USD million) Q4 2017 Q4 2016
Goodwill 1 860 1 847
PP&E 5 582 4 442
Cash & cash equivalents 233 115
Total assets 12 019 9 255
Equity 2 989 2 449
Interest-bearingdebt 3 389 2 541
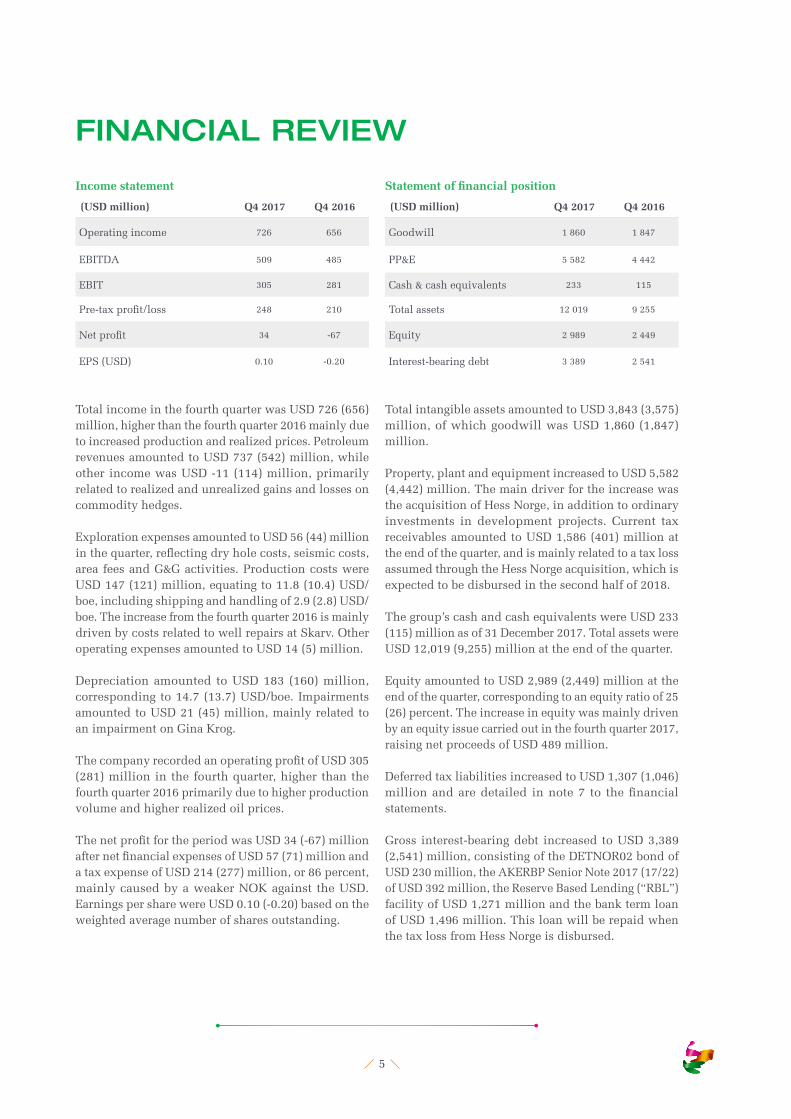
TotalincomeinthefourthquarterwasUSD726(656)million, higher than the fourth quarter 2016 mainly due toincreasedproductionandrealizedprices.PetroleumrevenuesamountedtoUSD737(542)million,whileotherincomewasUSD-11(114)million,primarilyrelatedtorealizedandunrealizedgainsandlossesoncommodity hedges.
ExplorationexpensesamountedtoUSD56(44)millioninthequarter,reflectingdryholecosts,seismiccosts,area fees and G&G activities. Production costs were USD147(121)million,equatingto11.8(10.4)USD/boe,includingshippingandhandlingof2.9(2.8)USD/boe. The increase from the fourth quarter 2016 is mainly driven by costs related to well repairs at Skarv. Other operatingexpensesamountedtoUSD14(5)million.
Depreciationamounted toUSD183 (160)million,correspondingto14.7(13.7)USD/boe.ImpairmentsamountedtoUSD21(45)million,mainlyrelatedtoan impairment on Gina Krog.
ThecompanyrecordedanoperatingprofitofUSD305(281)millioninthefourthquarter,higherthanthefourth quarter 2016 primarily due to higher production volumeandhigherrealizedoilprices.
ThenetprofitfortheperiodwasUSD34(-67)millionafternetfinancialexpensesofUSD57(71)millionandataxexpenseofUSD214(277)million,or86percent,mainly caused by a weaker NOK against the USD. EarningspersharewereUSD0.10(-0.20)basedontheweighted average number of shares outstanding.
TotalintangibleassetsamountedtoUSD3,843(3,575)million,ofwhichgoodwillwasUSD1,860(1,847)million.
Property, plant and equipment increased to USD 5,582 (4,442)million.Themaindriverfortheincreasewasthe acquisition of Hess Norge, in addition to ordinary investments in development projects. Current taxreceivablesamountedtoUSD1,586(401)millionattheendofthequarter,andismainlyrelatedtoataxlossassumed through the Hess Norge acquisition, which is expectedtobedisbursedinthesecondhalfof2018.
The group’s cash and cash equivalents were USD 233 (115)millionasof31December2017.TotalassetswereUSD12,019(9,255)millionattheendofthequarter.
EquityamountedtoUSD2,989(2,449)millionattheend of the quarter, corresponding to an equity ratio of 25 (26)percent.Theincreaseinequitywasmainlydrivenby an equity issue carried out in the fourth quarter 2017, raising net proceeds of USD 489 million.
DeferredtaxliabilitiesincreasedtoUSD1,307(1,046)millionandaredetailed innote7 to thefinancialstatements.
Gross interest-bearing debt increased to USD 3,389 (2,541)million,consistingoftheDETNOR02bondofUSD230million,theAKERBPSeniorNote2017(17/22)ofUSD392million,theReserveBasedLending(“RBL”)facility of USD 1,271 million and the bank term loan of USD 1,496 million. This loan will be repaid when thetaxlossfromHessNorgeisdisbursed.
Income statement Statement of financial position
6QUARTERLY REPORT Q4 2017
(USD million) Q4 2017 Q4 2016
Cashflowfromoperations 543 320
Cashflowfrominvestments -2 192 -313
Cashflowfromfinancing 1 796 -675
Net change in cash & cash eq. 147 -668
Cashandcasheq.EOQ 233 115
Statement of cash flow
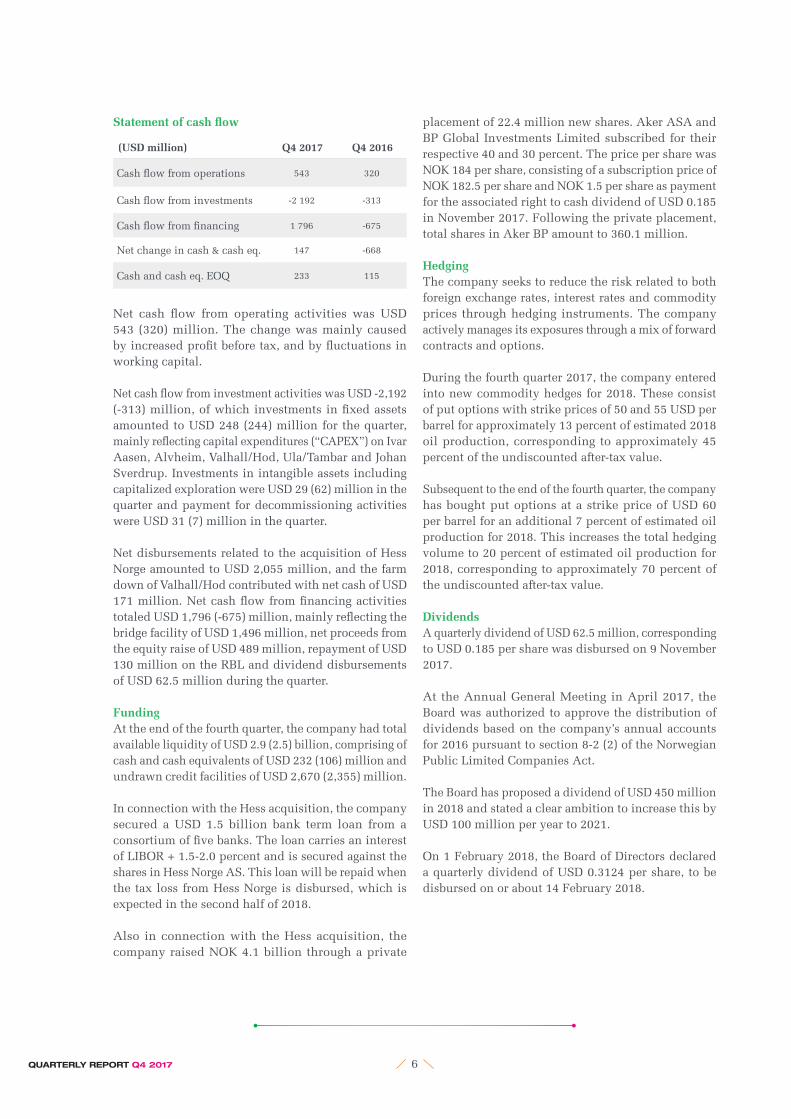
Net cash flow from operating activities was USD543 (320)million.Thechangewasmainlycausedbyincreasedprofitbeforetax,andbyfluctuationsinworking capital.
NetcashflowfrominvestmentactivitieswasUSD-2,192(-313)million,ofwhichinvestmentsinfixedassetsamountedtoUSD248(244)millionforthequarter,mainlyreflectingcapitalexpenditures(“CAPEX”)onIvarAasen, Alvheim, Valhall/Hod, Ula/Tambar and Johan Sverdrup.InvestmentsinintangibleassetsincludingcapitalizedexplorationwereUSD29(62)millioninthequarter and payment for decommissioning activities wereUSD31(7)millioninthequarter.
Net disbursements related to the acquisition of Hess Norge amounted to USD 2,055 million, and the farm down of Valhall/Hod contributed with net cash of USD 171million.NetcashflowfromfinancingactivitiestotaledUSD1,796(-675)million,mainlyreflectingthebridge facility of USD 1,496 million, net proceeds from the equity raise of USD 489 million, repayment of USD 130millionontheRBLanddividenddisbursementsof USD 62.5 million during the quarter.
FundingAt the end of the fourth quarter, the company had total availableliquidityofUSD2.9(2.5)billion,comprisingofcashandcashequivalentsofUSD232(106)millionandundrawncreditfacilitiesofUSD2,670(2,355)million.
InconnectionwiththeHessacquisition,thecompanysecured a USD 1.5 billion bank term loan from a consortiumoffivebanks.TheloancarriesaninterestofLIBOR+1.5-2.0percentandissecuredagainsttheshares in Hess Norge AS. This loan will be repaid when thetaxlossfromHessNorgeisdisbursed,whichisexpectedinthesecondhalfof2018.
Also in connection with the Hess acquisition, the company raised NOK 4.1 billion through a private
placement of 22.4 million new shares. Aker ASA and BPGlobalInvestmentsLimitedsubscribedfortheirrespective 40 and 30 percent. The price per share was NOK 184 per share, consisting of a subscription price of NOK 182.5 per share and NOK 1.5 per share as payment for the associated right to cash dividend of USD 0.185 inNovember2017.Followingtheprivateplacement,total shares in Aker BP amount to 360.1 million.
HedgingThe company seeks to reduce the risk related to both foreignexchangerates,interestratesandcommodityprices through hedging instruments. The company activelymanagesitsexposuresthroughamixofforwardcontracts and options.
During the fourth quarter 2017, the company entered into new commodity hedges for 2018. These consist of put options with strike prices of 50 and 55 USD per barrelforapproximately13percentofestimated2018oilproduction,correspondingtoapproximately45percentoftheundiscountedafter-taxvalue.
Subsequent to the end of the fourth quarter, the company has bought put options at a strike price of USD 60 per barrel for an additional 7 percent of estimated oil production for 2018. This increases the total hedging volume to 20 percent of estimated oil production for 2018,correspondingtoapproximately70percentoftheundiscountedafter-taxvalue.
DividendsA quarterly dividend of USD 62.5 million, corresponding to USD 0.185 per share was disbursed on 9 November 2017.
At the Annual General Meeting in April 2017, the Boardwasauthorizedtoapprovethedistributionofdividends based on the company’s annual accounts for2016pursuanttosection8-2(2)oftheNorwegianPublicLimitedCompaniesAct.
The Board has proposed a dividend of USD 450 million in 2018 and stated a clear ambition to increase this by USD 100 million per year to 2021.
On1February2018,theBoardofDirectorsdeclareda quarterly dividend of USD 0.3124 per share, to be disbursedonorabout14February2018.

7
HEALTH, SAFETY AND THE ENVIRONMENT
OPERATIONAL REVIEW
HSEisalwaysthenumberonepriorityinallofAkerBP’sactivities. The company ensures that all its operations, drilling campaigns and projects are carried out under thehighestHSEstandards.
On 7 December 2017, a fatal accident took place on the drillingrigMærskInterceptorwhileoperatingontheTambarfield.Thepolice,PetroleumSafetyAuthority(PSA)andMærskDrillingwithparticipationofAkerBP representatives are investigating the accident to understandtherootcauses.ThefinalreportisexpectedtobeissuedinearlyFebruary2018.Therootcausesfrom the incident will be duly followed up, learnings implemented and shared with the industry.
In the fourthquarter therewasoneprocesssafetyincident reported on Valhall, resulting in a spill of mud on the injection and drilling platform. The mud was contained and the incident investigated.
Process safety events and high potential incidents will remain focus areas in Aker BP’s work with the risk and barrier processes. Development of a new software tool on managing barriers will be a part of this work.
FournotificationsweresenttothePSAinthefourthquarter. The 2017 PSA audit program has been completed with no issues of notice of order to Aker BP.
AkerBPproduced12.5(11.6)mmboeinthefourthquarterof2017,correspondingto135.6(126.5)mboepd.TheaveragerealizedoilpricewasUSD65(52)perbarrel,whilegasrevenueswererecognizedatmarketvalueofUSD0.26(0.19)perstandardcubicmetre(scm).
Alvheim AreaPL203/088BS/036C/036D/150 (operator)TheproducingfieldsAlvheim(65percent),Volund(65percent),Bøyla(65percent)andVilje(46.9percent)arealltiedbacktotheAlvheimFPSO.
FourthquarterproductionfromAlvheimareawasapproximately three percent down from previousquarter. This was partly a result of ordinary decline, but also impacted by two unplanned plant shutdowns.
Two new wells at the Boa drill centre have been drilled and completed in the fourth quarter, and will be put in operationduringthefirstquarter2018.
TheproductionefficiencyfortheAlvheimareawas98percent in the quarter.
Valhall Area PL006B/033/033B (operator)TheValhallareaconsistsoftheproducingfieldsValhall(35.95percent)andHod(37.5percent).Followingthecompletion of the transactions with Hess and Pandion (describedelsewhereinthisreport),AkerBP’sinterestin Valhall and Hod has increased to 90 percent.
Production from the Valhall area increased in the fourth quarter,partlydrivenbyflushproductionfollowingaplanned maintenance shutdown in the third quarter, and partly driven by new wells.
During the quarter, four parallel drilling and wells operations have been in progress. This activity resulted in some temporary planned well shutdowns. The MaerskInvinciblerigcontinuedthesuccessfulP&Acampaign at Valhall with better than planned progress, whiletheIPrigdrillingcampaignprogressedverywelland two wireline crews were running production and abandonment well interventions.
TheproductionefficiencyfortheValhallareawas89percent in the fourth quarter.

8QUARTERLY REPORT Q4 2017
PROJECTSJohan Sverdrup UnitPL265/501/502 (partner)Phase 1 of the Johan Sverdrup (11.5733 percent)development project is progressing according to plan towards production start-up by the end of 2019. Phase 1consistsofafieldcentrewithfourfixedplatforms,threesubseatemplates,oilandgasexportpipelines,power from shore and 36 production and injection wells.
Attheendofthefourthquarter,approximately80percent of the Phase 1 facilities construction is complete. The construction and onshore commissioning of the riserplatformatSamsunginKoreaisinthefinalstagesbefore module transport to Norway and traditional heavy liftinstallationoffshoreinthespring(Heerema).The
onshore hook up and commissioning of the drilling platform at Aibel in Haugesund is progressing well, preparing for offshore installation in the summer of 2018byPioneeringSpirit(Allseas).
After a successful completion of the eight pre-drilled production wells and a four well pilot/appraisal campaignforfurtherimprovementofreservoirdefinition,nine out of 10 planned pre-drilled water injection wells have been completed for injection.
The frontendengineeringanddesign (“FEED”) isnearly complete for the Phase 2 installations, aiming forahighengineeringmaturitylevelpriortothefinalinvestment decision and PDO for Phase 2 scheduled
Ula Area PL019/019B/065/300 (operator)TheUlaareaconsistsoftheproducingfieldsUla(80.0percent),Tambar(55.0percent)andTambarEast(46.2percent).TambarandTambarEastaretiedbacktotheUlafacilities,togetherwiththeRepsoloperatedBlanefieldandtheFaroeoperatedOselvarfield.
Production from the Ula area was slightly down in the fourth quarter. The reduction was caused by cyclic well performance, as well as downtime related to maintenance, Tambar drilling activities and equipment failure.Thealternatingwaterandgas(WAG)injectionmodeofthesewellsisexpectedtocausefluctuationinproduction volumes going forward.
TheproductionefficiencyfortheUlaareawas61percentin the quarter.
Skarv AreaPL159/212/212B/262 (operator)TheSkarvareaconsistsoftheSkarvproducingfield(23.84percent).Inaddition,productionfromtheÆrfugl(previouslynamedSnadd)testproducerisincludedinthe Skarv volumes.
Production from the Skarv area was down 13 percent in the fourth quarter compared to the previous quarter. At the beginning of the quarter, three wells were shut in due to technical issues. One of these wells was successfully reinstated during the quarter. Aker BP plans to reinstate oneorbothoftheremainingshut-inwellsduringfirsthalf of 2018. The company is also taking steps to prevent recurrence of these well failures elsewhere.
TheÆrfugltestproducerwasrestartedduringthefourthquarterfollowingextendedpressurebuilduptesting that was performed to obtain key reservoir data insupportoftheÆrfugldevelopment.
TheÆrfugldevelopmentwassanctionedandthePlanforDevelopmentandOperation(PDO)wassubmittedin December 2017.
The production efficiency for the Skarv areawas88percentinthequarter, influencedbythebeforementionedwell failures and plannedÆrfugl testproducer pressure build up testing.
Ivar Aasen PL001B/242/457 (operator)IvarAasen(34.786percent)deliveredaboveplannedproduction in the fourth quarter and reached plateau production level, one year ahead of original plan. The plant continued to perform well averaging 97.6 percent availability in the quarter. The overall production efficiency in the fourth quarterwas 86.1 percent,impactedbyEdvardGriegandSAGEavailabilityissues.
Gina Krog PL029B/029C/048/303 (partner)TheGinaKrogfield(3.3percent)startedproductionon30June2017.Thefieldhasbeendevelopedwithafixedplatformwithlivingquartersandprocessingfacilities.OilfromGinaKrogisexportedwithshuttletankerswhilegasisexportedviatheSleipnerplatform.

9
for the second half of 2018. Phase 2 production start isexpectedin2022.Phase2includes28additionalproduction and injection wells in the peripheral parts oftheJohanSverdrupoilfield,increasingthetotalnumber of wells to 64.
Phase 2 also includes an increased production capacity on a fifth platform at the field centre, taking theproduction capacity from 440,000 to 660,000 barrels of oil per day. Phase 2 includes increased power-from-shore capacity, which will allow Johan Sverdrup to supplyalsothesurroundingfieldsIvarAasen,EdvardGrieg and Gina Krog with power.
Theoperator’sPhase1CAPEXestimate,lastupdatedinthethirdquarter2017,wasNOK92billion(nominalatprojectcurrency),whichismorethanNOK30billion(25percent)lowerthanatPDOin2015.TheCAPEXestimate for Phase 2 is NOK 40 – 55 billion, which is approximatelyhalfthecostestimatedforPhase2whenthe PDO for Phase 1 was submitted in 2015.
The operator estimates the Johan Sverdrup reserves at between 2.0 and 3.0 billion barrels of oil equivalents (boe)andthefullfieldbreak-evenoilpricelowerthanUSD 25 per boe.
Valhall Flank WestPL006B/033/033B (operator)TheValhallFlankWestprojectwillbedevelopedoutoftheTorFormationatthewesternflankoftheValhallfield.Valhallisachalktypereservoirlocatedinthesouthern area of the Norwegian North Sea. The project was sanctioned and PDO submitted in December 2017. TheFEEDhasalreadybeendeliveredandtheprojectisexperiencingaseamlesstransitionintodetailedengineering. Production start is planned for fourth quarter 2019.
Valhall Flank North Water InjectionPL006B/033/033B (operator)TheValhallFlankNorthplatformislocatedtothenorthoftheValhallcomplexin72meterwaterdepth.Aprojectiscurrentlybeingmaturedtoexpandcapabilityfor water injection to the northern basin drainage area, thus securing the Valhall base production through enablingwaterinjectiontoexistingdepletedproducersand offering a potential for increased reserves recovery fromValhallof6-8mmboe(gross).Theprojectisintheprocessofbeingsanctionedduringfirstquarter2018,and the plan is to drill the injector in fourth quarter 2018 and commence injection in second quarter 2019.
North of Alvheim and Askja-Krafla (NOAKA) PL442/026B/364 (operator) and PL272 (partner)TheNorthofAlvheimandAskja-Krafla(NOAKA)areaconsistsofthediscoveriesFriggGammaDelta,Langfjellet,Frøy,Fulla,Frigg,RindandAskja-Krafla.Gross resources in the area are estimated to be in excessof500mmboe.Theconceptstudiesforthearea development is a shared initiative between the partners in the licences.
Withlimitedinfrastructureavailableinthearea,thegoal is to develop an economically robust area solution, which can tie-in area discoveries and open up for new explorationupsides.Theareadevelopmentsolutionis likely to include subsea structures and unmanned/normally unmanned installations on the individual reservoirsbasedontheirsizeandcomplexity.AkerBP’s assessment of NOAKA is that the development concept should facilitate for the highest area resource recovery. A concept selection decision is planned in thefirstquarter2018.
Skogul PL460 (operator)Skogul(previouslyknownasStorklakken)willbedeveloped with a single multilateral production well tiedbacktotheViljefield,utilizingtheexistingpipelinefromViljetotheAlvheimFPSO.Theprojectwassanctioned and PDO submitted in December 2017. Firstoilisexpectedin2020.
Ærfugl PL162/159/212/212B (operator)InDecember2017,AkerBPonbehalfofthejointventurepartnerssubmittedaPDOfortheÆrfuglfield(previouslyknownasSnadd),includingSnaddOuter.
Thefieldwillbedevelopedintwophases.Thefirstphase includes three new production wells in the southernpartofthefieldtiedintotheSkarvFPSOviaatraceheatedpipe-in-pipeflowline,inadditiontotheexistingA-1Hwell.Productionisplannedtobegin in late 2020.
The second phase is subject to further maturation, but the reference case includes two additional wells in the northernpartofthefieldandoneinSnaddOuteralsotiedintotheSkarvFPSOwithanestimatedproductionstart in 2023. Other alternatives will be looked at to selecttheoptimizedconcept.
The total remaining reserves for the full-fielddevelopment are estimated at approximately275million barrels of oil equivalents.

10QUARTERLY REPORT Q4 2017
EXPLORATION
TotalinvestmentsintheÆrfuglprojectareestimatedatNOK8.5billion(realterms)withNOK4.5billioninthefirstphaseandNOK4.0billioninthesecondphase(referencecase)respectively.
AkerBPhasonbehalfoftheÆrfuglpartnersenteredintofielddevelopmentcontractswithSubsea7forSubseaUmbilicalRiserFlowline(SURF)andwithAkerSolutionsforSubseaProductionSystem(SPS).TheÆrfuglprojectwillbeorganizedandexecutedaccordingto Aker BP’s alliance model.
Tambar DevelopmentPL065 (operator) TambarisasatellitefieldtoUla.AkerBPiscurrentlyexecutingadevelopmentprojectatTambarwhichwilladdtwoproductionwellstothefieldandmodifyfacilitiestoprovidegasliftfromtheUlafieldforbothnewandexistingTambarwells.Thedrillingoperationsstarted in October 2017 and will be completed during thefirstquarter2018.Theoffshorefacilitymodificationsare ongoing in accordance with the overall plan. The firstwellisscheduledtobebroughtinproductionin
February,andthesecondwellinApril.ThegasliftfacilitiesfortheTambarwellsareexpectedtobereadyaround fourth quarter 2018.
Oda PL405 (partner)TheOdafieldisbeingdevelopedwithasubseatemplatetiedbackto theAkerBPoperatedUlafieldcentreviatheexistingOselvarinfrastructure.Theprojectinvolves two production wells and one water injector. AkerBPperformstherequiredfaciltymodificationstoreceive production from and provide injection water to Oda. Oda’s recoverable reserves are estimated at 48 mmboe(gross).NaturalgasfromOdawillsupportUladevelopment strategy in provision of gas for the water alternatinggas(WAG)injectionregime.ThePDOwasapprovedbytheMinistryofPetroleumandEnergyinMay 2017. Total investments for Oda are estimated toNOK 5.4 billion.Offshore execution of facilitymodificationsontheUlafieldcentretobereadytoreceiveOdaproductionisongoing.FirstoilfromOdaisexpectedin2019.
During the quarter, the company’s cash spending on explorationwasUSD65million.USD56millionwasrecognizedas explorationexpenses in theperiod,relating to dry wells, seismic, area fees and G&G costs.
DrillingoftheHufsaprospectinPL533(AkerBP35percent)intheBarentsSeawascompletedinNovember.The well encountered a total gas column of 22 metres. Preliminaryestimates indicate that thesizeof thediscovery is less than 0.5 BCM of recoverable gas, and theassessmentisthatthediscoveryisnotprofitable.
After completing the Hufsa well, the rig moved on to drill the Hurri prospect in the same license. Hurri was completed in January 2018 as a dry well. A dry explorationwellwasalsodrilledintheGinaKrogunit(AkerBP3.3percent)inthequarter.
On 16 January 2018, the Norwegian Ministry of PetroleumandEnergyannouncedtheresultsoftheAPA 2017 licensing round. Aker BP was awarded 23 newexplorationlicenses,ofwhich14asoperator.
11
BUSINESS DEVELOPMENTOn 24 October 2017, Aker BP entered into an agreement to acquire Hess Norge for a cash consideration of USD 2.0 billion, with effective date 1 January 2017. Through this transaction, Aker BP assumed Hess Norge’s interests inthefieldsValhall(64.05percent)andHod(62.5percent),andHessNorge’staxpositionwhichincludedataxlosscarryforwardwithanetnominalafter-taxvalueofUSD1.5billion(asbookedinHessNorge’s2016annualaccounts).
On 4 December 2017, Aker BP entered into an agreement tosell10percentinterestintheValhallandHodfieldstoPandionEnergyforacashconsiderationofUSD170 million.
The transactions with Hess and Pandion were completed on 22 December, following approval by all relevant authorities. After these transactions, Aker BP holds 90 percent interest in both Valhall and Hod.
During the quarter, Aker BP transferred its share in the shut-downJotunfieldtoExxonMobil.
OUTLOOK
The company continues to build on a strong platform for further value creation through safe operations, an effective business model built on lean principles, technological competence and industrial cooperation to secure long term competitiveness.
Going forward, the company will continue to selectively pursue growth opportunities which will enhance production and increase dividend capacity. A quarterly dividend of USD 0.3124 per share is scheduled to be paidinFebruary.Thisrepresentsatotaldividendfor2018 of USD 450 million. The board’s intention is to increase the dividend level by USD 100 million each year until 2021.
Thecompanywillhavefiverigsinoperationinthefirstquarter2018.OperationsincludeinfilldrillingTambar,productiondrillingatIvarAasen,productionandP&AactivityatValhallandexplorationdrillingintheNorthSeaandNorwegianSea.Intotal,AkerBPplanstoparticipateinatotalof12(7operated)explorationwells in 2018, half of which are in the Barents Sea.
The company has a robust balance sheet, providing the companywithamplefinancialflexibilitygoingforward.
Thecompanyexpects2018productiontobe155-160mboepdwithaproductioncostofapproximately12USD/boe.2018CAPEXisexpectedtobearoundUSD1.3billion.Guidancefor2018explorationexpendituresis USD 350 million, while total cash spend on decommissioningisalsoexpectedtobearoundUSD350 million.

12QUARTERLY REPORT Q4 2017
FINANCIAL STATEMENTSWITH NOTES

13
INCOME STATEMENT (Unaudited)
(USD 1 000) Note 2017 2016 2017 2016
Petroleum revenues 2 737 204 541 550 2 575 654 1 260 803Other income 2 -11 210 114 074 -12 721 103 326
Total income 725 994 655 624 2 562 933 1 364 129
Exploration expenses 4 56 181 44 281 225 702 147 453Production costs 147 076 121 139 523 379 226 818Depreciation 6 183 138 159 796 726 670 509 027Impairments 5, 6 21 111 44 627 52 349 71 375Other operating expenses 13 549 5 029 27 606 21 993
Total operating expenses 421 055 374 872 1 555 705 976 665
Operating profit/loss 304 940 280 752 1 007 228 387 464
Interest income 2 991 2 887 7 716 5 795Other financial income 18 298 20 625 75 507 42 871Interest expenses 15 230 20 229 103 627 82 161Other financial expenses 62 585 73 855 175 696 63 515
Net financial items 7 -56 526 -70 572 -196 100 -97 011
Profit/loss before taxes 248 413 210 180 811 128 290 453
Taxes (+)/tax income (-) 8 214 377 277 183 536 340 255 482
Net profit/loss 34 036 -67 003 274 787 34 971
Weighted average no. of shares outstanding basic and diluted 347 465 957 337 737 071 340 189 283 236 582 807Basic and diluted earnings/loss(-) USD per share 0.10 -0.20 0.81 0.15
STATEMENT OF COMPREHENSIVE INCOME
(USD 1 000) Note 2017 2016 2017 2016
Profit/loss for the period 34 036 -67 003 274 787 34 971
Items which will not be reclassified over profit and loss (net of taxes)Actuarial gain/loss pension plan -1 - -1 -
Items which may be reclassified over profit and loss (net of taxes)Currency translation adjustment 25 524 - 25 167 -59
Total comprehensive income in period 59 558 -67 003 299 953 34 911
Q4 01.01.-31.12.
Q4 01.01.-31.12.Group
Group

14QUARTERLY REPORT Q4 2017
STATEMENT OF FINANCIAL POSITION (Unaudited)
(USD 1 000) Note 31.12.2017 31.12.2016
ASSETS
Intangible assetsGoodwill 6 1 860 126 1 846 971Capitalized exploration expenditures 6 365 417 395 260Other intangible assets 6 1 617 039 1 332 813
Tangible fixed assetsProperty, plant and equipment 6 5 582 493 4 441 796
Financial assetsLong-term receivables 40 453 47 171Long-term derivatives 12 12 564 -Other non-current assets 8 398 12 894
Total non-current assets 9 486 491 8 076 905
InventoriesInventories 75 704 69 434
ReceivablesAccounts receivable 99 752 170 000Tax receivables 8 1 586 006 400 638Other short-term receivables 9 535 518 422 932Short-term derivatives 12 2 585 -
Cash and cash equivalentsCash and cash equivalents 10 232 504 115 286
Total current assets 2 532 069 1 178 290
TOTAL ASSETS 12 018 560 9 255 196
Group

15
STATEMENT OF FINANCIAL POSITION (Unaudited)
(USD 1 000) Note 31.12.2017 31.12.2016
EQUITY AND LIABILITIES
EquityShare capital 57 056 54 349Share premium 3 637 297 3 150 567Other equity -705 756 -755 709
Total equity 2 988 596 2 449 207
Non-current liabilitiesDeferred taxes 8 1 307 148 1 045 542Long-term abandonment provision 16 2 775 622 2 080 940Provisions for other liabilities 11 152 418 218 562
Long-term bonds 14 622 039 510 337Long-term derivatives 12 13 705 35 659Other interest-bearing debt 15 1 270 556 2 030 209
Current liabilitiesTrade creditors 32 847 88 156Accrued public charges and indirect taxes 27 949 39 048Tax payable 8 351 156 92 661Short-term derivatives 12 7 691 5 049Short-term abandonment provision 16 268 262 75 981Short-term interest-bearing debt 15 1 496 374 -Other current liabilities 13 704 197 583 844
Total liabilities 9 029 964 6 805 988
TOTAL EQUITY AND LIABILITIES 12 018 560 9 255 196
Group
16QUARTERLY REPORT Q4 2017
STATEMENT OF CHANGES IN EQUITY - GROUP (Unaudited)
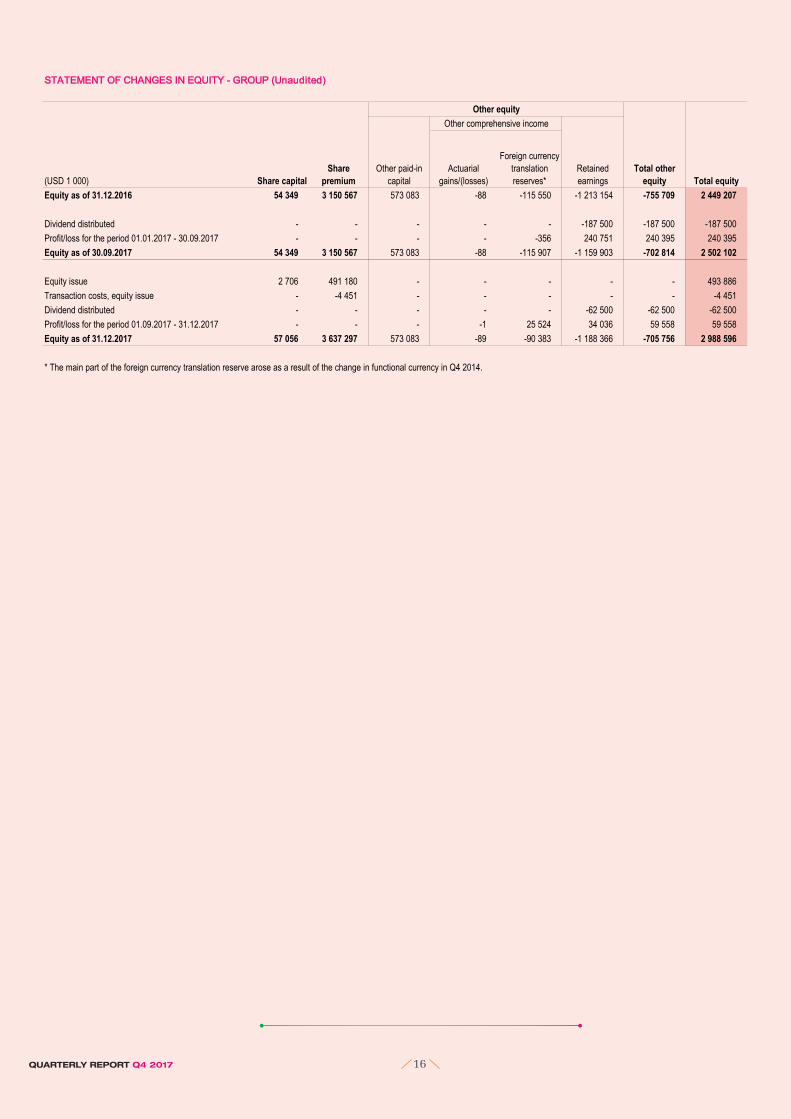
(USD 1 000)Equity as of 31.12.2016 54 349 3 150 567 573 083 -88 -115 550 -1 213 154 -755 709 2 449 207
Dividend distributed - - - - - -187 500 -187 500 -187 500Profit/loss for the period 01.01.2017 - 30.09.2017 - - - - -356 240 751 240 395 240 395Equity as of 30.09.2017 54 349 3 150 567 573 083 -88 -115 907 -1 159 903 -702 814 2 502 102
Equity issue 2 706 491 180 - - - - - 493 886Transaction costs, equity issue - -4 451 - - - - - -4 451Dividend distributed - - - - - -62 500 -62 500 -62 500Profit/loss for the period 01.09.2017 - 31.12.2017 - - - -1 25 524 34 036 59 558 59 558Equity as of 31.12.2017 57 056 3 637 297 573 083 -89 -90 383 -1 188 366 -705 756 2 988 596
* The main part of the foreign currency translation reserve arose as a result of the change in functional currency in Q4 2014.
Other equityOther comprehensive income
Share capitalShare
premiumOther paid-in
capitalActuarial
gains/(losses)
Foreign currency translation reserves*
Retained earnings
Total other equity Total equity

17
STATEMENT OF CASH FLOW (Unaudited)
(USD 1 000) Note 2017 2016 2017 2016
CASH FLOW FROM OPERATING ACTIVITIESProfit/loss before taxes 248 413 210 180 811 128 290 453Taxes paid during the period -67 024 - -101 115 -1 419Tax refund during the period 140 913 129 278 404 704 212 944Depreciation 6 183 138 159 796 726 670 509 027Net impairment losses 5, 6 21 111 44 627 52 349 71 375Accretion expenses 7, 16 32 407 29 285 129 619 47 977Interest expenses 7 32 539 42 693 156 704 160 808Interest paid -31 716 -52 316 -145 940 -161 634Changes in derivatives 2, 7 33 107 43 548 -34 461 10 408Amortized loan costs 7 6 336 5 672 36 900 17 915Gain on change of pension scheme - -115 616 - -115 616Amortization of fair value of contracts 11 4 398 - 11 728 -Expensed capitalized dry wells 4, 6 19 246 7 968 75 401 51 669Changes in inventories, accounts payable and receivables -63 673 -225 400 -7 583 -317 488Changes in abandonment liabilities through income statement -27 -1 131 -27 -1 131Changes in other current balance sheet items -16 218 41 609 39 414 120 365NET CASH FLOW FROM OPERATING ACTIVITIES 542 949 320 192 2 155 491 895 652
CASH FLOW FROM INVESTMENT ACTIVITIESPayment for removal and decommissioning of oil fields 16 -31 094 -6 743 -85 733 -12 237Disbursements on investments in fixed assets 6 -248 303 -244 267 -977 462 -935 755Acquisitions of companies (net of cash acquired) -2 055 033 - -2 055 033 423 990Cash received from sale of licenses 170 959 - 170 959 -
NET CASH FLOW FROM INVESTMENT ACTIVITIES -2 191 994 -313 045 -3 058 994 -705 494
CASH FLOW FROM FINANCING ACTIVITIESRepayment of long-term debt -130 000 -612 825 -777 911 -612 825Repayment of bond (DETNOR03) - - -330 000 -Net cash received from issuance of new shares 489 436 - 489 436 -Net proceeds from issuance of debt 1 498 885 - 1 886 885 512 013Paid dividend -62 500 -62 500 -250 000 -62 500NET CASH FLOW FROM FINANCING ACTIVITIES 1 795 820 -675 325 1 018 410 -163 312
Net change in cash and cash equivalents 146 776 -668 178 114 906 26 846
Cash and cash equivalents at start of period 80 764 785 622 115 286 90 599Effect of exchange rate fluctuation on cash held 4 965 -2 158 2 312 -2 158CASH AND CASH EQUIVALENTS AT END OF PERIOD 10 232 504 115 286 232 504 115 286
SPECIFICATION OF CASH EQUIVALENTS AT END OF PERIODBank deposits and cash 231 506 106 369 231 506 106 369Restricted bank deposits 998 8 917 998 8 917CASH AND CASH EQUIVALENTS AT END OF PERIOD 10 232 504 115 286 232 504 115 286
Group
-181 492Disbursements on investments in capitalized exploration expenditures and other intangible assets -28 5236 -62 034 -111 724
Q4 01.01.-31.12.

18QUARTERLY REPORT Q4 2017
NOTES(All figures in USD 1 000 unless otherwise stated)
Note 1 Accounting principles
Note 2 Income
Breakdown of petroleum revenues (USD 1 000) 2017 2016 2017 2016
Recognized income liquids 625 187 459 730 2 183 069 1 120 094Recognized income gas 106 577 76 684 369 694 128 436Tariff income 5 440 5 136 22 891 12 274Total petroleum revenues 737 204 541 550 2 575 654 1 260 803
Breakdown of produced volumes (barrels of oil equivalent)
Liquids 9 847 526 9 076 017 39 634 824 23 830 388Gas 2 623 436 2 563 841 11 036 406 4 512 648Total produced volumes 12 470 962 11 639 859 50 671 230 28 343 036
Other income (USD 1 000)
Realized gain/loss (-) on oil derivatives -2 549 1 497 -7 440 30 199Unrealized gain/loss (-) on oil derivatives -5 563 -2 963 -6 510 -46 399Other income* -3 098 115 540 1 230 119 526Total other income -11 210 114 074 -12 721 103 326
* For 2017 the amount is mainly related to sale of licenses, while for 2016 it mainly relates to gain on settlement of defined benefit scheme in BP Norge AS.
Q4 01.01.-31.12.Group
The acquisition of BP Norge AS was completed on 30 September 2016. Year to date income statement figures for 2016 are therefore not directly comparable as they partly represent Aker BP prior to the acquisition of BP Norge AS.
These interim financial statements were authorised for issue by the Company’s Board of Directors on 1 February 2018.
The significant judgements made by management in applying the group’s accounting policies and the key sources of estimation uncertainty were the same as those that applied to the annual financial statements as at 31 December 2016.
The accounting principles used for this interim report are consistent with the principles used in the group's annual financial statements as at 31 December 2016. There are no new standards effective from 1 January 2017.
In preparing these interim financial statements, management has made judgements, estimates and assumptions that affect the application of accounting policies and the reported amounts of assets and liabilities, income and expense. Actual results may differ from these estimates.
These interim financial statements have been prepared in accordance with the International Financial Reporting Standards as adopted by the EU ("IFRS") IAS 34 "Interim Financial Reporting", thus the interim financial statements do not include all information required by IFRS and should be read in conjunction with the group's annual financial statement as at 31 December 2016. The interim financial statements reflect all adjustments which are, in the opinion of management, necessary for a fair statement of the financial position, results of operations and cash flows for the dates and interim periods presented. Interim period results are not necessarily indicative of results of operations or cash flows for an annual period. These interim financial statements have not been subject to review or audit by independent auditors.
The acquisition of Hess Norge AS was completed on 22 December 2017. The transaction date for accounting purposes has been set to 31 December 2017, as the impact on the income statement from the period between 22 and 31 December is deemed immaterial, except for certain currency impacts which have been reflected in the financial statements. See note 3 for more information regarding the acquisition.

19
Note 3 Business combination
(USD 1 000) 31.12.2017
Other intangible assets 507 640Deferred tax assets 699Property, plant and equipment 1 076 337
Inventories 15 377Accounts receivable 41 673Other short-term receivables 65 077Tax receivables 1 558 574Cash and cash equivalents 21 231Total assets 3 286 608
Long-term abandonment provision 1 004 232Provisions for other liabilities* 85 963
Trade creditors 6 575Accrued public charges and indirect taxes 3 869Tax payable 17 518Short-term abandonment provision 182 806Other current liabilities 91 311Total liabilities 1 392 274
Total identifiable net assets at fair value 1 894 334Consideration paid on acquisition 2 076 264Goodwill arising on acquisition** 181 930
** No part of the goodwill will be deductible for tax purposes.
On 22 December 2017, Aker BP finalized the acquisition of 100 per cent of the shares in Hess Norge AS. The transaction was announced on 24 October 2017, and was financed by the issuance of USD 0.5 billion in new share capital and a new loan facility of USD 1.5 billion. The main reason for the acquisition was to give Aker BP a deeper exposure to one of its core areas and thereby to pursue upsides more aggressively.
The acquisition date for accounting purposes has been set to 31 December 2017, as the period between 22 December and 31 December 2017 has immaterial impact on the income statement, except for certain currency impacts which have been reflected in the financial statements. For tax purposes, the effective date was 1 January 2017. The acquisition is regarded as a business combination and has been accounted for using the acquisition method of accounting in accordance with IFRS 3. A purchase price allocation (PPA) has been performed to allocate the consideration to fair value of assets and liabilities of Hess Norge AS. The PPA is performed as of the acquisition date.
Each identifiable asset and liability is measured at its acquisition date fair value based on guidance in IFRS 13. The standard defines fair value as the price that would be received to sell an asset or paid to transfer a liability in an orderly transaction between market participants at the measurement date. This definition emphasizes that fair value is a market-based measurement, not an entity-specific measurement. When measuring fair value, the group uses the assumptions that market participants would use when pricing the asset or liability under current market conditions, including assumptions about risk. Acquired property, plant and equipment as well as intangible assets (value of licenses) have been valued using the income approach.
The entire amount of goodwill recognized in the transaction relates to the requirement to recognize deferred tax assets and liabilities for the difference between the assigned fair values and the tax bases of assets acquired and liabilities assumed in a business combination. Licences under development and licences in production can only be sold in a market after tax, based on a decision made by the Norwegian Ministry of Finance pursuant to the Petroleum Taxation Act Section 10. The assessment of fair value of such licences is therefore based on cash flows after tax. Nevertheless, in accordance with IAS 12 Sections 15 and 19, a provision is made for deferred tax corresponding to the tax rate multiplied with the difference between the acquisition cost and the tax base. The offsetting entry to this deferred tax is goodwill. Hence, goodwill arises as a technical effect of deferred tax ("technical goodwill").
The above valuation is based on currently available information about fair values as of the acquisition date. If new information becomes available within 12 months from the acquisition date, the group may change the fair value assessment in the PPA, in accordance with guidance in IFRS 3.
Accounts receivable are recognized at gross contractual amounts due, as they relate to large and credit-worthy customers. Historically, there has been no significant uncollected accounts receivable in Hess Norge AS.
The recognized amounts of assets and liabilities assumed as at the date of the acquisition were as follows:
* The amount arises from a committed rig contract where the contractual terms were different from the current market terms at the time of acquisition at 22 December 2017. The fair value is based on the difference between market price and contract price.

20QUARTERLY REPORT Q4 2017
Note 4 Exploration expenses
Breakdown of exploration expenses (USD 1 000) 2017 2016 2017 2016
Seismic 9 637 18 316 53 283 29 321Area fee 4 363 4 036 16 589 13 291Dry well expenses* 19 246 7 968 75 401 51 669Other exploration expenses 22 935 13 961 80 429 53 171Total exploration expenses 56 181 44 281 225 702 147 453
* Mainly related to Hufsa and Hurri wells.
Note 5 Impairments
Impairment testing
- Impairment test of fixed assets and related intangible assets, other than goodwill- Impairment test of goodwill
PricesThe nominal oil price based on the forward curve applied in the impairment test is as follows:
Year USD/BOE
2018 65.22019 60.22020 56.3From 2021 (in real terms) 65.0
Reserves
Discount rate
Currency ratesYear USD/NOK
2018 8.102019 8.002020 7.92From 2021 7.75
InflationThe long-term inflation rate is assumed to be 2.5 per cent.
GroupQ4 01.01.-31.12.
Impairment tests of individual cash-generating units are performed when impairment triggers are identified, and for goodwill impairment is tested at least annually. In Q4 2017, two categories of impairment tests have been performed:
Impairment is recognized when the book value of an asset or a cash-generating unit, including associated goodwill, exceeds the recoverable amount. The recoverable amount is the higher of the asset's fair value less cost to sell and value in use. For assets and goodwill in the group prior to the acquisition of BP Norge AS, the impairment testing has been based on value in use, consistent with the impairment testing prior to the acquisition of BP Norge AS. For assets and goodwill recognized in relation to the acquisition of BP Norge AS and Hess Norge AS, the impairment testing has been based on fair value. For both value in use and fair value, the impairment testing is performed based on discounted cash flows. The expected future cash flow is discounted to the net present value by applying a discount rate after tax that reflects the current market valuation of the time value of money, and the specific risk related to the asset. The discount rate is derived from the weighted average cost of capital (WACC) for a market participant. Cash flows are projected for the estimated lifetime of the fields, which may exceed periods greater than five years. If not specifically stated otherwise, the same assumptions have been applied for value in use and fair value testing.
Future cash flows are calculated on the basis of expected production profiles and estimated proven and probable remaining reserves. The recoverable amount is sensitive to changes in reserves.
For value in use testing, the post tax nominal discount rate used is 7.5 per cent. For fair value testing, an additional premium is added to the 7.5 per cent rate in order to reflect the additional risk in the related cash flows.
For producing licences and licences in the development phase, recoverable amount is estimated based on discounted future after tax cash flows. Below is an overview of the key assumptions applied for impairment testing purposes as of 31 December 2017.
21
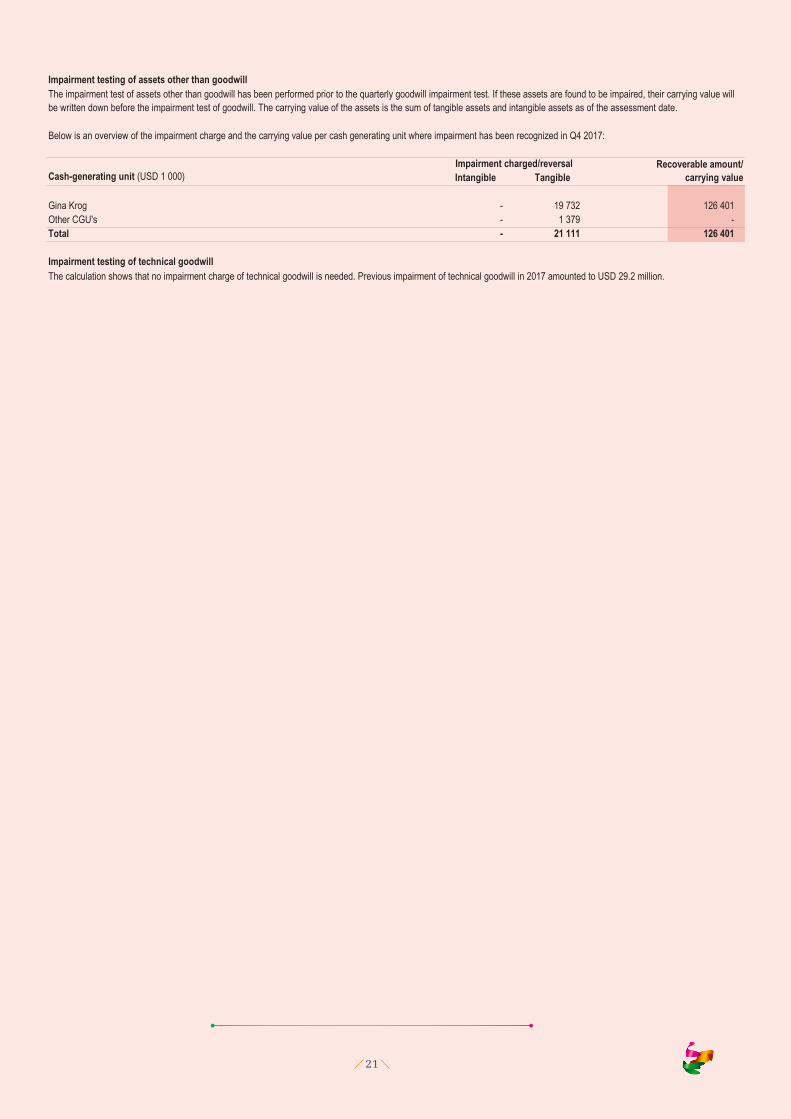
Impairment testing of assets other than goodwill
Below is an overview of the impairment charge and the carrying value per cash generating unit where impairment has been recognized in Q4 2017:
Cash-generating unit (USD 1 000) Intangible Tangible
Gina Krog - 19 732 126 401Other CGU's - 1 379 -Total - 21 111 126 401
Impairment testing of technical goodwill
The impairment test of assets other than goodwill has been performed prior to the quarterly goodwill impairment test. If these assets are found to be impaired, their carrying value will be written down before the impairment test of goodwill. The carrying value of the assets is the sum of tangible assets and intangible assets as of the assessment date.
Impairment charged/reversal Recoverable amount/carrying value
The calculation shows that no impairment charge of technical goodwill is needed. Previous impairment of technical goodwill in 2017 amounted to USD 29.2 million.

22QUARTERLY REPORT Q4 2017
Note 6 Tangible fixed assets and intangible assets
TANGIBLE FIXED ASSETS - GROUP
(USD 1 000)
Book value 31.12.2016 907 108 3 501 908 32 779 4 441 796
Acquisition cost 31.12.2016 908 674 4 950 566 56 137 5 915 377Additions 544 803 193 543 32 429 770 775Disposals 24 160 29 546 1 531 55 237Reclassification -174 479 234 363 6 351 66 235Acquisition cost 30.09.2017 1 254 838 5 348 926 93 386 6 697 150
Accumulated depreciation and impairments 31.12.2016 1 566 1 448 659 23 357 1 473 582Depreciation - 464 340 8 559 472 899Impairment -6 - 128 121Retirement/transfer depreciations 6 -29 546 -1 531 -31 071Accumulated depreciation and impairments 30.09.2017 1 566 1 883 452 30 513 1 915 532
Book value 30.09.2017 1 253 272 3 465 473 62 873 4 781 618
Acquisition cost 30.09.2017 1 254 838 5 348 926 93 386 6 697 150Acquisition of Hess Norge AS - 1 076 337 - 1 076 337Additions* 250 006 -322 881 10 972 -61 902Disposals** 9 169 59 367 - 68 536Reclassification -14 987 14 786 -13 -213Acquisition cost 31.12.2017 1 480 689 6 057 801 104 346 7 642 835
Accumulated depreciation and impairments 30.09.2017 1 566 1 883 452 30 513 1 915 532Depreciation - 157 839 4 825 162 664Impairment - 21 111 - 21 111Retirement/transfer depreciations -1 566 -37 398 - -38 964Accumulated depreciation and impairments 31.12.2017 - 2 025 004 35 338 2 060 342
Book value 31.12.2017 1 480 689 4 032 797 69 007 5 582 493
** The disposal is mainly related to the sale of 10 per cent share in Valhall/Hod.
Production facilities
including wells
Fixtures and fittings, office
machinery TotalAssets under development
Capitalized exploration expenditures are reclassified to "Fields under development" when the field enters into the development phase. If development plans are subsequently re-evaluated, the associated costs remain in assets under development and are not reclassified back to exploration assets. Fields under development are reclassified to "Production facilities" from the start of production. Production facilities, including wells, are depreciated in accordance with the Unit of Production Method. Office machinery, fixtures and fittings etc. are depreciated using the straight-line method over their useful life, i.e. 3 - 5 years. Removal and decommissioning costs are included as production facilities or fields under development.
* The negative addition is caused by decreased abandonment provision during the quarter.

23
INTANGIBLE ASSETS - GROUP
(USD 1 000) Licences etc. Software Total Goodwill
Book value 31.12.2016 1 332 534 279 1 332 813 395 260 1 846 971
Acquisition cost 31.12.2016 1 575 203 7 501 1 582 705 395 260 2 720 835Additions 156 - 156 83 046Disposals/expensed dry wells 10 978 - 10 978 56 155 9 943Reclassification -11 - -11 -66 224 -Acquisition cost 30.09.2017 1 564 371 7 501 1 571 872 355 926 2 710 892
Accumulated depreciation and impairments 31.12.2016 242 670 7 223 249 892 - 873 864Depreciation 70 422 211 70 633 - -Impairment 1 956 - 1 956 - 29 161Retirement/transfer depreciations -10 120 - -10 120 - -9 619Accumulated depreciation and impairments 30.09.2017 304 928 7 433 312 361 - 893 406
Book value 30.09.2017 1 259 443 68 1 259 511 355 926 1 817 486
Acquisition cost 30.09.2017 1 564 371 7 501 1 571 872 355 926 2 710 892Acquisition of Hess Norge AS 507 640 - 507 640 - 181 930Additions - - - 28 523 -Disposals/expensed dry wells* 138 770 - 138 770 19 246 153 848Reclassification - - - 213 -Acquisition cost 31.12.2017 1 933 241 7 501 1 940 742 365 417 2 738 973
Accumulated depreciation and impairments 30.09.2017 304 928 7 433 312 361 - 893 406Depreciation 20 440 34 20 474 -Impairment - - - - -Retirement/transfer depreciations* -9 132 - -9 132 - -14 558Accumulated depreciation and impairments 31.12.2017 316 236 7 467 323 703 - 878 847
Book value 31.12.2017 1 617 005 34 1 617 039 365 417 1 860 126
Depreciation in the income statement (USD 1 000) 2017 2016 2017 2016
Depreciation of tangible fixed assets 162 664 132 987 635 563 417 891Depreciation of intangible assets 20 474 26 809 91 107 91 136Total depreciation in the income statement 183 138 159 796 726 670 509 027
Impairment in the income statement (USD 1 000)
Impairment/reversal of tangible fixed assets 21 111 -6 739 21 232 -16 609Impairment/reversal of intangible assets - - 1 956 8 429Impairment of goodwill - 51 366 29 161 79 555Total impairment in the income statement 21 111 44 627 52 349 71 375
01.01.-31.12.Q4Group
Exploration wellsOther intangible assets
* The disposal is mainly related to the sale of 10 per cent share in Valhall/Hod.

24QUARTERLY REPORT Q4 2017
Note 7 Financial items
(USD 1 000) 2017 2016 2017 2016
Interest income 2 991 2 887 7 716 5 795
Realized gains on derivatives 8 659 601 18 428 3 138Change in fair value of derivatives - - 40 971 35 991Net currency gains 9 639 20 024 16 107 3 742Total other financial income 18 298 20 625 75 507 42 871
Interest expenses 32 539 42 693 156 704 160 808Capitalized interest cost, development projects -23 645 -28 136 -89 977 -96 562Amortized loan costs 6 336 5 672 36 900 17 915Total interest expenses 15 230 20 229 103 627 82 161
Realised loss on derivatives 1 472 1 466 9 331 7 675Change in fair value of derivatives 27 543 40 585 - -Accretion expenses 32 407 29 285 129 619 47 977Other financial expenses 1 162 2 519 36 746 7 864Total other financial expenses 62 585 73 855 175 696 63 515
Net financial items -56 526 -70 572 -196 100 -97 011
Note 8 Taxes
Taxes for the period appear as follows (USD 1 000) 2017 2016 2017 2016
Calculated current year tax/exploration tax refund 125 092 -114 769 332 092 -131 488Change in deferred taxes in the income statement 89 979 384 351 202 715 374 617Prior period adjustments -694 7 601 1 533 12 353Total taxes (+)/tax income (-) 214 377 277 183 536 340 255 482
Calculated tax receivable (+)/tax payable (-) (USD 1 000) 31.12.2017 31.12.2016
Tax receivable/payable at 01.01. 307 977 126 391Current year tax (-)/tax receivable (+) -332 092 131 488Taxes receivable/payable related to acquisitions/sales 1 523 512 255 873Net tax payment (+)/tax refund (-) -303 589 -211 525Prior period adjustments 9 502 -1 681Revaluation of taxes 29 540 7 430Total net tax receivable (+)/tax payable (-) 1 234 850 307 977Tax receivable included as current assets (+) 1 586 006 400 638Tax payable included as current liabilities (-) -351 156 -92 661
Group
Group
01.01.-31.12.
Q4
GroupQ4
01.01.-31.12.

25
Deferred taxes (-)/deferred tax asset (+) (USD 1 000) 31.12.2017 31.12.2016
Deferred taxes/deferred tax asset 01.01. -1 045 542 -1 356 114Change in deferred taxes in the income statement -202 715 -374 617Reclassification of acquired loss carried forward - -238 866Deferred tax related to acquisitions/sales -61 877 942 611Prior period adjustment 2 982 -18 555Deferred tax charged to OCI and equity 5 -1Net deferred tax (-)/deferred tax asset (+) -1 307 148 -1 045 542
Reconciliation of tax expense (USD 1 000) 2017 2016 2017 2016
78% tax rate on profit before tax 194 040 163 940 632 680 226 553Tax effect of uplift -30 784 -27 591 -123 057 -103 313Change in tax rates* -1 893 -2 888 -1 894 -2 888Permanent difference on impairment - 40 065 22 813 62 053Foreign currency translation of NOK monetary items -8 022 -8 527 -12 955 2 163Foreign currency translation of USD monetary items -11 176 -125 049 120 113 55 692Tax effect of financial and other 24%/25% items 23 398 82 879 -19 592 -21 335Revaluation of tax balances** 47 848 146 751 -84 676 28 901Other permanent differences and prior period adjustment 966 7 602 2 908 7 656Total taxes (+)/tax income (-) 214 377 277 183 536 340 255 482
* The tax rate for general corporation tax changed from 24 to 23 per cent from 1 January 2018. The rate for special tax changed from from the same date from 54 to 55 per cent.
Note 9 Other short-term receivables
(USD 1 000) 31.12.2017 31.12.2016
Prepayments 59 100 40 730VAT receivable 10 856 7 913Underlift of petroleum 118 012 70 003Accrued income from sale of petroleum products 105 670 86 429Other receivables, mainly from licenses 241 879 217 857Total other short-term receivables 535 518 422 932
Group
Group
Q4 01.01.-31.12.
** Tax balances are in NOK and converted to USD using the period end currency rate. When NOK weakens against USD, the tax rate increases as there is less remaining tax depreciation measured in USD (vice versa).
In accordance with statutory requirements, the calculation of current tax is required to be based on NOK functional currency. This may impact the tax rate as the company's functional currency is USD.
Group

26QUARTERLY REPORT Q4 2017
Note 10 Cash and cash equivalents
The item 'Cash and cash equivalents' consists of bank accounts and short-term investments that constitute parts of the group's transaction liquidity.
Breakdown of cash and cash equivalents (USD 1 000) 31.12.2017 31.12.2016
Bank deposits 231 506 106 369Restricted funds (tax withholdings)* 998 8 917Cash and cash equivalents 232 504 115 286
Unused revolving credit facility - 550 000Unused reserve-based lending facility (see note 15) 2 670 000 1 805 000
* During Q4, the company established a bank guarantee related to withheld payroll tax of NOK 300 million. The main part of the restricted funds was thus released.
Note 11 Provisions for other liabilities
Breakdown of provisions for other liabilities (USD 1 000) 31.12.2017 31.12.2016
Fair value of contracts assumed in acquisitions* 149 031 202 874Other long term liabilities 3 387 15 688Total provisions for other liabilities 152 418 218 562
Note 12 Derivatives
(USD 1 000) 31.12.2017 31.12.2016
Unrealized gain currency contracts 12 564 -Long-term derivatives included in assets 12 564 -Unrealized gain currency contracts 2 585 -Short-term derivatives included in assets 2 585 -Total derivatives included in assets 15 149 -
Unrealized losses currency contracts - 5 073Unrealized losses interest rate swaps 13 705 30 586Long-term derivatives included in liabilities 13 705 35 659Unrealized losses currency contracts - 3 868Unrealized losses commodity derivatives 7 691 1 181Short-term derivatives included in liabilities 7 691 5 049Total derivatives included in liabilities 21 396 40 708
The group has different types of hedging instruments. The commodity derivatives are used to hedge the risk of oil price reduction. The group manages its interest rate exposure using interest rate derivatives, including a cross currency interest rate swap. Foreign currency exchange derivatives are used to manage the company's exposure to currency risks, mainly NOK, EUR and GBP. These derivatives are mark to market with changes in market value recognized in the income statement.The nature of the instruments and the valuation method is consistent with the disclosed information in the annual financial statements as at 31 December 2016.
* The negative contract values are related to rig contracts entered into by the acquirees, which were different from current market terms at the time of the acquisitions. The fair value is based on the difference between market price and contract price at the time of the acquisitions. The balance is split between current and non-current liabilities based on the cash flow in the contracts, and amortized over the lifetime of the contracts.
Group
Group
Group
During the fourth quarter 2017, the company entered into new commodity hedges for 2018. These consist of put options with strike prices of 50 and 55 USD per barrel for approximately 13 percent of estimated 2018 oil production, corresponding to approximately 45 percent of the undiscounted after-tax value.

27
Note 13 Other current liabilities
Breakdown of other current liabilities (USD 1 000) 31.12.2017 31.12.2016
Current liabilities related to overcall in licences 81 223 81 686Share of other current liabilities in licences 409 387 360 222Overlift of petroleum 9 610 20 000Fair value of contracts assumed in acquisitions* 62 097 36 199Other current liabilities** 141 880 85 737Total other current liabilities 704 197 583 844
* Refer to note 11.
** Other current liabilities include unpaid wages and vacation pay, accrued interest and other provisions.
Note 14 Bonds
(USD 1 000) 31.12.2017 31.12.2016
DETNOR02 Senior unsecured bond 1) 230 375 214 827DETNOR03 Subordinated PIK toggle bond 2) - 295 510AKERBP – Senior Notes 2017 (17/22) 3) 391 664 -Long-term bonds 622 039 510 337
2) As described in the Q2 2017 report, the bond was repaid in July 2017.
Note 15 Other interest-bearing debt
(USD 1 000) 31.12.2017 31.12.2016
Reserve-based lending facility 1 270 556 2 030 209Long-term interest-bearing debt 1 270 556 2 030 209
Bridge facility 1 496 374 -Short-term interest-bearing debt 1 496 374 -
- Interest Coverage Ratio shall be minimum 3.5
The interest rate is from 1 - 6 months LIBOR plus a margin of 2 - 3 per cent based on drawn amount. In addition, a commitment fee is paid on unused credit.
- Leverage Ratio shall be maximum 4 untill the production start of Johan Sverdrup, thereafter maximum 3.5
1) The loan is denominated in NOK and runs from July 2013 to July 2020 and carries an interest rate of 3 month NIBOR + 6.5 per cent. The principal falls due on July 2020 and interest is paid on a quarterly basis. The loan is unsecured. The loan has been swapped into USD using a cross currency interest rate swap whereby the group pays LIBOR + 6.81 per cent quarterly. In connection with the RBL amendment described in note 15, the financial covenants in this bond have been adjusted to be consistent with the RBL.
3) The bond was established in July 2017 and carries an interest of 6 per cent. The principal falls due on July 2022 and interest is paid on a semi annual basis. The loan is senior unsecured and has no financial covenants.
The RBL facility was established in 2014 and is a senior secured seven-year facility. The facility was originally USD 3.0 billion, with an additional uncommitted accordion option of USD 1.0 billion. In connection with the acquisition of BP Norge AS, the facility size was increased to USD 4.0 billion. In addition a new, uncommitted, accordion option of USD 1.0 billion was added to the facility.
After certain amendments made to the RBL facility in Q3 2017, the borrowing base under the amended facility is set annually based on the company’s certified 2P reserves. Current availability under the RBL is USD 4 billion. The financial covenants are as follows:
In relation to the acquisition of Hess Norge AS, the company obtained a new USD 1.5 billion bank facility ("Bridge facility"). The facility has a duration of 18 months, carries an interest of Libor + 1.5 per cent (the margin increases to 2.0 per cent after nine months), and is secured by a pledge in the shares of Aker BP AS (previously Hess Norge AS). The company expects the tax losses from Aker BP AS to be settled during 2018. Such settlement would trigger a mandatory repayment of the USD 1.5 billion bank facility. The financial covenants in this facility are consistent with the RBL.
Group
Group
Group

28QUARTERLY REPORT Q4 2017
Note 16 Provision for abandonment liabilities
(USD 1 000) 31.12.2017 31.12.2016
Provisions as of 1 January 2 156 921 423 325Abondonment liability from acquisitions 1 315 181 1 680 206Change in abandonment liability due to asset sales -207 516 -Incurred cost removal -74 005 -12 237Accretion expense - present value calculation 129 619 47 977Change in estimates and incurred liabilities on new drilling and installations* -276 315 17 650Total provision for abandonment liabilities 3 043 884 2 156 921
Break down of the provision to short-term and long-term liabilitiesShort-term 268 262 75 981Long-term 2 775 622 2 080 940Total provision for abandonment liabilities 3 043 884 2 156 921
* The change in estimates are mainly a result of increased experience and learning from P&A activities, offset by decreased discount rates.
Note 17 Contingent liabilities
Note 18 Subsequent events
The estimate is based on executing a concept for abandonment in accordance with the Petroleum Activities Act and international regulations and guidelines. The calculations assume an inflation rate of 2.5 per cent and a nominal discount rate before tax of between 3.44 per cent and 4.42 per cent. The discount rate for the previous quarters in 2017 was between 4.14 per cent and 6.35 per cent.
The company has not identified any events with significant accounting impacts that have occured between the end of the reporting period and the date of this report.
During the normal course of its business, the group will be involved in disputes, including tax disputes. The group has made accruals for probable liabilities related to litigation and claims based on management's best judgment and in line with IAS 37 and IAS 12.
Group

29
Note 19 Investments in joint operations
Fields operated: 31.12.2017 30.09.2017 Fields non-operated: 31.12.2017 30.09.2017Alvheim 65.000 % 65.000 % Atla 10.000 % 10.000 %Bøyla 65.000 % 65.000 % Enoch 2.000 % 2.000 %Hod** 90.000 % 37.500 % Gina Krog 3.300 % 3.300 %Ivar Aasen Unit 34.786 % 34.786 % Johan Sverdrup 11.5733 % 11.5733 %Jette Unit 70.000 % 70.000 % Jotun* 0.000 % 7.000 %Valhall** 90.000 % 35.953 % Oda 15.000 % 15.000 %Vilje 46.904 % 46.904 % Varg 5.000 % 5.000 %Volund 65.000 % 65.000 %Tambar 55.000 % 55.000 %Tambar Øst 46.200 % 46.200 %Ula 80.000 % 80.000 %Skarv 23.835 % 23.835 %
Production licences in which Aker BP is the operator: Production licences in which Aker BP is a partner:Licence: 31.12.2017 30.09.2017 Licence: 31.12.2017 30.09.2017PL 001B 35.000 % 35.000 % PL 006C 15.000 % 15.000 %PL 006B** 90.000 % 35.833 % PL 018DS 13.338 % 13.338 %PL 019 80.000 % 80.000 % PL 019C 0.000 % 30.000 %PL 019C 80.000 % 0.000 % PL 026 30.000 % 30.000 %PL 026B 90.260 % 90.260 % PL 029B 20.000 % 20.000 %PL 027D 100.000 % 100.000 % PL 035 50.000 % 50.000 %PL 028B 35.000 % 35.000 % PL 035C 50.000 % 50.000 %PL 033** 90.000 % 37.500 % PL 038 5.000 % 5.000 %PL 033B** 90.000 % 37.500 % PL 048D 10.000 % 10.000 %PL 036C 65.000 % 65.000 % PL 102C 10.000 % 10.000 %PL 036D 46.904 % 46.904 % PL 102D 10.000 % 10.000 %PL 065 55.000 % 55.000 % PL 102F 10.000 % 10.000 %PL 088BS 65.000 % 65.000 % PL 102G 10.000 % 10.000 %PL 103B* 0.000 % 70.000 % PL 220** 15.000 % 0.000 %PL 150 65.000 % 65.000 % PL 265 20.000 % 20.000 %PL 150B 65.000 % 65.000 % PL 272 50.000 % 50.000 %PL 169C 50.000 % 50.000 % PL 405 15.000 % 15.000 %PL 203 65.000 % 65.000 % PL 457BS 40.000 % 40.000 %PL 203B 65.000 % 65.000 % PL 492 60.000 % 60.000 %PL 212 30.000 % 30.000 % PL 502 22.222 % 22.222 %PL 212B 30.000 % 30.000 % PL 507* 0.000 % 45.000 %PL 212E 30.000 % 30.000 % PL 533 35.000 % 35.000 %PL 242 35.000 % 35.000 % PL 554 30.000 % 30.000 %PL 261 50.000 % 50.000 % PL 554B 30.000 % 30.000 %PL 262 30.000 % 30.000 % PL 554C 30.000 % 30.000 %PL 300 55.000 % 55.000 % PL 627 20.000 % 20.000 %PL 340 65.000 % 65.000 % PL 627B 20.000 % 20.000 %PL 340BS 65.000 % 65.000 % PL 719 20.000 % 20.000 %PL 364** 90.260 % 90.260 % PL 721 40.000 % 40.000 %PL 442 90.260 % 90.260 % PL 722 20.000 % 20.000 %PL 442B*** 90.260 % 90.260 % PL 778* 0.000 % 20.000 %PL 460** 65.000 % 65.000 % PL 782S 20.000 % 20.000 %PL 504 47.593 % 47.593 % PL 782SB 20.000 % 20.000 %PL 626 50.000 % 50.000 % PL 782SC*** 20.000 % 20.000 %PL 659 50.000 % 50.000 % PL 810** 30.000 % 0.000 %PL 677 60.000 % 60.000 % PL 811 20.000 % 20.000 %PL 715* 0.000 % 40.000 % PL 813 3.300 % 3.300 %PL 724 40.000 % 40.000 % PL 838 30.000 % 30.000 %PL 724B 40.000 % 40.000 % PL 842 30.000 % 30.000 %PL 748 50.000 % 50.000 % PL 844 20.000 % 20.000 %PL 748B*** 50.000 % 50.000 % PL 852 40.000 % 40.000 %PL 762 20.000 % 20.000 % PL 857 20.000 % 20.000 %PL 777 40.000 % 40.000 % PL 862*** 50.000 % 50.000 %PL 777B 40.000 % 40.000 % PL 863*** 40.000 % 40.000 %PL 777C*** 40.000 % 40.000 % PL 864*** 20.000 % 20.000 %PL 784 40.000 % 40.000 % PL 871*** 20.000 % 20.000 %PL 790 30.000 % 30.000 % PL 891*** 30.000 % 30.000 %PL 814 40.000 % 40.000 % PL 892*** 30.000 % 30.000 %PL 818 40.000 % 40.000 % PL 902*** 30.000 % 30.000 %PL 821 60.000 % 60.000 % Number 46 47PL 821B*** 60.000 % 60.000 %PL 822S 60.000 % 60.000 %PL 839 23.835 % 23.835 %PL 843 40.000 % 40.000 %PL 858 40.000 % 40.000 %PL 861*** 50.000 % 50.000 %PL 867*** 40.000 % 40.000 %PL 868*** 60.000 % 60.000 %PL 869*** 40.000 % 40.000 %PL 872*** 40.000 % 40.000 %PL 873*** 40.000 % 40.000 %PL 874*** 90.260 % 90.260 %PL 893*** 60.000 % 60.000 %PL 895*** 60.000 % 60.000 %Number 62 63
*** Interest awarded in the APA Licensing round (Application in Predefined Areas) in 2016. The awards were announced in 2017.** Acquired/changed through licence transactions or licence splits.* Relinquished licences or Aker BP has withdrawn from the licence.

30QUARTERLY REPORT Q4 2017
Note 20 Results from previous interim reports
(USD 1 000) Q4 Q3 Q2 Q1 Q4 Q3 Q2 Q1
Total income 725 994 596 188 594 501 646 250 655 624 247 993 255 665 204 848
Exploration expenses 56 181 63 887 75 375 30 259 44 281 30 843 36 214 36 115Production costs 147 076 134 411 121 017 120 874 121 139 32 188 39 116 34 374Depreciation 183 138 175 334 184 194 184 004 159 796 114 649 120 264 114 318Impairments 21 111 1 091 365 29 782 44 627 8 429 -19 644 37 964Other operating expenses 13 549 2 893 3 113 8 051 5 029 6 223 5 410 5 330
Total operating expenses 421 055 377 617 384 065 372 969 374 872 192 333 181 360 228 101
Operating profit/loss 304 940 218 571 210 436 273 280 280 752 55 660 74 305 -23 253
Net financial items -56 526 -9 469 -83 597 -46 508 -70 572 -5 107 -28 951 7 620
Profit/loss before taxes 248 413 209 102 126 840 226 772 210 180 50 553 45 353 -15 633Taxes (+)/tax income (-) 214 377 97 065 66 944 157 955 277 183 -12 880 39 046 -47 866
Net profit/loss 34 036 112 037 59 896 68 818 -67 003 63 433 6 308 32 233
20162017

31
Alternative performance measures
Depreciation per boe is depreciation divided by number of barrels of oil equivalents produced in the corresponding period
Dividend per share (DPS) is dividend paid in the quarter divided by number of shares outstanding
EBIT is short for earnings before interest and other financial items and taxes
EBITDA is short for earnings before interest and other financial items, taxes, depreciation and amortisation and impairments
EBITDAX is short for earnings before interest and other financial items, taxes, depreciation and amortisation, impairments and exploration expenses
Equity ratio is total equity divided by total assets
Net interest-bearing debt is book value of current and non-current interest-bearing debt less cash and cash equivalents
Production cost per boe is production cost divided by number of barrels of oil equivalents produced in the corresponding period
Aker BP may disclose alternative performance measures as part of its financial reporting as a supplement to the financial statements prepared in accordance with IFRS. Aker BP believes that the alternative performance measures provide useful supplemental information to management, investors, security analysts and other stakeholders and are meant to provide an enhanced insight into the financial development of Aker BP’s business operations and to improve comparability between periods.

akerbp.com