2017-2027 - city of perth 17... · long term financial plan page 1 . 2017-2027 . long term...
TRANSCRIPT
L O N G T E R M F I N A N C I A L P L A N
Page 1
2017-2027

L O N G T E R M F I N A N C I A L P L A N
Page 2
1. Executive Summary ....................................................................................................................... 4
2. Background ................................................................................................................................... 5
2.1 Key Statistics ......................................................................................................................... 5
3. Integrated Planning and Reporting Framework ............................................................................. 6
4. Financial Strategy .......................................................................................................................... 8
4.1 Rates .......................................................................................................................................... 8
4.2 Parking Fees................................................................................................................................ 8
4.3 Debt Management ...................................................................................................................... 8
4.4 Cashflow Management ............................................................................................................... 8
4.5 Asset Management ..................................................................................................................... 8
4.6 Investment ................................................................................................................................. 8
5. Asset Management ....................................................................................................................... 8
6. Workforce Planning.................................................................................................................... 10
7. Assumptions ............................................................................................................................... 11
7.1 Economic Indicators .................................................................................................................. 11
7.2 Rates ........................................................................................................................................ 11
7.3 Parking Fees.............................................................................................................................. 11
7.4 Waste Fees ............................................................................................................................... 11
7.5 Compliance Income (Parking Fines) ........................................................................................... 11
7.6 Employee Costs ........................................................................................................................ 12
7.7 Materials and Costs .................................................................................................................. 12
7.8 Utilities ..................................................................................................................................... 12
7.9 Insurances ................................................................................................................................ 12
7.10 Interest ................................................................................................................................... 12
7.11 Expense Provisions.................................................................................................................. 12
7.12 Other Expenses ....................................................................................................................... 12
7.13 Depreciation ........................................................................................................................... 12
7.14 Tamala Park ............................................................................................................................ 13
7.15 Capital Expenditure ................................................................................................................. 13
7.16 Working Capital ...................................................................................................................... 13
7.17 Reserves ................................................................................................................................. 14
7.18 Debt Management .................................................................................................................. 14
7.19 Exclusions from the Long Term Plan ........................................................................................ 15

L O N G T E R M F I N A N C I A L P L A N
Page 3
8. Financial Indicators ..................................................................................................................... 16
9. Risks............................................................................................................................................ 18
9.1 Economic Assumptions ............................................................................................................. 18
9.2 Civic Factors .............................................................................................................................. 18
9.3 Capital Expenditure ..................................................................................................................... 19
10. Contacts ...................................................................................................................................... 20
Appendix: Supporting Statements and Schedules ............................................................................... 21
I. Forecast Financial Statements 2017/18 – 2026/27 .................................................................. 22

L O N G T E R M F I N A N C I A L P L A N
Page 4
1. Executive Summary
The City of Perth has prepared this Long Term Financial Plan (LTFP) to set priorities in accordance with financial resources and to measure and ensure the financial sustainability of the City.
In terms of financial sustainability the plans objectives are ensuring:
• Strong cash flow capability • A diverse revenue base with rate increases being kept to a reasonable level • Ability to meet financial commitments • Prudent management of debt • Maintenance of the City’s assets to an appropriate level
The plan is aligned to the core planning documents of the City’s Integrated Planning & Reporting Framework – The Strategic Community Plan and Corporate Business Plan. The plan also shares information with the Corporate Asset Management Plan and Workforce Plan.
The City’s Integrated Planning process continues to mature and work to fully integrate the component documents of the framework is ongoing.
The plan informs the City’s long term planning and relies on a range of economic and civic assumptions. The financial information in the plan is based on the best available information at the time of publication and will be subject to change.
Items of note from the LTFP include:
• Consistent growth in revenues from rates, parking and waste collection • Control of operating expenses at levels that are consistent with a growing Capital City • Initial reduction of the City’s reserves followed by increases in reserves in the latter part of
the plan • Demonstration of financial sustainability of the City of Perth through positive cashflows and
asset growth.
The City of Perth Act came into effect on 1 July 2016 when the boundaries of the City of Perth were revised to include the University of Western Australia, the Queen Elizabeth II Medical Centre and the Royal Perth Yacht Club. Additionally, 1,348 ratepayers were transferred from the City of Subiaco and a small number from the City of Nedlands. The financial impact of council boundary changes has been included as part of the Long Term Financial Plan.
The plan does however exclude the impact of the Riverside MRA project and asset revaluations which cannot be accurately quantified at this time.

L O N G T E R M F I N A N C I A L P L A N
Page 5
2. Background
There has been a significant economic downturn in Perth over the past two years. The office vacancy rate is now 25.2% a 25 year high. Property values continue to fall; Landgate estimate an average office GRV reduction of 32% for the latest triennial valuation. Unemployment rates are forecast to be 6.5% for 2017/18. These factors have already had an impact on the City’s finances with a fall in car parking patronage
The 2017-2027 Long Term Financial Plan reflects this subdued economic outlook and includes the following key assumptions:
• Economic measures such as CPI, wages growth and interest rates are assumed to remain low for the duration of the plan
• Increases in Rates, Car parking and waste fees are modest and predominantly in line with CPI • The City’s Capital Expenditure program has been rationalised and efficiencies will be achieved
in the maintenance program • There is no forecast expansion of car parking facilities as a result of lower forecast parking
patronage • There will be minimal new borrowings to fund strategic renewals.
2.1 Key Statistics Key statistics relating to the City of Perth include:
Area 9.8 km² Length of Roads 106 km Areas of Parkland and Reserves 122.7 ha Population 2017 (Forecast id) 27,173 Workforce Population (Forecast id) 134,459 Office Space (Savills Research Jan 2017) 2,176,400m² Private Dwellings (CoP Rates Database) 13,717
Note: Figures exclude Kings Park
As a result of community engagement undertaken in creating the City’s Strategic Community Plan ‘Vision 2029+’ the following ‘priorities’ or ‘themes’ were identified. The Long Term Financial Plan

L O N G T E R M F I N A N C I A L P L A N
Page 6
forms part of the City’s integrated planning and reporting framework, it is a key document in the delivery of the seven key strategic priorities.
Major Strategic Investments Getting Around Perth Perth as a Capital City The planning and integration of major infrastructure and developments to maximise their net benefit and minimise risk and future costs to the City.
An effective pedestrian friendly movement system integrating transport modes to maintain a high level of accessibility to and within the City.
The City is recognised internationally as a city on the move and for its liveability, talented people, and centres of excellence and business opportunities.
Living in Perth Perth at Night Healthy and Active in Perth The City is a place where a diverse range of people choose to live for a unique sustainable urban lifestyle and access to government and private services.
A City that has a vibrant night time economy that attracts new innovative businesses and events and where people and families feel safe.
A City with a well-integrated, built and green natural environment in which people and families choose a lifestyle that enhances their physical and mental health and takes part in arts, cultural and local community events.
Capable and Responsive Organisation A capable, flexible and sustainable organisation with a strong and effective governance system to provide leadership as a capital city and provide efficient and effective community centred services.
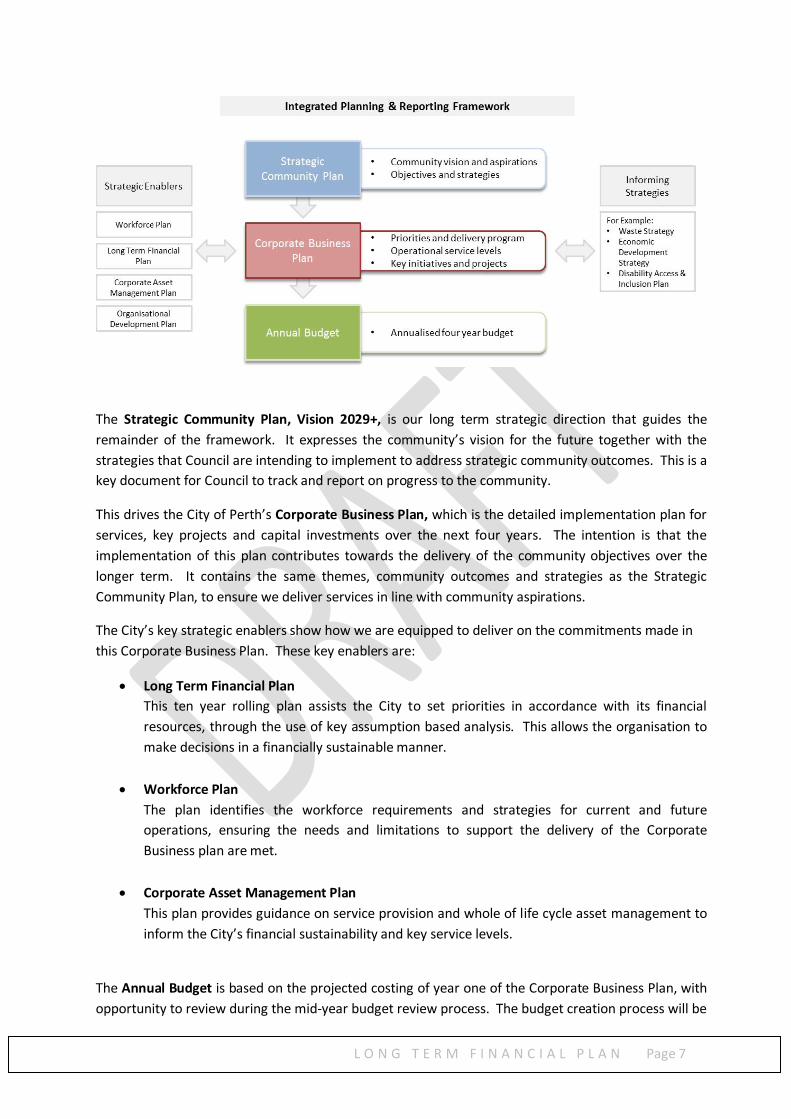
3. Integrated Planning and Reporting Framework
The below diagram depicts the components that make up the City of Perth’s Integrated Planning and Reporting Framework (IPRF). It shows the interaction between the plans, the influence of the informing strategies and the strategic enablers, with emphasis given to a mutual informing relationship. The intent of the IPRF is to ensure the priorities and services provided by the City of Perth are aligned with our community needs and aspirations. The strategic enablers allow rigour to be applied to these, taking into account available resources to deliver the best possible results for the community.
L O N G T E R M F I N A N C I A L P L A N
Page 7
The Strategic Community Plan, Vision 2029+, is our long term strategic direction that guides the remainder of the framework. It expresses the community’s vision for the future together with the strategies that Council are intending to implement to address strategic community outcomes. This is a key document for Council to track and report on progress to the community.
This drives the City of Perth’s Corporate Business Plan, which is the detailed implementation plan for services, key projects and capital investments over the next four years. The intention is that the implementation of this plan contributes towards the delivery of the community objectives over the longer term. It contains the same themes, community outcomes and strategies as the Strategic Community Plan, to ensure we deliver services in line with community aspirations.
The City’s key strategic enablers show how we are equipped to deliver on the commitments made in this Corporate Business Plan. These key enablers are:
• Long Term Financial Plan This ten year rolling plan assists the City to set priorities in accordance with its financial resources, through the use of key assumption based analysis. This allows the organisation to make decisions in a financially sustainable manner.
• Workforce Plan The plan identifies the workforce requirements and strategies for current and future operations, ensuring the needs and limitations to support the delivery of the Corporate Business plan are met.
• Corporate Asset Management Plan This plan provides guidance on service provision and whole of life cycle asset management to inform the City’s financial sustainability and key service levels.
The Annual Budget is based on the projected costing of year one of the Corporate Business Plan, with opportunity to review during the mid-year budget review process. The budget creation process will be
L O N G T E R M F I N A N C I A L P L A N
Page 8
continually improved to strengthen the financial integration between the plans within the framework.
4. Financial Strategy
The City’s financial strategy is influenced by the growth of the City itself and reflects the current economic climate.
Specific financial strategies which should be noted include:
4.1 Rates The City of Perth derives around 37% of its revenue from parking fees, which enables the setting of rates in the dollar below other Australian Capital cities and the surrounding Perth metropolitan councils. Due to the current economic climate, the strategy for rates setting will remain conservative and increases are currently forecast to be limited to the level of CPI for the life of the plan.
4.2 Parking Fees The City of Perth operates both on street and off street parking facilities. Fees are kept to a level comparable with competitors operating in the City. The parking levy paid to the state government has a significant impact on the setting of parking fees and it currently accounts for 24.7% of total parking revenue.
4.3 Debt Management The City’s current debt level is low as evidenced by the debt ratios in Section 8 of the plan. The City’s policy is to borrow to fund growth in its asset base or for the renewal and major maintenance of strategic assets. It has been assumed that there will be new borrowing in year two of the plan.
4.4 Cashflow Management The City aims to achieve positive cash flows by prudent financial management. This priority is aided by distributions from the Tamala Park Regional Council and by using debt funding for certain major capital projects as required.
4.5 Asset Management It is the City’s policy to maintain assets to appropriate standards and adequately provide for ongoing maintenance and fund replacements and enhancements when warranted.
4.6 Investment Investment management is undertaken in a manner that seeks to ensure the security of the investment portfolio. This includes managing credit and interest rate risk within identified parameters. The City ensures sufficient liquidity to meet all reasonably anticipated cash flow requirements as and when they fall due without incurring significant costs due to the unanticipated sale of an investment.
5. Asset Management The goal of Asset Management for the City of Perth is to plan the capital, maintenance and operational activities for assets that return the greatest value for the Community and the City.
L O N G T E R M F I N A N C I A L P L A N
Page 9
Guided by the direction provided in the City of Perth Strategic Community Plan and Vision 2029+, such activities could include:
• injecting capital funding to develop and upgrade assets that are in high demand by the Community;
• planning for the renewal of assets that have reached the end of their useful service life; or • executing activities in a cost effective manner to maintain and sustain the usability of assets to
agreed service levels.
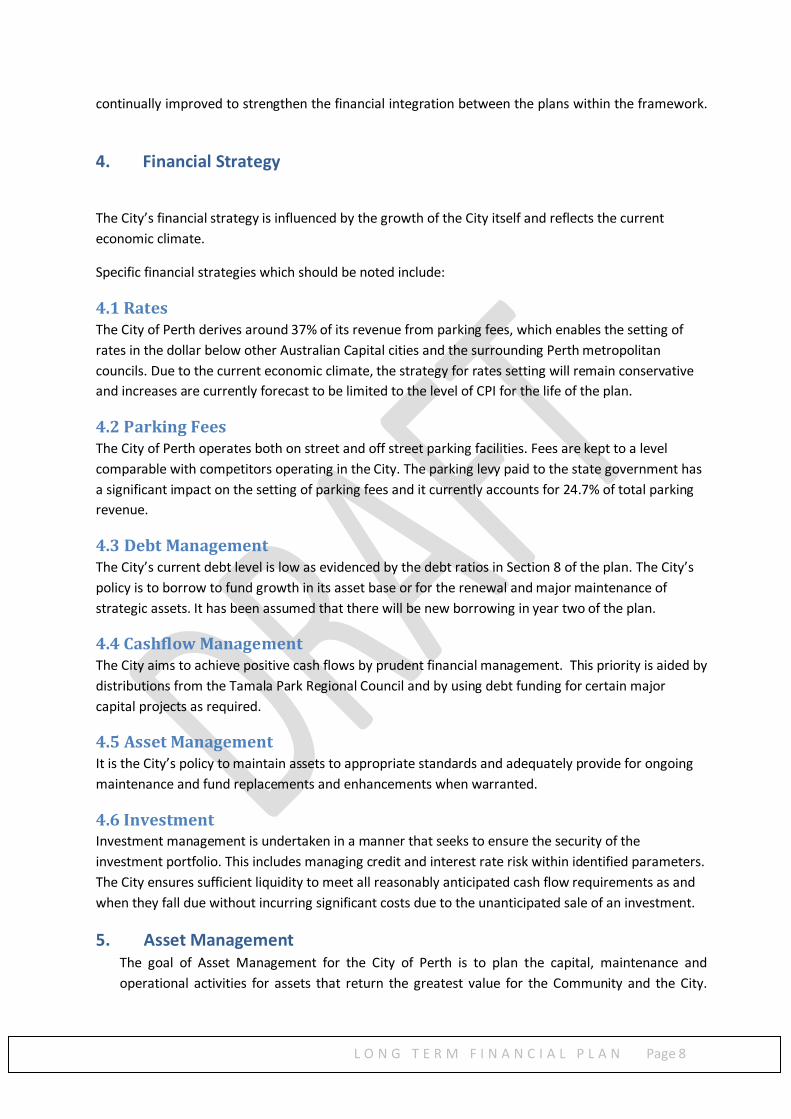
To determine priorities with the objective of maximising the return on investment, the City of Perth has introduced four values or ‘focus areas’ that guide the Asset Management decision making framework. These are detailed in the diagram below:
Asset Management Focus Areas
• Asset Information – The City emphasis the use information to drive our decision making. This includes developing a “Strategy on a Page” for each asset class to define exactly what information is used to make what decisions.
• Asset Management Innovation – The City recognises the need to remain proactive in looking for innovative methods, more durable materials and better technology or processes to maximise asset success in the long term.
• Sustainability – This reinforces the City’s core values and commitments to our role as a Capital City. The City understands that aiming for a world-class asset portfolio with innovative

L O N G T E R M F I N A N C I A L P L A N
Page 10
systems and techniques is inadequate if we are not able to sustain this for future generations to enjoy; and
• Accountability – The City will endeavour to demonstrate a transparent link between what we plan and what we execute. This will ensure transference and continuity of the decision making and justification processes of our asset planning into our execution.
These four focus areas will guide our financial decision making process and they will collectively ensure long term success in the City’s asset planning. For more information on the City of Perth’s assets, their governance structure and management methodologies, please refer to the City of Perth’s Corporate Asset Management Plan.
6. Workforce Planning
The City of Perth Workforce Plan is based on a traditional approach to workforce planning, identifying the numbers of positions required to deliver services. Based on this analysis, the Workforce Plan is developed. The Workforce Plan tracks the movement of the City’s personnel and is used as a basis for employee expenses in the LTFP.

L O N G T E R M F I N A N C I A L P L A N
Page 11
7. Assumptions The LTFP takes the 2017/18 Budget as a base and applies various assumptions to forecast the following years of the plan. In relation to the assumptions, the following should be noted:
7.1 Economic Indicators Forecasting of long term economic indicators is notoriously difficult and published data for 10 year forecasts are rare. The Long Term Financial plan has used the best available data and made assumptions where 10 year data is not available. The plan assumes a low interest rate environment and low inflation for the duration of the plan.
7.2 Rates The City’s policy has generally been to limit rate increases to CPI. Increases above this level have been implemented to fund major strategic capital projects such as the City of Perth Library. The 10 year capital plan has not identified any capital expenditure of this nature and with the WA economy subdued and a particularly high office vacancy rate, it is prudent to limit rate increases. Annual rates increases have therefore been limited to CPI for the duration of the plan.
The City has a rates differential policy, charging a different rate in the dollar for each of the defined rate payer classes. The recommended rate increase for 2017/18 applied CPI increases across all rates categories.
Additionally where new property or improvements to property become rateable interim rates for partial years have been forecast. Full year values are then combined into the base rates CPI calculation for the successive year.
7.3 Parking Fees Since its inception in 2002, the State Government Parking Levy has increased significantly. The Council’s policy was to pass on the cost of the levy to the consumer which results in increases in parking fees consistently above the level of CPI. Due to falling patronage as a result of a declining workforce in the City, the increase in parking levy will not be directly passed on to the consumer for the first 4 years of the plan (assuming forecast levy increases are applied). Increases in parking fees will be limited to the level of CPI for this period of the plan. In the LTFP the number of parking bays will remain constant and parking patronage, which has fallen over the past 3 years, will improve as office vacancy rates decrease.
7.4 Waste Fees Waste fees have in the past been subsidised by the City of Perth, as the full cost of the service was not passed on to the ratepayer. The rates charged are below those charged by peer capital cities and the surrounding metropolitan councils. The Council’s strategy is to progressively increase waste fees over time to pass on to ratepayers the full cost of the service.
7.5 Compliance Income (Parking Fines) Approximately 5% of City’s revenue is derived from parking fines. The objective of compliance officers is primarily traffic management and it should be noted that although standard parking fines were

L O N G T E R M F I N A N C I A L P L A N
Page 12
increased in the 2015/16 budget, prior to this they had remained at the same level for many years. Revenue has been increased by CPI only over the life of the plan.
7.6 Employee Costs Employee costs include direct salaries and wage costs and indirect costs such as workers compensation, recruitment and training. Headcount is forecast to remain static and deliver value to the City, whilst wage growth is limited to CPI. Indirect employee costs have also been inflated by CPI.
7.7 Materials and Costs Materials and costs which includes the cost of maintenance, have in the past increased above the level of CPI due to the expansion of the City’s asset base. The City will implement improved maintenance planning to reduce cost growth and so it has been assumed that these costs will grow at the rate of CPI over the life of the plan.
7.8 Utilities The City has achieved some success in reducing utilities consumption. Utilities have been extrapolated at CPI as increased costs from an expanding asset base will be tempered by the drive for greater efficiency.
7.9 Insurances The City tendered for insurance services in April 2017 and significant savings were achieved, the majority of which were in the Workers Compensation cost (included in Salaries & Wages). Increase in insurance cost have been projected at CPI.
7.10 Interest Interest has been calculated from information available on existing loans, all of which are on fixed rates of interest and broad assumptions regarding a new loan to fund renewals to the Perth Convention and Exhibition Centre Carpark. The lower interest cost trend reflects full repayment of some of the larger loans and the ten year term of the Library loans.
7.11 Expense Provisions Expense provisions consist of increases in employee provisions commensurate with EBA increases. The consumption of stationery plant at the Perth Convention and Exhibition Centre (PCEC) leasehold car park is also reflected in this account.
7.12 Other Expenses Other expenses consist mainly of parking levies paid to the government, donations and sponsorships. Increases in the parking levy is at the discretion of the State Government.
7.13 Depreciation Depreciation is extrapolated on the basis of growth and CPI. The depreciation calculation does not allow for the depreciation of contributed assets from the Elizabeth Quay which have not been included in the plan.
L O N G T E R M F I N A N C I A L P L A N
Page 13
7.14 Tamala Park The Tamala Park income arises from distributions from the Tamala Park Regional Council which is developing and selling land at Catalina of which the City has a one twelfth interest. This has been recognised on a cash basis. The cash received is appropriated to the Enterprise and Initiative Reserve.
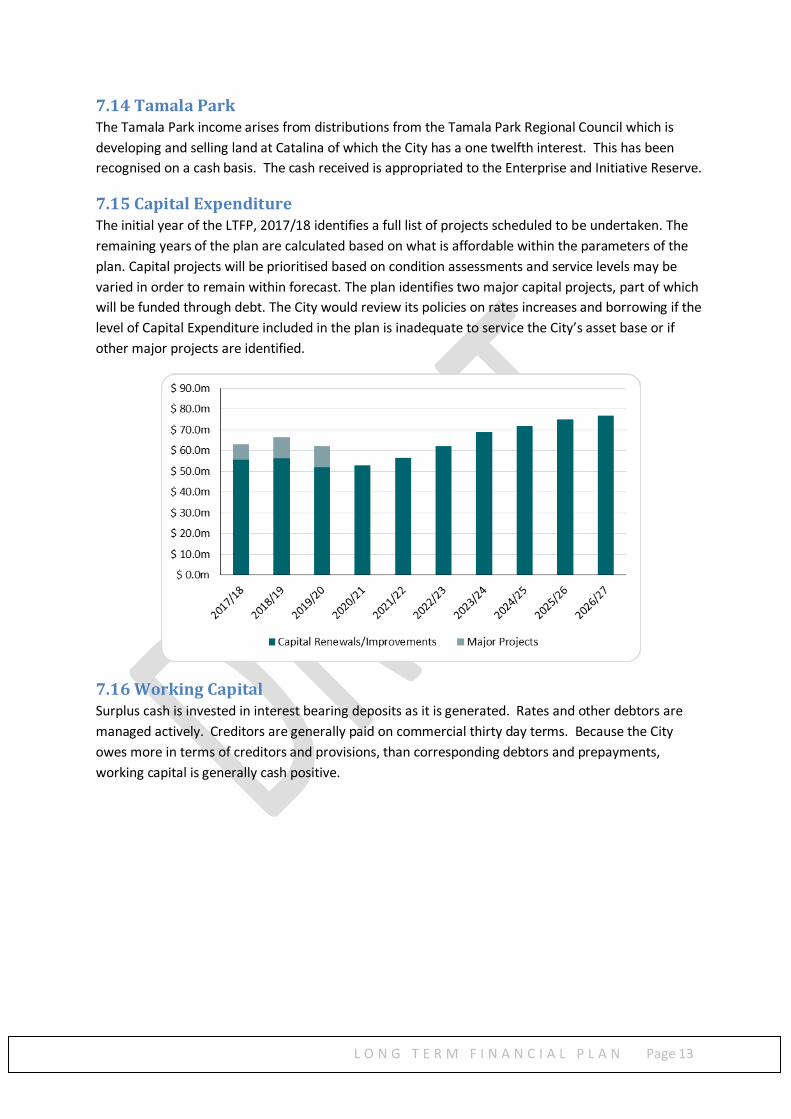
7.15 Capital Expenditure The initial year of the LTFP, 2017/18 identifies a full list of projects scheduled to be undertaken. The remaining years of the plan are calculated based on what is affordable within the parameters of the plan. Capital projects will be prioritised based on condition assessments and service levels may be varied in order to remain within forecast. The plan identifies two major capital projects, part of which will be funded through debt. The City would review its policies on rates increases and borrowing if the level of Capital Expenditure included in the plan is inadequate to service the City’s asset base or if other major projects are identified.
7.16 Working Capital Surplus cash is invested in interest bearing deposits as it is generated. Rates and other debtors are managed actively. Creditors are generally paid on commercial thirty day terms. Because the City owes more in terms of creditors and provisions, than corresponding debtors and prepayments, working capital is generally cash positive.

L O N G T E R M F I N A N C I A L P L A N
Page 14
7.17 Reserves Reserves at the City are primarily utilised to set aside money for larger projects and to smooth out the funding of large capital expenditure commitments. The principal reserves for funding capital are the Asset Enhancement and the Parking Facilities Development reserves. The City also transfers money to the Parking Levy reserve each June for payment of the State Government parking levy the following financial year.
7.18 Debt Management The City has for a number of years borrowed to fund capital projects. The type of projects which are funded by these means will either be for the renewal of iconic Perth buildings or projects with a business emphasis that generates income to repay loans. Loans are currently sourced from the Western Australian Treasury Corporation (WATC). In July 2015 the guarantee fee applied by the WATC on outstanding loan balances increased from 0.1% to 0.8% which has had a significant impact on the City’s cost of borrowing.

L O N G T E R M F I N A N C I A L P L A N
Page 15
7.19 Exclusions from the Long Term Plan The plan excludes the following:
• Adjustments for the revaluation of assets • Impact of the MRA Riverside development • Contributed Assets from Elizabeth Quay

L O N G T E R M F I N A N C I A L P L A N
Page 16
8. Financial Indicators The following financial measures have been used in the development of the Long Term Financial Plan to monitor and assess performance over the planning period.
Ratio Current RatioCurrent Assets minus Restricted Current Assets
Current Liabilities minus those associated with Current Restricted Assets
Target not met
Target >=1.00Calculation
Performance
CommentThis is not a traditional current ratio but distorted by the Department of Local Government and Communities (DLGC) guidelines to exclude reserves.
0.20
0.60
1.00
1.40
FY18 FY19 FY20 FY21 FY22 FY23 FY24 FY25 FY26 FY27
Ratio Rate Coverage RatioNet Rate RevenueOperating Revenue
The ratio indicates an increasing reliance on Rates as a revenue source.
Target No TargetCalculation
Performance
Comment
38.0%42.0%46.0%50.0%54.0%58.0%
FY18 FY19 FY20 FY21 FY22 FY23 FY24 FY25 FY26 FY27
Ratio Debt RatioTotal Liabilities
Total AssetsTarget No Target
Calculation
Performance
Comment The City is well within the target ratio for the duration of the plan
0.0%
2.0%
4.0%
6.0%
8.0%
FY18 FY19 FY20 FY21 FY22 FY23 FY24 FY25 FY26 FY27

L O N G T E R M F I N A N C I A L P L A N
Page 17
Ratio Debt Service Cover RatioOperating Surplus before Interest & Depreciation
Interest and Principal Repayments
Target met
Target >2Calculation
Performance
CommentThe City is running significantly above the target and it is assumed that all debt currently held will be repaid by 2022/23. A new loan is anticipated to be drawn for year 2018/19 and will continue to be repaid throughout the ten year plan.
-
20.00
40.00
60.00
FY18 FY19 FY20 FY21 FY22 FY23 FY24 FY25 FY26 FY27
Ratio Gross Debt to Revenue RatioGross Debt
Total Revenue
The City is running significantly below the target in all years due to the low levels of debt.
No TargetCalculation
Comment
Performance
Target
0.0%
10.0%
20.0%
30.0%
40.0%
FY18 FY19 FY20 FY21 FY22 FY23 FY24 FY25 FY26 FY27
Ratio Operating Surplus RatioOperating Revenue minus Operating Expense
Own Source Operating Revenue
Target metThe ratio rises over time to the mid point between target and advanced target.
Comment
Target Advanced
>1% >15%Calculation
Performance
0.0%
4.0%
8.0%
12.0%
16.0%
FY18 FY19 FY20 FY21 FY22 FY23 FY24 FY25 FY26 FY27
Ratio Own Source Revenue Coverage RatioOwn Source Operating Revenue
Operating Expense
Advanced Target metDemonstrates that the City is not reliant on grants and other external income.
Comment
Calculation
Performance
Target Advanced
>40% >90%
20.0%40.0%60.0%80.0%
100.0%120.0%
FY18 FY19 FY20 FY21 FY22 FY23 FY24 FY25 FY26 FY27
L O N G T E R M F I N A N C I A L P L A N
Page 18
Source: All above targets are sourced from the Government of Western Australia - Department of Local Government and Communities - Local Government Operational Guidelines - Number 18-June 2013, Financial Ratios. https://www.dlgc.wa.gov.au/Publications/Pages/LG-Operational-Guidelines-18.aspx
9. Risks There are three major risk factors which will influence the LTFP:
9.1 Economic Assumptions Forecasting of long term economic predictions is notoriously problematic. For the purpose of the LTFP, it has been assumed that interest rates will remain low and inflation will remain relatively consistent over the life of the plan.
9.2 Civic Factors
MRA Projects The Metropolitan Redevelopment Authority (MRA) is engaged in the construction of three major projects within the City: Elizabeth Quay, Perth City Link and Riverside. During the life of these projects the MRA will be progressively transferring some newly constructed public realm assets to the City.
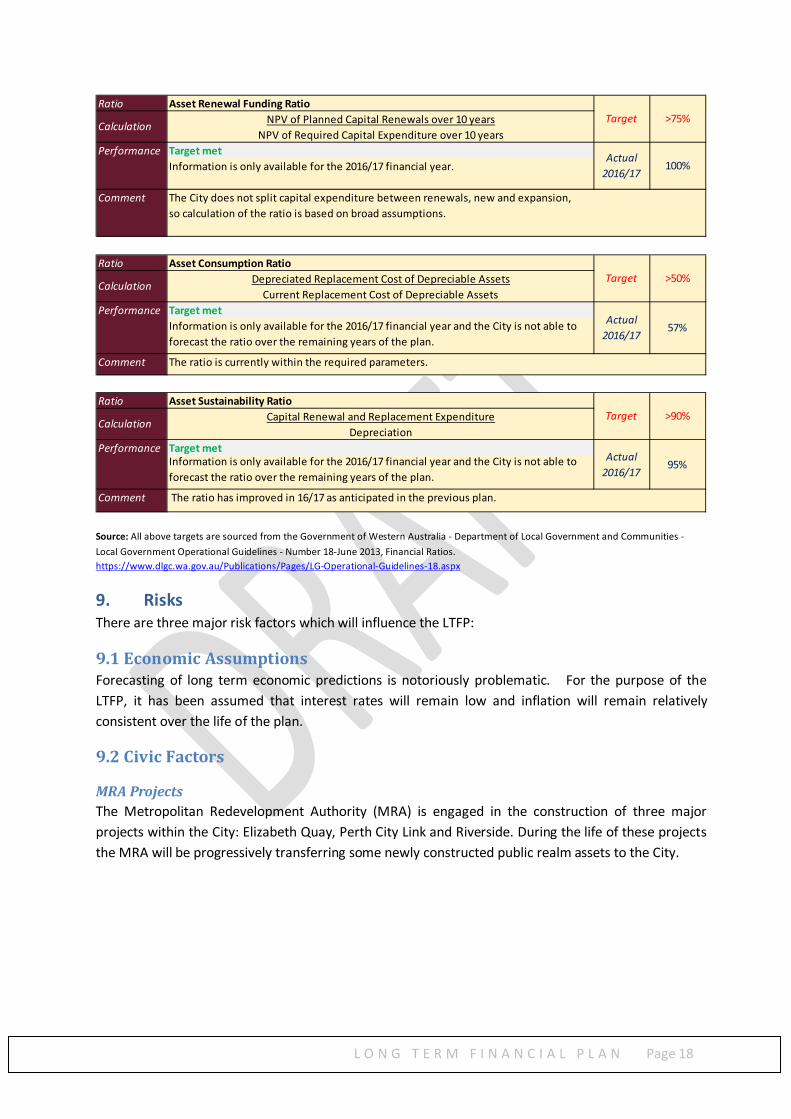
Ratio Asset Renewal Funding RatioNPV of Planned Capital Renewals over 10 years
NPV of Required Capital Expenditure over 10 yearsTarget metInformation is only available for the 2016/17 financial year.
The City does not split capital expenditure between renewals, new and expansion,so calculation of the ratio is based on broad assumptions.
Target >75%Calculation
Performance
Comment
Actual 2016/17
100%
Ratio Asset Consumption RatioDepreciated Replacement Cost of Depreciable Assets
Current Replacement Cost of Depreciable AssetsTarget metInformation is only available for the 2016/17 financial year and the City is not able to forecast the ratio over the remaining years of the plan.
The ratio is currently within the required parameters.
Target >50%Calculation
Performance
Comment
Actual 2016/17
57%
Ratio Asset Sustainability RatioCapital Renewal and Replacement Expenditure
DepreciationTarget metInformation is only available for the 2016/17 financial year and the City is not able to forecast the ratio over the remaining years of the plan.
The ratio has improved in 16/17 as anticipated in the previous plan.
Actual 2016/17
95%
Comment
Target >90%Calculation
Performance

L O N G T E R M F I N A N C I A L P L A N
Page 19
Elizabeth Quay The Elizabeth Quay development opened in January 2016. The development incorporates commercial, retail and cultural attractions which are set around a 2.7 hectare inlet.
The MRA will retain ownership of a number of public realm areas and assets for up to 10 years although the road reserve has already been handed over to the City. The MRA is currently responsible for activation, presentation, maintenance and public services in the precinct. MRA will sell and oversee development of nine private lots over an extended period of time.
The full cost of servicing the precinct will not be covered by the rates generated until there is further development of the site, which will take a number of years. The City currently provides waste and cleansing services for the precinct capped at a level which is fully funded from the rates revenue generated. The MRA also procure other cleaning and maintenance services from external providers to maintain an appropriate service level for the precinct. The Long Term Financial Plan assumes the continuation of this agreement with an expansion of services provided as rates revenue generated from the site increases. It is assumed that servicing of the precinct will remain cost neutral to the City until development of the site is substantially complete.
It is too early to forecast the impact of the Riverside project and so it has been excluded from the plan.
Parking Levy The State Government imposes a parking levy on all commercial parking bays in the city. The cost of this levy increased by over 20% in both 2014/15 and 2015/16. Although the increase in 2016/17 was a more modest 1.8% it still has a significant impact on the City’s parking business. The levy currently accounts for over 24.7% of parking revenue and due to the current economic conditions the City is intending not to pass the full levy increase on to its patrons in 2016/17 and 2017/18. If the parking levy increases revert to levels significantly above the level of CPI it will result in a reduced margin for the City of Perth Parking business and the City will have to increase rates above the level of CPI in order to fund the shortfall.
9.3 Capital Expenditure The City’s capital expenditure program forms a significant part of the LTFP. The timing of expenditure is difficult to predict particularly in the later years of the plan. Delays in capital expenditure can also affect other areas of the plan including financing and maintenance costs. The capital expenditure figures included in the plan are a best estimate based on information available at the time of publication.

L O N G T E R M F I N A N C I A L P L A N
Page 20
10. Contacts
Martin Mileham Chief Executive Officer [email protected]
Robert Mianich Director Corporate Services [email protected]
Dan Richards Finance Manager [email protected]

L O N G T E R M F I N A N C I A L P L A N
Page 21
Appendix: Supporting Statements and Schedules

L O N G T E R M F I N A N C I A L P L A N
Page 22
I. Forecast Financial Statements 2017/18 – 2026/27

L O N G T E R M F I N A N C I A L P L A N
Page 23
Base Year Budget Forecast Forecast Forecast Forecast Forecast Forecast Forecast Forecast Forecast2016/17 2017/18 2018/19 2019/20 2020/21 2021/22 2022/23 2023/24 2024/25 2025/26 2026/27
$'000 $'000 $'000 $'000 $'000 $'000 $'000 $'000 $'000 $'000 $'000REVENUES FROM ORDINARY ACTIVITIESRates 88,078 89,253 98,152 105,555 110,468 115,825 123,015 128,274 133,122 137,602 143,014 Grants and Subsidies 2,025 1,969 1,576 1,615 1,655 1,697 1,739 1,783 1,828 1,873 1,920 Contributions, Donations and Reimbursements 474 422 337 346 355 363 373 382 391 401 411 Fees and Charges 98,745 99,520 100,377 101,976 105,414 109,644 114,049 118,634 123,415 128,398 133,596 Interest Earned 5,242 4,619 4,356 3,610 3,250 3,198 3,296 3,521 3,771 3,925 4,091 Other Revenue 1,478 1,210 1,237 1,268 1,300 1,333 1,366 1,400 1,435 1,471 1,508 TOTAL REVENUE FROM ORDINARY ACTIVITIES 196,042 196,994 206,035 214,370 222,442 232,060 243,838 253,994 263,962 273,670 284,540
EXPENSES FROM ORDINARY ACTIVITIESEmployee costs 77,738 74,753 76,595 78,510 80,473 82,485 84,547 86,661 88,827 91,048 93,324 Materials and Contracts 49,918 50,713 51,854 53,150 54,479 55,841 57,237 58,668 60,135 61,638 63,179 Utilities (gas,electricity,water) 3,332 3,465 3,542 3,631 3,722 3,815 3,910 4,008 4,108 4,211 4,316 Insurance Expenditure 1,199 922 943 967 991 1,016 1,041 1,067 1,094 1,121 1,149 Depreciation of Non-Current Assets 33,050 33,534 35,211 36,972 38,821 40,762 42,800 44,940 47,187 49,546 52,023 Interest Expenses 1,724 1,381 1,606 1,227 943 750 614 566 517 466 412 Expense Provisions 940 916 936 959 983 1,008 1,033 1,059 1,085 1,112 1,140 Other Expenditure 24,623 25,791 26,055 26,255 26,911 27,584 28,274 28,981 29,705 30,448 31,209 TOTAL EXPENDITURE FROM ORDINARY ACTIVITIES 192,525 191,474 196,742 201,671 207,323 213,261 219,456 225,950 232,658 239,590 246,752
SUB TOTAL 3,517 5,520 9,293 12,699 15,119 18,799 24,382 28,044 31,304 34,080 37,788
GRANTS AND CONTRIBUTIONSGrants and Subsidies 2,075 1,295 1,324 1,357 1,391 1,426 1,462 1,498 1,536 1,574 1,613 NET OPERATING SURPLUS 5,591 6,815 10,617 14,056 16,510 20,225 25,844 29,542 32,840 35,654 39,401
DISPOSAL / WRITE-OFF OF ASSETSLoss on Disposal of Assets (932) (1,664) (2,425) (2,486) (2,548) (2,612) (2,677) (2,744) (2,813) (2,883) (2,955)
SIGNIFICANT ITEMSDistribution from TPRC 1,000 1,400 2,333 1,500 3,083 2,750 3,083 3,583 1,000 1,250 1,167
CHANGE IN NET ASSETS FROM ORDINARY ACTIVITESAFTER SIGNIFICANT ITEMS - GAIN / (REDUCTION) 5,659 6,551 10,525 13,070 17,045 20,363 26,250 30,381 31,027 34,021 37,613
Statement of Comprehensive Income by Nature and Type for period 2017/18 - 2026/27
L O N G T E R M F I N A N C I A L P L A N
Page 24
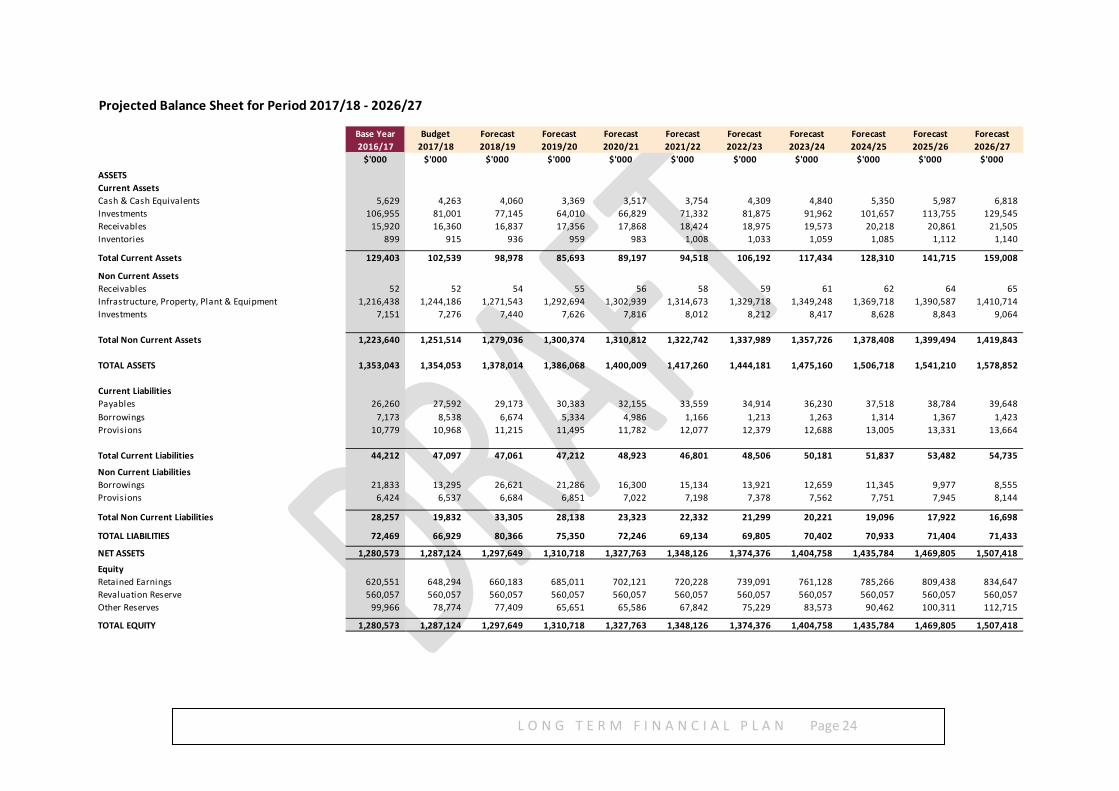
Projected Balance Sheet for Period 2017/18 - 2026/27
Base Year Budget Forecast Forecast Forecast Forecast Forecast Forecast Forecast Forecast Forecast2016/17 2017/18 2018/19 2019/20 2020/21 2021/22 2022/23 2023/24 2024/25 2025/26 2026/27
$'000 $'000 $'000 $'000 $'000 $'000 $'000 $'000 $'000 $'000 $'000
ASSETSCurrent AssetsCash & Cash Equivalents 5,629 4,263 4,060 3,369 3,517 3,754 4,309 4,840 5,350 5,987 6,818 Investments 106,955 81,001 77,145 64,010 66,829 71,332 81,875 91,962 101,657 113,755 129,545 Receivables 15,920 16,360 16,837 17,356 17,868 18,424 18,975 19,573 20,218 20,861 21,505 Inventories 899 915 936 959 983 1,008 1,033 1,059 1,085 1,112 1,140
Total Current Assets 129,403 102,539 98,978 85,693 89,197 94,518 106,192 117,434 128,310 141,715 159,008
Non Current AssetsReceivables 52 52 54 55 56 58 59 61 62 64 65 Infrastructure, Property, Plant & Equipment 1,216,438 1,244,186 1,271,543 1,292,694 1,302,939 1,314,673 1,329,718 1,349,248 1,369,718 1,390,587 1,410,714 Investments 7,151 7,276 7,440 7,626 7,816 8,012 8,212 8,417 8,628 8,843 9,064
Total Non Current Assets 1,223,640 1,251,514 1,279,036 1,300,374 1,310,812 1,322,742 1,337,989 1,357,726 1,378,408 1,399,494 1,419,843
TOTAL ASSETS 1,353,043 1,354,053 1,378,014 1,386,068 1,400,009 1,417,260 1,444,181 1,475,160 1,506,718 1,541,210 1,578,852
Current LiabilitiesPayables 26,260 27,592 29,173 30,383 32,155 33,559 34,914 36,230 37,518 38,784 39,648 Borrowings 7,173 8,538 6,674 5,334 4,986 1,166 1,213 1,263 1,314 1,367 1,423 Provisions 10,779 10,968 11,215 11,495 11,782 12,077 12,379 12,688 13,005 13,331 13,664
Total Current Liabilities 44,212 47,097 47,061 47,212 48,923 46,801 48,506 50,181 51,837 53,482 54,735
Non Current LiabilitiesBorrowings 21,833 13,295 26,621 21,286 16,300 15,134 13,921 12,659 11,345 9,977 8,555 Provisions 6,424 6,537 6,684 6,851 7,022 7,198 7,378 7,562 7,751 7,945 8,144
Total Non Current Liabilities 28,257 19,832 33,305 28,138 23,323 22,332 21,299 20,221 19,096 17,922 16,698
TOTAL LIABILITIES 72,469 66,929 80,366 75,350 72,246 69,134 69,805 70,402 70,933 71,404 71,433
NET ASSETS 1,280,573 1,287,124 1,297,649 1,310,718 1,327,763 1,348,126 1,374,376 1,404,758 1,435,784 1,469,805 1,507,418
EquityRetained Earnings 620,551 648,294 660,183 685,011 702,121 720,228 739,091 761,128 785,266 809,438 834,647 Revaluation Reserve 560,057 560,057 560,057 560,057 560,057 560,057 560,057 560,057 560,057 560,057 560,057 Other Reserves 99,966 78,774 77,409 65,651 65,586 67,842 75,229 83,573 90,462 100,311 112,715
TOTAL EQUITY 1,280,573 1,287,124 1,297,649 1,310,718 1,327,763 1,348,126 1,374,376 1,404,758 1,435,784 1,469,805 1,507,418

L O N G T E R M F I N A N C I A L P L A N
Page 25
Projected Cash Flow for Period 2017/18 - 2026/27Base Year Budget Forecast Forecast Forecast Forecast Forecast Forecast Forecast Forecast Forecast2016/17 2017/18 2018/19 2019/20 2020/21 2021/22 2022/23 2023/24 2024/25 2025/26 2026/27
$'000 $'000 $'000 $'000 $'000 $'000 $'000 $'000 $'000 $'000 $'000Cashflow from Operating Activities
Receipts:Rates & Annual Charges 172,968 180,013 189,591 198,363 206,505 215,826 227,199 236,764 246,106 255,326 265,686 Investment Revenue & Interest 5,035 4,619 4,356 3,610 3,250 3,198 3,296 3,521 3,771 3,925 4,091 Other Receipts - Operating 16,169 9,689 9,906 10,154 10,408 10,668 10,935 11,208 11,489 11,776 12,070
Payments:Employee Benefits & On-costs (78,019) (74,965) (76,193) (78,090) (80,042) (82,043) (84,094) (86,196) (88,351) (90,560) (92,824) Materials & Contracts (46,863) (50,426) (51,948) (53,388) (54,193) (55,689) (57,165) (58,667) (60,196) (61,754) (63,732) Borrowing Costs (1,793) (1,381) (1,606) (1,227) (943) (750) (614) (566) (517) (466) (412) Other Payments Operating (29,576) (29,836) (30,204) (30,784) (31,553) (32,613) (33,428) (34,264) (35,120) (35,998) (36,897)
Net Cash Provided (or Used) in Operating Activities 37,920 37,714 43,903 48,638 53,432 58,598 66,129 71,800 77,182 82,249 87,982
Cash flows from Investing ActivitiesReceipts:Sale of Investments 1,000 1,400 2,333 1,500 3,083 2,750 3,083 3,583 1,000 1,250 1,167 Sale of Infrastructure, Property, Plant & Equipment 1,333 158 1,354 1,388 1,423 1,459 1,495 1,532 1,570 1,609 1,649
Payments:Purchase of Infrastructure, Property, Plant & Equipment (35,234) (63,105) (66,347) (61,997) (53,038) (56,566) (62,017) (68,747) (72,039) (74,907) (76,753)
Net Cash Provided (or Used) in Investing Activities (32,901) (61,547) (62,660) (59,109) (48,532) (52,357) (57,439) (63,632) (69,469) (72,048) (73,937)
Cash flows from Financing ActivitiesReceipts:Proceeds from Loans - - 20,000 - - - - - - - -
Payments:Repayment of Loans (7,322) (7,173) (8,538) (6,674) (5,334) (4,986) (1,166) (1,213) (1,263) (1,314) (1,367)
Net Cash Provided (or Used) in Financing Activities (7,322) (7,173) 11,462 (6,674) (5,334) (4,986) (1,166) (1,213) (1,263) (1,314) (1,367)
Cashflows from GovernmentReceipts from Appropriation/GrantsRecurrent Appropriations/Grants 2,498 2,391 1,913 1,961 2,010 2,060 2,112 2,165 2,219 2,274 2,331 Capital Appropriations/Grants 2,075 1,295 1,324 1,357 1,391 1,426 1,462 1,498 1,536 1,574 1,613
Net Cash from Government 4,573 3,686 3,237 3,318 3,401 3,486 3,574 3,663 3,755 3,848 3,944
Net Increase/(Decrease) in Cash & Cash Equivalents 2,271 (27,320) (4,058) (13,827) 2,967 4,740 11,098 10,618 10,205 12,735 16,622
Cash at 1 July 110,313 112,584 85,264 81,205 67,378 70,346 75,086 86,184 96,802 107,007 119,742
Cash at 30 June 112,584 85,264 81,205 67,378 70,346 75,086 86,184 96,802 107,007 119,742 136,363

L O N G T E R M F I N A N C I A L P L A N
Page 26
Statement of Changes in Equity for period 2017/18 - 2026-27Base 1 2 3 4 5 6 7 8 9 10
Base Year Budget Forecast Forecast Forecast Forecast Forecast Forecast Forecast Forecast Forecast2016/17 2017/18 2018/19 2019/20 2020/21 2021/22 2022/23 2023/24 2024/25 2025/26 2026/27
$'000 $'000 $'000 $'000 $'000 $'000 $'000 $'000 $'000 $'000 $'000EQUITY
RETAINED SURPLUSBalance at 1 July 623,861 620,551 648,294 660,183 685,011 702,121 720,228 739,091 761,128 785,266 809,438 Transfer (from) / to Reserve (8,969) 21,192 1,365 11,758 65 (2,256) (7,387) (8,344) (6,889) (9,849) (12,404) Net Result 5,659 6,551 10,525 13,070 17,045 20,363 26,250 30,381 31,027 34,021 37,613 Balance at 30 June 620,551 648,294 660,183 685,011 702,121 720,228 739,091 761,128 785,266 809,438 834,647
CASH BACKED RESERVESBalance at 1 July 90,997 99,966 78,774 77,409 65,651 65,586 67,842 75,229 83,573 90,462 100,311 Transfer from / to Reserve 8,969 (21,192) (1,365) (11,758) (65) 2,256 7,387 8,344 6,889 9,849 12,404 Balance at 30 June 99,966 78,774 77,409 65,651 65,586 67,842 75,229 83,573 90,462 100,311 112,715
ASSET REVALUATION RESERVEBalance at 1 July 560,057 560,057 560,057 560,057 560,057 560,057 560,057 560,057 560,057 560,057 560,057 Total Other Comprehensive Income - - - - - - - - - - - Balance at 30 June 560,057 560,057 560,057 560,057 560,057 560,057 560,057 560,057 560,057 560,057 560,057
Total Equity 1,280,573 1,287,124 1,297,649 1,310,718 1,327,763 1,348,126 1,374,376 1,404,758 1,435,784 1,469,805 1,507,418

L O N G T E R M F I N A N C I A L P L A N
Page 27
Rate Setting Statement for period 2017/18 - 2026/27Base Year Budget Forecast Forecast Forecast Forecast Forecast Forecast Forecast Forecast Forecast2016/17 2017/18 2018/19 2019/20 2020/21 2021/22 2022/23 2023/24 2024/25 2025/26 2026/27
$'000 $'000 $'000 $'000 $'000 $'000 $'000 $'000 $'000 $'000 $'000
Proceeds from Operating ActivitiesOperating Revenues Excl Rates 107,964 107,741 107,883 108,815 111,974 116,235 120,823 125,720 130,840 136,068 141,526 Operating Expenses (193,457) (193,138) (199,167) (204,157) (209,871) (215,873) (222,133) (228,694) (235,471) (242,473) (249,707)
(85,494) (85,397) (91,284) (95,342) (97,897) (99,638) (101,310) (102,974) (104,631) (106,405) (108,181) Non Cash ItemsLoss on Disposal of Fixed Assets 932 1,664 2,425 2,486 2,548 2,612 2,677 2,744 2,813 2,883 2,955 Depreciation on Assets 33,050 33,534 35,211 36,972 38,821 40,762 42,800 44,940 47,187 49,546 52,023
33,982 35,198 37,636 39,458 41,369 43,374 45,477 47,684 50,000 52,429 54,978 Net Deficit from Operations (51,511) (50,199) (53,648) (55,884) (56,528) (56,264) (55,833) (55,290) (54,631) (53,976) (53,203)
Investing ActivitiesCapital Expenditure (35,234) (63,105) (66,347) (61,997) (53,038) (56,566) (62,017) (68,747) (72,039) (74,907) (76,753) Repayment of Borrowings (7,322) (7,173) (8,538) (6,674) (5,334) (4,986) (1,166) (1,213) (1,263) (1,314) (1,367) Transfers to Reserves (39,133) (22,478) (38,494) (31,634) (35,773) (34,715) (47,117) (50,784) (50,905) (55,311) (58,984)
(81,689) (92,756) (113,378) (100,305) (94,145) (96,267) (110,300) (120,744) (124,207) (131,532) (137,104)
Financing ActivitiesTransfer from Reserves 27,396 43,670 39,859 43,392 35,838 32,459 39,730 42,440 44,016 45,462 46,580 Proceeds from Disposal of Assets 1,333 158 1,354 1,388 1,423 1,459 1,495 1,532 1,570 1,609 1,649 Capital Grants and Contributions 2,075 1,295 1,324 1,357 1,391 1,426 1,462 1,498 1,536 1,574 1,613 Proceeds from Borrowings - - 20,000 - - - - - - - - Proceeds from TPRC 1,000 1,400 2,333 1,500 3,083 2,750 3,083 3,583 1,000 1,250 1,167
31,804 46,523 64,870 47,637 41,735 38,094 45,770 49,053 48,122 49,895 51,009
Net Deficit before Rates (101,397) (96,432) (102,157) (108,553) (108,938) (114,438) (120,362) (126,980) (130,716) (135,613) (139,299) Add Opening Funds 21,141 7,822 643 (3,362) (6,359) (4,829) (3,442) (789) 505 2,910 4,899 Net Deficit before Rates (80,256) (88,610) (101,514) (111,914) (115,297) (119,267) (123,804) (127,769) (130,212) (132,703) (134,400)
Rate Levies 88,078 89,253 98,152 105,555 110,468 115,825 123,015 128,274 133,122 137,602 143,014
Surplus/(Deficit) from Rates 7,822 643 (3,362) (6,359) (4,829) (3,442) (789) 505 2,910 4,899 8,614 8.9% 0.7% (3.4%) (6.0%) (4.4%) (3.0%) (0.6%) 0.4% 2.2% 3.6% 6.0%

L O N G T E R M F I N A N C I A L P L A N
Page 28
Cash Reserves for period 2017/18 - 2026/27Budget Forecast Forecast Forecast Forecast Forecast Forecast Forecast Forecast Forecast Forecast2016/17 2017/18 2018/19 2019/20 2020/21 2021/22 2022/23 2023/24 2024/25 2025/26 2026/27
$'000 $'000 $'000 $'000 $'000 $'000 $'000 $'000 $'000 $'000 $'000
CAPACITY BUILDING & SPECIFIC RESERVESOpening Balance 88,228 99,965 78,773 77,408 65,650 65,585 67,841 75,228 83,572 90,461 100,310 Transfer to Reserve 39,133 22,478 38,494 31,634 35,773 34,715 47,117 50,784 50,905 55,311 58,984 Transfer from Reserve (27,396) (43,670) (39,859) (43,392) (35,838) (32,459) (39,730) (42,440) (44,016) (45,462) (46,580) Balance 30 June 99,965 78,773 77,408 65,650 65,585 67,841 75,228 83,572 90,461 100,310 112,714
TOTAL RESERVESOpening Balance 88,228 99,965 78,773 77,408 65,650 65,585 67,841 75,228 83,572 90,461 100,310 Transfer to Reserve 39,133 22,478 38,494 31,634 35,773 34,715 47,117 50,784 50,905 55,311 58,984 Transfer from Reserve (27,396) (43,670) (39,859) (43,392) (35,838) (32,459) (39,730) (42,440) (44,016) (45,462) (46,580) Balance 30 June 99,965 78,773 77,408 65,650 65,585 67,841 75,228 83,572 90,461 100,310 112,714