2016 software sector outlook - rbc insight
TRANSCRIPT
EQU
ITY
RESE
ARC
H RBC Global Equity TeamClick here for contributing analysts' contactinformation
December 18, 2015
2016 Software Sector OutlookWe remain optimistic and biased towards next-gen software withmargin expansionStay long the SPAWNS in 2016: Although our software universe as a whole was effectively flat vs themarket in 2015, large-cap software was dominated by names such as PANW +53%, CRM +33%, ADBE+31%, NOW +29% and MSFT +21%. Similar to 2015, a core tenet in picking our favorite names is next-generation/disruptive software or names that have reinvented themselves coupled with improvingmargins. We don't see a change to that thesis in 2016 and expect the SPAWNS (Salesforce, Palo Alto,Adobe, Workday, ServiceNow, Mr. Softy (Microsoft) and Splunk) to outperform again.
Sector view expectations for 2016: (1) Stay long SaaS applications: We remain bullish on the group asa disruptor of legacy tech and are modeling 24% growth driven by CRM, HCM, Financials, vertical SaaSsolutions and analytics. Consolidation through M&A and increased IPO activity are likely to remain afocus. (2) Still optimistic on Security, but stay selective: We are modeling 12% growth, and excludingCHKP and SYMC are modeling a more bullish 25% growth. We expect 2016 to be another good year forsecurity, with a greater focus on consolidation and endpoint security as increased regulation could helpthe sector. (3) Legacy Infrastructure feels the pain of the hybrid/public cloud as we remain cautious:We are bearish towards the legacy names in the group and are modeling 2% growth as concerns lingeraround the negative impact of the hybrid/public cloud to infrastructure software. We remain positive/optimistic on next-gen infrastructure names.
Top themes for software in 2016: (1) Margins matter more: Stock performance has depended onpositive margin out-performance in addition to revenue growth. (2) 2016 could be a tipping point forstrategic M&A: A number of factors are converging that could make 2016 a significant year for strategicM&A in software. (3) All apps to the cloud: The progression of apps to the cloud continues, thoughnot all at the same pace. (4) Data as a differentiator: The most innovative cloud application playersare differentiating offerings through unique data insight. (5) Amazon moves to the app layer: Amazonhas moved from compute and storage to database and could start to attack the app layer. (6) Shiftingpriorities for cyber-security: 2016 could see more vendor consolidation at the high end and focus ondifferentiated best-of-breed solutions, especially endpoint-based solutions. (7) Shift to the cloud shouldcontinue to be deflationary to legacy infrastructure vendors: Next generation software should continueto pull spending from legacy infrastructure vendors that face deflationary trends. (8) Value emergesas the IoT market starts to materialize: This attractive, but nascent market has begun to materialize,which could create real value for software companies and investors. (9) Focus on the next-generationdisruptors: In addition to public cousins, there are a number of emerging private companies that couldhelp shape the tech landscape.
Favorite large cap names: (1) ADBE: Strong growth and conservative cost expectations, (2) CRM:Consistent execution, expanding margins and still a large TAM, (3) MSFT: A reinvigorated juggernaut -the pivot to growth coming (4) NOW: ERP for IT and so much more, (5) PANW: Next-gen security couldconsolidate spend, (6) SPLK: Could see a reversion in 2016 with accelerating results and (7) WDAY: 2016the year for financials take off, margin upside potential.
Favorite SMID cap names: (1) DWRE: A reasonable guide to FY/16 sets the stage for a good year, (2)ELLI: a 2H16 re-acceleration story, (3) HDP: Once in a decade data replatforming opportunity, (4) MIME:Attractive opportunity and below-peer valuation, (5) PFPT: Best in class Security-as-a-Service, (6) QLIK:Early success of Qlik Sense and easy comps, (7) SHOP: Multi-quarter inflection for fundamentals and (8)ZEN: Rapid growth, CFFO improvement and expanding product set.
Priced as of prior trading day's market close, EST (unless otherwise noted).All values in USD unless otherwise noted.
For Required Conflicts Disclosures, see Page 79.

Table of contents
2015 in Review: Software ..................................................................................................... 3
Software slightly outperforms S&P 500 in 2015 ........................................................................ 3
2015 much like last year for large-cap software ........................................................................ 5
Balanced returns for growth vs. value/GARP software .............................................................. 7
2015 was again a tougher year for smid-cap software .............................................................. 7
Largest outperformers for 2015 across all market caps .......................................................... 10
Largest underperformers for 2015 across all market caps ...................................................... 12
Mixed performance from the IPO class of 2015 ...................................................................... 13
2016 Software Spending Outlook ....................................................................................... 15
Stay long Software-as-a-Service (SaaS): expect 24% growth or better .................................... 15
Still optimistic on Security software, but stay selective: expect 25% plus growth excluding CHKP and SYMC ........................................................................................................................ 16
We remain more bearish on legacy Infrastructure and more optimistic/bullish on next-gen names: overall expect low-to-mid single digit growth ............................................................. 17
Top Themes in 2016: Software ........................................................................................... 18
1) Stock theme: margins matter .............................................................................................. 18
2) Could 2016 be a tipping point for strategic M&A? .............................................................. 23
3) Tech theme: All apps to the cloud ....................................................................................... 27
4) Tech theme: Data as a differentiator ................................................................................... 31
5) Tech theme: Amazon to the app layer ................................................................................. 36
6) Tech theme: Shifting priorities for cyber-security ............................................................... 42
7) Tech theme: Shift to the cloud should continue to be deflationary to legacy infrastructure vendors ..................................................................................................................................... 45
8) Tech theme: Value emerges as the IoT market starts to materialize .................................. 48
9) Tech theme: Focus on next-generation disruptors .............................................................. 53
Looking at 2017 estimates .................................................................................................. 58
Top Ideas for 2016 .............................................................................................................. 60
2016 Software Sector Outlook
December 18, 2015 2

2015 in Review: Software In a year where software was flat vs. the market, next-generation/disruptive names or those that reinvented themselves dominated Although our software universe as a whole was effectively flat vs the market in 2015, large-cap software was dominated by names such as PANW +53%, CRM +33%, ADBE +31%, NOW +29% and MSFT +21%. Similar to 2015, a core tenet in picking our favorite names is next-generation/disruptive software or names that have reinvented themselves coupled with improving margins. We don't see a change to that thesis in 2016 and expect the SPAWNS (Salesforce, Palo Alto, Adobe, Workday, ServiceNow, Mr. Softy (Microsoft) and Splunk) to outperform.
Software slightly outperforms S&P 500 in 2015
As of December 16, our coverage universe (+2.8%) outperformed the S&P 500 (+0.7%), but trailed the NASDAQ composite (+7.1%) on a market cap-weighted basis in 2015. Outperformance was more balanced across market cap in 2015 vs. 2014, when nine of 15 large-cap ($10B+) stocks were up more than 20%. In 2015, only six of 15 large-cap stocks were up more than 20% while seven of 31 small-to-midcap stocks were up more than 20%. In total, 11 of 15 large-cap stocks had positive returns while 15 of 31 small-to-midcap stocks had positive returns. In total, 20 of 46 stocks in our coverage universe outperformed the NASDAQ while 26 of 46 stocks outperformed the S&P 500.
In the mega-cap space, Microsoft and Oracle were up 24% and 18%, respectively, in 2014. In 2015, Microsoft was up 21% while Oracle was down 13%.
Elli Mae was the best-performing stock in our coverage universe, up 58% vs. +50% in 2014.
After Elli Mae, the best-performing stocks in our software coverage universe in 2015 were Palo Alto (+53%), Fleetmatics (+49%), Q2 Holdings (+47%) and Imperva (+39%). The worst-performing stock in our coverage universe in 2015 was Varonis (-48%), followed by Teradata (-37%), Interactive Intelligence (-33%), Verint (-29%) and NetSuite (-23%).
2016 Software Sector Outlook
December 18, 2015 3

Exhibit 1: Coverage universe vs. S&P 500 and NASDAQ, 2011-2015
2011 2012 2013 2014 2015 Market Cap ($M)
ELLI NA 391% -3% 50% 58% 1,904
PANW NA 1% 7% 113% 53% 16,087
FLTX NA 13% 72% -18% 49% 2,041
QTWO NA NA NA 24% 47% 1,070
IMPV 45% -9% 53% 3% 39% 2,153
LOGM -13% -42% 50% 47% 37% 1,692
PFPT NA -27% 169% 45% 36% 2,659
ULTI 34% 45% 62% -4% 36% 5,729
CRM -23% 66% 31% 7% 33% 52,383
ADBE -8% 33% 59% 21% 31% 47,665
NOW NA 22% 87% 21% 29% 13,816
CTXS -11% 8% -4% 1% 24% 12,440
MSFT -7% 3% 40% 24% 21% 448,361
NICE -1% -3% 22% 24% 16% 3,557
RHT -10% 28% 6% 23% 14% 14,399
SAP 5% 52% 8% -20% 13% 96,413
ANSS 10% 18% 29% -6% 12% 8,165
BNFT NA NA 8% -43% 11% 1,046
CHKP 14% -9% 35% 22% 10% 15,646
DATA NA NA 36% 23% 9% 6,739
INTU 7% 13% 28% 21% 7% 26,150
RP -18% -15% 8% -6% 7% 1,847
ZEN NA 0% 0% 81% 7% 2,315
NASDAQ -2% 16% 38% 13% 7%
FTNT 35% -4% -9% 60% 4% 5,508
ADSK -21% 17% 42% 19% 3% 13,954
SHOP NA NA NA NA 2% 1,985
S&P 500 0% 13% 30% 11% 1%
QLIK NA -10% 23% 16% 0% 2,884
WDAY NA 12% 53% -2% 0% 15,608
MIME NA NA NA NA -1% 541
CA -17% 9% 53% -10% -6% 11,917
PTC -19% 23% 57% 4% -6% 3,911
SPLK NA -18% 137% -14% -6% 7,188
QLYS NA 1% 56% 63% -7% 1,199
DWRE NA 16% 135% -10% -8% 1,998
ORCL -18% 30% 15% 18% -13% 165,937
BCOV NA -37% 56% -45% -14% 218
MKTO NA NA 60% -12% -20% 1,132
SYMC -7% 20% 25% 9% -20% 13,828
CVLT 49% 63% 7% -31% -22% 1,822
HDP NA NA NA NA -22% 978
LOCK NA -4% 102% 13% -23% 1,365
N 62% 66% 53% 6% -23% 6,716
VRNT -13% 7% 46% 36% -29% 2,577
ININ -12% 46% 101% -29% -33% 698
TDC 18% 28% -26% -4% -37% 3,665
VRNS NA NA NA -25% -48% 443
Source: FactSet, priced as of December 16, 2015
2016 Software Sector Outlook
December 18, 2015 4

2015 much like last year for large-cap software Large-cap software ($10B+ market cap) performance was much like last year across our coverage universe with essentially the same number of companies outperforming the S&P 500 and NASDAQ as in 2014. Of the 15 names under coverage with over $10B market cap, nine outperformed in 2015 and eight outperformed in 2014. This compares with seven names outperforming in the last three years and four in the last five years. With a few exceptions, 2015 was another good year to own mid-large cap software. Notable outperformers in 2015 included many of the top performers from the last three years: Palo Alto, Salesforce, Adobe and ServiceNow with increases of 53%, 33%, 21% and 29% in 2015 and 279%, 87%, 153% and 194% over the last three years, respectively. Adobe and Salesforce have also been the best performing large-cap stocks over the last five years at 210% and 139%, respectively. The worst performing large-cap stocks in 2015 included Symantec (-20%), Oracle (-13%) and CA (-6%) while over the last three years the worst performing large-cap stocks include SAP (-2%), Symantec (+5%) and Oracle (+13%). Over the last five years, the worst-performing stocks include Citrix (+16%), CA (+17%) and Symantec (+22%). The only large-cap stocks that have outperformed over the last one, three and five years are Adobe, Microsoft and Salesforce. The only large-cap stocks that have underperformed over the last one, three and five years are CA, Oracle and Symantec.
Exhibit 2: Large cap 2015, three-year and five-year stock performance
Large Cap Stocks (>$10B)
Ticker Price Market Cap ($M) 5-Year Return 3-Year Return 2015 Return
PANW $187 $16,087 NA 279% 53%
CRM $79 $52,383 139% 87% 33%
ADBE $96 $47,665 210% 153% 31%
NOW $87 $13,816 NA 194% 29%
CTXS $79 $12,440 16% 20% 24%
MSFT $56 $448,361 101% 106% 21%
RHT $79 $14,399 73% 46% 14%
SAP $78 $96,413 55% -2% 13%
CHKP $87 $15,646 87% 83% 10%
INTU $99 $26,150 101% 60% 7%
ADSK $62 $13,954 62% 70% 3%
WDAY $81 $15,608 NA 55% 0%
CA $29 $11,917 17% 26% -6%
ORCL $39 $165,937 24% 13% -13%
SYMC $20 $13,828 22% 5% -20%
S&P 500 2,073 65% 42% 1%
Nasdaq Composite 5,071 91% 64% 7% Source: FactSet, priced as of December 16, 2015
2016 Software Sector Outlook
December 18, 2015 5

Exhibit 3: Large cap stocks vs. S&P 500
Large Cap Stocks (>$10B) vs. S&P 500
Ticker Price Market Cap ($M) 5-Year 3-Year 2015
PANW $187 $16,087 NA 237% 52%
CRM $79 $52,383 74% 45% 32%
ADBE $96 $47,665 146% 111% 31%
NOW $87 $13,816 NA 152% 28%
CTXS $79 $12,440 -49% -22% 23%
MSFT $56 $448,361 36% 64% 20%
RHT $79 $14,399 8% 4% 13%
SAP $78 $96,413 -10% -45% 12%
CHKP $87 $15,646 22% 41% 9%
INTU $99 $26,150 36% 18% 7%
ADSK $62 $13,954 -3% 28% 2%
WDAY $81 $15,608 NA 13% -1%
CA $29 $11,917 -48% -16% -7%
ORCL $39 $165,937 -41% -29% -14%
SYMC $20 $13,828 -43% -37% -21%
Over/Under-Performance
Source: FactSet, priced as of December 16, 2015
Exhibit 4: Large cap stocks vs. NASDAQ
Large Cap Stocks (>$10B) vs. Nasdaq Composite
Ticker Price Market Cap ($M) 5-Year 3-Year 2015
PANW $187 $16,087 NA 216% 46%
CRM $79 $52,383 48% 23% 26%
ADBE $96 $47,665 119% 90% 24%
NOW $87 $13,816 NA 131% 22%
CTXS $79 $12,440 -75% -43% 17%
MSFT $56 $448,361 10% 42% 14%
RHT $79 $14,399 -19% -17% 7%
SAP $78 $96,413 -36% -66% 6%
CHKP $87 $15,646 -4% 20% 3%
INTU $99 $26,150 10% -3% 0%
ADSK $62 $13,954 -29% 7% -4%
WDAY $81 $15,608 NA -8% -7%
CA $29 $11,917 -74% -37% -13%
ORCL $39 $165,937 -67% -50% -21%
SYMC $20 $13,828 -69% -58% -27%
Over/Under-Performance
Source: FactSet, priced as of December 16, 2015
2016 Software Sector Outlook
December 18, 2015 6

Balanced returns for growth vs. value/GARP software Returns for growth vs. value/GARP software stocks were more balanced in 2015 following outperformance of value/GARP in 2014. In 2015, the total return for growth names was 8.1% while the total return for value/GARP names was also 6.6%. Of the 26 names that outperformed the S&P 500 in 2015, seven were value/GARP compared to eight in 2014. Growth names accounted for all five of the best-performing stocks (Ellie Mae, Palo Alto, Fleetmatics, Q2 Holdings and Imperva) and value/GARP names accounted for three of the five worst-performing stocks (Teradata, Interactive Intelligence and Verint). The best performing value/GARP name was Adobe while the worst performing growth name was Varonis.
Exhibit 5: Balanced growth and value returns in 2015
Growth vs. GARP/Value (2014)
-25.0%
-20.0%
-15.0%
-10.0%
-5.0%
0.0%
5.0%
10.0%
15.0%
20.0%
25.0%
Growth GARP/Value
Growth vs. GARP/Value (2015)
Growth includes: CRM, DATA, DWRE, N, NOW, WDAY, ULTI, QLIK, PFPT and RHT; GARP/Value includes: MSFT, ORCL, ADBE, ADSK, INTU, PTC, CA, and CHKP Source: FactSet, RBC Capital Markets, priced as of December 16, 2015
2015 was again a tougher year for smid-cap software Slightly fewer SMID cap software companies (under $10B market cap) in our coverage outperformed the S&P500 and NASDAQ in 2015 as in 2014. Of the 31 companies under coverage in this market cap range, 11 outperformed the major indexes vs. 14 last year while 18 underperformed. Compared to the three-year average, where only three companies had a negative return, 2015 again turned out to be a tougher year for smid-cap software with 15 companies having a negative return. The top-performing stocks in 2015 included Ellie Mae (+58%), Fleetmatics (+49%), Q2 Holdings (+47%), Imperva (+39%) and LogMeIn (+37%). Only Ellie Mae returned as one of the top-performing stocks (+56% in 2014). Security accounted for two of the six top-performing stocks compared to three in 2014, but with different companies: Imperva and Proofpoint in 2015 compared to Palo Alto (moved to large cap), Qualys (-7% vs. +68% in 2014) and Fortinet (+4% vs. +64% in 2014) in 2014. The only smid-cap company that outperformed over the last one, three and five years is Ultimate Software. The worst-performing stocks in 2015 included Netsuite (-23%), Verint (-29%), Interactive Intelligence (-33%), Teradata (-37%) and Varonis (-48%). The only smid-cap companies that underperformed over the last one, three and five years are CommVault, Interactive Intelligence, Teradata and Verint.
Returns for growth and value/GARP were more balanced in 2015 following outperformance of value/GARP in 2014.
2016 Software Sector Outlook
December 18, 2015 7
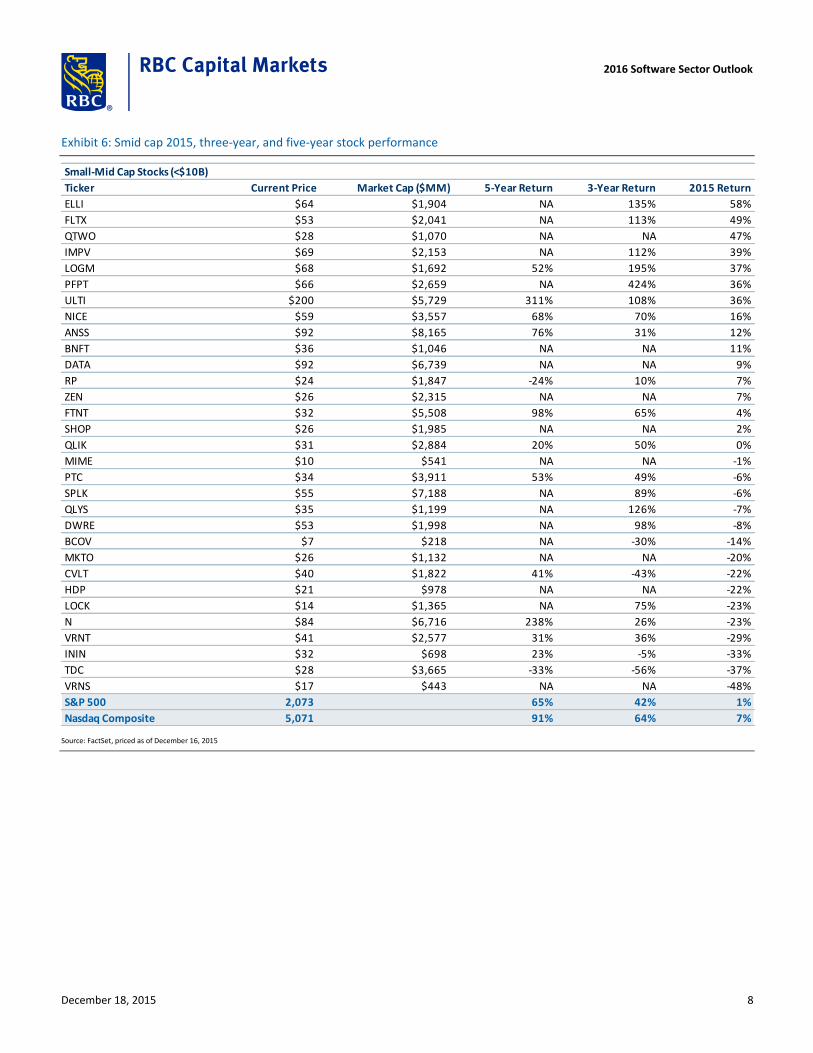
Exhibit 6: Smid cap 2015, three-year, and five-year stock performance
Small-Mid Cap Stocks (<$10B)
Ticker Current Price Market Cap ($MM) 5-Year Return 3-Year Return 2015 Return
ELLI $64 $1,904 NA 135% 58%
FLTX $53 $2,041 NA 113% 49%
QTWO $28 $1,070 NA NA 47%
IMPV $69 $2,153 NA 112% 39%
LOGM $68 $1,692 52% 195% 37%
PFPT $66 $2,659 NA 424% 36%
ULTI $200 $5,729 311% 108% 36%
NICE $59 $3,557 68% 70% 16%
ANSS $92 $8,165 76% 31% 12%
BNFT $36 $1,046 NA NA 11%
DATA $92 $6,739 NA NA 9%
RP $24 $1,847 -24% 10% 7%
ZEN $26 $2,315 NA NA 7%
FTNT $32 $5,508 98% 65% 4%
SHOP $26 $1,985 NA NA 2%
QLIK $31 $2,884 20% 50% 0%
MIME $10 $541 NA NA -1%
PTC $34 $3,911 53% 49% -6%
SPLK $55 $7,188 NA 89% -6%
QLYS $35 $1,199 NA 126% -7%
DWRE $53 $1,998 NA 98% -8%
BCOV $7 $218 NA -30% -14%
MKTO $26 $1,132 NA NA -20%
CVLT $40 $1,822 41% -43% -22%
HDP $21 $978 NA NA -22%
LOCK $14 $1,365 NA 75% -23%
N $84 $6,716 238% 26% -23%
VRNT $41 $2,577 31% 36% -29%
ININ $32 $698 23% -5% -33%
TDC $28 $3,665 -33% -56% -37%
VRNS $17 $443 NA NA -48%
S&P 500 2,073 65% 42% 1%
Nasdaq Composite 5,071 91% 64% 7%
Source: FactSet, priced as of December 16, 2015
2016 Software Sector Outlook
December 18, 2015 8

Exhibit 7: Smid cap stocks vs. S&P 500
Small-Mid Cap Stocks (<$10B) vs. S&P 500
Ticker Price Market Cap 5-Year 3-Year 2015
ELLI $64 $1,904 NA 93% 58%
FLTX $53 $2,041 NA 71% 48%
QTWO $28 $1,070 NA NA 46%
IMPV $69 $2,153 NA 70% 38%
LOGM $68 $1,692 -13% 152% 36%
PFPT $66 $2,659 NA 382% 36%
ULTI $200 $5,729 247% 66% 36%
NICE $59 $3,557 3% 28% 15%
ANSS $92 $8,165 11% -11% 11%
BNFT $36 $1,046 NA NA 10%
DATA $92 $6,739 NA NA 8%
RP $24 $1,847 -89% -32% 7%
ZEN $26 $2,315 NA NA 6%
FTNT $32 $5,508 33% 23% 4%
SHOP $26 $1,985 NA NA 1%
QLIK $31 $2,884 -45% 8% 0%
MIME $10 $541 NA NA -1%
PTC $34 $3,911 -12% 7% -7%
SPLK $55 $7,188 NA 47% -7%
QLYS $35 $1,199 NA 84% -8%
DWRE $53 $1,998 NA 56% -9%
BCOV $7 $218 NA -72% -15%
MKTO $26 $1,132 NA NA -21%
HDP $21 $978 NA NA -22%
CVLT $40 $1,822 -24% -85% -23%
LOCK $14 $1,365 NA 33% -23%
N $84 $6,716 173% -16% -23%
VRNT $41 $2,577 -34% -6% -30%
ININ $32 $698 -42% -47% -34%
TDC $28 $3,665 -98% -98% -38%
VRNS $17 $443 NA NA -48%
Over/Under-Performance
Source: FactSet, priced as of December 16, 2015
2016 Software Sector Outlook
December 18, 2015 9

Exhibit 8: SMid cap stocks vs. NASDAQ Composite
Small-Mid Cap Stocks (<$10B) vs. Nasdaq Composite
Ticker Price Market Cap 5-Year 3-Year 2015
ELLI $64 $1,904 NA 72% 51%
FLTX $53 $2,041 NA 50% 42%
QTWO $28 $1,070 NA NA 40%
IMPV $69 $2,153 NA 48% 32%
LOGM $68 $1,692 -39% 131% 30%
PFPT $66 $2,659 NA 360% 29%
ULTI $200 $5,729 220% 45% 29%
NICE $59 $3,557 -23% 6% 9%
ANSS $92 $8,165 -15% -32% 5%
BNFT $36 $1,046 NA NA 4%
DATA $92 $6,739 NA NA 2%
RP $24 $1,847 -115% -54% 0%
ZEN $26 $2,315 NA NA 0%
FTNT $32 $5,508 6% 2% -3%
SHOP $26 $1,985 NA NA -5%
QLIK $31 $2,884 -71% -14% -7%
MIME $10 $541 NA NA -8%
PTC $34 $3,911 -39% -14% -13%
SPLK $55 $7,188 NA 25% -13%
QLYS $35 $1,199 NA 63% -14%
DWRE $53 $1,998 NA 35% -15%
BCOV $7 $218 NA -94% -21%
MKTO $26 $1,132 NA NA -27%
CVLT $40 $1,822 -51% -106% -29%
HDP $21 $978 NA NA -29%
LOCK $14 $1,365 NA 12% -30%
N $84 $6,716 147% -38% -30%
VRNT $41 $2,577 -61% -28% -36%
ININ $32 $698 -68% -69% -40%
TDC $28 $3,665 -124% -119% -44%
VRNS $17 $443 NA NA -55%
Over/Under-Performance
Source: FactSet, priced as of December 16, 2015
Largest outperformers for 2015 across all market caps Ellie Mae (58%): Ellie Mae was the best performing stock in our coverage universe in 2015 and benefitted from strong fundamental outperformance. Consensus expectations for growth started the year at 26% and have since more than doubled, while expectations for EBIT margins have improved almost as much. This outperformance has come from a stronger mortgage market, as well as the company taking share and adding users faster than expected. Despite negative near-term mortgage origination volumes, we think growth expectations, valuation and the potential for growth surprises (especially in 2H16) leave the outlook biased to the upside.
Palo Alto (53%): The stock benefitted from another strong year in security and is well-positioned to continue its share gains, in our opinion. Billings and revenue accelerated Y/Y throughout the year, demonstrating the power of the hybrid-SaaS model while margins have consistently expanded Y/Y. Palo Alto's platform approach clearly is resonating with
2016 Software Sector Outlook
December 18, 2015 10

customers, as we feel the company is taking a disproportionate share of increased security spend while legacy providers and point solution vendors seem to be lagging behind.
Fleetmatics (49%): Fleetmatics rebounded following second-quarter guidance that was lowered due to FX and some conservatism around larger deals, to become the fourth best performing stock in our coverage universe. The company had an analyst day shortly following first-quarter results/second-quarter guidance that helped refocus investors on the long-term opportunity. From there the company continued to expand vehicles under subscription, made several acquisitions, entered new geographies and had success in mid-to-larger deals. The year was capped off with an OEM deal with GM, which was a positive surprise and while early, has been a focal point for investors to close the year.
Q2 Holdings (47%): Outperformance for the stock was driven largely by tier one deal signings, which should bode well for the future, as it will take several quarters for the deals to go live and the company to recognize revenue from them. Other positive events included the introduction of a new Treasury product and version 4.0 of the platform, the acquisition of Centrix, entry into the banking-rich northeastern part of the country and continued adoption of the platform by registered users.
Imperva (39%): Imperva reported strong results throughout 2015, outperforming the mid-point of revenue guidance by an average of $5.9 million. Similar to Palo Alto, what is even more impressive is expanding OM by 1,400 bps Y/Y to date. We feel this momentum should be sustainable as the company continues to take a disproportionate amount of the increased security spend as it displaces legacy providers such as IBM. The company is only 13% penetrated in the Fortune 1000 and has a long runway for expansion.
LogMeIn (37%): LogMeIn was again one of the top performing software names, up 36% in 2015 after being up 47% in 2014 and 50% in 2013. The stock really got moving following fourth-quarter and first-quarter results and followed through from there. The company executed consistently throughout the year, outperformed on leading metrics, steadily raised guidance and made a single-sign-on and password management acquisition. We remain impressed by an evolving strategy for relevance in collaboration, ITM and IoT, while join.me remains the overall growth driver. Cash flow remains strong while the stock continues to trade at a discount to peers.
Proofpoint (36%): Shares of Proofpoint benefitted from consistent quarterly outperformance through the year, a positive security backdrop and a competitive environment that continued to improve. We believe the threat landscape continues to move in the company’s favor, as we believe email/social should be a multiple-year opportunity with social more of a FY/16-to-FY/17 opportunity. TAP remains a robust opportunity and can double the ASP, as each of the 3,500+ customers could be a potential TAP customer. Most recently, McAfee announced it was going to end-of-life its email security suite, which should be a positive for Proofpoint and partially led management to guide to initial FY/16 revenue growth of 29-30%, which was above our initial expectations of 25%.
2016 Software Sector Outlook
December 18, 2015 11
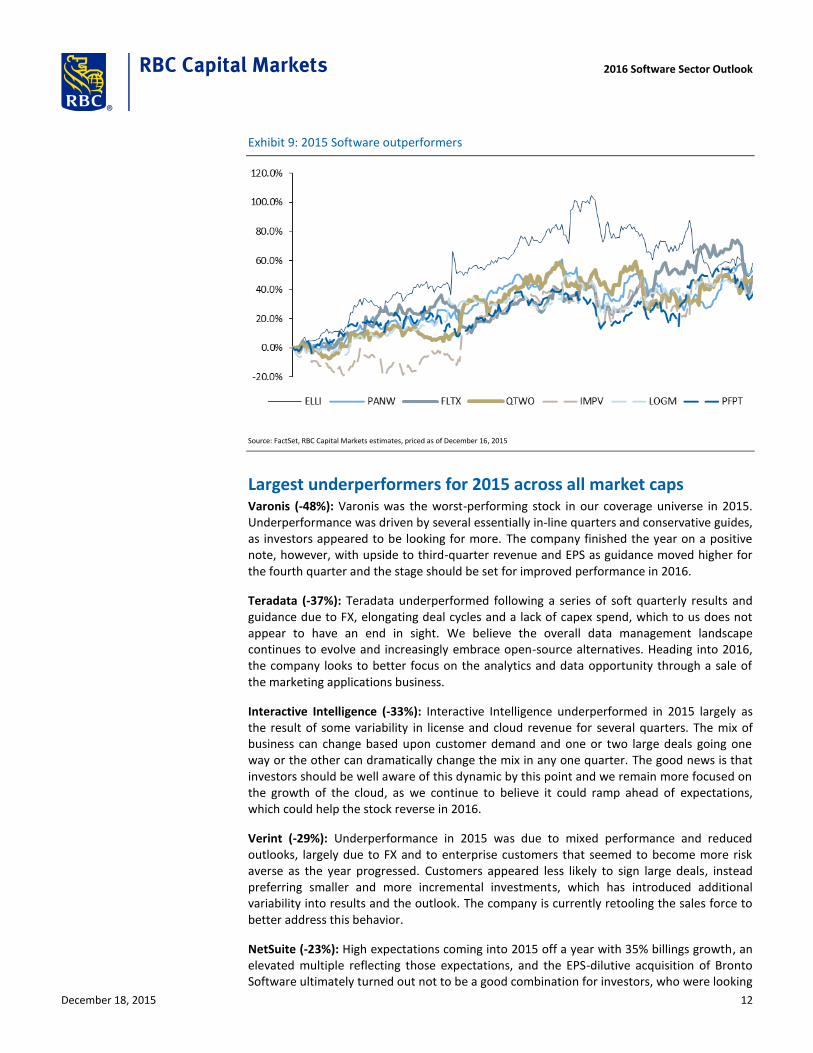
Exhibit 9: 2015 Software outperformers
Source: FactSet, RBC Capital Markets estimates, priced as of December 16, 2015
Largest underperformers for 2015 across all market caps Varonis (-48%): Varonis was the worst-performing stock in our coverage universe in 2015. Underperformance was driven by several essentially in-line quarters and conservative guides, as investors appeared to be looking for more. The company finished the year on a positive note, however, with upside to third-quarter revenue and EPS as guidance moved higher for the fourth quarter and the stage should be set for improved performance in 2016.
Teradata (-37%): Teradata underperformed following a series of soft quarterly results and guidance due to FX, elongating deal cycles and a lack of capex spend, which to us does not appear to have an end in sight. We believe the overall data management landscape continues to evolve and increasingly embrace open-source alternatives. Heading into 2016, the company looks to better focus on the analytics and data opportunity through a sale of the marketing applications business.
Interactive Intelligence (-33%): Interactive Intelligence underperformed in 2015 largely as the result of some variability in license and cloud revenue for several quarters. The mix of business can change based upon customer demand and one or two large deals going one way or the other can dramatically change the mix in any one quarter. The good news is that investors should be well aware of this dynamic by this point and we remain more focused on the growth of the cloud, as we continue to believe it could ramp ahead of expectations, which could help the stock reverse in 2016.
Verint (-29%): Underperformance in 2015 was due to mixed performance and reduced outlooks, largely due to FX and to enterprise customers that seemed to become more risk averse as the year progressed. Customers appeared less likely to sign large deals, instead preferring smaller and more incremental investments, which has introduced additional variability into results and the outlook. The company is currently retooling the sales force to better address this behavior.
NetSuite (-23%): High expectations coming into 2015 off a year with 35% billings growth, an elevated multiple reflecting those expectations, and the EPS-dilutive acquisition of Bronto Software ultimately turned out not to be a good combination for investors, who were looking
2016 Software Sector Outlook
December 18, 2015 12

for some operating leverage in the model. While the first two quarters were solid, cracks started to appear in Q3 as the Enterprise spending environment weakened. The company lowered annual guidance at the high end, a first for it since 3Q09, missed internal Enterprise expectations for Q3 due to volatility in ASPs, and declined to guide for 2016. We think the competitive environment needs to be watched, as others (including Oracle and Workday) begin to focus more on enterprise and upper-mid market Financials/ ERP.
Exhibit 10: 2015 Software Underperformers
Source: FactSet, RBC Capital Markets estimates, priced as of December 16, 2015
Mixed performance from the IPO class of 2015 We saw another full slate of issuance in 2015, with 12 software companies going public vs. 14 last year. IPO performance was mixed, with a couple of sizable outperformers, most notably Shopify, and also several stocks that were below issue price (Apigee, Box and Ooma).
Within our coverage universe, Shopify was up 54% from its pricing and Mimecast was flat from its pricing.
2016 Software Sector Outlook
December 18, 2015 13

Exhibit 11: 2015 IPOs and returns as of 12/16/15
Company Ticker Exchange IPO Date IPO Price Current Price Mkt Cap ($M) Return Since IPO
Box, Inc. BOX NYSE Jan-22-2015 14.00 $13.80 $1,595 -1%
Apigee Corporation APIC NASDAQ Apr-24-2015 17.00 $8.27 $238 -51%
Shopify, Inc. SHOP NYSE May-20-2015 17.00 $26.21 $2,238 54%
MINDBODY, Inc. MB NASDAQ Jun-24-2015 14.00 $15.04 $606 7%
Alarm.com Holdings, Inc. ALRM NASDAQ Jun-25-2015 14.00 $17.12 $761 22%
Xactly Corporation XTLY NYSE Jul-01-2015 8.00 $8.77 $267 10%
AppFolio, Inc. APPF NASDAQ Jun-25-2015 12.00 $15.41 $525 28%
Ooma, Inc. OOMA NYSE Jul-16-2015 13.00 $7.15 $119 -45%
Rapid7, Inc. RPD NASDAQ Jul-16-2015 16.00 $16.91 $637 6%
Instructure, Inc. INST NYSE Nov-12-2015 16.00 $19.98 $539 25%
Mimecast Limited MIME NASDAQ Nov-19-2015 10.00 $10.02 $576 0%
Atlassian Corporation Plc TEAM NASDAQ Dec-10-2015 21.00 $26.54 $5,529 26%
Unweighted Return: 7%
Weighted Return: 26%
Source: Company filings, FactSet
2016 Software Sector Outlook
December 18, 2015 14

2016 Software Spending Outlook Coming off a mixed year for software in 2015, we expect 2016 to remain more of a stock-picker’s market. Overall valuations have moved higher and tech spending continues to show signs of improvement. In the following sections, we analyze the forecasted revenue growth for various segments of software: SaaS, security and infrastructure. Company data is sorted by expected 2016 revenue growth.
Stay long Software-as-a-Service (SaaS): expect 24% growth or better For 2016, we are modeling 24.3% growth in actual SaaS dollar spending vs. 28.7% in 2015. From an absolute growth perspective (median growth expected across the 18 companies), we expect 24.0% for 2016 vs. 33.1% in 2015. In general, we expect incrementally more dollars to be allocated to CRM, social, HR, Human Capital Management (HCM), vertical SaaS solutions (health care, insurance, banking, wellness, etc.) and marketing automation software. In addition, we expect to see continued consolidation in the space, as many of the smaller vendors remain attractive acquisition candidates, in our opinion.
Exhibit 12: RBC SaaS spending forecast
2013A revenue
growth
2014A revenue
growth
2015E revenue
growth
2016E revenue
growth
SHOP 112.2% 108.7% 86.7% 56.6%
ZEN 88.5% 76.4% 62.2% 44.2%
NOW 74.2% 60.7% 46.8% 37.0%
WDAY 71.3% 68.1% 47.0% 35.2%
N 34.2% 34.1% 32.9% 31.4%
MKTO 64.2% 56.4% 39.3% 31.1%
QTWO 38.4% 39.1% 36.8% 30.3%
DWRE 34.1% 51.0% 46.0% 28.1%
BNFT 28.2% 31.1% 33.2% 24.9%
ULTI 23.5% 23.3% 21.7% 23.1%
CRM 33.5% 32.0% 23.7% 21.1%
FLTX 39.2% 30.6% 22.9% 20.7%
ELLI 26.2% 26.1% 54.3% 19.6%
LOGM 19.8% 33.5% 21.6% 19.3%
LOCK 33.7% 28.8% 23.0% 13.1%
ININ 34.1% 7.2% 14.0% 12.5%
RP 17.8% 6.6% 15.1% 11.8%
BCOV 24.9% 13.8% 6.8% 9.3%
Mean growth 44.3% 40.4% 35.2% 26.1%
Median growth 34.1% 32.8% 33.1% 24.0%
Mean dollar growth 36.1% 34.1% 28.7% 24.3%
Source: FactSet, RBC Capital Markets estimates
For 2016, we are modeling 24.3% growth in actual SaaS dollar spending vs. 28.7% in 2015.
2016 Software Sector Outlook
December 18, 2015 15

Still optimistic on Security software, but stay selective: expect 25% plus growth excluding CHKP and SYMC For 2016, we are modeling 11.5% growth in actual security software dollar spending vs. 7.0% in 2015 across the eight companies, though much of that is driven by larger firms, including CHKP and SYMC. Excluding CHKP and SYMC, we are modeling 25.1% in actual security software dollar spending vs. 32.9% in 2015 across the six companies, which we view as a better proxy for the potential in the more growth-oriented companies in the space. From an absolute growth perspective (median growth expected across the eight companies), we expect 23.9% for 2016 vs. 27.1% in 2015, though we expect an upward bias to estimates throughout the year. In general, we expect incrementally more dollars to be allocated to data security, Security-as-a-Service, advanced threat protection, passwords/authentication and endpoint security. In addition, we expect to see continued consolidation in the space, as many of the smaller vendors remain attractive acquisition candidates, in our opinion.
Exhibit 13: RBC security software spending forecast
2013A revenue
growth
2014A revenue
growth
2015E revenue
growth
2016E revenue
growth
PANW 49.2% 53.0% 53.4% 33.4%
PFPT 29.8% 41.8% 34.7% 29.3%
FTNT 15.3% 25.2% 31.2% 25.2%
IMPV 32.2% 19.1% 40.0% 25.0%
QLYS 18.1% 23.7% 23.0% 22.8%
MIME NA 33.5% 22.2% 19.2%
CHKP 3.8% 7.3% 9.1% 9.3%
SYMC NA -3.4% -10.4% -1.0%
Mean growth 24.7% 25.0% 25.4% 20.4%
Median growth 23.9% 24.5% 27.1% 23.9%
Mean dollar growth 186.9% 7.0% 7.0% 11.5%
Source: FactSet, RBC Capital Markets estimates
For 2016, we are modeling 11.5% growth in actual security software dollar spending vs. 7.0% in 2015, though much of that is driven by larger firms, including CHKP and SYMC. From an absolute growth perspective (median growth expected across the eight companies), we expect 23.9% for 2016.
2016 Software Sector Outlook
December 18, 2015 16

We remain more bearish on legacy Infrastructure and more optimistic/bullish on next-gen names: overall expect low-to-mid single digit growth For 2016, we are modeling 2.2% growth in actual infrastructure/application software dollar spending vs. -2.6% in 2015. From an absolute growth perspective (median growth expected across the 20 companies), we expect 6.4% for 2016 vs. 0.8% in 2015. Within the group, concerns linger around the impact of the hybrid cloud to classic infrastructure software (will be addressed further in the next section) as next-generation names thrive.
Exhibit 14: RBC infrastructure software and traditional applications spending forecast
2013A revenue
growth
2014A revenue
growth
2015E revenue
growth
2016E revenue
growth
HDP 670.9% 113.1% 131.3% 46.4%
DATA 82.0% 77.5% 57.7% 32.8%
SPLK 52.1% 49.0% 44.3% 30.7%
VRNS 39.7% 35.8% 23.6% 23.4%
ADBE -7.9% 2.3% 15.7% 19.4%
QLIK 21.1% 18.4% 11.4% 16.2%
RHT 16.0% 16.5% 14.3% 14.5%
ANSS 6.6% 9.3% 1.2% 7.2%
CVLT 20.4% 8.1% -5.5% 6.4%
NICE 6.5% -1.5% -1.2% 6.4%
SAP 14.3% 0.8% 16.8% 6.4%
INTU 7.2% 11.0% -1.7% 5.9%
VRNT 7.3% 27.3% 0.4% 5.3%
CA -2.8% -2.8% -7.1% 2.8%
CTXS 12.9% 7.7% 2.9% 0.9%
MSFT 14.4% 12.0% -8.1% 0.4%
ORCL 0.7% 3.3% -3.4% 0.2%
PTC 3.2% 4.6% -10.0% -2.0%
TDC 0.8% 1.5% -8.0% -3.2%
ADSK -1.7% 10.5% -1.1% -15.3%
Mean growth 48.2% 20.2% 13.7% 10.2%
Median growth 10.1% 9.6% 0.8% 6.4%
Mean dollar growth 9.2% 8.0% -2.6% 2.2%
Source: FactSet, RBC Capital Markets estimates
For 2016, we are modeling 2.2% growth in actual infrastructure software dollar spending vs. -2.6% in 2015. From an absolute growth perspective (median growth expected across the 20 companies), we expect 6.4% for 2016 vs. 0.8% in 2015.
2016 Software Sector Outlook
December 18, 2015 17
Top Themes in 2016: Software In this section, we highlight several themes we think will be most impactful for software in 2016. A number of these are consistent with what we have experienced over the last few years and center on the shift to the cloud, security, M&A and the importance of margin expansion, but we also call out several new themes.
Our software themes for 2016 include: margins matter; we could see a tipping point for strategic M&A; all apps to the cloud; data as a differentiator; Amazon to the apps layer; shifting priorities in cyber-security; a shift to the cloud should continue to be deflationary to legacy infrastructure vendors; value emerges as the IoT market starts to materialize; and a focus on next-generation disruptors.
These should all be important themes for 2016 so we provide a brief overview and details on which companies are affected by these trends.
1) Stock theme: margins matter The call is that positive stock performance has almost become as correlated to positive margin surprises as it has been to positive revenue growth surprises. This is very different from two years ago. We expect this to continue. Look for more of the same in 2016.
Our analysis of the drivers of software stock performance over the last three years reveals that the best-performing stocks are no longer driven just by positive revenue growth surprises, but also by positive operating margin surprises. We view this quality growth bias as increasingly important and use it as an important input into stock selection.
We think the quality growth bias is here to stay. In fact, we believe it will become more relevant in a rising interest rate environment where stocks that have more of their valuation tied up to profitability far off in the future (the terminal) could suffer due to increased discount rates.
As a result, our quality growth bias is focused on names with the potential to positively surprise on growth and operating margins. In this camp we would highlight NOW, PANW, IMPV, PFPT, DATA, LOGM, SHOP, ZEN, WDAY, CRM and ELLI.
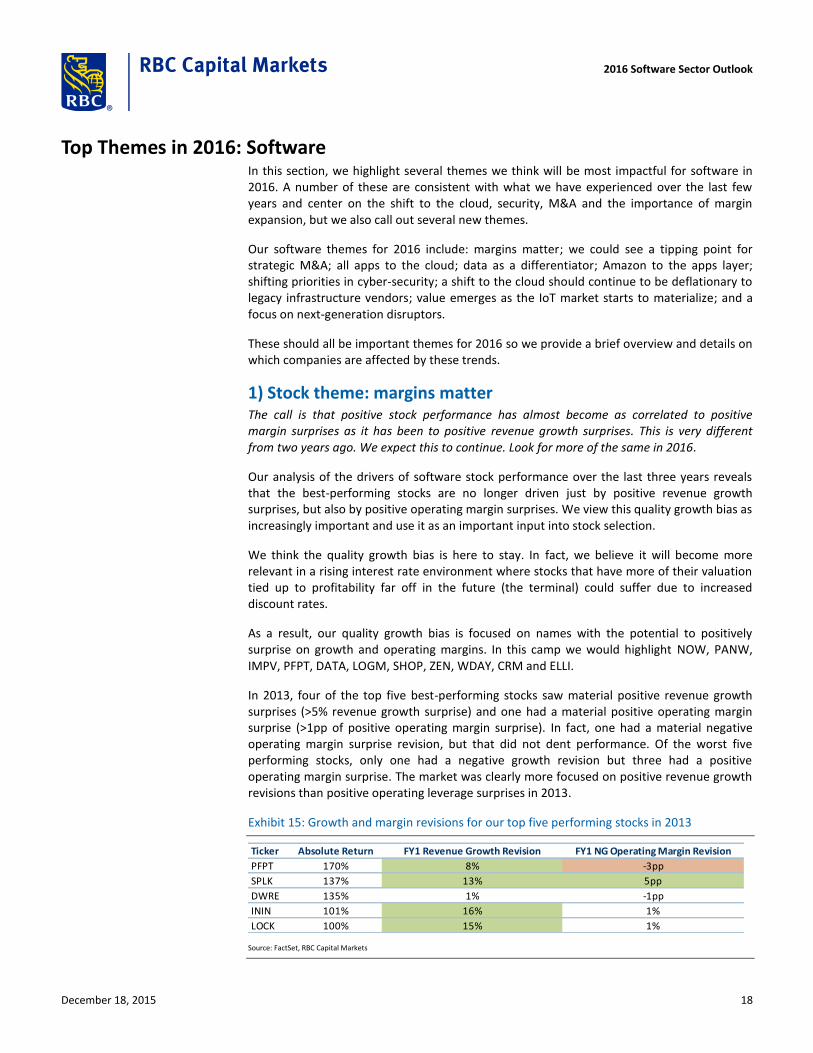
In 2013, four of the top five best-performing stocks saw material positive revenue growth surprises (>5% revenue growth surprise) and one had a material positive operating margin surprise (>1pp of positive operating margin surprise). In fact, one had a material negative operating margin surprise revision, but that did not dent performance. Of the worst five performing stocks, only one had a negative growth revision but three had a positive operating margin surprise. The market was clearly more focused on positive revenue growth revisions than positive operating leverage surprises in 2013.
Exhibit 15: Growth and margin revisions for our top five performing stocks in 2013
Ticker Absolute Return FY1 Revenue Growth Revision FY1 NG Operating Margin Revision
PFPT 170% 8% -3pp
SPLK 137% 13% 5pp
DWRE 135% 1% -1pp
ININ 101% 16% 1%
LOCK 100% 15% 1%
Source: FactSet, RBC Capital Markets
2016 Software Sector Outlook
December 18, 2015 18

Exhibit 16: Growth and margin revisions for our bottom five performing stocks in 2013
Ticker Absolute Return FY1 Revenue Growth Revision FY1 NG Operating Margin Revision
TDC -27% -11% 1pp
FTNT -9% -4% -2pp
CTXS -4% -1% 2pp
ELLI -3% 0% 3pp
RHT 6% -1% 3pp
Source: FactSet, RBC Capital Markets
In 2014, things started to change. Four of the top five best-performing stocks saw material positive growth revisions, but in addition, two of the top five saw material positive operating margin surprises. Even more telling is the fact that while three of the bottom five performing stocks had negative material revenue growth surprises, four of the bottom five had negative material operating margin surprises.
Exhibit 17: Growth and margin revisions for our top five performing stocks in 2014
Ticker Absolute Return FY1 Revenue Growth Revision FY1 NG Operating Margin Revision
PANW 113% 16% 1pp
QLYS 63% 4% 3pp
FTNT 60% 9% -5pp
ELLI 50% 6% 0pp
LOGM 47% 18% 3pp
Source: FactSet, RBC Capital Markets
Exhibit 18: Growth and margin revisions for our bottom five performing stocks in 2014
Ticker Absolute Return FY1 Revenue Growth Revision FY1 NG Operating Margin Revision
BCOV -45% -3% -5pp
BNFT -43% 4% -14pp
CVLT -31% -7% -3pp
ININ -29% -8% -8pp
SAP -20% -8% -1pp
Source: FactSet, RBC Capital Markets
In 2015 (YTD through December 16), four of the top five best performing stocks saw material positive revenue growth surprises and three of the top five saw material positive operating margin surprises. Not one of the top five stocks had a negative operating margin surprise, while two of the worst-performing stocks had negative revenue growth and operating margin surprises.
Exhibit 19: Growth and margin revisions for our top five performing stocks in 2015
Ticker Absolute Return FY1 Revenue Growth Revision FY1 NG Operating Margin Revision
ELLI 58% 29% 9pp
PANW 53% 19% 1pp
FLTX 49% -2% 0pp
QTWO 48% 7% 2pp
IMPV 39% 18% 7pp
Source: FactSet (priced as of December 16, 2015), RBC Capital Markets
2016 Software Sector Outlook
December 18, 2015 19

Exhibit 20: Growth and margin revisions for our bottom five performing stocks in 2015
Ticker Absolute Return FY1 Revenue Growth Revision FY1 NG Operating Margin Revision
VRNS -48% -4% 1pp
TDC -37% -12% -6pp
ININ -33% 3% 2pp
VRNT -29% -7% -1pp
N -23% 2% -3pp
Source: FactSet (priced as of December 16, 2015), RBC Capital Markets
Taking a broader view of the space, we see similar patterns emerge over the last three years. Revisions to 2013 growth expectations had a 59% correlation to 2013 returns, while margin revisions were essentially uncorrelated at (9%). This dipped to 43% for 2014 growth revisions and grew to 28% for margin revision. 2015 through December 16 has seen growth revisions 46% correlated to returns, while margin revisions are almost as high at 41% (excluding Hortonworks from both calculations).
Exhibit 21: Growth Revisions vs. Stock Outperformance in 2013 (59% Correlation)
NOW
ININLOCK
SPLK
FLTX
WDAY
PFPT
CRM
IMPV
CVLT
N
PANW
BCOV
DWRE
QLIK
ELLI
LOGMVRNT
RHT
ULTIQLYS
CTXS
ADBE
RP
MSFT
CA
CHKP
NICESYMC
FTNT
ANSS
ORCLSAP
ADSK
PTC
INTU
TDC
-100%
-50%
0%
50%
100%
150%
-15% -10% -5% 0% 5% 10% 15% 20%
Source: RBC Capital Markets, FactSet
2016 Software Sector Outlook
December 18, 2015 20

Exhibit 22: Margin Revisions vs. Stock Outperformance in 2013 (-9% correlation)
WDAY
FLTX
CVLT
BCOV
PANW
NOW
ULTI
SPLK
RP
PTC
ANSS
SAP
QLYS
CHKP
ELLI
RHT
NICEINTU
SYMCCRM
VRNT
CTXS
LOCKININ
TDC
LOGM
QLIK
ORCL
NCA
DWRE
FTNT
IMPV
PFPT
MSFT
ADBE
ADSK
-100%
-50%
0%
50%
100%
150%
-10% -5% 0% 5% 10% 15%
Source: RBC Capital Markets, FactSet
Exhibit 23: Growth Revisions vs. Stock Outperformance in 2015 (46% correlation)
Source: RBC Capital Markets, FactSet (priced as of December 16, 2015)
2016 Software Sector Outlook
December 18, 2015 21

Exhibit 24: Margin Revisions vs. Stock Outperformance in 2015 (41% correlation)
Source: RBC Capital Markets, FactSet (priced as of December 16, 2015).
Ways to play the theme Among our coverage universe, companies that we see as well-positioned to deliver upside on both growth and margin expectations include Ellie Mae, Hortonworks, Imperva, LogMeIn, Palo Alto Networks, Proofpoint, Salesforce, ServiceNow, Shopify, Tableau, Workday and Zendesk.
2016 Software Sector Outlook
December 18, 2015 22

2) Could 2016 be a tipping point for strategic M&A? The call is that we think a number of factors are converging that could make 2016 a significant year of strategic M&A in software – especially large cap SaaS and Security.
The transition of enterprise technology to the cloud is accelerating, creating a fundamental challenge for incumbent technology players that have sold to the corporate data center for the past 30 years.
There is a risk that cloud leaders are reaching escape velocity in terms of scale and pace of innovation that means the window of opportunity to catch up is closing.
The number of strategic assets that could make a difference is limited to a small number of SaaS/ PaaS companies that are growing rapidly and could accelerate the efforts of incumbents.
Some extraneous factors could also add a spark. In particular, we think the potential for tax relief on the repatriation of overseas cash driven by the outcome of the 2016 elections could be a factor in driving strategic M&A next year.
Time for strategic (rather than sponsor) M&A? The last 12-18 months has seen a dearth of strategic M&A but a relatively high volume of financial sponsor M&A. In fact, in 2015, $15B (58%) of the $26B of software M&A was done by private equity, a significantly higher amount than in 2014 when $8B (34%) of the $23B of software M&A was done by private equity.
We note that some of the largest financial sponsor acquisitions of the last year in software include Vista Partners’ acquisition of Solera Holdings for $6.5B, Silverlake’s/Thoma Bravo’s acquisition of SolarWinds (~$4.6B), Permira’s/CPP’s acquisition of Informatica (~$4.8B) and Bain Capital’s acquisition of Blue Coat Systems (~$2.4B). Raytheon’s purchase of Websense ($1.9B) and the firewall business (Secure Computing asset) of Intel/McAfee also highlights the potential for non-traditional acquirers for specific assets.
Meanwhile, the most prominent strategic M&A deal has probably been SS&C’s acquisition of Advent Software to further consolidate its position in portfolio accounting and fund administration.
In 2016, we think this could change with the potential for large, strategic deals.
The lack of growth ex cloud makes this an imperative We think the continued expansion of cloud-based applications, platforms and infrastructure is a significant driver of M&A in the software universe.
The first wave of SaaS applications M&A was driven by the need for incumbents to kick-start their cloud presence and compete more effectively around the edge of the application core. Examples include Oracle’s purchases of RightNow, Taleo, Eloqua and Responsys; SAP’s purchases of SuccessFactors and Ariba and IBM’s purchases of DemandTec and Kenexa.
The question we ask ourselves today is whether we could see a second wave of SaaS applications M&A, driven by the need for incumbents to increase their cloud scale, make them more relevant in the cloud discussion and potentially elevate their chances of attracting future cloud workloads.
We think it is important to reflect that public SaaS revenue will be over $25B in 2015 (including SaaS revenues at SAP and Oracle) or about 17% of the total software application market. By 2018, we believe this could be ~$50B and in the range of 35% of the total software application market. Given that the software application market will grow at about
The accelerating shift to cloud and the need for incumbents to catch up fast could drive strategic M&A that has been absent over the last 12 months
2016 Software Sector Outlook
December 18, 2015 23
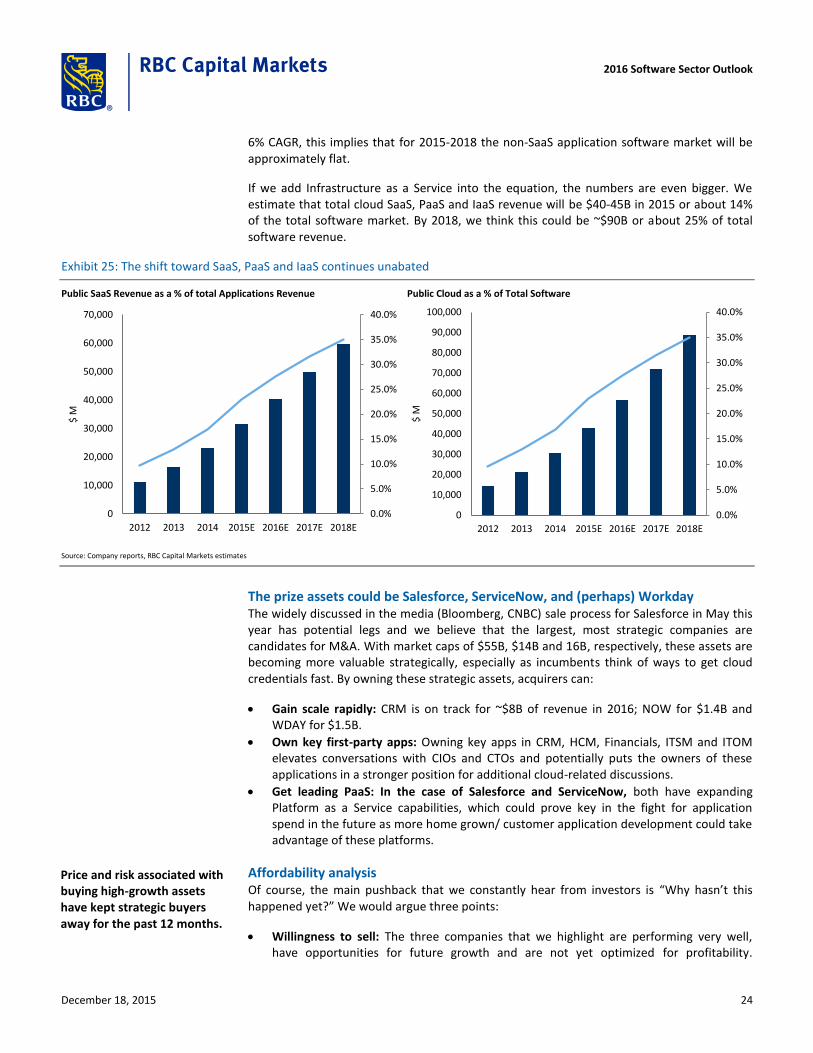
6% CAGR, this implies that for 2015-2018 the non-SaaS application software market will be approximately flat.
If we add Infrastructure as a Service into the equation, the numbers are even bigger. We estimate that total cloud SaaS, PaaS and IaaS revenue will be $40-45B in 2015 or about 14% of the total software market. By 2018, we think this could be ~$90B or about 25% of total software revenue.
Exhibit 25: The shift toward SaaS, PaaS and IaaS continues unabated
Public SaaS Revenue as a % of total Applications Revenue
0.0%
5.0%
10.0%
15.0%
20.0%
25.0%
30.0%
35.0%
40.0%
0
10,000
20,000
30,000
40,000
50,000
60,000
70,000
2012 2013 2014 2015E 2016E 2017E 2018E
$ M
Public Cloud as a % of Total Software
0.0%
5.0%
10.0%
15.0%
20.0%
25.0%
30.0%
35.0%
40.0%
0
10,000
20,000
30,000
40,000
50,000
60,000
70,000
80,000
90,000
100,000
2012 2013 2014 2015E 2016E 2017E 2018E
$ M
Source: Company reports, RBC Capital Markets estimates
The prize assets could be Salesforce, ServiceNow, and (perhaps) Workday The widely discussed in the media (Bloomberg, CNBC) sale process for Salesforce in May this year has potential legs and we believe that the largest, most strategic companies are candidates for M&A. With market caps of $55B, $14B and 16B, respectively, these assets are becoming more valuable strategically, especially as incumbents think of ways to get cloud credentials fast. By owning these strategic assets, acquirers can:
Gain scale rapidly: CRM is on track for ~$8B of revenue in 2016; NOW for $1.4B and WDAY for $1.5B.
Own key first-party apps: Owning key apps in CRM, HCM, Financials, ITSM and ITOM elevates conversations with CIOs and CTOs and potentially puts the owners of these applications in a stronger position for additional cloud-related discussions.
Get leading PaaS: In the case of Salesforce and ServiceNow, both have expanding Platform as a Service capabilities, which could prove key in the fight for application spend in the future as more home grown/ customer application development could take advantage of these platforms.
Affordability analysis Of course, the main pushback that we constantly hear from investors is “Why hasn’t this happened yet?” We would argue three points:
Willingness to sell: The three companies that we highlight are performing very well, have opportunities for future growth and are not yet optimized for profitability.
Price and risk associated with buying high-growth assets have kept strategic buyers away for the past 12 months.
2016 Software Sector Outlook
December 18, 2015 24

Therefore, management and the board have less incentive to sell, unless a very significant premium can be realized.
Price: Salesforce and Microsoft unconfirmed discussions from 2015 are reported to have stalled due to a disagreement on price. We note that relative to current valuations, a 30% premium would put the three assets significantly above the median multiple of historical M&A deals (CRM currently trades at ~7x FY16 EV/Sales, while NOW and WDAY are at ~11x).
Risk: Acquisition of these assets would carry significant risk. First, an acquisition of Salesforce has the potential to be the largest technology acquisition of all time. Second, all of these companies have the classic founder/ owner deep involvement, which is notoriously difficult to maintain when no longer independent (Marc Benioff at Salesforce, Frank Luddy at ServiceNow and Dave Duffield/ Aneel Bhusri at Workday). Third, these companies have significant equity compensation incentives, which may be hard to replicate when no longer independent. Finally, the operational and execution risk surrounding buying growth assets is relatively high.
Affordability isn’t much of a gating factor: With large cash balances, we run illustrative affordability analyses to demonstrate that the potential universe of buyers remains robust. We haircut acquirers’ offshore cash balances by 35% where applicable to account for tax repatriation issues, and assume that strategic buyers could lever up to 3.0x Net Debt/2016 EBITDA to fund their purchases. The result is that Salesforce has a limited set of potential suitors (we think AAPL, GOOG and MSFT), but ServiceNow and Workday have a much wider set of potential suitors.
Exhibit 26: Illustrative affordability analysis
($ in M)
Potential Adj.
Acquirer Market Cap Net Debt EV EBITDA 2.0x Net Debt 3.0x Net Debt 4.0x Net Debt 2.0x Net Debt 3.0x Net Debt 4.0x Net Debt
2015E 2016E 2015E 2016E / '15 EBITDA /'15 EBITDA /'15 EBITDA / '15 EBITDA /'15 EBITDA /'15 EBITDA
Amazon $321,667 ($4,575) $317,092 $10,805 $14,218 -0.4x -0.3x $21,610 $32,416 $43,221 $26,185 $36,991 $47,796
Google 526,356 (52,836) 473,520 29,607 34,813 -1.8x -1.5x 59,214 88,821 118,428 112,050 141,657 171,264
IBM 136,365 30,092 166,457 21,333 21,551 1.4x 1.4x 42,667 64,000 85,334 12,575 33,908 55,242
HP Enterprise 26,872 4,345 31,217 7,962 7,983 0.5x 0.5x 15,925 23,887 31,850 11,580 19,542 27,505
Microsoft 453,773 (27,188) 426,585 32,235 32,648 -0.8x -0.8x 64,471 96,706 128,941 91,659 123,894 156,129
Apple 621,144 (75,784) 545,360 82,487 82,850 -0.9x -0.9x 164,974 247,461 329,948 240,758 323,245 405,732
Oracle 175,174 1,800 176,974 17,556 18,104 0.1x 0.1x 35,113 52,669 70,225 33,313 50,869 68,425
Cisco 138,408 (15,551) 122,857 16,218 16,423 -1.0x -0.9x 32,436 48,654 64,872 47,987 64,205 80,423
SAP 95,786 6,538 102,325 7,621 8,332 0.9x 0.8x 15,243 22,864 30,486 8,705 16,326 23,947
Debt Capacity at Capacity to purchase
Adj. Net Debt / EBITDA
Potential Target Market Cap 30% Premium Net Debt Adj. EV AMZN GOOG IBM HPE MSFT AAPL ORCL CSCO SAP
CRM salesforce.com, inc. $54,633 $71,022 ($269) $70,753 No Yes No No Yes Yes No No No
NOW ServiceNow, Inc. $14,730 $19,149 ($663) $18,486 Yes Yes Yes Yes Yes Yes Yes Yes No
WDAY Workday, Inc. Class A $17,494 $22,743 ($1,388) $21,354 Yes Yes Yes No Yes Yes Yes Yes No
Source: FactSet, Company reports and RBC Capital Markets estimates
2016 Software Sector Outlook
December 18, 2015 25

Some historical context Looking at large public-technology deals between 2001 and today, we screened over 150 transactions. In this universe, the smallest was the acquisition of Cytiva by Taleo for $8.7 million in early 2011 and the largest was the acquisition of VERITAS by Symantec for $13.0 billion in 2004. From an EV/S multiple, the mean of these transactions was 4.4x, the median was 3.5x, the high was 15.7x (HP’s 2011 acquisition of Autonomy), and the low was 0.5x (Oracle’s 2009 acquisition of Sun Microsystems). Exhibit 27 illustrates the multiples of the various transactions from 2001 to today, including the median and mean.
Exhibit 27: EV/S multiples for large, public, technology transactions 2001-2015
0.0x
2.5x
5.0x
7.5x
10.0x
12.5x
15.0x
Mean 4.4xMedian 3.5x
Source: FactSet, Company reports, RBC Capital Markets estimates
Exhibit 28: EV/S mean and median multiples for large public software transactions 2001-2015
Source: FactSet, RBC Capital Markets estimates
2016 Software Sector Outlook
December 18, 2015 26

3) Tech theme: All apps to the cloud The simple call is the progression of applications to the cloud continues. 2016 could be the tipping point for Financial Management, with WDAY the best way to play the theme.
However, it is clear that some application categories have moved faster than others. For example, when comparing Customer Relationship Management (CRM) to Enterprise Resource Planning (ERP), we can see that the former is already 50% in the cloud today given Salesforce’s dominance of the market, while ERP remains less than 20% converted to the cloud, with most of that shift being Human Capital Management (HCM) rather than Financial Management or others parts of the core backbone.
Exhibit 29: CRM is ~50% in the cloud, but ERP is less than 20% in the cloud
0%
10%
20%
30%
40%
50%
60%
70%
0
5,000
10,000
15,000
20,000
25,000
30,000
2013 2014 2015E 2016E 2017E 2018E 2019E
CRM ERP CRM ERP
Source: Gartner (Forecast: Public Cloud Services, Worldwide, 2013-2019, 3Q15 Update), RBC Capital Markets estimates
We think the shift of different application categories to the cloud is a function of one or more vendors forcing the agenda (Salesforce in the case of CRM), the state of the existing application environment (arguably the CRM market was littered with under-utilized CRM applications before Salesforce), and the pace of innovation and change in the underlying market. Recruiting applications in HCM, for example, have been largely replaced by next-generation versions that have tight integration to social networks such as Linkedin, as this is the way most recruiters now source candidates.
It is also interesting to note that two of the leading cloud SaaS vendors today, Salesforce and Netsuite, have had a very different path of growth. While there are many different reasons as to why Salesforce has >$6.5B of revenue today versus Netsuite’s <$1B, we fundamentally believe that the pace at which their respective end markets have adopted (Financial Management for Netsuite and Customer Relationship Management for Salesforce) has been an important input into this equation. In fact, overlaying the historical annual revenues of Salesforce against Netsuite, it is apparent that Financials adoption has lagged CRM adoption by an almost perfect factor of 10.
Salesforce and Netsuite were founded around the same time, but their respective markets have adopted at very different paces
2016 Software Sector Outlook
December 18, 2015 27

Exhibit 30: Salesforce vs. Netsuite tells the story of cloud adoption of CRM vs. financials
0
1,000
2,000
3,000
4,000
5,000
6,000
20
03
20
04
20
05
20
06
20
07
20
08
20
09
20
10
20
11
20
12
20
13
20
14CRM Revenues N Revenues
0
1,000
2,000
3,000
4,000
5,000
6,000
20
03
20
04
20
05
20
06
20
07
20
08
20
09
20
10
20
11
20
12
20
13
20
14
CRM Revenues (N x 10) Revenues
Source: Company reports
Could 2016 be the year for financials to the cloud? We think a number of factors are in place that suggest 2016 could be a tipping point for financials moving to the cloud:
Functionality and scalability of cloud products continues to improve. We note that Workday is able to address companies with up to 200M annual journal lines (low end of F250) and continue to add functionality (such as professional service automation, internal inventory and financial planning).
More large companies are accepting that financials can move to the cloud. In 2015, we would highlight a number of wins, including HP’s deployment of Netsuite for its entire software division (15 counties and >$5B of revenue), and more recently, AON’s decision to move to Workday for Financial Management (AON is a F500 company with ~$12B in revenue, operations in over 60 counties and ~65K employees)
Incumbent vendors are stepping up their cloud game. Despite the risk of increased competition, we think the fact that Oracle is in the market selling Fusion ERP Cloud (Oracle claims more than 1,350 on Fusion ERP) and SAP with its Simple Finance for S4HANA solution, is actually an important catalyst for new cloud vendors.
Existing cloud applications are aging fast: We note that most existing applications continue to move through key support sunset dates, which usually triggers a customer need to look at upgrades and/or alternatives in the market. For example, Oracle Fusion Financials release in 2011 will see an end of Premier Support in 2016; Similarly Oracle Financials 12.1 released in 2009 will see an end of Premier Support in 2016.
Ways to play the theme Workday: Our recent meetings with management suggest the company remains confident in the Financial Management pipeline, product functionality, scalability and go to market. The pace of adoption appears to be the primary debate, but we think like CRM (50% cloud today) and HCM (35% cloud) before it, the shift of FM (15% cloud) is inevitable. The pace of adoption has actually accelerated, with signed customer count growing 40% in FY14, and 50% in FY16 through only three quarters. In addition, Workday continues to add ever larger customers, e.g., Unum (~20K employees) was the largest customer added in 2014 and AON (~65K employees).
2016 Software Sector Outlook
December 18, 2015 28

Exhibit 31: Workday’s financials customers are growing rapidly
0
20
40
60
80
100
120
140
160
180
200
FY13 FY14 FY15 FY16E
Financials Customers Live Financials Customers
Source: Company reports, RBC Capital Markets estimates
Other key business processes are being rapidly moved to the cloud While the largest core enterprise functions (CRM, HCM and ERP) are dominated by the key public players, other non-core processes that have long been the domain of in-house custom software, spreadsheets, or legacy ERP programs with limited functionality, are being attacked by fast-growing privates. We note the following areas:
Order to cash: Receiving and processing both B2B and B2C customer sales typically is categorized into different sub-processes such as Contracting, Pricing, Quoting (CPQ) and Revenue Management (especially in today’s increasingly subscription-focused economy). While these functions exist in the world of Enterprise Resource Planning (ERP), there are a number of emerging companies in this market. Zuora started as a subscription revenue management vendor; the company has evolved into a broader solution provider encompassing configure/ price/ quote, e-commerce and subscription revenue management. The company has an extensive customer list, which includes Dell, NCR, Informatica, Zendesk, Box and Tata Communications.
Spend management: Spend management encompasses the processes associated with direct and indirect spend by a company, including procurement, invoicing, travel and expense, sourcing, inventory management and contract management. SAP is the global leader in this market, given its strong position in core ERP and the acquisition of the market leaders in procurement (Ariba) and Travel and Expense (Concur). Other large competitors include Oracle (iProcurement) and IBM (Emptoris). However, we think there are companies to watch in this space that are addressing the market with easy to use cloud solutions that appear to be taking share.
Manufacturing: Long the domain of major ERP companies (SAP at the high end, Epicor and Infor in the mid-market), we are seeing a number of cloud first manufacturing process ERP companies emerge. Plex Systems, for example, provides cloud-based ERP exclusively focused on manufacturing. Its suite includes manufacturing execution systems, quality management systems, manufacturing specific customer relationship management, supply chain management and advanced planning and scheduling.
2016 Software Sector Outlook
December 18, 2015 29

Exhibit 32: Plex and its partner ecosystem
Source: Company reports
Vertical industry cloud software continues to create winners We have seen vertical-specific champions play for the winner-take-most nature of application software. Ellie Mae (ELLI) in mortgage compliance, quality and efficiency; Veeva Systems (VEEV) for life sciences; Fleetmatics (FLTX) for fleet management and vehicle tracking; and Q2 eBanking (QWTO) for online banking are just some of the public names that come to mind.
While the pace of adoption has differed, we note that once a vendor has achieved critical market share, it can usually outspend direct competitors and drive innovation that furthers its leading competitive position. In addition, we think by selling into discrete markets, vertical industry solution vendors can focus their sales spending more directly on a smaller set of customers and channels. This usually leads to achieving profitability earlier, which is evident across many of these names.
2016 Software Sector Outlook
December 18, 2015 30

4) Tech theme: Data as a differentiator The call is that the most innovative cloud application players are trying to differentiate their offerings through unique data insights – e.g., WDAY, CRM, ZEN, DWRE. This could be an important driver over time.
Cloud applications (SaaS) began in the 1990s with the formation of companies such as Salesforce and Netsuite, which brought the principles of the consumer internet to business applications. However, 15 years later it is hard to call the SaaS model a meaningful differentiator given that most applications that have been built since the early 2000s are SaaS and even incumbent vendors such as SAP and Oracle have acquired SaaS applications and (in the case of Oracle at least) tried to refactor their existing applications for the cloud.
Of course, the devil is in the details, and true cloud applications (multi-tenancy, single code base, high frequency of innovation) are quite a different beast from hosted applications (where instances are spun up on VMs) with the key determiner usually being gross margin profile (lower for hosted) and pace of innovation (slower for hosted).
However, we think true cloud applications have a durable competitive advantage based on the data that can be collected, analyzed and measured across users on the platform:
The use of the application is completely transparent to the application vendor. This has material advantages for the vendor, such as being able to tell when customers are at risk of leaving the platform (low usage) or which features development should focus on (those being used most often). This transparency was never available in the on-premise application world.
Aggregate data has significant value. Another advantage for cloud application vendors is the view on aggregate data across their customer base. While vendors don’t own their customers’ data, they still glean significant insights from it. This could be relatively simple (e.g., peak transaction times across a certain application) through to more sophisticated data (best practices that can be provided to other customers on the platform based on their characteristics).
Data network effects: In the cloud application world, there is greater opportunity to leverage networks from the data/ content. A simple example is Adobe’s use of the Behance Creative network alongside its creative tools. Creative professionals can post their portfolios of work on the network, which in turn can be seen by companies and agencies. This has driven new hiring and job features on the platform and so in some ways Behance has become a creative industry specific Linkedin tool used by professionals and recruiters alike.
Ways to play the theme Workday: We think Workday has always had a very strong focus on using data as a differentiator for its products and services. The Workday product is architected on an object-based, in-memory store, which is optimized for both transactions and analytic queries to run off the same data set at the same time. This provides the customer with real-time views of the business and negates the need for after the fact reports and analytics that are common amongst today’s enterprise applications.
Aneel Bhusri, co-CEO and founder of Workday, has made comments about how if the current generation of business applications were defined by cloud delivery, the next generation will be defined by their ability to leverage data for predictive means. Workday is therefore beginning to leverage data in a more significant way to differentiate its products. In late 2014, Workday announced Insight Applications (following the acquisitions of Identified and
Metadata can be used to both enhance existing features and drive additional revenue streams.
2016 Software Sector Outlook
December 18, 2015 31

Upshot earlier in the year), a new suite of applications for finance and human resources that harness the power of advanced data science and machine learning to equip customers to make better decisions. These applications are aimed at:
Predicting future outcomes: By pushing historic data from inside the Workday application and preconfigured third-party data through a machine learning algorithm, the company hopes to provide predictive insights for specific business scenarios.
Triggers and alerts: This same analysis can be run in the background of the application, such that triggers and alerts can be set, when the algorithm suggests a change in action to deliver against an outcome.
A new intelligent information engine: Workday SYMAN takes advantage of the latest technologies in data science and machine learning to map, classify and normalize definitions across multiple sources of data.
In 2015, Workday delivered Workday Talent Insights, the first insights application that predicts which employees are at risk of leaving based on historical data, job posting data and other third-party data. We expect further insight applications to be made available, especially in financial management as the company invests in planning functionality.
2016 Software Sector Outlook
December 18, 2015 32

Exhibit 33: Workday Talent Insights, which highlights retention risk
Source: Company reports
Salesforce: Salesforce has been increasing its focus on data across its platform in the last couple of years. First, the company launched Wave analytics in late 2014, a new cloud and mobile first business intelligence product. Second, the company has started to leverage assets from prior acquisitions into its sales cloud assets, such as Pardot for lead scoring and optimization in a B2B selling process. Finally, the company has made direct investments into analytics functional, including the acquisition of RelateIQ, to build new functionality into its core offering.
2016 Software Sector Outlook
December 18, 2015 33
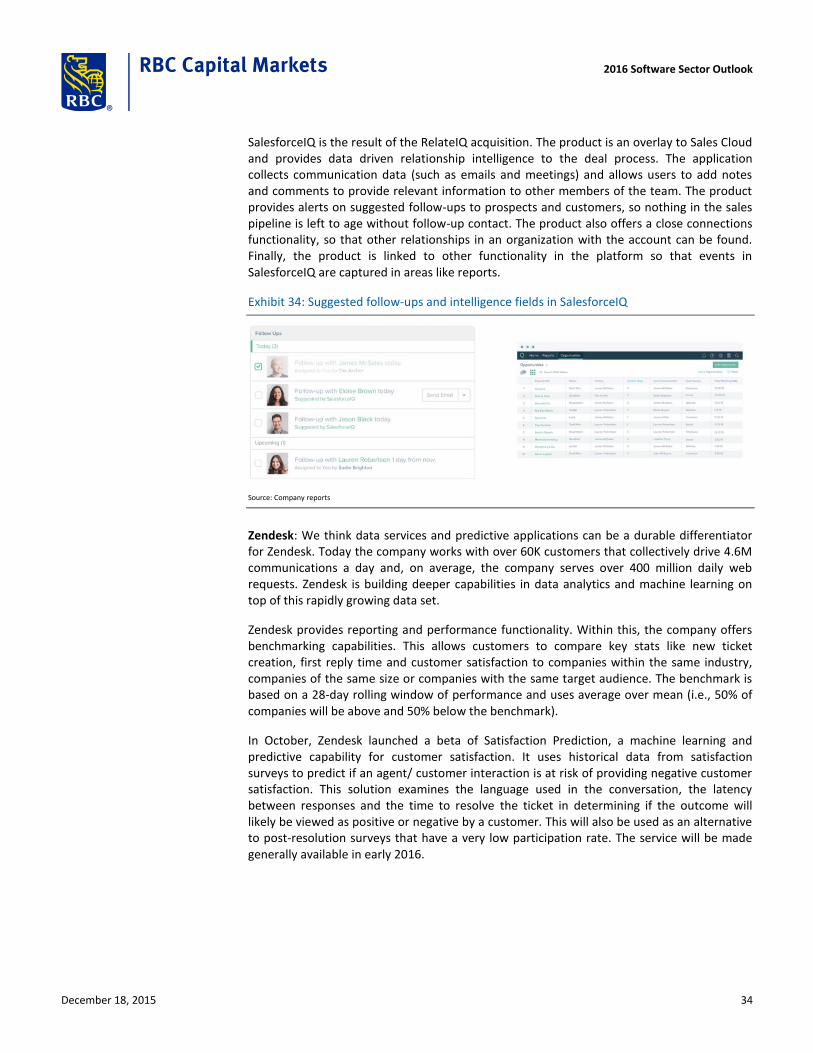
SalesforceIQ is the result of the RelateIQ acquisition. The product is an overlay to Sales Cloud and provides data driven relationship intelligence to the deal process. The application collects communication data (such as emails and meetings) and allows users to add notes and comments to provide relevant information to other members of the team. The product provides alerts on suggested follow-ups to prospects and customers, so nothing in the sales pipeline is left to age without follow-up contact. The product also offers a close connections functionality, so that other relationships in an organization with the account can be found. Finally, the product is linked to other functionality in the platform so that events in SalesforceIQ are captured in areas like reports.
Exhibit 34: Suggested follow-ups and intelligence fields in SalesforceIQ
Source: Company reports
Zendesk: We think data services and predictive applications can be a durable differentiator for Zendesk. Today the company works with over 60K customers that collectively drive 4.6M communications a day and, on average, the company serves over 400 million daily web requests. Zendesk is building deeper capabilities in data analytics and machine learning on top of this rapidly growing data set.
Zendesk provides reporting and performance functionality. Within this, the company offers benchmarking capabilities. This allows customers to compare key stats like new ticket creation, first reply time and customer satisfaction to companies within the same industry, companies of the same size or companies with the same target audience. The benchmark is based on a 28-day rolling window of performance and uses average over mean (i.e., 50% of companies will be above and 50% below the benchmark).
In October, Zendesk launched a beta of Satisfaction Prediction, a machine learning and predictive capability for customer satisfaction. It uses historical data from satisfaction surveys to predict if an agent/ customer interaction is at risk of providing negative customer satisfaction. This solution examines the language used in the conversation, the latency between responses and the time to resolve the ticket in determining if the outcome will likely be viewed as positive or negative by a customer. This will also be used as an alternative to post-resolution surveys that have a very low participation rate. The service will be made generally available in early 2016.
2016 Software Sector Outlook
December 18, 2015 34
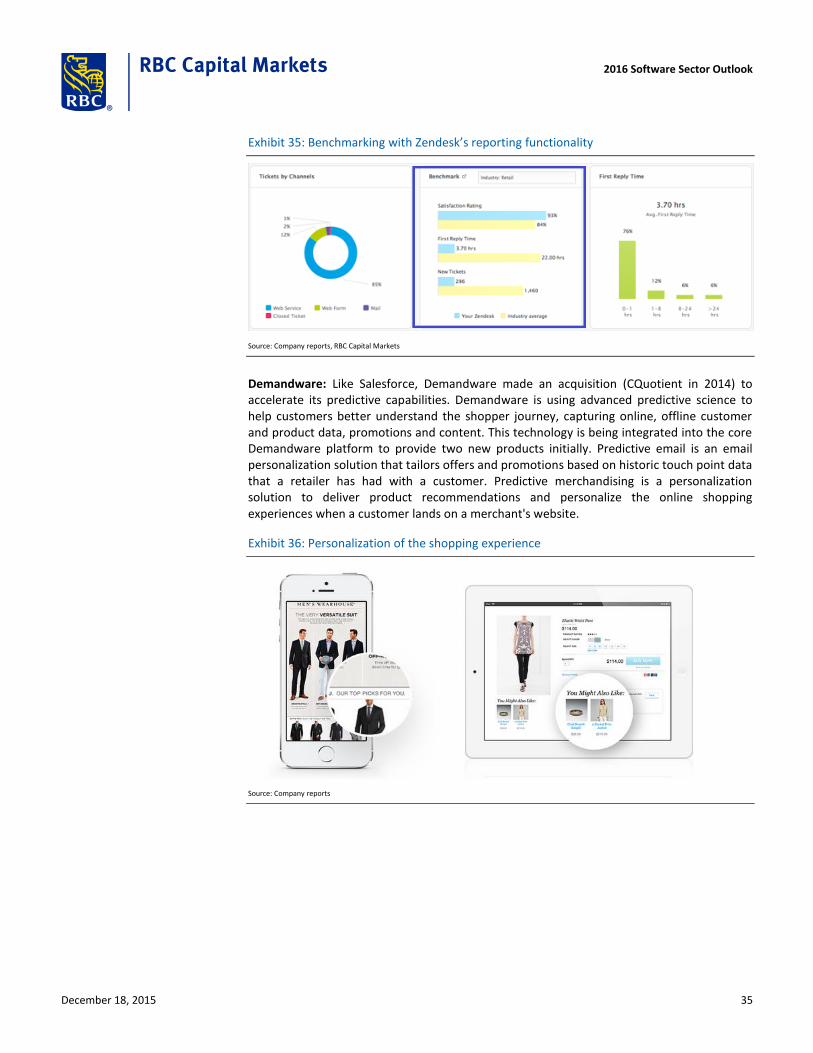
Exhibit 35: Benchmarking with Zendesk’s reporting functionality
Source: Company reports, RBC Capital Markets
Demandware: Like Salesforce, Demandware made an acquisition (CQuotient in 2014) to accelerate its predictive capabilities. Demandware is using advanced predictive science to help customers better understand the shopper journey, capturing online, offline customer and product data, promotions and content. This technology is being integrated into the core Demandware platform to provide two new products initially. Predictive email is an email personalization solution that tailors offers and promotions based on historic touch point data that a retailer has had with a customer. Predictive merchandising is a personalization solution to deliver product recommendations and personalize the online shopping experiences when a customer lands on a merchant's website.
Exhibit 36: Personalization of the shopping experience
Source: Company reports
2016 Software Sector Outlook
December 18, 2015 35

5) Tech theme: Amazon to the app layer The call is Amazon has moved from compute and storage, is attacking database and is now moving to the app layer (Workmail, Workdocs, etc). More business apps could be coming.
Amazon AWS continues to march forward as the disruptive technology force of our time. The business has grown from $4B run rate revenue at the end of CY13 to $8.3B in 3Q15. RBC expects this business to achieve >$25B run rate revenue exiting 2018. Amazon is covered by RBC Analyst, Mark Mahaney; Outperform; $670.65 priced as of market close 12/17/2015.
AWS was formed by Amazon taking the decade worth of experience in building out its e-commerce platform and exposing it to the outside world. At its heart is a set of dedicated software and operating procedures that allows Amazon to drive performance, reliability, operational quality and security at incredible scale. Amazon also allowed access to its catalogue of services and innovative developers started to leverage both the infrastructure and the services that Amazon was sharing with the outside community.
Exhibit 37: The shift toward SaaS, PaaS and IaaS continues unabated
AWS revenue growth has been accelerating . . .
3,1003,546 3,851
4,2304,644
5,1605,979
6,895
0
1,000
2,000
3,000
4,000
5,000
6,000
7,000
8,000
Dec
-13
Mar
-14
Jun
-14
Sep
-14
Dec
-14
Mar
-15
Jun
-15
Sep
-15
4Q13 1Q14 2Q14 3Q14 4Q14 1Q15 2Q15 3Q15
0%
10%
20%
30%
40%
50%
60%
70%
LTM AWS Revenue Y/Y growth
. . . with price reductions as a driving force
Source: Company reports, RBC Capital Markets estimates
It starts with better economics . . . Superior economics has been the primary driver of AWS historically. The cost of building and maintaining reliable infrastructure in a multi-datacenter model could be as high as 70% of the total cost of provisioning IT for the enterprise. By exposing this infrastructure, Amazon can reduce the cost of provisioning IT for a normal company. Amazon also recognized that utilization of infrastructure resources at an individual company level is dramatically low. So Amazon provided a model where a company could achieve 100% utilization of the IT resources it was paying for. Pricing services in an on-demand fashion with a utility pricing model was key and in 2006 AWS delivered the first storage service (S3) and elastic compute (EC2).
Superior economics remains at the heart of everything Amazon does. The company’s mentality is one of building the best services and pricing them at a level that customers struggle to match elsewhere. However, we think there has been a subtle shift in the value proposition of AWS over the last three years to one where better economics has been augmented by more services that are allowing customers to innovate at a faster speed on AWS than they would elsewhere.
AWS started with superior economics . . . but is driving toward superior innovation
2016 Software Sector Outlook
December 18, 2015 36

Exhibit 38: The evolution of AWS
Infrastructure Applications
WorkDocs
Mobile Analytics WorkMail
Key Management Service Device Farm
Directory Service API Gateway
Cloudsearch Quicksight
Appstreaming Machine Learning
Service Catalog Elastisearch Service
Data Pipeline Workspaces Config WAF
Mobile SNS SWF Kinesis CodeDeploy Inspector
Elastic MapReduce Identity and Access Management Opsworks Cloud HSM CodeCommit IoT
Virtual Private Cloud SES Redshift SNS Elastic Load Balancing API Gateway
Relational Database Service Mobile SDK Cloudformation Dyanmo DB Elastic Transcoder Aurora CodePipeline
S3 Cloudfront Elastic Load Balancing Cloudwatch Elasticache Glacier Cloudtrail Lambda Database migration Service
EC2 EBS Auto Scaling Route 53 Elastic Beanstalk Storage Gateway Direct Connect EC2 Contain Service and Registry Import/ Export
2006 2007 2008 2009 2010 2011 2012 2013 2014 2015
Compute Database Management Tools IoT Security and Identity Mobile Services
Storage Networking Developer Application Services Analytics Enterprise Applications
Source: FactSet, Company reports and RBC Capital Markets estimates
2016 Software Sector Outlook
December 18, 2015 37

. . . and has moved to superior innovation The pace of innovation that Amazon has delivered has started to accelerate over the past two years. Some of the innovation has been related to optimization of the core infrastructure to allow customers to run workloads more efficiently. We highlight the following as key areas of innovation:
Lambda – A zero administration platform that allows a user to write an application and connect it to AWS resources. Those resources are then consumer dependent on the requirements of the application and the parameters which the administrator sets. This is a fundamental change in the cloud model, which negates the need to reserve capacity nor worry about scale or fault tolerance.
Direct Connect – Enables a dedicated network connection from on-premises to AWS, which can reduce network costs, increase bandwidth throughput and provide a more consistent network experience. Creates greater coordination and integration between on-premise and cloud resources provided through AWS.
Container Service and Registry – A high scale, high performance container management service that supports Docker and other container technology and allows developers to run applications on a managed cluster of compute instances.
Exhibit 39: Lambda automatically matches resources to the application’s needs
Source: Company reports, RBC Capital Markets
Up the Stack we go: First comes the data layer . . . After the provisioning the basic building blocks of compute and storage in 2006-2008 (Elastic Cloud Compute, Simple Storage Service, Cloudfront and Elastic Block Store), AWS moved into the data base layer. The initial service provided was the Relational Database Service (RDS), which provisions and manages both open source and commercial databases in the AWS environment, including Oracle, Microsoft SQL Server, MySQL, PostgreSQL and MariaDB. In 2012, AWS added two new database services:
DynamoDB - The company’s own NoSQL database, used primarily for modern highly distributed workloads.
Redshift - A fast, fully managed, highly scalable data warehouse. We think the adoption of Redshift over the last three years has contributed to growth challenges for traditional on-premise data warehouse vendors, including Teradata (TDC) and Oracle (ORCL).
2016 Software Sector Outlook
December 18, 2015 38

More recently, AWS has added its own relational database service, Aurora, to RDS, which is a clone of the MySQL open-source database. In addition, AWS launched a preview of its Database Migration Service, which moves data to and from all widely used commercial and open-source databases. This service includes a schema-conversion tool that converts source database schemas and code for format compatibility with the target database. This move increases the risk that commercial database workloads will begin to migrate to AWS (and subsequently running on open-source databases) rather than commercially licensed databases from the likes of Oracle, IBM or Microsoft.
. . . then analytics . . . AWS started a concerted effort in analytics in 2012 with the introduction of the Redshift data warehouse and Data Pipeline service. This service allows customers to process and move data between different AWS services and on-premise workloads. This allowed customers to start to use the Redshift data warehouse capabilities on on-premise data sources.
Kinesis – Introduced in 2013, Kinesis allows customers to manage and analyze real-time streaming data. This is particularly helpful for processing streaming data from modern applications such as web apps, mobile devices, wearables and industrial sensors.
It wasn’t until 2015 that AWS stepped up its efforts further and introduced three new analytics services, including Quicksight.
Quicksight is a new fast, cloud-based business intelligence service that allows customers to build visualizations and perform ad hoc analysis. It uses a new engine (super-fast, parallel, in-memory calculation engine, or SPICE for short) and is immediately integrated with all existing AWS data services.
Exhibit 40: AWS Analytics and BI portfolio
Source: Company reports, RBC Capital Markets
2016 Software Sector Outlook
December 18, 2015 39

. . . into applications Although AWS has many application services that help developers build applications, and increasingly, mobile applications, Amazon has also been moving into the application layer. There are three major applications that AWS has introduced, with its email service perhaps being the clearest signal of intent that it is focused on moving into large application markets.
Workspaces – A managed desktop computing experience in the cloud. This allows companies to provision cloud-based desktops using Windows server 2008 R2 at the back.
Workdocs - A managed enterprise storage and file-sharing service. This is AWS’s answer to Dropbox for Enterprise, Box, Google Drive for Work or Microsoft Onedrive for business. We believe more work is required to make the AWS offering more competitive with other services from a feature-functionality standpoint (e.g., multi-file collaboration, workflow and mobile application support standpoint). However, it is priced competitively and we expect functionality to improve over time.
Workmail – Was launched this year and is Amazon’s first foray into providing a full email service for companies. As a first release, the product is not as competitive from a feature functionality standpoint as Google Apps or Office 365. For example, Workmail is just an email service today and does not offer the option of personal productivity tools nor the advanced features of those other offerings (such as VoiP with Skype for business).
Exhibit 41: AWS Analytics and BI portfolio
Source: Company reports, RBC Capital Markets
Where next in applications for AWS? So far, Amazon’s move into the application layer has been less of a concern than its shift into the compute, storage, data and analytics layer. In many ways, business applications are a much tougher challenge for Amazon to address due to:
Service requirements of non-technical business users – AWS’s history has been to offer relatively lightweight support and have many technical questions answered by the community. However, that is beginning to change. For example, AWS has introduced new tiers of service, such as Premium Support (Platinum), which provides a 15-minute response time for critical issues and a technical account manager for the account. Pricing is the greater of $15K/ month or 10% of monthly AWS fees. We would expect more
2016 Software Sector Outlook
December 18, 2015 40

investments in services would be required to fulfill the needs of business users over time.
Business process (not just technical) expertise – AWS would need to hire more experts in areas of business application development and not just areas associated with the technology stack. We believe different skills are required to solve for building applications.
Simply not being the best at everything – AWS has had great success in infrastructure, but this has not stopped new infrastructure software companies from being successful – look at the recent examples of Pure Storage (PSTG), Hortonworks (HDP) and New Relic (NEWR). We think there is still room for companies that are the best at what they do to thrive in the age of AWS.
That said, we still think it is possible that AWS will move into other areas of the application stack. We would highlight:
Personal productivity – Given that AWS is in file storage and collaboration (WorkDocs) and email (Workmail), we think it would be logical that the company could move into personal productivity. This could make AWS’s offerings in this area more competitive relative to Microsoft’s O365 and Google’s Apps for Work.
Collaboration software – Given that AWS is already addressing email, we think it would be a relatively small leap for the company to build next generation collaboration tools based on file sharing, messaging and social paradigms. Existing players in this space include Slack and Facebook at Work.
Simple CRM – While Salesforce clearly dominates the customer relationship market, Microsoft’s CRM dynamics Online and Zoho CRM and Sugar CRM have shown that there is room for others to exist. Interestingly, AWS already has some simple CRM capabilities, which it offers its resellers. We think it is possible that the company could extend CRM capabilities to external customers with aggressive pricing.
Simple accounting – This would likely take more time and may be harder to execute on given the market position of existing competitors such as Intuit’s QuickBooks and Xero. However, we are mindful that Amazon could move into this space at disruptive price points.
2016 Software Sector Outlook
December 18, 2015 41

6) Tech theme: Shifting priorities for cyber-security The call is that we want to own PANW in large cap and IMPV, MIME and PFPT in small cap security. While we believe security spending intentions are likely to remain strong, we think 2016 could see more vendor consolidation at the high end where PANW could benefit as well as best-of-breed solutions such as IMPV, MIME and PFPT that are differentiated from large-cap peers.
Security spending likely to remain elevated… According to our interpretation of Gartner’s work (Forecast: Information Security, Worldwide, 2013-2019, 3Q15 Update, November 11, 2015, by Ruggero Contu, et al.), it estimates the security market could grow from $84.3 billion in 2015 to $115.9 billion in 2019, reflecting a CAGR of 8.3%. We would note that the 2015 projection of $84.3 billion was 9.5%, or $7.3 billion, above the 2015 projection from the same report last year (Forecast: Information Security, Worldwide, 2012-2018, 3Q14 Update, October 29, 2014, by Ruggero Contu, et al.).
Given the increasing rate of high-profile breaches and the potential for additional US Government regulations/mandates, we would expect there to be an upward bias to security spending estimates.
Exhibit 42: Global security spending by segment 2013-2019E ($M)
CAGR
2013 2014 2015E 2016E 2017E 2018E 2019E 2013-2019E
Enterprise Identity Access Management Identity Governance and Administration 1,376 1,582 1,704 1,845 2,013 2,192 2,389 8.6%
Other Identity Access Management 685 776 860 936 1,011 1,067 1,127 7.8%
Web Access Management (WAM) 789 861 914 961 1,003 1,046 1,093 4.9%
Infrastructure Protection Security Testing 495 614 705 807 922 1,055 1,206 14.5%
Data Loss Prevention 555 652 714 784 861 948 1,045 9.9%
Security Information and Event Management (SIEM) 1,504 1,689 1,875 2,056 2,225 2,408 2,613 9.1%
Secure Web Gateway 2,204 2,432 2,599 2,770 2,937 3,107 3,291 6.2%
Other Security Software 2,865 3,025 3,171 3,333 3,504 3,701 3,910 5.3%
Endpoint Protection Platform (Enterprise) 3,282 3,507 3,612 3,714 3,814 3,908 4,006 2.7%
Secure E-mail Gateway 1,600 1,646 1,691 1,726 1,752 1,779 1,807 1.9%
Network Security Equipment VPN/Firewall Equipment 6,734 7,512 9,031 10,094 11,055 12,051 13,026 11.6%
IPS Equipment 1,418 1,529 1,712 1,699 1,585 1,392 1,175 -5.1%
Security Services IT Outsourcing 10,746 12,524 15,556 17,840 20,445 23,461 26,911 16.5%
Consulting 14,217 15,576 18,249 19,718 21,353 23,132 25,080 10.0%
Implementation 12,114 13,152 15,281 16,296 17,309 18,394 19,570 8.3%
Hardware Support 1,206 1,310 1,510 1,605 1,694 1,790 1,889 7.6%
Consumer Consumer Security Software Consumer Security Software 4,992 4,999 5,115 5,259 5,432 5,604 5,790 3.0%
Grand Total 66,782 73,386 84,299 91,444 98,914 107,036 115,927 9.6%
Source: Gartner "Forecast: Information Security, Worldwide, 2013-2019, 3Q15 Update" November 11, 2015, by Ruggero Contu, Christian Canales, Sid Deshpande and Lawrence Pingree
…but a rising tide doesn’t lift all ships equally At our recent technology conference, one of the big takeaways from security vendors was that while security spending is likely to remain elevated in 2016, not all segments should benefit equally. We believe PANW is likely to remain the market consolidator in large-cap security and benefit from share shift from CHKP, CSCO, JNPR and MFE. We also expect
2016 Software Sector Outlook
December 18, 2015 42

additional attention to end-point security, which remains more of a Holy Grail of security. Finally, we expect select vendors that fall outside PANW’s umbrella, such as IMPV, MIME and PFPT, to continue to benefit by taking share from incumbents such as CSCO, IBM, MFE and SYMC. Note, for the table below, the mean and median growth rates exclude SYMC.
Exhibit 43: RBC revenue growth projections
Ticker Company M-Cap ($M) CY/15E CY/16E CY/17E
PANW Palo Alto Networks 16,986 53% 33% 29%
PFPT Proofpoint 2,638 35% 29% 25%
IMPV Imperva 2,243 40% 25% 24%
QLYS Qualys 1,329 23% 23% 23%
MIME Mimecast 554 22% 19% 21%
FTNT Fortinet 5,684 31% 25% 20%
CHKP Check Point Software Technologies 15,728 9% 9% 8%
SYMC Symantec 14,063 -10% -1% 3%
Mean Growth 31% 23% 21%
Median Growth 31% 25% 23%
Revenue Growth
Source: Company reports, FactSet and RBC Capital Markets estimates, priced as of 12/16/15
Changing cyber-security regulation could benefit EU spend In 2015 we saw an increase in government regulation activity in the cyber-security landscape addressing the growing number of incidents as well as what appears to be an influx in nation-state activity. As recent as the beginning of December, the EU members drafted their first ever set of cyber-security requirements. Among the changes were the following:
Increased security requirements for “operators of essential services” in sectors such as energy, finance, health care and transportation. These industries have been identified by the EU member panel as needing to be held to more robust security standard in the interest of the general public.
In addition to increased security requirements, these industries, as well as certain large internet companies, will be required to disclose breaches to a further extent than under previous requirements.
Increased cooperation within the EU to share best practices and information. Additionally, each member state will set up a Computer Security Incidents Response Team to discuss internal and cross-border incidents and set up coordinated responses.
We feel that ultimately the more government oversight along with greater penalty for breaches could lead to increased spend in the EU, which could be a nice positive for the security sector. We note the finalized text of the agreement is not yet available and still needs to be formally approved by the European Parliament’s Internal Market Committee and the Council Committee of Permanent Representatives.
The US Government has also has been focused on cyber security, with $14 billion in the FY/16 budget allocated for it. The largest portion of the funds will go towards securing the federal network, followed by allocations toward the Department of Justice to investigate cyber intrusions and threats to national security. Looking back to previous legislation, the government’s cyber-security priorities include a boost in information sharing between the government and private sector, continuing to establish breach standards and modernizing the penalties for cyber-crimes.
2016 Software Sector Outlook
December 18, 2015 43

Although it is difficult to tell exactly where cyber-security legislation will move in 2016, directionally there appears to be momentum toward increased emphasis and spend on addressing the evolving world of cyber threats in both the public and private sectors. We feel increased awareness and government scrutiny should be a net benefit for the space.
Ways to play the theme Imperva: IMPV reported strong results throughout 2015, outperforming the mid-point of revenue guidance by an average of $5.9 million. Similar to Palo Alto, what is even more impressive is expanding OM by 1,400 bps Y/Y to date. We feel this momentum should be sustainable as the company continues to take a disproportionate amount of the increased security spend as it displaces legacy providers such as IBM. The company is only 13% penetrated in the Fortune 1000 and has a long runway for expansion.
Mimecast: We recently initiated coverage of MIME with an Outperform rating and believe it can benefit from some of the same trends that Proofpoint has enjoyed. In addition to a below-peer valuation, we see several catalysts over the next 12 months, including: 1) attractive end markets of email security, archiving, and continuity, as email is often one of the larger threat vectors into an organization; 2) competitive share shifts from Intel/McAfee, Symantec/Veritas and Cisco; 3) the migration to cloud-based email services such as Office 365; 4) growing customer base faster than expected; 5) cross-sell products such as Target Threat Protection back into the install base; 6) the introduction of new products; and 7) enhanced global distribution capabilities.
Palo Alto: PANW remains our favorite large cap security name. The company is seeing acceleration in billings and margins/cash flow, a rare combination for software. Specifically, the company has reported six consecutive quarters of Y/Y revenue and billings acceleration, an impressive feat at its scale, and almost as impressive, expanded margins by 450 bps in FY/15, a trend that continued in Q1/16, up 610 bps y/y. As part of our September Security Survey, security resellers identified Palo Alto as the vendor with both the most momentum and that is taking the most share from peers.
Proofpoint: PFPT remains one of our favorite small cap security ideas and should benefit from the cross-sell of TAP and share shift from McAfee, Symantec and Cisco. Proofpoint has been a consistent beat-and-raise story throughout 2015, with increasing cash margins, a trend we would expect to continue in 2016. Targeted attack prevention, or TAP, is the fastest growing product and is currently only 20% penetrated in the install base, leaving an attractive runway as management feels every customer should be a TAP user. Looking into 2016, Proofpoint should benefit from enterprise customers shifting to Office 365 as well as continued share shift from legacy competitors as McAfee end-of-lifes its email security product.
2016 Software Sector Outlook
December 18, 2015 44

7) Tech theme: Shift to the cloud should continue to be deflationary to legacy infrastructure vendors The call is to buy companies such as CRM, NOW and WDAY in the app space and AMZN and MSFT in the platform market, which should continue to pull spending away from legacy infrastructure vendors that face deflationary trends.
A trend investors have been watching for the past several years is a number of infrastructure vendors going private, including BMC, TIBX, INFA, CPWR and RVBD, while other public vendors have underperformed, including CA, CTXS and TDC. Why is this happening?
As more services move to the cloud, it means CTOs need to purchase less on premise infrastructure hardware and software for private clouds. That means less load balancers, less middleware, less general datacenter plumbing. Instead of customers absorbing the cost for infrastructure, cloud or platform vendors assume those costs that can be spread over a larger number of customers. It is effectively an economy of scale situation where the economics favor the cloud and platform players vs. the on-premise vendors. Effectively the spending on overall infrastructure software and hardware decreases and at the same time shifts.
For example, a traditional network, as shown in the following exhibit, is made up of a variety of hardware (databases, servers, switches, load balancers, firewalls, routers, etc.) and software (ETL, middleware, operating systems, provisioning, hypervisors, etc.).
Exhibit 44: Traditional enterprise network
Source: Networking in the Cloud Age by Chiradeep Vittal
However, in a hybrid cloud environment which leverages public (AWS, Azure, Salesforce, etc.) and private clouds, as shown in the following exhibit, more of the compute resources are shifted to the public cloud vendors.
2016 Software Sector Outlook
December 18, 2015 45

Exhibit 45: Hybrid cloud environment
Source: Techwebpedia.com
One question we get all the time is, “Will the shift to a hybrid cloud architecture negatively impact traditional security vendors?” While the answer may vary, we believe security that protects a private cloud will always exist and even more so, vendors are pivoting to areas of security that are less likely to be disrupted, such as virtual firewalls, solutions that protect data in motion, endpoint security, email security, etc.
Ways to play the theme Salesforce: A widely discussed target earlier this year, Salesforce is on track for ~$8B of revenue in 2016 and has expanding Platform-as-a-Service capabilities, which could prove key in the fight for application spend in the future. In core CRM, Salesforce has established a commanding competitive presence. Marketing and Service clouds, along with nascent IoT and vertical-specific products additionally build out the company’s product footprint. Improved enterprise sales execution and scale is leading to an attractive combination of growth and operating leverage.
Microsoft: We believe it is becoming increasingly clear that the battle for public cloud infrastructure is a two-horse race between MSFT and AMZN and that these businesses can be very profitable at scale. We estimate MSFT's incremental cloud GMs are 75%+. Meanwhile AWS just reported NG OMs of ~25% for 3Q15. MSFT’s incumbency is an advantage in hybrid cloud – i.e., when public cloud and corporate data centers share many underlying infrastructure components. MSFT’s hybrid cloud strategy – where customers get to choose how they adopt the cloud and distribute their workloads, which in turn drives the growth of the server business – appears to be kicking into gear.
ServiceNow: The company is redefining the IT service management space as it becomes the “ERP for IT”. Moving beyond IT, ServiceNow could become the platform for the enterprise service relationship management vendor as customers and partners write custom SaaS applications on the platform. We believe the company’s platform provides the ability to expand into other areas in the enterprise through customer applications built for HR, finance, legal, etc.
Splunk: We believe Splunk is well positioned to act as an independent “Switzerland” layer between on prem and cloud workload as they partner well with Amazon for instance. We believe their ability to correlate data cross-platform is unique and could help companies feel more comfortable moving workload to the cloud.
2016 Software Sector Outlook
December 18, 2015 46

Red Hat: Coming off a strong third quarter, Red Hat seems well positioned to benefit from public/hybrid cloud workload given the success of their public cloud business highlighted by AWS and more recently Azure. We believe Red Hat can continue to benefit from these shifting priorities, which is unique among its infrastructure peers.
Workday: Workday has built out a strong suite of HR applications that has been displacing legacy systems for a decade, and more recently financial management systems as well, by taking advantage of the economic and other advantages of a cloud-based approach. Initially less successful in serving the enterprise, its ability to scale continues to improve, allowing it to win in the larger accounts that have traditionally been the legacy providers’ bread and butter.
2016 Software Sector Outlook
December 18, 2015 47

8) Tech theme: Value emerges as the IoT market starts to materialize The call is to buy companies such as PTC and HDP for maximum IoT growth opportunities while companies like FLTX and LOGM can also benefit.
The Internet of Things (IoT) market is not new, but for the first time, we are seeing this attractive but nascent market materialize to create real value as software companies such as PTC, Hortonworks and Fleetmatics could continue to see outsized returns.
We have characterized the IoT market as the world developing a nervous system, where smart connected devices communicate to improve efficiency and performance in an increasingly automated world.
Virtually all devices can become connected, as connected devices are made up of three parts:
1) The physical component, which is the device itself whether it be a car, thermostat or manufacturing machinery.
2) The sensory component. This is the part that enables the physical component to take in and process information utilizing sensors and an operating system, or become “smart”.
3) The communication component. Once the information is processed, the final step of a connected product is to connect.
Connected products are projected to be utilized in virtually every industry, as the true value of the technology should come from the breadth of solutions that can be connected.
As shown in the following exhibit by McKinsey, the use-cases for IoT are diverse with the total market size estimate varying from $3.9 trillion on the low end to $11.0 trillion on the high end by 2025. The vertical that is expected to be the largest is factories, which is expected to be a $1.21 trillion to $3.70 trillion market by 2025, while the industry with the greatest uncertainty is human devices, such as wearables, which has a high-end estimate of almost 10 times the low-end estimate.
2016 Software Sector Outlook
December 18, 2015 48
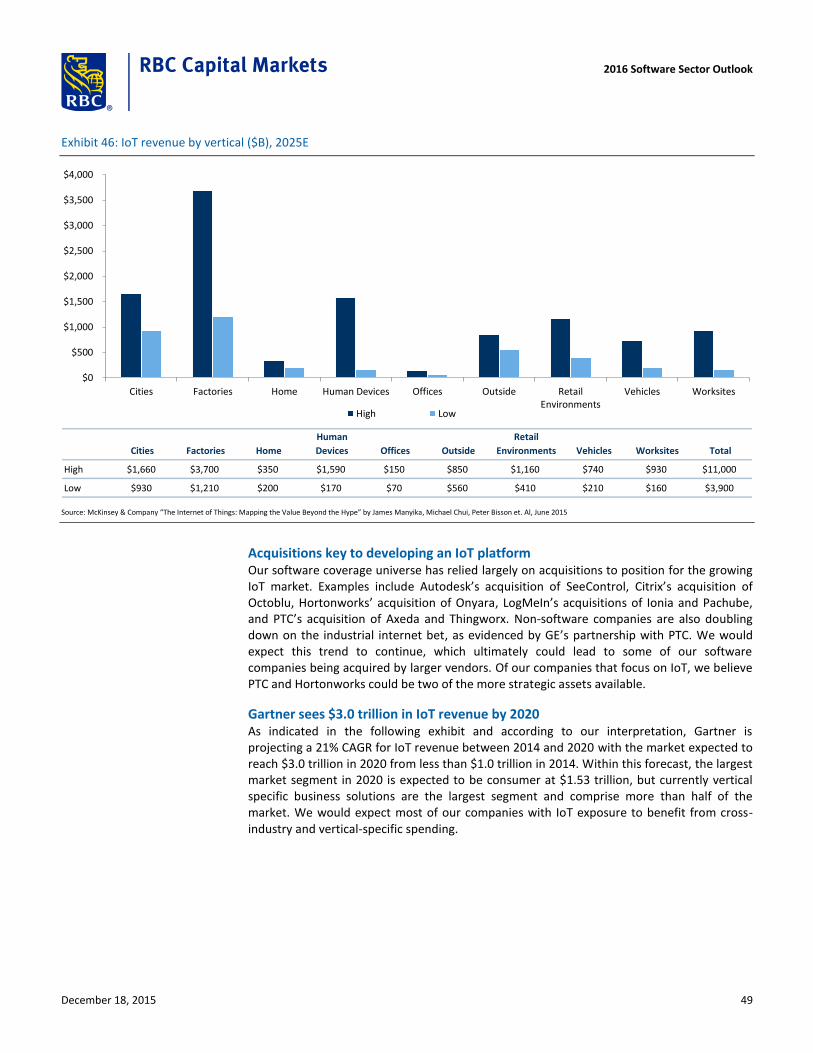
Exhibit 46: IoT revenue by vertical ($B), 2025E
$0
$500
$1,000
$1,500
$2,000
$2,500
$3,000
$3,500
$4,000
Cities Factories Home Human Devices Offices Outside RetailEnvironments
Vehicles Worksites
High Low
Cities Factories Home
Human
Devices Offices Outside
Retail
Environments Vehicles Worksites Total
High $1,660 $3,700 $350 $1,590 $150 $850 $1,160 $740 $930 $11,000
Low $930 $1,210 $200 $170 $70 $560 $410 $210 $160 $3,900
Source: McKinsey & Company “The Internet of Things: Mapping the Value Beyond the Hype” by James Manyika, Michael Chui, Peter Bisson et. Al, June 2015
Acquisitions key to developing an IoT platform Our software coverage universe has relied largely on acquisitions to position for the growing IoT market. Examples include Autodesk’s acquisition of SeeControl, Citrix’s acquisition of Octoblu, Hortonworks’ acquisition of Onyara, LogMeIn’s acquisitions of Ionia and Pachube, and PTC’s acquisition of Axeda and Thingworx. Non-software companies are also doubling down on the industrial internet bet, as evidenced by GE’s partnership with PTC. We would expect this trend to continue, which ultimately could lead to some of our software companies being acquired by larger vendors. Of our companies that focus on IoT, we believe PTC and Hortonworks could be two of the more strategic assets available.
Gartner sees $3.0 trillion in IoT revenue by 2020 As indicated in the following exhibit and according to our interpretation, Gartner is projecting a 21% CAGR for IoT revenue between 2014 and 2020 with the market expected to reach $3.0 trillion in 2020 from less than $1.0 trillion in 2014. Within this forecast, the largest market segment in 2020 is expected to be consumer at $1.53 trillion, but currently vertical specific business solutions are the largest segment and comprise more than half of the market. We would expect most of our companies with IoT exposure to benefit from cross-industry and vertical-specific spending.
2016 Software Sector Outlook
December 18, 2015 49

Exhibit 47: Forecast IoT revenue by segment ($B), 2014-2020E
$0
$500
$1,000
$1,500
$2,000
$2,500
$3,000
$3,500
2014 2015E 2016E 2020E
Consumer Business: Cross-Industry Business: Vertical-Specific
Revenue ($B) 2014-2020E
2014 2015E 2016E 2020E CAGR
Consumer $257 $416 $546 $1,534 34.7%
Business: Cross-Industry $115 $155 $201 $566 30.4%
Business: Vertical-Specific $567 $612 $667 $911 8.2%
Grand Total $939 $1,183 $1,414 $3,010 21.4%
Source: Gartner, Tully, Jim. Symposium/IT Expo 2015. Centre Convencions Internacional Barcelona, Barcelona. 10 Nov. 2015. Lecture.
As the market matures, prices are expected to decrease As indicated in the following exhibit and according to our interpretation of Gartner’s forecast, the number of connected devices is expected to expand at a CAGR of 32.7% from 2014 to 2020, while average revenue per device is expected to decrease at a CAGR of 8.5% over that same period. We believe software companies can benefit from this scale and actually lower the cost of production and services through smarter software.
2016 Software Sector Outlook
December 18, 2015 50

Exhibit 48: IoT devices by vertical (M), 2014-2020E
0
5,000
10,000
15,000
20,000
25,000
2014 2015E 2016E 2020E
Consumer Business: Cross-Industry Business: Vertical-Specific
Connected devices (M) 2014-2020E
2014 2015E 2016E 2020E CAGR
Consumer 2,277 3,023 4,024 13,509 34.5%
Business: Cross-Industry 632 815 1,092 4,408 38.2%
Business: Vertical-Specific 898 1,065 1,276 2,880 21.4%
Grand Total 3,807 4,902 6,392 20,797 32.7%
Revenue per device 2014-2020E
2014 2015E 2016E 2020E CAGR
Consumer $113 $138 $136 $114 0.1%
Business: Cross-Industry $182 $190 $184 $128 -5.6%
Business: Vertical-Specific $631 $575 $523 $316 -10.9%
Grand Total $247 $241 $221 $145 -8.5%
Source: Gartner, Tully, Jim. Symposium/IT Expo 2015. Centre Convencions Internacional Barcelona, Barcelona. 10 Nov. 2015. Lecture.
Ways to play the theme Fleetmatics: FLTX has emerged as a viable IoT vendor by connecting vehicles and improving efficiencies of fleets. This was done through internal product development, unlike other software companies in our coverage universe that have largely pursued the opportunity through acquisitions. We believe Fleetmatics can continue to outpace market growth while tapping a large and underpenetrated fleet market and has long-term call options including a recent OEM agreement with GM.
Hortonworks: HDP continues to see expanded IoT use cases for its big data solutions that should benefit from its recent acquisition of Onyara. The acquisition formed the basis of Hortonworks DataFlow, or HDF, which processes data-in-motion for real-time streaming from any data source. We believe HDF could open up additional IoT use cases for industries such as oil and gas, and transportation. We continue to believe Hortonworks is a strategic asset that could be an acquisition target, similar to PTC.
2016 Software Sector Outlook
December 18, 2015 51

LogMeIn: LOGM’s IoT platform and application solution Xively enables customers to securely connect and manage IoT products. Xively remains in the low single digits as percentage of revenue, or likely under $10 million annually, but could begin to accelerate under a new operational CEO. LogMeIn recently announced partnerships with AWS, Salesforce and Splunk, which is indicative of the traction the product is having in the market.
PTC: PTC currently has one of the most material IoT businesses within our coverage, with total IoT-related revenue of $52 million in FY/15, up 787% Y/Y to account for 4.5% of total revenue. The company continues to view the market as more of a land grab and has added 290 new logos in FY/15 vs. guidance of 200. ThingWorx, the company’s IoT platform, is predominately a complement to the PLM business at this point, but has much broader applications in the IoT market as a whole. A recent success story and validation for the platform is an IoT partnership with GE that should result in a royalty payment for PTC upon sale of GE IoT solutions. We continue to believe that PTC could be an interesting M&A candidate for an industrial company that is looking for a scalable top-tier IoT platform.
2016 Software Sector Outlook
December 18, 2015 52

9) Tech theme: Focus on next-generation disruptors The call is that we would continue to focus on next-gen disruptors such as the public vendors listed below and would also continue to watch the list of private vendors that follow.
We have seen plenty of examples of next gen software disruptors in the public market over the past several years, such as:
HortonWorks for commercializing the Hadoop big data processing platform.
New Relic for helping to define the application performance management market.
ServiceNow for re-inventing the IT Systems Management market.
Palo Alto Networks for re-inventing the firewall space.
Shopify for simplifying e-commerce.
Splunk for enabling the correlation of petabytes of data at scale.
Tableau for inventing the data visualization market.
Workday for enabling the processing of HR and Financials in the cloud.
The one thing in common across all these use cases is that each company has either re-invented or disrupted a legacy market with next-generation technology. The result in each case is share-shift away from legacy vendors, and a nice valuation that follows.
We think this wave of disruption is likely to continue in 2016 and beyond given a growing shift to public/hybrid clouds, IoT, evolving security threats, a focus on DevOps, big data processing, analytics and more. While there are a number of interesting private companies we follow, below are a sample of names that could benefit from a changing technology fabric.
Ways to play the theme Next-gen DevOps, data management, storage and processing:
Actifio: Actifio virtualizes the data of businesses in more than 30 countries around the world. Actifio’s Virtual Data Pipeline technology enables businesses to protect, access, and move data faster, more efficiently, and more simply by decoupling data from physical storage, much the same way a hypervisor decouples compute from physical servers. Within the copy data virtualization market, the company focuses on enterprise-class backup modernization, self-serve instant data access and service provider business transformation.
AppDynamics: The AppDynamics Application Intelligence Platform helps software-defined businesses proactively monitor, manage, analyze and optimize the most complex software environments, providing real-time, actionable IT operational and business insights into application performance, user experience and business outcomes. This is done in real time and in production.
Cloudera: Cloudera delivers a modern data management and analytics platform built on Apache Hadoop and the latest open-source technologies. Customers can capture, store, process and analyze vast amounts of data and use advanced analytics to drive business decisions more quickly, flexibly and at lower cost than has been possible with older technology.
Code42: Code42 is a global enterprise SaaS provider of endpoint data protection and security to more than 37,000 organizations, including the most recognized brands in business and education. The company’s highly secure cloud solutions enable IT and security teams to better limit risk, meet data privacy regulations and recover from data loss.
2016 Software Sector Outlook
December 18, 2015 53

Couchbase: Couchbase delivers a NoSQL distributed database platform. Developers use the Couchbase platform globally to build enterprise web, mobile, and IoT applications that support massive data volumes in real time. The Couchbase platform includes Couchbase Server, Couchbase Lite - a mobile NoSQL database, and Couchbase Sync Gateway. Couchbase is designed for global deployments, with configurable cross data center replication to increase data locality and availability. All Couchbase products are open-source projects.
Databricks: Databricks’ vision is to simplify big data processing. The company was founded by the team that created and continues to drive Apache Spark, a powerful open source data processing engine built for sophisticated analytics, ease of use and speed. Databricks offers a cloud-based integrated workspace for big data that enables users to go from data ingest, to visual exploration and production jobs, making it easier to turn data into value, without the hassle of managing complex infrastructure, systems and tools.
DataStax: Datastax delivers Apache Cassandra in a database platform purpose-built for the performance and availability demands of IoT, Web and mobile applications. This provides enterprises a secure, always-on database technology that remains operationally simple when scaling in a single datacenter or across multiple datacenters and clouds. With more than 500 customers in over 50 countries, DataStax is the database technology for companies such as Adobe, eBay ING, Intuit, Netflix and Safeway.
Delphix: Delphix is a vendor in the Data-as-a-Service market, which helps companies release applications 10 times faster by delivering secure, virtualized data across the application lifecycle. Delphix software delivers the right data to the right team at the right time, on premises or in the cloud instead of relying on IT teams to manually move data across systems. Over 30% of the Global 100 use Delphix to deliver data across development, testing, and reporting environments, improving developer productivity and data security.
Docker: Docker is the company behind the Docker open-source platform, and is the chief sponsor of the Docker ecosystem. Docker is an open platform for developers and system administrators to build, ship and run distributed applications. With Docker, IT organizations shrink application delivery from months to minutes, frictionlessly move workloads between data centers and the cloud and can achieve up to 20 times greater efficiency in the use of computing resources. Docker containers have been downloaded more than 1.2 billion times and Docker is used by millions of developers across thousands of organizations, including the BBC, Baidu, eBay, Goldman Sachs, Groupon, ING, Spotify and Yelp. Docker’s rapid adoption has catalyzed an active ecosystem, resulting in more than 230,000 “Dockerized” applications, over 40 Docker-related startups and integration partnerships with AWS, Cloud Foundry, Google, IBM, Microsoft, OpenStack, Rackspace, Red Hat and VMware.
GitHub: GitHub has a community of more than 11 million people and allows developers to discover, use, and contribute to over 30 million projects using a powerful collaborative development workflow. GitHub can be used with third-party tools from project management to continuous deployment to build software easier.
MapR: MapR provides a converged data platform that integrates the power of Hadoop and Spark with global event streaming, real-time database capabilities and enterprise storage that enables customers to harness the enormous power of data. Organizations with the most demanding production needs, including sub-second response for fraud prevention, secure and highly available data-driven insights for better healthcare, petabyte analysis for threat detection, and integrated operational and analytic processing for improved customer experiences, run on MapR. A majority of customers achieve payback in fewer than 12 months and realize greater than five times ROI.
2016 Software Sector Outlook
December 18, 2015 54

MarkLogic: MarkLogic delivers a powerful, agile and trusted Enterprise NoSQL database platform that enables organizations to turn all data into valuable and actionable information. Organizations around the world use MarkLogic’s enterprise grade technology to power the new generation of information applications.
MongoDB: MongoDB is a provider of a NoSQL database that offers some of the best features of traditional databases as well as the flexibility, scale and performance that modern applications require.
MuleSoft: MuleSoft makes it easy to connect the world's applications, data and devices. MuleSoft’s Anypoint Platform enables companies to unlock the potential of applications and data through API-led connectivity, both on-premises and in the cloud. Organizations in over 60 countries, from emerging companies to Global 500 corporations, use MuleSoft to innovate faster and transform their businesses.
Platfora: Platfora is a Big Data Discovery platform built natively on Apache Hadoop and Spark. Platfora enables business users and data scientists to visually interact with petabyte-scale data in seconds, enabling work with even the rawest forms of transaction, customer interaction and machine data to find new opportunities and manage risk. Platfora is transforming the way businesses unlock insights, make decisions and produce better outcomes through the use of Customer Analytics, Security Analytics and Internet of Things solutions.
Next-gen application market:
Adaptive Insights: Adaptive Insights is a cloud corporate performance management vendor. Via its software as a service platform, the company offers capabilities for budgeting, forecasting, reporting, consolidation, dashboards and analytics that empower finance, sales and other business leaders.
Anaplan: Anaplan is a provider of enterprise planning cloud technology. Anaplan brings together a planning and modeling engine, collaboration in the cloud and a simple interface for business users. Anaplan customers can choose from over 100 pre-built planning apps from the Anaplan App Hub, or easily build their own apps.
FinancialForce.com: FinancialForce.com is built on the Salesforce App Cloud, FinancialForce ERP equips customer-centric businesses with a unified platform that delivers ERP and CRM on a single cloud. The company’s Financial Management, Human Capital Management (HCM), Professional Services Automation (PSA), and Supply Chain Management (SCM) apps enable businesses to increase the speed of operation and be more responsive along every touch point of a customer's journey.
Intacct: Intacct is a provider of cloud ERP software. In use by more than 10,500 organizations from startups to public companies, Intacct is designed to improve company performance and make finance more productive. Hundreds of leading CPA firms and Value Added Resellers also offer Intacct to their clients. The Intacct system includes accounting, cash management, purchasing, vendor management, financial consolidation, revenue recognition, subscription billing, project accounting, fund accounting, inventory management and financial reporting applications, all delivered over the Internet via cloud computing.
Plex: Plex is the Manufacturing Cloud, delivering ERP and manufacturing automation to more than 400 companies across process and discrete industries. Plex helped develop Cloud solutions for the shop floor, connecting suppliers, machines, people, systems and customers with capabilities that are easy to configure, deliver continuous innovation and reduce IT
2016 Software Sector Outlook
December 18, 2015 55

costs. With insight that starts on the production line, Plex helps companies see and better understand their business ecosystem.
Pluralsight: Pluralsight is the global vendor in online learning for professional software developers, IT specialists and creative technologists. With a large curated professional development platform, the company offers instant access to more than 4,500 courses authored by top experts. With customers in more than 150 countries, Pluralsight serves as a career catalyst, delivering hands-on, practical training for the most in-demand and understaffed jobs of today.
Slack: Slack is a messaging platform for teams that brings all communication together, creating a single unified archive accessible through powerful search. It integrates with dozens of popular services such as Twitter, Dropbox, Trello, Asana, Google Docs, JIRA, MailChimp, Stripe, Zendesk, and others to help consolidate and make sense of the ever-growing flows of data that confront modern teams.
Telogis: Telogis is a platform for connected intelligence, dedicated to enhancing the value of customers’ business through intelligent integration of location technology, information and services. Telogis’ products and services are used and distributed in more than 100 countries worldwide.
Zenefits: Zenefits is a free, SaaS-based HR platform that gives businesses a single place to manage payroll, benefits and compliance - all online, in one dashboard. Employers can sync directly with current payroll, health insurance and other HR systems in seconds, or use Zenefits to set up with new payroll and benefits providers. Once connected, Zenefits helps automate 95% of HR administration work, from benefits enrollment to employee onboarding.
Zuora: Zuora develops Relationship Business Management solutions that help enable businesses in any industry to launch or shift products to subscription, implement new pay-as-you-go pricing and packaging models, gain new insights into subscriber behavior, open new revenue streams, and disrupt market segments to gain competitive advantage. Zuora clients come from a wide range of industries, including media, travel services, consumer packaged goods, cloud services, and telecommunications.
Next-gen security software: Alert Logic: Alert Logic provides Security-as-a-Service for on-premises, cloud and hybrid infrastructures by delivering security insight and continuous protection for customers at a lower cost than traditional security solutions. Fully managed by a team of experts, the Alert Logic Security-as-a-Service solution provides network, system and web application protection immediately, wherever a customer’s IT infrastructure resides.
Alfresco: Alfresco provides modern enterprise content management software built on open standards that enables organizations to unlock the power of business-critical content. With the controls that IT demands and the simplicity that end users love, Alfresco's open-source technology enables global organizations to collaborate more effectively across cloud, mobile, hybrid and on-premise environments.
Cloudflare: Cloudflare helps improve the performance of Internet applications, protects from attacks, ensures applications are always online and makes it simple to add web apps with a single click. Regardless of size or platform, CloudFlare improves Internet applications with no need to add hardware, install software or change a line of code. The CloudFlare community gets stronger as it grows: every new application makes the network smarter. More than 5%
2016 Software Sector Outlook
December 18, 2015 56
of global Internet requests flow through CloudFlare's network experienced by more than two billion people each month.
Okta: Okta is a provider of secure connections between people and technology. The products use identity information to grant people access to applications on any device at any time, while still enforcing strong security protections. The platform lets thousands of organizations securely connect to customers and partners.
Tanium: Tanium provides enterprises and government organizations the power to secure, control and manage millions of endpoints across the enterprise within seconds. Serving as the “central nervous system” for enterprises, Tanium empowers security and IT operations teams to ask questions about the state of every endpoint across the enterprise in plain English, retrieve data on the current and historical state and execute change as necessary, all within seconds. With the speed, scale and simplicity of Tanium, organizations have complete and accurate information on the state of endpoints at all times to more effectively protect against modern-day threats and realize new levels of cost efficiency in IT operations.
Zscaler: Zscaler helps protect more than 15 million employees across thousands of enterprises and government organizations worldwide against cyber-attacks and data breaches while staying compliant with corporate and regulatory policies. Zscaler’s Security-as-a-Service platform delivers a safe and productive Internet experience for every user, from any device and from any location. Zscaler effectively moves security into the Internet backbone, operating in more than 100 data centers around the world and enabling organizations to fully leverage the promise of cloud and mobile computing. Zscaler delivers unified, carrier-grade Internet security, advanced persistent threat (APT) protection, data loss prevention, SSL decryption, traffic shaping, policy management and threat intelligence–all without the need for on-premise hardware, appliances or software.
Next-gen analytics: Alteryx: Alteryx is a provider of data blending and advanced analytics software. Alteryx Analytics provides analysts with an intuitive workflow for data blending and advanced analytics that leads to deeper insights in hours, not the weeks typical of traditional approaches. Analysts use the Alteryx analytics platform to deliver deeper insights by seamlessly blending internal, third party and cloud data, and analyze it using spatial and predictive drag-and-drop tools. This is all done in a single workflow, with no programming required. More than 1,000 customers and thousands of data analysts worldwide rely on Alteryx daily.
Domo: Domo is a cloud-based business management platform that transforms the way business is run. Domo provides CEOs and decision makers across the business the confidence to make faster, more effective decisions by providing one place to easily access all the information needed.
Sumo Logic: Sumo Logic is a secure, cloud-native, data analytics service, delivering real-time, continuous intelligence across an organization’s entire infrastructure and application stack. More than 700 customers around the globe experience real-time operational, business and customer insights using Sumo Logic for DevOps, IT ops and security and compliance use cases. With Sumo Logic, customers gain a service model to accelerate the shift to continuous innovation, increasing competitive advantage, business value and growth.
2016 Software Sector Outlook
December 18, 2015 57

Looking at 2017 estimates At this point, we have entirely rolled out 2017 estimates for our universe and are largely using the CY/17 estimates for valuation. As we enter CY/16 and progress through the year, more investors are likely to look forward to CY/17 estimates to gauge valuation, if they are not already. In general, EV/S multiples and the multiple difference between CY/16 and CY/17 valuations appear more attractive for higher growth names. A few names worth highlighting to us when looking at CY/17 estimates and the multiple difference from CY/16 estimates include:
NOW and PANW have the largest multiple differences between EV/S valuations based on CY/16 and CY/17 estimates.
HDP has the fastest revenue growth rate in CY/17 by our estimates and has a multiple differential of 2.0x between EV/S valuations based on CY/16 and CY/17 estimates.
MKTO has revenue growth of 30% in CY/17 by our estimates, but has an EV/S multiple differentiation between CY/16 and CY/17 more in-line with companies that have CY/17 revenue growth in the high-teens to low-20s range.
VRNS has revenue growth of 19% in CY/17 by our estimates, but has an EV/S multiple differentiation between CY/16 and CY/17 more in-line with companies that have CY/17 revenue growth in the high single digits to low double digits.
CA, PTC and TDC trade at essentially the same EV/S multiple on our CY/17 estimates as on our CY/16 estimates.
2016 Software Sector Outlook
December 18, 2015 58

Exhibit 49: CY/16E to CY/17E multiple differences
CY/17E EV/S CY/16E-CY/17E CY/17E EV/S CY/16E-CY/17E
Ticker Y/Y Rev Growth CY/16E CY/17E Multiple Difference Ticker Y/Y Rev Growth CY/16E CY/17E Multiple Difference
NOW 32% 9.9X 7.5X 2.4X CHKP 7% 8.3X 7.7X .6X
PANW 30% 10.4X 8.0X 2.4X FTNT 18% 3.7X 3.1X .6X
WDAY 33% 9.4X 7.0X 2.3X LOGM 16% 4.5X 3.9X .6X
HDP 46% 6.2X 4.2X 2.0X ANSS 8% 7.2X 6.7X .5X
SHOP 35% 6.4X 4.7X 1.7X INTU 11% 5.5X 5.0X .5X
SPLK 30% 7.3X 5.7X 1.7X MIME 20% 2.7X 2.2X .5X
ZEN 32% 7.1X 5.3X 1.7X QLIK 17% 3.6X 3.0X .5X
DATA 32% 6.8X 5.2X 1.6X RP 12% 3.4X 3.0X .4X
N 28% 6.9X 5.4X 1.5X MSFT 7% 4.0X 3.8X .3X
PFPT 28% 7.0X 5.5X 1.5X VRNS 19% 2.2X 1.9X .3X
QTWO 29% 6.6X 5.2X 1.5X CVLT 9% 2.3X 2.1X .2X
ADBE 21% 7.7X 6.4X 1.3X ININ 17% 1.2X 1.1X .2X
DWRE 29% 5.7X 4.4X 1.3X LOCK 13% 1.5X 1.3X .2X
ULTI 22% 7.4X 6.1X 1.3X NICE 7% 3.1X 2.9X .2X
ELLI 25% 5.9X 4.7X 1.2X SAP 6% 4.3X 4.1X .2X
CRM 19% 6.6X 5.5X 1.1X BCOV 9% 1.4X 1.2X .1X
IMPV 21% 6.6X 5.4X 1.1X CTXS 3% 3.8X 3.7X .1X
MKTO 30% 3.7X 2.8X .9X ORCL 3% 4.0X 3.9X .1X
QLYS 22% 5.1X 4.2X .9X VRNT 7% 2.4X 2.2X .1X
BNFT 21% 4.5X 3.7X .8X CA 0% 2.8X 2.8X .0X
FLTX 17% 5.5X 4.6X .8X PTC -1% 3.6X 3.6X .0X
ADSK 14% 5.8X 5.1X .7X TDC -1% 1.4X 1.4X .0X
RHT 13% 6.1X 5.4X .7X SYMC -6% 3.2X 3.4X -.2X
Average 27% 6.7X 5.3X 1.4X Average 9% 3.5X 3.2X .3X
Source: FactSet, priced as of December 16, 2015
2016 Software Sector Outlook
December 18, 2015 59

Top Ideas for 2016 Top large-cap software names (in alphabetical order)
ADBE long thesis: A Seamless Transition Analyst: Ross MacMillan; Market Cap: $49.0B
1. Moving back into a more attractive part of the transition: We think ADBE is set to move from the mid-stage of its model transition to the late-stage, where revenue, EPS and CFFO accelerate. While metrics such as sub adds and ARR will remain relevant, we think investor focus will shift to accelerating fundamentals in the income statement which can drive outperformance.
2. A larger creative opportunity: TAM gets larger with 16.9M core users for Creative, well ahead of the the 12.8M provided 2 years ago. In addition, the company believes there is an additional 11.7M potential users driven by growth in the Creative Community, Student and Teacher penetration and conversions from the piracy. Market and Value expansion provide additional upside.
3. Few believe the 15% Opex guide: We understand increasing spend in Digital Media to reach beyond low hanging fruit, but still struggle to reach the levels of opex growth implied by management's guidance. Management's implied 15% Opex CAGR in the FY15–18 period means an absolute dollar figure of ~$1.4B of Opex FY15–18 vs. the ~$352M that the company added in FY12–15. We believe low double digit growth is more likely.
4. Digital marketing business well-positioned: Given the secular growth of the end market and the competitive position of ADBE’s products, we think the bias of risk is for higher growth in this segment of the business. Recent bookings trends have been above the targeted 30% growth.
The biggest risks to our long thesis: i) Sub adds have become more volatile as the cycle has matured, and mix issues will have hard to forecast effects on Volume/Price; ii) FX impact has become more meaningful as the rolling hedge rolls; iii) the bull case on Adobe seems consensus.
Price Target: Our base case is 25x our FY18 EPS estimate of $5.00 discounted back one year by 10%, which yields a $112 price. This is above the historical 22x NTM P/E ratio reflecting higher growth (+30% Y/Y for EPS) and the higher percentage of recurring revenue in the model (>90% by FY18).
2016 Software Sector Outlook
December 18, 2015 60

MSFT long thesis: A reinvigorated juggernaut Analyst: Ross MacMillan; Market Cap: $455.0B
1. Growth pivot coming closer: We edge closer to the pivot in growth (F2H16) as the Office transition and momentum in Server products/Azure continue to build. We remain convinced that in F2H16 (i.e., the first half of CY16) revenue, gross profit, earnings and cash flows should pivot to growth which should accelerate into FY17.
2. AWS and Azure = A two-horse race: We believe it is becoming increasingly clear that the battle for public cloud infrastructure is a two-horse race between MSFT and AMZN and that these businesses can be very profitable at scale. We estimate MSFT's incremental cloud GMs are 75%+. Meanwhile AWS just reported NG OMs of ~25% for 3Q15.
3. Operational expenses under control: Opex was guided to be flat in FY16 vs. FY15. Given that FY15 opex ultimately came in ~$2B below the initial guide ($0.5B due to underlying core reductions) this is a good starting point and remains a source of misvalued upside.
4. Enterprise Strength and Server Licensing growth: MSFT remains confident in its ability to grow Server Licensing revenue vs. investor fears that price tailwinds will diminish. There is still a price envelope between its products and market leaders such as VMware in server virtualization and Oracle in relational database. MSFT’s hybrid cloud strategy appears to be kicking into gear.
5. Focus on cash flow: We think a combination of factors including the forthcoming Windows revenue deferrals, the shift of the business to more subscription revenue and the lagged impact from FX on the income statement means that management will increasingly emphasize CFFO and FCF as measures of the health of the business.
The biggest risks to our long thesis: i) Higher levels of operating expense and/ or no improvement in capital allocation; ii) deterioration in enterprise demand trends in the commercial segment; iii) worse-than-expected weakness in PC demand and hardware.
Price target: Our base case of $57 reflects 14x our FY17E FCF/ share estimate of $3.57 plus $6 adjusted net cash per share at the end of FY16E. This valuation is also supported by our sum-of-the-parts valuation and our DCF that assumes 4% revenue CAGR, 33% terminal operating margins, and a 25% terminal tax rate.
2016 Software Sector Outlook
December 18, 2015 61

PANW long thesis: Next-generation security in a breached world Analyst: Matthew Hedberg; Market Cap: $17.0B
1. Well positioned in a top-of-mind market: We feel Palo Alto is well positioned to excel in a $19.5B security market by CY/17 that is expected to grow 7% annually and would expect outsized growth for Palo Alto.
2. Land, expand and retain: a. Land: Over 22.5K customers vs.13.5K and 9K in FY/14 and FY/13. b. Expand: Customers added in 2009 have increased lifetime value 6x with the top 25
customers 20x+. c. Retain: Retention rates are over 85%.
3. Integrated product platform, a key differentiator: With the recent addition of its endpoint solution Traps, Palo Alto's highly integrated product platform now covers cloud, endpoint and network. There are five subscription services (four can attach to an appliance) and as of Q4/15, the attach rate was 2.2 per box (was 2.1 in Q4/14) and is expected to increase.
4. Opportunity for LT margin expansion: Though investing for growth, we expect leverage to drive margin expansion to over 24% by FY/17 according to our estimates vs. 12.9% in FY/15.
5. Growth in subscriptions and WildFire: Palo Alto offers five subscription services including its cloud-based WildFire offering that launched in 2011 and has over 8K paid premium subscribers as of Q1/16.
The biggest risk to our long thesis: i) increased macro volatility; ii) the potential for increased competition from larger vendors; iii) dependency on large channel partners: in the most recent quarter three channel partners represented 69% of total revenue.
Price target: Our price target of $205 is calculated using 26.5x our CY/17 FCF estimate, vs. leading growth peers at 50x.
2016 Software Sector Outlook
December 18, 2015 62
CRM long thesis: Cut and Paste Execution Analyst: Ross MacMillan; Market Cap: $54.6B
1. New products are expanding the TAM: The core CRM market was a $19B market in 2014 and is growing at 15%, implying the company has around 28% market share. However, Platform (PaaS is a +$3B market growing ~23%, according to Gartner) and Analytics (BI is a $15B market growing ~8%, according to Gartner) significantly expand the TAM opportunity. Wave analytics reception from customers has been highly positive, and full Wave capabilities will be sold as a separate SKU on top of editions, although some very basic functionality (related to data within Sales Cloud, etc.) is provided for free to customers in apps. The newly announced Internet of Things cloud also represents untapped business opportunities.
2. Large Enterprise Dynamics continue to improve: We expect to hear of more success in enterprise accounts as the sales organization under Keith Block begins to find stronger traction. Salesforce has begun launching vertical solutions, such as for financial services and health management, and we expect more to be forthcoming.
3. International remains an area of focus and expansion: We continue to view CRM’s <30% of revenue from international sources as a large opportunity for the company.
4. Confident margin commentary: The company is (over) delivering on its promise of operating margin expansion and has the ability to continue on a path of margin expansion for some time. At the same time, stock-based comp as a percentage of sales is now <10% and will continue to move lower modestly over time.
The biggest risks to our long thesis: i) A more acute deceleration in billings growth than expected; ii) a failure to achieve stronger traction in enterprise accounts; iii) a major operating margin dilutive acquisition; and iv) the failure of new product initiatives to achieve adoption, such as Salesforce1 and Wave analytics.
Price target: Our $90 price target reflects 34x our FY18 (CY17) FCF/share estimate of $2.52 plus $4 net cash per share at the end of FY17 (CY16). This also represents 6.5x FY18 (CY17) estimated revenues at the end of CY16. The multiple reflects a modest premium to our forward two-year FCF growth estimate of 30% and a discount to the 39x forward multiple average of the last five years, reflecting slowing billings and revenue growth.
2016 Software Sector Outlook
December 18, 2015 63

NOW long thesis: ERP for IT Analyst: Matthew Hedberg; Market Cap: $14.7B
1. Above market growth opportunity from large customers: NOW expects to have 50% of the Global 2000 as customers by 2020 (15-20 new/quarter) and generate ~$2M in ACV from each. Assuming large customers account for ~50% of business, this paints the path to $4B+ in revenue, which we view as achievable.
2. Growth formula = land + expand + retain: Land: 2,804 customers in Q3/15 vs. 2,176 y/y. Expand: ~37% of total ACV comes from upsells. Retain: 98% customer retention rates in FY/14 vs. 96% in FY/13.
3. Conservative expectations: FY/15 consensus revenue growth of ~47% likely shows upside based on Q4/15 results, while in FY/16 we believe the consensus growth rate of 37% could end up north of 40%.
4. Opportunity for long-term margin expansion: Over time, we expect margins to improve with revenue and approach 20%+. As margins scale, we believe investors could begin to value shares on a multiple of FCF.
5. Seasoned management team: The management team includes many former executives from Data Domain, which sold to EMC in 2009. The quality of the management team gives us confidence as the company rapidly increases in scale.
The biggest risk to our long thesis: i) macro-economic volatility; ii) increased competition from both pure-play competitors and from larger competitors in the market; iii) the ability to hire quality talent.
Price target: Our $90 target assumes shares trade at 8.3x our 2017 sales estimate, a premium to SaaS peers at 4.5x, but essentially in-line to vendors such as WDAY, SPLK and DATA.
2016 Software Sector Outlook
December 18, 2015 64

SPLK long thesis: Transcendent operational intelligence Analyst: Matthew Hedberg; Market Cap: $7.4B
1. Large addressable market opportunity: The TAM is significant with core markets sized at $45B comprised of IT operations at $22B, application delivery at $11B, security, compliance and fraud at $2B, business analytics at $5B and industrial data and Internet of Things at $4B.
2. Growing customer base: Splunk has over 10.5K customers, up from 1K in 2009, 100 in 2006 and one in 2005. New customers added a quarter totaled 200-300 in 2011-2012, 300-400 in 2013-2014 and 400-500 are expected in 2015-2016.
3. Customer base driving bookings as deal sizes move higher: In 2015, ~79% of license bookings were from the install base vs. 73% in 2014, 76% in 2013 and 68% in 2012. This is driving deal sizes higher with 1,112 deals over $100K in 2015 (224 new customers) vs. 791 in 2014 (203 were customers) and 72 in 2010 (28 new customers). Customers are indexing 8x the information and spending 5x the dollars and 4x the license dollars four years after the initial purchase.
4. Security use cases shine: Security has an increasingly important role following the acquisition of Caspida and its behavioral analytic capabilities, adds cross-sell opportunities and provides new entry points into customers.
5. Opportunity for long-term margin expansion: Though focused on growth, operating margins of 20-25% are targeted approximately five years from now vs. operating margins of approximately 3% today.
The biggest risk to our long thesis: i) increased macro volatility; ii) the potential for increased competition from open source alternatives; and iii) a premium valuation.
Price target: Our $85 price target is based on a 10.4x multiple on our CY/17 revenue estimate compared leading software peers at 7.3x.
2016 Software Sector Outlook
December 18, 2015 65

WDAY long thesis: 2016 the tipping point for Financials? Analyst: Ross MacMillan; Market Cap: $17.5B
1. Financial Management continues making progress: Workday continues to improve its Financial Management offering, and now believes it can scale to support 200M journal lines, enough to address up to a Fortune 250 company. Though not as attention grabbing as Flextronics using HCM was back in 2011, the AON signing was encouraging. We believe other large customers are in the sales cycle. Also encouraging is that FM will be sold by the full sales force rather than an overlay in 2016.
2. Flexibility on terms masks bookings strength: The company has become more flexible on payment terms, especially on large platform (FM + HCM) deals. This creates near-term headwinds in billings/ sub revenue that obscure stronger fundamentals. Management recently estimated that it was a 2pp headwind to F3Q16 billings, will be 5pp off F4Q16 billings and 5pp off FY17 subscription revenue. The coming disclosure of both FY-end backlog and average duration changes will provide better visibility into true business strength. We think it is possible that growth re-accelerates in FY18 as the effect normalizes.
3. Potential for upside surprises: We model billings growth slowing from 40% in FY16 to 32% in FY17 and revenue growth slowing from 47% to 35%, in-line with preliminary guidance for above 30%, despite ~18% upside in FY15 and 7%+ in FY16. Our margin assumptions include only modest improvement, with operating margin rising by 2% after 12% and 6% increases in FY15 and FY16, respectively. Faster uptake on Financial Management could be a catalyst for beats.
4. Valuation is Still High, but not crazy relative to other higher growth leaders: WDAY has traded at a wide range of multiples, from a low of 5.6x forward EV/Sales (a few months post-IPO), to a high of 22.9x (during the early-2014 SaaS run-up), with an average of 14.0x. It currently trades at 9.9x the forward consensus. We look for high growth rates to support continued high multiples. With FCF turning positive this fiscal year, and operating profitability likely in FY17, we are nearing the point when other valuation metrics can be used as well.
The biggest risks to our long thesis: i) lower than expected growth due to execution and/ or competitive issues; ii) a lack of operating margin/ FCF leverage; iii) material change in management.
Price target: Our $89 PT is based on 8.2X FY18 E(CY17) EV/Sales at the end of CY16, much lower than the company's 14.1X average NTM multiple, and modestly above our 6.5X multiple on CRM due to its faster growth and optionality around the financials management opportunity. We support this target with a DCF, which assumes 24% revenue CAGR over the next 10 years, terminal operating margins of 35%, and WACC of 10.5%.
2016 Software Sector Outlook
December 18, 2015 66

Top small-cap software names (in alphabetical order)
DWRE long thesis: Alive and Kicking Analyst: Ross MacMillan; Market Cap: $2.1B
1. Moderated sub growth sets a reasonable bar: Management reaffirmed guidance for the year (given Oct trends) at the recent analyst day in November, provided an initial guidance range for FY16 and gave a growth vs. margin framework for the medium term. While 30-35% sub growth for 2016 was lower than our/Street expectations of 35%, we believe this is a sensible reset that was needed given the current retail environment.
2. DWRE is a share gainer in a large market: We highlight that underlying GMV growth has been slowing, although still growing in excess of overall e-commerce/ e-commerce apparel category growth. We attribute this to the law of large numbers, customer mix and some impact from softer current trends. We think above-market growth is sustainable for some time given geographic, site and brand expansion. Our new sub rev estimate for CY16 of $265M can be reached with steeper same customer GMV deceleration in CY16 (-7%) vs. CY15 (-5%).
3. Shared success model intact: We think the scalable pricing solution that Demandware goes to market with is still competitive. As the cost of servicing customers grows with scale, there needs to be a similar mechanism. Tying it to traffic, CPU cycles or other engagement metrics tends to have difficulties in translation to dollar amounts – GMV has been the best metric thus far. Views from IDC, Coach, and Wolverine Worldwide don't seem to imply that this is unsustainable.
4. Still ahead from a competitive viewpoint: We believe the issues that Demandware faced over 2015 reflect weak customer fundamentals and not a change in the competitive environment. However, we do continue to monitor potential change, as incumbents focus more on cloud (e.g., SAP Customer Experience and Commerce and Oracle Commerce Cloud) and new entrants expand upmarket. Two points: i) Shopify doesn’t compare for enterprise solutions of size given its small customer base, and ii) Magento is seeing competitive disruption through its sale to PE and re-platforming process.
The biggest risks to our long thesis: i) Continued weakness in end-customer health; ii) failure to achieve success at the high end of the market where ORCL, IBM and SAP dominate today; iii) high levels of ongoing investment that could delay operating leverage in the model; and iv) the risk of change to the variable pricing model.
Price Target: Our base case is 6x our CY17 sales estimate of $384M, which equals $60. This is well below the company's historical average of 8x NTM EV/ Sales ratio. We believe this multiple is justified by underlying revenue growth (35%) and revenue per customer (~8%) and is supported by our DCF.
2016 Software Sector Outlook
December 18, 2015 67
ELLI long thesis: Should Rebound in anticipation of 2H16 Analyst: Ross MacMillan; Market Cap: $2.1B
1. Slowing growth, but still likely better than RBC/ Street. Management remains confident in 25% revenue growth in CY16, despite negative mortgage volumes expected in 1H16 given the backlog of users set to go live and increasing revenue per user/ loan. Both we and Street are modeling revenue modestly below the 25% target.
2. Opportunity to take market share: Out of 700K licensed mortgage professionals, the company now has 135K active Encompass users, or just under 20% penetration. We estimate Ellie Mae will process 1.4M loans this year; assuming an average mortgage value across refinancings and purchases of $270K, the company is on pace to process a ~25% of US mortgages. Signing a top five originator would help drive a meaningful increase in these shares, and we believe this is possible in 2016.
3. Revenue per loan can increase from today’s ~$120: Revenue per loan increased by 22% Y/Y in CY14 to $100 and the company expects a further increase of ~20% to ~$120 in CY15. Importantly, if every user adopted every product in the portfolio today, management believes the company could generate $320 per loan.
4. Mortgage volumes still low historically: Averaging Mortgage Bankers Association, Freddie Mac and Fannie Mae data and estimates, mortgage-origination volumes in 2015 will be 20% below the 1997-2014 average, and less than half of the 2003 peak. From a demographic perspective, there are 4.6M 24 year olds (more than any other age group, including the baby boomers) and these individuals will move into key first time home buying in the next five years.
5. Reasonable expectations: Close to 40% of total revenue tied to mortgage-origination volumes, and the MBA/Fannie/Freddie consensus currently shows a 13% decline in 2016. Flat volumes from 2015 would boost 2016 revenue by $16M, or 5%, and we believe growth is more likely.
6. In-line valuation on revenue despite already good margins: ELLI stock trades at an EV/Sales of 6.6x our 2016 estimate, in-line with its mid-cap comps. However, the company is growing at a rate comparable to its peers, while earning stable operating margins above 20%, giving it a PE of 34x, well below the comp median of 52x.
The biggest risks to our long thesis: i) Post RESPA/TILA (TRID) could slow new user growth; ii) a decline in mortgage-lending volumes would hurt variable revenue; iii) increased origination share by mega-lenders.
Price target: Our $80 price target reflects EV/sales of 6.5x our CY17 revenue of $385M. Our PT is also 30X our CY17 NG EPS estimate and 20X CY17 EV/EBITDA. Our base case is supported by a DCF analysis, which assumes a 16% long-term revenue CAGR, 35% terminal operating margins and a WACC of 8.6%.
2016 Software Sector Outlook
December 18, 2015 68

HDP long thesis: Once in a decade replatforming opportunity Analyst: Matthew Hedberg; Market Cap: $1.3B
1. A pioneer in Hadoop: Hortonworks is the only distributor of Hadoop that is 100% open source and powered by YARN, the next-generation computing and resource-management framework it developed that is estimated to be a $10B+ market by 2017.
2. Hortonworks Data Platform (HDP): is a 100% open-source distribution of Hadoop that is enterprise grade and built, tested and hardened with enterprise use in mind. All data is integrated into data lakes that enables increased scope and depth of data management.
3. The flywheel continues to accelerate: YTD 376 customers have been added (land), more than doubling the customer base while renewals (expansion) have made up over 10% of business. Hortonworks could have more customers than any independent Hadoop provider by year-end.
4. Subscriptions billings have accelerated this year: Subscription billings grew 118% in Q1/15, 120% in Q2/15 and 129% in Q3/15. Guidance for Q4/15 implies 101% growth and we think there could be some upside in a seasonally strong quarter.
5. Hortonworks DataFlow: While still early, the acquisition of Onyara has created Hortonworks DataFlow (HDF), that supports data in motion and should be an additional product and complementary to HDP that supports data at rest. Simplistically, HDF has the ability to double the size of a subscription.
The biggest risk to our long thesis: i) increased macro volatility; ii) relatively early stage of the company and market; iii) the somewhat evangelical nature of sales; iv) a potential for additional funding to reach profitability.
Price target: Our $36 target is based on a 9.1x multiple on our CY17 revenue estimate.
2016 Software Sector Outlook
December 18, 2015 69

MIME long thesis: Attractive opportunity and below-peer valuation Analyst: Matthew Hedberg; Market Cap: $0.6B
1. A number of growth drivers: We see several including: 1) attractive end markets of email security, archiving, and continuity, as email is often one of the larger threat vectors into an organization; 2) competitive share shifts from Intel/McAfee, Symantec/Veritas, and Cisco; 3) the migration to cloud-based email services such as Office 365; 4) growing customer base more quickly than expected; 5) cross-sell products such as Target Threat Protection back into the install base; 6) the introduction of new products; and 7) enhanced global distribution capabilities.
2. Disrupting a large market: We believe the total addressable market or TAM is $9.7B today and could grow to $13B by 2019. Much of this market is held by legacy vendors such as Cisco, Symantec/Veritas, IBM, Intel/McAfee, etc., and we would expect cloud-based vendors like Mimecast to take an above-average amount of share.
3. Impressively low churn and high gross retention aid in visibility: On an annual basis, Mimecast sees a very low 3% customer churn, 3% down-sell, and a high 13% upsell. This leads to a gross retention rate of 107%, which aids in revenue predictability, as ~87% of forward 12-months revenue is visible on day one of a new year.
4. Attractive cross-sell opportunity: With more than 15,200 customers (added 750+ in Q2/16), we see a large opportunity to sell additional products into its base of customers that, on average, use 2.5 of seven key products.
5. Significant currency exposure: In FY/15, 61% of revenue was from outside the USD, and as such, the company has seen FX negatively affect results by ~800 bps in the last several quarters.
6. Healthy EBITDA margins for a company of its scale: EBITDA margins were 12% in FY/15, and while they are likely to be reduced slightly over the next several years on added investments, we see a path back to 20-22%, which should aid in valuation.
The biggest risk to our long thesis: i) increased macro volatility; ii) the potential for increased competition from larger vendors; iii) achieving sustainable profitability; iv) any future service outages.
Price target: Our price target of $15 is calculated using 3.7x our CY/17 sales estimate, vs. peers at 4.4x.
2016 Software Sector Outlook
December 18, 2015 70

PFPT long thesis: Security-as-a-Service Analyst: Matthew Hedberg; Market Cap: $2.6B
1. Strong momentum likely to continue: Continues to have success replacing legacy competitors and cross/up-selling new products such as TAP and social media archiving. The recent McAfee end of life of their email security solution could also drive upside in 2016.
2. Strong modular product portfolio and technology architecture are key differentiators: Products are modular in nature and enable the purchase of any product or combination of products that customers may need and products can be easily added as desired.
3. Customer base and product portfolio should provide ample opportunity to expand deployments and drive repeat sales: We believe there is ample opportunity to expand deployments across the user base as we believe only one-third of customers have more than one product, and less than 5% have purchased all major products. Additionally, we believe TAP is only 20% penetrated into the install base and has the opportunity to double the ARPU and could be deployed much further within their install base, in our opinion.
4. Strong growth profile and scalable financial model should drive significant margin expansion through breakeven and beyond: Billings growth has exceeded 30% for nine consecutive quarters. Though the focus has been on driving growth, we believe operating margins can scale toward the 20% level over the longer term.
5. One of the most attractive acquisition targets in software: PFPT is one of the more unique security assets available and would complement the scaled out solutions of a number of larger vendors.
The biggest risk to our long thesis: i) increased macro volatility; ii) the potential for increased competition from larger vendors; and iii) a lack of margin expansion.
Price target: Our $75 price target is based on a 6.9x multiple on our 2017 sales estimate. This is a premium to the security comparable group at 5.4x, but is in line with other leading peers.
2016 Software Sector Outlook
December 18, 2015 71

QLIK long thesis: Early success of Qlik Sense, attractive entry point Analyst: Matthew Hedberg; Market Cap: $3.0B
1. Bullish towards next-gen BI: We believe Qlik is a disruptive force due to its fresh take on Business Intelligence (BI) and represents an attractive alternative/complement to legacy BI vendors. As a pure play on big data, Qlik remains well focused on garnering a larger portion of BI spend through a unique product portfolio and land-and-expand strategy.
2. Qlik Sense: One of the most important product releases to date has gotten off to a fast start with several large Sense deals and one that was over $1 million as a stand-alone deal. We were pleased with the demos we saw at Qlik's user conference and believe the goal of three Sense releases per year should help raise the bar.
3. Improved execution: The company has made some organizational and process changes to the pipeline that should help with the timing of larger deals and productivity of added sales resources should continue to materialize.
4. Subscription tokens: The success of tokens could lead to a transition towards more recurring revenue, which we think would be a positive.
5. Expanding distribution: The company is ramping its strategic partner network. We see this as one of the most promising opportunities as SIs such as Accenture, PWC and Deloitte could become a large opportunity.
The biggest risk to our long thesis: i) increased macro volatility; ii) return of execution issues; and iii) increased competition from DATA, new entrants and legacy competitors.
Price target: Our $45 target assumes shares trade at 5.0x our 2017E sales vs. the peer mean of 4.5x and QLIK's historical average of 5.2x.
2016 Software Sector Outlook
December 18, 2015 72

SHOP long thesis: Multi-quarter inflection of fundamentals Analyst: Ross MacMillan; Market Cap: $2.4B
1. A better entry point: We have insight into two quarters of solid management execution, have raised our estimates materially and therefore have de-risked the downside. Shopify has struck partnerships, increased feature functionality, and extended differentiation in the competitive landscape. We remain significantly above consensus for 2016 and 2017 revenues. (2016: $307M vs. consensus of $283M and 2017: $451M vs. consensus of $383M).
2. Improved competitive dynamics: Amazon exiting Webstores and selecting Shopify as a preferred migration partner was a large and important vote of confidence. We note that the Amazon Webstores shutdown should be accretive to merchant adds in 2016. From our recent conversations at Shop.Org’s digital summit, we’ve also picked up that BigCommerce is trying to de-emphasize the SMB portion of their business and move toward the mid-market. Magento’s sale (as part of eBay Enterprise) could mean potential disruptions at the company as well.
3. New monetization opportunities: We gain incremental conviction on new monetization opportunities. Shipping has the potential to increase take rate on GMV and be accretive to gross margins on the merchant solutions business. We think shipping revenue can be meaningful over the next two years: Our current model largely excludes any impact from shipping, although the ramp with shipping will be slower than with payments (payments had a big incentive with the elimination of transaction fees). Shipping is being provisioned initially with a partner (Parcel Partners) who has negotiated volume discounts. Over time, as shipping volumes grow, we expect the company to negotiate rates directly, leading to improving margins. Furthermore, the new sales channel initiatives across Pinterest/Facebook/Twitter, and expanded partnership with Amazon are likely to increase both merchant additions and merchant success.
4. Accelerating fundamentals: Improving metrics across all lines (MRR, Merchant growth, MRR per merchant, GMV per merchant) imply success in driving mix toward higher value merchants and/or migrating successful merchants up plans.
The biggest risks to our long thesis: i) Heightened competition from other pure-play commerce platforms, web site builder/hosting companies and potentially large internet assets; ii) gross margin pressure as Merchant Solutions grows faster than subscriptions; iii) high churn on the SMB base resulting in a drag on financials; iv) technical overhang as VCs conduct unmananged sales vs. formal secondary offerings.
Price target: Our $39 price target is based on the stock trading at a blended 7x our CY17 EV/ Sales estimate of $451M (8x on 2017 Subscription solutions Revenue and 6.5x on Merchant Solutions ), emphasizing that Merchant Solution gross profit dollars remain fully incremental to the core recurring revenue stream. The price target is also supported by our DCF that assumes the company achieves ~12% unit market share and 25% higher ARPU by 2022.
2016 Software Sector Outlook
December 18, 2015 73
ZEN long thesis: Building out, moving up, growing fast Analyst: Ross MacMillan; Market Cap: $2.6B
1. New offerings can drive upside & improve stickiness: Zendesk just GA’d its Advanced Voice product, which we see as adding about $140M to its TAM. The company also recently added integration into Facebook Messenger for its chat support offering, and bought BIME to improve its analytics and reporting. Continued additions will help the company address more of the methods that customers need covered, which we believe will help it both with adding new customers, as well as retaining existing ones.
2. Moving further into the enterprise: Zendesk originally was heavily concentrated in small and mid-sized businesses. While that remains the bulk of its customer base, it has steadily grown its large customers very well, with 100+ seat customers now account for 31% of Monthly Recurring Revenue, from 18% 2 years ago. Further moves upmarket will allow the company to continue growing at an impressive clip.
3. Margins improving despite investment for rapid growth: After investing in achieving scale in 2014, growth has been profitable since, with YTD operating margins improving by 14 percentage points in 2015. We are currently modeling the company will improve its operating margin by 2% in 2016, and 3% in 2017, while revenue grows 44% and 38%. We think there is upside potential to both lines.
4. VC overhang largely gone, and valuation vs. growth is compelling: The company’s venture capital investors accounted for nearly 50% of ownership at the time of its 2014 IPO. These holders have been selling down their stakes, which has pressured the stock, but we believe they now account for ~10% of the total, limiting the remaining impact of further sales. The stock is trading at an EV/Sales of 8.2x our CY16 estimate, above comps, but less so than its growth advantage.
The biggest risks to our long thesis: i) Competitive threats exist at the high-end of the market; ii) it is hard to stay differentiated; iii) unit economics could change over time.
Price target: Our $31 price target is based on the stock trading on 7x our CY17 EV/Sales estimate of $409M. This is a modest premium to the NTM EV/S multiple of 6.5x since coming public and reflects our conviction in sustaining >40% revenue growth and a path to positive FCF. Our DCF assumes the company achieves $1.7B of revenue in a decade (~23% CAGR), which would represent ~10% of the market at that time.
All statements in this report attributable to Gartner represent RBC Capital Market’s interpretation of data, research opinion or viewpoints published as part of a syndicated subscription service by Gartner, Inc., and have not been reviewed by Gartner. Each Gartner publication speaks as of its original publication date (and not as of the date of this research report). The opinions expressed in Gartner publications are not representations of fact, and are subject to change without notice.
2016 Software Sector Outlook
December 18, 2015 74

Exhibit 50: Large cap comp sheet
($MM, except per share amounts)
Large Cap Software (>$10B) Price Market Ent. Growth Growth
Ticker Rating PT Analyst 12/16/15 Cap Value CY15e CY16e Y/Y CY15e CY16e CY15e CY16e Y/Y CY15e CY16e CY15e CY16e CY15e CY16e CY15e CY16e
Adobe Systems Inc ADBE Outperform $112 Ross MacMillan $96 48,957 46,876 4,794 5,727 19% 9.8x 8.2x 2.08 2.71 31% 46.0x 35.2x 45.9x 34.7x 1,729 2,154 27.1x 21.8x
Autodesk Inc ADSK Sector Perform $67 Matthew Hedberg $62 14,163 12,826 2,486 2,105 -15% 5.2x 6.1x 0.74 (0.65) -214% 83.7x NA 84.4x NA 403 (6) 31.8x NA
CA Inc CA Sector Perform $31 Matthew Hedberg $29 12,498 11,697 4,017 4,128 3% 2.9x 2.8x 2.33 2.68 15% 12.3x 10.7x 12.2x 11.3x 1,840 2,040 6.4x 5.7x
Check Point Software CHKP Sector Perform $92 Matthew Hedberg $87 15,728 12,115 1,632 1,783 9% 7.4x 6.8x 4.14 4.51 9% 20.9x 19.2x 20.9x 19.0x 936 993 13.0x 12.2x
salesforce.com CRM Outperform $90 Ross MacMillan $79 54,633 54,363 6,647 8,050 21% 8.2x 6.8x 0.75 1.06 42% 105.5x 74.3x 105.0x 79.9x 1,344 1,596 40.4x 34.1x
Citrix Systems CTXS Sector Perform $82 Matthew Hedberg $79 12,810 12,262 3,234 3,263 1% 3.8x 3.8x 3.81 4.42 16% 20.8x 17.9x 20.4x 17.8x 1,178 1,288 10.4x 9.5x
Intuit Inc INTU Sector Perform $96 Ross MacMillan $99 28,060 28,436 4,505 4,770 6% 6.3x 6.0x 3.09 3.44 11% 32.1x 28.8x 32.1x 27.0x 1,902 2,048 15.0x 13.9x
Microsoft MSFT Outperform $57 Ross MacMillan $56 454,782 393,548 85,866 86,214 0% 4.6x 4.6x 2.51 2.85 14% 22.4x 19.7x 21.5x 19.1x 28,096 27,111 14.0x 14.5x
ServiceNow Inc NOW Top Pick $90 Matthew Hedberg $87 14,730 14,067 1,002 1,373 37% 14.0x 10.2x 0.25 0.51 104% 349.6x 171.4x 312.1x 154.4x 251 345 56.0x 40.8x
Oracle ORCL Outperform $46 Ross MacMillan $39 175,137 164,742 37,493 37,823 1% 4.4x 4.4x 2.63 2.71 3% 14.8x 14.4x 14.9x 14.4x 17,197 17,289 9.6x 9.5x
Palo Alto Networks Inc PANW Outperform $205 Matthew Hedberg $187 16,986 16,023 1,133 1,512 33% 14.1x 10.6x 1.26 2.19 74% 148.6x 85.5x 149.9x 83.4x 214 377 74.8x 42.5x
Red Hat Inc RHT Outperform $90 Matthew Hedberg $79 14,664 13,395 1,972 2,257 14% 6.8x 5.9x 1.80 2.00 11% 43.8x 39.4x 43.7x 38.0x 568 625 23.6x 21.4x
SAP SAP Sector Perform $81 Ross MacMillan $78 95,786 102,389 22,253 23,674 6% 4.6x 4.3x 4.02 4.50 12% 19.5x 17.4x 19.0x 17.2x 8,221 8,973 12.5x 11.4x
Symantec Corporation SYMC Sector Perform $24 Matthew Hedberg $20 14,063 12,446 5,450 3,615 -34% 2.3x 3.4x 1.51 1.05 -30% 13.6x 19.5x 13.6x 18.3x 1,851 1,317 6.7x 9.5x
Workday Inc WDAY Outperform $89 Ross MacMillan $81 17,494 16,106 1,158 1,566 35% 13.9x 10.3x (0.06) 0.06 -200% NA NA NA NA 75 144 214.7x 112.2x
Average 7.2x 6.3x Average 66.7x 136.3x Average 37.1x 25.6x
Median 6.3x 6.0x Median 27.2x 24.2x Median 15.0x 14.2x
EV/ EBITDAEBITDAP/E - StreetSales Est. EV/ Sales EPS - RBC P/E - RBC
($MM, except per share amounts)
Large Cap Software (>$10B) Price P/ FCF Cash/
Ticker Rating PT Analyst 12/16/15 CY15e CY16e CY15e CY16e CY15e CY16e CY15e CY16e CY15e CY16e CY15e CY16e Share 1W 1M 3M YTD LTM
Adobe Systems Inc ADBE Outperform $112 Ross MacMillan $96 1,338 1,645 35.0x 28.5x 1,277 1,565 38.3x 31.3x 14.1x 9.7x 0% 0% 7.78 7% 6% 19% 31% 32%
Autodesk Inc ADSK Sector Perform $67 Matthew Hedberg $62 363 111 35.4x 116.0x 380 141 37.2x 100.4x 9.9x 6.9x 0% 0% 12.35 -2% 2% 32% 3% 9%
CA Inc CA Sector Perform $31 Matthew Hedberg $29 911 914 12.8x 12.8x 947 971 13.2x 12.9x 3.5x 3.4x 4% 4% 5.62 4% 6% 2% -6% -2%
Check Point Software CHKP Sector Perform $92 Matthew Hedberg $87 901 952 13.4x 12.7x 875 926 18.0x 17.0x 11.3x 10.1x 0% 0% 19.87 1% 6% 9% 10% 15%
salesforce.com CRM Outperform $90 Ross MacMillan $79 1,141 1,469 47.6x 37.0x 1,133 1,466 48.2x 37.3x 8.8x 7.3x 0% 0% 1.96 -1% 3% 9% 33% 47%
Citrix Systems CTXS Sector Perform $82 Matthew Hedberg $79 819 858 15.0x 14.3x 821 866 15.6x 14.8x 5.5x 5.1x 0% 0% 11.53 3% 0% 8% 24% 33%
Intuit Inc INTU Sector Perform $96 Ross MacMillan $99 1,162 861 24.5x 33.0x 1,144 854 24.5x 32.9x NA NA 1% 1% 1.67 1% 2% 15% 7% 8%
Microsoft MSFT Outperform $57 Ross MacMillan $56 20,344 23,571 19.3x 16.7x 28,096 27,111 16.2x 16.8x 9.3x 8.2x 2% 3% 11.91 2% 4% 27% 21% 24%
ServiceNow Inc NOW Top Pick $90 Matthew Hedberg $87 208 297 67.6x 47.3x 207 297 71.0x 49.5x 14.0x 10.2x 0% 0% 6.70 1% 4% 17% 29% 37%
Oracle ORCL Outperform $46 Ross MacMillan $39 12,206 13,991 13.5x 11.8x 11,297 12,910 15.5x 13.6x 7.8x 7.3x 1% 2% 11.63 1% 2% 6% -13% -4%
Palo Alto Networks Inc PANW Outperform $205 Matthew Hedberg $187 408 556 39.3x 28.8x 408 556 41.6x 30.6x 29.0x 20.8x 0% 0% 16.05 -1% 18% 2% 53% 61%
Red Hat Inc RHT Outperform $90 Matthew Hedberg $79 623 699 21.5x 19.2x 617 697 23.8x 21.1x 7.7x 6.8x 0% 0% 10.72 0% 0% 10% 14% 35%
SAP SAP Sector Perform $81 Ross MacMillan $78 4,877 5,067 21.0x 20.2x 4,863 4,996 19.7x 19.2x 7.6x 6.9x 2% 2% 4.23 0% 1% 17% 13% 16%
Symantec Corporation SYMC Sector Perform $24 Matthew Hedberg $20 883 274 14.1x 45.4x 931 314 15.1x 44.8x NA NA 3% 3% 4.89 2% 3% 2% -20% -18%
Workday Inc WDAY Outperform $89 Ross MacMillan $81 72 122 223.4x 132.3x 72 122 242.6x 143.8x 17.3x 12.4x 0% 0% 8.81 -3% 1% 13% 0% 3%
Average 40.2x 38.4x Average 42.7x 39.0x
Median 21.5x 28.5x Median 23.8x 30.6x
FCFEV/ uFCFuFCF EV/ Recurr Rev Div Yield
Source: Company reports, FactSet, RBC Capital Markets estimates
2016 Software Sector Outlook
December 18, 2015 75

Exhibit 51: Mid cap comp sheet
($MM, except per share amounts)
Mid Cap Software ($2B to $10B) Price Market Ent. Growth Growth
Ticker Rating PT Analyst 12/16/15 Cap Value CY15e CY16e Y/Y CY15e CY16e CY15e CY16e Y/Y CY15e CY16e CY15e CY16e CY15e CY16e CY15e CY16e
ANSYS Inc ANSS Sector Perform $90 Ross MacMillan $92 8,390 7,613 952 1,021 7% 8.0x 7.5x 3.38 3.64 8% 27.1x 25.2x 27.1x 25.0x 527 556 14.4x 13.7x
Tableau Software Inc DATA Outperform $120 Matthew Hedberg $92 6,647 5,896 651 864 33% 9.1x 6.8x 0.42 0.54 29% 219.5x 170.7x 204.1x 152.2x 78 98 75.2x 60.3x
Demandware Inc DWRE Outperform $60 Ross MacMillan $53 2,099 1,916 235 301 28% 8.2x 6.4x 0.15 0.07 -53% 352.1x 751.4x 465.6x 266.4x 6 9 308.8x 223.4x
Ellie Mae Inc ELLI Outperform $80 Ross MacMillan $64 2,090 1,981 250 299 20% 7.9x 6.6x 1.45 1.84 27% 44.0x 34.7x 43.5x 36.0x 65 85 30.5x 23.3x
Fleetmatics FLTX Outperform $62 Matthew Hedberg $53 2,074 1,917 283 343 21% 6.8x 5.6x 1.39 1.64 18% 38.1x 32.3x 36.3x 30.0x 90 107 21.4x 17.9x
Fortinet Inc FTNT Sector Perform $46 Daniel Bergstrom $32 5,684 4,514 1,011 1,265 25% 4.5x 3.6x 0.51 0.63 24% 62.6x 50.7x 62.1x 47.5x 139 177 32.5x 25.5x
Imperva Inc IMPV Outperform $85 Matthew Hedberg $69 2,243 1,989 230 287 25% 8.7x 6.9x 0.05 0.13 160% 1370.4x 527.1x NA 241.6x 9 15 216.0x 135.2x
NetSuite Inc N Outperform $108 Ross MacMillan $84 6,994 6,897 739 971 31% 9.3x 7.1x 0.21 0.42 98% 399.3x 201.6x 418.3x 236.3x 20 34 350.9x 205.0x
NICE Systems NICE Sector Perform $72 Daniel Bergstrom $59 3,603 2,795 925 984 6% 3.0x 2.8x 3.09 3.36 9% 19.0x 17.5x 18.3x 17.2x 289 308 9.7x 9.1x
Proofpoint Inc PFPT Outperform $75 Matthew Hedberg $66 2,638 2,562 263 341 29% 9.7x 7.5x (0.35) (0.27) 30% NA NA NA NA 4 8 577.2x 314.6x
PTC Inc PTC Outperform $44 Matthew Hedberg $34 3,955 4,349 1,224 1,200 -2% 3.6x 3.6x 2.16 1.84 -15% 15.9x 18.7x 15.9x 18.8x 383 363 11.4x 12.0x
Qlik Technologies Inc QLIK Outperform $45 Matthew Hedberg $31 2,955 2,634 615 708 15% 4.3x 3.7x 0.29 0.42 45% 106.9x 73.8x 103.7x 63.5x 60 81 43.9x 32.4x
Shopify SHOP Outperform $39 Ross MacMillan $26 2,369 2,182 196 307 57% 11.2x 7.1x (0.19) (0.05) 279% NA NA NA NA (2) 11 NA 191.9x
Splunk SPLK Outperform $85 Matthew Hedberg $55 7,353 6,403 650 850 31% 9.8x 7.5x 0.16 0.23 44% 346.4x 241.0x 370.8x 235.2x 23 34 280.7x 189.9x
Teradata Corporation TDC Sector Perform $30 Matthew Hedberg $28 3,897 3,623 2,513 2,432 -3% 1.4x 1.5x 2.01 2.02 0% 13.7x 13.6x 13.2x 11.9x 571 559 6.3x 6.5x
Ultimate Software ULTI Outperform $200 Ross MacMillan $200 6,134 6,014 616 758 23% 9.8x 7.9x 2.55 3.15 23% 78.4x 63.6x 78.2x 63.5x 148 181 40.6x 33.1x
Verint Systems Inc VRNT Outperform $52 Daniel Bergstrom $41 2,599 3,070 1,163 1,225 5% 2.6x 2.5x 3.30 3.50 6% 12.5x 11.8x 12.5x 11.7x 262 282 11.7x 10.9x
Zendesk Inc ZEN Outperform $31 Ross MacMillan $26 2,625 2,345 206 297 44% 11.4x 7.9x (0.30) (0.33) -9% NA NA NA NA 2 (0) 952.1x NA
Average 7.2x 5.7x Average 207.1x 148.9x Average 185.6x 93.2x
Median 8.1x 6.7x Median 62.6x 50.7x Median 42.2x 32.7x
Sales Est. EV/ Sales EPS - RBC EBITDA EV/ EBITDAP/E - StreetP/E - RBC
($MM, except per share amounts)
Mid Cap Software ($2B to $10B) Price Cash/
Ticker Rating PT Analyst 12/16/15 CY14e CY15e CY15e CY16e CY15e CY16e CY15e CY16e CY15e CY16e CY15e CY16e Share 1W 1M 3M YTD LTM
ANSYS Inc ANSS Sector Perform $90 Ross MacMillan $92 341 334 22.3x 22.8x 342 336 24.5x 25.0x 11.2x 10.4x 0% 0% 8.49 1% 2% -1% 12% 14%
Tableau Software Inc DATA Outperform $120 Matthew Hedberg $92 59 108 100.8x 54.5x 58 108 115.3x 61.4x 25.8x 16.9x 0% 0% 10.41 1% 0% 9% 9% 15%
Demandware Inc DWRE Outperform $60 Ross MacMillan $53 (4) 9 NA NA (4) 9 NA NA 9.6x 7.2x 0% 0% 4.63 5% 15% -7% -8% -1%
Ellie Mae Inc ELLI Outperform $80 Ross MacMillan $64 27 27 74.4x 73.7x 27 28 76.4x 76.0x 8.1x 6.6x 0% 0% 3.37 1% 6% -13% 58% 70%
Fleetmatics FLTX Outperform $62 Matthew Hedberg $53 37 53 52.0x 36.3x 38 54 55.0x 38.7x 6.8x 5.6x 0% 0% 4.58 -5% -10% 9% 49% 45%
Fortinet Inc FTNT Sector Perform $46 Daniel Bergstrom $32 244 302 18.5x 14.9x 242 301 23.5x 18.9x 8.5x 6.6x 0% 0% 6.57 -2% -4% -29% 4% 14%
Imperva Inc IMPV Outperform $85 Matthew Hedberg $69 12 28 161.7x 71.8x 12 28 180.9x NA 15.9x 12.1x 0% 0% 7.75 -3% -2% 1% 39% 43%
NetSuite Inc N Outperform $108 Ross MacMillan $84 52 75 133.3x 91.5x 54 75 128.8x 93.2x 11.6x 8.9x 0% 0% 4.49 4% 0% -9% -23% -17%
NICE Systems NICE Sector Perform $72 Daniel Bergstrom $59 250 265 11.2x 10.5x 246 261 14.7x 13.8x 4.6x 4.5x 1% 1% 13.16 0% -5% -3% 16% 19%
Proofpoint Inc PFPT Outperform $75 Matthew Hedberg $66 15 27 167.0x 95.5x 18 31 142.8x 86.1x 10.0x 7.7x 0% 0% 10.39 -3% -8% 6% 36% 45%
PTC Inc PTC Outperform $44 Matthew Hedberg $34 148 217 29.4x 20.1x 162 229 24.4x 17.2x 5.9x 5.7x 0% 0% 2.38 -1% -3% 3% -6% -3%
Qlik Technologies Inc QLIK Outperform $45 Matthew Hedberg $31 43 60 60.8x 44.2x 43 60 68.3x 49.7x 11.5x 9.9x 0% 0% 3.37 0% -1% -23% 0% 5%
Splunk SPLK Outperform $85 Matthew Hedberg $55 93 135 68.5x 47.3x 93 135 78.7x 54.4x 24.7x 17.9x 0% 0% 7.16 -2% -8% -6% -6% 3%
Shopify SHOP Outperform $39 Ross MacMillan $26 (6) (0) NA NA (6) (0) NA NA 19.9x 13.7x 0% 0% 2.07 6% -4% -26% 0% 0%
Teradata Corporation TDC Sector Perform $30 Matthew Hedberg $28 356 364 10.2x 9.9x 361 370 10.8x 10.5x 5.3x 5.3x 0% 0% 6.18 -2% 5% -7% -37% -33%
Ultimate Software ULTI Outperform $200 Ross MacMillan $200 38 85 158.6x 70.5x 38 85 162.2x 71.9x 11.7x 9.4x 0% 0% 4.21 6% 0% 9% 36% 42%
Verint Systems Inc VRNT Outperform $52 Daniel Bergstrom $41 103 153 29.9x 20.1x 129 175 20.2x 14.8x 4.5x 4.3x 0% 0% 4.34 3% -11% -11% -29% -26%
Zendesk Inc ZEN Outperform $31 Ross MacMillan $26 (18) 2 NA NA (18) 2 NA NA 11.4x 7.9x 0% 0% 2.79 -3% 14% 20% 7% 12%
Average 73.2x 110.4x Average 75.1x 122.5x
Median 60.8x 47.3x Median 68.3x 52.0x
uFCF EV/ uFCF FCF PerformanceDiv YieldEV/ Recurr RevP/ FCF
Source: Company reports, FactSet, RBC Capital Markets estimates
2016 Software Sector Outlook
December 18, 2015 76

Exhibit 52: Small cap comp sheet
($MM, except per share amounts)
Small Cap Software (<$2B) Price Market Ent. Growth Growth
Ticker Rating PT Analyst 12/16/15 Cap Value CY15e CY16e Y/Y CY15e CY16e CY15e CY16e Y/Y CY15e CY16e CY15e CY16e CY15e CY16e CY15e CY16e
Brightcove Inc BCOV Sector Perform $8 Daniel Bergstrom $7 223 200 134 146 9% 1.5x 1.4x (0.02) 0.03 -250% NA 222.3x NA 133.4x 7 7 30.4x 27.1x
Benefitfocus Inc BNFT Sector Perform $39 Ross MacMillan $36 1,140 1,106 183 229 25% 6.0x 4.8x (1.93) (1.51) 28% NA NA NA NA (35) (30) NA NA
CommVault Systems Inc CVLT Sector Perform $43 Daniel Bergstrom $40 1,872 1,472 580 617 6% 2.5x 2.4x 0.74 0.85 15% 54.4x 47.3x 54.4x 41.0x 55 66 26.6x 22.4x
Hortonworks Inc HDP Outperform $36 Matthew Hedberg $21 1,339 1,222 121 177 46% 10.1x 6.9x (3.19) (3.25) -2% NA NA NA NA (87) (66) NA NA
Interactive Intelligence ININ Outperform $42 Daniel Bergstrom $32 696 667 389 438 13% 1.7x 1.5x (0.04) (0.09) -56% NA NA NA NA 24 22 27.3x 30.8x
LifeLock Inc LOCK Sector Perform $13 Daniel Bergstrom $14 1,422 1,090 585 662 13% 1.9x 1.6x 0.63 0.77 22% 22.7x 18.6x 23.4x 18.6x 72 100 15.1x 10.9x
LogMeIn Inc LOGM Outperform $90 Matthew Hedberg $68 1,740 1,494 270 322 19% 5.5x 4.6x 1.61 1.80 12% 41.9x 37.5x 42.0x 37.9x 70 81 21.3x 18.4x
Mimecast MIME Outperform $15 Matthew Hedberg $10 554 446 134 160 19% 3.3x 2.8x 0.08 (0.07) -214% 125.3x NA 0.0x NA 16 9 27.9x 49.5x
Marketo MKTO Sector Perform $34 Ross MacMillan $26 1,308 1,199 209 274 31% 5.7x 4.4x (0.73) (0.79) -8% NA NA NA NA (18) (19) NA NA
Qualys Inc QLYS Sector Perform $36 Matthew Hedberg $35 1,329 1,129 164 202 23% 6.9x 5.6x 0.67 0.82 22% 52.3x 42.8x 52.3x 43.4x 54 66 20.7x 17.1x
Q2 Holdings Inc QTWO Outperform $30 Matthew Hedberg $28 1,034 967 108 141 30% 8.9x 6.9x (0.04) (0.33) -88% NA NA NA NA (8) (8) NA NA
RealPage Inc RP Sector Perform $24 Matthew Hedberg $24 1,824 1,746 466 521 12% 3.7x 3.3x 0.53 0.64 21% 44.5x 36.8x 44.6x 37.8x 90 106 19.3x 16.5x
Varonis Systems Inc VRNS Outperform $26 Matthew Hedberg $17 436 331 125 155 23% 2.6x 2.1x (0.55) (0.44) 25% NA NA NA NA (13) (12) NA NA
Average 4.7x 3.7x Average 56.8x 67.6x Average 23.6x 24.1x
Median 3.7x 3.3x Median 48.4x 40.1x Median 24.0x 20.4x
EV/ EBITDAEBITDASales Est. EV/ Sales EPS - RBC P/E - StreetP/E - RBC
($MM, except per share amounts)
Small Cap Software (<$2B) Price Cash/
Ticker Rating PT Analyst 12/16/15 CY14e CY15e CY15e CY16e CY15e CY16e CY15e CY16e CY15e CY16e CY15e CY16e Share 1W 1M 3M YTD LTM
Brightcove Inc BCOV Sector Perform $8 Daniel Bergstrom $7 3 7 66.5x 27.7x 3 7 74.5x 31.0x 1.5x 1.4x 0% 0% 0.71 1% 4% 24% -14% -4%
Benefitfocus Inc BNFT Sector Perform $39 Ross MacMillan $36 (25) (18) NA NA (31) (18) NA NA 6.9x 5.3x 0% 0% 2.72 1% -5% 3% 11% 46%
CommVault Systems Inc CVLT Sector Perform $43 Daniel Bergstrom $40 79 89 18.5x 16.6x 80 89 23.5x 21.0x 4.5x 4.3x 0% 0% 8.59 -1% 2% 12% -22% -17%
Hortonworks Inc HDP Outperform $36 Matthew Hedberg $21 (118) (92) NA NA (118) (92) NA NA 10.1x 6.9x 0% 0% 1.84 7% 31% -16% -22% -22%
Interactive Intelligence ININ Outperform $42 Daniel Bergstrom $32 (7) 2 NA 317.8x (1) 13 NA 53.4x 2.9x 2.3x 0% 0% 6.72 -7% 0% 0% -33% -28%
LifeLock Inc LOCK Sector Perform $13 Daniel Bergstrom $14 98 114 11.1x 9.6x 98 114 14.5x 12.5x 1.9x 1.6x 0% 0% 3.34 0% -1% 54% -23% -13%
LogMeIn Inc LOGM Outperform $90 Matthew Hedberg $68 78 86 19.1x 17.4x 78 86 22.4x 20.3x 5.5x 4.6x 0% 0% 9.53 -3% -5% 4% 37% 46%
Mimecast MIME Outperform $15 Matthew Hedberg $10 11 (7) 109.0x NA 11 (7) 50.5x NA 3.3x 2.8x 0% 0% 1.96 3% 0% 0% 0% 0%
Marketo MKTO Sector Perform $34 Ross MacMillan $26 (19) (19) NA NA (19) (19) NA NA 6.5x 5.0x 0% 0% 2.26 -7% -11% -14% -20% -12%
Qualys Inc QLYS Sector Perform $36 Matthew Hedberg $35 39 57 28.8x 19.8x 39 57 33.8x 23.2x 6.9x 5.6x 0% 0% 5.27 -7% -3% 6% -7% -1%
Q2 Holdings Inc QTWO Outperform $30 Matthew Hedberg $28 (4) (4) NA NA (4) (4) NA NA 8.9x 6.9x 0% 0% 2.01 2% 2% -7% 47% 55%
RealPage Inc RP Sector Perform $24 Matthew Hedberg $24 65 79 26.9x 22.2x 66 80 27.7x 22.9x 5.2x 3.5x 0% 0% 1.66 1% 12% 32% 7% 9%
Varonis Systems Inc VRNS Outperform $26 Matthew Hedberg $17 (8) (3) NA NA (7) (3) NA NA 6.0x 4.9x 0% 0% 4.14 4% 4% -8% -48% -48%
Average 40.0x 61.6x Average 35.3x 26.3x
Median 26.9x 19.8x Median 27.7x 22.9x
uFCF EV/ uFCF FCF PerformanceDiv YieldEV/ Recurr RevP/ FCF
Source: Company reports, FactSet, RBC Capital Markets estimates
2016 Software Sector Outlook
December 18, 2015 77

Contributing Authors
RBC Capital Markets, LLCMatthew Hedberg (Analyst) (612) 313-1293 [email protected] MacMillan (Analyst) (212) 428-7917 [email protected] Bergstrom (Associate Analyst) (612) 313-1254 [email protected] Swanson (Associate) (612) 313-1237 [email protected] Chew (Associate) (212) 858-8331 [email protected] Simmons (Associate) (212) 905-5973 [email protected]
2016 Software Sector Outlook
December 18, 2015 78

Required disclosuresConflicts disclosuresThis product constitutes a compendium report (covers six or more subject companies). As such, RBC Capital Markets chooses toprovide specific disclosures for the subject companies by reference. To access conflict of interest and other disclosures for thesubject companies, clients should refer to https://www.rbccm.com/GLDisclosure/PublicWeb/DisclosureLookup.aspx?entityId=1.These disclosures are also available by sending a written request to RBC Capital Markets Research Publishing, P.O. Box 50, 200 BayStreet, Royal Bank Plaza, 29th Floor, South Tower, Toronto, Ontario M5J 2W7 or an email to [email protected].
The analyst(s) responsible for preparing this research report received compensation that is based upon various factors, includingtotal revenues of the member companies of RBC Capital Markets and its affiliates, a portion of which are or have been generatedby investment banking activities of the member companies of RBC Capital Markets and its affiliates.
Distribution of ratingsFor the purpose of ratings distributions, regulatory rules require member firms to assign ratings to one of three rating categories- Buy, Hold/Neutral, or Sell - regardless of a firm's own rating categories. Although RBC Capital Markets' ratings of Top Pick(TP)/Outperform (O), Sector Perform (SP), and Underperform (U) most closely correspond to Buy, Hold/Neutral and Sell, respectively,the meanings are not the same because our ratings are determined on a relative basis (as described below).
Distribution of ratings
RBC Capital Markets, Equity Research
As of 30-Sep-2015
Investment Banking
Serv./Past 12 Mos.
Rating Count Percent Count Percent
BUY [Top Pick & Outperform] 958 54.40 281 29.33
HOLD [Sector Perform] 701 39.81 118 16.83
SELL [Underperform] 102 5.79 4 3.92
Conflicts policyRBC Capital Markets Policy for Managing Conflicts of Interest in Relation to Investment Research is available from us on request.To access our current policy, clients should refer tohttps://www.rbccm.com/global/file-414164.pdfor send a request to RBC Capital Markets Research Publishing, P.O. Box 50, 200 Bay Street, Royal Bank Plaza, 29th Floor, SouthTower, Toronto, Ontario M5J 2W7. We reserve the right to amend or supplement this policy at any time.
Dissemination of research and short-term trade ideasRBC Capital Markets endeavors to make all reasonable efforts to provide research simultaneously to all eligible clients, havingregard to local time zones in overseas jurisdictions. RBC Capital Markets' equity research is posted to our proprietary websiteto ensure eligible clients receive coverage initiations and changes in ratings, targets and opinions in a timely manner. Additionaldistribution may be done by the sales personnel via email, fax, or other electronic means, or regular mail. Clients may alsoreceive our research via third party vendors. RBC Capital Markets also provides eligible clients with access to SPARC on the Firmsproprietary INSIGHT website, via email and via third-party vendors. SPARC contains market color and commentary regardingsubject companies on which the Firm currently provides equity research coverage. Research Analysts may, from time to time,include short-term trade ideas in research reports and / or in SPARC. A short-term trade idea offers a short-term view onhow a security may trade, based on market and trading events, and the resulting trading opportunity that may be available. Ashort-term trade idea may differ from the price targets and recommendations in our published research reports reflecting theresearch analyst's views of the longer-term (one year) prospects of the subject company, as a result of the differing time horizons,methodologies and/or other factors. Thus, it is possible that a subject company's common equity that is considered a long-term'Sector Perform' or even an 'Underperform' might present a short-term buying opportunity as a result of temporary selling pressurein the market; conversely, a subject company's common equity rated a long-term 'Outperform' could be considered susceptible
2016 Software Sector Outlook
December 18, 2015 79
to a short-term downward price correction. Short-term trade ideas are not ratings, nor are they part of any ratings system, andthe firm generally does not intend, nor undertakes any obligation, to maintain or update short-term trade ideas. Short-term tradeideas may not be suitable for all investors and have not been tailored to individual investor circumstances and objectives, andinvestors should make their own independent decisions regarding any securities or strategies discussed herein. Please contactyour investment advisor or institutional salesperson for more information regarding RBC Capital Markets' research.
Analyst certificationAll of the views expressed in this report accurately reflect the personal views of the responsible analyst(s) about any and all ofthe subject securities or issuers. No part of the compensation of the responsible analyst(s) named herein is, or will be, directly orindirectly, related to the specific recommendations or views expressed by the responsible analyst(s) in this report.
The Global Industry Classification Standard (“GICS”) was developed by and is the exclusive property and a service mark of MSCI Inc. (“MSCI”) and Standard & Poor’s Financial ServicesLLC (“S&P”) and is licensed for use by RBC. Neither MSCI, S&P, nor any other party involved in making or compiling the GICS or any GICS classifications makes any express or impliedwarranties or representations with respect to such standard or classification (or the results to be obtained by the use thereof), and all such parties hereby expressly disclaim all warrantiesof originality, accuracy, completeness, merchantability and fitness for a particular purpose with respect to any of such standard or classification. Without limiting any of the foregoing,in no event shall MSCI, S&P, any of their affiliates or any third party involved in making or compiling the GICS or any GICS classifications have any liability for any direct, indirect, special,punitive, consequential or any other damages (including lost profits) even if notified of the possibility of such damages.
Disclaimer
RBC Capital Markets is the business name used by certain branches and subsidiaries of the Royal Bank of Canada, including RBC Dominion Securities Inc., RBCCapital Markets, LLC, RBC Europe Limited, RBC Capital Markets (Hong Kong) Limited, Royal Bank of Canada, Hong Kong Branch and Royal Bank of Canada, SydneyBranch. The information contained in this report has been compiled by RBC Capital Markets from sources believed to be reliable, but no representation or warranty,express or implied, is made by Royal Bank of Canada, RBC Capital Markets, its affiliates or any other person as to its accuracy, completeness or correctness. Allopinions and estimates contained in this report constitute RBC Capital Markets' judgement as of the date of this report, are subject to change without notice andare provided in good faith but without legal responsibility. Nothing in this report constitutes legal, accounting or tax advice or individually tailored investmentadvice. This material is prepared for general circulation to clients and has been prepared without regard to the individual financial circumstances and objectives ofpersons who receive it. The investments or services contained in this report may not be suitable for you and it is recommended that you consult an independentinvestment advisor if you are in doubt about the suitability of such investments or services. This report is not an offer to sell or a solicitation of an offer to buyany securities. Past performance is not a guide to future performance, future returns are not guaranteed, and a loss of original capital may occur. RBC CapitalMarkets research analyst compensation is based in part on the overall profitability of RBC Capital Markets, which includes profits attributable to investment bankingrevenues. Every province in Canada, state in the U.S., and most countries throughout the world have their own laws regulating the types of securities and otherinvestment products which may be offered to their residents, as well as the process for doing so. As a result, the securities discussed in this report may not beeligible for sale in some jurisdictions. RBC Capital Markets may be restricted from publishing research reports, from time to time, due to regulatory restrictions and/or internal compliance policies. If this is the case, the latest published research reports available to clients may not reflect recent material changes in the applicableindustry and/or applicable subject companies. RBC Capital Markets research reports are current only as of the date set forth on the research reports. This report isnot, and under no circumstances should be construed as, a solicitation to act as securities broker or dealer in any jurisdiction by any person or company that is notlegally permitted to carry on the business of a securities broker or dealer in that jurisdiction. To the full extent permitted by law neither RBC Capital Markets norany of its affiliates, nor any other person, accepts any liability whatsoever for any direct or consequential loss arising from any use of this report or the informationcontained herein. No matter contained in this document may be reproduced or copied by any means without the prior consent of RBC Capital Markets.
Additional information is available on request.
To U.S. Residents:This publication has been approved by RBC Capital Markets, LLC (member FINRA, NYSE, SIPC), which is a U.S. registered broker-dealer and which acceptsresponsibility for this report and its dissemination in the United States. Any U.S. recipient of this report that is not a registered broker-dealer or a bank acting ina broker or dealer capacity and that wishes further information regarding, or to effect any transaction in, any of the securities discussed in this report, shouldcontact and place orders with RBC Capital Markets, LLC.To Canadian Residents:This publication has been approved by RBC Dominion Securities Inc.(member IIROC). Any Canadian recipient of this report that is not a Designated Institution inOntario, an Accredited Investor in British Columbia or Alberta or a Sophisticated Purchaser in Quebec (or similar permitted purchaser in any other province) andthat wishes further information regarding, or to effect any transaction in, any of the securities discussed in this report should contact and place orders with RBCDominion Securities Inc., which, without in any way limiting the foregoing, accepts responsibility for this report and its dissemination in Canada.To U.K. Residents:This publication has been approved by RBC Europe Limited ('RBCEL') which is authorized by the Prudential Regulation Authority and regulated by the FinancialConduct Authority ('FCA') and the Prudential Regulation Authority, in connection with its distribution in the United Kingdom. This material is not for generaldistribution in the United Kingdom to retail clients, as defined under the rules of the FCA. However, targeted distribution may be made to selected retail clients ofRBC and its affiliates. RBCEL accepts responsibility for this report and its dissemination in the United Kingdom.To Persons Receiving This Advice in Australia:This material has been distributed in Australia by Royal Bank of Canada - Sydney Branch (ABN 86 076 940 880, AFSL No. 246521). This material has been preparedfor general circulation and does not take into account the objectives, financial situation or needs of any recipient. Accordingly, any recipient should, before acting onthis material, consider the appropriateness of this material having regard to their objectives, financial situation and needs. If this material relates to the acquisitionor possible acquisition of a particular financial product, a recipient in Australia should obtain any relevant disclosure document prepared in respect of that productand consider that document before making any decision about whether to acquire the product. This research report is not for retail investors as defined in section761G of the Corporations Act.
2016 Software Sector Outlook
December 18, 2015 80
To Hong Kong Residents:This publication is distributed in Hong Kong by RBC Capital Markets (Hong Kong) Limited and Royal Bank of Canada, Hong Kong Branch (both entities which areregulated by the Hong Kong Monetary Authority ('HKMA') and the Securities and Futures Commission ('SFC')). Financial Services provided to Australia: Financialservices may be provided in Australia in accordance with applicable law. Financial services provided by the Royal Bank of Canada, Hong Kong Branch are providedpursuant to the Royal Bank of Canada's Australian Financial Services Licence ('AFSL') (No. 246521). RBC Capital Markets (Hong Kong) Limited is exempt from therequirement to hold an AFSL under the Corporations Act 2001 in respect of the provision of such financial services. RBC Capital Markets (Hong Kong) Limited isregulated by the HKMA and the SFC under the laws of Hong Kong, which differ from Australian laws.To Singapore Residents:This publication is distributed in Singapore by the Royal Bank of Canada, Singapore Branch, a registered entity granted offshore bank licence by the MonetaryAuthority of Singapore. This material has been prepared for general circulation and does not take into account the objectives, financial situation, or needs of anyrecipient. You are advised to seek independent advice from a financial adviser before purchasing any product. If you do not obtain independent advice, you shouldconsider whether the product is suitable for you. Past performance is not indicative of future performance. If you have any questions related to this publication,please contact the Royal Bank of Canada, Singapore Branch. Royal Bank of Canada, Singapore Branch accepts responsibility for this report and its disseminationin Singapore.To Japanese Residents:Unless otherwise exempted by Japanese law, this publication is distributed in Japan by or through RBC Capital Markets (Japan) Ltd., a registered type one financialinstruments firm and/or Royal Bank of Canada, Tokyo Branch, a licensed foreign bank.
.® Registered trademark of Royal Bank of Canada. RBC Capital Markets is a trademark of Royal Bank of Canada. Used under license.Copyright © RBC Capital Markets, LLC 2015 - Member SIPC
Copyright © RBC Dominion Securities Inc. 2015 - Member Canadian Investor Protection FundCopyright © RBC Europe Limited 2015
Copyright © Royal Bank of Canada 2015All rights reserved
2016 Software Sector Outlook
December 18, 2015 81