2016 post-election national asian american...
TRANSCRIPT

2016 Post-Election National Asian American SurveyMay 16, 2017
Karthick Ramakrishnan, DirectorJanelle Wong, Jennifer Lee, and Taeku Lee, co-Principal Investigators
This survey was supported by a major grant from the National Science Foundation, with support for supplemental data collections from the Ford Foundation, California Immigration Research Initiative, and the Wallace H. Coulter Foundation. A grant from Russell Sage Foundation provided support for data analysis.
The authors are solely responsible for the content and analysis presented herein.
1Erratum: Question wording on p. 41 was an inadvertent duplicate of the question on p. 40 and was corrected on June 8, 2017

2016 Post-Election National Asian American Survey
� In 2016, Asian Americans posted their biggest gains ever in voting, with more than 1.1 million new voters. Between 2000 and 2012, the average increase in each presidential cycle was about 620,000 voters.
�Asian Americans and Pacific Islanders are the fastest-growing populations in the country—growing 46% and 40%, respectively, between 2000 and 2010
�The rapid growth of AAPIs continues today; between 2010 and 2015, the growth rates were 18% and 12%, respectively
�AAPIs are growing even faster in states such as Nevada, Arizona, North Carolina, Georgia, and Virginia
�AAPIs are 5% or more of the eligible voter population in 9 states� Hawaii, California, Nevada, Washington, New Jersey, New York, Alaska, Maryland, and Virginia
Key Facts About the AAPI Electorate
Source: AAPIData.com
2

2016 Post-Election National Asian American Survey
� When compared to the 2012 AAPI Post-Election Study, Clinton did about as well as Obama did among Asian American voters and won every segment of the Asian American vote
� For the first time, we surveyed Bangladeshi and Pakistani American voters, and they show among the strongest levels of Democratic party identification and strongest support for Clinton over Trump
� Asian Americans and Pacific Islanders were less likely than Whites or Blacks to be contacted by political parties
� The most serious problems facing Asian Americans include the affordability of college, health care, and elder care
� Asian Americans are progressive on various aspects of economic policy, but are more split when it comes to policies related to undocumented immigrants
� In terms of relations with other groups, Asian Americans are more likely to have contact with Whites than with Blacks or Latinos; Chinese Americans report the least contact with other racial groups
� The question of Asian American identity is contested, with South Asian groups (Indians and Pakistanis) finding it more challenging for American society to view them as Asian American
� Experiences with discrimination and micro-aggression vary significantly across groups, and there has been an increase in job-related discrimination experiences for some groups since 2008
Key Findings from the Fall 2016 Survey
3

2016 Post-Election National Asian American Survey
�4,393 telephone interviews of Asian American adults conducted between November 10, 2016 and March 2, 2017� Overall margin of error (includes design effect): 2.5%� Landline (63%) and cell phones (37%)
�Listed samples available from Catalist using registered voter and commercial vendor samples and classified for ethnicity by name, listed race where applicable, and tract-level ethnic concentration
�Ten national origins (six largest, plus South Asian and Southeast Asian groups)� Chinese (475), Asian Indian (504), Filipino (505), Korean (499), Vietnamese (501), Japanese
(517), Pakistani (320), Bangladeshi (320), Hmong (351), Cambodian (401)
�Data weighted by ethnicity and gender, age, state of residence, education, and nativity (raking method)
Methodology
4

Voting and Election-Related Contact
5

2016 Post-Election National Asian American Survey
723,000
589,000
547,000
1,139,000
2004
2008
2012
2016
Gain in Votes Over Prior Presidential Election
Asian Americans Posted Record Gains in Voting in 2016
Source: Current Population Survey
6

2016 Post-Election National Asian American Survey
Still, Asian Americans & Pacific Islanders Were Less Likely to Be Contacted By Political Parties
44%
42%
29%
27%
26%
White
Black
Asian American
Latino
NHPI
Question: As you know, the political parties try to talk to as many people as they can to get them to vote for their candidate. Did anyone from one of the political parties call you up or come around and talk to you about the campaign this year?
7

2016 Post-Election National Asian American Survey
There Is Significant Variation in Party Contact by Ethnic Group
29%
36%
35%
35%
31%
31%
30%
29%
26%
23%
16%
ASN AM
Japanese
Vietnamese
Pakistani
Bangladeshi
Indian
Korean
Filipino
Chinese
Cambodian
Hmong
Question:Asyouknow,thepoliticalpartiestrytotalktoasmanypeopleastheycantogetthemtovotefortheircandidate.Didanyonefromoneofthepoliticalparties callyouuporcomearoundandtalktoyouaboutthecampaignthisyear?
8

2016 Post-Election National Asian American Survey
Racial Differences in Contact by Non-Partisan Organizations Were More Muted
16%
12%
11%
11%
10%
Black
Asian American
White
Latino
NHPI
Other than someone from the two major parties, did anyone else call you up or come around and talk to you about this election?
9

2016 Post-Election National Asian American Survey
There Is Significant Variation in Nonpartisan Contact by Ethnic Group
12%
19%
18%
16%
14%
13%
8%
8%
7%
7%
6%
ASN AM
Bangladeshi
Cambodian
Chinese
Filipino
Vietnamese
Japanese
Pakistani
Hmong
Indian
Korean
Otherthansomeonefromthetwomajorparties,didanyoneelsecallyouuporcomearoundandtalktoyouaboutthiselection?
10

2016 Post-Election National Asian American Survey
Still, overall contact (partisan and nonpartisan) was lower among AAPIs
47%
46%
33%
32%
31%
Black
White
Asian American
Latino
NHPI
Anyelection-relatedcontact=“Yes”answertopartycontactornonpartisancontactquestions
11
2016 Post-Election National Asian American Survey
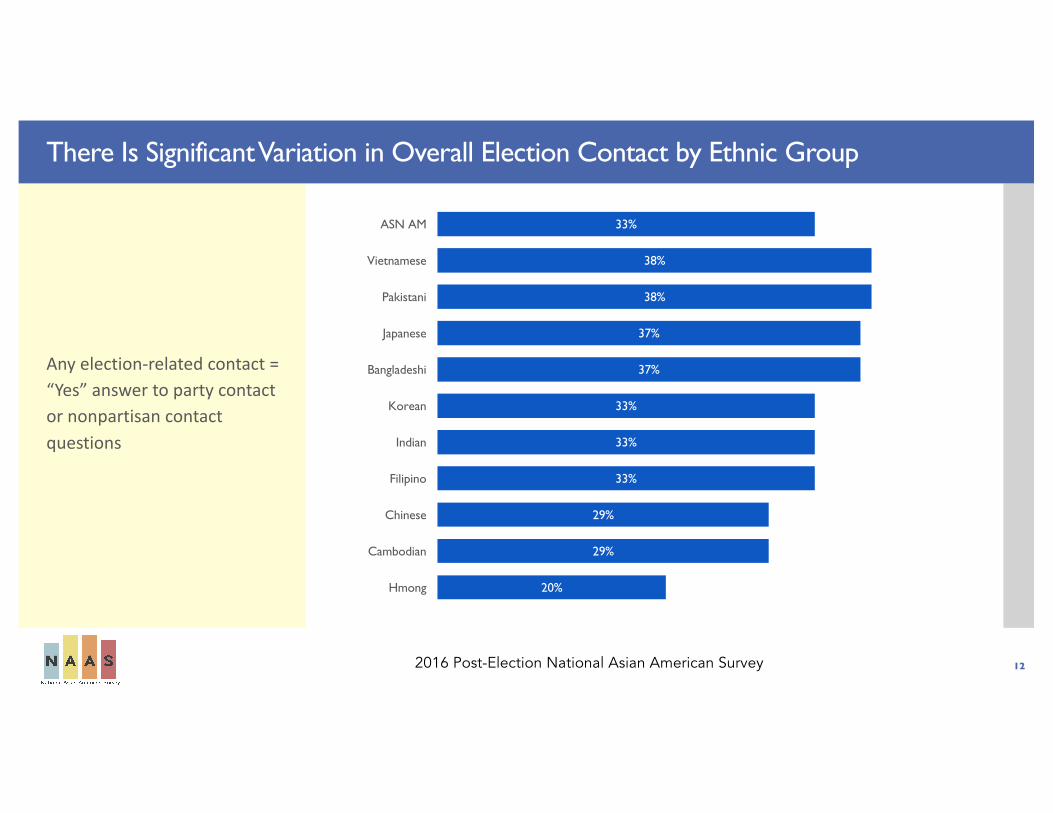
There Is Significant Variation in Overall Election Contact by Ethnic Group
33%
38%
38%
37%
37%
33%
33%
33%
29%
29%
20%
ASN AM
Vietnamese
Pakistani
Japanese
Bangladeshi
Korean
Indian
Filipino
Chinese
Cambodian
Hmong
Anyelection-relatedcontact=“Yes”answertopartycontactornonpartisancontactquestions
12

Presidential Vote and Party Identification
13

2016 Post-Election National Asian American Survey
Presidential Vote Choice Among Asian Americans in 2016: A Comparison of Survey Estimates
65%
79%
69%
8%
3%
6%
27%
18%
25%
National Exit Poll
AALDEF Exit Poll
NAAS 2016 Post-Election
Clinton Other TrumpThe 2016 Post-Election National Asian American Survey is also distinctive from other surveys in the following ways:
1) Unlike the National Exit Polls, which were conducted only in English and Spanish, the 2016 NAAS was conducted in the same languages, plus 11 Asian languages (Bangla, Cambodian, Cantonese, Hindi, Hmong, Japanese, Korean, Mandarin, Tagalog, Vietnamese, and Urdu). The 2016 NAAS found higher support for Clinton among English-language respondents (74%) than among Asian-language respondents (61%).
2) Unlike the National Exit Poll, which is designed to be representative of the overall electorate, but not necessarily of smaller minority populations, the 2016 NAAS is designed to be nationally representative, with Asian respondents from 48 states and the District of Columbia. The 2016 NAAS found higher support for Clinton among English-language respondents (74%) than what the National Exit Poll found with respect to their English-language respondents (65%).
3) Unlike the AALDEF exit poll of Asian Americans, which was conducted in high-density precincts with significant Asian American populations, the 2016 NAAS includes respondents from suburban areas as well as central cities. While the 2016 AALDEF exit poll found that 79% of their respondents voted for Clinton. By contrast, the 2016 NAAS finds that 69% of Asian Americans voted for Clinton.
14

2016 Post-Election National Asian American Survey
Presidential Vote Choice By Ethnicity for Asian Americans, 2016
69%
90%
88%
78%
77%
75%
74%
74%
65%
61%
61%
6%
6%
7%
10%
7%
6%
5%
7%
7%
5%
6%
25%
4%
5%
12%
16%
18%
21%
19%
28%
35%
34%
ASN AM
Bangladeshi
Pakistani
Cambodian
Indian
Korean
Hmong
Japanese
Filipino
Chinese
Vietnamese
Clinton Other Trump
Thinking about the past November election forPresident… did you to vote for Hillary Clinton, Donald Trump, or some other candidate?
15

2016 Post-Election National Asian American Survey
Party Identification, 3-point scale
36%
56%
54%
52%
51%
50%
44%
46%
19%
17%
13%
51%
31%
24%
44%
45%
39%
47%
35%
70%
66%
85%
13%
13%
22%
3%
3%
12%
9%
19%
11%
17%
2%
ASN AM
Japanese
Korean
Bangladeshi
Pakistani
Cambodian
Filipino
Indian
Hmong
Vietnamese
Chinese
Democrat Independent/Other Republican
Generally speaking, do you usually think of yourself as a {READ CATEGORIES}, an independent, or in terms of some other party?
Note: Independent/Other includes those who say “Don’t Know” or “Do not think in terms of political parties”
16

2016 Post-Election National Asian American Survey
Party Identification, 7-point scale, including party leaners among independents
20%
27%
31%
28%
31%
11%
25%
18%
19%
11%
13%
20%
27%
24%
25%
17%
44%
21%
27%
12%
14%
20%
15%
25%
24%
16%
20%
9%
14%
11%
10%
17%
9%
22%
15%
14%
9%
16%
7%
12%
30%
25%
41%
43%
7%
2%
4%
7%
5%
6%
8%
6%
10%
9%
2%
8%
2%
3%
11%
7%
19%
10%
4%
8%
5%
6%
6%
2%
1%
5%
4%
4%
10%
3%
16%
3%
7%
ASN AM
Pakistani
Bangladeshi
Japanese
Indian
Korean
Filipino
Hmong
Vietnamese
Chinese
Cambodian
Strong Democrat Weak Democrat Lean Democrat Pure Independent
Lean Republican Weak Republican Strong Republican
Generally speaking, do you usually think of yourself as a {READ CATEGORIES}, an independent, or in terms of some other part
17

2016 Post-Election National Asian American Survey
Favorability: Trump
9%
16%
15%
7%
5%
7%
8%
5%
5%
6%
4%
23%
27%
26%
25%
23%
20%
19%
19%
17%
14%
11%
19%
18%
14%
18%
22%
23%
14%
30%
19%
9%
17%
33%
21%
36%
37%
25%
36%
32%
42%
53%
53%
44%
15%
18%
9%
13%
25%
12%
26%
4%
5%
16%
23%
1%
1%
1%
3%
2%
ASN AM
Vietnamese
Filipino
Indian
Chinese
Cambodian
Hmong
Korean
Japanese
Pakistani
Bangladeshi
Very favorable Somewhat favorable Somewhat unfavorable
Very unfavorable No opinion Never heard
Now I'd like to ask you about some people and organizations who have been mentioned in the news recently. For each, please tell me whether you have a very favorable, somewhat favorable, somewhat unfavorable, or veryunfavorable impression.
Do you have a very favorable, somewhat favorable, somewhat unfavorable, or very unfavorable impression of [NAME]?
18

2016 Post-Election National Asian American Survey
Favorability: Clinton
20%
37%
31%
30%
30%
25%
16%
25%
19%
19%
8%
39%
38%
43%
43%
37%
42%
46%
36%
37%
35%
36%
17%
10%
13%
11%
9%
17%
25%
13%
11%
22%
21%
14%
5%
6%
8%
4%
13%
13%
19%
8%
14%
20%
9%
10%
7%
8%
18%
3%
1%
7%
23%
10%
15%
2%
2%
1%
ASN AM
Pakistani
Cambodian
Indian
Bangladeshi
Japanese
Korean
Filipino
Hmong
Vietnamese
Chinese
Very favorable Somewhat favorable Somewhat unfavorable
Very Unfavorable No opinion Never heard
Now I'd like to ask you about some people and organizations who have been mentioned in the news recently. For each, please tell me whether you have a very favorable, somewhat favorable, somewhat unfavorable, or veryunfavorable impression.
Do you have a very favorable, somewhat favorable, somewhat unfavorable, or very unfavorable impression of [NAME]?
19

2016 Post-Election National Asian American Survey
Favorability: Black Lives Matter
21%
33%
33%
31%
37%
22%
23%
23%
15%
11%
10%
28%
40%
32%
30%
19%
33%
31%
24%
26%
20%
19%
11%
11%
10%
4%
6%
9%
12%
8%
12%
8%
15%
8%
4%
5%
3%
5%
12%
9%
5%
15%
8%
8%
18%
12%
13%
11%
22%
18%
11%
29%
14%
15%
28%
14%
1%
7%
21%
12%
6%
14%
12%
19%
38%
20%
ASN AM
Korean
Indian
Pakistani
Bangladeshi
Filipino
Japanese
Hmong
Cambodian
Vietnamese
Chinese
Very favorable Somewhat favorable Somewhat unfavorable
Very Unfavorable No opinion Never heard
Now I'd like to ask you about some people and organizations who have been mentioned in the news recently. For each, please tell me whether you have a very favorable, somewhat favorable, somewhat unfavorable, or veryunfavorable impression.
Do you have a very favorable, somewhat favorable, somewhat unfavorable, or very unfavorable impression of [NAME]?
20

2016 Post-Election National Asian American Survey
Favorability: Tea Party
3%
7%
4%
2%
6%
1%
1%
2%
3%
5%
1%
12%
21%
14%
14%
10%
15%
12%
10%
10%
7%
7%
17%
17%
19%
28%
10%
10%
14%
12%
22%
20%
12%
21%
14%
32%
22%
37%
24%
16%
17%
36%
23%
11%
30%
29%
22%
32%
20%
26%
35%
19%
19%
31%
43%
17%
12%
9%
1%
17%
25%
22%
40%
11%
15%
26%
ASN AM
Filipino
Indian
Korean
Pakistani
Cambodian
Hmong
Vietnamese
Japanese
Bangladeshi
Chinese
Very favorable Somewhat favorable Somewhat unfavorable
Very Unfavorable No opinion Never heard
Now I'd like to ask you about some people and organizations who have been mentioned in the news recently. For each, please tell me whether you have a very favorable, somewhat favorable, somewhat unfavorable, or veryunfavorable impression.
The Tea Party Movement, which is a conservative movement within the Republican Party
21

Problems Facing the Asian American Community
22

2016 Post-Election National Asian American Survey
Serious Problem: Asian Americans
35%
33%
30%
30%
30%
24%
26%
25%
20%
24%
18%
18%
18%
19%
18%
15%
19%
15%
15%
16%
13%
12%
Afford College
Cost of Medical Care
Elderly Care
Children's Schools
College Debt/Student Loans
Bullying
Paying Mortgage
Childcare Costs
Visa
Medical Debt
Credit Card Debt
Very Serious Fairly Serious
Please tell me how serious of a problem each is for you and your family: Not at all serious, not very serious, fairly serious, or very serious
23
2016 Post-Election National Asian American Survey
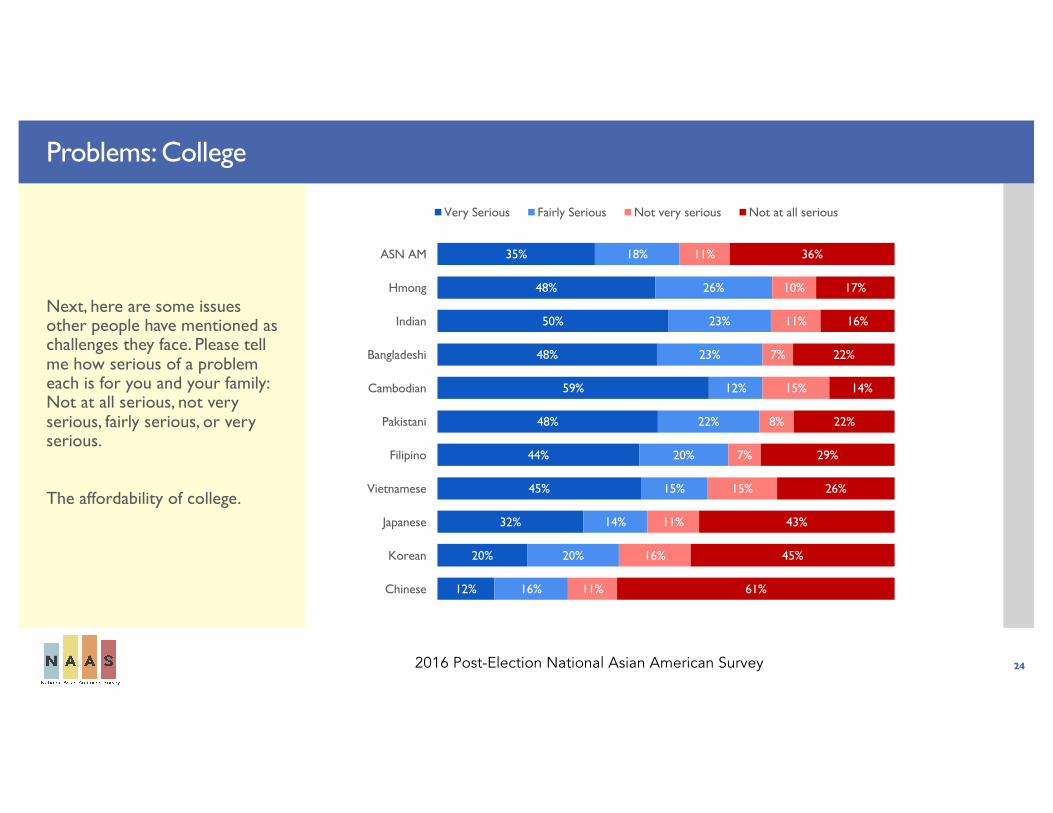
Problems: College
35%
48%
50%
48%
59%
48%
44%
45%
32%
20%
12%
18%
26%
23%
23%
12%
22%
20%
15%
14%
20%
16%
11%
10%
11%
7%
15%
8%
7%
15%
11%
16%
11%
36%
17%
16%
22%
14%
22%
29%
26%
43%
45%
61%
ASN AM
Hmong
Indian
Bangladeshi
Cambodian
Pakistani
Filipino
Vietnamese
Japanese
Korean
Chinese
Very Serious Fairly Serious Not very serious Not at all serious
Next, here are some issues other people have mentioned as challenges they face. Please tell me how serious of a problem each is for you and your family: Not at all serious, not very serious, fairly serious, or very serious.
The affordability of college.
24

2016 Post-Election National Asian American Survey
Problems: Medical Care
33%
57%
53%
43%
45%
46%
47%
38%
26%
28%
9%
18%
15%
19%
26%
22%
15%
9%
16%
21%
15%
19%
14%
12%
10%
13%
13%
6%
14%
15%
18%
20%
13%
35%
16%
18%
18%
20%
33%
29%
31%
35%
38%
59%
ASN AM
Cambodian
Hmong
Bangladeshi
Indian
Vietnamese
Pakistani
Filipino
Korean
Japanese
Chinese
Very Serious Fairly Serious Not very serious Not at all serious
Next, here are some issues other people have mentioned as challenges they face. Please tell me how serious of a problem each is for you and your family: Not at all serious, not very serious, fairly serious, or very serious.
The cost of medical care.
25

2016 Post-Election National Asian American Survey
Problems: Elderly Care
30%
55%
47%
51%
41%
36%
42%
26%
27%
13%
6%
19%
18%
24%
18%
21%
24%
17%
22%
18%
22%
13%
12%
8%
9%
10%
4%
12%
13%
16%
12%
16%
14%
40%
19%
20%
21%
34%
28%
28%
36%
44%
49%
68%
ASN AM
Bangladeshi
Indian
Cambodian
Vietnamese
Pakistani
Filipino
Japanese
Hmong
Korean
Chinese
Very Serious Fairly Serious Not very serious Not at all serious
Next, here are some issues other people have mentioned as challenges they face. Please tell me how serious of a problem each is for you and your family: Not at all serious, not very serious, fairly serious, or very serious.
The cost of taking care of elderly
26

2016 Post-Election National Asian American Survey
Problems: Children’s Schools
30%
57%
53%
51%
45%
34%
48%
32%
26%
17%
8%
13%
15%
16%
16%
16%
19%
5%
15%
14%
14%
11%
12%
15%
10%
17%
6%
10%
11%
10%
12%
16%
16%
46%
14%
21%
16%
34%
37%
36%
43%
48%
54%
65%
ASN AM
Cambodian
Hmong
Bangladeshi
Indian
Pakistani
Vietnamese
Filipino
Japanese
Korean
Chinese
Very Serious Fairly Serious Not very serious Not at all serious
Next, here are some issues other people have mentioned as challenges they face. Please tell me how serious of a problem each is for you and your family: Not at all serious, not very serious, fairly serious, or very serious.
The quality of children's schools.
27

2016 Post-Election National Asian American Survey
Problems: College Debt/Student Loans
30%
59%
36%
49%
48%
40%
42%
40%
19%
24%
7%
15%
9%
26%
13%
12%
19%
14%
13%
18%
13%
11%
10%
9%
18%
13%
7%
9%
7%
9%
13%
13%
9%
46%
23%
20%
26%
33%
32%
37%
38%
50%
50%
73%
ASN AM
Hmong
Cambodian
Bangladeshi
Pakistani
Indian
Filipino
Vietnamese
Korean
Japanese
Chinese
Very Serious Fairly Serious Not very serious Not at all serious
Next, here are some issues other people have mentioned as challenges they face. Please tell me how serious of a problem each is for you and your family: Not at all serious, not very serious, fairly serious, or very serious.
College debt or student loans.
28

2016 Post-Election National Asian American Survey
Problems: Bullying
24%
46%
36%
38%
27%
40%
37%
29%
16%
15%
6%
10%
10%
20%
13%
22%
7%
5%
10%
15%
13%
6%
16%
14%
16%
12%
19%
6%
33%
18%
16%
15%
19%
50%
30%
28%
37%
32%
47%
25%
43%
54%
58%
70%
ASN AM
Hmong
Pakistani
Indian
Bangladeshi
Vietnamese
Cambodian
Filipino
Japanese
Korean
Chinese
Very Serious Fairly Serious Not very serious Not at all serious
Next, here are some issues other people have mentioned as challenges they face. Please tell me how serious of a problem each is for you and your family: Not at all serious, not very serious, fairly serious, or very serious.
Getting bullied in school.
29
2016 Post-Election National Asian American Survey
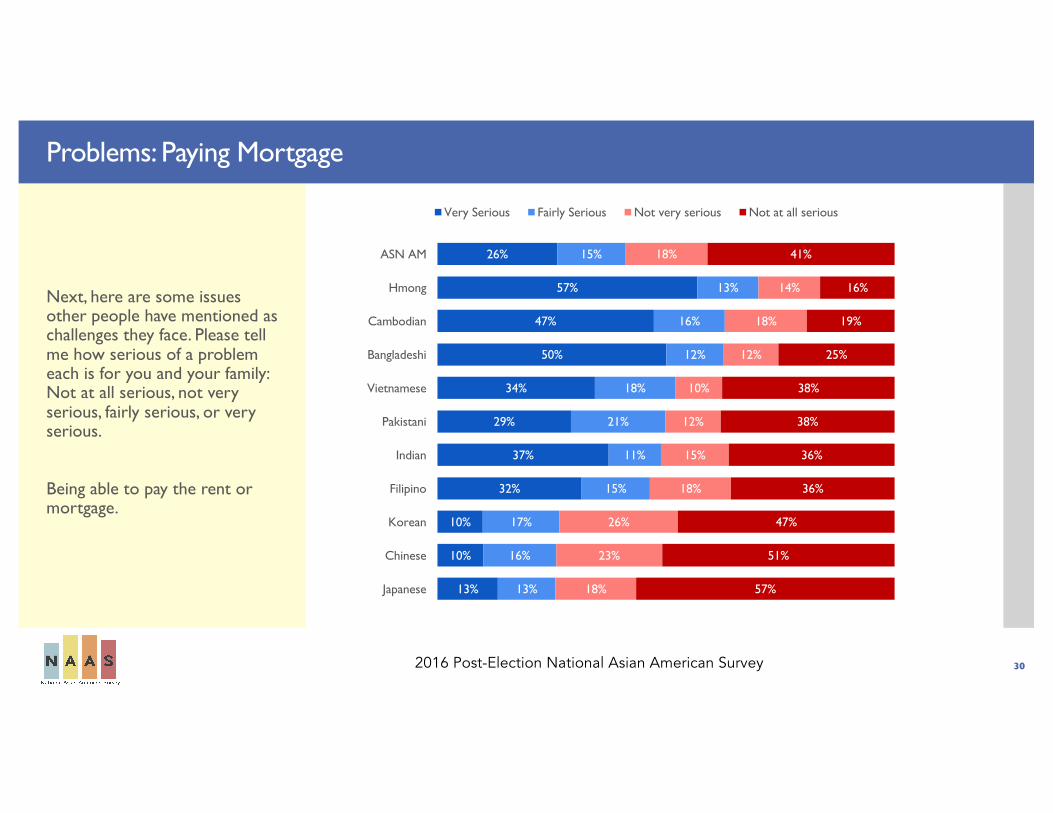
Problems: Paying Mortgage
26%
57%
47%
50%
34%
29%
37%
32%
10%
10%
13%
15%
13%
16%
12%
18%
21%
11%
15%
17%
16%
13%
18%
14%
18%
12%
10%
12%
15%
18%
26%
23%
18%
41%
16%
19%
25%
38%
38%
36%
36%
47%
51%
57%
ASN AM
Hmong
Cambodian
Bangladeshi
Vietnamese
Pakistani
Indian
Filipino
Korean
Chinese
Japanese
Very Serious Fairly Serious Not very serious Not at all serious
Next, here are some issues other people have mentioned as challenges they face. Please tell me how serious of a problem each is for you and your family: Not at all serious, not very serious, fairly serious, or very serious.
Being able to pay the rent or mortgage.
30

2016 Post-Election National Asian American Survey
Problems: Childcare costs
25%
59%
32%
33%
39%
39%
34%
30%
10%
14%
14%
15%
16%
30%
26%
20%
10%
11%
15%
16%
10%
9%
10%
14%
11%
8%
9%
14%
7%
9%
19%
11%
11%
49%
12%
28%
33%
33%
38%
48%
47%
55%
66%
66%
ASN AM
Cambodian
Bangladeshi
Indian
Pakistani
Hmong
Vietnamese
Filipino
Korean
Japanese
Chinese
Very Serious Fairly Serious Not very serious Not at all serious
Next, here are some issues other people have mentioned as challenges they face. Please tell me how serious of a problem each is for you and your family: Not at all serious, not very serious, fairly serious, or very serious.
The cost of child care
31

2016 Post-Election National Asian American Survey
Problems: Visa
20%
40%
29%
32%
33%
33%
25%
28%
8%
7%
5%
16%
29%
28%
24%
22%
18%
19%
12%
22%
8%
6%
15%
13%
28%
18%
12%
10%
17%
13%
18%
17%
13%
49%
18%
16%
26%
34%
40%
40%
47%
52%
67%
76%
ASN AM
Bangladeshi
Cambodian
Pakistani
Indian
Vietnamese
Filipino
Hmong
Korean
Chinese
Japanese
Very Serious Fairly Serious Not very serious Not at all serious
Next, here are some issues other people have mentioned as challenges they face. Please tell me how serious of a problem each is for you and your family: Not at all serious, not very serious, fairly serious, or very serious.
The long time it takes for people to get visas.
32

2016 Post-Election National Asian American Survey
Problems: Medical Debt
24%
45%
54%
41%
42%
35%
32%
25%
15%
17%
7%
13%
19%
9%
18%
15%
13%
16%
12%
17%
10%
8%
14%
11%
9%
19%
15%
9%
18%
12%
15%
17%
11%
50%
24%
27%
21%
28%
43%
34%
51%
53%
56%
74%
ASN AM
Bangladeshi
Hmong
Cambodian
Pakistani
Vietnamese
Indian
Filipino
Korean
Japanese
Chinese
Very Serious Fairly Serious Not very serious Not at all serious
Next, here are some issues other people have mentioned as challenges they face. Please tell me how serious of a problem each is for you and your family: Not at all serious, not very serious, fairly serious, or very serious.
Medical debt
33

2016 Post-Election National Asian American Survey
Problems: Credit card debt
18%
43%
40%
36%
24%
24%
29%
26%
10%
10%
4%
12%
12%
7%
11%
17%
18%
12%
13%
13%
12%
5%
15%
9%
33%
14%
17%
18%
8%
8%
16%
20%
13%
55%
36%
20%
39%
42%
40%
52%
54%
61%
58%
78%
ASN AM
Bangladeshi
Cambodian
Pakistani
Indian
Filipino
Hmong
Vietnamese
Japanese
Korean
Chinese
Very Serious Fairly Serious Not very serious Not at all serious
Next, here are some issues other people have mentioned as challenges they face. Please tell me how serious of a problem each is for you and your family: Not at all serious, not very serious, fairly serious, or very serious.
Credit Card Debt
34

Experiences with Discrimination
35

2016 Post-Election National Asian American Survey
Major Discrim: Denied Promotion
14%
19%
17%
14%
12%
11%
11%
10%
9%
9%
8%
ASN AM
Filipino
Indian
Bangladeshi
Japanese
Chinese
Vietnamese
Hmong
Korean
Pakistani
Cambodian
Next, we would like to ask about important ways that some people have been treated poorly or unfairly:
Have you ever been unfairly denied a promotion?
36

2016 Post-Election National Asian American Survey
Major Discrim: Unfairly Fired
9%
12%
11%
10%
9%
9%
8%
7%
7%
7%
4%
ASN AM
Indian
Bangladeshi
Filipino
Hmong
Pakistani
Chinese
Japanese
Korean
Vietnamese
Cambodian
Next, we would like to ask about important ways that some people have been treated poorly or unfairly:
Have you ever been unfairly fired from a job?
37
2016 Post-Election National Asian American Survey
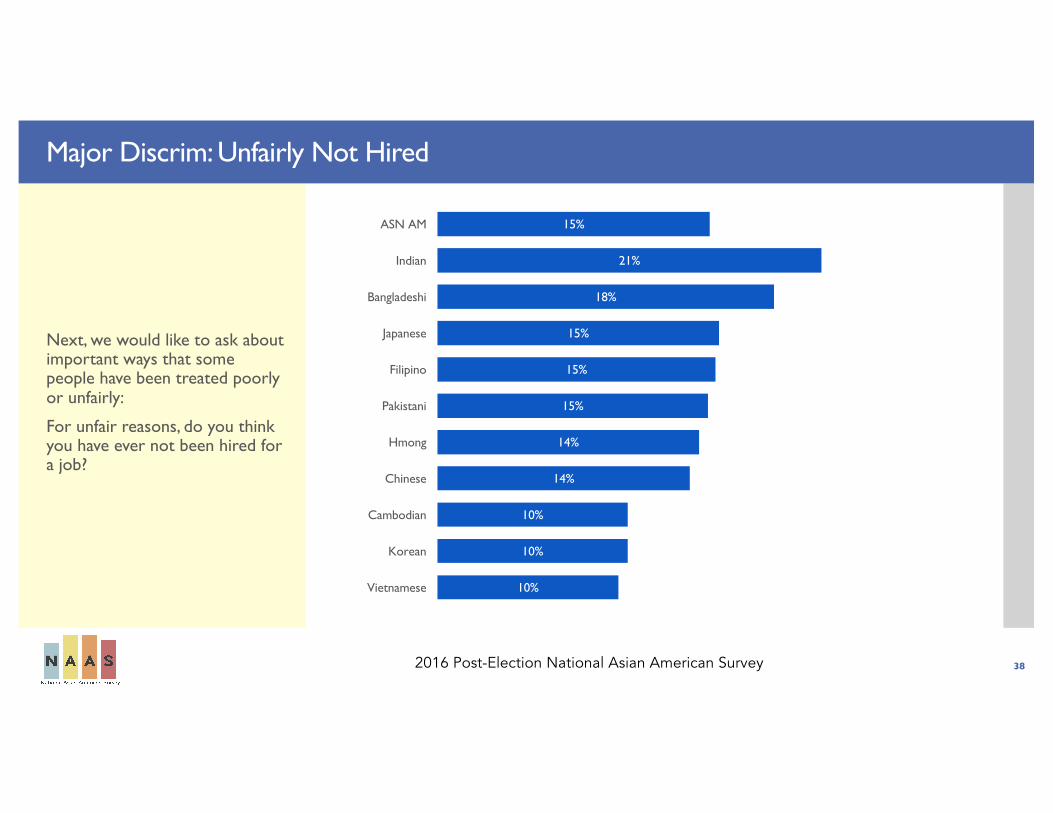
Major Discrim: Unfairly Not Hired
15%
21%
18%
15%
15%
15%
14%
14%
10%
10%
10%
ASN AM
Indian
Bangladeshi
Japanese
Filipino
Pakistani
Hmong
Chinese
Cambodian
Korean
Vietnamese
Next, we would like to ask about important ways that some people have been treated poorly or unfairly:
For unfair reasons, do you think you have ever not been hired for a job?
38

2016 Post-Election National Asian American Survey
Major Discrim: Police
10%
15%
13%
12%
12%
10%
10%
9%
9%
7%
7%
ASN AM
Cambodian
Indian
Hmong
Pakistani
Japanese
Filipino
Bangladeshi
Korean
Chinese
Vietnamese
Next, we would like to ask about important ways that some people have been treated poorly or unfairly:
Have you ever been unfairly stopped, searched, questioned, physically threatened or abused by the police?
39

2016 Post-Election National Asian American Survey
Major Discrim: Housing
6%
9%
8%
8%
7%
7%
6%
6%
5%
3%
3%
ASN AM
Pakistani
Indian
Bangladeshi
Cambodian
Filipino
Japanese
Korean
Hmong
Vietnamese
Chinese
Next, we would like to ask about important ways that some people have been treated poorly or unfairly:
Do you think you have ever been unfairly prevented from moving into a neighborhood because the landlord or a realtor refused to sell or rent you a house or apartment?
40

2016 Post-Election National Asian American Survey
Major Discrim: Neighbors
9%
19%
16%
13%
11%
11%
10%
9%
9%
8%
7%
ASN AM
Hmong
Cambodian
Bangladeshi
Pakistani
Korean
Filipino
Japanese
Indian
Vietnamese
Chinese
Next, we would like to ask about important ways that some people have been treated poorly or unfairly:
Have you ever moved into a neighborhood where neighbors made life difficult for you or your family?
41

2016 Post-Election National Asian American Survey
Microaggression: Poorer Service
21%
27%
26%
22%
21%
21%
20%
20%
17%
15%
14%
ASN AM
Filipino
Hmong
Indian
Bangladeshi
Chinese
Cambodian
Korean
Japanese
Pakistani
Vietnamese
In the following questions, we are interested in the way you have been treated in your day to day encounters with strangers in the United States. In an average month, do any of the following things happen to you?
You receive poorer service than other people at restaurants or stores.
42

2016 Post-Election National Asian American Survey
Microaggression: Non English Speaker
28%
44%
36%
31%
30%
27%
25%
25%
24%
23%
22%
ASN AM
Hmong
Filipino
Bangladeshi
Korean
Chinese
Japanese
Pakistani
Indian
Cambodian
Vietnamese
In the following questions, we are interested in the way you have been treated in your day to day encounters with strangers in the United States. In an average month, do any of the following things happen to you?
People act as if you don’t speak English.
43

2016 Post-Election National Asian American Survey
Microaggression: Afraid of R
7%
16%
15%
11%
10%
9%
7%
7%
5%
4%
4%
ASN AM
Bangladeshi
Pakistani
Hmong
Indian
Filipino
Cambodian
Chinese
Japanese
Vietnamese
Korean
In the following questions, we are interested in the way you have been treated in your day to day encounters with strangers in the United States. In an average month, do any of the following things happen to you?
People act as if they are afraid of you.
44

2016 Post-Election National Asian American Survey
Microaggression: People act as if they think you are dishonest
8%
15%
14%
10%
8%
7%
6%
5%
5%
5%
3%
ASN AM
Hmong
Filipino
Cambodian
Indian
Bangladeshi
Chinese
Vietnamese
Pakistani
Japanese
Korean
In the following questions, we are interested in the way you have been treated in your day to day encounters with strangers in the United States. In an average month, do any of the following things happen to you?
People act as if they think you are dishonest.
45

2016 Post-Election National Asian American Survey
Microaggression: Called Names
14%
21%
20%
20%
16%
15%
14%
12%
10%
10%
9%
ASN AM
Filipino
Hmong
Bangladeshi
Korean
Japanese
Indian
Vietnamese
Pakistani
Cambodian
Chinese
In the following questions, we are interested in the way you have been treated in your day to day encounters with strangers in the United States. In an average month, do any of the following things happen to you?
You are called names or insulted.
46

2016 Post-Election National Asian American Survey
Microaggression: Harassed/Threatened
9%
15%
14%
13%
13%
11%
10%
10%
8%
6%
4%
ASN AM
Filipino
Bangladeshi
Cambodian
Hmong
Japanese
Korean
Pakistani
Indian
Chinese
Vietnamese
In the following questions, we are interested in the way you have been treated in your day to day encounters with strangers in the United States. In an average month, do any of the following things happen to you?
You are threatened or harassed
47

2016 Post-Election National Asian American Survey
Microaggression: Name Mispronounced
61%
79%
76%
67%
64%
58%
58%
56%
54%
44%
43%
ASN AM
Indian
Japanese
Filipino
Hmong
Pakistani
Bangladeshi
Vietnamese
Korean
Chinese
Cambodian
In the following questions, we are interested in the way you have been treated in your day to day encounters with strangers in the United States. In an average month, do any of the following things happen to you?
You are threatened or harassed
48

2016 Post-Election National Asian American Survey
Microaggression: STEM
63%
84%
69%
67%
61%
61%
56%
54%
47%
45%
44%
ASN AM
Indian
Bangladeshi
Korean
Filipino
Pakistani
Chinese
Vietnamese
Japanese
Hmong
Cambodian
In the following questions, we are interested in the way you have been treated in your day to day encounters with strangers in the United States. In an average month, do any of the following things happen to you?
People assume you are good at math and science.
49

2016 Post-Election National Asian American Survey
Microaggression: Not Creative
15%
27%
20%
17%
15%
15%
13%
13%
12%
11%
10%
ASN AM
Hmong
Filipino
Bangladeshi
Indian
Korean
Cambodian
Pakistani
Vietnamese
Chinese
Japanese
In the following questions, we are interested in the way you have been treated in your day to day encounters with strangers in the United States. In an average month, do any of the following things happen to you?
People assume you are not a creative thinker
50

Opinions on Policy Issues
51

2016 Post-Election National Asian American Survey
Role of Federal Government: Reduce Income Differences
51%
73%
55%
65%
64%
61%
47%
45%
49%
39%
42%
28%
15%
32%
21%
21%
19%
32%
30%
26%
30%
24%
8%
4%
3%
7%
8%
16%
4%
8%
12%
7%
15%
8%
3%
6%
4%
4%
3%
9%
10%
9%
12%
10%
6%
5%
3%
3%
3%
1%
8%
8%
5%
12%
8%
ASN AM
Pakistani
Korean
Bangladeshi
Vietnamese
Hmong
Indian
Filipino
Chinese
Japanese
Cambodian
Strongly agree Somewhat agree Neither Somewhat Disagree Strongly Disagree
The federal government should do more to reduce income differences between the richest and the poorest households.
52

2016 Post-Election National Asian American Survey
Role of Federal Government: Regulate Banks
46%
65%
53%
69%
49%
42%
45%
40%
45%
47%
33%
29%
20%
29%
12%
30%
34%
28%
34%
26%
22%
26%
12%
7%
13%
10%
8%
10%
17%
17%
10%
20%
23%
8%
3%
4%
6%
10%
9%
5%
6%
12%
7%
12%
5%
5%
2%
3%
3%
5%
4%
4%
7%
5%
7%
ASN AM
Vietnamese
Bangladeshi
Pakistani
Indian
Korean
Cambodian
Chinese
Filipino
Hmong
Japanese
Strongly agree Somewhat agree Neither Somewhat Disagree Strongly Disagree
The federal government should do more to regulate banks.
53

2016 Post-Election National Asian American Survey
Role of Federal Government: Raise Minimum Wage
53%
75%
76%
60%
57%
69%
55%
45%
38%
53%
42%
24%
16%
15%
24%
25%
12%
25%
31%
37%
20%
23%
8%
4%
4%
3%
5%
8%
7%
5%
9%
11%
13%
10%
3%
3%
8%
7%
5%
9%
10%
11%
11%
16%
6%
3%
3%
6%
6%
7%
5%
10%
5%
5%
7%
ASN AM
Bangladeshi
Pakistani
Indian
Filipino
Vietnamese
Cambodian
Japanese
Korean
Hmong
Chinese
Strongly agree Somewhat agree Neither Somewhat Disagree Strongly Disagree
The federal government should raise the minimum wage to allow every working American a decent standard of living.
54

2016 Post-Election National Asian American Survey
Role of Federal Government: Raise Taxes on the rich
61%
69%
61%
69%
63%
56%
64%
63%
59%
51%
40%
21%
23%
23%
15%
20%
27%
17%
17%
21%
21%
28%
6%
2%
4%
5%
5%
6%
8%
2%
8%
19%
15%
8%
4%
6%
6%
7%
8%
5%
13%
9%
5%
10%
5%
3%
6%
5%
5%
4%
6%
6%
3%
5%
8%
ASN AM
Bangladeshi
Indian
Vietnamese
Japanese
Korean
Pakistani
Filipino
Chinese
Hmong
Cambodian
Strongly agree Somewhat agree Neither Somewhat Disagree Strongly Disagree
The federal government should increase income taxes on people making over a million dollars a year.
55

2016 Post-Election National Asian American Survey
Role of Federal Government: Offshoring jobs
35%
72%
40%
32%
44%
39%
42%
33%
31%
18%
15%
24%
10%
23%
29%
17%
22%
16%
22%
24%
28%
30%
11%
7%
8%
7%
11%
22%
17%
8%
16%
18%
10%
18%
5%
16%
16%
15%
16%
9%
22%
19%
23%
26%
13%
5%
14%
16%
13%
2%
16%
15%
11%
13%
19%
ASN AM
Vietnamese
Bangladeshi
Indian
Pakistani
Cambodian
Hmong
Filipino
Chinese
Japanese
Korean
Strongly agree Somewhat agree Neither Somewhat Disagree Strongly Disagree
The federal government should do more to discourage big American companies from hiring foreign workers to replace workers in the U.S.
56

2016 Post-Election National Asian American Survey
Role of Federal Government: College Tuition
52%
70%
72%
78%
73%
57%
52%
49%
44%
44%
40%
26%
24%
20%
11%
13%
26%
26%
29%
30%
29%
28%
7%
2%
4%
3%
8%
4%
6%
6%
7%
9%
11%
9%
2%
3%
4%
4%
8%
11%
8%
11%
10%
13%
6%
3%
2%
3%
2%
5%
5%
8%
8%
8%
8%
ASN AM
Bangladeshi
Hmong
Pakistani
Vietnamese
Indian
Cambodian
Filipino
Korean
Japanese
Chinese
Strongly agree Somewhat agree Neither Somewhat Disagree Strongly Disagree
The federal government should enact major new spending that would help undergraduates pay tuition at public colleges without needing loans.
57

2016 Post-Election National Asian American Survey
Immigration Policy: Pathway to Citizenship
32%
65%
51%
53%
41%
41%
45%
33%
25%
32%
17%
27%
22%
27%
21%
31%
27%
22%
32%
24%
15%
27%
11%
8%
5%
6%
5%
11%
17%
5%
6%
10%
22%
13%
1%
5%
8%
7%
10%
10%
13%
25%
18%
13%
18%
5%
13%
12%
16%
12%
6%
17%
19%
26%
21%
ASN AM
Hmong
Bangladeshi
Pakistani
Filipino
Japanese
Cambodian
Indian
Korean
Vietnamese
Chinese
Strongly agree Somewhat agree Neither Somewhat Disagree Strongly Disagree
Undocumented or illegal immigrants should be allowed to have an opportunity to eventually become U.S. citizens
58

2016 Post-Election National Asian American Survey
Immigration Policy: Driver’s Licenses
30%
48%
50%
50%
33%
39%
36%
27%
31%
22%
22%
22%
24%
21%
19%
27%
17%
18%
26%
20%
24%
22%
9%
5%
11%
8%
4%
6%
22%
9%
6%
7%
17%
15%
9%
2%
8%
12%
16%
11%
16%
17%
21%
15%
24%
13%
16%
16%
24%
22%
13%
21%
26%
26%
25%
ASN AM
Bangladeshi
Hmong
Pakistani
Indian
Vietnamese
Cambodian
Japanese
Filipino
Korean
Chinese
Strongly agree Somewhat agree Neither Somewhat Disagree Strongly Disagree
States should provide driver’s licenses to all residents, regardless of their immigration status
59
Racial Identification
60

2016 Post-Election National Asian American Survey
Asian Americans: Share Common Race
57%
80%
68%
66%
62%
56%
54%
54%
54%
43%
39%
ASN AM
Hmong
Korean
Filipino
Japanese
Chinese
Indian
Bangladeshi
Cambodian
Pakistani
Vietnamese
What, if anything do [RACES] in the United States share with one another? Would you say they share…
A common race
61

2016 Post-Election National Asian American Survey
Asian Americans: Share Common Culture
65%
76%
74%
70%
65%
65%
63%
59%
56%
56%
51%
ASN AM
Filipino
Indian
Bangladeshi
Japanese
Korean
Hmong
Pakistani
Chinese
Cambodian
Vietnamese
What, if anything do [RACES] in the United States share with one another? Would you say they share…
A common culture
62

2016 Post-Election National Asian American Survey
Asian Americans: Share Common Economic Interests
66%
79%
75%
73%
69%
68%
64%
61%
55%
53%
52%
ASN AM
Hmong
Indian
Filipino
Bangladeshi
Vietnamese
Pakistani
Chinese
Cambodian
Korean
Japanese
What, if anything do [RACES] in the United States share with one another? Would you say they share…
A common economic interests
63

2016 Post-Election National Asian American Survey
Asian Americans: Share Common Political Interests
49%
55%
55%
55%
53%
52%
48%
47%
39%
37%
35%
ASN AM
Pakistani
Bangladeshi
Chinese
Indian
Hmong
Korean
Filipino
Cambodian
Vietnamese
Japanese
What, if anything do [RACES] in the United States share with one another? Would you say they share…
A common political interests
64

2016 Post-Election National Asian American Survey
Who Counts As Asian American? Answers by Race of Respondent
Now I am going to read you a list of different groups. After I say each one, please tell me if you think the group is very likely to be Asian or Asian American, somewhat likely, or not likely to be Asian or Asian American.
White Latino Black NHPI ASIAN AMChinese
- Not likely to be Asian/Asian Am 5% 9% 10% 5% 5% - Don't Know 11% 17% 17% 3% 7% Korean
- Not likely to be Asian/Asian Am 7% 11% 11% 6% 6% - Don't Know 12% 17% 19% 4% 8% Japanese
- Not likely to be Asian/Asian Am 5% 8% 11% 6% 7% - Don't Know 12% 18% 17% 2% 8% Filipino
- Not likely to be Asian/Asian Am 15% 15% 17% 17% 6% - Don't Know 14% 18% 15% 1% 9% Indian
- Not likely to be Asian/Asian Am 42% 35% 34% 48% 15% - Don't Know 14% 20% 19% 4% 11% Paskitani
- Not likely to be Asian/Asian Am 45% 42% 45% 56% 27% - Don't Know 16% 24% 22% 6% 16% Arabs or Middle Eastern people
- Not likely to be Asian/Asian Am 55% 43% 47% 59% 45% - Don't Know 14% 21% 21% 6% 17%
65

Race Relations
66

2016 Post-Election National Asian American Survey
Common with Blacks
21%
33%
27%
24%
23%
22%
19%
19%
14%
14%
12%
31%
24%
23%
30%
18%
37%
27%
31%
14%
42%
18%
38%
37%
36%
40%
43%
34%
42%
39%
51%
33%
47%
11%
7%
15%
7%
15%
7%
12%
11%
21%
12%
23%
Asn Am Average
Cambodian
Vietnamese
Japanese
Pakistani
Chinese
Indian
Filipino
Hmong
Korean
Bangladeshi
A lot in common Some Little Nothing at all in common
Thinking about government services, political power and representation, would you say Asian Americans have a lot in common, some, little in common, or nothing at all in common with… Blacks?
67
2016 Post-Election National Asian American Survey
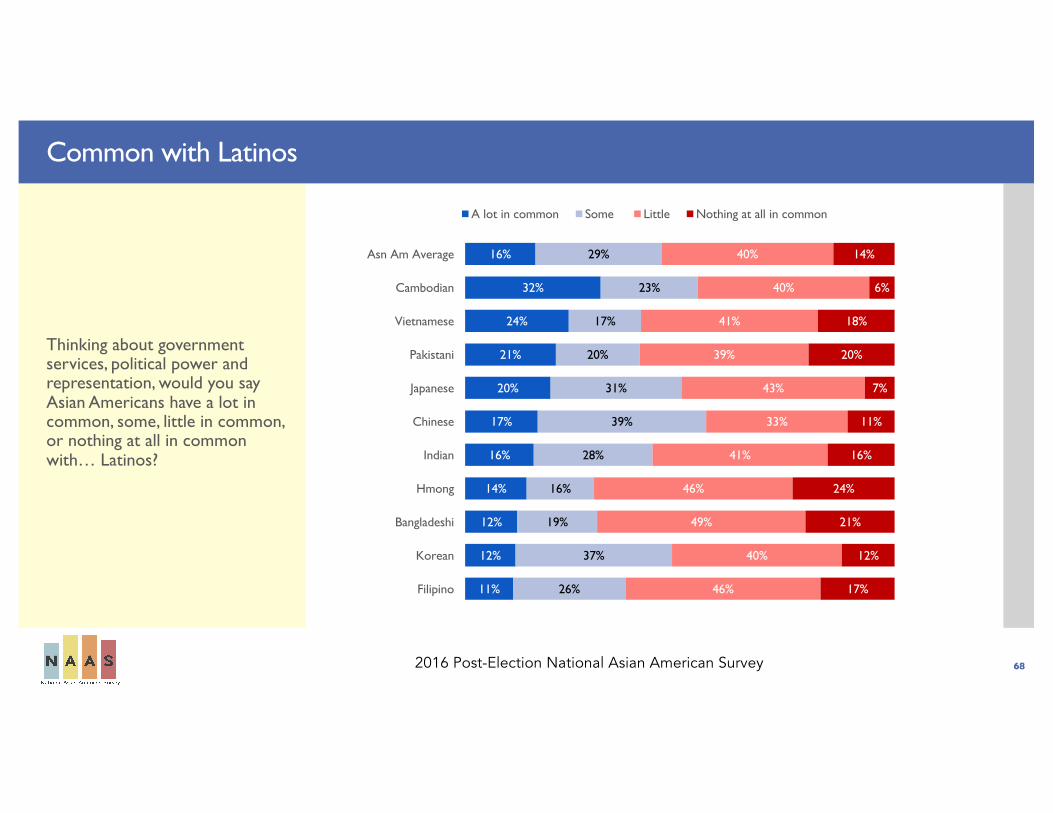
Common with Latinos
16%
32%
24%
21%
20%
17%
16%
14%
12%
12%
11%
29%
23%
17%
20%
31%
39%
28%
16%
19%
37%
26%
40%
40%
41%
39%
43%
33%
41%
46%
49%
40%
46%
14%
6%
18%
20%
7%
11%
16%
24%
21%
12%
17%
Asn Am Average
Cambodian
Vietnamese
Pakistani
Japanese
Chinese
Indian
Hmong
Bangladeshi
Korean
Filipino
A lot in common Some Little Nothing at all in common
Thinking about government services, political power and representation, would you say Asian Americans have a lot in common, some, little in common, or nothing at all in common with… Latinos?
68

2016 Post-Election National Asian American Survey
Common with Whites
16%
30%
27%
24%
20%
17%
17%
14%
13%
10%
9%
30%
32%
26%
20%
37%
22%
15%
24%
31%
31%
41%
42%
32%
27%
40%
34%
45%
47%
45%
43%
48%
44%
13%
5%
19%
17%
8%
15%
22%
18%
12%
11%
7%
ASN AM
Cambodian
Hmong
Pakistani
Chinese
Bangladeshi
Vietnamese
Indian
Filipino
Japanese
Korean
A lot in common Some Little Nothing at all in common
Thinking about government services, political power and representation, would you say Asian Americans have a lot in common, some, little in common, or nothing at all in common with… Whites?
69

2016 Post-Election National Asian American Survey
Contact with: Whites
48%
58%
51%
59%
64%
55%
46%
37%
37%
25%
30%
27%
33%
33%
25%
17%
23%
24%
29%
29%
36%
28%
17%
8%
10%
13%
17%
14%
24%
18%
21%
21%
23%
8%
1%
5%
3%
2%
8%
7%
15%
13%
19%
18%
1%
1%
1%
1%
ASN AM
Indian
Pakistani
Japanese
Vietnamese
Filipino
Korean
Cambodian
Bangladeshi
Hmong
Chinese
A lot of contact Some contact Only a little contact
No contact at all Don't know Refused
In your daily life, how much contact do you, personally, have with people who are…
70
2016 Post-Election National Asian American Survey
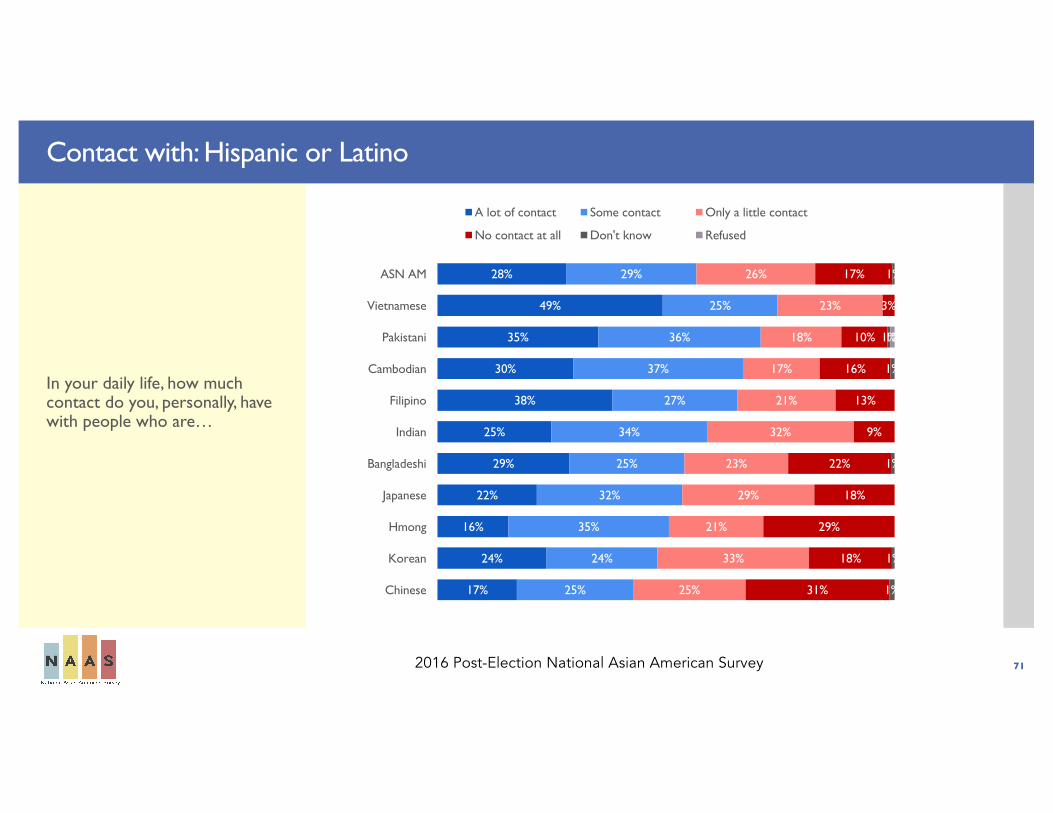
Contact with: Hispanic or Latino
28%
49%
35%
30%
38%
25%
29%
22%
16%
24%
17%
29%
25%
36%
37%
27%
34%
25%
32%
35%
24%
25%
26%
23%
18%
17%
21%
32%
23%
29%
21%
33%
25%
17%
3%
10%
16%
13%
9%
22%
18%
29%
18%
31%
1%
1%
1%
1%
1%
1%
1%
ASN AM
Vietnamese
Pakistani
Cambodian
Filipino
Indian
Bangladeshi
Japanese
Hmong
Korean
Chinese
A lot of contact Some contact Only a little contact
No contact at all Don't know Refused
In your daily life, how much contact do you, personally, have with people who are…
71

2016 Post-Election National Asian American Survey
Contact with: Black or African American
22%
27%
30%
27%
28%
30%
28%
15%
14%
16%
13%
29%
42%
39%
34%
32%
27%
26%
30%
27%
24%
22%
30%
25%
19%
23%
26%
37%
29%
34%
28%
40%
27%
19%
7%
11%
15%
14%
5%
16%
21%
30%
20%
35%
1%
1%
1%
1%
2%
1%
ASN AM
Indian
Pakistani
Cambodian
Bangladeshi
Vietnamese
Filipino
Japanese
Hmong
Korean
Chinese
A lot of contact Some contact Only a little contact
No contact at all Don't know Refused
In your daily life, how much contact do you, personally, have with people who are…
72