2016 eu-wide stress test · irb total 71,659 214 010,458 85 103 48.7% 1 computed as: stock of...
TRANSCRIPT

Bank Name Société Générale S.A.
LEI Code O2RNE8IBXP4R0TD8PU41
Country Code FRSo
2016 EU-wide Stress Test

Actual
(starting year)Baseline Scenario Adverse Scenario
(mln EUR, %) 31/12/2015 31/12/2018 31/12/2018
Cumulative 3y: Net interest income 29,448.67 25,109.01
Cumulative 3y: Gains or (-) losses on financial assets and liabilities held for trading or designated at fair value through profit
and loss, net13,452.68 4,738.46
Cumulative 3y: (Impairment or (-) reversal of impairment on financial assets not measured at fair value through profit or loss) -6,185.50 -9,691.45
Cumulative 3y: Profit or (-) loss for the year 7,040.26 -5,040.81
Coverage ratio - Default stock 55.38% 45.49% 45.98%
Common Equity Tier 1 capital 40,735.09 42,908.87 30,651.43
Total Risk exposure amount 356,725.34 359,259.90 381,600.39
Common Equity Tier 1 ratio, % 11.4% 11.9% 8.0%
Fully loaded Common Equity Tier 1 ratio, % 10.9% 11.6% 7.5%
Tier 1 capital 49,926.40 52,128.02 39,870.59
Total leverage ratio exposures 1,196,041.55 1,196,041.55 1,196,041.55
Leverage ratio, % 4.2% 4.4% 3.3%
Fully loaded leverage ratio, % 4.0% 2.9%
Total amount of instruments with mandatory conversion into ordinary shares upon a fixed date in the 2016 -2018 period
(cumulative conversions)1 0
Total Additional Tier 1 and Tier 2 instruments eligible as regulatory capital under the CRR provisions that convert into Common
Equity Tier 1 or are written down upon a trigger event2 0
Of which: eligible instruments whose trigger is above CET1 capital ratio in the adverse scenario2 0
1 Conversions not considered for CET1 computation
2 Excluding instruments with mandatory conversion into ordinary shares upon a fixed date in the 2016 -2018 period
2016 EU-wide Stress Test: SummarySociété Générale S.A.
Memorandum items

2016 EU-wide Stress Test:
Credit risk IRBSociété Générale S.A.
(mln EUR, %)
Non-defaulted Defaulted Non-defaulted Defaulted Non-defaulted Defaulted Non-defaulted Defaulted Non-defaulted Defaulted Non-defaulted Defaulted
Central banks and central governments 169,172 65 16 0 5,841 8 0 0 9 56 0 0 85.6%
Institutions 50,967 49 29 0 10,487 104 5 0 0 27 0 0 58.9%
Corporates 223,954 6,617 4,610 219 101,492 3,796 3,673 0 946 2,941 0 90 46.2%
Corporates - Of Which: Specialised Lending 29,393 1,107 0 0 11,992 809 0 0 0 380 0 0 34.3%
Corporates - Of Which: SME 29,240 1,924 2,114 121 17,420 540 1,544 0 0 919 0 58 47.9%
Retail 137,269 6,686 0 0 26,698 2,284 0 0 105 3,427 0 0 51.3%
Retail - Secured on real estate property 89,792 1,278 0 0 11,834 1,024 0 0 0 395 0 0 30.9%
Retail - Secured on real estate property - Of Which: SME 4,849 87 0 0 760 90 0 0 0 8 0 0 9.4%
Retail - Secured on real estate property - Of Which: non-SME 84,944 1,191 0 0 11,074 934 0 0 0 386 0 0 32.4%
Retail - Qualifying Revolving 4,830 714 0 0 2,136 280 0 0 0 405 0 0 56.7%
42,647 4,695 0 0 12,728 980 0 0 105 2,628 0 0 56.0%
Retail - Other Retail - Of Which: SME 15,117 2,131 0 0 4,631 588 0 0 0 1,231 0 0 57.8%
Retail - Other Retail - Of Which: non-SME 27,530 2,564 0 0 8,097 392 0 0 105 1,397 0 0 54.5%
Equity 5,110 0 0 0 18,462 0 0 0 0 0 0 0 -
Securitisation
Other non-credit obligation assets 33 0 0 0 30 0 0 0 0 0 0 0 -
IRB TOTAL 586,504 13,417 4,655 219 163,011 6,192 3,679 0 1,060 6,451 0 91 49.0%1 Computed as: Stock of provisions for defaulted stock / default stock (as defined in paragraphs 59 and 61 of the Methodological note)
(mln EUR, %)Non-defaulted Defaulted Non-defaulted Defaulted Non-defaulted Defaulted Non-defaulted Defaulted Non-defaulted Defaulted Non-defaulted Defaulted
Central banks and central governments 60,977 8 16 0 17 8 0 0 9 0 0 0 0.0%
Institutions 18,991 9 29 0 1,129 39 5 0 0 6 0 0 64.9%
Corporates 80,753 3,334 4,387 214 43,902 1,493 3,538 0 946 1,481 0 83 44.3%
Corporates - Of Which: Specialised Lending 3,770 156 0 0 1,896 37 0 0 0 57 0 0 36.4%
Corporates - Of Which: SME 16,800 1,362 2,114 121 11,610 280 1,544 0 0 684 0 54 49.9%
Retail 118,615 5,650 0 0 20,935 1,864 0 0 105 2,764 0 0 48.9%
Retail - Secured on real estate property 80,881 1,024 0 0 9,555 895 0 0 0 261 0 0 25.5%
Retail - Secured on real estate property - Of Which: SME 4,849 87 0 0 760 90 0 0 0 8 0 0 9.4%
Retail - Secured on real estate property - Of Which: non-SME 76,033 937 0 0 8,795 805 0 0 0 253 0 0 27.0%
Retail - Qualifying Revolving 4,463 692 0 0 2,007 259 0 0 0 386 0 0 55.7%
Retail - Other Retail 33,271 3,935 0 0 9,372 711 0 0 105 2,118 0 0 53.8%
Retail - Other Retail - Of Which: SME 10,586 1,842 0 0 3,610 436 0 0 0 1,117 0 0 60.6%
Retail - Other Retail - Of Which: non-SME 22,684 2,093 0 0 5,761 275 0 0 105 1,001 0 0 47.8%
Equity 4,251 0 0 0 15,305 0 0 0 0 0 0 0 -
Securitisation
Other non-credit obligation assets 10 0 0 0 10 0 0 0 0 0 0 0 -
IRB TOTAL 283,598 9,001 4,431 214 81,297 3,404 3,543 0 1,060 4,251 0 83 47.1%1 Computed as: Stock of provisions for defaulted stock / default stock (as defined in paragraphs 59 and 61 of the Methodological note)
(mln EUR, %)Non-defaulted Defaulted Non-defaulted Defaulted Non-defaulted Defaulted Non-defaulted Defaulted Non-defaulted Defaulted Non-defaulted Defaulted
Central banks and central governments 33,643 0 0 0 0 0 0 0 0 0 0 0 -
Institutions 4,497 0 0 0 411 0 0 0 0 0 0 0 0.0%
Corporates 33,390 213 0 0 9,781 84 0 0 0 103 0 0 48.8%
Corporates - Of Which: Specialised Lending 5,740 103 0 0 2,062 51 0 0 0 37 0 0 36.0%
Corporates - Of Which: SME 83 0 0 0 30 0 0 0 0 0 0 0 -
Retail 59 1 0 0 10 1 0 0 0 0 0 0 31.1%
Retail - Secured on real estate property 19 0 0 0 2 0 0 0 0 0 0 0 5.7%
Retail - Secured on real estate property - Of Which: SME 0 0 0 0 0 0 0 0 0 0 0 0 -
Retail - Secured on real estate property - Of Which: non-SME 19 0 0 0 2 0 0 0 0 0 0 0 5.7%
Retail - Qualifying Revolving 3 0 0 0 1 0 0 0 0 0 0 0 60.4%
Retail - Other Retail 38 0 0 0 6 0 0 0 0 0 0 0 45.1%
Retail - Other Retail - Of Which: SME 4 0 0 0 2 0 0 0 0 0 0 0 36.0%
Retail - Other Retail - Of Which: non-SME 34 0 0 0 5 0 0 0 0 0 0 0 45.1%
Equity 70 0 0 0 256 0 0 0 0 0 0 0 -
Securitisation
Other non-credit obligation assets 0 0 0 0 0 0 0 0 0 0 0 0 -
IRB TOTAL 71,659 214 0 0 10,458 85 0 0 0 103 0 0 48.7%1 Computed as: Stock of provisions for defaulted stock / default stock (as defined in paragraphs 59 and 61 of the Methodological note)
(mln EUR, %)Non-defaulted Defaulted Non-defaulted Defaulted Non-defaulted Defaulted Non-defaulted Defaulted Non-defaulted Defaulted Non-defaulted Defaulted
Central banks and central governments 1,307 0 0 0 0 0 0 0 0 0 0 0 -
Institutions 4,421 0 0 0 562 0 0 0 0 0 0 0 -
Corporates 14,608 2 3 0 5,207 0 3 0 0 1 0 0 62.8%
Corporates - Of Which: Specialised Lending 2,367 0 0 0 702 0 0 0 0 0 0 0 -
Corporates - Of Which: SME 523 0 0 0 346 0 0 0 0 0 0 0 0.0%
Retail 1,696 10 0 0 206 2 0 0 0 4 0 0 40.0%
Retail - Secured on real estate property 988 4 0 0 99 0 0 0 0 1 0 0 21.0%
Retail - Secured on real estate property - Of Which: SME 0 0 0 0 0 0 0 0 0 0 0 0 -
Retail - Secured on real estate property - Of Which: non-SME 988 4 0 0 99 0 0 0 0 1 0 0 21.0%
Retail - Qualifying Revolving 3 0 0 0 1 0 0 0 0 0 0 0 79.7%
Retail - Other Retail 705 5 0 0 105 1 0 0 0 3 0 0 54.2%
Retail - Other Retail - Of Which: SME 5 0 0 0 3 0 0 0 0 0 0 0 91.9%
Retail - Other Retail - Of Which: non-SME 700 5 0 0 102 1 0 0 0 3 0 0 54.2%
Equity 9 0 0 0 32 0 0 0 0 0 0 0 -
Securitisation
Other non-credit obligation assets 0 0 0 0 0 0 0 0 0 0 0 0 -
IRB TOTAL 22,040 12 3 0 6,007 2 3 0 0 5 0 0 44.0%1 Computed as: Stock of provisions for defaulted stock / default stock (as defined in paragraphs 59 and 61 of the Methodological note)
United Kingdom
A-IRB F-IRB A-IRB F-IRB
United States
31/12/2015
Exposure values Risk exposure amounts Stock of provisions
Coverage Ratio -
Default Stock1
A-IRB F-IRB
Coverage Ratio -
Default Stock1
A-IRB F-IRB A-IRB F-IRB A-IRB F-IRB
France
31/12/2015
Exposure values Risk exposure amounts Stock of provisions
F-IRB A-IRB F-IRB
31/12/2015
Exposure values Risk exposure amounts Stock of provisions
Coverage Ratio -
Default Stock1
A-IRB F-IRB A-IRB
Société Générale S.A.
F-IRB A-IRB F-IRB A-IRB F-IRB
31/12/2015
Exposure values Risk exposure amounts Stock of provisions
Coverage Ratio -
Default Stock1
A-IRB

2016 EU-wide Stress Test:
Credit risk IRBSociété Générale S.A.
(mln EUR, %)Non-defaulted Defaulted Non-defaulted Defaulted Non-defaulted Defaulted Non-defaulted Defaulted Non-defaulted Defaulted Non-defaulted Defaulted
Central banks and central governments 7,439 0 0 0 0 0 0 0 0 0 0 0 -
Institutions 1,774 0 0 0 263 0 0 0 0 0 0 0 -
Corporates 11,225 104 4 0 4,140 150 4 0 0 30 0 0 28.7%
Corporates - Of Which: Specialised Lending 514 14 0 0 358 45 0 0 0 0 0 0 1.0%
Corporates - Of Which: SME 1,404 60 0 0 579 88 0 0 0 21 0 0 35.5%
Retail 3,002 51 0 0 556 24 0 0 0 11 0 0 21.0%
Retail - Secured on real estate property 11 1 0 0 2 0 0 0 0 0 0 0 74.1%
Retail - Secured on real estate property - Of Which: SME 0 0 0 0 0 0 0 0 0 0 0 0 -
Retail - Secured on real estate property - Of Which: non-SME 11 1 0 0 2 0 0 0 0 0 0 0 74.1%
Retail - Qualifying Revolving 2 0 0 0 1 0 0 0 0 0 0 0 81.8%
Retail - Other Retail 2,990 51 0 0 554 24 0 0 0 10 0 0 20.4%
Retail - Other Retail - Of Which: SME 2,977 50 0 0 552 23 0 0 0 10 0 0 19.9%
Retail - Other Retail - Of Which: non-SME 13 1 0 0 2 0 0 0 0 0 0 0 60.2%
Equity 5 0 0 0 20 0 0 0 0 0 0 0 -
Securitisation
Other non-credit obligation assets 4 0 0 0 1 0 0 0 0 0 0 0 -
IRB TOTAL 23,450 155 4 0 4,980 174 4 0 0 41 0 0 26.2%1 Computed as: Stock of provisions for defaulted stock / default stock (as defined in paragraphs 59 and 61 of the Methodological note)
(mln EUR, %)Non-defaulted Defaulted Non-defaulted Defaulted Non-defaulted Defaulted Non-defaulted Defaulted Non-defaulted Defaulted Non-defaulted Defaulted
Central banks and central governments 8,507 0 0 0 302 0 0 0 0 0 0 0 -
Institutions 1,522 0 0 0 678 0 0 0 0 0 0 0 16.1%
Corporates 7,888 253 0 0 4,637 80 0 0 0 166 0 0 65.8%
Corporates - Of Which: Specialised Lending 1,507 16 0 0 1,228 12 0 0 0 5 0 0 29.2%
Corporates - Of Which: SME 3,084 175 0 0 1,590 20 0 0 0 113 0 0 65.1%
Retail 8,133 364 0 0 2,755 237 0 0 0 249 0 0 68.3%
Retail - Secured on real estate property 6,810 222 0 0 2,041 125 0 0 0 128 0 0 57.4%
Retail - Secured on real estate property - Of Which: SME 0 0 0 0 0 0 0 0 0 0 0 0 -
Retail - Secured on real estate property - Of Which: non-SME 6,810 222 0 0 2,041 125 0 0 0 128 0 0 57.4%
Retail - Qualifying Revolving 262 17 0 0 85 17 0 0 0 15 0 0 89.6%
Retail - Other Retail 1,061 125 0 0 629 96 0 0 0 106 0 0 84.8%
Retail - Other Retail - Of Which: SME 536 61 0 0 254 35 0 0 0 55 0 0 90.5%
Retail - Other Retail - Of Which: non-SME 525 64 0 0 375 60 0 0 0 50 0 0 79.3%
Equity 24 0 0 0 91 0 0 0 0 0 0 0 -
Securitisation
Other non-credit obligation assets 0 0 0 0 0 0 0 0 0 0 0 0 -
IRB TOTAL 26,075 617 0 0 8,462 317 0 0 0 415 0 0 67.3%1 Computed as: Stock of provisions for defaulted stock / default stock (as defined in paragraphs 59 and 61 of the Methodological note)
(mln EUR, %)Non-defaulted Defaulted Non-defaulted Defaulted Non-defaulted Defaulted Non-defaulted Defaulted Non-defaulted Defaulted Non-defaulted Defaulted
Central banks and central governments 2,404 0 0 0 483 0 0 0 0 0 0 0 -
Institutions 908 4 0 0 470 13 0 0 0 0 0 0 7.3%
Corporates 4,933 361 0 0 2,540 134 0 0 0 80 0 0 24.0%
Corporates - Of Which: Specialised Lending 613 93 0 0 275 60 0 0 0 23 0 0 24.5%
Corporates - Of Which: SME 1,049 180 0 0 440 4 0 0 0 44 0 0 24.3%
Retail 3,147 561 0 0 1,817 142 0 0 0 382 0 0 68.0%
Retail - Secured on real estate property 22 0 0 0 3 0 0 0 0 0 0 0 62.4%
Retail - Secured on real estate property - Of Which: SME 0 0 0 0 0 0 0 0 0 0 0 0 -
Retail - Secured on real estate property - Of Which: non-SME 22 0 0 0 3 0 0 0 0 0 0 0 62.4%
Retail - Qualifying Revolving 3 0 0 0 2 0 0 0 0 0 0 0 56.1%
Retail - Other Retail 3,122 561 0 0 1,812 142 0 0 0 381 0 0 68.0%
Retail - Other Retail - Of Which: SME 909 172 0 0 158 93 0 0 0 47 0 0 27.2%
Retail - Other Retail - Of Which: non-SME 2,213 388 0 0 1,654 49 0 0 0 335 0 0 86.2%
Equity 2 0 0 0 6 0 0 0 0 0 0 0 -
Securitisation
Other non-credit obligation assets 0 0 0 0 0 0 0 0 0 0 0 0 -
IRB TOTAL 11,394 926 0 0 5,315 289 0 0 0 462 0 0 51.5%1 Computed as: Stock of provisions for defaulted stock / default stock (as defined in paragraphs 59 and 61 of the Methodological note)
(mln EUR, %)Non-defaulted Defaulted Non-defaulted Defaulted Non-defaulted Defaulted Non-defaulted Defaulted Non-defaulted Defaulted Non-defaulted Defaulted
Central banks and central governments 12,234 0 0 0 0 0 0 0 0 0 0 0 -
Institutions 688 0 0 0 48 0 0 0 0 0 0 0 -
Corporates 3,766 9 0 0 1,229 23 0 0 0 1 0 0 6.7%
Corporates - Of Which: Specialised Lending 1,824 4 0 0 432 15 0 0 0 0 0 0 7.6%
Corporates - Of Which: SME 87 2 0 0 39 0 0 0 0 0 0 0 0.0%
Retail 611 17 0 0 82 3 0 0 0 3 0 0 17.2%
Retail - Secured on real estate property 321 13 0 0 37 0 0 0 0 0 0 0 0.3%
Retail - Secured on real estate property - Of Which: SME 0 0 0 0 0 0 0 0 0 0 0 0 -
Retail - Secured on real estate property - Of Which: non-SME 321 13 0 0 37 0 0 0 0 0 0 0 0.3%
Retail - Qualifying Revolving 5 3 0 0 3 1 0 0 0 2 0 0 86.1%
Retail - Other Retail 285 1 0 0 42 1 0 0 0 0 0 0 43.1%
Retail - Other Retail - Of Which: SME 13 0 0 0 7 0 0 0 0 0 0 0 80.6%
Retail - Other Retail - Of Which: non-SME 272 1 0 0 35 1 0 0 0 0 0 0 36.5%
Equity 0 0 0 0 1 0 0 0 0 0 0 0 -
Securitisation
Other non-credit obligation assets 0 0 0 0 0 0 0 0 0 0 0 0 -
IRB TOTAL 17,299 26 0 0 1,360 26 0 0 0 3 0 0 13.4%1 Computed as: Stock of provisions for defaulted stock / default stock (as defined in paragraphs 59 and 61 of the Methodological note)
Switzerland
A-IRB F-IRB A-IRB F-IRB
Italy
31/12/2015
Exposure values Risk exposure amounts Stock of provisions
Coverage Ratio -
Default Stock1
A-IRB F-IRB
Stock of provisions
Coverage Ratio -
Default Stock1
A-IRB F-IRB A-IRB F-IRB A-IRB F-IRB
Czech Republic
31/12/2015
Exposure values Risk exposure amounts
A-IRB F-IRB A-IRB F-IRB
Germany
31/12/2015
Exposure values Risk exposure amounts Stock of provisions
Coverage Ratio -
Default Stock1
A-IRB F-IRB
Stock of provisions
Coverage Ratio -
Default Stock1
A-IRB F-IRB A-IRB F-IRB A-IRB F-IRB
31/12/2015
Exposure values Risk exposure amounts

2016 EU-wide Stress Test:
Credit risk IRBSociété Générale S.A.
(mln EUR, %)Non-defaulted Defaulted Non-defaulted Defaulted Non-defaulted Defaulted Non-defaulted Defaulted Non-defaulted Defaulted Non-defaulted Defaulted
Central banks and central governments 7,736 0 0 0 0 0 0 0 0 0 0 0 -
Institutions 256 0 0 0 21 0 0 0 0 0 0 0 -
Corporates 6,602 16 0 0 2,333 2 0 0 0 13 0 0 78.7%
Corporates - Of Which: Specialised Lending 1,075 0 0 0 208 0 0 0 0 0 0 0 -
Corporates - Of Which: SME 850 1 0 0 383 0 0 0 0 0 0 0 0.1%
Retail 115 1 0 0 18 1 0 0 0 0 0 0 16.6%
Retail - Secured on real estate property 9 1 0 0 1 0 0 0 0 0 0 0 4.9%
Retail - Secured on real estate property - Of Which: SME 0 0 0 0 0 0 0 0 0 0 0 0 -
Retail - Secured on real estate property - Of Which: non-SME 9 1 0 0 1 0 0 0 0 0 0 0 4.9%
Retail - Qualifying Revolving 2 0 0 0 1 0 0 0 0 0 0 0 84.1%
Retail - Other Retail 104 0 0 0 16 0 0 0 0 0 0 0 81.1%
Retail - Other Retail - Of Which: SME 8 0 0 0 4 0 0 0 0 0 0 0 84.7%
Retail - Other Retail - Of Which: non-SME 97 0 0 0 12 0 0 0 0 0 0 0 19.4%
Equity 332 0 0 0 1,228 0 0 0 0 0 0 0 -
Securitisation
Other non-credit obligation assets 0 0 0 0 0 0 0 0 0 0 0 0 -
IRB TOTAL 15,041 17 0 0 3,599 2 0 0 0 13 0 0 76.3%1 Computed as: Stock of provisions for defaulted stock / default stock (as defined in paragraphs 59 and 61 of the Methodological note)
(mln EUR, %)Non-defaulted Defaulted Non-defaulted Defaulted Non-defaulted Defaulted Non-defaulted Defaulted Non-defaulted Defaulted Non-defaulted Defaulted
Central banks and central governments 2,117 0 0 0 960 0 0 0 0 0 0 0 -
Institutions 372 0 0 0 514 0 0 0 0 0 0 0 -
Corporates 2,732 20 0 0 1,203 26 0 0 0 13 0 0 66.2%
Corporates - Of Which: Specialised Lending 2,000 12 0 0 741 0 0 0 0 12 0 0 99.9%
Corporates - Of Which: SME 6 7 0 0 4 26 0 0 0 0 0 0 0.0%
Retail 170 0 0 0 19 0 0 0 0 0 0 0 59.4%
Retail - Secured on real estate property 98 0 0 0 10 0 0 0 0 0 0 0 -
Retail - Secured on real estate property - Of Which: SME 0 0 0 0 0 0 0 0 0 0 0 0 -
Retail - Secured on real estate property - Of Which: non-SME 98 0 0 0 10 0 0 0 0 0 0 0 -
Retail - Qualifying Revolving 2 0 0 0 1 0 0 0 0 0 0 0 59.4%
Retail - Other Retail 71 0 0 0 9 0 0 0 0 0 0 0 100.0%
Retail - Other Retail - Of Which: SME 0 0 0 0 0 0 0 0 0 0 0 0 -
Retail - Other Retail - Of Which: non-SME 71 0 0 0 9 0 0 0 0 0 0 0 100.0%
Equity 15 0 0 0 54 0 0 0 0 0 0 0 -
Securitisation
Other non-credit obligation assets 0 0 0 0 0 0 0 0 0 0 0 0 -
IRB TOTAL 5,406 20 0 0 2,750 26 0 0 0 13 0 0 66.2%1 Computed as: Stock of provisions for defaulted stock / default stock (as defined in paragraphs 59 and 61 of the Methodological note)
(mln EUR, %)Non-defaulted Defaulted Non-defaulted Defaulted Non-defaulted Defaulted Non-defaulted Defaulted Non-defaulted Defaulted Non-defaulted Defaulted
Central banks and central governments 9,579 0 0 0 254 0 0 0 0 0 0 0 -
Institutions 966 0 0 0 132 0 0 0 0 0 0 0 -
Corporates 1,321 0 0 0 335 0 0 0 0 0 0 0 -
Corporates - Of Which: Specialised Lending 0 0 0 0 0 0 0 0 0 0 0 0 -
Corporates - Of Which: SME 0 0 0 0 1 0 0 0 0 0 0 0 -
Retail 10 0 0 0 1 0 0 0 0 0 0 0 34.8%
Retail - Secured on real estate property 6 0 0 0 0 0 0 0 0 0 0 0 -
Retail - Secured on real estate property - Of Which: SME 0 0 0 0 0 0 0 0 0 0 0 0 -
Retail - Secured on real estate property - Of Which: non-SME 6 0 0 0 0 0 0 0 0 0 0 0 -
Retail - Qualifying Revolving 1 0 0 0 0 0 0 0 0 0 0 0 34.8%
Retail - Other Retail 3 0 0 0 1 0 0 0 0 0 0 0 -
Retail - Other Retail - Of Which: SME 0 0 0 0 0 0 0 0 0 0 0 0 -
Retail - Other Retail - Of Which: non-SME 3 0 0 0 1 0 0 0 0 0 0 0 -
Equity 2 0 0 0 6 0 0 0 0 0 0 0 -
Securitisation
Other non-credit obligation assets 0 0 0 0 0 0 0 0 0 0 0 0 -
IRB TOTAL 11,878 0 0 0 728 0 0 0 0 0 0 0 34.8%1 Computed as: Stock of provisions for defaulted stock / default stock (as defined in paragraphs 59 and 61 of the Methodological note)
Japan
Stock of provisions
Coverage Ratio -
Default Stock1
A-IRB F-IRB A-IRB F-IRB A-IRB F-IRB
Russian Federation
31/12/2015
Exposure values Risk exposure amounts
A-IRB F-IRB A-IRB F-IRB
Luxembourg
31/12/2015
Exposure values Risk exposure amounts Stock of provisions
Coverage Ratio -
Default Stock1
A-IRB F-IRB
Stock of provisions
Coverage Ratio -
Default Stock1
A-IRB F-IRB A-IRB F-IRB A-IRB F-IRB
31/12/2015
Exposure values Risk exposure amounts

2016 EU-wide Stress Test:
Credit risk IRBSociété Générale S.A.
(mln EUR, %)
Central banks and central governments
Institutions
Corporates
Corporates - Of Which: Specialised Lending
Corporates - Of Which: SME
Retail
Retail - Secured on real estate property
Retail - Secured on real estate property - Of Which: SME
Retail - Secured on real estate property - Of Which: non-SME
Retail - Qualifying Revolving
Retail - Other Retail - Of Which: SME
Retail - Other Retail - Of Which: non-SME
Equity
Securitisation
Other non-credit obligation assets
IRB TOTAL1 Computed as: Stock of provisions for defaulted stock / default stock (as defined in paragraphs 59 and 61 of the Methodological note)
(mln EUR, %)
Central banks and central governments
Institutions
Corporates
Corporates - Of Which: Specialised Lending
Corporates - Of Which: SME
Retail
Retail - Secured on real estate property
Retail - Secured on real estate property - Of Which: SME
Retail - Secured on real estate property - Of Which: non-SME
Retail - Qualifying Revolving
Retail - Other Retail
Retail - Other Retail - Of Which: SME
Retail - Other Retail - Of Which: non-SME
Equity
Securitisation
Other non-credit obligation assets
IRB TOTAL1 Computed as: Stock of provisions for defaulted stock / default stock (as defined in paragraphs 59 and 61 of the Methodological note)
United Kingdom
United States
France
Société Générale S.A.
Impairment
rate
Stock of
Provisions
Coverage Ratio -
Default Stock1
Impairment
rate
Stock of
Provisions
Coverage Ratio -
Default Stock1
Impairment
rate
Stock of
Provisions
Coverage Ratio -
Default Stock1
Impairment
rate
Stock of
Provisions
Coverage Ratio -
Default Stock1
Impairment
rate
Stock of
Provisions
Coverage Ratio -
Default Stock1
Impairment
rate
Stock of
Provisions
Coverage Ratio -
Default Stock1
0.0% 102 51.1% 0.0% 139 43.9% 0.0% 175 40.8% 0.1% 152 44.7% 0.1% 237 39.9% 0.1% 320 38.1%
0.0% 30 53.8% 0.0% 33 50.1% 0.0% 36 47.3% 0.0% 31 53.4% 0.0% 34 49.0% 0.0% 38 46.3%
0.3% 4,466 43.9% 0.3% 4,937 42.3% 0.3% 5,396 41.2% 0.4% 4,743 45.2% 0.5% 5,579 42.6% 0.4% 6,297 41.3%
0.1% 421 32.5% 0.1% 462 31.2% 0.2% 506 30.3% 0.4% 530 39.2% 0.3% 616 36.0% 0.2% 682 34.4%
0.8% 1,229 45.8% 0.8% 1,470 44.5% 0.8% 1,696 43.7% 1.0% 1,282 45.1% 1.2% 1,647 43.2% 1.2% 1,986 42.3%
0.4% 4,062 43.5% 0.4% 4,550 39.4% 0.3% 5,012 36.8% 0.4% 4,178 43.6% 0.5% 4,873 40.0% 0.4% 5,539 37.9%
0.0% 431 24.1% 0.0% 464 20.6% 0.0% 495 18.4% 0.1% 469 25.7% 0.1% 582 24.5% 0.0% 711 24.6%
0.1% 12 8.0% 0.1% 15 7.5% 0.1% 18 7.2% 0.1% 14 9.8% 0.1% 25 11.9% 0.1% 37 14.1%
0.0% 420 25.5% 0.0% 449 21.9% 0.0% 478 19.6% 0.0% 455 27.0% 0.0% 558 25.7% 0.0% 674 25.7%
2.3% 515 50.2% 2.0% 606 47.5% 1.8% 682 46.0% 2.6% 531 51.0% 2.5% 642 48.5% 2.1% 731 47.3%
0.9% 3,115 47.9% 0.9% 3,480 43.6% 0.9% 3,835 40.7% 1.0% 3,178 47.5% 1.1% 3,649 43.1% 1.1% 4,097 40.3%
1.3% 1,424 52.0% 1.4% 1,621 48.8% 1.4% 1,818 46.6% 1.5% 1,454 51.9% 1.7% 1,700 48.7% 1.6% 1,930 46.6%
0.7% 1,691 44.8% 0.6% 1,860 39.6% 0.6% 2,017 36.4% 0.8% 1,724 44.2% 0.9% 1,948 38.9% 0.9% 2,168 35.8%
0.0% 0 - 0.0% 0 - 0.0% 0 - 0.0% 0 - 0.0% 0 - 0.0% 0 -
0.0% 0 0.8% 0.0% 0 0.8% 0.0% 0 0.8% 0.0% 0 0.7% 0.0% 0 0.8% 0.0% 0 0.7%
0.2% 8,660 43.8% 0.2% 9,659 40.8% 0.2% 10,618 38.8% 0.3% 9,103 44.4% 0.3% 10,724 41.2% 0.3% 12,194 39.5%
Impairment
rate
Stock of
Provisions
Coverage Ratio -
Default Stock1
Impairment
rate
Stock of
Provisions
Coverage Ratio -
Default Stock1
Impairment
rate
Stock of
Provisions
Coverage Ratio -
Default Stock1
Impairment
rate
Stock of
Provisions
Coverage Ratio -
Default Stock1
Impairment
rate
Stock of
Provisions
Coverage Ratio -
Default Stock1
Impairment
rate
Stock of
Provisions
Coverage Ratio -
Default Stock1
0.0% 11 18.9% 0.0% 14 25.7% 0.0% 17 29.1% 0.0% 25 33.8% 0.0% 42 36.6% 0.0% 58 37.7%
0.0% 6 62.5% 0.0% 7 60.4% 0.0% 7 58.3% 0.0% 7 62.1% 0.0% 7 59.3% 0.0% 7 57.1%
0.4% 2,834 43.2% 0.4% 3,145 42.4% 0.4% 3,439 41.9% 0.5% 2,876 43.3% 0.7% 3,372 42.3% 0.6% 3,818 41.8%
0.1% 61 34.9% 0.1% 66 33.6% 0.1% 71 32.4% 0.1% 62 34.8% 0.3% 71 32.7% 0.2% 80 31.5%
1.1% 940 47.8% 1.1% 1,132 46.6% 1.0% 1,311 45.9% 1.2% 958 47.9% 1.5% 1,232 46.5% 1.5% 1,488 45.7%
0.4% 3,289 41.2% 0.3% 3,677 37.3% 0.3% 4,042 34.7% 0.4% 3,358 41.4% 0.4% 3,887 37.8% 0.4% 4,403 35.7%
0.0% 291 20.2% 0.0% 316 17.7% 0.0% 340 16.0% 0.0% 319 22.2% 0.0% 407 22.0% 0.0% 512 22.7%
0.1% 12 8.0% 0.1% 15 7.5% 0.1% 18 7.2% 0.1% 14 9.8% 0.1% 25 11.9% 0.1% 37 14.1%
0.0% 279 21.6% 0.0% 301 18.9% 0.0% 322 17.1% 0.0% 304 23.6% 0.0% 383 23.3% 0.0% 474 23.8%
2.3% 490 49.7% 2.0% 575 47.2% 1.8% 646 45.7% 2.6% 504 50.5% 2.5% 609 48.2% 2.1% 692 47.0%
0.9% 2,509 45.3% 0.9% 2,786 40.7% 0.9% 3,056 37.8% 0.9% 2,535 44.8% 1.0% 2,871 40.1% 1.1% 3,200 37.2%
1.5% 1,270 53.9% 1.6% 1,428 50.1% 1.6% 1,586 47.5% 1.5% 1,274 53.9% 1.8% 1,456 50.0% 1.8% 1,638 47.4%
0.6% 1,239 38.4% 0.5% 1,359 33.6% 0.5% 1,470 30.6% 0.7% 1,261 37.8% 0.7% 1,415 32.9% 0.7% 1,562 30.0%
0.0% 0 - 0.0% 0 - 0.0% 0 - 0.0% 0 - 0.0% 0 - 0.0% 0 -
0.0% 0 0.0% 0.0% 0 0.0% 0.0% 0 0.0% 0.0% 0 0.0% 0.0% 0 0.0% 0.0% 0 0.0%
0.3% 6,141 41.9% 0.3% 6,842 39.1% 0.2% 7,505 37.2% 0.3% 6,265 42.1% 0.4% 7,307 39.4% 0.3% 8,287 37.9%
Impairment
rate
Stock of
Provisions
Coverage Ratio -
Default Stock1
Impairment
rate
Stock of
Provisions
Coverage Ratio -
Default Stock1
Impairment
rate
Stock of
Provisions
Coverage Ratio -
Default Stock1
Impairment
rate
Stock of
Provisions
Coverage Ratio -
Default Stock1
Impairment
rate
Stock of
Provisions
Coverage Ratio -
Default Stock1
Impairment
rate
Stock of
Provisions
Coverage Ratio -
Default Stock1
0.0% 1 38.9% 0.0% 1 38.9% 0.0% 2 38.9% 0.0% 1 38.9% 0.0% 1 38.9% 0.0% 2 38.9%
0.0% 0 11.9% 0.0% 0 13.8% 0.0% 0 14.6% 0.0% 0 38.7% 0.0% 0 27.7% 0.0% 0 24.2%
0.1% 125 41.0% 0.1% 146 37.2% 0.1% 169 34.7% 0.3% 163 51.2% 0.2% 204 42.8% 0.1% 234 39.6%
0.1% 45 30.3% 0.1% 53 27.6% 0.2% 62 25.9% 0.6% 72 45.9% 0.3% 87 37.2% 0.2% 98 34.0%
0.4% 0 56.9% 0.4% 1 56.2% 0.4% 1 55.6% 0.4% 0 56.6% 0.6% 1 53.8% 0.6% 1 53.0%
0.3% 0 27.6% 0.3% 1 26.4% 0.3% 1 25.8% 0.4% 0 28.5% 0.3% 1 28.0% 0.3% 1 27.7%
0.0% 0 6.1% 0.0% 0 6.3% 0.0% 0 6.5% 0.1% 0 8.1% 0.1% 0 10.4% 0.0% 0 12.3%
- 0 - - 0 - - 0 - - 0 - - 0 - - 0 -
0.0% 0 6.1% 0.0% 0 6.3% 0.0% 0 6.5% 0.1% 0 8.1% 0.1% 0 10.4% 0.0% 0 12.3%
3.1% 0 37.7% 2.3% 0 34.4% 1.9% 0 33.0% 3.4% 0 39.2% 2.7% 0 36.0% 2.2% 0 34.8%
0.3% 0 35.2% 0.3% 0 32.2% 0.3% 0 30.7% 0.3% 0 35.3% 0.3% 0 32.4% 0.3% 0 31.1%
2.3% 0 43.6% 2.3% 0 43.6% 2.5% 0 43.6% 2.4% 0 43.6% 2.6% 0 43.7% 2.8% 0 43.8%
0.1% 0 32.3% 0.1% 0 26.4% 0.1% 0 23.0% 0.1% 0 32.3% 0.1% 0 26.4% 0.1% 0 23.0%
0.0% 0 - 0.0% 0 - 0.0% 0 - 0.0% 0 - 0.0% 0 - 0.0% 0 -
- 0 - - 0 - - 0 - - 0 - - 0 - - 0 -
0.0% 126 40.9% 0.0% 148 37.1% 0.0% 171 34.7% 0.1% 164 51.1% 0.1% 206 42.7% 0.1% 236 39.6%
Impairment
rate
Stock of
Provisions
Coverage Ratio -
Default Stock1
Impairment
rate
Stock of
Provisions
Coverage Ratio -
Default Stock1
Impairment
rate
Stock of
Provisions
Coverage Ratio -
Default Stock1
Impairment
rate
Stock of
Provisions
Coverage Ratio -
Default Stock1
Impairment
rate
Stock of
Provisions
Coverage Ratio -
Default Stock1
Impairment
rate
Stock of
Provisions
Coverage Ratio -
Default Stock1
0.0% 0 40.0% 0.0% 0 40.0% 0.0% 0 40.0% 0.0% 0 40.0% 0.0% 0 40.0% 0.0% 0 40.0%
0.0% 0 29.7% 0.0% 0 29.7% 0.0% 0 29.7% 0.0% 0 30.8% 0.0% 0 30.8% 0.0% 0 30.8%
0.1% 9 34.4% 0.1% 18 32.8% 0.1% 27 31.9% 0.1% 12 37.8% 0.2% 27 33.1% 0.1% 38 32.4%
0.0% 1 13.6% 0.0% 2 13.7% 0.1% 3 13.7% 0.0% 1 14.2% 0.1% 3 14.2% 0.1% 5 14.2%
0.4% 2 71.2% 0.4% 4 73.8% 0.4% 7 74.3% 0.4% 2 67.8% 0.5% 5 66.6% 0.5% 8 67.0%
0.1% 5 25.1% 0.1% 6 20.2% 0.1% 7 17.6% 0.1% 5 25.3% 0.1% 6 20.5% 0.1% 7 18.2%
0.0% 1 13.8% 0.0% 2 11.8% 0.0% 2 10.8% 0.0% 1 14.2% 0.0% 2 12.4% 0.0% 2 11.6%
- 0 - - 0 - - 0 - - 0 - - 0 - - 0 -
0.0% 1 13.8% 0.0% 2 11.8% 0.0% 2 10.8% 0.0% 1 14.2% 0.0% 2 12.4% 0.0% 2 11.6%
3.2% 0 43.9% 2.4% 0 38.5% 2.0% 0 36.3% 3.5% 0 45.4% 2.8% 0 40.1% 2.3% 0 38.0%
0.1% 3 35.5% 0.1% 4 28.2% 0.1% 4 24.3% 0.1% 3 35.5% 0.1% 4 28.2% 0.1% 4 24.4%
2.5% 0 47.2% 2.5% 0 47.0% 2.6% 0 46.9% 2.5% 0 47.2% 2.8% 0 47.1% 2.9% 0 47.1%
0.1% 3 35.1% 0.0% 4 27.5% 0.0% 4 23.3% 0.1% 3 35.1% 0.1% 4 27.5% 0.1% 4 23.3%
0.0% 0 - 0.0% 0 - 0.0% 0 - 0.0% 0 - 0.0% 0 - 0.0% 0 -
- 0 - - 0 - - 0 - - 0 - - 0 - - 0 -
0.1% 14 30.6% 0.1% 24 28.5% 0.1% 33 27.5% 0.1% 17 33.1% 0.1% 33 29.8% 0.1% 45 28.9%
31/12/2016 31/12/2017
Baseline Scenario Adverse Scenario
31/12/2018 31/12/2016 31/12/2017 31/12/2018
31/12/2016 31/12/2017 31/12/2018 31/12/2016 31/12/2017 31/12/2018
Baseline Scenario Adverse Scenario
31/12/2016 31/12/2017 31/12/2018
Baseline Scenario Adverse Scenario
31/12/2016 31/12/2017 31/12/2018
31/12/2017 31/12/2018 31/12/2016 31/12/2017 31/12/201831/12/2016
Baseline Scenario Adverse Scenario

2016 EU-wide Stress Test:
Credit risk IRBSociété Générale S.A.
(mln EUR, %)
Central banks and central governments
Institutions
Corporates
Corporates - Of Which: Specialised Lending
Corporates - Of Which: SME
Retail
Retail - Secured on real estate property
Retail - Secured on real estate property - Of Which: SME
Retail - Secured on real estate property - Of Which: non-SME
Retail - Qualifying Revolving
Retail - Other Retail
Retail - Other Retail - Of Which: SME
Retail - Other Retail - Of Which: non-SME
Equity
Securitisation
Other non-credit obligation assets
IRB TOTAL1 Computed as: Stock of provisions for defaulted stock / default stock (as defined in paragraphs 59 and 61 of the Methodological note)
Switzerland
Italy
Czech Republic
Germany
Impairment
rate
Stock of
Provisions
Coverage Ratio -
Default Stock1
Impairment
rate
Stock of
Provisions
Coverage Ratio -
Default Stock1
Impairment
rate
Stock of
Provisions
Coverage Ratio -
Default Stock1
Impairment
rate
Stock of
Provisions
Coverage Ratio -
Default Stock1
Impairment
rate
Stock of
Provisions
Coverage Ratio -
Default Stock1
Impairment
rate
Stock of
Provisions
Coverage Ratio -
Default Stock1
0.0% 0 40.0% 0.0% 1 40.0% 0.0% 1 40.0% 0.0% 0 40.0% 0.0% 1 40.0% 0.0% 1 40.0%
0.0% 0 31.4% 0.0% 0 31.3% 0.0% 0 31.2% 0.0% 0 32.6% 0.0% 0 32.5% 0.0% 0 32.5%
0.1% 38 26.1% 0.1% 47 24.5% 0.1% 56 23.5% 0.1% 43 24.7% 0.2% 63 22.6% 0.2% 79 21.6%
0.2% 1 5.4% 0.2% 2 8.2% 0.2% 3 10.4% 0.2% 1 6.0% 0.3% 3 10.4% 0.2% 4 12.4%
0.1% 24 31.5% 0.2% 26 28.5% 0.2% 28 26.4% 0.3% 26 28.9% 0.5% 32 24.3% 0.4% 38 22.1%
0.4% 22 27.9% 0.4% 35 31.3% 0.4% 48 33.3% 0.8% 34 31.8% 0.9% 61 35.6% 0.6% 80 36.9%
0.1% 0 63.4% 0.1% 0 55.8% 0.1% 0 50.2% 0.1% 0 63.2% 0.1% 0 56.9% 0.1% 0 53.9%
- 0 - - 0 - - 0 - - 0 - - 0 - - 0 -
0.1% 0 63.4% 0.1% 0 55.8% 0.1% 0 50.2% 0.1% 0 63.2% 0.1% 0 56.9% 0.1% 0 53.9%
3.3% 0 34.9% 2.5% 0 31.7% 2.1% 0 30.5% 3.6% 0 36.8% 2.9% 0 33.7% 2.4% 0 32.6%
0.4% 22 27.6% 0.4% 34 31.1% 0.4% 48 33.2% 0.8% 33 31.6% 0.9% 61 35.5% 0.6% 79 36.8%
0.4% 21 27.3% 0.4% 34 31.0% 0.4% 47 33.1% 0.8% 33 31.4% 0.9% 60 35.5% 0.6% 78 36.8%
0.1% 0 53.7% 0.1% 0 49.1% 0.1% 0 45.5% 0.2% 0 53.6% 0.2% 0 48.8% 0.2% 0 45.0%
0.0% 0 - 0.0% 0 - 0.0% 0 - 0.0% 0 - 0.0% 0 - 0.0% 0 -
0.0% 0 17.9% 0.0% 0 17.7% 0.0% 0 17.7% 0.0% 0 17.5% 0.1% 0 18.4% 0.0% 0 18.6%
0.1% 61 26.8% 0.1% 82 27.1% 0.1% 105 27.3% 0.2% 77 27.4% 0.3% 125 27.6% 0.2% 160 27.3%
Impairment
rate
Stock of
Provisions
Coverage Ratio -
Default Stock1
Impairment
rate
Stock of
Provisions
Coverage Ratio -
Default Stock1
Impairment
rate
Stock of
Provisions
Coverage Ratio -
Default Stock1
Impairment
rate
Stock of
Provisions
Coverage Ratio -
Default Stock1
Impairment
rate
Stock of
Provisions
Coverage Ratio -
Default Stock1
Impairment
rate
Stock of
Provisions
Coverage Ratio -
Default Stock1
0.0% 2 40.0% 0.0% 3 40.0% 0.0% 5 40.0% 0.0% 3 40.0% 0.0% 5 40.0% 0.0% 8 40.0%
0.0% 0 19.1% 0.0% 0 19.9% 0.0% 0 20.4% 0.0% 0 19.7% 0.0% 0 20.6% 0.0% 0 21.0%
0.3% 186 54.2% 0.3% 205 47.6% 0.2% 223 43.5% 0.4% 195 50.8% 0.6% 236 41.3% 0.5% 270 37.2%
0.2% 8 25.8% 0.3% 12 24.7% 0.3% 16 24.1% 0.4% 10 25.2% 0.6% 19 23.9% 0.5% 26 23.5%
0.3% 122 56.4% 0.3% 131 50.8% 0.3% 139 47.0% 0.4% 126 53.5% 0.6% 144 44.8% 0.5% 159 40.6%
0.3% 272 55.7% 0.3% 295 48.3% 0.3% 317 43.4% 0.5% 290 54.4% 0.5% 339 48.1% 0.4% 382 46.1%
0.1% 134 43.0% 0.1% 140 35.1% 0.1% 146 30.0% 0.2% 144 41.6% 0.2% 166 35.4% 0.1% 189 33.8%
- 0 - - 0 - - 0 - - 0 - - 0 - - 0 -
0.1% 134 43.0% 0.1% 140 35.1% 0.1% 146 30.0% 0.2% 144 41.6% 0.2% 166 35.4% 0.1% 189 33.8%
1.1% 18 81.8% 1.0% 21 77.0% 1.0% 23 73.8% 1.4% 19 83.0% 1.4% 22 79.2% 1.2% 26 76.9%
1.4% 120 77.6% 1.4% 134 72.8% 1.4% 147 69.4% 2.1% 128 77.2% 2.3% 150 72.6% 1.8% 168 70.4%
1.6% 64 83.4% 1.6% 72 78.8% 1.6% 80 75.6% 2.2% 67 84.2% 2.6% 81 79.8% 2.3% 92 77.3%
1.2% 56 71.8% 1.2% 62 66.8% 1.2% 68 63.3% 2.0% 61 70.6% 2.0% 70 65.8% 1.3% 76 63.6%
0.0% 0 - 0.0% 0 - 0.0% 0 - 0.0% 0 - 0.0% 0 - 0.0% 0 -
- 0 - - 0 - - 0 - - 0 - - 0 - - 0 -
0.2% 459 55.0% 0.2% 503 47.9% 0.2% 545 43.4% 0.3% 487 52.8% 0.3% 580 45.0% 0.3% 660 41.9%
Impairment
rate
Stock of
Provisions
Coverage Ratio -
Default Stock1
Impairment
rate
Stock of
Provisions
Coverage Ratio -
Default Stock1
Impairment
rate
Stock of
Provisions
Coverage Ratio -
Default Stock1
Impairment
rate
Stock of
Provisions
Coverage Ratio -
Default Stock1
Impairment
rate
Stock of
Provisions
Coverage Ratio -
Default Stock1
Impairment
rate
Stock of
Provisions
Coverage Ratio -
Default Stock1
0.1% 2 40.0% 0.1% 4 40.0% 0.1% 7 40.0% 0.3% 7 40.0% 0.3% 15 40.0% 0.3% 22 40.0%
0.0% 0 9.1% 0.0% 0 10.6% 0.0% 0 12.2% 0.0% 0 9.5% 0.0% 0 11.7% 0.0% 0 13.5%
0.2% 90 22.6% 0.2% 99 21.7% 0.2% 109 21.1% 0.4% 95 22.0% 0.4% 110 21.2% 0.3% 121 20.8%
0.1% 23 24.0% 0.1% 24 23.7% 0.1% 25 23.3% 0.1% 23 24.0% 0.2% 25 23.4% 0.1% 25 23.1%
0.6% 50 22.1% 0.6% 56 20.7% 0.6% 61 19.8% 0.9% 53 21.1% 0.7% 60 19.7% 0.6% 66 19.0%
2.1% 446 64.9% 1.9% 503 62.9% 1.8% 556 61.4% 2.6% 463 64.3% 2.6% 542 62.2% 2.8% 621 61.0%
0.1% 0 39.2% 0.1% 0 30.3% 0.1% 0 25.4% 0.1% 0 40.2% 0.1% 0 32.4% 0.1% 0 28.8%
- 0 - - 0 - - 0 - - 0 - - 0 - - 0 -
0.1% 0 39.2% 0.1% 0 30.3% 0.1% 0 25.4% 0.1% 0 40.2% 0.1% 0 32.4% 0.1% 0 28.8%
3.4% 0 35.9% 2.6% 0 32.8% 2.1% 0 31.5% 3.7% 0 37.4% 3.0% 0 34.4% 2.5% 0 33.2%
2.1% 446 64.9% 1.9% 502 62.9% 1.8% 555 61.5% 2.6% 463 64.3% 2.7% 542 62.2% 2.8% 621 61.0%
1.8% 63 29.7% 1.8% 79 31.4% 1.8% 94 32.5% 3.0% 74 31.3% 2.4% 95 33.1% 1.9% 110 34.1%
2.2% 383 80.7% 1.9% 423 77.4% 1.9% 461 75.0% 2.5% 389 80.5% 2.7% 447 76.5% 3.2% 511 73.5%
0.0% 0 - 0.0% 0 - 0.0% 0 - 0.0% 0 - 0.0% 0 - 0.0% 0 -
- 0 - - 0 - - 0 - - 0 - - 0 - - 0 -
0.8% 539 49.3% 0.7% 607 47.8% 0.7% 672 46.6% 1.0% 566 48.3% 1.0% 667 46.7% 1.0% 764 46.1%
Impairment
rate
Stock of
Provisions
Coverage Ratio -
Default Stock1
Impairment
rate
Stock of
Provisions
Coverage Ratio -
Default Stock1
Impairment
rate
Stock of
Provisions
Coverage Ratio -
Default Stock1
Impairment
rate
Stock of
Provisions
Coverage Ratio -
Default Stock1
Impairment
rate
Stock of
Provisions
Coverage Ratio -
Default Stock1
Impairment
rate
Stock of
Provisions
Coverage Ratio -
Default Stock1
0.0% 0 13.6% 0.0% 0 13.6% 0.0% 0 13.6% 0.0% 0 13.6% 0.0% 0 13.6% 0.0% 0 13.6%
0.0% 0 32.1% 0.0% 0 32.1% 0.0% 0 32.1% 0.0% 0 33.4% 0.0% 0 33.4% 0.0% 0 33.5%
0.1% 4 21.6% 0.1% 7 26.5% 0.1% 11 28.9% 0.2% 5 23.7% 0.2% 11 29.9% 0.2% 16 31.8%
0.1% 2 22.0% 0.2% 4 26.8% 0.2% 6 29.2% 0.2% 2 24.5% 0.3% 7 30.9% 0.2% 10 32.6%
0.5% 0 10.6% 0.5% 1 19.0% 0.5% 1 25.9% 0.5% 0 10.6% 0.5% 1 19.0% 0.5% 1 26.0%
0.1% 4 17.1% 0.1% 4 16.9% 0.1% 5 16.8% 0.1% 4 17.4% 0.1% 5 17.5% 0.1% 6 17.6%
0.0% 0 1.3% 0.0% 0 2.0% 0.0% 0 2.6% 0.0% 0 1.4% 0.0% 0 2.4% 0.0% 1 3.3%
- 0 - - 0 - - 0 - - 0 - - 0 - - 0 -
0.0% 0 1.3% 0.0% 0 2.0% 0.0% 0 2.6% 0.0% 0 1.4% 0.0% 0 2.4% 0.0% 1 3.3%
3.2% 2 75.3% 2.4% 3 70.1% 2.0% 3 66.9% 3.5% 3 75.7% 2.8% 3 70.4% 2.3% 3 67.2%
0.2% 1 28.2% 0.2% 2 25.4% 0.2% 2 24.2% 0.2% 1 28.7% 0.2% 2 26.2% 0.2% 2 25.0%
2.2% 0 50.5% 2.2% 1 47.2% 2.4% 1 45.9% 2.3% 0 50.4% 2.5% 1 47.0% 2.6% 1 45.8%
0.1% 1 21.4% 0.1% 1 18.2% 0.1% 1 16.8% 0.1% 1 22.2% 0.1% 1 19.3% 0.1% 1 17.7%
0.0% 0 - 0.0% 0 - 0.0% 0 - 0.0% 0 - 0.0% 0 - 0.0% 0 -
- 0 - - 0 - - 0 - - 0 - - 0 - - 0 -
0.0% 8 19.2% 0.0% 12 21.8% 0.0% 16 23.5% 0.0% 9 20.4% 0.0% 16 24.7% 0.0% 21 26.3%
31/12/2016 31/12/2017
Baseline Scenario Adverse Scenario
31/12/2018 31/12/2016 31/12/2017 31/12/2018
31/12/2016 31/12/2017 31/12/2018 31/12/2016 31/12/2017 31/12/2018
Baseline Scenario Adverse Scenario
31/12/2016 31/12/2017
Baseline Scenario Adverse Scenario
31/12/2018 31/12/2016 31/12/2017 31/12/2018
31/12/2016 31/12/2017 31/12/2018 31/12/2016 31/12/2017 31/12/2018
Baseline Scenario Adverse Scenario
2016 EU-wide Stress Test:
Credit risk IRBSociété Générale S.A.
(mln EUR, %)
Central banks and central governments
Institutions
Corporates
Corporates - Of Which: Specialised Lending
Corporates - Of Which: SME
Retail
Retail - Secured on real estate property
Retail - Secured on real estate property - Of Which: SME
Retail - Secured on real estate property - Of Which: non-SME
Retail - Qualifying Revolving
Retail - Other Retail
Retail - Other Retail - Of Which: SME
Retail - Other Retail - Of Which: non-SME
Equity
Securitisation
Other non-credit obligation assets
IRB TOTAL1 Computed as: Stock of provisions for defaulted stock / default stock (as defined in paragraphs 59 and 61 of the Methodological note)
(mln EUR, %)
Central banks and central governments
Institutions
Corporates
Corporates - Of Which: Specialised Lending
Corporates - Of Which: SME
Retail
Retail - Secured on real estate property
Retail - Secured on real estate property - Of Which: SME
Retail - Secured on real estate property - Of Which: non-SME
Retail - Qualifying Revolving
Retail - Other Retail
Retail - Other Retail - Of Which: SME
Retail - Other Retail - Of Which: non-SME
Equity
Securitisation
Other non-credit obligation assets
IRB TOTAL1 Computed as: Stock of provisions for defaulted stock / default stock (as defined in paragraphs 59 and 61 of the Methodological note)
(mln EUR, %)
Central banks and central governments
Institutions
Corporates
Corporates - Of Which: Specialised Lending
Corporates - Of Which: SME
Retail
Retail - Secured on real estate property
Retail - Secured on real estate property - Of Which: SME
Retail - Secured on real estate property - Of Which: non-SME
Retail - Qualifying Revolving
Retail - Other Retail
Retail - Other Retail - Of Which: SME
Retail - Other Retail - Of Which: non-SME
Equity
Securitisation
Other non-credit obligation assets
IRB TOTAL1 Computed as: Stock of provisions for defaulted stock / default stock (as defined in paragraphs 59 and 61 of the Methodological note)
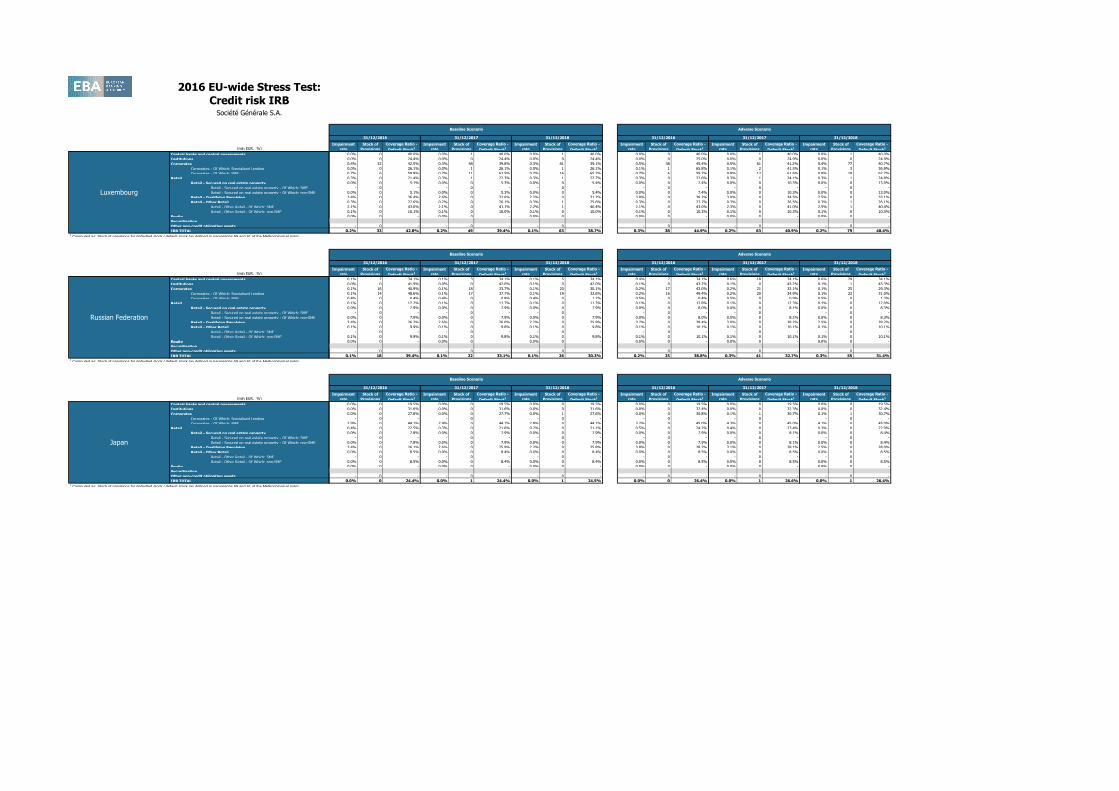
Japan
Russian Federation
Luxembourg
Impairment
rate
Stock of
Provisions
Coverage Ratio -
Default Stock1
Impairment
rate
Stock of
Provisions
Coverage Ratio -
Default Stock1
Impairment
rate
Stock of
Provisions
Coverage Ratio -
Default Stock1
Impairment
rate
Stock of
Provisions
Coverage Ratio -
Default Stock1
Impairment
rate
Stock of
Provisions
Coverage Ratio -
Default Stock1
Impairment
rate
Stock of
Provisions
Coverage Ratio -
Default Stock1
0.0% 0 40.0% 0.0% 1 40.0% 0.0% 1 40.0% 0.0% 0 40.0% 0.0% 1 40.0% 0.0% 1 40.0%
0.0% 0 24.4% 0.0% 0 24.4% 0.0% 0 24.4% 0.0% 0 25.0% 0.0% 0 24.9% 0.0% 0 24.9%
0.4% 32 42.5% 0.3% 48 39.8% 0.3% 61 39.1% 0.5% 38 45.4% 0.5% 61 41.2% 0.4% 77 40.7%
0.0% 0 26.1% 0.0% 1 26.1% 0.0% 1 26.1% 0.1% 1 65.8% 0.1% 2 41.5% 0.1% 3 36.9%
0.7% 6 59.8% 0.7% 11 63.5% 0.7% 16 65.2% 0.7% 6 59.7% 0.8% 12 61.6% 0.8% 18 62.7%
0.3% 0 21.4% 0.3% 1 22.3% 0.3% 1 22.7% 0.3% 0 22.6% 0.3% 1 24.1% 0.3% 1 24.8%
0.0% 0 5.1% 0.0% 0 5.3% 0.0% 0 5.4% 0.0% 0 7.4% 0.0% 0 10.3% 0.0% 0 13.0%
- 0 - - 0 - - 0 - - 0 - - 0 - - 0 -
0.0% 0 5.1% 0.0% 0 5.3% 0.0% 0 5.4% 0.0% 0 7.4% 0.0% 0 10.3% 0.0% 0 13.0%
3.4% 0 36.4% 2.6% 0 32.6% 2.2% 0 31.2% 3.8% 0 38.2% 3.0% 0 34.5% 2.5% 0 33.1%
0.3% 0 27.6% 0.2% 0 26.1% 0.3% 1 25.6% 0.3% 0 27.7% 0.3% 0 26.5% 0.3% 1 26.1%
2.1% 0 43.0% 2.1% 0 41.1% 2.2% 1 40.4% 2.1% 0 43.0% 2.3% 0 41.0% 2.5% 1 40.4%
0.1% 0 10.1% 0.1% 0 10.0% 0.1% 0 10.0% 0.1% 0 10.3% 0.1% 0 10.3% 0.1% 0 10.3%
0.0% 0 - 0.0% 0 - 0.0% 0 - 0.0% 0 - 0.0% 0 - 0.0% 0 -
- 0 - - 0 - - 0 - - 0 - - 0 - - 0 -
0.2% 33 42.0% 0.2% 49 39.4% 0.1% 63 38.7% 0.3% 38 44.9% 0.2% 63 40.9% 0.2% 79 40.4%
Impairment
rate
Stock of
Provisions
Coverage Ratio -
Default Stock1
Impairment
rate
Stock of
Provisions
Coverage Ratio -
Default Stock1
Impairment
rate
Stock of
Provisions
Coverage Ratio -
Default Stock1
Impairment
rate
Stock of
Provisions
Coverage Ratio -
Default Stock1
Impairment
rate
Stock of
Provisions
Coverage Ratio -
Default Stock1
Impairment
rate
Stock of
Provisions
Coverage Ratio -
Default Stock1
0.1% 2 34.1% 0.1% 3 34.1% 0.1% 5 34.1% 0.4% 7 34.1% 0.6% 18 34.1% 0.6% 29 34.1%
0.0% 0 41.9% 0.0% 0 42.0% 0.1% 0 42.0% 0.1% 0 43.2% 0.1% 0 43.2% 0.1% 1 43.3%
0.1% 16 40.9% 0.1% 18 33.7% 0.1% 20 30.1% 0.2% 17 42.0% 0.2% 21 32.1% 0.1% 25 29.3%
0.1% 14 48.6% 0.1% 17 37.7% 0.1% 19 32.6% 0.2% 16 49.4% 0.2% 20 34.9% 0.1% 22 31.0%
0.4% 0 0.4% 0.4% 0 0.8% 0.4% 0 1.2% 0.5% 0 0.4% 0.5% 0 0.9% 0.5% 0 1.3%
0.1% 0 12.2% 0.1% 0 11.7% 0.1% 0 11.3% 0.1% 0 12.8% 0.1% 0 12.3% 0.1% 0 12.0%
0.0% 0 7.9% 0.0% 0 7.9% 0.0% 0 7.9% 0.0% 0 8.0% 0.0% 0 8.1% 0.0% 0 8.3%
- 0 - - 0 - - 0 - - 0 - - 0 - - 0 -
0.0% 0 7.9% 0.0% 0 7.9% 0.0% 0 7.9% 0.0% 0 8.0% 0.0% 0 8.1% 0.0% 0 8.3%
3.4% 0 26.2% 2.6% 0 26.0% 2.2% 0 25.9% 3.7% 0 28.4% 3.0% 0 28.2% 2.5% 0 28.2%
0.1% 0 9.9% 0.1% 0 9.8% 0.1% 0 9.8% 0.1% 0 10.1% 0.1% 0 10.1% 0.1% 0 10.1%
- 0 - - 0 - - 0 - - 0 - - 0 - - 0 -
0.1% 0 9.9% 0.1% 0 9.8% 0.1% 0 9.8% 0.1% 0 10.1% 0.1% 0 10.1% 0.1% 0 10.1%
0.0% 0 - 0.0% 0 - 0.0% 0 - 0.0% 0 - 0.0% 0 - 0.0% 0 -
- 0 - - 0 - - 0 - - 0 - - 0 - - 0 -
0.1% 18 39.4% 0.1% 22 33.1% 0.1% 26 30.3% 0.2% 25 38.8% 0.3% 41 32.7% 0.3% 55 31.4%
Impairment
rate
Stock of
Provisions
Coverage Ratio -
Default Stock1
Impairment
rate
Stock of
Provisions
Coverage Ratio -
Default Stock1
Impairment
rate
Stock of
Provisions
Coverage Ratio -
Default Stock1
Impairment
rate
Stock of
Provisions
Coverage Ratio -
Default Stock1
Impairment
rate
Stock of
Provisions
Coverage Ratio -
Default Stock1
Impairment
rate
Stock of
Provisions
Coverage Ratio -
Default Stock1
0.0% 0 19.5% 0.0% 0 19.5% 0.0% 0 19.5% 0.0% 0 19.5% 0.0% 0 19.5% 0.0% 0 19.5%
0.0% 0 31.6% 0.0% 0 31.6% 0.0% 0 31.6% 0.0% 0 32.4% 0.0% 0 32.3% 0.0% 0 32.4%
0.0% 0 27.8% 0.0% 0 27.7% 0.0% 1 27.6% 0.0% 0 30.8% 0.1% 1 30.7% 0.1% 1 30.7%
- 0 - - 0 - - 0 - - 0 - - 0 - - 0 -
2.9% 0 44.1% 2.9% 0 44.1% 2.8% 0 44.1% 3.2% 0 45.0% 4.3% 0 45.0% 4.1% 0 45.0%
0.4% 0 22.5% 0.3% 0 21.6% 0.2% 0 21.1% 0.5% 0 24.2% 0.4% 0 23.4% 0.3% 0 22.9%
0.0% 0 7.8% 0.0% 0 7.9% 0.0% 0 7.9% 0.0% 0 7.9% 0.0% 0 8.1% 0.0% 0 8.4%
- 0 - - 0 - - 0 - - 0 - - 0 - - 0 -
0.0% 0 7.8% 0.0% 0 7.9% 0.0% 0 7.9% 0.0% 0 7.9% 0.0% 0 8.1% 0.0% 0 8.4%
3.4% 0 26.1% 2.6% 0 25.9% 2.2% 0 25.8% 3.8% 0 28.2% 3.1% 0 28.1% 2.5% 0 28.0%
0.0% 0 8.5% 0.0% 0 8.4% 0.0% 0 8.4% 0.0% 0 8.5% 0.0% 0 8.5% 0.0% 0 8.5%
- 0 - - 0 - - 0 - - 0 - - 0 - - 0 -
0.0% 0 8.5% 0.0% 0 8.4% 0.0% 0 8.4% 0.0% 0 8.5% 0.0% 0 8.5% 0.0% 0 8.5%
0.0% 0 - 0.0% 0 - 0.0% 0 - 0.0% 0 - 0.0% 0 - 0.0% 0 -
- 0 - - 0 - - 0 - - 0 - - 0 - - 0 -
0.0% 0 24.4% 0.0% 1 24.4% 0.0% 1 24.5% 0.0% 0 26.4% 0.0% 1 26.6% 0.0% 1 26.4%
31/12/2016 31/12/2017 31/12/2018 31/12/2016 31/12/2017 31/12/2018
Baseline Scenario Adverse Scenario
31/12/2016 31/12/2017
Baseline Scenario Adverse Scenario
31/12/2018 31/12/2016 31/12/2017 31/12/2018
31/12/2016 31/12/2017 31/12/2018 31/12/2016 31/12/2017 31/12/2018
Baseline Scenario Adverse Scenario

2016 EU-wide Stress Test:
Credit risk STASociété Générale S.A.
Non-defaulted Defaulted Non-defaulted Defaulted Non-defaulted Defaulted
Central governments or central banks 11,462 150 10,258 139 0 5 3.4%
Regional governments or local authorities 1,356 9 866 7 0 4 42.4%
Public sector entities 535 1 131 1 0 1 62.7%
Multilateral Development Banks 26 0 24 0 0 0 0.0%
International Organisations 0 0 0 0 0 0 0.0%
Institutions 48,234 58 4,651 42 0 15 26.2%
Corporates 60,746 5,123 48,326 2,403 0 3,496 68.2%
of which: SME 14,711 3,090 12,710 1,265 0 2,015 65.2%
Retail 27,568 3,672 19,063 1,595 0 2,453 66.8%
of which: SME 8,090 1,245 4,627 682 0 759 60.9%
Secured by mortgages on immovable property 12,383 782 4,934 448 0 313 40.0%
334 95 128 76 0 5 5.2%
Items associated with particularly high risk 0 0 0 0 0 0 0.0%
Covered bonds 0 0 0 0 0 0 0.0%
Claims on institutions and corporates with a ST credit assessment 0 0 0 0 0 0 0.0%
Collective investments undertakings (CIU) 805 6 771 9 0 0 0.1%
Equity 2,326 0 2,972 0 357 0 0.0%
Securitisation
Other exposures 20,152 0 15,914 0 0 0 0.0%
Standardised Total 185,592 9,802 107,910 4,643 357 6,287 64.1%1 Computed as: Stock of provisions for defaulted stock / default stock (as defined in paragraphs 59 and 61 of the Methodological note)
Non-defaulted Defaulted Non-defaulted Defaulted Non-defaulted Defaulted
Central governments or central banks 4,130 34 5,714 34 0 0 0.2%
Regional governments or local authorities 853 2 627 2 0 0 2.9%
Public sector entities 174 0 35 0 0 0 53.2%
Multilateral Development Banks 0 0 0 0 0 0 0.0%
International Organisations 0 0 0 0 0 0 0.0%
Institutions 5,894 0 1,220 0 0 0 24.5%
Corporates 19,416 1,002 12,138 724 0 640 63.9%
of which: SME 5,050 668 4,121 440 0 335 50.1%
Retail 6,204 1,027 4,135 676 0 586 57.0%
of which: SME 2,945 568 1,670 406 0 294 51.7%
Secured by mortgages on immovable property 2,242 104 970 84 0 25 23.9%
of which: SME 165 6 77 9 0 0 0.6%
Items associated with particularly high risk 0 0 0 0 0 0 0.0%
Covered bonds 0 0 0 0 0 0 0.0%
Claims on institutions and corporates with a ST credit assessment 0 0 0 0 0 0 0.0%
Collective investments undertakings (CIU) 65 0 65 0 0 0 100.0%
Equity 1,391 0 1,935 0 88 0 0.0%
Securitisation
Other exposures 10,386 0 9,046 0 0 0 0.0%
Standardised Total 50,755 2,169 35,885 1,519 88 1,251 57.6%1 Computed as: Stock of provisions for defaulted stock / default stock (as defined in paragraphs 59 and 61 of the Methodological note)
Non-defaulted Defaulted Non-defaulted Defaulted Non-defaulted Defaulted
Central governments or central banks 884 0 1,726 0 0 0 0.0%
Regional governments or local authorities 18 0 9 0 0 0 0.0%
Public sector entities 0 0 0 0 0 0 0.0%
Multilateral Development Banks 0 0 0 0 0 0 0.0%
International Organisations 0 0 0 0 0 0 0.0%
Institutions 10,019 0 814 0 0 0 0.0%
Corporates 3,536 83 3,087 48 0 20 24.5%
of which: SME 176 1 150 1 0 0 5.8%
Retail 54 1 2 0 0 0 62.1%
of which: SME 0 0 0 0 0 0 64.0%
Secured by mortgages on immovable property 14 1 5 0 0 1 66.1%
of which: SME 0 0 0 0 0 0 0.0%
Items associated with particularly high risk 0 0 0 0 0 0 0.0%
Covered bonds 0 0 0 0 0 0 0.0%
Claims on institutions and corporates with a ST credit assessment 0 0 0 0 0 0 0.0%
Collective investments undertakings (CIU) 442 0 442 0 0 0 0.0%
Equity 76 0 36 0 49 0 0.0%
Securitisation
Other exposures 165 0 165 0 0 0 0.0%
Standardised Total 15,208 85 6,286 48 49 22 25.4%1 Computed as: Stock of provisions for defaulted stock / default stock (as defined in paragraphs 59 and 61 of the Methodological note)
United States
Exposure values Risk exposure amounts Stock of provisionsCoverage Ratio -
Default Stock1
France
31/12/2015
31/12/2015
Exposure values Risk exposure amounts Stock of provisionsCoverage Ratio -
Default Stock1
Société Générale S.A.
31/12/2015
Exposure values Risk exposure amounts Stock of provisions
Coverage Ratio -
Default Stock1

2016 EU-wide Stress Test:
Credit risk STASociété Générale S.A.
Non-defaulted Defaulted Non-defaulted Defaulted Non-defaulted Defaulted
Central governments or central banks 1,875 0 19 0 0 0 0.0%
Regional governments or local authorities 13 0 9 0 0 0 0.0%
Public sector entities 127 0 25 0 0 0 100.0%
Multilateral Development Banks 0 0 0 0 0 0 0.0%
International Organisations 0 0 0 0 0 0 0.0%
Institutions 15,002 0 1,096 0 0 0 0.0%
Corporates 4,772 47 4,527 35 0 25 54.2%
of which: SME 281 4 236 2 0 3 78.2%
Retail 1,062 15 619 5 0 11 72.2%
of which: SME 1,054 10 612 4 0 7 71.0%
Secured by mortgages on immovable property 84 0 79 0 0 0 71.9%
of which: SME 0 0 0 0 0 0 0.0%
Items associated with particularly high risk 0 0 0 0 0 0 0.0%
Covered bonds 0 0 0 0 0 0 0.0%
Claims on institutions and corporates with a ST credit assessment 0 0 0 0 0 0 0.0%
Collective investments undertakings (CIU) 83 0 49 0 0 0 0.0%
Equity 253 0 253 0 0 0 0.0%
Securitisation
Other exposures 1,351 0 972 0 0 0 0.0%
Standardised Total 24,622 62 7,648 40 0 36 58.5%1 Computed as: Stock of provisions for defaulted stock / default stock (as defined in paragraphs 59 and 61 of the Methodological note)
Non-defaulted Defaulted Non-defaulted Defaulted Non-defaulted Defaulted
Central governments or central banks 393 0 81 0 0 0 0.0%
Regional governments or local authorities 0 0 0 0 0 0 0.0%
Public sector entities 0 0 0 0 0 0 0.0%
Multilateral Development Banks 0 0 0 0 0 0 0.0%
International Organisations 0 0 0 0 0 0 0.0%
Institutions 6,173 5 210 1 0 0 0.0%
Corporates 2,473 53 1,332 39 0 34 65.1%
of which: SME 124 1 120 1 0 0 12.1%
Retail 5,457 222 3,925 213 0 70 31.4%
of which: SME 1,002 22 583 17 0 7 31.7%
Secured by mortgages on immovable property 8 4 5 2 0 2 42.8%
of which: SME 0 0 0 0 0 0 0.0%
Items associated with particularly high risk 0 0 0 0 0 0 0.0%
Covered bonds 0 0 0 0 0 0 0.0%
Claims on institutions and corporates with a ST credit assessment 0 0 0 0 0 0 0.0%
Collective investments undertakings (CIU) 6 0 6 0 0 0 0.0%
Equity 10 0 11 0 3 0 0.0%
Securitisation
Other exposures 1,492 0 851 0 0 0 0.0%
Standardised Total 16,013 283 6,423 255 3 106 37.3%1 Computed as: Stock of provisions for defaulted stock / default stock (as defined in paragraphs 59 and 61 of the Methodological note)
Non-defaulted Defaulted Non-defaulted Defaulted Non-defaulted Defaulted
Central governments or central banks 28 0 7 0 0 0 0.0%
Regional governments or local authorities 0 0 0 0 0 0 2.4%
Public sector entities 2 0 0 0 0 0 0.0%
Multilateral Development Banks 0 0 0 0 0 0 0.0%
International Organisations 0 0 0 0 0 0 0.0%
Institutions 8 0 4 0 0 0 0.0%
Corporates 826 39 790 20 0 27 67.5%
of which: SME 326 17 304 8 0 10 61.4%
Retail 1,032 144 693 23 0 113 78.7%
of which: SME 453 28 259 5 0 21 75.4%
Secured by mortgages on immovable property 794 32 230 19 0 14 43.2%
of which: SME 0 0 0 0 0 0 0.0%
Items associated with particularly high risk 0 0 0 0 0 0 0.0%
Covered bonds 0 0 0 0 0 0 0.0%
Claims on institutions and corporates with a ST credit assessment 0 0 0 0 0 0 0.0%
Collective investments undertakings (CIU) 0 0 0 0 0 0 0.0%
Equity 0 0 0 0 0 0 0.0%
Securitisation
Other exposures 503 0 453 0 0 0 0.0%
Standardised Total 3,193 216 2,177 63 0 154 71.3%1 Computed as: Stock of provisions for defaulted stock / default stock (as defined in paragraphs 59 and 61 of the Methodological note)
Czech Republic
Exposure values Risk exposure amounts Stock of provisionsCoverage Ratio -
Default Stock1
Germany
31/12/2015
Exposure values Risk exposure amounts Stock of provisionsCoverage Ratio -
Default Stock1
United Kingdom
31/12/2015
Exposure values Risk exposure amounts Stock of provisionsCoverage Ratio -
Default Stock1
31/12/2015

2016 EU-wide Stress Test:
Credit risk STASociété Générale S.A.
Non-defaulted Defaulted Non-defaulted Defaulted Non-defaulted Defaulted
Central governments or central banks 572 0 545 0 0 0 19.7%
Regional governments or local authorities 24 3 5 4 0 0 0.4%
Public sector entities 7 0 1 0 0 0 37.2%
Multilateral Development Banks 0 0 0 0 0 0 0.0%
International Organisations 0 0 0 0 0 0 0.0%
Institutions 524 0 40 0 0 0 0.0%
Corporates 2,855 61 1,746 24 0 51 83.2%
of which: SME 563 53 538 19 0 44 83.0%
Retail 970 251 687 91 0 167 66.5%
of which: SME 224 25 128 7 0 25 99.6%
Secured by mortgages on immovable property 13 2 5 1 0 1 51.4%
of which: SME 0 0 0 0 0 0 0.0%
Items associated with particularly high risk 0 0 0 0 0 0 0.0%
Covered bonds 0 0 0 0 0 0 0.0%
Claims on institutions and corporates with a ST credit assessment 0 0 0 0 0 0 0.0%
Collective investments undertakings (CIU) 20 0 20 0 0 0 0.0%
Equity 35 0 29 0 9 0 0.0%
Securitisation
Other exposures 1,119 0 626 0 0 0 0.0%
Standardised Total 6,138 317 3,703 120 9 219 69.1%1 Computed as: Stock of provisions for defaulted stock / default stock (as defined in paragraphs 59 and 61 of the Methodological note)
Non-defaulted Defaulted Non-defaulted Defaulted Non-defaulted Defaulted
Central governments or central banks 55 0 51 0 0 0 0.0%
Regional governments or local authorities 0 0 0 0 0 0 0.0%
Public sector entities 9 0 2 0 0 0 0.0%
Multilateral Development Banks 0 0 0 0 0 0 0.0%
International Organisations 0 0 0 0 0 0 0.0%
Institutions 76 0 19 0 0 0 0.0%
Corporates 172 2 107 1 0 1 45.8%
of which: SME 45 1 40 0 0 1 50.2%
Retail 168 11 101 12 0 4 37.0%
of which: SME 150 9 86 10 0 2 18.8%
Secured by mortgages on immovable property 31 1 21 0 0 0 57.6%
of which: SME 3 0 3 0 0 0 0.0%
Items associated with particularly high risk 0 0 0 0 0 0 0.0%
Covered bonds 0 0 0 0 0 0 0.0%
Claims on institutions and corporates with a ST credit assessment 0 0 0 0 0 0 0.0%
Collective investments undertakings (CIU) 0 0 0 0 0 0 0.0%
Equity 11 0 12 0 2 0 0.0%
Securitisation
Other exposures 53 0 53 0 0 0 0.0%
Standardised Total 573 14 366 13 2 5 38.6%1 Computed as: Stock of provisions for defaulted stock / default stock (as defined in paragraphs 59 and 61 of the Methodological note)
Non-defaulted Defaulted Non-defaulted Defaulted Non-defaulted Defaulted
Central governments or central banks 99 0 107 0 0 0 0.0%
Regional governments or local authorities 0 0 0 0 0 0 0.0%
Public sector entities 0 0 0 0 0 0 0.0%
Multilateral Development Banks 0 0 0 0 0 0 0.0%
International Organisations 0 0 0 0 0 0 0.0%
Institutions 40 0 23 0 0 0 0.0%
Corporates 454 67 321 40 0 27 40.6%
of which: SME 214 67 97 40 0 27 40.8%
Retail 9 3 8 3 0 0 13.7%
of which: SME 0 0 0 0 0 0 84.2%
Secured by mortgages on immovable property 6 2 3 2 0 0 4.7%
of which: SME 0 0 0 0 0 0 0.0%
Items associated with particularly high risk 0 0 0 0 0 0 0.0%
Covered bonds 0 0 0 0 0 0 0.0%
Claims on institutions and corporates with a ST credit assessment 0 0 0 0 0 0 0.0%
Collective investments undertakings (CIU) 26 0 26 0 0 0 0.0%
Equity 0 0 0 0 0 0 0.0%
Securitisation
Other exposures 448 0 283 0 0 0 0.0%
Standardised Total 1,081 72 770 45 0 28 38.5%1 Computed as: Stock of provisions for defaulted stock / default stock (as defined in paragraphs 59 and 61 of the Methodological note)
Luxembourg
Exposure values Risk exposure amounts Stock of provisionsCoverage Ratio -
Default Stock1
Switzerland
31/12/2015
Exposure values Risk exposure amounts Stock of provisionsCoverage Ratio -
Default Stock1
Italy
31/12/2015
Exposure values Risk exposure amounts Stock of provisionsCoverage Ratio -
Default Stock1
31/12/2015

2016 EU-wide Stress Test:
Credit risk STASociété Générale S.A.
Non-defaulted Defaulted Non-defaulted Defaulted Non-defaulted Defaulted
Central governments or central banks 169 0 177 0 0 0 0.0%
Regional governments or local authorities 37 0 37 0 0 0 0.0%
Public sector entities 24 0 20 0 0 0 0.0%
Multilateral Development Banks 23 0 23 0 0 0 0.0%
International Organisations 0 0 0 0 0 0 0.0%
Institutions 411 0 331 0 0 0 0.0%
Corporates 3,951 201 3,931 38 0 170 84.3%
of which: SME 186 14 155 3 0 14 99.5%
Retail 2,402 607 1,788 91 0 517 85.1%
of which: SME 75 49 43 6 0 44 88.9%
Secured by mortgages on immovable property 2,263 111 792 61 0 31 28.0%
of which: SME 2 0 1 0 0 0 0.0%
Items associated with particularly high risk 0 0 0 0 0 0 0.0%
Covered bonds 0 0 0 0 0 0 0.0%
Claims on institutions and corporates with a ST credit assessment 0 0 0 0 0 0 0.0%
Collective investments undertakings (CIU) 0 0 0 0 0 0 0.0%
Equity 2 0 4 0 0 0 0.0%
Securitisation
Other exposures 347 0 344 0 0 0 0.0%
Standardised Total 9,629 919 7,448 190 0 717 78.1%1 Computed as: Stock of provisions for defaulted stock / default stock (as defined in paragraphs 59 and 61 of the Methodological note)
Non-defaulted Defaulted Non-defaulted Defaulted Non-defaulted Defaulted
Central governments or central banks 2 0 0 0 0 0 0.0%
Regional governments or local authorities 0 0 0 0 0 0 0.0%
Public sector entities 0 0 0 0 0 0 0.0%
Multilateral Development Banks 0 0 0 0 0 0 0.0%
International Organisations 0 0 0 0 0 0 0.0%
Institutions 2,490 0 81 0 0 0 0.0%
Corporates 5 0 5 0 0 0 0.0%
of which: SME 0 0 0 0 0 0 0.0%
Retail 1 0 1 0 0 0 72.2%
of which: SME 0 0 0 0 0 0 0.0%
Secured by mortgages on immovable property 0 0 0 0 0 0 0.0%
of which: SME 0 0 0 0 0 0 0.0%
Items associated with particularly high risk 0 0 0 0 0 0 0.0%
Covered bonds 0 0 0 0 0 0 0.0%
Claims on institutions and corporates with a ST credit assessment 0 0 0 0 0 0 0.0%
Collective investments undertakings (CIU) 5 0 5 0 0 0 0.0%
Equity 2 0 2 0 0 0 0.0%
Securitisation
Other exposures 29 0 29 0 0 0 0.0%
Standardised Total 2,534 0 123 0 0 0 52.8%1 Computed as: Stock of provisions for defaulted stock / default stock (as defined in paragraphs 59 and 61 of the Methodological note)
Japan
Exposure values Risk exposure amounts Stock of provisionsCoverage Ratio -
Default Stock1
Russian Federation
31/12/2015
Exposure values Risk exposure amounts Stock of provisionsCoverage Ratio -
Default Stock1
31/12/2015

2016 EU-wide Stress Test:
Credit risk STASociété Générale S.A.
Central governments or central banks
Regional governments or local authorities
Public sector entities
Multilateral Development Banks
International Organisations
Institutions
Corporates
of which: SME
Retail
of which: SME
Secured by mortgages on immovable property
Items associated with particularly high risk
Covered bonds
Claims on institutions and corporates with a ST credit assessment
Collective investments undertakings (CIU)
Equity
Securitisation
Other exposures
Standardised Total1 Computed as: Stock of provisions for defaulted stock / default stock (as defined in paragraphs 59 and 61 of the Methodological note)
Central governments or central banks
Regional governments or local authorities
Public sector entities
Multilateral Development Banks
International Organisations
Institutions
Corporates
of which: SME
Retail
of which: SME
Secured by mortgages on immovable property
of which: SME
Items associated with particularly high risk
Covered bonds
Claims on institutions and corporates with a ST credit assessment
Collective investments undertakings (CIU)
Equity
Securitisation
Other exposures
Standardised Total1 Computed as: Stock of provisions for defaulted stock / default stock (as defined in paragraphs 59 and 61 of the Methodological note)
United States
France
Société Générale S.A.
Impairment
rate
Stock of
Provisions
Coverage Ratio -
Default Stock1
Impairment
rate
Stock of
Provisions
Coverage Ratio -
Default Stock1
Impairment
rate
Stock of
Provisions
Coverage Ratio -
Default Stock1
Impairment
rate
Stock of
Provisions
Coverage Ratio -
Default Stock1
Impairment
rate
Stock of
Provisions
Coverage Ratio -
Default Stock1
Impairment
rate
Stock of
Provisions
Coverage Ratio -
Default Stock1
0.1% 14 7.0% 0.1% 23 9.0% 0.1% 31 10.2% 0.1% 21 9.2% 0.2% 41 12.9% 0.1% 63 16.3%
0.2% 6 42.8% 0.2% 8 43.0% 0.2% 10 43.1% 0.2% 6 42.8% 0.2% 9 43.0% 0.2% 11 43.1%
0.1% 1 48.7% 0.1% 2 45.2% 0.1% 3 43.6% 0.1% 2 48.0% 0.2% 2 44.5% 0.1% 3 43.1%
0.0% 0 - 0.0% 0 - 0.0% 0 - 0.0% 0 - 0.0% 0 - 0.0% 0 -
- 0 - - 0 - - 0 - - 0 - - 0 - - 0 -
0.0% 16 26.7% 0.0% 17 27.0% 0.0% 18 27.4% 0.0% 16 26.8% 0.0% 18 27.4% 0.0% 19 27.9%
0.9% 3,990 64.3% 0.8% 4,449 61.7% 0.8% 4,877 59.9% 1.4% 4,304 63.8% 1.7% 5,220 60.4% 1.3% 5,940 58.5%
1.3% 2,201 62.9% 1.3% 2,383 61.2% 1.2% 2,549 59.9% 2.1% 2,323 62.6% 2.5% 2,673 60.3% 2.1% 2,956 58.9%
1.7% 3,015 62.4% 1.5% 3,452 59.3% 1.4% 3,875 57.5% 2.4% 3,256 63.1% 2.2% 3,890 59.1% 1.9% 4,430 57.2%
0.9% 835 55.7% 0.9% 907 52.0% 0.9% 978 49.4% 1.2% 857 55.6% 1.3% 968 51.3% 1.1% 1,062 49.3%
0.4% 388 36.4% 0.4% 454 33.9% 0.4% 525 32.8% 0.6% 448 39.7% 0.7% 600 39.1% 0.7% 772 41.7%
1.0% 8 7.8% 1.1% 12 9.8% 1.0% 15 11.4% 1.3% 11 9.8% 1.7% 19 14.8% 1.5% 26 18.3%
- 0 - - 0 - - 0 - - 0 - - 0 - - 0 -
- 0 - - 0 - - 0 - - 0 - - 0 - - 0 -
- 0 - - 0 - - 0 - - 0 - - 0 - - 0 -
0.0% 0 0.3% 0.0% 0 0.4% 0.0% 0 0.6% 0.0% 0 0.3% 0.0% 0 0.5% 0.0% 0 0.8%
0.0% 357 - 0.0% 357 - 0.0% 357 - 0.0% 357 - 0.0% 357 - 0.0% 357 -
0.2% 31 40.5% 0.2% 64 40.5% 0.2% 98 40.5% 0.2% 44 42.0% 0.2% 86 42.1% 0.2% 116 42.1%
0.7% 7,819 59.9% 0.6% 8,827 56.9% 0.6% 9,794 55.1% 1.0% 8,454 60.1% 1.1% 10,224 56.6% 0.9% 11,712 55.2%
Impairment
rate
Stock of
Provisions
Coverage Ratio -
Default Stock1
Impairment
rate
Stock of
Provisions
Coverage Ratio -
Default Stock1
Impairment
rate
Stock of
Provisions
Coverage Ratio -
Default Stock1
Impairment
rate
Stock of
Provisions
Coverage Ratio -
Default Stock1
Impairment
rate
Stock of
Provisions
Coverage Ratio -
Default Stock1
Impairment
rate
Stock of
Provisions
Coverage Ratio -
Default Stock1
0.0% 0 0.3% 0.0% 0 0.4% 0.0% 0 0.4% 0.0% 0 0.6% 0.0% 0 1.0% 0.0% 0 1.4%
0.1% 1 19.9% 0.1% 2 25.1% 0.1% 3 27.7% 0.1% 1 21.0% 0.1% 2 26.4% 0.1% 3 28.6%
0.1% 0 36.8% 0.1% 0 36.0% 0.1% 0 35.7% 0.1% 0 36.6% 0.1% 0 35.8% 0.1% 1 35.6%
- 0 - - 0 - - 0 - - 0 - - 0 - - 0 -
- 0 - - 0 - - 0 - - 0 - - 0 - - 0 -
0.0% 0 23.0% 0.0% 0 22.9% 0.0% 0 23.0% 0.0% 0 25.1% 0.0% 0 25.9% 0.0% 0 26.0%
0.8% 803 57.1% 0.7% 931 54.0% 0.6% 1,051 52.0% 1.0% 827 57.1% 1.1% 1,045 53.1% 1.0% 1,237 51.0%
1.1% 391 48.4% 1.0% 442 47.4% 1.0% 487 46.6% 1.3% 399 48.6% 1.6% 477 47.4% 1.6% 550 46.6%
1.0% 645 51.0% 0.9% 696 47.3% 0.8% 744 44.4% 1.0% 650 51.2% 1.0% 712 47.3% 1.0% 770 44.5%
0.9% 321 46.0% 0.9% 348 42.3% 1.0% 374 39.5% 1.0% 323 46.1% 1.1% 356 42.3% 1.1% 388 39.7%
0.3% 31 22.7% 0.3% 38 22.2% 0.3% 43 21.8% 0.3% 34 24.2% 0.4% 46 25.6% 0.4% 58 26.6%
1.4% 2 14.0% 1.4% 4 17.4% 1.3% 6 18.8% 1.5% 4 24.2% 2.0% 10 34.6% 2.0% 15 39.1%
- 0 - - 0 - - 0 - - 0 - - 0 - - 0 -
- 0 - - 0 - - 0 - - 0 - - 0 - - 0 -
- 0 - - 0 - - 0 - - 0 - - 0 - - 0 -
0.0% 0 66.2% 0.0% 0 55.4% 0.0% 0 50.1% 0.0% 0 64.3% 0.0% 0 53.4% 0.0% 0 49.4%
0.0% 88 - 0.0% 88 - 0.0% 88 - 0.0% 88 - 0.0% 88 - 0.0% 88 -
0.1% 7 40.4% 0.1% 15 40.4% 0.1% 23 40.4% 0.1% 10 42.0% 0.1% 20 42.0% 0.1% 28 42.0%0.5% 1,576 51.9% 0.4% 1,770 48.8% 0.4% 1,952 46.7% 0.5% 1,611 52.1% 0.6% 1,914 48.8% 0.5% 2,184 46.8%
Impairment
rate
Stock of
Provisions
Coverage Ratio -
Default Stock1
Impairment
rate
Stock of
Provisions
Coverage Ratio -
Default Stock1
Impairment
rate
Stock of
Provisions
Coverage Ratio -
Default Stock1
Impairment
rate
Stock of
Provisions
Coverage Ratio -
Default Stock1
Impairment
rate
Stock of
Provisions
Coverage Ratio -
Default Stock1
Impairment
rate
Stock of
Provisions
Coverage Ratio -
Default Stock1
0.0% 0 40.0% 0.0% 0 40.0% 0.0% 0 40.0% 0.0% 0 40.0% 0.0% 0 40.0% 0.0% 0 40.0%
0.0% 0 35.0% 0.0% 0 35.0% 0.0% 0 35.0% 0.0% 0 35.0% 0.0% 0 35.0% 0.0% 0 35.0%
- 0 - - 0 - - 0 - - 0 - - 0 - - 0 -
- 0 - - 0 - - 0 - - 0 - - 0 - - 0 -
- 0 - - 0 - - 0 - - 0 - - 0 - - 0 -
0.0% 0 33.5% 0.0% 0 33.5% 0.0% 1 33.5% 0.0% 0 35.0% 0.0% 0 35.0% 0.0% 1 35.0%
0.3% 25 26.5% 0.2% 30 28.0% 0.3% 35 29.3% 0.4% 28 27.6% 0.5% 37 30.2% 0.4% 44 31.5%
0.4% 1 28.1% 0.4% 1 33.1% 0.5% 2 35.3% 0.8% 1 33.8% 0.9% 3 37.7% 0.6% 4 38.8%
1.0% 0 59.0% 0.8% 0 57.0% 0.7% 0 55.4% 1.2% 0 59.3% 1.0% 0 57.2% 0.9% 0 55.6%
0.0% 0 64.0% 0.0% 0 64.0% 0.0% 0 63.9% 0.0% 0 64.0% 0.0% 0 64.0% 0.0% 0 64.1%
0.8% 1 63.1% 0.9% 1 60.9% 0.9% 1 59.3% 1.0% 1 62.8% 1.2% 1 60.2% 1.3% 1 58.9%
13.1% 0 51.4% 19.2% 0 51.4% 31.3% 0 51.4% 15.8% 0 51.4% 26.6% 0 51.4% 60.8% 0 54.6%
- 0 - - 0 - - 0 - - 0 - - 0 - - 0 -
- 0 - - 0 - - 0 - - 0 - - 0 - - 0 -
- 0 - - 0 - - 0 - - 0 - - 0 - - 0 -
0.0% 0 35.6% 0.0% 0 36.4% 0.0% 0 37.0% 0.0% 0 37.2% 0.0% 0 38.1% 0.0% 0 38.8%
0.0% 49 - 0.0% 49 - 0.0% 49 - 0.0% 49 - 0.0% 49 - 0.0% 49 -
0.0% 0 33.5% 0.0% 0 33.5% 0.0% 0 33.5% 0.0% 0 35.0% 0.0% 0 35.0% 0.0% 0 35.0%
0.1% 76 27.3% 0.1% 81 28.8% 0.1% 86 30.0% 0.1% 78 28.4% 0.1% 88 30.9% 0.1% 95 32.1%
31/12/2018 31/12/2016 31/12/2017 31/12/201831/12/2016 31/12/2017
Baseline Scenario Adverse Scenario
Baseline Scenario Adverse Scenario
31/12/2016 31/12/2017 31/12/2018
31/12/2018
31/12/2016 31/12/2017 31/12/2018
Baseline Scenario Adverse Scenario
31/12/2016 31/12/2017 31/12/2018 31/12/2016 31/12/2017

2016 EU-wide Stress Test:
Credit risk STASociété Générale S.A.
Central governments or central banks
Regional governments or local authorities
Public sector entities
Multilateral Development Banks
International Organisations
Institutions
Corporates
of which: SME
Retail
of which: SME
Secured by mortgages on immovable property
of which: SME
Items associated with particularly high risk
Covered bonds
Claims on institutions and corporates with a ST credit assessment
Collective investments undertakings (CIU)
Equity
Securitisation
Other exposures
Standardised Total1 Computed as: Stock of provisions for defaulted stock / default stock (as defined in paragraphs 59 and 61 of the Methodological note)
Czech Republic
Germany
United Kingdom
Impairment
rate
Stock of
Provisions
Coverage Ratio -
Default Stock1
Impairment
rate
Stock of
Provisions
Coverage Ratio -
Default Stock1
Impairment
rate
Stock of
Provisions
Coverage Ratio -
Default Stock1
Impairment
rate
Stock of
Provisions
Coverage Ratio -
Default Stock1
Impairment
rate
Stock of
Provisions
Coverage Ratio -
Default Stock1
Impairment
rate
Stock of
Provisions
Coverage Ratio -
Default Stock1
0.0% 0 40.0% 0.0% 0 40.0% 0.0% 0 40.0% 0.0% 0 40.0% 0.0% 0 40.0% 0.0% 0 40.0%
0.1% 0 35.0% 0.1% 0 35.0% 0.1% 0 35.0% 0.1% 0 35.0% 0.2% 0 35.0% 0.1% 0 35.0%
0.1% 0 42.7% 0.1% 0 39.2% 0.1% 0 37.9% 0.1% 0 41.9% 0.1% 0 38.5% 0.1% 1 37.5%
- 0 - - 0 - - 0 - - 0 - - 0 - - 0 -
- 0 - - 0 - - 0 - - 0 - - 0 - - 0 -
0.0% 0 33.5% 0.0% 0 33.5% 0.0% 1 33.5% 0.0% 0 35.0% 0.0% 1 35.0% 0.0% 1 35.0%
0.5% 39 48.4% 0.4% 50 46.3% 0.4% 62 45.1% 0.6% 41 48.7% 0.7% 62 46.3% 0.6% 78 45.3%
1.3% 7 52.3% 1.2% 10 47.7% 1.1% 13 45.8% 1.5% 7 52.6% 1.8% 12 47.7% 1.7% 17 46.0%
0.3% 14 52.1% 0.3% 17 44.1% 0.3% 21 39.7% 0.5% 16 49.3% 0.6% 22 42.5% 0.4% 26 40.0%
0.3% 10 47.6% 0.3% 14 40.1% 0.3% 17 36.4% 0.5% 13 45.2% 0.6% 18 39.5% 0.4% 22 37.5%
0.2% 0 15.6% 0.2% 0 12.9% 0.2% 1 11.9% 0.2% 0 17.3% 0.2% 1 14.5% 0.3% 1 13.6%
1.7% 0 51.4% 2.0% 0 51.4% 2.1% 0 51.4% 2.1% 0 51.4% 2.6% 0 51.4% 3.0% 0 51.4%
- 0 - - 0 - - 0 - - 0 - - 0 - - 0 -
- 0 - - 0 - - 0 - - 0 - - 0 - - 0 -
- 0 - - 0 - - 0 - - 0 - - 0 - - 0 -
0.0% 0 40.4% 0.0% 0 40.4% 0.0% 0 40.4% 0.0% 0 42.0% 0.0% 0 42.0% 0.0% 0 42.0%
0.0% 0 - 0.0% 0 - 0.0% 0 - 0.0% 0 - 0.0% 0 - 0.0% 0 -
0.3% 4 40.0% 0.3% 9 40.2% 0.4% 14 40.3% 0.5% 6 41.7% 0.5% 12 41.9% 0.3% 17 41.9%
0.1% 58 47.8% 0.1% 78 44.2% 0.1% 99 42.2% 0.2% 65 47.4% 0.2% 98 44.1% 0.2% 123 42.8%
Impairment
rate
Stock of
Provisions
Coverage Ratio -
Default Stock1
Impairment
rate
Stock of
Provisions
Coverage Ratio -
Default Stock1
Impairment
rate
Stock of
Provisions
Coverage Ratio -
Default Stock1
Impairment
rate
Stock of
Provisions
Coverage Ratio -
Default Stock1
Impairment
rate
Stock of
Provisions
Coverage Ratio -
Default Stock1
Impairment
rate
Stock of
Provisions
Coverage Ratio -
Default Stock1
0.0% 0 12.2% 0.0% 0 18.7% 0.0% 0 22.8% 0.0% 0 12.2% 0.0% 0 18.7% 0.0% 0 22.8%
0.1% 0 35.0% 0.1% 0 35.0% 0.1% 0 35.0% 0.1% 0 35.0% 0.2% 0 35.0% 0.1% 0 35.0%
0.1% 0 35.0% 0.1% 0 35.0% 0.1% 0 35.0% 0.1% 0 35.0% 0.1% 0 35.0% 0.1% 0 35.0%
- 0 - - 0 - - 0 - - 0 - - 0 - - 0 -
- 0 - - 0 - - 0 - - 0 - - 0 - - 0 -
0.0% 0 0.5% 0.0% 0 1.1% 0.0% 0 1.6% 0.0% 0 0.7% 0.0% 0 1.5% 0.0% 0 2.2%
0.4% 44 57.5% 0.4% 53 53.6% 0.4% 63 51.0% 0.6% 48 56.2% 0.7% 65 51.7% 0.5% 78 49.8%
0.4% 1 27.7% 0.5% 1 32.5% 0.5% 2 34.7% 0.7% 1 31.7% 0.9% 2 36.4% 0.9% 3 38.1%
1.4% 145 31.1% 1.3% 214 31.1% 1.2% 275 31.0% 1.6% 158 31.1% 1.9% 256 31.1% 1.9% 347 31.1%
0.2% 10 32.0% 0.2% 12 32.1% 0.2% 14 32.0% 0.3% 10 32.2% 0.4% 14 32.8% 0.4% 18 33.4%
2.6% 2 41.6% 2.6% 2 40.8% 2.5% 2 40.1% 3.2% 2 42.7% 3.4% 2 42.9% 3.4% 3 43.3%
- 0 - - 0 - - 0 - - 0 - - 0 - - 0 -
- 0 - - 0 - - 0 - - 0 - - 0 - - 0 -
- 0 - - 0 - - 0 - - 0 - - 0 - - 0 -
- 0 - - 0 - - 0 - - 0 - - 0 - - 0 -
- 0 - - 0 - - 0 - - 0 - - 0 - - 0 -
0.0% 3 - 0.0% 3 - 0.0% 3 - 0.0% 3 - 0.0% 3 - 0.0% 3 -
0.3% 4 40.4% 0.3% 9 40.4% 0.3% 13 40.4% 0.4% 6 42.0% 0.4% 12 42.0% 0.3% 16 42.0%
0.7% 198 34.7% 0.7% 282 33.9% 0.7% 357 33.5% 0.9% 218 34.7% 1.0% 338 33.9% 1.0% 447 33.5%
Impairment
rate
Stock of
Provisions
Coverage Ratio -
Default Stock1
Impairment
rate
Stock of
Provisions
Coverage Ratio -
Default Stock1
Impairment
rate
Stock of
Provisions
Coverage Ratio -
Default Stock1
Impairment
rate
Stock of
Provisions
Coverage Ratio -
Default Stock1
Impairment
rate
Stock of
Provisions
Coverage Ratio -
Default Stock1
Impairment
rate
Stock of
Provisions
Coverage Ratio -
Default Stock1
0.0% 0 40.0% 0.0% 0 40.0% 0.0% 0 40.0% 0.0% 0 40.0% 0.0% 0 40.0% 0.0% 0 40.0%
0.0% 0 4.0% 0.0% 0 5.6% 0.0% 0 7.3% 0.0% 0 4.2% 0.0% 0 6.4% 0.0% 0 8.3%
0.1% 0 45.0% 0.1% 0 45.0% 0.1% 0 45.0% 0.2% 0 45.0% 0.2% 0 45.0% 0.2% 0 45.0%
- 0 - - 0 - - 0 - - 0 - - 0 - - 0 -
- 0 - - 0 - - 0 - - 0 - - 0 - - 0 -
0.0% 0 33.5% 0.0% 0 33.5% 0.0% 0 33.5% 0.0% 0 35.0% 0.0% 0 35.0% 0.0% 0 35.0%
0.5% 31 61.7% 0.5% 35 58.0% 0.5% 39 55.5% 0.8% 33 60.3% 1.1% 42 55.2% 0.9% 49 52.8%
0.5% 12 57.3% 0.5% 14 54.4% 0.5% 15 52.5% 0.8% 13 56.3% 1.2% 17 52.2% 1.0% 20 50.3%
1.4% 127 73.4% 1.4% 141 69.8% 1.4% 154 67.1% 2.1% 134 73.3% 2.2% 157 69.9% 1.8% 173 68.3%
1.6% 28 69.0% 1.6% 35 65.8% 1.6% 42 63.8% 2.2% 31 71.1% 2.6% 43 68.9% 2.3% 52 67.8%
0.1% 15 35.6% 0.1% 15 30.7% 0.1% 16 27.2% 0.1% 16 35.5% 0.1% 18 32.4% 0.1% 21 32.0%
0.6% 0 16.1% 0.7% 0 16.6% 0.7% 0 16.8% 1.0% 0 19.2% 1.5% 0 22.0% 1.3% 0 24.0%
- 0 - - 0 - - 0 - - 0 - - 0 - - 0 -
- 0 - - 0 - - 0 - - 0 - - 0 - - 0 -
- 0 - - 0 - - 0 - - 0 - - 0 - - 0 -
- 0 - - 0 - - 0 - - 0 - - 0 - - 0 -
- 0 - - 0 - - 0 - - 0 - - 0 - - 0 -
0.1% 0 40.4% 0.1% 1 40.4% 0.1% 1 40.4% 0.1% 1 42.0% 0.1% 1 42.0% 0.1% 2 42.0%
0.6% 173 65.2% 0.6% 192 61.1% 0.6% 210 58.2% 0.9% 184 64.8% 1.1% 218 60.7% 0.8% 245 58.9%
31/12/2018 31/12/2016 31/12/2017 31/12/201831/12/2016 31/12/2017
31/12/2018 31/12/2016 31/12/2017 31/12/2018
Baseline Scenario Adverse Scenario
31/12/2016 31/12/2017
31/12/2018 31/12/2016 31/12/2017 31/12/2018
Baseline Scenario Adverse Scenario
31/12/2016 31/12/2017
Baseline Scenario Adverse Scenario

2016 EU-wide Stress Test:
Credit risk STASociété Générale S.A.
Central governments or central banks
Regional governments or local authorities
Public sector entities
Multilateral Development Banks
International Organisations
Institutions
Corporates
of which: SME
Retail
of which: SME
Secured by mortgages on immovable property
of which: SME
Items associated with particularly high risk
Covered bonds
Claims on institutions and corporates with a ST credit assessment
Collective investments undertakings (CIU)
Equity
Securitisation
Other exposures
Standardised Total1 Computed as: Stock of provisions for defaulted stock / default stock (as defined in paragraphs 59 and 61 of the Methodological note)
Central governments or central banks
Regional governments or local authorities
Public sector entities
Multilateral Development Banks
International Organisations
Institutions
Corporates
of which: SME
Retail
of which: SME
Secured by mortgages on immovable property
of which: SME
Items associated with particularly high risk
Covered bonds
Claims on institutions and corporates with a ST credit assessment
Collective investments undertakings (CIU)
Equity
Securitisation
Other exposures
Standardised Total1 Computed as: Stock of provisions for defaulted stock / default stock (as defined in paragraphs 59 and 61 of the Methodological note)
Central governments or central banks
Regional governments or local authorities
Public sector entities
Multilateral Development Banks
International Organisations
Institutions
Corporates
of which: SME
Retail
of which: SME
Secured by mortgages on immovable property
of which: SME
Items associated with particularly high risk
Covered bonds
Claims on institutions and corporates with a ST credit assessment
Collective investments undertakings (CIU)
Equity
Securitisation
Other exposures
Standardised Total1 Computed as: Stock of provisions for defaulted stock / default stock (as defined in paragraphs 59 and 61 of the Methodological note)
Luxembourg
Switzerland
Italy
Impairment
rate
Stock of
Provisions
Coverage Ratio -
Default Stock1
Impairment
rate
Stock of
Provisions
Coverage Ratio -
Default Stock1
Impairment
rate
Stock of
Provisions
Coverage Ratio -
Default Stock1
Impairment
rate
Stock of
Provisions
Coverage Ratio -
Default Stock1
Impairment
rate
Stock of
Provisions
Coverage Ratio -
Default Stock1
Impairment
rate
Stock of
Provisions
Coverage Ratio -
Default Stock1
0.0% 0 35.7% 0.0% 0 37.6% 0.0% 0 38.3% 0.0% 0 38.5% 0.0% 0 39.2% 0.0% 0 39.5%
0.8% 0 6.6% 0.8% 0 10.8% 0.7% 1 13.9% 0.9% 0 7.2% 0.9% 0 12.0% 0.8% 1 15.1%
1.6% 0 44.0% 1.4% 0 44.4% 1.3% 0 44.6% 1.8% 0 44.1% 1.7% 0 44.5% 1.4% 0 44.6%
- 0 - - 0 - - 0 - - 0 - - 0 - - 0 -
- 0 - - 0 - - 0 - - 0 - - 0 - - 0 -
0.0% 0 33.5% 0.0% 0 33.5% 0.0% 0 33.5% 0.0% 0 35.0% 0.0% 0 35.0% 0.0% 0 35.0%
0.6% 68 65.9% 0.6% 84 58.9% 0.6% 99 54.9% 0.9% 75 63.8% 1.0% 102 56.2% 0.8% 125 52.9%
0.8% 48 76.0% 0.8% 53 70.7% 0.8% 57 66.8% 1.3% 51 73.2% 1.5% 59 66.5% 1.5% 67 62.3%
2.0% 187 64.2% 1.9% 204 62.6% 1.8% 220 61.4% 2.8% 194 63.9% 2.9% 221 62.1% 3.1% 247 60.9%
1.1% 28 83.5% 1.1% 30 73.9% 1.1% 32 67.4% 1.8% 29 78.2% 1.5% 32 68.3% 1.3% 35 62.7%
0.7% 1 50.7% 0.8% 1 50.2% 0.9% 1 49.8% 0.9% 1 51.6% 1.2% 1 52.0% 1.3% 1 52.6%
0.6% 0 0.6% 0.7% 0 1.2% 0.7% 0 1.8% 0.9% 0 0.9% 0.9% 0 1.6% 0.8% 0 2.4%
- 0 - - 0 - - 0 - - 0 - - 0 - - 0 -
- 0 - - 0 - - 0 - - 0 - - 0 - - 0 -
- 0 - - 0 - - 0 - - 0 - - 0 - - 0 -
0.0% 0 40.4% 0.0% 0 40.4% 0.0% 0 40.4% 0.0% 0 42.0% 0.0% 0 42.0% 0.0% 0 42.0%
0.0% 9 - 0.0% 9 - 0.0% 9 - 0.0% 9 - 0.0% 9 - 0.0% 9 -
0.4% 4 40.4% 0.4% 9 40.4% 0.4% 13 40.4% 0.5% 6 42.0% 0.5% 11 42.0% 0.4% 16 42.0%
0.7% 269 63.5% 0.6% 307 60.1% 0.6% 344 57.8% 1.0% 286 62.7% 1.0% 345 58.8% 0.9% 399 56.8%
Impairment
rate
Stock of
Provisions
Coverage Ratio -
Default Stock1
Impairment
rate
Stock of
Provisions
Coverage Ratio -
Default Stock1
Impairment
rate
Stock of
Provisions
Coverage Ratio -
Default Stock1
Impairment
rate
Stock of
Provisions
Coverage Ratio -
Default Stock1
Impairment
rate
Stock of
Provisions
Coverage Ratio -
Default Stock1
Impairment
rate
Stock of
Provisions
Coverage Ratio -
Default Stock1
0.0% 0 40.0% 0.0% 0 40.0% 0.0% 0 40.0% 0.0% 0 40.0% 0.0% 0 40.0% 0.0% 0 40.0%
0.1% 0 35.0% 0.1% 0 35.0% 0.1% 0 35.0% 0.1% 0 35.0% 0.2% 0 35.0% 0.1% 0 35.0%
0.1% 0 35.0% 0.1% 0 35.0% 0.1% 0 35.0% 0.1% 0 35.0% 0.1% 0 35.0% 0.1% 0 35.0%
- 0 - - 0 - - 0 - - 0 - - 0 - - 0 -
- 0 - - 0 - - 0 - - 0 - - 0 - - 0 -
0.0% 0 1.5% 0.0% 0 2.9% 0.0% 0 4.3% 0.0% 0 1.9% 0.0% 0 4.0% 0.0% 0 5.7%
0.3% 1 43.3% 0.3% 2 42.4% 0.4% 3 41.9% 0.5% 2 43.7% 0.7% 3 43.0% 0.5% 4 42.8%
0.3% 1 48.3% 0.3% 1 47.0% 0.3% 1 46.1% 0.5% 1 48.0% 0.6% 1 46.6% 0.4% 1 46.0%
0.4% 5 37.0% 0.5% 6 37.1% 0.5% 6 37.1% 0.8% 6 37.6% 0.9% 7 38.1% 0.7% 8 38.2%
0.4% 2 21.8% 0.4% 3 24.3% 0.4% 4 26.2% 0.8% 3 24.3% 0.9% 4 28.2% 0.6% 5 30.0%
0.3% 1 40.0% 0.3% 1 33.9% 0.4% 1 30.6% 0.4% 1 40.2% 0.5% 1 33.8% 0.5% 1 31.5%
0.3% 0 42.0% 0.3% 0 42.2% 0.3% 0 42.3% 0.3% 0 43.6% 0.3% 0 43.8% 0.3% 0 43.9%
- 0 - - 0 - - 0 - - 0 - - 0 - - 0 -
- 0 - - 0 - - 0 - - 0 - - 0 - - 0 -
- 0 - - 0 - - 0 - - 0 - - 0 - - 0 -
- 0 - - 0 - - 0 - - 0 - - 0 - - 0 -
0.0% 2 - 0.0% 2 - 0.0% 2 - 0.0% 2 - 0.0% 2 - 0.0% 2 -
0.0% 0 - 0.0% 0 - 0.0% 0 - 0.0% 0 - 0.0% 0 - 0.0% 0 -
0.3% 9 38.0% 0.3% 11 37.6% 0.3% 12 37.4% 0.4% 10 38.6% 0.5% 13 38.7% 0.4% 15 38.6%
Impairment
rate
Stock of
Provisions
Coverage Ratio -
Default Stock1
Impairment
rate
Stock of
Provisions
Coverage Ratio -
Default Stock1
Impairment
rate
Stock of
Provisions
Coverage Ratio -
Default Stock1
Impairment
rate
Stock of
Provisions
Coverage Ratio -
Default Stock1
Impairment
rate
Stock of
Provisions
Coverage Ratio -
Default Stock1
Impairment
rate
Stock of
Provisions
Coverage Ratio -
Default Stock1
0.0% 0 40.0% 0.0% 0 40.0% 0.0% 0 40.0% 0.0% 0 40.0% 0.0% 0 40.0% 0.0% 0 40.0%
- 0 - - 0 - - 0 - - 0 - - 0 - - 0 -
- 0 - - 0 - - 0 - - 0 - - 0 - - 0 -
- 0 - - 0 - - 0 - - 0 - - 0 - - 0 -
- 0 - - 0 - - 0 - - 0 - - 0 - - 0 -
0.0% 0 33.5% 0.0% 0 33.5% 0.0% 0 33.5% 0.0% 0 35.0% 0.0% 0 35.0% 0.0% 0 35.0%
0.4% 29 40.6% 0.4% 31 40.6% 0.4% 33 40.6% 0.5% 30 40.7% 0.6% 32 40.8% 0.6% 34 40.9%
0.4% 28 40.8% 0.4% 29 40.8% 0.4% 30 40.7% 0.5% 28 40.8% 0.6% 30 40.9% 0.6% 31 40.9%
0.5% 0 14.4% 0.4% 0 14.9% 0.4% 0 15.3% 0.5% 0 14.5% 0.6% 0 15.2% 0.5% 1 15.8%
0.3% 0 83.0% 0.3% 0 81.9% 0.3% 0 80.9% 0.4% 0 83.0% 0.4% 0 81.7% 0.4% 0 80.5%
0.7% 0 6.1% 0.6% 0 7.3% 0.6% 0 8.3% 0.8% 0 6.4% 1.1% 0 8.3% 0.7% 0 9.5%
0.5% 0 51.4% 0.6% 0 51.4% 0.6% 0 51.4% 0.6% 0 51.4% 0.8% 0 51.4% 0.8% 0 51.4%
- 0 - - 0 - - 0 - - 0 - - 0 - - 0 -
- 0 - - 0 - - 0 - - 0 - - 0 - - 0 -
- 0 - - 0 - - 0 - - 0 - - 0 - - 0 -
0.0% 0 40.4% 0.0% 0 40.4% 0.0% 0 40.4% 0.0% 0 42.0% 0.0% 0 42.0% 0.0% 0 42.0%
- 0 - - 0 - - 0 - - 0 - - 0 - - 0 -
0.1% 1 40.4% 0.1% 1 40.4% 0.1% 2 40.4% 0.2% 1 42.0% 0.2% 2 42.0% 0.1% 2 42.0%
0.2% 30 38.6% 0.2% 33 38.7% 0.2% 35 38.8% 0.3% 31 38.8% 0.3% 35 39.0% 0.3% 38 39.2%
31/12/2018 31/12/2016 31/12/2017 31/12/201831/12/2016 31/12/2017
31/12/2018 31/12/2016 31/12/2017 31/12/2018
Baseline Scenario Adverse Scenario
31/12/2016 31/12/2017
31/12/2018 31/12/2016 31/12/2017 31/12/2018
Baseline Scenario Adverse Scenario
31/12/2016 31/12/2017
Baseline Scenario Adverse Scenario

2016 EU-wide Stress Test:
Credit risk STASociété Générale S.A.
Central governments or central banks
Regional governments or local authorities
Public sector entities
Multilateral Development Banks
International Organisations
Institutions
Corporates
of which: SME
Retail
of which: SME
Secured by mortgages on immovable property
of which: SME
Items associated with particularly high risk
Covered bonds
Claims on institutions and corporates with a ST credit assessment
Collective investments undertakings (CIU)
Equity
Securitisation
Other exposures
Standardised Total1 Computed as: Stock of provisions for defaulted stock / default stock (as defined in paragraphs 59 and 61 of the Methodological note)
Central governments or central banks
Regional governments or local authorities
Public sector entities
Multilateral Development Banks
International Organisations
Institutions
Corporates
of which: SME
Retail
of which: SME
Secured by mortgages on immovable property
of which: SME
Items associated with particularly high risk
Covered bonds
Claims on institutions and corporates with a ST credit assessment
Collective investments undertakings (CIU)
Equity
Securitisation
Other exposures
Standardised Total1 Computed as: Stock of provisions for defaulted stock / default stock (as defined in paragraphs 59 and 61 of the Methodological note)
Japan
Russian Federation
Impairment
rate
Stock of
Provisions
Coverage Ratio -
Default Stock1
Impairment
rate
Stock of
Provisions
Coverage Ratio -
Default Stock1
Impairment
rate
Stock of
Provisions
Coverage Ratio -
Default Stock1
Impairment
rate
Stock of
Provisions
Coverage Ratio -
Default Stock1
Impairment
rate
Stock of
Provisions
Coverage Ratio -
Default Stock1
Impairment
rate
Stock of
Provisions
Coverage Ratio -
Default Stock1
0.0% 0 - 0.0% 0 - 0.0% 0 - 0.0% 0 - 0.0% 0 - 0.0% 0 -
0.2% 0 55.0% 0.2% 0 55.0% 0.3% 0 55.0% 0.2% 0 55.0% 0.3% 0 55.0% 0.3% 0 55.0%
0.1% 0 55.0% 0.1% 0 55.0% 0.2% 0 55.0% 0.2% 0 55.0% 0.2% 0 55.0% 0.2% 0 55.0%
0.0% 0 - 0.0% 0 - 0.0% 0 - 0.0% 0 - 0.0% 0 - 0.0% 0 -
- 0 - - 0 - - 0 - - 0 - - 0 - - 0 -
0.0% 0 48.5% 0.0% 0 48.5% 0.0% 0 48.5% 0.0% 0 50.0% 0.0% 0 50.0% 0.0% 0 50.0%
0.3% 180 80.0% 0.3% 193 76.1% 0.3% 205 72.9% 0.4% 184 79.0% 0.8% 213 71.6% 0.3% 224 69.5%
0.6% 15 90.9% 0.7% 16 84.0% 0.7% 17 79.1% 0.8% 15 89.2% 1.5% 18 77.4% 0.6% 19 74.4%
6.2% 754 88.8% 3.7% 868 87.7% 3.4% 980 88.1% 10.4% 850 92.8% 4.4% 945 89.3% 3.6% 1,017 87.3%
9.1% 55 90.2% 9.1% 63 90.2% 9.1% 71 91.3% 12.4% 54 86.8% 10.8% 63 88.1% 10.0% 71 89.9%
0.3% 62 32.8% 0.3% 82 31.4% 0.3% 108 32.3% 0.5% 79 37.8% 0.5% 103 36.3% 0.4% 132 37.7%
- 0 - - 0 - - 0 - - 0 - - 0 - - 0 -
- 0 - - 0 - - 0 - - 0 - - 0 - - 0 -
- 0 - - 0 - - 0 - - 0 - - 0 - - 0 -
- 0 - - 0 - - 0 - - 0 - - 0 - - 0 -
- 0 - - 0 - - 0 - - 0 - - 0 - - 0 -
0.0% 0 - 0.0% 0 - 0.0% 0 - 0.0% 0 - 0.0% 0 - 0.0% 0 -
0.0% 0 - 0.0% 0 - 0.0% 0 - 0.0% 0 - 0.0% 0 - 0.0% 0 -
1.8% 996 78.9% 1.1% 1,144 75.9% 1.0% 1,293 74.8% 3.0% 1,113 82.0% 1.5% 1,262 76.9% 1.1% 1,375 74.7%
Impairment
rate
Stock of
Provisions
Coverage Ratio -
Default Stock1
Impairment
rate
Stock of
Provisions
Coverage Ratio -
Default Stock1
Impairment
rate
Stock of
Provisions
Coverage Ratio -
Default Stock1
Impairment
rate
Stock of
Provisions
Coverage Ratio -
Default Stock1
Impairment
rate
Stock of
Provisions
Coverage Ratio -
Default Stock1
Impairment
rate
Stock of
Provisions
Coverage Ratio -
Default Stock1
0.0% 0 - 0.0% 0 - 0.0% 0 - 0.0% 0 - 0.0% 0 - 0.0% 0 -
- 0 - - 0 - - 0 - - 0 - - 0 - - 0 -
- 0 - - 0 - - 0 - - 0 - - 0 - - 0 -
- 0 - - 0 - - 0 - - 0 - - 0 - - 0 -
- 0 - - 0 - - 0 - - 0 - - 0 - - 0 -
0.0% 0 32.8% 0.0% 0 33.2% 0.0% 0 33.3% 0.0% 0 34.4% 0.0% 0 34.7% 0.0% 0 34.8%
0.3% 0 37.6% 0.2% 0 38.8% 0.3% 0 39.3% 0.4% 0 39.4% 0.5% 0 40.8% 0.3% 0 41.2%
- 0 - - 0 - - 0 - - 0 - - 0 - - 0 -
0.5% 0 36.7% 0.5% 0 30.2% 0.4% 0 27.0% 0.6% 0 37.7% 0.5% 0 30.7% 0.5% 0 27.4%
1.2% 0 23.0% 1.2% 0 23.0% 1.3% 0 23.0% 1.3% 0 23.4% 1.4% 0 23.6% 1.5% 0 23.8%
1.1% 0 66.0% 1.2% 0 66.0% 1.3% 0 66.0% 1.4% 0 66.0% 1.6% 0 66.0% 1.8% 0 66.0%
- 0 - - 0 - - 0 - - 0 - - 0 - - 0 -
- 0 - - 0 - - 0 - - 0 - - 0 - - 0 -
- 0 - - 0 - - 0 - - 0 - - 0 - - 0 -
- 0 - - 0 - - 0 - - 0 - - 0 - - 0 -
- 0 - - 0 - - 0 - - 0 - - 0 - - 0 -
0.0% 0 - 0.0% 0 - 0.0% 0 - 0.0% 0 - 0.0% 0 - 0.0% 0 -
0.0% 0 - 0.0% 0 - 0.0% 0 - 0.0% 0 - 0.0% 0 - 0.0% 0 -
0.0% 0 35.2% 0.0% 0 34.4% 0.0% 0 34.1% 0.0% 0 36.6% 0.0% 0 36.1% 0.0% 0 35.7%
31/12/2018 31/12/2016 31/12/2017 31/12/201831/12/2016 31/12/2017
31/12/2018 31/12/2016 31/12/2017 31/12/2018
Baseline Scenario Adverse Scenario
31/12/2016 31/12/2017
Baseline Scenario Adverse Scenario

(mln EUR) 31/12/2016 31/12/2017 31/12/2018 31/12/2016 31/12/2017 31/12/2018
STA 43IRB 17,999Total 18,042
STA 289 747 747 747 747 747 747IRB 2,043 2,855 3,040 3,249 4,025 5,876 7,663Total 2,331 3,602 3,787 3,996 4,772 6,623 8,410
Impairments Total banking book others than assessed at fair value 1,251 17 2 0 21 5 4
2016 EU-wide Stress Test: SecuritisationsSociété Générale S.A.
Risk exposure amounts
31/12/2015Baseline Scenario Adverse Scenario
Exposure values

2016 EU-wide Stress Test: Sovereign
(mln EUR)
[ 0 - 3M [ 0 0 0 0 0 0 0 0 0 44 0 25 0 21 0
[ 3M - 1Y [ 18 18 0 0 18 0 0 495 26 0 0 654 4 701 -5
[ 1Y - 2Y [ 52 35 0 0 35 0 0 231 13 176 -8 735 12 562 -9
[ 2Y - 3Y [ 140 135 135 0 0 0 0 0 0 724 -39 231 5 393 -8
[3Y - 5Y [ 621 525 525 0 0 0 0 50 4 978 -85 558 18 519 -17
[5Y - 10Y [ 1,007 841 841 0 0 0 0 430 26 501 -18 282 13 347 -15
[10Y - more 540 494 285 0 209 0 0 0 0 0 0 0 0 0 0Tot 2,377 2,048 1,786 0 262 0 0 1,206 69 2,423 -149 2,486 52 2,543 -54
[ 0 - 3M [ 70 47 47 0 0 0 0 0 0 189 0 129 0 196 0
[ 3M - 1Y [ 225 144 6 0 76 62 0 400 16 0 0 483 3 470 -3
[ 1Y - 2Y [ 54 54 0 0 0 0 0 0 0 0 502 7 582 -8
[ 2Y - 3Y [ 264 227 0 0 56 51 120 65 2 0 0 176 4 242 -6
[3Y - 5Y [ 270 177 47 0 0 0 130 302 20 0 0 750 20 477 -14
[5Y - 10Y [ 1,467 703 498 0 40 0 165 100 0 0 0 132 4 148 -5
[10Y - more 676 0 0 0 0 0 0 475 89 618 -210 0 0 0 0Tot 3,101 1,353 653 0 172 113 415 1,342 128 807 -210 2,173 39 2,115 -36
[ 0 - 3M [ 245 245 245 0 0 0 1 0 0 0 0 0 0 15 0
[ 3M - 1Y [ 0 0 0 0 0 0 0 0 0 0 0 68 0 47 0
[ 1Y - 2Y [ 2 2 0 0 2 0 0 0 0 0 0 15 1 14 0
[ 2Y - 3Y [ 0 0 0 0 0 0 0 0 0 0 0 0 0 5 0
[3Y - 5Y [ 0 0 0 0 0 0 0 0 0 0 0 0 0 8 0
[5Y - 10Y [ 5 5 0 0 5 0 0 0 0 0 0 0 0 4 0
[10Y - more 0 0 0 0 0 0 0 0 0 0 0 0 0 0 0Tot 253 253 245 0 7 0 1 0 0 0 0 82 1 93 -1
[ 0 - 3M [ 0 0 0 0 0 0 0 0 0 0 0 14 0 14 0
[ 3M - 1Y [ 0 0 0 0 0 0 0 0 0 0 0 5 0 0 0
[ 1Y - 2Y [ 0 0 0 0 0 0 0 0 0 0 0 9 0 10 0
[ 2Y - 3Y [ 0 0 0 0 0 0 0 0 0 0 0 0 0 5 0
[3Y - 5Y [ 0 0 0 0 0 0 0 0 0 0 0 0 0 0 0
[5Y - 10Y [ 0 0 0 0 0 0 0 0 0 0 0 0 0 0 0
[10Y - more 0 0 0 0 0 0 0 0 0 0 0 0 0 0 0Tot 0 0 0 0 0 0 0 0 0 0 0 27 0 28 0
[ 0 - 3M [ 195 195 36 0 26 133 0 0 0 150 0 0 0 0 0
[ 3M - 1Y [ 164 164 8 0 156 0 1 0 0 0 0 0 0 1 0
[ 1Y - 2Y [ 279 279 103 0 68 108 0 0 0 0 0 0 0 0 0
[ 2Y - 3Y [ 205 205 60 0 26 120 0 0 0 0 0 0 0 0 0
[3Y - 5Y [ 490 484 83 0 11 390 0 0 0 0 0 0 0 0 0
[5Y - 10Y [ 1,535 1,526 228 0 1 1,296 0 6 0 0 0 0 0 0 0
[10Y - more 308 308 244 0 32 33 0 0 0 0 0 0 0 0 0Tot 3,177 3,161 760 0 319 2,081 1 6 0 150 0 0 0 1 0
[ 0 - 3M [ 0 0 0 0 0 0 0 0 0 54 -2 138 0 93 0
[ 3M - 1Y [ 0 0 0 0 0 0 0 0 0 190 -8 267 1 307 -1
[ 1Y - 2Y [ 0 0 0 0 0 0 0 0 0 0 0 128 1 88 0
[ 2Y - 3Y [ 2 2 0 0 0 0 2 0 0 0 0 133 1 186 -1
[3Y - 5Y [ 3 3 0 0 0 0 3 200 3 200 -31 153 2 158 -1
[5Y - 10Y [ 0 0 0 0 0 0 0 200 8 200 -39 46 0 46 0
[10Y - more 0 0 0 0 0 0 0 0 0 0 0 0 0 0 0Tot 6 6 0 0 0 0 6 400 11 644 -80 865 4 877 -4
[ 0 - 3M [ 0 0 0 0 0 0 0 0 0 0 0 0 0 0 0
[ 3M - 1Y [ 0 0 0 0 0 0 0 0 0 0 0 0 0 0 0
[ 1Y - 2Y [ 0 0 0 0 0 0 0 0 0 0 0 0 0 0 0
[ 2Y - 3Y [ 0 0 0 0 0 0 0 0 0 0 0 0 0 0 0
[3Y - 5Y [ 0 0 0 0 0 0 0 0 0 0 0 0 0 0 0
[5Y - 10Y [ 0 0 0 0 0 0 0 0 0 0 0 0 0 0 0
[10Y - more 0 0 0 0 0 0 0 0 0 0 0 0 0 0 0Tot 0 0 0 0 0 0 0 0 0 0 0 0 0 0 0
Société Générale S.A.
31/12/2015
Residual Maturity Country / Region
GROSS DIRECT LONG
EXPOSURES
(accounting value gross
of provisions)
(1)
NET DIRECT EXPOSURES
(accounting value gross of provisions)
(1)
Notional value Fair-value (+) Fair-value (-) Notional value Fair-value (+)
DIRECT SOVEREIGN EXPOSURES IN DERIVATIVES (1) INDIRECT SOVEREIGN EXPOSURES (3) (on and off balance sheet)
Derivatives with positive fair value Derivatives with negative fair value Derivatives with positive fair value Derivatives with negative fair value
Notional value Fair-value (-)Notional value
Cyprus
Czech Republic
of which: Loans and
receivablesof which: AFS
of which: FVO
(designated at fair
value through
profit&loss)
of which: HFT
(2)of which: HTM
Austria
Belgium
Bulgaria
Denmark
Estonia

2016 EU-wide Stress Test: Sovereign
(mln EUR)
Société Générale S.A.
31/12/2015
Residual Maturity Country / Region
GROSS DIRECT LONG
EXPOSURES
(accounting value gross
of provisions)
(1)
NET DIRECT EXPOSURES
(accounting value gross of provisions)
(1)
Notional value Fair-value (+) Fair-value (-) Notional value Fair-value (+)
DIRECT SOVEREIGN EXPOSURES IN DERIVATIVES (1) INDIRECT SOVEREIGN EXPOSURES (3) (on and off balance sheet)
Derivatives with positive fair value Derivatives with negative fair value Derivatives with positive fair value Derivatives with negative fair value
Notional value Fair-value (-)Notional valueof which: Loans and
receivablesof which: AFS
of which: FVO
(designated at fair
value through
profit&loss)
of which: HFT
(2)of which: HTM
Austria
[ 0 - 3M [ 0 0 0 0 0 0 0 0 0 0 0 41 0 46 0
[ 3M - 1Y [ 44 44 31 0 12 0 0 300 7 92 0 124 0 256 0
[ 1Y - 2Y [ 1 1 0 0 0 0 1 200 14 0 0 78 0 87 0
[ 2Y - 3Y [ 1 0 0 0 0 0 0 100 5 0 0 148 1 109 0
[3Y - 5Y [ 172 172 72 0 100 0 0 245 36 0 0 180 1 186 -1
[5Y - 10Y [ 476 432 432 0 0 0 0 1,968 317 1,800 -320 0 0 9 0
[10Y - more 34 34 0 0 34 0 0 0 0 0 0 0 0 0 0Tot 728 683 536 0 146 0 1 2,814 379 1,892 -320 571 2 693 -3
[ 0 - 3M [ 4,567 4,565 1,201 0 166 0 3,198 43 3 96 0 17 0 39 0
[ 3M - 1Y [ 10,756 10,657 80 0 128 19 10,430 465 11 37 -39 157 1 100 0
[ 1Y - 2Y [ 1,974 1,796 1,079 0 0 18 700 128 9 67 -21 49 1 75 -1
[ 2Y - 3Y [ 1,500 1,123 1,013 0 64 3 42 168 15 0 0 0 0 34 0
[3Y - 5Y [ 4,809 4,175 4,014 0 0 0 161 367 37 38 -2 0 0 14 0
[5Y - 10Y [ 7,144 5,864 5,465 0 0 0 400 1,277 128 65 -3 3 0 6 0
[10Y - more 4,897 2,936 985 0 0 0 1,951 300 49 1,175 -116 0 0 0 0Tot 35,648 31,116 13,837 0 358 41 16,881 2,747 253 1,478 -182 225 1 266 -2
[ 0 - 3M [ 258 87 45 0 35 0 7 1,110 44 513 -100 83 0 55 0
[ 3M - 1Y [ 534 517 15 0 496 0 6 3,337 69 664 -82 1,197 3 997 -2
[ 1Y - 2Y [ 731 447 49 0 390 0 8 4,409 307 831 -176 854 5 909 -6
[ 2Y - 3Y [ 420 261 233 0 10 0 18 3,618 430 1,081 -231 663 8 685 -5
[3Y - 5Y [ 2,732 2,167 2,146 0 0 0 21 5,607 175 3,387 -386 975 10 1,093 -11
[5Y - 10Y [ 2,582 1,623 868 0 713 0 43 4,364 913 8,580 -835 164 2 147 -2
[10Y - more 1,708 1,065 56 0 1,009 0 0 7,316 2,657 5,318 -2,130 0 0 0 0Tot 8,966 6,167 3,411 0 2,652 0 103 29,762 4,595 20,375 -3,940 3,937 27 3,886 -27
[ 0 - 3M [ 102 102 0 0 0 102 0 0 0 0 0 9 0 29 0
[ 3M - 1Y [ 303 303 0 0 0 303 0 0 0 0 0 27 0 32 0
[ 1Y - 2Y [ 54 54 0 0 3 1 51 0 0 0 0 113 2 89 -1
[ 2Y - 3Y [ 101 101 0 0 11 9 81 0 0 0 0 9 0 9 0
[3Y - 5Y [ 133 133 0 0 1 0 132 0 0 0 0 39 2 46 -3
[5Y - 10Y [ 17 16 0 0 16 0 0 0 0 0 0 0 0 0 0
[10Y - more 3 3 0 0 3 0 0 0 0 0 0 0 0 0 0Tot 713 712 0 0 34 415 263 0 0 0 0 198 4 205 -5
[ 0 - 3M [ 0 0 0 0 0 0 0 0 0 0 0 0 0 0 0
[ 3M - 1Y [ 0 0 0 0 0 0 0 0 0 0 0 0 0 0 0
[ 1Y - 2Y [ 0 0 0 0 0 0 0 0 0 0 0 0 0 0 0
[ 2Y - 3Y [ 0 0 0 0 0 0 0 0 0 0 0 0 0 0 0
[3Y - 5Y [ 0 0 0 0 0 0 0 0 0 0 0 3 1 3 -1
[5Y - 10Y [ 0 0 0 0 0 0 0 0 0 0 0 0 0 0 0
[10Y - more 0 0 0 0 0 0 0 0 0 0 0 0 0 0 0Tot 0 0 0 0 0 0 0 0 0 0 0 3 1 3 -1
[ 0 - 3M [ 0 0 0 0 0 0 0 247 5 0 0 74 1 83 0
[ 3M - 1Y [ 14 14 13 0 1 0 0 0 0 510 -15 101 1 106 0
[ 1Y - 2Y [ 7 7 0 0 7 0 0 0 0 0 0 23 1 21 0
[ 2Y - 3Y [ 26 26 0 0 26 0 0 0 0 500 -71 23 0 25 0
[3Y - 5Y [ 7 5 0 0 5 0 0 0 0 241 -107 0 0 5 0
[5Y - 10Y [ 2 2 0 0 2 0 0 0 0 0 0 0 0 0 0
[10Y - more 0 0 0 0 0 0 0 0 0 0 0 0 0 0 0Tot 56 53 13 0 40 0 0 247 5 1,251 -193 220 2 240 -2
[ 0 - 3M [ 0 0 0 0 0 0 0 41 1 0 0 22 0 30 0
[ 3M - 1Y [ 0 0 0 0 0 0 0 0 0 0 0 148 1 119 -1
[ 1Y - 2Y [ 0 0 0 0 0 0 0 0 0 0 0 266 5 254 -3
[ 2Y - 3Y [ 4 0 0 0 0 0 0 0 0 0 0 664 14 786 -14
[3Y - 5Y [ 27 11 0 0 11 0 0 0 0 0 0 245 9 175 -6
[5Y - 10Y [ 55 12 0 0 12 0 0 0 0 0 0 18 1 18 -1
[10Y - more 23 15 0 0 15 0 0 0 0 0 0 0 0 0 0Tot 109 37 0 0 37 0 0 41 1 0 0 1,364 29 1,383 -26
Greece
Ireland
Finland
France
Germany
Croatia
Hungary

2016 EU-wide Stress Test: Sovereign
(mln EUR)
Société Générale S.A.
31/12/2015
Residual Maturity Country / Region
GROSS DIRECT LONG
EXPOSURES
(accounting value gross
of provisions)
(1)
NET DIRECT EXPOSURES
(accounting value gross of provisions)
(1)
Notional value Fair-value (+) Fair-value (-) Notional value Fair-value (+)
DIRECT SOVEREIGN EXPOSURES IN DERIVATIVES (1) INDIRECT SOVEREIGN EXPOSURES (3) (on and off balance sheet)
Derivatives with positive fair value Derivatives with negative fair value Derivatives with positive fair value Derivatives with negative fair value
Notional value Fair-value (-)Notional valueof which: Loans and
receivablesof which: AFS
of which: FVO
(designated at fair
value through
profit&loss)
of which: HFT
(2)of which: HTM
Austria
[ 0 - 3M [ 133 133 0 0 133 0 0 0 0 0 0 311 1 331 -1
[ 3M - 1Y [ 1,003 981 153 0 828 0 0 0 0 0 0 1,908 11 1,945 -17
[ 1Y - 2Y [ 239 11 0 0 11 0 0 0 0 91 -5 1,436 21 478 -21
[ 2Y - 3Y [ 1,344 1,147 55 0 1,093 0 0 0 0 0 0 982 29 1,816 -36
[3Y - 5Y [ 953 684 0 0 479 20 185 0 0 181 -16 2,476 33 2,522 -37
[5Y - 10Y [ 958 2 0 0 2 0 0 0 0 0 0 1,189 55 1,190 -34
[10Y - more 770 265 0 0 265 0 0 0 0 0 0 661 78 640 -59Tot 5,399 3,223 208 0 2,811 20 185 0 0 272 -21 8,964 227 8,923 -205
[ 0 - 3M [ 0 0 0 0 0 0 0 0 0 0 0 0 0 0 0
[ 3M - 1Y [ 0 0 0 0 0 0 0 0 0 0 0 0 0 8 0
[ 1Y - 2Y [ 0 0 0 0 0 0 0 0 0 120 -24 15 0 0 0
[ 2Y - 3Y [ 0 0 0 0 0 0 0 0 0 0 0 0 0 6 0
[3Y - 5Y [ 0 0 0 0 0 0 0 0 0 75 -11 22 0 23 0
[5Y - 10Y [ 0 0 0 0 0 0 0 0 0 0 0 0 0 0 0
[10Y - more 0 0 0 0 0 0 0 0 0 0 0 0 0 0 0Tot 0 0 0 0 0 0 0 0 0 195 -35 37 1 36 -1
[ 0 - 3M [ 3 3 0 0 3 0 0 0 0 0 0 0 0 0 0
[ 3M - 1Y [ 0 0 0 0 0 0 0 0 0 0 0 0 0 0 0
[ 1Y - 2Y [ 9 9 0 0 9 0 0 0 0 0 0 47 5 45 -2
[ 2Y - 3Y [ 0 0 0 0 0 0 0 0 0 0 0 0 0 0 0
[3Y - 5Y [ 0 0 0 0 0 0 0 0 0 0 0 0 0 0 0
[5Y - 10Y [ 3 3 0 0 3 0 0 0 0 0 0 0 0 0 0
[10Y - more 8 5 0 0 5 0 0 0 0 0 0 0 0 0 0Tot 24 20 0 0 20 0 0 0 0 0 0 47 5 45 -2
[ 0 - 3M [ 0 0 0 0 0 0 0 0 0 0 0 0 0 0 0
[ 3M - 1Y [ 0 0 0 0 0 0 0 0 0 0 0 0 0 0 0
[ 1Y - 2Y [ 0 0 0 0 0 0 0 0 0 0 0 0 0 0 0
[ 2Y - 3Y [ 0 0 0 0 0 0 0 0 0 0 0 0 0 0 0
[3Y - 5Y [ 0 0 0 0 0 0 0 0 0 0 0 0 0 0 0
[5Y - 10Y [ 0 0 0 0 0 0 0 0 0 0 0 0 0 0 0
[10Y - more 0 0 0 0 0 0 0 0 0 0 0 0 0 0 0Tot 0 0 0 0 0 0 0 0 0 0 0 0 0 0 0
[ 0 - 3M [ 0 0 0 0 0 0 0 0 0 0 0 0 0 0 0
[ 3M - 1Y [ 0 0 0 0 0 0 0 0 0 0 0 0 0 0 0
[ 1Y - 2Y [ 0 0 0 0 0 0 0 0 0 0 0 0 0 0 0
[ 2Y - 3Y [ 0 0 0 0 0 0 0 0 0 0 0 9 0 9 0
[3Y - 5Y [ 0 0 0 0 0 0 0 0 0 0 0 0 0 0 0
[5Y - 10Y [ 0 0 0 0 0 0 0 0 0 0 0 0 0 0 0
[10Y - more 0 0 0 0 0 0 0 0 0 0 0 0 0 0 0Tot 0 0 0 0 0 0 0 0 0 0 0 9 0 9 0
[ 0 - 3M [ 16 13 0 0 13 0 0 813 26 2,890 -3 87 0 93 0
[ 3M - 1Y [ 56 47 0 0 47 0 0 2,181 19 1,000 -27 250 0 267 -1
[ 1Y - 2Y [ 69 21 0 0 21 0 0 348 7 2,000 -76 346 2 319 -2
[ 2Y - 3Y [ 80 8 8 0 0 0 0 1,770 126 3,229 -111 238 1 226 -2
[3Y - 5Y [ 236 205 205 0 0 0 0 8,186 491 1,350 -137 324 3 351 -4
[5Y - 10Y [ 955 788 671 0 117 0 0 0 0 1,371 -247 0 0 0 0
[10Y - more 183 5 0 0 5 0 0 0 0 962 -483 0 0 0 0Tot 1,596 1,087 884 0 203 0 0 13,298 668 12,802 -1,083 1,245 6 1,256 -8
[ 0 - 3M [ 51 51 0 0 13 38 0 186 0 0 0 5 0 5 0
[ 3M - 1Y [ 129 129 0 0 129 0 0 0 0 0 0 18 0 36 0
[ 1Y - 2Y [ 62 47 0 0 36 11 0 0 0 0 0 42 1 22 0
[ 2Y - 3Y [ 24 24 0 0 0 24 0 0 0 0 0 19 0 28 0
[3Y - 5Y [ 110 26 0 0 26 0 0 0 0 0 0 9 0 18 0
[5Y - 10Y [ 244 175 29 0 0 146 0 0 0 0 0 0 0 0 0
[10Y - more 181 181 0 0 181 0 0 0 0 0 0 0 0 0 0Tot 802 634 29 0 385 219 0 186 0 0 0 93 1 108 -1
Italy
Latvia
Lithuania
Malta
Netherlands
Poland
Luxembourg

2016 EU-wide Stress Test: Sovereign
(mln EUR)
Société Générale S.A.
31/12/2015
Residual Maturity Country / Region
GROSS DIRECT LONG
EXPOSURES
(accounting value gross
of provisions)
(1)
NET DIRECT EXPOSURES
(accounting value gross of provisions)
(1)
Notional value Fair-value (+) Fair-value (-) Notional value Fair-value (+)
DIRECT SOVEREIGN EXPOSURES IN DERIVATIVES (1) INDIRECT SOVEREIGN EXPOSURES (3) (on and off balance sheet)
Derivatives with positive fair value Derivatives with negative fair value Derivatives with positive fair value Derivatives with negative fair value
Notional value Fair-value (-)Notional valueof which: Loans and
receivablesof which: AFS
of which: FVO
(designated at fair
value through
profit&loss)
of which: HFT
(2)of which: HTM
Austria
[ 0 - 3M [ 50 50 0 0 50 0 0 0 0 0 0 149 0 62 0
[ 3M - 1Y [ 145 145 0 0 145 0 0 0 0 0 0 213 2 267 -2
[ 1Y - 2Y [ 1 1 0 0 1 0 0 0 0 0 0 544 7 561 -6
[ 2Y - 3Y [ 0 0 0 0 0 0 0 0 0 0 0 129 8 59 -22
[3Y - 5Y [ 110 110 0 0 110 0 0 0 0 0 0 531 13 532 -10
[5Y - 10Y [ 48 47 0 0 47 0 0 0 0 3,044 -648 187 12 249 -14
[10Y - more 4 3 0 0 3 0 0 0 0 0 0 38 6 23 -4Tot 356 355 0 0 355 0 0 0 0 3,044 -648 1,790 49 1,752 -58
[ 0 - 3M [ 324 324 268 0 53 0 3 0 0 0 0 0 0 3 0
[ 3M - 1Y [ 335 335 332 0 2 0 1 0 0 0 0 37 0 42 0
[ 1Y - 2Y [ 115 115 110 0 5 0 0 0 0 0 0 77 3 100 -1
[ 2Y - 3Y [ 174 174 131 0 17 0 25 0 0 0 0 33 2 6 0
[3Y - 5Y [ 467 452 452 0 0 0 0 0 0 0 0 0 0 9 0
[5Y - 10Y [ 675 675 651 0 24 0 0 0 0 0 0 0 0 0 0
[10Y - more 73 70 57 0 0 0 12 0 0 0 0 0 0 0 0Tot 2,163 2,144 2,001 0 102 0 42 0 0 0 0 147 5 160 -1
[ 0 - 3M [ 106 106 0 0 41 63 2 0 0 0 0 0 0 0 0
[ 3M - 1Y [ 11 11 0 0 11 0 0 0 0 0 0 30 0 33 0
[ 1Y - 2Y [ 43 43 0 0 25 17 0 0 0 0 0 11 0 8 0
[ 2Y - 3Y [ 12 12 0 0 0 12 0 0 0 0 0 0 0 0 0
[3Y - 5Y [ 42 42 0 0 0 42 0 0 0 0 0 13 0 16 0
[5Y - 10Y [ 151 151 102 0 0 48 0 0 0 0 0 0 0 0 0
[10Y - more 0 0 0 0 0 0 0 0 0 0 0 0 0 0 0Tot 365 365 102 0 78 183 2 0 0 0 0 54 1 57 -1
[ 0 - 3M [ 51 51 31 0 4 17 0 0 0 0 0 0 0 0 0
[ 3M - 1Y [ 40 40 0 0 40 0 0 0 0 0 0 0 0 12 0
[ 1Y - 2Y [ 9 9 0 0 9 0 0 0 0 0 0 31 0 23 -1
[ 2Y - 3Y [ 16 16 16 0 0 0 0 0 0 0 0 5 0 5 0
[3Y - 5Y [ 47 47 47 0 0 0 0 0 0 0 0 0 0 0 0
[5Y - 10Y [ 93 92 91 0 1 0 0 0 0 0 0 0 0 0 0
[10Y - more 118 117 117 0 0 0 0 0 0 0 0 0 0 0 0Tot 375 373 303 0 54 17 0 0 0 0 0 36 0 40 -1
[ 0 - 3M [ 180 180 50 0 85 31 14 0 0 0 0 352 1 197 0
[ 3M - 1Y [ 904 894 0 0 876 0 18 0 0 0 0 1,169 6 966 -5
[ 1Y - 2Y [ 523 501 51 0 14 135 301 0 0 0 0 981 14 1,043 -17
[ 2Y - 3Y [ 177 147 0 0 50 0 97 0 0 0 0 780 11 778 -11
[3Y - 5Y [ 194 32 0 0 32 0 0 0 0 0 0 846 8 949 -18
[5Y - 10Y [ 274 3 0 0 0 0 3 0 0 0 0 84 4 100 -2
[10Y - more 688 324 0 0 324 0 0 0 0 0 0 0 0 0 0Tot 2,940 2,081 101 0 1,381 166 433 0 0 0 0 4,212 43 4,034 -54
[ 0 - 3M [ 0 0 0 0 0 0 0 161 0 0 0 38 0 40 0
[ 3M - 1Y [ 0 0 0 0 0 0 0 0 0 0 0 211 1 200 -1
[ 1Y - 2Y [ 2 2 0 0 2 0 0 0 0 0 0 96 0 114 0
[ 2Y - 3Y [ 1 1 0 0 0 0 1 0 0 0 0 25 0 29 -1
[3Y - 5Y [ 3 1 0 0 0 0 1 0 0 0 0 224 4 183 -2
[5Y - 10Y [ 0 0 0 0 0 0 0 0 0 0 0 0 0 0 0
[10Y - more 0 0 0 0 0 0 0 0 0 0 0 0 0 0 0Tot 5 4 0 0 2 0 2 161 0 0 0 595 5 566 -5
[ 0 - 3M [ 267 260 216 0 44 0 0 0 0 0 0 58 0 61 0
[ 3M - 1Y [ 580 543 524 0 0 18 1 0 0 0 0 318 2 139 -1
[ 1Y - 2Y [ 124 38 32 0 0 6 0 0 0 0 0 82 1 106 -2
[ 2Y - 3Y [ 168 132 45 0 84 0 3 0 0 0 0 92 2 143 -3
[3Y - 5Y [ 880 659 151 0 508 0 0 0 0 0 0 151 5 127 -4
[5Y - 10Y [ 894 85 85 0 0 0 0 0 0 0 0 0 0 21 -1
[10Y - more 823 487 0 0 487 0 0 0 0 0 0 0 0 0 0Tot 3,737 2,205 1,053 0 1,123 24 3 0 0 0 0 701 11 597 -12
Portugal
Romania
Slovakia
Slovenia
Spain
Sweden
United Kingdom

2016 EU-wide Stress Test: Sovereign
(mln EUR)
Société Générale S.A.
31/12/2015
Residual Maturity Country / Region
GROSS DIRECT LONG
EXPOSURES
(accounting value gross
of provisions)
(1)
NET DIRECT EXPOSURES
(accounting value gross of provisions)
(1)
Notional value Fair-value (+) Fair-value (-) Notional value Fair-value (+)
DIRECT SOVEREIGN EXPOSURES IN DERIVATIVES (1) INDIRECT SOVEREIGN EXPOSURES (3) (on and off balance sheet)
Derivatives with positive fair value Derivatives with negative fair value Derivatives with positive fair value Derivatives with negative fair value
Notional value Fair-value (-)Notional valueof which: Loans and
receivablesof which: AFS
of which: FVO
(designated at fair
value through
profit&loss)
of which: HFT
(2)of which: HTM
Austria
[ 0 - 3M [ 0 0 0 0 0 0 0 0 0 0 0 9 0 9 0
[ 3M - 1Y [ 0 0 0 0 0 0 0 0 0 0 0 10 0 6 -1
[ 1Y - 2Y [ 0 0 0 0 0 0 0 0 0 0 0 32 1 33 -2
[ 2Y - 3Y [ 0 0 0 0 0 0 0 0 0 0 0 18 2 20 -1
[3Y - 5Y [ 0 0 0 0 0 0 0 0 0 0 0 0 0 4 -1
[5Y - 10Y [ 0 0 0 0 0 0 0 0 0 0 0 0 0 0 0
[10Y - more 0 0 0 0 0 0 0 0 0 0 0 0 0 0 0Tot 0 0 0 0 0 0 0 0 0 0 0 70 3 72 -4
[ 0 - 3M [ 0 0 0 0 0 0 0 0 0 0 0 0 0 0 0
[ 3M - 1Y [ 0 0 0 0 0 0 0 0 0 0 0 0 0 0 0
[ 1Y - 2Y [ 0 0 0 0 0 0 0 0 0 0 0 0 0 0 0
[ 2Y - 3Y [ 0 0 0 0 0 0 0 0 0 0 0 0 0 0 0
[3Y - 5Y [ 0 0 0 0 0 0 0 0 0 0 0 0 0 0 0
[5Y - 10Y [ 0 0 0 0 0 0 0 0 0 0 0 0 0 0 0
[10Y - more 0 0 0 0 0 0 0 0 0 0 0 0 0 0 0Tot 0 0 0 0 0 0 0 0 0 0 0 0 0 0 0
[ 0 - 3M [ 0 0 0 0 0 0 0 0 0 0 0 45 0 46 0
[ 3M - 1Y [ 3 3 0 0 0 0 3 0 0 0 0 101 0 82 -1
[ 1Y - 2Y [ 1 1 0 0 0 0 1 0 0 0 0 136 1 154 -1
[ 2Y - 3Y [ 3 3 0 0 0 0 3 0 0 0 0 118 1 105 0
[3Y - 5Y [ 3 3 0 0 0 0 3 0 0 0 0 25 0 25 0
[5Y - 10Y [ 0 0 0 0 0 0 0 0 0 0 0 0 0 0 0
[10Y - more 0 0 0 0 0 0 0 0 0 0 0 0 0 0 0Tot 10 10 0 0 0 0 10 0 0 0 0 425 2 411 -2
[ 0 - 3M [ 0 0 0 0 0 0 0 0 0 0 0 1 0 0 0
[ 3M - 1Y [ 0 0 0 0 0 0 0 0 0 0 0 24 0 0 0
[ 1Y - 2Y [ 0 0 0 0 0 0 0 0 0 0 0 40 1 51 -1
[ 2Y - 3Y [ 0 0 0 0 0 0 0 0 0 0 0 39 1 72 -1
[3Y - 5Y [ 0 0 0 0 0 0 0 0 0 0 0 9 0 0 0
[5Y - 10Y [ 0 0 0 0 0 0 0 0 0 2 -10 0 0 0 0
[10Y - more 0 0 0 0 0 0 0 0 0 0 0 0 0 0 0Tot 0 0 0 0 0 0 0 0 0 2 -10 112 2 123 -1
[ 0 - 3M [ 0 0 0 0 0 0 0 317 50 108 -7 0 0 0 0
[ 3M - 1Y [ 129 129 80 0 49 0 0 197 47 669 -21 0 0 0 0
[ 1Y - 2Y [ 146 146 64 0 7 0 74 188 39 328 -19 0 0 0 0
[ 2Y - 3Y [ 45 44 34 0 11 0 0 166 16 8 -2 0 0 0 0
[3Y - 5Y [ 109 69 69 0 0 0 0 1,293 61 250 -35 0 0 0 0
[5Y - 10Y [ 122 118 109 0 9 0 0 26 3 46 -9 0 0 0 0
[10Y - more 14 14 0 0 14 0 0 9 2 940 -112 0 0 0 0Tot 565 520 355 0 90 0 74 2,196 218 2,349 -205 0 0 0 0
[ 0 - 3M [ 181 174 0 0 174 0 0 0 0 0 0 0 0 0 0
[ 3M - 1Y [ 230 54 0 0 54 0 0 0 0 0 0 0 0 0 0
[ 1Y - 2Y [ 76 14 0 0 14 0 0 0 0 0 0 0 0 0 0
[ 2Y - 3Y [ 0 0 0 0 0 0 0 0 0 0 0 0 0 0 0
[3Y - 5Y [ 217 176 0 0 176 0 0 0 0 0 0 0 0 0 0
[5Y - 10Y [ 268 169 0 0 169 0 0 0 0 0 0 0 0 0 0
[10Y - more 14 0 0 0 0 0 0 0 0 0 0 0 0 0 0Tot 985 587 0 0 587 0 0 0 0 0 0 0 0 0 0
[ 0 - 3M [ 377 372 370 0 2 0 0 0 0 0 0 64 0 87 0
[ 3M - 1Y [ 687 681 37 0 575 70 0 2,138 442 0 0 83 1 111 -1
[ 1Y - 2Y [ 570 570 0 0 570 0 0 1,513 198 0 0 76 4 61 -1
[ 2Y - 3Y [ 340 125 0 0 125 0 0 0 0 0 0 209 5 204 -1
[3Y - 5Y [ 381 362 72 0 290 0 0 195 38 0 0 213 6 14 0
[5Y - 10Y [ 1,577 203 203 0 0 0 0 72 3 0 0 30 1 27 -1
[10Y - more 1,005 0 0 0 0 0 0 0 0 0 0 0 0 0 0Tot 4,938 2,314 682 0 1,562 70 0 3,918 681 0 0 676 16 504 -3
Liechtenstein
Iceland
Norway
Australia
Canada
Hong Kong
Japan

2016 EU-wide Stress Test: Sovereign
(mln EUR)
Société Générale S.A.
31/12/2015
Residual Maturity Country / Region
GROSS DIRECT LONG
EXPOSURES
(accounting value gross
of provisions)
(1)
NET DIRECT EXPOSURES
(accounting value gross of provisions)
(1)
Notional value Fair-value (+) Fair-value (-) Notional value Fair-value (+)
DIRECT SOVEREIGN EXPOSURES IN DERIVATIVES (1) INDIRECT SOVEREIGN EXPOSURES (3) (on and off balance sheet)
Derivatives with positive fair value Derivatives with negative fair value Derivatives with positive fair value Derivatives with negative fair value
Notional value Fair-value (-)Notional valueof which: Loans and
receivablesof which: AFS
of which: FVO
(designated at fair
value through
profit&loss)
of which: HFT
(2)of which: HTM
Austria
[ 0 - 3M [ 265 234 214 0 20 0 0 1,837 7 0 0 65 0 219 0
[ 3M - 1Y [ 1,455 614 0 0 614 0 0 919 4 873 -1 297 0 351 0
[ 1Y - 2Y [ 855 143 10 0 133 0 0 69 0 418 -2 143 0 55 0
[ 2Y - 3Y [ 581 16 16 0 0 0 0 418 2 349 -1 193 1 163 0
[3Y - 5Y [ 3,793 2,334 1,631 0 703 0 0 2,131 9 689 -3 25 0 108 0
[5Y - 10Y [ 13,948 11,847 11,742 0 105 0 0 115 0 129 -1 50 0 3 0
[10Y - more 5,557 3,035 513 2 2,520 0 0 0 0 0 0 0 0 0 0Tot 26,455 18,224 14,126 2 4,095 0 0 5,488 22 2,457 -9 772 2 900 -2
[ 0 - 3M [ 119 119 0 0 119 0 0 0 0 0 0 9 0 17 0
[ 3M - 1Y [ 42 42 17 0 24 0 0 0 0 0 0 237 1 367 -2
[ 1Y - 2Y [ 88 88 44 0 43 0 0 0 0 0 0 171 2 189 -2
[ 2Y - 3Y [ 69 69 66 0 3 0 0 0 0 0 0 51 1 28 0
[3Y - 5Y [ 131 131 113 0 18 0 0 0 0 0 0 106 2 23 -1
[5Y - 10Y [ 296 296 286 0 10 0 0 0 0 0 0 7 0 52 -2
[10Y - more 0 0 0 0 0 0 0 0 0 0 0 0 0 0 0Tot 745 745 527 0 218 0 0 0 0 0 0 581 6 676 -7
[ 0 - 3M [ 0 0 0 0 0 0 0 0 0 0 0 0 0 0 0
[ 3M - 1Y [ 0 0 0 0 0 0 0 0 0 0 0 0 0 0 0
[ 1Y - 2Y [ 0 0 0 0 0 0 0 0 0 0 0 0 0 0 0
[ 2Y - 3Y [ 5 5 5 0 0 0 0 0 0 0 0 0 0 0 0
[3Y - 5Y [ 29 29 29 0 0 0 0 0 0 0 0 0 0 0 0
[5Y - 10Y [ 0 0 0 0 0 0 0 0 0 0 0 0 0 0 0
[10Y - more 0 0 0 0 0 0 0 0 0 0 0 0 0 0 0Tot 34 34 34 0 0 0 0 0 0 0 0 0 0 0 0
[ 0 - 3M [ 180 180 16 0 164 0 0 905 0 666 -4 45 0 51 0[ 3M - 1Y [ 820 820 227 0 592 0 0 249 6 230 0 294 2 301 -2
[ 1Y - 2Y [ 310 310 51 0 167 0 92 638 50 331 -1 461 6 611 -9
[ 2Y - 3Y [ 280 280 66 0 122 0 92 168 7 164 0 402 8 146 -3
[3Y - 5Y [ 128 128 70 0 59 0 0 311 37 1,227 -5 418 9 335 -8
[5Y - 10Y [ 264 264 257 0 8 0 0 9 0 0 0 1,606 32 726 -16
[10Y - more 168 168 0 0 144 0 24 290 10 390 -28 0 0 0 0Tot 2,150 2,150 686 0 1,256 0 208 2,571 110 3,009 -39 3,226 57 2,170 -38
[ 0 - 3M [ 28 25 15 0 2 8 0 0 0 0 0 76 0 45 0[ 3M - 1Y [ 170 170 153 0 2 0 15 0 0 0 0 22 1 5 -3
[ 1Y - 2Y [ 399 393 70 0 8 0 315 0 0 0 0 78 2 83 -6
[ 2Y - 3Y [ 40 40 23 0 7 9 1 0 0 0 0 264 8 230 -8
[3Y - 5Y [ 232 223 166 0 2 8 47 0 0 0 0 323 28 221 -40
[5Y - 10Y [ 69 68 35 0 17 14 1 0 0 0 0 0 0 0 0
[10Y - more 101 97 0 0 6 0 90 0 0 0 0 0 0 0 0Tot 1,041 1,016 462 0 45 39 470 0 0 0 0 764 39 583 -57
[ 0 - 3M [ 0 0 0 0 0 0 0 0 0 0 0 69 0 61 0
[ 3M - 1Y [ 27 27 0 0 0 0 27 0 0 0 0 29 1 76 -1
[ 1Y - 2Y [ 2 2 0 0 0 0 2 0 0 0 0 9 1 47 -1
[ 2Y - 3Y [ 40 40 0 0 0 0 40 0 0 0 0 31 1 9 -1
[3Y - 5Y [ 1 0 0 0 0 0 0 0 0 0 0 50 4 6 -2
[5Y - 10Y [ 104 104 0 0 0 0 104 0 0 0 0 14 0 19 0
[10Y - more 13 13 0 0 9 0 3 0 0 0 0 0 0 0 0Tot 188 187 0 0 10 0 177 0 0 0 0 201 6 217 -5
[ 0 - 3M [ 1 1 0 0 0 0 0 0 0 0 0 0 0 32 0[ 3M - 1Y [ 465 465 0 0 440 0 25 0 0 0 0 80 4 99 -2
[ 1Y - 2Y [ 79 79 23 0 29 0 27 0 0 0 0 37 9 44 -9
[ 2Y - 3Y [ 52 52 0 0 12 0 39 0 0 0 0 22 2 31 -2
[3Y - 5Y [ 127 127 0 0 24 0 104 0 0 0 0 186 29 219 -34
[5Y - 10Y [ 479 479 0 0 20 0 459 0 0 0 0 0 0 9 -1
[10Y - more 41 41 0 0 4 0 37 0 0 0 0 0 0 18 -5Tot 1,244 1,244 23 0 530 0 691 0 0 0 0 325 43 452 -54
Latin America and the
Caribbean
Middle East
U.S.
China
Switzerland
Other advanced
economies non EEA
Other Central and eastern
Europe countries non EEA

2016 EU-wide Stress Test: Sovereign
(mln EUR)
Société Générale S.A.
31/12/2015
Residual Maturity Country / Region
GROSS DIRECT LONG
EXPOSURES
(accounting value gross
of provisions)
(1)
NET DIRECT EXPOSURES
(accounting value gross of provisions)
(1)
Notional value Fair-value (+) Fair-value (-) Notional value Fair-value (+)
DIRECT SOVEREIGN EXPOSURES IN DERIVATIVES (1) INDIRECT SOVEREIGN EXPOSURES (3) (on and off balance sheet)
Derivatives with positive fair value Derivatives with negative fair value Derivatives with positive fair value Derivatives with negative fair value
Notional value Fair-value (-)Notional valueof which: Loans and
receivablesof which: AFS
of which: FVO
(designated at fair
value through
profit&loss)
of which: HFT
(2)of which: HTM
Austria
[ 0 - 3M [ 386 386 366 0 0 0 20 0 0 0 0 2 0 1 0
[ 3M - 1Y [ 5 5 0 0 0 0 5 0 0 0 0 0 0 0 0
[ 1Y - 2Y [ 6 6 4 0 0 0 1 0 0 0 0 0 0 0 0
[ 2Y - 3Y [ 17 17 0 0 0 0 17 0 0 0 0 0 0 0 0
[3Y - 5Y [ 64 64 0 0 0 0 64 0 0 0 0 0 0 0 0
[5Y - 10Y [ 694 694 0 0 0 0 694 0 0 0 0 0 0 0 0
[10Y - more 0 0 0 0 0 0 0 0 0 0 0 0 0 0 0Tot 1,172 1,172 370 0 0 0 802 0 0 0 0 2 0 1 0
[ 0 - 3M [ 958 958 465 0 101 0 391 0 0 0 0 118 0 69 0
[ 3M - 1Y [ 269 269 76 0 66 91 36 0 0 0 0 87 1 115 -2
[ 1Y - 2Y [ 73 73 21 0 31 0 21 0 0 0 0 49 3 181 -4
[ 2Y - 3Y [ 289 273 75 0 16 0 183 0 0 0 0 108 4 84 -5
[3Y - 5Y [ 1,009 1,007 296 0 66 270 376 0 0 0 0 271 18 296 -19
[5Y - 10Y [ 1,763 1,731 746 0 14 367 604 524 53 0 0 21 3 29 -4
[10Y - more 693 684 1 0 0 220 463 19 4 0 0 0 0 0 0Tot 5,054 4,995 1,680 0 294 948 2,074 544 57 0 0 655 30 775 -34
117,476 91,277 44,867 2 19,228 4,334 22,845 66,926 7,196 53,150 -7,124 37,888 723 36,801 -715
Notes, definitions and regions:
(1) The exposures reported cover only exposures to central, regional and local governments on immediate borrower basis, and do not include exposures to other counterparts with full or partial government guarantees. Exposures to central banks should not be included here.(2) For positions in HFT this should include gross exposures (long) net of cash short positions of sovereign debt to other counterpaties only where there is a maturity matching(3) The exposures reported include the positions towards counterparts (other than sovereign) on sovereign credit risk (i.e. CDS) booked in all the accounting portfolio (on-off balance sheet). Irrespective of the denomination and or accounting classification of the positions.Other advanced non EEA: Israel, Korea, New Zealand, San Marino, Singapore,Taiwan and RussiaOther CEE non EEA: Albania, Bosnia and Herzegovina, Kosovo, FYR Macedonia, Montenegro, Serbia, and Turkey.Middle East: Yemen,United Arab Emirates,Syrian ,Sudan,Saudi Arabia,Qatar ,Oman ,Mauritania ,Libya ,Lebanon ,Kuwait ,Jordan ,Iraq ,Iran,Djibouti and Bahrain.Latin America: Venezuela,Uruguay ,Trinidad and Tobago,Suriname ,St. Vincent and the Grenadines,St. Lucia,St. Kitts and Nevis,Peru ,Paraguay ,Panama ,Nicaragua ,Mexico ,Jamaica ,Honduras ,Haiti ,Guyana ,Guatemala ,Grenada ,El Salvador,Ecuador ,Dominican Republic,Dominica ,Costa Rica,Colombia ,Chile ,Brazil ,Bolivia and Belize.Africa: South Africa, Tunisia ,Morocco ,Egypt and Algeria.
Africa
Others
Total

2016 EU-wide Stress Test - Risk exposure amounts
(mln EUR) 31/12/2015 31/12/2016 31/12/2017 31/12/2018 31/12/2016 31/12/2017 31/12/2018
Risk exposure amount for credit risk 288,475 289,745 289,930 290,139 290,916 294,835 295,937
Risk exposure amount for securitisations and re-securitisations 2,331 3,602 3,787 3,996 4,772 6,623 8,410
Risk exposure amount other credit risk 286,144 286,144 286,144 286,144 286,144 288,213 287,527
Risk exposure amount for market risk 24,394 24,837 25,066 25,264 35,394 35,786 35,786
Risk exposure amount for operational risk 43,854 43,854 43,854 43,854 45,072 48,241 49,876
Other risk exposure amounts 2 2 2 2 2 2 2
Total risk exposure amount 356,725 358,438 358,852 359,260 371,384 378,864 381,600
Baseline scenario Adverse scenario
Société Générale S.A.

2016 EU-wide Stress Test - P&L
31/12/2015 31/12/2016 31/12/2017 31/12/2018 31/12/2016 31/12/2017 31/12/2018
Net interest income (1) 9,8169,816 9,816 9,816 8,687 8,377 8,045
Interest income 23,416 23,814 24,272 24,598 25,214 25,901 25,404
(Interest expense) -13,600 -13,505 -14,222 -14,624 -16,527 -17,524 -17,360
Dividend income 59 59 59 59 59 59 59
Net fee and commission income 6,319 6,319 6,319 6,319 6,306 6,306 6,306
Gains or (-) losses on financial assets and liabilities held for trading, net 5,187 4,484 4,484 4,484 -1,125 3,363 3,363
Gains or (-) losses on financial assets and liabilities designated at fair
value through profit and loss, net1,654 -863
Other operating income not listed above, net 4,479 4,191 4,191 4,191 3,992 3,992 3,992
Total operating income, net 27,514 24,869 24,869 24,869 17,057 22,098 21,765
(Impairment or (-) reversal of impairment on financial assets not
measured at fair value through profit or loss)-2,169 -2,251 -2,008 -1,926 -3,333 -3,396 -2,963
Other income and expenses not listed above, net -19,490 -19,548 -19,548 -19,148 -20,147 -18,650 -19,550
Profit or (-) loss before tax from continuing operations 5,855 3,070 3,313 3,795 -6,424 52 -748
(Tax expenses or (-) income related to profit or loss from continuing operations) -953 -1,026 -1,159 1,898 -47 227
Profit or (-) loss after tax from discontinued operations 0 0 0 0 0 0 0
Profit or (-) loss for the year 4,359 2,118 2,286 2,636 -4,526 5 -520
Attributable to owners of the parent 4,001 1,906 2,058 2,399 -4,073 5 -473
Amount of dividends paid 1,593 712 791 970 0 0 0
Attributable to owners of the parent net of estimated dividends 2,408 1,194 1,267 1,429 -4,073 5 -473
(mln EUR)
Baseline Scenario Adverse Scenario
Société Générale S.A.
(1) Projected NII may differ from the sum of interest income and interest expenses due to the application of the cap on NII (paragraphs 308 of the methodological note).

2016 EU-wide Stress Test: Capital
(mln EUR,%) 31/12/2015 31/12/2016 31/12/2017 31/12/2018 31/12/2016 31/12/2017 31/12/2018
A OWN FUNDS 59,919 60,441 61,208 62,121 53,071 51,965 49,864
A.1 COMMON EQUITY TIER 1 CAPITAL (net of deductions and after applying transitional adjustments) 40,735 41,248 42,005 42,909 33,878 32,762 30,651
A.1.1 Capital instruments eligible as CET1 Capital (including share premium and net own capital instruments) 18,730 18,730 18,730 18,730 18,730 18,730 18,730
A.1.1.1 Of which: CET1 instruments subscribed by Government 1,008 1,008 1,008 1,008 1,008 1,008 1,008
A.1.2 Retained earnings 7,158 8,352 9,619 11,048 3,085 3,090 2,616
A.1.3 Accumulated other comprehensive income 1,581 1,581 1,581 1,581 -2,156 -2,156 -2,156
A.1.3.1 Of which: arising from unrealised gains/losses from Sovereign exposure in AFS portfolio 168 168 168 168 -1,856 -1,856 -1,856
A.1.3.2 Of which: arising from unrealised gains/losses from the rest of AFS portfolio 1,263 1,263 1,263 1,263 -449 -449 -449
A.1.4 Other Reserves 19,891 19,403 18,919 18,450 20,222 20,221 20,221
A.1.5 Funds for general banking risk 0 0 0 0 0 0 0
A.1.6 Minority interest given recognition in CET1 capital 1,355 1,413 1,475 1,540 1,108 1,109 1,083
A.1.7 Adjustments to CET1 due to prudential filters -621 -821 -821 -821 -86 -86 -86
A.1.8 (-) Intangible assets (including Goodwill) -5,975 -5,975 -5,975 -5,975 -5,975 -5,975 -5,975
(-) DTAs that rely on future profitability and do not arise from temporary differences net of associated DTLs -2,318 -2,256 -2,212 -2,085 -4,280 -4,412 -4,634
A.1.10 (-) IRB shortfall of credit risk adjustments to expected losses -759 -733 -718 -701 -744 -799 -731
A.1.11 (-) Defined benefit pension fund assets -20 -20 -20 -20 -95 -95 -95
A.1.12 (-) Reciprocal cross holdings in CET1 Capital 0 0 0 0 0 0 0
A.1.13 (-) Excess deduction from AT1 items over AT1 Capital 0 0 0 0 0 0 0
A.1.14 (-) Deductions related to assets which can alternatively be subject to a 1.250% risk weight -93 -91 -29 -23 -91 -29 -23
A.1.14.1 Of which: from securitisation positions (-) -93 -91 -29 -23 -91 -29 -23
A.1.15(-) Holdings of CET1 capital instruments of financial sector entities where the institiution does not have a significant
investment0 0 0 0 0 0 0
A.1.16 (-) Deductible DTAs that rely on future profitability and arise from temporary differences 0 0 0 0 -432 -265 -335
A.1.17 (-) CET1 instruments of financial sector entities where the institiution has a significant investment 0 0 0 0 0 0 0
A.1.18 (-) Amount exceding the 17.65% threshold 0 0 0 0 0 0 0
A.1.19 (-) Additional deductions of CET1 Capital due to Article 3 CRR 0 0 0 0 0 0 0
A.1.20 CET1 capital elements or deductions - other 0 0 0 0 0 0 0
A.1.21 Transitional adjustments 1,806 1,666 1,458 1,187 4,591 3,429 2,036
A.1.21.1 Transitional adjustments due to grandfathered CET1 Capital instruments (+/-) 0 0 0 0 0 0 0
A.1.21.2 Transitional adjustments due to additional minority interests (+/-) 569 471 246 0 369 185 0
A.1.21.3Transitional adjustments to CET1 Capital from unrealised gains/losses from Sovereign exposure in AFS portfolio (+/-
)-101 -67 -34 0 742 371 0
A.1.21.4 Transitional adjustments to CET1 Capital from unrealised gains/losses from the rest of AFS portfolio (+/-) -598 -505 -253 0 180 90 0
A.1.21.5 Other transitional adjustments to CET1 Capital 1,935 1,768 1,498 1,187 3,300 2,784 2,036
A.1.21.5.1 Of which: due to DTAs that rely on future profitability and do not arise from temporary differences 2,024 1,805 1,549 1,251 2,778 2,215 1,599
A.1.21.5.2Of which: due to DTAs that rely on future profitability and arise from temporary differences and CET1
instruments of financial sector entities where the institution has a significant investment0 0 0 0 0 0 0
A.2 ADDITIONAL TIER 1 CAPITAL (net of deductions and after transitional adjustments) 9,191 9,201 9,210 9,219 9,201 9,210 9,219
A.2.1 Additional Tier 1 Capital instruments 6,175 6,175 6,175 6,175 6,175 6,175 6,175
A.2.2 (-) Excess deduction from T2 items over T2 capital 0 0 0 0 0 0 0
A.2.3 Other Additional Tier 1 Capital components and deductions -12 -12 -12 -12 -12 -12 -12
A.2.4 Additional Tier 1 transitional adjustments 3,029 3,038 3,048 3,057 3,038 3,048 3,057
A.3 TIER 1 CAPITAL (net of deductions and after transitional adjustments) 49,926 50,448 51,215 52,128 43,078 41,972 39,871
A.4 TIER 2 CAPITAL (net of deductions and after transitional adjustments) 9,993 9,993 9,993 9,993 9,993 9,993 9,993
A.4.1 Tier 2 Capital instruments 10,677 10,677 10,677 10,677 10,677 10,677 10,677
A.4.2 Other Tier 2 Capital components and deductions -1,020 -1,020 -1,020 -1,020 -1,020 -1,020 -1,020
A.4.3 Tier 2 transitional adjustments 336 336 336 336 336 336 336
B TOTAL RISK EXPOSURE AMOUNT 356,725 358,438 358,852 359,260 371,384 378,864 381,600
B.1 Of which: Transitional adjustments included 0 0 0 0 0 0 0
C.1 Common Equity Tier 1 Capital ratio 11.42% 11.51% 11.71% 11.94% 9.12% 8.65% 8.03%
C.2 Tier 1 Capital ratio 14.00% 14.07% 14.27% 14.51% 11.60% 11.08% 10.45%
C.3 Total Capital ratio 16.80% 16.86% 17.06% 17.29% 14.29% 13.72% 13.07%
D.1 Common Equity Tier 1 Capital ratio (1) 10.91% 11.04% 11.30% 11.61% 7.89% 7.74% 7.50%
D.2 Tier 1 Capital ratio (2) 12.64% 12.76% 13.02% 13.33% 9.54% 9.37% 9.11%
D.3 Total Capital ratio (3) 15.35% 15.46% 15.71% 16.02% 12.15% 11.92% 11.64%
ETotal amount of instruments with mandatory conversion into ordinary shares upon a fixed date in the 2016 -2018 period
(cumulative conversions) (4)0 0 0 0 0 0 0
FTotal Additional Tier 1 and Tier 2 instruments eligible as regulatory capital under the CRR provisions that convert into
Common Equity Tier 1 or are written down upon a trigger event (5)0 0 0
F.1 Of which: eligible instruments whose trigger is above CET1 capital ratio in the adverse scenario (5) 0 0 0
G.1 Total leverage ratio exposures (transitional) 1,196,042 1,196,042 1,196,042 1,196,042 1,196,042 1,196,042 1,196,042
G.2 Total leverage ratio exposures (fully loaded) 1,194,805 1,194,805 1,194,805 1,194,805 1,194,805 1,194,805 1,194,805
G.3 Leverage ratio (transitional) 4.17% 4.22% 4.28% 4.36% 3.60% 3.51% 3.33%
G.4 Leverage ratio (fully loaded) 3.77% 3.83% 3.91% 4.01% 2.97% 2.97% 2.91%
(1) Fully loaded CET1 capital ratio estimation: [A.1-A.1.13-A.1.21+MIN(A.2+A.1.13-A.2.2-A.2.4+MIN(A.4+A.2.2-A.4.3,0),0)]/[B-B.1]
(2) Fully loaded T1 capital ratio estimation: [A.1-A.1.21+A.2-A.2.2-A.2.4+MIN(A.4+A.2.2-A.4.3,0)]/[B-B.1]
(3) Fully loaded Total capital ratio estimation: [A.1-A.1.21+A.2-A.2.4+A.4-A.4.3)/[B-B.1]. This ratio does not include grandfathered AT1 capital instruments meeting the conditions laid down in Article 63 of CRR and, hence, eligible as fully loaded T2 capital. Therefore, the ratio could be underestimated for banks with material instruments of such kind.
(4) Conversions not considered for CET1 computation
(5) Excluding instruments included in row E
Memorandum items
Baseline Scenario Adverse Scenario
CAPITAL RATIOS (%)
Transitional period
Société Générale S.A.
OWN FUNDS
CAPITAL RATIOS (%)
Fully loaded
TOTAL RISK EXPOSURE
AMOUNT

(mln EUR)
Of which:
defaulted
Debt securities (including at amortised cost and fair value) 64,037 0 105 105 0 100 0
Central banks 2,133 0 0 0 0 0 0
General governments 50,517 0 8 8 0 6 0
Credit institutions 6,890 0 1 1 0 1 0
Other financial corporations 1,421 0 84 84 0 82 0
Non-financial corporations 3,075 0 12 12 0 12 0
Loans and advances(including at amortised cost and fair value) 477,414 2,098 25,125 25,125 1,387 14,017 6,373
Central banks 4,770 0 13 13 0 13 0
General governments 20,976 80 97 97 12 43 31
Credit institutions 33 91 91 1 37 33
Other financial corporations 32,682 591 1,315 1,315 0 1,142 3
Non-financial corporations 211,856 564 11,022 11,022 1,126 6,224 3,139
Households 178,203 829 12,587 12,587 247 6,557 3,168
DEBT INSTRUMENTS other than HFT 541,450 2,098 25,230 25,230 1,387 14,117 6,373
OFF-BALANCE SHEET EXPOSURES 389,545 2,729 2,729 146 222 5331 For the definition of non-performing exposures please refer to COMMISSION IMPLEMENTING REGULATION (EU) 2015/227 of 9 January 2015, ANNEX V, Part 2-Template related instructions, subtitle 29
2 Insitutions report here collective allowances for incurrred but not reported losses (instruments at amortised cost) and changes in fair value of performing exposures due to credit risk and provisions (instruments at fair value other than HFT)
3 Insitutions report here specific allowances for financial assets, individually and collectively estimated (instruments at amortised cost) and changes in fair value of NPE due to credit risk and provisions (instruments at fair value other than HFT)
On non-performing
exposures3
2016 EU-wide Stress Test Information on performing and non-performing exposures
1
31/12/2015
Gross carrying amount
Accumulated impairment,
accumulated changes in fair value due
to credit risk and provisions Collaterals and
financial
guarantees
received on non-
performing
exposures
Of which performing
but past due >30 days
and <=90 days
Of which non-performing
On performing
exposures2
Société Générale S.A.

(mln EUR)
Debt securities (including at amortised cost and fair value) 0 0 0 0 0
Central banks 0 0 0 0 0
General governments 0 0 0 0 0
Credit institutions 0 0 0 0 0
Other financial corporations 0 0 0 0 0
Non-financial corporations 0 0 0 0 0
Loans and advances (including at amortised cost and fair value) 6,710 5,828 2,599 2,599 1,872
Central banks 0 0 0 0 0
General governments 0 0 0 0
Credit institutions 1 1 0 0 0
Other financial corporations 36 14 6 6 16
Non-financial corporations 3,441 3,121 1,466 1,466 1,175
Households 3,224 2,692 1,127 1,127 680
DEBT INSTRUMENTS other than HFT 6,710 5,828 2,599 2,599 1,872
Loan commitments given 152 105 7 7 511 For the definition of forborne exposures please refer to COMMISSION IMPLEMENTING REGULATION (EU) 2015/227 of 9 January 2015, ANNEX V, Part 2-Template related instructions, subtitle 30
2016 EU-wide Stress Test Information on forborne exposures
1
31/12/2015
Of which non-
performing
exposures with
forbearance
measures
Of which on non-
performing
exposures with
forbearance
measures
Gross carrying amount of exposures
with forbearance measures
Accumulated impairment, accumulated
changes in fair value due to credit risk
and provisions for exposures with
forbearance measures Collateral and financial
guarantees received on
exposures with forbearance
measures
Société Générale S.A.