2016 conservation track: a climate change vulnerability framework and interactive visualization...
TRANSCRIPT

A Climate Change VulnerabilityFramework and Interactive
Visualization Tool
Adriana C. Bejarano and Jennifer L. HorsmanResearch Planning, Inc. (RPI)

Acknowledgements
Funding for this project was provided by the U.S. Agency for International Development (USAID) through the U.S. National Park Service (NPS).
The authors would like to thank Parque Nacionales Naturales de Colombia for their significant contributions.

Research Planning, Inc. (RPI), in partnership with the National Park Service and ICF International, coordinated the development of a scoring framework and an interactive visualization tool to assesses the vulnerability of one of the Natural National Parks of Colombia to impacts associated with climate change (e.g., sea level rise, storm surge).

A climate change vulnerability framework was specifically developed for Coralesdel Rosario y San Bernardo National Natural Park (PNNCRSB), Colombia, a park designated to protect coastal and marine environments.
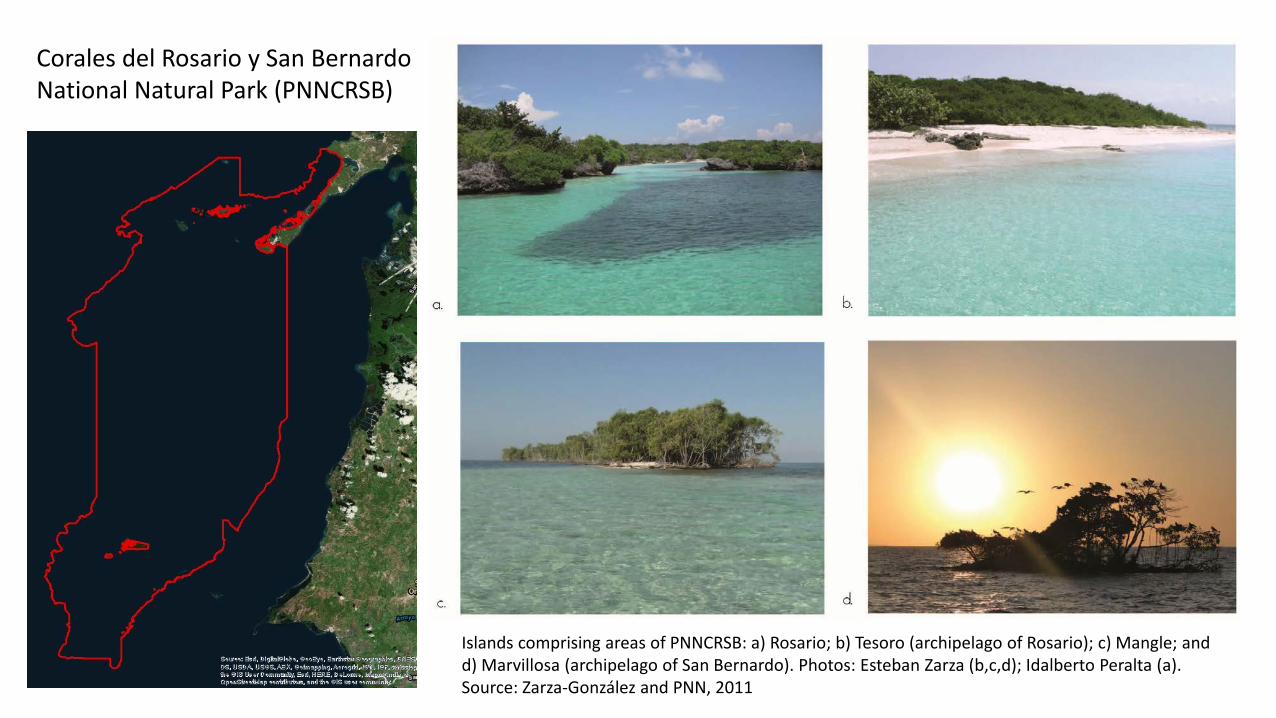
Corales del Rosario y San Bernardo National Natural Park (PNNCRSB)
Islands comprising areas of PNNCRSB: a) Rosario; b) Tesoro (archipelago of Rosario); c) Mangle; and d) Marvillosa (archipelago of San Bernardo). Photos: Esteban Zarza (b,c,d); Idalberto Peralta (a). Source: Zarza-González and PNN, 2011
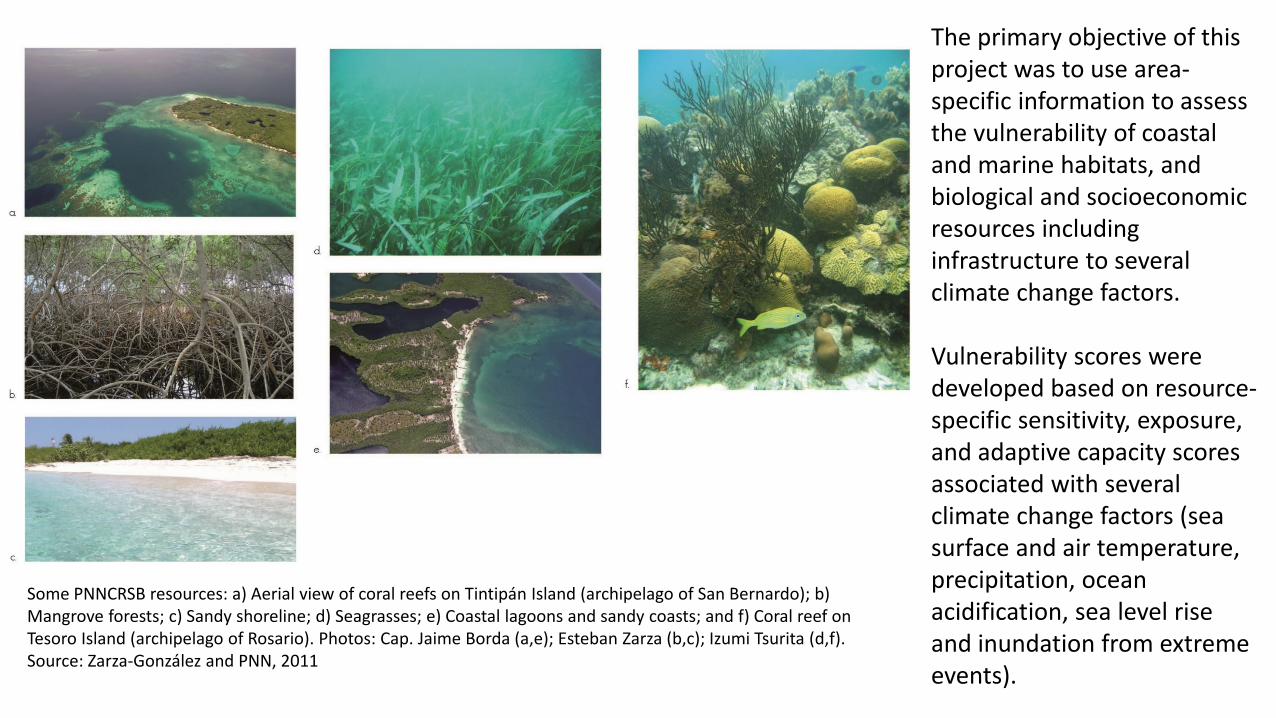
The primary objective of this project was to use area-specific information to assess the vulnerability of coastal and marine habitats, and biological and socioeconomic resources including infrastructure to several climate change factors.
Vulnerability scores were developed based on resource-specific sensitivity, exposure, and adaptive capacity scores associated with several climate change factors (sea surface and air temperature, precipitation, ocean acidification, sea level rise and inundation from extreme events).
Some PNNCRSB resources: a) Aerial view of coral reefs on Tintipán Island (archipelago of San Bernardo); b) Mangrove forests; c) Sandy shoreline; d) Seagrasses; e) Coastal lagoons and sandy coasts; and f) Coral reef on Tesoro Island (archipelago of Rosario). Photos: Cap. Jaime Borda (a,e); Esteban Zarza (b,c); Izumi Tsurita (d,f). Source: Zarza-González and PNN, 2011

The climate change vulnerability framework
Sensitivity− the extent to which a resource is susceptible or sensitive to changes induced by one or more climate change factors and is a function of resource-specific thresholds and tolerances to specific climate change factors.
Exposure− the extent to which a resource is directly and physically impacted by changes induced by one or more climate change factors. Exposure depends on the degree of exceedance of resource-specific thresholds, as well as to the degree of physical exposure experienced by the resource.
Adaptive capacity− the potential capacity of a resource to adapt, adjust or cope with changes induced by one or more climate change factors moderating, reducing or minimizing the magnitude of adverse direct effects. These include responses leading to restored essential function, identity, structure and feedbacks. Adaptive capacity could be greatly influenced by resource-specific inherent characteristics, which for the purpose of this research included: dependency; level of specialization; dispersal/movement; functional diversity; key features and uniqueness; conservation levels and status, management priority; existing threats.These and possibly other non-climate change-related characteristics may contribute to a resource’s ability to respond to climate change.
Vulnerability− the propensity or predisposition of a resource to be vulnerable or adversely impacted by climate change. Vulnerability is a function of sensitivity, exposure and adaptive capacity.

Sensitivity
RESOURCETYPE
Habitats and BiologicalResources(29 attributes)
Turtle nesting sites
Socio-economic,
infrastructure and tourism
(18 attributes)
Hotels
Sea/air temperature
Scoring supported by peer-review literature, reports and/or best
professional judgment
Exposure* Adaptive capacity Resource
TypeResource
name
Sensitivity Exposure Adaptability Final Vulnerability
ScoreS1 S2 … E4 E5 … A1 A2 …
Habitat and BiologicalResources
B1
B2
…
B29
Socio-economic,
infrastructure and tourism
Infrastructure
E1
E2
…
E18
The color scheme presented here is for illustrative purposes only
CLIMATE CHANGE VULNERABILITY SCORING EXAMPLE
Vulnerability
ScoresLOW
MODERATE
HIGH
ScoresLOW
HIGH
ScoresHIGH
MODERATE
LOW
CLIMATE CHANGE VULNERABILITY APPROACH FOR “CORALES DEL ROSARIO Y SAN BERNARDO” NATIONAL NATURAL PARK, COLOMBIA
Precipitation and
hydrological regimesOcean
acidificationSea level rise
Shoreline changes, erosion
Extreme events,
inundation
Dependency
Level of specialization
Dispersal/movement
Functional diversity
Key features, uniqueness
Existing threats
Conservation level and
status
Sea/air temperature
Precipitation and
hydrological regimesOcean
acidification
Sea level rise
Extreme events,
inundation
Birds
Corals
Mangroves
Lagoons
…
Crops
Recreational beaches
Docks
Coastal protection projects
Park’s facilities
…
* Based on resource-specific thresholds and area-specific climate change scenarios
KEY COMPONENTS OF THE CLIMATE CHANGE VULNERABILITY APPROACH

green 5-6yellow 7-8red 9-10
green 6-9yellow 10-13
red 14-18
green 7-11yellow 12-16
red 17-21
Sensitivity AdaptabilityExposuretime series2010 - 2100
Final Vulnerability Scores(Optimistic and Pessimistic
scenarios)time series 2010-2100
5 year intervals
EXPOSURE SCORES
All exposure scores change with time. For some resources, exposure is spatially dependent upon permanent inundation due to sea level rise (SLR) and temporary inundation due to storm surge.
SLR is calculated based on rates of 2.88 mm/yr and 5.64 mm/yr for optimisticand pessimistic scenarios, respectively.
Storm surge values are 20 cm and 50 cm.
Subsidence rates of -3.66 mm/yr and -7 mm/yr are included in the calculation.
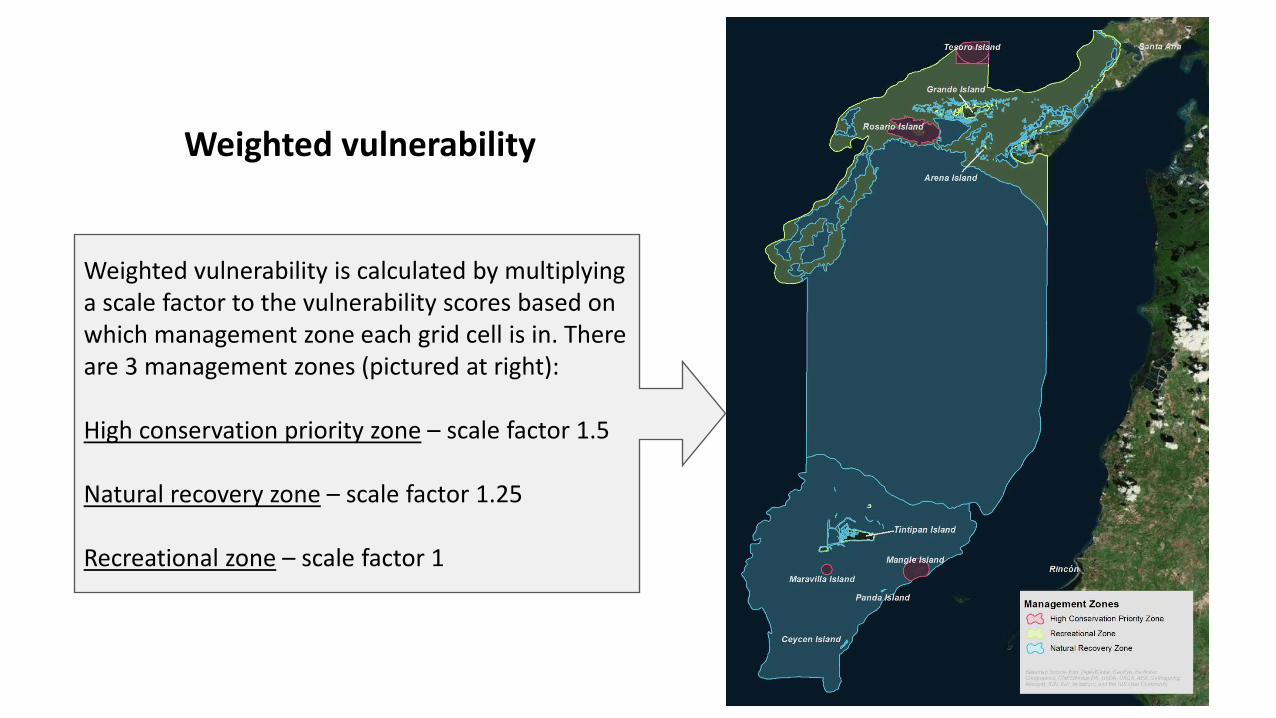
Weighted vulnerability is calculated by multiplying a scale factor to the vulnerability scores based on which management zone each grid cell is in. There are 3 management zones (pictured at right):
High conservation priority zone – scale factor 1.5
Natural recovery zone – scale factor 1.25
Recreational zone – scale factor 1
Weighted vulnerability

BirdsRocky shoresAlgaeSoft bottomsDry forestCoralsCoastal lagoonsMangrovesSea grassesSedimentsCropsVegetation mosaicRecreational beachesRecreational lagoonsShoreline protectionPNNCRSB facilitiesHousing
Topo to Raster (10 m) Magna-Sirgas Central
Assign 1 for presence and 0 for absence to all AOI
grid cells for each resource
Point Density with 10 m raster output
Buffer 30 m
Data processing steps used to develop the PNNCRSB Climate Change tool
Cell Statistics MAX+
Highest Position
VectorDatasets
SRTM 30 mDEM
Shorelines
Presence/Absence (1/0) grids for all
resourcesSea Turtles
Clip toPNNCRSB boundary
snap to DEM
Clip to buffer and PNNCRSB boundary
static scoresSensitivity scores
Adaptability scores
Sensitivity AdaptabilityExposure
time series2010 - 2100
Final Vulnerability Scores(Optimistic and Pessimistic
scenarios)time series 2010-2100
timeseries
2010-2100
Inundation due to sea level rise
0/1
Inundation due to
storm surge 0/1
Raster Calculator multiply
Exposure scores
time series2010 - 2100
Permanent inundation
scorestime series2010 - 2100
Temporary inundation
scorestime series2010 - 2100
Raster Calculator
add
Area of interest
(AOI) grid
Raster Calculator multiply
Raster Calculator
add
Highest score in each cell
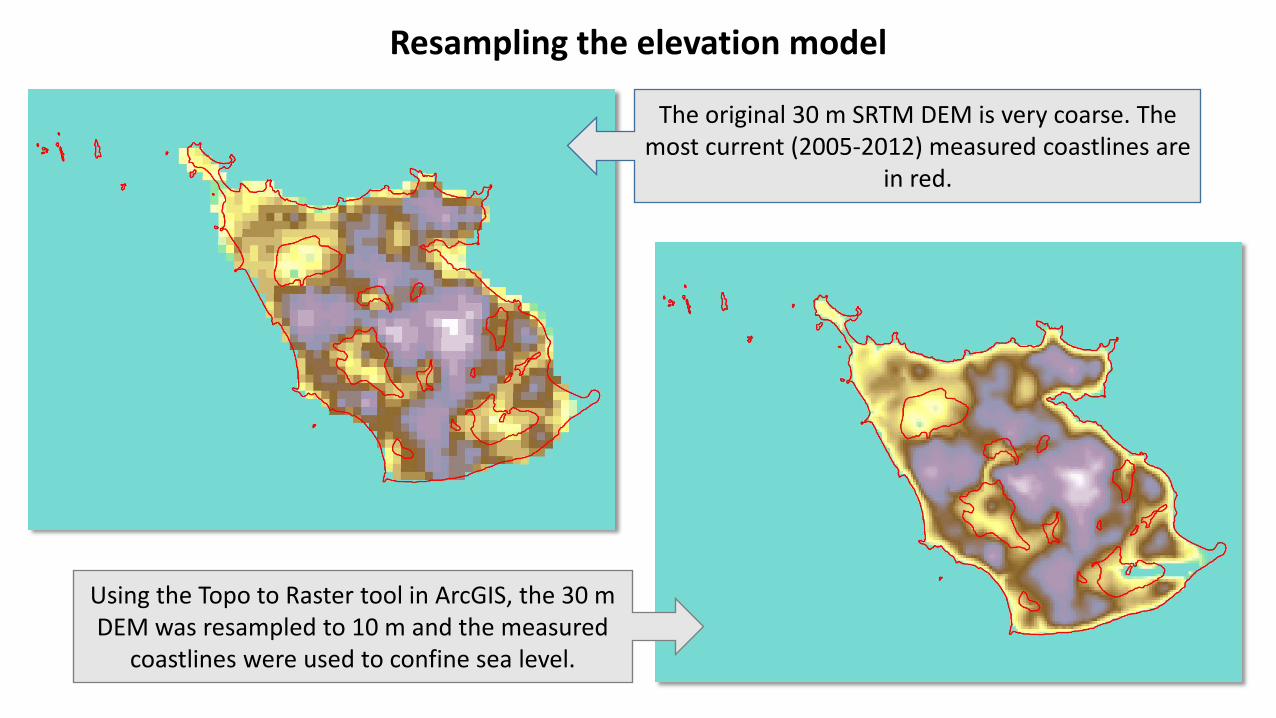
The original 30 m SRTM DEM is very coarse. The most current (2005-2012) measured coastlines are
in red.
Using the Topo to Raster tool in ArcGIS, the 30 m DEM was resampled to 10 m and the measured
coastlines were used to confine sea level.
Resampling the elevation model

The resampled 10 m zero-level contour (red lines) matches the coastline in the imagery better than those of the SRTM 30 m DEM (yellow lines).
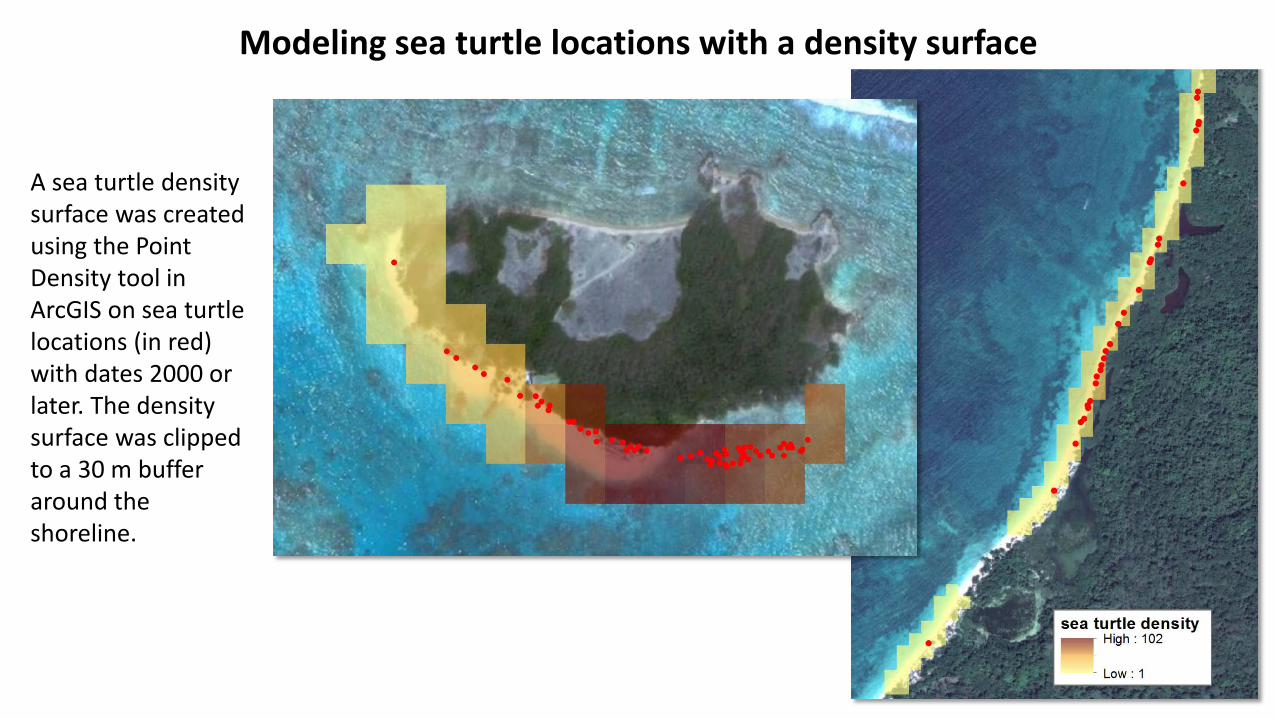
A sea turtle density surface was created using the Point Density tool in ArcGIS on sea turtle locations (in red) with dates 2000 or later. The density surface was clipped to a 30 m buffer around the shoreline.
Modeling sea turtle locations with a density surface

AOI grid colored by grid cell unique ID: 12,834,567 cells
Presence/absence grids were created for all resources based on an area of interest (AOI) grid and whether or not a resource was present (value=1) or not (value=0) in each grid cell.
Presence/absence (0/1) grids for all resources
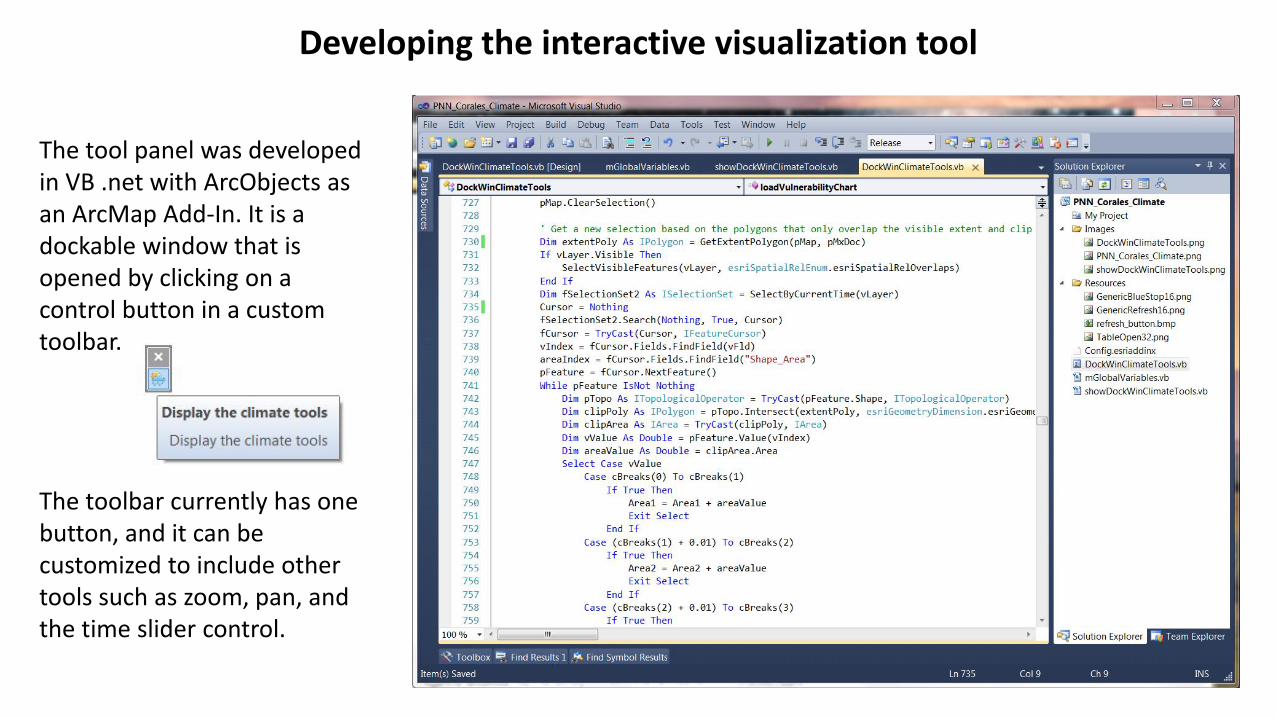
Developing the interactive visualization tool
The tool panel was developed in VB .net with ArcObjects as an ArcMap Add-In. It is a dockable window that is opened by clicking on a control button in a custom toolbar.
The toolbar currently has one button, and it can be customized to include other tools such as zoom, pan, and the time slider control.

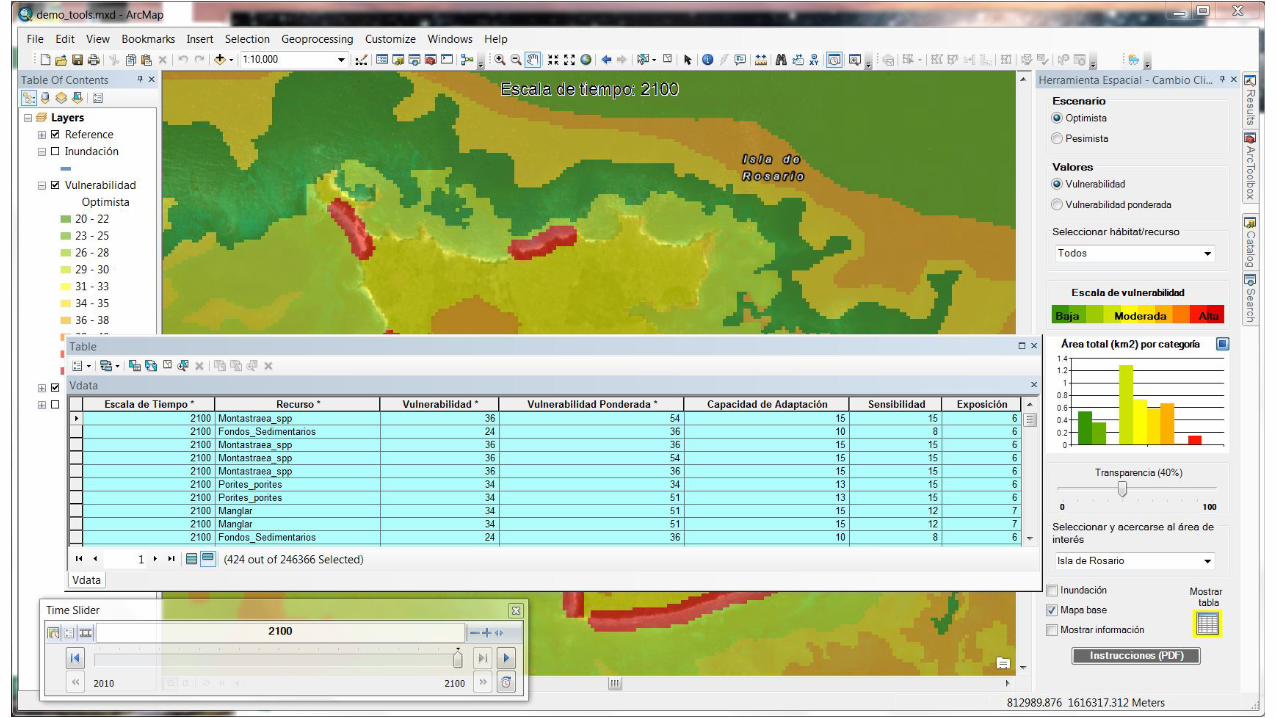


The climate change vulnerability visualization tool panel
Switch symbology between optimistic and pessimistic scenarios
Switch symbology between weighted and unweighted vulnerability scores
Select a single resource to display vulnerability values for
Vulnerability scoring scale with 10 value ranges
Chart displaying the total area covered by each score range in the visible extent
Refresh button turns
on Active View Refresh listener for
pan and zoom events
Show table of attributes for resources visible in the current extent
Change transparency value for vulnerability score layer
Select an island to zoom to
Turn on/off inundation line, base map imagery, and pop-up info window
Display PDF instructions document

Questions?Jennifer L. Horsman
Research Planning, Inc. (RPI)[email protected]
803.608.8106Paper (in press, Climate Research): A climate change vulnerability framework for
Corales del Rosario y San Bernardo National Natural Park, Colombia
http://www.researchplanning.com