2016 chicago council survey america in the age of uncertainty · in the age of uncertainty by dina...
TRANSCRIPT

America in the Age of Uncertainty
By Dina Smeltz, Ivo Daalder, Karl Friedhoff, and Craig Kafura
2 0 1 6 C H I C A G O C O U N C I L S U R V E Y
American Public Opinion and US Foreign Policy

2016 Chicago Council Survey Team
Joshua BusbyAssociate Professor of Public Affairs, The University of Texas
Karl FriedhoffFellow, Public Opinion and Foreign Policy, Chicago Council on Global Affairs
Gregory HolykSenior Research Analyst, Langer Research
Min Ji KimKorea Foundation Intern, Chicago Council on Global Affairs
Craig KafuraResearch Associate, Chicago Council on Global Affairs
Kelhan MartinIntern, Chicago Council on Global Affairs
Dina Smeltz Senior Fellow, Public Opinion and Foreign Policy, Chicago Council on Global Affairs
Lily WojtowiczIntern, Chicago Council on Global Affairs
Foreign Policy Advisory Board
Ivo Daalder President, Chicago Council on Global Affairs
Michael Desch Chair and Professor, Department of Political Science, University of Notre Dame
Daniel Drezner Professor of International Politics, The Fletcher School of of Law and Diplomacy, Tufts University
Peter Feaver Professor of Political Science and Public Policy, Duke University
Bruce Jentleson Professor of Political Science and Public Policy, Duke University
Ellen Laipson Distinguished Fellow and President Emeritus, The Stimson Center
Tod Lindberg Research Fellow, Hoover Institution
James Lindsay Senior Vice President, Director of Studies, Council on Foreign Relations
Diana MutzSamuel A. Stouffer Professor of Political Science and Communication, University of Pennsylvania
Kori SchakeResearch Fellow, Hoover Institution
James Steinberg University Professor, Maxwell School of Citizenship and Public Affairs, Syracuse University
The Chicago Council on Global Affairs is an independent, nonpartisan organization. All statements of fact and expressions of opinion contained in this report are the sole responsibility of the author and do not necessarily reflect the views of the Chicago Council on Global Affairs or of the project funders.
Copyright © 2016 by the Chicago Council on Global Affairs.All rights reserved.
Printed in the United States of America.
This report may not be reproduced in whole or in part, in any form (beyond that copying permitted by sections 107 and 108 of the US Copyright Law and excerpts by reviewers for the public press), without written permission from the publisher. For further information about the Chicago Council or this study, please write to the Chicago Council on Global Affairs, Prudential Plaza, 180 North Stetson Avenue, Suite 1400, Chicago, Illinois 60601, or visit thechicagocouncil.org.

1
TABLE OF CONTENTS
EXECUTIVE SUMMARY
2
INTRODUCTION
8CHANGING DEMOGRAPHICS, IMMIGRATION, AND SECURITY FEARS
10
THE CONSEQUENCE OF GLOBAL ECONOMICS
19
AMERICANS REMAIN COMMITTED TO WORLD ENGAGEMENT
25APPENDIX
35
METHODOLOGY
37
ABOUT THE SURVEY SAMPLE
40ABOUT THE SURVEY
41

2 America in the Age of Uncertainty: 2016 Chicago Council Survey
EXECUTIVE SUMMARY
Over the past year, Donald Trump has been able to channel the anxieties of a significant segment of the
American public into a powerful political force, taking him to the doorstep of the White House. These
public anxieties stem from growing concerns about the effects of globalization on the American economy
and about the changing demographics of the United States.
Although Trump has been able to mobilize many of those who are most concerned about these
developments, their motivating concerns are not new. They existed before Donald Trump entered the
race, and they are likely to persist even if he loses the election in November 2016. Yet, uniquely
among the candidates running for president this cycle, Trump has given voice to this group of Americans,
notably through his tough stances on immigration and trade.
At the same time, while this segment of the American public has given Donald Trump traction in the
presidential race, his views on important issues garner only minority support from the overall American
public. While they are divided on expanding a wall on the US border with Mexico, Americans overall
support continued immigration into the United States and favor reform to address the large population of
unauthorized immigrants already in the country. Americans overall think globalization is mostly good for
the United States, and they see many benefits to free trade. And the American public as a whole—including
the core supporters of Donald Trump—still favors the country’s traditional alliances, a shared leadership
role for the United States abroad, and the preservation of US military superiority.
CORE TRUMP SUPPORTERS” ARE THOSE IN THE SAMPLE WHO SAID THAT DONALD TRUMP WAS THEIR “TOP CHOICE FOR PRESIDENT” AMONG A LIST INCLUDING THE FOLLOWING CANDIDATES: HILLARY CLINTON, DONALD TRUMP, BERNIE SANDERS, JEB BUSH, TED CRUZ, AND JOHN KASICH.
Trump’s Core Support Is Based on Immigration and TradeTrump’s rhetoric on immigrants and refugees has most clearly struck a chord with his base. On each and
every question concerning immigration, Trump’s core supporters are the least favorable. An overwhelming
majority of core Trump supporters agree that immigration is a critical threat to the United States—
almost double the percentage among the general public (43%, see Figure A). Six in ten Trump supporters
believe that illegal immigrants in the United States should be forced to leave their jobs and the United
States (63%). And nine in ten Trump supporters support expanding the wall on the border with Mexico (92%).
The public overall is divided on expanding the wall, and 58 percent support a pathway to citizenship
for illegal immigrants.

3Executive Summary
Figure A: More Trump Supporters See Immigration as a Critical Threat
Republicans
Core Trump supporters
40
67
Independents
Democrats 27
80
Below is a list of possible threats to the vital interest of the United States in the next 10 years. For each one, please select whether you see this as a critical threat, an important but not critical threat, or not an important threat at all. Large numbers of immigrants and refugees coming into the US (% critical threat)n = 1,728
Overall
43
2016 Chicago Council Survey
Core Trump supporters express similar levels of fear about Islamic fundamentalism as Republicans
among the general public. However, they are more unfavorable than other Republicans in their views of
Middle Eastern immigrants and are less likely to favor admitting refugees from Syria into the United
States (Figure B).
RepublicansIndependentsDemocrats
42
42
32
Figure B: A Record Percentage of Republicans See Islamic Fundamentalism as a Critical Threat
2016 Chicago Council Survey
Below is a list of possible threats to the vital interest of the United States in the next 10 years. For each one, please select whether you see this as a critical threat, an important but not critical threat, or not an important threat at all. Islamic fundamentalism (% critical threat)n = 1,715
70
57
59
33
37
50
38
39
56
32
36
60
42
35
54 54
35
31
38
35
4856
48
66
57
49
75
1998 2002 2004 2006 2008 2010 2012 2014 2015 2016

4 America in the Age of Uncertainty: 2016 Chicago Council Survey
Concerns about immigration reinforce economic worries, which are also reflected in the views of core
Trump supporters. Trump backers are the least likely to support globalization (Figure C) and to say that
free trade has been good for the US economy, for consumers like them, or for their own standard of living.
They are also least likely to support the Trans-Pacific Partnership trade deal and the most likely to say
the next generation of Americans will be economically worse off than adults today.
Negative Feelings toward Immigration and Trade Are Not New and Do Not Reflect the Majority ViewWhile Trump supporters are the most stridently opposed to immigration and are the least likely to support
free trade today, these sentiments are not new. Nor are they the majority viewpoint among Americans,
who generally support both immigration and trade.
The Chicago Council results reflect partisan differences on these issues over many seasons. Since 1998,
a majority of Republicans have consistently said that immigration is a critical threat to the United States,
which, at 67 percent, is at a peak today (Figure D). In contrast, beginning in 2002, Democrats’ concerns
about immigration steadily decreased, with just 27 percent of Democrats saying it poses a critical threat
in 2016. Given this wide disparity, as Figure A demonstrates, only a minority of Americans (43%) see
immigration as a threat to the United States. And an overall majority of Americans say that illegal immigrants
currently working in the United States should be allowed to stay and pursue a path to citizenship (58%).
Overall
65
Figure C: Trump Supporters Are Less Likely Than Republicans Overall to See Globalization as Good
Republicans
Core Trump supporters
74
61Independents
Democrats
59
49
2016 Chicago Council Survey
Do you believe that globalization, especially the increasing connections of our economy with others around the world, is mostly good or mostly bad for the United States? (% mostly good)n = 2,061

5Executive Summary
Similarly, since 2008, Republicans have consistently expressed more negative views than Democrats on
globalization and trade. While the gap between Republicans and Democrats on support for globalization
has grown from four percentage points in 2006 to 15 percentage points in 2016, this should not detract
from the fact that overall two in three Americans continue to favor globalization (Figure E).
1998 2002 2004 2006 2008 2010 2012 2014 2015 2016
RepublicansIndependentsDemocrats
56
51
58
Figure D: Republicans Are Most Likely to Say Immigration Is a Critical Threat to the United States
2016 Chicago Council Survey
Below is a list of possible threats to the vital interest of the United States in the next 10 years. For each one, please select whether you see this as a critical threat, an important but not critical threat, or not an important threat at all: Large numbers of immigrant and refugees coming into the United States (% critical threat) n = 1,728
58 57
62 62
50
49
63
44
46
63
44
47
62
51
41
64
46
29
55
40
30
55
42
21
67
40
27
RepublicansIndependentsDemocrats
57
52
55
Figure E: Democrat and Republican Views on Globalization Have Diverged Do you believe that globalization, especially the increasing connections of our economy with others around the world, is mostly good or mostly bad for the United States? (% mostly good) n = 2,061
55
5558
56
6465
6258
61
65
52
65
52
66
515655
64
59
74
62 61
74
59
1998 2002 2004 2006 2008 2010 2012 2014 2016
2016 Chicago Council Survey
6 America in the Age of Uncertainty: 2016 Chicago Council Survey
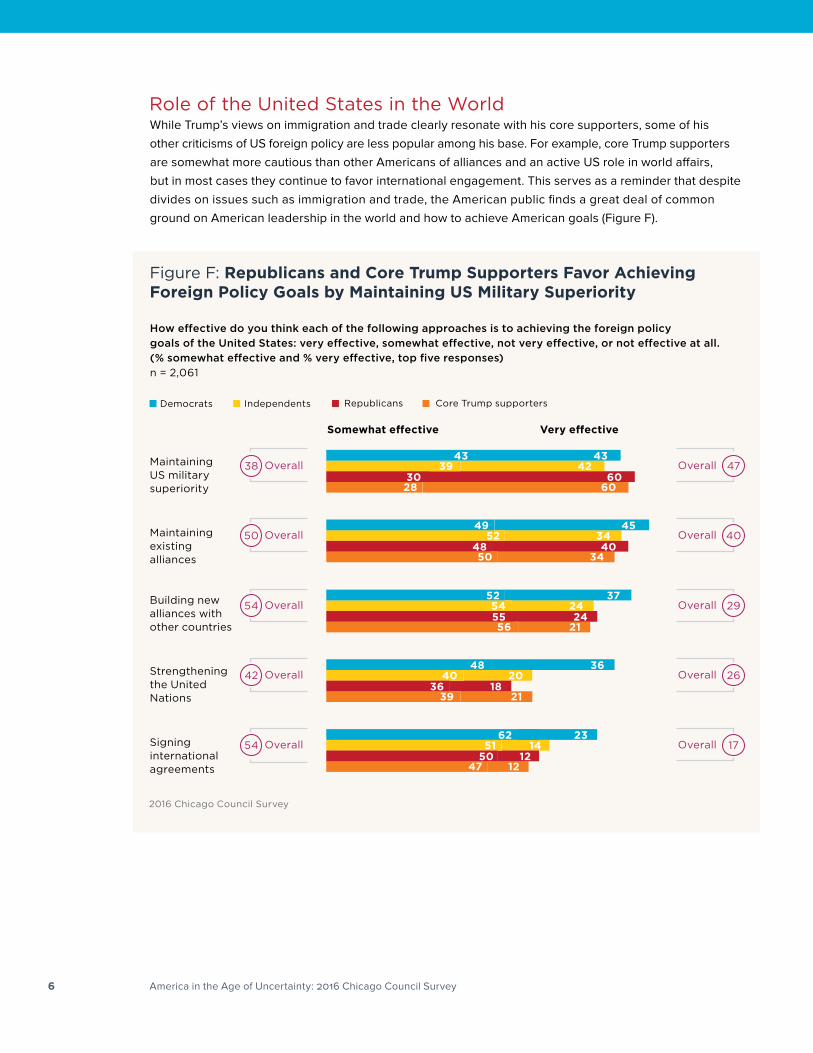
Role of the United States in the WorldWhile Trump’s views on immigration and trade clearly resonate with his core supporters, some of his
other criticisms of US foreign policy are less popular among his base. For example, core Trump supporters
are somewhat more cautious than other Americans of alliances and an active US role in world affairs,
but in most cases they continue to favor international engagement. This serves as a reminder that despite
divides on issues such as immigration and trade, the American public finds a great deal of common
ground on American leadership in the world and how to achieve American goals (Figure F).
Figure F: Republicans and Core Trump Supporters Favor Achieving Foreign Policy Goals by Maintaining US Military Superiority
4342
6060
2016 Chicago Council Survey
How e�ective do you think each of the following approaches is to achieving the foreign policy goals of the United States: very e�ective, somewhat e�ective, not very e�ective, or not e�ective at all. (% somewhat e�ective and % very e�ective, top five responses)n = 2,061
Overall 47
RepublicansIndependentsDemocrats Core Trump supporters
Maintaining US military superiority
453440
34
Overall 40Maintaining existing alliances
372424
21
Overall 29Building new alliances with other countries
3620
1821
Overall 26Strengthening the United Nations
2314
1212
4339
3028
4952
4850
52545556
4840
3639
6251
5047
Overall 17
Overall38
Overall50
Overall54
Overall42
Overall54Signing international agreements
Somewhat e�ective Very e�ective

7
ConclusionFuture political candidates may not be able to recreate Trump’s success in conveying the public’s
grievances, but the political winds that have brought Trump to the edge of the presidency will persist.
Therefore, it is crucial to understand what these grievances suggest about the United States. Economic
recovery has been uneven. The breadth and pace of diversity is increasing, creating discomfort among
some segments of American society—especially among those most isolated from these changes.1
And many Americans find themselves affected by decisions made by people who do not seem to take
their views or anxieties seriously.
The changing demographic makeup of America will likely transform the political dynamics, given that
younger and non-white Americans are more supportive of globalization, immigration, and increasing ties
to the world. But in the near term, the attitudes and opinions that brought Trump to the fore of American
politics will remain—and could very well strengthen.
Executive Summary

8 America in the Age of Uncertainty: 2016 Chicago Council Survey
INTRODUCTION
The rise of Donald Trump to the Republican Party nomination shocked the political establishment and
has dramatically reshaped the contours of the 2016 election. Key to his political success has been his ability
to reflect the anxieties of Americans who have felt ignored by politicians and policymakers. The 2016
Chicago Council Survey shows that among this portion of the American public, concerns over changing
demographics and economics have built into a potent political force.
While Bernie Sanders also managed to rally a type of “outsider” success in this election cycle, the 2016
Survey found that self-described Democrats share a fairly coherent view on foreign policy regardless of
who they supported in the primaries. For this reason, this report focuses on ways that Donald Trump’s
campaign seems to have disrupted the traditional Republican party platform by channeling his supporters’
hard-line focus on immigration and—to a lesser extent—opposition to globalization.
Trump’s rise to prominence has occurred as white Americans find themselves on the path to becoming
a minority within the overall population for the first time in the nation’s history. Diversity is on the rise, and
so too is the foreign-born population—three-quarters of which come from Asia, Mexico, or other Latin
American countries.2 From 2000 to 2012, America’s foreign-born population increased from 31.1 million to
40.7 million.3 As a percentage of the total population, the foreign-born population has more than doubled,
from 5.4 percent in 1960 to 13 percent in 2012. White Americans are now expected to become a minority
before 2040.4
A Public Religion Research Institute/Brookings survey conducted in 2016 finds that while 78 percent
of Americans are comfortable with the prospect of a majority non-white nation, the minority who express
concern has grown from 14 percent in 2013 to 21 percent in 2016.5 Discomfort with the prospect
of increasing diversity is highest among core Trump supporters (34%), an opinion shared by 28 percent of
Republicans, 20 percent of Democrats, and 18 percent of Independents. Americans are also closely
divided between those who think that immigrants today strengthen the United States because of their
hard work and talents (47%) and those who believe immigrants are a burden on the country because
they take jobs, housing, and healthcare (43%). Majorities of core Trump supporters (80%) and Republicans
(65%) describe immigrants as a burden, while only minorities of Independents (41%) and Democrats (27%)
say the same.
However, Trumpism only reaches so far. American support for US engagement in the world remains
remarkably stable and cross-partisan. The US public also remains united around combatting a similar set
of top threats, including terrorism and nuclear proliferation. Americans of both parties share a similar
view of how to deal with Russian and Chinese power, and both support the US military presence in key
allied countries such as Japan and South Korea. And cross-partisan majorities favor a continued shared
leadership role for the United States internationally.
In the future, other candidates may not be able to recreate Trump’s success in tapping into the anxieties
of a discontented minority of the electorate. But his triumph in securing the nomination of a major
US political party can be better understood by examining the public opinion context that led to this
political moment.

9
% of respondentsn = 345
2016 Chicago Council Survey
18–29
30–44
45–59
60+
High school grad or less
Some college/ associate’s degree
College graduates
16
27
27
30
49
20
31
$0–20K
$20–40K
$40–75K
$75–125K
$125K+
White, non-Hispanic
Black, non-Hispanic
Other, non-Hispanic
Hispanic
88
1
6
5
13
21
25
29
13
Republican
Liberal
Moderate
Conservative
59
3
15
40
Independent
Liberal
Moderate
Conservative
33
2
19
11
Democrat
Liberal
Moderate
Conservative
8
1
7
1
Education
Age Ethnicity Party identification
Household income
Male
Female
52
48
Gender
Introduction
Spotlight: Characteristics of Core Trump SupportersThe media has made much of the demographics of Trump supporters—white, older, lesser educated,
rust belt residents—in an effort to explain their attraction to Donald Trump’s oratory about a rigged
economic system. Conventional wisdom has become that “working class islands of economic discontent”6
have borne the brunt of the US and global economic transformation and thus are attracted to an
outsider who says he feels their pain.
The Chicago Council Survey finds that the demographics of Trump supporters match some of these
features, at least on the surface. Nearly nine in ten identify themselves as white, similar to Republicans
overall (82% white). This is notably more white than the US general public overall (65% white) or
Democrats (49% white). Core Trump supporters also stand out in educational attainment. While 30 percent
of the overall American public and 32 percent of Republicans report having a bachelor’s degree or
higher, just two in ten (20%) of core Trump supporters state the same.
Although the racial and age demographics line up with a story of a dispossessed white working class,
the income levels of Trump supporters call the working class storyline into question. The Chicago
Council Survey finds that core Trump supporters’ income levels are comparable to overall American
incomes, though lower than other Republicans.

10 America in the Age of Uncertainty: 2016 Chicago Council Survey
CHANGING DEMOGRAPHICS, IMMIGRATION, AND SECURITY FEARS
While the candidates disagree over many key points of US foreign policy matters in this election, the
most strident divide strikes at the very heart of American identity. In a country populated by immigrants
from every corner of the globe, what it means to be American has long been a prominent feature
of political debate. Donald Trump has promised to expand the 700-mile wall along the US border with
Mexico to prevent illegal immigration and has proposed a temporary ban on Muslim immigrants.7
In contrast, Hillary Clinton has said she would accept an even greater number of Syrian refugees than
President Obama has pledged and that she will work for comprehensive immigration reform.8 With
such stark differences among the candidates on an issue that touches on both domestic and foreign
policy, the debate on America’s openness to immigration—and to the world—is now a core issue in
the presidential campaign.9
The Great Immigration DivideAn overwhelming majority of core Trump supporters agree that immigration is a critical threat to the
United States—almost double the percentage among the general public (Figure 1; Figure 2). And on each
and every question concerning immigration, Trump’s core supporters are the most unfavorable in
their views; for example, eight in ten believe that controlling and reducing illegal immigration is a very
important foreign policy goal for the United States—significantly more than Republicans, Democrats,
Independents, and the general public.
Figure 1: More Trump Supporters See Immigration as a Critical Threat
Republicans
Core Trump supporters
40
67
Independents
Democrats 27
80
Below is a list of possible threats to the vital interest of the United States in the next 10 years. For each one, please select whether you see this as a critical threat, an important but not critical threat, or not an important threat at all. Large numbers of immigrants and refugees coming into the US (% critical threat)n = 1,728
Overall
43
2016 Chicago Council Survey

11Changing Demographics, Immigration, and Security Fears
Figure 2: More Trump Supporters Prioritize Controlling and Reducing Illegal Immigration as a Goal
2016 Chicago Council Survey
Republicans
Core Trump supporters
31
40Independents
Democrats
68
83
Below is a list of possible foreign policy goals that the United States might have. For each one please select whether you think that it should be a very important foreign policy goal of the United States. Controlling and reducing illegal immigration (% very important goal)n = 782
Overall
45
Trump’s success in rousing support for his anti-immigration policy proposals is best understood in the
context of public opinion changes that have taken place over the past two decades. From 1998 to
2002, similarly sized majorities of Democrats, Republicans, and Independents viewed large numbers of
immigrants and refugees as a critical threat, and they saw controlling and reducing illegal immigration
as a very important goal. But beginning in 2002, Democrats’ concerns steadily decreased. By 2016, threat
perceptions of immigration among Democrats had dropped by 35 percentage points (Figure 3).
1998 2002 2004 2006 2008 2010 2012 2014 2015 2016
RepublicansIndependentsDemocrats
56
51
58
Figure 3: More Republicans See Immigration as a Critical Threat
2016 Chicago Council Survey
Below is a list of possible threats to the vital interest of the United States in the next 10 years. For each one, please select whether you see this as a critical threat, an important but not critical threat, or not an important threat at all: Large numbers of immigrant and refugees coming into the United States (% critical threat) n = 1,728
58 57
62 62
50
49
63
44
46
63
44
47
62
51
41
64
46
29
55
40
30
55
42
21
67
40
27

12 America in the Age of Uncertainty: 2016 Chicago Council Survey
Donald Trump in Step with Republican Public on Immigration As evidenced by the past two decades of Chicago Council Surveys, the topic of immigration has been a
hot-button issue for Republican voters for quite some time. But the same has not been true for Republican
opinion leaders. A 2014 Chicago Council Survey of foreign policy opinion leaders found that among
Republican opinion leaders, immigration was ranked the lowest among potential threats (16%, see Figure
5). Similarly, as a foreign policy goal, Republican opinion leaders rated controlling and reducing illegal
immigration one of the least important goals (20%, very important goal).
Trump has capitalized on these preexisting gaps between Republican leaders and the Republican public
and between Democrats and Republicans. His claims about Mexican immigrants being “criminals” and
“rapists”10 and his proposals to build a wall on the border with Mexico are controversial to many. But they
channel the concerns of a significant portion of the public. As shown in Figure 1, core supporters of
Trump express even greater concern about immigration than the average Republican.
This concern is not limited to illegal immigration. When it comes to legal immigration, Trump’s core
supporters also take the least accommodating view. Among this group, 70 percent say that legal
immigration should be decreased, compared with 53 percent of Republicans, 41 percent of Independents,
and 26 percent of Democrats.
1998 2002 2004 2006 2008 2010 2012 2014 2015 2016
RepublicansIndependentsDemocrats
57
5453
Figure 4: Republicans and Democrats are Divided on the Importance of Controlling and Reducing IIlegal Immigration
2016 Chicago Council Survey
Below is a list of possible foreign policy goals that the United States might have. For each one please select whether you think that it should be a very important foreign policy goal of the United States: Controlling and reducing illegal immigration (% very important goal)n = 782
7271
67
56
57
71
53
53
70
56
52
75
60
46
73
48
43
70
50
35
61
55
36
66
40
31
68
Republicans, for their part, are now more likely than at any other time to say that immigrants and
refugees are a critical threat. Similarly, the percentage of Republicans who say that controlling and reducing
immigration is a very important goal has risen to 68 percent, from 61 percent just two years ago
(Figure 4). The gaps between Republicans and Democrats on these two indicators now stand at roughly
40 percentage points—both historic highs.

13Changing Demographics, Immigration, and Security Fears
Rising Concerns about Islamic Fundamentalism The increase in the Republican public’s concern about immigration since 2014 is likely related to increased
media attention to the topic during the primary campaigns, especially since it has become a signature
issue for Trump. In addition, Donald Trump has managed to blend fears about terrorism and immigration,
saying in an August foreign policy speech, “The common thread linking the major Islamic terrorist
attacks that have recently occurred on our soil—9/11, the Ft. Hood shooting, the Boston Bombing, the San
Bernardino attack, the Orlando attack—is that they have involved immigrants or the children of immi-
grants. Clearly new screening procedures are needed.”11
Americans express increased concern about the threats posed by both international terrorism (75% in 2016,
up from 69% in 2015) and Islamic fundamentalism (59% in 2016, up from 55% in 2015). The public now
views these as among the top three threats (along with nuclear proliferation) facing the United States
(Figure 6). This makes sense given the context in which the 2016 Chicago Council Survey was fielded—
in close proximity to the Orlando shooting and several other high-profile attacks in the United States and
Europe which many linked to violent Islamic extremist groups.
Figure 5: Public Expresses Greater Concern over Immigration than Opinion Leaders
431
40
20
968
427
40
16
967
Note: Republican, Democrat, and Independent leader opinions from the 2014 leader survey. Public opinions from the 2016 Chicago Council Survey.
2016 Chicago Council Survey
Below is a list of possible threats to the vital interest of the United States in the next 10 years. For each one, please select whether you see this as a critical threat, an important but not critical threat, or not an important threat at all:n = Public 1,728, Leaders 635
Below is a list of possible foreign policy goals that the United States might have. For each one please select whether you think that it should be a very important foreign policy goal of the United States, a somewhat important foreign policy goal, or not an important goal at all:n = Public 782, Leaders 642
Overall public
Overall public
45Controlling and reducing illegal immigration (% very important goal)
Large numbers of immigrants and refugees coming to the US (% critical threat)
43
Democratic leaders
Democratic public
Independent public
Republican leaders
Independent leaders
Republican public

14 America in the Age of Uncertainty: 2016 Chicago Council Survey
WHILE ONLY 23 PERCENT OF AMERICANS OVERALL SAY THAT LIMITING THE FLOW OF MIGRANTS AND REFUGEES IS ALWAYS EFFECTIVE, TWICE AS MANY CORE TRUMP SUPPORTERS SAY THAT SUCH LIMITS ARE ALWAYS EFFECTIVE.
Figure 6: The Top Five Critical Threats According to . . .
1
2
International terrorism
83%
Islamic fundamentalism
75%2 North Korea's
nuclear program
64%2 The possibility of
unfriendly countries becoming nuclear powers
57%
1 International terrorism
74%
1 International terrorism
71%
5 North Korea's nuclear program
63%5 An international
financial crisis
50%5 An international
financial crisis
49%
4 The possibility of unfriendly countries becoming nuclear powers
66%
4 Climate change
57%4 North Korea's
nuclear program
52%
3 Large numbers of immigrants and refugees coming into the United States
67%
3 The possibility of unfriendly countries becoming nuclear powers
60%
3 Islamic fundamentalism
57%
Below is a list of possible threats to the vital interest of the United States in the next 10 years. For each one, please select whether you see this as a critical threat, an important but not critical threat, or not an important threat at all: (% critical threat)n varies
RepublicansDemocrats Independents
1
2
International terrorism
83%
Large numbers of immigrants and refugees coming into the United States
80%
5 North Korea's nuclear program
62%
4 The possibility of unfriendly countries becoming nuclear powers
68%
3 Islamic fundamentalism
76%
Core Trump supporters
2016 Chicago Council Survey

15
While Republicans and Democrats agree that terrorism is a critical threat, they express differing levels of
concern about Islamic fundamentalism. Today, three in four Republicans believe that Islamic fundamentalism
poses a critical threat—the highest point since the question was first asked in 1998, even higher than
after the September 11 attacks (Figure 7). In contrast, only half of Democrats identify Islamic fundamentalism
as a critical threat. Core Trump supporters (76%) are similar to Republicans overall on this question.
RepublicansIndependentsDemocrats
42
42
32
Figure 7: A Record Percentage of Republicans See Islamic Fundamentalism as a Critical Threat
2016 Chicago Council Survey
Below is a list of possible threats to the vital interest of the United States in the next 10 years. For each one, please select whether you see this as a critical threat, an important but not critical threat, or not an important threat at all. Islamic fundamentalism (% critical threat)n = 1,715
70
57
59
33
37
50
38
39
56
32
36
60
42
35
54 54
35
31
38
35
4856
48
66
57
49
75
1998 2002 2004 2006 2008 2010 2012 2014 2015 2016
Changing Demographics, Immigration, and Security Fears
Partisan Differences Toward Middle Eastern ImmigrantsPolls have shown that Americans generally oppose Trump’s proposal for a temporary ban on Muslims
from other countries entering the United States.12 The Chicago Council Survey did not ask about a
specific ban, but it did ask about the effectiveness of limiting the flow of migrants and refugees as a way
to combat terrorism. While only 23 percent of Americans overall say that limiting the flow of migrants
and refugees is always effective, twice as many core Trump supporters (47%) say that such limits are always
effective. Most other methods of combatting terrorism, including airstrikes, drone strikes, sending
US troops, and blocking financing, are deemed effective by majorities across political affiliations.13
When asked more specifically about various groups of immigrants, Americans overall are roughly divided
on Middle Eastern immigrants, with 45 percent holding a favorable view and 52 percent an unfavorable
view. These views help to explain why only 36 percent of the overall US public favors accepting Syrian
refugees into the United States (Figure 8).

16 America in the Age of Uncertainty: 2016 Chicago Council Survey
As with most of the questions about immigrants and immigration, there is a wide partisan divide: about
six in ten Democrats feel favorably toward Middle Eastern immigrants (58%) and support taking in Syrian
refugees (56%), while among Republicans, only 29 percent are positive toward Middle Eastern immigrants
and only 18 percent favor admitting Syrian refugees.14 Core Trump supporters are the most negative of
all: just 15 percent feel favorably toward Middle Eastern immigrants and nine percent support admitting
Syrian refugees.
Republicans Want to “Build that Wall”From the time he formally announced his candidacy, Trump began courting votes from the segment
of the US public opposed to immigration. To keep out illegal immigrants, he proposed—and has stuck by—
a policy to expand the wall on the border with Mexico.15
Large majorities of core Trump supporters (92%) and Republicans (79%) favor “expanding the 700 miles of
border wall and fencing with Mexico” to reduce illegal immigration into the United States. They also
think the wall will be effective at reducing illegal immigration (85% among core Trump supporters and 71%
of Republicans).
But Americans overall are evenly divided on building such a wall, with 48 percent in favor and 50 percent
opposed. A narrow majority of Americans (54%) say that such an expansion would be ineffective at
reducing illegal immigration (compared with 45% effective). Seven in ten Democrats oppose expanding
the wall (71%) and think it would be ineffective (69%). And 56 percent of Independents oppose expand-
ing the wall and also think it will be ineffective.
Partisan Divide on Mexican Immigrants—Though Views Have Grown More Positive Since 2013Americans overall—and across party lines—have grown more positive toward Mexican immigrants
since a 2013 Chicago Council survey. In 2013, 55 percent reported favorable views of Mexican immigrants
living in the United States—a sentiment that rose to 60 percent in 2016. Looking at partisan views,
three-quarters of Democrats (74%, up from 64% in 2013) and nearly half of Republicans (46%, up from 38%
in 2013) say they view Mexican immigrants favorably. By contrast, only one-third of core Trump supporters
express a favorable view of Mexican immigrants living in the United State (Figure 8).16
The population of unauthorized immigrants in the United States has been in decline since 2008, and in
2016 it reportedly fell below 11 million for the first time since 2005.17 This decline has coincided with a shift
in Mexican migration: since 2005, net migration into the United States from Mexico has been negative.18
Many of the unauthorized immigrants still in the United States have lived in the country for many years, and
whether they should be offered a legal path to citizenship has been a longstanding issue.
A path to citizenship seems to be a non-starter among a majority of core Trump supporters. Six in ten core
Trump supporters (63%) say that illegal immigrants in the United States should be forced to leave their
jobs and the United States, while only three in ten (30%) support allowing illegal immigrants to stay in the
United States with a path to citizenship.

17
Figure 8: Core Trump Supporters Are More Negative Toward Immigrant Groups
2016 Chicago Council Survey
Do you have a very favorable, somewhat favorable, somewhat unfavorable, or very unfavorable view of the following people?: (% net favorable)n = 2,061
RepublicansDemocrats IndependentsCore Trump supporters
Middle Eastern immigrants in the United States
Mexican immigrants in the United States
Mexicans living in Mexico
1558 46 29
7582 79 80
33
Overall
40
80
6074 59 46
However, these views are out of step with overall American opinion. Just three in ten among the overall
US public (28%) say that illegal immigrants should be forced to leave the United States and leave their
jobs—half the percentage of core Trump supporters who feel this way (Figure 9).
Instead, 58 percent of Americans say that illegal immigrants currently working in the United States should
be allowed to stay and pursue US citizenship, either immediately (32%) or after a waiting period and
paying a fine (26%). An additional 13 percent say they should be allowed to stay in the United States with
a work permit but not apply for citizenship. Overall, the number of Americans who prefer there be a
pathway to citizenship has increased since 2013, when 50 percent were in favor either immediately (25%)
or after a waiting period and paying a fine (25%). This result is in line with the findings of other polls,
which have found that a majority of Americans favor a pathway to citizenship and have since at least 2014.19
As on other immigration questions, there is a sharp partisan divide. Republicans (42%) are more likely than
Democrats (14%) to say illegal immigrants should leave the United States. Despite Trump’s strong views
to the contrary,20 Republicans have become somewhat more favorable toward a path to citizenship (44% in
2016, up from 37% in 2015). For their part, seven in ten Democrats would prefer a path to citizenship, now
(44%) or with a conditional fine and waiting period (28%). Only 14 percent of Democrats favor deportation
(Figure 9).
Demographic Divisions on ImmigrationAmericans who are older, white, or have less than a college education are more likely than other
Americans to name immigration as a critical threat, prioritize controlling and reducing illegal immigration,
and support decreasing legal immigration into the United States (Appendix Figure 1). It is also these
demographic groups that are more likely to be core supporters of Trump.
Changing Demographics, Immigration, and Security Fears

18 America in the Age of Uncertainty: 2016 Chicago Council Survey
However, it is important to note that other demographic groups—and those groups of Americans that
are growing the fastest—hold notably different views. Younger Americans, those with college degrees,
and non-whites are generally more likely to favor maintaining legal immigration levels and less likely
to view immigration as a critical threat.
Immigration and Economic InsecurityClearly, differences of opinion on immigrants and immigration are a major dividing point in this election.
The candidates represent vastly different visions for the future of the United States. While those in
Trump’s camp support expanding the wall with Mexico and are suspicious of immigrant groups, Americans
overall favor continued immigration combined with immigration reform to address the large population
of unauthorized immigrants already in the country.
Concerns about immigration are also linked to concerns about the economic prospects for the next
generation of Americans. Those Americans who feel more threatened by immigration, favor deportation,
and feel unfavorably toward immigrants believe that the next generation will be economically worse
off than adults today. Unease with immigration and pessimism about the next generation’s economic
prospects reinforce each other and have proven to be key factors in support for Donald Trump.21
Figure 9: Americans Overall Favor a Pathway to Citizenship
4429
2015
2016 Chicago Council Survey
When it comes to immigration, which comes closest to your view about illegal immigrants who are currently working in the US? (%)n = 1,029
Overall 32
RepublicansIndependentsDemocrats Core Trump supporters
They should be allowed to stay in their jobs and to apply for citizenship
2826
2415
Overall 26
They should be allowed to stay in their jobs and to eventually apply for US citizenship only if they pay a penalty and wait a number of years
131313
7
Overall 13They should be allowed to stay in their jobs with work permits, but not to apply for US citizenship
1431
4263
Overall 28They should be required to leave their jobs and leave the US

19
THE CONSEQUENCE OF GLOBAL ECONOMICS
One of the most prominent issues in any presidential campaign is the economy, and economic conditions
have proven to be a major factor in election outcomes.22 In the 2016 campaign, income inequality
is a prominent topic, and in the words of Barney Frank, former Congressman from Massachusetts, “The
bumper sticker is now ‘income fairness.’”23
While the United States has added millions of jobs over several years of sustained growth since the 2009
recession, the top one percent of Americans captured 85 percent of total income growth from 2009
to 2013.24 Additionally, the Great Recession temporarily reduced income inequality, but it has risen again
in many states.25 Globalization and international trade have become targets for both candidates. Both
Hillary Clinton and Donald Trump have spoken strongly against certain trade deals and criticized some
outcomes of globalization. Yet the data show that majorities of Democrats and Republicans continue to
think that globalization is good for the United States, and these views have been stable over long periods
of time. Core Trump supporters, conversely, are much less likely to positively assess the effects of
globalization and international trade.
Republicans Less Supportive of Globalization Than DemocratsWhile economists and politicians are positive about US economic recovery, the public is less optimistic.
The Gallup Economic Confidence Index remains stuck in the negative range,26 and two-thirds of Americans
say that the economic system unfairly favors powerful interests.27 Core Trump supporters are even
more pessimistic about the economy than other Americans; according to a CNN/ORC survey in June, only
18 percent of Trump supporters say that economic conditions are good, compared with 45 percent of
Americans overall.28
In a measure of economic optimism, the Chicago Council asked Americans to compare the prospects of
the next generation to their own. As in past years, a solid majority (57%) of Americans say that the next
generation will be economically worse off than adults working today. But Trump’s core supporters are the
most pessimistic: 70 percent say that the next generation of Americans will be worse off. In a rare
instance of substantial opinion difference among Democrats, the core supporters of Bernie Sanders are
also more inclined than Hillary Clinton’s supporters to say that future generations would be worse off
(57% vs. 41%).
Both Trump and Clinton have sought to place the blame for this pessimism on globalization and inter-
national trade. Trump has pledged to impose tariffs on Chinese and Mexican imports and cancel trade
agreements in order to revitalize the American economy, saying, “I would tax China on products coming
in. I would do a tariff … [because] they do it to us. The tax should be 45 percent.”29 For her part, Clinton
stated that “too many companies lobbied for trade deals so they could sell products abroad but then they
instead moved abroad and sold back into the United States.”30
The Consequence of Global Economics

20 America in the Age of Uncertainty: 2016 Chicago Council Survey
RepublicansIndependentsDemocrats
57
52
55
Figure 10: Democrat and Republican Views on Globalization Have Diverged Do you believe that globalization, especially the increasing connections of our economy with others around the world, is mostly good or mostly bad for the United States? (% mostly good) n = 2,061
55
5558
56
6465
6258
61
65
52
65
52
66
515655
64
59
74
62 61
74
59
1998 2002 2004 2006 2008 2010 2012 2014 2016
2016 Chicago Council Survey
The Republican party’s longstanding position has been one that promotes trade as an engine of growth.
The party’s 2016 platform envisions “a worldwide multilateral agreement among nations committed to
the principles of open markets.”31 Yet recent Chicago Council survey results show that among the public,
self-described Republicans are now less positive toward both globalization and international trade than
Democrats (Figure 10).
The gap between Republican and Democratic views has grown steadily since 2008. While Republican
support for globalization has declined somewhat from its peak in 2006, Democratic support has risen.
The result is that the gap between Republicans and Democrats on support for globalization has grown
from four percentage points in 2006 to 15 percentage points in 2016.
THE GAP BETWEEN REPUBLICANS AND DEMOCRATS ON SUPPORT FOR GLOBALIZATION HAS GROWN FROM FOUR PERCENTAGE POINTS IN 2006 TO 15 PERCENTAGE POINTS IN 2016.

21
Overall
65
Figure 11: Trump Supporters Are Less Likely Than Republicans Overall to See Globalization as Good
Republicans
Core Trump supporters
74
61Independents
Democrats
59
49
2016 Chicago Council Survey
Do you believe that globalization, especially the increasing connections of our economy with others around the world, is mostly good or mostly bad for the United States? (% mostly good)n = 2,061
When asked whether or not globalization is mostly good or mostly bad for the United States, core
supporters of Trump are nearly evenly split: 49 percent say it is mostly good, and 51 percent say that it
is mostly bad (Figure 11).
But the partisan gap should not detract from the fact that overall support for globalization remains strong:
two in three Americans say globalization is mostly good for the United States, one of the highest levels
ever reported in the Chicago Council Survey. That support among the public is still cross-partisan, with
majorities of Democrats, Independents, and Republicans all in agreement. There has also been
an increase in support for globalization among all groups since 2010, just after the Great Recession.
Exploiting Divisions between the Party Elite and the PublicOn two core areas—globalization and jobs—Trump has been able to take advantage of an opinion gap
between the Republican public and Republican leadership. The 2016 Chicago Council Survey reveals
that 85 percent of core Trump supporters and 78 percent of Republicans say protecting American jobs is
a very important foreign policy goal. In contrast, the 2014 survey of foreign policy opinion leaders found
that only 37 percent of Republican opinion leaders think protecting American jobs is a very important
foreign policy goal.32
Similarly, while the Republican public is somewhat divided on the benefits of globalization, Republican
opinion leaders show no such qualms: they overwhelmingly said globalization was mostly good for the
United States (98%). And Trump has blamed those leaders for the loss of American manufacturing jobs,
telling audiences that “[o]ur politicians have aggressively pursued a policy of globalization—moving our
jobs, our wealth and our factories to Mexico and overseas.”33
The Consequence of Global Economics

22 America in the Age of Uncertainty: 2016 Chicago Council Survey
Core Trump Supporters and Growing Partisan Divisions on TradeCore Trump supporters’ doubts about globalization carry over into doubts about the specific benefits of
international trade, not only for the country but also for their personal lives. A majority of core Trump
supporters are positive on the benefits of international trade along just one dimension—“consumers like
you.” However, on all other dimensions, a majority of core Trump supporters say that international trade is
bad (Figure 12).
Americans overall are positive on the benefits of international trade, except in two areas—creating US
jobs and the job security of American workers—though larger minorities of Democrats than Republicans
say that trade is good for these goals. Democrats are generally more positive than Republicans and
Independents about the benefits of international trade. Roughly two in three Democrats and half of
Republicans say that trade is good for the US economy and American companies. And a larger majority
of Democrats than Republicans also say that trade has been good for US consumers as well as their own
standard of living.
This partisan pattern has not always been the case. In 2004 and 2006 Republicans were more likely
than Democrats to say that trade was beneficial to the American economy, American consumers, and US
standards of living (Figure 12). Republicans and Democrats were equally likely to say that trade is good
for jobs and job security in both 2004 and 2006. But today, Democrats are more positive than Republicans
across the board.
Candidates and the Public Disagree on the TPP The Trans-Pacific Partnership (TPP) has been held up to signify the negative aspects of free trade. While
both presidential candidates have criticized the TPP, Trump is vehemently opposed to the deal, declaring,
“Not only will the TPP undermine our economy, but it will undermine our independence.”34
With a negative outlook on international trade, it is somewhat surprising that half of core Trump supporters
support the TPP (49% support, 46% oppose). Nonetheless, this puts them at lower levels of support than
the overall US public (60%), Republicans (58%), and Democrats (70%) and on par with Independents (52%).
Surprisingly, despite Sanders’ vocal opposition to the TPP, 56 percent of his core supporters favor the
agreement, as do 74 percent of Clinton’s core supporters.
YOUNGER AMERICANS, THE COLLEGE-EDUCATED, THOSE WITH HIGHER INCOME, AND NON-WHITES ARE GENERALLY MORE LIKELY THAN OTHER GROUPS TO SAY THAT FREE TRADE AND GLOBALIZATION ARE GOOD.

23
Overall
57
Figure 12: Republican and Democrat Opinions on International Trade Have Shifted
5559
The US economy
57
2016 Chicago Council Survey
Overall, do you think international trade is good or bad for: (% good)n = 2,061
Democrats Republicans Core Trump supportersIndependents
2004
Overall
54
5260
53
2006
Overall
59
68
5142
56
2016
Overall
59
59 58
American companies
59
2004
Overall
52
505552
2006
Overall
57
65
5057
2016
Overall
73
73 74
Consumers like you
72
2004
Overall
70
6878
69
2006
Overall
70
756669
2016
Overall
38
38 37
Creating jobs in the United States
39
2004
Overall
37
38 3836
2006
Overall
40
473437
2016
Overall
31
29 31
Job security for American workers
33
2004
Overall
30
30 3031
2006
Overall
35
413033
2016
Overall
65
63 66
Your own standard of living
65
2004
Overall
64
6470
62
2006
Overall
64
726060
2016
45
52
30
29
49
The Consequence of Global Economics

24 America in the Age of Uncertainty: 2016 Chicago Council Survey
Demographic Differences on Trade and Globalization Partisanship is not the only factor that determines support for free trade. Demographic factors such
as age, education, race, income, and gender also play a role. Younger Americans, the college-educated,
those with higher income, and non-whites are generally more likely than other groups to say that free
trade is good for the US economy, US companies, consumers, and their own standard of living. Moreover,
younger Americans and college graduates are more likely than older Americans and the lesser-educated
to favor the TPP.
To an extent, these demographic patterns even encompass aspects of trade that most Americans view
negatively, such as the impact of international trade on job creation in the United States and job security
for American workers. In both cases, non-whites are significantly more likely to view international trade
as good than are white, non-Hispanic Americans.
Views of globalization follow suit: younger Americans, non-whites, and college graduates are consistenly
more likely to say that trade is mostly good for the United States (Appendix Figure 2).
A Changing America and Its Impact on TradeCore Trump supporters have different views than other Americans on trade and globalization. But some
of core Trump supporters’ demographic groupings—namely predominately white, less-educated, and
older Americans—are shrinking in America.35 As minority populations grow, America becomes less
white every year.36 And in 2016, Millennials overtook the Boomers as the largest age cohort.37 Combined
with overall growth in the US population, these demographic trends point to a future American public that,
all other things being equal, will be even more open to international trade and globalization.
Not only do these growing communities of Americans have different views on trade than core Trump
supporters, they are also more positive about the economic future of their children. While 62 percent of
whites say that the next generation of children will be worse off, fewer than half of blacks (47%) and
Hispanics (49%) say the same.

25
AMERICANS REMAIN COMMITTED TO WORLD ENGAGEMENT
Since using the slogan “America First” in his initial major foreign policy speech, Trump has questioned
long-standing tenets of US foreign policy, including US alliance commitments to NATO, Japan, and
South Korea. While Trump’s core supporters are generally in step with his policy stances on trade, global-
ization, and immigration, by and large they do not align with their chosen candidate’s views on
broader international engagement.38
Core Trump supporters are somewhat more cautious than other Americans of alliances and an active US
role in world affairs, but in most cases they continue to favor international engagement. This serves as
a reminder that while Americans may be divided on some issues, when it comes to US leadership in the
world and how to achieve foreign policy goals, the public finds common ground.
Making America [Even] Great[er] AgainOne of Trump’s common refrains is that the United States is losing internationally. “We lose every-
where. . . . We can’t beat anybody.”39 But Americans—including Trump’s core supporters—do not agree.
Across political stripes, Americans continue to see the United States as the most influential country
in the world. The public as a whole rates US global influence an average of 8.5 on a 0 to 10 scale—higher
than any other individual country or the European Union—and core Trump supporters agree, rating it
at 8.3. For comparison, Americans overall ranked China second with a mean influence of 7.1, the EU third
at 7.0, and Russia fourth at 6.2 (Figure 13).
Americans Remain Committed to World Engagement
European UnionIndiaChinaRussiaUnited States Iran
Figure 13: The United States Still Considered Most Influential
2016 Chicago Council Survey
I would like to know how much influence you think each of the following countries has in the world. Please answer on a 0 to 10 scale, with 0 meaning they are not at all influential and 10 meaning they are extremely influential.n = 2,061
2002 2006 2008 2010 2012 2014 2016
South Korea
4.7 4.74.3 4.54.7
4.8
6.7 6.46.8 6.9
7.5 7.4 7.4 7.1
6.5
9.18.5 8.68.5 8.5 8.6 8.5
6.0
6.97.2 6.5
7.1 7.0
5.6
6.1
5.2
6.2
5.0
5.84.6
4.4
6.2
4.86.2
4.8
4.6

26 America in the Age of Uncertainty: 2016 Chicago Council Survey
Figure 14: Across Parties, Majorities Think America is the Greatest
Republicans
Core Trump supporters
55
54Independents
Democrats
78
75
2016 Chicago Council Survey
Some people say the United States has a unique character that makes it the greatest country in theworld. Others say that every country is unique, and the United States is no greater than other nations. Which view is closer to your own? (% the greatest country in the world) n = 2,061
Overall
61
Since 2010, the perceived influence of the United States has remained steady even as China’s perceived
influence has marginally waned. Moreover, on this question there has been little partisan divide over time.
Americans across political affiliations seem to agree that the United States remains the most influential
country in the world, and even though that gap has narrowed since 2002, they do not seem to feel that
US influence is being seriously challenged.
Not only do Americans see the United States as the most influential country in the world, but 61 percent
say that the United States “has a unique character that makes it the greatest country in the world,” versus
38 percent who say that “every country is unique, and the United States is no greater than other nations.”
While Republicans and core Trump supporters are most likely to say that the United States is the greatest
country, that should not overshadow the fact that majorities of Democrats and Independents agree
(Figure 14).
Few Favor US Retreat from World LeadershipWhile some have characterized Trump’s policies as isolationist,40 his supporters do not express a
desire to withdraw from America’s global leadership role. When asked what kind of leadership role the
United States should play in the world, only nine percent of core Trump supporters say it should play
no leadership role. And while core Trump supporters are more likely than others to favor a dominant
leadership position for the United States, 50 percent prefer that the United States take a shared leadership
role. This puts Trump’s core supporters in line with Republicans more broadly (53% shared leadership)
and suggests commonalities with Democrats (70% shared) and Independents (63% shared).
A majority of Americans (64%) also find broad agreement—as they have since 1974—that it would be best
for the future of the country to take an active role in world affairs. Support for an active role has long
been cross-partisan, and that trend continues in 2016 as majorities of Democrats, Republicans, and Inde-
pendents all agree on this issue (Figure 15). Core Trump supporters are somewhat divided on the issue,
with similar numbers supporting an active role (51%) and staying out of world affairs (48%).

27
RepublicansIndependentsDemocrats
72
6568
Figure 15: Across Parties, Majorities Favor an Active US Role in World A�airs
2016 Chicago Council Survey
Do you think it will be best for the future of the country if we take an active part in world aairs or stay out of world aairs? (% active part)n = 2,061
6163
5855
49
64
68
58
71
59
61
69
6061
66
77 77
6970
6465
74
6865 60
59
72
1974 1978 1982 1986 1990 1998 2002 2004 2006 2012 2014 2015 20162008 2010
57
6769
63
68
72
5560
70
51
6460
57
70
64
Q3 Republican Democrat Independent1974 72 68 652008 72 59 60
Americans Remain Committed to World Engagement
Previous qualitative results show that “staying out of world affairs” means different things to different
people, but rarely does it reflect purely isolationist tendencies.41 For some, “staying out of world affairs”
reflects their desire to place greater priority on domestic problems, while others say US international
involvement in the past has not been effective nor appreciated. Still others say that the United States
should avoid engagement unless there is a direct threat to US security. Trump has referenced each
of these ideas in statements, which helps explain why his positions appeal to a certain segment of the
population. He has criticized past administrations, stating that “we went from mistakes in Iraq to
Egypt to Libya, to President Obama’s line in the sand in Syria.”42 He has condemned “rebuilding other
countries while weakening our own,” and said that “ending the theft of American jobs will give us
resources we need to . . . regain our financial independence and strength.”43
Republicans Say Maintaining US Military Edge Is ImportantTrump has promised to build up what he perceives as an underfunded US military and that under
his leadership it will be “so big, powerful, and strong that no one will mess with us.”44 For the most part,
Americans agree on the importance of having a powerful fighting force. A majority of the overall US
public says that maintaining US military superiority is a very important foreign policy goal—including half
of Democrats (50%) and Independents (49%) and seven in ten Republicans (71%) and core Trump
supporters (72%).

28 America in the Age of Uncertainty: 2016 Chicago Council Survey
To achieve US foreign policy goals, Republicans and core Trump supporters also see maintaining military
superiority as the most effective method (Figure 16). Independents rank it second, and Democrats rank
it third. Notably, six in ten Republicans (60%) and core Trump supporters (60%) alike say that maintaining US
military superiority is very effective, compared to four in ten Democrats (43%) and Independents (42%).
Figure 16: Republicans and Core Trump Supporters Think Maintaining US Military Superiority is Very E�ective in Achieving Foreign Policy Goals
4342
6060
2016 Chicago Council Survey
How e�ective do you think each of the following approaches is to achieving the foreign policy goals of the United States: very e�ective, somewhat e�ective, not very e�ective, or not e�ective at all. (% somewhat e�ective and % very e�ective, top five responses)n = 2,061
Overall 47
RepublicansIndependentsDemocrats Core Trump supporters
Maintaining US military superiority
453440
34
Overall 40Maintaining existing alliances
372424
21
Overall 29Building new alliances with other countries
3620
1821
Overall 26Strengthening the United Nations
2314
1212
4339
3028
4952
4850
52545556
4840
3639
6251
5047
Overall 17
Overall38
Overall50
Overall54
Overall42
Overall54Signing international agreements
Somewhat e�ective Very e�ective

29Americans Remain Committed to World Engagement
Majorities Think Alliances Are EffectiveA significant pillar in the Trump campaign has been to cast existing alliance partners as freeloaders who
fail to pay their fair share for their defense. He has continually singled out NATO, Japan, and South
Korea as prime examples of this behavior.45 But this view finds little resonance among the public or even
Trump’s base.
Among the overall public, 89 percent say that maintaining existing alliances is very or somewhat effective
at achieving US foreign policy goals. That view has bipartisan support: Democrats (94%), Republicans
(88%), and Independents (86%) all view maintaining existing alliances as very or somewhat effective, as do
84 percent of core Trump supporters.
Majority Support for Maintaining US NATO CommitmentIn one of his critical remarks about the transatlantic alliance, Trump stated in July of 2016 that that “NATO
is obsolete” and “many member countries [are] not paying their fair share.”46 Core Trump supporters
are divided on whether NATO is essential to US security (50% essential, 48% no longer essential), but a
majority prefer to increase or maintain the US commitment to NATO (Figure 17). Fewer support a
decrease or end to the US commitment to NATO.
Figure 17: Despite Trump's Criticisms, a Majority of His Supporters Favor US Commitment to NATO
17899
2016 Chicago Council Survey
Do you feel we should increase our commitment to NATO, keep our commitment what it is now, decrease our commitment to NATO, or withdraw from NATO entirely? (%)n = 1,046
Overall 12
RepublicansIndependentsDemocrats
Increase commitment
6961
6051
Overall 63Keep commitment what it is now
817
1924
Overall 14Decrease commitment
39
813
Overall 7Withdraw
Core Trump supporters

30 America in the Age of Uncertainty: 2016 Chicago Council Survey
The US public as a whole is even more positive about NATO. Clear majorities of Republicans, Democrats,
and Independents prefer to increase or maintain the commitment to NATO. Just two in ten Republicans
and Independents, and one in ten Democrats, want to decrease the US commitment to NATO, and even
fewer support withdrawing from NATO entirely. Additionally, a majority overall (65%) and among
Democrats (81%), Republicans (57%), and Independents (58%) say that NATO is still essential to US security.
Majorities Support US Bases AbroadRegarding US security commitments, Trump has said that “the countries we are defending must pay for
the cost of this defense, and if not, the US must be prepared to let these countries defend themselves.”47
But Trump’s supporters favor projecting US military power abroad through basing. In fact, core Trump
supporters are as or more likely than other Americans to support long-term US military bases in Australia,
Germany, Japan, and South Korea (Figure 18).
Figure 18: Trump Supporters Favor Long-Term US Military Bases in Several Key Countries
5756
6966
2016 Chicago Council Survey
Do you think the United States should or should not have long-term military bases in the following places? (% should have)n = 2,061
Overall 60
RepublicansIndependentsDemocrats
Japan
7064
7672
Overall 70South Korea
5856
7062
Overall 61Germany
Core Trump supporters
4344
5450
Overall 46Australia
This finding fits with Republicans’ overall inclination toward a strong military presence abroad. Whether
it is Australia, Germany, Japan, or South Korea, Republicans are consistently more likely than Democrats
to support US bases overseas.

31
A Majority of Americans Support International AgreementsOver decades of Chicago Council surveys, Democrats have consistently been more inclined than
Republicans and Independents to favor multilateral cooperation and international agreements, and core
Trump supporters are no different than Republicans on these questions. Seven in ten Americans overall
and at least eight in ten Democrats say that the United States should participate in “the International
Criminal Court that can try individuals for war crimes, genocide, or crimes against humanity if their
own county won’t try them” and “the Paris agreement that calls for countries to collectively reduce their
emissions of greenhouse gases” (Figure 19). In each case, smaller majorities of Republicans and core
Trump supporters agree.
Americans Remain Committed to World Engagement
Figure 19: Americans Support US Participation in International Agreements
8768
5757
2016 Chicago Council Survey
Based on what you know, do you think the United States should or should not participate in the following international agreements? (% should)n = 2,061
Overall 71
RepublicansIndependentsDemocrats
The Paris Agreement that calls for countries to collectively reduce their emissions of greenhouse gases
7969
6765
Overall 72The agreement on the International Criminal Court that can try individuals for war crimes, genocide, or crimes against humanity if their own country won't try them
7457
4646
Overall 60The agreement that lifts some international economic sanctions against Iran in exchange for strict limits on its nuclear program for at least the next decade
Core Trump supporters
Opinion is more divided on the nuclear agreement with Iran. While six in ten Americans overall also
support “the agreement that lifts some international economic sanctions against Iran in exchange for
strict limits on its nuclear program for at least the next decade,” less than half of each Republicans
and core Trump supporters agree.
In a similar vein, while an overall majority of Americans favor cooperating with Russia (56%) and China
(63%) over actively working to limiting their influence, Democrats are much more supportive of cooperation
than Republicans. Sixty-seven percent of each Democrats and Independents, 55 percent of Republicans,
and 49 percent of core Trump supporters think the United States should “undertake friendly cooperation
and engagement” with China. When it comes to Russia, 62 percent of Democrats, 55 percent of
Independents, 50 percent of Republicans, and 53 percent of core Trump supporters favor cooperation.

32 America in the Age of Uncertainty: 2016 Chicago Council Survey
Demographic Trends Suggest StabilityDespite the important demographic changes taking place in the United States, there is currently little
evidence to suggest that these changes will spark an American withdrawal from the world. Across races
and ethnicities, Americans prefer that the United States take an active part in world affairs, as do
majorities of all age cohorts (Figure 20). The youngest Americans are also the most likely to see main-
taining existing alliances as an effective means of achieving the goals of US foreign policy. And across
ethnicities, more than eight in ten people agree on the effectiveness of maintaining alliances. There
is broad agreement across ages and ethnicities on the full range of options to achieve US foreign
policy goals, with little to distinguish between the various groups.
The same is true of US alliance commitments. At least seven in ten people of all age cohorts say the
United States should increase or maintain its commitment to NATO, and the same is true of all ethnicities.
Likewise, more than six in ten members of all age groups and ethnicities cite NATO as still essential
to US security. Majorities of all ages and ethnicities also support military bases in Germany, Japan, and
South Korea.
And when it comes to participating in international agreements, majorities of all ages and ethnicities think
the United States should participate in the Paris Agreement to reduce greenhouse gases, the Internation-
al Criminal Court, and in the agreement to lift sanctions and limit Iran’s nuclear program.
Americans Support Continued US LeadershipTaken together, these findings suggest that despite the very different rhetoric out of both campaigns
on the role of America in the world, the American public finds much broader agreement than one
might otherwise expect. The American public as a whole still thinks that the United States is the greatest
and most influential country in the world, and and bipartisan support remains strong for the country
to take an active part in world affairs. Americans still favor the country’s traditional alliances, the mainte-
nance of bases overseas, and the preservation of US military superiority. While core Trump supporters
differ from other Americans on immigration and trade, they too support international US engagement,
leadership, and the maintenance of the international US military presence.
ACROSS RACES AND ETHNICITIES, A MAJORITY OF AMERICANS PREFER THAT THE UNITED STATES TAKE AN ACTIVE PART IN WORLD AFFAIRS, INCREASE OR MAINTAIN ITS COMMITMENT TO NATO, AND PARTICI-PATE IN SELECT INTERNATIONAL AGREEMENTS.

33Americans Remain Committed to World Engagement
Figure 20: Few Di�erences Across Demographic Groups Regarding America's Role in the World
2016 Chicago Council Survey
Do you think it will be best for the future of the country if we take an active part in world aairs or if we stay out of world aairs? (% active part)n = 2,061
Some people say that NATO is still essential to our country’s security. Others say it is no longer essential. Which of these views is closer to your own? (% still essential)n = 2,061
In dealing with the rise of China's power, do you think the United States should:n = 1,003
In dealing with Russia, do you think the United States should:n = 1,058
18–29
30–44
45–59
60+
$0–20K
$20–40K
$40–75K
$75–125K
$125K+
High school or less
Some college/ associate’s degree
College graduates
White, non-Hispanic
Black, non-Hispanic
Male
Female
Other, non-Hispanic
Hispanic
56
56
67
75
58
73
63
57
72
66
66
62
57
62
61
66
73
62
63
66
66
65
64
71
64
66
75
68
67
64
61
66
62
69
67
61
70
60
64
58
58
73
64
54
73
59
67
60
52
57
70
63
67
59
26
37
31
38
36
26
32
37
25
37
31
35
39
39
27
34
30
36
60
61
49
54
48
63
55
51
65
57
58
53
52
51
52
61
58
59
32
Overall American public
64 65 63 33 56 39
35
44
41
44
33
40
39
31
36
39
38
41
42
42
34
36
36
Undertake friendly cooperation and engagement with China (%)
Actively work to limit the growth of China's power (%)
Undertake friendly cooperation and engagement with Russia (%)
Actively work to limit Russia's power (%)

34 America in the Age of Uncertainty: 2016 Chicago Council Survey
CONCLUSION
Some commentators believe that Trumpism—“a personality-fueled movement that has proven, against
the smart money’s predictions, to be in tune with the frustrations of a significant slice of the electorate”48—
will disappear if Trump loses the election.
The data in this report suggest that this will not be the case. This election cycle has brought certain
underlying tensions between Republicans and Democrats to the fore. While the divisions on the issues
of immigration and globalization are now more prominent, they were not created in the past year alone.
Democrats and Republicans have expressed diverging opinions about immigration since 2002, and the
gap between Republican and Democratic views on globalization has grown steadily since 2008. In
2016, Trump supporters are consistently the most negative on these two issues.
Finally, while Hillary Clinton and Donald Trump represent vastly different visions for the future role of
the United States in the world, the Chicago Council Survey data suggest that Americans’ preference for
international engagement will endure, just as it has over at least the past 40 years. Americans across
party affiliation seem to value maintaining traditional alliances, bases overseas, and US military superiority—
even supporters of Donald Trump.

35
APPENDIX
Appendix Figure 1: Demographic Breakdowns and Attitudes toward Immigration
2016 Chicago Council Survey
Large numbers of immigrants and refugees coming into the United States (% critical threat)n = 1,728
Controlling and reduc-ing illegal immigration (% very important goal)n = 782
Should legal immigration into the United States be kept at its present level, increased, or decreased?n = 2,061
Do you have a very favorable, somewhat favorable, somewhat unfavorable, or very unfavorable view of the following people:n = 2,061Kept at
present level (%)
Increased (%) Decreased (%) Mexican
immigrants in the United States (% net favorable)
Middle Eastern immigrants in the United States (% net favorable)
Overall American public
18–29
30–44
45–59
60+
$0–20K
$20–40K
$40–75K
$75–125K
$125K+
High school or less
Some college/ associate’s degree
College graduates
White, non-Hispanic
Black, non-Hispanic
Male
Female
Other, non-Hispanic
Hispanic
43
30
37
51
51
45
38
50
29
36
31
43
43
44
49
42
40
44
46
45
34
34
51
57
47
39
51
36
34
33
45
44
48
49
42
44
42
47
41
43
44
36
40
41
45
37
48
47
47
41
40
38
42
39
43
40
37
18
26
21
16
13
15
24
16
22
28
22
19
18
18
13
18
19
26
18
39
30
33
47
45
42
31
45
29
25
30
39
40
42
44
42
36
34
43
60
65
62
58
58
55
71
55
67
67
71
62
58
55
56
58
64
66
57
45
53
46
41
41
38
56
42
57
48
47
44
46
41
38
45
49
49
43
Appendix

36 America in the Age of Uncertainty: 2016 Chicago Council Survey
Appendix Figure 2: Younger Americans, Non-whites, and College Graduates Are Most Likely to See Trade as Beneficial
Overall, do you think international trade is good or bad for: (% good) n = 2,061
2016 Chicago Council Survey
The US economy
American companies
Consumers like you
Creating jobs in the United States
Job security for American workers
Your own standard of living
18–29
30–44
45–59
60+
$0–20K
$20–40K
$40–75K
$75–125K
$125K+
High school or less
Some college/ associate’s degree
College graduates
White, non-Hispanic
Black, non-Hispanic
Male
Female
Other, non-Hispanic
Hispanic
65
61
53
56
55
67
54
66
68
66
61
56
53
52
58
61
69
55
62
56
56
57
54
65
55
67
61
60
62
53
52
58
58
56
64
56
75
74
67
66
64
82
68
64
80
79
73
68
63
60
67
76
82
68
45
41
36
38
43
39
33
55
44
54
41
38
46
39
38
36
43
35
37
34
35
33
37
34
30
44
40
47
35
35
43
33
34
33
34
32
71
65
59
63
60
73
61
63
78
73
66
63
56
58
61
68
75
61

37
This report is based on the results of a survey commissioned by the Chicago Council on Global Affairs.
The 2016 edition of the survey is the latest effort in a series of wide-ranging surveys on American atti-
tudes toward US foreign policy. The 2016 Chicago Council Survey was made possible by the generous
support of the John D. and Catherine T. MacArthur Foundation, the Robert R. McCormick Foundation, the
Korea Foundation, and the personal support of Lester Crown and the Crown Family.
The survey was conducted from June 10 to 27, 2016, among a representative national sample of
2,061 adults. The margin of sampling error for the full sample is ±2.38, including a design effect of 1.2149.
Partisan identification is based on respondents’ answer to a standard partisan self-identification question:
“Generally speaking, do you usually think of yourself as a Republican, a Democrat, an independent, or
what?”
The label of “core Trump supporter” is based on respondents’ answer to a presidential preference ques-
tion: “Regardless of your voting preference in the previous question, who was your top choice for president
among the following candidates?” The list of candidates was randomly ordered, with specific candidates
including Hillary Clinton, Donald Trump, Bernie Sanders, Ted Cruz, John Kasich, Marco Rubio, and Jeb Bush,
as well as the option for respondents to write in additional preferred candidates. Those respondents who
said their top choice for president was Donald Trump are referred to as “core Trump supporters.”
A full listing of questions asked in the 2016 Chicago Council Survey, including details on which questions
were administered to split samples, is available online at www.thechicagocouncil.org.
The survey was conducted by GfK Custom Research, a polling, social science, and market research firm
in Palo Alto, California, using a randomly selected sample of GfK’s large-scale nationwide research panel,
KnowledgePanel® (KP). The survey was fielded to a total of 3,580 panel members yielding a total of
2,244 completed surveys (a completion rate of 63%). The median survey length was 20 minutes. Of the
2,244 total completed surveys, 183 cases were excluded for quality control reasons, leaving a final sample
size of 2,061 respondents:
Respondents were excluded if they failed at least one of three key checks: • Respondents who completed the survey in eight minutes or less.
• Respondents who refused to answer half or more of the items in the survey.
• Respondents who failed two or three of the following checks:
— Did not accurately input “4,” refused or skipped the question that was specifically designed
to make sure respondents were paying attention. (“In order to make sure that your browser is
working correctly, please select number 4 from the list below.”)
— Refused one or more full lists that included five items or more (of which there were 11 such lists).
— Respondents who gave exactly the same answer (“straight-lined”) to every item on one of the
four longest lists in the survey (Q5, Q7, Q50, or Q185).
METHODOLOGY
Methodology

38 America in the Age of Uncertainty: 2016 Chicago Council Survey
The GfK Knowledge Panel was originally based exclusively on a national Random Digit Dialing (RDD)
sampling methodology. In order to improve the representation of the panel, GfK migrated to using an Ad-
dress Based Sampling (ABS) methodology for selecting panel members in 2009. For both ABS and RDD
recruitment, households (i.e., all eligible adults in the household) that agree to participate in the panel are
provided with free Internet hardware and access (if necessary), which uses a telephone line to connect to
the Internet and the television as a monitor. Thus, the sample is not limited to those in the population who
already have Internet access.
Generally, the specific survey samples represent an equal probability selection method (EPSEM) sample
from the panel for general population surveys. The raw distribution of KP mirrors that of the US adults fair-
ly closely, barring occasional disparities that may emerge for certain subgroups due to differential attrition.
To ensure selection of general population samples from KP behave as EPSEM, additional measures are
undertaken, starting by weighting the pool of active members to the geodemographic benchmarks se-
cured from the latest March supplement of the Current Population Survey (CPS) along several dimensions.
Using the resulting weights as measure of size, in the next step a PPS (probability proportional to size)
procedure is used to select study-specific samples. It is the application of this PPS methodology with the
imposed size measures that produces fully self-weighing samples from KP, for which each sample mem-
ber can carry a design weight of unity. Moreover, in instances where a study design requires any form of
oversampling of certain subgroups, such departures from an EPSEM design are accounted for by adjust-
ing the design weights in reference to the CPS benchmarks for the population of interest.
The geodemographic benchmarks used to weight the active panel members for computation of size measures include: • Gender (male, female)
• Age (18–29, 30–44, 45–59, and 60-plus)
• Race/Hispanic ethnicity (white non-Hispanic, black non-Hispanic, other non-Hispanic,
two-plus races non-Hispanic, Hispanic)
• Education (less than high school, high school, some college, bachelor and beyond)
• Census region (Northeast, Midwest, South, West)
• Household income (under $10k, $10K to <$25k, $25K to <$50k, $50K to <$75k,
$75K to <$100k, $100K+)
• Home ownership status (own, rent/other)
• Metropolitan area (yes, no)
• Internet access (yes, no)
Once the study sample has been selected and the survey administered, and all the survey data are edit-
ed and made final, design weights are adjusted to account for any differential nonresponse that may have
resulted during the field period. Depending on the specific target population for a given study, geodemo-
graphic distributions for the corresponding population are obtained from the CPS, the American Commu-
nity Survey (ACS), or in certain instances from the weighted KP profile data. For this purpose an iterative
proportional fitting (raking) procedure is used to produce the final weights. In the final step, calculated
weights are examined to identify and, if necessary, trim outliers at the extreme upper and lower tails of
the weight distribution. The resulting weights are then scaled to aggregate to the total sample size of all
eligible respondents.

39
For this study, the following benchmark distributions of the US adult general population (age 18 or older) from the most recent data (March 2015 Supplement) from the CPS were used for the raking adjustment of weights: • Gender (male, female) by age (18–29, 30–44, 45–59, 60-plus)
• Race/ethnicity (white non-Hispanic, black non-Hispanic, other non-Hispanic, Hispanic,
two-plus races non-Hispanic)
• Census region (Northeast, Midwest, South, West) by metropolitan status (metro, non-metro)
• Education (less than high school, high school, some college, bachelor or higher)
• Household Income (under $25,000, $25–$49,999, $50,000–$74,999, $75,000-plus)
• Household with internet access (yes, no) (Source: July 2013 CPS Supplement Data)
For more information about the sample and survey methodology, please visit the GfK website at
http://www.gfk.com/us/Solutions/consumer-panels/Pages/GfK-KnowledgePanel.aspx.
For more information about the Chicago Council Survey, please contact Craig Kafura, research
associate, at [email protected].
Methodology

40 America in the Age of Uncertainty: 2016 Chicago Council Survey
ABOUT THE SURVEY SAMPLE
2016 Chicago Council Survey
% of 2016 samplen = 2,046
Registered to vote
Average age
White, non-Hispanic
Black, non-Hispanic
Hispanic
Other, non-Hispanic
Racial composition (%)
Hillary Clinton
Bernie Sanders
Donald Trump
Other Republican
Original vote preference (%)
High school or less
Some college/associate's degree
College graduates
Education (%)
Female
28
48
90
82
2
10
6
3
5
32
55
40
28
32
53
47
36
47
86
49
23
18
10
51
34
3
8
44
28
28
55
45
34
75
47
68
7
16
8
13
27
15
30
42
28
30
47
53Male
Gender (%)
Democrat Independent Republican

ABOUT THE SURVEY
The Chicago Council Survey, conducted every four years since 1974, biennially since 2002, and now annually, is a trusted and widely cited source of longitudinal data on American public opinion about a broad range of US foreign policy and international issues. With its combination of time series and comprehensive coverage, the Chicago Council Survey is a valuable resource to policymakers, academics, media, and the general public because of its unique ability to capture the sense of particular eras—post-Vietnam, post-Cold War, post-9/11—and to define critical shifts in American public thinking. The Chicago Council Surveys are highly respected and widely used in policy circles and academic research both in the United States and abroad. Several scholarly works have drawn on Chicago Council survey data, including The Foreign Policy Gap (Page, Bouton), Public Opinion and American Foreign Policy (Holsti), Faces of Internationalism (Wittkopf), and The Rational Public (Page and Shapiro). All of the Chicago Council Survey data sets are available to the public via the Roper Center, and ICPSR and the 2016 data will be available soon on www.thechicagocouncil.org.
In addition to the annual Chicago Council Survey of American public opinion and US foreign policy, the Chicago Council’s polling has often expanded to international polling in Europe, Asia, and Mexico. Recently the Council has reintroduced a leaders’ survey as an important component of the 2014 and 2016 Chicago Council Surveys (report forthcoming). Besides these compre- hensive reports, the Chicago Council Survey team publishes and dissemi- nates short opinion briefs on topical issues such as negotiations with Iran, climate change, energy, and the pivot to Asia. These short reports can be found on the Council’s website and on the Chicago Council Survey blog www.RunningNumbers.org.
41Endnotes

42 America in the Age of Uncertainty: 2016 Chicago Council Survey
Introduction1 Mark Hugo Lopez, Jeffrey Passel, and Molly Rohal, “Modern Immi-
gration Wave Brings 59 Million to U.S., Driving Population Growth and Change Through 2065,” Pew Research Center, September 28, 2015, http://www.pewhispanic.org/2015/09/28/modern-immigra-tion-wave-brings-59-million-to-u-s-driving-population-growth-and-change-through-2065/.
2 “The Facts on Immigration Today,” Center for American Progress, October 23, 2014, https://www.americanprogress.org/issues/immi-gration/report/2014/10/23/59040/the-facts-on-immigration-today-3/.
3 Haya El Nasser, “US birthrate continues to slow because of re-cession,” Al Jazeera America, December 10, 2014, http://america.aljazeera.com/articles/2014/12/10/census-populationdiversity.html.
4 Robert P. Jones et al, “How immigration and concerns about cultural change are shaping the 2016 election: Findings from the 2016 PRRI/Brookings immigration survey,” Public Religion Research Institute (PRRI) and the Brookings Institution, June 23, 2016, http://www.prri.org/wp-content/uploads/2016/06/PRRI-Brookings-2016-Immigra-tion-survey-report.pdf.
5 Jonathan T. Rothwell, “Explaining Nationalist Political Views: The Case of Donald Trump,” Gallup, September 4, 2016, http://papers.ssrn.com/sol3/papers.cfm?abstract_id=2822059#.V7mTMszJiXE.twitter/.
6 William Greider, “Sanders and Trump Offer Two Roads Out of Estab-lishment Politics—Which Will We Follow?,” The Nation, September 28, 2015, https://www.thenation.com/article/bernie-and-trump-offer-two-roads-out-of-establishment-politics-which-will-we-follow/.
Changing Demographics, Immigration, and Security Fears7 “Donald J. Trump statement on preventing Muslim immigration,”
December 7, 2015, https://www.donaldjtrump.com/press-releases/donald-j.-trump-statement-on-preventing-muslim-immigration.
8 Rebecca Kaplan, “Hillary Clinton: U.S. should take 65,000 Syrian ref-ugees,” Face the Nation, September 20, 2015, http://www.cbsnews.com/news/hillary-clinton-u-s-should-take-65000-syrian-refugees/.
9 Dina Smeltz, Karl Friedhoff, and Craig Kafura, “Republicans Get behind Trump, but Not All of His Policies,” The Chicago Council on Global Affairs, July 2016, https://www.thechicagocouncil.org/publi-cation/republicans-get-behind-trump-not-all-his-policies.
10 Donald Trump, “Statement raging against Mexican immigrants and ‘disease’,” July 6, 2015, http://www.businessinsider.com/don-ald-trumps-epic-statement-on-mexico-2015-7#ixzz3fDbHDVHk/.
11 Donald Trump, “Speech on Fighting Terrorism”, Youngstown, OH, August 15, 2016, Politico, http://www.politico.com/story/2016/08/donald-trump-terrorism-speech-227025.
12 PollingReport.com, accessed September 13, 2016, http://www.poll-ingreport.com/terror.htm.
13 Torture is the other method of combatting terrorism that elicits a strong partisan divide. See: Dina Smeltz and Karl Friedhoff, “As Acts of Terror Proliferate, Americans See No End in Sight,” August 22, 2016, https://www.thechicagocouncil.org/publication/acts-terror-proliferate-americans-see-no-end-sight.
ENDNOTES
14 A similar partisan divide exists across all immigrant groups, with Democrats more likely to report favorable views than Republicans, though majorities of both parties hold favorable views of Chinese (74% Democrats, 59% Republicans) and Korean (73% Democrats, 59% Republicans) immigrants.
15 Jason Carroll et al, “Trump says he’d build a wall along the Mexican border. We tried to figure out how.” CNN, February 17, 2016, http://www.cnn.com/2016/02/17/politics/donald-trump-mexico-wall/.
16 The question wording did not specify whether these Mexican immi-grants were undocumented or legal, the ambiguity of which could have affected views.
17 Jerry Markon, “U.S. illegal immigrant population falls below 11 million, continuing nearly decade-long decline, report says,” The Washing-ton Post, January 20, 2016, https://www.washingtonpost.com/news/federal-eye/wp/2016/01/20/u-s-illegal-immigrant-population-falls-below-11-million-continuing-nearly-decade-long-decline-report-says/.
18 Ana Gonzalez-Barrera, “More Mexicans Leaving Than Coming to the U.S.,” Pew Research Center, November 19, 2015, http://www.pewhispanic.org/2015/11/19/more-mexicans-leaving-than-coming-to-the-u-s/.
19 PollingReport.com, accessed September 13, 2016, http://www.poll-ingreport.com/immigration.htm.
20 Donald Trump, “Immigration speech in Arizona,” Phoenix, AZ, August 31, 2016, http://www.politico.com/story/2016/08/don-ald-trump-immigration-address-transcript-227614.
21 Jonathan T. Rothwell, “Explaining Nationalist Political Views: The Case of Donald Trump.”
The Consequence of Global Economics22 For example, see John Sides and Lynn Vavrek, The Gamble: Choice
and Chance in the 2012 Presidential Election, 2013.
23 Jonathan Martin, “Democrats, Looking Past Obama, Are a Party Without a Cause,” The New York Times, July 23, 2016, http://www.nytimes.com/2016/07/24/us/politics/obama-democrats-dnc.html?_r=1.
24 Estelle Sommeiller, Mark Price, and Ellis Wazeter, “Income inequality in the U.S. by state, metropolitan area, and county,” Economic Policy Institute, June 16, 2016, http://www.epi.org/publication/income-in-equality-in-the-us/.
25 Ibid.
26 “U.S. Economic Confidence Index Holds at -12,” Gallup, August 23, 2016, http://www.gallup.com/poll/194801/economic-confidence-in-dex-holds.aspx.
27 Hannah Fingerhut, “Most Americans say U.S. economic system is unfair, but high-income Republicans disagree,” Pew Research Center, February 10, 2016, http://www.pewresearch.org/fact-tank/2016/02/10/most-americans-say-u-s-economic-system-is-un-fair-but-high-income-republicans-disagree/.

43
28 CNN/ORC poll, June 16-19, 2016, http://i2.cdn.turner.com/cnn/2016/images/06/23/rel7f.-.obama.economy.pdf.
29 Maggie Haberman, “Donald Trump Says He Favors Big Tariffs on Chinese Exports,” The New York Times, January 7, 2016, http://www.nytimes.com/politics/first-draft/2016/01/07/donald-trump-says-he-favors-big-tariffs-on-chinese-exports/?_r=1.
30 Hillary Clinton, “Economic Speech,” Warren, MI, August 11, 2016, http://www.newsweek.com/ hillary-clinton-full-transcript-econom-ic-speech-489602.
31 “The 2016 Republican Party Platform,” July 18, 2016, https://www. gop.com/the-2016-republican-party-platform/.
32 Dina Smeltz, Craig Kafura, Joshua Busby, Gregory Holyk, Jonathan Monten, et al, “United in Goals, Divided on Means: Results of the 2014 Chicago Council Survey of Foreign Policy Opinion Leaders,” June 2, 2015, https://www.thechicagocouncil.org/sites/default/files/2014%20Chicago%20Council%20Opinion%20Leaders%20Sur-vey%20Report_FINAL.pdf.
33 Donald Trump, “Speech on the Economy, Annotated,” NPR, June 28, 2016, http://www.npr. org/2016/06/28/483883321/fact-check-trumps-speech-on-theeconomy-annotated.
34 Ibid.
35 Camille L. Ryan and Kurt Bauman, “Educational Attainment in the United states; 2015 Population Characteristics,” March 2016, https://www.census.gov/content/dam/Census/library/publications/2016/demo/p20-578.pdf; D’Vera Cohn and Andra Caumont, “10 demo-graphic trends that are shaping the U.S. and the world,” March 31, 2016, http://www.pewresearch.org/fact-tank/2016/03/31/10-demo-graphic-trends-that-are-shaping-the-u-s-and-the-world/.
36 Sandra L. Colby and Jennifer M. Ortman, “Projections of the Size and Composition of the U.S. Population: 2014 to 2060,” March 2015, https://www.census.gov/content/dam/Census/library/publica-tions/2015/demo/p25-1143.pdf.
37 Richard Fry, “Millennials overtake Baby Boomers as America’s larg-est generation,” Pew Research Center, April 25, 2016, http://www.pewresearch.org/fact-tank/2016/04/25/millennials-overtake-ba-by-boomers/.
The Consequence of Global Economics38 Donald Trump, “Foreign Policy Speech,” Washington, DC, April
27, 2016, http://www.nytimes.com/2016/04/28/us/politics/tran-script-trump-foreign-policy.html?_r=0.
39 Donald Trump, “Speech on Iran Nuclear Deal”, Washington, DC, September 9, 2015, http://www.cnn.com/TRANSCRIPTS/1509/09/wolf.02.html.
40 The Associated Press, “North American Leaders Urge Against Donald Trump’s Isolationism,” Fortune, June 29, 2016, http://for-tune.com/2016/06/29/north-american-leaders-urge-against-don-ald-trumps-isolationism/.
41 Dina Smeltz, Ivo Daalder, and Craig Kafura, “Foreign Policy in the Age of Retrenchment: Results of the 2014 Chicago Council Survey,” September 15, 2014, https://www.thechicagocouncil.org/sites/de-fault/files/2014_CCS_Report_1.pdf.
42 Donald Trump, “Foreign Policy Speech,” Washington, DC, April 27, 2016, http://www.nytimes.com/2016/04/28/us/politics/tran-script-trump-foreign-policy.html?_r=0.Ibid.
43 Ibid.
44 Donald Trump, “Military,” YouTube, January, 24, 2016, https://www.youtube.com/watch?v=6iZKBv8xqyk.
45 Ayako Mie, “In first debate, Clinton rips Trump over Japan comments, reassures nervous Asian allies,” Japan Times, September 27, 2016, http://www.japantimes.co.jp/news/2016/09/27/national/politics-di-plomacy/first-debate-clinton-rips-trump-japan-comments-reas-sures-nervous-asian-allies/#.V-6J2fkrJhF.
46 Mark Hertling, “The danger of Trump’s NATO comments,” CNN, July 22, 2016, http://www.cnn.com/2016/07/22/opinions/trump-nato-po-sition-hertling/.
47 Donald Trump, “Foreign Policy Speech,” Washington, DC, April 27, 2016, http://www.nytimes.com/2016/04/28/us/politics/transcript- trump-foreign-policy.html?_r=0.
Conclusion48 Karen Tumulty and Robert Costa, “This is Trumpism: A personal-
ity-fueled run that resonates in an anxious era,” The Washington Post, June 13, 2016, https://www.washingtonpost.com/politics/after-orlando-trump-blows-past-political-norms/2016/06/13/f97ef168317d-11e6-8ff7-7b6c1998b7a0_story.html.

44 America in the Age of Uncertainty: 2016 Chicago Council Survey

Additional reports based on the 2016 Chicago Council Survey are available at www.thechicagocouncil.org:
“Americans Support Limited Military Action in Syria against ISIS,” Dina Smeltz, Craig Kafura, and Kelhan Martin, August 15, 2016.
“As Acts of Terror Proliferate, Americans See No End in Sight,” Dina Smeltz and Karl Friedhoff, August 22, 2016.
“Actually Americans Like Free Trade,” Dina Smeltz, Craig Kafura, and Lily Wojtowicz, September 7, 2016.
“On Eve of NATO Summit, Majority of Americans Say Alliance is Essential,” Craig Kafura and Dina Smeltz, July 6, 2016.
“Republicans Get behind Trump, but Not all of His Policies,” Dina Smeltz and Karl Friedhoff, July 18, 2016.
“Core Sanders Supporters’ Pessimism Sets Them Apart from Clinton Supporters,” Dina Smeltz, Karl Friedhoff, and Craig Kafura, July 25, 2016.

Chicago Council on Global AffairsTwo Prudential Plaza180 North Stetson Avenue Suite 1400 Chicago, Illinois 60601
The Chicago Council on Global Affairs is an independent, nonpartisan organization that provides insight—and influences the public discourse— on critical global issues. We convene leading global voices and conduct independent research to bring clarity and offer solutions to challenges and opportunities across the globe. Ranked the #1 Think Tank to Watch worldwide, the Council on Global Affairs is committed to engaging the public and raising global awareness of issues that transcend borders and transform how people, business, and governments engage the world.
Learn more at thechicagocouncil.org and follow @ChicagoCouncil.