2016 annual reports21.q4cdn.com/.../doc_financials/annual/wwt-ar-2016.pdfwater safety and flow...
TRANSCRIPT
2016W
atts Water Technologies, Inc. A
nnual Rep
ort W
atts Water Technologies, Inc. A
nnual Rep
ort
2016 Annual Report
3/21/17 6:39 PM

Our Mission:
To improve comfort, safety, and quality of life for people around the world through our expertise in a wide range of water technologies.
To be the best in the eyes of our associates, customers, and shareholders.
707069cov.indd 2

A Global Industry Leader
2016
Water is essential in our lives, and at Watts we are focused on delivering innovative solutions that
address water safety and regulation, energy efficiency, and water conservation.
Through our leading brands, we are a global manufacturer offering solutions for plumbing and flow
control, water quality, drainage and water reuse, and HVAC applications, primarily within commercial and
residential buildings.
We sell our products and solutions under many brand names, such as our Watts and Socla brands of
water safety and flow control products, BLÜCHER stainless steel drainage systems, and AERCO and PVI
brands of heating and hot water solutions.
We have been an industry leader for more than a century and have a history of innovation. Such
innovations include temperature and pressure relief valves, first introduced in the 1930s, and backflow
prevention products, introduced in the 1970s—both of which continue to be successful product lines.
With today’s technologies, our IntelliStation™ Digital Water Mixing System is enabling facility man-
agers to remotely monitor and control water temperatures in buildings. And our AERCO Benchmark®
Platinum commercial boiler enables pro-active system monitoring and efficiencies for significant savings
and superior return on investment.
We focus on a five-part corporate strategy to create shareholder value:
• Growth—Driving customer-focused innovation and focusing on key, specific geographies for growth
• Commercial Excellence—Delivering a superior customer experience and building world-class
commercial functions
• Operational Excellence—Empowering people with knowledge & tools to eliminate waste and
continuously improve
• One Watts—Working as a unified organization and promoting shared values, goals, and processes
• Talent & Performance Culture—Expecting accountability at all levels and encouraging innova-
tive thinking and ongoing development
Each day, we are helping people safely and efficiently use water, one of the world’s most precious
resources. Guided by our corporate strategy and our focus on customers and innovation, we are con-
tinuing our drive to improve comfort, safety, and quality of life for people around the world through
our expertise in a wide range of water technologies.
707069txt.indd 3 3/23/17 2:17 PM

The Global Management Team Photographed in the Watts® WorksSM Learning Center in North Andover, Massachusetts.Left to right:James F. Dagley, President, Heating and Hot Water Solutions Platform; Munish Nanda, President, Americas and Europe; Kenneth R. Lepage, General Counsel, Executive Vice President and Secretary; Robert J. Pagano, Jr., Chief Executive Officer and President; Todd A. Trapp, Chief Financial Officer; Jennifer L. Congdon, Chief Human Resources Officer; Elie A.Melhem, President, Asia-Pacific, the Middle East, and Africa; Ram Ramakrishnan, Executive Vice President, Strategy and Business Development
707069txtcx.indd 4 3/21/17 8:01 PM

To Our Shareholders
2016
We made great progress in 2016, as we strengthened our focus on the customer, fostered a “One Watts” global mindset, executed on many transformative initiatives, upgraded our portfolio, and
delivered strong operating performance. We believe our efforts this past year have positioned our Com-pany for growth.
2016 Financial Highlights Sales for the full year were $1.4 billion, down approximately $70 million, or five percent, on a reported
basis. The sales reduction was primarily the result of our 2015 decision to strategically exit non-core products of approximately $98 million. Acquired and organic sales contributed $24 million and $13 mil-lion, respectively, and were partially offset by $9 million in negative foreign exchange movements.
Organically, sales in the Americas and Asia-Pacific increased approximately one percent and 12 per-cent, respectively, while sales in Europe, the Middle East, and Africa (EMEA) were flat.
We committed to investors that our adjusted operating margin, a key profitability measure, would increase by 100 basis points in 2016. We are proud to report that we exceeded our goal, delivering a 130 basis point improvement year over year, to a record 11.4 percent. And we increased our adjusted operating margin while still making key investments in sales and marketing, research and development, information technology, and training.
Free cash flow continued to be a very good story for us. In 2016, free cash flow was $102 million, repre-senting a free cash flow conversion rate of 121 percent for the year. We achieved this while investing 30
For further discussion of “adjusted operating margin,” “adjusted earnings per share,” “free cash flow,” and “free cash flow conversion rate,” which are non-GAAP financial measures, and the comparable GAAP measures, see the section titled “Management’s Discussion and Analysis of Financial Condition and Results of Operations” in our Form 10-K included in this Annual Report to Shareholders.
707069txtcx.indd 5 3/21/17 8:01 PM

percent more in capital spending to upgrade our manufacturing processes, enhance our training capa-bilities, and improve our systems—all to support our growth and productivity.
Focusing on Customers In 2016, we continued our focus on customers, finding new ways to recognize their needs and provide
them with an expanded portfolio of products and solutions. To educate customers and gain valuable feedback, on April 20, 2016, we opened our world-class
Watts® WorksSM Learning Center in North Andover, Massachusetts. During the year, we also established a Learning Center in Dubai as part of our Middle East expansion, revamped our existing Learning Center in Biassono, Italy, and opened a satellite Learning Center in our Woodland, California, facility. These centers provide customers, channel partners, and Watts associates with valuable knowledge and experience with our products and systems—enabling them to gain an understanding of our unique value proposi-tion. We trained thousands of customers, channel partners, and sales representatives in our Learning Centers and through e-learning courses.
In November, we purchased PVI Industries, Inc. (PVI), a leading manufacturer of engineer-specified, high-capacity commercial water heaters for new construction and building retrofits. PVI complements our AERCO brand’s leading position in high-efficiency boilers. By acquiring PVI, we have strengthened our ability to provide our customers with complete heating and hot water system solutions.
Coming Together as “One Watts”We took meaningful steps in 2016 to foster a One Watts culture. In November, we held the first-ever
Connect conference, bringing together our top 140 leaders from around the world to focus on growth and accountability.
Earlier in the year, we initiated several key senior-level management changes to drive a One Watts mindset. Munish Nanda, our Americas leader, took over additional responsibilities for Europe. Eli Melhem, our Asia-Pacific leader, also assumed responsibility for the Middle East and Africa. We made these changes to simplify our organization and employ a more global business approach.
During 2016, we realigned platforms and leadership in both Europe and the Americas. In Europe, we now have a pan-European business structure for product management, marketing, and sales. We also created global product platforms for Drains, Water Quality, and Electronics. This supports our intention to gain voice of customer feedback from multiple regions, develop new products to meet customer needs globally, and promote more cross-selling opportunities around the world.
With the acquisition of PVI, we announced a new Heating and Hot Water Solutions platform, led by Jim Dagley. We expect this alignment to foster customer-centric system solutions in commercial applications.
Watts® WorksSM Learning Center in North Andover, Massachusetts
707069txt.indd 6 3/20/17 10:05 AM

Powers IntelliStationTM training Facility opening in Jebel Ali, Dubai PVI Industries in Fort Worth, Texas
2016
To also support “One Watts” in the eyes of our customers, in 2016 we launched a new global brand strategy. We are including a tieback of “A Watts Brand” beneath all of our brand logos globally on products, marketing collateral, and websites. Our goal is to clearly connect all our brands, leverage our collective strength, and enable customers to learn about all of our products and solutions.
Driving Operational ExcellenceIn 2016, we continued our commitment to operational excellence, and as part of this, we achieved sig-
nificant improvements in safety across the globe. Our safety performance for 2016 was the best on record in the history of the Company for both recordable and lost-time injuries.
In the last two years globally, recordable injuries have been cut by 55 percent, while lost-time injuries have decreased by more than 45 percent. We believe, however, that even one injury or accident is one too many, and we will continue to strive towards zero incidents.
During 2016, we realized the operational savings in the U.S. and EMEA that we expected. Our transfor-mation and restructuring initiatives, global sourcing, and ongoing productivity focus were key elements enabling our record adjusted operating margin.
While most of the Americas transformation was accomplished in 2016, we expect to complete phase 2 of the initiative in 2017. Phase 2 addresses our infrastructure requirements to support a streamlined product portfolio. We are on track to reduce our net operating footprint by approximately 30 percent. When completed, our phase 2 efforts should reduce working capital, improve our planning process, help create savings by reducing redundancy, and enable us to become a company that is easier to do business with. Further, we will drive new lean initiatives to generate additional operating efficiencies as part of our normal operations.
Driving Profitable GrowthWe are pursuing many avenues to drive profitable growth, including introducing new products, enter-
ing new markets and geographies, and becoming more of a solutions seller.In 2016, we launched our Hot Water Control Valve product line in Australia. This new product line,
which used the design capabilities of our Apex Valves business in New Zealand, is enabling us to grow in the Australian market.
We also completed the acquisition of a former joint venture company in South Korea, positioning our-selves to more effectively market AERCO and additional Watts brands in South Korea and other parts of Asia.
Looking ahead, we see exciting possibilities for driving growth. For example, customers are demand-ing smart solutions, as evidenced by the market response to the IntelliStation™ from our Powers brand. The IntelliStation is a smart hot water mixing and recirculation system for commercial and institutional
707069txt.indd 7 3/20/17 10:05 AM

AquaTowers in Colombia and China
2016
facilities. Sales in 2016, its first full year of availability, exceeded our expectations.We are also delivering products that support water conservation, an area of strong customer interest.
For example, in 2016 we launched in the Americas the BLÜCHER HygienicPro® line of stainless steel drains and channels, which are specifically designed to meet the stringent sanitation and efficiency demands of food processing and beverage production facilities. The design and construction of HygienicPro drains and channels allow them to be thoroughly cleaned with minimal water and little production downtime.
In 2017, we intend to continue to drive a streamlined new product development process across the globe focused on listening to customers, developing innovative solutions, and efficiently delivering those solutions to the market.
Helping Those in NeedAs a final note, 2016 was the first year of our partnership with the Planet Water Foundation, a U.S.-based
non-profit that helps bring clean drinking water to the world’s most disadvantaged communities. In March 2016, we supported the construction of an AquaTower at a school in the village of Campo de
la Cruz, Colombia. In September, we sponsored a similar tower at a school in the community of Luoxiang in the Guangxi province of southwestern China. The water towers provide great benefits to the schools and surrounding communities, and in China, members of our Asia-Pacific team were on site to construct the tower.
In 2017, we are expanding our partnership with the Planet Water Foundation and are sponsoring three additional water towers. Through this partnership, we have the power to help thousands of people ob-tain an absolute essential: access to clean drinking water. We are helping improve comfort, safety, and quality of life, and we are all very proud to be playing a part.
Delivering on CommitmentsOver the past year, we have made substantial progress in our journey to becoming a leaner, more
customer-centric organization. Our achievements, including stabilizing our foundation and driving trans-formation efforts, are helping to seed our future growth. This coming year, we will be particularly focused on growth through new product introductions, geographical expansion, and solutions selling. I am confident our team will continue to deliver on its commitments for 2017 and beyond.
Chief Executive Officer and President
707069txtcx.indd 8 3/21/17 8:01 PM

UNITED STATES SECURITIES AND EXCHANGE COMMISSION
Washington, D.C. 20549
FORM 10-K
ANNUAL REPORT PURSUANT TO SECTION 13 OR 15(d) OF THE SECURITIES EXCHANGE ACT OF 1934
For the fiscal year ended December 31, 2016
Or
TRANSITION REPORT PURSUANT TO SECTION 13 OR 15(d) OF THE SECURITIES EXCHANGE ACT OF 1934
Commission file number 001-11499
WATTS WATER TECHNOLOGIES, INC. (Exact name of registrant as specified in its charter)
Delaware 04-2916536 (State or Other Jurisdiction of (I.R.S. Employer Incorporation or Organization) Identification No.)
815 Chestnut Street, North Andover, MA 01845
(Address of Principal Executive Offices) (Zip Code)
Registrant’s telephone number, including area code: (978) 688-1811
Securities registered pursuant to Section 12(b) of the Act:
Title of Each Class Name of Each Exchange on Which Registered
Class A common stock, par value $0.10 per share New York Stock Exchange
Securities registered pursuant to Section 12(g) of the Act: None
Indicate by check mark if the registrant is a well-known seasoned issuer, as defined in Rule 405 of the Securities Act. Yes No Indicate by check mark if the registrant is not required to file reports pursuant to Section 13 or Section 15(d) of the Exchange Act. Yes No Indicate by check mark whether the registrant (1) has filed all reports required to be filed by Section 13 or 15(d) of the Securities Exchange Act of 1934 during the
preceding 12 months (or for such shorter period that the registrant was required to file such reports), and (2) has been subject to such filing requirements for the past 90 days. Yes No
Indicate by check mark whether the registrant has submitted electronically and posted on its corporate Web site, if any, every Interactive Data File required to be
submitted and posted pursuant to Rule 405 of Regulation S-T during the preceding 12 months (or for such shorter period that the registrant was required to submit and post such files). Yes No
Indicate by check mark if disclosure of delinquent filers pursuant to Item 405 of Regulation S-K is not contained herein, and will not be contained, to the best of
registrant’s knowledge, in definitive proxy or information statements incorporated by reference in Part III of this Form 10-K or any amendment to this Form 10-K. Indicate by check mark whether the registrant is a large accelerated filer, an accelerated filer, a non-accelerated filer, or a smaller reporting company. See the
definitions of “large accelerated filer,” “accelerated filer” and “smaller reporting company” in Rule 12b-2 of the Exchange Act. (Check one):
Large accelerated filer Accelerated filer Non-accelerated filer Smaller reporting company (Do not check if a smaller reporting company)
Indicate by check mark whether the registrant is a shell company (as defined in Rule 12b-2 of the Exchange Act). Yes No As of July 1, 2016, the aggregate market value of the registrant’s common stock held by non-affiliates of the registrant was approximately $1,657,749,907 based
on the closing sale price as reported on the New York Stock Exchange. Indicate the number of shares outstanding of each of the issuer’s classes of common stock, as of the latest practicable date.
Class Outstanding at January 27, 2017 Class A common stock, $0.10 par value per share 27,811,140 shares Class B common stock, $0.10 par value per share 6,379,290 shares
DOCUMENTS INCORPORATED BY REFERENCE
Portions of the Registrant’s Proxy Statement for its Annual Meeting of Stockholders to be held on May 17, 2017, are incorporated by reference into Part III of this
Annual Report on Form 10-K.

2
PART I
Item 1. BUSINESS.
This Annual Report on Form 10-K contains statements that are not historical facts and are considered forward-looking within the meaning of the Private Securities Litigation Reform Act of 1995. These forward-looking statements contain projections of our future results of operations or our financial position or state other forward-looking information. In some cases you can identify these forward-looking statements by words such as “anticipate,” “believe,” “could,” “estimate,” “expect,” “intend,” “may,” “should,” and “would” or similar words. You should not rely on forward-looking statements because they involve known and unknown risks, uncertainties and other factors, some of which are beyond our control. These risks, uncertainties and other factors may cause our actual results, performance or achievements to differ materially from the anticipated future results, performance or achievements expressed or implied by the forward-looking statements. Some of the factors that might cause these differences are described under Item 1A—“Risk Factors.” You should carefully review all of these factors, and you should be aware that there may be other factors that could cause these differences. These forward-looking statements were based on information, plans and estimates at the date of this report, and, except as required by law, we undertake no obligation to update any forward-looking statements to reflect changes in underlying assumptions or factors, new information, future events or other changes.
In this Annual Report on Form 10-K, references to “the Company,” “Watts Water,” “we,” “us” or “our” refer to
Watts Water Technologies, Inc. and its consolidated subsidiaries.
Overview
Watts Regulator Co. was founded by Joseph E. Watts in 1874 in Lawrence, Massachusetts. Watts Regulator Co. started as a small machine shop supplying parts to the New England textile mills of the 19th century and grew into a global manufacturer of products and systems focused on the control, conservation and quality of water and the comfort and safety of the people using it. Watts Water Technologies, Inc. was incorporated in Delaware in 1985 and became the parent company of Watts Regulator Co.
Our strategy is to be the preferred supplier of differentiated products and systems that manage and conserve the
flow of fluids and energy into, through and out of buildings in the residential and commercial markets of the Americas, EMEA (Europe, Middle East and Africa) and Asia-Pacific. Within this framework, we focus upon three themes: safety & regulation, energy efficiency and water conservation. This strategy enables us to continue our growth of earnings via increased sales, both organic and inorganic, and the systematic reduction of manufacturing costs and operational expenses.
We intend to continue to expand organically by introducing new products in existing markets, by enhancing our
preferred brands, by developing new complementary products, by promoting plumbing code development to drive the need for safety and water quality products and by continually improving merchandising in our wholesale distribution channels. We target selected new product and geographic markets based on growth potential, including our ability to leverage our existing distribution channels. Additionally, we leverage our distribution channels through the introduction of new products, as well as the integration of products of our acquired companies.
We intend to continue to generate incremental growth by targeting selected acquisitions, both in our core
markets as well as new complementary markets. We have completed 11 acquisitions in the last decade. Our acquisition strategy focuses on businesses that manufacture preferred brand name products that address our themes of safety & regulation, energy efficiency and water conservation in our primary or related complementary markets. We target businesses that will provide us with one or more of the following: an entry into new markets, an increase in shelf space with existing customers, strong brand names, a new or improved technology or an expansion of the breadth of our product offerings.
We are committed to reducing our manufacturing and operating costs using Lean methodologies to drive
improvement across all key processes, and consolidating our diverse manufacturing operations and distribution centers in Americas, EMEA and Asia-Pacific. We have a number of manufacturing facilities in lower-cost regions. In recent years, we have announced several global restructuring plans to reduce our manufacturing and distribution footprint in order to reduce our costs and to realize additional operating efficiencies.

3
Additionally, a majority of our manufacturing facilities are ISO 9000, 9001 or 9002 certified by the
International Organization for Standardization. Many of our sales are for products that have been approved under regulatory standards incorporated into state
and municipal plumbing, heating, building and fire protection codes in North America, Europe, and certain countries within Asia-Pacific. We have consistently advocated for the development and enforcement of plumbing codes and are committed to providing products to meet these standards, particularly for safety and control valve products.
Our business is reported in three geographic segments: Americas, EMEA and Asia-Pacific. The contributions of
each segment to net sales, operating income and the presentation of certain other financial information by segment are reported in Note 16 of the Notes to Consolidated Financial Statements and in “Management’s Discussion and Analysis of Financial Condition and Results of Operations” included elsewhere in this report.
Products
We have a broad range of products in terms of design distinction, size and configuration. We classify our many products into four global product lines. These product lines are:
• Residential & commercial flow control products—includes products typically sold into plumbing and hot
water applications such as backflow preventers, water pressure regulators, temperature and pressure relief valves, and thermostatic mixing valves. Residential & commercial flow control products accounted for approximately 56% of our total sales in 2016, 57% of our total sales in 2015, and 61% of our total sales in 2014.
• HVAC & gas products—includes commercial high-efficiency boilers, water heaters and heating solutions, hydronic and electric heating systems for under-floor radiant applications, custom heat and hot water solutions, hydronic pump groups for boiler manufacturers and alternative energy control packages, and flexible stainless steel connectors for natural and liquid propane gas in commercial food service and residential applications. HVAC & gas products accounted for approximately 29% of our total sales in 2016 and 2015 and 24% of our total sales in 2014. HVAC is an acronym for heating, ventilation and air conditioning.
• Drainage & water re-use products—includes drainage products and engineered rain water harvesting solutions for commercial, industrial, marine and residential applications. Drainage & water re-use products accounted for approximately 9% of our total sales in 2016 and 2015, and 10% of our total sales in 2014.
• Water quality products—includes point-of-use and point-of-entry water filtration, conditioning and scale
prevention systems for both commercial and residential applications. Water quality products accounted for approximately 6% of our total sales in 2016 and 5% of our total sales in each of 2015 and 2014.
Commercial and Operational Excellence
We strive to invest in product innovation that meets the wants and needs of our customers. Our focus is on differentiated products that will provide greater opportunity to distinguish and defend ourselves in the market place. Conversely, we want to migrate away from commoditized products where we cannot add value. Our goal is to be a solutions provider, not merely a components supplier. We refer to this customer-facing mindset as commercial excellence and we are continually looking for strategic opportunities to invest or divest, where necessary, in order to meet those objectives. In conjunction with this customer-centric focus, we continually review our operations to ensure we can efficiently and effectively produce and deliver products to customers. We call this aspect of our business operational excellence.
In 2015, our Board of Directors approved a program relating to the transformation of our Americas and
Asia-Pacific businesses. The first phase of the program primarily involved the exit of low-margin, non-core product lines and global sourcing actions. We eliminated approximately $165 million of our combined Americas and Asia-Pacific net sales that primarily sold through our do-it-yourself (DIY) distribution channel. We discontinued selling our remaining rationalized product lines as of the end of the first quarter of 2016. As part of the rationalization exercise,

4
we entered into an agreement to sell an operating subsidiary in China that was dedicated exclusively to the manufacturing of products being rationalized. We completed the sale in the second quarter of 2016. The second phase of the program is substantially complete and involved decreasing the square footage of our Americas facilities, which together with phase one, reduced the Americas net operating footprint by approximately 30%. The second phase is designed to improve the utilization of our remaining facilities, better leverage our cost structure, reduce working capital, and improve execution of customer delivery requirements. The second phase is expected to be complete in 2017. Refer to “Management’s Discussion and Analysis of Financial Condition and Results of Operations” for further discussion. Customers and Markets
We sell our products to plumbing, heating and mechanical wholesale distributors and dealers, original equipment manufacturers (OEMs), specialty product distributors, and major DIY chains. In September 2015, as part of the first phase of our transformation of our Americas and Asia-Pacific business, we divested a substantial portion of our DIY business in the Americas, which reduced the significance of DIY as a distribution channel for our products in 2016. In 2016, we added specialty as an additional primary distribution channel since this channel has become more prominent as a result of our acquisitions in recent years. This specialty channel is distinct and is managed separately from our traditional plumbing wholesale channel. The specialty channel was previously reported in the wholesale channel.
Wholesalers. Approximately 57% of our sales in 2016, 52% of our sales in 2015, and 59% of our sales in 2014 were to wholesale distributors for commercial and residential applications.
OEMs. Approximately 21% of our sales in 2016, 20% of our sales in 2015, and 24% of our sales in 2014 were
to OEMs. In the Americas, our typical OEM customers are water heater manufacturers and equipment and water systems manufacturers needing flow control devices and other products. Our sales to OEMs in EMEA are primarily to boiler manufacturers and radiant system manufacturers. Our sales to OEMs in Asia-Pacific are primarily to boiler, water heater and bath manufacturers, including manufacturers of faucet and shower products.
Specialty. Approximately 18% of our sales in 2016 and 2015, and 4% of our sales in 2014 were through our
specialty channel. The specialty channel primarily includes sales related to high-efficiency boilers and water heaters, water filtration and conditioning products, specialty floor and tile products, and food service products.
DIY Chains. Approximately 4% of our sales in 2016, 10% of our sales in 2015 and 13% of our sales in 2014 were to DIY chains.
In 2016, 2015 and 2014, no customer accounted for more than 10% of our total net sales. Our top ten customers
accounted for approximately $275.2 million, or 20% of our total net sales in 2016, $345.6 million, or 24%, of our total net sales in 2015; and $380.0 million, or 25%, of our total net sales in 2014. Thousands of other customers constituted the balance of our net sales in each of those years.
Marketing and Sales
For product sales in the Americas, we rely primarily on commissioned manufacturers’ representatives to market our product lines, some of which maintain a consigned inventory of our products. These representatives sell primarily to plumbing and heating wholesalers and contractors or service DIY stores. Our specialty channel in the Americas is sold through independent representatives, dealers and distributors. We also sell products directly to wholesalers, OEMs and private label accounts primarily in EMEA and Asia-Pacific, and to a lesser extent in the Americas. Manufacturing
We have integrated and automated manufacturing capabilities, including a state of the art lead-free foundry and a traditional brass and bronze foundry, machining, plastic extrusion and injection molding and assembly operations. Our foundry operations include metal pouring systems, automatic core making, and brass and bronze die-castings. Our machining operations feature computer-controlled machine tools, high-speed chucking machines with robotics and automatic screw machines for machining bronze, brass and steel components. We have invested in recent years to expand our manufacturing capabilities to ensure the availability of the most efficient and productive equipment. We are committed to maintaining our manufacturing equipment at a level consistent with current technology in order to

5
maintain high levels of quality and manufacturing efficiencies. In 2016, we continued to invest in our systems and in our manufacturing and training facilities.
Capital expenditures and depreciation for each of the last three years were as follows:
Years Ended December 31, 2016 2015 2014 (in millions)
Capital expenditures $ 36.0 $ 27.7 $ 23.7 Depreciation $ 30.4 $ 31.6 $ 32.9
Raw Materials
We require substantial amounts of raw materials to produce our products, including bronze, brass, cast iron, stainless steel, steel, plastic, and other materials used in our products. Substantially all of the raw materials we require are purchased from outside sources. The commodity markets have experienced volatility over the past several years, particularly with respect to copper and stainless steel. Bronze and brass are copper-based alloys. The price of copper had steadily declined over the three previous years, however prices began to increase in the second half of 2016. We expect to see increased commodity pricing in 2017 particularly with respect to copper and steel. The fact that we internationally source a significant amount of raw materials means that several months of raw materials and work in process are moving through our supply chain at any point in time. We are not able to predict whether commodity costs, including copper and stainless steel, will significantly increase or decrease in the future. If commodity costs increase in the future and we are not able to reduce or eliminate the effect of the cost increases by reducing production costs or implementing price increases, our profit margins could decrease. If commodity costs were to decline, we may experience pressures from customers to reduce our selling prices. The timing of any price reductions and decreases in commodity costs may not align. As a result, our margins could be affected.
With limited exceptions, we have multiple suppliers for our commodities and other raw materials. We believe
our relationships with our key suppliers are good and that an interruption in supply from any one supplier would not materially affect our ability to meet our immediate demands while another supplier is qualified. We regularly review our suppliers to evaluate their strengths. If a supplier is unable to meet our demands, we believe that in most cases our inventory of raw materials will allow for sufficient time to identify and obtain the necessary commodities and other raw materials from an alternate source. We believe that the nature of the commodities and other raw materials used in our business are such that multiple sources are generally available in the market.
Code Compliance
Products representing a majority of our sales are subject to regulatory standards and code enforcement, which typically require that these products meet stringent performance criteria. Standards are established by such industry test and certification organizations as the American Society of Mechanical Engineers (ASME), the America Water Works Association (AWWA), the Canadian Standards Association (CSA), the International Code Council (ICC), the American Society of Sanitary Engineering (ASSE), the American National Standards Institute—Leadership in Energy & Environmental Design (LEED), the University of Southern California Foundation for Cross-Connection Control and Hydraulic Research (USC FCCC & HR), the International Association of Plumbing and Mechanical Officials (IAPMO), FM Global (FM), NSF International (NSF) and Underwriters Laboratories (UL), the National Board (NB), the Environmental Protection Agency (EPA), and the Californian Energy Commission (CEC). Many of these standards are incorporated into state and municipal plumbing and heating, building and fire protection codes.
National regulatory standards in Europe vary by country. The major standards and/or guidelines that our
products must meet are AFNOR (France), DVGW (Germany), UNI/ICIM (Italy), KIWA (Netherlands), SVGW (Switzerland), SITAC (Sweden), WRAS (United Kingdom) and CEN (Denmark). Further, there are local regulatory standards requiring compliance as well.
Together with our commissioned manufacturers’ representatives, we have consistently advocated for the
development and enforcement of plumbing codes. We maintain stringent quality control and testing procedures at each of our manufacturing facilities in order to manufacture products that comply with code requirements. We believe that product-testing capability and investment in plant and equipment are needed to manufacture products that comply with code requirements. Our product-testing capabilities and dedicated investments are areas of strength for the Company.

6
Additionally, a majority of our manufacturing facilities are ISO 9000, 9001 or 9002 certified by the International Organization for Standardization.
New Product Development and Engineering
We retain our own product development staff, design teams, and testing laboratories in Americas, EMEA and Asia-Pacific that work to enhance our existing products and develop new products. We maintain sophisticated product development and testing laboratories and are committed to investing more in this area. In 2015, we re-engineered our new product development process and rolled out a uniform global program. In 2016, we continued to focus on our global program and expect it to drive innovation to our markets more effectively. Research and development costs included in selling, general, and administrative expense amounted to $26.5 million, $23.5 million and $22.5 million for the years ended December 31, 2016, 2015 and 2014, respectively.
Competition
The domestic and international markets for safety & regulation, energy efficiency and water conservation devices are intensely competitive and require us to compete against some companies possessing greater financial, marketing and other resources than ours. Due to the breadth of our product offerings, the number and identities of our competitors vary by product line and market. We consider quality, brand preference, delivery times, engineering specifications, plumbing code requirements, price, technological expertise, breadth of product offerings and integrated solutions offerings to be the primary competitive factors. We believe that new product development and product engineering are also important to success in the water industry and that our position in the industry is attributable in part to our ability to develop new and innovative products quickly and to adapt and enhance existing products. We continue to develop new and innovative products to enhance our market position and are continuing to implement manufacturing and design programs to reduce costs. We cannot be certain that our efforts to develop new products will be successful or that our customers will accept our new products. Although we own certain patents and trademarks that we consider to be of importance, we do not believe that our business and competitiveness as a whole are dependent on any one of our patents or trademarks or on patent or trademark protection generally.
Backlog
Backlog was approximately $83.2 million at January 29, 2017 and approximately $88.6 million at February 5, 2016. We do not believe that our backlog at any point in time is indicative of future operating results and we expect our entire current backlog to be converted to sales in 2017.
Employees
As of December 31, 2016, we employed approximately 4,800 people worldwide. With the exception of two subsidiaries, one in Canada and the other in New York, none of our employees in North America or Asia are covered by collective bargaining agreements. In some European countries, our employees are subject to traditional national collective bargaining agreements. We believe that our employee relations are good.
Product Liability, Environmental and Other Litigation Matters
We are subject to a variety of potential liabilities connected with our business operations, including potential liabilities and expenses associated with possible product defects or failures and compliance with environmental laws. We maintain product liability and other insurance coverage, which we believe to be generally in accordance with industry practices. Nonetheless, such insurance coverage may not be adequate to protect us fully against substantial damage claims.
Contingencies Connector Class Actions In November and December 2014, Watts Water Technologies, Inc. and Watts Regulator Co. were named as defendants in three separate putative nationwide class action complaints (Meyers v. Watts Water Technologies, Inc., United States District Court for the Southern District of Ohio; Ponzo v. Watts Regulator Co., United States District

7
Court for the District of Massachusetts; Sharp v. Watts Regulator Co., United States District Court for the District of Massachusetts) seeking to recover damages and other relief based on the alleged failure of water heater connectors. On June 26, 2015, plaintiffs in the three actions filed a consolidated amended complaint, under the case captioned Ponzo v. Watts Regulator Co., in the United States District Court for the District of Massachusetts (hereinafter “Ponzo”). Watts Water Technologies was voluntarily dismissed from the Ponzo case. The complaint seeks among other items, damages in an unspecified amount, replacement costs, injunctive relief, declaratory relief, and attorneys’ fees and costs. On August 7, 2015, the Company filed a motion to dismiss the complaint, which motion was temporarily withdrawn pending final approval of the settlement. After initial discovery was conducted the parties agreed to a mediation of all claims, which resulted in the below-referenced settlement.
In February 2015, Watts Regulator Co. was named as a defendant in a putative nationwide class action complaint (Klug v. Watts Water Technologies, Inc., et al., United States District Court for the District of Nebraska) seeking to recover damages and other relief based on the alleged failure of the Company’s Floodsafe connectors (hereinafter “Klug”). On June 26, 2015, the Company filed a partial motion to dismiss the complaint. In response, on July 17, 2015, plaintiff filed an amended complaint which added additional named plaintiffs and sought to correct deficiencies in the original complaint, Klug v. Watts Regulator Co., United States District Court for the District of Nebraska. The complaint seeks among other items, damages in an unspecified amount, injunctive relief, declaratory relief, and attorneys’ fees and costs. On July 31, 2015, the Company filed a partial motion to dismiss the complaint which was granted in part and denied in part on December 29, 2015. The Company answered the amended complaint on February 2, 2016. No formal discovery has yet been conducted.
We participated in mediation sessions of the Ponzo and Klug cases in December 2015 and January 2016. On
February 16, 2016, we reached an agreement in principle to settle all claims. The proposed total settlement amount is $14 million, of which we expect to pay approximately $4.1 million after insurance proceeds of up to $9.9 million. The parties executed final written settlement agreements in April 2016. Motions for preliminary approval of the settlements were submitted on May 4, 2016 before the District of Nebraska Federal Court. On December 7, 2016, the Court issued an order preliminarily approving the settlements. The settlements are subject to final court approval after a fairness hearing set for April 12, 2017. Accordingly, there can be no assurance that the proposed settlements will be approved in their current form. If the settlements are not approved, the Company intends to continue to vigorously contest the allegations in these cases.
Environmental Remediation
We have been named as a potentially responsible party with respect to a limited number of identified contaminated sites. The levels of contamination vary significantly from site to site as do the related levels of remediation efforts. Environmental liabilities are recorded based on the most probable cost, if known, or on the estimated minimum cost of remediation. Accruals are not discounted to their present value, unless the amount and timing of expenditures are fixed and reliably determinable. We accrue estimated environmental liabilities based on assumptions, which are subject to a number of factors and uncertainties. Circumstances that can affect the reliability and precision of these estimates include identification of additional sites, environmental regulations, level of clean-up required, technologies available, number and financial condition of other contributors to remediation and the time period over which remediation may occur. We recognize changes in estimates as new remediation requirements are defined or as new information becomes available.
Asbestos Litigation
We are defending approximately 332 lawsuits in different jurisdictions, alleging injury or death as a result of exposure to asbestos. The complaints in these cases typically name a large number of defendants and do not identify any of our particular products as a source of asbestos exposure. To date, discovery has failed to yield evidence of substantial exposure to any of our products and no judgments have been entered against us.
Other Litigation
Other lawsuits and proceedings or claims, arising from the ordinary course of operations, are also pending or threatened against us.

8
Available Information
We maintain a website with the address www.wattswater.com. The information contained on our website is not included as a part of, or incorporated by reference into, this Annual Report on Form 10-K. Other than an investor’s own internet access charges, we make available free of charge through our website our Annual Report on Form 10-K, quarterly reports on Form 10-Q and current reports on Form 8-K, and amendments to these reports, as soon as reasonably practicable after we have electronically filed such material with, or furnished such material to, the Securities and Exchange Commission (SEC).
Executive Officers and Directors
Set forth below are the names of our executive officers and directors, their respective ages and positions with our Company and a brief summary of their business experience for at least the past five years:
Executive Officers Age Position Robert J. Pagano, Jr. 54 Chief Executive Officer Todd A. Trapp 46 Chief Financial Officer Jennifer L. Congdon 47 Chief Human Resources Officer Kenneth R. Lepage
46
General Counsel, Executive Vice President & Secretary
Elie A. Melhem
53
President, Asia-Pacific, the Middle East & Africa
Munish Nanda 52 President, Americas & Europe Non-Employee Directors Robert L. Ayers(2)(3) 71 Director Bernard Baert(1)(3) 67 Director Richard J. Cathcart(2)(3) 72 Director Christopher L. Conway(2)(3) 61 Director David A. Dunbar(1)(3) 55 Director Jes Munk Hansen(2)(3) 49 Director W. Craig Kissel(3) 66 Chairman of the Board and Director Joseph T. Noonan 35 Director Merilee Raines(1)(3) 61 Director Joseph W. Reitmeier(1)(3) 52 Director
(1) Member of the Audit Committee (2) Member of the Compensation Committee (3) Member of the Nominating and Corporate Governance Committee
Robert J. Pagano, Jr. has served as Chief Executive Officer and President of our Company since May 2014. He
also served as interim Chief Financial Officer from October 2014 to April 2015. Mr. Pagano previously served as Senior Vice President of ITT Corporation and President, ITT Industrial Process from April 2009 to May 2014. Mr. Pagano originally joined ITT in 1997 and served in several additional management roles during his career at ITT, including as Vice President Finance, Corporate Controller, and President of Industrial Products. ITT Corporation is a diversified manufacturer of highly engineered critical components and customized technology solutions for the energy, transportation and industrial markets. Prior to joining ITT, Mr. Pagano worked at KPMG LLP. Mr. Pagano is a Certified Public Accountant.
Todd A. Trapp has served as Chief Financial Officer since April 2015. Mr. Trapp previously served as Vice
President of Financial Planning & Analysis of Honeywell International Inc. from August 2013 to April 2015. Mr. Trapp originally joined Honeywell in 2002 and served in several senior financial roles, including as Chief Financial Officer of the Airlines Business Unit from November 2010 to August 2013, Vice President of Business Analysis & Planning for Honeywell’s Aerospace Division from 2008 to November 2010, Director of Finance for the Transportation Systems Division from 2006 to 2008, Director of Business Analysis & Planning from 2005 to 2006, Investor Relations Manager

9
from 2003 to 2005 and Senior Financial Analyst from 2002 to 2003. Honeywell is a Fortune 100 diversified technology and manufacturing leader, serving customers worldwide with aerospace products and services; control technologies for buildings, homes and industry; turbochargers; and performance materials. Prior to joining Honeywell, Mr. Trapp worked as Assistant Treasurer at United Business Media Inc. and Manager of Treasury Services and Special Projects at Pearson Inc.
Jennifer L. Congdon has served as Chief Human Resources Officer since December 2016. Ms. Congdon
previously served as Vice President, Human Resources, Applied Water Systems and Business Transformation and Continuous Improvement with Xylem Inc. from August 2012 to December 2016. Xylem is a global designer, manufacturer and equipment and service provider for water and wastewater applications. From 2010 to August 2012, Ms. Congdon served as Vice President, Human Resources, Power Transmission for Rexnord Corporation. Rexnord Corporation is a multi-industry manufacturer and marketer of highly engineered mechanical power transmission components and water management products. From 2004 to 2010, Ms. Congdon held several human resources management positions of increasing responsibility with Honeywell International Inc. Prior to joining Honeywell, Ms. Congdon was a Human Resources Manager with Cisco Systems, Inc. and worked as a human resources consultant.
Kenneth R. Lepage has served as General Counsel, Executive Vice President and Secretary of the Company
since August 2008. He also served as Executive Vice President of Human Resources from December 2009 to October 2015. Mr. Lepage originally joined our Company in September 2003 as Assistant General Counsel and Assistant Secretary. Prior to joining our Company, he was a junior partner at the law firm of Hale and Dorr LLP (now Wilmer Cutler Pickering Hale and Dorr LLP).
Elie A. Melhem has served as President, Asia-Pacific, Middle East & Africa since February 2016. Mr. Melhem
originally joined our Company in July 2011 as President, Asia-Pacific. Mr. Melhem was previously the Managing Director of China for Ariston Thermo Group, a global manufacturer of heating and hot water products, from 2008 to July 2011. Prior to joining Ariston, Mr. Melhem spent eleven years with ITT Industries in China where he held several management positions, including serving as President of ITT’s Residential and Commercial Water Group in China and President of ITT’s Water Technology Group in Asia.
Munish Nanda has served as President, Americas & Europe since February 2016. Mr. Nanda originally joined
our Company in April 2015 as President, Americas. Mr. Nanda previously served as President of Control Technologies for ITT Corporation from April 2011 to March 2015. Mr. Nanda also served as Group Vice President of ITT Corporation’s Fluid and Motion Control Group from April 2008 to April 2011. ITT Corporation is a diversified manufacturer of highly engineered critical components and customized technology solutions for the energy, transportation and industrial markets. Prior to joining ITT Corporation, Mr. Nanda held several operating leadership and general management positions with Thermo Fisher Scientific Corporation and Honeywell International Inc.
Robert L. Ayers has served as a director of our Company since October 2006. He was Senior Vice President of ITT Industries and President of ITT Industries’ Fluid Technology from October 1999 until September 2005. Mr. Ayers continued to be employed by ITT Industries from September 2005 until his retirement in September 2006, during which time he focused on special projects for the company. Mr. Ayers joined ITT Industries in 1998 as President of ITT Industries’ Industrial Pump Group. Before joining ITT Industries, he was President of Sulzer Industrial USA and Chief Executive Officer of Sulzer Bingham, a pump manufacturer. Mr. Ayers served as a director of T-3 Energy Services, Inc. from August 2007 to January 2011.
Bernard Baert has served as a director of our Company since August 2011. Mr. Baert served as Senior Vice
President and President, Europe and International of PolyOne Corporation from January 2010 until his retirement in April 2012. Mr. Baert served as Senior Vice President and General Manager, Color and Engineered Materials—Europe and China for PolyOne Corporation from 2006 to December 2009 and as Vice President and General Manager, Color and Engineered Materials—Europe and China from 2000 to 2006. From 1995 to September 2000, Mr. Baert was General Manager, Color—Europe for M.A. Hanna Company, the predecessor to PolyOne Corporation. PolyOne Corporation is a worldwide provider of specialty polymer materials, services and solutions. Prior to joining M.A. Hanna, Mr. Baert was General Manager, Europe for Hexcel Corporation and spent 17 years with Owens Corning where he served as a plant manager and held various positions in the areas of cost control and production. On December 9, 2016, Mr. Baert informed us of his decision not to stand for re-election to our Board of Directors at our 2017 Annual Meeting of Stockholders.

10
Richard J. Cathcart has served as a director of our Company since October 2007. He was Vice Chairman and a member of the Board of Directors of Pentair, Inc. from February 2005 until his retirement in September 2007. Pentair is a diversified manufacturing company consisting of three operating segments: Flow & Filtration Solutions, Water Quality Systems and Technical Solutions. He was appointed President and Chief Operating Officer of Pentair’s Water Quality Systems group in January 2001 and served in that capacity until his appointment as Vice Chairman in February 2005. He began his career at Pentair in March 1995 as Executive Vice President, Corporate Development, where he identified water as a strategic area of growth. In February 1996, he was named Executive Vice President and President of Pentair’s Water Technologies Group. Prior to joining Pentair, he held several management and business development positions during his 20-year career with Honeywell International Inc. He is a director of Fluidra S.A., an international manufacturer of accessories and products for swimming pools, irrigation, and water treatment and purification systems.
Christopher L. Conway has served as a director of our Company since June 2015. Mr. Conway is currently
President and Chief Executive Officer and Chairman of the Board of CLARCOR Inc. Mr. Conway has been employed by CLARCOR or its affiliates since 2006, when he was named Vice President of Manufacturing of Baldwin Filters, Inc., an affiliate of CLARCOR. In September 2007, Mr. Conway was promoted to the position of President of Facet USA, Inc., another affiliate of CLARCOR. He was then named President of CLARCOR’s PECOFacet division in December 2007 and continued in that role until being named as President and Chief Operating Officer of CLARCOR in May 2010. In December 2011, Mr. Conway assumed the position of President and Chief Executive Officer of CLARCOR. CLARCOR is a diversified marketer and manufacturer of mobile, industrial and environmental filtration products sold in domestic and international markets. Prior to joining CLARCOR or its affiliates, Mr. Conway served for two years as the Chief Operating Officer of Cortron Corporation, Inc., a small manufacturing start-up based in Minneapolis, Minnesota. Mr. Conway also served for seven years in various management positions at Pentair, Inc., an international provider of products, services, and solutions for its customers’ diverse needs in water and other fluids, thermal management, and equipment protection.
David A. Dunbar has served as a director of our Company since February 2017. Mr. Dunbar has served as
President and Chief Executive Officer and a member of the Board of Directors of Standex International Corporation since January 2014. Standex is a global, multi-industry manufacturer in five broad business segments: Food Service Equipment Group, Engineering Technologies Group, Engraving Group, Electronics Group, and Hydraulics Group. Mr. Dunbar previously served as President of the valves and controls global business unit of Pentair Ltd. from October 2009 to December 2013. The unit was initially owned by Tyco Flow Control and Tyco Flow Control and Pentair merged in 2012. Pentair is a global provider of products and services relating to energy, water, thermal management and equipment protection. Prior to his tenure at Pentair, Mr. Dunbar held a number of senior positions at Emerson Electric Co., including President of each of the following: Emerson Process Management Europe; Machinery Health Management; and Emerson Climate Technologies Refrigeration.
Jes Munk Hansen has served as a director of our Company since February 2017. Mr. Hansen has served as
Chief Executive Officer of LEDVANCE GmbH since July 2015. LEDVANCE is the general lighting lamps business unit of OSRAM GmbH. Mr. Hansen previously served as Chief Executive Officer of the classical lamps and ballast business unit of OSRAM from January 2015 to July 2015 and as Chief Executive Officer of OSRAM Americas and President of OSRAM Sylvania from October 2013 to January 2015. OSRAM is a leading global lighting manufacturer. Prior to his tenure at OSRAM, Mr. Hansen served in several senior management roles with Grundfos from 2000 to October 2013, including as Chief Executive Officer and President of Grundfos North America from 2007 to October 2013. Grundfos is a leading global manufacturer of pumps as well as motors and electronics for monitoring and controlling pumps.
W. Craig Kissel has served as a director of our Company since November 2011. Mr. Kissel previously was employed by American Standard Companies Inc. from 1980 until his retirement in September, 2008. American Standard was a leading worldwide supplier of air conditioning and heating systems, vehicle control systems, and bathroom china and faucet-ware. During his time at American Standard, Mr. Kissel served as President of Trane Commercial Systems from 2004 to June, 2008, President of WABCO Vehicle Control Systems from 1998 to 2003, President of the Trane North American Unitary Products Group from 1994 to 1997, Vice President of Trane Marketing of the North American Unitary Products Group from 1992 to 1994 and he held various other management positions at Trane from 1980 to 1991. From 2001 to 2008, Mr. Kissel served as Chairman of American Standard’s Corporate Ethics and Integrity Council, which was responsible for developing the company’s ethical business standards. Mr. Kissel also served in the U.S. Navy from 1973 to 1978. Mr. Kissel has served as a director of Chicago Bridge & Iron Company since May 2009. Chicago Bridge & Iron Company engineers and constructs some of the world’s largest energy infrastructure projects.

11
Joseph T. Noonan has served as a director of our Company since May 2013. Mr. Noonan has served as Chief
Executive Officer of Homespun Design, Inc. since November 2013. Homespun Design is a start-up phase online retailer of American-made furniture and design founded by Mr. Noonan. Mr. Noonan previously worked as an independent digital strategy consultant from November 2012 to November 2013. Mr. Noonan was employed by Wayfair LLC from April 2008 to November 2012. During his time at Wayfair, Mr. Noonan served as Senior Director of Wayfair International from June 2011 to November 2012, Director of Category Management and Merchandising from February 2009 to June 2011 and Manager of Wayfair’s Business-to-Business Division from April 2008 to February 2009. Wayfair is an online retailer of home furnishings, décor and home improvement products. Prior to joining Wayfair, Mr. Noonan worked as a venture capitalist at Polaris Partners and as an investment banker at Cowen & Company.
Merilee Raines has served as a director of our Company since February 2011. Ms. Raines served as Chief
Financial Officer of IDEXX Laboratories, Inc. from October 2003 until her retirement in May 2013. Prior to becoming Chief Financial Officer, Ms. Raines held several management positions with IDEXX Laboratories, including Corporate Vice President of Finance, Vice President and Treasurer of Finance, Director of Finance, and Controller. IDEXX Laboratories develops, manufactures and distributes diagnostic and information technology-based products and services for companion animals, livestock, poultry, water quality and food safety, and human point-of-care diagnostics. Ms. Raines served as a member of the Board of Directors of Affymetrix, Inc., a provider of life science and molecular diagnostic products that enable analysis of biological systems at the gene, protein and cell level, from January 2015 until it was acquired in March 2016. Ms. Raines is a member of the Board of Directors of Aratana Therapeutics, Inc., a pet therapeutics company focused on licensing, developing and commercializing biopharmaceutical products for companion animals.
Joseph W. Reitmeier has served as a director of our Company since February 2016. Mr. Reitmeier has served as
Executive Vice President & Chief Financial Officer of Lennox International Inc. since July 2012. Mr. Reitmeier had served as Vice President of Finance for the LII Commercial business segment of Lennox International from 2007 to July 2012 and as Director of Internal Audit from 2005 to 2007. Lennox International is a leading global provider of climate control solutions and designs, manufactures and markets a broad range of products for the heating, ventilation, air conditioning and refrigeration markets. Before joining Lennox International, Mr. Reitmeier held financial leadership roles at Cummins Inc. and PolyOne Corporation.
Item 1A. RISK FACTORS. Economic cycles, particularly those involving reduced levels of commercial and residential starts and remodeling, may have adverse effects on our revenues and operating results.
We have experienced and expect to continue to experience fluctuations in revenues and operating results due to economic and business cycles. The businesses of most of our customers, particularly plumbing and heating wholesalers and OEM manufacturers, are cyclical. Therefore, the level of our business activity has been cyclical, fluctuating with economic cycles. An economic downturn may also affect the financial stability of our customers, which could affect their ability to pay amounts owed to their vendors, including us. We also believe our level of business activity is influenced by commercial and residential starts and renovation and remodeling, which are, in turn, heavily influenced by interest rates, consumer debt levels, changes in disposable income, employment growth and consumer confidence. Credit market conditions may prevent commercial and residential builders or developers from obtaining the necessary capital to continue existing projects or to start new projects. This may result in the delay or cancellation of orders from our customers or potential customers and may adversely affect our revenues and our ability to manage inventory levels, collect customer receivables and maintain profitability. If economic conditions worsen in the future or if economic recovery were to dissipate, our revenues and profits could decrease or trigger additional goodwill, indefinite-lived intangible assets, or long-lived asset impairments and could have a material effect on our financial condition and results of operations.
We face intense competition and, if we are not able to respond to competition in our markets, our revenues and profits may decrease.
Competitive pressures in our markets could adversely affect our competitive position, leading to a possible loss of market share or a decrease in prices, either of which could result in decreased revenues and profits. We encounter intense competition in all areas of our business. Additionally, we believe our customers are attempting to reduce the

12
number of vendors from which they purchase in order to reduce the size and diversity of their inventories and their transaction costs. To remain competitive, we will need to invest continually in manufacturing, product development, marketing, customer service and support and our distribution networks. We may not have sufficient resources to continue to make such investments and we may be unable to maintain our competitive position. In addition, we anticipate that we may have to reduce the prices of some of our products to stay competitive, potentially resulting in a reduction in the profit margin for, and inventory valuation of, these products. Some of our competitors are based in foreign countries and have cost structures and prices in foreign currencies. Accordingly, currency fluctuations could cause our U.S. dollar costed products to be less competitive than our competitors’ products costed in other currencies.
Changes in the costs of raw materials could reduce our profit margins. Reductions or interruptions in the supply of components or finished goods from international sources could adversely affect our ability to meet our customer delivery commitments.
We require substantial amounts of raw materials, including bronze, brass, cast iron, stainless steel and plastic, and substantially all of the raw materials we require are purchased from outside sources. The costs of raw materials may be subject to change due to, among other things, interruptions in production by suppliers and changes in exchange rates and worldwide price and demand levels. We typically do not enter into long-term supply agreements. Our inability to obtain supplies of raw materials for our products at favorable costs could have a material adverse effect on our business, financial condition or results of operations by decreasing our profit margins. The commodity markets have experienced tremendous volatility over the past several years, particularly copper. Should commodity costs increase substantially, we may not be able to recover such costs, through selling price increases to our customers or other product cost reductions, which would have a negative effect on our financial results. If commodity costs decline, we may experience pressure from customers to reduce our selling prices. Additionally, we continue to purchase increased levels of components and finished goods from international sources. In limited cases, these components or finished goods are single-sourced. The availability of components and finished goods from international sources could be adversely impacted by, among other things, interruptions in production by suppliers, suppliers’ allocations to other purchasers and new laws, tariffs, or regulations.
Changes in regulations or standards could adversely affect our business
Our products and business are subject to a wide variety of statutory, regulatory and industry standards and requirements. A significant change to regulatory requirements, whether federal, foreign, state or local, or to industry standards, could substantially increase manufacturing costs, impact the size and timing of demand for our products, or put us at a competitive disadvantage, any of which could harm our business and have a material adverse effect on our financial condition, results of operations and cash flow.
Implementation of our acquisition strategy may not be successful, which could affect our ability to increase our revenues or our profitability.
One of our strategies is to increase our revenues and profitability and expand our business through acquisitions that will provide us with complementary products and increase market share for our existing product lines. We cannot be certain that we will be able to identify, acquire or profitably manage additional companies or successfully integrate such additional companies without substantial costs, delays or other problems. Also, companies acquired recently and in the future may not achieve anticipated revenues, cost synergies, profitability or cash flows that justify our investment in them. We have faced increasing competition for acquisition candidates, which has resulted in significant increases in the purchase prices of many acquisition candidates. This competition, and the resulting purchase price increases, may limit the number of acquisition opportunities available to us, possibly leading to a decrease in the rate of growth of our revenues and profitability. In addition, acquisitions may involve a number of risks, including, but not limited to:
• inadequate internal controls over financial reporting and our ability to bring such controls into compliance
with the requirements of Section 404 of the Sarbanes-Oxley Act of 2002 in a timely manner; • adverse short-term effects on our reported operating results; • diversion of management’s attention; • investigations of, or challenges to, acquisitions by competition authorities;

13
• loss of key personnel at acquired companies; • unanticipated management or operational problems or legal liabilities; and • potential goodwill, indefinite-lived intangible assets, or long- lived asset impairment charges.
We are subject to risks related to product defects, which could result in product recalls and could subject us to warranty claims in excess of our warranty provisions or which are greater than anticipated due to the unenforceability of liability limitations.
We maintain strict quality controls and procedures, including the testing of raw materials and safety testing of selected finished products. However, we cannot be certain that our testing will reveal latent defects in our products or the materials from which they are made, which may not become apparent until after the products have been sold into the market. We also cannot be certain that our suppliers will always eliminate latent defects in products we purchase from them. Accordingly, there is a risk that product defects will occur, which could require a product recall. Product recalls can be expensive to implement and, if a product recall occurs during the product’s warranty period, we may be required to replace the defective product. In addition, a product recall may damage our relationship with our customers and we may lose market share with our customers. Our insurance policies may not cover the costs of a product recall.
Our standard warranties contain limits on damages and exclusions of liability for consequential damages and
for misuse, improper installation, alteration, accident or mishandling while in the possession of someone other than us. We may incur additional operating expenses if our warranty provision does not reflect the actual cost of resolving issues related to defects in our products. If these additional expenses are significant, it could adversely affect our business, financial condition and results of operations.
We face risks from product liability and other lawsuits, which may adversely affect our business.
We have been and expect to continue to be subject to various product liability claims or other lawsuits, including, among others, that our products include inadequate or improper instructions for use or installation, inadequate warnings concerning the effects of the failure of our products, alleged manufacturing or design defects, or allegations that our products contained asbestos. If we do not have adequate insurance or contractual indemnification, damages from these claims would have to be paid from our assets and could have a material adverse effect on our results of operations, liquidity and financial condition. Like other manufacturers and distributors of products designed to control and regulate fluids and gases, we face an inherent risk of exposure to product liability claims and other lawsuits in the event that the use of our products results in personal injury, property damage or business interruption to our customers. We cannot be certain that our products will be completely free from defect. In addition, in certain cases, we rely on third-party manufacturers for our products or components of our products. We cannot be certain that our insurance coverage will continue to be available to us at a reasonable cost, or, if available, will be adequate to cover any such liabilities. For more information, see “Item 1. Business—Product Liability, Environmental and Other Litigation Matters.”
Economic and other risks associated with international sales and operations could adversely affect our business and future operating results.
Since we sell and manufacture our products worldwide, our business is subject to risks associated with doing business internationally. Our business and future operating results could be harmed by a variety of factors, including:
• unexpected geo-political events in foreign countries in which we operate, which could adversely affect
manufacturing and our ability to fulfill customer orders;
• our inability to comply with anti-corruption laws and regulations of the U.S. government and various international jurisdictions, such as the U.S. Foreign Corrupt Practices Act and the United Kingdom’s Bribery Act of 2010;
• trade protection measures and import or export duties or licensing requirements, which could increase our costs of doing business internationally;

14
• potentially negative consequences from changes in tax laws, which could have an adverse impact on our profits;
• difficulty in staffing and managing widespread operations, which could reduce our productivity;
• costs of compliance with differing labor regulations, especially in connection with restructuring our overseas operations;
• laws of some foreign countries, which may not protect our intellectual property rights to the same extent as the laws of the U.S.;
• unexpected changes in regulatory requirements, which may be costly and require time to implement; and
• foreign exchange rate fluctuations, which could also materially affect our reported results. A portion of our sales and certain portions of our costs, assets and liabilities are denominated in currencies other than U.S. dollars, and the percentage of our revenues denominated in a particular currency may not match the percentage of our expenses denominated in that currency. Approximately 40% of our sales during the year ended December 31, 2016 were from sales outside of the U.S. compared to 38.1% and 43.9% for the years ended December 31, 2015 and 2014, respectively. We cannot predict whether currencies such as the euro, Canadian dollar, Chinese yuan, or other currencies in which we transact will appreciate or depreciate against the U.S. dollar in future periods or whether future foreign exchange rate fluctuations will have a positive or negative impact on our reported results.
Our ability to achieve savings through our restructuring and business transformation activities may be adversely affected by management’s ability to fully execute the plans as a result of local regulations, geo-political risk or other factors within or beyond the control of management.
We have implemented a number of restructuring and business transformation activities, which include steps that we believe are necessary to enhance the value and performance of the Company, including reducing operating costs and increasing efficiencies throughout our manufacturing, sales and distribution footprint. Factors within or beyond the control of management may change the total estimated costs or the timing of when the savings will be achieved under the plans. Further, if we are not successful in completing the restructuring or business transformation activities timely or if additional or unanticipated issues such as labor disruptions, inability to retain key personnel during and after the transformation or higher exit costs arise, our expected cost savings may not be met and our operating results could be negatively affected. In addition, our restructuring and transformation activities may place substantial demands on our management, which could lead to diversion of management’s attention from other business priorities and result in a reduced customer focus.
Future operating results could be negatively affected by the resolution of various uncertain tax positions and by potential changes to tax incentives.
In the ordinary course of our business, there are many transactions and calculations where the ultimate tax determination is uncertain. Significant judgment is required in determining our worldwide provision for income taxes. We periodically assess our exposures related to our worldwide provision for income taxes and believe that we have appropriately accrued taxes for contingencies. Any reduction of these contingent liabilities or additional assessment would increase or decrease income, respectively, in the period such determination was made. Our income tax filings are regularly under audit by tax authorities and the final determination of tax audits could be materially different than that which is reflected in historical income tax provisions and accruals. As issues arise during tax audits we adjust our tax accrual accordingly. Additionally, we benefit from certain tax incentives offered by various jurisdictions. If certain tax incentives were discontinued or if we are unable to meet the requirements of such incentives, our inability to use these benefits could have a material negative effect on future earnings.
We are currently a decentralized company, which presents certain risks.
We are currently a decentralized company, which sometimes places significant control and decision-making powers in the hands of local management. This presents various risks such as the risk of being slower to identify or react to problems affecting a key business. Additionally, we are implementing in a phased approach a company-wide initiative

15
to standardize and upgrade our enterprise resource planning (ERP) systems. This initiative could be more challenging and costly to implement because divergent legacy systems currently exist. Further, if the ERP updates are not successful, we could incur substantial business interruption, including our ability to perform routine business transactions, which could have a material adverse effect on our financial results.
Our business and financial performance may be adversely affected by information technology and other business disruptions.
Our business may be impacted by disruptions, including information technology attacks or failures, threats to physical security, as well as damaging weather or other acts of nature, pandemics or other public health crises. Cyber security attacks, in particular, are evolving and include, but are not limited to, malicious software, attempts to gain unauthorized access to data, and other electronic security breaches that could lead to disruptions in systems, unauthorized release of confidential or otherwise protected information and corruption of data. We have experienced cyber security attacks and may continue to experience them going forward, potentially with more frequency. Given the unpredictability of the timing, nature and scope of such disruptions, we could potentially be subject to production downtimes, operational delays, other detrimental impacts on our operations or ability to provide products to our customers, the compromising of confidential or otherwise protected information, misappropriation, destruction or corruption of data, security breaches, other manipulation or improper use of our systems or networks, financial losses from remedial actions, loss of business or potential liability, and/or damage to our reputation, any of which could have a material adverse effect on our competitive position, results of operations, cash flows or financial condition.
The requirements to evaluate goodwill, indefinite-lived intangible assets and long-lived assets for impairment may result in a write-off of all or a portion of our recorded amounts, which would negatively affect our operating results and financial condition.
As of December 31, 2016, our balance sheet included goodwill, indefinite-lived intangible assets, amortizable intangible assets and property, plant and equipment of $532.7 million, $35.3 million, $167.2 million and $189.7 million, respectively. In lieu of amortization, we are required to perform an annual impairment review of both goodwill and indefinite-lived intangible assets. In performing our annual reviews in 2016, 2015 and 2014, we recognized pre-tax non-cash indefinite-lived intangible asset impairment charges of approximately $0.4 million, $0.6 million and $1.3 million, respectively. In 2016, none of our reporting units were impaired. In 2015 and 2014, we did recognize pre-tax non-cash goodwill impairment charges of $129.7 million and $12.9 million, respectively. The $129.7 million charge in 2015 related to an impairment within the EMEA reporting unit and represented approximately 74% of the reporting unit’s goodwill balance. The $12.9 million charge in 2014 related to a full impairment within the Asia-Pacific reporting unit. We are also required to perform an impairment review of our long-lived assets if indicators of impairment exist. In 2016, we recognized a pre-tax non-cash charge of $0.1 million, and we recognized a pre-tax non-cash charge of $0.3 million in 2015. There were no impairments recognized in 2014.
There can be no assurances that future goodwill, indefinite-lived intangible assets or other long-lived asset
impairments will not occur. We perform our annual test for indications of goodwill and indefinite-lived intangible assets impairment in the fourth quarter of our fiscal year or sooner if indicators of impairment exist.
The loss or financial instability of major customers could have an adverse effect on our results of operations.
In 2016, our top ten customers accounted for approximately 20% of our total net sales with no one customer accounting for more than 10% of our total net sales. Our customers generally are not obligated to purchase any minimum volume of products from us and are able to terminate their relationships with us at any time. In addition, increases in the prices of our products could result in a reduction in orders from our customers. A significant reduction in orders from, or change in terms of contracts with, any significant customers could have a material adverse effect on our future results of operations.
Certain indebtedness may limit our ability to pay dividends, incur additional debt and make acquisitions and other investments.
Our revolving credit facility and other senior indebtedness contain operational and financial covenants that restrict our ability to make distributions to stockholders, incur additional debt and make acquisitions and other investments unless we satisfy certain financial tests and comply with various financial ratios. If we do not maintain

16
compliance with these covenants, our creditors could declare a default under our revolving credit facility or senior notes and our indebtedness could be declared immediately due and payable. Our ability to comply with the provisions of our indebtedness may be affected by changes in economic or business conditions beyond our control. Further, one of our strategies is to increase our revenues and profitability and expand our business through acquisitions. We may require capital in excess of our available cash and the unused portion of our revolving credit facility to make large acquisitions, which we would generally obtain from access to the credit markets. There can be no assurance that if a large acquisition is identified that we would have access to sufficient capital to complete such acquisition. Should we require additional debt financing above our existing credit limit, we cannot be assured such financing would be available to us or available to us on reasonable economic terms.
One of our stockholders can exercise substantial influence over our Company.
As of January 30, 2017, Timothy P. Horne beneficially owned 6,329,290 shares of Class B common stock and no shares of Class A common stock. Our Class B common stock entitles its holders to ten votes for each share and our Class A common stock entitles its holders to one vote per share. As of January 30, 2017, Timothy P. Horne beneficially owned approximately 18.5% of our outstanding shares of Class A common stock (assuming conversion of all shares of Class B common stock beneficially owned by Mr. Horne into Class A common stock) and approximately 99.2% of our outstanding shares of Class B common stock, which represents approximately 69.1% of the total outstanding voting power. As long as Mr. Horne controls shares representing at least a majority of the total voting power of our outstanding stock, Mr. Horne will be able to unilaterally determine the outcome of most stockholder votes, and other stockholders will not be able to affect the outcome of any such votes.
Conversion and sale of a significant number of shares of our Class B common stock could adversely affect the market price of our Class A common stock.
As of January 27, 2017, there were outstanding 27,811,140 shares of our Class A common stock and 6,379,290 shares of our Class B common stock. Shares of our Class B common stock may be converted into Class A common stock at any time on a one for one basis. Under the terms of a registration rights agreement with respect to outstanding shares of our Class B common stock, the holders of our Class B common stock have rights with respect to the registration of the underlying Class A common stock. Under these registration rights, the holders of Class B common stock may require, on up to two occasions that we register their shares for public resale. If we are eligible to use Form S-3 or a similar short-form registration statement, the holders of Class B common stock may require that we register their shares for public resale up to two times per year. If we elect to register any shares of Class A common stock for any public offering, the holders of Class B common stock are entitled to include shares of Class A common stock into which such shares of Class B common stock may be converted in such registration. However, we may reduce the number of shares proposed to be registered in view of market conditions. We will pay all expenses in connection with any registration, other than underwriting discounts and commissions. If all of the available registered shares are sold into the public market the trading price of our Class A common stock could decline.
Item 1B. UNRESOLVED STAFF COMMENTS.
None.
Item 2. PROPERTIES.
We maintain 30 principal manufacturing, warehouse and distribution centers worldwide, including our corporate headquarters located in North Andover, Massachusetts. Additionally, we maintain numerous sales offices and other smaller manufacturing facilities and warehouses. The principal properties in each of our three geographic segments and their location, principal use and ownership status are set forth below:

17
Americas:
Location Principal Use Owned/Leased North Andover, MA Corporate Headquarters Owned Burlington, ON, Canada Distribution Center Owned Export, PA Manufacturing Owned Franklin, NH Manufacturing/Distribution Owned St. Pauls, NC Manufacturing Owned Fort Worth, TX Manufacturing/Distribution Owned San Antonio, TX Warehouse/Distribution Owned Spindale, NC Distribution Center Owned Blauvelt, NY Manufacturing/Distribution Leased Peoria, AZ Manufacturing/Distribution Leased Reno, NV Distribution Center Leased Vernon, BC, Canada Manufacturing/Distribution Leased Woodland, CA Manufacturing Leased
Europe, Middle East and Africa:
Location Principal Use Owned/Leased Biassono, Italy Manufacturing/Distribution Owned Hautvillers, France Manufacturing Owned Landau, Germany Manufacturing/Distribution Owned Mery, France Manufacturing Owned Plovdiv, Bulgaria Manufacturing Owned Sorgues, France Distribution Center Owned Vildbjerg, Denmark Manufacturing/Distribution Owned Virey-le-Grand, France Manufacturing/Distribution Owned Amsterdam, Netherlands EMEA Headquarters Leased Gardolo, Italy Manufacturing Leased Monastir, Tunisia Manufacturing Leased Rosières, France Manufacturing/Distribution Leased St. Neots, United Kingdom Manufacturing/Distribution Leased
Asia-Pacific:
Location Principal Use Owned/Leased Ningbo, Beilun, China Manufacturing Owned Shanghai, China Asia-Pacific Headquarters Leased Ningbo, Beilun District, China Distribution Center Leased Auckland, New Zealand Manufacturing/Distribution Leased
Certain of our facilities are subject to mortgages and collateral assignments under loan agreements with
long-term lenders. In general, we believe that our properties, including machinery, tools and equipment, are in good condition, well maintained and adequate and suitable for their intended uses.
Item 3. LEGAL PROCEEDINGS.
We are from time to time involved in various legal and administrative proceedings. See Item 1. “Business—Product Liability, Environmental and Other Litigation Matters,” and Note 14 of the Notes to Consolidated Financial Statements, both of which are incorporated herein by reference.
Item 4. MINE SAFETY DISCLOSURES.
Not applicable.

18
PART II
Item 5. MARKET FOR REGISTRANT’S COMMON EQUITY, RELATED STOCKHOLDER MATTERS AND ISSUER PURCHASES OF EQUITY SECURITIES.
The following table sets forth the high and low sales prices of our Class A common stock on the New York
Stock Exchange during 2016 and 2015 and cash dividends declared per share.
2016 2015 High Low Dividend High Low Dividend
First Quarter $ 55.70 $ 44.94 $ 0.17 $ 64.16 $ 52.16 $ 0.15 Second Quarter 60.55 53.95 0.18 56.53 52.03 0.17 Third Quarter 65.90 57.11 0.18 57.74 48.09 0.17 Fourth Quarter 70.60 59.25 0.18 60.22 49.51 0.17
There is no established public trading market for our Class B common stock, which is held by members of the
Horne family. The principal holders of such stock are subject to restrictions on transfer with respect to their shares. Each share of our Class B common stock (10 votes per share) is convertible into one share of Class A common stock (1 vote per share).
On February 8, 2017, we declared a quarterly dividend of eighteen cents ($0.18) per share on each outstanding
share of Class A common stock and Class B common stock. Aggregate common stock dividend payments in 2016 were $24.5 million, which consisted of $20.0 million and
$4.5 million for Class A shares and Class B shares, respectively. Aggregate common stock dividend payments in 2015 were $23.1 million, which consisted of $18.8 million and $4.3 million for Class A shares and Class B shares, respectively. While we presently intend to continue to pay comparable cash dividends, the payment of future cash dividends depends upon the Board of Directors’ assessment of our earnings, financial condition, capital requirements and other factors.
The number of record holders of our Class A common stock as of January 27, 2017 was 150. The number of
record holders of our Class B common stock as of January 27, 2017 was 8. We satisfy the minimum withholding tax obligation due upon the vesting of shares of restricted stock and the
conversion of restricted stock units into shares of Class A common stock by automatically withholding from the shares being issued a number of shares with an aggregate fair market value on the date of such vesting or conversion that would satisfy the withholding amount due.
The following table includes information with respect to shares of our Class A common stock withheld to
satisfy withholding tax obligations during the quarter ended December 31, 2016.
Issuer Purchases of Equity Securities (d) Maximum Number (or (a) Total (c) Total Number of Approximate Dollar Number of Shares (or Units) Value) of Shares (or Shares (or (b) Average Purchased as Part of Units) that May Yet Be Units) Price Paid per Publicly Announced Purchased Under the Period Purchased Share (or Unit) Plans or Programs Plans or Programs
October 3, 2016 - October 30, 2016 584 $ 63.83 — —
October 31, 2016 - November 27, 2016 419 $ 59.25 — —
November 28, 2016 - December 31, 2016 — $ — — —
Total 1,003 $ 61.92 — —

19
The following table includes information with respect to repurchases of our Class A common stock during the three-month period ended December 31, 2016 under our stock repurchase program.
Issuer Purchases of Equity Securities (d) Maximum Number (or (a) Total (c) Total Number of Approximate Dollar Number of (b) Average Shares (or Units) Value) of Shares (or Shares (or Price Paid Purchased as Part of Units) that May Yet Be Units) per Share Publicly Announced Purchased Under the Period Purchased(1) (or Unit) Plans or Programs Plans or Programs
October 3, 2016 - October 30, 2016 22,050 $ 63.26 22,050 $ 59,063,231
October 31, 2016 - November 27, 2016 20,550 $ 64.09 20,550 $ 57,746,208
November 28, 2016 - December 31, 2016 25,200 $ 68.30 25,200 $ 56,024,399
Total 67,800 $ 65.22 67,800 $ 56,024,399
(1) On July 27, 2015, the Board of Directors authorized a new stock repurchase program of up to $100 million of the
Company’s Class A common stock to be purchased from time to time on the open market or in privately negotiated transactions. The timing and number of shares repurchased will be determined by the Company’s management based on its evaluation of market conditions and other factors.
Performance Graph
Set forth below is a line graph comparing the cumulative total shareholder return on our Class A common stock for the last five years with the cumulative return of companies on the Standard & Poor’s 500 Stock Index and the Russell 2000 Index. We chose the Russell 2000 Index because it represents companies with a market capitalization similar to that of Watts Water. The graph assumes that the value of the investment in our Class A common stock and each index was $100 at December 31, 2011 and that all dividends were reinvested.

20
COMPARISON OF 5 YEAR CUMULATIVE TOTAL RETURN* Among Watts Water Technologies, Inc., the S&P 500 Index
and the Russell 2000 Index
* $100 invested on 12/31/11 in stock or index, including reinvestment of dividends. Fiscal year ending December 31.
Cumulative Total Return
12/31/11 12/31/12 12/31/13 12/31/14 12/31/15 12/31/16
Watts Water Technologies, Inc. 100 127.16 184.81 191.37 151.62 201.40 S & P 500 100 116.00 153.58 174.60 177.01 198.18 Russell 2000 100 116.35 161.52 169.43 161.95 196.45
The above Performance Graph and related information shall not be deemed “soliciting material” or to be
“filed” with the Securities and Exchange Commission, nor shall such information be incorporated by reference into any future filing under the Securities Act of 1933 or Securities Exchange Act of 1934, each as amended, except to the extent that we specifically incorporate it by reference into such filing.

21
Item 6. SELECTED FINANCIAL DATA.
The selected financial data set forth below should be read in conjunction with our consolidated financial statements, related Notes thereto and “Management’s Discussion and Analysis of Financial Condition and Results of Operations” included herein.
FIVE-YEAR FINANCIAL SUMMARY (Amounts in millions, except per share and cash dividend information)
Year Ended Year Ended
Year Ended
Year Ended
Year Ended
12/31/16(1) 12/31/15(2) 12/31/14(3) 12/31/13(4)(6) 12/31/12(5)(6)
Statement of operations data: Net sales $ 1,398.4 $ 1,467.7 $ 1,513.7 $ 1,473.5 $ 1,427.4 Net income (loss) from continuing operations 84.2 (112.9) 50.3 60.9 70.4 Loss from discontinued operations, net of taxes — — — (2.3) (2.0) Net income (loss) 84.2 (112.9) 50.3 58.6 68.4 DILUTED EPS Income (loss) per share:
Continuing operations 2.44 (3.24) 1.42 1.71 1.95 Discontinued operations — — — (0.07) (0.05) NET INCOME (LOSS) 2.44 (3.24) 1.42 1.65 1.90
Cash dividends declared per common share $ 0.71 $ 0.66 $ 0.58 $ 0.50 $ 0.44 Balance sheet data (at year end): Total assets $ 1,800.3 $ 1,692.8 $ 1,948.0 $ 1,740.2 $ 1,709.0 Long‑term debt, net of current portion 511.3 576.2 577.8 305.5 307.5
(1) For the year ended December 31, 2016, net income includes the following net pre-tax costs: long-lived asset
impairment charges of $0.5 million, acquisition costs of $2.0 million, purchase accounting adjustments of $2.0 million, restructuring charges of $4.7 million, deployment costs related to the Americas, Asia-Pacific, and EMEA transformation programs of $14.2 million, and debt issuance costs of $0.3 million. Net income also includes a pre-tax gain of $8.7 million related to the disposition of a subsidiary in China.
(2) For the year ended December 31, 2015, net loss includes the following net pre-tax costs: goodwill and other
long-lived asset impairment of $130.5 million, acquisition related costs of $1.6 million, restructuring related costs of $21.4 million, Americas, Asia-Pacific, and EMEA transformation deployment costs of $14.3 million, a $3.5 million charge for a settlement in principle relating to two class action lawsuits, a $2.5 million charge related to the resolution of certain product liability legacy claims for non-core products which we have exited, and long-term obligations settlements, including our pension plan and supplemental employee retirement plan obligations of $64.7 million. The net after-tax cost of these items was $197.3 million.
(3) For the year ended December 31, 2014, net income includes the following net pre-tax costs: goodwill and other
long-lived asset impairment of $14.2 million, acquisitions related costs of $5.8 million, restructuring and severance related costs of $16.4 million, EMEA and Americas transformation deployment costs of $9.3 million, and customs settlements costs of $1.9 million. The net after-tax cost of these items was $38.5 million.
(4) For the year ended December 31, 2013, net income from continuing operations includes the following net pre-tax
costs: legal costs of $15.3 million, restructuring charges of $8.7 million, goodwill and other long-lived asset impairment of $2.3 million (of which $1.1 million is recorded in cost of goods sold), EMEA transformation deployment costs of $1.2 million, earn-out adjustments of $0.9 million, acceleration of executive share based compensation expense of $0.9 million and an adjustment to the disposal of the business related to the sale of Tianjin Watts Valve Company Ltd. (TWVC) of $0.6 million. The net after-tax cost of these items was $18.3 million.
(5) For the year ended December 31, 2012, net income from continuing operations includes the following net pre-tax
costs: restructuring charges of $5.2 million, goodwill and other long-lived asset impairment of $3.4 million, net legal and customs costs of $2.5 million, an adjustment to the gain on sale of TWVC of $1.6 million, retention charges related to our former Chief Financial Officer of $1.6 million, and a charge of $0.4 million for costs related

22
to the 2012 acquisition of Tekmar, offset by a pre-tax gain for an earn-out adjustment of $1.0 million. Additionally, net income includes tax benefits totaling $0.7 million, primarily related to a tax law change in Italy. The net after-tax cost of these items was $8.1 million.
(6) In August 2013, we disposed of 100% of the stock of Austroflex. Results from operations and a loss on disposal are
recorded in discontinued operations for 2013 and 2012. In December 2012, we disposed of 100% of the stock of Flomatic Corporation. Results from operations and a loss on disposal are recorded in discontinued operations for 2012.
Item 7. MANAGEMENT’S DISCUSSION AND ANALYSIS OF FINANCIAL CONDITION AND RESULTS
OF OPERATIONS. Overview
We are a leading supplier of products and solutions that manage and conserve the flow of fluids and energy into, through and out of buildings in the residential and commercial markets of the Americas, EMEA and Asia-Pacific. For over 140 years, we have designed and produced valve systems that safeguard and regulate water systems, energy efficient heating and hydronic systems, drainage systems and water filtration technology that helps conserve water. We earn revenue and income almost exclusively from the sale of our products. Our principal product lines include:
• Residential & commercial flow control products—includes products typically sold into plumbing and hot
water applications such as backflow preventers, water pressure regulators, temperature and pressure relief valves, and thermostatic mixing valves.
• HVAC & gas products—includes commercial high-efficiency boilers, water heaters and heating solutions, hydronic and electric heating systems for under-floor radiant applications, custom heat and hot water solutions, hydronic pump groups for boiler manufacturers and alternative energy control packages, and flexible stainless steel connectors for natural and liquid propane gas in commercial food service and residential applications. HVAC is an acronym for heating, ventilation and air conditioning.
• Drainage & water re-use products—includes drainage products and engineered rain water harvesting solutions for commercial, industrial, marine and residential applications.
• Water quality products—includes point-of-use and point-of-entry water filtration, conditioning and scale prevention systems for both commercial and residential applications.
Our business is reported in three geographic segments: Americas, EMEA, and Asia-Pacific. We distribute our products through four primary distribution channels: wholesale, original equipment manufacturers (OEMs), specialty, and do-it-yourself (DIY). In September 2015, we divested a substantial portion of our DIY business in the Americas, which reduced the significance of DIY as a distribution channel for our products in 2016. In 2016, we added specialty as an additional primary distribution channel since this channel has become more prominent as a result of our acquisitions in recent years. The specialty channel primarily includes independent representatives who sell high-efficiency boilers and water heaters, independent water filtration and conditioning dealers, specialty floor and tile distributors, and food service distributors. This specialty channel is distinct and is managed separately from our traditional plumbing wholesale channel. The specialty channel was previously reported in the wholesale channel.
We believe that the factors relating to our future growth include our ability to continue to make selective acquisitions, both in our core markets as well as in new complementary markets; regulatory requirements relating to the quality and conservation of water and the safe use of water; increased demand for clean water; continued enforcement of plumbing and building codes; and a healthy economic environment. We have completed 11 acquisitions in the last decade. Our acquisition strategy focuses on businesses that promote our key macro themes around safety & regulation, energy efficiency and water conservation. We target businesses that will provide us with one or more of the following: an entry into new markets and/or new geographies, improved channel access, unique and/or proprietary technologies, advanced production capabilities or complementary solution offerings.
We strive to invest in product innovation that meets the needs of our customers and our end markets. Our focus is on differentiated products that provide greater opportunity to distinguish ourselves in the market place and on

23
providing system solutions to our customers rather than supplying components. We continually look for strategic opportunities to invest in new products and markets or divest existing product lines where necessary in order to meet those objectives.
Products representing a majority of our sales are subject to regulatory standards and code enforcement, which typically require that these products meet stringent performance criteria. Together with our commissioned manufacturers’ representatives, we have consistently advocated for the development and enforcement of such plumbing codes. We are focused on maintaining stringent quality control and testing procedures at each of our manufacturing facilities in order to manufacture products in compliance with code requirements and take advantage of the resulting demand for compliant products. We believe that the product development, product testing capability and investment in plant and equipment needed to manufacture products in compliance with code requirements, represent a competitive advantage for us.
In 2016, we made significant progress on our transformation programs (discussed below), continued to drive commercial excellence, and delivered on operational excellence. We completed the integration of the Apex Valves Limited (“Apex”) and AERCO Korea Co., Ltd., (“AERCO Korea”) acquisitions, and added PVI Industries, LLC (“PVI”) to our portfolio late in the year. AERCO Korea was renamed Watts Korea in January 2017. Our financial performance in 2016 was mixed, driven by different economic and business dynamics within each region in which we operate. In the Americas, there was an overall decline in reported sales, which was primarily driven by the exit of our non-core products in 2015 as well as lower than anticipated sales of AERCO products primarily attributable to project timing. AERCO is a leading provider of commercial high-efficiency boilers, water heaters and heating solutions in North Americas. This decline was partially offset by growth in our drains business, control valves and specialty products. In EMEA, there was growth in our electronics platform due to new product introductions and growth in our HVAC market in Italy, offset by continued decline in the OEM boiler market in Germany as well as declines in the UK primarily related to the challenging economic environment. In Asia-Pacific there was growth in 2016, primarily related to increased sales of valves outside of China and strong demand for our underfloor heating products for residential applications in China.
Overall, reported sales for 2016 declined 4.7%, or $69.3 million, primarily due to the exit of non-core products, which caused a decrease of $98.0 million year over year. This decrease was partially offset by increases in sales from acquired companies of $24.0 million. Compared to 2015, reported sales in Americas and EMEA declined by 7.9% and 0.7%, respectively, while reported sales in Asia-Pacific grew by 26.3%. Organic sales for 2016 grew by 1.0%, or $13.1 million, as compared to 2015. Compared to 2015, organic sales in Americas and Asia-Pacific grew by 0.8% and 11.8%, respectively, while organic sales in EMEA were essentially flat compared to 2015. Organic sales is a non-GAAP measure that excludes the impacts of acquisitions, divestitures and foreign exchange from year-over-year comparisons. Divested sales includes the exit of our non-core products through sale and through the discontinuation of product lines. Management believes reporting organic sales growth provides useful information to investors, potential investors and others, because it allows for a more complete understanding of underlying sales trends by providing sales growth on a consistent basis. We reconcile the change in organic sales to our reported sales for each region within our results below. In 2015, our Board of Directors approved a program relating to the transformation of our Americas and Asia-Pacific businesses. The first phase of the program primarily involved the exit of low-margin, non-core product lines and global sourcing actions. We eliminated approximately $165 million of our combined Americas and Asia-Pacific net sales that primarily sold through our DIY distribution channel. We discontinued selling our remaining rationalized product lines as of the end of the first quarter of 2016. As part of the rationalization exercise, we entered into an agreement to sell an operating subsidiary in China that was dedicated exclusively to the manufacturing of products being rationalized. We completed the sale in the second quarter of 2016, recognized a pre-tax gain of $8.7 million and received total proceeds from the sale of $8.4 million. The pre-tax gain includes a non-cash accumulated currency translation adjustment of $7.3 million. The second phase of the program involves the consolidation of manufacturing facilities and distribution center network optimization in the Americas. Together with phase one, the transformation reduced the Americas net operating footprint by approximately 30%. The second phase is substantially complete and is designed to improve the utilization of our remaining facilities, better leverage our cost structure, reduce working capital, and improve execution of customer delivery requirements. The second phase is expected to be completed in 2017.
On a combined basis, the total estimated pre-tax cost for our transformation program related to our Americas and Asia-Pacific businesses is approximately $65 million, including restructuring costs of $19.5 million, goodwill and intangible asset impairments of $13.4 million and other transformation and deployment costs of approximately $32 million. Other transformation and deployment costs include consulting and project management fees and other

24
associated costs. Costs of the program are expected to be incurred through the middle of 2017. Refer to Notes 3 and 4 of the Notes to Consolidated Financial Statements in this Annual Report on Form 10-K, for further details.
Acquisitions and Disposals
On November 2, 2016, we acquired 100% of the shares of PVI Riverside Holdings, Inc., the parent company of PVI. The aggregate purchase price recorded, including an estimated working capital adjustment, was approximately $79.2 million, and is subject to final post-closing working capital adjustments. PVI is a leading manufacturer of commercial stainless steel water heating equipment, focused on the high capacity market in North America and is based in Fort Worth, Texas. Its water heater product offering complements AERCO’s boiler products, allowing us to address customers’ total heating and hot water requirements.
On February 26, 2016, we acquired an additional 50% of the outstanding shares of AERCO Korea for an
aggregate purchase price of approximately $4 million. Prior to February 26, 2016, we held a 40% interest in AERCO Korea, which operated as a joint venture. On December 30, 2016, we acquired the remaining 10% of the outstanding shares of AERCO Korea for $0.8 million. This acquisition is expected to expand both AERCO’s boiler market and the sale of Watts’ products in Asia.
On September 22, 2015, we signed an agreement to sell an operating subsidiary in China that was dedicated to
the production of non-core products. The sale was finalized in the second quarter of 2016, and we received total proceeds of approximately $8.4 million from the sale as of the fourth quarter of 2016. We recognized a pre-tax gain of $8.7 million, which includes a non-cash accumulated currency translation adjustment of $7.3 million. The net after-tax gain was approximately $8.3 million.
On November 30, 2015, we completed the acquisition of 80% of the outstanding shares of Apex Valves
Limited (“Apex”), a New Zealand company, with a commitment to purchase the remaining 20% ownership within three years of closing. The aggregate purchase price was approximately $20.4 million, and we recorded a liability of $5.5 million as the estimate of the acquisition date fair value on the contractual call option to purchase the remaining 20%. Apex manufactures high-end valves for the New Zealand market that we believe could be introduced in the China market and other countries in South East Asia.
Recent Developments
On February 8, 2017, we declared a quarterly dividend of eighteen cents ($0.18) per share on each outstanding share of Class A common stock and Class B common stock payable on March 16, 2017 to stockholders of record on March 2, 2017.
On February 8, 2017, the Board of Directors elected David A. Dunbar and Jes Munk Hansen to serve as
members of the Board of Directors. Mr. Dunbar was appointed as a member of the Audit Committee and the Nominating and Corporate Governance Committee and Mr. Hansen was appointed as a member of the Compensation Committee and the Nominating and Corporate Governance Committee.
Results of Operations Year Ended December 31, 2016 Compared to Year Ended December 31, 2015
Net Sales. Our business is reported in three geographic segments: Americas, EMEA and Asia-Pacific. Our net sales in each of these segments for the years ended December 31, 2016 and December 31, 2015 were as follows:
Year Ended Year Ended % Change to December 31,2016 December 31,2015 Consolidated Net Sales % Sales Net Sales % Sales Change Net Sales (dollars in millions)
Americas $ 900.9 64.5 % $ 978.5 66.7 % $ (77.6) (5.3)%EMEA 442.3 31.6 445.5 30.3 (3.2) (0.2) Asia‑Pacific 55.2 3.9 43.7 3.0 11.5 0.8 Total $ 1,398.4 100.0 % $ 1,467.7 100.0 % $ (69.3) (4.7)%

25
The change in net sales was attributable to the following:
Change As a % Change As a % of Consolidated Net Sales of Segment Net Sales
Asia‑ Asia‑ Asia‑
America
s EMEA Pacific Total Americas EMEA Pacific Total Americas EMEA Pacific (dollars in millions) Organic $ 7.7 $ 1.0 $ 4.4 $ 13.1 0.6 % 0.1 % 0.3 % 1.0 % 0.8 % 0.2 % 11.8 % Foreign exchange (2.4) (4.2) (1.8) (8.4) (0.2) (0.3) (0.1) (0.6) (0.2) (0.9) (4.2) Divested (91.8) — (6.2) (98.0) (6.3) (0.4) (6.7) (9.4) (15.8)
Acquisitions 8.9 —
15.1 24.0 0.6 — 1.0 1.6 0.9 — 34.5
Total $ (77.6) $ (3.2) $
11.5 $ (69.3) (5.3)% (0.2)% 0.8 % (4.7)% (7.9)% (0.7)% 26.3 %
The change in organic net sales as a percentage of consolidated net sales and of segment net sales in the Americas and Asia-Pacific excludes divested sales for both periods presented.
Our products are sold to wholesalers, OEMs, DIY chains, and through various specialty channels. The change in organic net sales by channel was attributable to the following:
Change As a % of Prior Year Sales Wholesale DIY OEMs Specialty Total Wholesale DIY OEMs Specialty (dollars in millions)
Americas $ 3.7 $ 1.0 $ 4.3 $ (1.3) $ 7.7 0.7 % 1.7 % 6.3 % (0.5)% EMEA 1.8 (3.0) 2.2 — 1.0 0.7 (35.6) 1.0 — Asia‑Pacific 8.2 — (3.8) — 4.4 30.4 — (36.2) — Total $ 13.7 $ (2.0) $ 2.7 $ (1.3) $ 13.1
The change in organic net sales by channel in the Americas and Asia-Pacific excludes divested sales for both
periods presented. Organic net sales in the Americas increased $7.7 million compared to 2015 primarily due to growth in our
wholesale markets and OEM channels, particularly relating to backflow, valve, and drainage products. Organic net sales in EMEA increased slightly compared to 2015 mainly due to improved demand in certain key
markets like Italy and new product introductions in our electronics platform. These increases were partially offset by declines in the OEM boiler market in Germany, sales declines in France, and by project delays in our drains business partly driven by the impact of economic and political uncertainty in the UK.
Organic net sales in the Asia-Pacific wholesale market increased as compared to 2015 primarily due to strong
demand for our underfloor heating products for residential applications as well as for our water and plumbing products outside of China.
The net decrease in sales due to foreign exchange was primarily due to the depreciation of the euro, Chinese
yuan and the Canadian dollar against the U.S. dollar in 2016. We cannot predict whether foreign currencies will appreciate or depreciate against the U.S. dollar in future periods or whether future foreign exchange rate fluctuations will have a positive or negative impact on our net sales.
The decrease in total net sales due to divested products of $98.0 million was a result of the exit of our low margin, non-core products beginning after the first quarter 2015 in our Americas and Asia-Pacific segments. Divested sales includes the exit of our non-core products through sale and through the discontinuation of product lines. The increase in net sales from acquisitions in Asia-Pacific is related to the fourth quarter 2015 acquisition of Apex and the first quarter 2016 acquisition of AERCO Korea. The increase in net sales from acquisitions in the Americas is related to the acquisition of PVI in the fourth quarter of 2016.

26
Gross Profit. Gross profit and gross profit as a percent of net sales (gross margin) for 2016 and 2015 were as follows:
Year Ended December 31, 2016 2015 (dollars in millions)
Gross profit $ 565.6 $ 553.1 Gross margin 40.5 % 37.7 %
Americas’ gross margin percentage increased compared to 2015 due primarily to a favorable product mix, including the 2015 exit of our low-margin, non-core product lines, as well as manufacturing efficiencies and commodity cost savings. EMEA’s gross margin percentage increased marginally due to manufacturing productivity, restructuring savings and commodity cost savings, compared to 2015. Asia-Pacific’s gross margin percentage increased compared to 2015 primarily due to increased trade sales and product mix, offset by the decreased intercompany activity.
Selling, General and Administrative Expenses. Selling, general and administrative, or SG&A, expenses
decreased $67.2 million, or 13.7%, in 2016 compared to 2015. The decrease in SG&A expenses was attributable to the following:
(in millions) % Change
Organic $ (72.2) (14.8)%Foreign exchange (2.2) (0.4) Acquisition 7.2 1.5
Total $ (67.2) (13.7)%
The organic decrease in SG&A expenses was primarily due to the 2015 settlement of certain long-term obligations, including our pension plan and supplemental employee retirement plan obligations of $64.7 million and a $6.0 million charge incurred in 2015 to settle legacy product liability claims. Product liability expense decreased $2.8 million in 2016 compared to 2015 due to a reduction in the frequency of reported claims. These decreases were partially offset by an increase in stock compensation expense of $2.5 million in 2016 compared to 2015 mainly due to a change in timing of our 2016 grants, which were granted earlier in 2016 than in 2015. SG&A expenses from acquisitions relate to the Apex, AERCO Korea, and PVI acquisitions. Total SG&A expenses, as a percentage of sales, were 30.3% in 2016 compared to 33.5% in 2015.
Restructuring. In 2016, we recorded a net charge of $4.7 million primarily for the transformation of our
Americas and Asia-Pacific businesses and involuntary terminations and other costs incurred as part of our EMEA restructuring plans, as compared to $21.4 million in 2015. For a more detailed description of our current restructuring plans, see Note 3 of Notes to Consolidated Financial Statements in this Annual Report on Form 10-K.
Goodwill and Other Long-Lived Asset Impairment Charges. In 2016, we recorded impairment charges of $0.5
million, primarily related to an indefinite lived tradename in the EMEA reporting unit. In 2015, we recorded impairment charges of $130.5 million, primarily relating to a $129.7 million goodwill impairment charge in the EMEA reporting unit. See Note 2 of Notes to Consolidated Financial Statements in this Annual Report on Form 10-K for additional information regarding these impairments.
Gain on disposition. In the second quarter of 2016, we recorded a pre-tax gain of $8.7 million related to the sale
of a China subsidiary that was dedicated to the production of non-core products and part of the transformation of our Americas and Asia-Pacific businesses. The pre-tax gain includes a non-cash accumulated currency translation adjustment of $7.3 million.

27
Operating Income (Loss). Operating income (loss) by geographic segment for 2016 and 2015 was as follows:
% Change to Year Ended Consolidated December 31, December 31, Operating 2016 2015 Change Income (dollars in millions)
Americas $ 127.1 $ 109.9 $ 17.2 19.1 %EMEA 40.8 (98.6) 139.4 154.6 Asia‑Pacific 14.3 (0.5) 14.8 16.5 Corporate (37.2) (100.9) 63.7 70.7 Total $ 145.0 $ (90.1) $ 235.1 260.9 %
The increase (decrease) in operating income (loss) is attributable to the following:
Change As a % of Change As a % of Consolidated Operating Income Segment Operating Income Asia‑ Asia‑ Asia‑
Americas EMEA Pacifi
c Corporate Total Americas EMEA Pacific Corporate Total Americas EMEA Pacific Corporate (dollars in millions) Organic $ 10.5 $ 7.0 $ 0.8 $ 62.1 $ 80.4 11.6 % 7.8 % 0.9 % 68.9 % 89.2 % 7.0 % 7.1 % 151.2 % 61.5 % Foreign exchange (0.3) (0.3) (0.5) — (1.1) (0.3) (0.3) (0.5) — (1.1) (0.3) (0.3) (91.1) — Acquisitions (1.4) — 1.8 — 0.4 (1.6) — 2.0 — 0.4 1.3 — NMF — Restructuring, impairment charges and other 8.4 132.7 4.0 1.6 146.7 9.3 147.2 4.4 1.8 162.7 7.7 134.6 NMF 1.6 Gain on disposition — — 8.7 8.7 — — 9.7 9.7 — — NMF Total $ 17.2 $ 139.4 $ 14.8 $ 63.7 $ 235.1 19.0 % 154.7 % 16.5 % 70.7 % 260.9 % 15.7 % 141.4 % NMF % 63.1 %
Operating income in 2016 of $145.0 million increased by $235.1 million compared to 2015. This increase is primarily related to the $129.7 million goodwill impairment charge in the EMEA reporting unit, the 2015 settlement charge of $64.7 million for certain long-term obligations, including our pension plan and supplemental employee retirement plan, $16.7 million less in restructuring costs recognized in 2016 compared to 2015, as well as the $6.0 million charge to settle legacy product liability claims in 2015. We also recognized a gain of $8.7 million in the second quarter of 2016 on the disposition of a subsidiary in China. The remaining $9.3 million increase was due to favorable sales mix, favorable sourcing, and productivity.
Interest Expense. Interest expense decreased $1.7 million, or 7%, in 2016 as compared to 2015 primarily due to the retirement in April 2016 of a $225 million higher interest bearing private placement note that was replaced by $230 million drawn on our line of credit. Refer to Note 10 of the Notes to Consolidated Financial Statements in this Annual Report on Form 10-K for further details.
Other income, net. Other income, net, increased $2.0 million to an income balance of $4.4 million in 2016 as compared to 2015, primarily due to the $1.7 million non-cash gain recognized on the acquisition of AERCO Korea in the first quarter of 2016. Refer to Note 5 of the Notes to Consolidated Financial Statements in this Annual Report on Form 10-K for further details on the acquisition. The remaining increase is due to net foreign currency transaction gains in 2016 as a result of the depreciation of the euro and the Canadian dollar against the U.S. dollar in 2016 compared to 2015.
Income Taxes. Our effective income tax rate changed to 34.1% in 2016, from (1.7%) in 2015. The significant
change in the tax rate was due to the impact that the non-deductible and other income tax reserve items had on a loss before income taxes reported in 2015, primarily related to the goodwill impairment charge and the settlement of our pension plan and supplemental employee retirement plan obligations.
Net Income (Loss). Net income was $84.2 million, or $2.45 per common share, compared to a net loss of ($112.9) million, or ($3.24) per common share, for 2015. Results for 2016 include after-tax benefits of $8.3 million, or $0.24 per common share, for a gain on disposition and $1.0 million, or $0.03 per common share, for a gain on acquisition of AERCO Korea, offset by an after-tax charge of $8.8 million, or $0.26 per common share, for the EMEA and Americas transformation deployment costs; $3.2 million, or $0.09 per common share, for restructuring charges; $1.3 million, or $0.04 per common share for purchase accounting adjustments related to our acquisitions in 2016; $1.2

28
million, or $0.03 per common share for acquisition costs in 2016; and $2.6 million, or $0.08 per common share for other items, primarily related to tax charges related to the transformation.
Results for 2015 include an after-tax charge of $126.8 million, or $3.63 per common share, for a goodwill and
other long-lived asset impairment charges; $44.6 million, or $1.28 per common share, for long-term obligation settlements including pension obligations; $13.9 million, or $0.40 per common share, for restructuring; $9.0 million, or $0.26 per common share, for the EMEA and Americas transformation deployment costs; $3.7 million, or $0.11 per common share, for legal and other settlements; and $0.9 million, or $0.03 per common share, for acquisition related costs.
Results of Operations Year Ended December 31, 2015 Compared to Year Ended December 31, 2014
Net Sales. Our business is reported in three geographic segments: Americas, EMEA and Asia-Pacific. Our net sales in each of these segments for the years ended December 31, 2015 and 2014 were as follows:
Year Ended Year Ended % Change to December 31,2015 December 31,2014 Consolidated Net Sales % Sales Net Sales % Sales Change Net Sales (Dollars in millions)
Americas $ 978.5 66.7 % $ 926.8 61.2 % $ 51.7 3.4 % EMEA 445.5 30.3 546.4 36.1 (100.9) (6.6) Asia‑Pacific 43.7 3.0 40.5 2.7 3.2 0.2 Total $ 1,467.7 100.0 % $ 1,513.7 100.0 % $ (46.0) (3.0)%
The change in net sales was attributable to the following:
Change as a % Change as a % of Consolidated Net Sales of Segment Net Sales Asia‑ Asia‑ Asia‑ Americas EMEA Pacific Total Americas EMEA Pacific Total Americas EMEA Pacific (Dollars in millions) Organic $ 19.7 $ (17.4) $ 5.1 $ 7.4 1.3 % (1.1)% 0.3 % 0.5 % 2.1 % (3.2)% 12.6 %Foreign exchange (10.6) (83.5) (0.4) (94.5) (0.7) (5.5) — (6.2) (1.1) (15.3) (1.0) Acquired/divested,
net 42.6 — (1.5) 41.1 2.8 — (0.1) 2.7 4.6 — (3.7) Total $ 51.7 $ (100.9) $ 3.2 $ (46.0) 3.4 % (6.6)% 0.2 % (3.0)% 5.6 % (18.5)% 7.9 %
Our products are sold to wholesalers, DIY chains, and OEMs. The change in organic net sales by channel was
attributable to the following:
Change As a % of Prior Year Sales Wholesale DIY OEMs Total Wholesale DIY OEMs (dollars in millions)
Americas $ 20.9 $ (0.6) $ (0.6) $ 19.7 3.3 % (1.0)% (0.8)%EMEA (8.2) (1.7) (7.5) (17.4) (2.9) (13.5) (3.0) Asia‑Pacific 6.0 — (0.9) 5.1 24.4 — (75.0) Total $ 18.7 $ (2.3) $ (9.0) $ 7.4
Organic net sales in the Americas increased $19.7 million compared to 2014 due to growth in our wholesale markets, particularly relating to commercial boilers, backflow and valve product sales and drainage products. Weather issues in the Northeast, Midwest and South Central U.S. over the first half of 2015 partially offset the sales increases during the year. Organic net sales into the EMEA wholesale, DIY and OEM markets decreased as compared to 2014 primarily due to the struggling end-markets in France, Germany and Russia. These decreases were partially offset by increased sales in the Middle East and UK markets and in our electronics business.

29
Organic net sales in the Asia-Pacific wholesale market increased as compared to 2014 primarily due to increased sales of residential valve and heating products that were sold into expanded geographic regions within China. Outside China, we also increased sales in Australia during the year. The net decrease in sales due to foreign exchange was primarily due to the depreciation of the euro and the Canadian dollar against the U.S. dollar in 2015. We cannot predict whether foreign currencies will appreciate or depreciate against the U.S. dollar in future periods or whether future foreign exchange rate fluctuations will have a positive or negative impact on our net sales. The change in net sales due to acquired/divested relates to the acquisition of AERCO in December of 2014, which contributed $104.2 million in net sales in the first eleven months of 2015 and the acquisition of Apex on November 30, 2015, which contributed $0.9 million in the last month of 2015, offset by the divestiture of our non-core product lines in the Americas and Asia-Pacific that reduced net sales by $64.0 million compared to 2014.
Gross Profit. Gross profit and gross profit as a percent of net sales (gross margin) for 2015 and 2014 were as
follows:
Year Ended December 31, 2015 2014 (Dollars in millions)
Gross profit $ 553.1 $ 541.8 Gross margin 37.7 % 35.8 %
Americas’ gross margin increased compared to 2014 due primarily to product mix, price realization, and material cost savings. The increase from product mix was largely due to the AERCO acquisition and the positive impact of divested products, while material cost savings improved in part due to lower copper prices. The Americas lead free foundry operated more efficiently than in the prior year. EMEA’s gross margin decreased primarily due to lower overhead absorption related to volume declines and unfavorable product mix that more than offset transformation and production efficiencies. Asia-Pacific’s gross margin increased primarily due to productivity initiatives and increased third-party sales offset partially by reduced intercompany activity.
Selling, General and Administrative Expenses. Selling, general and administrative, or SG&A, expenses increased $84.3 million, or 20.7%, in 2015 compared to 2014. The increase in SG&A expenses was attributable to the following:
(in millions) % Change
Organic $ 76.7 18.9%Foreign exchange (23.9) (5.9) Acquisitions 31.5 7.7 Total $ 84.3 20.7 %
The organic increase in SG&A expenses primarily related to the settlement of certain long-term obligations,
including pension obligations, of $64.7 million, increased personnel costs of $9.3 million, increased legal costs of $3.5 million and increased product liability costs of $8.1 million, offset by decreased acquisition related costs of $4.4 million, and reduced commission and freight costs of $3.5 million. The increased personnel costs primarily relate to increased compensation costs of $4.4 million, increased stock-based compensation costs of $2.5 million, partially due to a benefit recognized in the prior year related to our former CEO’s forfeiture of unvested equity awards, increased pension costs of $1.7 million and increased other employee related costs of $0.7 million, partially offset by reduced relocation costs of $1.0 million. Incremental legal costs include the impact of a settlement in principle relating to two class action lawsuits regarding legacy products. The net settlement charged to operations amounted to $3.5 million in 2015. Refer to Note 14 of the Notes to Consolidated Financial Statements in this Annual Report on Form 10-K for more detail. The increased product liability cost in the Americas of $8.1 million was driven by a recent increase in reported claims, a majority of which relate to divested or discontinued products, and a $2.5 million charge related to the resolution of certain legacy claims for non-core products which we have exited. The decrease in SG&A expenses from foreign exchange was primarily due to the depreciation of the euro and the Canadian dollar against the U.S. dollar in 2015. Acquired SG&A costs relate to the AERCO and Apex acquisitions. Total SG&A expenses, as a percentage of sales, were 33.5% in 2015 and 26.9% in 2014.

30
Restructuring. In 2015, we recorded a net charge of $21.4 million primarily for the transformation of our Americas and Asia-Pacific businesses, involuntary terminations at Corporate and involuntary terminations and other costs incurred as part of our EMEA restructuring plans, as compared to $15.2 million in 2014. For a more detailed description of our current restructuring plans, see Note 3 of Notes to Consolidated Financial Statements in this Annual Report on Form 10-K.
Goodwill and Other Long-Lived Asset Impairment Charges. In 2015, we recorded impairment charges of
$130.5 million, primarily relating to a $129.7 million goodwill impairment charge in the EMEA reporting unit and trade name impairment charges of $0.5 million and $0.1 million in the Americas and EMEA, respectively, compared to $14.2 million in 2014. See Note 2 of Notes to Consolidated Financial Statements in this Annual Report on Form 10-K for additional information regarding these impairments.
Operating (Loss) Income. Operating (loss) income by geographic segment for 2015 and 2014 was as follows:
% Change to Year Ended Consolidated December 31, December 31, Operating 2015 2014 Change Income (Dollars in millions)
Americas $ 109.9 $ 110.3 $ (0.4) (0.4) % EMEA (98.6) 37.5 (136.1) (129.1) Asia‑Pacific (0.5) (6.5) 6.0 5.7 Corporate (100.9) (35.9) (65.0) (61.7) Total $ (90.1) $ 105.4 $ (195.5) (185.5)%
The change in operating income was attributable to the following:
Change as a % of Change as a % of Consolidated Operating Income Segment Operating Income Asia‑ Asia‑ Asia‑ Americas EMEA Pacific Corp. Total Americas EMEA Pacific Corp. Total Americas EMEA Pacific Corp. (Dollars in millions) Organic $ (7.5) $ (4.7) $ (2.9) $ (64.7) $ (79.8) (7.1)% (4.5)% (2.7)% (61.4)% (75.7)% (6.8)% (12.5)% 44.6 % (180.2)% Foreign
exchange (2.0) (7.5) — — (9.5) (1.9) (7.1) — — (9.0) (1.8) (20.0) — — Acquisitions 16.3 — — — 16.3 15.4 — — — 15.4 14.8 — — — Restructuring,
impairment charges and other (7.2) (123.9) 8.9 (0.3) (122.5) (6.8) (117.5) 8.4 (0.3) (116.2) (6.5) (330.4) (136.9) (0.8)
Total $ ( 0.4) $ (136.1) $ 6.0 $ (65.0) $ (195.5) (0.4) % (129.1)% 5.7 % (61.7)% (185.5)% (0.3) % (362.9)% (92.3)% (181.0)%
The decrease in consolidated operating income was largely due to non-cash goodwill impairment charge recorded in EMEA for $129.7 million, the settlement of certain long-term obligations, including pension obligations, of $64.7 million in Corporate and an increase in restructuring charges. Other factors contributing to the decrease included an increase in SG&A and unfavorable foreign exchange, offset partially by contribution from the AERCO acquisition. The Americas organic operating income decrease was primarily due to increased SG&A expenses related to product liability costs of $8.1 million and transformation-related costs of $7.1 million. EMEA organic operating income decrease was primarily due to volume decline.
Interest Expense. Interest expense increased $4.4 million, or 22.1%, in 2015 as compared to 2014 primarily due to the interest on borrowings used to purchase AERCO in December 2014. Other (income) expense, net. Other (income) expense, net, fluctuated $5.5 million to an income balance of $2.4 million in 2015 as compared to 2014, primarily due to net foreign currency transaction gains in 2015 compared to losses in 2014 as a result of the depreciation of the euro, the Chinese yuan, and the Canadian dollar against the U.S. dollar and depreciation of the Canadian dollar against the euro in 2015. Income Taxes. Our effective income tax rate changed to (1.7%) in 2015, from 39.5% in 2014. The significant change in the tax rate was due to the impact that non-deductible and other income tax reserve items had on a loss before income taxes reported in 2015 compared to 2014, primarily related to the goodwill impairment charge and the settlement of our pension plan and supplemental employee retirement plan obligations.

31
Net (Loss) Income. Net loss for 2015 was ($112.9) million, or ($3.24) per common share, compared to net income of $50.3 million, or $1.42 per common share, for 2014. Results for 2015 include an after-tax charge of $126.8 million, or $3.63 per common share, for a goodwill and other long-lived asset impairment charge, $44.6 million, or $1.28 per common share, for long-term obligation settlements including pension obligations, $13.9 million, or $0.40 per common share, for restructuring; $9.0 million, or $0.26 per common share, for the EMEA and Americas transformation deployment costs; $3.7 million, or $0.11 per common share, for legal and other settlements; and $0.9 million, or $0.03 per common share, for acquisition related costs. Results for 2014 include net after-tax charges of $38.5 million, or $1.09 per common share, including acquisitions and impairment related costs of $0.51, restructuring charges of $0.39, and EMEA and Americas transformation deployment costs of $0.19. Liquidity and Capital Resources 2016 Cash Flows
In 2016, we generated $138.1 million of cash from operating activities as compared to $109.4 million in 2015. Cash flows from operating activities in 2015 included a $49.2 million settlement of certain long-term obligations, including pension obligations. We generated approximately $102.2 million of free cash flow (a non-GAAP financial measure, which we reconcile below, defined as net cash provided by operating activities minus capital expenditures plus proceeds from sale of assets), compared to free cash flow of $81.8 million in 2015.
In 2016, we used $114.0 million of net cash for investing activities compared to $17.3 million in 2015. We used $67.6 million more cash in 2016 than 2015 relating to the acquisitions of PVI and AERCO Korea. We also increased our purchases of capital equipment during 2016 by $8.3 million. In 2015, we received approximately $20.8 million more in cash proceeds from the sale of assets, primarily relating to the sale of non-core product lines in the Americas. We anticipate investing approximately $36 million to $40 million in capital equipment in 2017 to improve our manufacturing capabilities.
In 2016, we generated $27.7 million of net cash from financing activities as compared to $70.9 million of net cash used in 2015. The increase in cash generated is primarily due to net proceeds from long-term borrowings of $74.4 million and $17.8 million less in stock repurchases in 2016. We also received an additional $5.7 million in cash proceeds from share transactions under employee stock plans in 2016 compared to 2015.
On February 12, 2016, we terminated our prior Credit Agreement and entered into a new Credit Agreement (the “Credit Agreement”) among the Company, certain subsidiaries of the Company who became borrowers under the Credit Agreement, JPMorgan Chase Bank, N.A., as Administrative Agent, Swing Line Lender and Letter of Credit Issuer, and the other lenders referred to therein. The Credit Agreement provides for a $500 million, five-year, senior unsecured revolving credit facility (the “Revolving Credit Facility”) with a sublimit of up to $100 million in letters of credit. The Credit Agreement also provided for a $300 million, five-year, term loan facility (the “Term Loan Facility”) available to us in a single draw. The Credit Agreement matures on February 12, 2021, subject to extension under certain circumstances and subject to the terms of the Credit Agreement. As of December 31, 2016, we had $300 million of borrowings outstanding on the term loan and $162 million drawn on the line of credit under the Credit Agreement. As of December 31, 2016, we were in compliance with all covenants related to the Credit Agreement and had $312.4 million of unused and available credit under the Credit Agreement and $25.6 million of stand-by letters of credit outstanding on the Credit Agreement.
Borrowings outstanding under the Revolving Credit Facility bear interest at a fluctuating rate per annum equal to an applicable percentage defined as (i) in the case of Eurocurrency rate loans, the ICE Benchmark Administration LIBOR rate plus an applicable percentage, ranging from 0.975% to 1.45%, determined by reference to our consolidated leverage ratio, or (ii) in the case of base rate loans and swing line loans, the highest of (a) the federal funds rate plus 0.5%, (b) the rate of interest in effect for such day as announced by JPMorgan Chase Bank, N.A. as its “prime rate,” and (c) the ICE Benchmark Administration LIBOR rate plus 1.0%, plus an applicable percentage, ranging from 0.00% to 0.45%, determined by reference to the Company’s consolidated leverage ratio. Borrowings outstanding under the Term Loan Facility will bear interest at a fluctuating rate per annum equal to an applicable percentage defined as the ICE Benchmark Administration LIBOR rate plus an applicable percentage, ranging from 1.125% to 1.75%, determined by
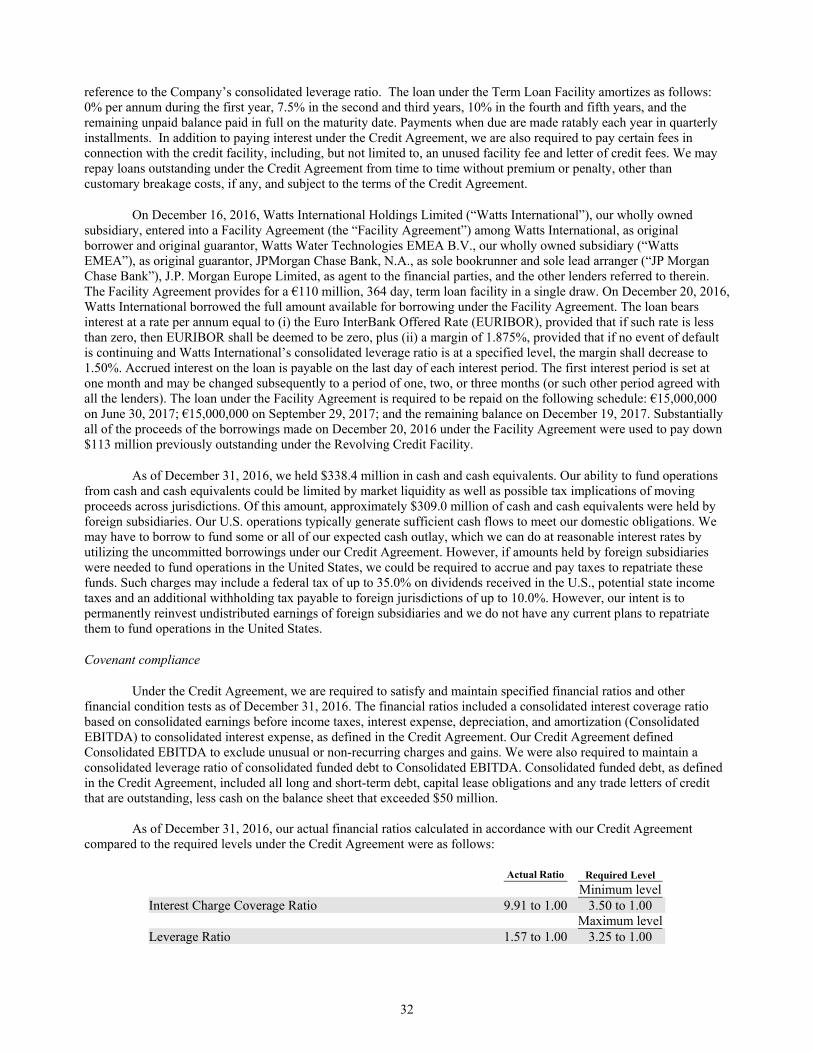
32
reference to the Company’s consolidated leverage ratio. The loan under the Term Loan Facility amortizes as follows: 0% per annum during the first year, 7.5% in the second and third years, 10% in the fourth and fifth years, and the remaining unpaid balance paid in full on the maturity date. Payments when due are made ratably each year in quarterly installments. In addition to paying interest under the Credit Agreement, we are also required to pay certain fees in connection with the credit facility, including, but not limited to, an unused facility fee and letter of credit fees. We may repay loans outstanding under the Credit Agreement from time to time without premium or penalty, other than customary breakage costs, if any, and subject to the terms of the Credit Agreement.
On December 16, 2016, Watts International Holdings Limited (“Watts International”), our wholly owned subsidiary, entered into a Facility Agreement (the “Facility Agreement”) among Watts International, as original borrower and original guarantor, Watts Water Technologies EMEA B.V., our wholly owned subsidiary (“Watts EMEA”), as original guarantor, JPMorgan Chase Bank, N.A., as sole bookrunner and sole lead arranger (“JP Morgan Chase Bank”), J.P. Morgan Europe Limited, as agent to the financial parties, and the other lenders referred to therein. The Facility Agreement provides for a €110 million, 364 day, term loan facility in a single draw. On December 20, 2016, Watts International borrowed the full amount available for borrowing under the Facility Agreement. The loan bears interest at a rate per annum equal to (i) the Euro InterBank Offered Rate (EURIBOR), provided that if such rate is less than zero, then EURIBOR shall be deemed to be zero, plus (ii) a margin of 1.875%, provided that if no event of default is continuing and Watts International’s consolidated leverage ratio is at a specified level, the margin shall decrease to 1.50%. Accrued interest on the loan is payable on the last day of each interest period. The first interest period is set at one month and may be changed subsequently to a period of one, two, or three months (or such other period agreed with all the lenders). The loan under the Facility Agreement is required to be repaid on the following schedule: €15,000,000 on June 30, 2017; €15,000,000 on September 29, 2017; and the remaining balance on December 19, 2017. Substantially all of the proceeds of the borrowings made on December 20, 2016 under the Facility Agreement were used to pay down $113 million previously outstanding under the Revolving Credit Facility.
As of December 31, 2016, we held $338.4 million in cash and cash equivalents. Our ability to fund operations from cash and cash equivalents could be limited by market liquidity as well as possible tax implications of moving proceeds across jurisdictions. Of this amount, approximately $309.0 million of cash and cash equivalents were held by foreign subsidiaries. Our U.S. operations typically generate sufficient cash flows to meet our domestic obligations. We may have to borrow to fund some or all of our expected cash outlay, which we can do at reasonable interest rates by utilizing the uncommitted borrowings under our Credit Agreement. However, if amounts held by foreign subsidiaries were needed to fund operations in the United States, we could be required to accrue and pay taxes to repatriate these funds. Such charges may include a federal tax of up to 35.0% on dividends received in the U.S., potential state income taxes and an additional withholding tax payable to foreign jurisdictions of up to 10.0%. However, our intent is to permanently reinvest undistributed earnings of foreign subsidiaries and we do not have any current plans to repatriate them to fund operations in the United States.
Covenant compliance
Under the Credit Agreement, we are required to satisfy and maintain specified financial ratios and other financial condition tests as of December 31, 2016. The financial ratios included a consolidated interest coverage ratio based on consolidated earnings before income taxes, interest expense, depreciation, and amortization (Consolidated EBITDA) to consolidated interest expense, as defined in the Credit Agreement. Our Credit Agreement defined Consolidated EBITDA to exclude unusual or non-recurring charges and gains. We were also required to maintain a consolidated leverage ratio of consolidated funded debt to Consolidated EBITDA. Consolidated funded debt, as defined in the Credit Agreement, included all long and short-term debt, capital lease obligations and any trade letters of credit that are outstanding, less cash on the balance sheet that exceeded $50 million.
As of December 31, 2016, our actual financial ratios calculated in accordance with our Credit Agreement
compared to the required levels under the Credit Agreement were as follows:
Actual Ratio Required Level
Minimum level Interest Charge Coverage Ratio 9.91 to 1.00 3.50 to 1.00 Maximum level Leverage Ratio 1.57 to 1.00 3.25 to 1.00

33
As of December 31, 2016, we were in compliance with all covenants related to the Credit Agreement. We have one senior note agreement as further detailed in Note 10 of Notes to Consolidated Financial
Statements in this Annual Report Form 10-K. This senior note agreement requires us to maintain a fixed charge coverage ratio of consolidated EBITDA plus consolidated rent expense during the period to consolidated fixed charges. Consolidated fixed charges are the sum of consolidated interest expense for the period and consolidated rent expense.
As of December 31, 2016, our actual fixed charge coverage ratio calculated in accordance with our senior note
agreements compared to the required ratio therein was as follows:
Actual Ratio Required Level
Minimum level Fixed Charge Coverage Ratio 6.06 to 1.00 2.00 to 1.00
Under the Facility Agreement, we are required to satisfy and maintain specified financial ratios and other
financial condition tests as of December 31, 2016. The financial ratios relate to the accounts of Watts International and its wholly-owned subsidiaries and includes a consolidated leverage ratio calculated as consolidated total gross debt to consolidated EBITDA. Consolidated total gross debt, as defined in the Facility Agreement, includes all long and short-term debt, capital lease obligations, and any trade letters of credit that are outstanding. Consolidated EBITDA, as defined in the Facility Agreement, includes consolidated earnings before income taxes, interest expense, depreciation and amortization and excludes unusual or non-recurring charges and gains. Watts International is also required to maintain a minimum consolidated cash balance ratio, defined as the cash balance held by the company to consolidated total gross debt. Cash balance, as defined, includes cash and cash equivalents.
Actual Ratio Required Level
Minimum level Minimum Cash Ratio 1.58 to 1.00 1.00 to 1.00 Maximum levelLeverage Ratio 1.96 to 1.00 2.50 to 1.00
As of December 31, 2016, we were in compliance with all covenants related to the Facility Agreement.
In addition to financial ratios, the Credit Agreement, Facility Agreement, and senior note agreement contain
affirmative and negative covenants that include limitations on disposition or sale of assets, prohibitions on assuming or incurring any liens on assets with limited exceptions and limitations on making investments other than those permitted by the agreements.
Working capital (defined as current assets less current liabilities) as of December 31, 2016 was $432.8 million
compared to $514.0 million as of December 31, 2015. The ratio of current assets to current liabilities was 2.0 to 1 as of December 31, 2016 compared to 2.7 to 1 as of December 31, 2015. The decrease in working capital is primarily related to the short-term Facility Agreement entered into in 2016. 2015 Cash Flows
In 2015, we generated $109.4 million of cash from operating activities as compared to $135.2 million in 2014. The decrease was primarily due to the $49.2 million settlement of certain long-term obligations, including the pension plan, offset by inventory reduction efforts and stronger accounts receivable collections. We generated approximately $81.8 million of free cash flow (a non-GAAP financial measure, which we reconcile below, defined as net cash provided by continuing operating activities minus capital expenditures plus proceeds from sale of assets), compared to free cash flow of $111.9 million in 2014.
In 2015, we used $17.3 million of net cash for investing activities, including $20.4 million for the purchase of
Apex and $27.7 million of cash for capital equipment, offset by cash proceeds of approximately $33.1 million for the sale of certain assets relating to divested product lines in the Americas.
In 2015, we used $70.9 million of net cash from financing activities including $44.6 million used to repurchase
approximately 813,000 shares of Class A common stock and $23.1 million used to pay dividends.

34
2014 Cash Flows
In 2014, we generated $135.2 million of cash from operating activities. We generated approximately $111.9 million of free cash flow (a non-GAAP financial measure, which we reconcile below, defined as net cash provided by continuing operating activities minus capital expenditures plus proceeds from sale of assets. Free cash flow as a percentage of net income from continuing operations was 222.5% in 2014.
In 2014, we used $295.5 million of net cash for investing activities, including $272.2 million for the purchase
of AERCO and $23.7 million of cash for capital equipment. In 2014, we generated $220.8 million of net cash from financing activities. Cash provided by financing
activities was primarily due to the $275.0 million borrowings under our Prior Credit Agreement to fund the AERCO acquisition and by proceeds of $11.8 million from option exercises under the employee stock plans, offset by payments to repurchase approximately 670,000 shares of Class A common stock at a cost of $39.6 million and payment of dividends of $20.5 million. Non-GAAP Financial Measures
In accordance with the SEC's Regulation G and item 10(e) of Regulation S-K, the following provides definitions of the non-GAAP measures used by management. We believe that these measures provide for a more complete perspective of underlying business results and trends. These non-GAAP measures are not intended to be considered by the user in place of the related GAAP measure, but rather as supplemental information to more fully understand our business results. These non-GAAP measures may not be the same as similar measures used by other companies due to possible differences in method and in the items or events being adjusted.
Organic sales growth is a non-GAAP measure of sales growth that excludes the impacts of acquisitions, divestitures and foreign exchange from period-over-period comparisons. A reconciliation to the most closely related U.S.GAAP measure, net sales, has been included in our discussion within “Results of Operations” above. Organic net sales should be considered in addition to, and not as a replacement for or as a superior measure to net sales. Management believes reporting organic sales growth provides useful information to investors, potential investors and others, by facilitating easier comparisons of our revenue performance with prior and future periods.
Adjusted operating income, adjusted operating margins, adjusted net income, and adjusted earnings per share
are non-GAAP measures that exclude certain expenses that relate primarily to our global restructuring programs, deployment costs, acquisition related costs, purchase accounting adjustments, gains on acquisition and disposition, goodwill and other long-lived asset impairments, Defined Benefit Plans settlement, certain other costs and the related income tax impacts on these items and other tax adjustments. Management believes reporting these financial measures provides useful information to investors, potential investors and others, by facilitating easier comparisons of our performance with prior and future periods.

35
A reconciliation of U.S. GAAP results to these adjusted non-GAAP measures is provided below:
Year Ended December 31 December 31 2016 2015
Net sales $ 1,398.4 $ 1,467.7 Operating income (loss) - as reported 145.0 (90.1) Operating margin % 10.4% -6.1% Adjustments for special items: Goodwill and other long-lived asset impairment charges 0.5 130.5 Acquisitions/divestiture related (benefits)/costs (4.7) 1.6 Restructuring 4.7 21.4 Transformation and deployment costs 14.2 14.3 Other costs/long-term obligation settlements 0.3 70.7 Total adjustments for special items $ 15.0 $ 238.5 Operating income - as adjusted $ 160.0 $ 148.4 Adjusted operating margin % 11.4% 10.1% Net income (loss) - as reported $ 84.2 $ (112.9) Adjustments for special items - tax affected: Goodwill and other long-lived asset impairment charges 0.4 126.8 Acquisitions/divestiture related (benefits)/costs (6.8) 0.9 Restructuring 3.2 13.9 Transformation and deployment costs 8.8 9.0 Other costs/long-term obligation settlements 2.6 46.7 Total Adjustments for special items - tax affected: $ 8.2 $ 197.3 Net income as adjusted $ 92.4 $ 84.4 Diluted earnings per share - as reported 2.44 (3.24) Adjustments for special items 0.23 5.65 Diluted earnings per share - as adjusted $ 2.67 $ 2.41
Free cash flow is a non-GAAP measure that does not represent cash generated from operating activities in accordance with U.S. GAAP. Therefore it should not be considered an alternative to net cash provided by operating activities as an indication of our performance. The cash conversion rate of free cash flow to net income is also a measure of our performance in cash flow generation. We believe free cash flow to be an appropriate supplemental measure of our operating performance because it provides investors with a measure of our ability to generate cash, repay debt, pay dividends, repurchase stock and fund acquisitions.
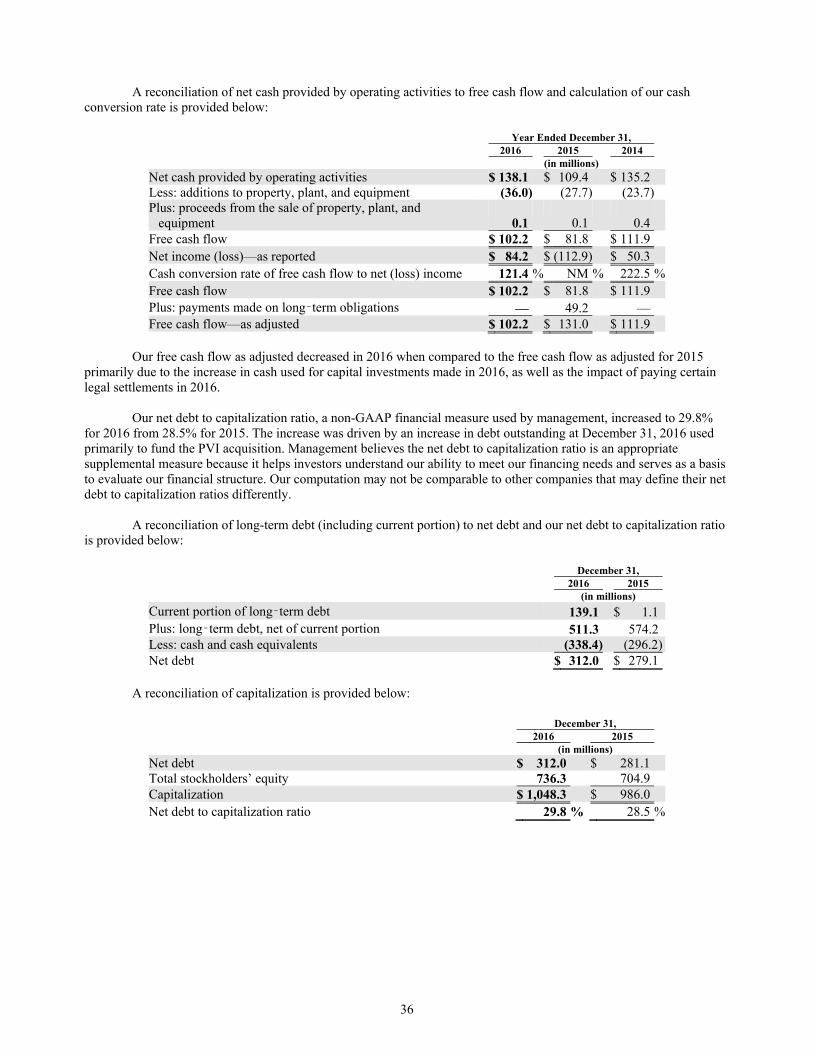
36
A reconciliation of net cash provided by operating activities to free cash flow and calculation of our cash conversion rate is provided below:
Year Ended December 31, 2016 2015 2014 (in millions)
Net cash provided by operating activities $ 138.1 $ 109.4 $ 135.2 Less: additions to property, plant, and equipment (36.0) (27.7) (23.7) Plus: proceeds from the sale of property, plant, and
equipment 0.1 0.1 0.4 Free cash flow $ 102.2 $ 81.8 $ 111.9 Net income (loss)—as reported $ 84.2 $ (112.9) $ 50.3 Cash conversion rate of free cash flow to net (loss) income 121.4 % NM % 222.5 %Free cash flow $ 102.2 $ 81.8 $ 111.9 Plus: payments made on long‑term obligations — 49.2 — Free cash flow—as adjusted $ 102.2 $ 131.0 $ 111.9
Our free cash flow as adjusted decreased in 2016 when compared to the free cash flow as adjusted for 2015 primarily due to the increase in cash used for capital investments made in 2016, as well as the impact of paying certain legal settlements in 2016.
Our net debt to capitalization ratio, a non-GAAP financial measure used by management, increased to 29.8%
for 2016 from 28.5% for 2015. The increase was driven by an increase in debt outstanding at December 31, 2016 used primarily to fund the PVI acquisition. Management believes the net debt to capitalization ratio is an appropriate supplemental measure because it helps investors understand our ability to meet our financing needs and serves as a basis to evaluate our financial structure. Our computation may not be comparable to other companies that may define their net debt to capitalization ratios differently.
A reconciliation of long-term debt (including current portion) to net debt and our net debt to capitalization ratio
is provided below:
December 31, 2016 2015 (in millions)
Current portion of long‑term debt 139.1 $ 1.1 Plus: long‑term debt, net of current portion 511.3 574.2 Less: cash and cash equivalents (338.4) (296.2) Net debt $ 312.0 $ 279.1
A reconciliation of capitalization is provided below:
December 31, 2016 2015 (in millions)
Net debt $ 312.0 $ 281.1 Total stockholders’ equity 736.3 704.9 Capitalization $ 1,048.3 $ 986.0 Net debt to capitalization ratio 29.8 % 28.5 %

37
Contractual Obligations
Our contractual obligations as of December 31, 2016 are presented in the following table:
Payments Due by Period Less than More than Contractual Obligations Total 1 year 1‑3 years 4‑5 years 5 years
(in millions) Long‑term debt obligations, including
current maturities(a)(c) $ 653.6 $ 139.1 $ 52.5 $ 462.0 $ — Operating lease obligations 26.6 7.8 10.6 4.4 3.8 Capital lease obligations(a) 4.0 1.0 1.9 1.1 — Pension contributions 7.1 0.4 0.8 1.0 4.9 Interest 61.6 18.8 33.3 9.5 — Redeemable financial instrument(a) 5.8 — 5.8 — — Other(b) 26.4 23.3 2.8 0.1 0.2 Total $ 785.1 $ 190.4 $ 107.7 $ 478.1 $ 8.9
(a) as recognized in the consolidated balance sheet (b) the majority relates to commodity and capital commitments at December 31, 2016 (c) the payment in less than one year represents the first year of amortization of the term loan under the Credit
Agreement as well as the retirement of the 364 day term loan facility entered into on December 16, 2016. See Note 10 of Notes to Consolidated Financial Statements in this Annual Report on Form 10-K for further details of our financing arrangements.
We maintain letters of credit that guarantee our performance or payment to third parties in accordance with
specified terms and conditions. Amounts outstanding were approximately $25.6 million as of December 31, 2016 and $24.8 million as of December 31, 2015. Our letters of credit are primarily associated with insurance coverage and, to a lesser extent, foreign purchases and generally expire within one year of issuance. These instruments may exist or expire without being drawn down; therefore they do not necessarily represent future cash flow obligations.
Off-Balance Sheet Arrangements
Except for operating lease commitments, we have no off-balance sheet arrangements that have or are reasonably likely to have a current or future effect on our financial condition, changes in financial condition, revenues or expenses, results of operations, liquidity, capital expenditures or capital resources that is material to investors.
Application of Critical Accounting Policies and Key Estimates
The preparation of our consolidated financial statements in accordance with U.S. GAAP requires management to make judgments, assumptions and estimates that affect the amounts reported. A critical accounting estimate is an assumption about highly uncertain matters and could have a material effect on the consolidated financial statements if another, also reasonable, amount were used, or, a change in the estimate is reasonably likely from period to period. We base our assumptions on historical experience and on other estimates that we believe are reasonable under the circumstances. Actual results could differ significantly from these estimates. In 2016, we removed workers compensation costs and pension benefits from our critical accounting policies as they are no longer considered critical. There were no other significant changes in our accounting policies or significant changes in our accounting estimates during 2016.
We periodically discuss the development, selection and disclosure of the estimates with our Audit Committee.
Management believes the following critical accounting policies reflect our more significant estimates and assumptions.

38
Revenue recognition
We recognize revenue when all of the following criteria are met: (1) we have entered into a binding agreement, (2) the product has shipped and title has passed, (3) the sales price to the customer is fixed or is determinable and (4) collectability is reasonably assured. We recognize revenue based upon a determination that all criteria for revenue recognition have been met, which, based on the majority of our shipping terms, is considered to have occurred upon shipment of the finished product. Some shipping terms require the goods to be received by the customer before title passes. In those instances, revenues are not recognized until the customer has received the goods. We record estimated reductions to revenue for customer returns and allowances and for customer programs. Provisions for returns and allowances are made at the time of sale, derived from historical trends and form a portion of the allowance for doubtful accounts. Customer programs, which are primarily annual volume incentive plans, allow customers to earn credit for attaining agreed upon purchase targets from us. We record estimated reductions to revenue, made at the time of sale, for customer programs based on estimated purchase targets.
Allowance for doubtful accounts
The allowance for doubtful accounts is established to represent our best estimate of the net realizable value of the outstanding accounts receivable. The development of our allowance for doubtful accounts varies by region but in general is based on a review of past due amounts, historical write-off experience, as well as aging trends affecting specific accounts and general operational factors affecting all accounts. In addition, factors are developed in certain regions utilizing historical trends of sales and returns and allowances and cash discount activities to derive a reserve for returns and allowances and cash discounts.
We uniformly consider current economic trends and changes in customer payment terms when evaluating the
adequacy of the allowance for doubtful accounts. We also aggressively monitor the creditworthiness of our largest customers, and periodically review customer credit limits to reduce risk. If circumstances relating to specific customers change or unanticipated changes occur in the general business environment, our estimates of the recoverability of receivables could be further adjusted.
Inventory valuation
Inventories are stated at the lower of cost or market with costs determined primarily on a first-in first-out basis. We utilize both specific product identification and historical product demand as the basis for determining our excess or obsolete inventory reserve. We identify all inventories that exceed a range of one to three years in sales. This is determined by comparing the current inventory balance against unit sales for the trailing twelve months. New products added to inventory within the past twelve months are excluded from this analysis. A portion of our products contain recoverable materials, therefore the excess and obsolete reserve is established net of any recoverable amounts. Changes in market conditions, lower-than- expected customer demand or changes in technology or features could result in additional obsolete inventory that is not saleable and could require additional inventory reserve provisions.
In certain countries, additional inventory reserves are maintained for potential shrinkage experienced in the
manufacturing process. The reserve is established based on the prior year’s inventory losses adjusted for any change in the gross inventory balance.
Goodwill and other intangibles
We have made numerous acquisitions over the years and have recognized a significant amount of goodwill. Goodwill is tested for impairment annually or more frequently if an event or circumstance indicates that an impairment loss may have been incurred. Application of the goodwill impairment test requires judgment, including the identification of reporting units, assignment of assets and liabilities to reporting units, and determination of the fair value of each reporting unit. We estimate the fair value of our reporting units using an income approach based on the present value of estimated future cash flows, and when appropriate, guideline public company and guideline transaction market approaches.
Accounting guidance allows us to review goodwill for impairment utilizing either qualitative or quantitative
analyses. We have the option to first assess qualitative factors to determine whether the existence of events or circumstances leads to a determination that it is more likely than not that the fair value of a reporting unit is less than its
39
carrying amount. If, after assessing the totality of events and circumstances, we determine it is more likely than not that the fair value of a reporting unit is greater than its carrying amount, then performing the two-step (quantitative) impairment test is unnecessary.
We first identify those reporting units that we believe could pass a qualitative assessment to determine whether
further impairment testing is necessary. For each reporting unit identified, our qualitative analysis includes: 1) A review of the most recent fair value calculation to identify the extent of the cushion between fair value
and carrying amount, to determine if a substantial cushion existed. 2) A review of events and circumstances that have occurred since the most recent fair value calculation to
determine if those events or circumstances would have affected our previous fair value assessment. Items identified and reviewed include macroeconomic conditions, industry and market changes, cost factor changes, events that affect the reporting unit, financial performance against expectations and the reporting unit’s performance relative to peers.
We then compile this information and make our assessment of whether it is more likely than not that the fair
value of the reporting unit is less than its carrying amount. If we determine it is not more likely than not, then no further quantitative analysis is required.
In 2016, we had eight reporting units. One of these reporting units, Water Quality, had no goodwill. We
performed a qualitative analysis for the remaining reporting units, which include Blücher, Dormont, US Drains, AERCO, EMEA, Residential and Commercial, and Asia-Pacific. As of our October 30, 2016 testing date, we had approximately $493.4 million of goodwill on our balance sheet. As a result of our qualitative analyses, we determined that the fair values of the reporting units were more likely than not greater than the carrying amounts. In 2016, we did not need to proceed beyond the qualitative analysis, and no goodwill impairments were recorded.
In 2015, we recognized a pre-tax impairment charge of $129.7 million in the EMEA reporting unit. The
remaining goodwill balance as of December 31, 2015 in this reporting unit was $46.4 million. During the fourth quarter of 2014, we recognized a pre-tax non-cash goodwill impairment charge of
$12.9 million. The charge in 2014 related to the Asia-Pacific reporting unit. As of December 31, 2014, goodwill for the Asia-Pacific reporting unit was fully impaired.
Intangible assets such as trademarks and trade names are generally recorded in connection with a business
acquisition. Values assigned to intangible assets are determined by an independent valuation firm based on our estimates and judgments regarding expectations of the success and life cycle of products and technology acquired. Accounting guidance allows us to perform a qualitative impairment assessment of indefinite-lived intangible assets consistent with the goodwill guidance noted previously. For our 2016 impairment assessment, which occurred as of October 30, 2016, we performed quantitative assessments for all indefinite-lived intangible assets. The methodology we employed was the relief from royalty method, a subset of the income approach. During 2016 we recognized a non-cash pre-tax charge of approximately $0.4 million related to an indefinite lived tradename in our EMEA reporting unit. In 2015 and 2014, we recognized non-cash pre-tax impairment charges of $0.6 million and $1.3 million, respectively, as an impairment of certain of our indefinite-lived intangible assets.
Product liability
Because of retention requirements associated with our insurance policies, we are generally self-insured for potential product liability claims. We are subject to a variety of potential liabilities in connection with product liability cases and we maintain a high self-insured retention limit within our product liability and general liability coverage, which we believe to be generally in accordance with industry practices. For product liability cases in the U.S., management establishes its product liability accrual, which includes legal costs associated with accrued claims, by utilizing third-party actuarial valuations which incorporate historical trend factors and our specific claims experience derived from loss reports provided by third-party administrators. The product liability accrual is established after considering any applicable insurance coverage. Changes in the nature of product liability claims, legal costs, or the actual settlement amounts could affect the adequacy of the estimates and require changes to the accrual. Because the liability is an estimate, the ultimate liability may be more or less than reported.

40
We determine the trend factors for product liability based on consultation with outside actuaries. We maintain excess liability insurance to minimize our risks related to claims in excess of our primary insurance policies. Any material change in the aforementioned factors could have an adverse impact on our operating results.
Legal contingencies
We are a defendant in numerous legal matters including those involving environmental issues and product liability as discussed in more detail in Part I, Item 1. “Business—Product Liability, Environmental and Other Litigation Matters.” As required by GAAP, we determine whether an estimated loss from a loss contingency should be accrued by assessing whether a loss is deemed probable and the loss amount can be reasonably estimated. When it is possible to estimate reasonably possible loss or range of loss above the amount accrued, that estimate is aggregated and disclosed. Estimates of potential outcomes of these contingencies are often developed in consultation with outside counsel. While this assessment is based upon all available information, litigation is inherently uncertain and the actual liability to fully resolve litigation cannot be predicted with any assurance of accuracy. In the event of an unfavorable outcome in one or more legal matters, the ultimate liability may be in excess of amounts currently accrued, if any, and may be material to our operating results or cash flows for a particular quarterly or annual period. However, based on information currently known to us, management believes that the ultimate outcome of all legal contingencies, as they are resolved over time, is not likely to have a material adverse effect on our financial condition, though the outcome could be material to our operating results for any particular period depending, in part, upon the operating results for such period. Income taxes
We estimate and use our expected annual effective income tax rates to accrue income taxes. Effective tax rates are determined based on budgeted earnings before taxes, including our best estimate of permanent items that will affect the effective rate for the year. Management periodically reviews these rates with outside tax advisors and changes are made if material variances from expectations are identified.
Income taxes are accounted for under the asset and liability method. Deferred tax assets and liabilities are
recognized for the future tax consequences attributable to differences between the financial statement carrying amounts of existing assets and liabilities and their respective tax basis and operating loss and tax credit carry forwards. Deferred tax assets and liabilities are measured using enacted tax rates expected to apply to taxable income in the years in which those temporary differences are expected to be recovered or settled. The effect on deferred tax assets and liabilities of a change in tax rates is recognized in income in the period that includes the enactment date.
A valuation allowance is provided to offset any net deferred tax assets if, based upon the available evidence, it
is more likely than not that some or all of the deferred tax assets will not be realized. We consider estimated future taxable income and future reversals of the deferred tax liabilities in assessing the need for a valuation allowance.
New Accounting Standards A discussion of recent accounting pronouncements is included in Note 2 of the Notes to Consolidated Financial Statements in this Annual Report on Form 10-K.
Item 7A. QUANTITATIVE AND QUALITATIVE DISCLOSURES ABOUT MARKET RISK.
We use derivative financial instruments primarily to reduce exposure to adverse fluctuations in foreign exchange rates, interest rates and costs of certain raw materials used in the manufacturing process. We do not enter into derivative financial instruments for trading purposes. As a matter of policy, all derivative positions are used to reduce risk by hedging underlying economic exposure. The derivatives we use are instruments with liquid markets. See Note 15 of Notes to the Consolidated Financial Statements in this Annual Report on Form 10-K.
Our consolidated earnings, which are reported in United States dollars, are subject to translation risks due to
changes in foreign currency exchange rates. This risk is concentrated in the exchange rate between the U.S. dollar and the euro; the U.S. dollar and the Canadian dollar; the U.S. dollar and the Chinese yuan; and the Hong Kong Dollar and the euro.

41
Our foreign subsidiaries transact most business, including certain intercompany transactions, in foreign currencies. Such transactions are principally purchases or sales of materials and are denominated in European currencies or the U.S. or Canadian dollar. We use foreign currency forward exchange contracts from time to time to manage the risk related to intercompany purchases that occur during the course of a year and certain open foreign currency denominated commitments to sell products to third parties. At December 31, 2016, we have one open forward exchange contract which was entered to manage the foreign currency rate exposure between the Hong Kong dollar and the euro regarding an intercompany loan. This forward contract is marked-to-market with changes in the fair value recorded to earnings.
Prior to 2016, we generally had a low exposure on the cost of our debt to changes in interest rates. On
February 12, 2016, the Company entered into a new Credit Agreement (the “Credit Agreement”) pursuant to which it received a funding commitment under a Term Loan of $300 million, of which the entire $300 million has been drawn on, and a Revolving Commitment (“Revolver”) of $500 million, of which $162 million has been drawn as of December 31, 2016. Both facilities mature on February 12, 2021. For each facility, the Company can choose either an Adjusted LIBOR or Alternative Base Rate (“ABR”). Accordingly, the Company’s earnings and cash flows are exposed to interest rate risk from changes in Adjusted LIBOR. In order to manage the Company’s exposure to changes in cash flows attributable to fluctuations in LIBOR-indexed interest payments related to our floating rate debt, the Company entered into two interest rate swaps. For each interest rate swap, the Company receives the three-month USD-LIBOR subject to a 0% floor, and pays a fixed rate of 1.31375% on a notional amount of $225.0 million. Information about our long-term debt including principal amounts and related interest rates appears in Note 10 of Notes to the Consolidated Financial Statements in this Annual Report on Form 10-K for the year ended December 31, 2016.
We purchase significant amounts of bronze ingot, brass rod, cast iron, stainless steel and plastic, which are
utilized in manufacturing our many product lines. Our operating results can be adversely affected by changes in commodity prices if we are unable to pass on related price increases to our customers. We manage this risk by monitoring related market prices, working with our suppliers to achieve the maximum level of stability in their costs and related pricing, seeking alternative supply sources when necessary and passing increases in commodity costs to our customers, to the maximum extent possible, when they occur.
Item 8. FINANCIAL STATEMENTS AND SUPPLEMENTARY DATA.
The financial statements listed in section (a) (1) of “Part IV, Item 15. Exhibits and Financial Statement Schedules” of this Annual Report are incorporated herein by reference.
Item 9. CHANGES IN AND DISAGREEMENTS WITH ACCOUNTANTS ON ACCOUNTING AND FINANCIAL
DISCLOSURE.
None.
Item 9A. CONTROLS AND PROCEDURES.
As required by Rule 13a-15(b) under the Securities Exchange Act of 1934, as amended, or Exchange Act, as of the end of the period covered by this report, we carried out an evaluation under the supervision and with the participation of our management, including our Chief Executive Officer and Chief Financial Officer, of the effectiveness of our disclosure controls and procedures. In designing and evaluating our disclosure controls and procedures, we recognize that any controls and procedures, no matter how well designed and operated, can provide only reasonable assurance of achieving the desired control objectives, and our management necessarily applies its judgment in evaluating and implementing possible controls and procedures. The effectiveness of our disclosure controls and procedures is also necessarily limited by the staff and other resources available to us and the geographic diversity of our operations. Based upon that evaluation, the Chief Executive Officer and Chief Financial Officer concluded that, as of the end of the period covered by this report, our disclosure controls and procedures were effective, in that they provide reasonable assurance that information required to be disclosed by us in the reports we file or submit under the Exchange Act is recorded, processed, summarized and reported within the time periods specified in the Securities and Exchange Commission’s rules and forms and are designed to ensure that information required to be disclosed by us in the reports that we file or submit under the Exchange Act are accumulated and communicated to our management, including our Chief Executive Officer and Chief Financial Officer, as appropriate to allow timely decisions regarding required disclosure.

42
There was no change in our internal control over financial reporting that occurred during the quarter ended December 31, 2016, that has materially affected, or is reasonably likely to materially affect, our internal control over financial reporting. In connection with these rules, we will continue to review and document our disclosure controls and procedures, including our internal control over financial reporting, and may from time to time make changes aimed at enhancing their effectiveness and to ensure that our systems evolve with our business.
Management’s Annual Report on Internal Control Over Financial Reporting
Management of the Company is responsible for establishing and maintaining adequate internal control over financial reporting as defined in Rules 13a-15(f) and 15d-15(f) under the Securities Exchange Act of 1934. The Company’s internal control over financial reporting is designed to provide reasonable assurance regarding the reliability of financial reporting and the preparation of financial statements for external purposes in accordance with generally accepted accounting principles. The Company’s internal control over financial reporting includes those policies and procedures that:
(i) pertain to the maintenance of records that, in reasonable detail, accurately and fairly reflect the
transactions and dispositions of the assets of the Company; (ii) provide reasonable assurance that transactions are recorded as necessary to permit preparation of
financial statements in accordance with generally accepted accounting principles, and that receipts and expenditures of the Company are being made only in accordance with authorizations of management and directors of the Company; and
(iii) provide reasonable assurance regarding prevention or timely detection of unauthorized acquisition, use
or disposition of the Company’s assets that could have a material effect on the financial statements. Because of its inherent limitations, internal control over financial reporting may not prevent or detect
misstatements. Also, projections of any evaluation of effectiveness to future periods are subject to the risk that controls may become inadequate because of changes in conditions, or that the degree of compliance with the policies or procedures may deteriorate.
Management, including our Chief Executive Officer and Chief Financial Officer, assessed the effectiveness of
the Company’s internal control over financial reporting as of December 31, 2016. In making this assessment, management used the criteria set forth by the Committee of Sponsoring Organizations of the Treadway Commission (COSO) in Internal Control—Integrated Framework (2013).
Based on our assessment and those criteria, management believes that the Company maintained effective
internal control over financial reporting as of December 31, 2016. On November 2, 2016, the Company completed the acquisition of PVI Riverside Holdings, Inc. (“PVI”). The
audited consolidated financial statements of the Company include the results of PVI, including total assets of $79.2 million (of which $70.1 million represents goodwill and intangible assets included within the scope of the assessment) and total revenue of $8.9 million, but management’s assessment does not include an assessment of the internal control over financial reporting of PVI.
The independent registered public accounting firm that audited the Company’s consolidated financial
statements included elsewhere in this Annual Report on Form 10-K has issued an audit report on the Company’s internal control over financial reporting. That report appears immediately following this report.

43
Report of Independent Registered Public Accounting Firm The Board of Directors and Stockholders Watts Water Technologies, Inc.:
We have audited Watts Water Technologies, Inc.’s internal control over financial reporting as of December 31, 2016, based on criteria established in Internal Control – Integrated Framework (2013) issued by the Committee of Sponsoring Organizations of the Treadway Commission (COSO). Watts Water Technologies, Inc.’s management is responsible for maintaining effective internal control over financial reporting and for its assessment of the effectiveness of internal control over financial reporting, included in the accompanying Management’s Annual Report on Internal Control Over Financial Reporting. Our responsibility is to express an opinion on the Company’s internal control over financial reporting based on our audit.
We conducted our audit in accordance with the standards of the Public Company Accounting Oversight Board
(United States). Those standards require that we plan and perform the audit to obtain reasonable assurance about whether effective internal control over financial reporting was maintained in all material respects. Our audit included obtaining an understanding of internal control over financial reporting, assessing the risk that a material weakness exists, and testing and evaluating the design and operating effectiveness of internal control based on the assessed risk. Our audit also included performing such other procedures as we considered necessary in the circumstances. We believe that our audit provides a reasonable basis for our opinion.
A company’s internal control over financial reporting is a process designed to provide reasonable assurance
regarding the reliability of financial reporting and the preparation of financial statements for external purposes in accordance with generally accepted accounting principles. A company’s internal control over financial reporting includes those policies and procedures that (1) pertain to the maintenance of records that, in reasonable detail, accurately and fairly reflect the transactions and dispositions of the assets of the company; (2) provide reasonable assurance that transactions are recorded as necessary to permit preparation of financial statements in accordance with generally accepted accounting principles, and that receipts and expenditures of the company are being made only in accordance with authorizations of management and directors of the company; and (3) provide reasonable assurance regarding prevention or timely detection of unauthorized acquisition, use, or disposition of the company’s assets that could have a material effect on the financial statements.
Because of its inherent limitations, internal control over financial reporting may not prevent or detect
misstatements. Also, projections of any evaluation of effectiveness to future periods are subject to the risk that controls may become inadequate because of changes in conditions, or that the degree of compliance with the policies or procedures may deteriorate.
In our opinion, Watts Water Technologies, Inc. maintained, in all material respects, effective internal control
over financial reporting as of December 31, 2016, based on criteria established in Internal Control – Integrated Framework (2013) issued by the Committee of Sponsoring Organizations of the Treadway Commission.
Watts Water Technologies, Inc. acquired PVI Industries, LLC (“PVI”) during 2016, and management excluded
from its assessment of the effectiveness of Watts Water Technologies, Inc.’s internal control over financial reporting as of December 31, 2016, PVI’s internal control over financial reporting associated with total assets of $79.2 million (of which 70.1 million represents goodwill and intangible assets included within the scope of the assessment) and total revenue of $8.9 million included in the consolidated financial statements of Watts Water Technologies, Inc. and subsidiaries as of and for the year ended December 31, 2016. Our audit of internal control over financial reporting of Watts Water Technologies, Inc. also excluded an evaluation of the internal control over financial reporting of PVI.
We also have audited, in accordance with the standards of the Public Company Accounting Oversight Board
(United States), the consolidated balance sheets of Watts Water Technologies, Inc. and subsidiaries as of December 31, 2016 and 2015, and the related consolidated statements of operations, comprehensive income (loss), stockholders’ equity, and cash flows for each of the years in the three-year period ended December 31, 2016, and our report dated February 24, 2017 expressed an unqualified opinion on those consolidated financial statements.
/s/ KPMG LLP Boston, Massachusetts February 24, 2017

44
Item 9B. OTHER INFORMATION.
None.
PART III
Item 10. DIRECTORS, EXECUTIVE OFFICERS AND CORPORATE GOVERNANCE.
Information with respect to the executive officers of the Company is set forth in Part I, Item 1 of this Report under the caption “Executive Officers and Directors” and is incorporated herein by reference. The information provided under the captions “Information as to Nominees for Director,” “Corporate Governance,” and “Section 16(a) Beneficial Ownership Reporting Compliance” in our definitive Proxy Statement for our 2017 Annual Meeting of Stockholders to be held on May 17, 2017 is incorporated herein by reference.
We have adopted a Code of Business Conduct applicable to all officers, employees and Board members. The
Code of Business Conduct is posted in the Investors section of our website, www.wattswater.com. We will provide you with a print copy of our Code of Business Conduct free of charge on written request to Kenneth R. Lepage, Secretary, Watts Water Technologies, Inc., 815 Chestnut Street, North Andover, MA 01845. Any amendments to, or waivers of, the Code of Business Conduct which apply to our Chief Executive Officer, Chief Financial Officer, Corporate Controller or any person performing similar functions will be disclosed on our website promptly following the date of such amendment or waiver.
Item 11. EXECUTIVE COMPENSATION.
The information provided under the captions “Director Compensation,” “Corporate Governance,” “Compensation Discussion and Analysis,” “Executive Compensation,” “Compensation Committee Interlocks and Insider Participation,” and “Compensation Committee Report” in our definitive Proxy Statement for our 2017 Annual Meeting of Stockholders to be held on May 17, 2017 is incorporated herein by reference.
The “Compensation Committee Report” contained in our Proxy Statement shall not be deemed “soliciting
material” or “filed” with the Securities and Exchange Commission or otherwise subject to the liabilities of Section 18 of the Securities Exchange Act of 1934, nor shall it be deemed incorporated by reference in any filings under the Securities Act of 1933 or the Exchange Act, except to the extent we specifically request that such information be treated as soliciting material or specifically incorporate such information by reference into a document filed under the Securities Act or Exchange Act.
Item 12. SECURITY OWNERSHIP OF CERTAIN BENEFICIAL OWNERS AND MANAGEMENT AND
RELATED STOCKHOLDER MATTERS.
The information appearing under the caption “Principal Stockholders” in our definitive Proxy Statement for our 2017 Annual Meeting of Stockholders to be held on May 17, 2017 is incorporated herein by reference.

45
Securities Authorized for Issuance Under Equity Compensation Plans
The following table provides information as of December 31, 2016, about the shares of Class A common stock that may be issued upon the exercise of stock options issued under the Company’s Second Amended and Restated 2004 Stock Incentive Plan, and the settlement of restricted stock units granted under our Management Stock Purchase Plan as well as the number of shares remaining for future issuance under our Second Amended and Restated 2004 Stock Incentive Plan and Management Stock Purchase Plan.
Equity Compensation Plan Information Number of securities remaining Number of securities to be available for future issuance issued upon exercise of Weighted‑average exercise under equity compensation outstanding options, price of outstanding options, plan (excluding securities warrants and rights warrants and rights reflected in column (a)) Plan Category (a) (b) (c)
Equity compensation plans approved by security holders 567,420 (1) $ — 2,206,142 (2)
Equity compensation plans not approved by security holders None None None
Total 567,420 (1) $ — 2,206,142 (2)
(1) Represents 130,483 outstanding options, 266,738 performance share awards and 22,671 deferred shares under the Second Amended and Restated 2004 Stock Incentive Plan, and 147,528 outstanding restricted stock units under the Management Stock Purchase Plan.
(2) Includes 1,402,580 shares available for future issuance under the Second Amended and Restated 2004 Stock
Incentive Plan, and 803,562 shares available for future issuance under the Management Stock Purchase Plan. Item 13. CERTAIN RELATIONSHIPS AND RELATED TRANSACTIONS, AND DIRECTOR INDEPENDENCE.
The information provided under the captions “Corporate Governance” and “Certain Relationships and Related Transactions” in our definitive Proxy Statement for our 2017 Annual Meeting of Stockholders to be held on May 17, 2017 is incorporated herein by reference. Item 14. PRINCIPAL ACCOUNTANT FEES AND SERVICES.
The information provided under the caption “Ratification of Independent Registered Public Accounting Firm” in our definitive Proxy Statement for our 2017 Annual Meeting of Stockholders to be held on May 17, 2017 is incorporated herein by reference.
PART IV
Item 15. EXHIBITS AND FINANCIAL STATEMENT SCHEDULES. (a)(1) Financial Statements
The following financial statements are included in a separate section of this Report commencing on the page numbers specified below:
Report of Independent Registered Public Accounting Firm 48 Consolidated Statements of Operations for the years ended December 31, 2016, 2015 and 2014 49 Consolidated Statements of Comprehensive Income (Loss) for the years ended December 31,
2016, 2015 and 2014 50 Consolidated Balance Sheets as of December 31, 2016 and 2015 51 Consolidated Statements of Stockholders’ Equity for the years ended December 31, 2016, 2015
and 2014 52 Consolidated Statements of Cash Flows for the years ended December 31, 2016, 2015 and 2014 53 Notes to Consolidated Financial Statements 54

46
(a)(2) Schedules
Schedule II—Valuation and Qualifying Accounts for the years ended December 31, 2016, 2015 and 2014 87
All other required schedules for which provision is made in the applicable accounting regulations of the
Securities and Exchange Commission are included in the Notes to the Consolidated Financial Statements.
(a)(3) Exhibits
The exhibits listed in the Exhibit Index immediately preceding the exhibits are filed as part of this Annual Report on Form 10-K.
Item 16. FORM 10-K SUMMARY.
None.
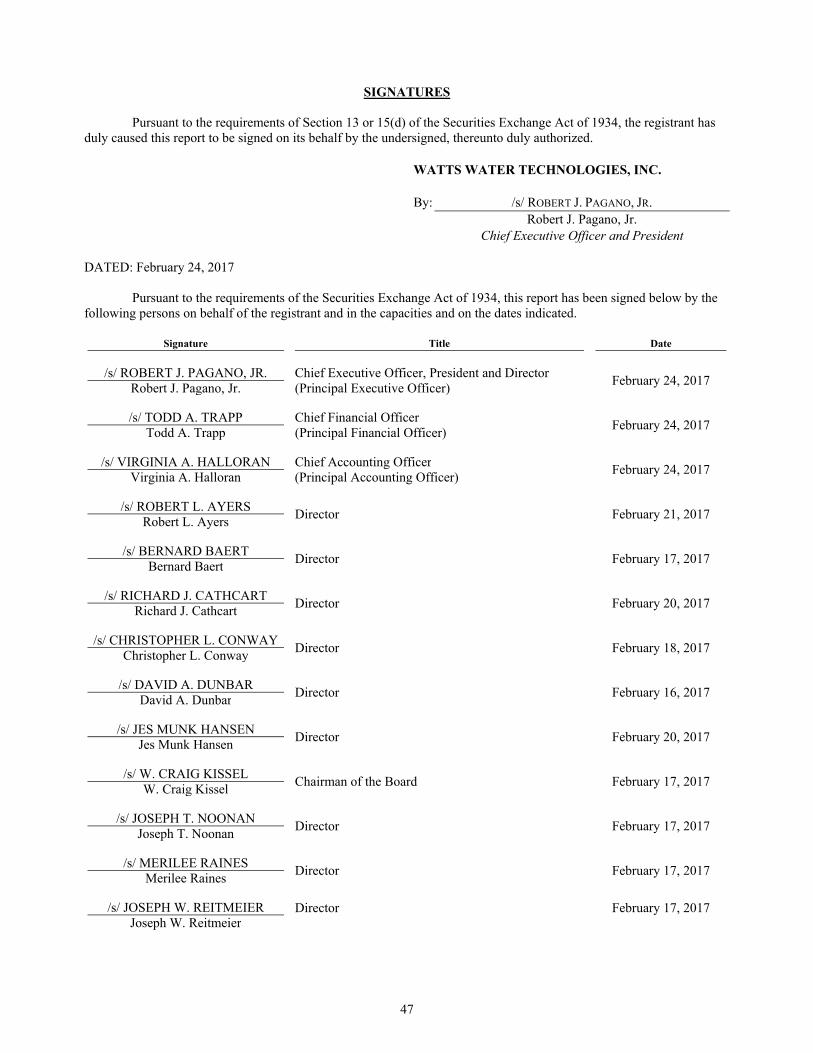
47
SIGNATURES
Pursuant to the requirements of Section 13 or 15(d) of the Securities Exchange Act of 1934, the registrant has duly caused this report to be signed on its behalf by the undersigned, thereunto duly authorized.
WATTS WATER TECHNOLOGIES, INC. By: /s/ ROBERT J. PAGANO, JR. Robert J. Pagano, Jr. Chief Executive Officer and President DATED: February 24, 2017
Pursuant to the requirements of the Securities Exchange Act of 1934, this report has been signed below by the following persons on behalf of the registrant and in the capacities and on the dates indicated.
Signature Title Date
/s/ ROBERT J. PAGANO, JR. Chief Executive Officer, President and Director February 24, 2017
Robert J. Pagano, Jr. (Principal Executive Officer)
/s/ TODD A. TRAPP Chief Financial Officer February 24, 2017
Todd A. Trapp (Principal Financial Officer)
/s/ VIRGINIA A. HALLORAN Chief Accounting Officer February 24, 2017
Virginia A. Halloran (Principal Accounting Officer)
/s/ ROBERT L. AYERS Director
February 21, 2017
Robert L. Ayers
/s/ BERNARD BAERT Director
February 17, 2017
Bernard Baert
/s/ RICHARD J. CATHCART Director
February 20, 2017
Richard J. Cathcart
/s/ CHRISTOPHER L. CONWAY Director
February 18, 2017
Christopher L. Conway
/s/ DAVID A. DUNBAR Director
February 16, 2017
David A. Dunbar
/s/ JES MUNK HANSEN Director
February 20, 2017
Jes Munk Hansen
/s/ W. CRAIG KISSEL Chairman of the Board
February 17, 2017
W. Craig Kissel
/s/ JOSEPH T. NOONAN Director
February 17, 2017
Joseph T. Noonan
/s/ MERILEE RAINES Director
February 17, 2017
Merilee Raines
/s/ JOSEPH W. REITMEIER
Director
February 17, 2017 Joseph W. Reitmeier

48
Report of Independent Registered Public Accounting Firm
The Board of Directors and Stockholders Watts Water Technologies, Inc.:
We have audited the accompanying consolidated balance sheets of Watts Water Technologies, Inc. and subsidiaries as of December 31, 2016 and 2015, and the related consolidated statements of operations, comprehensive income (loss), stockholders’ equity, and cash flows for each of the years in the three-year period ended December 31, 2016. In connection with our audits of the consolidated financial statements, we also have audited financial statement Schedule II-Valuation and Qualifying Accounts. These consolidated financial statements and financial statement schedule are the responsibility of the Company’s management. Our responsibility is to express an opinion on these consolidated financial statements and financial statement schedule based on our audits.
We conducted our audits in accordance with the standards of the Public Company Accounting Oversight Board (United States). Those standards require that we plan and perform the audit to obtain reasonable assurance about whether the financial statements are free of material misstatement. An audit includes examining, on a test basis, evidence supporting the amounts and disclosures in the financial statements. An audit also includes assessing the accounting principles used and significant estimates made by management, as well as evaluating the overall financial statement presentation. We believe that our audits provide a reasonable basis for our opinion.
In our opinion, the consolidated financial statements referred to above present fairly, in all material respects, the financial position of Watts Water Technologies, Inc. and subsidiaries as of December 31, 2016 and 2015, and the results of their operations and their cash flows for each of the years in the three-year period ended December 31, 2016, in conformity with U.S. generally accepted accounting principles. Also in our opinion, the related financial statement schedule, when considered in relation to the basic consolidated financial statements taken as a whole, presents fairly, in all material respects, the information set forth therein.
We also have audited, in accordance with the standards of the Public Company Accounting Oversight Board (United States), Watts Water Technologies, Inc. internal control over financial reporting as of December 31, 2016, based on criteria established in Internal Control – Integrated Framework (2013) issued by the Committee of Sponsoring Organizations of the Treadway Commission (COSO), and our report dated February 24, 2017 expressed an unqualified opinion on the effectiveness of the Company’s internal control over financial reporting
Our report dated February 24, 2017 on the effectiveness of internal control over financial reporting as of December 31, 2016, contains an explanatory paragraph that states that management excluded from its assessment of the effectiveness of Watts Water Technologies, Inc. and subsidiaries’ internal control over financial reporting as of December 31, 2016, PVI Industries, LLC (“PVI”) internal control over financial reporting associated with total assets of $79.2 million (of which $70.1 million represents goodwill and intangible assets included within the scope of the assessment) and total revenue of $8.9 million included in the consolidated financial statements of Watts Water Technologies, Inc. and subsidiaries as of and for the year ended December 31, 2016. Our audit of internal control over financial reporting of Watts Water Technologies, Inc. also excluded an evaluation of the internal control over financial reporting of PVI.
/s/ KPMG LLP Boston, Massachusetts February 24, 2017

49
Watts Water Technologies, Inc. and Subsidiaries
Consolidated Statements of Operations
(Amounts in millions, except per share information)
Year Ended December 31, 2016 2015 2014
Net sales $ 1,398.4 $ 1,467.7 $ 1,513.7 Cost of goods sold 832.8 914.6 971.9
GROSS PROFIT 565.6 553.1 541.8 Selling, general and administrative expenses 424.1 491.3 407.0 Restructuring 4.7 21.4 15.2 Goodwill and other long-lived asset impairment charges 0.5 130.5 14.2 Gain on disposition (8.7) — —
OPERATING INCOME (LOSS) 145.0 (90.1) 105.4 Other (income) expense:
Interest income (1.0) (1.0) (0.7) Interest expense 22.6 24.3 19.9 Other (income) expense, net (4.4) (2.4) 3.1
Total other expense 17.2 20.9 22.3 INCOME (LOSS) BEFORE INCOME TAXES 127.8 (111.0) 83.1 Provision for income taxes 43.6 1.9 32.8 NET INCOME (LOSS) $ 84.2 $ (112.9) $ 50.3 Basic EPS
NET INCOME (LOSS) PER SHARE $ 2.45 $ (3.24) $ 1.42 Weighted average number of shares 34.4 34.9 35.3 Diluted EPS
NET INCOME (LOSS) PER SHARE $ 2.44 $ (3.24) $ 1.42 Weighted average number of shares 34.5 34.9 35.4 Dividends declared per share $ 0.71 $ 0.66 $ 0.58
The accompanying notes are an integral part of these consolidated financial statements.
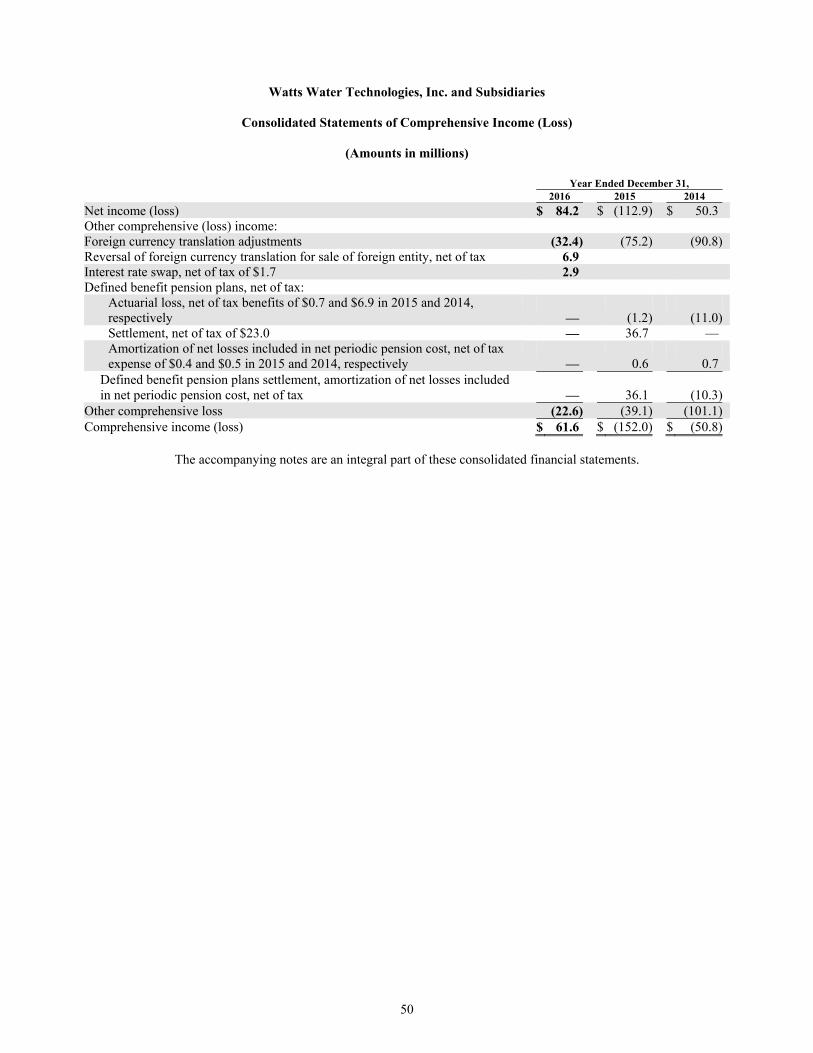
50
Watts Water Technologies, Inc. and Subsidiaries
Consolidated Statements of Comprehensive Income (Loss)
(Amounts in millions)
Year Ended December 31, 2016 2015 2014
Net income (loss) $ 84.2 $ (112.9) $ 50.3 Other comprehensive (loss) income: Foreign currency translation adjustments (32.4) (75.2) (90.8) Reversal of foreign currency translation for sale of foreign entity, net of tax 6.9 Interest rate swap, net of tax of $1.7 2.9 Defined benefit pension plans, net of tax:
Actuarial loss, net of tax benefits of $0.7 and $6.9 in 2015 and 2014, respectively — (1.2) (11.0) Settlement, net of tax of $23.0 — 36.7 — Amortization of net losses included in net periodic pension cost, net of tax expense of $0.4 and $0.5 in 2015 and 2014, respectively — 0.6 0.7
Defined benefit pension plans settlement, amortization of net losses included in net periodic pension cost, net of tax — 36.1 (10.3)
Other comprehensive loss (22.6) (39.1) (101.1) Comprehensive income (loss) $ 61.6 $ (152.0) $ (50.8)
The accompanying notes are an integral part of these consolidated financial statements.

51
Watts Water Technologies, Inc. and Subsidiaries
Consolidated Balance Sheets
(Amounts in millions, except share information)
December 31, 2016 2015
ASSETS CURRENT ASSETS:
Cash and cash equivalents $ 338.4 $ 296.2 Trade accounts receivable, less allowance for doubtful accounts of $14.2 million in 2016 and $10.1 million in 2015 198.0 186.4 Inventories, net 239.4 240.0 Prepaid expenses and other assets 40.5 46.1 Deferred income taxes 38.6 38.4 Assets held for sale 3.1 1.9
Total Current Assets 858.0 809.0 PROPERTY, PLANT AND EQUIPMENT, NET 189.7 184.4 OTHER ASSETS:
Goodwill 532.7 489.0 Intangible assets, net 202.5 192.8 Deferred income taxes 1.5 3.7 Other, net 15.9 11.9
TOTAL ASSETS $ 1,800.3 $ 1,690.8 LIABILITIES AND STOCKHOLDERS’ EQUITY CURRENT LIABILITIES:
Accounts payable $ 101.1 $ 101.7 Accrued expenses and other liabilities 136.8 145.7 Accrued compensation and benefits 48.5 46.5 Current portion of long-term debt 139.1 1.1
Total Current Liabilities 425.5 295.0 LONG-TERM DEBT, NET OF CURRENT PORTION 511.3 574.2 DEFERRED INCOME TAXES 85.7 71.8 OTHER NONCURRENT LIABILITIES 41.5 44.9 STOCKHOLDERS’ EQUITY:
Preferred Stock, $0.10 par value; 5,000,000 shares authorized; no shares issued or outstanding — — Class A common stock, $0.10 par value; 80,000,000 shares authorized; 1 vote per share; issued and outstanding, 27,831,013 shares in 2016 and 28,049,908 shares in 2015 2.8 2.8 Class B common stock, $0.10 par value; 25,000,000 shares authorized; 10 votes per share; issued and outstanding, 6,379,290 shares in 2016 and 2015 0.6 0.6 Additional paid-in capital 535.2 512.0 Retained earnings 348.5 317.7 Accumulated other comprehensive loss (150.8) (128.2)
Total Stockholders’ Equity 736.3 704.9 TOTAL LIABILITIES AND STOCKHOLDERS’ EQUITY $ 1,800.3 $ 1,690.8
The accompanying notes are an integral part of these consolidated financial statements.
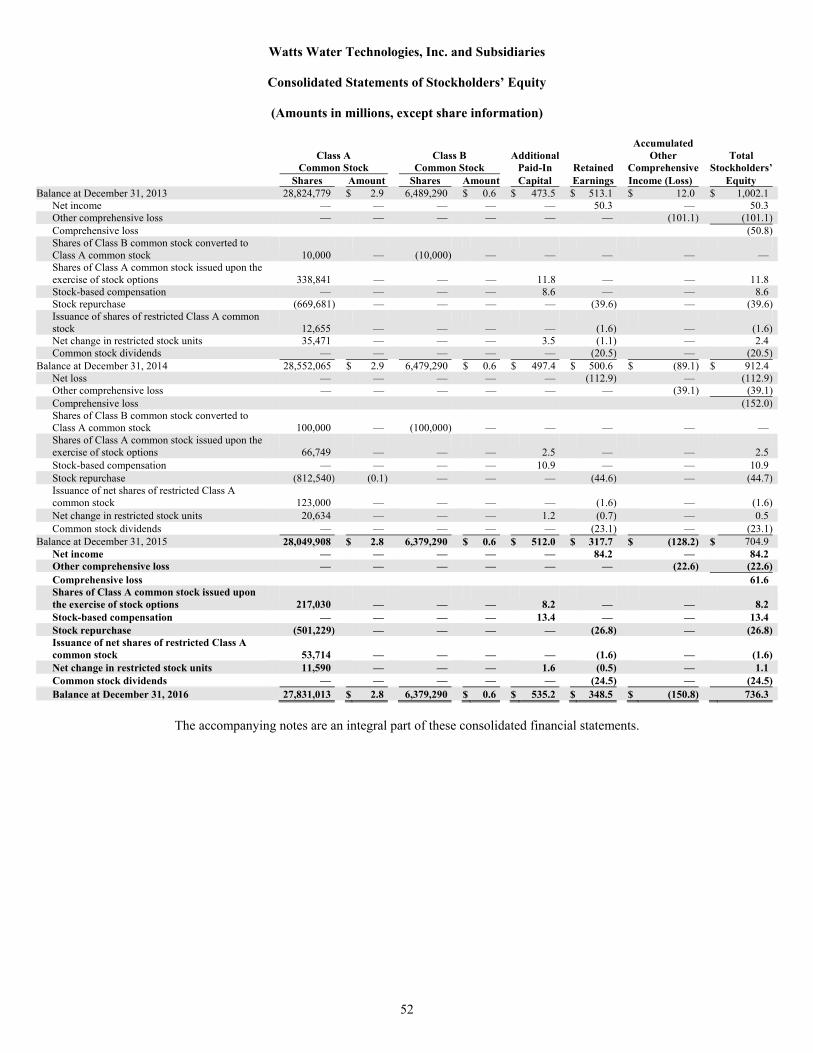
52
Watts Water Technologies, Inc. and Subsidiaries
Consolidated Statements of Stockholders’ Equity
(Amounts in millions, except share information)
Accumulated Class A Class B Additional Other Total Common Stock Common Stock Paid-In Retained Comprehensive Stockholders’ Shares Amount Shares Amount Capital Earnings Income (Loss) Equity Balance at December 31, 2013 28,824,779 $ 2.9 6,489,290 $ 0.6 $ 473.5 $ 513.1 $ 12.0 $ 1,002.1
Net income — — — — — 50.3 — 50.3 Other comprehensive loss — — — — — — (101.1) (101.1) Comprehensive loss (50.8) Shares of Class B common stock converted to Class A common stock 10,000 — (10,000) — — — — — Shares of Class A common stock issued upon the exercise of stock options 338,841 — — — 11.8 — — 11.8 Stock-based compensation — — — — 8.6 — — 8.6 Stock repurchase (669,681) — — — — (39.6) — (39.6) Issuance of shares of restricted Class A common stock 12,655 — — — — (1.6) — (1.6) Net change in restricted stock units 35,471 — — — 3.5 (1.1) — 2.4 Common stock dividends — — — — — (20.5) — (20.5)
Balance at December 31, 2014 28,552,065 $ 2.9 6,479,290 $ 0.6 $ 497.4 $ 500.6 $ (89.1) $ 912.4 Net loss — — — — — (112.9) — (112.9) Other comprehensive loss — — — — — — (39.1) (39.1) Comprehensive loss (152.0) Shares of Class B common stock converted to Class A common stock 100,000 — (100,000) — — — — — Shares of Class A common stock issued upon the exercise of stock options 66,749 — — — 2.5 — — 2.5 Stock-based compensation — — — — 10.9 — — 10.9 Stock repurchase (812,540) (0.1) — — — (44.6) — (44.7) Issuance of net shares of restricted Class A common stock 123,000 — — — — (1.6) — (1.6) Net change in restricted stock units 20,634 — — — 1.2 (0.7) — 0.5 Common stock dividends — — — — — (23.1) — (23.1)
Balance at December 31, 2015 28,049,908 $ 2.8 6,379,290 $ 0.6 $ 512.0 $ 317.7 $ (128.2) $ 704.9 Net income — — — — — 84.2 — 84.2 Other comprehensive loss — — — — — — (22.6) (22.6) Comprehensive loss 61.6 Shares of Class A common stock issued upon the exercise of stock options 217,030 — — — 8.2 — — 8.2 Stock-based compensation — — — — 13.4 — — 13.4 Stock repurchase (501,229) — — — — (26.8) — (26.8) Issuance of net shares of restricted Class A common stock 53,714 — — — — (1.6) — (1.6) Net change in restricted stock units 11,590 — — — 1.6 (0.5) — 1.1 Common stock dividends — — — — — (24.5) — (24.5) Balance at December 31, 2016 27,831,013 $ 2.8 6,379,290 $ 0.6 $ 535.2 $ 348.5 $ (150.8) 736.3
The accompanying notes are an integral part of these consolidated financial statements.

53
Watts Water Technologies, Inc. and Subsidiaries
Consolidated Statements of Cash Flows
(Amounts in millions)
Year Ended December 31, 2016 2015 2014 OPERATING ACTIVITIES
Net income (loss) $ 84.2 $ (112.9) $ 50.3 Adjustments to reconcile net income (loss) to net cash provided by operating activities:
Depreciation 30.4 31.6 32.9 Amortization of intangibles 20.8 20.9 15.2 Loss on disposal, impairment of goodwill, property, plant and equipment and other 3.7 132.4 15.3 Gain on disposition (8.6) — — Gain on acquisition (1.7) — — Stock-based compensation 13.4 10.9 8.6 Deferred income taxes 3.5 (20.5) (2.7) Defined benefit plans settlement — 59.7 — Changes in operating assets and liabilities, net of effects from business acquisitions and divestures:
Accounts receivable (7.1) 13.0 9.6 Inventories 9.8 21.2 21.4 Prepaid expenses and other assets 4.9 (17.8) 10.9 Accounts payable, accrued expenses and other liabilities (15.2) (29.1) (26.3)
Net cash provided by operating activities 138.1 109.4 135.2 INVESTING ACTIVITIES
Additions to property, plant and equipment (36.0) (27.7) (23.7) Proceeds from the sale of property, plant and equipment 0.1 0.1 0.4 Net proceeds from the sale of assets, and other 9.9 30.7 — Business acquisitions, net of cash acquired (88.0) (20.4) (272.2)
Net cash used in investing activities (114.0) (17.3) (295.5) FINANCING ACTIVITIES
Proceeds from long-term borrowings 688.8 — 275.0 Payments of long-term debt (614.4) (2.0) (2.3) Payment of capital leases and other (1.9) (4.0) (3.6) Proceeds from share transactions under employee stock plans 8.2 2.5 11.8 Tax benefit of stock awards exercised 0.4 0.3 2.0 Payments to repurchase common stock (26.8) (44.6) (39.6) Debt issuance costs (2.1) — (2.0) Dividends (24.5) (23.1) (20.5)
Net cash provided by (used in) financing activities 27.7 (70.9) 220.8 Effect of exchange rate changes on cash and cash equivalents (9.6) (26.1) (27.3) INCREASE (DECREASE) IN CASH AND CASH EQUIVALENTS 42.2 (4.9) 33.2 Cash and cash equivalents at beginning of year 296.2 301.1 267.9 CASH AND CASH EQUIVALENTS AT END OF YEAR $ 338.4 $ 296.2 $ 301.1 NON CASH INVESTING AND FINANCING ACTIVITIES Acquisition of businesses: Fair value of assets acquired $ 112.6 $ 29.8 $ 333.0 Cash paid, net of cash acquired 88.0 20.4 272.2 Gain on fair value of acquisition 1.7 — — Liabilities assumed $ 22.9 $ 9.4 $ 60.8 Acquisitions of fixed assets under financing agreement $ — $ 0.2 $ — Issuance of stock under management stock purchase plan $ 0.7 $ 0.3 $ 0.4 CASH PAID FOR:
Interest $ 20.2 $ 23.1 $ 18.3 Taxes $ 33.5 $ 24.5 $ 30.5
The accompanying notes are an integral part of these consolidated financial statements.

54
Watts Water Technologies, Inc. and Subsidiaries
Notes to Consolidated Financial Statements (1) Description of Business
Watts Water Technologies, Inc. (the Company), is a leading supplier of products and solutions that manage and conserve the flow of fluids and energy into, through and out of buildings in the residential and commercial markets of the Americas, Europe, Middle East and Africa (EMEA) and Asia-Pacific. For over 140 years, the Company has designed and produced valve systems that safeguard and regulate water systems, energy efficient heating and hydronic systems, drainage systems and water filtration technology that helps conserve water.
(2) Accounting Policies Principles of Consolidation
The consolidated financial statements include the accounts of the Company and its majority and wholly owned subsidiaries. Upon consolidation, all intercompany accounts and transactions are eliminated.
Cash Equivalents
Cash equivalents consist of instruments with remaining maturities of three months or less at the date of purchase and consist primarily of certificates of deposit and money market funds, for which the carrying amount is a reasonable estimate of fair value.
Allowance for Doubtful Accounts
Allowance for doubtful accounts includes reserves for bad debts, sales returns and allowances and cash discounts. The Company analyzes the aging of accounts receivable, individual accounts receivable, historical bad debts, concentration of receivables by customer, customer credit worthiness, current economic trends, and changes in customer payment terms. The Company specifically analyzes individual accounts receivable and establishes specific reserves against financially troubled customers. In addition, factors are developed in certain regions utilizing historical trends of sales and returns and allowances and cash discount activities to derive a reserve for returns and allowances and cash discounts.
Concentration of Credit
The Company sells products to a diversified customer base and, therefore, has no significant concentrations of credit risk. In 2016, 2015, and 2014, no customer accounted for 10% or more of the Company’s total sales. Inventories
Inventories are stated at the lower of cost or market, using primarily the first-in, first-out method. Market value is determined by replacement cost or net realizable value. Historical usage is used as the basis for determining the reserve for excess or obsolete inventories.
Goodwill and Other Intangible Assets
Goodwill is recorded when the consideration paid for acquisitions exceeds the fair value of net tangible and intangible assets acquired. Goodwill and other intangible assets with indefinite useful lives are not amortized, but rather are tested for impairment at least annually or more frequently if events or circumstances indicate that it is “more likely than not” that they might be impaired, such as from a change in business conditions. There were no triggering events identified during the year ended December 31, 2016. The Company performs its annual goodwill and indefinite-lived intangible assets impairment assessment in the fourth quarter of each year.
In 2016, the Company had eight reporting units. One of these reporting units, Water Quality, had no goodwill.
The Company performed a qualitative analysis for the remaining reporting units, which include Blücher, Dormont, US

55
Drains, AERCO, EMEA, Residential and Commercial, and Asia-Pacific. As of the October 30, 2016 testing date, the Company had approximately $493.4 million of goodwill on its balance sheet. As a result of the qualitative analyses, the Company determined that the fair values of the reporting units were more likely than not greater than the carrying amounts. In 2016, the Company did not need to proceed beyond the qualitative analysis, and no goodwill impairments were recorded.
In the fourth quarter of 2015, the Company performed a quantitative impairment analysis for the EMEA
reporting unit in connection with the annual strategic plan and due to the underperformance to budget, primarily caused by the continued challenging European macroeconomic environment. The Company estimated the fair value of the reporting unit using a weighted calculation of the income approach and the market approach. The income approach calculated the present value of expected future cash flows and included the impact of recent underperformance of the reporting unit due to the continued challenging macroeconomic environment in Europe and the Company’s lowered expectations for the reporting unit included in the strategic plan. The guideline public company method (market approach) calculated estimated fair values based on valuation multiples derived from stock prices and enterprise values of publicly traded companies that are comparable to the Company. In the second step of the impairment test, the carrying value of the goodwill exceeded the implied fair value of goodwill, resulting in a pre-tax impairment charge of $129.7 million. There was a tax benefit associated with the impairment of $3.4 million, resulting in a net impairment charge of $126.3 million.
Goodwill
The changes in the carrying amount of goodwill by geographic segment are as follows:
Year Ended December 31,2016 Gross Balance Accumulated Impairment Losses Net Goodwill Acquired Foreign Balance During Currency Balance Balance Impairment Balance January 1, the Translation December 31, January 1, Loss During December 31, December 31, 2016 Period (1) and Other 2016 2016 the Period 2016 2016 (in millions) Americas $ 391.2 43.3 0.2 434.7 $ (24.5) — (24.5) 410.2 EMEA 238.6 — (3.7) 234.9 (129.7) — (129.7) 105.2 Asia -
Pacific 26.3 3.7 0.2 30.2 (12.9) — (12.9) 17.3 Total $ 656.1 47.0 (3.3) 699.8 $ (167.1) — (167.1) 532.7
(1) Americas goodwill additions during 2016 include $4.2 million of goodwill resulting from an insignificant acquisition.
Year Ended December 31,2015 Gross Balance Accumulated Impairment Losses Net Goodwill Acquired Foreign Balance During Currency Balance Balance Impairment Balance January 1, the Translation December 31, January 1, Loss During December 31, December 31, 2015 Period and Other 2015 2015 the Period 2015 2015 (in millions)
Americas $ 398.0 — (6.8) 391.2 $ (24.5) — (24.5) 366.7 EMEA 265.5 — (26.9) 238.6 — (129.7) (129.7) 108.9 Asia -
Pacific 12.9 12.9 0.5 26.3 (12.9) — (12.9) 13.4 Total $ 676.4 12.9 (33.2) 656.1 $ (37.4) (129.7) (167.1) 489.0
On November 2, 2016, the Company acquired 100% of the shares of PVI Riverside Holdings, Inc., the parent company of PVI Industries, LLC (“PVI”). The aggregate purchase price recorded, including an estimated working capital adjustment, was approximately $79.2 million. The Company accounted for the transaction as a purchased business combination. The Company completed a preliminary purchase price allocation that resulted in the recognition of $39.1 million in goodwill and $31.0 million in intangible assets as of December 31, 2016.
On February 26, 2016, the Company acquired an additional 50% of the outstanding shares of AERCO Korea
Co., Ltd., (“AERCO Korea”) for an aggregate purchase price of approximately $4 million. Prior to February 26, 2016, the Company held a 40% interest in AERCO Korea, which operated as a joint venture. On December 30, 2016, the

56
Company acquired the remaining 10% of the outstanding shares of AERCO Korea for $0.8 million. The Company completed a valuation of the assets and liabilities acquired that resulted in the recognition of $3.7 million in goodwill and $1.6 million in intangible assets. On November 30, 2015, the Company completed the acquisition of 80% of the outstanding shares of Apex Valves Limited (“Apex”), a New Zealand company, with a commitment to purchase the remaining 20% ownership within three years of closing. The aggregate purchase price was approximately $20.4 million and the Company recorded a liability of $5.5 million as the estimate of the acquisition date fair value on the contractual call option to purchase the remaining 20%. The Company accounted for the transaction as a business combination. The Company completed a purchase price allocation that resulted in the recognition of $12.9 million in goodwill and $10.1 million in intangible assets. Long-Lived Assets
Indefinite-lived intangibles are tested for impairment at least annually or more frequently if events or circumstances, such as a change in business conditions, indicate that it is “more likely than not” that an intangible asset might be impaired. The Company performs its annual indefinite-lived intangibles impairment assessment in the fourth quarter of each year. For the 2016, 2015 and 2014 impairment assessments, the Company performed quantitative assessments for all indefinite-lived intangible assets. The methodology employed was the relief from royalty method, a subset of the income approach. Based on the results of the assessment, the Company recognized non-cash pre-tax impairment charges in 2016, 2015 and 2014 of approximately $0.4 million, $0.6 million and $1.3 million, respectively. The impairment charge of $0.4 million in 2016 consists of an impairment charge for a trade name in the EMEA segment. The $0.6 million in 2015 consists of a $0.5 million impairment charge for a trade name in the Americas segment and a $0.1 million impairment charge for a trade name in the EMEA segment. The impairment charge of $1.3 million in 2014 consists of a $0.5 million impairment charge for a trade name in the Americas segment and a $0.8 million impairment charge for a trade name in the EMEA segment. The gross carrying amount in the table below reflects the impairment charges.
Intangible assets with estimable lives and other long-lived assets are reviewed for impairment whenever events
or changes in circumstances indicate that the carrying amount of an asset or asset group may not be recoverable. Recoverability of intangible assets with estimable lives and other long- lived assets is measured by a comparison of the carrying amount of an asset or asset group to future net undiscounted pretax cash flows expected to be generated by the asset or asset group. If these comparisons indicate that an asset is not recoverable, the impairment loss recognized is the amount by which the carrying amount of the asset or asset group exceeds the related estimated fair value. Estimated fair value is based on either discounted future pretax operating cash flows or appraised values, depending on the nature of the asset. The Company determines the discount rate for this analysis based on the weighted average cost of capital using the market and guideline public companies for the related businesses and does not allocate interest charges to the asset or asset group being measured. Judgment is required to estimate future operating cash flows.
Intangible assets include the following:
December 31, 2016 2015 Gross Net Gross Net Carrying Accumulated Carrying Carrying Accumulated Carrying Amount Amortization Amount Amount Amortization Amount (in millions)
Patents $ 16.1 $ (14.9) $ 1.2 $ 16.1 $ (14.1) $ 2.0 Customer relationships 231.5 (117.3) 114.2 212.5 (102.1) 110.4 Technology 53.1 (19.2) 33.9 41.3 (16.1) 25.2 Trade names 25.1 (8.1) 17.0 21.9 (6.4) 15.5 Other 6.8 (5.9) 0.9 9.4 (5.9) 3.5
Total amortizable intangibles 332.6 (165.4) 167.2 301.2 (144.6) 156.6
Indefinite-lived intangible assets 35.3 — 35.3 36.2 — 36.2 $ 367.9 $ (165.4) $ 202.5 $ 337.4 $ (144.6) $ 192.8

57
The Company acquired $31.0 million in intangible assets as part of the PVI acquisition in 2016, consisting of customer relationships valued at $17.6 million, technology of $10.2 million, and the trade name of $3.2 million. The weighted-average amortization period in total and by asset category of customer relationships, technology, and the trade name is 16.1 years, 15 years, 10 years, and 20 years, respectively.
The Company acquired $1.6 million in intangible assets as part of the AERCO Korea acquisition in 2016,
consisting entirely of customer relationships. The weighted-average amortization period for the customer relationships acquired in 10 years.
The Company acquired $10.1 million in intangible assets as part of the APEX acquisition in 2015, consisting
primarily of customer relationships valued at $8.4 million and the trade name of $1.7 million. The weighted-average amortization period in total and by asset category of customer relationships and the trade name is 13 years, 10 years and 15 years, respectively.
Aggregate amortization expense for amortized intangible assets for 2016, 2015 and 2014 was $20.8 million,
$20.9 million and $15.2 million, respectively. Additionally, future amortization expense on amortizable intangible assets is expected to be $21.6 million for 2017, $18.4 million for 2018, $14.8 million for 2019, $14.4 million for 2020, and $12.7 million for 2021. Amortization expense is provided on a straight-line basis over the estimated useful lives of the intangible assets. The weighted-average remaining life of total amortizable intangible assets is 11.5 years. Patents, customer relationships, technology, trade names and other amortizable intangibles have weighted-average remaining lives of 3.6 years, 11.7 years, 9.1 years, 15.1 years and 19.7 years, respectively. Indefinite-lived intangible assets primarily include trade names and trademarks.
Property, Plant and Equipment
Property, plant and equipment are recorded at cost. Depreciation is provided on a straight-line basis over the estimated useful lives of the assets, which range from 10 to 40 years for buildings and improvements and 3 to 15 years for machinery and equipment. Leasehold improvements are depreciated over the lesser of the economic useful life of the asset or the remaining lease term.
Taxes, Other than Income Taxes
Taxes assessed by governmental authorities on sale transactions are recorded on a net basis and excluded from sales in the Company’s consolidated statements of operations.
Income Taxes
Income taxes are accounted for under the asset and liability method. Deferred tax assets and liabilities are recognized for the future tax consequences attributable to differences between the financial statement carrying amounts of existing assets and liabilities and their respective tax bases and operating loss and tax credit carry forwards. Deferred tax assets and liabilities are measured using enacted tax rates expected to apply to taxable income in the years in which those temporary differences are expected to be recovered or settled. The effect on deferred tax assets and liabilities of a change in tax rates is recognized in income in the period that includes the enactment date.
The Company recognizes tax benefits when the item in question meets the more–likely–than-not (greater than
50% likelihood of being sustained upon examination by the taxing authorities) threshold. During 2016, unrecognized tax benefits of the Company increased by a net amount of $0.9 million. Unrecognized tax benefits increased by approximately $1.1 million which was mainly related to European tax positions. Unrecognized tax benefits decreased by $0.2 million, whereby approximately $0.2 million was primarily related to a settlement from the completion of a Massachusetts audit and various statue expirations.
As of December 31, 2016, the Company had gross unrecognized tax benefits of approximately $5.1 million,
approximately $2.4 million of which, if recognized, would affect the effective tax rate. The difference between the amount of unrecognized tax benefits and the amount that would affect the effective tax rate consists of the federal tax benefit of state income tax items and allowable correlative adjustments that are available for certain jurisdictions.

58
A reconciliation of the beginning and ending amount of unrecognized tax is as follows:
(in millions)
Balance at January 1, 2016 $ 4.2 Increases related to prior year tax positions 1.1 Decreases related to statute expirations (0.1) Settlements (0.2) Currency movement 0.1 Balance at December 31, 2016 $ 5.1
The Company estimates that it is reasonably possible that the balance of unrecognized tax benefits as of
December 31, 2016 may decrease by approximately $0.3 million in the next twelve months, as a result of lapses in statutes of limitations.
In January of 2017, the United States Internal Revenue Service commenced an audit of the Company’s 2015 tax
year. The Company does not anticipate any material adjustments to arise as a result of the audit. The Company conducts business in a variety of locations throughout the world resulting in tax filings in numerous domestic and foreign jurisdictions. The Company is subject to tax examinations regularly as part of the normal course of business. The Company’s major jurisdictions are the U.S., France, Germany, Canada, and the Netherlands. The statute of limitations in the U.S. is subject to tax examination for 2013 and later; France, Germany, Canada and the Netherlands are subject to tax examination for 2011-2013 and later. All other jurisdictions, with few exceptions, are no longer subject to tax examinations in state and local, or international jurisdictions for tax years before 2011.
The Company accounts for interest and penalties related to uncertain tax positions as a component of income
tax expense.
Foreign Currency Translation
The financial statements of subsidiaries located outside the United States generally are measured using the local currency as the functional currency. Balance sheet accounts, including goodwill, of foreign subsidiaries are translated into United States dollars at year-end exchange rates. Income and expense items are translated at weighted average exchange rates for each period. Net translation gains or losses are included in other comprehensive income, a separate component of stockholders’ equity. The Company does not provide for U.S. income taxes on foreign currency translation adjustments since it does not provide for such taxes on undistributed earnings of foreign subsidiaries. Gains and losses from foreign currency transactions of these subsidiaries are included in net earnings.
Stock-Based Compensation
The Company records compensation expense in the financial statements for share-based awards based on the grant date fair value of those awards. Stock-based compensation expense includes an estimate for pre-vesting forfeitures and is recognized over the requisite service periods of the awards on a straight-line basis, which is generally commensurate with the vesting term. The benefits associated with tax deductions in excess of recognized compensation cost are reported as a financing cash flow.
At December 31, 2016, the Company had one stock-based compensation plan with total unrecognized
compensation costs related to unvested stock-based compensation arrangements of approximately $16.2 million and a total weighted average remaining term of 1.62 years. For 2016, 2015 and 2014, the Company recognized compensation costs related to stock-based programs of approximately $13.4 million, $10.9 million and $8.6 million, respectively. In 2014, the Company began recognizing certain stock compensation costs in cost of goods sold based on the allocation of costs to its three operating segments. For 2016 and 2015, stock compensation expense, $0.9 million and $0.4 million, respectively, was recorded in cost of goods sold and $12.5 million and $10.5 million, respectively, was recorded in selling, general and administrative expenses. For 2016, 2015 and 2014, the Company recorded approximately $0.8 million, $0.3 million and $0.7 million, respectively, of tax benefits for the compensation expense relating to its stock options. For 2016, 2015 and 2014, the Company recorded approximately $2.8 million, $2.0 million and $1.6 million, respectively, of tax benefit for its other stock-based plans. For 2016, 2015 and 2014, the recognition of total stock-based compensation expense impacted both basic and diluted net income per common share by $0.29, $0.25 and $0.10, respectively.

59
Net Income (Loss) Per Common Share
Basic net income (loss) per common share is calculated by dividing net income (loss) by the weighted average number of common shares outstanding. The calculation of diluted net income (loss) per share assumes the conversion of all dilutive securities (see Note 11).
Net income (loss) and number of shares used to compute net income (loss) per share, basic and assuming full
dilution, are reconciled below:
Year Ended December 31, 2016 2015 2014 Per Per Per Net Share Net Share Net Share
Income Shares Amount Loss Shares Amount Income Shares Amoun
t (Amounts in millions, except per share information)
Basic EPS $ 84.2 34.4 $ 2.45 $ (112.9) 34.9 $ (3.24) $ 50.3 35.3 $ 1.42 Dilutive securities, principally common stock options — 0.1 (0.01) — — — — 0.1 — Diluted EPS $ 84.2 34.5 $ 2.44 $ (112.9) 34.9 $ (3.24) $ 50.3 35.4 $ 1.42 The computation of diluted net income (loss) per share for the years ended December 31, 2016, 2015 and 2014
excludes the effect of the potential exercise of options to purchase approximately 0.1 million, 0.3 million and 0.3 million shares, respectively, because the exercise price of the option was greater than the average market price of the Class A common stock and the effect would have been anti-dilutive.
Financial Instruments
In the normal course of business, the Company manages risks associated with commodity prices, foreign exchange rates and interest rates through a variety of strategies, including the use of hedging transactions, executed in accordance with the Company’s policies. The Company’s hedging transactions include, but are not limited to, the use of various derivative financial and commodity instruments. As a matter of policy, the Company does not use derivative instruments unless there is an underlying exposure. Any change in value of the derivative instruments would be substantially offset by an opposite change in the value of the underlying hedged items. The Company does not use derivative instruments for trading or speculative purposes.
Derivative instruments may be designated and accounted for as either a hedge of a recognized asset or liability
(fair value hedge) or a hedge of a forecasted transaction (cash flow hedge). For a fair value hedge, both the effective and ineffective portions of the change in fair value of the derivative instrument, along with an adjustment to the carrying amount of the hedged item for fair value changes attributable to the hedged risk, are recognized in earnings. For a cash flow hedge, changes in the fair value of the derivative instrument that are highly effective are deferred in accumulated other comprehensive income or loss until the underlying hedged item is recognized in earnings. The Company has two interest rate swaps designated as cash flow hedges and one foreign currency swap which is a non-designated cash flow hedge as of December 31, 2016. The Company did not have any cash flow hedges at December 31, 2015. Refer to Note 15 for further details.
If a fair value or cash flow hedge were to cease to qualify for hedge accounting or be terminated, it would
continue to be carried on the balance sheet at fair value until settled, but hedge accounting would be discontinued prospectively. If a forecasted transaction were no longer probable of occurring, amounts previously deferred in accumulated other comprehensive income would be recognized immediately in earnings. On occasion, the Company may enter into a derivative instrument that does not qualify for hedge accounting because it is entered into to offset changes in the fair value of an underlying transaction which is required to be recognized in earnings (natural hedge). These instruments are reflected in the Consolidated Balance Sheets at fair value with changes in fair value recognized in earnings.

60
The Company’s foreign currency derivative includes a forward foreign exchange contract related to the current rate exposure between the Hong Kong Dollar and the euro regarding an intercompany loan.
Portions of the Company’s outstanding debt are exposed to interest rate risks. The Company monitors its
interest rate exposures on an ongoing basis to maximize the overall effectiveness of its interest rates.
Fair Value Measurements
Fair value is defined as the exchange price that would be received for an asset or paid to transfer a liability (an exit price) in the principal or most advantageous market for the asset or liability in an orderly transaction between market participants on the measurement date. An entity is required to maximize the use of observable inputs, where available, and minimize the use of unobservable inputs when measuring fair value.
The Company has certain financial assets and liabilities that are measured at fair value on a recurring basis and
certain nonfinancial assets and liabilities that may be measured at fair value on a nonrecurring basis. The fair value disclosures of these assets and liabilities are based on a three-level hierarchy, which is defined as follows:
Level 1 Quoted prices in active markets for identical assets or liabilities that the entity has the
ability to access at the measurement date. Level 2 Observable inputs other than Level 1 prices, such as quoted prices for similar assets or
liabilities, quoted prices in markets that are not active or other inputs that are observable or can be corroborated by observable market data for substantially the full term of the assets or liabilities.
Level 3 Unobservable inputs that are supported by little or no market activity and that are significant to the fair value of the assets or liabilities.
Assets and liabilities subject to this hierarchy are classified in their entirety based on the lowest level of input
that is significant to the fair value measurement. The Company’s assessment of the significance of a particular input to the fair value measurement in its entirety requires judgment and considers factors specific to the asset or liability. Refer to Note 15 for further details.
Shipping and Handling
Shipping and handling costs included in selling, general and administrative expense amounted to $47.9 million, $53.5 million and $61.8 million for the years ended December 31, 2016, 2015 and 2014, respectively.
Research and Development
Research and development costs included in selling, general, and administrative expense amounted to $26.5 million, $23.5 million and $22.5 million for the years ended December 31, 2016, 2015 and 2014, respectively.
Revenue Recognition
The Company recognizes revenue when all of the following criteria have been met: the Company has entered into a binding agreement, the product has been shipped and title passes, the sales price to the customer is fixed or is determinable, and collectability is reasonably assured. Provisions for estimated returns and allowances are made at the time of sale, and are recorded as a reduction of sales and included in the allowance for doubtful accounts in the Consolidated Balance Sheets. The Company records provisions for sales incentives (primarily volume rebates), as an adjustment to net sales, at the time of sale based on estimated purchase targets.
Basis of Presentation Certain amounts in the 2015 and 2014 consolidated financial statements have been reclassified to permit comparison with the 2016 presentation. These reclassifications had no effect on reported results of operations or stockholders' equity.

61
Estimates
The preparation of financial statements in conformity with accounting principles generally accepted in the United States requires management to make estimates and assumptions that affect the reported amounts of assets and liabilities and disclosure of contingent assets and liabilities at the date of the financial statements and the reported amounts of revenues and expenses during the reporting period. Actual results could differ from those estimates. New Accounting Standards In January 2017, the Financial Accounting Standards Board (FASB) issued Accounting Standards Update (ASU) 2017-04, “Intangibles-Goodwill and Other (Topic 350): Simplifying the Test for Goodwill Impairment.” The new guidance eliminates the need to determine the fair value of individual assets and liabilities of a reporting unit to measure a goodwill impairment. A goodwill impairment will now be the amount by which a reporting unit’s carrying value exceeds its fair value. The revised guidance will be applied prospectively and is effective for calendar year-end SEC filers in 2020. Early adoption is permitted for any impairment tests performed after January 1, 2017. The new guidance is not expected to have a material impact on the Company's financial statements.
In January 2017, the FASB issued ASU 2017-01 “Business Combinations (Topic 805)-Clarifying the Definition of a Business”, which clarifies the definition of a business to assist entities with evaluating whether transactions should be accounted for as acquisitions or disposals of assets or businesses. The standard introduces a screen for determining when assets acquired are not a business and clarifies that a business must include, at a minimum, an input and a substantive process that contribute to an output to be considered a business. This standard is effective for fiscal years beginning after December 15, 2017, including interim periods within that reporting period. The adoption of this guidance is not expected to have a material impact on the Company’s financial statements.
In October 2016, the FASB issued ASU 2016-16 “Intra-Entity Transfers of Assets Other than Inventory.” ASU 2016-16 provides guidance on the timing of recognition of tax consequences of an intra-entity transfer of an asset other than inventory. ASU 2016-16 is effective for public companies with fiscal years beginning after December 15, 2017, with early adoption permitted. The ASU requires modified retrospective application through a cumulative-effect adjustment to retained earnings as of the beginning of the period of adoption. The adoption of this guidance is not expected to have a material impact on the Company’s financial statements.
In August 2016, the FASB issued ASU 2016-15, “Classification of Certain Cash Receipts and Cash Payments.” ASU 2016-15 provides guidance on the classification of specific types of cash receipts and cash payments within the Statement of Cash Flows. ASU 2016-15 is effective for public companies with fiscal years beginning after December 15, 2017, with early adoption permitted. The ASU requires retrospective application to all prior periods presented in the financial statements. The adoption of this guidance is not expected to have a material impact on the Company’s financial statements.
In April 2016, the FASB issued ASU 2016-10, “Revenue from Contracts with Customers-Identifying Performance Obligations and Licensing.” ASU 2016-10 clarifies the guidance on identifying performance obligations and licensing implementation guidance determined in ASU 2014-09 “Revenue from Contracts with Customers (Topic 606),” which is not yet effective. The adoption of ASU 2016-10 is not expected to have a material impact on the Company’s financial statements.
In March 2016, the FASB issued ASU 2016-09, “Improvements to Employee Share-Based Payment Accounting.” ASU 2016-09 simplifies several aspects of the accounting for share-based payment transactions, including the income tax consequences, classification of awards as equity or liabilities, forfeitures, and classification on the statement of cash flows. The Company will adopt the new standard in the first quarter of 2017. Although the impact of adopting this update to the Company’s Consolidated Financial Statements is not expected to have a material effect, the impact will depend on market factors and the timing and intrinsic value of future share-based compensation award vests and exercises. The Company has elected to account for forfeitures as they occur, rather than estimate expected forfeitures. The net cumulative effect of this change will be recognized as an adjustment to retained earnings as of January 1, 2017. Subsequent to adoption, the Company notes the potential for volatility in its effective tax rate as any windfall or shortfall tax benefits related to its stock-based compensation plans will be recorded directly into results of operations.

62
In March 2016, the FASB issued ASU 2016-08, “Revenue from Contracts with Customers-Principal versus Agent Consideration.” ASU 2016-08 clarifies the guidance on principal versus agent considerations determined in ASU 2014-09 “Revenue from Contracts with Customers (Topic 606),” which is not yet effective. The adoption of this guidance is not expected to have a material impact on the Company’s financial statements.
In February 2016, the FASB issued ASU 2016-02, “Leases (Topic 842).” ASU 2016-02 requires a lessee to recognize in the statement of financial position a liability to make lease payments and a right-of-use asset representing the right to use the underlying asset for the lease term for both finance and operating leases. ASU 2016-02 is effective for financial statements issued for annual periods beginning after December 15, 2018 and all interim periods thereafter. Earlier application is permitted for all entities. The Company is assessing the impact of this standard on the Company’s financial statements.
In November 2015, the FASB issued ASU 2015-17, “Income Taxes: Balance Sheet Classification of Deferred Taxes.” ASU 2015-17 requires that deferred tax liabilities and assets be classified as noncurrent in a classified statement of financial position. ASU 2015-17 is effective for financial statements issued for annual periods beginning after December 15, 2016 and all interim periods thereafter. Earlier application is permitted for all entities as of the beginning of an interim or annual reporting period and can be applied either prospectively or retrospectively to all periods presented. The adoption of this guidance is not expected to have a material impact on the Company’s financial statements.
In July 2015, the FASB issued ASU 2015-11, “Inventory: Simplifying the Measurement of Inventory.” This
new standard changes inventory measurement from lower of cost or market to lower of cost and net realizable value. The standard eliminates the requirement to consider replacement cost or net realizable value less a normal profit margin when measuring inventory. ASU 2015-11 is effective in the first quarter of 2017 for public companies with calendar year ends, and should be applied prospectively with early adoption permitted. The adoption of this guidance is not expected to have a material impact on the Company’s financial statements.
The FASB issued ASU 2015-03, “Interest-Imputation of Interest (Subtopic 835-30): Simplifying the Presentation of Debt Issuance Costs” effective for public companies beginning with the first interim period after December 15, 2015. ASU 2015-03 requires that debt issuance costs related to a recognized debt liability be presented in the balance sheet as a direct deduction from the carrying amount of the debt liability, consistent with debt discounts as opposed to an asset. This is considered a change in accounting principle, and the Company applied the new guidance as of April 3, 2016 and on a retrospective basis. Therefore, the Company has restated its long-term debt and other asset balances in the Balance Sheet for December 31, 2015 for comparative purposes. Refer to Note 10 below for further details. In May 2014, FASB issued ASU 2014-09, "Revenue from Contracts with Customers". ASU 2014-09 converges revenue recognition under U.S. GAAP and International Financial Reporting Standards ("IFRS"). For U.S. GAAP, the standard generally eliminates transaction and industry-specific revenue recognition guidance. This includes current guidance on long-term construction-type contracts, software arrangements, real estate sales, telecommunication arrangements, and franchise sales. Under the new standard, revenue is recognized based on a five-step model. The FASB issued ASU 2015-14 in August 2015 which deferred the effective date of ASU 2014-09 for public companies to periods beginning after December 15, 2017, with early adoption permitted. The Company plans to adopt the new standard effective January 1, 2018. The Company is currently reviewing its revenue arrangements in order to evaluate the impact of this standard on the Company’s financial statements and its method of adoption.
(3) Restructuring and Other Charges, Net
The Company’s Board of Directors approves all major restructuring programs that may involve the discontinuance of significant product lines or the shutdown of significant facilities. From time to time, the Company takes additional restructuring actions, including involuntary terminations that are not part of a major program. The Company accounts for these costs in the period that the liability is incurred. These costs are included in restructuring charges in the Company’s consolidated statements of operations.

63
A summary of the pre-tax cost by restructuring program is as follows:
Year Ended December 31, 2016 2015 2014 (in millions)
Restructuring costs: 2015 Actions $ 2.1 $ 13.6 $ — 2013 Actions — 0.5 3.8 Other Actions 2.6 7.3 11.3
Total restructuring $ 4.7 $ 21.4 $ 15.2
The Company recorded pre-tax restructuring in its business segments as follows:
Year Ended December 31, 2016 2015 2014 (in millions)
Americas $ 1.6 $ 9.4 $ 2.1 EMEA 3.4 6.7 12.1 Asia - Pacific 0.2 4.2 0.2 Corporate (0.5) 1.1 0.8 Total $ 4.7 $ 21.4 $ 15.2
2015 Actions
In 2015, the Board of Directors of the Company approved a transformation program relating to the Company’s Americas and Asia-Pacific businesses, which primarily involved the exit of low-margin, non-core product lines (“phase one”). The Company eliminated approximately $165 million of the combined Americas and Asia-Pacific net sales primarily within the Company’s do-it-yourself (DIY) distribution channel. As part of the rationalization exercise, the Company entered into an agreement to sell an operating subsidiary in China that was dedicated exclusively to the manufacturing of products being rationalized. The sale was finalized in the second quarter of 2016, and the Company recognized a pre-tax gain of $8.7 million and received proceeds from the sale of $8.4 million.
The second phase of the program involves the consolidation of manufacturing facilities and distribution center
network optimization. The second phase of the program involves reducing the square footage of the Company’s Americas facilities, which together with phase one, reduced the Americas net operating footprint by approximately 30%. The second phase is designed to improve the utilization of our remaining facilities, better leverage our cost structure, reduce working capital, and improve execution of customer delivery requirements. As of December 31, 2016, the second phase was substantially complete and is expected to be completed in the third quarter of 2017.
On a combined basis, the total estimated pre-tax cost for the Company’s transformation program related to its
Americas and Asia-Pacific businesses is approximately $65 million, including restructuring costs of $19.5 million, goodwill and intangible asset impairments of $13.5 million and other transformation and deployment costs of approximately $32 million. The other transformation and deployment costs include consulting and project management fees, inventory write-offs, and other associated costs. Costs of the program are expected to be incurred through 2017.
The following table summarizes by type, the total expected, incurred and remaining pre-tax restructuring costs
for the Company’s transformation program related to its Americas and Asia-Pacific businesses (phase one and phase two combined):
Facility Legal and Asset exit Severance consultancy write‑downs and other Total (in millions) Costs incurred—2015 $ 8.5 0.7 1.6 2.8 13.6 Costs incurred—2016 (1.5) 0.2 2.9 0.5 2.1 Remaining costs to be incurred 0.2 0.1 1.8 1.7 3.8 Total expected restructuring costs $ 7.2 $ 1.0 $ 6.3 $ 5.0 $ 19.5

64
The following table summarizes total incurred for the year ended December 31, 2016, incurred program to date and expected pre-tax restructuring costs by business segment for the Company’s Americas and Asia-Pacific 2015 transformation program:
Year Ended Total December 31, Incurred Expected 2016 to Date Costs Asia-Pacific $ 0.2 $ 4.4 $ 4.6 Americas 1.9 11.3 14.9 Total restructuring costs $ 2.1 $ 15.7 $ 19.5
Details of the restructuring reserve activity for the Company’s Americas and Asia-Pacific 2015 transformation
program for the year ended December 31, 2016 are as follows:
Facility Legal and Asset exit Severance consultancy write-downs and other Total (in millions)
Balance at December 31, 2014 $ — $ — $ — $ — $ — Net pre-tax restructuring charges 8.5 0.7 1.6 2.8 13.6 Utilization and foreign currency impact (3.5) (0.3) (1.6) (1.8) (7.2)
Balance at December 31,2015 5.0 0.4 — 1.0 6.4 Net pre-tax restructuring charges (1.5) 0.2 2.9 0.5 2.1 Utilization and foreign currency impact (2.3) (0.6) (2.9) (1.5) (7.3) Balance at December 31, 2016 $ 1.2 $ — $ — $ — $ 1.2
Other Actions
The Company periodically initiates other actions which are not part of a major program. In the fourth quarter of 2015 and in the fourth quarter of 2014, management initiated certain restructuring actions and strategic initiatives with respect to the Company’s EMEA segment in response to the ongoing economic challenges in Europe and additional product rationalization. The restructuring actions included severance benefits and limited costs relating to asset write offs, professional fees and relocation.
Total “Other Actions” pre-tax restructuring expense was $2.6 million for the year ended December 31, 2016.
Included in “Other Actions” is the 2014 and 2015 EMEA restructuring initiatives, in addition to other minor initiatives for which the Company incurred restructuring expenses for the year ended December 31, 2016.
The total pre-tax charge for the EMEA 2015 restructuring initiatives is expected to be approximately $10
million, of which approximately $8.7 million was incurred as of December 31, 2016 for the program to date. The remaining expected costs relate to severance and legal costs and are expected to be completed in 2017.
The total pre-tax charge for the EMEA 2014 restructuring initiatives was approximately $6.7 million, all of
which was incurred as of December 31, 2016.

65
The following table summarizes total expected, incurred and remaining pre-tax restructuring costs for the EMEA 2015 restructuring actions:
Facility Legal and Exit Severance consultancy and other Total (in millions) Costs incurred-2015 $ 6.6 $ — $ 0.3 $ 6.9 Costs incurred-2016 1.3 0.5 — 1.8 Remaining costs to be incurred 1.1 0.2 — 1.3 Total expected restructuring costs $ 9.0 $ 0.7 $ 0.3 $ 10.0
Details of the Company’s EMEA 2015 restructuring reserve activity for the year ended December 31, 2016 are
as follows:
Legal and Facility exit Severance Consultancy and other Total (in millions) Balance at December 31, 2014 $ — $ — $ — $ — Net pre-tax restructuring charges 6.6 — 0.3 6.9 Utilization and foreign currency impact (0.2) — (0.3) (0.5)
Balance at December 31, 2015 6.4 — — 6.4 Net pre-tax restructuring charges 1.3 0.5 — 1.8 Utilization and foreign currency impact (2.9) (0.5) — (3.4) Balance at December 31, 2016 $ 4.8 $ — $ — $ 4.8
The following table summarizes total expected, incurred and remaining pre-tax restructuring costs for the
EMEA 2014 restructuring actions:
Facility Legal and Asset exit Severance consultancy write‑downs and other Total (in millions) Costs incurred—2014 $ 6.9 $ — $ — $ — $ 6.9 Costs incurred – 2015 (1.0) 0.2 0.3 — (0.5) Costs incurred – 2016 — — 0.3 — 0.3 Total restructuring costs $ 5.9 $ 0.2 $ 0.6 $ — $ 6.7
Details of the Company’s EMEA 2014 restructuring reserve activity for the year ended December 31, 2016 are
as follows:
Legal and Asset Severance consultancy write-downs Total (in millions)
Balance at December 31, 2014 $ 6.9 $ — $ — $ 6.9 Net pre-tax restructuring charges (1.0) 0.2 0.3 (0.5)
Utilization and foreign currency impact (3.3) (0.2) (0.3) (3.8)
Balance at December 31, 2015 2.6 — — 2.6 Net pre-tax restructuring charges — — 0.3 0.3 Utilization and foreign currency impact (2.1) — (0.3) (2.4) Balance at December 31, 2016 $ 0.5 $ — $ — $ 0.5
(4) Sale of Business Gain on Sale of China Operating Subsidiary
On September 22, 2015, the Company signed an agreement to sell an operating subsidiary in China that was dedicated to the production of non-core products. The sale was finalized in the second quarter of 2016, and the Company received proceeds of $8.4 million from the sale as of the fourth quarter of 2016. The Company recognized a pre-tax gain

66
of $8.7 million, which includes a non-cash accumulated currency translation adjustment of $7.3 million. The net after-tax gain was approximately $8.3 million. Sale of Certain Americas Product Lines
On September 15, 2015, the Company completed the sale of certain assets related to the Company’s fittings, brass and tubular and vinyl tubing product lines to a third party in an all-cash transaction. The Company received net cash proceeds of approximately $33.1 million, after inventory adjustments and transaction fees. Total net assets sold were $33.4 million, resulting in an immaterial loss.
The carrying amounts of the net assets sold were as follows:
(in millions)
Inventories, net $ 21.9 Other assets 3.1 Property, plant and equipment, net 4.3 Goodwill 4.1 Total net assets sold $ 33.4
(5) Business Acquisitions PVI Industries, LLC
On November 2, 2016, the Company acquired 100% of the shares of PVI. The aggregate purchase price recorded, including an estimated working capital adjustment, was approximately $79.2 million, and is subject to final post-closing working capital adjustments.
PVI is a leading manufacturer of commercial stainless steel water heating equipment, focused on the high capacity market in North America and is based in Fort Worth, Texas. PVI’s water heater product offering complements AERCO’s boiler products, allowing the Company to address customers’ heating and hot water requirements. The results of operations for PVI are included in the Company’s Americas segment since the date of acquisition. The Company has determined that both the pro-forma and actual results, including PVI’s net sales, net income, and earnings per share, are not material to the Company’s financial results, and therefore has not included these disclosures.
The Company accounted for the transaction as a purchased business combination and the acquisition was funded partially with available cash and partially from borrowings under the Company’s Credit Agreement. The Company completed a preliminary purchase price allocation that resulted in the recognition of $39.1 million in goodwill and $31.0 million in intangible assets. The intangible assets acquired consist of customer relationships valued at $17.6 million with estimated lives of 15 years, developed technology valued at $10.2 million with estimated lives of 10 years, and the trade name valued at $3.2 million, with estimated lives of 20 years. The goodwill is attributable to the workforce of PVI and the strategic platform adjacency that will allow Watts to extend its product offerings as a result of the acquisition. Approximately $6.9 million of the goodwill is deductible for tax purposes. The following table summarizes the value of the assets and liabilities acquired (in millions):
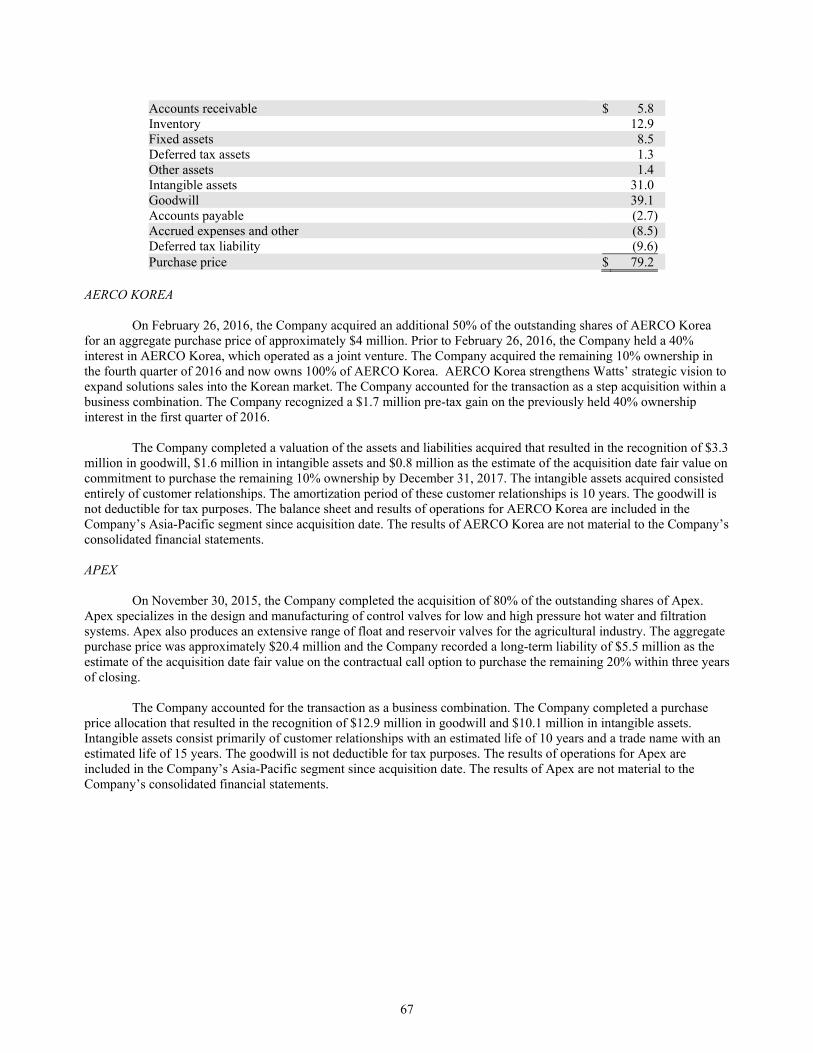
67
Accounts receivable $ 5.8 Inventory 12.9 Fixed assets 8.5 Deferred tax assets 1.3 Other assets 1.4 Intangible assets 31.0 Goodwill 39.1 Accounts payable (2.7) Accrued expenses and other (8.5) Deferred tax liability (9.6) Purchase price $ 79.2
AERCO KOREA
On February 26, 2016, the Company acquired an additional 50% of the outstanding shares of AERCO Korea
for an aggregate purchase price of approximately $4 million. Prior to February 26, 2016, the Company held a 40% interest in AERCO Korea, which operated as a joint venture. The Company acquired the remaining 10% ownership in the fourth quarter of 2016 and now owns 100% of AERCO Korea. AERCO Korea strengthens Watts’ strategic vision to expand solutions sales into the Korean market. The Company accounted for the transaction as a step acquisition within a business combination. The Company recognized a $1.7 million pre-tax gain on the previously held 40% ownership interest in the first quarter of 2016.
The Company completed a valuation of the assets and liabilities acquired that resulted in the recognition of $3.3 million in goodwill, $1.6 million in intangible assets and $0.8 million as the estimate of the acquisition date fair value on commitment to purchase the remaining 10% ownership by December 31, 2017. The intangible assets acquired consisted entirely of customer relationships. The amortization period of these customer relationships is 10 years. The goodwill is not deductible for tax purposes. The balance sheet and results of operations for AERCO Korea are included in the Company’s Asia-Pacific segment since acquisition date. The results of AERCO Korea are not material to the Company’s consolidated financial statements. APEX
On November 30, 2015, the Company completed the acquisition of 80% of the outstanding shares of Apex. Apex specializes in the design and manufacturing of control valves for low and high pressure hot water and filtration systems. Apex also produces an extensive range of float and reservoir valves for the agricultural industry. The aggregate purchase price was approximately $20.4 million and the Company recorded a long-term liability of $5.5 million as the estimate of the acquisition date fair value on the contractual call option to purchase the remaining 20% within three years of closing.
The Company accounted for the transaction as a business combination. The Company completed a purchase price allocation that resulted in the recognition of $12.9 million in goodwill and $10.1 million in intangible assets. Intangible assets consist primarily of customer relationships with an estimated life of 10 years and a trade name with an estimated life of 15 years. The goodwill is not deductible for tax purposes. The results of operations for Apex are included in the Company’s Asia-Pacific segment since acquisition date. The results of Apex are not material to the Company’s consolidated financial statements.
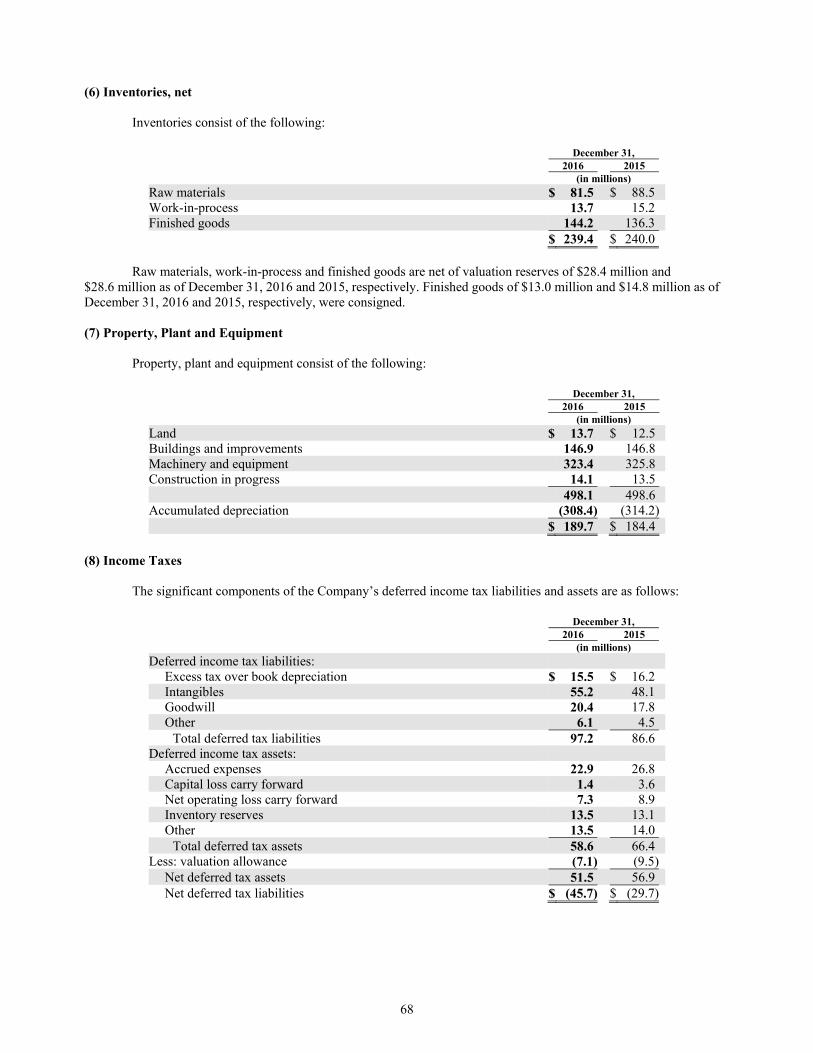
68
(6) Inventories, net
Inventories consist of the following:
December 31, 2016 2015 (in millions) Raw materials $ 81.5 $ 88.5 Work-in-process 13.7 15.2 Finished goods 144.2 136.3 $ 239.4 $ 240.0
Raw materials, work-in-process and finished goods are net of valuation reserves of $28.4 million and
$28.6 million as of December 31, 2016 and 2015, respectively. Finished goods of $13.0 million and $14.8 million as of December 31, 2016 and 2015, respectively, were consigned.
(7) Property, Plant and Equipment
Property, plant and equipment consist of the following:
December 31, 2016 2015 (in millions)
Land $ 13.7 $ 12.5 Buildings and improvements 146.9 146.8 Machinery and equipment 323.4 325.8 Construction in progress 14.1 13.5 498.1 498.6 Accumulated depreciation (308.4) (314.2) $ 189.7 $ 184.4
(8) Income Taxes
The significant components of the Company’s deferred income tax liabilities and assets are as follows:
December 31, 2016 2015 (in millions)
Deferred income tax liabilities: Excess tax over book depreciation $ 15.5 $ 16.2 Intangibles 55.2 48.1 Goodwill 20.4 17.8 Other 6.1 4.5
Total deferred tax liabilities 97.2 86.6 Deferred income tax assets:
Accrued expenses 22.9 26.8 Capital loss carry forward 1.4 3.6 Net operating loss carry forward 7.3 8.9 Inventory reserves 13.5 13.1 Other 13.5 14.0
Total deferred tax assets 58.6 66.4 Less: valuation allowance (7.1) (9.5)
Net deferred tax assets 51.5 56.9 Net deferred tax liabilities $ (45.7) $ (29.7)

69
The provision for income taxes is based on the following pre-tax income:
Year Ended December 31, 2016 2015 2014 (in millions)
Domestic $ 64.8 $ (25.8) $ 44.2 Foreign $ 63.0 (85.2) 38.9 $ 127.8 $ (111.0) $ 83.1
The provision for income taxes consists of the following:
Year Ended December 31, 2016 2015 2014 (in millions) Current tax expense:
Federal $ 18.3 $ 3.4 $ 12.8 Foreign 17.2 18.1 20.4 State 3.9 2.0 2.7
39.4 23.5 35.9 Deferred tax expense (benefit):
Federal 3.6 (13.6) 2.1 Foreign 0.6 (7.0) (5.2) State — (1.0) —
4.2 (21.6) (3.1) $ 43.6 $ 1.9 $ 32.8
Actual income taxes reported are different than what would have been computed by applying the federal
statutory tax rate to income before income taxes. The reasons for these differences are as follows:
Year Ended December 31, 2016 2015 2014 (in millions) Computed expected federal income expense $ 44.7 $ (38.8) $ 29.1 State income taxes, net of federal tax benefit 2.2 0.8 2.1 Foreign tax rate differential (6.7) 7.5 (4.2) Goodwill impairment — 29.0 3.2 Change in valuation allowance — (1.8) — Other, net 3.4 5.2 2.6 $ 43.6 $ 1.9 $ 32.8
At December 31, 2016, the Company had foreign net operating loss carry forwards of $27.2 million for income
tax purposes before considering valuation allowances; $22.9 million of the losses can be carried forward indefinitely, and $4.3 million expire in 2023. The net operating losses consist of $22.9 million related to Austrian operations and $4.3 million to Dutch operations.
At December 31, 2016, the Company has U.S. capital loss carry forwards of $1.5 million for income tax
purposes before considering valuation allowances; $1.0 million expire in 2017 and $0.5 million expire in 2018. At December 31, 2016 and December 31, 2015, the Company had valuation allowances of $7.2 million and
$9.5 million, respectively. At December 31, 2016, $1.5 million relates to U.S. capital losses and $5.7 million relates to Austrian net operating losses. At December 31, 2015, $3.6 million related to U.S. capital losses and $5.9 million related to Austrian net operating losses. Management believes that the ability of the Company to use such losses within the applicable carry forward period does not rise to the level of the more likely than not threshold. The Company does not have a valuation allowance on other deferred tax assets, as management believes that it is more likely than not that the Company will recover the net deferred tax assets. Management believes it is more likely than not that the future reversals of the deferred tax liabilities, together with forecasted income, will be sufficient to fully recover the deferred tax assets.

70
Changes enacted in income tax laws had no material effect on the Company in 2016, 2015 or 2014. Undistributed earnings of the Company’s foreign subsidiaries amounted to approximately $346.1 million at
December 31, 2016, $366.1 million at December 31, 2015, and $386.0 million at December 31, 2014. Those earnings are considered to be indefinitely reinvested and, accordingly, no provision for U.S. federal and state income taxes has been recorded thereon. Upon distribution of those earnings, in the form of dividends or otherwise, the Company will be subject to withholding taxes payable to the various foreign countries. Determination of the amount of U.S. income tax liability that would be incurred is not practicable because of the complexities associated with its hypothetical calculation; however, unrecognized foreign tax credits may be available to reduce some portion of any U.S. income tax liability.
(9) Accrued Expenses and Other Liabilities
Accrued expenses and other liabilities consist of the following:
December 31, 2016 2015 (in millions) Commissions and sales incentives payable $ 36.0 $ 35.6 Product liability and workers’ compensation 28.1 30.7 Other 68.6 75.5 Income taxes payable 4.1 3.9 $ 136.8 $ 145.7
(10) Financing Arrangements
The Company’s debt consists of the following:
December 31, 2016 2015 (in millions) 5.85% notes due April 2016 $ — $ 225.0 5.05% notes due June 2020 75.0 75.0 Term Loan due February 2021 300.0 — Term Loan due December 2017 115.8 — Line of Credit matures February 2019 — 275.0 Line of Credit matures February 2021 162.0 — Other—consists primarily of European borrowings (at interest rates ranging from 1.1% to 6.0%) 0.8 2.3 Total debt outstanding 653.6 577.3 Less debt issuance costs (deduction from debt liability) (3.2) (2.0) Less current maturities (139.1) (1.1) Total long-term debt $ 511.3 $ 574.2
Principal payments during each of the next five years and thereafter are due as follows (in millions): 2017—
$139.1; 2018—$22.5; 2019—$30.0; 2020—$105.0; and 2021—$357.0. On February 12, 2016, the Company terminated its prior credit agreement and entered into a new Credit
Agreement (the “Credit Agreement”) among the Company, certain subsidiaries of the Company who become borrowers under the Credit Agreement, JPMorgan Chase Bank, N.A., as Administrative Agent, Swing Line Lender and Letter of Credit Issuer, and the other lenders referred to therein. The Credit Agreement provides for a $500 million, five-year, senior unsecured revolving credit facility (the “Revolving Credit Facility”) with a sublimit of up to $100 million in letters of credit. The Credit Agreement also provides for a $300 million, five-year, term loan facility (the “Term Loan Facility”) available to the Company in a single draw. Borrowings outstanding under the Revolving Credit Facility bear interest at a fluctuating rate per annum equal to an applicable percentage defined as (i) in the case of Eurocurrency rate loans, the ICE Benchmark Administration LIBOR rate plus an applicable percentage, ranging from 0.975% to 1.45%, determined by reference to the Company’s consolidated leverage ratio, or (ii) in the case of base rate loans and swing line loans, the highest of (a) the federal funds rate plus 0.5%, (b) the rate of interest in effect for such day as announced by JPMorgan Chase Bank, N.A. as its “prime rate,” and (c) the ICE Benchmark Administration LIBOR rate plus 1.0%,

71
plus an applicable percentage, ranging from 0.00% to 0.45%, determined by reference to the Company’s consolidated leverage ratio. Borrowings outstanding under the Term Loan Facility will bear interest at a fluctuating rate per annum equal to an applicable percentage defined as the ICE Benchmark Administration LIBOR rate plus an applicable percentage, ranging from 1.125% to 1.75%, determined by reference to the Company’s consolidated leverage ratio. The interest rates as of December 31, 2016 on the Revolving Credit Facility and on the Term Loan Facility were 1.94% and 2.13%, respectively.
The loan under the Term Loan Facility amortizes as follows: 0% per annum during the first year, 7.5% in the
second and third years, 10% in the fourth and fifth years, and the remaining unpaid balance paid in full on the maturity date. Payments when due are made ratably each year in quarterly installments. In addition to paying interest under the Credit Agreement, the Company is also required to pay certain fees in connection with the credit facility, including, but not limited to, an unused facility fee and letter of credit fees. The Credit Agreement matures on February 12, 2021, subject to extension under certain circumstances and subject to the terms of the Credit Agreement. The Company may repay loans outstanding under the Credit Agreement from time to time without premium or penalty, other than customary breakage costs, if any, and subject to the terms of the Credit Agreement. Once repaid, amounts borrowed under the Term Loan Facility may not be borrowed again.
The Company maintains letters of credit that guarantee its performance or payment to third parties in accordance with specified terms and conditions. Amounts outstanding were approximately $25.6 million as of December 31, 2016 and $24.8 million as of December 31, 2015. The Company’s letters of credit are primarily associated with insurance coverage. The Company’s letters of credit generally expire within one year of issuance and are drawn down against the revolving credit facility. These instruments may exist or expire without being drawn down. Therefore, they do not necessarily represent future cash flow obligations.
On April 28, 2016, the Company borrowed $230 million under the Revolving Credit Facility to pay off all
amounts outstanding under its $225 million of 5.85% Senior Notes due April 30, 2016 (the “April 2016 Notes”). On November 1, 2016, the Company borrowed $45 million under the Revolving Credit Facility in order to finance the acquisition of PVI.
On December 16, 2016, Watts International Holdings Limited (“Watts International”), a wholly owned
subsidiary of the Company, entered into a Facility Agreement (the “Facility Agreement”) among Watts International, as original borrower and original guarantor, Watts Water Technologies EMEA B.V., a wholly owned subsidiary of the Company (“Watts EMEA”), as original guarantor, JPMorgan Chase Bank, N.A., as sole bookrunner and sole lead arranger (“JP Morgan Chase Bank”), J.P. Morgan Europe Limited, as agent to the financial parties, and the other lenders referred to therein. The Facility Agreement provides for a €110 million, 364 day, term loan facility available to the Company in a single draw. On December 20, 2016, Watts International borrowed the full amount available for borrowing under the Facility Agreement. The loan made on December 20, 2016 bears interest at a rate per annum equal to (i) the Euro InterBank Offered Rate (EURIBOR), provided that if such rate is less than zero, then EURIBOR shall be deemed to be zero, plus (ii) a margin of 1.875%, provided that if no event of default is continuing and Watts International’s consolidated leverage ratio is at a specified level, the margin shall decrease to 1.50%. Accrued interest on the loan is payable on the last day of each interest period. The first interest period is set at one month and may be changed subsequently to a period of one, two, or three months (or such other period agreed with all the lenders). The loan under the Facility Agreement is required to be repaid on the following schedule: €15,000,000 on June 30, 2017; €15,000,000 on September 29, 2017; and the remaining balance on December 19, 2017.
Watts International’s obligations under the Facility Agreement are guaranteed by Watts EMEA with a cross guarantee from Watts International. The Facility Agreement matures on December 19, 2017, subject to the terms of the Facility Agreement. Watts International may prepay all or a portion of the loan outstanding under the Facility Agreement from time to time (subject to prepaying a minimum amount) without premium or penalty, other than customary breakage costs, if any, and subject to the terms of the Facility Agreement. Once repaid, amounts borrowed under the Facility Agreement may not be borrowed again. If the Registrant ceases to control Watts International, the lenders may cancel their commitments and declare the loan immediately due and payable.
The Facility Agreement imposes various restrictions on Watts International and its subsidiaries, including restrictions pertaining to: (i) the incurrence of additional indebtedness, (ii) limitations on liens, (iii) making distributions, dividends and other payments, (iv) mergers, consolidations and acquisitions, (v) dispositions of assets, and (vi) the requirement to meet a certain consolidated leverage ratio and a certain consolidated cash to debt ratio.

72
Substantially all of the proceeds of the borrowings made on December 20, 2016 under the Facility Agreement
were used to pay down $113 million outstanding under the Revolving Credit Facility. As of December 31, 2016, the Company had $312.4 million of unused and available credit under the Credit
Agreement and $25.6 million of stand-by letters of credit outstanding on the Credit Agreement. The Company had $300 million of borrowings outstanding on the term loan as of December 31, 2016. As of December 31, 2016, the Company was in compliance with all covenants related to the Credit Agreement and the Facility Agreement.
During 2015 the Company was a party to a Credit Agreement (the Prior Credit Agreement) among the Company, certain subsidiaries of the Company who become borrowers under the Prior Credit Agreement, JPMorgan Chase Bank, N.A., as Administrative Agent, Swing Line Lender and Letter of Credit Issuer, and the other lenders referred to therein. The Prior Credit Agreement provided for a $500 million, five-year, senior unsecured revolving credit facility which could have been increased by an additional $500 million under certain circumstances and subject to the terms of the Prior Credit Agreement. The Prior Credit Agreement had a sublimit of up to $100 million in letters of credit. This credit agreement was terminated in February 2016.
On June 18, 2010, the Company entered into a note purchase agreement with certain institutional investors (the 2010 Note Purchase Agreement). Pursuant to the 2010 Note Purchase Agreement, the Company issued senior notes of $75.0 million in principal, due June 18, 2020. The Company will pay interest on the outstanding balance of the Notes at the rate of 5.05% per annum, payable semi-annually on June 18th and December 18th until the principal on the Notes shall become due and payable. The Company may, at its option, upon notice, and subject to the terms of the 2010 Note Purchase Agreement, prepay at any time all or part of the Notes in an amount not less than $1.0 million by paying the principal amount plus a make-whole amount, which is dependent upon the yield of respective U.S. Treasury securities. The 2010 Note Purchase Agreement includes operational and financial covenants, with which the Company is required to comply, including, among others, maintenance of certain financial ratios and restrictions on additional indebtedness, liens and dispositions. As of December 31, 2016, the Company was in compliance with all covenants related to the 2010 Note Purchase Agreement.
In April 2015, the FASB issued ASU 2015-03, “Interest-Imputation of Interest (Subtopic 835-30): Simplifying
the Presentation of Debt Issuance Costs.” This ASU requires that debt issuance costs related to a recognized debt liability be presented in the balance sheet as a direct deduction from the carrying amount of the debt liability, consistent with debt discounts as opposed to an asset. This ASU was effective for public companies beginning with the first interim period after December 15, 2015. This is considered a change in accounting principle, and the new guidance has been applied on a retrospective basis. As of December 31, 2016, the Company had total debt outstanding of $653.6 million and total unamortized debt issuance costs on the debt outstanding of $3.2 million. The long-term debt, net of current portion and net of debt issuance costs was $511.3 million as of December 31, 2016. As of December 31, 2015, the Company had total debt outstanding of $577.3 million and total unamortized debt issuance costs on the debt outstanding of $2.0 million. The long-term debt, net of current portion was $576.2 million as of December 31, 2015. In order to apply the guidance on a retrospective basis, the Company reclassified debt issuance costs as of December 31, 2015 from other assets against total long-term debt outstanding. Therefore, the restated long-term debt, net of current portion balance as of December 31, 2015 is $574.2 million, and the restated other long-term asset balance as of December 31, 2015 is $11.9 million.
(11) Common Stock
The Class A common stock and Class B common stock have equal dividend and liquidation rights. Each share of the Company’s Class A common stock is entitled to one vote on all matters submitted to stockholders, and each share of Class B common stock is entitled to ten votes on all such matters. Shares of Class B common stock are convertible into shares of Class A common stock on a one-to-one basis at the option of the holder. As of December 31, 2016, the Company had reserved a total of 2,773,562 shares of Class A common stock for issuance under its stock-based compensation plans and 6,379,290 shares for conversion of Class B common stock to Class A common stock.
On July 27, 2015, the Company’s Board of Directors authorized the repurchase of up to $100 million of the
Company’s Class A common stock from time to time on the open market or in privately negotiated transactions. In connection with this stock repurchase program, the Company entered into a Rule 10b5-1 plan, which permits shares to

73
be repurchased when the Company might otherwise be precluded from doing so under insider trading laws. The repurchase program may be suspended or discontinued at any time, subject to the terms of the Rule 10b5-1 plan the Company entered into with respect to the repurchase program. As of December 31, 2016, there was approximately $56.0 million remaining authorized for share repurchases under this program.
On April 30, 2013, the Company’s Board of Directors authorized the repurchase of up to $90 million of the
Company’s Class A common stock from time to time on the open market or in privately negotiated transactions. The stock repurchase program was completed in September 2015, after the Company expended the entire $90 million authorized under the program.
The following table summarizes the cost and the number of shares of Class A common stock repurchased under
the April 30, 2013 and July 27, 2015 programs for the years ended December 31, 2016 and 2015:
Year Ended December 31, 2016 2015 Number of shares Cost of shares Number of shares Cost of shares repurchased repurchased repurchased repurchased (amounts in millions, except share amount) Stock repurchase programs:
April 30, 2013 — $ — 497,010 $ 27.3 July 27, 2015 501,229 26.8 315,530 17.3
Total 501,229 $ 26.8 812,540 $ 44.6
(12) Stock-Based Compensation
As of December 31, 2016, the Company maintains one stock incentive plan, the Second Amended and Restated 2004 Stock Incentive Plan (the “2004 Stock Incentive Plan”). At December 31, 2016, 1,402,580 shares of Class A common stock were authorized for future grants of new equity awards under this plan. Under this plan, key employees have been granted nonqualified stock options to purchase the Company’s Class A common stock. Options typically become exercisable over a four-year period at the rate of 25% per year and expire ten years after the grant date. However, most options granted in 2014 become exercisable over a three-year period at a rate of one-third per year. Options granted under the plan may have exercise prices of not less than 100% of the fair market value of the Class A common stock on the date of grant. The Company’s current practice has been to grant all options at fair market value on the grant date. Beginning in 2015, the Company stopped granting stock options as part of its annual equity awards to employees and the Company did not issue any stock options for 2016 or 2015.
The Company grants shares of restricted stock and deferred shares to key employees and stock awards to
non-employee members of the Company’s Board of Directors under the 2004 Stock Incentive Plan. Stock awards to non-employee members of the Company’s Board of Directors vest immediately. Employees’ restricted stock awards and deferred shares typically vest over a three-year period at the rate of one-third per year, except that most restricted stock awards and deferred shares granted in 2014 vest over a two-year period at the rate of 50% per year.
The Company also grants performance stock units to key employees under the 2004 Stock Incentive Plan.
Performance stock units cliff vest at the end of a performance period set by the Compensation Committee of the Board of Directors at the time of grant. Upon vesting, the number of shares of the Company’s Class A common stock awarded to each performance stock unit recipient will be determined based on the Company’s performance relative to certain performance goals set at the time the performance stock units were granted. The recipient of a performance stock unit award may earn from zero shares to twice the number of target shares awarded to such recipient. The performance stock units are amortized to expense over the vesting period, and based on the Company’s performance relative to the performance goals, may be adjusted. Changes to the estimated shares expected to vest will result in adjustments to the related share-based compensation expense that will be recorded in the period of change. If the performance goals are not met, no awards are earned and previously recognized compensation expense is reversed. The Company granted performance stock units in 2014, 2015 and 2016. The performance goals for the performance stock units are based on the compound annual growth rate of the Company’s revenue over the three-year performance period and the Company’s return on invested capital (“ROIC”) for the third year of the performance period.
The Company also has a Management Stock Purchase Plan that allows for the granting of restricted stock units
(RSUs) to key employees. On an annual basis, key employees may elect to receive a portion of their annual incentive

74
compensation in RSUs instead of cash. Each RSU provides the key employee with the right to purchase a share of Class A common stock at 67% of the fair market value on the date of grant. Beginning with annual incentive compensation for 2016 and RSUs granted in 2017, the purchase price for RSUs will be increased to 80% of the fair market value of the Company’s Class A common stock. RSUs vest either annually over a three-year period from the grant date or upon the third anniversary of the grant date and receipt of the shares underlying RSUs is deferred for a minimum of three years or such greater number of years as is chosen by the employee. An aggregate of 2,000,000 shares of Class A common stock may be issued under the Management Stock Purchase Plan. At December 31, 2016, 803,562 shares of Class A common stock were authorized for future grants under the Company’s Management Stock Purchase Plan.
2004 Stock Incentive Plan
At December 31, 2016, total unrecognized compensation cost related to the unvested stock options was approximately $0.6 million with a total weighted average remaining term of 0.6 years. For 2016, 2015 and 2014, the Company recognized compensation cost of $1.1 million, $1.9 million and $2.6 million, respectively.
The following is a summary of stock option activity and related information:
Year Ended December 31, 2016 2015 2014 Weighted Weighted Weighted Weighted Average Average Average Average Exercise Intrinsic Exercise Exercise Options Price Value Options Price Options Price (Options in thousands) Outstanding at beginning of year 362 $ 48.46 495 $ 47.34 1,029 $ 41.66 Granted — — — — 114 57.58 Cancelled/Forfeitures (43) 52.93 (69) 51.66 (306) 44.19 Exercised (189) 43.31 (64) 36.29 (342) 36.48 Outstanding at end of year 130 $ 54.46 $ 10.74 362 $ 48.46 495 $ 47.34 Exercisable at end of year 82 $ 53.38 $ 11.82 192 $ 45.10 128 $ 40.04
As of December 31, 2016, the aggregate intrinsic value of exercisable options was approximately $1.0 million,
representing the total pre-tax intrinsic value, based on the Company’s closing Class A common stock price of $65.20 as of December 31, 2016, which would have been received by the option holders had all option holders exercised their options as of that date. The total intrinsic value of options exercised for 2016, 2015 and 2014 was approximately $3.5 million, $1.2 million and $8.2 million, respectively.
Upon exercise of options, the Company issues shares of Class A common stock. The following table summarizes information about options outstanding at December 31, 2016:
Options Outstanding Options Exercisable Weighted Average Weighted Average Weighted Average Number Remaining Contractual Exercise Number Exercise Range of Exercise Prices Outstanding Life (years) Price Exercisable Price (Options in thousands)
$29.05-$37.41 11,300 5.30 $ 35.01 11,300 $ 35.01 $54.76–$54.76 57,769 6.46 54.76 34,020 54.76 $57.47–$60.10 61,414 7.22 57.76 36,736 57.75 130,483 6.72 $ 54.46 82,056 $ 53.38

75
The fair value of each option granted under the 2004 Stock Incentive Plan is estimated on the date of grant, using the Black-Scholes-Merton Model, based on the following weighted average assumptions:
Year ended December 31, 2014
Expected life (years) 6.0 Expected stock price volatility 37.5 % Expected dividend yield 1.0 % Risk-free interest rate 1.9 %
The risk-free interest rate is based upon the U.S. Treasury yield curve at the time of grant for the respective
expected life of the option. The expected life (estimated period of time outstanding) of options and volatility were calculated using historical data. The expected dividend yield of stock is the Company’s best estimate of the expected future dividend yield.
The above assumptions were used to determine the weighted average grant-date fair value of stock options of
$20.04 for the year ended December 31, 2014. There were no stock options granted in 2015 or 2016. The following is a summary of unvested restricted stock and deferred shares activity and related information:
Year Ended December 31, 2016 2015 2014 Weighted Weighted Weighted Average Average Average Grant Date Grant Date Grant Date Shares Fair Value Shares Fair Value Shares Fair Value (Shares in thousands) Unvested at beginning of year 244 $ 52.61 214 $ 53.74 260 $ 45.58 Granted 140 56.33 180 50.87 151 56.79
Cancelled/Forfeitures (132) 54.43
(28) 53.99 (95) 46.83 Vested (42) 53.10 (122) 51.72 (102) 44.87 Unvested at end of year 210 $ 53.79 244 $ 52.61 214 $ 53.74
The total fair value of shares vested during 2016, 2015 and 2014 was $7.9 million, $6.6 million and
$5.9 million, respectively. At December 31, 2016, total unrecognized compensation cost related to unvested restricted stock and deferred shares was approximately $7.9 million with a total weighted average remaining term of 1.72 years. For 2016, 2015 and 2014, the Company recognized compensation costs of $7.6 million, $6.7 million and $4.8 million, respectively.
The aggregate intrinsic value of restricted stock and deferred shares granted and outstanding approximated
$13.7 million representing the total pre-tax intrinsic value based on the Company’s closing Class A common stock price of $65.20 as of December 31, 2016.
The following is a summary of unvested performance share award activity and related information:
Year Ended December 31, 2016 2015 Weighted Weighted Average Average Grant Date Grant Date Shares Fair Value Shares Fair Value (Shares in thousands) Unvested at beginning of year 201 $ 57.98 107 56.97 Granted 107 55.27 106 $ 58.94 Cancelled/Forfeitures (41) 57.56 (12) 57.51 Unvested at end of year 267 $ 56.96 201 $ 57.98

76
At December 31, 2016, total unrecognized compensation cost related to unvested performance shares was approximately $6.3 million with a total weighted average remaining term of 1.53 years. For 2016 and 2015, the Company recognized compensation costs of $4.0 million and $1.7 million, respectively.
The aggregate intrinsic value of performance shares granted and outstanding approximated $17.4 million
representing the total pre-tax intrinsic value based on the Company’s closing Class A common stock price of $65.20 as of December 31, 2016.
Management Stock Purchase Plan
Total unrecognized compensation cost related to unvested RSUs was approximately $1.5 million at December 31, 2016 with a total weighted average remaining term of 1.8 years. For 2016, 2015 and 2014 the Company recognized compensation cost of $0.7 million, $0.6 million and $0.5 million, respectively. Dividends declared for RSUs, that are paid to individuals, that remain unpaid at December 31, 2016 total approximately $0.1 million.
A summary of the Company’s RSU activity and related information is shown in the following table:
Year Ended December 31, 2016 2015 2014 Weighted Weighted Weighted Weighted Average Average Average Average Purchase Intrinsic Purchase Purchase RSUs Price Value RSUs Price RSUs Price (RSU’s in thousands) Outstanding at beginning of period 101 $ 36.14 80 $ 32.08 132 $ 27.46 Granted 89 35.41 60 37.13 31 40.27 Cancelled/Forfeitures (28) 32.25 (9) 36.92 (32) 31.58 Settled (14) 36.91 (30) 27.10 (51) 25.41 Outstanding at end of period 148 $ 36.37 13.53 $ 101 $ 36.14 80 $ 32.08 Vested at end of period 28 $ 37.78 16.32 $ 25 $ 33.35 31 $ 27.96
As of December 31, 2016, the aggregate intrinsic values of outstanding and vested RSUs were approximately
$4.3 million and $0.8 million, respectively, representing the total pre-tax intrinsic value, based on the Company’s closing Class A common stock price of $65.20 as of December 31, 2016, which would have been received by the RSUs holders had all RSUs settled as of that date. The total intrinsic value of RSUs settled for 2016, 2015 and 2014 was approximately $1.5 million, $0.8 million and $1.7 million, respectively. Upon settlement of RSUs, the Company issues shares of Class A common stock.
The following table summarizes information about RSUs outstanding at December 31, 2016:
RSUs Outstanding RSUs Vested Weighted Average Weighted Average Number Purchase Number Purchase Range of Purchase Prices Outstanding Price Vested Price (RSUs in thousands) $26.51-$35.41 87 35.30 2 30.96 $37.13–$40.27 61 37.89 26 38.35 148 $ 36.37 28 $ 37.78

77
The fair value of each share issued under the Management Stock Purchase Plan is estimated on the date of grant, using the Black-Scholes-Merton Model, based on the following weighted average assumptions:
Year Ended December 31, 2016 2015 2014
Expected life (years) 3.0 3.0 3.0 Expected stock price volatility 24.8 % 23.4 % 31.2 %Expected dividend yield 1.3 % 1.2 % 0.9 %Risk-free interest rate 0.9 % 1.1 % 0.7 %
The risk-free interest rate is based upon the U.S. Treasury yield curve at the time of grant for the respective
expected life of the RSUs. The expected life (estimated period of time outstanding) of RSUs and volatility were calculated using historical data. The expected dividend yield of stock is the Company’s best estimate of the expected future dividend yield.
The above assumptions were used to determine the weighted average grant-date fair value of RSUs granted of
$18.15, $19.04 and $22.57 during 2016, 2015 and 2014, respectively. The Company distributed dividends of $0.71 per share for 2016, $0.66 per share for 2015, and $0.58 per share
for 2014, respectively, on the Company’s Class A common stock and Class B common stock.
(13) Employee Benefit Plans
The Company’s domestic employees are eligible to participate in the Company’s 401(k) savings plan. Since January 1, 2012, the Company has provided a base contribution of 2% of an employee’s salary, regardless of whether the employee participates in the plan. Further, the Company matches the contribution of up to 100% of the first 4% of an employee’s contribution. The Company’s match contributions for the years ended December 31, 2016, 2015 and 2014, were $5.4 million, $4.3 million, and $4.4 million, respectively. Charges for EMEA pension plans approximated $4.5 million, $4.9 million and $5.5 million for the years ended December 31, 2016, 2015 and 2014, respectively. These costs relate to plans administered by certain European subsidiaries, with benefits calculated according to government requirements and paid out to employees upon retirement or change of employment. Prior to January 1, 2012, for the majority of its U.S. employees, the Company had sponsored a funded non-contributory defined benefit pension plan, the Watts Water Technologies, Inc. Pension Plan (the “Pension Plan”), and an unfunded non-contributory defined benefit pension plan, the Watts Water Technologies, Inc. Supplemental Employees Retirement Plan (the “SERP”). On April 28, 2014, the Company’s Board of Directors voted to terminate the Company’s Pension Plan and the SERP. The Board of Directors authorized the Company to make such contributions to the Pension Plan and SERP as may be necessary to make the plans sufficient to settle all plan liabilities. The Pension Plan was terminated effective July 31, 2014, and on June 4, 2015 the Company received the Internal Revenue Service’s favorable determination letter for terminating the Pension Plan. The SERP was terminated effective May 15, 2014. In September 2015, the Company settled its Pension Plan and SERP benefit obligations. The Company made cash contributions in September 2015 of $43.2 million to fully fund the settlement actions.
The cumulative actuarial losses of $59.7 million that were previously recorded in accumulated other comprehensive income were recognized in selling, general and administrative expenses for the quarter ended September 27, 2015. The associated deferred tax asset of $23.0 million that was previously recorded in accumulated other comprehensive income and netted within long-term deferred tax liabilities was reversed in the quarter ended September 27, 2015.
On August 18, 2015, the Company entered into Amendment No. 3 to Supplemental Compensation Agreement (the “Amendment”) with Timothy P. Horne, the Company’s former Chief Executive Officer and President and a principal stockholder. Under the Supplemental Compensation Agreement, dated September 1, 1995, as amended on July 25, 2000 and October 23, 2002 (the “Compensation Agreement”), between the Company and Mr. Horne, Mr. Horne received payments for consulting services equal to the greater of (i) one-half of the average of his annual base salary as an employee of the Company during the three years immediately prior to his retirement or (ii) $400,000 for each calendar year following his retirement until the date of his death, subject to certain cost-of-living increases each year. Mr. Horne was paid $598,562 for his consulting services in 2014. Under the Compensation Agreement Mr. Horne was

78
also entitled to receive lifetime benefits, including use of secretarial services, use of an office, retiree health insurance, reimbursement of tax and financial planning expenses, and certain other benefits. The Amendment provides for a $6 million lump-sum buyout of all of the Company’s ongoing lifetime payment obligations and all benefits under the Compensation Agreement, except for the use of an office and administrative support. The Amendment also provides for consulting services from Mr. Horne as requested by the Company rather than per year hourly requirements. The Company paid the $6 million lump-sum buyout amount to Mr. Horne in September 2015, which resulted in a $5 million pre-tax charge for the year ended December 31, 2015.
(14) Contingencies and Environmental Remediation Accrual and Disclosure Policy
The Company is a defendant in numerous legal matters arising from its ordinary course of operations, including those involving product liability, environmental matters, and commercial disputes.
The Company reviews its lawsuits and other legal proceedings on an ongoing basis and follows appropriate
accounting guidance when making accrual and disclosure decisions. The Company establishes accruals for matters when the Company assesses that it is probable that a loss has been incurred and the amount of the loss can be reasonably estimated. The Company does not establish accruals for such matters when the Company does not believe both that it is probable that a loss has been incurred and the amount of the loss can be reasonably estimated. The Company’s assessment of whether a loss is probable is based on its assessment of the ultimate outcome of the matter following all appeals.
Under the FASB issued ASC 450 “Contingencies”, an event is “reasonably possible” if “the chance of the
future event or events occurring is more than remote but less than likely” and an event is “remote” if “the chance of the future event or events occurring is slight”. Thus, references to the upper end of the range of reasonably possible loss for cases in which the Company is able to estimate a range of reasonably possible loss mean the upper end of the range of loss for cases for which the Company believes the risk of loss is more than slight.
There may continue to be exposure to loss in excess of any amount accrued. When it is possible to estimate the
reasonably possible loss or range of loss above the amount accrued for the matters disclosed, that estimate is aggregated and disclosed. The Company records legal costs associated with its legal contingencies as incurred, except for legal costs associated with product liability claims which are included in the actuarial estimates used in determining the product liability accrual.
As of December 31, 2016, the Company estimates that the aggregate amount of reasonably possible loss in
excess of the amount accrued for its legal contingencies is approximately $4.0 million pre-tax. With respect to the estimate of reasonably possible loss, management has estimated the upper end of the range of reasonably possible loss based on (i) the amount of money damages claimed, where applicable, (ii) the allegations and factual development to date, (iii) available defenses based on the allegations, and/or (iv) other potentially liable parties. This estimate is based upon currently available information and is subject to significant judgment and a variety of assumptions, and known and unknown uncertainties. The matters underlying the estimate will change from time to time, and actual results may vary significantly from the current estimate. In the event of an unfavorable outcome in one or more of the matters described below, the ultimate liability may be in excess of amounts currently accrued, if any, and may be material to the Company’s operating results or cash flows for a particular quarterly or annual period. However, based on information currently known to it, management believes that the ultimate outcome of all matters, as they are resolved over time, is not likely to have a material adverse effect on the financial condition of the Company, though the outcome could be material to the Company’s operating results for any particular period depending, in part, upon the operating results for such period.
Connector Class Actions
In November and December 2014, Watts Water Technologies, Inc. and Watts Regulator Co. were named as defendants in three separate putative nationwide class action complaints (Meyers v. Watts Water Technologies, Inc., United States District Court for the Southern District of Ohio; Ponzo v. Watts Regulator Co., United States District Court for the District of Massachusetts; Sharp v. Watts Regulator Co., United States District Court for the District of Massachusetts) seeking to recover damages and other relief based on the alleged failure of water heater connectors. On

79
June 26, 2015, plaintiffs in the three actions filed a consolidated amended complaint, under the case captioned Ponzo v. Watts Regulator Co., in the United States District Court for the District of Massachusetts (hereinafter “Ponzo”). Watts Water Technologies was voluntarily dismissed from the Ponzo case. The complaint seeks among other items, damages in an unspecified amount, replacement costs, injunctive relief, declaratory relief, and attorneys’ fees and costs. On August 7, 2015, the Company filed a motion to dismiss the complaint, which motion is still pending.
In February 2015, Watts Regulator Co. was named as a defendant in a putative nationwide class action
complaint (Klug v. Watts Water Technologies, Inc., et al., United States District Court for the District of Nebraska) seeking to recover damages and other relief based on the alleged failure of the Company’s Floodsafe connectors (hereinafter “Klug”). On June 26, 2015, the Company filed a partial motion to dismiss the complaint. In response, on July 17, 2015, plaintiff filed an amended complaint which added additional named plaintiffs and sought to correct deficiencies in the original complaint, Klug v. Watts Regulator Co., United States District Court for the District of Nebraska. The complaint seeks among other items, damages in an unspecified amount, injunctive relief, declaratory relief, and attorneys’ fees and costs. On July 31, 2015, the Company filed a partial motion to dismiss the complaint which was granted in part and denied in part on December 29, 2015. The Company answered the amended complaint on February 2, 2016. No formal discovery has yet been conducted.
The Company participated in mediation sessions of the Ponzo and Klug cases in December 2015 and January
2016. On February 16, 2016, the Company reached an agreement in principle to settle all claims. The proposed total settlement amount is $14 million, of which the Company is expected to pay approximately $4.1 million after insurance proceeds, of up to $9.9 million. The parties executed final written settlement agreements in April 2016. Motions for preliminary approval of the settlements were submitted on May 4, 2016 before the District of Nebraska Federal Court. On December 7, 2016, the Court issued an order preliminarily approving the settlements. The settlements are subject to final court approval after a fairness hearing set for April 12, 2017. Accordingly, there can be no assurance that the proposed settlements will be approved in their current form. If the settlements are not approved, the Company intends to continue to vigorously contest the allegations in these cases.
During the fourth quarter of 2015, the Company recorded a liability of $14 million related to the Ponzo and
Klug matters of which $7.8 million was included in current liabilities and $6.2 million in other noncurrent liabilities. In addition, a $9.5 million receivable was recorded in current assets related to insurance proceeds due, based on costs incurred as of December 31, 2015, and subject to completion of a separate final written settlement agreement if the class action settlement is approved. The Company recorded a pre-tax charge of $3.5 million in the fourth quarter of 2015 related to the settlement after adjusting the existing product liability accrual.
Product Liability
The Company is subject to a variety of potential liabilities in connection with product liability cases. The Company maintains a high self-insured retention limit within our product liability and general liability coverage, which the Company believes to be generally in accordance with industry practices. For product liability cases in the U.S., management establishes its product liability accrual, which includes legal costs associated with accrued claims, by utilizing third-party actuarial valuations which incorporate historical trend factors and the Company’s specific claims experience derived from loss reports provided by third-party administrators. The product liability accrual is established after considering any applicable insurance coverage. Changes in the nature of product liability claims or the actual settlement amounts could affect the adequacy of the estimates and require changes to the provisions. Because the liability is an estimate, the ultimate liability may be more or less than reported.
Environmental Remediation
The Company has been named as a potentially responsible party with respect to a limited number of identified contaminated sites. The levels of contamination vary significantly from site to site as do the related levels of remediation efforts. Environmental liabilities are recorded based on the most probable cost, if known, or on the estimated minimum cost of remediation. Accruals are not discounted to their present value, unless the amount and timing of expenditures are fixed and reliably determinable. The Company accrues estimated environmental liabilities based on assumptions, which are subject to a number of factors and uncertainties. Circumstances that can affect the reliability and precision of these estimates include identification of additional sites, environmental regulations, level of clean-up required, technologies available, number and financial condition of other contributors to remediation and the time period over which

80
remediation may occur. The Company recognizes changes in estimates as new remediation requirements are defined or as new information becomes available.
Asbestos Litigation
The Company is defending approximately 332 lawsuits in different jurisdictions, alleging injury or death as a result of exposure to asbestos. The complaints in these cases typically name a large number of defendants and do not identify any particular Company products as a source of asbestos exposure. To date, discovery has failed to yield evidence of substantial exposure to any Company products and no judgments have been entered against the Company.
Other Litigation
Other lawsuits and proceedings or claims, arising from the ordinary course of operations, are also pending or threatened against the Company.
(15) Financial Instruments Fair Value
The carrying amounts of cash and cash equivalents, trade receivables and trade payables approximate fair value because of the short maturity of these financial instruments.
The fair value of the Company’s 5.05% senior notes due 2020 is based on quoted market prices of similar notes
(level 2). The fair value of the Company’s borrowings outstanding under the Credit Agreement and the Company’s variable rate debt approximates its carrying value. The carrying amount and the estimated fair market value of the Company’s long-term debt, including the current portion, are as follows:
December 31, 2016 2015 (in millions)
Carrying amount $ 653.6 $ 577.3 Estimated fair value $ 658.3 $ 586.1
Financial Instruments The Company measures certain financial assets and liabilities at fair value on a recurring basis, including deferred compensation plan assets and related liabilities, redeemable financial instruments, and derivatives. The fair values of these certain financial assets and liabilities were determined using the following inputs at December 31, 2016 and December 31, 2015:
Fair Value Measurements at December 31, 2016 Using: Quoted Prices in Active Significant Other Significant Markets for Identical Observable Unobservable Assets Inputs Inputs Total (Level 1) (Level 2) (Level 3) (in millions)
Assets Plan asset for deferred compensation(1) $ 3.0 $ 3.0 $ — $ — Interest rate swaps (1) $ 4.6 $ — $ 4.6 $ — Total assets $ 7.6 $ 3.0 $ 4.6 $ — Liabilities Plan liability for deferred compensation(2) $ 3.0 $ 3.0 $ — $ — Redeemable financial instrument(3) $ 5.8 $ — $ — $ 5.8 Total liabilities $ 8.8 $ 3.0 $ — $ 5.8

81
Fair Value Measurements at December 31, 2015 Using: Quoted Prices in Active Significant Other Significant Markets for Identical Observable Unobservable Assets Inputs Inputs Total (Level 1) (Level 2) (Level 3) (in millions)
Assets Plan asset for deferred compensation(1) $ 3.3 $ 3.3 $ — $ — Total assets $ 3.3 $ 3.3 $ — $ — Liabilities Plan liability for deferred compensation(2) $ 3.3 $ 3.3 $ — $ — Redeemable financial instrument(3) 5.7 — — 5.7 Total liabilities $ 9.0 $ 3.3 $ — $ 5.7
(1) Included on the Company’s consolidated balance sheet in other assets (other, net). (2) Included on the Company’s consolidated balance sheet in accrued compensation and benefits. (3) Included on the Company’s consolidated balance sheet in other noncurrent liabilities as of December 31, 2016 and
December 31, 2015 and relates to a mandatorily redeemable equity instrument as part of the Apex acquisition in 2015.
The table below provides a summary of the changes in fair value of all financial assets and liabilities measured at fair value on a recurring basis using significant unobservable inputs (Level 3) for the period December 31, 2015 to December 31, 2016.
Total realized and unrealized Balance (gains) losses included in: Balance December 31, Net earnings Comprehensive December 31, 2015 Settlements Purchases adjustments income 2016 (in millions)
Redeemable financial instrument $ 5.7 (0.8) $ 0.8 — $ 0.1 $ 5.8
In connection with the acquisition of AERCO Korea in the first quarter of 2016, a liability of $0.8 million was recognized as the estimate of the acquisition date fair value of the mandatorily redeemable equity instrument. This liability was classified as Level 3 under the fair value hierarchy as it is based on the commitment to purchase the remaining 10% of AERCO Korea shares by December 31, 2017, which is not observable in the market. On December 30, 2016, the Company purchased the remaining 10% of AERCO Korea shares, settling this redeemable financial instrument.
In connection with the acquisition of Apex, a liability of $5.5 million was recognized on November 30, 2015 as the estimate of the acquisition date fair value of the mandatorily redeemable equity instrument. This liability is classified as Level 3 under the fair value hierarchy as it is based on the commitment to purchase the remaining 20% of Apex shares within the next three years, which is not observable in the market. Cash equivalents consist of instruments with remaining maturities of three months or less at the date of purchase and consist primarily of certificates of deposit and money market funds, for which the carrying amount is a reasonable estimate of fair value.
The Company uses financial instruments from time to time to enhance its ability to manage risk, including
foreign currency and commodity pricing exposures, which exist as part of its ongoing business operations. The use of derivatives exposes the Company to counterparty credit risk for nonperformance and to market risk related to changes in currency exchange rates and commodity prices. The Company manages its exposure to counterparty credit risk through diversification of counterparties. The Company’s counterparties in derivative transactions are substantial commercial banks with significant experience using such derivative instruments. The impact of market risk on the fair value and cash

82
flows of the Company’s derivative instruments is monitored and the Company restricts the use of derivative financial instruments to hedging activities. The Company does not enter into contracts for trading purposes nor does the Company enter into any contracts for speculative purposes. The use of derivative instruments is approved by senior management under written guidelines.
Interest Rate Swaps
On February 12, 2016, the Company entered into a new Credit Agreement (the “Credit Agreement”) pursuant to which it received a funding commitment under a Term Loan of $300 million, of which the entire $300 million has been drawn on, and a Revolving Commitment (“Revolver”) of $500 million, of which $162 million has been drawn as of December 31, 2016. Both facilities mature on February 12, 2021. For each facility, the Company can choose either an Adjusted LIBOR or Alternative Base Rate (“ABR”). Upon intended election of Adjusted LIBOR as the interest rate, the Term Loan has quarterly interest payments that began on May 12, 2016, quarterly principal repayments commencing on March 31, 2017, with a balloon payment of principal on maturity date. The Revolver has quarterly interest payments that began on July 27, 2016.
Accordingly, the Company’s earnings and cash flows are exposed to interest rate risk from changes in Adjusted LIBOR. In order to manage the Company’s exposure to changes in cash flows attributable to fluctuations in LIBOR-indexed interest payments related to the Company’s floating rate debt, the Company entered into two interest rate swaps. For each interest rate swap, the Company receives the three-month USD-LIBOR subject to a 0% floor, and pays a fixed rate of 1.31375% on a notional amount of $225.0 million. The swaps mature on February 12, 2021. The Company formally documents the hedge relationships at hedge inception to ensure that its interest rate swaps qualify for hedge accounting. On a quarterly basis, the Company assesses whether the interest rate swaps are highly effective in offsetting changes in the cash flow of the hedged item. The Company does not hold or issue interest rate swaps for trading purposes. The swaps are designated as cash flow hedges. For the year ended December 31, 2016, a gain of $2.9 million was recorded in Accumulated Other Comprehensive Income to recognize the change in the fair value of interest rate swaps that qualify as a cash flow hedge. The Company did not enter into any interest rate swaps during 2015.
Non-Designated Cash Flow Hedge
The Company has exposure to a number of foreign currency rates, including the Canadian dollar, the euro, the Chinese yuan and the British Pound Sterling. To manage this risk, the Company generally uses a layering methodology whereby at the end of any quarter, the Company has generally entered into forward exchange contracts which hedge approximately 50% of the projected intercompany purchase transactions for the next twelve months. These forward exchange contracts are not designated as cash flow or fair value hedges. The Company entered into two forward exchange contracts to manage the foreign currency rate exposure in 2016. The first forward contract was entered into to manage the foreign currency rate exposure between the Canadian dollar and the euro regarding an intercompany loan. This hedge was terminated in November 2016 when the intercompany loan was settled. The second forward contract was entered into to manage the foreign currency rate exposure between the Hong Kong Dollar and the euro regarding an intercompany loan. These forward contracts are marked-to-market with changes in the fair value recorded to earnings. The Company recognized a gain on this forward contract in 2016 of $0.3 million. The Company did not have any forward contracts in 2015.

83
Leases
The Company leases certain manufacturing facilities, sales offices, warehouses, and equipment. Generally, the leases carry renewal provisions and require the Company to pay maintenance costs. Future minimum lease payments under capital leases and non-cancelable operating leases as of December 31, 2016 are as follows:
Capital Leases Operating Leases (in millions)
2017 $ 1.1 $ 7.8 2018 1.0 6.1 2019 1.0 4.5 2020 1.0 2.9 2021 0.2 1.5 Thereafter — 3.8
Total $ 4.3 $ 26.6 Less amount representing interest (at rates ranging from 4.3% to
7.0%) 0.3 Present value of net minimum capital lease payments 4.0 Less current installments of obligations under capital leases 1.0
Obligations under capital leases, excluding current installments $ 3.0
Carrying amounts of assets under capital lease include:
December 31, 2016 2015 (in millions)
Buildings $ 13.4 $ 13.8 Machinery and equipment 1.5 1.7 14.9 15.5 Less accumulated depreciation (5.4) (5.1) $ 9.5 $ 10.4
(16) Segment Information
The Company operates in three geographic segments: Americas, EMEA, and Asia-Pacific. Each of these segments sells similar products and has separate financial results that are reviewed by the Company’s chief operating decision-maker. All intercompany sales transactions have been eliminated. Sales by region are based upon location of the entity recording the sale. The accounting policies for each segment are the same as those described in the summary of significant accounting policies (see Note 2).

84
The following is a summary of the Company’s significant accounts and balances by segment, reconciled to its consolidated totals:
* Corporate expenses are primarily for administrative compensation expense, compliance costs, professional fees,
including corporate-related legal and audit expenses, shareholder services and benefit administration costs. Included in Corporate’s operating loss for 2015 is a $59.7 million charge related to the Company’s settlement of its Pension Plan and SERP benefit obligations. Refer to Note 13 Defined Benefit Plans for further discussion.
The following includes U.S. net sales and U.S. property, plant and equipment of the Company’s Americas segment:
December 31, 2016 2015 2014 (in millions)
U.S. net sales $ 839.2 $ 909.2 $ 849.0 U.S. property, plant and equipment, net (at end of year) $ 102.5 $ 85.2 $ 86.0
Year Ended December 31, 2016 2015 2014 (in millions)
Net Sales Americas $ 900.9 $ 978.5 $ 926.8 EMEA 442.3 445.5 546.4 Asia-Pacific 55.2 43.7 40.5
Consolidated net sales $ 1,398.4 $ 1,467.7 $ 1,513.7 Operating income (loss)
Americas $ 127.1 $ 109.9 $ 110.3 EMEA 40.8 (98.6) 37.5 Asia-Pacific 14.3 (0.5) (6.5)
Subtotal reportable segments 182.2 10.8 141.3 Corporate(*) (37.2) (100.9) (35.9)
Consolidated operating income (loss) 145.0 (90.1) 105.4 Interest income (1.0) (1.0) (0.7) Interest expense 22.6 24.3 19.9 Other (income) expense, net (4.4) (2.4) 3.1
Income (loss) before income taxes $ 127.8 $ (111.0) $ 83.1 Identifiable assets (at end of period)
Americas $ 1,093.7 $ 970.7 $ 1,014.8 EMEA 582.0 607.7 787.5 Asia-Pacific 124.6 112.4 145.7
Consolidated identifiable assets $ 1,800.3 $ 1,690.8 $ 1,948.0 Property, plant and equipment, net (at end of period)
Americas $ 106.2 $ 88.6 $ 90.1 EMEA 75.9 82.3 100.1 Asia-Pacific 7.6 13.5 13.1
Consolidated long-lived assets $ 189.7 $ 184.4 $ 203.3 Capital Expenditures
Americas $ 25.7 $ 19.0 $ 10.9 EMEA 9.2 7.5 11.6 Asia-Pacific 1.1 1.2 1.2
Consolidated capital expenditures $ 36.0 $ 27.7 $ 23.7 Depreciation and Amortization
Americas $ 28.8 $ 29.0 $ 20.1 EMEA 19.4 21.1 25.8 Asia-Pacific 3.0 2.3 2.2
Consolidated depreciation and amortization $ 51.2 $ 52.4 $ 48.1

85
The following includes intersegment sales for Americas, EMEA and Asia-Pacific:
December 31, 2016 2015 2014 (in millions)
Intersegment Sales Americas $ 12.0 $ 8.2 $ 6.3 EMEA 11.8 9.8 13.3 Asia-Pacific 77.9 110.9 155.3
Intersegment sales $ 101.7 $ 128.9 $ 174.9
The Company sells its products into various end markets around the world and groups net sales to third parties into four product categories. Net sales to third parties for the four product categories are as follows:
Year Ended December 31, 2016 2015 2014 (in millions)
Net Sales Residential & commercial flow control $ 779.2 $ 831.1 $ 930.3 HVAC & gas 408.1 425.1 356.2 Drains & water re-use 132.3 131.0 144.0 Water quality 78.8 80.5 83.2
Consolidated net sales $ 1,398.4 $ 1,467.7 $ 1,513.7
(17) Accumulated Other Comprehensive Loss
Accumulated other comprehensive loss consists of the following:
Accumulated Foreign Other Currency Pension Interest rate Comprehensive Translation Adjustments swaps Loss (in millions)
Balance December 31, 2015 $ (128.2) $ — $ — $ (128.2) Change in period 24.4 — (0.2) 24.2 Balance April 3, 2016 $ (103.8) $ — $ (0.2) $ (104.0) Change in period (19.1) — (1.7) (20.8) Balance July 3, 2016 $ (122.9) $ — $ (1.9) $ (124.8) Change in period 3.3 — 1.3 4.6 Balance October 2, 2016 $ (119.6) $ — $ (0.6) $ (120.2) Change in period (34.1) — 3.5 (30.6) Balance December 31, 2016 $ (153.7) $ — $ 2.9 $ (150.8) Balance December 31,2014 $ (53.0) $ (36.1)$ — $ (89.1) Change in period (65.1) 0.2 — (64.9) Balance March 29, 2015 $ (118.1) $ (35.9)$ — $ (154.0) Change in period 18.4 0.2 — 18.6 Balance June 28, 2015 $ (99.7) $ (35.7)$ — $ (135.4) Change in period (5.8) 35.7 — 29.9 Balance September 27, 2015 $ (105.5) $ — $ — $ (105.5) Change in period (22.7) — — (22.7) Balance December 31, 2015 $ (128.2) $ — $ — $ (128.2)

86
(18) Quarterly Financial Information (unaudited)
First Second Third Fourth Quarter Quarter Quarter Quarter (in millions, except per share information)
Year ended December 31, 2016 Net sales $ 344.2 $ 371.1 $ 341.1 $ 342.0 Gross profit 135.2 150.7 142.0 137.7 Net income 16.2 28.6 21.9 17.5 Per common share: Basic
Net income(1) 0.47 0.83 0.63 0.51 Diluted
Net income(1) 0.47 0.83 0.63 0.51 Dividends declared per common share 0.17 0.18 0.18 0.18 Year ended December 31, 2015 Net sales $ 356.2 $ 386.9 $ 366.3 $ 358.3 Gross profit 130.5 145.8 142.2 134.6 Net income (loss) 11.6 19.3 (25.7) (118.2) Per common share: Basic
Net income (loss) 0.33 0.55 (0.73) (3.41) Diluted
Net income (loss) 0.33 0.55 (0.73) (3.41) Dividends declared per common share 0.15 0.17 0.17 0.17
(1) Four quarters may not sum to full year due to rounding.
(19) Subsequent Events
On February 8, 2017, the Company declared a quarterly dividend of eighteen cents ($0.18) per share on each outstanding share of Class A common stock and Class B common stock payable on March 16, 2017 to stockholders of record on March 2, 2017.

87
Watts Water Technologies, Inc. and Subsidiaries Schedule II—Valuation and Qualifying Accounts
(Amounts in millions)
Balance At Additions Additions Balance At Beginning of Charged To Charged To End of Period Expense Other Accounts Deductions Period
Year Ended December 31, 2014 Allowance for doubtful accounts $ 9.7 1.8 0.6 (1.5) $ 10.6 Reserve for excess and obsolete inventories $ 27.9 7.0 1.6 (7.2) $ 29.3 Year Ended December 31, 2015 Allowance for doubtful accounts $ 10.6 2.8 — (3.3) $ 10.1 Reserve for excess and obsolete inventories $ 29.3 11.8 — (12.0) $ 29.1 Year Ended December 31, 2016 Allowance for doubtful accounts $ 10.1 $ 5.5 0.5 (1.9) $ 14.2 Reserve for excess and obsolete inventories $ 29.1 $ 7.0 0.6 (10.6) $ 26.1

88
EXHIBIT INDEX
Exhibit No. Description 3.1 Restated Certificate of Incorporation, as amended(14) 3.2 Amended and Restated By-Laws(1) 9.1 The Amended and Restated George B. Horne Voting Trust Agreement—1997 dated as of September 14,
1999(15) 10.1* Supplemental Compensation Agreement effective as of September 1, 1996 between the Registrant and
Timothy P. Horne(9), Amendment No. 1 dated July 25, 2000(16), Amendment No. 2 dated October 23, 2002(3), and Amendment No. 3 dated August 18, 2015(7)
10.2 Amended and Restated Stock Restriction Agreement dated October 30, 1991(2), and Amendment dated August 26, 1997(12)
10.3 Registration Rights Agreement dated July 25, 1986(5) 10.4*† Form of Indemnification Agreement between the Registrant and certain directors and officers of the
Registrant 10.5* Watts Water Technologies, Inc. Executive Incentive Bonus Plan(11) 10.6* Non-Employee Director Compensation Arrangements(24) 10.7* Watts Water Technologies, Inc. Management Stock Purchase Plan Amended and Restated as of
October 27, 2015(6) 10.8* Watts Water Technologies, Inc. Second Amended and Restated 2004 Stock Incentive Plan(8) 10.9* Form of Non-Qualified Stock Option Agreement under the Watts Water Technologies, Inc. Second
Amended and Restated 2004 Stock Incentive Plan(10) 10.10* Form of Restricted Stock Award Agreement for Employees under the Watts Water Technologies, Inc.
Second Amended and Restated 2004 Stock Incentive Plan(20) 10.11* Form of Restricted Stock Agreement between Watts Water Technologies, Inc. and Robert J. Pagano,
Jr.(21) 10.12* Form of Performance Stock Unit Award Agreement between Watts Water Technologies, Inc. and
Robert J. Pagano, Jr.(21) 10.13* Form of 2014 Performance Stock Unit Award Agreement under the Watts Water Technologies, Inc.
Second Amended and Restated 2004 Stock Incentive Plan(22) 10.14* Form of 2015 Performance Stock Unit Award Agreement under the Watts Water Technologies, Inc.
Second Amended and Restated 2004 Stock Incentive Plan(20) 10.15*† Form of 2016 Performance Stock Unit Award Agreement under the Watts Water Technologies, Inc.
Second Amended and Restated 2004 Stock Incentive Plan 10.16* Form of 2014 Restricted Stock Award Agreement under the Watts Water Technologies, Inc. Second
Amended and Restated 2004 Stock Incentive Plan(23) 10.17* Form of 2014 Non-Qualified Stock Option Agreement under the Watts Water Technologies, Inc. Second
Amended and Restated 2004 Stock Incentive Plan(23) 10.18*† Watts Water Technologies, Inc. Executive Severance Plan, as amended and restated as of February 8,
2017 10.19* Separation Agreement dated February 14, 2016 between Watts Water Technologies, Inc. and Mario
Sanchez(19) 10.20*† Separation Agreement dated August 12, 2016 between Watts Water Technologies, Inc. and Debra Ogston
10.21 Note Purchase Agreement, dated as of April 27, 2006, between the Registrant and the Purchasers named in Schedule A thereto relating to the Registrant’s $225,000,000 5.85% Senior Notes due April 30, 2016(4)
10.22 Form of 5.85% Senior Note due April 30, 2016(4) 10.23 Subsidiary Guaranty, dated as of April 27, 2006, in connection with the Registrant’s 5.85% Senior Notes
due April 30, 2016 executed by the subsidiary guarantors party thereto, including the form of Joinder to Subsidiary Guaranty(4)
10.24 Credit Agreement, dated as of February 12, 2016, among the Registrant, certain subsidiaries of the Registrant as Borrowers, JPMorgan Chase Bank N.A., as Administrative Agent, Swing Line Lender and L/C Issuer and the other lenders referred to therein(19)
10.25 Guaranty, dated as of February 12, 2016, by the Registrant and the Subsidiaries of the Registrant set forth therein, in favor of JPMorgan Chase Bank N.A. and other lenders referred to therein(19)

89
Exhibit No. Description 10.26 Note Purchase Agreement, dates as of June 18, 2010, between the Registrant and Purchasers named in
Schedule A thereto relating to the Registrants $75,000,000 5.05% Senior Notes due June 18, 2020(18) 10.27 Form of 5.05% Senior Note due June 18, 2020(18) 10.28 Form of Subsidiary Guaranty in connection with the Registrants 5.05% Senior Notes due June 18, 2020,
including the form of Joinder to Subsidiary Guaranty(18) 10.29 Facility Agreement dated as of December 16, 2016, among Watts International Holdings Limited, as
original borrower and original guarantor, Watts Water Technologies EMEA B.V., as original guarantor, JPMorgan Chase Bank, N.A., as sole bookrunner and sole lead arranger, J.P. Morgan Europe Limited, as agent to the financial parties, and the other lenders referred to therein(17)
11 Statement Regarding Computation of Earnings per Common Share(13) 21† Subsidiaries 23† Consent of KPMG LLP, Independent Registered Public Accounting Firm
31.1† Certification of Principal Executive Officer pursuant to Rule 13a-14(a) or Rule 15d-14(a) of the Securities Exchange Act of 1934, as amended
31.2† Certification of Principal Financial Officer pursuant to Rule 13a-14(a) or Rule 15d-14(a) of the Securities Exchange Act of 1934, as amended
32.1†† Certification of Principal Executive Officer pursuant to 18 U.S.C. Section 1350 32.2†† Certification of Principal Financial Officer Pursuant to 18 U.S.C. Section 1350
101.INS† XBRL Instance Document. 101.SCH† XBRL Taxonomy Extension Schema Document. 101.CAL† XBRL Taxonomy Extension Calculation Linkbase Document. 101.DEF† XBRL Taxonomy Extension Definition Linkbase Document 101.LAB† XBRL Taxonomy Extension Label Linkbase Document. 101.PRE† XBRL Taxonomy Extension Presentation Linkbase Document.
(1) Incorporated by reference to the Registrant’s Current Report on Form 8-K dated July 27, 2015 (File
No. 001-11499). (2) Incorporated by reference to the Registrant’s Current Report on Form 8-K dated November 14, 1991 (File
No. 001-11499). (3) Incorporated by reference to the Registrant’s Annual Report on Form 10-K for the year ended December 31,
2002 (File No. 001- 11499). (4) Incorporated by reference to the Registrant’s Current Report on Form 8-K dated April 27, 2006 (File
No. 001-11499). (5) Incorporated by reference to the Registrant’s Form S-1 (No. 33-6515) as part of the Second Amendment to such
Form S-1 dated August 21, 1986. (6) Incorporated by reference to the Registrant’s Current Report on Form 8-K dated October 26, 2015 (File
No. 001- 11499). (7) Incorporated by reference to the Registrant’s Current Report on Form 8-K dated August 18, 2015 (File
No. 001- 11499). (8) Incorporated by reference to the Registrant’s Current Report on Form 8-K dated May 15, 2013 (File
No. 001-11499). (9) Incorporated by reference to the Registrant’s Annual Report on Form 10-K for year ended June 30, 1996 (File
No. 001-11499). (10) Incorporated by reference to the Registrant’s Quarterly Report on Form 10-Q for the quarter ended June 30,
2013 (File No. 001- 11499).

90
(11) Incorporated by reference to the Registrant’s Annual Report on Form 10-K for year ended December 31, 2015 (File No. 001-11499).
(12) Incorporated by reference to the Registrant’s Annual Report on Form 10-K for year ended June 30, 1997 (File
No. 001-11499). (13) Incorporated by reference to notes to Consolidated Financial Statements, Note 2 of this Report. (14) Incorporated by reference to the Registrant’s Quarterly Report on Form 10-Q for the quarter ended July 3, 2005
(File No. 001- 11499). (15) Incorporated by reference to the Registrant’s Annual Report on Form 10-K for year ended June 30, 1999 (File
No. 001-11499). (16) Incorporated by reference to the Registrant’s Quarterly Report on Form 10-Q for quarter ended September 30,
2000 (File No. 001- 11499). (17) Incorporated by reference to the Registrant’s Current Report on Form 8-K dated December 16, 2016 (File
No. 001-11499). (18) Incorporated by reference to the Registrant’s Current Report on Form 8-K dated June 18, 2010 (File
No. 001-11499). (19) Incorporated by reference to the Registrant’s Current Report on Form 8-K dated February 9, 2016 (File
No. 001-11499). (20) Incorporated by reference to the Registrant’s Quarterly Report on Form 10-Q for the quarter ended
September 27, 2015 (File No. 001-11499). (21) Incorporated by reference to the Registrant’s Current Report on Form 8-K dated May 4, 2014 (File
No. 001-11499). (22) Incorporated by reference to the Registrant’s Quarterly Report on Form 10-Q for quarter ended March 30, 2014
(File No. 001- 11499). (23) Incorporated by reference to the Registrant’s Quarterly Report on Form 10-Q for quarter ended June 29, 2014
(File No. 001- 11499). (24) Incorporated by reference to the Registrant’s Annual Report on Form 10-K for the year ended December 31,
2014 (File No. 001- 11499).
* Management contract or compensatory plan or arrangement. † Filed herewith. †† Furnished herewith. Attached as Exhibit 101 to this report are the following formatted in XBRL (Extensible Business Reporting Language): (i) Consolidated Statements of Operations for the Years Ended December 31, 2016, 2015 and 2014, (ii) Consolidated Statements of Comprehensive (Loss) Income for the Years Ended December 31, 2016, 2015 and 2014, (iii) Consolidated Balance Sheets at December 31, 2016 and December 31, 2015, (iv) Consolidated Statements of Stockholders’ Equity for the Years Ended December 31, 2016, 2015 and 2014, (v) Consolidated Statements of Cash Flows for the Years Ended December 31, 2016, 2015 and 2014, and (vi) Notes to Consolidated Financial Statements.

This Annual Report contains “forward-looking” statements within the meaning of the Private Securities Litigation Reform Act of 1995. All statements that relate to prospective events or developments are forward-looking statements. Also, words such as “intend,” “believe,” “anticipate,” “plan," “expect,” and similar expressions identify forward-looking state-ments. We cannot assure investors that our assumptions and expectations will prove to have been correct. There are a number of important factors that could cause our actual results to differ materially from those indicated or implied by forward-looking statements. These factors include, but are not limited to, those set forth in the section titled “Risk Factors” in our Annual Report on Form 10-K for the year ended December 31, 2016, included in this Annual Report. Ex-cept as required by law, we undertake no intention or obligation to update or revise any forward-looking statements, whether as a result of new information, future events, or otherwise.
For more information on Watts Water Technologies, visit our investor website by scanning the QR code below or visiting WattsWater.com/Investors.
GlobalManagement Team
Robert J. Pagano, Jr.Chief Executive Officer and President
Jennifer L. CongdonChief Human Resources Officer
James F. DagleyPresident,Heating & Hot Water Solutions
Kenneth R. LepageGeneral Counsel,Executive Vice President and Secretary
Elie A. MelhemPresident,Asia-Pacific, the Middle East, and Africa
Munish NandaPresident,Americas and Europe
Ram RamakrishnanExecutive Vice President,Strategy and Business Development
Todd A. TrappChief FInancial Officer
Directors
Robert L. AyersDirector
Bernard BaertDirector
Richard J. CathcartDirector
Christopher L. ConwayDirector
David A. DunbarDirector
Jes Munk HansenDirector
W. Craig KisselChairman of the Board and Director
Joseph T. NoonanDirector
Robert J. Pagano, Jr.Director
Merilee RainesDirector
Joseph W. ReitmeierDirector
Corporate Information
Executive Offices815 Chestnut StreetNorth Andover, MA 01845-6098Tel: (978) 688-1811Fax: (978) 688-2976
Registrar and Transfer AgentWells Fargo Shareowner ServicesP.O. Box 64854St. Paul, MN 55164-0854Tel: (800) 468-9716
AuditorsKPMG LLPTwo FInancial Center60 South StreetBoston, MA 02111
Stock ListingNew York Stock ExchangeTicker Symbol: WTS
The Board of DirectorsLeft to right: Jes Munk Hansen, Joseph T. Noonan, Christopher L. Conway, Merilee Raines, Robert L. Ayers, W. Craig Kissel, David A. Dunbar, Robert J. Pagano, Jr., Richard J. Cathcart, and Joseph W. Reitmeier. (Not pictured: Bernard Baert)
3/20/17 11:06 AM

Annual Report 1716© Watts Water Technologies, Inc. 2017WattsWater.com
Printed on Recycled Paper
2016W
atts Water Technologies, Inc. A
nnual Rep
ort W
atts Water Technologies, Inc. A
nnual Rep
ort
707069cov.indd 1