2016 annual report citibank nigeria limited · 2018-02-05 · balance of payment problems, weak...
TRANSCRIPT

2016 ANNUAL REPORT Citibank Nigeria Limited

Citi’s Value Proposition: A Mission of Enabling Growth and Progress
What You Can Expect from Us and What We Expect from Ourselves
Citi’s mission is to serve as a trusted partner to its clients by responsibly providing financial services that enable growth and economic progress. Our core activities are safeguarding assets, lending money, making payments and accessing the capital markets on behalf of our clients. We have 200 years of experience in helping our clients meet the world’s toughest challenges and embrace its greatest opportunities. We are Citi, the global bank — an institution connecting millions of people across hundreds of countries and cities.
We protect people’s savings and help them make the purchases — from everyday transactions to buying a home — that improve the quality of their lives. We advise people on how to invest for future needs, such as their children’s education and their own retirement, and help them buy securities, such as stocks and bonds.
We work with companies to optimise their daily operations, whether they need working capital to make payroll or export their goods overseas. By lending to companies large and small, we help them grow, creating jobs and real economic value at home and in communities around the world. We provide financing and support to governments at all levels so they can build sustainable infrastructure, such as housing, transportation, schools and other vital public works.
These capabilities create an obligation to act responsibly, do everything possible to create the best outcomes and prudently manage risk. If we fall short, we will take decisive action and learn from our experience.
We strive to earn and maintain the public’s trust by constantly adhering to the highest ethical standards. We ask our colleagues to ensure that their decisions pass three tests: they are in our clients’ interests, create economic value and are always systemically responsible. When we do these things well, we make a positive financial and social impact in the communities we serve and show what a global bank can do.
2016 ANNUAL REPORT 1
CEO REMARKS
The Nigerian economy continued to face headwinds in 2016 and the banking sector was not immune to the fallout. The
scarcity of foreign exchange, rising cost of doing business, declining consumer purchasing power and lingering security
issues generally led to tighter margins for our clients. Despite these challenges, Citibank Nigeria Limited remained committed
to its role as a financial facilitator for our customers by providing increased support for their operations to enable growth and
progress. We were able to achieve this through continued innovation and a commitment to service,leveraging on the strength
of our global expertise and product suite as key differentiators in the domestic market.
Looking forward, we expect the macroeconomic environment to improve in the medium term as the Nigerian economy
continues the process of adjusting to the shifting fundamental trends that increasingly govern the global markets now and in
the future. Citibank Nigeria Limited’s goal during this time will be to remain a source of stability to clients by leveraging our
global capabilities and unique network to enable clients navigate thesechanges in the operating environment.
Akinsowon Dawodu
Chief Executive Officer,
Citibank Nigeria Limited

2016 ANNUAL REPORT2
TABLE OF CONTENTS
CEO’s Remarks
Table of Content
Board of Directors
Management Committee
Annual General Meeting Notice
Chairman’s Statement
Sustainability Report
Pathways to Progress
Business Report
Corporate and Investment Banking
Risk Management
Treasury and Trade Solutions
Global Subsidiaries Group
Markets
Direct Custody and Clearing
Operations and Technology
Human Resources
Employee of the Year
Financial Report
2016 in Pictures
1
2
3
4
5
6
12
14
16
18
20
22
24
26
28
30
32
34
36
140

2016 ANNUAL REPORT 3
BOARD OF DIRECTORS
Olayemi CardosoChairman
Dr. Hilary Onyiuke Dr. Daphne Dafinone
Mr. Fatai Karim
Mr. Akin Dawodu
Mrs. Ireti Samuel-Ogbu
Mrs. Nneka Enwereji
Chief Arthur Mbanefo
Mr. Philip Cullingworth
Mr. Chinedu Ikwudinma
Mr. Michael Murray-Bruce
Mrs. Funmi Ogunlesi
Mrs. Olusola FagbureCompany Secretaryand Legal Adviser
2016 ANNUAL REPORT 3

2016 ANNUAL REPORT4
MANAGEMENT COMMITTEE
Mr. Akin Dawodu Managing Director and CEO
Mr. Chinedu Ikwudinma Executive Director, Risk Management
Mrs. Aderonke Adetoro Securities Country Manager
Mr. Gboyega Oloyede Country Human Resources Officer
Mrs. Funmi Ogunlesi Executive Director and Head of Treasury and Trade Solutions Public Sector, Africa
Mr. Segun Adaramola Head of Treasury and Trade Solutions
Mr. Sharaf Muhammed Chief Finance Officer and Head of Strategy & Sustainability
Mrs. Ngozi Omoke-Enyi Head of Operations and Technology
Ms. Chidinma Ohajunwa Head of Operational Risk Management
Mr. Fatai Karim Executive Director and Head of Treasury and Trade Solutions Client Operations SSA
Mr. Bayo Adeyemo Country Treasurer and Head of Markets
Mrs. Sola Fagbure Country Counsel and Company Secretary
Mr. Bolaji Ajao Head of Internal Audit
Mrs. Lola Oyeka Country Public Affairs Officer
Mrs. Nneka Enwereji Executive Director and Head of Global Subsidiaries Group
Mr. Mudassir Amray Head of Corporate and Investment Bank
Ms. Shola Phillips Country Compliace Officer
2016 ANNUAL REPORT4

2016 ANNUAL REPORT 5
ANNUAL GENERAL MEETING NOTICE
NOTICE IS HEREBY GIVEN THAT THE THIRTY THIRD ANNUAL GENERAL MEETING OF THE MEMBERS OF CITIBANK NIGERIA
LIMITED WILL BE HELD AT CHARLES S. SANKEY HOUSE, 27, KOFO ABAYOMI STREET, VICTORIA ISLAND, LAGOS ON
THURSDAY APRIL 27 2017 AT 1.30 P.M. FOR THE TRANSACTION OF THE FOLLOWING BUSINESS:
ORDINARY BUSINESS:
1. To receive the Report of the Directors, the Balance Sheet as at 31st December, 2016 together with the Profit and Loss
Account for the year ended on that date and the Report of the Auditors thereon.
2. To declare a dividend.
3. To re-elect Directors.
4. To authorize the Directors to fix the remuneration of the Auditors.
SPECIAL BUSINESS:
To receive the Report on the Board performance review conducted by DCSL Corporate Services Limited.
BY ORDER OF THE BOARD
OLUSOLA FAGBURE
Company Secretary
Dated this 27th day of March 2017
Charles S. Sankey House
27, Kofo Abayomi Street
Victoria Island, Lagos.
NOTE
A member of the Company entitled to attend and vote at the above meeting is entitled to appoint a proxy to attend and vote
instead of him and such proxy need not also be a member. A form of proxy is enclosed and if it is to be valid for the purposes
of the meeting, it must be completed and deposited at the registered office of the Company not less than 48 hours before the
time for holding the meeting.

2016 ANNUAL REPORT6
CHAIRMAN’S STATEMENT
Olayemi CardosoChairman
Fellow shareholders, members of the board of directors, distinguished ladies and gentlemen.
I am pleased to welcome you to the 33rd Annual General Meeting of your bank, Citibank Nigeria Limited, and present to you its financial results and key achievements during the year 2016. Despite the challenging operating environment, Citibank Nigeria Limited continued to make significant progress, creating value for customers and shareholders of the bank.
Macroeconomic Overview
World EconomyIn 2016, the global economy grew by about 2.3% driven by a combination of sustained growth in major Asian economies such as China and India, and mild growth in more advanced economies such as the United States (US) and the European Union (EU). On the other hand, developing economies in Africa and South America weighed down global growth as these economies struggled to recover from weak commodity prices due to inadequate fiscal and economic responses.
Across major economies, the slowdown in growth in 2016 was mostly due to the uncertainty brought about by political events and diverging policy responses to individual economic prospects. Politics is now set to play an increasingly relevant role in the EU and the US after the United Kingdom voted to leave the EU and the US elected a new president whose policy direction is still unfolding. As a whole, the US economy grew by about 1.6%,
The strong 2016 financial results reflect the significant dedication and efforts of stakeholders at the bank in responding to the challenging economic environment which led to a dip in performance in 2015.
2016 ANNUAL REPORT 7
compared to 2.6% in 2015, subdued by a slowdown in exports and private investments. The story was similar for the EU as slowing exports, slowing domestic demand, and general uncertainty about the economic bloc following the ‘Brexit’ vote led to a deceleration in growth to 1.6% in 2016. In Japan, the introduction of negative interest rates in January 2016 and the continuation of a now 4-year old Quantitative Easing program were not enough to lift growth as private consumption and investments remained weak. Overall, an overarching theme of soft demand for goods, services, and investments remained prominent in advanced economies during the year. Growth in emerging and developing markets was similarly subdued in 2016 due to weak trade flows occasioned by soft commodity prices and reduced global demand. The Chinese economy, in the process of changing its growth model to a consumption driven one, faced decelerating growth in 2016. This led to weak trade flows across the globe as a result of the volume of trade
that typically involves China due to its status as a manufacturing powerhouse. Meanwhile, major developing economies Brazil and Russia remained in recession as the effect of weak global crude oil prices affected both economies significantly. Generally, growth in commodity exporting emerging economies was weak in 2016, while growth in commodity importing developing economies such as Thailand and Pakistan remained resilient reflecting sustained domestic demand following accommodative macroeconomic policies.
Sub-Saharan African EconomyIn Sub-Saharan Africa, growth slowed to 1.5% in 2016 from 3.1% in 2015. This slowdown was as a result of inadequate policy responses to low commodity prices, especially oil prices, which affected a number of Sub-Saharan African countries including Angola and Nigeria. Balance of Payment problems, weak external buffers, and other idiosyncratic factors affected economies such as Mozambique and South Africa. More diversified economies such as Kenya and
Ethiopia were however able to stay resilient in 2016. In general, Sub-Saharan African growth was muted as the biggest economies struggled to make adjustments to changing macroeconomic conditions. Capital flows to Sub Saharan Africa declined in 2016 as investors, wary of low commodity prices and increasing global economic uncertainty, fled to safe-haven assets. In recent years, Sub-Saharan African countries had tapped into the international bond market, taking advantage of the global low-interest rate environment and investors’ search for yields. However, in 2016, sovereign spreads rose and yields increased, reflecting a reassessment of risk by investors in anticipation of current economic headwinds and a lift-off in the planned cycle of interest rate hikes in the United States.
Nigerian EconomyThe Nigerian economy contracted by 1.5% in 2016 following a slowdown in activities in the bellwether oil and gas and manufacturing sectors of the economy representing its first
Citibank Nigeria Limited was also recognized as the “Most Customer Focused Bank” in 2016 by KPMG’s Banking Industry Customer Satisfaction survey for the second year in a row.

2016 ANNUAL REPORT8
Chairman’s Statement
economic contraction since June 2004. which officially made the country enter into recession in 2016.
The oil sector contracted due to lower oil prices and a resurgence in Niger Delta militancy which led to lower oil output, while the contraction in the manufacturing sector was brought about by a depreciating Naira and the scarcity of foreign exchange. for imports which severely affected manufacturing companies. On the other hand, the agricultural sector remained resilient growing by 4.11% in 2016, and now makes up about 23% of Nigeria’s GDP.
Notably the contribution of the oil sector to GDP continued to decrease, dropping from 14% in 2015 to about 10% in 2016. The multiplier effects of the oil shock reverberated throughout the economy due to the government’s dependence on oil revenues, and the entire country’s dependence on hard currency from oil exports. This led to prolonged periods of foreign currency scarcity and uncertainty regarding foreign exchange
policy, which in turn contributed to a significant decline in overall economic activity levels. The IMF forecasts an economic growth rate of 0.8% for Nigeria in 2017.
As at December 2016, Nigeria’s foreign currency reserves declined by 11% to USD25 billion from USD29 billion in 2015; reserves were also 25% lower than the USD34 billion year end figure as at December 2014. In June, the CBN harmonized the official and interbank foreign exchange markets, effectively creating a single interbank market after years of selling dollars at its official RDAS auctions. With this move, the CBN effectively devalued the Naira by about 23% to c.N280/$ in a bid to stimulate the economy and attract foreign investments to Nigeria. By year end, the exchange rate had depreciated further to N305/$ (from N197/$ as at Dec. 2015) in the interbank market.
Prices increased significantly during the year, with inflation rising to 18.5% in December from 9.6% in January. Within the year, the apex bank tightened monetary policy in a bid to curb inflation and possibly
attract more foreign investment flows to the country. The monetary policy rate increased from 11.0% in January to 14.0% currently, with an asymmetric corridor of +2%/-5% around the MPR. The higher MPR led to a general increase in fixed income yields across board. The cash reserve ratio (CRR) was also increased to 22.5% from 20.0%, while the liquidity ratio was retained at 30% throughout the year.
On the regulatory front, 2016 was scheduled for a complete phaseout of commission-on-turnover (COT) to zero. However, after considering the economic situation, and in the interest of banking stability, the CBN decided to replace the COT with a Current Account Maintenance fee not to exceed N1/mille. In May, the CBN also indefinitely extended its deadline for the implementation of a higher Capital Adequacy Ratio (CAR) of 16% for the Systemically Important Banks (SIBs), again after assessing the economic climate. The liberalization of the foreign exchange market in June also ushered in a landmark Naira-settled OTC FX Futures Market in a bid to manage the volatility of FX spot
2016 ANNUAL REPORT 9
prices and introduced FX Primary Dealers to aid operations in the new FX market. Furthermore the CBN issued various circulars and directives in a bid to manage the secondary effects of the fall in oil prices. Other key regulations in 2016 included proper provisioning for increased foreign-currency loan balances and a one-off forbearance to write-off fully provided for NPLs in 2016. Citibank Nigeria Limited has since complied with all relevant directives.
Financial Performance 2016
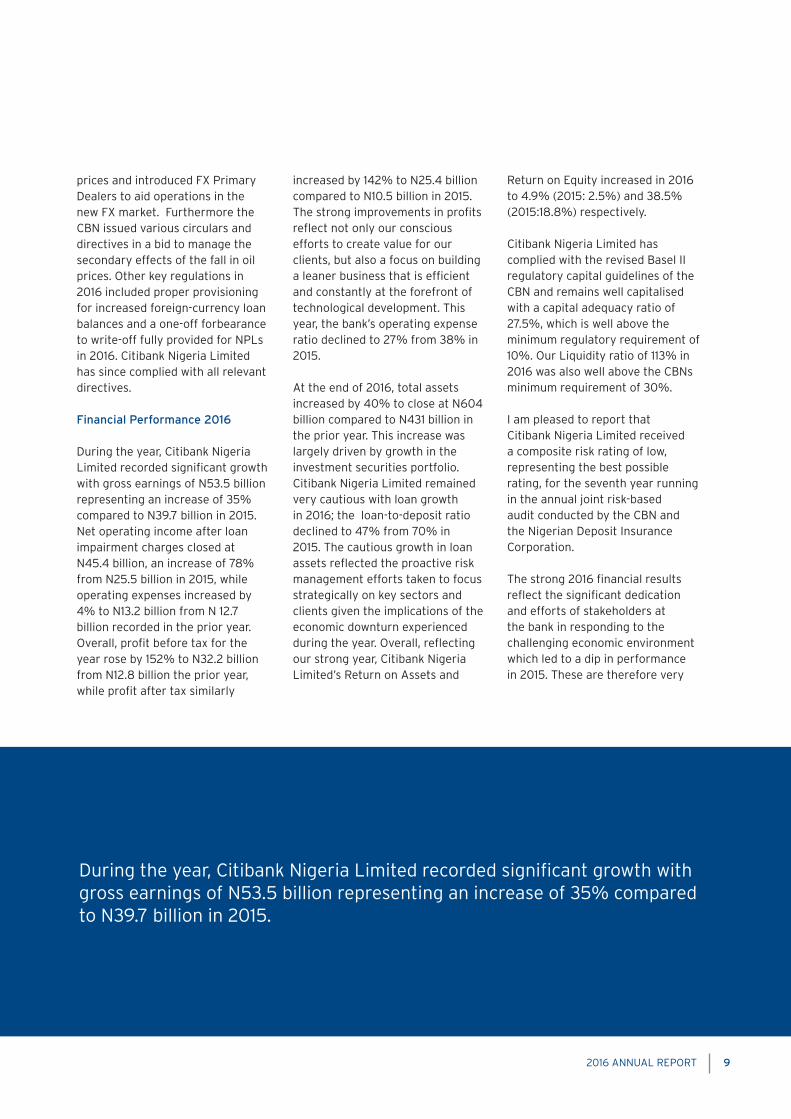
During the year, Citibank Nigeria Limited recorded significant growth with gross earnings of N53.5 billion representing an increase of 35% compared to N39.7 billion in 2015. Net operating income after loan impairment charges closed at N45.4 billion, an increase of 78% from N25.5 billion in 2015, while operating expenses increased by 4% to N13.2 billion from N 12.7 billion recorded in the prior year. Overall, profit before tax for the year rose by 152% to N32.2 billion from N12.8 billion the prior year, while profit after tax similarly
increased by 142% to N25.4 billion compared to N10.5 billion in 2015. The strong improvements in profits reflect not only our conscious efforts to create value for our clients, but also a focus on building a leaner business that is efficient and constantly at the forefront of technological development. This year, the bank’s operating expense ratio declined to 27% from 38% in 2015.
At the end of 2016, total assets increased by 40% to close at N604 billion compared to N431 billion in the prior year. This increase was largely driven by growth in the investment securities portfolio. Citibank Nigeria Limited remained very cautious with loan growth in 2016; the loan-to-deposit ratio declined to 47% from 70% in 2015. The cautious growth in loan assets reflected the proactive risk management efforts taken to focus strategically on key sectors and clients given the implications of the economic downturn experienced during the year. Overall, reflecting our strong year, Citibank Nigeria Limited’s Return on Assets and
Return on Equity increased in 2016 to 4.9% (2015: 2.5%) and 38.5% (2015:18.8%) respectively.
Citibank Nigeria Limited has complied with the revised Basel II regulatory capital guidelines of the CBN and remains well capitalised with a capital adequacy ratio of 27.5%, which is well above the minimum regulatory requirement of 10%. Our Liquidity ratio of 113% in 2016 was also well above the CBNs minimum requirement of 30%.
I am pleased to report that Citibank Nigeria Limited received a composite risk rating of low, representing the best possible rating, for the seventh year running in the annual joint risk-based audit conducted by the CBN and the Nigerian Deposit Insurance Corporation.
The strong 2016 financial results reflect the significant dedication and efforts of stakeholders at the bank in responding to the challenging economic environment which led to a dip in performance in 2015. These are therefore very
During the year, Citibank Nigeria Limited recorded significant growth with gross earnings of N53.5 billion representing an increase of 35% compared to N39.7 billion in 2015.

2016 ANNUAL REPORT10
commendable results as Citibank Nigeria Limited has come back stronger across all business segments. Overall, Citibank Nigeria Limited is well capitalized and relatively cautious in the environment, and remains well positioned to take advantage of opportunities to deepen relationships with customers and support business growth as the economy recovers in 2017 and beyond.
Notable Events and Activities
EventsIn support of quality journalism, Citibank Nigeria Limited held its annual Journalistic Excellence Awards (CJEA) with a view to recognising outstanding business reporting. The winner participated in an 8-day business and financial sector seminar in New York City administered by Columbia Graduate School of Journalism and sponsored by Citibank Nigeria Limited. The program offered participants rigorous workshops in business fundamentals and
provided exposure to institutions, policy makers and other thought leaders in the United States.
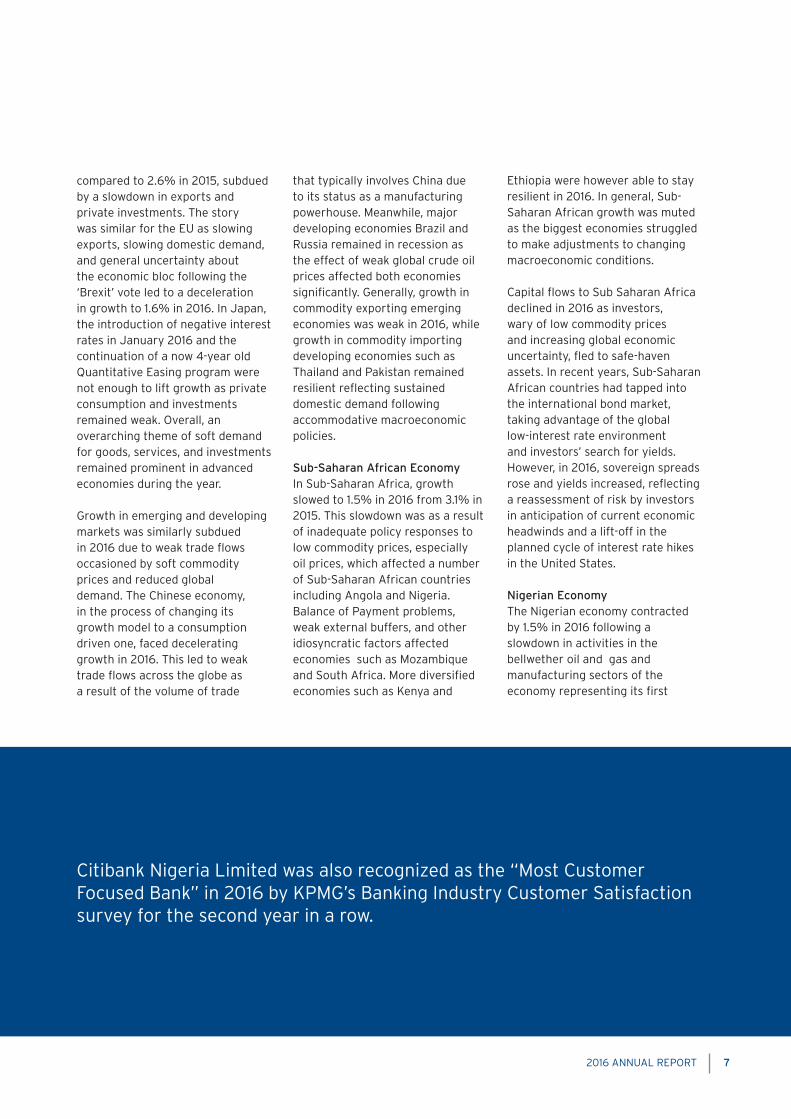
Awards and RecognitionsGlobal Finance Markets magazine named Citibank Nigeria Limited the “Best Institutional Digital Bank” in 2016 and, for the 9th consecutive year, the “Best Domestic Cash Management Bank”. Citibank Nigeria Limited was also recognized as the “Most Customer Focused Bank” in 2016 by KPMG’s Banking Industry Customer Satisfaction survey for the second year in a row. The bank also won a number of regional awards including “Best Corporate Bank West Africa” by Banker Africa, and “Best Treasury Solutions in Africa” – Adam Smith Award, getting recognition for its E-Bills Pay solution.
Corporate CitizenshipCiti celebrated its 11th annual Global Community Day, in June 2016 with more than 85,000 Citi volunteers, in 487 cities, spanning 93 countries and territories, engaged in activities of benefit to local communities. In Nigeria, over 2,500 Citibank
Nigeria volunteers came together to educate, empower and engage youths in Lagos, Abuja, Port-Harcourt, Kano and Warri. A total of 6 events took place across the nation.
In Lagos, Citibank Nigeria Limited unveiled an upgraded library at the Government Senior College Victoria Island. The upgrade of the library is part of Project 350, a public private partnership with Lagos State targeted at increasing access to knowledge for Lagosians. I am pleased to announce that Citibank Nigeria Limited was the first private sector partner to unveil its library, eventually donating computers, furniture, a solar-panel, and an inverter to the library. This collaboration showcases Citi’s philanthropic culture, reinforces Citibank Nigeria Limited’s position as an integral member of the community, and highlights the bank’s commitment to youth.
In 2016, Citibank Nigeria Limited supported over 25 charities nationwide. Our focus is to continue to promote economic progress
Chairman’s Statement
19
8In the U.S., Citi launches mobile app combining banking, wealth management and money movement
Citi wins Client Clearing Firm of the Year award
9Clients rank Citi top 2016 Asia Pacific Fixed Income Bank, according to Greenwich Associates
15Citi announces industry-leading partnership with PayPal
16International Financing Review magazine names Citi Bank of the Year
Deborah C. Wright elected to Citi’s board of directors
21Citi Retail Services signs long-term credit card agreement with The Toro Company
DECEMBER
Citi Volunteers Give Back on Global Community Day
In 2016, Citi celebrated its 11th annual Global Community Day. Citi employees, friends and families participated in volunteer projects ranging from revitalizing parks to providing youth with financial education, mentorship and literacy training, and serving and collecting food.
“Volunteerism is a key part of giving back to the communities we serve around the globe,” said Citi CEO Michael Corbat. “My colleagues and I share the view that our success as a company is inextricably linked to the positive outcomes and progress we can help enable for others.”
“The breadth of background, experience, thought, opinion and perspective supports our commitment to advancing diversity as a proven catalyst of economic growth and progress. The richness of our teams helps us to recognize diversity as an integral part of how — and why — we do what we do every day.”
— CEO Michael Corbat
• Citi hires women-owned firms to lead distribution of $1.5 billion bond issuance
• Citi celebrates International Women’s Day
• Citi earns perfect score on LGBT workplace equality scorecard
• Citi offers enhanced parenting leave policies in the U.S.
• Citi named one of Working Mother magazine’s Best Companies in 2016
• YWCA inducts four senior Citi women into Academy of Women Leaders
• City Veterans Network dinner raises £200,000 for military charities across the U.K.
• Citi Colombia recognized as one of the best companies in gender equality
• Citi leaders Jim Cowles and Bob Annibale named by OUTstanding/FT for their demonstration of Citi’s commitment to the LGBT community
CITI’S COMMITMENT TO DIVERSITY
citizenship.citigroup.com
85,000+ VOLUNTEERS GAVE 425,000+HOURS AT 1,400+ EVENTS IN 91 COUNTRIES & 500+ CITIES TO ENABLE GROWTH & PROGRESS
2016 Highlights
Dedicated in 155 cities toward environmental sustainability, including the revitalization of parks
99,900+ HOURS
Served and 82 tons of food collected and donated, supporting healthy living solutions
42,600+ MEALS
151,000+ YOUTHAcross 600+ events in 340+ cities provided with access to support services, including financial education, mentorship and literacy training
Focused on improving housing solutions for families across 53 cities 90+ EVENTS
7,800+ VOLUNTEERSDedicated 37,000+ hours toward skill-based activities, including building the capacity of community organizations through the Citi Skills Marathon model
2016 ANNUAL REPORT 11
and improve the lives of people in Nigeria and around the world. Consequently, we invest in efforts that increase financial inclusion, catalyze job opportunities for the youth, and re-imagine approaches to building economically vibrant cities.
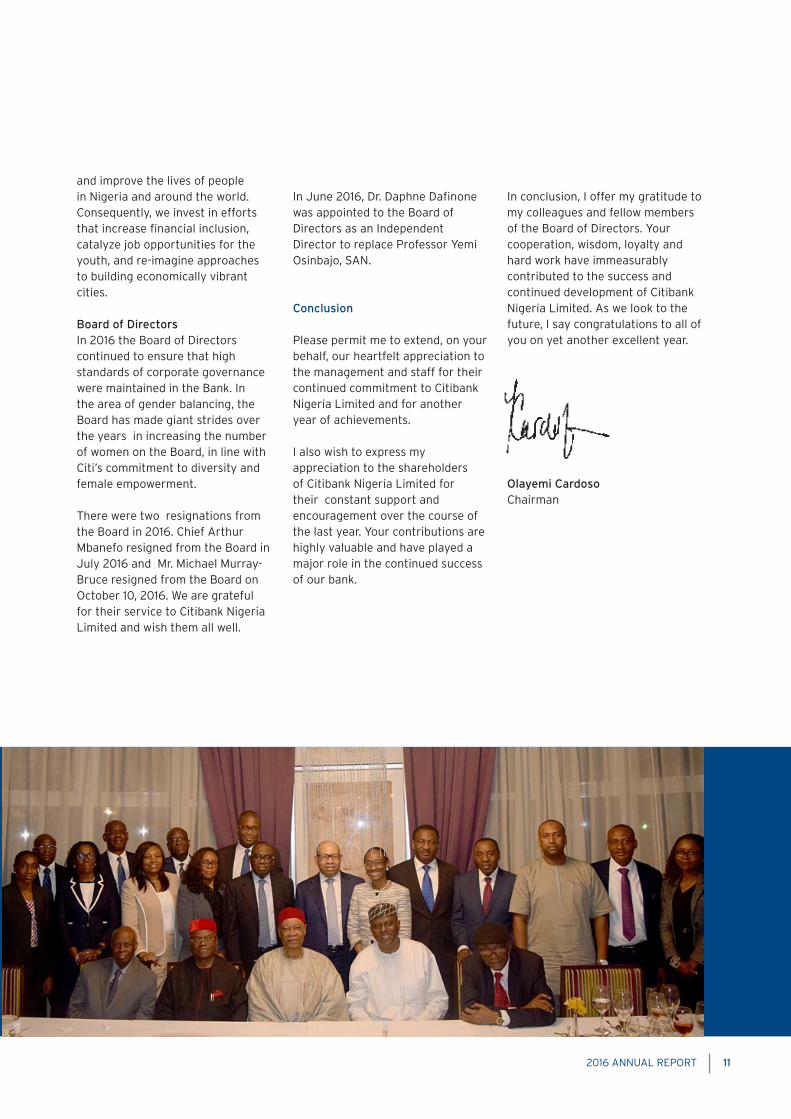
Board of DirectorsIn 2016 the Board of Directors continued to ensure that high standards of corporate governance were maintained in the Bank. In the area of gender balancing, the Board has made giant strides over the years in increasing the number of women on the Board, in line with Citi’s commitment to diversity and female empowerment.
There were two resignations from the Board in 2016. Chief Arthur Mbanefo resigned from the Board in July 2016 and Mr. Michael Murray-Bruce resigned from the Board on October 10, 2016. We are grateful for their service to Citibank Nigeria Limited and wish them all well.
In June 2016, Dr. Daphne Dafinone was appointed to the Board of Directors as an Independent Director to replace Professor Yemi Osinbajo, SAN.
Conclusion
Please permit me to extend, on your behalf, our heartfelt appreciation to the management and staff for their continued commitment to Citibank Nigeria Limited and for another year of achievements.
I also wish to express my appreciation to the shareholders of Citibank Nigeria Limited for their constant support and encouragement over the course of the last year. Your contributions are highly valuable and have played a major role in the continued success of our bank.
In conclusion, I offer my gratitude to my colleagues and fellow members of the Board of Directors. Your cooperation, wisdom, loyalty and hard work have immeasurably contributed to the success and continued development of Citibank Nigeria Limited. As we look to the future, I say congratulations to all of you on yet another excellent year.
Olayemi CardosoChairman

2016 ANNUAL REPORT12
SUSTAINABILITY REPORT
the firm. As a result, we pro-actively assess covered transactions using our robust ESRM policy.
Our environmental sustainability strategy is based on managing the environmental footprint of our own operations, such as energy use in our offices and proactively assessing and managing environmental and social risk in projects we finance.
Citi is committed to sharing best practices and improving the financial literacy base of financially excluded individuals. In 2010, we launched the Citi Microenterprise Development for Rural Farmers Initiative, targeted at increasing the income of small holder farmers in rural areas, including women, by facilitating access to financial management training, access to agricultural inputs through a loan fund and access to markets through linkage to agro-products merchants and centralized logistics for post-harvest produce. 100 farmers have received business development training and access to low-interest loans to allow them to purchase inputs to grow crops.
By partnering with other banks and microfinance institutions, Citi continues to explore innovative avenues to provide capital to those who otherwise would not have had access.
The promotion of diversity, one of the key pillars of Citi’s operating culture, ensures that Citi continues to provide equal opportunities for all irrespective of gender, religion or race.
Processes developed to identity innovative, sustainable business opportunities
As part of its review of a project’s expected social and environmental impacts, Citi uses a system of social and environmental categorization in its evaluation of all projects, based on IFC’s environmental and social screening criteria, to reflect the magnitude of impacts understood as a result of assessment:
CATEGORY A – use of proceeds are likely to have potential significant adverse social or environmental impacts that are diverse, irreversible or unprecedented;
Citi Nigeria Limited’s sustainability vision entails conducting business in an environmentally and socially responsible manner. In addition to making good business sense, this is consistent with our goal of being a good corporate citizen sensitive to the communities in which we do business. We developed our Environmental and Social Risk Management (ESRM) Policy which includes categorization requirements and, as appropriate, environmental due diligence and elevated review and approval requirements for corporate and government loans, project finance, equity transactions, acquisition finance, letters of credit, bid bonds, performance bonds, and project finance advisory mandates. This policy decision reinforces Citi’s commitment to managing environmental and social risks in a rigorous and effective manner.
Citi Nigeria has a long standing commitment to conduct business in a manner consistent with the Citigroup core principle of Responsible Finance. We recognize that sustainability issues could impact the reputation of the firm and the ability of a potential customer to fulfill its obligations to
2016 ANNUAL REPORT 13
CATEGORY B – use of proceeds are likely to have potential limited adverse social or environmental impacts that are few in number, generally site-specific, largely reversible and readily addressed through mitigation measures; and
CATEGORY C – use of proceeds expected to have minimal or no social or environmental impacts.
The screening and categorization criteria above are supplemented by a focus on a number of broad, high-level issues as framed by the IFC Performance Standards, including:
i. biodiversity protection and sustainable use of natural resources
ii. community health, safety and security
iii. cultural heritageiv. indigenous peoplesv. labor and working conditionsvi. land acquisition and involuntary
resettlementvii. pollution prevention and
abatement.
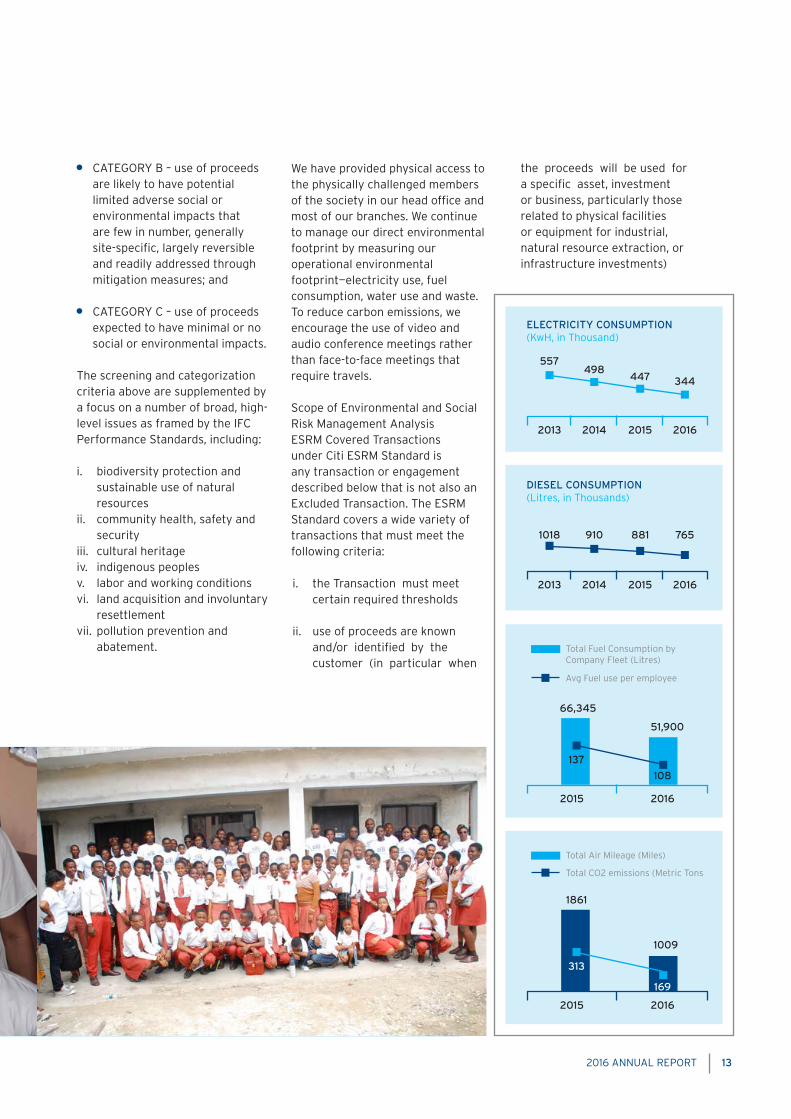
We have provided physical access to the physically challenged members of the society in our head office and most of our branches. We continue to manage our direct environmental footprint by measuring our operational environmental footprint—electricity use, fuel consumption, water use and waste. To reduce carbon emissions, we encourage the use of video and audio conference meetings rather than face-to-face meetings that require travels.
Scope of Environmental and Social Risk Management AnalysisESRM Covered Transactions under Citi ESRM Standard is any transaction or engagement described below that is not also an Excluded Transaction. The ESRM Standard covers a wide variety of transactions that must meet the following criteria:
i. the Transaction must meet certain required thresholds
ii. use of proceeds are known and/or identified by the customer (in particular when
the proceeds will be used for a specific asset, investment or business, particularly those related to physical facilities or equipment for industrial, natural resource extraction, or infrastructure investments)
ELECTRICITY CONSUMPTION (KwH, in Thousand)
DIESEL CONSUMPTION (Litres, in Thousands)
557
2013 2014 2015 2016
498447 344
2013
1018
2014
910
2015
881
2016
765
2015
2015
2016
2016
66,345
1861
Total Fuel Consumption by Company Fleet (Litres)
Total Air Mileage (Miles)
Avg Fuel use per employee
Total CO2 emissions (Metric Tons
51,900
1009
137
313
108
169

2016 ANNUAL REPORT14
PATHWAYS TO PROGRESS
Citi Foundation is making its largest philanthropic commitment ever by investing $100 million to impact the lives of 500,000 young people globally, ages 16-24, over the next three years to prepare them for today’s competitive job market. This funding is in addition to the previously announced U.S. commitment of $50 million, which in its first three years, helped more than 100,000 young people become career-ready and employable. You can see some of their stories of progress in this video.
83%

2016 ANNUAL REPORT 15
of young people in Lagos are optimistic about their career prospects
#Pathways2Progress
Based on data and analysis by Ipsos
Citi Foundation
83%

2016 ANNUAL REPORT16

2016 ANNUAL REPORT 17
Business Report

2016 ANNUAL REPORT18
CORPORATE AND INVESTMENT BANKING
Citi’s Corporate & Investment Banking (CIB) Group’s key business objective remains to be the strategic advisor of choice to our valued clients, by providing differentiated industry advice and expertise. Citi offers a broad range of products including; Corporate Finance, Investment Banking, Transaction Services (Cash Management, Trade Products and Custody Services), Treasury services (Fixed Income, currencies and commodities) and structured solutions to meet the needs of our clients.
Citi continues to face increased competitive pressure with the continued local presence of regional and global banks such as Rand Merchant Bank (RMB), Barclays, Standard Chartered (SC) and JP Morgan. With this backdrop, Citi’s CIB team has remained focused and consistent in delivering best in class product solutions and services to meet the needs of its clients.
Citi remains committed in supporting its clients to successfully navigate market volatility driven by the challenging backdrop of persistently low crude prices, providing the necessary risk management advice and solutions,
and remains confident in the country’s long term economic prospects as well as that of Citi’s rapidly growing client base.
Global corporates were faced with a world that had become more polarized, fragile, and unpredictable in 2016. The U.K. Brexit vote and the outcome of the U.S. presidential election elevated uncertainty in the global economy.
Nigeria’s Q4’16 real gross domestic product (GDP) contracted by 1.30%. This decline was less severe than the decline recorded in Q3’16 (-2.24%), but was nevertheless lower than the growth rate recorded in Q4’15 (2.11%). Hence FY’16 real GDP growth amounted to -1.5% (2015: 2.8%), the worst full-year decline in twenty-five years - as both oil and non-oil GDP contracted in 2016.
Although the Central Bank of Nigeria (CBN) put in place currency restrictions to try to shore up the value of the naira, this seemed ineffective and continued to widen the gap between the official and the parallel market till June 2016 when, as a response, the CBN unveiled a new framework for the FX market, under which the Naira will be market-driven but with occasional intervention by the government. The announcement was positively received and lifted the Nigerian Stock Exchange up by 7.4%. The Apex bank also announced the sale of FX forwards and futures that provided some much needed comfort to manufacturers and relieving pressure on the parallel market. The markets had initially witnessed a total depreciation of over c.58% from US$/NGN199 to US$/NGN280 and further to US$/NGN315 prior to the announcement of the new market regime. Despite
the announcement and the subsequent injection of $4bn to clear a backlog, the gap between the official and parallel market remained over 50% as the parallel market reached NGN500/US$ by year-end 2016, compared to NGN315/US$ analysts’ views were that retail demand i.e. school fees, PTA/BTA, medical bills etc. would need to be met to narrow the gap.
At the fourth Monetary Policy Committee meeting of 2016, the Committee decided to raise the policy rate (MPR) by 200bps to 14% against market consensus for a HOLD decision. The Committee retained the Cash Reserve Requirement (CRR) on private and public sector deposits at 22.5%, the Liquidity Ratio (LR) at 30% and the asymmetric corridor at +200bps/-500bps and remained at these levels till the end of the year.
Gross external reserves stood at $25.84bn by December 2016, down from $29.1 - $34.8bn in prior years, a decrease attributed primarily to increase funding of the foreign exchange market to stabilize the currency. On December 14 2016, Nigerian President Muhammadu Buhari presented a record budget to lawmakers to boost the nation’s spending by 20% in 2017 in a bid to revive an economy set for its first full-year contraction in more than two decades. Buhari asked lawmakers to allow the government to spend NGN7.3tn ($23bn) in 2017, compared with this year’s budget of NGN6.1tn. The proposal is based on a projected price of $42.50 per barrel of oil, the administration is also continuing the theme of recovery through infrastructure, allocating a record 30% (NGN 2.24tn) to infrastructure spending with key focus on Power, transportation, Agriculture etc.
Mudassir AmrayHead of Corporate and Investment Bank

2016 ANNUAL REPORT 19
Citi continues to maintain close dialogue with its clients providing creative solutions to their businesses while financing their needs in conjunction with the bank’s product partners. Citi also leveraged on its global network to support Nigerian corporates as they expand their businesses in the region and other locations.
Unforeseen geopolitical events have clouded the picture for the world’s economies in 2017. Political discontent has boosted anti-establishment forces in advanced economies - particularly the U.K. and the U.S.A. - potentially beclouding the future of global trade and raising fears of protectionism. There are high levels of dissatisfaction in other key European countries too, as seen by the rise of nationalist political parties. Despite this economic activity is projected to pick up pace in 2017 and 2018, especially in emerging market and developing economies. The IMF upgraded its growth forecast for China’s economy in 2017 to 6.5% it also kept its forecasts for global growth this year and next unchanged, at 3.4% and 3.6% (2017 and 2018 respectively) with global economic growth driven by United States, Germany and China.
Capital inflows are picking up in emerging markets, due to strong economic growth and outlook in China and India. With three consecutive quarters of 6.7% growth in 2016, China seems to have halted an economic slow-down and has begun to rev up its economy according to a Bloomberg survey. On the other hand sub-saharan Africa offers economies juxtaposed, whilst economies like Cote D’Ivoire and Tanzania are growing at a record pace, with an
average quarterly growth of 7% in 2016, and Cote d’Ivoire growing at 8% as a result of decisive fiscal reforms which has stimulated private investments. Angola, Ghana, Nigeria and other overly commodity dependent economies have slid into recession and are struggling to fashion out a viable exit and reposition for growth.
The Nigerian economy is expected to witness a weak recovery in 2017 with estimates of 1% according to EIU with promising prospects from the non-oil sector which remains relatively buoyant, particularly in agricultural production and infrastructure development, services including trade and telecommunications, which has benefitted from smartphone usage and data subscription. Crude oil prices are expected to remain at the recent levels ranging from US$45 – US$51 a barrel, as markets gauge the long term effects of production cuts by OPEC and fewer shale producers in the US. The Central Bank of Nigeria (CBN) has announced that it will provide direct additional funding to Deposit Money Banks (DMBs) to meet forex demands for personal and business travel (PTA & BTA), medical bill payments as well as school fees payments, which will be settled at a rate not exceeding 20% above the prevailing interbank market rate.
Nigeria has faced several macroeconomic headwinds in the past year which has put a strain on business, despite this, there are some opportunities for us to create value for our clients, across equity capital markets (GDR issuances and rights issues for multinationals to convert dollar loans to equity), debt capital markets (growing Interest among FIs on the back of the successful sovereign issuance),
and advisory (corporates seeking foreign strategic partnerships to bring in some much needed capital). Citi continues to be a trusted advisor to its clients, as the bank always would be side by side with its clients providing advice, reach and resources to support their growth plans.
The administration has taken a few steps to address the economic and structural issues in the country, narrowing the parallel market rate via retail intervention, introducing a detailed economic recovery and growth plan highlighting policy direction and initiatives for the next few years, which has garnered some interest from international and local investors but Citi believes that some investors would need to see action taking place before one can experience some semblance of the interests that was seen in past years.
Working with Citi’s product partners across electronic banking, cash, liability management, mergers & acquisitions, trade and treasury Citi’s objective remains that: Citi continues to be a trusted advisor to its clients, making the bank their first port of call and ensuring that Citi delivers the best possible products and services to them in a seamless manner. In this regard, the team has continued to surpass expectations. Citi remains committed to the continuous growth in the development of talent, as this remains the key differentiator for Citi.
Citi remains committed to assisting our clients to successfully navigate market volatility by providing the necessary advice and solutions. We remain confident of the country’s long term economic prospects as well as that of our rapidly growing client base.
2016 ANNUAL REPORT20
RISK MANAGEMENT
The year 2016 was challenging for Nigeria on the economic front. The country fell into recession for the first time in 25 years, as Gross Domestic Product (GDP) contracted by 1.3% in 2016. Other economic indices showed a similar trend, with rising inflation, scarcity of foreign exchange, frequent scarcity of petroleum products in the first half of the year, decline in manufacturing activities and substantial loss of value by investors on the Nigerian Stock Exchange.
The decline in government revenues was compounded by a dramatic reduction in oil production in mid-2016, caused by persistent militant attacks on oil facilities in the Niger Delta. At some point in the course of the year, oil production was down to c. 1.4 million barrels per day, compared to a typical level of 1.8 to 2.0 million barrels per day. Overall, these developments made for one of the most difficult periods the country has passed through in economic terms.
Faced with falling foreign exchange reserves, the Central Bank of Nigeria (CBN) deployed various
regulations and monetary policy initiatives to tighten local currency liquidity, limit demand for Foreign Exchange (FX) and reduce the rate of depletion of foreign reserves as a result. These measures have included the restriction of access to official sources of FX for certain products, preferential allocation of foreign exchange to some sectors, and sale of FX on a forward basis to end users. Despite these measures, the gap between the official exchange rate and the unofficial market exchange rates continued to widen, prompting the CBN to take further actions to mitigate the situation in the course of the year In June 2016, the Central Bank implemented new policies to allow the rate of exchange to be more market determined, leading to an official devaluation of the local currency from c. N199/$ to c. N285/$ in the first instance, and further to c. N310/$ later in the year. In tandem with these initiatives, the Central Bank also initiated policies to constrain local currency liquidity, including the sale of FX forward to corporations, while the local currency component is debited immediately. The overall impact has been a rise in interest rates in the economy. The Central Bank also introduced a local currency settled Non-Deliverable Forwards (NDFs) market, in order to attract portfolio and other investors with foreign currency flows into the Nigerian market.
These measures met with partial success, with foreign exchange scarcity persisting for the whole of 2016, adversely impacting the operations of companies with substantial FX needs. Foreign direct and portfolio investors seemed unconvinced by some of the policies, and did not return to the
market with the same level of flows as in the past, putting further strain on the Central Bank as the main supplier of foreign exchange to the economy.
The scarcity of FX has led to a reduction in international import trade transactions. On the positive side, it has encouraged corporations to explore opportunities to increase exports in order to earn foreign exchange. The adversely impacted corporations have faced increased difficulty in sourcing foreign currency for imports or remittances, and this, in combination with a general economic slowdown in the country, has led to weaker corporate performance for most of these companies. The reduced government spending caused by falling oil prices has also had a direct impact on consumer purchasing power. Fast-Moving Consumer Goods (FMCG) companies generally experienced a fall in their revenues and profitability in 2016, as they struggled to pass on incremental costs to their consumers in the face of intense competition.
The Banking system has also witnessed increased strain in the course of the year, with banks reporting higher non-performing loan ratios on the back weaker loan portfolio performance. Banking industry indices weakened, with non-performing loans as a proportion of gross loans increased from c. 5.3% as at the end of 2015 to c. 14% as at the end of 2016, based on Central Bank Financial Stability Reports for the referenced periods. There was also a marked increase in loan loss reserves for the period. Higher loan reserves will continue to put pressure on the profitability of the banks and,
Chinedu IkwudinmaExecutive Director,Risk Management
2016 ANNUAL REPORT 21
where losses arise, on capital adequacy ratios, depending on the categorisation of the institution (regional, national, international or systemically important). Devaluation of the local currency is also impacting capital adequacy ratios for banks with large loan outstandings in foreign currency, as the risk weighted impact of these loans become magnified as a result. To support the banks in their efforts to manage their portfolios in these circumstances, the Central Bank issued important variations to existing prudential regulations, including one permitting banks to decide to write off loans declared as “lost” immediately, instead of waiting for the required 1 year period. We note that several banks have reported large foreign exchange translation gains for the year ended December 31, 2016, due to the devaluation of the local currency, thereby mitigating some of the challenges in operational performance for the year.
Going into 2017, we expect the strains, in terms of national macro-economic performance, to abate, as the government focuses on growth initiatives and the implementation of social programs to alleviate the impact of the current market conditions. The consensus is that the country will emerge from recession this year, with 2017 GDP growth of just under 1%. Though positive, this is well below the benchmark of 5% required for sustainable growth and poverty alleviation.
We anticipate that several corporations will undertake some form of balance sheet restructuring, providing opportunities for corporate and investment banking and advisory services. We also
expect some banks to explore opportunities to raise capital in the course of the year, to boost their capital adequacy ratios and meet regulatory requirements. We note strong success by Nigerian institutions, including the Government of Nigeria and various banks, in raising financing on the international debt markets, in recent times. Up to March 2017, the Federal Government had raised a cumulative $1.5 billion through Eurobonds, demonstrating strong investor appetite for Nigerian debt instruments, despite the challenging economic conditions in the country.
Government’s dialogue with Niger Delta militants has led to a reduction in the attacks on oil facilities, and signposts a period of higher oil production for Nigeria. Combined with the positive impact of higher crude oil prices, buoyed by OPEC and Non-OPEC countries’ agreement on cuts to oil production, the prognosis for oil prices is somewhat more robust than for 2016. Average crude oil prices have been in the $50 range, since November 2016, though still vulnerable to increased shale production in the USA and quota-busting by oil producing countries.
We have been very pro-active in managing our portfolio and risk management profile during this period, thereby achieving very strong indices, including a non-performing loan ratio (NPL ratio) of 0.05% as at the end of 2016. This is an industry leading performance, and reflects our intense focus on portfolio health, effective stress testing, early problem recognition and decisive remedial management. We note that our portfolio remains stable, well diversified and largely short term. This gives the bank
greater flexibility in navigating current market conditions, further mitigating portfolio risk. We continue to generate very strong, high-quality earnings as a result. We continue to strengthen our risk management organisation through the employment of top talent, international and cross-regional exposure for our personnel, automation and technology, policy enhancements and a very robust management control assessment (MCA) process.
We expect our most important clients to navigate the current challenges and emerge stronger. Many sectors will see a consolidation, which will be to the advantage of the typically large, well-resourced clients at the core of our portfolio. The policies of the current government, with their focus on infrastructural development and job creation, should also help fuel a recovery in the near term.
We continue to maintain a very solid and collaborative relationship with our regulators, especially the CBN and the Nigerian Deposit Insurance Corporation (NDIC). We note that Citibank Nigeria underwent several regulatory audits in the course of 2016, which were all rated satisfactory. This is remarkable in the current market and regulatory environment. We intend to maintain this profile, and continue to focus on our core principles of responsible finance, high ethical standards and anticipatory risk management.
2016 ANNUAL REPORT22
TREASURY AND TRADE SOLUTIONS
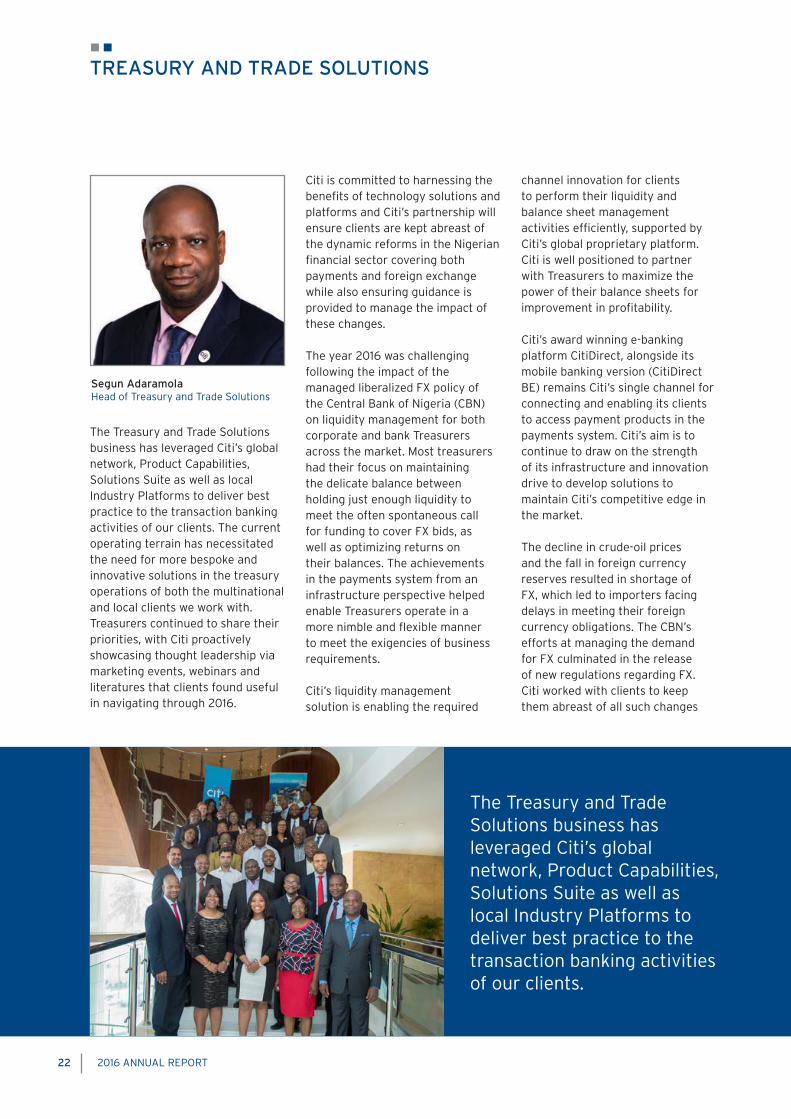
The Treasury and Trade Solutions business has leveraged Citi’s global network, Product Capabilities, Solutions Suite as well as local Industry Platforms to deliver best practice to the transaction banking activities of our clients. The current operating terrain has necessitated the need for more bespoke and innovative solutions in the treasury operations of both the multinational and local clients we work with. Treasurers continued to share their priorities, with Citi proactively showcasing thought leadership via marketing events, webinars and literatures that clients found useful in navigating through 2016.
Citi is committed to harnessing the benefits of technology solutions and platforms and Citi’s partnership will ensure clients are kept abreast of the dynamic reforms in the Nigerian financial sector covering both payments and foreign exchange while also ensuring guidance is provided to manage the impact of these changes.
The year 2016 was challenging following the impact of the managed liberalized FX policy of the Central Bank of Nigeria (CBN) on liquidity management for both corporate and bank Treasurers across the market. Most treasurers had their focus on maintaining the delicate balance between holding just enough liquidity to meet the often spontaneous call for funding to cover FX bids, as well as optimizing returns on their balances. The achievements in the payments system from an infrastructure perspective helped enable Treasurers operate in a more nimble and flexible manner to meet the exigencies of business requirements.
Citi’s liquidity management solution is enabling the required
channel innovation for clients to perform their liquidity and balance sheet management activities efficiently, supported by Citi’s global proprietary platform. Citi is well positioned to partner with Treasurers to maximize the power of their balance sheets for improvement in profitability.
Citi’s award winning e-banking platform CitiDirect, alongside its mobile banking version (CitiDirect BE) remains Citi’s single channel for connecting and enabling its clients to access payment products in the payments system. Citi’s aim is to continue to draw on the strength of its infrastructure and innovation drive to develop solutions to maintain Citi’s competitive edge in the market.
The decline in crude-oil prices and the fall in foreign currency reserves resulted in shortage of FX, which led to importers facing delays in meeting their foreign currency obligations. The CBN’s efforts at managing the demand for FX culminated in the release of new regulations regarding FX. Citi worked with clients to keep them abreast of all such changes
The Treasury and Trade Solutions business has leveraged Citi’s global network, Product Capabilities, Solutions Suite as well as local Industry Platforms to deliver best practice to the transaction banking activities of our clients.
Segun AdaramolaHead of Treasury and Trade Solutions

2016 ANNUAL REPORT 23
and the implications on their day to day business activities. Citi also leveraged its network to provide information and fact to foreign businesses that have operations in Nigeria. Citi also increased its offering of the supplier finance product to manage the impact on suppliers as well as clients in the fast-moving-consumer-goods (FMCG) sector, as manufacturers sought to offer extended payment terms to suppliers. Citi Nigeria’s injection of cutting-edge technology to its trade finance product suite brought efficiency and reduced cost to clients.
In 2017, Citi will focus on the digitization of trade processing via the deployment of its proprietary customer front end platform, CitiDirect for trade, and CitiConnect for supplier finance, providing end-to-end automation that will help clients make productivity and efficiency gains.
2016 was a peculiar year for businesses operating in Nigeria. Companies were concerned about rising inflation, interest rates,
scarcity of foreign exchange and the numerous regulations that were released in the course of the year. These topics and feedback from the environment and clients guided the bank’s interactions with its clients during the year.
In line with the realities in the country and consequent needs of clients, Citi actively engaged its clients on products such as Supply Chain Finance for working capital management, the Clean LC Structure to take care of clients who were unable to pay suppliers on time for imports, Automation, Straight-through processing and Reconciliation to bring efficiencies to clients’ operations and processes, Electronic collections channels like eBills Pay etc.
Citi also organized a number of marketing and sensitization events, which included an Export Trade seminar, CitiDirect for Trade workshop, Supplier Finance roundtable meeting, Digitization event, Foreign Exchange webinar, etc.
In 2017, Citi will continue to stay in tune with and be sensitive to
its clients, in order to anticipate their needs so the bank can provide the products and support required for continuous improvement of their processes.
Citi’s Implementations team was able to manage the delivery of Cash, Cards and Trade products to clients leveraging client friendly implementation models. With this, the team maintained a consistent and effective onboarding experience for clients, which resulted in faster solutions delivery of mandates received.
Tailored electronic solutions that provide greater efficiency were popular amongst the bank’s clients in the course of the year. Robust integration with clients’ enterprise resource planning (ERP) systems were implemented. These solutions enabled Citi clients to enhance their organizational work flow process, improve their overall productivity while aligning with various regulatory requirements.
In 2017, the team will continue to deploy value added and innovative solutions that will enable our customers optimize their operating performance.
Citi’s award winning e-banking platform CitiDirect, alongside its mobile banking version (CitiDirect BE) remains Citi’s single channel for connecting and enabling its clients to access payment products in the payments system. Citi’s aim is to continue to draw on the strength of its infrastructure and innovation drive to develop solutions to maintain Citi’s competitive edge in the market.

2016 ANNUAL REPORT24
GLOBAL SUBSIDIARIES GROUP
Citi Nigeria’s Global Subsidiaries Group (GSG) remains part of a global client coverage force, harnessing the power of Citi’s unparalleled global network and delivering seamlessly to our clients. The team framework is designed to mirror the clients’ organizational structure and continues to create a unique alignment between the clients’ Treasury organizations and Citi’s network. Citi’s clients value the depth of Citi’s offering, universal systems, well-orchestrated global teams and extensive local market knowledge. In the last year, the bank’s clients with their global Treasury teams, especially relied on
unique insights from the Citi team to interpret the rather dynamic and challenging economic environment in Nigeria, to support their business sustainability.
The year 2016 was quite historic in the Nigeria economic landscape, with negative growth recorded for four consecutive quarters and the country ultimately recording its first recession in over two decades. Many factors were contributory but severe Foreign Exchange shortages considerably dampened the business environment.
Citi played quite a pivotal role in supporting clients’ needs during this crucial period, leveraging its diversified foreign investor footprint and cross-border Trade Finance capacity. In particular, Citi deployed import and Foreign Exchange solutions which enabled our clients secure the much needed production inputs to remain in business. The critical supply chain partners of Citi’s client base were also integrated into the bank’s trade solution suite.
The Central Bank of Nigeria (CBN) Foreign Exchange reforms in June 2016 were laudable and provided
some of the much needed flexibility. In particular, the new Foreign Exchange policy enabled hedging opportunities and the bank worked with several clients to improve their cost certainties. The ensuing naira devaluation increased Citi clients’ input costs, coupled with a change in the fuel price regime which led to a sharp increase in the pump price of fuel. Also most market operators had foreign currency liabilities, which resulted in exchange losses when the exchange rate moved adversely. The CBN tightened the monetary policy rate by 200bps during the year to control inflationary pressures and interest costs increased, further aggravating business costs.
All of these cost escalations squeezed out business margins for most companies and inevitably led to outright losses in several others. While some market operators had sufficient capacity and financial flexibility to withstand the market stresses, others were more vulnerable. Citi worked closely with its clients to lower their financial risks. Citi’s rich credit culture, advanced credit monitoring techniques and proactive screening of the credit portfolio against key
Citi’s clients value the depth of Citi’s offering, universal systems, well-orchestrated global teams and extensive local market knowledge.
Nneka EnwerejiExecutive Director and Head of Global Subsidiaries Group
2016 ANNUAL REPORT 25
stress factors, ensured that Citi continued to maintain a healthy portfolio of credit clients, and defend shareholder value.
While credit availability generally reduced in the market due to cautious lending appetite in the bank market, Citi continued to provide competitively priced loans to clients in its target market. Citi’s scalable supply chain financing solution further deepened Citi’s reach, to provide financing options to its clients’ supply chain. Where some companies increased the number of their banking providers, ostensibly to improve access to Foreign Exchange, Citi’s multi-banking technology platforms/systems proved invaluable to optimizing liquidity across banking system applications and enhancing overall operating efficiency.
Citi remained key banking providers to strategic Industry segments. Citi especially dominated the wallets of a number of clients during the year, on the strength of the bank’s product innovation and dynamic response to clients’ key business imperatives. Notably, Citi won landmark client mandates
for Capital Raising and debt restructuring.
In Citi’s annual Client feedback survey, most clients defined their relationship with the Citi team as Trusted Advisor relationships, underscoring the strength of our partnerships. The quality of Citi’s client engagement was also validated in the KPMG 2016 Banking Industry Customer Satisfaction survey which for the third consecutive year voted Citibank Nigeria as the Most Customer Focused Bank in the wholesale banking category.
During the year, Citi continued to invest in talent, which remains fundamental to its business aspirations. Citi deployed various intervention programs, including training courses and short-term assignments with other businesses. In-house partnerships were crucial to the bank’s achievements during the year and GSG collaborated very effectively with the various product, risk and control functions, to drive our business agenda. The bank’s network connectivity remains a key advantage and Citi continued to optimally exploit this.
Overall, while it was a tough year, it was a very accomplished one for Citi’s business, as Citi differentiated itself as a trusted partner to its esteemed client base.
2017 OutlookThe Nigeria economic growth forecasts for 2017 signal some growth, albeit marginal. This would be driven by higher or at least more stable oil prices, continued containment of the Niger Delta militancy and better traction on economic policy implementation. Foreign Exchange availability would no doubt be a key enabler for the anticipated growth momentum and it is a good sign that the CBN have significantly boosted market supply in the first couple of months.
Citi’s continued insights on the business terrain, strong knowledge of our clients’ business dynamics, strategic client partnerships, innovative and proactive solutions should once again serve the bank well to steer the business to another record performance amidst the market uncertainties.
Citi especially dominated the wallets of a number of clients during the year, on the strength of the bank’s product innovation and dynamic response to clients’ key business imperatives.

2016 ANNUAL REPORT26
MARKETS
Citi started 2016 with optimism about the introduction and implementation of economic reforms based on the eventual confirmation of ministers in November 2015. However, a combination of low oil prices, reduced oil production and currency volatility made 2016 a challenging year for the country. Nigeria officially slipped into its first recession since the return to democracy as the economy contracted by 0.36% and 2.06% year-on-year in Q1 and Q2 of 2016 respectively. Nigeria’s full year GDP closed negative, at 1.51%. However
what provided some hope was that the GDP contracted slower in Q4, 2016 (-1.3%) than in the previous two quarters (-2.06% in Q2 and -2.24% in Q3).
Citi characterized 2014 as a “tale of two halves”. That was certainly true again in 2016. Citi’s clients – and by extension, the bank – navigated the challenging operating environment caused by the shortage of foreign exchange, in the first half of the year. Following months of resistance to adjust the value of the local currency, the Central Bank of Nigeria (CBN) took the decision to manage float the currency in June 2016 thus allowing a more flexible exchange market; a decision that was welcomed by financial market participants. Consequently, conditions and client sentiments did improve in the second half as the regulatory environment around foreign exchange got better.
The decision to allow a flexible exchange rate was in part due to the widening gap between the official exchange rate and the parallel market. This gap is widely viewed by investors as a measure of the level of pressure on the
currency. The monetary policy authority also faced dwindling reserves in 2016, having spent much of the first half of the year trying to shore up the pegged naira. After its announcement of a flexible exchange rate policy, the apex bank sold a total of US$4.05bn in spot and forwards to clear the pending demand in the interbank market. The Central Bank also launched the OTC FX Futures, a hedge product for local FX end users as well as foreign portfolio and direct investors.
The launching of the OTC FX Futures created an opportunity for FICC to reaffirm Citi’s position as the gateway for investors. Citi became the first bank to execute an OTC FX Futures transaction in a $20 million landmark deal with the CBN. It was also the first major offshore inflow of capital subsequent to the introduction of the new exchange rate policy. Citi further facilitated various investors to inflow capital into the Nigeria economy, investing in the federal government securities and the OTC FX Futures.
The monetary policy authority had to be more proactive from the onset as Nigeria faced inflationary
Citi became the first bank to execute an OTC FX Futures transaction in a $20 million landmark deal with the CBN. It was also the first major offshore inflow of capital subsequent to the introduction of the new exchange rate policy.
Bayo AdeyemoCountry Treasurer and Head of Markets

2016 ANNUAL REPORT 27
pressures. Headline inflation hit double digit in February, causing the Monetary Policy Committee (MPC) to increase the monetary policy rate (MPR) by 100 basis points to 12% and Cash Reserve Requirement (CRR) by 250 basis points to 22.5% in its March meeting. The lingering fuel scarcity which eventually led to the adjustment of petrol pump prices by 67% from NGN87 to NGN145 per litre in May 2016 and pass through effect of weakening currency in the unofficial market kept inflation elevated throughout the year. Faced with the trilemma of weakening currency, rising inflation and negative GDP growth, the MPC chose to combat inflation and exchange rate volatility as it increased the MPR further in July 2016 by 200 basis points to 14%. Inflation eventually closed the year at a high of 18.6%. In response to the tightening monetary policy and rising inflation, bond yields sustained an upward trend through the year.
Despite the headwinds that marked 2016, Citi continues to rely on our diverse client base and the connectivity derived from Citi’s global footprint. Citi’s product
knowledge and diversity remain a critical value proposition to its clients. Citi has also made it a key priority to deepen relationships with more traditional local institutional clients.
Citi expects 2017 to be a positive year for the Nigeria economy. Citi anticipates an improvement in the economic growth measures especially as the impact of Fiscal and Monetary authorities policies begin to gain ground. The focus on agriculture, power, transportation and infrastructural development should serve as a catalyst for the recovery of the economy. Citi expects an incremental and noticeable improvement in the foreign currency situation which hampered business activities in 2016, as the apex bank continues its market liberalization efforts. Higher oil prices are expected to provide the biggest support to the economy following OPEC’s decision to cut production in November. Citi remains committed to adding value to its clients especially as broader economic activity rebounds and the markets environment improves.
Citi has also made it a key priority to deepen relationships with more traditional local institutional clients.

2016 ANNUAL REPORT28
DIRECT CUSTODY AND CLEARING
The macro environment in 2016 set the stage for developments in the capital and money markets. Gross Domestic Product (GDP) growth was negative for the entire year for the first time in two decades. The first three quarters recorded progressively deteriorating growth, -0.36 percent (quarter one), -2.06 percent (quarter two) and: -2.24 (quarter three) percent with a slight moderation of the disappointing numbers in quarter four growth of -1.30 percent. This contraction in economic activity from associated limitations with foreign exchange
(FX) culminated in a lackluster performance for the financial markets.
On the capital market front, the Nigeria Stock Exchange (NSE) market capitalisation lost 6.1 percent year on year; a reflection of lower investor enthusiasm for exchange traded equities, many of whom were negatively impacted by the inability to import inputs of production. The NSE Industrial Good Index lost 26.3 percent; the worst performer of the 12 indices computed and published by the NSE. Related numbers from the Nigerian Bureau of Statistics (NBS) also show the gradual relapse of the industrial growth from -2.2 percent in 2015 to -8.5 percent in 2016. Growth in the agriculture sector; the bright spot in the economy, improved to 4.1 percent in 2016 from 3.72 percent, the preceding year.
Regrettably, agriculture does not have a representation on the NSE. All in all, Foreign Portfolio Investors (FPIs) seemed to reduce their risk appetite for investment in Nigerian equities in 2016.
Fixed Income yields on the other hand climbed throughout the year and closed near the inflation print for the shorter tenor government issued securities. The last Treasury Bill auction in December 2016 saw 182 day Treasuries issued at 17.4 percent, compared with 6.9 percent, the first week of 2016. Yields on longer term government paper; Bonds, also increased by about 350 basis points. Nevertheless, it appears the significant yields on these instruments were insufficient to entice FPIs to invest in Nigeria. The removal of Nigeria from the J.P. Morgan Government Bond Index Emerging Markets at the end of October 2015 continued to negatively affect the appeal of this asset class.
Oil prices stabilized in 2016, after tumbling from above USD100 per barrel in early 2014 to an average of just under USD50 per barrel in 2015. However, oil production losses of about 14 percent from shut-ins by the oil majors in the Niger Delta region continued to strain FX receipts from oil exports, Nigeria’s main stay. With less than
Citi Direct Custody and Clearing as a custody service provider continued to leverage Citi’s custody-related technology platforms, broad knowledge pool and staffing resources to support its domestic and foreign clients in 2016.
Aderonke AdetoroSecurities CountryManager

2016 ANNUAL REPORT 29
1.9million barrels per day produced on average in 2016, insufficient supply to meet the myriad of investors’ FX needs, a constantly changing regulatory environment and an inability to quickly and completely repatriate proceeds of investments, levels of Foreign Portfolio Investor activity were significantly reduced. Despite the resurgence in investment flows to Emerging Markets, Nigeria’s challenging operating environment and currency risk uncertainties have made it a less attractive investment destination.
Citi Direct Custody and Clearing (DCC) as a custody service provider, continued to leverage Citi’s custody-related technology platforms, broad knowledge pool and staffing resources to support its domestic and foreign clients in 2016. DCC has mitigated the decline in FPI interest in Nigeria by nurturing the domestic client base; with Assets Under Custody (AUC) belonging to locals growing by 116 percent in 2016. New client mandates were won during the year, and incremental deals from existing clients all led to a
steady growth in this sub segment. In 2016, DCC also launched the Outflow Custody business, an avenue for local clients to hold foreign denominated securities. This product was successfully implemented and continues to draw on the strength of Citi’s global capabilities and local expertise to meet the bank’s clients’ needs.
2017 OutlookCiti is optimistic about 2017, and will continue to put Citi’s global footprint to work, collaborating closely with market operators and regulators, on improving efficiency in the Nigerian capital market. Citi persist in driving process automation and straight-through transaction process enhancements while also strengthening its risk management framework and procedures. Citi believes that reforms in the economy should strengthen macro indicators and lead to stability and a return of investment flows to Nigeria.
In 2016, DCC also launched the Outflow Custody business, an avenue for local clients to hold foreign denominated securities.
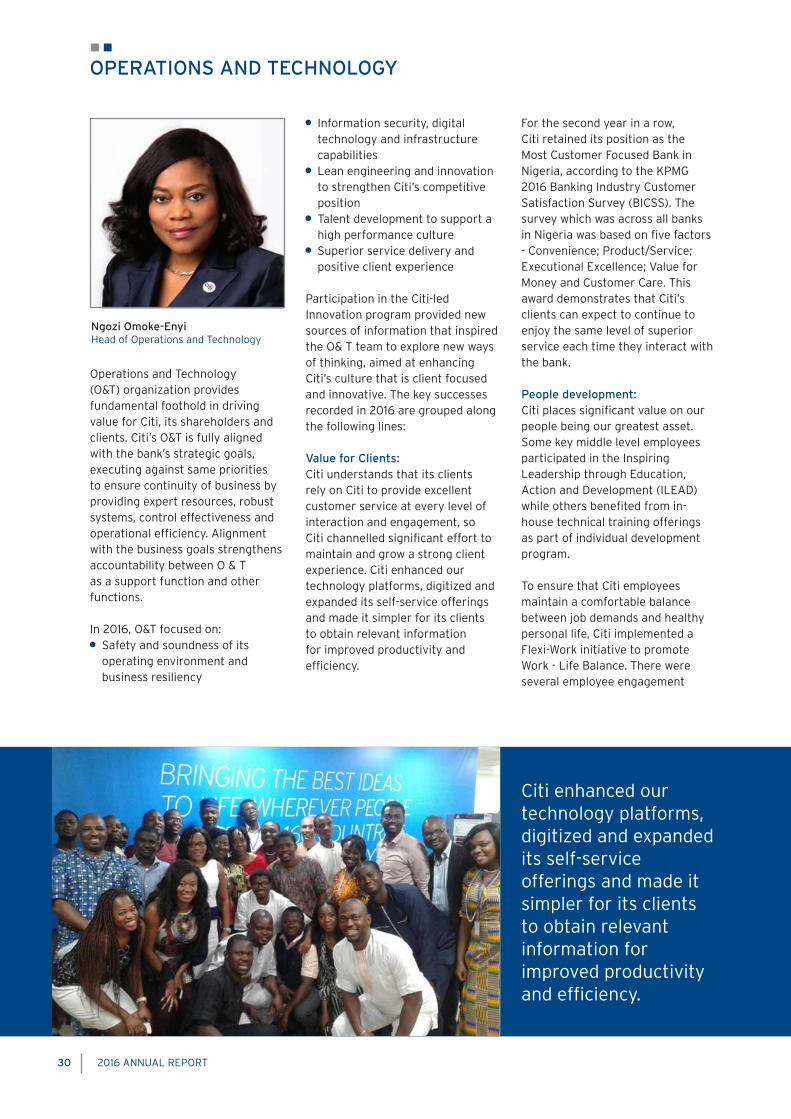
2016 ANNUAL REPORT30
OPERATIONS AND TECHNOLOGY
Operations and Technology (O&T) organization provides fundamental foothold in driving value for Citi, its shareholders and clients. Citi’s O&T is fully aligned with the bank’s strategic goals, executing against same priorities to ensure continuity of business by providing expert resources, robust systems, control effectiveness and operational efficiency. Alignment with the business goals strengthens accountability between O & T as a support function and other functions. In 2016, O&T focused on: Safety and soundness of its
operating environment and business resiliency
Information security, digital technology and infrastructure capabilities
Lean engineering and innovation to strengthen Citi’s competitive position
Talent development to support a high performance culture
Superior service delivery and positive client experience
Participation in the Citi-led Innovation program provided new sources of information that inspired the O& T team to explore new ways of thinking, aimed at enhancing Citi’s culture that is client focused and innovative. The key successes recorded in 2016 are grouped along the following lines:
Value for Clients:Citi understands that its clients rely on Citi to provide excellent customer service at every level of interaction and engagement, so Citi channelled significant effort to maintain and grow a strong client experience. Citi enhanced our technology platforms, digitized and expanded its self-service offerings and made it simpler for its clients to obtain relevant information for improved productivity and efficiency.
For the second year in a row, Citi retained its position as the Most Customer Focused Bank in Nigeria, according to the KPMG 2016 Banking Industry Customer Satisfaction Survey (BICSS). The survey which was across all banks in Nigeria was based on five factors - Convenience; Product/Service; Executional Excellence; Value for Money and Customer Care. This award demonstrates that Citi’s clients can expect to continue to enjoy the same level of superior service each time they interact with the bank.
People development:Citi places significant value on our people being our greatest asset. Some key middle level employees participated in the Inspiring Leadership through Education, Action and Development (ILEAD) while others benefited from in-house technical training offerings as part of individual development program.
To ensure that Citi employees maintain a comfortable balance between job demands and healthy personal life, Citi implemented a Flexi-Work initiative to promote Work - Life Balance. There were several employee engagement
Ngozi Omoke-EnyiHead of Operations and Technology
Citi enhanced our technology platforms, digitized and expanded its self-service offerings and made it simpler for its clients to obtain relevant information for improved productivity and efficiency.
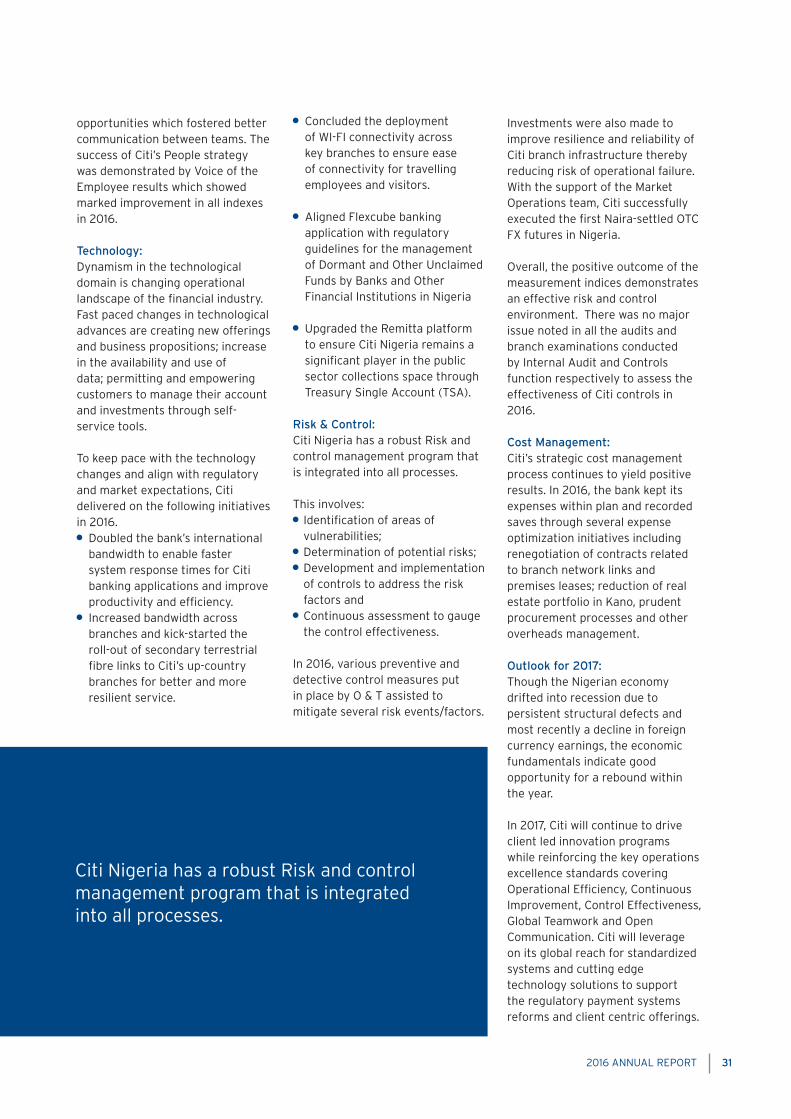
2016 ANNUAL REPORT 31
opportunities which fostered better communication between teams. The success of Citi’s People strategy was demonstrated by Voice of the Employee results which showed marked improvement in all indexes in 2016.
Technology:Dynamism in the technological domain is changing operational landscape of the financial industry. Fast paced changes in technological advances are creating new offerings and business propositions; increase in the availability and use of data; permitting and empowering customers to manage their account and investments through self-service tools.
To keep pace with the technology changes and align with regulatory and market expectations, Citi delivered on the following initiatives in 2016. Doubled the bank’s international
bandwidth to enable faster system response times for Citi banking applications and improve productivity and efficiency.
Increased bandwidth across branches and kick-started the roll-out of secondary terrestrial fibre links to Citi’s up-country branches for better and more resilient service.
Concluded the deployment of WI-FI connectivity across key branches to ensure ease of connectivity for travelling employees and visitors.
Aligned Flexcube banking application with regulatory guidelines for the management of Dormant and Other Unclaimed Funds by Banks and Other Financial Institutions in Nigeria
Upgraded the Remitta platform to ensure Citi Nigeria remains a significant player in the public sector collections space through Treasury Single Account (TSA).
Risk & Control:Citi Nigeria has a robust Risk and control management program that is integrated into all processes.
This involves: Identification of areas of vulnerabilities;
Determination of potential risks; Development and implementation of controls to address the risk factors and
Continuous assessment to gauge the control effectiveness.
In 2016, various preventive and detective control measures put in place by O & T assisted to mitigate several risk events/factors.
Investments were also made to improve resilience and reliability of Citi branch infrastructure thereby reducing risk of operational failure. With the support of the Market Operations team, Citi successfully executed the first Naira-settled OTC FX futures in Nigeria.
Overall, the positive outcome of the measurement indices demonstrates an effective risk and control environment. There was no major issue noted in all the audits and branch examinations conducted by Internal Audit and Controls function respectively to assess the effectiveness of Citi controls in 2016.
Cost Management:Citi’s strategic cost management process continues to yield positive results. In 2016, the bank kept its expenses within plan and recorded saves through several expense optimization initiatives including renegotiation of contracts related to branch network links and premises leases; reduction of real estate portfolio in Kano, prudent procurement processes and other overheads management. Outlook for 2017:Though the Nigerian economy drifted into recession due to persistent structural defects and most recently a decline in foreign currency earnings, the economic fundamentals indicate good opportunity for a rebound within the year.
In 2017, Citi will continue to drive client led innovation programs while reinforcing the key operations excellence standards covering Operational Efficiency, Continuous Improvement, Control Effectiveness, Global Teamwork and Open Communication. Citi will leverage on its global reach for standardized systems and cutting edge technology solutions to support the regulatory payment systems reforms and client centric offerings.
Citi Nigeria has a robust Risk and control management program that is integrated into all processes.

2016 ANNUAL REPORT32
HUMAN RESOURCES
Economic reforms and strict regulatory scrutiny were some of the key issues that impacted the banking industry in 2016.
The Nigeria economy experienced a recession; the first in decades with currency (Naira) devaluation and inflation at record high. Cost of goods and services increased, resulting in significant erosion of purchasing power and increased pressure on organizations profitability. In spite of this, Citi Nigeria continued to rely on its human capital in identifying and maximizing opportunities to increase the overall profitability of the bank.
Attrition rate in 2016 remained low through a series of employee engagement initiatives while leveraging Citi’s strong brand equity in resourcing
Some employees were selected for more senior roles across other Citi businesses thus providing opportunities internally for employees to transition into leadership roles with higher responsibilities. This also boosted Citi’s diversity drive through the bringing in of external suitable talents that further strengthened the bank’s market dominance.
Citi continued to explore various opportunities for personal and professional development of employees. Citi’s employees participated in external and internal training programs with a focus on leadership and regulatory trainings amongst others. Employees participated in Leadership Development programs as well as short-term assignments/On-the-Job training in various units and in other Citi locations. These programs and initiatives continue to provide visibility to employees and enhance their capabilities.
Citi remains unwavering in its commitment to its employees’
development and continues to provide developmental opportunities that ensure they are adequately engaged and motivated to sustain Citi’s position as a talent driven organization and a harbor for the best talents within the banking industry.
Citi employees continue to have equal opportunities to compete for open positions.
In the course of the year, employees were provided developmental opportunities in line with their career aspirations and organizational goals. A number of employees were transferred to various departments both locally and abroad to assume new roles with increased responsibility within Citi.
In July 2016, 21 students participated in the Citi Undergraduate Internship Program and 2 students participated in the maiden edition of the Citi Post-graduate Internship program in August 2016. The purpose of the Citi Internship Program is to create awareness about Citi as an employer of choice amongst future talents and an opportunity to them to experience working at Citi while learning more about our business.
Citi remains unwavering in its commitment to its employees’ development and continues to provide developmental opportunities that ensure they are adequately engaged and motivated to sustain Citi’s position as a talent driven organization and a harbor for the best talents within the banking industry
Gboyega OloyedeCountry Human Resources Officer

2016 ANNUAL REPORT 33
The programmes also offered participants a unique learning opportunity and overall its was a success
Diversity is an essential part of Citi. With Citi’s workforce being as diverse as its clients, communities and world it serves, Citi is a more vibrant, innovative and high-performing bank and a better place to work.
In March 2016 Citi celebrated International Women’s Day (IWD) with a panel discussion by some notable female leaders. IWD is a day set aside globally to recognize and celebrate the economic, political and social achievements of women. The event theme was “It Takes All of Us - Step It Up for Gender Equality” with focus on female leaders who have distinguished themselves in various fields cutting across different generations. Some of the topics discussed include: tips for success, balancing career, family and self, overcoming cultural barriers, leadership and mentoring.
Akin Dawodu MD/CEO Citi Nigeria applauded the immense contributions of women to the economic, political and social wellbeing of the economy. The
panelists were Funke Osibodu, CEO Benin Electricity Distribution Company Plc. and a Citi alumnus, Peju Adebajo CEO Cement Lafarge Africa Plc., and Onyeche Tifase MD/CEO Siemens Nigeria. Funmi Ogunlesi Executive Director Citi Nigeria moderated the discussion.
Citi’ Annual Diversity Week is an opportunity to reinforce diversity as a strategy and core strength of Citi to all its employees globally. The theme for 2016 focused on how we act as Allies – people who play an important part in building a diverse and inclusive environment. In Nigeria activities included a panel discussion with notable Nigerian celebrities, namely Kate Henshaw award-winning Actress, Charles Oputa, legendary media personality, Toyin Sokefun-Bello singer/songwriter, and photographer, and Eyo & Dallas On-Air personalities. They shared with the employees stories of their Allies (people who have been their allies and those they have been allies to). Employees also brought their children/wards to participate in the Bring-your-child-to-work day. The week was ended with a Diverse Allies Cultural Evening.
In October 2016 Citi commemorated Breast Cancer Awareness, by having
a Pink Day - employees wore a touch of pink. Dr. Sowunmi of the Lagos University Teaching Hospital (LUTH) in collaboration with Care Organization Public Enlightenment (COPE - an NGO dedicated to reducing the mortality rate of breast cancer, delivered a lecture on breast cancer prevention, treatment options and management. Employees had the opportunity to be screened for Breast, Cervical and Prostate cancer.
Citibank remains an equal opportunity employer.
Citi maintained its tradition of recognizing and rewarding performance on a quarterly basis. Many awards were presented in the year to deserving employees who performed exceptionally well and contributed to Citi’s success.
The Voice of Employee (VOE) survey which measures employee satisfaction recorded an increased score of 63% and Citi will continue to explore more innovative ways to improve on the level of employee satisfaction.
Citi remains committed to being an employer of choice as it continues to build on its successes.
Citi’ Annual Diversity Week is an opportunity to reinforce diversity as a strategy and core strength of Citi to all its employees globally. The theme for 2016 focused on how we act as Allies – people who play an important part in building a diverse and inclusive environment.

2016 ANNUAL REPORT34
EMPLOYEE OF THE YEAR
EMPLOYEE OF THE YEAR NOMINATION
Mabel Itambo joined the Trade Service Professional (TSP) team in June 2016. The country’s Trade environment was changing significantly owing to the scarcity of Foreign exchange in the country following introduction of new regulations that created challenges for the customers and their business. The Trade team therefore had to cope with the spike in volume of transactions and volatile regulatory environment, while maintaining Citi’s quality of service. As a TSP, Mabel stepped up to the challenge and provided the much needed guidance to her clients and colleagues to clarify emergent regulations and resolve issues.
Process Improvement/ Cost-Save ApproachMabel’s sterling performance has drastically reduced customer complaints and errors, avoiding financial losses. Additionally, she was instrumental to several initiatives that enhanced our client’s Trade experience through her systematic and thorough approach to work. She worked with the Regional Team to fine-tune the tracking of clients’ enquiries through the Trade processing. This initiative improved the quality of metrics for measuring performance and identifying areas of opportunity while saving valuable man-hours previously spent manually generating those reports and metrics.
At a time like this when the business environment has become more challenging and the competition is stiffer, the customer service role is a critical differentiator to sustain and grow the bank’s business.
ROLE MODEL – LEADING FROM THE FRONTMabel is a highly-motivated self-starter that willingly takes on new challenges. She is always ready to learn and she supports her colleagues with the winning combination of her wealth of experience, deep product knowledge, hard work, and “can-do” attitude. Mabel played and continues to play a very active role in the various activities and tasks in the Units, making her a dependable and reliable member of the team.
Customer Service Delivery She demonstrates a keen passion and deep understanding for quality customer service delivery. She constantly pushes the limits and goes the extra mile to actively engage with colleagues and clients to drilldown and resolve issues holistically.
The volatility experienced in the Foreign Exchange (FX) market in the country during the last few years led to frequent changes in regulatory requirements and internal work processes. This compounded the already complex regulatory landscape, directly increasing customer inquiries and customer complaints. Mabel provided critical support to some of our key Trade customers e.g. Procter & Gamble, Nestle Nigeria Ltd, Nigeria Bottling Company, Chi Limited and Parco Group to navigate through this complex maze, leading to a drastic reduction (more than 50%) in the number of customer complaints and errors.
She has been commended on several occasions by these customers, for her style, ability and readiness to get things done timely. These complements have very positive impacts for Citibank as we continue to support our clients to grow their business.

2016 ANNUAL REPORT 352016 ANNUAL REPORT 35


Financial ReportDirectors’ report 39
Corporate Governance report 46
Board Performance Review 50
Statement of responsibility and approval 51
Independent Auditor’s report 52
Consolidated Statement of Profit or Loss 57
Consolidated Statement of Comprehensive Income 58
Consolidated Statement of Financial Position 59
Consolidated Statement of Changes in Equity 60
Consolidated Statement of Cash Flows 62
Statement of significant accounting policies 63
Notes to the Financial Statements 63
Financial risk management 77
Statement of value added 137
Consolidated five year financial summary 138

38 2016 ANNUAL REPORT
DIRECTORS
Mr. Olayemi Cardoso Chairman
Mr. Akinsowon Dawodu Managing Director
Mr. Fatai Karim Executive Director
Mrs. Funmi Ogunlesi Executive Director
Mrs. Nneka Enwereji Executive Director
Mr. Chinedu Ikwudinma Executive Director
Mr. Michael Murray-Bruce (Resigned October 10, 2016) Non Executive Director
Mr. Phillip Cullingworth Non Executive Director
Mr. Peter McCarthy (Appointed June 25, 2015; CBN Approval April 15, 2016) Non Executive Director
Dr. Hilary Onyiuke Non Executive Director
Mrs. Ireti Samuel-Ogbu Non Executive Director
Chief Arthur Mbanefo CON (Resigned July 2, 2016) Independent Director
Dr. Daphne Dafinone (Appointed Feb 26, 2016; CBN Approval June 30, 2016) Independent Director
Mrs. Olusola Fagbure Company Secretary
CORPORATE HEAD OFFICE
Citibank Nigeria Limited
Charles S. Sankey House
27, Kofo Abayomi Street
Victoria Island, Lagos.
Telephone: +234 01 2798400
+234 01 4638400
Website: www.citigroup.com/nigeria
AUDITORS
PricewaterhouseCoopers
Landmark Towers, 5B Water Corporation Road
Victoria Island, Lagos
Telephone: +234 (1) 271 1700
Website: www.pwc.com/ng
Engagement Partner: Patrick Obianwa
FRC no.:FRC/2013/ICAN/00000000880
DIRECTORS, OFFICERS AND ADVISORS

2016 ANNUAL REPORT 39
The Directors have pleasure in presenting their annual report on the affairs of Citibank Nigeria Limited and its subsidiary
entity (“the Group”) together with the financial statements and auditors’ report for the year ended 31 December 2016.
LEGAL FORM
The Bank was incorporated in Nigeria under the Companies and Allied Matter Act as a private limited liability company on 2
May 1984. It was granted a license on 14 September 1984 to carry on the business of commercial banking and commenced
business on 14 September 1984.
PRINCIPAL ACTIVITY AND BUSINESS REVIEW
The principal activity of the Group is the provision of commercial banking services to its customers. Such services include
transactional services, corporate finance, provision of finance, custodial business and money market and trading activities.
The Bank has a subsidiary, Nigeria International Bank Nominees Limited. The company acts as the holder of securities
purchased for customers of the Bank’s custodial business.
OPERATING RESULTS
The net operating income and profit before tax of the Group increased by 78.41% and 150.48% respectively over prior year.
The directors recommend the approval of a final dividend of N21,704,297,219 (N7.77k per share) (2015:N8,995,962,677.38
(N3.22k per share) from the outstanding balance in the retained earnings account as at 31 December 2016. The dividends are
subject to deduction of withholding tax of 10%.
Highlights of the Group’s operating results for the year under review are as follows:
2016 2015
N’000 N’000 % change
Net operating Income 45,406,905 25,450,858 78.41%
Profit before tax 32,267,427 12,882,237 150.48%
Taxation (6,893,620) (2,367,360) 191.19%
Profit for the year 25,373,807 10,514,877 141.31%
Other comprehensive income for the year, net of tax (3,898,226) 4,280,739 (191.06%)
Total comprehensive income for the year 21,475,581 14,795,616 45.15%
DIRECTORS’ REPORTFOR THE YEAR ENDED 31 DECEMBER 2016

40 2016 ANNUAL REPORT
DIRECTORS’ SHAREHOLDING
The following directors of the Bank held office during the year and had direct and indirect interests in the issued share capital
of the Bank as recorded in the register of directors’ shareholding and/or as notified by the directors for the purposes of
sections 275 and 276 of the Companies and Allied Matters Act, as noted below:
Direct Shareholding Director Position Date of appointment/ Number of Number of Resignation in 2016 Ordinary Shares Ordinary Shares held in 2016 held in 2015
1 Mr. Olayemi Cardoso Chairman - -
2 Mr. Akinsowon Dawodu Managing Director - -
3 Mrs. Funmi Ogunlesi Executive Director - -
4 Mr. Fatai Karim Executive Director - -
5 Mrs. Nneka Enwereji Executive Director - -
6 Mr. Chinedu Ikwudinma Executive Director - -
7 Mrs. Ireti Samuel-Ogbu Non Executive Director - -
8 Dr. Hilary Onyiuke Non Executive Director - -
9 Mr. Philip Cullingworth (South African) Non Executive Director - -
10 Mr. Peter McCarthy (British) Non Executive Director Appointed - June 25, 2015;
CBN Approval April 15, 2016 - -
11 Mr. Michael Murray-Bruce Non Executive Director Resigned - October 10, 2016 - -
12 Chief Arthur Mbanefo CON Independent Director Resigned - July 2, 2016
13 Dr. Daphne Dafinone Independent Director Appointed - February 26, 2016,
CBN Approval June 30, 2016 - -
Dr. Hilary Onyiuke has an indirect shareholding through Gauthier Investments Ltd which has a shareholding of 33,445,769
ordinary shares.
Mr. Olayemi Cardoso has an indirect shareholding through the Estate of F.B. Cardoso which has a shareholding of 30,196,109
ordinary shares.
Mr. Michael Murray-Bruce has an indirect shareholding through Manilla Properties Limited which has a shareholding of
6,490,360 ordinary shares.
Since the last Annual General Meeting, Chief Arthur Mbanefo, and Mr. Michael Murray-Bruce resigned from the Board while
Mr. Peter McCarthy and Dr. Daphne Dafinone were appointed to the Board.
The Directors to retire by rotation at the next Annual General Meeting (AGM) are Mrs. Funmi Ogunlesi, Mr. Fatai Karim and Mr.
Akin Dawodu.
PROPERTY AND EQUIPMENT
Information relating to changes in property and equipment is given in Note 25 of the financial statements.
Directors’ Report
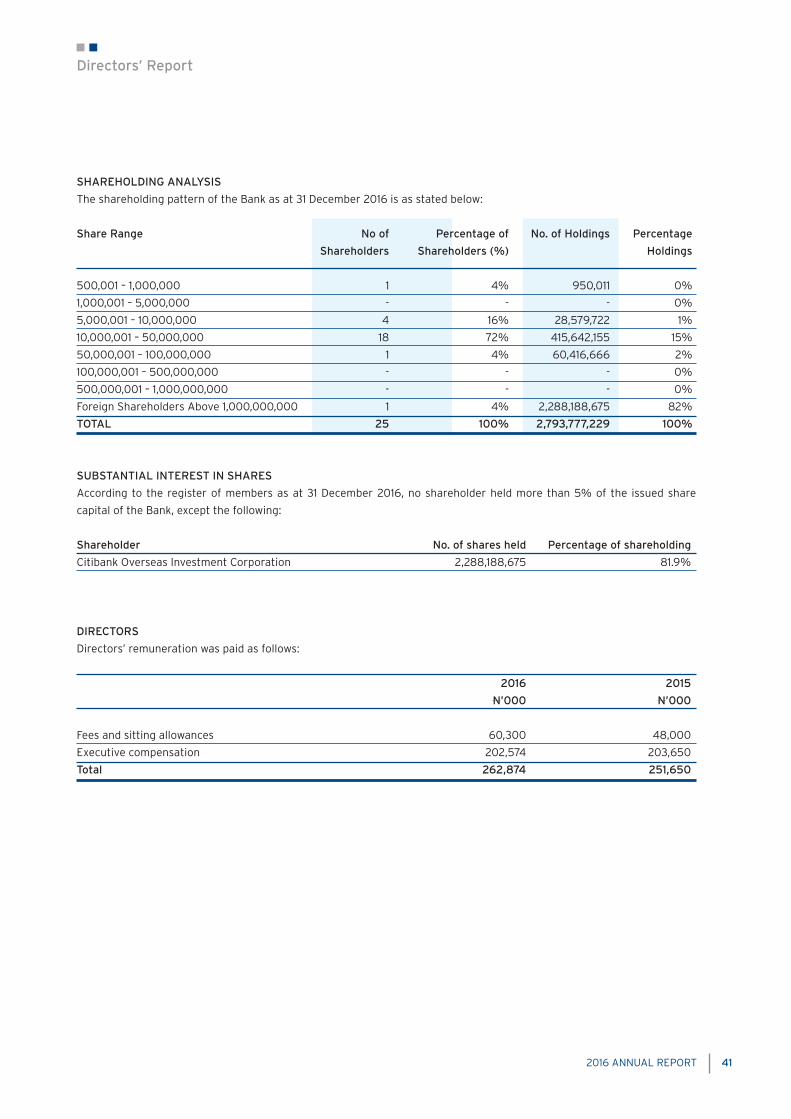
2016 ANNUAL REPORT 41
SHAREHOLDING ANALYSIS
The shareholding pattern of the Bank as at 31 December 2016 is as stated below:
Share Range No of Percentage of No. of Holdings Percentage
Shareholders Shareholders (%) Holdings
500,001 – 1,000,000 1 4% 950,011 0%
1,000,001 – 5,000,000 - - - 0%
5,000,001 – 10,000,000 4 16% 28,579,722 1%
10,000,001 – 50,000,000 18 72% 415,642,155 15%
50,000,001 – 100,000,000 1 4% 60,416,666 2%
100,000,001 – 500,000,000 - - - 0%
500,000,001 – 1,000,000,000 - - - 0%
Foreign Shareholders Above 1,000,000,000 1 4% 2,288,188,675 82%
TOTAL 25 100% 2,793,777,229 100%
SUBSTANTIAL INTEREST IN SHARES
According to the register of members as at 31 December 2016, no shareholder held more than 5% of the issued share
capital of the Bank, except the following:
Shareholder No. of shares held Percentage of shareholding
Citibank Overseas Investment Corporation 2,288,188,675 81.9%
DIRECTORS
Directors’ remuneration was paid as follows:
2016 2015
N’000 N’000
Fees and sitting allowances 60,300 48,000
Executive compensation 202,574 203,650
Total 262,874 251,650
Directors’ Report
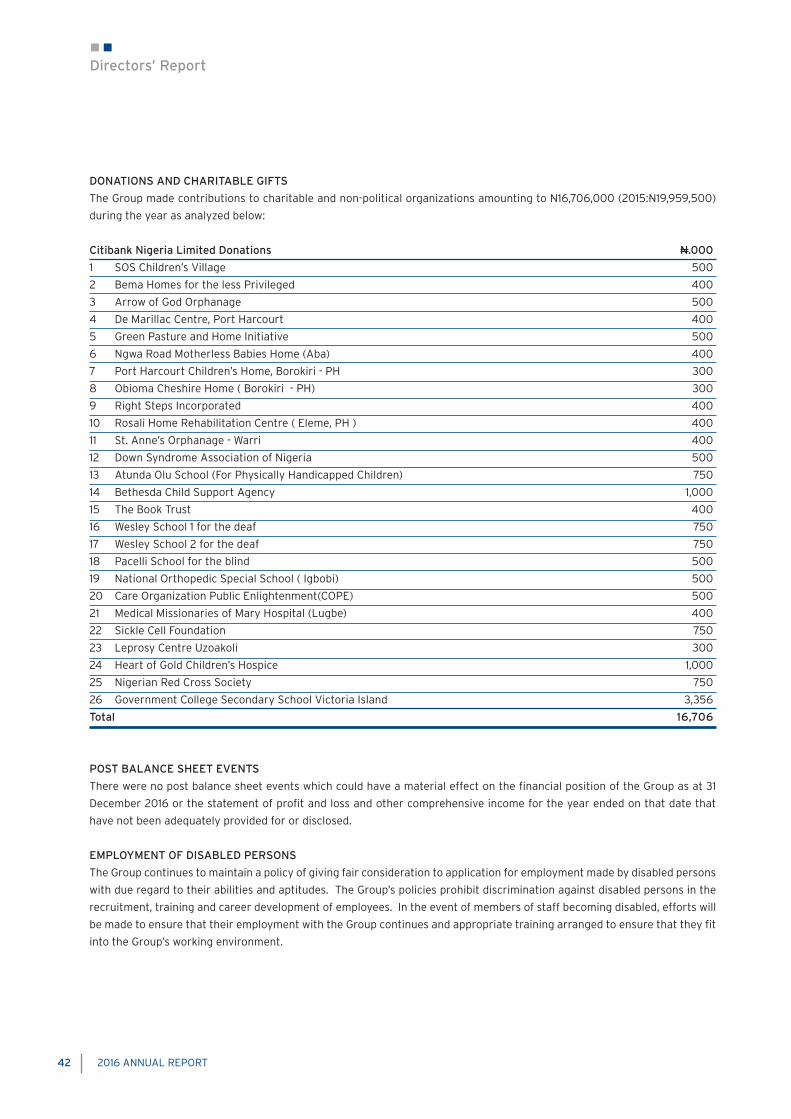
42 2016 ANNUAL REPORT
DONATIONS AND CHARITABLE GIFTS
The Group made contributions to charitable and non-political organizations amounting to N16,706,000 (2015:N19,959,500)
during the year as analyzed below:
Citibank Nigeria Limited Donations N.000
1 SOS Children’s Village 500
2 Bema Homes for the less Privileged 400
3 Arrow of God Orphanage 500
4 De Marillac Centre, Port Harcourt 400
5 Green Pasture and Home Initiative 500
6 Ngwa Road Motherless Babies Home (Aba) 400
7 Port Harcourt Children’s Home, Borokiri - PH 300
8 Obioma Cheshire Home ( Borokiri - PH) 300
9 Right Steps Incorporated 400
10 Rosali Home Rehabilitation Centre ( Eleme, PH ) 400
11 St. Anne’s Orphanage - Warri 400
12 Down Syndrome Association of Nigeria 500
13 Atunda Olu School (For Physically Handicapped Children) 750
14 Bethesda Child Support Agency 1,000
15 The Book Trust 400
16 Wesley School 1 for the deaf 750
17 Wesley School 2 for the deaf 750
18 Pacelli School for the blind 500
19 National Orthopedic Special School ( Igbobi) 500
20 Care Organization Public Enlightenment(COPE) 500
21 Medical Missionaries of Mary Hospital (Lugbe) 400
22 Sickle Cell Foundation 750
23 Leprosy Centre Uzoakoli 300
24 Heart of Gold Children’s Hospice 1,000
25 Nigerian Red Cross Society 750
26 Government College Secondary School Victoria Island 3,356
Total 16,706
POST BALANCE SHEET EVENTS
There were no post balance sheet events which could have a material effect on the financial position of the Group as at 31
December 2016 or the statement of profit and loss and other comprehensive income for the year ended on that date that
have not been adequately provided for or disclosed.
EMPLOYMENT OF DISABLED PERSONS
The Group continues to maintain a policy of giving fair consideration to application for employment made by disabled persons
with due regard to their abilities and aptitudes. The Group’s policies prohibit discrimination against disabled persons in the
recruitment, training and career development of employees. In the event of members of staff becoming disabled, efforts will
be made to ensure that their employment with the Group continues and appropriate training arranged to ensure that they fit
into the Group’s working environment.
Directors’ Report

2016 ANNUAL REPORT 43
HEALTH, SAFETY AND WELFARE AT WORK
The Group enforces strict health and safety rules and practices at the work environment, which are reviewed and tested
regularly. In addition, medical facilities are provided for staff and their immediate families at the Group’s expense.
Fire prevention and fire-fighting equipment are installed in strategic locations within the Group’s premises.
The Group operates both Group Personal Accident and Workmen’s Compensation Insurance cover for the benefit of its
employees. It is also fully compliant with the provisions of the Employee Compensation Act. The Group also operates a
contributory pension plan in line with the Pension Reform Act, 2014.
EMPLOYEE INVOLVEMENT AND TRAINING
The Group ensures, through various fora, that employees are informed on matters concerning them. Formal and informal
channels are also employed in communication with employees with an appropriate two-way feedback mechanism.
In accordance with the Group’s policy of continuous development, the Group draws extensively on Citigroup’s training
programmes around the world. The programmes include on the job training, classroom sessions and web-based training
programmes which are available to all staff. In addition, employees of the Group are nominated to attend both locally and
internationally organized courses.
DIVERSITY IN EMPLOYMENT
The Group recognises that the recruitment, involvement and advancement of women and a diverse workforce are business
imperatives. During the financial year ended 31 December 2016:
- There were 83 women out of 235 employees comprising 35.32% of the total number of employees;
- There were 4 women out of 11 Directors on the Board of Directors;
- There were 31 women out of 99 top management staff, including executive directors
- There were 29 women out of 94 top management staff between Assistant General Manager to General Manager grade;
- There were 2 women out of 5 top management staff between Executive Director to Chief Executive Officer;
- The bank had no persons with disabilities in its employment.
The Group is committed to maintaining a positive work environment and to conducting business in a positive, professional
manner by consistently ensuring equal employment opportunity. The Group has programs aimed at achieving gender balance
which include developmental programs targeted for women; mentoring; and policies that support Work-Life balance.
CONSUMER HELP DESK
Citi has a robust complaint management and feedback process, the object of which is to ensure that our clients are satisfied
with our products and services at all times.
All client communication channels e.g. phone calls, emails, letters etc. are monitored and tracked to ensure that satisfactory
service quality is maintained consistently. Also all queries are registered and monitored to resolution in line with pre-
established service level standards. 85% of client enquiries were resolved within 24 hours.
We value our clients’ feedback, and as such, we carry out frequent surveys to gauge their satisfaction with our products and
services. All feedback received through this forum is treated on a priority basis and required adjustment made accordingly.
Citi complies with all the Central Bank of Nigeria’s (CBN) guidelines on Customer Complaints Handling.
We have established a consumer complaints help desk to handle all categories of customer complaints and provide a monthly
report to the CBN in line with the guideline on customer complaint resolution.
Directors’ Report

44 2016 ANNUAL REPORT
The status of consumer complaints received in 2016 vs 2015 is presented below:
S/N NUMBER AMOUNT CLAIMED AMOUNT REFUNDED
2016 2015 2016 2015 2016 2015
1 Pending complaints B/F - - - - - -
2 Received complaints 3 13 10,306,504 276,787,371 727,702 24,500,284
3 Resolved complaints 2 13 727,702 276,787,371 727,702 24,500,284
4 Unresolved complaints escalated - - - - - -
to CBN for intervention
5 Unresolved complaints pending 1 - 9,578,802 - - -
with the bank C/F*
*Investigations into the”Unresolved complaint pending with the bank C/F” has been concluded and will be closed in January 2017
GUIDELINES ON ELECTRONIC PAYMENT OF SALARIES, PENSIONS, SUPPLIERS AND TAXES IN NIGERIA
The group has implemented the requirements in the guideline of e-payment of salaries, pensions, suppliers and taxes in Nigeria.
All forms of salaries, pensions, suppliers and taxes payment were initiated on our secure internet banking platform, CitiDirect,
during the financial year ended 31 December, 2016.
GUIDELINES ON CARD ISSUANCE & USAGE IN NIGERIA
During the financial year ended 31 December, 2016, the summary of activities relating to cards are as contained in the table
below:
Item Description Values
Card Type Citi Commercial Card (A corporate charge card)
Transaction Volume 98,080
Transaction Value N2,056,262,885
Directors’ Report
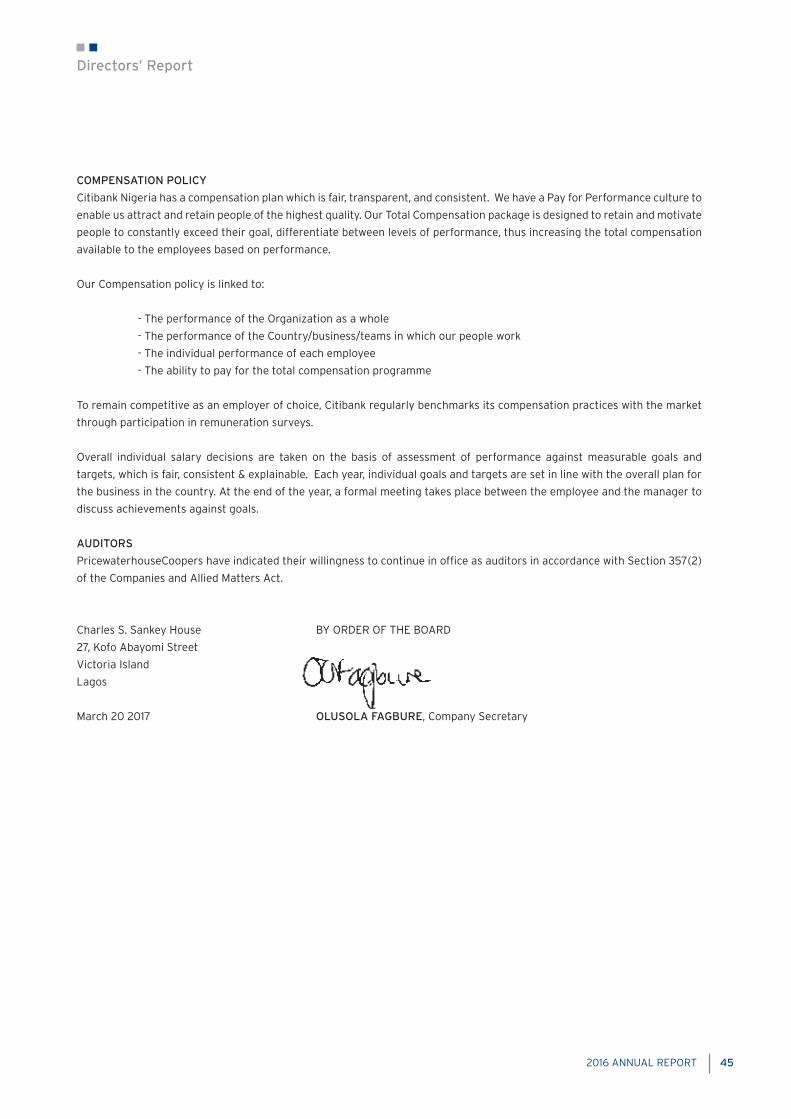
2016 ANNUAL REPORT 45
COMPENSATION POLICY
Citibank Nigeria has a compensation plan which is fair, transparent, and consistent. We have a Pay for Performance culture to
enable us attract and retain people of the highest quality. Our Total Compensation package is designed to retain and motivate
people to constantly exceed their goal, differentiate between levels of performance, thus increasing the total compensation
available to the employees based on performance.
Our Compensation policy is linked to:
- The performance of the Organization as a whole
- The performance of the Country/business/teams in which our people work
- The individual performance of each employee
- The ability to pay for the total compensation programme
To remain competitive as an employer of choice, Citibank regularly benchmarks its compensation practices with the market
through participation in remuneration surveys.
Overall individual salary decisions are taken on the basis of assessment of performance against measurable goals and
targets, which is fair, consistent & explainable. Each year, individual goals and targets are set in line with the overall plan for
the business in the country. At the end of the year, a formal meeting takes place between the employee and the manager to
discuss achievements against goals.
AUDITORS
PricewaterhouseCoopers have indicated their willingness to continue in office as auditors in accordance with Section 357(2)
of the Companies and Allied Matters Act.
Charles S. Sankey House BY ORDER OF THE BOARD
27, Kofo Abayomi Street
Victoria Island
Lagos
March 20 2017 OLUSOLA FAGBURE, Company Secretary
Directors’ Report
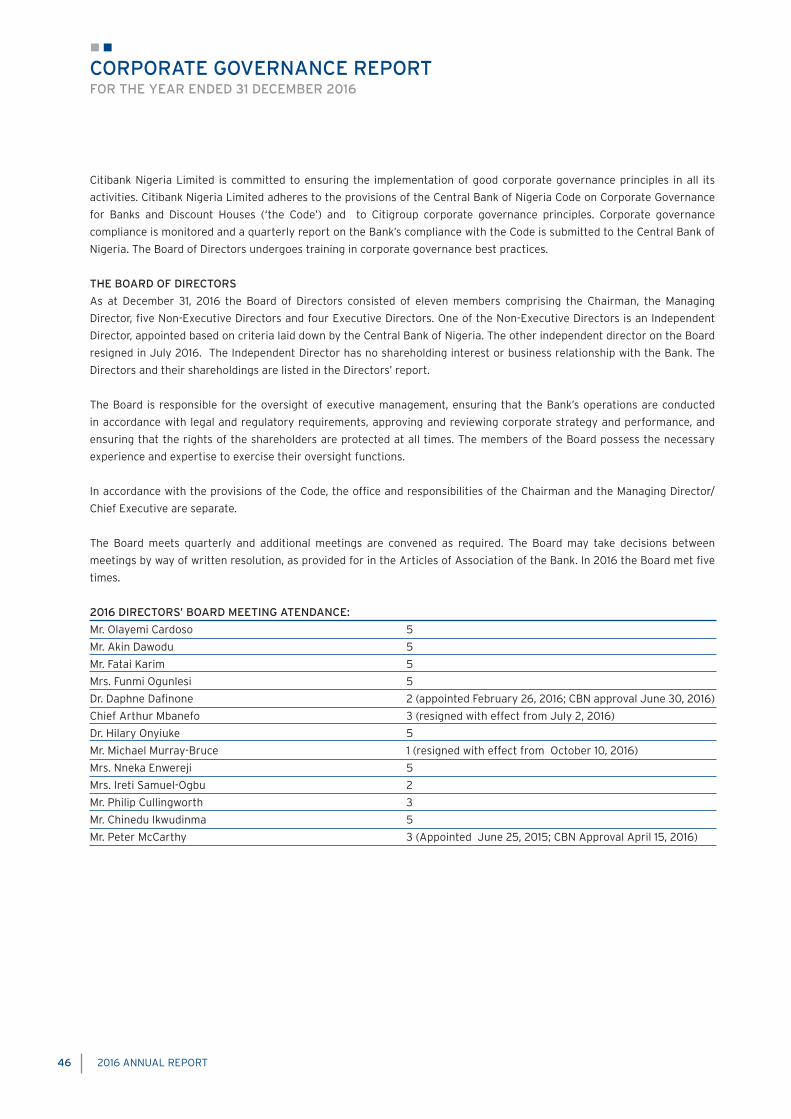
46 2016 ANNUAL REPORT
CORPORATE GOVERNANCE REPORTFOR THE YEAR ENDED 31 DECEMBER 2016
Citibank Nigeria Limited is committed to ensuring the implementation of good corporate governance principles in all its
activities. Citibank Nigeria Limited adheres to the provisions of the Central Bank of Nigeria Code on Corporate Governance
for Banks and Discount Houses (‘the Code’) and to Citigroup corporate governance principles. Corporate governance
compliance is monitored and a quarterly report on the Bank’s compliance with the Code is submitted to the Central Bank of
Nigeria. The Board of Directors undergoes training in corporate governance best practices.
THE BOARD OF DIRECTORS
As at December 31, 2016 the Board of Directors consisted of eleven members comprising the Chairman, the Managing
Director, five Non-Executive Directors and four Executive Directors. One of the Non-Executive Directors is an Independent
Director, appointed based on criteria laid down by the Central Bank of Nigeria. The other independent director on the Board
resigned in July 2016. The Independent Director has no shareholding interest or business relationship with the Bank. The
Directors and their shareholdings are listed in the Directors’ report.
The Board is responsible for the oversight of executive management, ensuring that the Bank’s operations are conducted
in accordance with legal and regulatory requirements, approving and reviewing corporate strategy and performance, and
ensuring that the rights of the shareholders are protected at all times. The members of the Board possess the necessary
experience and expertise to exercise their oversight functions.
In accordance with the provisions of the Code, the office and responsibilities of the Chairman and the Managing Director/
Chief Executive are separate.
The Board meets quarterly and additional meetings are convened as required. The Board may take decisions between
meetings by way of written resolution, as provided for in the Articles of Association of the Bank. In 2016 the Board met five
times.
2016 DIRECTORS’ BOARD MEETING ATENDANCE:
Mr. Olayemi Cardoso 5
Mr. Akin Dawodu 5
Mr. Fatai Karim 5
Mrs. Funmi Ogunlesi 5
Dr. Daphne Dafinone 2 (appointed February 26, 2016; CBN approval June 30, 2016)
Chief Arthur Mbanefo 3 (resigned with effect from July 2, 2016)
Dr. Hilary Onyiuke 5
Mr. Michael Murray-Bruce 1 (resigned with effect from October 10, 2016)
Mrs. Nneka Enwereji 5
Mrs. Ireti Samuel-Ogbu 2
Mr. Philip Cullingworth 3
Mr. Chinedu Ikwudinma 5
Mr. Peter McCarthy 3 (Appointed June 25, 2015; CBN Approval April 15, 2016)

2016 ANNUAL REPORT 47
BOARD COMMITTEES
The Board has delegated some of its responsibilities to the following board committees: Risk Management Committee, Audit
Committee, Credit Committee and the Board Governance and Nominations Committee. Each of these committees reports to
the Board on its activities. The Chairman of the Board is not a member of any of the board committees. The membership
of the Board Committees is in line with the requirements of the CBN Code of Corporate Governance for Banks and Discount
Houses.
Board Committees
a) The Risk Management Committee
The Risk Management Committee consists of six directors, two of whom, including the Chairman of the Committee,
are Non- Executive Directors. The Committee is responsible for overseeing the Bank’s Risk Management policies and
procedures in the areas of franchise, operational, credit and market risk. The Committee meets quarterly and met five
times during the year.
2016 COMMITTEE MEMBERS’ MEETING ATENDANCE:
Mrs. Ireti Samuel-Ogbu 2 (Chairman from October 12, 2016)
Mr. Michael Murray-Bruce 1 (Resigned with effect from October 10, 2016)
Mr. Fatai Karim 5
Mr. Akin Dawodu 5
Mrs. Funmi Ogunlesi 5
Mr. Chinedu Ikwudinma 5
Dr. Daphne Dafinone 2 (appointed to the Committee on July 2, 2016)
b) The Credit Committee
The Credit Committee consists of six directors, two of whom, including the Chairman of the Committee are Non- Executive
Directors. The Committee is responsible for approving credits above such limits as may be prescribed by the Board of
Directors from time to time. The Committee meets quarterly and met five times during the year.
2016 COMMITTEE MEMBERS’ MEETING ATENDANCE:
Mr. Philip Cullingworth 3
Mr. Akin Dawodu 5
Dr. Hilary Onyiuke 5
Mrs. Funmi Ogunlesi 5
Mrs. Nneka Enwereji 5
Mr. Chinedu Ikwudinma 5
Corporate Governance Report
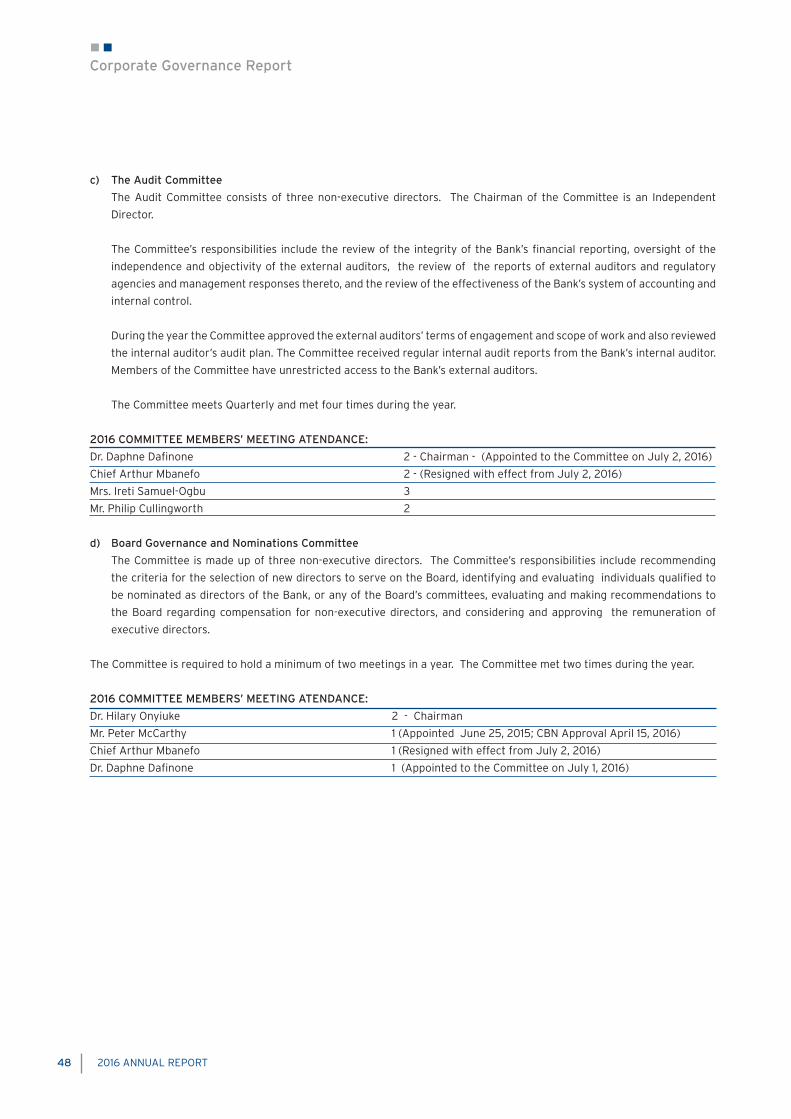
48 2016 ANNUAL REPORT
c) The Audit Committee
The Audit Committee consists of three non-executive directors. The Chairman of the Committee is an Independent
Director.
The Committee’s responsibilities include the review of the integrity of the Bank’s financial reporting, oversight of the
independence and objectivity of the external auditors, the review of the reports of external auditors and regulatory
agencies and management responses thereto, and the review of the effectiveness of the Bank’s system of accounting and
internal control.
During the year the Committee approved the external auditors’ terms of engagement and scope of work and also reviewed
the internal auditor’s audit plan. The Committee received regular internal audit reports from the Bank’s internal auditor.
Members of the Committee have unrestricted access to the Bank’s external auditors.
The Committee meets Quarterly and met four times during the year.
2016 COMMITTEE MEMBERS’ MEETING ATENDANCE:
Dr. Daphne Dafinone 2 - Chairman - (Appointed to the Committee on July 2, 2016)
Chief Arthur Mbanefo 2 - (Resigned with effect from July 2, 2016)
Mrs. Ireti Samuel-Ogbu 3
Mr. Philip Cullingworth 2
d) Board Governance and Nominations Committee
The Committee is made up of three non-executive directors. The Committee’s responsibilities include recommending
the criteria for the selection of new directors to serve on the Board, identifying and evaluating individuals qualified to
be nominated as directors of the Bank, or any of the Board’s committees, evaluating and making recommendations to
the Board regarding compensation for non-executive directors, and considering and approving the remuneration of
executive directors.
The Committee is required to hold a minimum of two meetings in a year. The Committee met two times during the year.
2016 COMMITTEE MEMBERS’ MEETING ATENDANCE:
Dr. Hilary Onyiuke 2 - Chairman
Mr. Peter McCarthy 1 (Appointed June 25, 2015; CBN Approval April 15, 2016)
Chief Arthur Mbanefo 1 (Resigned with effect from July 2, 2016)
Dr. Daphne Dafinone 1 (Appointed to the Committee on July 1, 2016)
Corporate Governance Report

2016 ANNUAL REPORT 49
GENERAL MEETINGS
The last Annual General Meeting was held on April 15, 2016.
Management Committees
The following are the key management committees: Country Co-Ordinating Committee, Business Risk and Compliance
Committee, Assets and Liabilities Committee, Legal Vehicle Management Committee, Country Senior Human Resources
Committee, Information Technology Steering Committee, Management Credit Committee and Third Party Management
Committee.
RISK AND CONTROLS
In line with Citigroup policies, the Bank maintains a strong control environment. The internal control system is designed to
achieve efficiency and effectiveness of operations, reliability of financial reporting and compliance with applicable laws and
regulations at all levels of the Group as required by the Code.
Robust risk management policies and mechanisms have been put in place to ensure identification of risk and effective
control. The Board, through the Board Risk Management Committee, oversees the Bank’s risk management policies.
WHISTLE BLOWING PROCEDURES
In line with the Bank’s commitment to instill best corporate governance practices, the Bank has established a whistle
blowing procedure that ensures anonymity. The Bank has a dedicated whistle blowing hotline and e-mail address. The Chief
Compliance Officer forwards quarterly returns to the Central Bank of Nigeria on all whistle-blowing reports.
CODE OF CONDUCT
The Bank has a Code of Conduct which all officers of the Bank are expected to adhere to. All staff are expected to strive to
maintain the highest standards of ethical conduct and integrity in all aspects of their professional life as prescribed in the
Code of Conduct.
MANAGEMENT SUCCESSION
The Bank has a strong management team and a documented succession plan for every executive role within the Bank.
REMUNERATION POLICY
The Bank’s employee remuneration policy revolves around Pay for Performance, to enable the Bank to attract and retain
people of the highest quality. Employees total compensation package is linked to the performance of the organisation as a
whole, as well as to the individual performance of each employee as assessed against measurable goals and targets.
Board Compensation
Members of the Board are paid directors fees, sitting allowances and reimbursable expenses as provided for in the CBN
Code of Corporate Governance for banks.
Board Performance Review
A review of the Board’s performance is conducted by DCSL Corporate Services Limited. A summary of DCSL’s report is
contained at page 50.
Corporate Governance Report

50 2016 ANNUAL REPORT
March 2017
REPORT OF THE EXTERNAL CONSULTANTS ON THE PERFORMANCE OF THE BOARD OF DIRECTORS OF CITIBANK
NIGERIA LIMITED “CITIBANK” FOR THE YEAR-ENDED DECEMBER 31, 2016.
DCSL Corporate Services Limited (DCSL) was engaged by Citibank Nigeria limited (“Citibank”) to carry out an evaluation
of the performance of Board of Directors for the year-ended December 31, 2016, in line with the provision of Section 2.8.3
of the CBN Code of Corporate Governance for Bank and Discount Houses, 2014 (the CBN Code). The evaluation entailed a
review of the bank’s corporate and statutory documents, the Minutes of Board and Committee meetings, Policies and other
ancillary documents made available to us, and the administration of questionnaires and interviews with the Directors and
select members of the Executive Management team. The objective was to ascertain the level of the Board’s compliance with
the provision of the CBN Code, relevant legalisation as well as global Best Practice and covered the following seven keys
corporate governance themes:
We considered seven key corporate governance indicators as follows;
1. Board Structure and Composition
2. Strategy and Planning
3. Board Operations and Effectiveness
4. Measuring and Monitoring of Performance
5. Risk Management and Compliance
6. Corporate Citizenship; and
7. Transparency and Disclosure.
Following our review of the corporate governance standards and processes, we affirm that the Board has complied with
the provisions of the CBN CODE and other relevant corporate governance best practices. The Peer Assessment undertaken
indicate that individual Directors performed satisfactorily against the parameters used for the appraisal and remained
committed to enhancing the Banks growth.
We note the commitment and commendable performance of the Board during the period under review and that it is in the
process of finalising the appointment of an additional independent Director for the Bank in compliance with the provisions of
Section 2.2.4 of the CBN Code of Corporate Governance.
Other recommendations are contained in our detailed report.
Yours faithfully,
For: DCSL Corporate Services Limited
Bisi Adeyemi
Managing Director
Directors: Abel Ajayi (Chairman) Obi Ogbechi Seni Ogunsanya Adebisi Adeyemi (Managing Director)
DCSL Corporate Services Limited 235 Ikorodu Road Abuja Office: Ilupeju 4th Floor, Bank of Industry Building P. O. Box 965, Marina Central Business District Lagos, Nigeria Abuja, Nigeria Tel: +234 9 4614902-5 Tel: +234 1 2717817 Port-Harcourt Office: Fax: +234 1 2717801 15 Emeyal Street, GRA www.dcsl.com.ng Phase II, Port Harcourt RC NO. 352393
March, 2015 The Chairman Board of Directors Citibank Nigeria Limited 27 Kofo Abayomi Street Victoria Island Lagos REPORT OF THE EXTERNAL CONSULTANTS ON THE EVALUATION OF THE BOARD OF DIRECTORS OF CITIBANK NIGERIA LIMITED FOR THE YEAR ENDED 31 DECEMBER 2014
DCSL Corporate Services Limited was engaged to carry out an evaluation of the Board of Citibank Nigeria Ltd (Citibank) as required by Section 2.8.1 of the Central Bank of Nigeria (CBN) Code of Corporate Governance (“the Code) for the period-ended 31st December 2014. Our engagement entailed a comprehensive review of the Bank’s corporate and statutory documents, minutes of Board and Committee meetings as well as policies. We benchmarked the Bank’s corporate governance structures, policies and processes against the provisions of the Code and global Corporate Governance Best Practices.
In undertaking the appraisal, we considered seven key corporate governance areas as follows:
Board Structure and Composition Strategy and Planning Board Operations and Effectiveness Measuring and Monitoring Performance Risk Management and Compliance Corporate Citizenship ( social, ethics, environment) Transparency & Disclosure
Our review of the structures, processes and practices in force at Citibank Nigeria Ltd, provide comfort on the Board’s continued commitment to adhering to the CBN Code of Corporate Governance as well as global best practice. The corporate culture inherent at Citibank as defined and guided by the Board is reflective of a structured environment where strong ethical values and a strong culture of compliance are pervasive. On the basis of our work, it is our conclusion that the Board has maintained an enviable standard of compliance with the provisions of the Code as well as the principles, practices and processes of good corporate governance. Yours faithfully, For: DCSL Corporate Services Ltd
Bisi Adeyemi Managing Director
Directors: ● Abel Ajayi (Chairman) ● Obi Ogbechi ● Seni Ogunsanya ● Adebisi Adeyemi (Managing Director) Directors: ● Abel Ajayi (Chairman) ● Obi Ogbechi ● Seni Ogunsanya ● Adebisi Adeyemi (Managing Director)
DCSL Corporate Services Limited 235 Ikorodu Road Abuja Office: Ilupeju 4th Floor, Bank of Industry Building P. O. Box 965, Marina Central Business District Lagos, Nigeria Abuja, Nigeria Tel: +234 9 4614902-5 Tel: +234 1 2717800 Fax: +234 1 2717801 www.dcsl.co.ng RC NO. 352393
March 2017
REPORT OF THE EXTERNAL CONSULTANTS ON THE PERFORMANCE OF THE BOARD OF DIRECTORS OF CITIBANK NIGERIA LIMITED (“CITIBANK”) FOR THE YEAR-ENDED DECEMBER 31, 2016.
DCSL Corporate Services Limited (DCSL) was engaged by Citibank Nigeria Limited (“Citibank”) to carry out an evaluation of the performance of the Board of Directors for the year-ended December 31, 2016 in line with the provision of Section 2.8.3 of the CBN Code of Corporate Governance for Banks and Discount Houses, 2014 (the CBN Code). The evaluation entailed a review of the Bank’s corporate and statutory documents, the Minutes of Board and Committee meetings, Policies and other ancillary documents made available to us, and the administration of questionnaires and interviews with the Directors and select members of the Executive Management team. The objective was to ascertain the level of the Board’s compliance with the provisions of the CBN Code, relevant legislation as well as global Best Practice and covered the following seven key corporate governance themes:
We considered seven key corporate governance indicators as follows:
1. Board Structure and Composition 2. Strategy and Planning 3. Board Operations and Effectiveness 4. Measuring and Monitoring of Performance 5. Risk Management and Compliance 6. Corporate Citizenship; and 7. Transparency and Disclosure.
Following our review of the corporate governance standards and processes, we affirm that the Board has complied with the provisions of the CBN Code and other relevant corporate governance best practices. The Peer Assessment undertaken indicate that individual Directors performed satisfactorily against the parameters used for the appraisal and remained committed to enhancing the Bank’s growth.
We note the commitment and commendable performance of the Board during the period under review and that it is in the process of finalizing the appointment of an additional Independent Director for the Bank in compliance with the provisions of Section 2.2.4 of the CBN Code of Corporate Governance.
Other recommendations are contained in our detailed Report.
Yours faithfully, For: DCSL Corporate Services Limited
Bisi Adeyemi Managing Director
Directors: ● Abel Ajayi (Chairman) ● Obi Ogbechi ● Seni Ogunsanya ● Adebisi Adeyemi (Managing Director)
DCSL Corporate Services Limited 235 Ikorodu Road Abuja Office: Ilupeju 4th Floor, Bank of Industry Building P. O. Box 965, Marina Central Business District Lagos, Nigeria Abuja, Nigeria Tel: +234 9 4614902-5 Tel: +234 1 2717800 Fax: +234 1 2717801 www.dcsl.co.ng RC NO. 352393
March 2017
REPORT OF THE EXTERNAL CONSULTANTS ON THE PERFORMANCE OF THE BOARD OF DIRECTORS OF CITIBANK NIGERIA LIMITED (“CITIBANK”) FOR THE YEAR-ENDED DECEMBER 31, 2016.
DCSL Corporate Services Limited (DCSL) was engaged by Citibank Nigeria Limited (“Citibank”) to carry out an evaluation of the performance of the Board of Directors for the year-ended December 31, 2016 in line with the provision of Section 2.8.3 of the CBN Code of Corporate Governance for Banks and Discount Houses, 2014 (the CBN Code). The evaluation entailed a review of the Bank’s corporate and statutory documents, the Minutes of Board and Committee meetings, Policies and other ancillary documents made available to us, and the administration of questionnaires and interviews with the Directors and select members of the Executive Management team. The objective was to ascertain the level of the Board’s compliance with the provisions of the CBN Code, relevant legislation as well as global Best Practice and covered the following seven key corporate governance themes:
We considered seven key corporate governance indicators as follows:
1. Board Structure and Composition 2. Strategy and Planning 3. Board Operations and Effectiveness 4. Measuring and Monitoring of Performance 5. Risk Management and Compliance 6. Corporate Citizenship; and 7. Transparency and Disclosure.
Following our review of the corporate governance standards and processes, we affirm that the Board has complied with the provisions of the CBN Code and other relevant corporate governance best practices. The Peer Assessment undertaken indicate that individual Directors performed satisfactorily against the parameters used for the appraisal and remained committed to enhancing the Bank’s growth.
We note the commitment and commendable performance of the Board during the period under review and that it is in the process of finalizing the appointment of an additional Independent Director for the Bank in compliance with the provisions of Section 2.2.4 of the CBN Code of Corporate Governance.
Other recommendations are contained in our detailed Report.
Yours faithfully, For: DCSL Corporate Services Limited
Bisi Adeyemi Managing Director

2016 ANNUAL REPORT 51
STATEMENT OF RESPONSIBILITY AND APPROVALFOR THE YEAR ENDED 31 DECEMBER 2016
RESPONSIBILITY FOR ANNUAL FINANCIAL STATEMENTS
In accordance with the provisions of the Companies and Allied Matters Act and the Banks and Other Financial Institutions
Act, the directors are responsible for the preparation of the annual financial statements which give a true and fair view of the
state of affairs of the Group at the end of the year and of the financial performance and cashflows for the year then ended.
The responsibilities include ensuring that:
i. the Group keeps proper accounting records that disclose, with reasonable accuracy, the financial position of the Group and
comply with the requirements of the Companies and Allied Matters Act and the Banks and Other Financial Institutions Act;
ii. appropriate and adequate internal controls are established to safeguard its assets and to prevent and detect fraud and
other irregularities;
iii. the Group prepares its financial statements using suitable accounting policies supported by reasonable and prudent
judgements and estimates, that are consistently applied; and
iv. it is appropriate for the financial statements to be prepared on a going concern basis.
The directors accept responsibility for the annual financial statements, which have been prepared using appropriate
accounting policies supported by reasonable and prudent judgements and estimates, in conformity with,
- International Financial Reporting Standards;
- Prudential Guidelines for Licensed Banks;
- Relevant circulars issued by the Central Bank of Nigeria;
- The requirements of the Banks and Other Financial Institutions Act;
- The requirements of the Companies and Allied Matters Act; and
- The requirements of the Financial Reporting Council of Nigeria Act.
The directors are of the opinion that the financial statements give a true and fair view of the state of the financial position of
the Group and of its financial performance and cash flows for the year.
The directors further accept responsibility for the maintenance of accounting records that may be relied upon in the
preparation of financial statements, as well as adequate systems of internal financial control.
Nothing has come to the attention of the directors to indicate that the Group will not remain a going concern for at least
twelve months from the date of this statement.
SIGNED ON BEHALF OF THE BOARD OF DIRECTORS BY:
MR. OLAYEMI CARDOSO MR. AKINSOWON DAWODU
CHAIRMAN MANAGING DIRECTOR
FRC/2013/CISN/00000002200 FRC/2015/CIBN/00000013238
March 20 2017 March 20 2017

52 2016 ANNUAL REPORT
Report on the audit of the financial statement
Our opinion
In our opinion, the consolidated and separate financial statements give a true and fair view of the consolidated and separate
financial position of Citibank Nigeria limited (“the bank”) and its subsidiary (Together “the Group”) as at 31 December 2016,
and of their consolidated and separate financial performance and their consolidated and separate cash flows for the year
then ended in accordance with international Financial Reporting Standards and the requirements of the Companies and
Allied Matters Act, the Banks and other Financial Institution Act and the Financial Reporting Council of Nigeria Act.
What we have audited
Citibank Nigeria Limited’s financial statements comprise:
The consolidated and separated statements of financial position as at 31 December 2016;
The consolidated and separated statements of comprehensive income for the year then ended;
The consolidated and separated statements of profit and loss;
The consolidated and separated statements of changes in equity for the year ended;
The consolidated and separated statements of cash flows for the year then ended; and
The noted to the consolidated and separate financial statement, which include a summary of significant accounting
policies.
Basis for opinion
We conducted our audit in accordance with International Standard on Auditing (ISAs). Our responsibilities under those
standards are further described in the Auditor’s responsibilities for the audit of the financial statements section in our
report.
We believe that the audit evidence we have obtained is sufficient and appropriate to provide a basis for our opinion.
Independence
We are independent of the bank in accordance with the International Ethics Standard Board for Accountants’ Code of Ethics
for Professional Accountants (IESBA Code). We have fulfilled our other ethical responsibilities in accordance with the IESBA
Code.
Key audit matters
Key audit matters are those matters that, in our professional judgement, were of most significance in our audit of the
consolidated and separate financial statements of the current period. These matters were addresses in the context of our
audit of the consolidated and separate financial statements as a whole, and in forming our opinion thereon, and we do not
provide a separate opinion on these matters.
Pricewaterhousecoopers Chartered Accountants, Landmark Towers, 5b Water Corporation Road, Victoria Island, Lagos, Nigeria
INDEPENDENT AUDITOR’S REPORTTO THE MEMBERS OF CITIBANK NIGERIA LIMITED

2016 ANNUAL REPORT 53
Key audit matter
Loan loss reserve assessment (N2.13Billion)
We focussed on this area due to the size of the loans and advances to customers net of impairment balance (N117.6billion) and because it required significant judgement both for the timing and recognition of impairment and the estimation of the size of any such impairment. This is considered a key audit matter in both the consolidated and separate financial statements.
In particular we focussed on:
How impairment events are identified which differs based on the type of lending product and borrower. Judgement is required to determine whether a loss has been incurred, and
How impairments are measured. For specific impairment, management makes assumptions about the future cash flows of the borrower. For collective impairment, an internal rating model developed by management is used to assess the credit quality and measure the default risk of borrowers. Management’s assumption in arriving at the risk rating in the model is subjective and sensitive to the changes in economic and credit conditions across the different sectors and industries that borrowers operate in.
See note 13 and 21 to the consolidated and separate financial statements.
How our audit addressers the key audit matter
We understood and tested key controls around the identification of impairment events, the governance controls over the impairment processes and the review process that management has in place for the outputs of the bank’s impairment models.
We applied a risk based target testing approach in selecting a sample of credit facilities, comprising significant and non-significant facilities, for detailed reviews of related customer files and account statements. Our reviews, which include checking the details of the borrowers and the account history, the nature of the facility, the borrower industry and the borrowers’ capacity to repay, was to enable us form our own judgement as to whether management’s identification of loans as potentially impaired we appropriate.
Where impairment was individually assessed, we considered whether key judgements were appropriate given the borrowers’ circumstances and formed our own judgement about the reasonableness of the specific impairment charge.
Where impairment was calculated on a modelled basis, we reviewed the reasonableness of management’s assumptions with respect to other inputs into the incurred loss model. We then verified the accuracy of the inputs and recalculated the collective impairment amount based on the incurred loss model.
With respect to the loan loss provisioning required by the CBN Prudential Guidelines, we obtained the expected CBN provision from management. We checked that the excess of the regulatory provision over that required by IFRS has been recognized as regulatory reserve
Independent Auditor’s Report

54 2016 ANNUAL REPORT
Key audit matter
Valuation of derivatives (N28.28Billion)
Due to their nature and terms, the valuations of derivatives
are based on management estimates and judgements. As
a result, changes to key inputs in the estimates and/or the
judgements made can result in a material change to the
valuation of the derivatives.
This matter is considered a key audit matter in the
consolidated and separate financial statements.
See note 19 to the consolidated and separate financial
statements.
How our audit addressers the key audit matter
Our audit work included valuing a sample of the derivatives
using independent models and source data and comparing
the results to the Group’s valuations and the investigation of
any significant differences.
For instruments with significant, unobservable valuation
inputs, our valuation experts developed an independent
point estimate to evaluate management’s estimate, based
on reasonable market indicators and assumptions.
Other information
The directors are responsible for other information. The other information comprises Directors’ report, Corporate Governance
report, statement of directors responsibilities, board performance review, statement of value added and consolidated five year
financial summary (but does not include the consolidated and separate financial statements and our auditors report thereon)
which we obtained prior to the date of the auditor’s report.
Our opinion on the financial statements does not cover the other information and we do not and will not express any form
of assurance conclusion thereon.
In connection with our audit of the financial statements, our responsibility is to read the other information identified above
in and, and in doing so, consider whether the other information is materially inconsistent with the financial statements or our
knowledge obtained in the audit, or otherwise appears to be materially misstated, if, based on the work we have performed o
the information that we obtained prior to the date of this auditors report, we conclude that there is a material misstatement of
this information, we are required to report that fact. We have nothing to report in this regard.
Responsibility of the director and those charged with governance for the consolidated and separate financial statements
The directors are responsible for the preparation of the consolidated and separate financial statements that give a true and fair
view in accordance with International Finance Reporting Standards and the requirements of the Companies And Allied Matters
Act, The Finance Reporting Council of Nigeria Act, the Banks and Other Financial Institutions Act, and for such internal control
as the directors determine is necessary to enable the preparation of consolidated and separate statements that are free from
material misstatement, whether due to fraud or error.
In preparing the consolidated and separate financial statements, the directors are responsible for accessing the Group’s ability
to continue as a going concern, disclosing, as applicable, matter related to going concern and using the going concern basis of
accounting unless the directors either intend to liquidate the Group or to cease operations, or has no realistic alternative but
to do so.
Independent Auditor’s Report

2016 ANNUAL REPORT 55
Those charged with governance are responsible for overseeing the Group’s financial reporting process
Auditor’s responsibilities for the audit of the consolidated and separate financial statements
Our objectives are to obtain reasonable assurance about whether the consolidated and separate financials statements
as a whole are free from material misstatement, whether due to fraud or error, and to issue an auditor’s report that
include our opinion. Reasonable assurance is a high level of assurance, but it is not a guarantee that an audit conducted
in accordance ISAs will always detect a material misstatement when it exists. Misstatements can arise from fraud or
error and are considered material if, individually or in the aggregate, they could reasonably be expected to influence the
economic decisions of user taken on the basis of these consolidated and separate financial statements.
As part of an audit in accordance with ISAs, we exercise professional judgement and maintain professional scepticism
throughout the audit. We also:
Identify and assess the risks of material misstatement of the consolidated and separate financial statements,
whether due to fraud or error, design and perform audit procedures responsive to risks, and obtain audit evidence
that is sufficient and appropriate to provide a basis for our opinion. The risk of not detecting a material misstatement
resulting from fraud is higher than one resulting from error, as fraud may involve collusion, forgery, intentional
omissions, misrepresentations, or the override of internal control.
Obtain an understanding of internal control relevant to the audit in order to design audit procedures that are
appropriate in the circumstances, but not for the purpose of expressing an opinion on the effectiveness of the
Group’s internal control.
Evaluate the appropriateness of accounting policies used and the reasonableness of accounting estimates and
related disclosures made by directors.
Conclude on the appropriateness of the directors’ use of the going concern basis of accounting and, based on
the audit evidence obtained, whether a material uncertainty exists related to events or conditions that may cast
significant doubt on the Group’s ability to continue as a going concern. If we conclude that a material uncertainty
exists, we arte required to draw attention in our auditor’s report to the related disclosures in the consolidated and
separate financial statements or, if such disclosures are inadequate, to modify our opinion. Our conclusions are
based on the audit evidence obtained up to the date of our auditors report. However, future events or conditions
may cause the Group to cease to continue as a going concern.
Evaluate the overall presentation, structure and content of the consolidated and separate financial statements,
including the disclosures, and whether the consolidated and separate financial statements represent the underlying
transactions and events in a manner that achieves fair presentation.
Independent Auditor’s Report

56 2016 ANNUAL REPORT
Obtain sufficient appropriate audit evidence regarding the financial information of the entities or business
activities within the Group to express an opinion on the consolidated financial statements. We are responsible
for the direction, supervision and performance of the group audit. We remain solely responsible for our audit
opinion.
We communicate with those charged with governance regarding, among other matters, the planned scope and
timing of the audit and significant6 audit findings, including any significant deficiencies in internal control that we
identity during our audit.
From the matters communicated with those charged with governance, we determine those matters that were of
most significance in the audit of the consolidated and separate financial statements of the current period and are
therefore the key audit matters. We describe these matters in our auditors report unless law or regulations precludes
public disclosures about the matter or when, is extremely rare circumstances, we determine that a matter should
not be communicated in our report because the adverse consequences of doing so would reasonably be expected to
outweigh the public interest benefits of such communication.
Report on other legal and regulatory requirements
The Companies and Allied Matter Act and The Bank and Other Financial Institutions Act require that in carrying out
our audit we consider and report to you the following matters. We confirm that:
i we have obtained all the information and explanation, which is to the best of our knowledge and belief, were
necessary for the purpose of our audit;
ii the bank has kept proper books account, so far as appears from the examination of those books and returns
adequate for our audit have been received from branches not visited by us;
iii the bank’s statements of financial position, income statement and statement of comprehensive income are in
agreement with the books of account.
iv the information required by Central Bank of Nigeria Circular BSD/1/2004 on insider related credits is disclosed in
Note 34.3 to the financial statement;
v except for the contraventions disclosed in Note 39 to the financial statements, the bank has complied with the
requirements of the relevant circulars issued by the Central Bank Of Nigeria.
For: Pricewaterhousecoopers
Chartered Accountants
Lagos Nigeria
Engagement Partner; Patrick Obianwa
FRC/2013/CIAN/00000000880
March 20, 2017
Independent Auditor’s Report
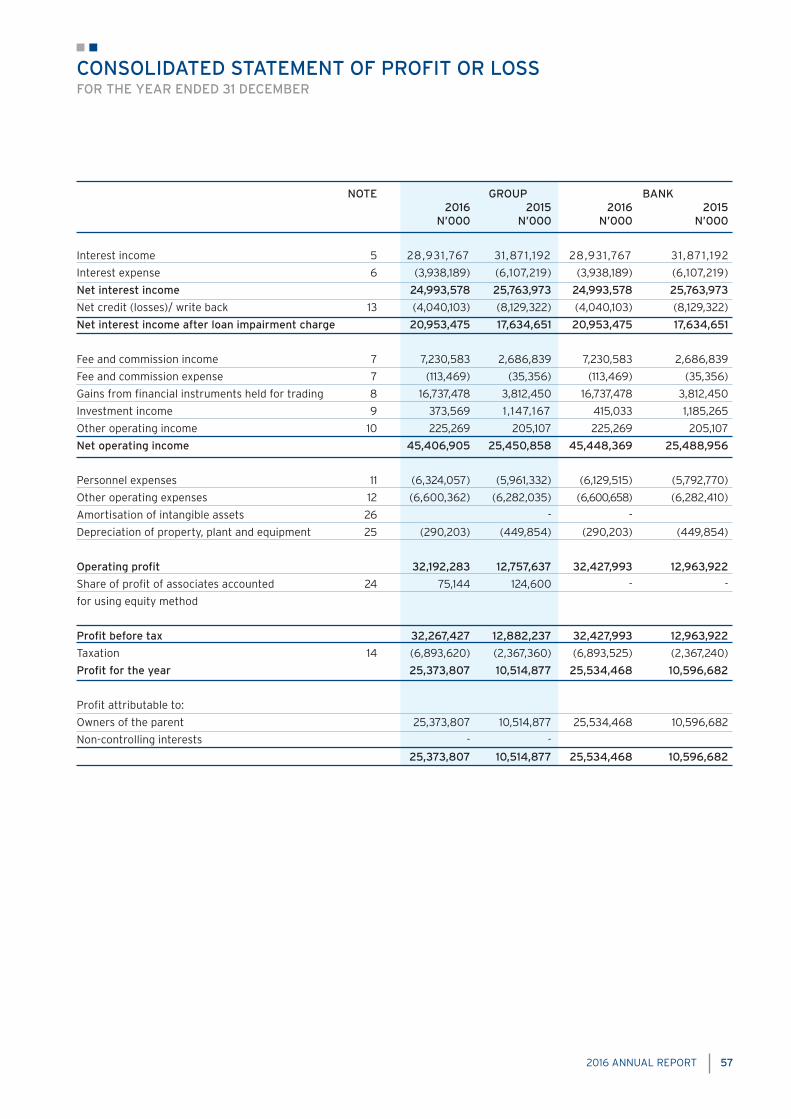
2016 ANNUAL REPORT 57
CONSOLIDATED STATEMENT OF PROFIT OR LOSSFOR THE YEAR ENDED 31 DECEMBER
NOTE GROUP BANK 2016 2015 2016 2015 N’000 N’000 N’000 N’000
Interest income 5 28,931 ,767 31,871,192 28,931 ,767 31,871,192
Interest expense 6 (3,938,189) (6,107,219) (3,938,189) (6,107,219)
Net interest income 24,993,578 25,763,973 24,993,578 25,763,973
Net credit (losses)/ write back 13 (4,040,103) (8,129,322) (4,040,103) (8,129,322)
Net interest income after loan impairment charge 20,953,475 17,634,651 20,953,475 17,634,651
Fee and commission income 7 7,230,583 2,686,839 7,230,583 2,686,839
Fee and commission expense 7 (113,469) (35,356) (113,469) (35,356)
Gains from financial instruments held for trading 8 16,737,478 3,812,450 16,737,478 3,812,450
Investment income 9 373,569 1 ,147,167 415,033 1,185,265
Other operating income 10 225,269 205,107 225,269 205,107
Net operating income 45,406,905 25,450,858 45,448,369 25,488,956
Personnel expenses 11 (6,324,057) (5,961,332) (6,129,515) (5,792,770)
Other operating expenses 12 (6,600,362) (6,282,035) (6,600,658) (6,282,410)
Amortisation of intangible assets 26 - -
Depreciation of property, plant and equipment 25 (290,203) (449,854) (290,203) (449,854)
Operating profit 32,192,283 12,757,637 32,427,993 12,963,922
Share of profit of associates accounted 24 75,144 124,600 - -
for using equity method
Profit before tax 32,267,427 12,882,237 32,427,993 12,963,922
Taxation 14 (6,893,620) (2,367,360) (6,893,525) (2,367,240)
Profit for the year 25,373,807 10,514,877 25,534,468 10,596,682
Profit attributable to:
Owners of the parent 25,373,807 10,514,877 25,534,468 10,596,682
Non-controlling interests - -
25,373,807 10,514,877 25,534,468 10,596,682
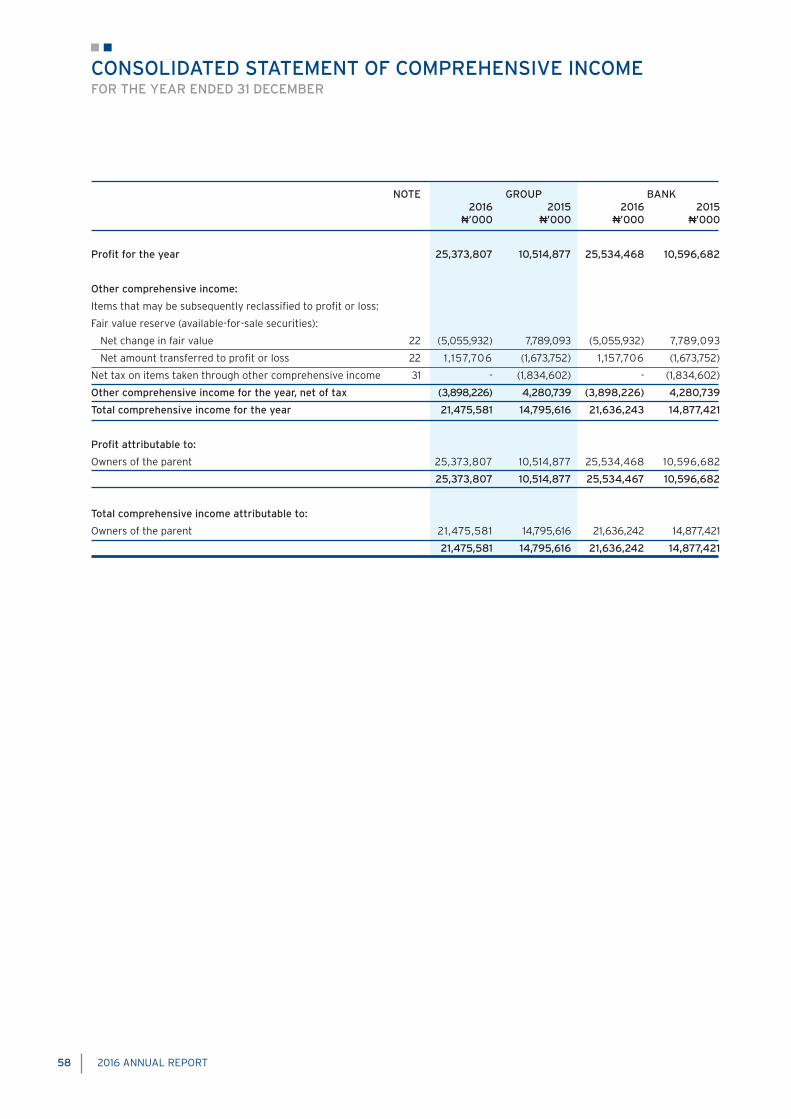
58 2016 ANNUAL REPORT
CONSOLIDATED STATEMENT OF COMPREHENSIVE INCOMEFOR THE YEAR ENDED 31 DECEMBER
NOTE GROUP BANK 2016 2015 2016 2015 N’000 N’000 N’000 N’000
Profit for the year 25,373,807 10,514,877 25,534,468 10,596,682
Other comprehensive income:
Items that may be subsequently reclassified to profit or loss:
Fair value reserve (available-for-sale securities):
Net change in fair value 22 (5,055,932) 7,789,093 (5,055,932) 7,789,093
Net amount transferred to profit or loss 22 1 ,157,706 (1,673,752) 1,157,706 (1,673,752)
Net tax on items taken through other comprehensive income 31 - (1,834,602) - (1,834,602)
Other comprehensive income for the year, net of tax (3,898,226) 4,280,739 (3,898,226) 4,280,739
Total comprehensive income for the year 21,475,581 14,795,616 21,636,243 14,877,421
Profit attributable to:
Owners of the parent 25,373,807 10,514,877 25,534,468 10,596,682
25,373,807 10,514,877 25,534,467 10,596,682
Total comprehensive income attributable to:
Owners of the parent 21,475,581 14,795,616 21,636,242 14,877,421
21,475,581 14,795,616 21,636,242 14,877,421
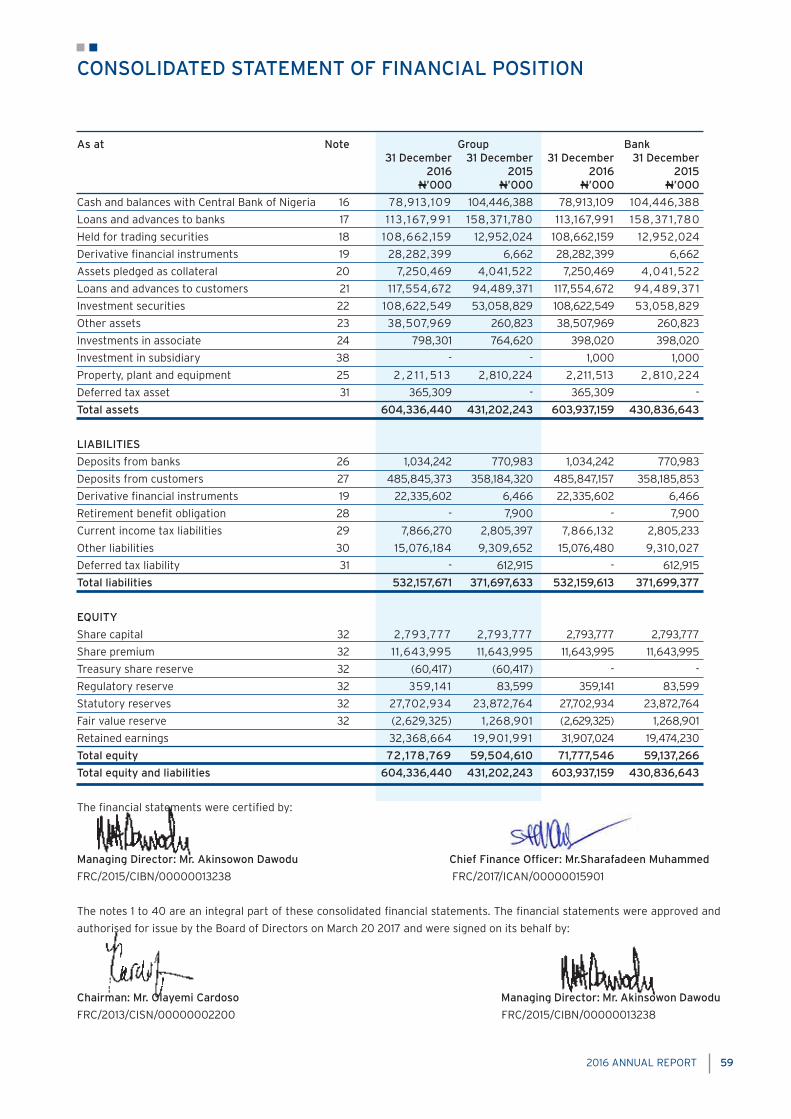
2016 ANNUAL REPORT 59
CONSOLIDATED STATEMENT OF FINANCIAL POSITION
As at Note Group Bank 31 December 31 December 31 December 31 December 2016 2015 2016 2015 N’000 N’000 N’000 N’000
Cash and balances with Central Bank of Nigeria 16 78,913,109 104,446,388 78,913,109 104,446,388
Loans and advances to banks 17 1 13 ,167,99 1 158,371,780 113,167,991 158,371 ,780
Held for trading securities 18 108,662,159 12,952,024 108,662,159 12,952,024
Derivative financial instruments 19 28,282,399 6,662 28,282,399 6,662
Assets pledged as collateral 20 7,250,469 4,041,522 7,250,469 4,041,522
Loans and advances to customers 21 117,554,672 94,489,371 117,554,672 94,489,371
Investment securities 22 108,622,549 53,058,829 108,622,549 53,058,829
Other assets 23 38,507,969 260,823 38,507,969 260,823
Investments in associate 24 798,301 764,620 398,020 398,020
Investment in subsidiary 38 - - 1,000 1,000
Property, plant and equipment 25 2 , 2 1 1 , 5 1 3 2,810,224 2,211,513 2 ,810,224
Deferred tax asset 31 365,309 - 365,309 -
Total assets 604,336,440 431,202,243 603,937,159 430,836,643
LIABILITIES
Deposits from banks 26 1,034,242 770,983 1,034,242 770,983
Deposits from customers 27 485,845,373 358,184,320 485,847,157 358,185,853
Derivative financial instruments 19 22,335,602 6,466 22,335,602 6,466
Retirement benefit obligation 28 - 7,900 - 7,900
Current income tax liabilities 29 7,866,270 2,805,397 7,866,132 2,805,233
Other liabilities 30 15,076,184 9,309,652 15,076,480 9,310,027
Deferred tax liability 31 - 612,915 - 612,915
Total liabilities 532,157,671 371,697,633 532,159,613 371,699,377
EQUITY
Share capital 32 2,793,777 2,793,777 2,793,777 2,793,777
Share premium 32 11,643,995 11,643,995 11,643,995 11,643,995
Treasury share reserve 32 (60,417) (60,417) - -
Regulatory reserve 32 359,141 83,599 359,141 83,599
Statutory reserves 32 27,702,934 23,872,764 27,702,934 23,872,764
Fair value reserve 32 (2,629,325) 1,268,901 (2,629,325) 1,268,901
Retained earnings 32,368,664 19,901,991 31,907,024 19,474,230
Total equity 72,178,769 59,504,610 71,777,546 59,137,266
Total equity and liabilities 604,336,440 431,202,243 603,937,159 430,836,643
The financial statements were certified by:
Managing Director: Mr. Akinsowon Dawodu Chief Finance Officer: Mr.Sharafadeen Muhammed
FRC/2015/CIBN/00000013238 FRC/2017/ICAN/00000015901
The notes 1 to 40 are an integral part of these consolidated financial statements. The financial statements were approved and
authorised for issue by the Board of Directors on March 20 2017 and were signed on its behalf by:
Chairman: Mr. Olayemi Cardoso Managing Director: Mr. Akinsowon Dawodu
FRC/2013/CISN/00000002200 FRC/2015/CIBN/00000013238
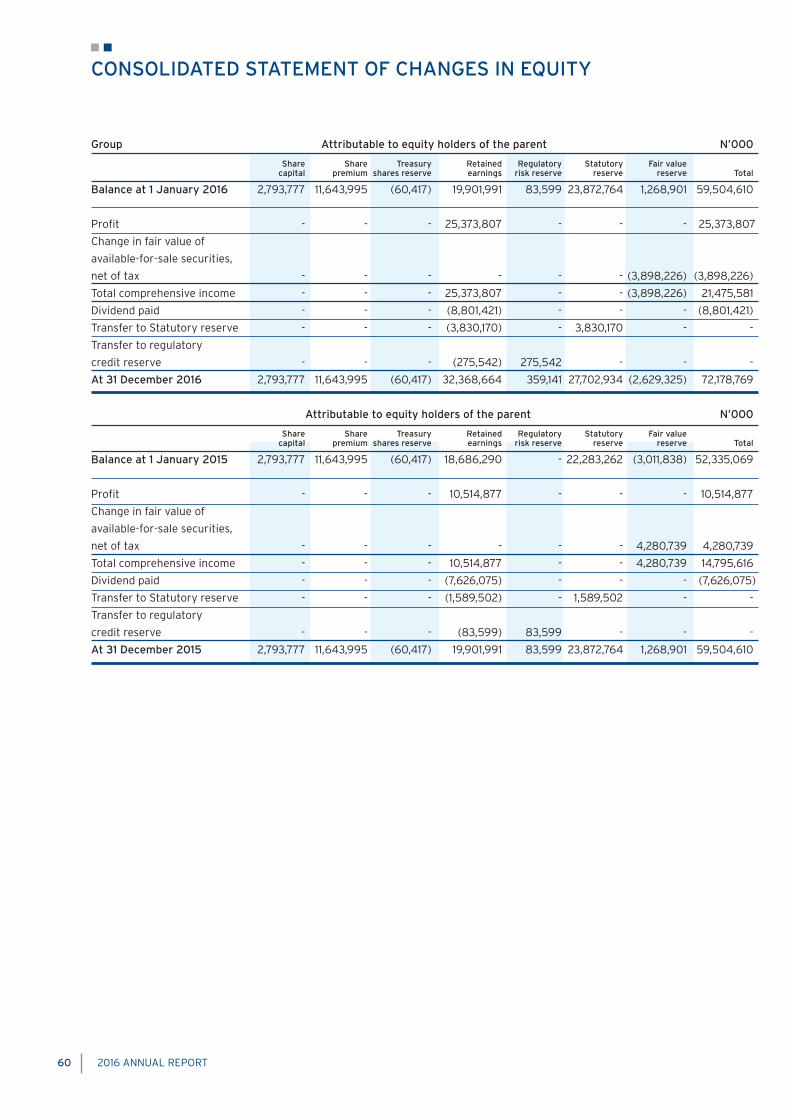
60 2016 ANNUAL REPORT
CONSOLIDATED STATEMENT OF CHANGES IN EQUITY
Group Attributable to equity holders of the parent N’000 Share Share Treasury Retained Regulatory Statutory Fair value capital premium shares reserve earnings risk reserve reserve reserve Total
Balance at 1 January 2016 2,793,777 11,643,995 (60,417) 19,901,991 83,599 23,872,764 1,268,901 59,504,610
Profit - - - 25,373,807 - - - 25,373,807
Change in fair value of
available-for-sale securities,
net of tax - - - - - - (3,898,226) (3,898,226)
Total comprehensive income - - - 25,373,807 - - (3,898,226) 21,475,581
Dividend paid - - - (8,801,421) - - - (8,801,421)
Transfer to Statutory reserve - - - (3,830,170) - 3,830,170 - -
Transfer to regulatory
credit reserve - - - (275,542) 275,542 - - -
At 31 December 2016 2,793,777 11,643,995 (60,417) 32,368,664 359,141 27,702,934 (2,629,325) 72,178,769
Attributable to equity holders of the parent N’000
Share Share Treasury Retained Regulatory Statutory Fair value capital premium shares reserve earnings risk reserve reserve reserve Total
Balance at 1 January 2015 2,793,777 11,643,995 (60,417) 18,686,290 - 22,283,262 (3,011,838) 52,335,069
Profit - - - 10,514,877 - - - 10,514,877
Change in fair value of
available-for-sale securities,
net of tax - - - - - - 4,280,739 4,280,739
Total comprehensive income - - - 10,514,877 - - 4,280,739 14,795,616
Dividend paid - - - (7,626,075) - - - (7,626,075)
Transfer to Statutory reserve - - - (1,589,502) - 1,589,502 - -
Transfer to regulatory
credit reserve - - - (83,599) 83,599 - - -
At 31 December 2015 2,793,777 11,643,995 (60,417) 19,901,991 83,599 23,872,764 1,268,901 59,504,610

2016 ANNUAL REPORT 61
BANK STATEMENT OF CHANGES IN EQUITY
Parent Attributable to equity holders of the parent N’000 Share Share Retained Regulatory Statutory Fair value capital premium earnings risk reserve reserve reserve Total
Balance at 1 January 2016 2,793,777 11,643,995 19,474,230 83,599 23,872,764 1,268,901 59,137,266
Profit - - 25,534,468 - - - 25,534,468
Change in fair value of
available-for-sale securities,
net of tax - - - - - (3,898,226) (3,898,226)
Total comprehensive income - - 25,534,467 - - (3,898,226) 21,636,242
Dividend paid - - (8,995,962) - - - (8,995,962)
Transfer to Statutory reserve - - (3,830,170) - 3,830,170 - -
Transfer from regulatory credit reserve (275,542) 275,542 -
At 31 December 2016 2,793,777 11,643,995 31,907,024 359,141 27,702,934 (2,629,325) 71,777,546
Attributable to equity holders of the bank N’000
Share Share Retained Regulatory Statutory Fair value capital premium earnings risk reserve reserve reserve Total
Balance at 1 January 2015 2,793,777 11,643,995 18,345,288 - 22,283,262 (3,011,838) 52,054,484
Profit - - 10,596,682 - - - 10,596,682
Change in fair value of
available-for-sale securities,
net of tax - - - - - 4,280,739 4,280,739
Total comprehensive income - - 10,596,682 - - 4,280,739 14,877,421
Dividend paid - - (7,794,637) - - - (7,794,637)
Transfer to Statutory reserve - - (1,589,502) 1,589,502 - -
Transfer from regulatory credit reserve (83,599) 83,599 -
At 31 December 2015 2,793,777 11,643,995 19,474,230 83,599 23,872,764 1,268,901 59,137,266

62 2016 ANNUAL REPORT
CONSOLIDATED STATEMENT OF CASHFLOWS
For the year ended Note Group Bank
31 December 31 December 31 December 31 December
2016 2015 2016 2015
N’000 N’000 N’000 N’000
Cash flows from operating activities
Profit before tax 32,267,426 12,882,237 32,427,993 12,963,922
Adjustment for non-cash items
Depreciation and amortisation 25 290,203 449,854 290,203 449,854
Fair value gains on trading securities (MTM) 8 (8,136,081) (3,911 ,573) (8,136,081) (3,911,573)
Loan loss provision 13 4,040,103 8 ,1 3 1 , 375 4,040,103 8 ,131 , 375
Unrealised exchange gains on revaluation (6,290,373) 1 ,616,224 (6,290,373) 1,616,224
Interest income 5 (28,541,730) (31,871,192) (28,541,730) (31,871,192)
Interest expense 6 3,938,188 6 , 1 0 7, 2 1 9 3,938,188 6 ,107,219
(Gains)/ loss on disposal of PPE 10 7,658 (17,217) 7,658 17,217
Share of profit in associate 38 (33,680) (86,503) - -
Dividend received 9 (27,448) (73,138) (68,913) (73,138)
Impairment of equity securities 645 - 645 -
Provision for litigation 30 50,000 364,700 50,000 364,700
(2,435,090) (6,408,014) (2,282,307) (6,205,392)
Changes in operating assets and liabilities
Change in restricted cash (13,425,380) (16,875,996) (13,425,380) (16,875,996)
Change in loans & advances 35, 312 ,557 (14,662,267) 35,312,557 (14,662,267)
Increase in trading securities (88,972,025) (9,967,229) (88,972,025) (9,967,229)
(Increase)/ decrease in derivative
financial instruments - assets (24,347,356) 5,344,361 (24,347,356) 5,344,361
Increase in assets pledged as collaterals (3,208,947) (254,099) (3,208,947) (254,099)
(Increase)/ decrease in other assets (38,247,146) 1 , 299,2 17 (38,247,146) 1 ,299,217
Increase/ (decrease) in deposits from banks 256,550 (47,156,653) 256,550 (47,156,653)
Increase in deposits from customers 36 ,819,823 67,121,225 36,820,074 67,121 ,370
Increase/ (decrease) in derivative
financial instruments - liability 22 , 329,1 36 (274,115) 22 , 329,136 (274,115)
(Decrease)/ increase in retirement benefit obligation (7,900) 315 (7,900) 315
Increase in other liabilities 5 ,7 16 ,532 4,004,999 5,716,449 4,005,108
(67,774,155) (11,420,241) (67,773,987) (11,419,987)
Interest received 28 , 1 76 ,0 8 1 30,986,183 28 ,1 76 ,0 8 1 30,986,183
Interest paid (4,389,521) (6,276,655) (4,389,521) (6,276,655)
Income tax paid (2,810,969) (2,367,360) (2,810,848) (2,367,240)
Net cashflows (used in)/ from operating activities (49,233,654) 4,513,913 (49,080,582) 4,716,908
Cash flows from investing activities
Purchase of Property, plant & equipment 25 (76,459) (504,674) (76,459) (504,674)
Purchase of Investment securities (112,328,017) (11,800,813) (112,328,017) (11,800,813)
Proceed from disposal of investment securities 52,832,965 69,840,189 52,832,972 69,840,189
Proceed from sale of trading securities 2 , 3 1 1 , 0 24 1 , 5 1 7, 1 0 1 2 , 3 1 1 ,024 1 , 5 1 7, 1 0 1
Proceed from sale of property, plant and equipment 377,310 19,704 377,310 2,487
Dividend received 9 27,448 90,355 68,913 73,138
Net cash (used in)/ from investing activities (56,855,729) 59,161 ,861 (56,814,258) 59,127,428
Cash flows from financing activities
Dividend paid (8,801,421) (7,626,075) (8,995,963) (7,794,638)
Net cash used in financing activities (8,801,421) (7,626,075) (8,995,963) (7,794,638)
(Decrease)/ increase in cash & cash equivalent (114,890,804) 56,049,699 (114,890,803) 56,049,699
Cash & cash equivalent at beginning 206,193,9 16 142,954,677 206,193,915 142,954,677
Effect of exchange rate changes on
cash and cash equivalents 38,900,201 7,189,540 38,900,201 7,189,540
Cash & cash equivalent at end of period 37 130,203,313 206,193,916 130,203,313 206,193,916
2016 ANNUAL REPORT 63
NOTES TO THE ANNUAL FINANCIAL STATEMENTSAT 31 DECEMBER 2016
1. General information
Citibank Nigeria Limited (“the Bank”) is a company domiciled in Nigeria. The Bank was incorporated in Nigeria under the
Companies and Allied Matters Act as a private limited liability company on 2 May 1984. It was granted a license on 14
September 1984 to carry on the business of commercial banking and commenced business on 14 September 1984. The
address of the Bank’s registered office is 27 Kofo Abayomi Street, Victoria Island, Lagos. These consolidated financial
statements for the year ended 31 December 2016 are prepared for the Bank and its subsidiaries (together, “the Group”).
The Group is primarily involved in commercial banking that includes transactional services, corporate finance, provision of
finance, custodial business and money market and trading activities. The Bank has a subsidiary, Nigeria International Bank
Nominees Limited.
2. Summary of significant accounting policies
2.1 Introduction to the summary of significant accounting policies
The principal accounting policies adopted in the preparation of these consolidated financial statements are set out below.
These policies have been consistently applied to all the years presented, unless otherwise stated.
2.2 Basis of preparation
The consolidated financial statements for the year 2016 have been prepared in accordance with International Financial
Reporting Standards (IFRS) as issued by the International Accounting Standards Board (IASB). Additional information
required by national regulations is included where appropriate.
2.2.1 Basis of measurement
The financial statements are prepared under the historical cost convention, modified to include the fair value of certain
financial instruments to the extent required or permitted under the accounting standards as set out in the relevant accounting
policies.
They have also been prepared in the manner required by the Companies and Allied Matters Act of Nigeria, Banks and Other
Financial Institutions Act of Nigeria, Financial Reporting Council of Nigeria and relevant Central Bank of Nigeria circulars.
2.2.2 Use of estimates and judgments
The preparation of financial statements in conformity with IFRS requires management to make judgements, estimates
and assumptions that affect the application of policies and reported amounts of assets and liabilities and disclosures of
contingent assets and liabilities at the date of the financial statements and the reported amounts of revenues and expenses
during the reported period. The estimates and assumptions are based on management’s best knowledge of current events,
actions, historical experience and various other factors that are believed to be reasonable under the circumstances, the
results of which form the basis of making the judgments about the carrying values of assets and liabilities that are not
readily apparent from other sources. Actual results may differ from these estimates.
The estimates and underlying assumptions are reviewed on an ongoing basis. Revisions to accounting estimates are
recognised in the period in which the estimate is revised if the revision affects only that period or in the period of the revision
and future periods if the revision affects both current and future periods. Information about significant areas of estimation
uncertainties and critical judgments in applying accounting policies that have the most significant effect on the amounts
recognised in the financial statements are described in note 3.
2.2.3 Changes in accounting policies and disclosures
i) New and amended standards adopted by the group for the first time for the financial year beginning on or after 1
January 2016
Standards and interpretations effective during the reporting period.
ii) New standards and interpretations effective during the period

64 2016 ANNUAL REPORT
Amendments to the following standard(s) became effective in the reporting period from 1st January, 2016.
The amendments applicable to the Group are:
Amendment to IAS 1- Presentation of financial statements
Amendment to IAS 1 is to clarify guidance on materiality and aggregation, the presentation of subtotals,the
structure of financial statements and the disclosure of accounting policies
These amendments are intended to assist entities in applying judgment when meeting the presentation and disclosure
requirements in IFRS, and do not affect recognition and measurement. The Group has assessed the impact on its financial
statement and has decided to consistently maintain the current presentation format in this set of financial statements.
Amendment to IAS 27 - Presentation of financial statements
Amendment to IAS 27 is to restore the option to use the equity method to account for investments in subsidiaries, joint
ventures and associates in an entity’s separate financial statements. The bank only has investments in subsidiaries which it
accounts for using the cost method, one of the allowable methods of accounting for investments in subsidiaries.
Amendment to IAS 16 - Property, Plant and Equipment
Amendment to IAS 16 is to clarify that the use of revenue based methods to calculate the depreciation of an asset is not
appropriate because revenue generated by an activity that includes the use of an asset generally reflects factors other
than the consumption of the economic benefit embodied in the asset. The IASB has also clarified that revenue is generally
presumed to be an inappropriate basis for measuring the consumption of the economic benefits in an intangible asset. The
Group’s property, plant and equipment are depreciated using the straight line method.
Amendment to IAS 28 - Investment in Associates and Joint ventures
The amendment allow the investor, when applying the equity method, to retain the fair value measurement applied by the
investment entity associate or joint venture to its interests in subsidiaries.
Furthermore, the amendments also clarify that a full gain or loss is recognised when a transfer to an associate or joint venture
involves a business as defined in IFRS 3 Business Combinations. Any gain or loss resulting from the sale or contribution of
assets that does not constitute a business, however, is recognised only to the extent of unrelated investors’ interests in the
associate or joint venture. The Group uses equity method to consolidate transactions with its associate.
iii) New standards and interpretations not yet effective
Up to the date of issue of these financial statements, the IASB has issued a number of amendments, new standards and
interpretations which are not yet effective for the year ended 31 December 2016 and which have not been adopted in these
financial statements.
Standard/Interpretation Effective Date
Amendments to IAS 12 Income Taxes 01-Jan-17
IFRS 15 Revenue from Contracts with Customers 01-Jan-18
Amendments to IAS 7 Statement of Cash Flows 01-Jan-17
IFRS 9 Financial instruments 01-Jan-18
IFRS 16 Leases 01-Jan-19
*Citibank will adopt all Standards and Interpretations at their effective dates as stated.
Commentaries on these new standards/amendments are provided below
Notes to the Annual Financial Statements

2016 ANNUAL REPORT 65
Notes to the Annual Financial Statements
Amendments to IAS 12 - Income Taxes
Amendment to IFRS 12 is to clarify accounting treatment for deferred tax assets for unrealised losses on debt instruments
measured at fair value. The amendments clarify that an entity needs to consider whether tax law restricts the sources of
taxable profits against which it may make deductions on the reversal of that deductible temporary difference. Furthermore,
the amendments provide guidance on how an entity should determine future taxable profits and explains in which
circumstances taxable profit may include the recovery of some assets for more than their carrying amount. Citibank is yet
to assess the impact.
IFRS 15 - Revenue from Contracts with Customers
IFRS 15 provides a single principle based five-step model to be applied to all contracts with customers.
The five steps in the model are Identification of the contract with the customer, Identification of the performance obligations
in the contract, Determination of the transaction price, Allocation of the transaction price to the performance obligations in
the contracts, and Recognition of revenue when (or as) the entity satisfies a performance obligation. Citibank is yet to assess
the impact.
Amendments to IAS 7 - Statement of Cash Flows
Amendment to IAS 7 is to include disclosures that enable users of financial statements to evaluate changes in liabilities
arising from financing activities. The amendment specifies that the following changes arising from financing activities
are disclosed (to the extent necessary): (i) changes from financing cash flows; (ii) changes arising from obtaining or losing
control of subsidiaries or other businesses; (iii) the effect of changes in foreign exchange rates; (iv) changes in fair values;
and (v) other changes.
Citibank is currently assessing its impact based on future financing plans.
IFRS 9 - Financial instruments
IFRS 9 is part of the IASB’s project to replace IAS 39. It addresses classification, measurement and impairment of financial
assets as well as hedge accounting.
IFRS 9 replaces the multiple classification and measurement models in IAS 39 with a single model that has only three
classification categories: amortised cost, fair value through OCI and fair value through profit or loss. It includes the guidance
on accounting for and presentation of financial liabilities and derecognition of financial instruments which was previously in
IAS 39. Furthermore for non-derivative financial liabilities designated at fair value through profit or loss, it requires that the
credit risk component of fair value gains and losses be separated and included in OCI rather than in the income statement.
IFRS 9 also requires that credit losses expected at the balance sheet date (rather than only losses incurred in the year)
on loans, debt securities and loan commitments not held at fair value through profit or loss be reflected in impairment
allowances. The bank is yet to assess the impact of this change although it is expected to lead to an increased impairment
charge than recognized under IAS 39.
Furthermore, the IASB has amended IFRS 9 to align hedge accounting more closely with an entity’s risk management.
The revised standard establishes a more principle-based approach to hedge accounting and addresses inconsistencies
and weaknesses in the current model in IAS 39. The bank is yet to quantify the impact of these changes on Its financial
statements.
The Bank is currently at the impact assessment phase of the IFRS 9 journey. The focus is on understanding the IFRS 9
financial and operational implications, with outcomes being key inputs to the design and implementation phases. Also, this
phase will help the bank identify any gaps in the implementation of IFRS 9, especially in terms of the people, processes,
technology and controls that will be necessary to drive an effective implementation.

66 2016 ANNUAL REPORT
The Bank expects to enter the Design phase by Q1, 2017. This phase will involve obtaining information from current systems,
adjusting the IT systems to capture the additional data requirements and determination of what constitutes a default and
significant credit loss. By Q4 2017, the bank will be ready for a parallel run of the IFRS 9 and IAS 39 standards.
IFRS 16 - Leases
This is a new standard introduced by IASB to replace existing standard IAS 17 - Leases
IFRS 16 requires lessees to account for all leases under a single on-balance sheet model in a similar way to finance leases
under IAS 17. The standard includes two recognition exemptions for lessees - leases of low-value’ assets (e.g., personal
computers) and short-term leases (i.e., leases with a lease term of 12 months or less). At the commencement date of a lease,
a lessee will recognise a liability to make lease payments (i.e. The lease liability) and an asset representing the right to use
the underlying asset during the lease term (i.e. The right-of-use asset)
Lessees will be required to separately recognise the interest expense on the lease liability and the depreciation expense on
the right-of-use asset. Lessees will be required to remeasure the lease liability upon the occurrence of certain events (e.g.,a
change in the lease term, a change in future lease payments resulting from a change in an index or rate used to determine
those payments). The lessee will generally recognise the amount of the remeasurement of the lease liability as an adjustment
to the right-of-use asset.
Lessor accounting substantially carries forward the lessor accounting requirements in IAS 17. Accordingly,a lessor continues
to classify its leases as operating leases or finance leases, and to account for those two types of leases differently. The bank
is yet to assess the impact of this.
There are no other IFRSs or IFRIC interpretations that are not yet effective that would be expected to have a material impact
on the Group.
2.3 Consolidation
The financial statements of the subsidiaries used to prepare the consolidated financial statements were prepared as of the
parent company’s reporting date.
Subsidiaries
The consolidated financial statements of the Group comprise the financials statements of the parent entity and subsidiary as
at 31 December 2016. Subsidiaries are all entities (including structured entities) over which the group has control. The group
controls an entity when the group is exposed to, or has rights to, variable returns from its involvement with the entity and
has the ability to affect those returns through its power over the entity.
The group financial statements consolidate the financial statements of the Bank and its wholly owned subsidiary company,
NIB Nominees Limited. Subsidiary undertakings of those companies in which the Group, directly or indirectly, has power to
exercise control over their operations, are consolidated.
Structured entities are consolidated where the group has control. The activities of the staff participation scheme has been
consolidated into the financial statements of the Group resulting in the assets of the staff participation scheme, which are
the shares of the bank, being recognised in shareholders equity as Treasury shares (Note 2.14).
Inter-company transactions, balances and unrealised gains on transactions between companies within the Group are
eliminated on consolidation. Unrealised losses are also eliminated in the same manner as unrealised gains, but only to the
extent that there is no evidence of impairment.
The subsidiaries were fully consolidated from the date control was transferred to the Group. The integration of the subsidiaries
into the consolidated financial statements is based on consistent accounting and valuation methods for similar transactions
and other occurrences under similar circumstances.
In the seperate financial statements for the bank, the investment in the subsidiary is carried at cost.
Notes to the Annual Financial Statements

2016 ANNUAL REPORT 67
Notes to the Annual Financial Statements
Associates
Associates are those entities over which the Group has significant influence but not control, generally accompanying a
shareholding between 20% and 50% of the voting rights. In addition, it includes entities where the shareholding is less than
20% but such significant influence can be demonstrated with the existence of representation on the board of directors or
equivalent governing body of the investee.
Investment in associates is accounted for by the equity method of accounting. Under the equity method, the investment is
initially recognised at cost, and the carrying amount is increased or decreased to Recognise the investor’s share of profit or
loss of the investee after the acquisition date.
The Group’s share of post-acquisition profit or loss is recognised in the statement of profit or loss, and its share of post-
acquisition movements in other comprehensive income is recognised in other comprehensive income with the corresponding
adjustment to the carrying amount of the investment. When the Group’s share of losses in an associate equals or exceeds its
interest in the associate, including any other unsecured receivables, the Group does not recognise further losses, unless it
has incurred legal or constructive obligations or made payments on behalf of the associate.
The Group determines at each reporting date whether there is any objective evidence that the investment in the associate
is impaired. If this is the case, the group calculates the amount of impairment as the difference between the recoverable
amount of the associate and its carrying value and recognises the amount adjacent to “share of profit/(loss) of an associate”
in the statement of profit or loss.
In the separate financial statements for the bank, the investment in the associate is carried at cost.
2.4 Segment Reporting
The Group is a private company that has no debt or equity traded in a public market therefore there is no disclosure required
for segment reporting.
2.5 Foreign currency translation
(a) Functional and presentation currency
Items included in the financial statements of each of the Group’s entities are measured using the currency of the primary
economic environment in which the entity operates (‘the functional currency’).The Consolidated financial statements
are presented in Naira, which is the Group’s presentation currency. The figures shown in the consolidated financial
statements are stated in thousands in Naira.
(b) Transactions and balances
Transactions in foreign currencies are translated to Naira at the rates of exchange ruling at the date of each transaction
(or where appropriate the rate of the related forward contracts). Monetary assets and liabilities denominated in foreign
currencies are reported at the rates of exchange prevailing at the statement of financial position date. Any gain or loss
arising from a change in exchange rates subsequent to the date of the transaction is included in the statement of profit
or loss.
Changes in fair value of monetary securities denominated in foreign currency classified as available for sale are
analysed between translation differences resulting from changes in amortised cost of the security and other changes in
the carrying amount of the security. Translation differences related to changes in amortised cost are recognised in the
statement of profit or loss, and other changes in carrying amount are recognised in other comprehensive income.

68 2016 ANNUAL REPORT
2.6 Financial assets and liabilities
In accordance with IAS 39 all financial assets and liabilities have to be recognised in the consolidated statement of financial
position and measured in accordance with their assigned category.
2.6.1 Recognition
The Group initially recognises loans, receivables and deposits on the date that they are originated. Other financial assets and
liabilities that include debt securities and assets and liabilities designated at fair value through profit or loss are recognised
on the basis of settlement date accounting.
All financial instruments are measured initially at their fair value plus transaction costs, except in the case of financial assets
and financial liabilities recorded at fair value through profit or loss. Subsequent recognition of financial assets and liabilities
is at amortised cost or fair value.
2.6.2 Classification
The classification of financial instruments depends on the purpose and management’s intention for which the financial
instruments were acquired and their characteristics. See accounting policies 2.6.11 to 2.6.16.
2.6.3 Derecognition
The Group derecognises a financial asset when the contractual rights to the cash flows from the asset expire, or it transfers
the rights to receive the contractual cash flows on the financial asset in a transaction in which substantially all the risks and
rewards of ownership of the financial asset are transferred. Any interest in transferred financial assets that is created or
retained by the Group is recognised as a separate asset or liability.
The Group derecognises a financial liability when its contractual obligations are discharged or cancelled or expire.
The Group enters into transactions whereby it transfers assets recognised on its statement of financial position, but retains
either all risks and rewards of the transferred assets or a portion of them. If all or substantially all risks and rewards are
retained, then the transferred assets are not derecognised from the statement of financial position. Transfers of assets with
retention of all or substantially all risks and rewards include, secured borrowing and repurchase transactions. Such assets are
reported as Assets pledged as collateral in the statement of financial position.
2.6.4 Offsetting of financial assets and liabilities
Financial assets and liabilities are offset and the net amount reported on the statement of financial position where there is a
legally enforceable right to set-off the recognised amount and there is an intention to settle on a net basis, or to realise the
asset and settle the liability simultaneously.
2.6.5 Sale and repurchase agreements
Securities sold subject to repurchase agreements (‘repos’) are reclassified in the financial statements as assets pledged as
collateral when the transferee has the right by contract or custom to sell or repledge the collateral; the counterparty liability
is included in deposits from banks or deposits from customers, as appropriate. Securities purchased under agreements to
resell (‘reverse repos’) are recorded as loans and advances to other banks or customers, as appropriate. The difference
between sale and repurchase price is treated as interest and accrued over the life of the agreements using the effective
interest method. Securities lent to counterparties are also retained in the financial statements.
2.6.6 Amortised cost measurement
The amortised cost of a financial asset or liability is the amount at which the financial asset or liability is measured at initial
recognition, minus principal repayments, plus or minus the cumulative amortisation using the effective interest method of
any difference between the initial amount recognised and the maturity amount, minus any reduction for impairment.
2.6.7 Fair value measurement
Fair value is the price that would be received from the sale of an asset or paid to transfer a liability in an orderly transaction
between market participants at the measurement date.
Notes to the Annual Financial Statements

2016 ANNUAL REPORT 69
Notes to the Annual Financial Statements
The fair value of trading assets, financial assets held at fair value and available-for-sale assets are based on quoted market
prices, excluding transaction costs. If a quoted market price is not available for the financial assets, the fair value is estimated
using pricing models or discounted cash flow techniques.
Where discounted cash flow techniques are used, estimated future cash flows are based on management’s best estimates and
the discount rate is a market-related rate at the reporting date for a financial asset with similar terms and conditions. Where
pricing models are used, inputs are based on market related measures at the reporting date.
All items for fair valuation are recurring.
2.6.8 Identification and measurement of impairment of financial assets
i) Assets carried at amortised cost
At each reporting date the Group assesses whether there is objective evidence that financial assets are impaired.
Financial assets are impaired when objective evidence demonstrates that a loss event has occurred after the initial
recognition of the asset, and that the loss event has an impact on the future cash flows of the asset that can be
estimated reliably.
The Group considers evidence of impairment at both a specific asset and collective asset level. All individually significant
financial assets are assessed for specific impairment. All significant assets found not to be specifically impaired are then
collectively assessed for any impairment that could be incurred but not yet identified. Assets that are not individually
significant are then collectively assessed for impairment by grouping together financial assets (carried at amortised
cost) with similar risk characteristics.
Objective evidence that financial assets (including equity securities) are impaired can include significant financial
difficulty, default on the facility or probability that the obligor will enter bankruptcy, the disappearance of an active
market for a security, or other observable data relating to a group of assets such as adverse changes in the payment
status of borrowers or issuers in the group, or economic conditions that correlate with defaults in the group.
In assessing collective impairment the Group uses statistical modeling of historical trends of the probability of default,
timing of recoveries and the amount of loss incurred, adjusted for management’s judgment as to whether current
economic and credit conditions are such that the actual losses are likely to be greater or less than suggested by historical
modeling. The collective impairment is determined on a portfolio basis based on the historical loss experience for assets
with credit risk characteristics similar to those in the Group. The loan impairment provision would be based on risk-
rating of obligor and loss norms attached to each risk-rating. The loss norm would have been statistically derived from
historical data.
Impairment losses on assets carried at amortised cost are measured as the difference between the carrying amount of
the financial assets and the present value of estimated cash flows discounted at the assets’ original effective interest
rate. Losses are recognised in statement of profit or loss and reflected in an allowance account against loans and
advances. Interest on the impaired asset continues to be recognised through the unwinding of the discount.
If, in a subsequent period, the amount of the impairment loss decreases and the decrease can be related objectively
to an event occurring after the impairment was recognised (such as an improvement in the obligor’s credit rating), the
previously recognised impairment loss is reversed by adjusting the allowance account. The amount of the reversal is
recognised in the statement of profit or loss.
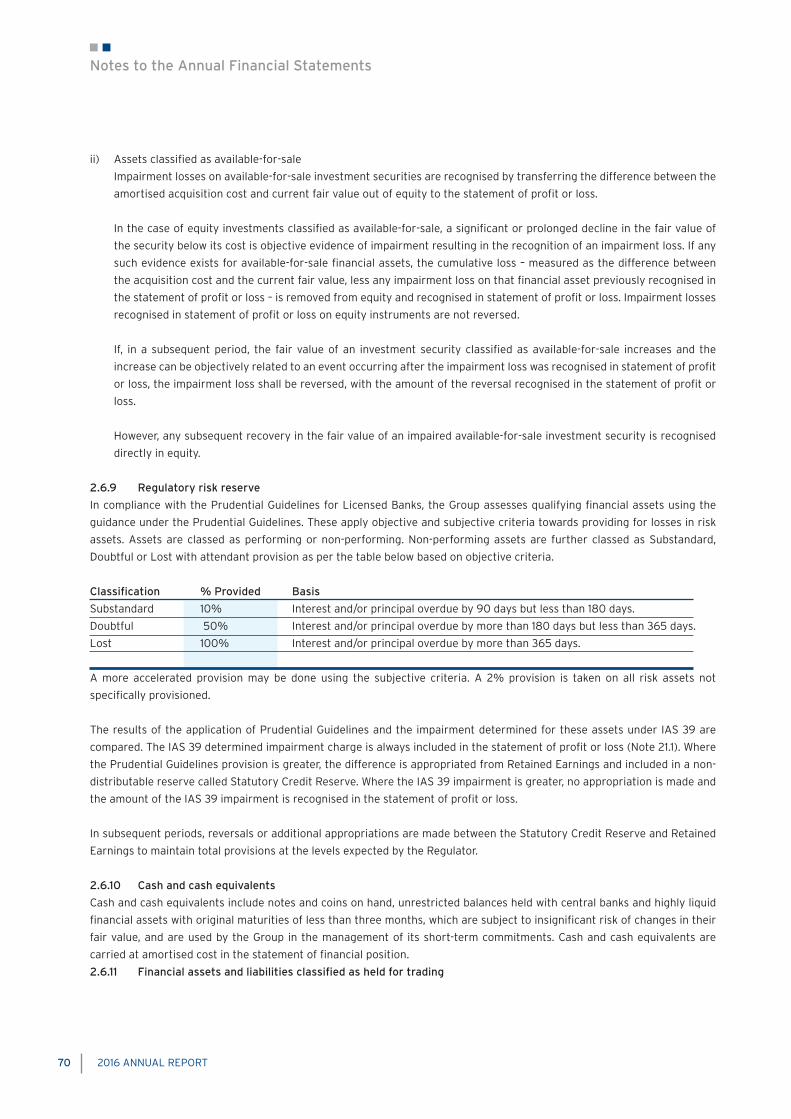
70 2016 ANNUAL REPORT
ii) Assets classified as available-for-sale
Impairment losses on available-for-sale investment securities are recognised by transferring the difference between the
amortised acquisition cost and current fair value out of equity to the statement of profit or loss.
In the case of equity investments classified as available-for-sale, a significant or prolonged decline in the fair value of
the security below its cost is objective evidence of impairment resulting in the recognition of an impairment loss. If any
such evidence exists for available-for-sale financial assets, the cumulative loss – measured as the difference between
the acquisition cost and the current fair value, less any impairment loss on that financial asset previously recognised in
the statement of profit or loss – is removed from equity and recognised in statement of profit or loss. Impairment losses
recognised in statement of profit or loss on equity instruments are not reversed.
If, in a subsequent period, the fair value of an investment security classified as available-for-sale increases and the
increase can be objectively related to an event occurring after the impairment loss was recognised in statement of profit
or loss, the impairment loss shall be reversed, with the amount of the reversal recognised in the statement of profit or
loss.
However, any subsequent recovery in the fair value of an impaired available-for-sale investment security is recognised
directly in equity.
2.6.9 Regulatory risk reserve
In compliance with the Prudential Guidelines for Licensed Banks, the Group assesses qualifying financial assets using the
guidance under the Prudential Guidelines. These apply objective and subjective criteria towards providing for losses in risk
assets. Assets are classed as performing or non-performing. Non-performing assets are further classed as Substandard,
Doubtful or Lost with attendant provision as per the table below based on objective criteria.
Classification % Provided Basis
Substandard 10% Interest and/or principal overdue by 90 days but less than 180 days.
Doubtful 50% Interest and/or principal overdue by more than 180 days but less than 365 days.
Lost 100% Interest and/or principal overdue by more than 365 days.
A more accelerated provision may be done using the subjective criteria. A 2% provision is taken on all risk assets not
specifically provisioned.
The results of the application of Prudential Guidelines and the impairment determined for these assets under IAS 39 are
compared. The IAS 39 determined impairment charge is always included in the statement of profit or loss (Note 21.1). Where
the Prudential Guidelines provision is greater, the difference is appropriated from Retained Earnings and included in a non-
distributable reserve called Statutory Credit Reserve. Where the IAS 39 impairment is greater, no appropriation is made and
the amount of the IAS 39 impairment is recognised in the statement of profit or loss.
In subsequent periods, reversals or additional appropriations are made between the Statutory Credit Reserve and Retained
Earnings to maintain total provisions at the levels expected by the Regulator.
2.6.10 Cash and cash equivalents
Cash and cash equivalents include notes and coins on hand, unrestricted balances held with central banks and highly liquid
financial assets with original maturities of less than three months, which are subject to insignificant risk of changes in their
fair value, and are used by the Group in the management of its short-term commitments. Cash and cash equivalents are
carried at amortised cost in the statement of financial position.
2.6.11 Financial assets and liabilities classified as held for trading
Notes to the Annual Financial Statements
2016 ANNUAL REPORT 71
Notes to the Annual Financial Statements
Trading assets and liabilities are those assets and liabilities that the Group acquires or incurs principally for the purpose of
selling or repurchasing in the near term, or holds as part of a portfolio that is managed together for short-term profit.
Trading assets and liabilities are initially recognised and subsequently measured at fair value in the statement of financial
position with transaction costs recognised in statement of profit or loss. All changes in fair value are recognised as part of
net trading income in statement of profit or loss.
2.6.12 Loans and receivables
Loans and receivables are non-derivative financial assets with fixed or determinable payments that are not quoted in an
active market and that the Group does not intend to sell immediately or in the near term.
When the Group is the lessor in a lease agreement that transfers substantially all of the risks and rewards incidental to
ownership of an asset to the lessee, the arrangement is classified as a finance lease and a receivable equal to the net
investment in the lease is recognised and presented as part of loans and advances to customers.
Loans and advances are initially measured at fair value plus incremental direct transaction costs, and subsequently measured
at their amortised cost using the effective interest method.
2.6.13 Available-for-sale
Available-for-sale investments are non-derivative investments that are not designated as any other category of
financial assets. All available-for-sale investments are carried at fair value.
Interest income is recognised in statement of profit or loss using the effective interest method. Dividend income is
recognised in statement of profit or loss when the Group becomes entitled to the dividend. Foreign exchange gains
or losses on available-for-sale debt investment securities are reclassified in statement of profit or loss.
Other fair value changes are recognised directly in other comprehensive income until the investment is sold or
impaired whereupon the cumulative gains and losses previously recognised in other comprehensive income are
recognised to statement of profit or loss as a reclassification adjustment for non-equity securities, while there will
be no reclassification adjustment to profit or loss in the case of equity securities
A non-derivative financial asset may be reclassified from the available-for-sale category to the loans and receivable
category if it otherwise would have met the definition of loans and receivables and if the Group has the intention
and ability to hold that financial asset for the foreseeable future or until maturity.”
2.6.14 Derivative financial instruments
Derivative financial instruments are recognised initially at fair value on the date which the derivative contract is
entered into and subsequently re-measured at their fair value. Fair values are obtained from quoted market prices
in active markets, including recent market transactions and valuation techniques. All derivatives are carried as
assets when fair value is positive and as liabilities when fair value is negative. Changes in fair value are recognised
immediately in the statement of profit or loss.
Derivatives are valued based on observable market inputs where readily available. However, where any of these
market inputs is not readily available, a derived value can be implied based on what is readily available in the
market or on market data.
2.6.15 Non-derivative
Financial liabilities are initially measured at fair value net of transaction costs at trade date. Subsequently, they are
measured at amortized cost using the effective interest rate method.
2.7 Revenue recognition
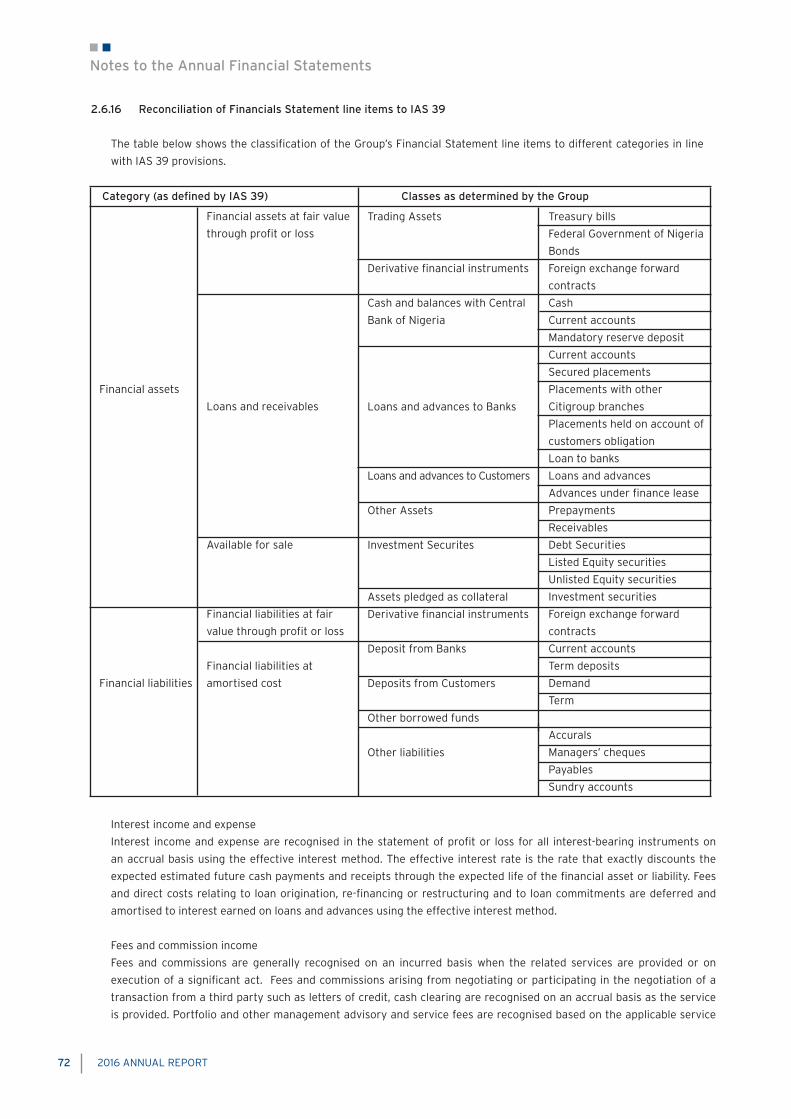
72 2016 ANNUAL REPORT
Category (as defined by IAS 39) Classes as determined by the Group
Trading Assets
Derivative financial instruments
Cash and balances with Central
Bank of Nigeria
Loans and advances to Banks
Loans and advances to Customers
Other Assets
Investment Securites
Assets pledged as collateral
Derivative financial instruments
Deposit from Banks
Deposits from Customers
Other borrowed funds
Other liabilities
Treasury bills
Federal Government of Nigeria
Bonds
Foreign exchange forward
contracts
Cash
Current accounts
Mandatory reserve deposit
Current accounts
Secured placements
Placements with other
Citigroup branches
Placements held on account of
customers obligation
Loan to banks
Loans and advances
Advances under finance lease
Prepayments
Receivables
Debt Securities
Listed Equity securities
Unlisted Equity securities
Investment securities
Foreign exchange forward
contracts
Current accounts
Term deposits
Demand
Term
Accurals
Managers’ cheques
Payables
Sundry accounts
Financial assets at fair value
through profit or loss
Loans and receivables
Available for sale
Financial liabilities at fair
value through profit or loss
Financial liabilities at
amortised cost
Financial assets
Financial liabilities
Interest income and expense
Interest income and expense are recognised in the statement of profit or loss for all interest-bearing instruments on
an accrual basis using the effective interest method. The effective interest rate is the rate that exactly discounts the
expected estimated future cash payments and receipts through the expected life of the financial asset or liability. Fees
and direct costs relating to loan origination, re-financing or restructuring and to loan commitments are deferred and
amortised to interest earned on loans and advances using the effective interest method.
Fees and commission income
Fees and commissions are generally recognised on an incurred basis when the related services are provided or on
execution of a significant act. Fees and commissions arising from negotiating or participating in the negotiation of a
transaction from a third party such as letters of credit, cash clearing are recognised on an accrual basis as the service
is provided. Portfolio and other management advisory and service fees are recognised based on the applicable service
2.6.16 Reconciliation of Financials Statement line items to IAS 39
The table below shows the classification of the Group’s Financial Statement line items to different categories in line
with IAS 39 provisions.
Notes to the Annual Financial Statements

2016 ANNUAL REPORT 73
Notes to the Annual Financial Statements
contracts, usually on a time-apportionment basis. Custody related fees are recognized over the period in which the
service is provided.
Net income from financial instruments held for trading at fair value through profit and loss .
Net income on items at fair value through profit and loss comprises of all gains less losses related to trading assets and
liabilities and financial instruments designated at fair value, and include all realized and unrealized fair value changes,
together with related interest and foreign exchange differences.
Dividend income
Dividends are recognised in Investment income in the statement of profit or loss when the entity’s right to receive
payment is established.
2.8 Property, plant and equipment
Land and buildings comprise mainly headoffice and branch offices. All property, plant and equipment used by the
parent or its subsidiary is stated at historical cost less depreciation. Historical cost includes expenditure that is directly
attributable to the acquisition of the items.
Subsequent costs are included in the asset’s carrying amount or are recognised as a separate asset, as appropriate, only
when it is probable that future economic benefits associated with the asset will flow to the Group and the cost of the
asset can be measured reliably. All other repairs and maintenance are charged to the statement of profit or loss during
the financial period in which they are incurred.
Land is not depreciated. Depreciation of assets is calculated using the straight-line method to allocate the cost of property
and equipment to their residual values over their estimated useful lives, as follows:
- Leasehold improvements: Over the lease period or useful life whichever is shorter
- Building 50 years
- Furniture and equipment 5 years
- Computer equipment 3 years
- Motor vehicles 4 years
Depreciation begins when an asset is available for use and ceases at the earlier of the date that the asset is derecognized
or classified as held for sale in accordance with IFRS 5. A non-current asset or disposal group is not depreciated while it
is classified as held for sale
Capital work-in-progress is not depreciated. Upon completion it is transferred to the relevant asset category.
The assets’ residual values and useful lives are reviewed, and adjusted if appropriate, at the end of each reporting period.
Assets are reviewed for impairment whenever events or changes in circumstances indicate that the carrying amount may
not be recoverable.
Gains and losses on disposals are determined by comparing proceeds with carrying amount. These are included in ‘other
operating income’ in the statement of profit or loss.
2.10 Impairment of non-financial assets
The carrying amounts of the Group’s non-financial assets, are reviewed at each reporting date to determine whether
there is any indication of impairment. If any such indication exists, then the asset’s recoverable amount is estimated.
For intangible assets that have indefinite useful lives or that are not yet available for use, the recoverable amount is
estimated each year at the same time. An impairment loss is recognised if the carrying amount of an asset exceeds its
estimated recoverable amount.

74 2016 ANNUAL REPORT
Impairment losses are recognised in the statement of profit or loss. Impairment losses recognised in respect of assets are
allocated to reduce the carrying amount of the assets.
Impairment losses recognised in prior periods are assessed at each reporting date for any indications that the loss
has decreased or no longer exists. An impairment loss is reversed if there has been a change in the estimates used to
determine the recoverable amount. An impairment loss is reversed only to the extent that the asset’s carrying amount
does not exceed the carrying amount that would have been determined, net of depreciation or amortisation, if no
impairment loss had been recognised.
2.11 Provisions
A provision is recognised if, as a result of a past event, the Group has a present legal or constructive obligation that can
be estimated reliably and it is probable that an outflow of economic benefits will be required to settle the obligation.
Provisions are determined by the present value of the expenditures expected to settle the obligation using a pre-tax rate
that reflects current market assessments of the time value of money and, where appropriate, the risks specific to the
liability.
2.12 Income taxation
Current income tax
The tax expense for the period comprises current and deferred income tax. Tax is recognised in statement of profit or
loss, except to the extent that it relates to items recognised in other comprehensive income or directly in equity. In this
case, the tax is also recognised in other comprehensive income or directly in equity respectively.
The current income tax charge is calculated on the basis of tax laws enacted or substantively enacted at the reporting
date. The directors periodically evaluate positions taken in tax returns with respect to situations in which applicable tax
regulation is subject to interpretation. They establish provisions where appropriate, on the basis of amounts expected to
be paid to the tax authorities.
Deferred income tax
Deferred tax arises from temporary differences in the recognition of items for accounting and tax purposes and is
calculated using the liability method. Deferred tax is provided on timing differences, which are expected to reverse in
the foreseeable future at the rates of tax likely to be in force at the time of reversal. Deferred income tax is determined
using tax rates (and laws) that have been enacted or substantially enacted by the reporting date and are expected to
apply when the related deferred income tax asset is realised or the deferred income tax liability is settled.
Deferred income tax asset is recognised only to the extent that it is probable that future taxable profit will be available
against which the temporary differences can be utilised.
Deferred income tax assets and liabilities are offset when there is a legally enforceable right to offset current income tax
assets against current income tax liabiltites and when the deferred income taxes assets and liabilities relate to income
taxes levied by the same taxation authority on either the same entity or different taxable entities where there is an
intention to settle the balances on a net basis.
Deferred tax related to fair value measurement, after initial recognition, of available-for-sale securities, is recognised in
other comprehensive income.
2.13 Employee benefits
Defined contribution scheme
The Group operates a defined contributory pension scheme. The scheme is fully funded and is managed by licensed
Pension Fund Administrators. Membership of the scheme is automatic for an employee upon commencement of duties
at the Group. The Group contributes 10% while the employee contributes 8% of gross emoluments to the scheme. The
Group’s contributions to this scheme are charged to the statement of profit or loss in the period to which they relate.
Notes to the Annual Financial Statements
2016 ANNUAL REPORT 75
Notes to the Annual Financial Statements
2.14 Share Capital
Dividend on ordinary shares
Dividend on ordinary shares is appropriated from retained earnings in the year it is approved by the Group’s shareholders.
Dividend per share is calculated based on the declared dividend during the year and the number of shares in issue at the
date of the declaration and qualifying for dividend.
Dividend for the current year that is approved by the Directors after the statement of financial position date is disclosed
in the subsequent events note to the financial statements.
Dividend proposed by Directors’ but not yet approved by members is disclosed in the financial statements in accordance
with the requirements of the Companies and Allied Matters Act of Nigeria.
Treasury shares
Where the Bank or any member of the Group purchases the Bank’s share capital, the consideration paid, if any, is
deducted from the shareholders equity as treasury shares until they are cancelled or disposed, as disclosed in note 35.2.
Where such shares are subsequently sold or reissued, any consideration received is included in shareholders equity.
2.15 Contingent assets and liabilities
Contingent assets
Contingent asset is a possible asset that arises from past events and whose existence will be confirmed only by the
occurrence or non-occurrence of one or more uncertain future events not wholly within the control of the Group.
Contingent assets are disclosed in the financial statements when they arise.
Contingent liabilities
Contingent liability is a probable obligation that arises from past events and whose existence will be confirmed only by
the occurrence or non-occurrence of one or more uncertain future events not wholly within the control of the Group.
Contingent liabilities are disclosed in the financial statements. However they are recognized, if it is probable that an
outflow of economic resources will be required to settle the obligation and the amount can be reliably estimated.
Financial guarantees
Financial guarantees are contracts that require the Group to make specified payments to reimburse the holder for a loss
it incurs because a specified debtor fails to make payment when due in accordance with the terms of a debt instrument.
Financial guarantee liabilities are recognised initially at their fair value, and the initial fair value is amortised over the
life of the financial guarantee. The financial guarantee liability is subsequently carried at the higher of this amortised
amount and the present value of any expected payment when a payment under the guarantee has become probable.
Financial guarantees are included within other liabilities. The fee income earned is recognised on a straight-line basis
over the life of the guarantee.
2.16 Comparatives
Except when a standard or an interpretation permits or requires otherwise, all amounts are reported or disclosed with
comparative information.
76 2016 ANNUAL REPORT
3 Critical accounting estimates and judgements
Estimates and judgements are continually evaluated and are based on historical experience and other factors, including
expectations of future events that are believed to be reasonable under the circumstances.
The group makes estimates and assumptions concerning the future. The resulting accounting estimates will, by definition,
seldom equal the related actual results. The estimates and assumptions that have a significant risk of causing a material
adjustment to the carrying amounts of assets and liabilities within the next financial year are addressed below.
3.1. Impairment losses on loans and advances
The Group reviews its loan portfolios to assess impairment periodically. In determining whether an impairment loss
should be recorded in statement of profit or loss, the Group makes judgements as to whether there is any observable
data indicating an impairment trigger, followed by measurable decrease in the estimated future cash flows from the
portfolio of loans, before the decrease can be identified with that portfolio. This evidence may include observable data
that indicates significant financial difficulty, default on the facility or probability that the obligor will enter bankruptcy,
or other observable data relating to a group of assets such as adverse changes in the payment status of borrowers or
issuers in the group, or economic conditions that correlate with defaults in the group. The Group uses estimates based
on historical loss experience for assets with credit risk characteristics and objective evidence of impairment similar to
those in the portfolio. The loan impairment provision was based on risk rating of obligor and loss norms attached to each
risk rating.
3.2. Impairment losses of available-for-sale equity investments
The Group determines that available-for-sale equity investments are impaired when there has been a significant or
prolonged decline in the fair value below its cost. This determination of what is significant or prolonged requires
judgement. In making this judgement, the Group evaluates among other factors, the normal volatility in share price,
deterioration in the financial health of the investee, industry and sector performance, changes in technology, and
operational and financing cash flows. In this respect, a decline of 20% or more is regarded as significant, a period longer
than 12 months is considered to be prolonged. If any such quantitative evidence exists for available-for-sale financial
assets, the asset is considered for impairment, taking qualitative evidence into account. The impairment is recognised in
the statement of comprehensive income. The impairment loss is recognised as part of net change in FV of AFS securities
in the statement of comprehensive income.
3.3. Fair value of financial instruments
The fair value of financial instruments where no active market exists or where quoted prices are not otherwise available
are determined by using valuation techniques. In these cases, the fair values are estimated from observable data in
respect of similar financial instruments or using valuation models. Where market observable inputs are not available,
they are estimated based on appropriate assumptions. Where valuation techniques (for example, models) are used to
determine fair values, they are validated and periodically reviewed by qualified personnel independent of those that
sourced them. All models are certified before they are used, and models are calibrated to ensure that outputs reflect
actual data and comparative market prices. To the extent practical, models use only observable data; however, areas
such as credit risk (both own credit risk and counterparty risk), volatilities and correlations require management to make
estimates. Note 4.2.2 details further sensitivity analysis on the non-trading portfolio.
Notes to the Annual Financial Statements

2016 ANNUAL REPORT 77
Notes to the Annual Financial Statements
4. Financial risk management
The risk management framework has as its foundation on a robust set of policies, procedures and processes covering the following broad categories of risk: Credit risk, Market risk and Liquidity risk.
The risk management policies serve as the basis for risk identification and analysis inherent in the product offering as well as operating environment, setting of appropriate risk limits and controls and monitoring adherence to limits. Risk management policies and systems are reviewed regularly to reflect changes in market conditions, products and services offered. Business managers and functional heads are acountable for risks in their businesses and functions. The Group, through its training, management standards and procedures, aims to develop a disciplined and constructive control environment, in which all employees understand their roles and obligations.
Enterprise risk review The diversity of customers, products, and business strategies at Citibank Nigeria Limited requires that we have a well-
defined, risk management framework to identify, analyze, originate, monitor and report on acceptable risk taking activities within pre-defined thresholds.
The Group’s risk management function works with the business towards the goal of taking intelligent risk with shared
responsibility, without forsaking individual accountability and mitigating the potential of losses in risk activities under 3 broad categories: Credit risk, Liquidity and Market risk. Senior Business Management‘s objectives (budgets, portfolios and investments) must be prudent, reflecting their view of risks and rewards arising from market conditions and should dynamically adjust these strategies and budgets to fit changing environments.
Governance structure The key governance structure includes the Board of Directors, Credit Committees, Risk Management committee and
senior management committees which specifically focus on the broad risk categories stated above. The Board of Directors has overall responsibility for the establishment and oversight of the Group’s risk management framework.
The Board Credit Committee has the responsibility for approval of credit facilities, delegation of approval limits and ratification of Management Credit committee limits as recommended by the Country Risk Manager.
All Board committees report regularly to the board of directors on their activities.
Asset and Liability Committee (ALCO) is responsible for the market risk management and oversight for the bank. The ALCO establishes and implements liquidity and price risk management policies; approves the annual liquidity and funding plans; approves and reviews the liquidity and price risk limits; monitors compliance with regulatory risk capital and the capital management process.
Excessive risk concentration Concentrations arise when a number of counterparties are engaged in similar business activities, or activities in the same
geographical region, or have similar economic features that would cause their ability to meet contractual obligations to be similarly affected by changes in economic, political or other conditions. Concentrations indicate the relative sensitivity of the Group’s performance to developments affecting a particular industry or geographical location. In order to avoid excessive concentrations of risk, the Group’s policies and procedures include specific concentration limits based on the Group’s overal risk capacity, capital considerations and evaluation of internal and external environments. Identified concentrations ofcredit risks are monitored, controlled and managed accordingly.

78 2016 ANNUAL REPORT
Classification of financial instruments according to IAS 39
Group (2016) Fair Value Available Loans and Amortized Total
through for sale Receivables Cost
Profit or Loss
N’000 N’000 N’000 N’000 N’000
Cash and balances with Central Bank of Nigeria - - 78,913,109 - 78,913,109
Loans and advances to banks - - 113,167,991 - 1 13,167,991
Trading securities 108,662,159 - - - 108,662,159
Derivative financial instruments 28,282,399 - - - 28,282,399
Assets pledged as collateral - 7,250,469 - - 7,250,469
Loans and advances to customers - - 117,554,672 - 117,554,672
Investment securities - 108,622,549 - - 108,622,549
Other assets (excluding prepayments) - - 37,891,569 - 37,891,569
136,944,558 115,873,018 347,527,341 - 600,344,917
Deposits from banks - - - 1,034,242 1,034,242
Deposits from customers - - - 485,845,373 485,845,373
Derivative financial instruments 22,335,602 - - - 22,335,602
Other liabilities (excl. accrued expenses) - - - 12,937,860 12,937,860
22,335,602 - - 499,817,475 522,153,077
Bonds and guarantees - - - 15,222,506 15,222,506
Loan commitments - - - 4,518,613 4,518,613
Other credit related obligations - - - 35,244,503 35,244,503
Total - - - 54,985,622 54,985,622
Bank (2016)
Fair Value Available Loans and Amortized Total
through for sale Receivables Cost
Profit or Loss
N’000 N’000 N’000 N’000 N’000
Cash and balances with Central Bank of Nigeria - - 78,913,109 - 78,913,109
Loans and advances to banks - - 113,167,991 - 1 13,167,991
Trading securities 108,662,159 - - - 108,662,159
Derivative financial instruments 28,282,399 - - - 28,282,399
Assets pledged as collateral - 7,250,469 - - 7,250,469
Loans and advances to customers - - 117,554,672 - 117,554,672
Investment securities - 108,622,549 - - 108,622,549
Other assets (excluding prepayments) - - 37,891,569 - 37,891,569
136,944,558 115,873,018 347,527,341 - 600,344,917
Deposits from banks - - - 1,034,242 1,034,242
Deposits from customers - - - 485,847,157 485,847,157
Derivative financial instruments 22,335,602 - - - 22,335,602
Other liabilities (excl. accrued expenses) - - - 12,937,860 12,937,860
22,335,602 - - 499,819,259 522,154,861
Bonds and guarantees - - - 15,222,506 15,222,506
Loan commitments - - - 4,518,613 4,518,613
Other credit related obligations - - - 35,244,503 35,244,503
Total - - - 54,985,622 54,985,622
Notes to the Annual Financial Statements

2016 ANNUAL REPORT 79
Classification of financial instruments according to IAS 39
Group (2015) Fair Value Available Loans and Amortized Total
through for sale Receivables Cost
Profit or Loss
N’000 N’000 N’000 N’000 N’000
Cash and balances with Central Bank of Nigeria - - 104,446,388 - 104,446,388
Loans and advances to banks - - 158,371,780 - 158,371,780
Trading securities 12,952,024 - - - 12,952,024
Derivative financial instruments 6,662 - - - 6,662
Assets pledged as collateral - 4,041,522 - - 4,041,522
Loans and advances to customers - - 94,489,371 - 94,489,371
Investment securities - 53,058,829 - - 53,058,829
Other assets (excluding prepayments) - - 143,852 - 143,852
12,958,686 57,100,351 357,451,392 - 427,510,428
Deposits from banks - - - 770,983 770,983
Deposits from customers - - - 358,184,320 358,184,320
Derivative financial instruments 6,466 - - - 6,466
Other liabilities (excl. accrued expenses) - - - 7,294,309 7,294,309
6,466 - - 366,249,612 366,256,078
Bonds and guarantees - - - 13,772,405 13,772,405
Loan commitments - - - 20,923,394 20,923,394
Other credit related obligations - - - 16,285,564 16,285,564
Total - - - 50,981,363 50,981,363
Bank (2015)
Fair Value Available Loans and Amortized Total
through for sale Receivables Cost
Profit or Loss
N’000 N’000 N’000 N’000 N’000
Cash and balances with Central Bank of Nigeria - - 104,446,388 - 104,446,388
Loans and advances to banks - - 158,371,780 - 158,371,780
Trading securities 12,952,024 - - - 12,952,024
Derivative financial instruments 6,662 - - - 6,662
Assets pledged as collateral - 4,041,522 - - 4,041,522
Loans and advances to customers - - 94,489,371 - 94,489,371
Investment securities - 53,058,829 - - 53,058,829
Other assets (excluding prepayments) - - 143,852 - 143,852
12,958,686 57,100,351 357,451,392 - 427,510,428
- -
Deposits from banks - - - 770,983 770,983
Deposits from customers - - - 358,185,854 358,185,854
Derivative financial instruments 6,466 - - - 6,466
Other liabilities (excl. accrued expenses) - - - 7,294,309 7,294,309
6,466 - - 366,251,146 366,257,612
Bonds and guarantees - - - 13,772,405 13,772,405
Loan commitments - - - 20,923,394 20,923,394
Other credit related obligations - - - 16,285,564 16,285,564
Total - - - 50,981,363 50,981,363
Notes to the Annual Financial Statements

80 2016 ANNUAL REPORT
Fair Value of Unquoted Securities
The fair value of investment securities in non-quoted equity securities is based on a model that takes observable data with
significant unobservableadjustments or assumptions required. Were these unobservable adjustments or assumptions
to differ by +/- 100 basis points, the change in fair value would be N170,775,753 higher or lower. Note 4.5.3 details the
movement in Investment securities under Level 3 that represent the fair value of non-quoted equity securities for the
year.
The table below shows +/-100 bps adjustment to the discount factor.
Investment Impact to OCI/Equity
2016 2015
N’000 N’000
CSCS 44,603 5,546
NIBSS 75,475 66,286
UPS 50,697 31,106
170,775 102,938
Notes to the Annual Financial Statements

2016 ANNUAL REPORT 81
4.1 Credit risk Credit risk is the risk of financial loss to the Group if a customer or counterparty to a financial instrument fails to meet
its contractual obligations. This arises principally from the Group’s loans and advances to customers and banks, and investment debt securities. For risk management reporting purposes the bank considers and consolidates all elements of credit risk exposure.
4.1.1 Management of credit risk The credit policy is the bedrock of the credit risk management and is predicated on the Group’s business
strategy and return objective through well pre-defined target market, risk acceptance criteria and stress testing. Based on Board approval, independent risk in conjuction with the business unit set and monitor limits.
To manage the credit process with predictable results, the Group has a dyamic and interactive three phased
approach: i) Portfolio strategy and planning: Where the Group defines desired financial results and strategies requiredto achieve those results. Target market is part of the strategy that identifies the acceptable profile of customers and the products the Group propose to offer; ii) Credit Origination and Maintenance: Where the Group creates and maintains transactions and
portfolios with characteristics that are consistent with institutional strategies; and iii) Performance Assessment and Reporting: Where the Group monitors the performance for continual improvement.
System capture of credit information and documentation review is another critical attribute of financial analysis which facilitates credit monitoring done both on obligor and portfolio basis. Methodology for risk rating The Risk Rating Process is the end-to-end process for deriving Obligor Risk Rating (ORR’s) and Facility Risk Rating
(FRR’s). These ratings are derived as part of the overall risk rating process that involves the use of risk rating models, supplemental guidelines, support adjustments, collateral adjustments, process controls, as well as any other defined processes that the Group undertakes in order to arrive at ORR’s and FRR’s. The required inputs into the model for deriving the risk rating are the obligor’s financial statements. The models are statistical models, which are revalidated periodically by the Credit and Operational Risk Analytics Group of Citigroup, which is based in New York. The revalidation had no impact but ensured consistency of the rating process.
The Obligor Risk Rating (ORR) represents the probability that an obligor will default within a one-year time horizon.
Risk ratings for obligors are assigned on a scale of 1 to 10, with sub-grades, where ‘1’ is the best quality risk and ‘7’ is the worst for performing and accruing obligors that are not in default. ORR “9” and “10” rating categories indicate that the obligor is in default (ORR “8” is applicable only to adverse classifications resulting solely from cross-border events).
The Facility Risk Rating (FRR) approximates a ‘Loss Norm’ for each facility, and is the product of two components: the
Default Probability of the Obligor, i.e. the final ORR, and the Loss Given Default (‘LGD’). FRR’s are assigned on a scale of 1 to 10, with sub-grades, where ‘1’ is the best quality risk and ‘7’ is the worst for performing facilities. The 8, 9 and 10 rating categories indicate facilities that have been classified as impaired.
The Obligor Limit Rating (OLR) represents a longer-term (beyond one year) view of an obligor’s credit quality. The OLR
is derived from the final ORR and considers a range of factors, such as quality of management and strategy, nature of industry, and regulatory environment, among other factors.
As part of the risk management process, the Group assigns numeric risk ratings to its Obligors based on quantitative and qualitative assessment of the obligor and facility. These risk ratings are reviewed at least annually or more often if material events related to the obligor or facility warrant.
Notes to the Annual Financial Statements
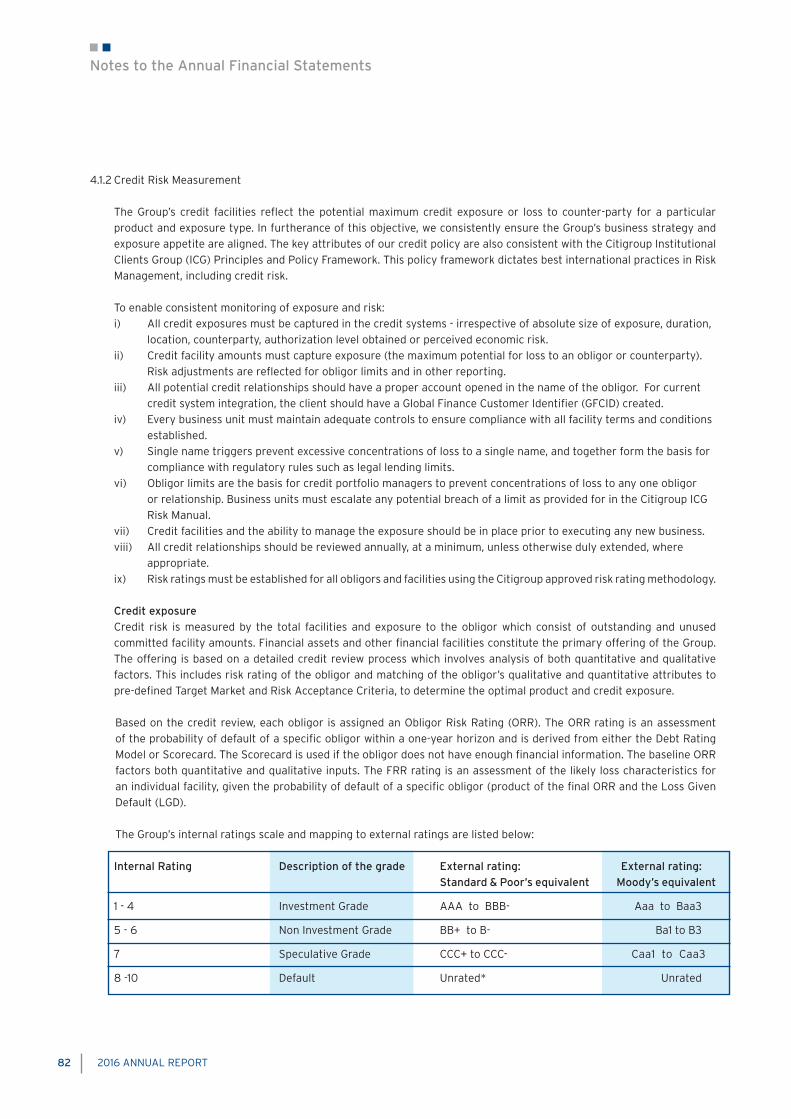
82 2016 ANNUAL REPORT
4.1.2 Credit Risk Measurement The Group’s credit facilities reflect the potential maximum credit exposure or loss to counter-party for a particular
product and exposure type. In furtherance of this objective, we consistently ensure the Group’s business strategy and exposure appetite are aligned. The key attributes of our credit policy are also consistent with the Citigroup Institutional Clients Group (ICG) Principles and Policy Framework. This policy framework dictates best international practices in Risk Management, including credit risk.
To enable consistent monitoring of exposure and risk: i) All credit exposures must be captured in the credit systems - irrespective of absolute size of exposure, duration, location, counterparty, authorization level obtained or perceived economic risk. ii) Credit facility amounts must capture exposure (the maximum potential for loss to an obligor or counterparty). Risk adjustments are reflected for obligor limits and in other reporting. iii) All potential credit relationships should have a proper account opened in the name of the obligor. For current credit system integration, the client should have a Global Finance Customer Identifier (GFCID) created. iv) Every business unit must maintain adequate controls to ensure compliance with all facility terms and conditions established. v) Single name triggers prevent excessive concentrations of loss to a single name, and together form the basis for compliance with regulatory rules such as legal lending limits. vi) Obligor limits are the basis for credit portfolio managers to prevent concentrations of loss to any one obligor or relationship. Business units must escalate any potential breach of a limit as provided for in the Citigroup ICG Risk Manual. vii) Credit facilities and the ability to manage the exposure should be in place prior to executing any new business. viii) All credit relationships should be reviewed annually, at a minimum, unless otherwise duly extended, where appropriate. ix) Risk ratings must be established for all obligors and facilities using the Citigroup approved risk rating methodology. Credit exposure Credit risk is measured by the total facilities and exposure to the obligor which consist of outstanding and unused
committed facility amounts. Financial assets and other financial facilities constitute the primary offering of the Group. The offering is based on a detailed credit review process which involves analysis of both quantitative and qualitative factors. This includes risk rating of the obligor and matching of the obligor’s qualitative and quantitative attributes to pre-defined Target Market and Risk Acceptance Criteria, to determine the optimal product and credit exposure.
Based on the credit review, each obligor is assigned an Obligor Risk Rating (ORR). The ORR rating is an assessment
of the probability of default of a specific obligor within a one-year horizon and is derived from either the Debt Rating Model or Scorecard. The Scorecard is used if the obligor does not have enough financial information. The baseline ORR factors both quantitative and qualitative inputs. The FRR rating is an assessment of the likely loss characteristics for an individual facility, given the probability of default of a specific obligor (product of the final ORR and the Loss Given Default (LGD).
The Group’s internal ratings scale and mapping to external ratings are listed below: Internal Rating Description of the grade External rating: External rating:
Standard & Poor’s equivalent Moody’s equivalent
1 - 4 Investment Grade AAA to BBB- Aaa to Baa3
5 - 6 Non Investment Grade BB+ to B- Ba1 to B3
7 Speculative Grade CCC+ to CCC- Caa1 to Caa3
8 -10 Default Unrated* Unrated
Notes to the Annual Financial Statements

2016 ANNUAL REPORT 83
Board
Board Credit Committee (see note below)
Management Credit Committee
N5billion and above for non cash collateralized facilities (for ratification)
1. N800million – N2.2billion for non cash-collateralised facilities (for noting).
2. N2.2billion - N5billion for non cash-collateralised facilities.
3. Over N5billion subject to final ratification by the Board, after board review of the full credit approval packages.
1. All fully cash-collateralised facilities.
2. Up to N2.2billion for non cash collateralized facilities
Authorizing Level Approval Limit
The internal ratings are assigned on a scale of 1-10 (with sub-grades), defined as follows: 1 is the best quality risk for obligors not in default 7- is the worst quality for obligors not in default 8 to 10 are ratings assigned to obligors that are in default and have non-performing facilities
The internal rating classifications reflect the risk profile, which dictates approval level, exposure appetite and level of monitoring required. Based on this, the investment grade represents the lowest risk profile while the speculative grade reflects the highest risk of a performing obligor. All internal ratings are cross referenced to S&P and Moody’s as an effective calibration to external market data. Monitoring Once the credit transactions have been approved, there is an established process for monitoring the risk exposure and maintaining it at acceptable levels. These risk management processes include: Annual review of facilities which will involve revalidation of exposure limits, review of risk ratings and general
account performance during the review period; At a minimum, quarterly credit customer calls including approving credit officers; Review of the monthly and quarterly portfolio trends; and Documentation review to ensure all required documentation is in place. 4.1.3 Risk limit control and mitigation policies The Group as part of its portfolio monitoring functions routinely defines concentration limits, with the goal of establishing
a well-diversified portfolio where expected return on risk capital should be commensurate with the inherent risk therein. Single name triggers prevent excessive concentrations of loss to a single name, and together form the basis for compliance with regulatory rules such as legal lending limits. Concentration limits are monitored on a monthly basis.
Some other specific control and mitigation measures are outlined below. Authorizing level approval limit The Group’s internal credit approval limits are a function of experience and credit exposure in line with the Citigroup
ICG Risk Manual requirement and the authorities delegated by the board. However, the board approved limits are listed below:
Notes to the Annual Financial Statements

84 2016 ANNUAL REPORT
Note: Where the Board Credit Committee’s approval for a non cash-collateralised facility is required, which is over and above any cash collateralised facilities to the same obligor, the Board Credit Committee must be informed of the total facilities granted, i.e. inclusive of cash collateralised facilities. The key feature of credit approval in the Group is the fact that no one person can singly approve a credit, irrespective of the limit. Exposure to credit risk is also managed through periodic calls on the borrowers to ascertain operating performance and determine their continued ability to meet all obligations as and when due. Collateral The Group focuses primarily on the cash-flows of the borrower for its repayments. The general principle is that repayment should come from the transactions financed or other operating cash-flows. The Group maintains a policy of not lending in an inferior position, without proper approvals (and only in exceptional circumstances), or where it is at a disadvantage to other lenders as regards seniority of claim in a default scenario. During the annual credit review process, searches are conducted to verify that the Group is not lending in an inferior position. In instances where pre-existing charges exist on the customer’s assets, the Group generally demands a pari-passu ranking with other lenders. However, based on the credit profile assessment on a case by case basis, the Board Credit Committee may also request for additional collateral for credit enhancement. For term loans for the acquisition of specific assets, the Group generally takes a charge over the assets financed by the term loan. As a general principle, all credits are reviewed and approved based broadly on the under listed key factors: The operations of the Borrower/Obligor falling within the approved target market. Strong financial profile with emphasis on present and future cash flow which determines the capacity of the operations
to meet debt obligations. Review and assessment of Borrower/Obligor management and sponsors. Credit history track record. Economic/industry trends. For an international company where the Group has recourse to branches or subsidiaries of Citibank outside Nigeria,
or where the exposure is secured against guarantees, cash or other types of collateral, the Bank may reserve the right not to insist on obtaining a local security ranking pari-passu with other local lenders, in view of the superior access it maintains through its global affiliates to the parent company seniors.
The Group implements the above guidelines on the acceptability of specific classes of collateral or credit risk mitigation. The principal collateral types for loans and advances are:
1. Floating charge which covers all the assets of the company and the value can change in the normal course of business e.g. stocks, receivables etc.
2. All assets debenture which is a fixed and floating charge on the assets of the company.3. Fixed charge which covers specicifc assets of the company.4. Mortgage debenture in which a charge is taken on land or real estates as well as other assets.5. Legal mortgage in which a charge is taken on other assets.” The Group’s summary policy on collateral for short term exposure is as summarized below If the practice of the obligor has been to secure the overdrafts or other facilities for other lenders, then Citi will join the
consortium in order to retain a pari-pasu position with other lenders When security is obtained in the form of a floating charge or all asset debentures, there is no reliance placed on this and
it is considered merely a leverage or negotiation tool in the event of adverse development i.e treated as support not security.
Given the minimal reliance on such security, the Group will not normally request insurance policies and valuation of
Notes to the Annual Financial Statements
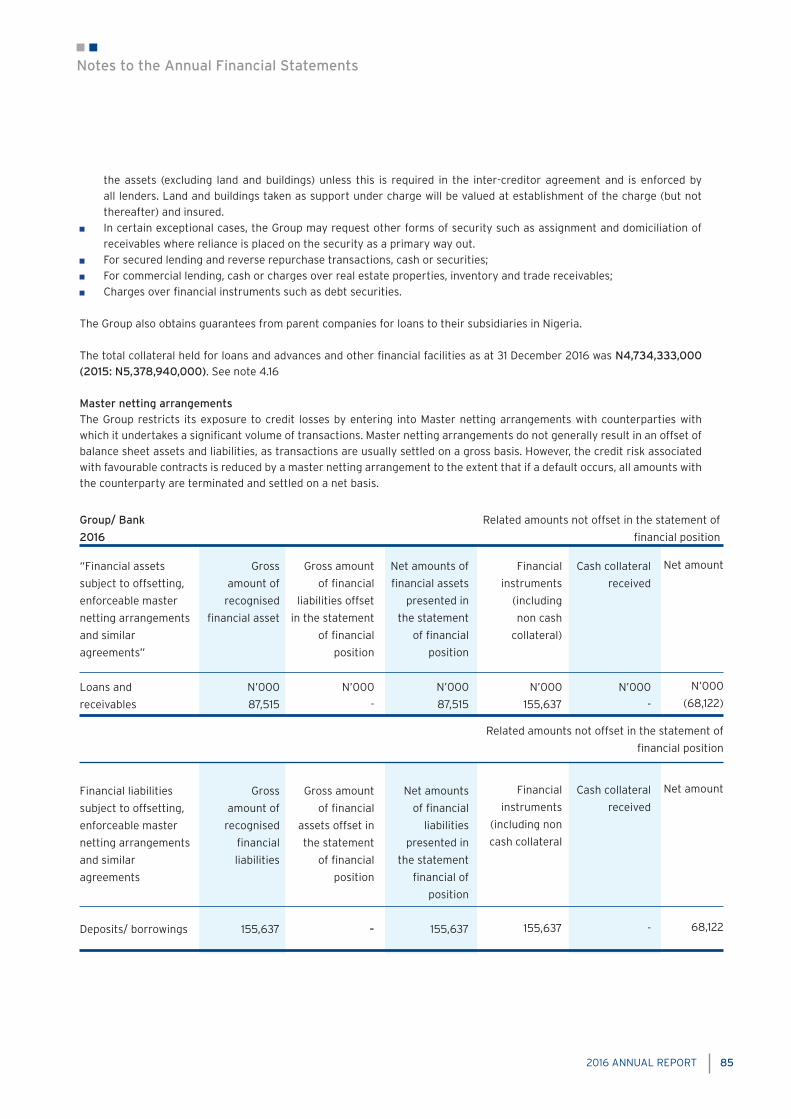
2016 ANNUAL REPORT 85
the assets (excluding land and buildings) unless this is required in the inter-creditor agreement and is enforced by all lenders. Land and buildings taken as support under charge will be valued at establishment of the charge (but not thereafter) and insured.
In certain exceptional cases, the Group may request other forms of security such as assignment and domiciliation of receivables where reliance is placed on the security as a primary way out.
For secured lending and reverse repurchase transactions, cash or securities; For commercial lending, cash or charges over real estate properties, inventory and trade receivables; Charges over financial instruments such as debt securities.
The Group also obtains guarantees from parent companies for loans to their subsidiaries in Nigeria.
The total collateral held for loans and advances and other financial facilities as at 31 December 2016 was N4,734,333,000 (2015: N5,378,940,000). See note 4.16
Master netting arrangements The Group restricts its exposure to credit losses by entering into Master netting arrangements with counterparties with which it undertakes a significant volume of transactions. Master netting arrangements do not generally result in an offset of balance sheet assets and liabilities, as transactions are usually settled on a gross basis. However, the credit risk associated with favourable contracts is reduced by a master netting arrangement to the extent that if a default occurs, all amounts with the counterparty are terminated and settled on a net basis.
Group/ Bank
2016
“Financial assets
subject to offsetting,
enforceable master
netting arrangements
and similar
agreements”
Loans and
receivables
Financial liabilities
subject to offsetting,
enforceable master
netting arrangements
and similar
agreements
Deposits/ borrowings
Gross amount
of financial
liabilities offset
in the statement
of financial
position
N’000
-
Gross amount
of financial
assets offset in
the statement
of financial
position
-
Cash collateral
received
N’000
-
Cash collateral
received
-
Gross
amount of
recognised
financial asset
N’000
87,515
Gross
amount of
recognised
financial
liabilities
155,637
Financial
instruments
(including
non cash
collateral)
N’000
155,637
Financial
instruments
(including non
cash collateral
155,637
Related amounts not offset in the statement of
financial position
Net amounts of
financial assets
presented in
the statement
of financial
position
N’000
87,515
Net amounts
of financial
liabilities
presented in
the statement
financial of
position
155,637
Net amount
N’000
(68,122)
Net amount
68,122
Notes to the Annual Financial Statements
Related amounts not offset in the statement of
financial position

86 2016 ANNUAL REPORT
Group/ Bank
2015
Financial assets
subject to offsetting,
enforceable master
netting arrangements
and similar
agreements
Loans and
receivables
Financial liabilities
subject to offsetting,
enforceable master
netting arrangements
and similar
agreements
Deposits/ borrowings
Gross amount
of financial
liabilities offset
in the statement
of financial
position
-
Gross amount
of financial
assets offset in
the statement
of financial
position
-
Cash collateral
received
-
Cash collateral
received
-
Gross
amount of
recognised
financial asset
96,409
Gross
amount of
recognised
financial
liabilities
206,637
Financial
instruments
(including non
cash collateral
206,637
Financial
instruments
(including non
cash collateral
96,409
Related amounts not offset in the statement of
financial position
Net amounts of
financial assets
presented in
the statement
financial of
position
96,409
Net amounts
of financial
liabilities
presented in
the statement
financial of
position
206,637
Net amount
(110,228)
Net amount
110,228
Group rating Description Credit Impairment Credit Impairment
of the grade Exposure (%) (%) Exposure (%) (%)
1 - 4 Investment Grade 55.58 - 42.13 -
5 - 6 Non Investment Grade 36.61 - 47.86 -
7 Speculative Grade 7.72 - 9.81 -
8 -10 Default 0.09 100.00 0.20 100.00
100.00 100.00 100.00 100.00
Notes to the Annual Financial Statements
4.1.4 Impairment and provisioning policies The internal rating systems described above focus more on credit-quality mapping from the inception of the lending
and investment activities. In contrast, impairment allowances are recognised for financial reporting purposes only for losses that have been incurred at the balance sheet date based on objective evidence of impairment. Due to different methodologies applied, the amount of incurred credit losses may differ from the criteria set out in the Prudential Guidelines for licensed banks and any additional provisions are taken in line with the Prudential guidelines.
The impairment allowance shown in the statement of financial position at year-end is derived from each of the internal
rating grades. However, the largest component of the impairment allowance comes from the default grade.The table below shows the percentage of the Group’s credit exposure items that include financial assets, financial guarantees, loan commitments and other credit related obligations and the associated impairment allowance for each of the Group’s internal rating categories.
Related amounts not offset in the statement of
financial position
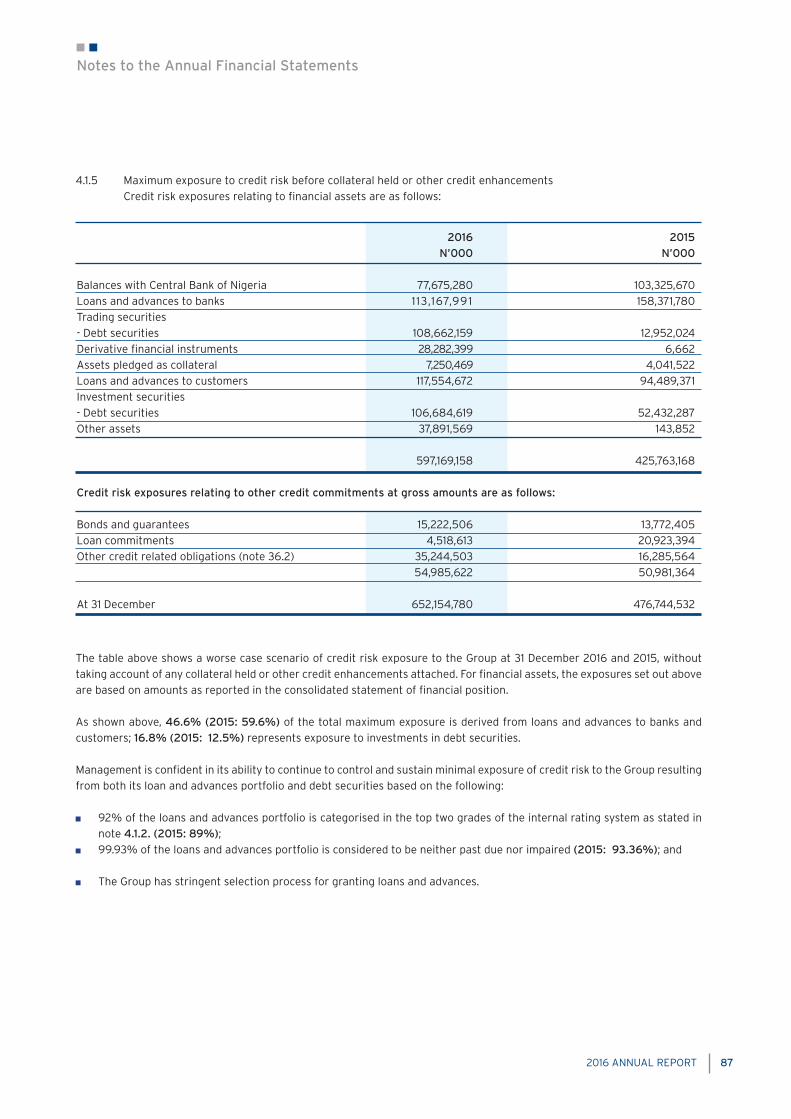
2016 ANNUAL REPORT 87
2016 2015 N’000 N’000
Balances with Central Bank of Nigeria 77,675,280 103,325,670Loans and advances to banks 113,167,991 158,371,780Trading securities - Debt securities 108,662,159 12,952,024Derivative financial instruments 28,282,399 6,662Assets pledged as collateral 7,250,469 4,041,522Loans and advances to customers 117,554,672 94,489,371Investment securities - Debt securities 106,684,619 52,432,287Other assets 37,891,569 143,852
597,169,158 425,763,168
Credit risk exposures relating to other credit commitments at gross amounts are as follows: Bonds and guarantees 15,222,506 13,772,405Loan commitments 4,518,613 20,923,394Other credit related obligations (note 36.2) 35,244,503 16,285,564 54,985,622 50,981,364 At 31 December 652,154,780 476,744,532
4.1.5 Maximum exposure to credit risk before collateral held or other credit enhancements Credit risk exposures relating to financial assets are as follows:
The table above shows a worse case scenario of credit risk exposure to the Group at 31 December 2016 and 2015, without taking account of any collateral held or other credit enhancements attached. For financial assets, the exposures set out above are based on amounts as reported in the consolidated statement of financial position. As shown above, 46.6% (2015: 59.6%) of the total maximum exposure is derived from loans and advances to banks and customers; 16.8% (2015: 12.5%) represents exposure to investments in debt securities.
Management is confident in its ability to continue to control and sustain minimal exposure of credit risk to the Group resulting from both its loan and advances portfolio and debt securities based on the following: 92% of the loans and advances portfolio is categorised in the top two grades of the internal rating system as stated in
note 4.1.2. (2015: 89%); 99.93% of the loans and advances portfolio is considered to be neither past due nor impaired (2015: 93.36%); and
The Group has stringent selection process for granting loans and advances.
Notes to the Annual Financial Statements
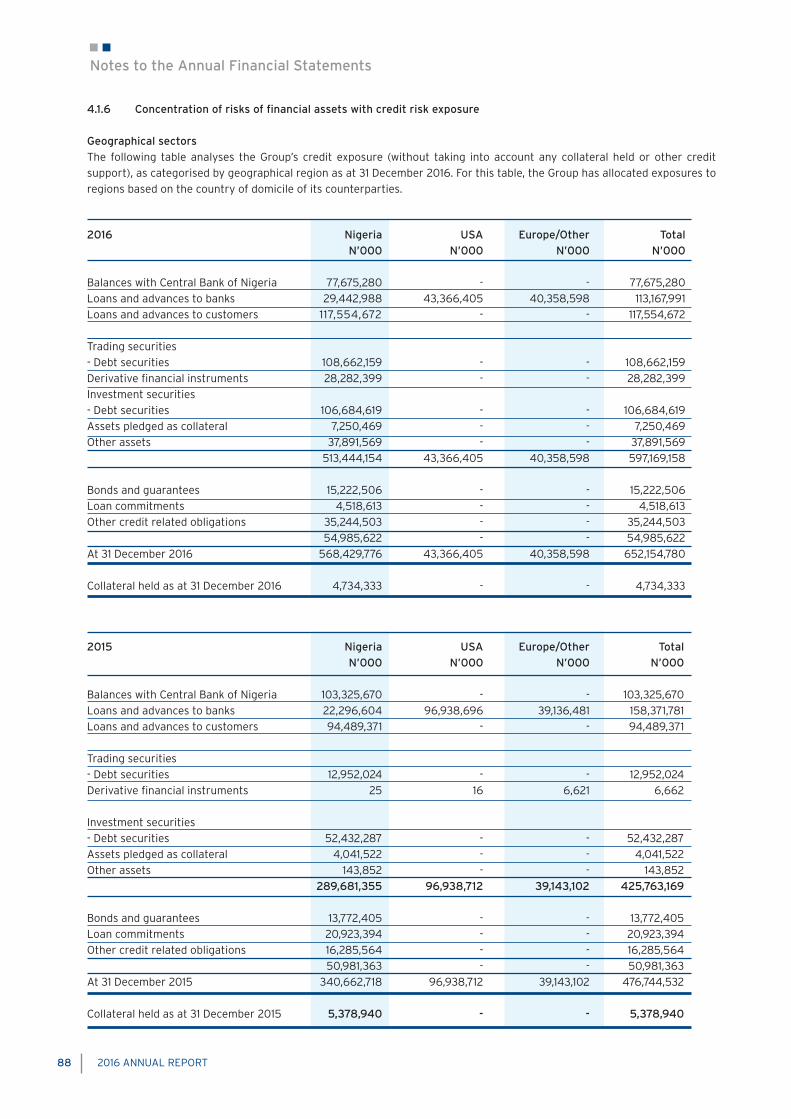
88 2016 ANNUAL REPORT
2016 Nigeria USA Europe/Other Total N’000 N’000 N’000 N’000
Balances with Central Bank of Nigeria 77,675,280 - - 77,675,280Loans and advances to banks 29,442,988 43,366,405 40,358,598 113,167,991Loans and advances to customers 117,554,672 - - 117,554,672
Trading securities - Debt securities 108,662,159 - - 108,662,159Derivative financial instruments 28,282,399 - - 28,282,399Investment securities - Debt securities 106,684,619 - - 106,684,619Assets pledged as collateral 7,250,469 - - 7,250,469Other assets 37,891,569 - - 37,891,569 513,444,154 43,366,405 40,358,598 597,169,158 Bonds and guarantees 15,222,506 - - 15,222,506Loan commitments 4,518,613 - - 4,518,613Other credit related obligations 35,244,503 - - 35,244,503 54,985,622 - - 54,985,622At 31 December 2016 568,429,776 43,366,405 40,358,598 652,154,780
Collateral held as at 31 December 2016 4,734,333 - - 4,734,333
2015 Nigeria USA Europe/Other Total N’000 N’000 N’000 N’000
Balances with Central Bank of Nigeria 103,325,670 - - 103,325,670Loans and advances to banks 22,296,604 96,938,696 39,136,481 158,371,781Loans and advances to customers 94,489,371 - - 94,489,371
Trading securities - Debt securities 12,952,024 - - 12,952,024Derivative financial instruments 25 16 6,621 6,662
Investment securities - Debt securities 52,432,287 - - 52,432,287Assets pledged as collateral 4,041,522 - - 4,041,522Other assets 143,852 - - 143,852 289,681,355 96,938,712 39,143,102 425,763,169
Bonds and guarantees 13,772,405 - - 13,772,405Loan commitments 20,923,394 - - 20,923,394Other credit related obligations 16,285,564 - - 16,285,564 50,981,363 - - 50,981,363At 31 December 2015 340,662,718 96,938,712 39,143,102 476,744,532
Collateral held as at 31 December 2015 5,378,940 - - 5,378,940
Notes to the Annual Financial Statements
4.1.6 Concentration of risks of financial assets with credit risk exposure Geographical sectors The following table analyses the Group’s credit exposure (without taking into account any collateral held or other credit support), as categorised by geographical region as at 31 December 2016. For this table, the Group has allocated exposures to regions based on the country of domicile of its counterparties.

2016 ANNUAL REPORT 89
Industry sectors The following table analyses the Group’s credit exposure (without taking into account any collateral held or other credit support), as categorised by industry sectors of the Group’s counterparties.
2016 Manufacturing Financial Government Transport & Oil & Gas General Others Total Institutions Communication Commerce N’000 N’000 N’000 N’000 N’000 N’000 N’000 N’000
Balances with Central Bank of Nigeria - 77,675,280 - - - - - 77,675,280 Loans and advances to banks - 113,167,991 - - - - - 113,167,991 Loans and advances to customers 88,097,439 120,211 - 18,612 1,350,888 27,967,521 - 117,554,671 Trading securities - Debt securities - - 108,662,159 - - - - 108,662,159 Derivative financial instruments 351,612 27,352,191 459,550 95,256 23,789 - 28,282,398 Investment securities - Debt securities - - 106,684,619 - - - - 106,684,620 Assets pledged as collateral - - 7,250,469 - - - - 7,250,469 Other assets 21,936,723 15,550,012 - - - 387,600 17,235 37,891,569 110,385,774 233,865,685 222,597,247 478,164 1,446,144 28,378,910 17,235 597,169,159 Bonds and guarantees 893,761 9,694,345 - 437,634 2,007,065 398,578 1,791,123 15,222,506Loan commitments 1,386,572 18,829 - 1,580,795 853,268 616,309 62,839 4,518,612Other credit related obligations 30,950,661 - - 1,053,159 - 1,906,564 1,334,118 35,244,502 33,230,994 9,713,174 - 3,071,588 2,860,333 2,921,451 3,188,080 54,985,622 At 31 December 2016 143,616,768 243,578,859 222,597,247 3,549,751 4,306,477 31,300,361 3,205,315 652,154,780
Collateral held as at 31 December 2016 4,636,497 - - 17,836 - - 80,000 4,734,333
Maximum Exposure 14,066,675 120,211 - 18,612 479,950 7,700,000 3,203,483 Minimum Exposure - - - - 76,225 12,717 -
2015 Manufacturing Financial Government Transport & Oil & Gas General Others Total Institutions Communication commerce N’000 N’000 N’000 N’000 N’000 N’000 N’000 N’000
Balances with Central Bank of Nigeria - 103,325,670 - - - - - 103,325,670Loans and advances to banks - 158,371,780 - - - - - 158,371,780Loans and advances to customers 38,149,785 - - 18,804,124 23,012,423 14,523,039 - 94,489,371Trading securities - Debt securities - - 12,952,024 - - - - 12,952,024Derivative financial instruments - 6,637 - - - 25 6,662Investment securities - Debt securities - - 52,432,287 - - - - 52,432,287Assets pledged as collateral - - 4,041,522 - - - - 4,041,522Other assets (464,987) 82,740 477,932 - - 30,912 17,255 143,852 37,684,798 261,786,827 69,903,765 18,804,124 23,012,423 14,553,951 17,280 425,763,169
Bonds and guarantees 1 ,137,1 10 9,016,043 - 586,823 1,148,144 93,163 1,791,123 13,772,406Loan commitments 12,050,697 851,064 - - 5,923,837 26,669 2,071,127 20,923,394Other credit related obligations 10,418,352 - - 1,715,424 770,664 2,738,712 642,412 16,285,564 23,606,159 9,867,107 - 2,302,247 7,842,645 2,858,544 4,504,662 50,981,364
At 31 December 2015 61,290,957 271,653,934 69,903,765 21,106,371 30,855,068 17,412,495 4,521,942 476,744,533
Collateral held as at 31 December 2015 3,825,375 - - 17,836 33,000.00 1,379,303 123,425.80 5,378,940
Maximum Exposure 48,865,744 154,941,390 - 20,532,830 32,234,046 14,523,039 6,635,408Minimum Exposure 27,506,550 6,535,302 - 18,128,001 23,012,423 7,866,953 -
Notes to the Annual Financial Statements

90 2016 ANNUAL REPORT
Collateral held as security for loans -
Summary of collateral pledged against loans and advances by collateral type
4.1.7 Loans and Advances Loans and advances are summarised as follows: Analysis by portfolio distribution and risk rating
The total impairment for loans and advances is N2,270 million (2015: N9,294 million) of which N92.35 million (2015: N7,477.98 million) represents the individually impaired loans and the remaining amount of N2,133 million (2015: N1,648 million) represents the portfolio allowance. Further information of the impairment allowance for loans and advances to banks and to customers is provided in Notes 17 and 21 respectively. Objective evidence that financial assets are impaired can include significant financial difficulty, default on the facility or probability that the obligor will enter bankruptcy, the disappearance of an active market for a security, or other observable data relating to a group of assets such as adverse changes in the payment status of borrowers or issuers in the group, or economic conditions that correlate with defaults in the group. All other financial assets are neither past due nor impaired
2016 2015 Collateral Loan & advances % Collateral Loan & advances % amount to customers coverage amount to customes coverage N’000 N’000 N’000 N’000
Cash 155,637 87,515 178% 206,637 96,409 214%
Fixed & Floating debenture 4,156,196 1,829,430 227% 4,449,196 8,051,439 55%
Floating debenture 332,500 1,172,554 28% 225,000 127,096 177%
Legal Mortgage 90,000 11,964 752% 405,000 649,458 62%
Legal Mortgage & Cash - - 0% 93,107 89,555 104%
Unsecured - 116,678,622 0% - 94,601,314 0%
4,734,333 119,780,085 5,378,940 103,615,271
2016 2015 Collateral Loan & advances Total Collateral Loan & advances Total amount to customers amount to customes N’000 N’000 N’000 N’000
Neither past due or impaired 119,687,732 113,212,141 232,899,873 96,137,294 158,540,217 254,677,511
Past due but not impaired - - - - - -
Individually impaired 92,353 - 92,352 7,477,978 - 7,477,978
Gross 119,780,085 113,212,141 232,992,225 103,615,272 158,540,217 262,155,489
Less: Allowance for impairment (2,225,413) (44,149) (2,269,562) (9,125,901) (168,437) (9,294,338)
Net 117,554,672 113,167,992 230,722,664 94,489,371 158,371,780 252,861,151
Allowance for impairment:
Individually impaired 92,353 - 92,353 7,477,978 - 7,477,978
Portfolio allowance 2,133,061 44,149 2,177,209 1,647,923 168,437 1,816,360
Total 2,225,414 44,149 2,269,562 9,125,901 168,437 9,294,338
Sectoral breakdown 2016 2015 N’000 N’000Other 80,000 123,426 General Commerce - 1,379,303 Manufacturing 4,636,497 3,825,375 Oil & Gas - 33,000 Telecommunications 17,836 17,836 4,734,333 5,378,940
Notes to the Annual Financial Statements
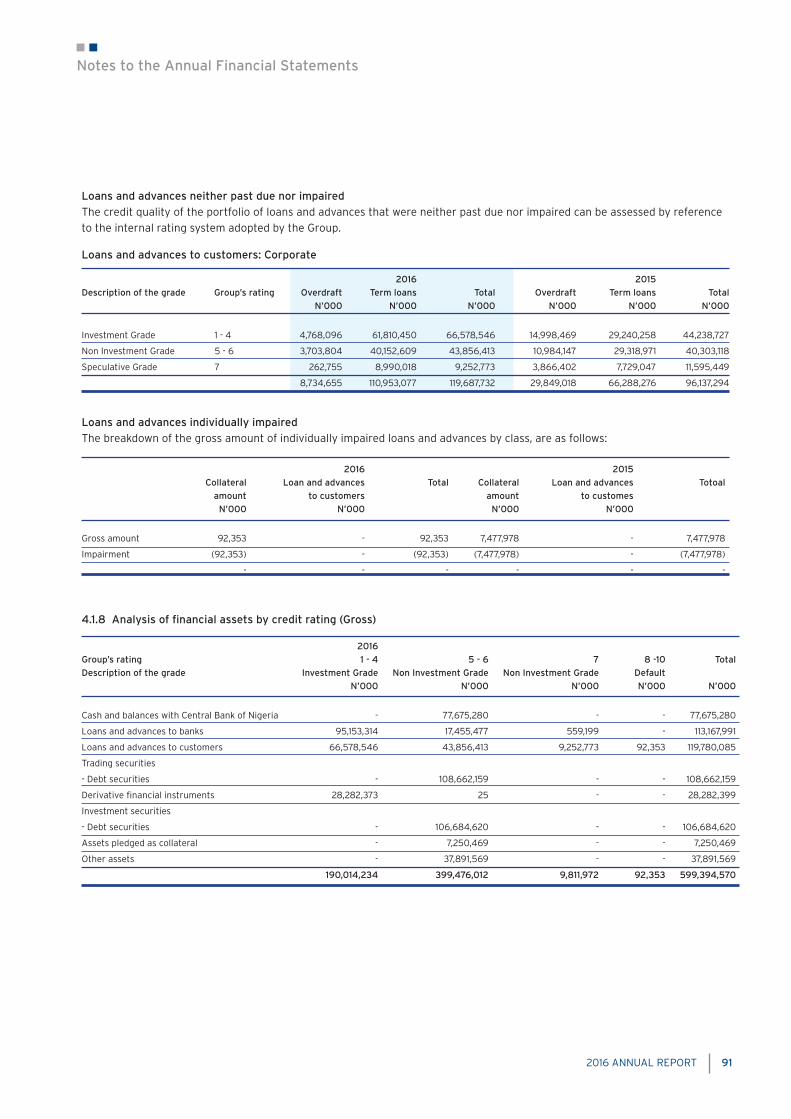
2016 ANNUAL REPORT 91
2016 2015 Description of the grade Group’s rating Overdraft Term loans Total Overdraft Term loans Total N’000 N’000 N’000 N’000 N’000 N’000
Investment Grade 1 - 4 4,768,096 61,810,450 66,578,546 14,998,469 29,240,258 44,238,727
Non Investment Grade 5 - 6 3,703,804 40,152,609 43,856,413 10,984,147 29,318,971 40,303,118
Speculative Grade 7 262,755 8,990,018 9,252,773 3,866,402 7,729,047 11,595,449
8,734,655 110,953,077 119,687,732 29,849,018 66,288,276 96,137,294
Loans and advances to customers: Corporate
4.1.8 Analysis of financial assets by credit rating (Gross)
Loans and advances individually impaired The breakdown of the gross amount of individually impaired loans and advances by class, are as follows:
2016 2015 Collateral Loan and advances Total Collateral Loan and advances Totoal amount to customers amount to customes N’000 N’000 N’000 N’000
Gross amount 92,353 - 92,353 7,477,978 - 7,477,978
Impairment (92,353) - (92,353) (7,477,978) - (7,477,978)
- - - - - -
2016 Group’s rating 1 - 4 5 - 6 7 8 -10 TotalDescription of the grade Investment Grade Non Investment Grade Non Investment Grade Default N’000 N’000 N’000 N’000 N’000
Cash and balances with Central Bank of Nigeria - 77,675,280 - - 77,675,280
Loans and advances to banks 95,153,314 17,455,477 559,199 - 113,167,991
Loans and advances to customers 66,578,546 43,856,413 9,252,773 92,353 119,780,085
Trading securities
- Debt securities - 108,662,159 - - 108,662,159
Derivative financial instruments 28,282,373 25 - - 28,282,399
Investment securities
- Debt securities - 106,684,620 - - 106,684,620
Assets pledged as collateral - 7,250,469 - - 7,250,469
Other assets - 37,891,569 - - 37,891,569
190,014,234 399,476,012 9,811,972 92,353 599,394,570
Loans and advances neither past due nor impaired The credit quality of the portfolio of loans and advances that were neither past due nor impaired can be assessed by reference to the internal rating system adopted by the Group.
Notes to the Annual Financial Statements

92 2016 ANNUAL REPORT
4.2 Market Risk
Market risk is the risk that the fair value of future cash flows of a financial instrument will fluctuate because of changes in market prices. Market risk comprises both currency risk and price risk. Currency risk is the risk that the fair value or future cash flows of a financial instrument will fluctuate because of changes in foreign exchange rates. Price risk is the earnings risk from changes in interest rates, and equity and commodity prices. Price risk arises in non-trading portfolios, as well as in trading portfolios. Market risks are measured in accordance with established standards to ensure consistency across businesses and the ability to aggregate risk. The Group is required to establish, with approval from independent market risk management, a market risk limit framework for identified risk factors that clearly defines approved risk profiles which are within the parameters of Citigroup’s overall risk appetite. In all cases, the Group’s Treasury department is ultimately responsible for the market risks of the Group and for remaining within its defined limits. The table below summarises the interest rate risk exposure of the financial assets and liabilities. The assets and liabilities are included at carrying amount and categorized by the earlier of contractual re-pricing or maturity dates.
2015 Group’s rating 1 - 4 5 - 6 7 8 -10 TotalDescription of the grade Investment Grade Non Investment Grade Non Investment Grade Default N’000 N’000 N’000 N’000
Cash and balances with Central Bank of Nigeria - 103,325,670 - - 103,325,670
Loans and advances to banks 140,357,104 17,455,477 559,199 - 158,371,780
Loans and advances to customers 44,238,727 40,303,118 2,469,548 7,477,978 94,489,371
Trading securities
- Debt securities - 12,952,024 - - 12,952,024
Derivative financial instruments 6,637 25 - - 6,662
Investment securities
- Debt securities - 52,432,287 - - 52,432,287
Assets pledged as collateral - 4,041,522 - - 4,041,522
Other assets - 143,852 - - 143,852
184,602,468 230,653,976 3,028,747 7,477,978 425,763,169
Notes to the Annual Financial Statements

2016 ANNUAL REPORT 93
Group
31 December 2016 Carrying Up to 1 – 3 3 – 12 1 – 5 Over Non interest amount 1 month months months years 5 years bearing N’000 N’000 N’000 N’000 N’000 N’000 N’000
Assets:
Balances with Central Bank of Nigeria 77,675,280 77,675,280 - - - - -
Loans and advances to banks 113,167,991 110,262,296 - 2,905,695 - - -
Loans and advances to customers 117,554,672 63,591,176 24,022,273 5,220,220 11,242,238 13,478,765 -
Trading securities 108,662,159 359,498 698,853 107,287,494 181,545 134,770 -
Derivative financial instruments 28,282,399 - - 4,338,435 - - 23,943,964
Investment securities 106,684,620 420,051 8,660,870 59,405,691 38,176,013 21,993 -
Assets pledged as collateral 7,250,469 1,996,721 4,052,085 916,215 285,448 - -
Other assets 37,891,569 3,258,426 - - - - 34,633,143
Total financial assets 597,169,159 257,563,448 37,434,081 180,073,750 49,885,244 13,635,528 58,577,107
Liabilities:
Deposits from banks 1,034,242 1,034,242 - - - - -
Deposits from customers 485,845,373 466,704,329 7,408,150 3,400,765 - 8,332,129 -
Derivative financial instruments 22,335,602 - - 34,439 - - 22,301,163
Other borrowed funds - - - - - -
Other liabilities (excluding accruals) 12,937,860 - - - - - 12,937,860
Total financial liabilities 522,153,077 467,738,571 7,408,150 3,435,204 - 8,332,129 35,239,023
Bank
31 December 2016 Carrying Up to 1 – 3 3 – 12 1 – 5 Over Non interest amount 1 month months months years 5 years bearing N’000 N’000 N’000 N’000 N’000 N’000 N’000
Assets:
Cash and balances with
Central Bank of Nigeria 77,675,280 77,675,280 - - - - -
Loans and advances to banks 113,167,991 110,262,296 - 2,905,695 - - -
Loans and advances to customers 117,554,672 63,591,176 24,022,273 5,220,220 11,242,238 13,478,765 -
Trading securities 108,662,159 359,498 698,853 107,287,494 181,545 134,770 -
Derivative financial instruments 28,282,399 - - 4,338,435 - - 23,943,964
Investment securities 106,684,620 420,051 8,660,870 59,405,691 38,176,013 21,993 -
Assets pledged as collateral 7,250,469 1,996,721 4,052,085 916,215 285,448 - -
Other assets 37,891,569 3,258,426 - - - - 34,633,143
Total financial assets 597,169,159 257,563,448 37,434,081 180,073,750 49,885,244 13,635,528 58,577,107
Liabilities:
Deposits from banks 1,034,242 1,034,242 - - - - -
Deposits from customers 485,847,157 466,706,113 7,408,150 3,400,765 - 8,332,129 -
Derivative financial instruments 22,335,602 - - 34,439 - - 22,301,163
Other liabilities (excluding accruals) 12,937,860 - - - - - 12,937,860
Total financial liabilities 522,154,861 467,740,355 7,408,150 3,435,204 - 8,332,129 35,239,023
Notes to the Annual Financial Statements

94 2016 ANNUAL REPORT
Group
31 December 2015 Carrying Up to 1 – 3 3 – 12 1 – 5 Over Non interest amount 1 month months months years 5 years bearing N’000 N’000 N’000 N’000 N’000 N’000 N’000
Assets:
Cash and balances with Central Bank
of Nigeria 103,325,670 103,325,670 - - - - -
Loans and advances to banks 158,371,780 147,857,926 - 6,114,804 4,399,050 - -
Loans and advances to customers 94,489,371 45,170,332 24,100,281 7,225,951 12,703,761 5,289,046 -
Trading securities 12,952,024 148,341 104,197 5,612,759 6,320,221 766,506 -
Derivative financial instruments 6,662 - - - - - 6,662
Investment securities 53,058,829 - - 32,258,962 20,147,084 652,783 -
Assets pledged as collateral 4,041,522 - - 4,041,522 - - -
Other assets 143,852 - - - - - 143,852
Total financial assets 426,389,710 296,502,269 24,204,478 55,253,998 43,570,116 6,708,335 150,514
Liabilities:
Deposits from banks 770,983 770,983 - - - - -
Deposits from customers 358,184,320 357,446,184 645,612 92,524 - - -
Derivative financial instruments 6,466 - - - - - 6,466
Other borrowed funds - - - - - -
Other liabilities 7,294,309 - - - - - 7,784,263
Total financial liabilities 366,256,078 358,217,167 645,612 92,524 - - 7,790,729
Bank
31 December 2015 Carrying Up to 1 – 3 3 – 12 1 – 5 Over Non interest amount 1 month months months years 5 years bearing N’000 N’000 N’000 N’000 N’000 N’000 N’000
Assets:
Cash and balances with
Central Bank of Nigeria 103,325,670 103,325,670 - - - - -
Loans and advances to banks 158,371,780 147,857,926 - 6,114,804 4,399,050 - -
Loans and advances to customers 94,489,371 45,170,332 24,100,281 7,225,951 12,703,761 5,289,046 -
Trading securities 12,952,024 148,341 104,197 5,612,759 6,320,221 766,506 -
Derivative financial instruments 6,662 - - - - - 6,662
Investment securities 53,058,829 - - 32,258,962 20,147,084 652,783 -
Assets pledged as collateral 4,041,522 - - 4,041,522 - - -
Other assets 143,852 - - - - - 143,852
Total financial assets 426,389,710 296,502,269 24,204,478 55,253,998 43,570,116 6,708,335 150,514
Liabilities:
Deposits from banks 770,983 770,983 - - - - -
Deposits from customers 358,185,854 357,447,717 645,612 92,524 - - -
Derivative financial instruments 6,466 - - - - - 6,466
Other borrowed funds - - - - - -
Other liabilities 7,294,309 - - - - - 7,784,263
Total financial liabilities 366,257,612 358,218,700 645,612 92,524 - - 7,790,729
Notes to the Annual Financial Statements

2016 ANNUAL REPORT 95
4.2.1 Foreign exchange risk
Foreign Exchange risk is the exposure of the Group’s financial condition to adverse movements in exchange rates. The Group is exposed to foreign exchange risk primarily through its assets, managing customers’ deposits and through acting as an intermediary in foreign exchange transactions.
Foreign exchange risk management The Group has a robust risk management system that identifies, measures and mitigates the foreign currency exchange rate risk on its financial position and cash flows. Apart from regulatory imposed limits such as the net open position limit (OPL) that helps to limit these exposures, the Group has market risk limits such as:
- Individual overnight position limits for individual currency positions, which limits exchange rate risk in all currencies that the Group has exposures.
- Cross currency funding limits (CCFL) that restricts the proportion of local currency assets funded by foreign currency liabilities. - Daily mark-to-market mechanism that revalues all currency positions daily, ensuring that foreign currency positions are valued at current market price and not at cost.
- Trading Management Action Trigger (MAT): This limits, on a realized or mark–to-market basis, the maximum loss that your total currency position can make before escalation is made to the Group’s management and the positions liquidated or effectively hedged. Where there are available-for-sale securities denominated in currencies other than the local currency (Naira), the Group
could mitigate the change in fair value attributable to foreign-exchange rate movements in those securities. Typically, the instrument employed is a forward foreign-exchange contracts.
The table below summarizes the Group’s exposure to foreign currency exchange rate risk at 31 December 2016. Included in the table are the Group’s financial assets and liabilities at carrying amounts, categorised by currency.
Group At 31 December 2016 Naira Dollar GBP Euro Others Total N’000 N’000 N’000 N’000 N’000 N’000Assets
Balances with Central bank of Nigeria 76,985,882 622,680 49,816 16,902 - 77,675,280
Loans and advances to banks 29,423,524 64,833,439 3,960,015 14,847,529 103,483 113,167,990
Loans and advances to customers 74,646,403 41,618,664 28,793 1,240,597 20,216 117,554,673
Trading securities 108,662,159 - - - - -
- 108,662,159
Derivative financial instruments 28,282,399 - - - - 28,282,399
Investment securities 108,622,549 - - - - 108,622,549
Assets pledged as collateral 7,250,469 - - - - 7,250,469
Other assets 36,844,508 773,166 29,681 244,213 - 37,891,568
Total financial assets 470,717,893 107,847,949 4,068,305 16,349,241 123,699 599,107,086
Naira Dollar GBP Euro Others TotalLiabilities N’000 N’000 N’000 N’000 N’000 N’000
Deposits from banks 716,948 166,210 148,648 - 2,437 1,034,242
Deposits from customers 236,953,139 232,394,342 1,187,531 15,213,327 97,034 485,845,373
Derivative financial instruments 22,335,602 - - - 22,335,602
Other borrowed funds - - - - - -
Other liabilities(excluding accruals) 11,465,249 1,330,457 25,863 116,291 - 12,937,860
Total financial liabilities 271,470,938 233,891,009 1,362,042 15,329,618 99,471 522,153,077
Net financial position 199,246,955 (126,043,059) 2,706,263 1,019,623 24,229 76,954,009
Credit commitments and other financial facilities 15,873,080 36,880,628 2,196,342 6,451 29,121 54,985,622
Notes to the Annual Financial Statements

96 2016 ANNUAL REPORT
Bank At 31 December 2016 Naira Dollar GBP Euro Others Total N’000 N’000 N’000 N’000 N’000 N’000
Assets
Balances with Central bank of Nigeria 76,985,882 622,680 49,816 16,902 - 77,675,280
Loans and advances to banks 29,423,524 64,833,439 3,960,015 14,847,529 103,483 113,167,991
Loans and advances to customers 74,646,403 41,618,664 28,793 1,240,597 20,216 117,554,673
Trading securities 108,662,159 - - - - 108,662,159
Derivative financial instruments 28,282,399 - - - - 28,282,399
Investment securities 108,622,549 - - - 108,622,549
Assets pledged as collateral 7,250,469 - - - - 7,250,469
Other assets 36,844,508 773,166 29,681 244,213 - 37,891,569
Total financial assets 470,717,893 107,847,948 4,068,305 16,349,241 123,699 599,107,089
Naira Dollar GBP Euro Others TotalLiabilities N’000 N’000 N’000 N’000 N’000 N’000
Deposits from banks 716,948 166,210 148,648 - 2,437 1,034,242
Deposits from customers 236,954,923 232,394,342 1,187,531 15,213,327 97,034 485,847,157
Derivative financial instruments 22,335,602 - - - - 22,335,602
Other borrowed funds - - - - - -
Other liabilities(excluding accruals) 13,152,828 1,330,457 25,863 116,291 - 12,937,860
Total financial liabilities 273,160,301 233,891,009 1,362,042 15,329,618 99,471 522,154,861
Net financial position 197,557,592 (126,043,060) 2,706,263 1,019,623 24,229 76,952,228
Credit commitments and other financial facilities 15,873,080 36,880,628 2,196,342 6,451 29,121 54,985,622
Group At 31 December 2015 Naira Dollar GBP Euro Others Total N’000 N’000 N’000 N’000 N’000 N’000
Balances with Central bank of Nigeria 102,965,781 341,580 1,609 16,700 - 103,325,670
Loans and advances to banks 16,579,271 130,416,672 639,090 10,675,497 61,251 158,371,780
Loans and advances to customers 59,308,720 35,143,793 - 36,858 - 94,489,372
Trading securities 12,952,024 - - - - 12,952,024
Derivative financial instruments 6,662 - - - - 6,662
Investment securities 53,058,829 - - - - 53,058,829
Assets pledged as collateral 4,041,522 - - - - 4,041,522
Other assets 110,310 24,965 - 8,361 217 143,852
Total financial assets 249,023,120 165,927,009 640,699 10,737,415 61,468 426,389,712
Liabilities
Deposits from banks 214,925 46,241 91,436 99 418,282 770,983
Deposits from customers 183,877,623 162,878,307 509,129 10,884,086 35,176 358,184,320
Derivative financial instruments 6,466 - - - 6,466
Other borrowed funds - - - - - -
Other liabilities 6,595,203 691,798 5,708 1,600 - 7,294,309
Total financial liabilities 190,694,216 163,616,345 606,273 10,885,785 453,458 366,256,077
Net financial position 58,328,903 2,310,664 34,426 (148,370) (391,990) 60,133,635
Credit commitments and other financial facilities 11,868,821 36,880,628 2,196,342 6,451 29,121 50,981,363
Notes to the Annual Financial Statements

2016 ANNUAL REPORT 97
Bank At 31 December 2015 Naira Dollar GBP Euro Others Total N’000 N’000 N’000 N’000 N’000 N’000Assets
Balances with Central bank of Nigeria 102,965,781 341,580 1,609 16,700 - 103,325,670
Loans and advances to banks 16,579,271 130,416,672 639,090 10,675,497 61,251 158,371,780
Loans and advances to customers 59,308,720 35,143,793 - 36,858 - 94,489,372
Trading securities 12,952,024 - - - - 12,952,024
Derivative financial instruments 6,662 - - - - 6,662
Investment securities 53,058,829 - - - - 53,058,829
Assets pledged as collateral 4,041,522 - - - - 4,041,522
Other assets 110,310 24,965 - 8,361 217 143,853
Total financial assets 249,023,119 165,927,009 640,699 10,737,416 61,468 426,389,712
Liabilities
Deposits from banks 214,925 46,241 91,436 99 418,282 770,983
Deposits from customers 183,877,623 162,878,307 509,129 10,884,086 35,176 358,185,854
Derivative financial instruments 6,466 - - - 6,466
Other borrowed funds - - - - - -
Other liabilities 6,595,203 691,798 5,708 1,600 - 7,294,309
Total financial liabilities 190,694,217 163,616,345 606,273 10,885,785 453,458 366,257,612
Net financial position 58,328,902 2,310,664 34,426 (148,369) (391,990) 60,132,100
Credit commitments and other financial facilities 11,868,821 36,880,628 2,196,342 6,451 29,121 50,981,363
Foreign exchange sensitivity analysisThe group is part of an international entity that operates and has exposures to foreign exchange risk arising from various currency exposures, mainly to the US dollar, UK pound and the Euros. Foreign exchange risk arises from future commercial transactions, recognised assets and liabilities and net investments in foreign operations. Instruments such as foreign currency denominated loans and securities, future cash flows in foreign currencies arising from foreign exchange transactions, foreign currency denominated debt etc. are all exposed to foreign exchange risk.
Notes to the Annual Financial Statements

98 2016 ANNUAL REPORT
There are other foreign currencies which are not significant to the balance sheet as at December 2016 The sensitivity analysis above is prepared based on assumptions that all other variables are kept constant while the exchange rate increases or decreases. These sensitivity analyses impact profit or loss which will eventually flow in to the equity in form of retained earnings.
Group 2016 2015 31st December, 2016 Dollar GBP Euro Dollar GBP Euro 000 000 000 000 000 000
Cash and balances with Central Bank of Nigeria 1,977 129 51 1,717 5 77
Loans and advances to banks 311,387 10,219 44,640 655,525 2,168 49,265
Loans and advances to customers 132,123 74 3,730 176,646 - 170
Derivative financial assets 27,217,681 - 13,947 - 15,979 -
Other assets (excl. prepayments) 2,454 77 734 125 - 444
Deposits from banks (528) (384) - (232) (310) -
Deposits from customers (737,760) (3,064) (45,739) (818,690) (1,727) (50,227)
Derivative financial liabilities (1,019,089) - (67,099) - (5,643) -
Other liabilities (excl. accruals) (4,224) (67) (350) (3,477) (19) (7)
Foreign currency exposure on net monetary items 25,904,021 (46,168) 13,402 11,614 117 (278)
The value of these instruments fluctuate with changes in the level of volatility of currency exchange rates or foreign interest rates.
2016 2015 31st December, 2016 Dollar GBP Euro Dollar GBP Euro
Sensitivity @ 60% increase (2015:30%) 47,450,361 2,396,998 9,506,902 49,778,103 192,210 3,247,561
Sensitivity @ 70% increase (2015:40%) 55,358,754 2,796,497 11,091,385 66,370,804 256,280 4,330,082
Sensitivity @ 30% decrease ( 2015:5%) (23,725,180) (1,198,499) (4,753,451) (8,296,350) (32,035) (541,260)
Sensitivity @ 40% decrease (2015:40%) (31,633,574) (1,597,999) (6,337,934) (16,592,701) (64,070) (1,082,520)
4.2.2 Price risk Price risk is the risk that the fair value of future cash flows of a financial instrument will fluctuate because of changes in market prices, whether those changes are caused by factors specific to the individual financial instrument or its issuer or by factors affecting all similar financial instruments traded in the market. The Group assess the potential impact that fluctuations of idenfied market risk factors would have on the Group’s income and the value of its holdings of financial instruments. Price risk management
Non trading portfolios Interest rate riskOne of Group’s primary business functions is providing financial products that meet the needs of its customers. Loans and deposits are tailored to the customers’ requirements with regard to tenor, index, and rate type. Net interest revenue (NIR) is the difference between the yield earned on the non-trading portfolio assets (including customer loans) and the rate paid on the liabilities (including customer deposits or wholesale borrowings). NIR is affected by changes in the level of interest rates. For example: - At any given time, there may be an unequal amount of assets and liabilities which are subject to market rates due to maturation
or repricing. Whenever the amount of liabilities subject to repricing exceeds the amount of assets subject to repricing, a company is considered “liability sensitive.” In this case, a company’s NIR will deteriorate in a rising rate environment.
Notes to the Annual Financial Statements
The fair values of the Group and bank’s monetary items (including financial investments and derivative financial instruments) that have foreign currency exposure at 31 December are shown below;

2016 ANNUAL REPORT 99
- The assets and liabilities of a company may reprice at different speeds or mature at different times, subjecting both
“liability-sensitive” and “asset sensitive” companies to NIR sensitivity from changing interest rates. For example, a company may have a large amount of loans that are subject to repricing at a particular period, but the majority of deposits are not scheduled for repricing until the following period. That company would suffer from NIR deterioration if interest rates were to fall.
NIR in the current period is the result of customer transactions and the related contractual rates originated in prior periods as well as new transactions in the current period. Those prior-period transactions will be impacted by changes in rates on floating-rate assets and liabilities in the current period. Due to the long-term nature of the portfolios, NIR will vary from quarter to quarter even assuming no change in the shape or level of the yield curve as the assets and liabilities reprice. These repricings are a function of implied forward interest rates, which represent the overall market’s unbiased estimate of future interest rates and incorporate possible changes in the overnight rate as well as the shape of the yield curve.
Interest rate risk governanceThe risks in the Group’s non-traded portfolios are estimated using a common set of standards that define, measure, limit and report the market risk. Each business is required to establish, with approval from independent market risk management, a market risk limit framework that clearly defines approved risk profiles and is within the parameters of the Group’s overall risk appetite. In all cases, the businesses are ultimately responsible for the market risks they take and for remaining within their defined limits. These limits are monitored by independent market risk, country and business ALCOs and financial control. Interest rate risk measurementThe principal risk to which non-trading portfolios are exposed is the risk of loss from fluctuations in the future cash flows or fair values of financial instruments because of a change in market interest rates. Interest rate risk is managed principally through monitoring interest rate gaps and by having pre-approved limits. ALCO is the monitoring body for compliance with these limits and is assisted by Treasury in its day-to-day monitoring activities.
The Group’s principal measure of risk to net interest revenue is interest rate exposure (IRE). IRE measures the change in expected net interest revenue in each currency resulting solely from unanticipated changes in interest rates. Factors such as changes in volumes, spreads, margins and the impact of prior-period pricing decisions are not captured by IRE. IRE assumes that businesses make no additional changes in pricing or balances in response to the unanticipated rate changes. IRE mesures the potential impact on net interest revenue over a specified period, for the accrual positions, from a defined parallel shift in the yield curve. It is a forward-looking measure, analogous to factor sensitivity on the trading portfolios. The IRE measures the potential change of interest rate margin of the Bank for 100 basis points parallel change of interest rate curve in the horizon. The impact of changing prepayment rates on loan portfolios is incorporated into the results. For example, in the declining interest rate scenarios, it is assumed that mortgage portfolios faster have a faster repayment period and income is reduced. In addition, in a rising interest rate scenario, portions of the deposit portfolio are assumed to experience rate increases that may be less than the change in market interest rates. Sensitivity analysis interest rate riskThe management of interest rate risk against interest rate gap limits is supplemented by monitoring the sensitivity of the Group’s financial assets and liabilities to specific interest rate scenarios. The sensitivity analysis is the effect of the assumed changes in interest rates on the profit or loss for the period, based on the floating rate non–trading financial assets and financial liabilities held at 31 December 2016. The sensitivity analysis on the non-trading portfolio is measured by the change in DV01(Dollar value of 01) that measures the change in value of the non-trading accrual portfolio due to a 100 basis point parallel move in the interest rates. At 31 December 2016, a 100 basis point parallel increase in the interest rates with all other variables held constant would have resulted to a total loss of N472,500 (2015: N238,740). On the available-for-sale
Notes to the Annual Financial Statements
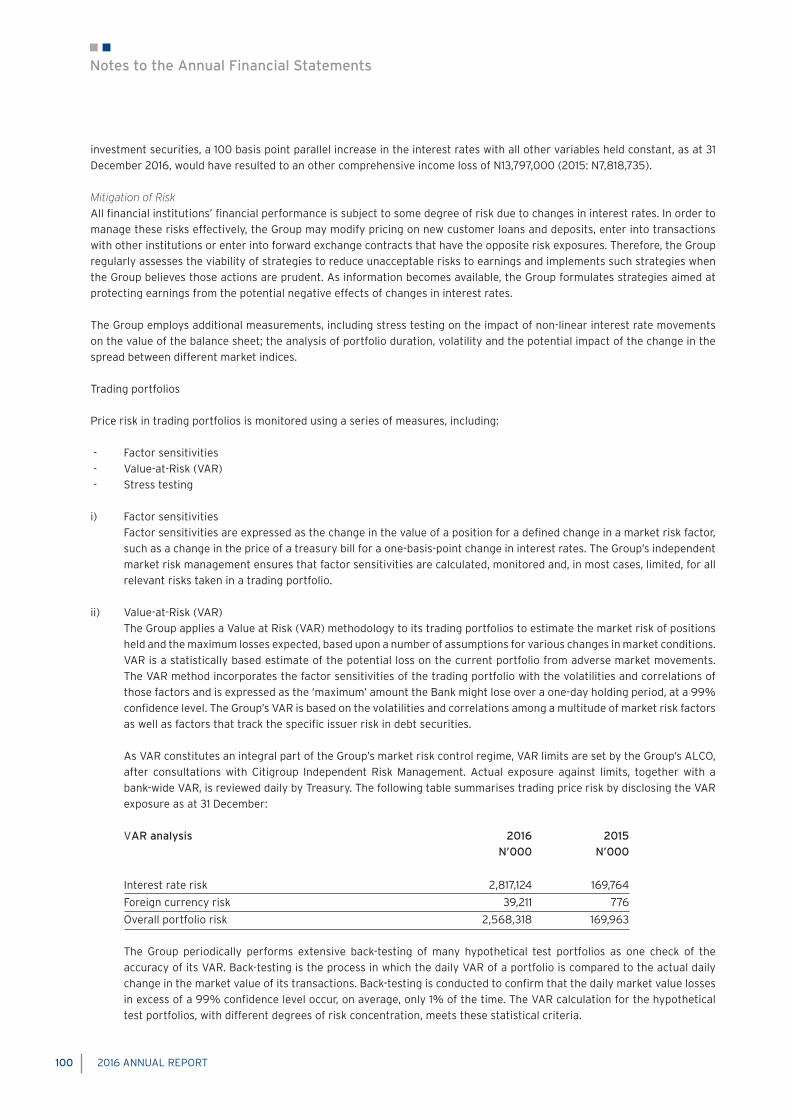
100 2016 ANNUAL REPORT
investment securities, a 100 basis point parallel increase in the interest rates with all other variables held constant, as at 31 December 2016, would have resulted to an other comprehensive income loss of N13,797,000 (2015: N7,818,735). Mitigation of RiskAll financial institutions’ financial performance is subject to some degree of risk due to changes in interest rates. In order to manage these risks effectively, the Group may modify pricing on new customer loans and deposits, enter into transactions with other institutions or enter into forward exchange contracts that have the opposite risk exposures. Therefore, the Group regularly assesses the viability of strategies to reduce unacceptable risks to earnings and implements such strategies when the Group believes those actions are prudent. As information becomes available, the Group formulates strategies aimed at protecting earnings from the potential negative effects of changes in interest rates. The Group employs additional measurements, including stress testing on the impact of non-linear interest rate movements on the value of the balance sheet; the analysis of portfolio duration, volatility and the potential impact of the change in the spread between different market indices.
Trading portfolios Price risk in trading portfolios is monitored using a series of measures, including: - Factor sensitivities - Value-at-Risk (VAR) - Stress testing i) Factor sensitivities Factor sensitivities are expressed as the change in the value of a position for a defined change in a market risk factor,
such as a change in the price of a treasury bill for a one-basis-point change in interest rates. The Group’s independent market risk management ensures that factor sensitivities are calculated, monitored and, in most cases, limited, for all relevant risks taken in a trading portfolio.
ii) Value-at-Risk (VAR) The Group applies a Value at Risk (VAR) methodology to its trading portfolios to estimate the market risk of positions
held and the maximum losses expected, based upon a number of assumptions for various changes in market conditions. VAR is a statistically based estimate of the potential loss on the current portfolio from adverse market movements. The VAR method incorporates the factor sensitivities of the trading portfolio with the volatilities and correlations of those factors and is expressed as the ‘maximum’ amount the Bank might lose over a one-day holding period, at a 99% confidence level. The Group’s VAR is based on the volatilities and correlations among a multitude of market risk factors as well as factors that track the specific issuer risk in debt securities.
As VAR constitutes an integral part of the Group’s market risk control regime, VAR limits are set by the Group’s ALCO,
after consultations with Citigroup Independent Risk Management. Actual exposure against limits, together with a bank-wide VAR, is reviewed daily by Treasury. The following table summarises trading price risk by disclosing the VAR exposure as at 31 December:
VAR analysis 2016 2015 N’000 N’000
Interest rate risk 2,817,124 169,764
Foreign currency risk 39,211 776
Overall portfolio risk 2,568,318 169,963
The Group periodically performs extensive back-testing of many hypothetical test portfolios as one check of the accuracy of its VAR. Back-testing is the process in which the daily VAR of a portfolio is compared to the actual daily change in the market value of its transactions. Back-testing is conducted to confirm that the daily market value losses in excess of a 99% confidence level occur, on average, only 1% of the time. The VAR calculation for the hypothetical test portfolios, with different degrees of risk concentration, meets these statistical criteria.
Notes to the Annual Financial Statements

2016 ANNUAL REPORT 101
iii) Stress testing Stress testing is performed on trading portfolios on a regular basis to estimate the impact of extreme market movements.
It is performed on both individual trading portfolios, and on aggregations of portfolios and businesses. Independent market risk management, in conjunction with the businesses, develops stress scenarios, reviews the output of periodic stress testing exercises, and uses the information to make judgments as to the ongoing appropriateness of exposure levels and limits.
Each trading portfolio has its own market risk limit framework encompassing these measures and other controls, including permitted product lists and a new product approval process for complex products.
The level of price risk exposure at any given point in time depends on the market environment and expectations of future price and market movements, and will vary from period to period.
4.3 Liquidity riskLiquidity risk is the risk that the Group is unable to meet its obligations as and when they fall due without affecting its daily operations or its financial condition. The Group’s approach to managing liquidity is to ensure, as far as possible, that it always has sufficient liquidity to meet its liabilities when due, under both normal and stressed conditions, without incurring unacceptable losses or risking damage to the bank’s reputation. Liquidity risk management Management of liquidity at the Group is the responsibility of the Risk Treasurer. There is a uniform liquidity risk management policy for Citigroup. Under this policy, there is a single set of standards for the measurement of liquidity risk in order to ensure consistency across businesses, stability in methodologies and transparency of risk. Management of liquidity risk is performed on a daily basis and is monitored by the Country Treasurer and independent risk management, combined with an active corporate oversight function. The Group’s ALCO undertakes this oversight responsibility along with the Country Treasurer. One of the objectives of ALCO is to monitor and review the overall liquidity and balance sheet positions of the Group. The Risk Treasurer must prepare an annual funding and liquidity plan for review by the Country Treasurer and approved by independent risk management. The funding and liquidity plan includes analysis of the statement of financial position, as well as the economic and business conditions impacting the liquidity of the Group. As part of the funding and liquidity plan, liquidity limits, liquidity ratios, market triggers, and assumptions for periodic stress tests are established and approved. At a minimum, these parameters are reviewed on an annual basis. Liquidity limits Liquidity limits establish boundaries for market access in business-as-usual conditions and are monitored against the liquidity position on a daily basis. These limits are established based on the size of the statement of financial position, depth of the market, experience level of local management, stability of the liabilities and liquidity of the assets. Finally, the limits are subject to evaluation of the Group’s stress test result. Generally, limits are established such that in stress scenarios, the entities are self-funded or net providers of liquidity. Thus, the risk tolerance of the liquidity position is limited based on the capacity to cover the position in a stressed environment. These limits are the key daily risk management tools for Treasury management. Liquidity sourcesThe Group maintains cash and a portfolio of highly liquid government securities that could be sold or financed on a secured basis. Liquidity ratiosA series of standard corporate-wide liquidity ratios have been established to monitor the structural elements of the Group’s liquidity. Ratios are established for liquid assets against short-term obligations. Key liquidity ratios include cash capital (defined as core deposits, long-term debt, and capital compared with illiquid assets), liquid assets against liquidity gaps, core deposits to loans, and deposits to loans. Several measures exist to review potential concentrations of funding by individual name, product, industry, or geography. Triggers for management discussion, which may result in other actions, have been established against these ratios.
Notes to the Annual Financial Statements

102 2016 ANNUAL REPORT
The Central Bank of Nigeria requires banks to maintain a statutory minimum liquidity ratio of 30% of liquid assets to all its local currency deposit liabilities. For this purpose, liquid assets comprise cash and balances with Central Bank of Nigeria and other local banks, treasury bills, FGN Bonds, placement and money at call with other banks. Deposit liabilities comprise deposits from customers, deposits from banks. The liquidity ratio at the reporting date 31 December 2016 was 112.52% (2015: 73.00%). Market triggers: Market triggers are internal, external market or economic factors that may imply a change to market liquidity or Citigroup’s access to the markets. Citibank Nigeria’s market triggers are monitored on a weekly basis by the Country Treasurer and the head of Risk and are presented to the ALCO at the monthly meeting. Stress testing: Simulated liquidity stress testing is periodically performed by the Group. A variety of firm-specific and market related scenarios are used at the consolidated level and in individual businesses. These scenarios include assumptions about significant changes in key funding sources, credit ratings, contingent uses of funding, and political and economic conditions in specific countries. The results of the stress tests are reviewed to ensure that the bank is either a self-funded or net provider of liquidity. In addition, a Contingency Funding Plan is prepared on a periodic basis for Citigroup. The plan includes detailed policies, procedures, roles and responsibilities, and the results of corporate stress tests. The product of these stress tests is a series of alternatives that can be used by the Treasurer in a liquidity event.
4.3.1 Analysis of financial assets and liabilities by remaining contractual maturities The table below summarises the maturity profile of the financial assets and liabilities:
Group 31 December 2016 Up to 1 – 3 3 – 12 1 – 5 Over Total 1 month months months years 5 years N’000Assets: N’000 N’000 N’000 N’000 N’000 N’000
Balances with Central Bank of Nigeria 77,675,280 - - - - 77,675,280
Loans and advances to banks 110,262,296 - 2,905,695 - - 113,167,991
Loans and advances to customers 63,591,176 24,022,273 5,220,220 11,242,238 13,478,765 117,554,673
Trading securities 359,498 698,853 107,287,494 181,545 134,770 108,662,160
Derivative financial instruments 514,969 1,872,242 25,895,188 - - 28,282,399
Investment securities 420,051 8,660,870 59,405,691 38,176,013 1,959,924 108,622,549
Assets pledged as collateral 1,996,721 4,052,085 916,215 285,448 - 7,250,469
Other assets 37,807,060 18,219 66,290.67 - - 37,891,569
Total financial assets 292,627,051 39,324,542 201,696,793 49,885,244 15,573,459 599,107,090
Liabilities:
Deposits from banks 1,034,242 - - - - 1,034,242
Deposits from customers 466,704,329 7,408,150 3,400,765 - 8,332,129 485,845,373
Derivative financial instruments 520,680 1,797,614 20,017,308 - - 22,335,602
Other liabilities(excl. accrued expenses) 8,649,437 551,182 1,722,981 458,567 1,555,693 12,937,860
Total financial liabilities 476,908,688 9,756,946 25,141,054 458,567 9,887,822 522,153,077
Net financial asset /(liabilities) (184,281,637) 29,567,596 176,555,739 49,426,677 5,685,637 76,954,013
Notes to the Annual Financial Statements
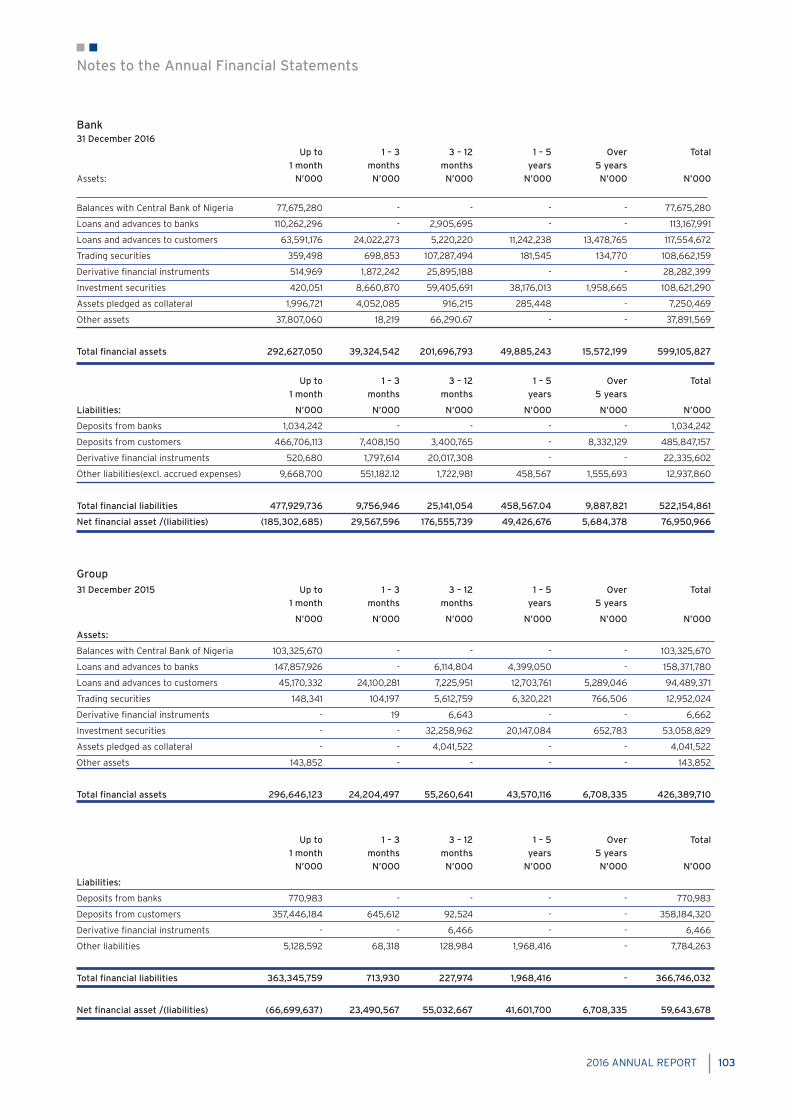
2016 ANNUAL REPORT 103
31 December 2015 Up to 1 – 3 3 – 12 1 – 5 Over Total 1 month months months years 5 years
N’000 N’000 N’000 N’000 N’000 N’000
Assets:
Balances with Central Bank of Nigeria 103,325,670 - - - - 103,325,670
Loans and advances to banks 147,857,926 - 6,114,804 4,399,050 - 158,371,780
Loans and advances to customers 45,170,332 24,100,281 7,225,951 12,703,761 5,289,046 94,489,371
Trading securities 148,341 104,197 5,612,759 6,320,221 766,506 12,952,024
Derivative financial instruments - 19 6,643 - - 6,662
Investment securities - - 32,258,962 20,147,084 652,783 53,058,829
Assets pledged as collateral - - 4,041,522 - - 4,041,522
Other assets 143,852 - - - - 143,852
Total financial assets 296,646,123 24,204,497 55,260,641 43,570,116 6,708,335 426,389,710
Up to 1 – 3 3 – 12 1 – 5 Over Total 1 month months months years 5 years N’000 N’000 N’000 N’000 N’000 N’000
Liabilities:
Deposits from banks 770,983 - - - - 770,983
Deposits from customers 357,446,184 645,612 92,524 - - 358,184,320
Derivative financial instruments - - 6,466 - - 6,466
Other liabilities 5,128,592 68,318 128,984 1,968,416 - 7,784,263
Total financial liabilities 363,345,759 713,930 227,974 1,968,416 - 366,746,032
Net financial asset /(liabilities) (66,699,637) 23,490,567 55,032,667 41,601,700 6,708,335 59,643,678
Bank31 December 2016 Up to 1 – 3 3 – 12 1 – 5 Over Total 1 month months months years 5 years Assets: N’000 N’000 N’000 N’000 N’000 N’000
Balances with Central Bank of Nigeria 77,675,280 - - - - 77,675,280
Loans and advances to banks 110,262,296 - 2,905,695 - - 113,167,991
Loans and advances to customers 63,591,176 24,022,273 5,220,220 11,242,238 13,478,765 117,554,672
Trading securities 359,498 698,853 107,287,494 181,545 134,770 108,662,159
Derivative financial instruments 514,969 1,872,242 25,895,188 - - 28,282,399
Investment securities 420,051 8,660,870 59,405,691 38,176,013 1,958,665 108,621,290
Assets pledged as collateral 1,996,721 4,052,085 916,215 285,448 - 7,250,469
Other assets 37,807,060 18,219 66,290.67 - - 37,891,569
Total financial assets 292,627,050 39,324,542 201,696,793 49,885,243 15,572,199 599,105,827
Up to 1 – 3 3 – 12 1 – 5 Over Total 1 month months months years 5 years
Liabilities: N’000 N’000 N’000 N’000 N’000 N’000
Deposits from banks 1,034,242 - - - - 1,034,242
Deposits from customers 466,706,113 7,408,150 3,400,765 - 8,332,129 485,847,157
Derivative financial instruments 520,680 1,797,614 20,017,308 - - 22,335,602
Other liabilities(excl. accrued expenses) 9,668,700 551,182.12 1,722,981 458,567 1,555,693 12,937,860
Total financial liabilities 477,929,736 9,756,946 25,141,054 458,567.04 9,887,821 522,154,861
Net financial asset /(liabilities) (185,302,685) 29,567,596 176,555,739 49,426,676 5,684,378 76,950,966
Notes to the Annual Financial Statements
Group

104 2016 ANNUAL REPORT
Bank
31 December 2015 Up to 1 – 3 3 – 12 1 – 5 Over Total 1 month months months years 5 years N’000 N’000 N’000 N’000 N’000 N’000
Assets:
Balances with Central Bank of Nigeria 103,325,670 - - - - 103,325,670
Loans and advances to banks 147,857,926 - 6,114,804 4,399,050 - 158,371,780
Loans and advances to customers 45,170,332 24,100,281 7,225,951 12,703,761 5,289,046 94,489,371
Trading securities 148,341 104,197 5,612,759 6,320,221 766,506 12,952,024
Derivative financial instruments - 19 6,643 - - 6,662
Investment securities - - 32,258,962 20,147,084 652,783 53,058,829
Assets pledged as collateral - - 4,041,522 - - 4,041,522
Other assets 143,852 - - - - 143,852
Total financial assets 296,646,123 24,204,497 55,260,641 43,570,116 6,708,335 426,389,710
Up to 1 – 3 3 – 12 1 – 5 Over Total 1 month months months years 5 years N’000 N’000 N’000 N’000 N’000 N’000
Liabilities:
Deposits from banks 770,983 - - - - 770,983
Deposits from customers 357,447,718 645,612 92,524 - - 358,185,854
Derivative financial instruments - - 6,466 - - 6,466
Other liabilities 5,128,592 68,318 128,984 1,968,416 - 7,294,309
Total financial liabilities 363,347,293 713,930 227,974 1,968,416 - 366,257,612
Net financial asset /(liabilities) (66,701,171) 23,490,567 55,032,667 41,601,700 6,708,335 60,132,098
Credit commitments and other financial facilities
Group/ Bank
31 December 2016 Up to 1 – 3 3 – 12 1 – 5 Over Total 1 month months months years 5 years N’000 N’000 N’000 N’000 N’000 N’000
Loan commitments - 2,537,908 1 1,980,678 25 4,518,613
Guarantees, acceptances and
other financial facilities 8,855,268 13,727,766 19,041,764 3,026,420 5,815,791 50,467,009
Total 8,855,268 16,265,674 19,041,765 5,007,098 5,815,816 54,985,622
31 December 2015 Up to 1 – 3 3 – 12 1 – 5 Over Total 1 month months months years 5 years N’000 N’000 N’000 N’000 N’000 N’000
Loan commitments 2,071,126 - - 3,975,680 14,876,587 20,923,394
Guarantees, acceptances and
other financial facilities 2,688,632 10,329,555 8,553,880 2,289,204 6,196,699 30,057,970
Total 4,759,758 10,329,555 8,553,880 6,264,884 21,073,286 50,981,364
Notes to the Annual Financial Statements
2016 ANNUAL REPORT 105
4.4 Capital management The Group’s capital management process is designed to ensure maintenance of sufficient capital consistent with the
Group’s risk profile, all applicable regulatory standards and guidelines. It is the Group’s objective to maintain a strong capital base to support the business and regulatory capital requirements at all times. The capital management process is centrally overseen by senior management and is reviewed at the consolidated, legal entity, and country level.
Regulatory capital The Group’s primary regulator, Central Bank of Nigeria, sets and monitors capital requirements for the bank. It prescribes
the minimum ratio for capital adequacy and minimum capital requirements. The Bank must at all times meet the relevant minimum capital requirements of the Central Bank of Nigeria. The Bank has established processes and controls in place to monitor and manage its capital requirements and remained in compliance with these requirements throughout the year.
The capital adequacy requirements as set out in the Central Bank of Nigeria, prescribes a minimum ratio of total capital to total risk-weighted assets. The risk weighted assets are arrived at using the Basel II framework, as defined in the Central Bank of Nigeria guidelines on both balance sheet position and credit commitments and other financial facilities to reflect the relative risk of each asset and counterparty, as well as Market and Operational risks elements.
“The Bank’s regulatory capital comprises of two tiers as follows:
Tier 1 capital: share capital, statutory reserve, SMEIS reserve, retained earnings and reserves created by appropriations of retained earnings with an adjustment for deferred tax asset and 50% of the value of investment in unconsolidated banking and financial subsidiary; and
Tier 2 capital: other comprehensive income (the greater of last audited position or current period losses) with adjustment for 50% of the value of investment in unconsolidated banking and financial subsidiary
The regulatory capital is managed by Treasury.” Further, ALCO monitors the Regulatory and Citigroup capital ratio requirements to ensure compliance. As at 31 December
2016, the Bank was in compliance with all the applicable capital ratios.
Notes to the Annual Financial Statements
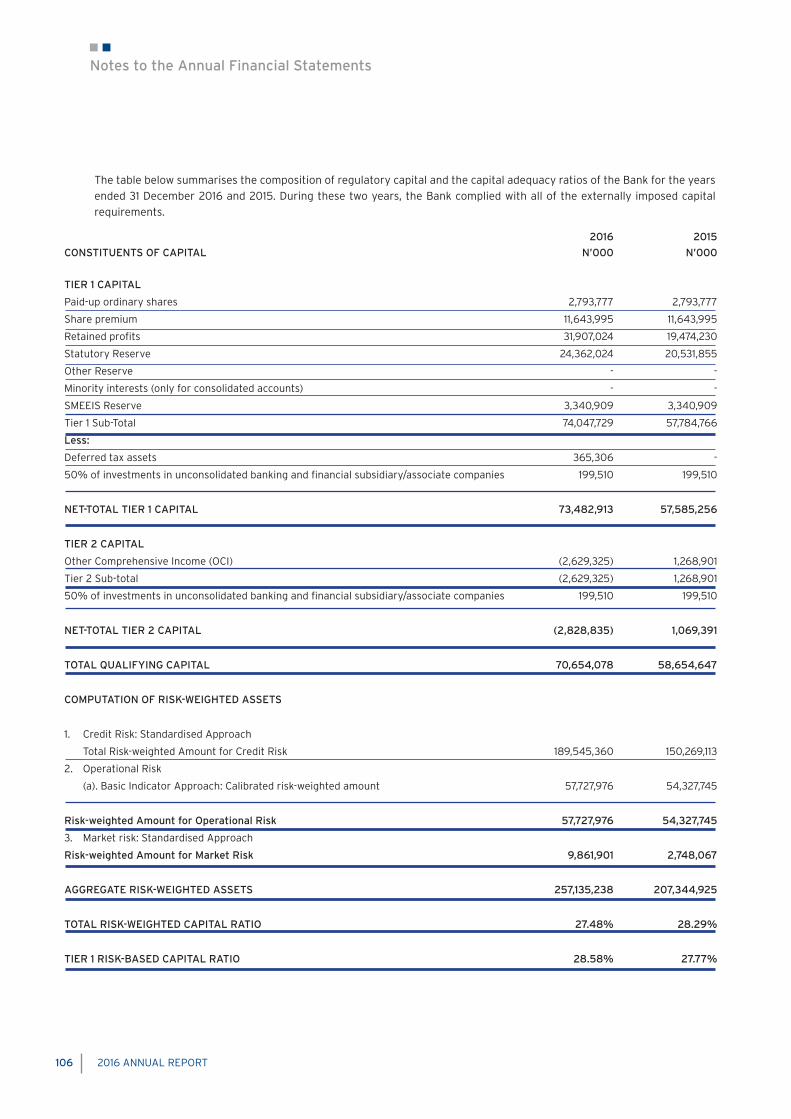
106 2016 ANNUAL REPORT
2016 2015 CONSTITUENTS OF CAPITAL N’000 N’000 TIER 1 CAPITAL
Paid-up ordinary shares 2,793,777 2,793,777
Share premium 11,643,995 11,643,995
Retained profits 31,907,024 19,474,230
Statutory Reserve 24,362,024 20,531,855
Other Reserve - -
Minority interests (only for consolidated accounts) - -
SMEEIS Reserve 3,340,909 3,340,909
Tier 1 Sub-Total 74,047,729 57,784,766
Less:
Deferred tax assets 365,306 -
50% of investments in unconsolidated banking and financial subsidiary/associate companies 199,510 199,510
NET-TOTAL TIER 1 CAPITAL 73,482,913 57,585,256
TIER 2 CAPITAL
Other Comprehensive Income (OCI) (2,629,325) 1,268,901
Tier 2 Sub-total (2,629,325) 1,268,901
50% of investments in unconsolidated banking and financial subsidiary/associate companies 199,510 199,510
NET-TOTAL TIER 2 CAPITAL (2,828,835) 1,069,391
TOTAL QUALIFYING CAPITAL 70,654,078 58,654,647
COMPUTATION OF RISK-WEIGHTED ASSETS
1. Credit Risk: Standardised Approach
Total Risk-weighted Amount for Credit Risk 189,545,360 150,269,113
2. Operational Risk
(a). Basic Indicator Approach: Calibrated risk-weighted amount 57,727,976 54,327,745
Risk-weighted Amount for Operational Risk 57,727,976 54,327,745
3. Market risk: Standardised Approach
Risk-weighted Amount for Market Risk 9,861,901 2,748,067
AGGREGATE RISK-WEIGHTED ASSETS 257,135,238 207,344,925
TOTAL RISK-WEIGHTED CAPITAL RATIO 27.48% 28.29%
TIER 1 RISK-BASED CAPITAL RATIO 28.58% 27.77%
Notes to the Annual Financial Statements
The table below summarises the composition of regulatory capital and the capital adequacy ratios of the Bank for the years ended 31 December 2016 and 2015. During these two years, the Bank complied with all of the externally imposed capital requirements.

2016 ANNUAL REPORT 107
Carrying value Fair value 31 December 2016 2015 2016 2015 N‘000 N‘000 N‘000 N‘000
Financial assets
Loans and advances to banks 113,167,991 158,371,780 113,212,139 158,540,217
Loans and advances to customers 117,554,672 94,489,371 119,687,733 96,137,294
Other assets (excluding prepayments) 37,891,569 143,852 37,891,569 143,852
268,614,232 253,005,003 270,791,441 254,821,363
Financial liabilities
Deposits from banks 1,034,242 770,983 1,034,242 770,983
Deposits from customers 485,845,373 358,184,320 485,845,373 358,184,320
Other liabilities 12,937,860 7,294,309 12,937,860 7,294,309
499,817,475 366,249,612 499,817,475 366,249,612
Credit commitments and other financial facilities
Loan commitments 4,518,613 20,923,394 4,518,613 20,923,394
Guarantees, acceptances and other financial facilities 50,467,009 30,057,969 50,467,009 30,057,969
54,985,622 50,981,363 54,985,622 50,981,363
4.5 Fair value of financial assets and liabilities 4.5.1 The table below summarises the carrying amounts and fair values of those financial assets and liabilities not measured at fair value in the Group’s consolidated statement of financial position. All fair value measurements are recurring.
i Loans and advances to banks Loans and advances to banks include interbank placements, loans and items in the course of collection. These are valued
at amortised cost.
The carrying amount of the floating rate placements and overnight deposits is a reasonable approximation of fair value
ii Loans and advances to customers Loans and advances to customers are net of provisions for impairment. The estimated fair value of loans and advances
represents the discounted amount of future cash flows expected to be received, including assumptions relating to prepayment rates. Expected cash flows are discounted at current market rates to determine fair value. A substantial proportion of loans and advances reprice within 12 months and hence the gross carrying amount is a good proxy of the fair value.These are valued at amortised cost.
iii Other assets Other assets relate to receivables that have a short term maturity (less than three months) therefore it is assumed that
the carrying amounts approximate their fair value. iv Deposits from banks and customers and other liabilities The estimated fair value of deposits with no stated maturity is the amount repayable on demand. The estimated fair value of fixed interest bearing deposits without quoted market prices is based on discounting cash flows using the prevailing
market.
A substantial proportion of deposits mature within 6 months and hence the carrying amount is a good estimate of the fair value.
v Credit commitments and other financial facilities The estimated fair values of the credit commitments and other financial facilities are based on market prices for similar
facilities. When this information is not available, fair value is estimated as the carrying value.
Notes to the Annual Financial Statements
108 2016 ANNUAL REPORT
4.5.2 Fair value hierarchy The Group measures fair values using the following fair value hierarchy that reflects the significance of the inputs used in making the measurements: Level 1: Quoted market price (unadjusted) in an active market for an identical instrument.
Level 2: Valuation techniques based on observable inputs, either directly (i.e. as prices) or indirectly (i.e. derived from
prices). This category includes instruments valued using: quoted market prices in active markets for similar instruments; quoted for identical or similar instruments in markets that are considered less than active; or other valuation techniques where all significant inputs are directly or indirectly observable from market data.
Level 3: Valuation techniques using significant unobservable inputs. This category includes all instruments where the valuation technique includes inputs not based on observable data and the unobservable inputs have a significant effect on the instrument’s valuation. This category includes instruments that are valued based on quoted prices for similar instruments where significant unobservable adjustments or assumptions are required to reflect the difference between the instruments.
The Group uses the following procedures to determine the fair value of financial assets and liabilities: Trading securities Where available, the Group uses the quoted market prices to determine the fair value of trading assets and such items are classified as Level 1 of the fair value hierarchy.
Where there are securities that are not actively traded, the Group uses internal valuation techniques which are based on observable inputs obtained from the quoted market prices of similiar actively traded securities. Derivatives The derivatives entered into by the Group are executed over the counter and so are valued using internal valuation techniques. These derivatives consist of foreign exchange forward contracts and the principal technique used to value these instruments is based on market observable inputs. The valuation techniques include forward pricing based on interpolation of the current interest rates and foreign exchange rates.
The key inputs depend upon the the type of derivative and the nature of underlying instrument and include interest rate yield curves and foreign exchange rates, which are based on observable input therefore classified as Level 2.
The Group also entered into some derivative instruments which are level 3 instruments. Investment securities Investment securities classified as available-for-sale are measured at fair value by reference to quoted market prices when available and therefore are classified as Level 1.
If quoted market prices are not available, the fair values are estimated based on internal valuation techniques. The key inputs depend upon the type of investment security and the nature of inputs to the valuation technique. The item is placed in either Level 2 or Level 3 depending on the observability of the significant inputs to the model. Valuation process for Level 3 Fair Value Measurements Price verification procedures and related internal control procedures are governed by the Citibank Pricing and Price Verification Policy and Standards, which are jointly owned by Finance and Risk Management. Finance has implemented the Pricing and Price Verification Standards and Procedures to facilitate compliance with this policy.
Notes to the Annual Financial Statements

2016 ANNUAL REPORT 109
For fair value measurements of substantially all assets and liabilities held by Citibank, individual business units are responsible for valuing the trading account assets and liabilities, and Product Control within Finance performs independent price verification procedures to evaluate those fair value measurements. Product Control is independent of the individual business units and reports into the Global Head of Product Control, who ultimately reports to the Citibank Chief Financial Officer. Fair value measurements of assets and liabilities are determined using various techniques including, but not limited to, discounted cash flows and internal models, such as option and correlation models. Based on the observability of inputs used, Product Control classifies the inventory as Level 1, Level 2 or Level 3 within the fair value hierarchy. When a position involves one or more significant inputs that are not directly observable, additional price verification procedures are applied. These procedures may include reviewing relevant historical data, analysing profit and loss, valuing each component of a structured trade individually and benchmarking, amongst others. Reports of Level 3 inventory of each business line of the bank are distributed to senior management in Finance, Risk and the individual business lines. Reports are also discussed at the EMEA Risk Committee, the Citibank Risk Committee and in monthly meetings with Senior Management. Whenever a valuation adjustment is needed to bring the price of an asset or liability to its exit price, Product Control reports it to management along with other price verification results. In addition, the pricing models used in measuring fair value are governed by an independent control framework. Although the models are developed and tested by the individual business units, they are independently validated by the Model Validation Group within Model Risk Management and reviewed by Finance with respect to their impact on the price verification procedures. The purpose of this independent control framework is to assess model risk arising from models’ theoretical soundness, calibration techniques where needed, and the appropriateness of the model for a specific product in a defined market. To ensure their continued applicability, models are independently reviewed annually. In addition, Risk Management approves and maintains a list of products permitted to be valued under each approved model for a given business. Transfers into or out of Level 3 are primarily driven by changes in the availability of independent data for positions where the Company has risk exposure, yet the market is no longer considered to be active. As liquidity and transparency improves, the financial instrument may transfer back to a previous classification level. Unobservable inputs During the year, total changes in fair value, representing a gain of N4,303,995,991 (2015: nil) were recognised in the profit and loss account relating to items where fair value was estimated using a valuation technique that incorporated one or more significant inputs based on unobservable market data. As these valuation techniques were based upon assumptions, changing the assumptions would change the estimate of fair value. The potential impact of using reasonably possible alternative assumptions for the valuation techniques for both observable and unobservable market data has been quantified as approximately N2,651,381,970 (2015: nill). The main contributor to this relative illiquidity is the forward rate curve. The methodology used to derive the impact across each product is determined by applying adjustments to the price or significant model input parameters used in the valuation.
Notes to the Annual Financial Statements

110 2016 ANNUAL REPORT
Notes to the Annual Financial Statements
4.5.3 The table below shows the classification of financial instruments in the appropriate hierarchy based on the valuation as at 31 December:
Group
Level 1 Level 2 Level 3 Total
31 December 2016 N‘000 N‘000 N‘000 N‘000
Assets
Trading securities 1,007,794 107,654,365 - 108,662,159
Derivative financial instruments - 23,943,964 4,338,435 28,282,399
Investment securities 34,537,781 72,386,242 1,698,526 108,622,549
Loans and advances to banks - 113,167,991 - 113,167,991
Loans and advances to customers - 117,554,672 - 117,554,672
Other assets - 37,891,569 - 37,891,569
Total assets 35,545,575 472,598,803 6,036,961 514,181,340
Liabilities
Derivative financial instruments - 22,301,163 34,439 22,335,602
Deposits from banks - 1,034,242 - 1,034,242
Deposits from customers - 485,845,373 - 485,845,373
Other liabilities - 12,937,860 - 12,937,860
Total liabilities - 522,118,638 34,439 522,153,077
Bank Level 1 Level 2 Level 3 Total
31 December 2016 N‘000 N‘000 N‘000 N‘000
Assets
Trading securities 1,007,794 107,654,365 - 108,662,159
Derivative financial instruments - 23,943,964 4,338,435 28,282,399
Investment securities 34,537,781 72,386,242 1,698,526 108,622,549
Loans and advances to banks - 113,167,991 - 113,167,991
Loans and advances to customers - 117,554,672 - 117,554,673
Other assets - 37,891,569 - 37,891,569
Total assets 35,545,575 472,598,802 6,036,961 514,181,339
Liabilities
Derivative financial instruments - 22,301,163 34,439 22,335,602
Deposits from banks - 1,034,242 - 1,034,242
Deposits from customers - 485,847,157 - 485,847,157
Other liabilities - 12,937,860 - 12,937,860
Total liabilities - 522,120,422 34,439 522,154,861

2016 ANNUAL REPORT 111
Notes to the Annual Financial Statements
Group Level 1 Level 2 Level 3 Total
31 December 2015 N‘000 N‘000 N‘000 N‘000
Assets
Trading securities 10,033,234 2,918,790 - 12,952,024
Derivative financial instruments - 6,662 - 6,662
Investment securities 491,199 51,941,088 626,542 53,058,829
Loans and advances to banks - 158,371,780 - 158,371,780
Loans and advances to customers - 94,489,371 - 94,489,371
Other assets - 143,852 - 143,852
Total assets 10,524,433 307,871,543 626,542 319,022,518
Liabilities
Derivative financial instruments - 6,466 - 6,466
Deposits from banks - 770,983 - 770,983
Deposits from customers - 358,184,320 - 358,184,320
Other liabilities - 7,294,309 - 7,294,309
Total liabilities - 366,256,078 - 366,256,078
Bank31 December 2015 Level 1 Level 2 Level 3 Total N‘000 N‘000 N‘000 N‘000Assets
Trading securities 10,033,234 2,918,790 - 12,952,024
Derivative financial instruments - 6,662 - 6,662
Investment securities 491,199 51,941,088 626,542 53,058,829
Loans and advances to banks - 158,371,780 - 158,371,780
Loans and advances to customers - 94,489,371 - 94,489,371
Other assets - 143,852 - 143,852
Total assets 10,524,433 307,871,543 626,542 319,022,518
Liabilities
Derivative financial instruments - 6,466 - 6,466
Deposits from banks - 770,983 - 770,983
Deposits from customers - 358,185,854 - 358,185,854
Other liabilities - 7,294,309 - 7,294,309
Total liabilities - 366,257,612 - 366,257,612

112 2016 ANNUAL REPORT
Financial risk management Level 3 financial instruments relates to some derivatives (CBN swaps) and available-for-sale unlisted equity securities and since quoted market prices are not available, the fair values are estimated based on internal valuation techniques as follows: i Investment in SME II Partnership fund which in turn has equity investment in various small and medium enterprises. The
investment valuation is based on the portfolio valuation done by the SME fund Managers.
ii Other equity investment relate to Central Securities Clearing System Limited, Nigerian Interbank Settlement System Plc and Unified Payments Services Limited. The valuation is based on a market approach valuation where the adjusted price/earnings multiple of comparable companies is utilised.
The fair value of investment securities in non-quoted equity securities is based on a model that takes observable data with significant unobservable adjustments or assumptions required. Were these unobservable adjustments or assumptions to differ by +/- 100 basis points, the change in fair value would be N450,003,000 higher or lower in other comprehensive income.
Table below shows description of valuation methodology and inputs.
Type of financial instrument
Unquoted equity securities
Derivative financial instruments Swap Contracts
Total
Valuation technique
Market approach
Discounted cash flow
Estimates for unobservable input
45%
25%
10%
100%
“Fair value as at 31 Dec. 2016 N’000”
1,937,931
4,338,435
6,276,366
Significant unobservable input
Emerging market factor
Private company factor
National scope factor
Forward swap rate
Fair value measurement sensitivity to unobservable inputs
Significant increases in emerging market factor, in isolation, would result in lower fair values. Significant reduction would result in higher fair values
Significant increases in private company factor, in isolation, would result in lower fair values. Significant reduction would result in higher fair values
Significant increases in national scope factor, in isolation, would result in higher fair values. Significant reduction would result in lower fair values Significant increases in foreign currency exchange rate would result in higher fair values. Significant reduction would result in lower fair values
The following table presents the changes in Level 3 instruments for the year end 31 December 2016.
2016 2015
N’000 N’000
At 1 January 626,543 377,612
Disposal of investment securities - (5,627)
Net change in fair value of available-for-sale securities 1,072,629 254,558
Purchase of derivative swap 4,338,435 -
Impairment of equity securities (646) -
Fair value loss on derivative financial liabilities (34,439) -
At 31 December 6,002,522 626,543
Notes to the Annual Financial Statements
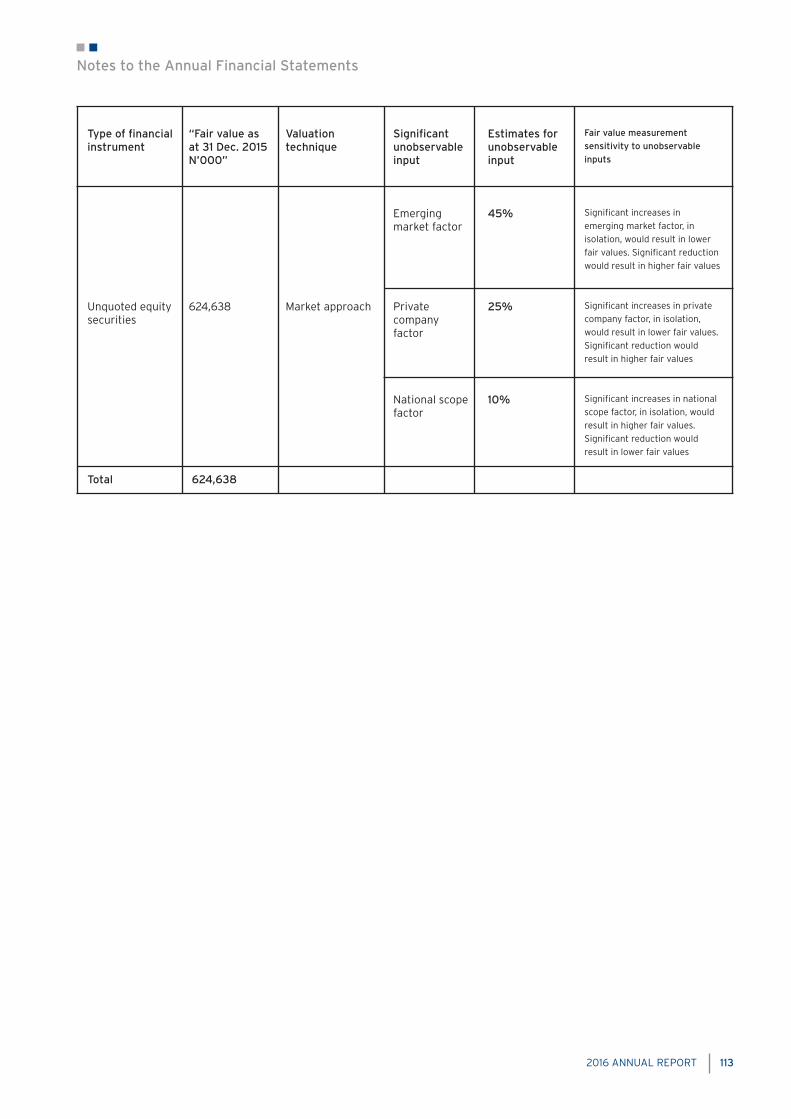
2016 ANNUAL REPORT 113
Type of financial instrument
Unquoted equity securities
Total
Valuation technique
Market approach
Estimates for unobservable input
45%
25%
10%
“Fair value as at 31 Dec. 2015 N’000”
624,638
624,638
Significant unobservable input
Emerging market factor
Private company factor
National scope factor
Fair value measurement sensitivity to unobservable inputs
Significant increases in emerging market factor, in isolation, would result in lower fair values. Significant reduction would result in higher fair values
Significant increases in private company factor, in isolation, would result in lower fair values. Significant reduction would result in higher fair values
Significant increases in national scope factor, in isolation, would result in higher fair values. Significant reduction would result in lower fair values
Notes to the Annual Financial Statements

114 2016 ANNUAL REPORT
The notes below represent “Group and Bank” with exception of where these are different and therefore separate disclosure is made for “Group” and for “Bank”.
5. Interest income Interest income generated from: Group Group Bank Bank 2016 2015 2016 2015 N’000 N’000 N’000 N’000
Cash and balances with Central Bank of Nigeria 390,036 514,743 390,036 514,743
Loans and advances to banks 3,474,577 1,756,870 3,474,577 1,756,870
Loans and advances to customers 12,064,166 13,293,946 12,064,166 13,293,946
Trading securities 445,403 744,785 445,403 744,785
Investment securities 12,557,585 15,560,848 12,557,585 15,560,848
28,931,767 31,871,192 28,931,767 31,871,192
Interest income accrued on impaired financial assets There was no interest income accrued on impaired financial assets during the year (2015: N226,332, 281)
6. Interest expense Interest expense comprises: Group Group Bank Bank 2016 2015 2016 2015 N’000 N’000 N’000 N’000
Deposits from banks 212,984 987,852 212,984 987,852
Deposits from customers 3,725,205 5,119,367 3,725,205 5,119,368
3,938,189 6,107,219 3,938,189 6,107,219
7. Fee and commission income and expense Fee and commission income: Group Group Bank Bank 2016 2015 2016 2015 N’000 N’000 N’000 N’000
Advisory related fees and commissions 12,292 6,853 12,292 6,853
Custody fees 585,370 458,689 585,370 458,689
Transactional services fees 6,367,107 2,207,787 6,367,107 2,207,787
Other fees and commissions 265,814 13,511 265,814 13,511
7,230,583 2,686,839 7,230,583 2,686,839 Fee and commission expense:
Fees paid 113,469 35,356 113,469 35,356
113,469 35,356 113,469 35,356
8. Gains from financial instruments Gains from financial instruments held for trading Group Group Bank Bank 2016 2015 2016 2015 N’000 N’000 N’000 N’000
Trading income on securities 2,311,024 1,517,101 2,311,024 1,517,101
Fair value gains on trading securities 8,136,081 3,911,573 8,136,081 3,911,573 10,447,105 5,428,674 10,447,105 5,428,674
Gains/ losses on foreign currency transactions
Foreign exchange revaluation 2,361,992 (19,406) 2,361,992 (19,406)
Gains/ (Losses) on foreign currency trading transactions 3,928,381 (1,596,818) 3,928,381 (1,596,818)
Net foreign exchange income/ (expenses) 6,290,373 (1,616,224) 6,290,373 (1,616,224)
16,737,478 3,812,450 16,737,478 3,812,450
Notes to the Annual Financial Statements

2016 ANNUAL REPORT 115
9. Investment income Group Group Bank Bank 2016 2015 2016 2015 N’000 N’000 N’000 N’000
Profits on sale of available for sale investment securities 346,121 1,074,030 346,121 1,074,030
Dividend on equity securities 27,448 73,137 68,913 111,235
373,569 1,147,167 415,033 1,185,265
10. Other operating income Group Group Bank Bank
2016 2015 2016 2015
N’000 N’000 N’000 N’000
Rental Income 237,432 187,890 237,432 187,890
(Loss)/gain on disposal of property, plant and equipment (7,658) 17,217 (7,658) 17,217
Loss on loan sale (4,505) - (4,505) -
225,269 205,107 225,269 205,107
11. Personnel Expenses Group Group Bank Bank 2016 2015 2016 2015 N’000 N’000 N’000 N’000
Wages and salaries 4,503,758 4,439,594 4,503,758 4,439,594
Pension costs (Note 28) 263,966 207,603 263,966 207,603
Executive compensation (Note 35.2) 202,574 203,650 202,574 203,650
Other indirect employee costs (Note 11.1) 924,426 579,866 729,884 411,304
Group life 149,224 227,267 149,224 227,267
Travel allowance 280,109 303,352 280,109 303,352
6,324,057 5,961,332 6,129,515 5,792,770 11.1 Included in other indirect employee cost is dividend paid to staff based on the Treasury shares held by the staff participation
scheme of N194,541,664 (2015: N168,562,498) which is subject to with-holding tax.
The indirect employee costs also includes a depreciation amount of N204,555,000 on fixed assets which are assets being used by employees.
12. Other operating expenses Group Group Bank Bank 2016 2015 2016 2015 N’000 N’000 N’000 N’000
General adminstrative expenses 855,073 1,169,212 855,369 1,169,587
Legal and Communication 354,329 153,946 354,329 153,946
Other related operating expenses 360,623 298,932 360,623 298,932
AMCON charge (see note 12.1) 2,189,052 2,059,032 2,189,052 2,059,032
Deposit insurance premium 1,611,394 1,262,501 1,611,394 1,262,501
Communications and postages 292,839 336,130 292,839 336,130
Travel and entertainment 223,446 397,207 223,446 397,207
Premises, furniture and equipment 653,306 557,075 653,306 557,075
Directors fees and sitting allowances (Note 35.2) 60,300 48,000 60,300 48,000
6,600,362 6,282,035 6,600,658 6,282,410
Notes to the Annual Financial Statements

116 2016 ANNUAL REPORT
Included within the General administrative expenses is auditors’ remuneration as follows: Group Group Bank Bank 2016 2015 2016 2015 N’000 N’000 N’000 N’000
Auditor’s remuneration 70,400 62,535 68,400 61,035
12.1 AMCON charge
The Asset Management Corporation of Nigeria (AMCON) acquired Eligible Bank Assets from banks to resolve the non-performing loans crisis in the banking industry. The Group did not sell Eligible Bank Assets to AMCON. All Nigerian banks are required to participate in partial funding of the banking sector resolution costs through a prescribed AMCON charge. In compliance with the Memorandum of Understanding in relation to the Establishment and funding of the Banking Sector resolution cost sinking fund, the 2016 AMCON charge contribution was N2.189 billion (2015: N2.059 billion) representing 0.5% of the bank’s total balance sheet assets and 33% of qualifying off balance sheet assets for the preceding year.
13. Net credit losses Group Group Bank Bank 2016 2015 2016 2015 N’000 N’000 N’000 N’000
Loans and advances to banks:
Decrease/ (increase) in impairment (Note 17.2) 124,288 (78,813) 124,288 (78,813)
Loans and advances to Customers:
Increase in impairment (Note 21.3) (4,480,685) (8,041,009) (4,480,685) (8,041,009)
Amount written off as uncollectible - (11,553) - (11,553)
Recoveries on loans previously written off 316,294 2,054 316,294 2,054
(4,040,103) (8,129,322) (4,040,103) (8,129,322)
14. Taxation 14.1 The tax charge for the year comprises: Group Group Bank Bank 2016 2015 2016 2015 N’000 N’000 N’000 N’000
Corporate income tax 7,329,170 2,678,400 7,329,076 2,678,280
Education tax 138,310 - 138,309 -
Information technology levy 327,465 128,985 327,465 128,984
Adjustments in respect of prior year (Note 14.3) 76,900 (244,702) 76,900 (244,702)
7,871,844 2,562,682 7,871,750 2,562,562
Deferred taxation (Note 31) (978,224) (195,322) (978,224) (195,322)
Current income tax charge 6,893,620 2,367,360 6,893,525 2,367,240
Notes to the Annual Financial Statements
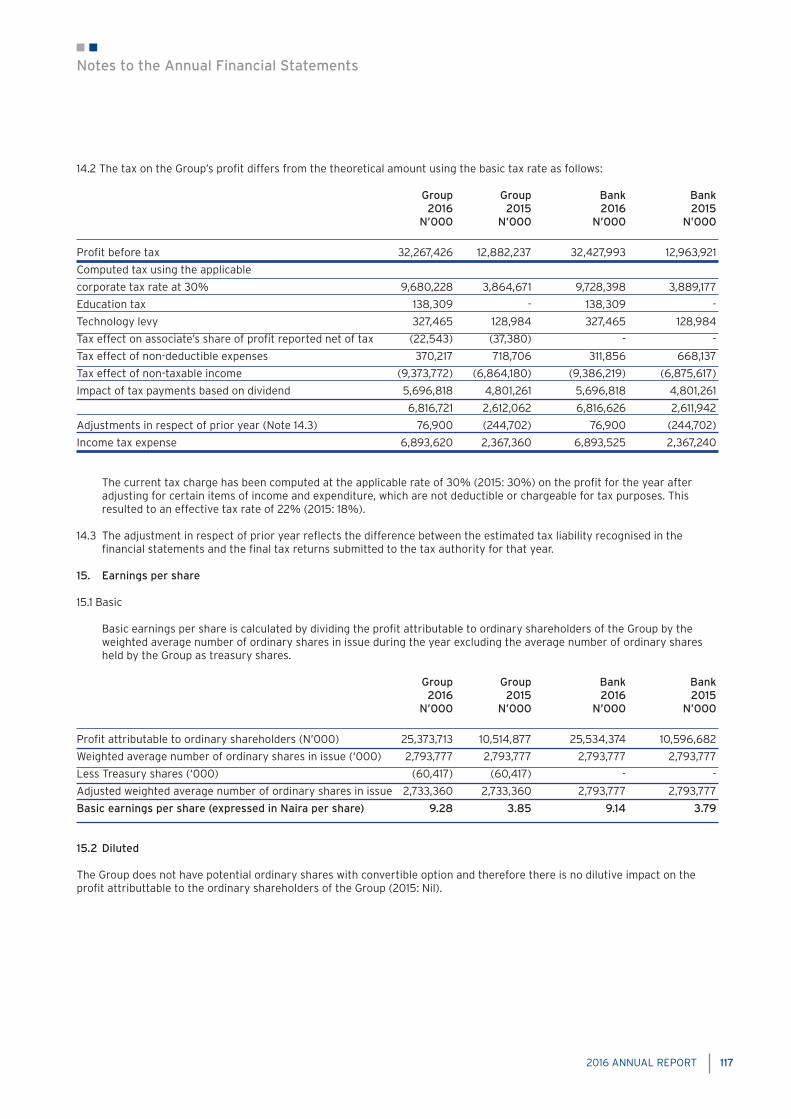
2016 ANNUAL REPORT 117
14.2 The tax on the Group’s profit differs from the theoretical amount using the basic tax rate as follows: Group Group Bank Bank 2016 2015 2016 2015 N’000 N’000 N’000 N’000
Profit before tax 32,267,426 12,882,237 32,427,993 12,963,921
Computed tax using the applicable
corporate tax rate at 30% 9,680,228 3,864,671 9,728,398 3,889,177
Education tax 138,309 - 138,309 -
Technology levy 327,465 128,984 327,465 128,984
Tax effect on associate’s share of profit reported net of tax (22,543) (37,380) - -
Tax effect of non-deductible expenses 370,217 718,706 311,856 668,137
Tax effect of non-taxable income (9,373,772) (6,864,180) (9,386,219) (6,875,617)
Impact of tax payments based on dividend 5,696,818 4,801,261 5,696,818 4,801,261
6,816,721 2,612,062 6,816,626 2,611,942
Adjustments in respect of prior year (Note 14.3) 76,900 (244,702) 76,900 (244,702)
Income tax expense 6,893,620 2,367,360 6,893,525 2,367,240
The current tax charge has been computed at the applicable rate of 30% (2015: 30%) on the profit for the year after adjusting for certain items of income and expenditure, which are not deductible or chargeable for tax purposes. This resulted to an effective tax rate of 22% (2015: 18%).
14.3 The adjustment in respect of prior year reflects the difference between the estimated tax liability recognised in the financial statements and the final tax returns submitted to the tax authority for that year.
15. Earnings per share
15.1 Basic
Basic earnings per share is calculated by dividing the profit attributable to ordinary shareholders of the Group by the weighted average number of ordinary shares in issue during the year excluding the average number of ordinary shares held by the Group as treasury shares.
Group Group Bank Bank 2016 2015 2016 2015 N’000 N’000 N’000 N’000
Profit attributable to ordinary shareholders (N’000) 25,373,713 10,514,877 25,534,374 10,596,682
Weighted average number of ordinary shares in issue (‘000) 2,793,777 2,793,777 2,793,777 2,793,777
Less Treasury shares (‘000) (60,417) (60,417) - -
Adjusted weighted average number of ordinary shares in issue 2,733,360 2,733,360 2,793,777 2,793,777
Basic earnings per share (expressed in Naira per share) 9.28 3.85 9.14 3.79
15.2 Diluted
The Group does not have potential ordinary shares with convertible option and therefore there is no dilutive impact on the profit attributtable to the ordinary shareholders of the Group (2015: Nil).
Notes to the Annual Financial Statements

118 2016 ANNUAL REPORT
16.2 This represents 22.5% of deposits (2015: 20% of customer deposits and 80% of public sector deposits) of monthly average daily balances of deposit liabilities . Mandatory reserve deposits are not available for use in the Group’s day to day operations. 17. Loans and advances to banks Group Group Bank Bank 2016 2015 2016 2015 N’000 N’000 N’000 N’000
In Nigeria: Current accounts 1,429,409 4,277,972 1,429,409 4,277,972
Secured placements 28,017,842 7,500,822 28,017,842 7,500,822
Outside Nigeria:
Current accounts 52,477,746 111,478,595 52,477,746 111,478,595
Placements held on account of customers’ obligations (Note 17.1) 28,337,299 24,600,537 28,337,299 24,600,537
Total included in cash and cash equivalents (Note 37) 110,262,295 147,857,926 110,262,295 147,857,926
Loans to banks in Nigeria 2,949,844 10,682,291 2,949,844 10,682,291
Less allowance for impairment (Note 17.2) (44,149) (168,437) (44,149) (168,437)
113,167,991 158,371,780 113,167,991 158,371,780
Current 113,167,991 153,972,730 113,167,991 153,972,730
Non-current - 4,399,050 - 4,399,050
113,167,991 158,371,780 113,167,991 158,371,780 17.1 This represents the Naira value of foreign currencies held on behalf of customers in respect of letter of credit transactions. The corresponding liability for this amount is included in customer deposits (see note 27). 17.2 The movement on the allowance for loans to banks during the year was as follows: Group Group Bank Bank 2016 2015 2016 2015 N’000 N’000 N’000 N’000 Collective Collective Collective Collective
Allowance Allowance Allowance Allowance
At 1 January 168,437 89,624 168,4378 9,624
(Write back)/ charge against profits (Note 13) (124,288) 78,813 (124,288) 78,813
At 31 December 44,149 168,437 44,149 168,437
16. Cash and balances with Central Bank of Nigeria: 16.1 Cash and balances with Central Bank of Nigeria: Group Group Bank Bank 2016 2015 2016 2015 N’000 N’000 N’000 N’000
Cash 1,237,829 1,120,718 1,237,829 1,120,718
Balances held with Central Bank of Nigeria:
Current accounts 10,386,964 56,962,733 10,386,964 56,962,733
Placement 7,500,000 - 7,500,000 -
Total included in cash and cash equivalents (Note 37) 19,124,793 58,083,451 19,124,793 58,083,451
Mandatory reserve deposit (see (16.2) below) 59,788,316 46,362,937 59,788,316 46,362,937
78,913,109 104,446,388 78,913,109 104,446,388
All balances are current
Notes to the Annual Financial Statements

2016 ANNUAL REPORT 119
18. Held for trading securities These comprise: Group Group Bank Bank 2016 2015 2016 2015 N’000 N’000 N’000 N’000
Treasury bills 108,336,113 5,681,016 108,336,113 5,681,016
Federal Government of Nigeria bonds 326,046 7,271,008 326,046 7,271,008
108,662,159 12,952,024 108,662,159 12,952,024
Group Group Bank Bank
2016 2015 2016 2015
N’000 N’000 N’000 N’000
Current 108,345,845 5,865,298 108,345,845 5,865,298
Non current 316,314 7,086,726 316,314 7,086,726
108,662,159 12,952,024 108,662,159 12,952,024 18.1 Included in cash & cash equivalent Trading securities - Treasury bills (Note 37) 816,222 252,539 816,222 252,539 19. Derivative financial instruments Derivatives are financial instruments that derive their value in response to changes in interest rates, financial instrument prices, commodity prices, foreign exchange rates, credit risk and indices. The types of derivatives used by the Group are set out below. All derivatives are initially recognised at fair value and subsequently measured at fair value, with all fair value changes recognised in the statement of comprehensive income. The table below analyses the notional principal amounts and the positive (assets) and negative (liabilities) fair values of the Group’s derivative financial instruments. Notional principal amounts are the amounts of principal underlying the contract at the reporting date.
Group & Bank 2016
Notional
principal amounts Assets Liabilities
N’000 N’000 N’000
Foreign exchange forward contracts 270,234,842 23,943,964 22,301,163
Swap 104,449,048 4,338,435 34,439
374,683,890 28,282,399 22,335,602
2015
Notional
principal amounts Assets Liabilities
N’000 N’000 N’000
Foreign exchange forward contracts 2,400,976 6,662 6,466
Notes to the Annual Financial Statements

120 2016 ANNUAL REPORT
21. Loans and advances to customers
21.1. The classification of loans and advances is as follows: Group2016 Gross Specific Collective Total Carrying Amount allowance for allowance for Impairment Amount Impairment Impairment N’000 N’000 N’000 N’000 N’000
Loans and advances 118,959,173 92,353 2,132,406 2,224,759 116,734,415
Net investment in finance leases 820,912 - 655 655 820,257
119,780,085 92,353 2,133,061 2,225,414 117,554,672 Gross Specific Collective Total Carrying Amount allowance for allowance for Impairment Amount Impairment Impairment N’000 N’000 N’000 N’000 N’000
Loans and advances 102,064,857 7,477,978 1,646,462 9,124,440 92,940,416
Net investment in finance leases 1,550,415 - 1,461 1,461 1,548,955
103,615,272 7,477,978 1,647,923 9,125,901 94,489,371 Bank 2016 Gross Specific Collective Total Carrying Amount allowance for allowance for Impairment Amount Impairment Impairment N’000 N’000 N’000 N’000 N’000
Loans and advances 118,959,173 92,353 2,132,406 2,224,759 116,734,415
Net investment in finance leases 820,912 - 655 655 820,257
119,780,085 92,353 2,133,061 2,225,414 117,554,672
20. Assets pledged as collateral Group Group Bank Bank 2016 2015 2016 2015 N’000 N’000 N’000 N’000
Investment debt securities: available for sale 7,250,469 4,041,522 7,250,469 4,041,522
7,250,469 4,041,522 7,250,469 4,041,522
All assets pledged as collateral are current Group Group 2016 2015 N’000 N’000
Current 7,250,469 4,041,522
Non current - -
7,250,469 4,041,522
N7,250,469,000 (2015: N4,041,521,570), for which there was no related liability, was pledged as security deposit to clearing house and payment agencies. The Group cannot trade on these pledged assets during the period that such assets are committed as pledged.
Notes to the Annual Financial Statements

2016 ANNUAL REPORT 121
2015 Gross Specific Collective Total Carrying Amount allowance for allowance for Impairment Amount Impairment Impairment N’000 N’000 N’000 N’000 N’000
Loans and advances 102,064,857 7,477,978 1,646,462 9,124,440 92,940,417
Net investment in finance leases 1,550,415 - 1,461 1,461 1,548,955
103,615,272 7,477,978 1,647,923 9,125,901 94,489,371 Group Group Bank Bank 2016 2015 2016 2015 N’000 N’000 N’000 N’000
Current (Gross) 92,072,415 76,496,564 92,072,416 76,496,564
Non-current (Gross) 25,482,257 17,992,807 25,482,257 17,992,807
117,554,672 94,489,371 117,554,672 94,489,371 21.2. Loans and advances to customers include finance lease receivables Group Group Bank Bank 2016 2015 2016 2015 N’000 N’000 N’000 N’000
Gross investment in finance leases
no later than one year 789,008 1,491,077 789,008 1,491,077
later than one year and no later than five years 65,124 108,627 65,124 108,627
854,132 1,599,704 854,132 1,599,704
Unearned income (33,220) (49,288) (33,220) (49,288)
Net investment in finance leases 820,912 1,550,415 820,912 1,550,415
The net investment in finance leases maybe analysed as follows:
Expiring:
No later than one year 755,788 1,441,789 755,788 1,441,789
Later than one year and no later than five years 65,124 108,627 65,124 108,627
820,912 1,550,416 820,912 1,550,416
21.3. The movement on the allowance for loans and advances during the year was as follows: Group/ Bank 2016 2016 2016 N’000 N’000 N’000
Specific Allowance Collective Allowance Total Allowance
Movement of allowance for loans
At 1 January 7,477,978 1,647,923 9,125,901
Charge against profits (Note 13) 3,995,547 485,138 4,480,685
Loans written off (11,381,172) - (11,381,172)
At 31 December 92,353 2,133,061 2,225,414
Allowance for loans by class
Loans and advances 92,353 2,132,406 2,224,759
Advances under finance lease - 655 655
92,353 2,133,061 2,225,414
Notes to the Annual Financial Statements

122 2016 ANNUAL REPORT
2015 2015 2015 N’000 N’000 N’000
Specific Allowance Collective Allowance Total Allowance
At 1 January 78,866 1,006,026 1,084,892
Charge against profits (Note 13) 7,399,112 641,897 8,041,009
7,477,978 1,647,923 9,125,901
Allowance for loans by class
Loans and advances 7,477,978 1,646,462 9,124,440
Advances under finance lease - 1,461 1,461
7,477,978 1,647,923 9,125,901
22. Investment securities Available for sale investments: Group Group Bank Bank 2016 2015 2016 2015 N’000 N’000 N’000 N’000
Debt securities - at fair value:
Listed 106,684,619 52,432,287 106,684,619 52,432,287
Equity securities - at fair value:
Unlisted 1,936,671 624,638 1,936,671 624,638
Equity securities - at cost: 1,259 1,904 1,259 1,904
Total Available-for-sale investment securities 108,622,550 53,058,829 108,622,549 53,058,829
2016 2015 2016 2015 N’000 N’000 N’000 N’000
Federal Government of Nigeria Bonds 38,682,375 50,751,215 38,682,375 50,751,215
Treasury bills 68,003,503 1,681,073 68,003,503 1,681,073
Unlisted Equity securities 1,936,671 626,542 1,936,671 626,542
Total Available-for-sale investment securities 108,622,549 53,058,829 108,622,549 53,058,829
2016 2015 2016 2015 N’000 N’000 N’000 N’000
Current 68,486,611 31,767,763 68,486,611 31,767,763
Non-current 40,135,938 21,291,066 40,135,938 21,291,066
108,622,550 53,058,829 108,622,549 53,058,829 All debt securities have fixed coupons. Listed debt securities available for sale at fair value of N7,250,469,000 were pledged to third parties under secured borrowing and as security deposit to clearing house and payment agencies (2015: N4,041,521,571), and are disclosed under Assets pledged as collateral in note 20.
Notes to the Annual Financial Statements

2016 ANNUAL REPORT 123
22.1. Movement in available for sale securities can be summarised as follows: Group/ Bank 2016 Debt securities - Equity securities - at fair value: - at fair value: Total N’000 N’000 N’000
At 1 January 52,432,287 626,542 53,058,829
Purchase of AFS investment securities 112,295,565 - 112,295,565
Disposal of AFS investment securities (52,832,973) - (52,832,973)
Impairment of equity securities - (646) (646)
Net change in fair value (6,367,965) 1,312,033 (5,055,932)
Net amount transferred to profit or loss (Note 22.2) 1,157,706 - 1,157,706
At 31 December 106,684,620 1,937,929 108,622,549
2015 Debt securities - Equity securities - at fair value: - at fair value: Total N’000 N’000 N’000
At 1 January 106,255,745 377,611 106,633,356
Purchase of investment securities 11,984,923 - 11,984,923
Disposal of investment securities (71,669,163) (5,627) (71,674,790)
Net change in fair value 7,534,535 254,558 7,789,093
Net amount transferred to profit or loss (Note 22.2) (1,673,752) - (1,673,752)
At 31 December 52,432,287 626,542 53,058,830 This relates to reclassification adjustments for realised net gains on available-for-sale securities on disposal or maturity that have been recognised through statement of comprehensive income.
Notes to the Annual Financial Statements

124 2016 ANNUAL REPORT
23. Other assets
Group Group Bank Bank 2016 2015 2016 2015 N’000 N’000 N’000 N’000
Prepayments 616,400 116,971 616,400 116,971
Receivables 37,891,569 143,852 37,891,569 143,852
38,507,969 260,823 38,507,969 260,823
2016 2015 2016 2015 N’000 N’000 N’000 N’000
Current 38,507,969 260,823 38,507,969 260,823
Non-current - - - -
38,507,969 260,823 38,507,969 260,823 24. Investments in associate Associates are those entities over which the Group has significant influence but not control, generally accompanying a shareholding between 20% and 50% of the voting rights. In addition, it includes entities where the shareholding is less than 20% but such significant influence can be demonstrated with the existence of representation on the board of directors or equivalent governing body of the investee. The Group has determined that its investment in Accion Microfinance Bank Limited should be treated as an investment in associate based on it’s board representation in the company.
The associate company’s principal place of business is Lagos, Nigeria which is also the same as the country of incorporation. Group Group Bank 2016 2015 2016 2015 N’000 N’000 N’000 N’000
At 1 January 764,620 678,116 398,020 398,020
Share of profit after tax 75,146 124,600 - -
Dividends received (41,465) (38,096) - -
At 31 December 798,301 764,620 398,020 398,020 The Group has an investment in an associate, Accion Microfinance Bank Limited, with an 19.9% equity participation and representation on the board of the investee. This has been accounted for using the equity method under the Group and carried at cost in the Bank’s seperate financial statements. All balances are non-current The information above reflects the amounts presented in the financial statements of the associates (and not Citi’s share of those amounts) adjusted for differences in accounting policies between the group and the associate.
Notes to the Annual Financial Statements

2016 ANNUAL REPORT 125
Apart from the information disclosed above there were no other transactions with the associate.
Summarised financial information of the Group’s associate accounted for using the equity method are as follows: 2016 2015 N’000 N’000
Total assets 7,477,868 6,868,656
Total liabilities (4,278,833) (3,788,106)
Net assets 3,199,035 3,080,550
Revenues 3,260,246 2,931,334
Profit 377,615 626,132
Total comprehensive income 377,615 626,132
Group share of profit 75,146 124,600
Group share of total comprehensive income 75,146 124,600 Reconciliation of summarized financial information 2016 2015 N’000 N’000
Current assets 1,084,233 1,002,046
Non current assets 6,393,635 5,866,610
Total assets 7,477,868 6,868,656
Current liabilities 3,079,352 2,700,847
Non current liabilities 1,199,481 1,087,259
Total liabilities (4,278,833) (3,788,106)
Net assets 3,199,034 3,080,550
Interest in associate (19.9%) 636,608 613,029
Loan to associate 161,694 151,591
Carrying value of investment in associate 798,302 764,620
There were no published price quotations for the associate of the Group. Furthermore, there are no significant restrictions on the ability of the associate to transfer funds to the Group in the form of cash dividends, or repayment of loans or advances.
Notes to the Annual Financial Statements

126 2016 ANNUAL REPORT
Group Year ended 31 December 2016 Computer Land Leasehold Equipment, Motor Work In Total Improvement Furniture & Vehicle progress & Building Equipment (WIP) N’000 N’000 N’000 N’000 N’000 N’000
COST:
At 1 January 596,385 1,416,429 3,602,334 833,483 4,033 6,452,663
Additions - 136,953 169,579 347,348 - 653,880
Disposals - (94,349) (434,924) (238,422) - (767,695)
Reclassification* - - (199,017) (811,631) - (1,010,648)
At 31 December 596,385 1,459,033 3,137,972 130,778 4,033 5,328,200
ACCUMULATED DEPRECIATION
At 1 January - 269,781 2,931,545 441,113 - 3,642,438
Charge for the year - 69,435 190,581 30,187 - 290,203
Disposals - (29,366) (320,404) (173,474) - (523,244)
Reclassification* - (94,901) (197,810) (292,711)
At 31 December - 309,850 2,706,821 100,017 - 3,116,684
NET BOOK VALUE
At 31 December 596,385 1,149,182 431,151 30,761 4,033 2,211,513 *Reclassification represents an amount of fixed assets transferred to benefits in kind (other assets) representing assets being used by staff members The depreciation expense thereof is included in personnel expenses.
Year ended 31 December 2015 Computer Land Leasehold Equipment, Motor Work In Total Improvement Furniture & Vehicle progress & Building Equipment (WIP) N’000 N’000 N’000 N’000 N’000 N’000
COST:
At 1 January 596,385 1,419,901 3,453,712 813,688 4,032 6,287,718
Additions - - 324,084 184,063 508,147
Disposals - - (178,934) (164,267) (343,201)
At 31 December 596,385 1,419,901 3,598,862 833,483 4,032 6,452,663
ACCUMULATED DEPRECIATION
At 1 January - 230,771 2,867,315 414,524 - 3,512,610
Charge for the year - 39,010 231,728 179,115 - 449,854
Disposals - - (167,499) (152,526) - (320,025)
At 31 December - 269,781 2,931,544 441,113 - 3,642,440
NET BOOK VALUE
At 31 December 596,385 1,150,120 667,318 392,370 4,032 2,810,224
Notes to the Annual Financial Statements
25. Property, plant and equipment The movement on these accounts during the year was as follows:

2016 ANNUAL REPORT 127
BankYear ended 31 December 2016 Land Leasehold Computer Motor Work In Total Improvement Equipment, Vehicle progress & Building Furniture & (WIP) N’000 N’000 N’000 N’000 N’000 N’000
COST:
At 1 January 596,385 1,416,429 3,602,334 833,483 4,033 6,452,663
Additions - 136,953 169,579 347,348 - 653,880
Disposals - (94,349) (434,924) (238,422) - (767,695)
Reclassification* - - (199,017) (811,631) - (1,010,648)
At 31 December 596,385 1,459,033 3,137,972 130,778 4,033 5,328,200
ACCUMULATED DEPRECIATION
At 1 January - 269,781 2,931,545 441,113.35 - 3,642,438
Charge for the year - 69,435 190,581 30,187 - 290,203
Disposals - (29,366) (320,404) (173,474) - (523,244)
Reclassification* - - (94,901) (197,810) - (292,712)
At 31 December - 309,850 2,706,820 100,017 - 3,116,688
NET BOOK VALUE
At 31 December 596,385 1,149,182 431,152 30,761 4,033 2,211,513
*Reclassification represents an amount of fixed assets transferred to benefits in kind (other assets) representing assets being used by staff members The depreciation expense thereof is included in personnel expenses
Year ended 31 December 2016 Land Leasehold Computer Motor Work In Total Improvement Equipment, Vehicle progress & Building Furniture & (WIP) N’000 N’000 N’000 N’000 N’000 N’000
COST:
At 1 January 596,385 1,419,901 3,453,712 813,688 4,032 6,287,718
Additions - - 324,084 184,063 508,147
Disposals - - (178,934) (164,267) (343,201)
At 31 December 596,385 1,419,901 3,598,862 833,483 4,032 6,452,663
ACCUMULATED DEPRECIATION
At 1 January - 230,771 2,867,315 414,524 - 3,512,610
Charge for the year - 39,010 231,728 179,115 - 449,854
Disposals - - (167,499) (152,526) - (320,025)
At 31 December - 269,781 2,931,544 441,113 - 3,642,440
NET BOOK VALUE
At 31 December 596,385 1,150,120 667,318 392,370 4,032 2,810,225
All balances are non-current
Notes to the Annual Financial Statements

128 2016 ANNUAL REPORT
26. Deposits from banks Group Group Bank Bank 2016 2015 2016 2015 N’000 N’000 N’000 N’000
Current accounts 1,034,242 770,983 1,034,242 770,983
1,034,242 770,983 1,034,242 770,983 All deposits from banks are current Deposit from banks only include financial instruments classifed as liabilities at amortised cost. 27. Deposits from customers Deposits and other accounts comprise: Group Group Bank Bank 2016 2015 2016 2015 N’000 N’000 N’000 N’000
Demand 456,051,306 338,833,472 456,053,090 338,835,005
Term 29,794,067 19,350,848 29,794,067 19,350,848
485,845,373 358,184,320 485,847,157 358,185,853 All deposits from customers are current Deposit from customers only include financial instruments classifed as liabilities at amortised cost. 27.1 Included in deposits from customer balance is the Naira value of foreign currencies amounting to N28,347,784,123 (2015: N26,108,528,886) held on behalf of customers as cash collateral in respect of letter of credit transactions. Also included in this balance is an amount of N272,106,571,631 (2015: N212,063,347,771) of fixed or variable interest rate and all other deposits are non-interest bearing deposits. 28. Retirement benefit obligation
The movement on retirement benefit obligation account during the year was as follows:
Group Group Bank Bank 2016 2015 2016 2015 N’000 N’000 N’000 N’000
At 1 January 7,900 7,586 7,900 7,586
Employee contribution 342,387 218,233 342,387 218,233
Charge to profit and loss (Note 11) 263,966 207,603 263,966 207,603
Remittances during the year (614,253) (425,522) (614,253) (425,522)
At 31 December - 7,900 - 7,900
All balances are current Group and its employees make a joint contribution of 18% (Employer 10%, employee 8%) of gross monthly emoluments. Included in the employee contribution is the sum of N130,956,156 representing voluntary contributions by the employees 29. Current income tax liabilities The movement in Income tax payable during the year is as follows:
Group Group Bank Bank 2016 2015 2016 2015
N’000 N’000 N’000 N’000
At 1 January 2,805,397 2,744,192 2,805,352 2,744,084
Payments during the year (2,810,970) (2,501,477) (2,810,970) (2,501,413)
Current year tax charge (Note 14.1 ) 7,871,843 2,562,682 7,871,750 2,562,562
At 31 December 7,866,270 2,805,397 7,866,132 2,805,233
All balances are current
Notes to the Annual Financial Statements

2016 ANNUAL REPORT 129
30. Other liabilities Other liabilities comprise: Group Group Bank Bank 2016 2015 2016 2015 N’000 N’000 N’000 N’000
Managers’ cheques 3,027,299 2,937,802 3,027,299 2,937,802
Payables 3,862,172 555,755 3,862,172 555,755
Sundry accounts 5,356,580 1,594 5,356,580 1,594
Deposit for foreign exchange purchase 131,624 350,372 131,624 350,372
Unapplied customer funds 96,577 2,987,414 96,577 2,987,414
Unclaimed customer balance 463,608 461,373 463,608 461,373
Financial liabilities 12,937,860 7,294,309 12,937,860 7,294,309
Accruals 1,470,010 1,525,390 1,470,303 1,525,765
Provison for litigation (note 30.1) 471,634 421,635 471,637 421,635
Unearned income 196,680 68,318 196,680 68,318
Non financial liabilities 2,138,324 2,015,343 2,138,620 2,015,718
15,076,184 9,309,652 15,076,480 9,310,027 Group Group Bank Bank 2016 2015 2016 2015 N’000 N’000 N’000 N’000
Current 13,061,924 7,341,237 13,062,220 7,341,612
Non-current 2,014,260 1,968,415 2,014,260 1,968,415
15,076,184 9,309,652 15,076,480 9,310,027
30.1 Provisions (Movement in provision for litigation)
Provisions for litigation comprise: 2016 2015 N’000 N’000
At 1 January 421,635 56,488
Charge against profits 50,000 365,147
At 31 December 471,635 421,635
All balances are non-current The amount represent the aggregate provisions for certain legal claims brought against/ instituted by the Group, in which it is probable that there would be future outflow of economic benefits to settle such legal obligations and whose values can be reliably estimated as at 31 December 2016. The provision charge is recognised in the statement of profit or loss within other operating expenses. The balance as at 31 December 2016 represents a reasonable estimate of what would be required to settle the legal claims even though some of the matters are still in progress as at reporting date.
Notes to the Annual Financial Statements
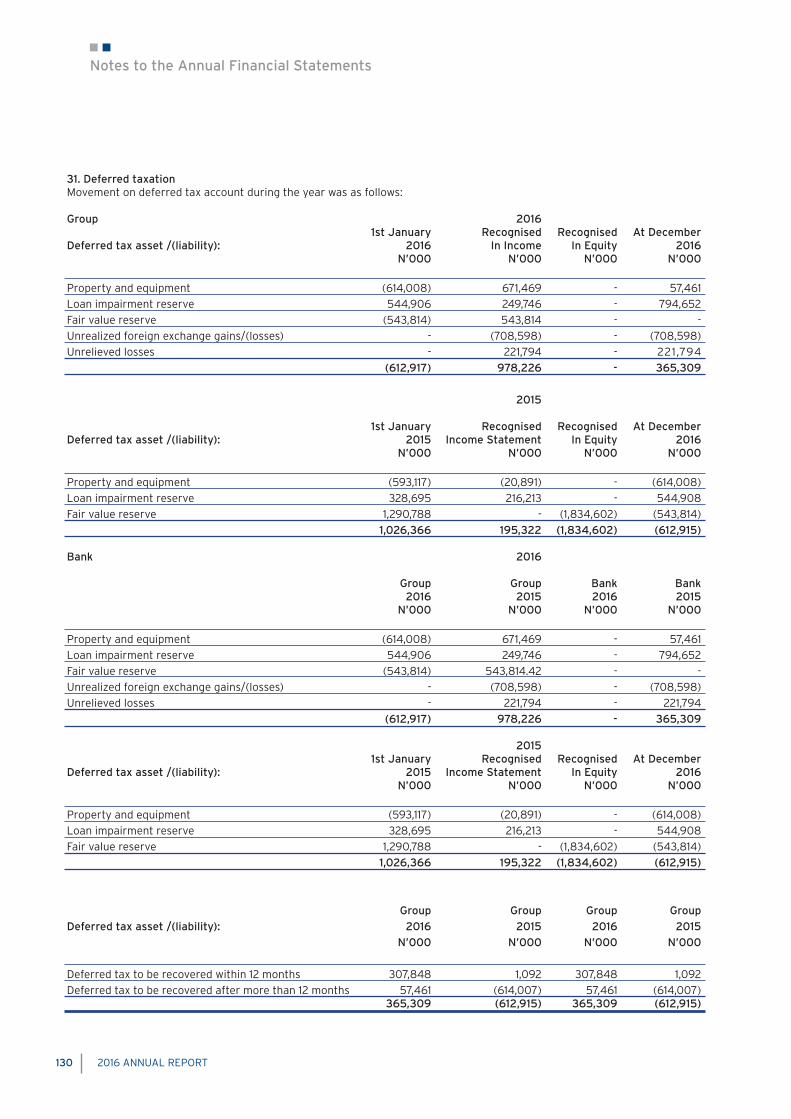
130 2016 ANNUAL REPORT
31. Deferred taxation Movement on deferred tax account during the year was as follows:
Group 2016 1st January Recognised Recognised At DecemberDeferred tax asset /(liability): 2016 In Income In Equity 2016 N’000 N’000 N’000 N’000 Property and equipment (614,008) 671,469 - 57,461Loan impairment reserve 544,906 249,746 - 794,652Fair value reserve (543,814) 543,814 - - Unrealized foreign exchange gains/(losses) - (708,598) - (708,598)Unrelieved losses - 221,794 - 221,794 (612,917) 978,226 - 365,309
2015 1st January Recognised Recognised At DecemberDeferred tax asset /(liability): 2015 Income Statement In Equity 2016 N’000 N’000 N’000 N’000 Property and equipment (593,117) (20,891) - (614,008)Loan impairment reserve 328,695 216,213 - 544,908 Fair value reserve 1,290,788 - (1,834,602) (543,814) 1,026,366 195,322 (1,834,602) (612,915) Bank 2016 Group Group Bank Bank 2016 2015 2016 2015 N’000 N’000 N’000 N’000 Property and equipment (614,008) 671,469 - 57,461Loan impairment reserve 544,906 249,746 - 794,652Fair value reserve (543,814) 543,814.42 - - Unrealized foreign exchange gains/(losses) - (708,598) - (708,598)Unrelieved losses - 221,794 - 221,794 (612,917) 978,226 - 365,309 2015 1st January Recognised Recognised At DecemberDeferred tax asset /(liability): 2015 Income Statement In Equity 2016 N’000 N’000 N’000 N’000 Property and equipment (593,117) (20,891) - (614,008)Loan impairment reserve 328,695 216,213 - 544,908 Fair value reserve 1,290,788 - (1,834,602) (543,814) 1,026,366 195,322 (1,834,602) (612,915)
Group Group Group GroupDeferred tax asset /(liability): 2016 2015 2016 2015 N’000 N’000 N’000 N’000 Deferred tax to be recovered within 12 months 307,848 1,092 307,848 1,092 Deferred tax to be recovered after more than 12 months 57,461 (614,007) 57,461 (614,007) 365,309 (612,915) 365,309 (612,915)
Notes to the Annual Financial Statements

2016 ANNUAL REPORT 131
32. Share capital Share capital comprises: Group Group Bank Bank 2016 2015 2016 2015 N’000 N’000 N’000 N’000Authorised:
3.0 billion Ordinary shares of N1.00 each 3,000,000 3,000,000 3,000,000 3,000,000
Issued and fully paid
2.794 billion Ordinary shares of N1.00 each 2,793,777 2,793,777 2,793,777 2,793,777 Other reserves include: 32.1. Share premium Premiums from the issue of shares are reported in the share premium. 32.2. Treasury shares reserve Treasury shares reserve holds 60,416,666 units of the Bank’s shares which are held in trust by the staff participation scheme (31 December 2015: 60,416,666).
Employees are not eligible to own any unit of the shares. And it is neither an equity or a cash settled share based scheme. 32.3 Statutory reserve Statutory reserves include i) the mandatory annual appropriation as required by the Banks and Other Financial Institution Act of Nigeria and ii) the N3,340,909,050 Small and Medium Scale Industries Reserve (SMEEIS) reserve (31 December 2015: N3,340,909,050) maintained to comply with the Central Bank of Nigeria requirement. 32.4 Fair value reserve The fair value reserve includes the net cumulative change in the fair value of available-for-sale investment securities until the investment is derecognised or impaired.
The movement on fair value reserve account during the year was as follows: Share capital comprises: Group Group Bank Bank 2016 2015 2016 2015 N’000 N’000 N’000 N’000
At 1 January 1,268,901 (3,011,838) 1,268,901 (3,011,838)
Net change in fair value of available-for-sale securities (5,055,933) 7,789,093 (5,055,933) 7,789,093
Reclassification adjustments for realised 1 , 1 5 7,70 (1,673,752) 1,157,706 (1,673,752)
net gains on available-for-sale securities
Net tax charge on fair value changes - (1,834,602) - (1,834,602)
At 31 December (2,629,325) 1,268,901 (2,629,325) 1,268,901
31.1 The tax (charge)/credit relating to components of other comprehensive income is as follows:
2016 Before tax Tax (charge) /credit After tax
Fair value gains/(losses) on available-for-sale assets (3,898,226) - (3,898,226) 2015 Before tax Tax (charge) /credit After tax
Fair value gains/(losses) on available-for-sale assets 6,115,341 (1,834,602) 4,280,739
Notes to the Annual Financial Statements
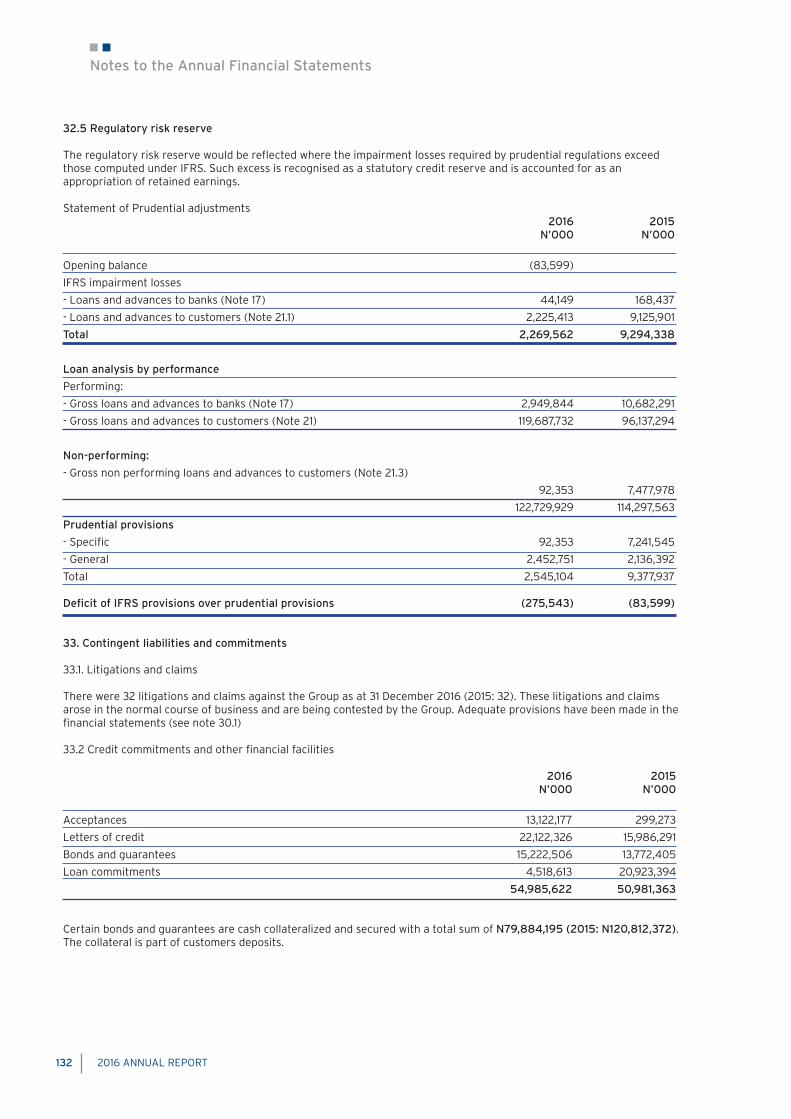
132 2016 ANNUAL REPORT
32.5 Regulatory risk reserve The regulatory risk reserve would be reflected where the impairment losses required by prudential regulations exceed those computed under IFRS. Such excess is recognised as a statutory credit reserve and is accounted for as an appropriation of retained earnings. Statement of Prudential adjustments 2016 2015 N’000 N’000
Opening balance (83,599)
IFRS impairment losses
- Loans and advances to banks (Note 17) 44,149 168,437
- Loans and advances to customers (Note 21.1) 2,225,413 9,125,901
Total 2,269,562 9,294,338
Loan analysis by performance
Performing:
- Gross loans and advances to banks (Note 17) 2,949,844 10,682,291
- Gross loans and advances to customers (Note 21) 119,687,732 96,137,294
Non-performing:
- Gross non performing loans and advances to customers (Note 21.3)
92,353 7,477,978
122,729,929 114,297,563
Prudential provisions
- Specific 92,353 7,241,545
- General 2,452,751 2,136,392
Total 2,545,104 9,377,937 Deficit of IFRS provisions over prudential provisions (275,543) (83,599)
33. Contingent liabilities and commitments 33.1. Litigations and claims There were 32 litigations and claims against the Group as at 31 December 2016 (2015: 32). These litigations and claims arose in the normal course of business and are being contested by the Group. Adequate provisions have been made in the financial statements (see note 30.1) 33.2 Credit commitments and other financial facilities 2016 2015 N’000 N’000
Acceptances 13,122,177 299,273
Letters of credit 22,122,326 15,986,291
Bonds and guarantees 15,222,506 13,772,405
Loan commitments 4,518,613 20,923,394
54,985,622 50,981,363 Certain bonds and guarantees are cash collateralized and secured with a total sum of N79,884,195 (2015: N120,812,372). The collateral is part of customers deposits.
Notes to the Annual Financial Statements

2016 ANNUAL REPORT 133
33.3 Capital commitments The group has no capital commitment as at 31 December 2016 (2015: nil)
34 Related party transactions
Parties are considered to be related if one party has the ability to control the other party or exercise significant influence over the other party in making financial and operational decisions, or another party controls both entities. The Group definition of related parties includes subsidiary, associates and key management personnel. Transactions with key management personnel
The Group’s key management personnel, and persons connected with them, are also considered to be related parties. The definition of key management includes the close members of family of key personnel and any entity over which key management personnel exercise control. The key management personnel have been identified as the executive and non-executive directors of the Group. Close members of family are those family members who may be expected to influence, or be influenced by that individual in their dealings with the Group.
34.1. Parent and ultimate controlling party
81.9% of the Bank’s share capital is held by Citibank Overseas Investment Corporation. The ultimate parent of the Group is Citigroup Inc. which is incorporated in the United States of America. In the normal course of the bank’s business, the Group enters into business transactions with other Citigroup offices.
Balances with other Citigroup offices as at 31 December
2016 2015 N’000 N’000
Assets
Loans and advances to Banks 116,979,388 136,075,177
Derivative financial instruments 52,689 6,637
117,032,077 136,081,813 2016 2015 N’000 N’000
Liabilities
Deposits from banks 860,722 617,296
Deposits from Customers 8,327,083 2,910,096
Derivative financial instruments 102,319,218 -
111,507,023 3,527,392
Income and expenses from other Citigroup offices during the year 2016 2015 N’000 N’000
Interest and similar income 382,719 82,230
Interest and similar expense (138,996) (528,707)
Net interest income 243,722 (446,477)
Fee and commission income 130,016 197,604
373,739 (248,873)
34.2. Key management personnel and their immediate relatives engaged in the following transactions with the Group as at
31 December 2016
2016 2015 N’000 N’000
Loans and advances 72,595 65,995
Deposits 3,823 2,500 2016 2015 N’000 N’000
Interest income on KMP loans 1,455 1,403
Interest expense on KMP deposits 38 87
Notes to the Annual Financial Statements
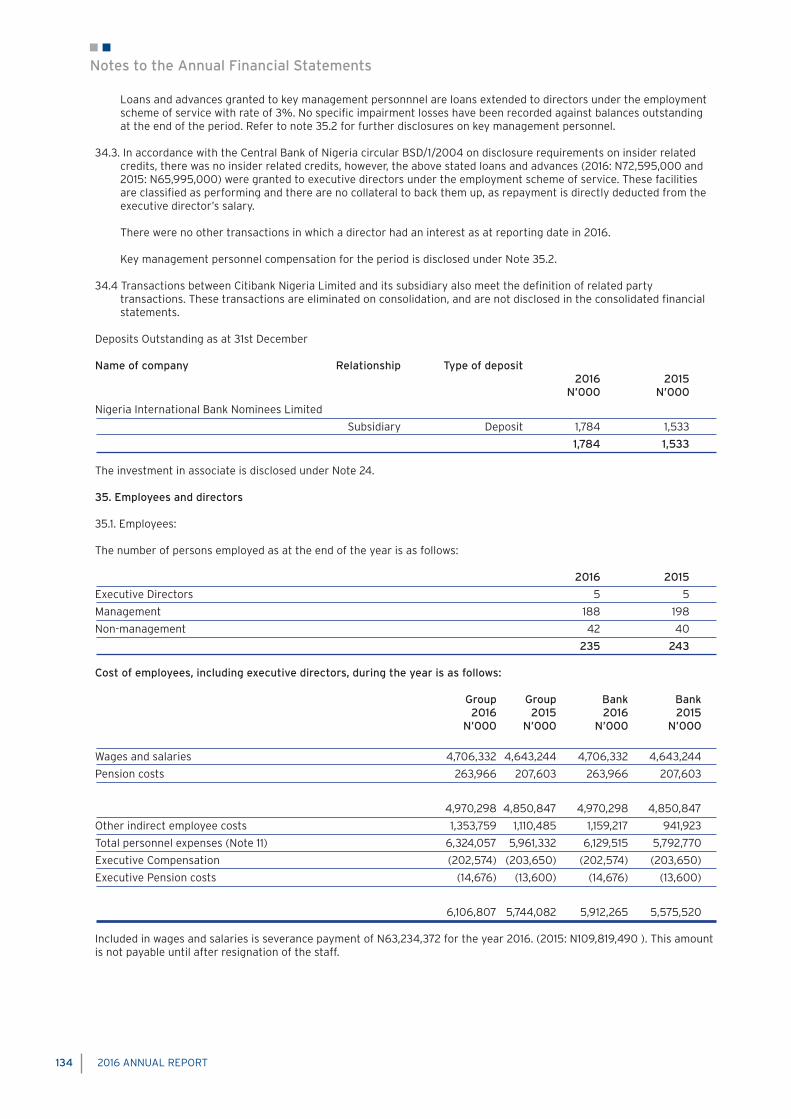
134 2016 ANNUAL REPORT
Loans and advances granted to key management personnnel are loans extended to directors under the employment scheme of service with rate of 3%. No specific impairment losses have been recorded against balances outstanding at the end of the period. Refer to note 35.2 for further disclosures on key management personnel.
34.3. In accordance with the Central Bank of Nigeria circular BSD/1/2004 on disclosure requirements on insider related
credits, there was no insider related credits, however, the above stated loans and advances (2016: N72,595,000 and 2015: N65,995,000) were granted to executive directors under the employment scheme of service. These facilities are classified as performing and there are no collateral to back them up, as repayment is directly deducted from the executive director’s salary.
There were no other transactions in which a director had an interest as at reporting date in 2016. Key management personnel compensation for the period is disclosed under Note 35.2.
34.4 Transactions between Citibank Nigeria Limited and its subsidiary also meet the definition of related party
transactions. These transactions are eliminated on consolidation, and are not disclosed in the consolidated financial statements.
Deposits Outstanding as at 31st December Name of company Relationship Type of deposit 2016 2015 N’000 N’000
Nigeria International Bank Nominees Limited
Subsidiary Deposit 1,784 1,533
1,784 1,533
The investment in associate is disclosed under Note 24. 35. Employees and directors 35.1. Employees: The number of persons employed as at the end of the year is as follows: 2016 2015
Executive Directors 5 5
Management 188 198
Non-management 42 40
235 243
Cost of employees, including executive directors, during the year is as follows:
Group Group Bank Bank 2016 2015 2016 2015 N’000 N’000 N’000 N’000
Wages and salaries 4,706,332 4,643,244 4,706,332 4,643,244
Pension costs 263,966 207,603 263,966 207,603
4,970,298 4,850,847 4,970,298 4,850,847
Other indirect employee costs 1,353,759 1,110,485 1,159,217 941,923
Total personnel expenses (Note 11) 6,324,057 5,961,332 6,129,515 5,792,770
Executive Compensation (202,574) (203,650) (202,574) (203,650)
Executive Pension costs (14,676) (13,600) (14,676) (13,600)
6,106,807 5,744,082 5,912,265 5,575,520
Included in wages and salaries is severance payment of N63,234,372 for the year 2016. (2015: N109,819,490 ). This amount is not payable until after resignation of the staff.
Notes to the Annual Financial Statements

2016 ANNUAL REPORT 135
The number of persons employed by the Group, who received emoluments in the following ranges (excluding pension contribution), were: 2016 2015
N2,000,001 - N3,000,000 0 5
N3,000,001 - N4,000,000 21 9
N4,000,001 - N5,000,000 8 15
N5,000,001 - N6,000,000 2 12
N6,000,001 - N7,000,000 11 7
Above N7,000,000 193 195
235 243
35.2 Directors Directors’ remuneration was paid as follows: 2016 2015 N’000 N’000
Fees and sitting allowances (Note 12) 60,300 48,000
Executive compensation (Note 11) 202,574 203,650
Executive pension costs 14,676 13,600
277,550 265,250
The directors’ remuneration shown above includes: 2016 2015 N’000 N’000
Chairman 15,400 11,500
Highest paid director 63,250 63,250
The number of other directors who received fees and other emoluments in the following ranges were: 2016 2015 Number Number Directors with fees above N2,000,000 11 12 Three non-executive directors did not receive any fees or other emoluments. 36 Dividend The dividend paid in 2016 and 2015 were N8,995,962,677.38 (N3.22k per share) and N7,794,638,468.91 (N2.79k per share) respectively. A dividend in respect of the year ended 31 December 2016 of N7.77k per share, amounting to a total dividend of N21,704,297,219 is to be proposed at the next annual general meeting. These financial statements do not reflect this dividend payable. 37. Cash and cash equivalents
For the purposes of the cash flow statement, cash and cash equivalents include cash and non restricted balances with the Central Bank of Nigeria, treasury bills and other eligible bills, operating account balances with other banks, amount due from other banks: 2016 2015 N’000 N’000
Cash and balances with Central Bank of Nigeria (Note 16.1) 19,124,795 58,083,452
Trading securities - Treasury bills 816,222 252,537
Loans and advances to banks (Note 17) 110,262,296 147,857,927
130,203,313 206,193,916 38. Group entities 38.1 Investments in subsidiaries comprises: 2016 2015 N’000 N’000 Nigeria International Bank Nominees Limited 1,000 1,000 There was no movement in the Bank’s investment in the share capital of its fully owned subsidiary during the year.
Notes to the Annual Financial Statements

136 2016 ANNUAL REPORT
38.2 Investment in Associates comprises of Accion Microfinance Bank as disclosed in Note 24. 38.3. Treasury shares comprises of the staff participation scheme as disclosed in Note 32.2.
38.4 Condensed results of the consolidated entities are as follows:
31 December 2016 Staff NIB Participation Elimination Bank Nominees Scheme Entries Group N’000 N’000 N’000 N’000 N’000
Operating income 49,488,472 3,250 - (44,714) 49,447,008
Operating expenses (17,060,478) (2,954) (194,542) 3,250 (17,254,724)
32,427,994 296 (194,542) (41,464) 32,192,285
Share of profit of associates accounted for
using equity method - - 75,144 75,144
Profit before tax 32,427,994 296 (194,542) 33,680 32,267,429
Tax (6,893,619) (95) - - (6,893,713)
Profit after tax 25,534,376 201 (194,542) 33,680 25,373,716
Total assets 603,937,157 5,034 60,417 333,829 604,336,437
Liabilities 531,615,890 3,092 - (5,034) 531,613,948
Net assets 72,321,267 1,942 60,417 338,863 72,722,489
Equity 72,321,266 1,941 60,417 338,863 72,722,487 31 December 2015 Staff NIB Participation Elimination Bank Nominees Scheme Entries Group N’000 N’000 N’000 N’000 N’000
Operating Income 33,618,278 4,124 - (42,221) 33,580,181
Operating Expenses (20,654,356) (3,749) (168,562) 4 , 1 24 (20,822,543)
12,963,922 375 (168,562) (38,097) 12,757,638
Share of profit of associates accounted
for using equity method - - 124,600 124,600
Profit before tax 12,963,922 376 (168,562) 86,503 12,882,239
Tax (2,367,240) (120) - - (2,367,360)
Profit after tax 10,596,682 256 (168,562) 86,503 10,514,878
Total Assets 430,836,643 5,657 60,417 299,526 431,202,244
Liabilities 371,699,377 3,913 - (5,657) 371,697,633
Net Assets 59,137,266 1,744 60,417 305,183 59,504,611
Equity 59,137,266 1,744 60,417 305,183 59,504,610
39. Compliance with banking regulations The Bank did not contravene any provisions of the Banks and Other Financial Institutions Act (BOFIA). The bank was fined an amount of N125,000 representing penalty for late rendition of daily returns to CBN. The bank was also fined for an amount of N36,000 by SEC for late submission of its Annual Financial Statement for year 2015. Subsequent events 40. Subsequent events
There were no post reporting date events which could have a material effect on the financial position of the Group and Bank as at 31 December 2016 or the profit for the year ended on that date that have not been adequately provided for or disclosed.
Notes to the Annual Financial Statements

2016 ANNUAL REPORT 137
Group Bank 2016 2015 2016 2015 N’000 % N’000 % N’000 % N’000 %
Gross Operating income 49,345,093 31,558,078 49,386,558 31,596,175
Interest expense
- Foreign 177,579 (591,382) 177,579 (591,382)
- Local (4,115,767) (5,515,838) (3,938,189) (5,515,838)
45,406,905 25,450,858 45,625,948 25,488,955
Net credit losses (4,040,103) - (4,040,103) -
Adminstrative overheads (6,600,362) (6,282,035) (6,600,658) (6,282,410)
Share of profit of associates
accounted for using equity method 75,144 124,600 - -
34,841,584 100% 19,293,425 100% 34,985,187 100% 19,206,545 100%
Distribution:
Employees
- Salaries and benefits 6,324,057 16% 5,961,332 31% 6,129,515 16% 5,792,770 30%
Government
- Taxation 6,893,713 18% 2,367,360 12% 6,893,619 18% 2,367,240 12%
Future
- Asset replacement (depreciation) 290,203 1% 449,854 2% 290,204 1% 449,854 2%
- Expansion (transfer to equity) 25,373,713 65% 10,514,877 54% 25,534,374 66% 10,596,682 55%
38,881,686 100% 19,293,423 100% 38,847,712 100% 19,206,546 100%
STATEMENT OF VALUE ADDED AT 31 DECEMBER 2016

138 2016 ANNUAL REPORT
2016 2015 2014 2013 2012 N’000 N’000 N’000 N’000 N’000 ASSETS
Cash and balances with Central Bank of Nigeria 78,913,109 104,446,388 34,331,517 22,996,953 20,762,072
Loans and advances to banks 113,167,991 158,371,780 150,740,892 122,258,126 121,241,497
Held for trading securities 108,662,159 12,952,024 1,919,692 81,538,729 61,168,214
Derivative financial instruments 28,282,399 6,662 5,351,023 14,466,556 10,962,881
Assets pledged as collateral 7,250,469 4,041,522 3,787,423 14,237 167,107
Loans and advances to customers 117,554,672 94,489,371 92,364,499 89,778,262 97,501,871
Investment securities 108,622,549 53,058,829 106,633,357 4,646,152 7,808,015
Other assets 38,507,969 260,823 533,674 1,091,075 850,692
Investments in associate 798,300 764,620 678,116 564,864 497,762
Property, plant and equipment 2,211,513 2,810,224 2,775,107 2,606,933 2,618,705
Deferred tax asset 365,309 - 1,026,366 359,545 -
Total assets 604,336,440 431,202,243 400,141,666 340,321,432 323,586,324
LIABILITIES
Deposits from banks 1,034,242 770,983 47,999,349 1,263,243 10,440,127
Deposits from customers 485,845,373 358,184,320 291,160,817 276,901,195 250,158,010
Derivative financial instruments 22,335,602 6,466 280,580 12,393 93,550
Retirement benefit obligations - 7,900 7,586 8,063 13,054
Current income tax liabilities 7,866,270 2,805,397 2,561,944 3,740,849 3,551,266
Other borrowed funds - - - 700,000 2,285,714
Other liabilities 15,076,184 9,309,653 5,739,833 7,376,514 6,930,799
Provisions - - 56,488 58,488 58,488
Deferred income tax liability - 612,915 - - 782,924
Total equity 72,178,769 59,504,610 52,335,069 50,260,687 49,272,392
Total equity and liabilities 604,336,440 431,202,243 400,141,666 340,321,432 323,586,324
Credit commitments and other financial facilties 54,985,623 50,981,363 92,412,948 56,189,598 62,277,919
STATEMENT OF COMPREHENSIVE INCOME
Net operating income 45,406,905 25,450,858 30,484,210 28,136,917 27,915,342
Operating expenses (13,214,622) (12,693,221) (12,518,793) (11,304,892) (11,072,735)
Write-back/(allowance) on risk assets
Share of profit of associates accounted for using equity method 75,144 124,600 127,676 78,197 56,652
Profit before tax 32,267,427 12,882,237 18,093,093 16,910,222 16,899,258
Income tax expense (6,893,620) (2,367,360) (2,635,539) (3,267,092) (3,874,866)
Profit for the year 25,373,807 10,514,877 15,457,554 13,643,130 13,024,392
Other comprehensive income for the year, net of tax (3,898,226) 4,280,739 (1,903,058) (1,858,058) 4,788,575
Total comprehensive income attributable to shareholders 21,475,581 14,795,616 13,554,496 11,785,072 17,812,967
Earnings per share 908k 389k 566k 495k 476k
Declared dividend per share 777k 322k 279k 395k 295k
Number of ordinary shares of N1.00 2,793,777 2,793,777 2,793,777 2,793,777 2,793,777
CONSOLIDATED FIVE YEAR FINANCIAL SUMMARYOTHER FINANCIAL INFORMATIONFOR THE YEAR ENDED 31 DECEMBER 2016
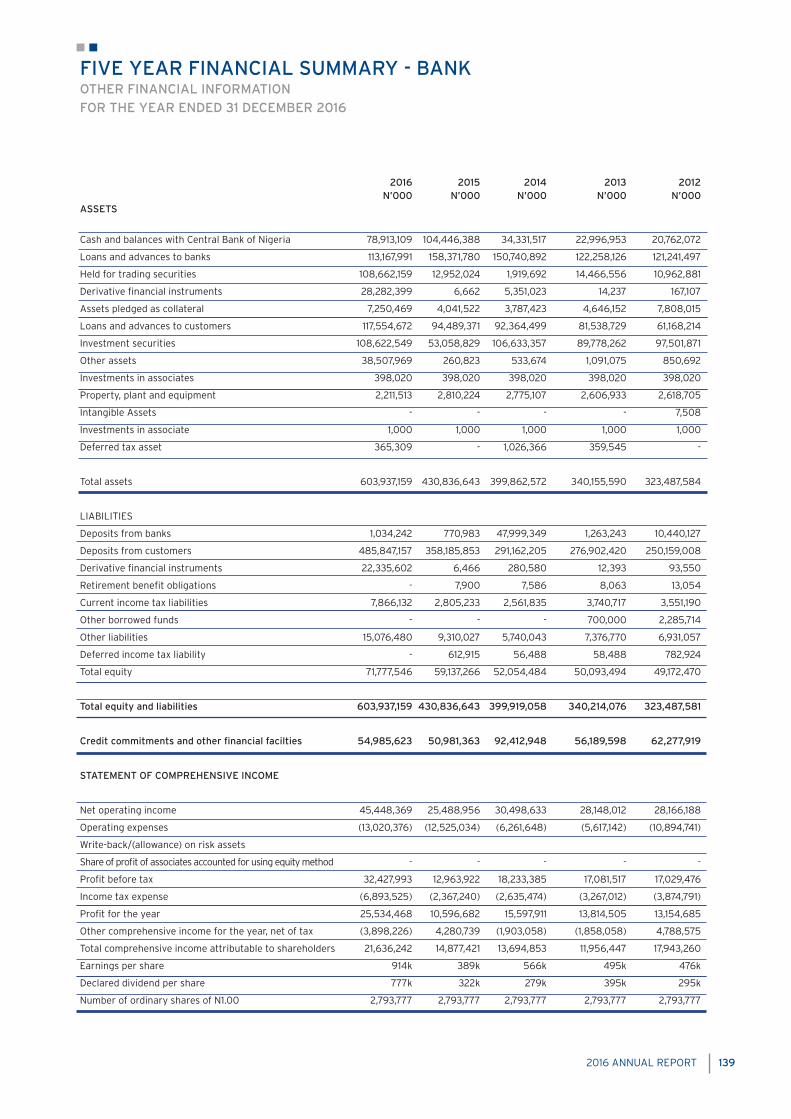
2016 ANNUAL REPORT 139
2016 2015 2014 2013 2012 N’000 N’000 N’000 N’000 N’000 ASSETS
Cash and balances with Central Bank of Nigeria 78,913,109 104,446,388 34,331,517 22,996,953 20,762,072
Loans and advances to banks 113,167,991 158,371,780 150,740,892 122,258,126 121,241,497
Held for trading securities 108,662,159 12,952,024 1,919,692 14,466,556 10,962,881
Derivative financial instruments 28,282,399 6,662 5,351,023 14,237 167,107
Assets pledged as collateral 7,250,469 4,041,522 3,787,423 4,646,152 7,808,015
Loans and advances to customers 117,554,672 94,489,371 92,364,499 81,538,729 61,168,214
Investment securities 108,622,549 53,058,829 106,633,357 89,778,262 97,501,871
Other assets 38,507,969 260,823 533,674 1,091,075 850,692
Investments in associates 398,020 398,020 398,020 398,020 398,020
Property, plant and equipment 2,211,513 2,810,224 2,775,107 2,606,933 2,618,705
Intangible Assets - - - - 7,508
Investments in associate 1,000 1,000 1,000 1,000 1,000
Deferred tax asset 365,309 - 1,026,366 359,545 -
Total assets 603,937,159 430,836,643 399,862,572 340,155,590 323,487,584
LIABILITIES
Deposits from banks 1,034,242 770,983 47,999,349 1,263,243 10,440,127
Deposits from customers 485,847,157 358,185,853 291,162,205 276,902,420 250,159,008
Derivative financial instruments 22,335,602 6,466 280,580 12,393 93,550
Retirement benefit obligations - 7,900 7,586 8,063 13,054
Current income tax liabilities 7,866,132 2,805,233 2,561,835 3,740,717 3,551,190
Other borrowed funds - - - 700,000 2,285,714
Other liabilities 15,076,480 9,310,027 5,740,043 7,376,770 6,931,057
Deferred income tax liability - 612,915 56,488 58,488 782,924
Total equity 71,777,546 59,137,266 52,054,484 50,093,494 49,172,470
Total equity and liabilities 603,937,159 430,836,643 399,919,058 340,214,076 323,487,581
Credit commitments and other financial facilties 54,985,623 50,981,363 92,412,948 56,189,598 62,277,919
STATEMENT OF COMPREHENSIVE INCOME
Net operating income 45,448,369 25,488,956 30,498,633 28,148,012 28,166,188
Operating expenses (13,020,376) (12,525,034) (6,261,648) (5,617,142) (10,894,741)
Write-back/(allowance) on risk assets
Share of profit of associates accounted for using equity method - - - - -
Profit before tax 32,427,993 12,963,922 18,233,385 17,081,517 17,029,476
Income tax expense (6,893,525) (2,367,240) (2,635,474) (3,267,012) (3,874,791)
Profit for the year 25,534,468 10,596,682 15,597,911 13,814,505 13,154,685
Other comprehensive income for the year, net of tax (3,898,226) 4,280,739 (1,903,058) (1,858,058) 4,788,575
Total comprehensive income attributable to shareholders 21,636,242 14,877,421 13,694,853 11,956,447 17,943,260
Earnings per share 914k 389k 566k 495k 476k
Declared dividend per share 777k 322k 279k 395k 295k
Number of ordinary shares of N1.00 2,793,777 2,793,777 2,793,777 2,793,777 2,793,777
FIVE YEAR FINANCIAL SUMMARY - BANK OTHER FINANCIAL INFORMATIONFOR THE YEAR ENDED 31 DECEMBER 2016

2016 ANNUAL REPORT140
2016 IN PICTURES

2016 ANNUAL REPORT 141

2016 ANNUAL REPORT142


© 2016 Citibank, N.A. All rights reserved. Citi and Arc Design is a trademark and service mark of Citigroup Inc., used and registered throughout the world.
GRA27031 09/16