2015 second quarter results -...
TRANSCRIPT
TSX: IMG NYSE: IAG
2015 Second Quarter Results August 6, 2015
2
STEVE LETWIN President & CEO
GORD STOTHART EVP & Chief Operating Officer
CAROL BANDUCCI EVP & Chief Financial Officer
CRAIG MACDOUGALL SVP, Exploration
JEFF SNOW General Counsel & SVP, Business Development
BOB TAIT VP, Investor Relations
Management Participants
Cautionary Statement on Forward-Looking Information
All information included in this presentation, including any information as to the Company’s future financial or operating performance, and other statements that express management’s
expectations or estimates of future performance, other than statements of historical fact, constitute forward looking information or forward-looking statements and are based on
expectations, estimates and projections as of the date of this presentation. Forward-looking statements contained in this presentation include, without limitation, statements with respect to:
the Company’s guidance for production, cash costs, all-in sustaining costs, depreciation expense, effective tax rate, and operating margin, capital expenditures, operations outlook, cost
management initiatives, development and expansion projects, exploration, the future price of gold, the estimation of mineral reserves and mineral resources, the realization of mineral
reserve and mineral resource estimates, the timing and amount of estimated future production, costs of production, permitting timelines, currency fluctuations, requirements for additional
capital, government regulation of mining operations, environmental risks, unanticipated reclamation expenses, title disputes or claims and limitations on insurance coverage. Forward-
looking statements are provided for the purpose of providing information about management’s current expectations and plans relating to the future. Forward-looking statements are
generally identifiable by, but are not limited to the, use of the words “may”, “will”, “should”, “continue”, “expect”, “antic ipate”, “estimate”, “believe”, “intend”, “plan”, “suggest”, “guidance”,
“outlook”, “potential”, “prospects”, “seek”, “targets”, “strategy” or “project” or the negative of these words or other variations on these words or comparable terminology. Forward-looking
statements are necessarily based upon a number of estimates and assumptions that, while considered reasonable by management, are inherently subject to significant business,
economic and competitive uncertainties and contingencies. The Company cautions the reader that reliance on such forward-looking statements involve risks, uncertainties and other
factors that may cause the actual financial results, performance or achievements of IAMGOLD to be materially different from the Company’s estimated future results, performance or
achievements expressed or implied by those forward-looking statements, and the forward-looking statements are not guarantees of future performance. These risks, uncertainties and
other factors include, but are not limited to, changes in the global prices for gold, copper, silver or certain other commodities (such as diesel and electricity); changes in U.S. dollar and
other currency exchange rates, interest rates or gold lease rates; risks arising from holding derivative instruments; the level of liquidity and capital resources; access to capital markets,
and financing; mining tax regimes; ability to successfully integrate acquired assets; legislative, political or economic developments in the jurisdictions in which the Company carries on
business; operating or technical difficulties in connection with mining or development activities; laws and regulations governing the protection of the environment; employee relations;
availability and increasing costs associated with mining inputs and labour; the speculative nature of exploration and development, including the risks of diminishing quantities or grades of
reserves; adverse changes in the Company’s credit rating; contests over title to properties, particularly title to undeveloped properties; and the risks involved in the exploration,
development and mining business. With respect to development projects, IAMGOLD’s ability to sustain or increase its present levels of gold production is dependent in part on the success
of its projects. Risks and unknowns inherent in all projects include the inaccuracy of estimated reserves and resources, metallurgical recoveries, capital and operating costs of such
projects, and the future prices for the relevant minerals. Development projects have no operating history upon which to base estimates of future cash flows. The capital expenditures and
time required to develop new mines or other projects are considerable, and changes in costs or construction schedules can affect project economics. Actual costs and economic returns
may differ materially from IAMGOLD’s estimates or IAMGOLD could fail to obtain the governmental approvals necessary for the operation of a project; in either case, the project may not
proceed, either on its original timing or at all.
For a more comprehensive discussion of the risks faced by the Company, and which may cause the actual financial results, performance or achievements of IAMGOLD to be materially
different from the company’s estimated future results, performance or achievements expressed or implied by forward-looking information or forward-looking statements, please refer to the
Company’s latest Annual Information Form, filed with Canadian securities regulatory authorities at www.sedar.com, and filed under Form 40-F with the United States Securities Exchange
Commission at www.sec.gov/edgar.shtml. The risks described in the Annual Information Form (filed and viewable on www.sedar.com and www.sec.gov/edgar.shtml, and available upon
request from the Company) are hereby incorporated by reference into this presentation.
The Company disclaims any intention or obligation to update or revise any forward-looking statements whether as a result of new information, future events or otherwise except as
required by applicable law.
3
The Gold Price: An Industry Challenge
4
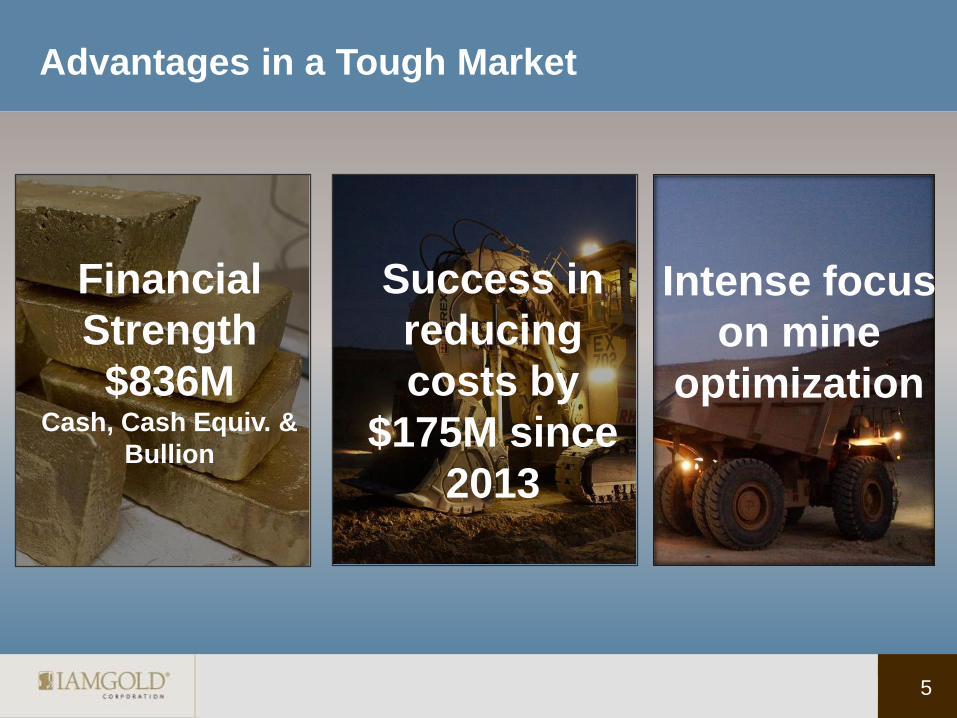
Advantages in a Tough Market
5
Success in
reducing
costs by
$175M since
2013
Financial
Strength
$836M Cash, Cash Equiv. &
Bullion
Intense focus
on mine
optimization
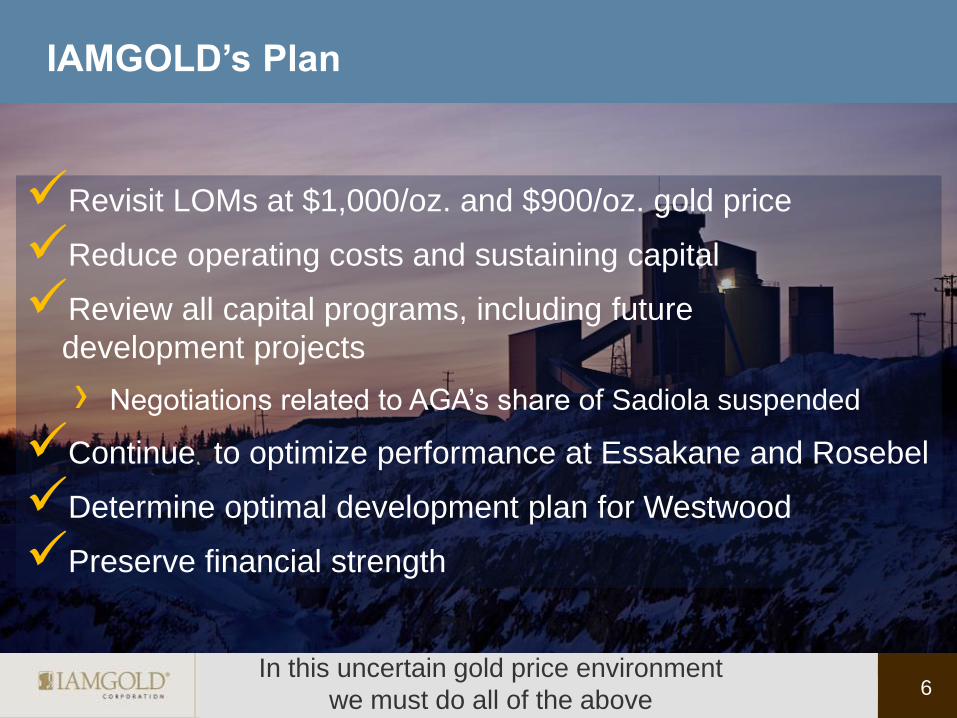
IAMGOLD’s Plan
6
1
Revisit LOMs at $1,000/oz. and $900/oz. gold price
Reduce operating costs and sustaining capital
Review all capital programs, including future
development projects
› Negotiations related to AGA’s share of Sadiola suspended
Continue to optimize performance at Essakane and Rosebel
Determine optimal development plan for Westwood
Preserve financial strength
In this uncertain gold price environment
we must do all of the above
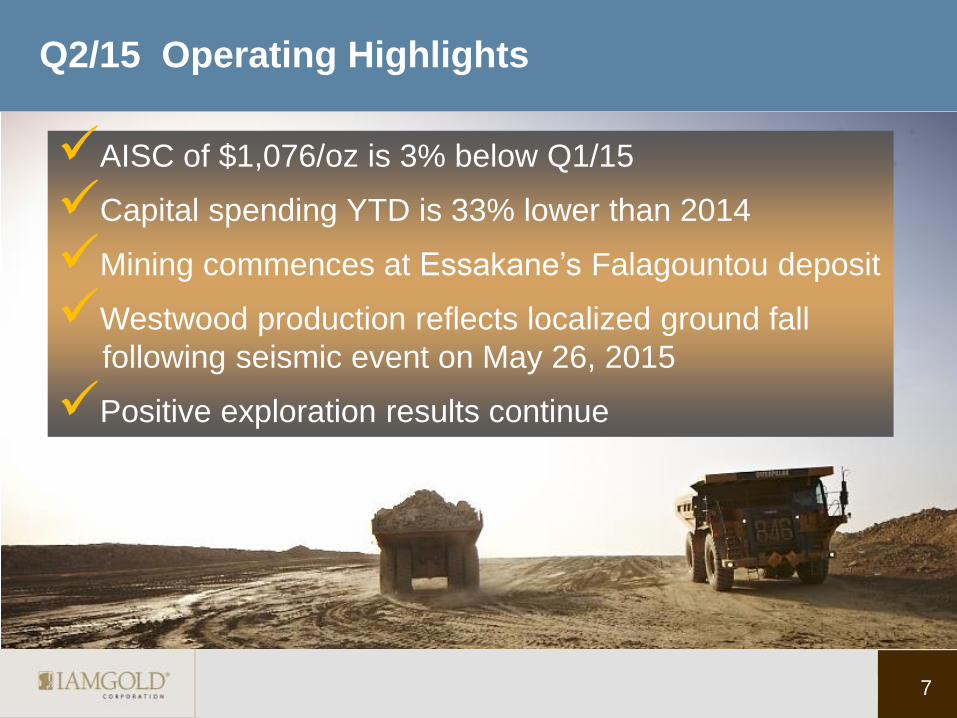
Q2/15 Operating Highlights
7
AISC of $1,076/oz is 3% below Q1/15
Capital spending YTD is 33% lower than 2014
Mining commences at Essakane’s Falagountou deposit
Westwood production reflects localized ground fall
following seismic event on May 26, 2015
Positive exploration results continue
8
Financial Review
9
305.3
279.3
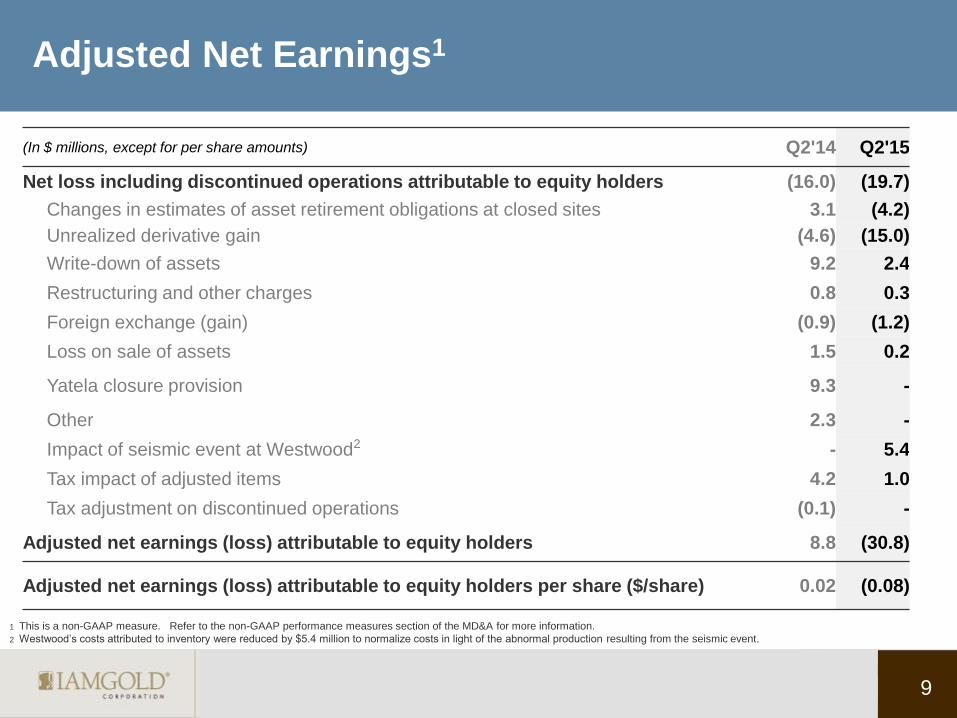
Adjusted Net Earnings1
(In $ millions, except for per share amounts) Q2'14 Q2'15
Net loss including discontinued operations attributable to equity holders (16.0) (19.7)
Changes in estimates of asset retirement obligations at closed sites 3.1 (4.2)
Unrealized derivative gain (4.6) (15.0)
Write-down of assets 9.2 2.4
Restructuring and other charges 0.8 0.3
Foreign exchange (gain) (0.9) (1.2)
Loss on sale of assets 1.5 0.2
Yatela closure provision 9.3 -
Other 2.3 -
Impact of seismic event at Westwood2 - 5.4
Tax impact of adjusted items 4.2 1.0
Tax adjustment on discontinued operations (0.1) -
Adjusted net earnings (loss) attributable to equity holders 8.8 (30.8)
Adjusted net earnings (loss) attributable to equity holders per share ($/share) 0.02 (0.08)
1 This is a non-GAAP measure. Refer to the non-GAAP performance measures section of the MD&A for more information.
2 Westwood’s costs attributed to inventory were reduced by $5.4 million to normalize costs in light of the abnormal production resulting from the seismic event.
$m
illi
on
s
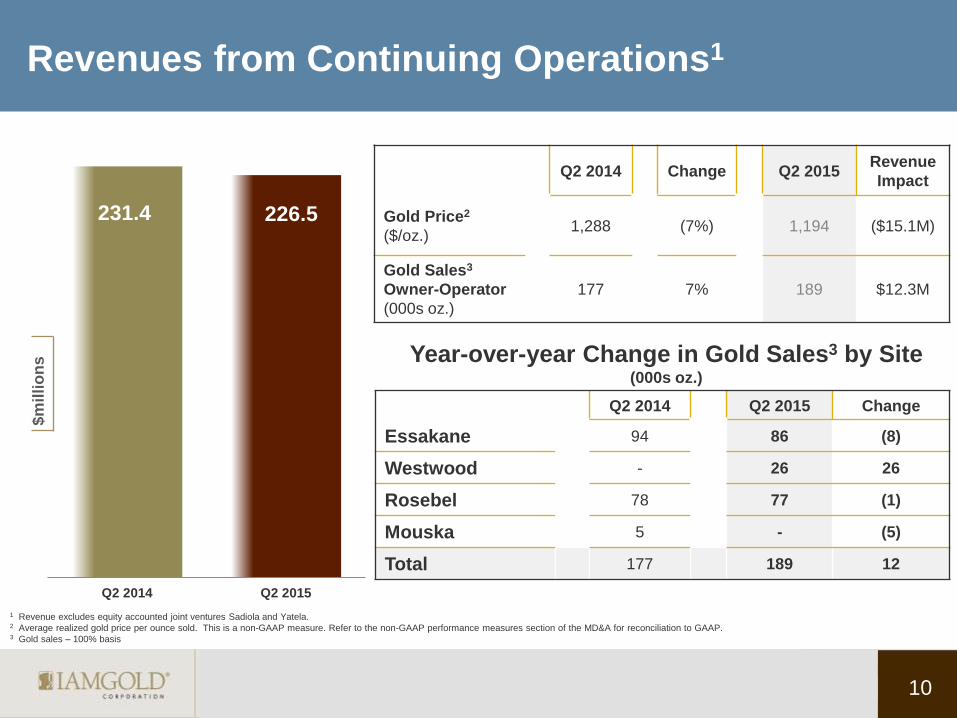
Q2 2014 Change Q2 2015 Revenue
Impact
Gold Price2
($/oz.) 1,288 (7%) 1,194 ($15.1M)
Gold Sales3
Owner-Operator
(000s oz.)
177 7% 189 $12.3M
10
305.3
279.3
231.4 226.5
Q2 2014 Q2 2015
Q2 2014 Q2 2015 Change
Essakane 94 86 (8)
Westwood - 26 26
Rosebel 78 77 (1)
Mouska 5 - (5)
Total 177 189 12
Year-over-year Change in Gold Sales3 by Site (000s oz.)
Revenues from Continuing Operations1
1 Revenue excludes equity accounted joint ventures Sadiola and Yatela. 2 Average realized gold price per ounce sold. This is a non-GAAP measure. Refer to the non-GAAP performance measures section of the MD&A for reconciliation to GAAP. 3 Gold sales – 100% basis
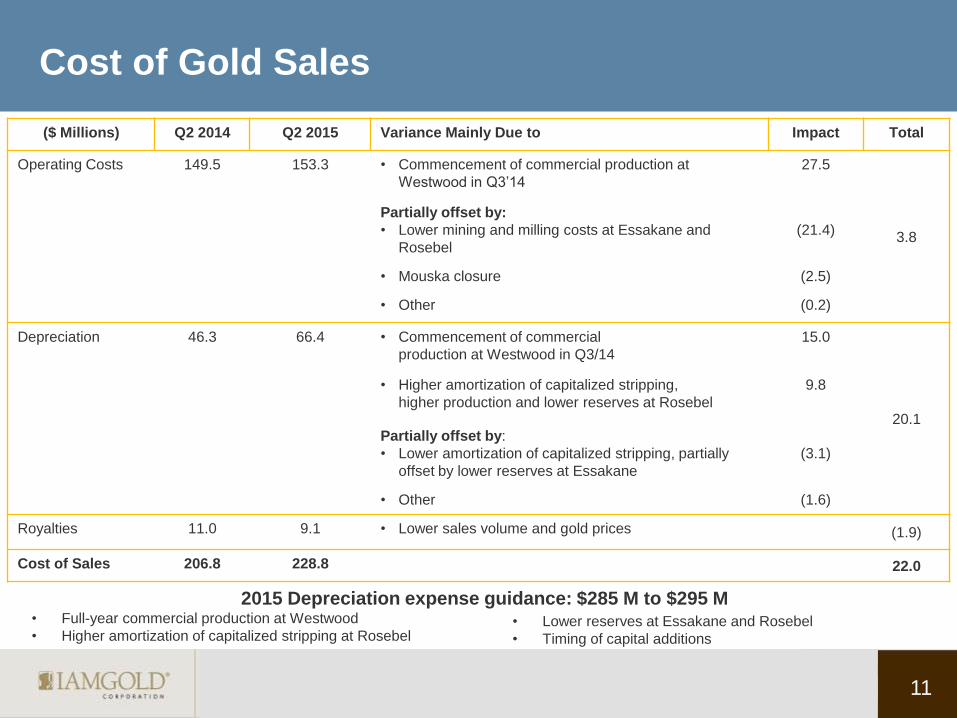
Cost of Gold Sales
11
($ Millions) Q2 2014 Q2 2015 Variance Mainly Due to Impact Total
Operating Costs 149.5 153.3 • Commencement of commercial production at
Westwood in Q3’14
27.5
3.8
Partially offset by:
• Lower mining and milling costs at Essakane and
Rosebel
(21.4)
• Mouska closure (2.5)
• Other (0.2)
Depreciation 46.3 66.4 • Commencement of commercial
production at Westwood in Q3/14
15.0
20.1
• Higher amortization of capitalized stripping,
higher production and lower reserves at Rosebel
9.8
Partially offset by:
• Lower amortization of capitalized stripping, partially
offset by lower reserves at Essakane
(3.1)
• Other (1.6)
Royalties 11.0 9.1 • Lower sales volume and gold prices (1.9)
Cost of Sales 206.8 228.8 22.0
• Full-year commercial production at Westwood
• Higher amortization of capitalized stripping at Rosebel
2015 Depreciation expense guidance: $285 M to $295 M • Lower reserves at Essakane and Rosebel
• Timing of capital additions
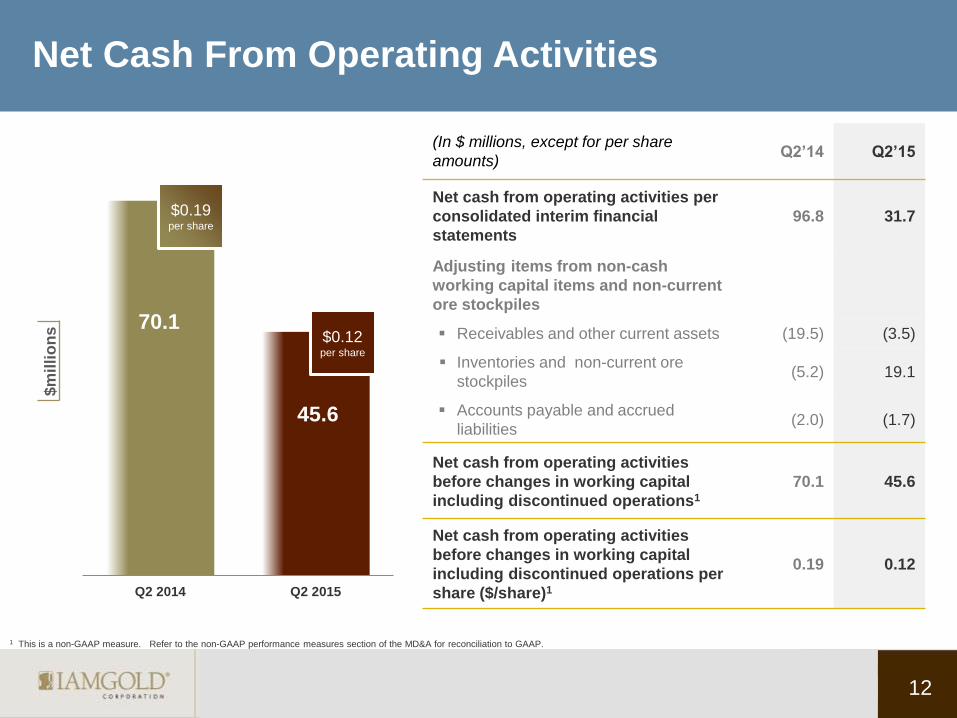
Net Cash From Operating Activities $
mil
lio
ns
12
(In $ millions, except for per share
amounts) Q2’14 Q2’15
Net cash from operating activities per
consolidated interim financial
statements
96.8 31.7
Adjusting items from non-cash
working capital items and non-current
ore stockpiles
Receivables and other current assets (19.5) (3.5)
Inventories and non-current ore
stockpiles (5.2) 19.1
Accounts payable and accrued
liabilities (2.0) (1.7)
Net cash from operating activities
before changes in working capital
including discontinued operations1
70.1 45.6
Net cash from operating activities
before changes in working capital
including discontinued operations per
share ($/share)1
0.19 0.12
70.1
45.6
Q2 2014 Q2 2015
$0.19 per share
1 This is a non-GAAP measure. Refer to the non-GAAP performance measures section of the MD&A for reconciliation to GAAP.
$0.12 per share
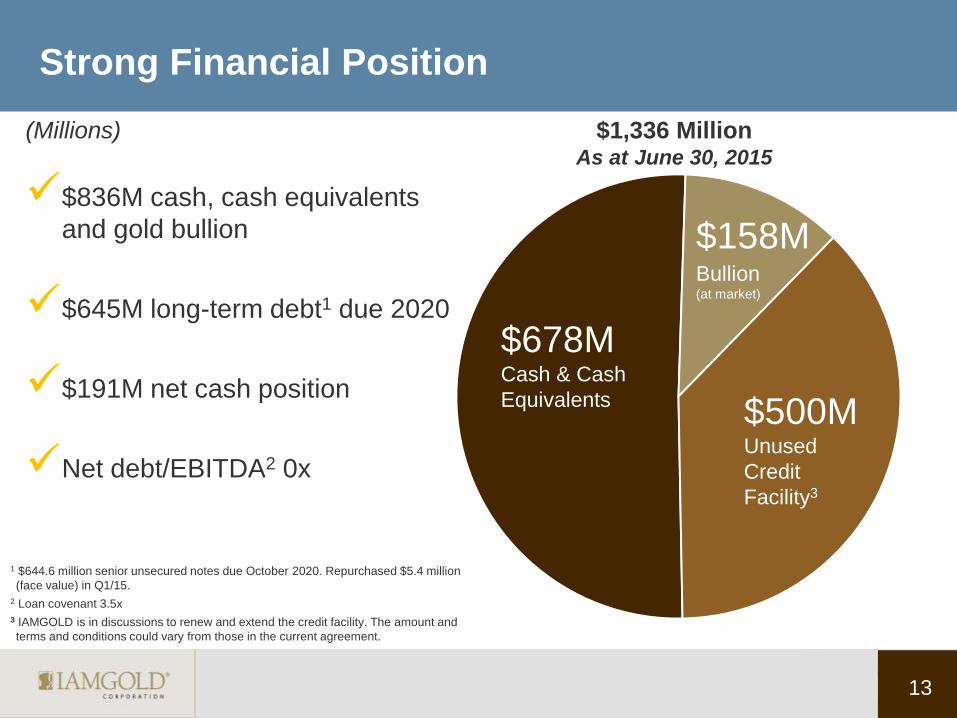
Strong Financial Position
$500M Unused
Credit
Facility3
$158M Bullion (at market)
13
$1,336 Million As at June 30, 2015
$678M Cash & Cash
Equivalents
$836M cash, cash equivalents
and gold bullion
$645M long-term debt1 due 2020
$191M net cash position
Net debt/EBITDA2 0x
(Millions)
1 $644.6 million senior unsecured notes due October 2020. Repurchased $5.4 million
(face value) in Q1/15.
2 Loan covenant 3.5x
3 IAMGOLD is in discussions to renew and extend the credit facility. The amount and
terms and conditions could vary from those in the current agreement.
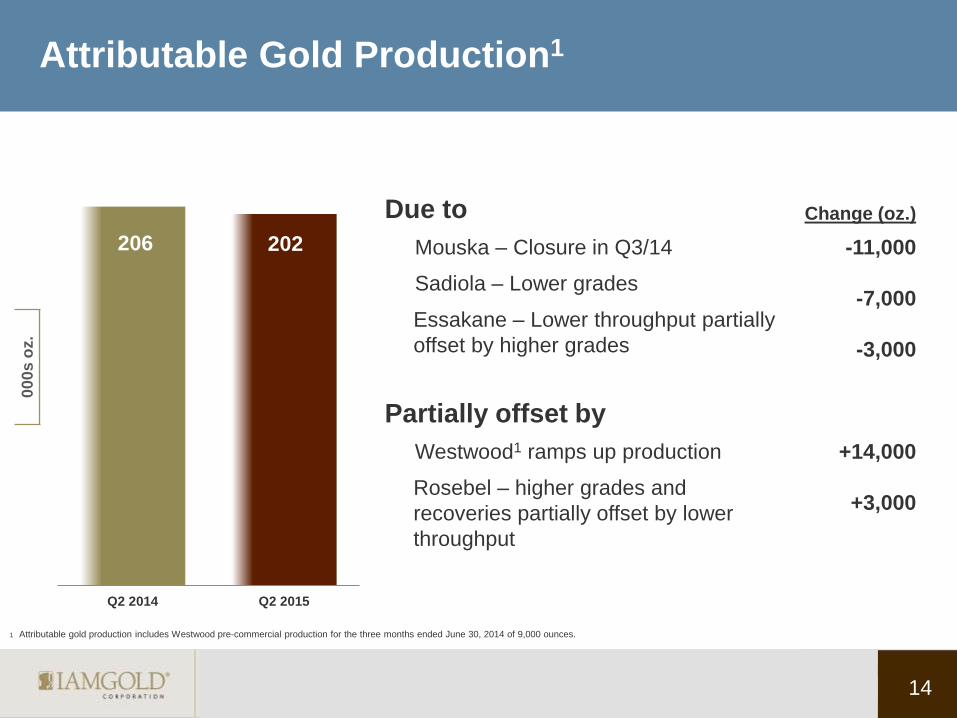
Attributable Gold Production1
14
00
0s
oz.
1 Attributable gold production includes Westwood pre-commercial production for the three months ended June 30, 2014 of 9,000 ounces.
206 202
Q2 2014 Q2 2015
Due to Change (oz.)
Mouska – Closure in Q3/14
Sadiola – Lower grades
Essakane – Lower throughput partially
offset by higher grades
-11,000
-7,000
-3,000
Partially offset by
Westwood1 ramps up production
Rosebel – higher grades and
recoveries partially offset by lower
throughput
+14,000
+3,000
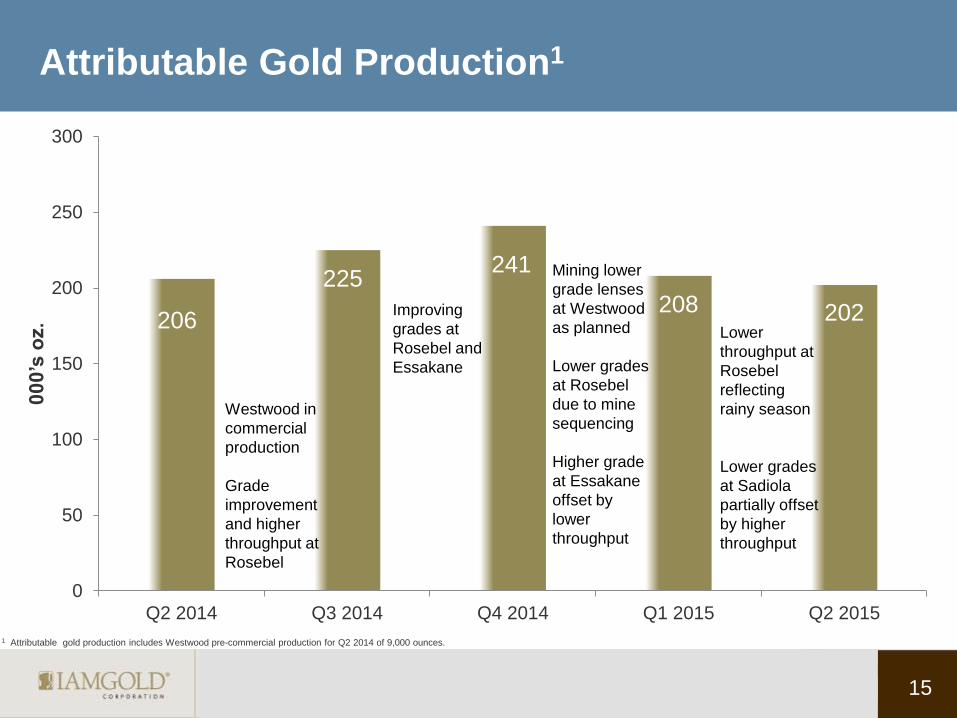
Attributable Gold Production1
206
225 241
208 202
0
50
100
150
200
250
300
Q2 2014 Q3 2014 Q4 2014 Q1 2015 Q2 2015
00
0’s
oz.
Westwood in
commercial
production
Grade
improvement
and higher
throughput at
Rosebel
Improving
grades at
Rosebel and
Essakane
Mining lower
grade lenses
at Westwood
as planned
Lower grades
at Rosebel
due to mine
sequencing
Higher grade
at Essakane
offset by
lower
throughput
Lower
throughput at
Rosebel
reflecting
rainy season
Lower grades
at Sadiola
partially offset
by higher
throughput
15
1 Attributable gold production includes Westwood pre-commercial production for Q2 2014 of 9,000 ounces.
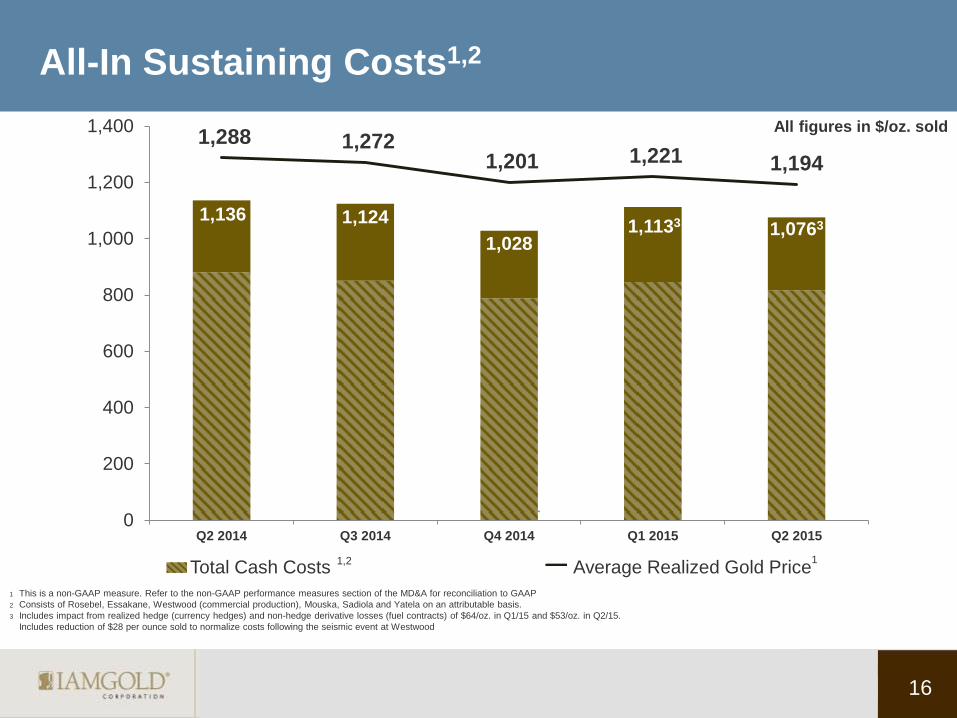
Total Cash Costs Average Realized Gold Price
All-In Sustaining Costs1,2
1,136 1,124
1,028 1,1133 1,0763
1,288 1,272 1,201 1,221 1,194
0
200
400
600
800
1,000
1,200
1,400
Q2 2014 Q3 2014 Q4 2014 Q1 2015 Q2 2015
`
All figures in $/oz. sold
16
1 This is a non-GAAP measure. Refer to the non-GAAP performance measures section of the MD&A for reconciliation to GAAP
2 Consists of Rosebel, Essakane, Westwood (commercial production), Mouska, Sadiola and Yatela on an attributable basis.
3 Includes impact from realized hedge (currency hedges) and non-hedge derivative losses (fuel contracts) of $64/oz. in Q1/15 and $53/oz. in Q2/15.
Includes reduction of $28 per ounce sold to normalize costs following the seismic event at Westwood
1,2 1
Operations Review
17
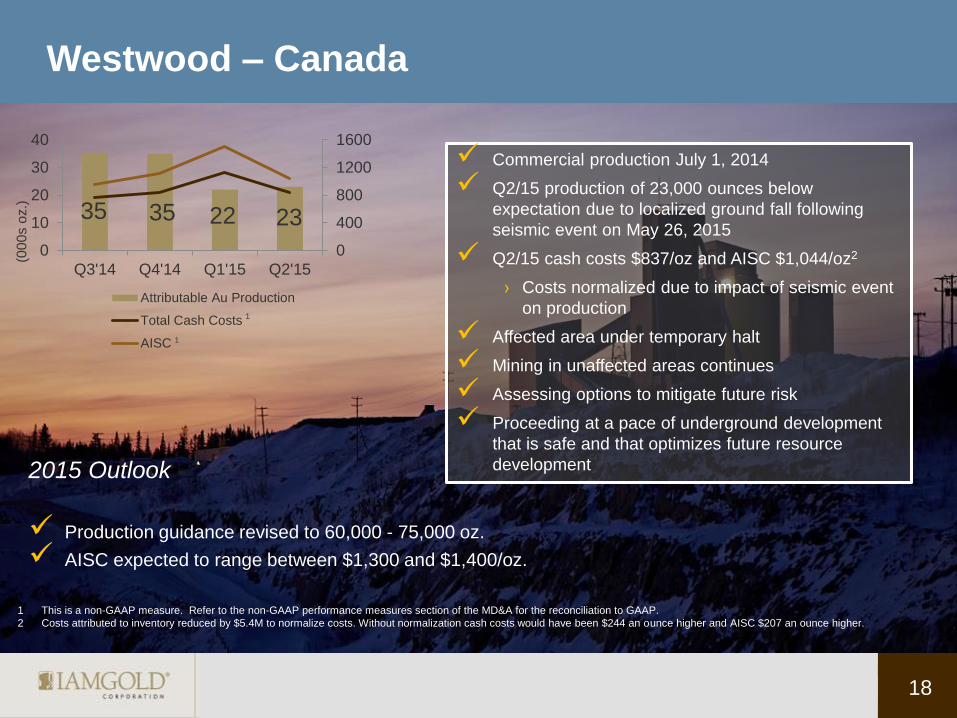
2015 Outlook
Production guidance revised to 60,000 - 75,000 oz.
AISC expected to range between $1,300 and $1,400/oz.
Westwood – Canada
18
Commercial production July 1, 2014
Q2/15 production of 23,000 ounces below
expectation due to localized ground fall following
seismic event on May 26, 2015
Q2/15 cash costs $837/oz and AISC $1,044/oz2
› Costs normalized due to impact of seismic event
on production
Affected area under temporary halt
Mining in unaffected areas continues
Assessing options to mitigate future risk
Proceeding at a pace of underground development
that is safe and that optimizes future resource
development
(00
0s o
z.)
35 35 22 23
0
400
800
1200
1600
0
10
20
30
40
Q3'14 Q4'14 Q1'15 Q2'15
Attributable Au Production
Total Cash Costs
AISC
1 This is a non-GAAP measure. Refer to the non-GAAP performance measures section of the MD&A for the reconciliation to GAAP.
2 Costs attributed to inventory reduced by $5.4M to normalize costs. Without normalization cash costs would have been $244 an ounce higher and AISC $207 an ounce higher.
1
1
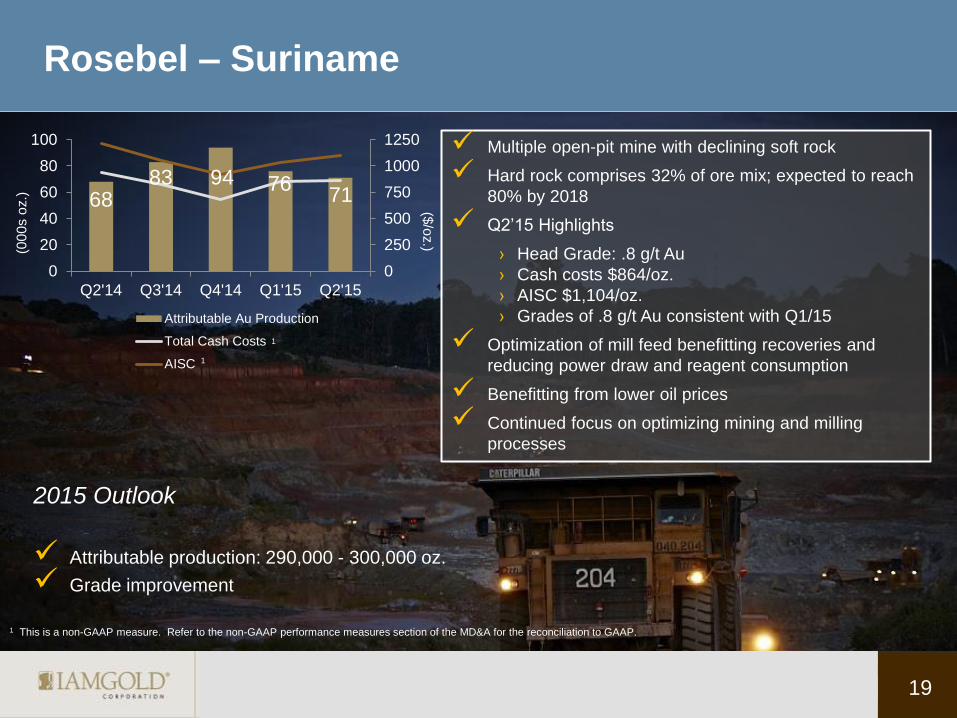
Rosebel – Suriname
1 This is a non-GAAP measure. Refer to the non-GAAP performance measures section of the MD&A for the reconciliation to GAAP.
($/o
z.) (0
00
s o
z.)
Multiple open-pit mine with declining soft rock
Hard rock comprises 32% of ore mix; expected to reach
80% by 2018
Q2’15 Highlights
› Head Grade: .8 g/t Au
› Cash costs $864/oz.
› AISC $1,104/oz.
› Grades of .8 g/t Au consistent with Q1/15
Optimization of mill feed benefitting recoveries and
reducing power draw and reagent consumption
Benefitting from lower oil prices
Continued focus on optimizing mining and milling
processes
19
2015 Outlook
Attributable production: 290,000 - 300,000 oz.
Grade improvement
68 83 94 76
71
0
250
500
750
1000
1250
0
20
40
60
80
100
Q2'14 Q3'14 Q4'14 Q1'15 Q2'15
Attributable Au Production
Total Cash Costs
AISC
1
1
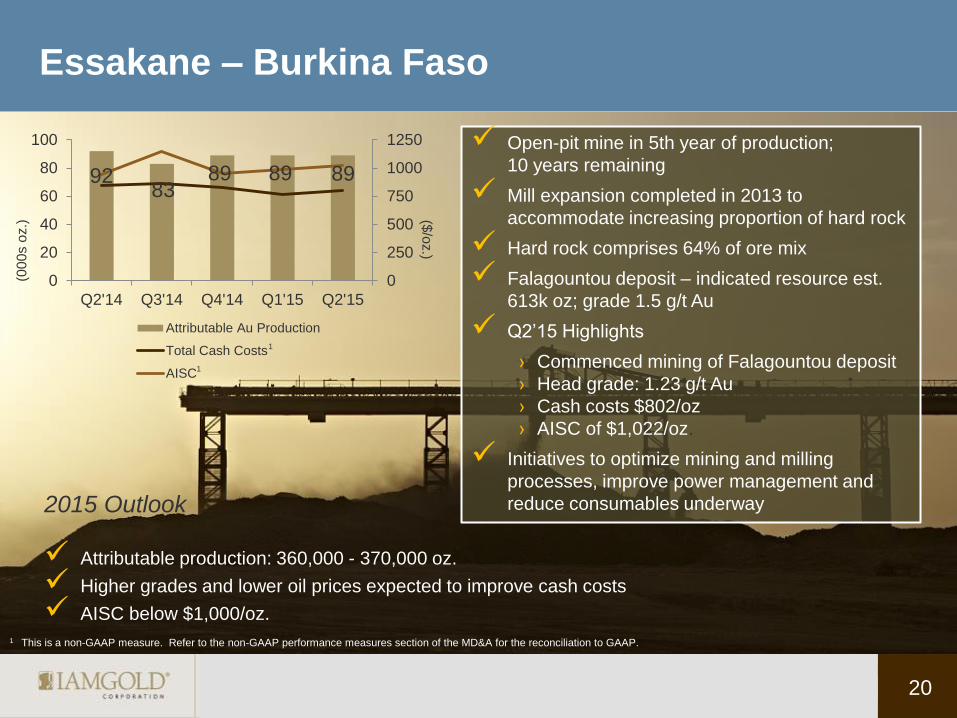
Essakane – Burkina Faso
2015 Outlook
Attributable production: 360,000 - 370,000 oz.
Higher grades and lower oil prices expected to improve cash costs
AISC below $1,000/oz.
($/o
z.)
(00
0s o
z.)
1 This is a non-GAAP measure. Refer to the non-GAAP performance measures section of the MD&A for the reconciliation to GAAP.
20
92 83
89 89 89
0
250
500
750
1000
1250
0
20
40
60
80
100
Q2'14 Q3'14 Q4'14 Q1'15 Q2'15
Attributable Au Production
Total Cash Costs
AISC
Open-pit mine in 5th year of production;
10 years remaining
Mill expansion completed in 2013 to
accommodate increasing proportion of hard rock
Hard rock comprises 64% of ore mix
Falagountou deposit – indicated resource est.
613k oz; grade 1.5 g/t Au
Q2’15 Highlights
› Commenced mining of Falagountou deposit
› Head grade: 1.23 g/t Au
› Cash costs $802/oz
› AISC of $1,022/oz.
Initiatives to optimize mining and milling
processes, improve power management and
reduce consumables underway
1
1
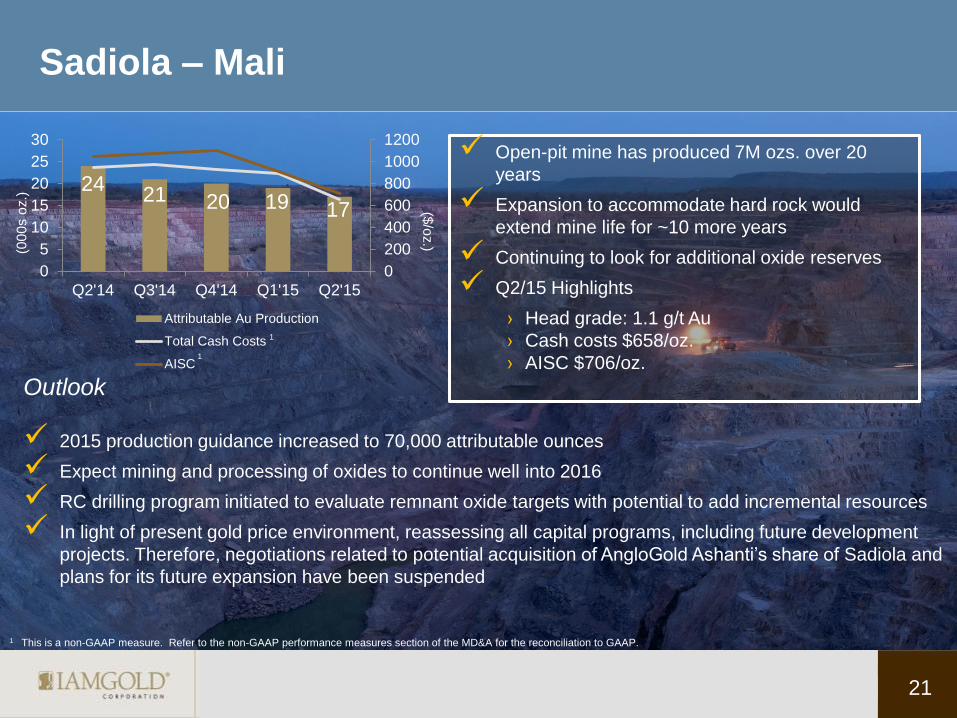
Sadiola – Mali
21
Open-pit mine has produced 7M ozs. over 20
years
Expansion to accommodate hard rock would
extend mine life for ~10 more years
Continuing to look for additional oxide reserves
Q2/15 Highlights
› Head grade: 1.1 g/t Au
› Cash costs $658/oz.
› AISC $706/oz.
($/o
z.) (0
00
s o
z.)
24 21 20 19 17
0
200
400
600
800
1000
1200
0
5
10
15
20
25
30
Q2'14 Q3'14 Q4'14 Q1'15 Q2'15
Attributable Au Production
Total Cash Costs
AISC
Outlook
2015 production guidance increased to 70,000 attributable ounces
Expect mining and processing of oxides to continue well into 2016
RC drilling program initiated to evaluate remnant oxide targets with potential to add incremental resources
In light of present gold price environment, reassessing all capital programs, including future development
projects. Therefore, negotiations related to potential acquisition of AngloGold Ashanti’s share of Sadiola and
plans for its future expansion have been suspended
1 This is a non-GAAP measure. Refer to the non-GAAP performance measures section of the MD&A for the reconciliation to GAAP.
1
1
Exploration Review
22
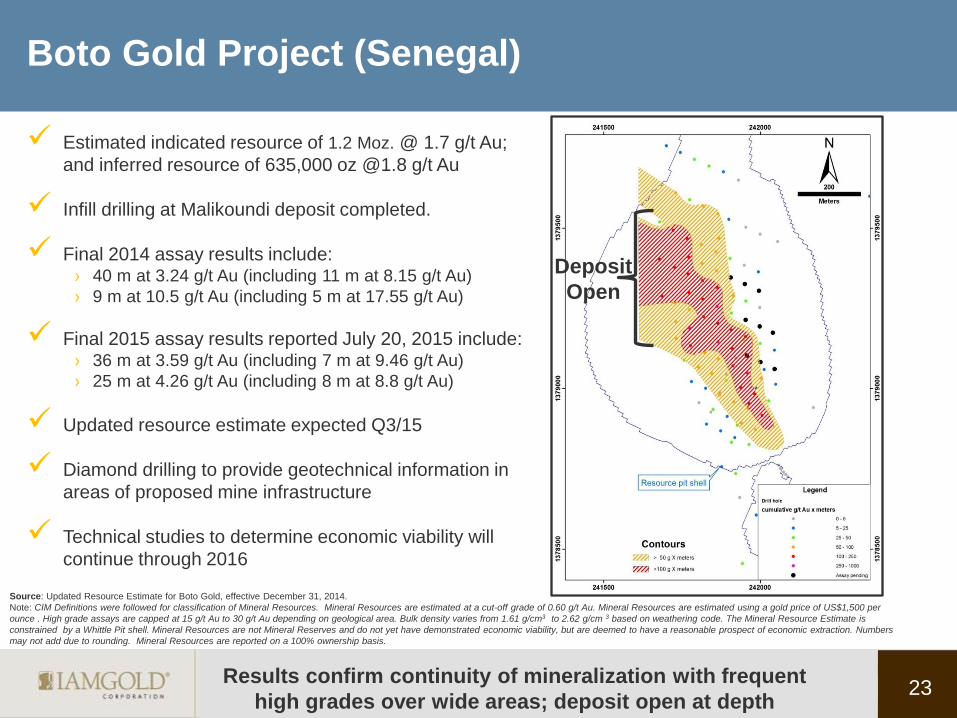
Estimated indicated resource of 1.2 Moz. @ 1.7 g/t Au;
and inferred resource of 635,000 oz @1.8 g/t Au
Infill drilling at Malikoundi deposit completed.
Final 2014 assay results include: › 40 m at 3.24 g/t Au (including 11 m at 8.15 g/t Au)
› 9 m at 10.5 g/t Au (including 5 m at 17.55 g/t Au)
Final 2015 assay results reported July 20, 2015 include: › 36 m at 3.59 g/t Au (including 7 m at 9.46 g/t Au)
› 25 m at 4.26 g/t Au (including 8 m at 8.8 g/t Au)
Updated resource estimate expected Q3/15
Diamond drilling to provide geotechnical information in
areas of proposed mine infrastructure
Technical studies to determine economic viability will
continue through 2016
Source: Updated Resource Estimate for Boto Gold, effective December 31, 2014.
Note: CIM Definitions were followed for classification of Mineral Resources. Mineral Resources are estimated at a cut-off grade of 0.60 g/t Au. Mineral Resources are estimated using a gold price of US$1,500 per
ounce . High grade assays are capped at 15 g/t Au to 30 g/t Au depending on geological area. Bulk density varies from 1.61 g/cm3 to 2.62 g/cm 3 based on weathering code. The Mineral Resource Estimate is
constrained by a Whittle Pit shell. Mineral Resources are not Mineral Reserves and do not yet have demonstrated economic viability, but are deemed to have a reasonable prospect of economic extraction. Numbers
may not add due to rounding. Mineral Resources are reported on a 100% ownership basis.
Boto Gold Project (Senegal)
23
Deposit
Open
Results confirm continuity of mineralization with frequent
high grades over wide areas; deposit open at depth
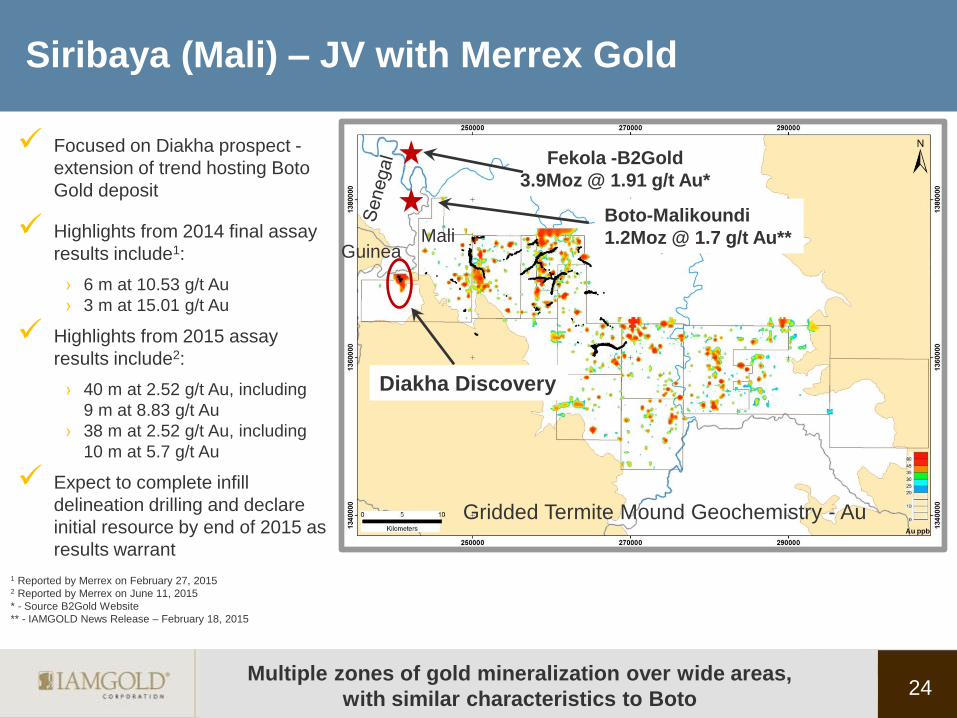
Siribaya (Mali) – JV with Merrex Gold
Focused on Diakha prospect -
extension of trend hosting Boto
Gold deposit
Highlights from 2014 final assay
results include1:
› 6 m at 10.53 g/t Au
› 3 m at 15.01 g/t Au
Highlights from 2015 assay
results include2:
› 40 m at 2.52 g/t Au, including
9 m at 8.83 g/t Au
› 38 m at 2.52 g/t Au, including
10 m at 5.7 g/t Au
Expect to complete infill
delineation drilling and declare
initial resource by end of 2015 as
results warrant
24
Mali Guinea
Fekola -B2Gold
3.9Moz @ 1.91 g/t Au*
Boto-Malikoundi
1.2Moz @ 1.7 g/t Au**
Diakha Discovery
1 Reported by Merrex on February 27, 2015 2 Reported by Merrex on June 11, 2015
* - Source B2Gold Website
** - IAMGOLD News Release – February 18, 2015
Gridded Termite Mound Geochemistry - Au
Multiple zones of gold mineralization over wide areas,
with similar characteristics to Boto
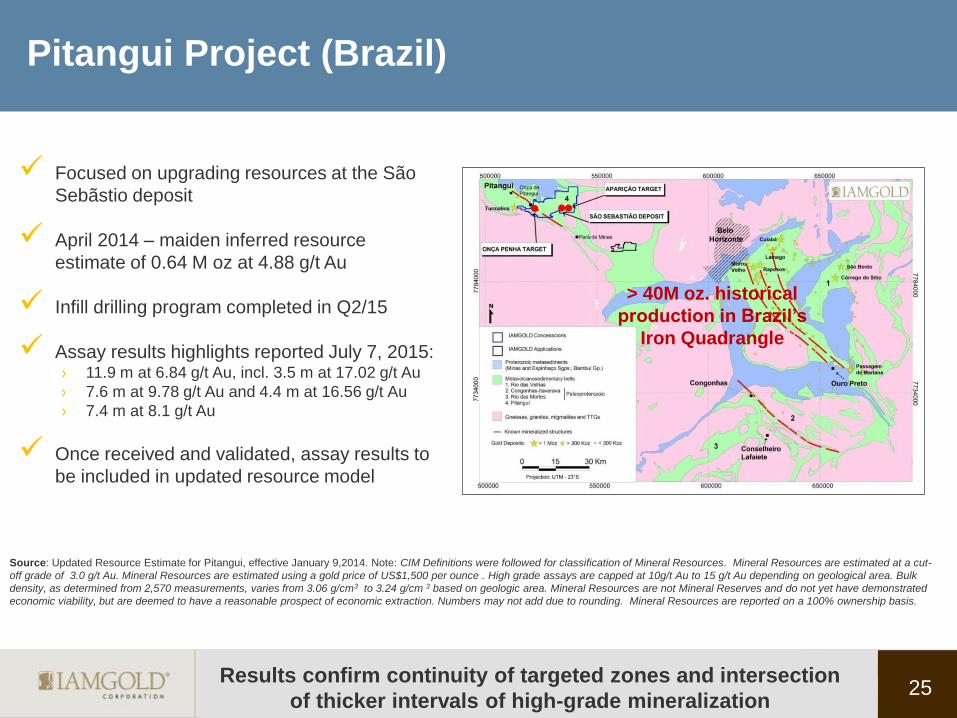
Focused on upgrading resources at the São
Sebãstio deposit
April 2014 – maiden inferred resource
estimate of 0.64 M oz at 4.88 g/t Au
Infill drilling program completed in Q2/15
Assay results highlights reported July 7, 2015: › 11.9 m at 6.84 g/t Au, incl. 3.5 m at 17.02 g/t Au
› 7.6 m at 9.78 g/t Au and 4.4 m at 16.56 g/t Au
› 7.4 m at 8.1 g/t Au
Once received and validated, assay results to
be included in updated resource model
Source: Updated Resource Estimate for Pitangui, effective January 9,2014. Note: CIM Definitions were followed for classification of Mineral Resources. Mineral Resources are estimated at a cut-
off grade of 3.0 g/t Au. Mineral Resources are estimated using a gold price of US$1,500 per ounce . High grade assays are capped at 10g/t Au to 15 g/t Au depending on geological area. Bulk
density, as determined from 2,570 measurements, varies from 3.06 g/cm3 to 3.24 g/cm 3 based on geologic area. Mineral Resources are not Mineral Reserves and do not yet have demonstrated
economic viability, but are deemed to have a reasonable prospect of economic extraction. Numbers may not add due to rounding. Mineral Resources are reported on a 100% ownership basis.
25
Pitangui Project (Brazil)
Results confirm continuity of targeted zones and intersection
of thicker intervals of high-grade mineralization
> 40M oz. historical
production in Brazil’s
Iron Quadrangle
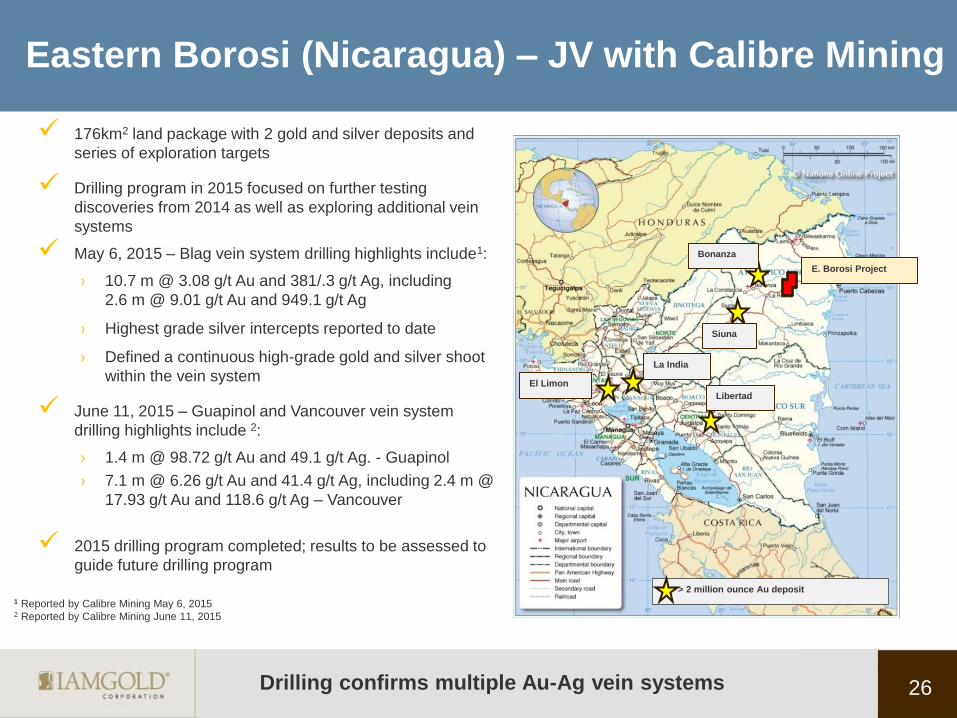
Eastern Borosi (Nicaragua) – JV with Calibre Mining
176km2 land package with 2 gold and silver deposits and
series of exploration targets
Drilling program in 2015 focused on further testing
discoveries from 2014 as well as exploring additional vein
systems
May 6, 2015 – Blag vein system drilling highlights include1:
› 10.7 m @ 3.08 g/t Au and 381/.3 g/t Ag, including
2.6 m @ 9.01 g/t Au and 949.1 g/t Ag
› Highest grade silver intercepts reported to date
› Defined a continuous high-grade gold and silver shoot
within the vein system
June 11, 2015 – Guapinol and Vancouver vein system
drilling highlights include 2:
› 1.4 m @ 98.72 g/t Au and 49.1 g/t Ag. - Guapinol
› 7.1 m @ 6.26 g/t Au and 41.4 g/t Ag, including 2.4 m @
17.93 g/t Au and 118.6 g/t Ag – Vancouver
2015 drilling program completed; results to be assessed to
guide future drilling program
> 2 million ounce Au deposit
Bonanza
El Limon
Siuna
Libertad
La India
E. Borosi Project
26
1 Reported by Calibre Mining May 6, 2015 2 Reported by Calibre Mining June 11, 2015
Drilling confirms multiple Au-Ag vein systems
27
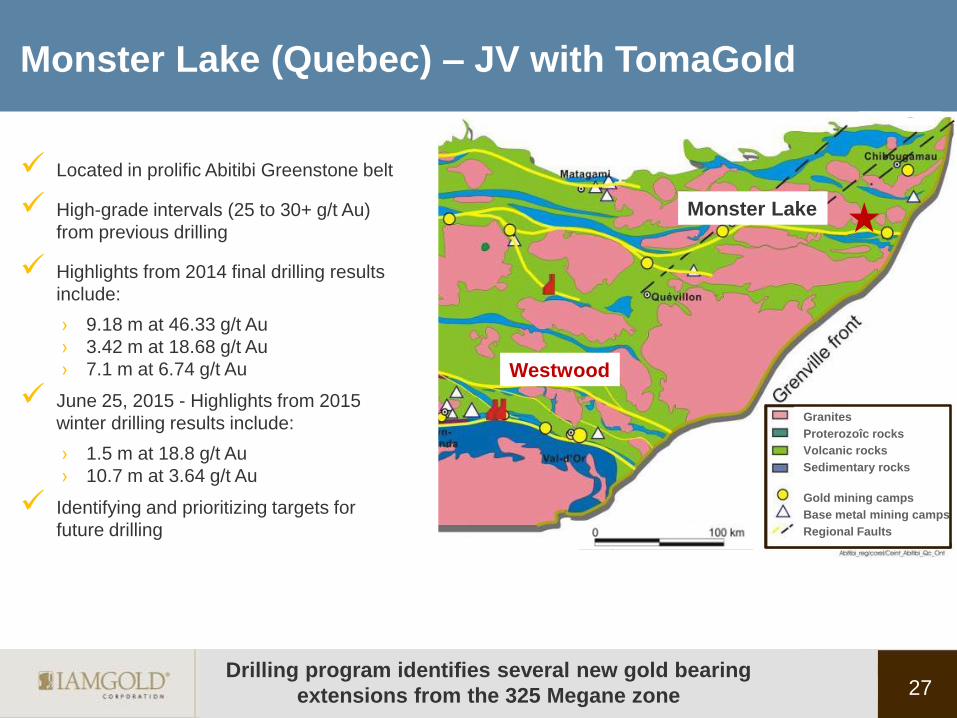
Monster Lake (Quebec) – JV with TomaGold
Located in prolific Abitibi Greenstone belt
High-grade intervals (25 to 30+ g/t Au)
from previous drilling
Highlights from 2014 final drilling results
include:
› 9.18 m at 46.33 g/t Au
› 3.42 m at 18.68 g/t Au
› 7.1 m at 6.74 g/t Au
June 25, 2015 - Highlights from 2015
winter drilling results include:
› 1.5 m at 18.8 g/t Au
› 10.7 m at 3.64 g/t Au
Identifying and prioritizing targets for
future drilling
Granites
Proterozoîc rocks
Volcanic rocks
Sedimentary rocks
Gold mining camps
Base metal mining camps
Regional Faults
Westwood
Monster Lake
Drilling program identifies several new gold bearing
extensions from the 325 Megane zone
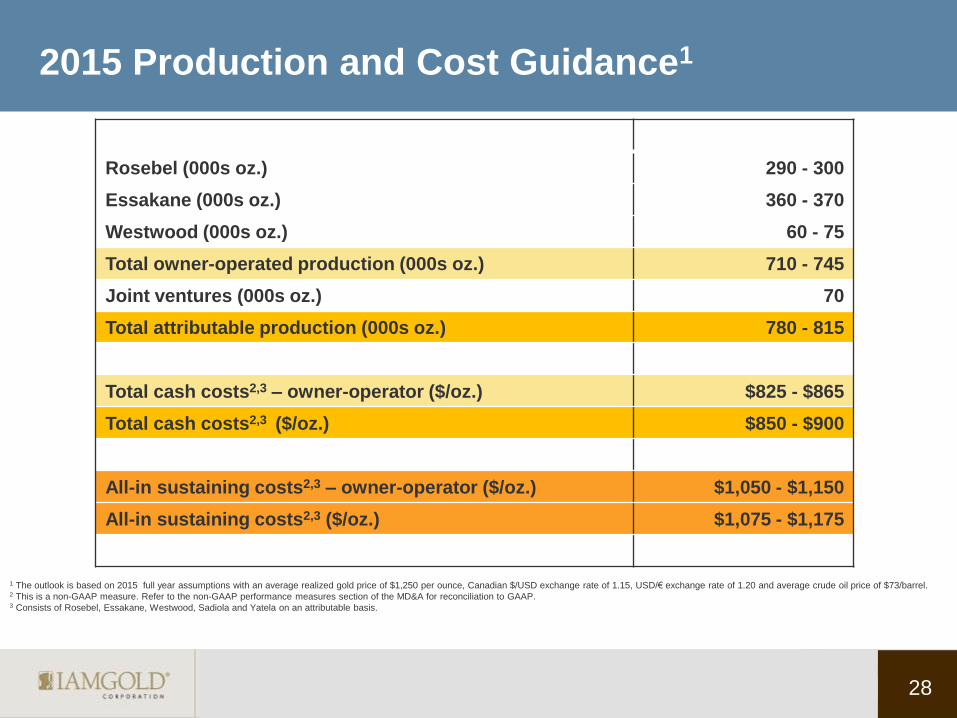
2015 Production and Cost Guidance1
Rosebel (000s oz.) 290 - 300
Essakane (000s oz.) 360 - 370
Westwood (000s oz.) 60 - 75
Total owner-operated production (000s oz.) 710 - 745
Joint ventures (000s oz.) 70
Total attributable production (000s oz.) 780 - 815
Total cash costs2,3 – owner-operator ($/oz.) $825 - $865
Total cash costs2,3 ($/oz.) $850 - $900
All-in sustaining costs2,3 – owner-operator ($/oz.) $1,050 - $1,150
All-in sustaining costs2,3 ($/oz.) $1,075 - $1,175
28
1 The outlook is based on 2015 full year assumptions with an average realized gold price of $1,250 per ounce, Canadian $/USD exchange rate of 1.15, USD/€ exchange rate of 1.20 and average crude oil price of $73/barrel. 2 This is a non-GAAP measure. Refer to the non-GAAP performance measures section of the MD&A for reconciliation to GAAP. 3 Consists of Rosebel, Essakane, Westwood, Sadiola and Yatela on an attributable basis.
TSX: IMG NYSE: IAG
Investor Relations [email protected]
Laura Young
Director, Investor Relations
T: 416-933-4952
Bob Tait
VP, Investor Relations
T: 416-360-4743