second quarter 2015 results
TRANSCRIPT
SECOND QUARTER 2015 RESULTS7 AUGUST 2015
LUCA BETTONTE, CEO
2
DISCLAIMER
This document contains certain forward-looking information that is subject to a number of factors that may influence the accuracy of the statements and the projections upon which the statements are based.There can be non assurance that the projections or forecasts will ultimately prove to be accurate; accordingly, the Company makes no representation or warranty as to the accuracy of such information or the likelihood that the Company will perform as projected.
3
AGENDA
2Q 2015 HighlightsAcquisition of Hydro BusinessOther Developments in 2Q 2015Results Review
✓ Business Environment✓ 2Q 2015 Group EBITDA✓ Results by Segments
Key Financials✓ Profit & Loss✓ Investments ✓ Cash Flow Statement
2015 Guidance and ConclusionsAppendix

4
RC Ebitda Adj (€ mn)
HIGHLIGHTS: KEY FIGURES
RC Net Profit (€ mn)
Strong set of resultsHighlights
183
63
(6)
52
157
(11)
CORPORATERENEWABLESPOWER
Leverage
DERIVATIVESADJ. NFP EXCL. DERIVATIVES
19%
22%
30/06/2015
320
157
225
184
409
Adj NFP (€ mn)
31/12/2014 Pro-forma
198
19
477
2Q 2014 Pro-forma
1H 2014Pro-forma
75 86
47
149
(14)
(5)
62
30
1H 20152Q 2015 2Q 2015
40
1H 2015
57
23
10
1H 2014Pro-forma 2Q 2014
Pro-forma

5
ACQUISITION OF HYDRO BUSINESS
6
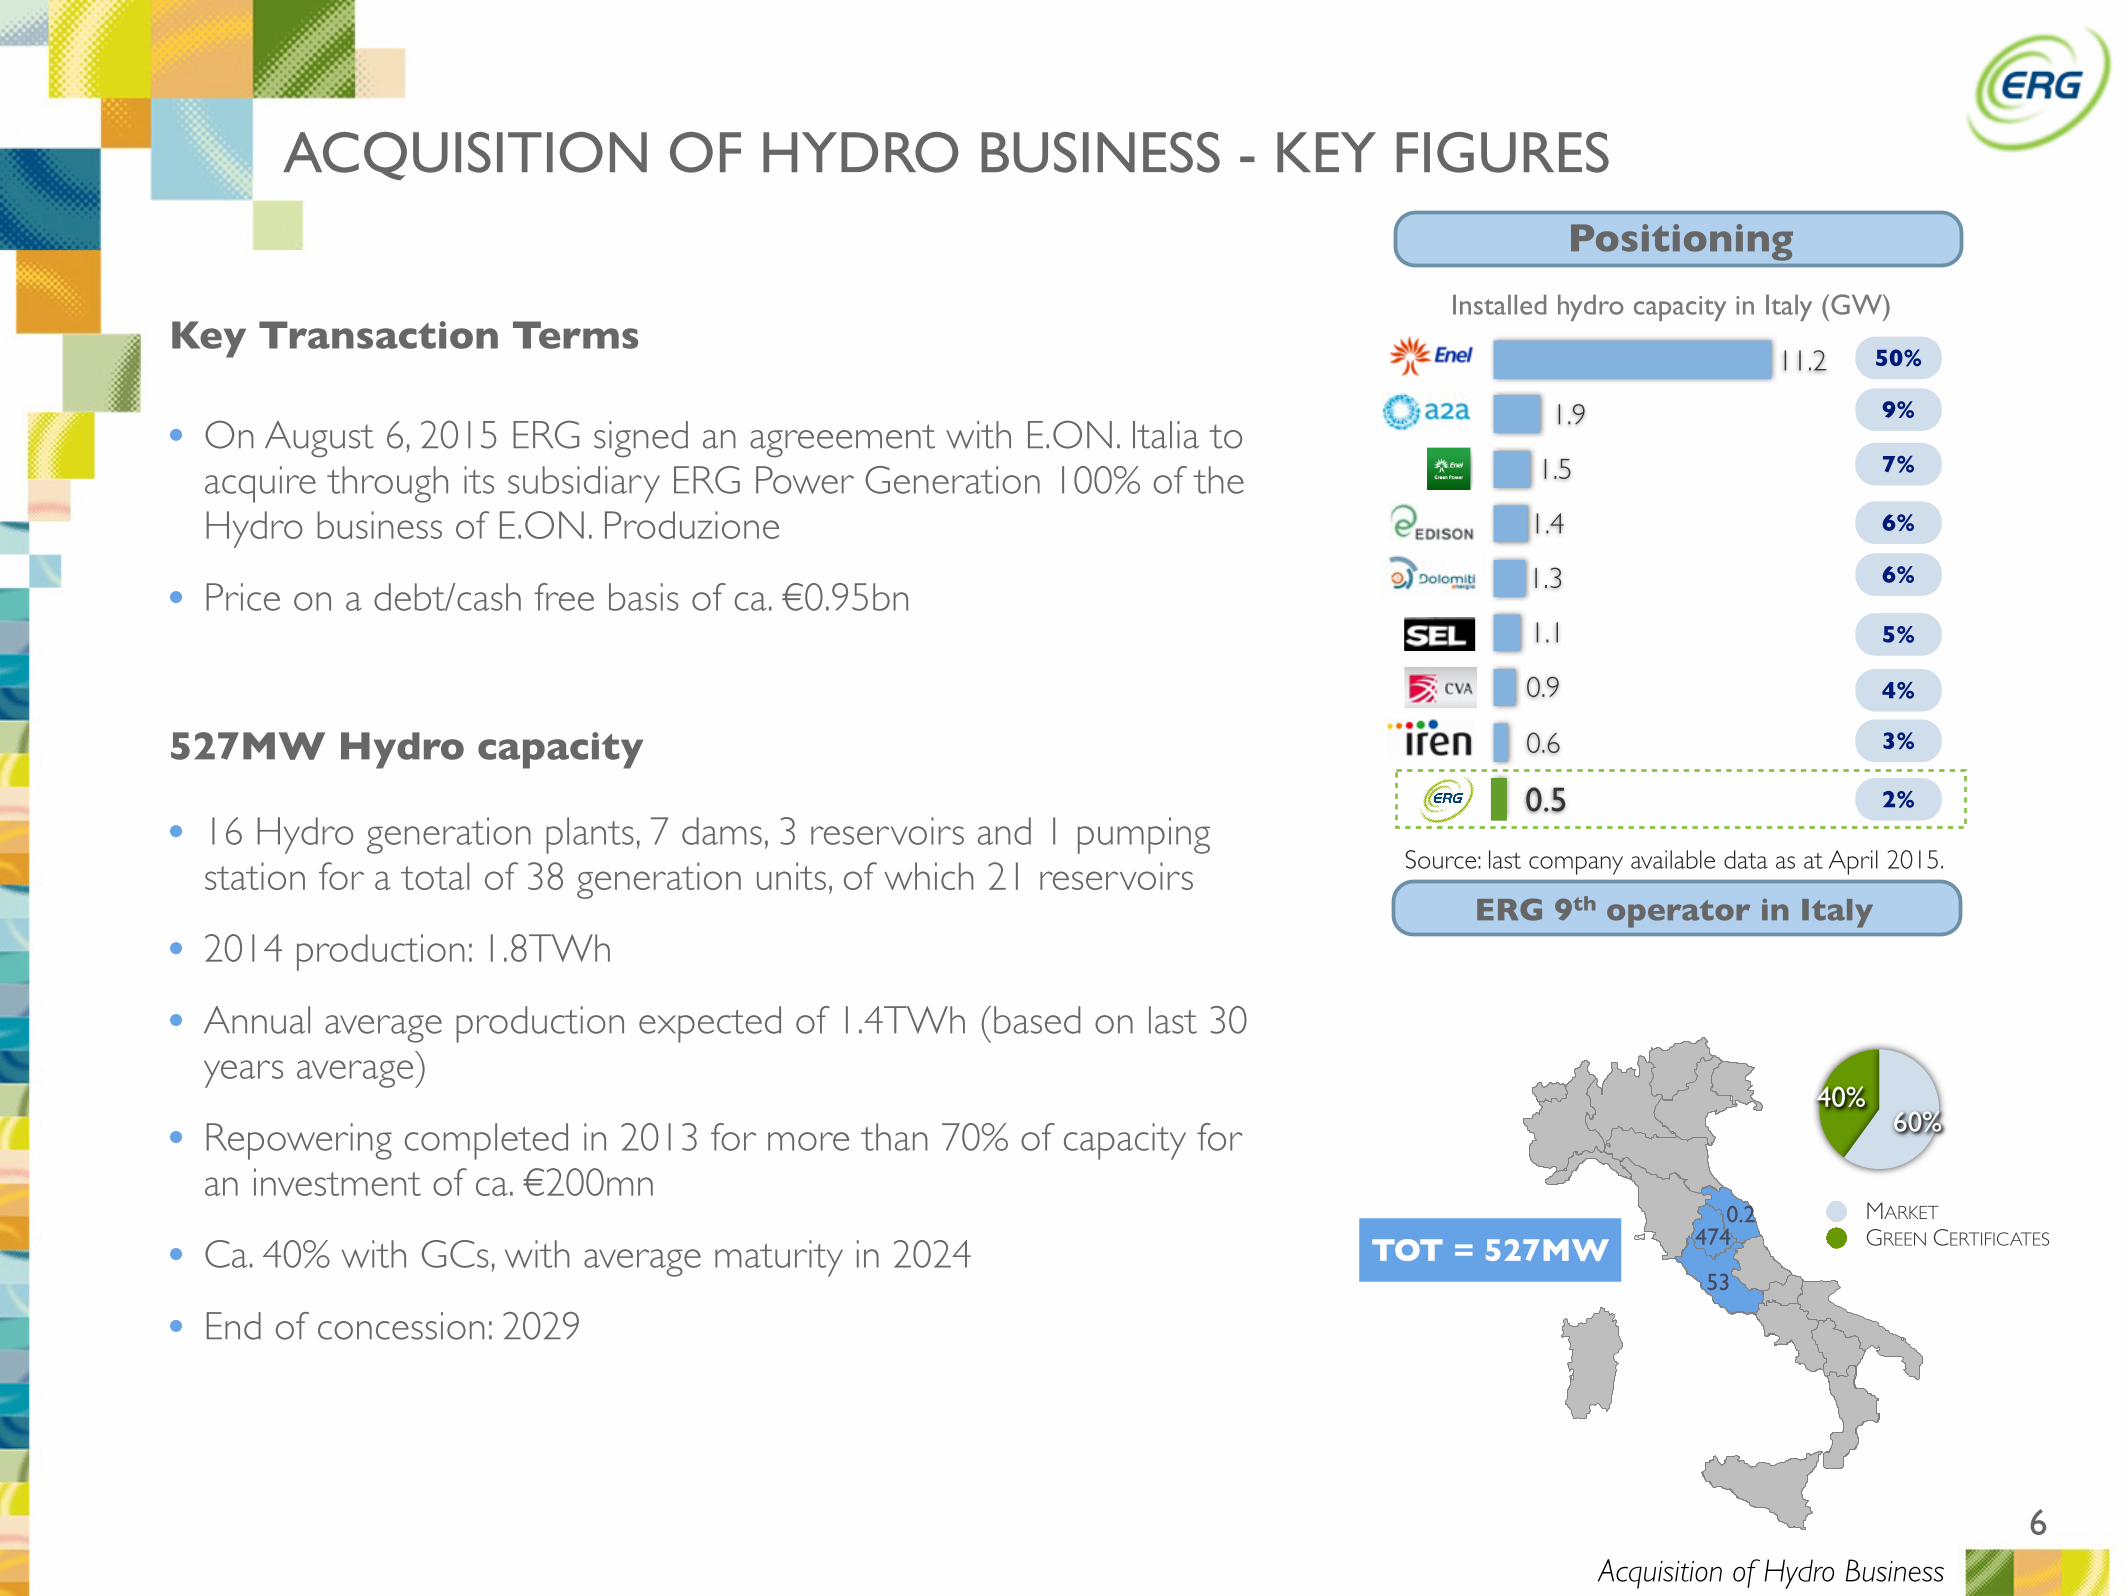
ACQUISITION OF HYDRO BUSINESS - KEY FIGURES
• On August 6, 2015 ERG signed an agreeement with E.ON. Italia to acquire through its subsidiary ERG Power Generation 100% of the Hydro business of E.ON. Produzione
• Price on a debt/cash free basis of ca. €0.95bn
Key Transaction Terms
527MW Hydro capacity
• 16 Hydro generation plants, 7 dams, 3 reservoirs and 1 pumping station for a total of 38 generation units, of which 21 reservoirs
• 2014 production: 1.8TWh
• Annual average production expected of 1.4TWh (based on last 30 years average)
• Repowering completed in 2013 for more than 70% of capacity for an investment of ca. €200mn
• Ca. 40% with GCs, with average maturity in 2024
• End of concession: 2029
40%60%
MARKETGREEN CERTIFICATESTOT = 527MW
53
4740.2
11.2
0.5
50%
1.9
1.5
1.4
1.3
1.1
0.9
0.6
9%
7%
6%
6%
5%
4%
3%
2%
Source: last company available data as at April 2015.
Positioning
Installed hydro capacity in Italy (GW)
ERG 9th operator in Italy
Acquisition of Hydro Business
7
ACQUISITION OF HYDRO BUSINESS - FINANCING
✓ €700mn corporate acquisition loan
✓ Pool of 7 international banks involved
✓ at very competitive cost conditions (leveraging on current financial markets)
Acquisition of Hydro Business
8
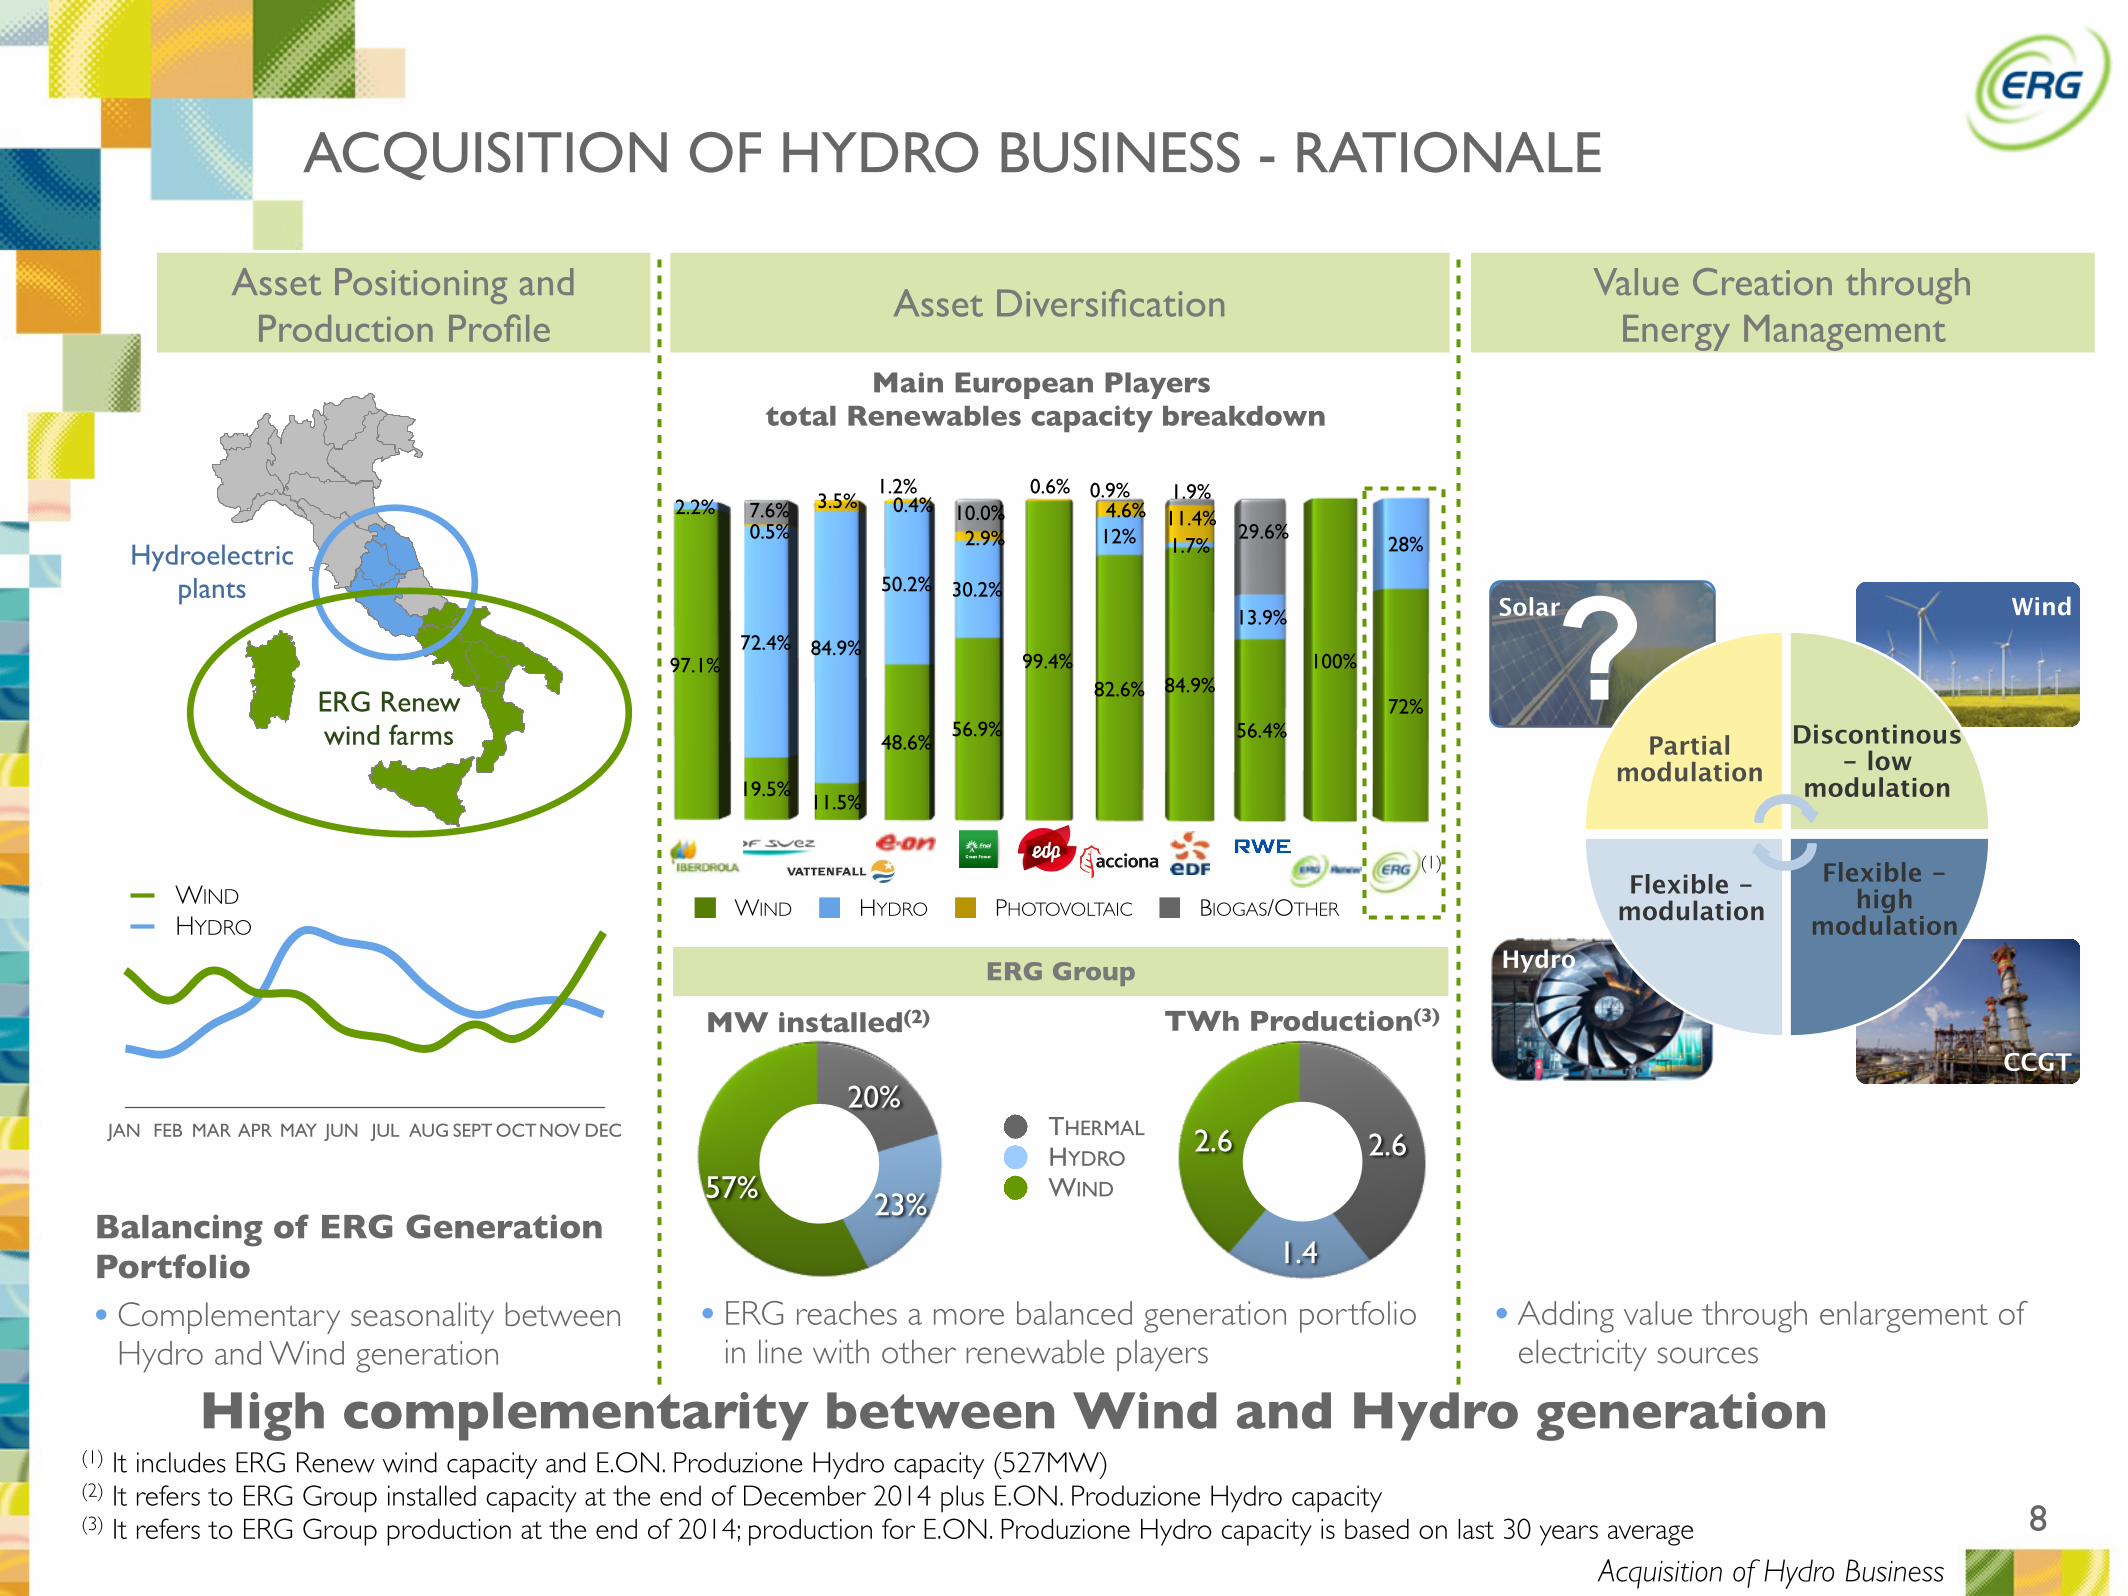
ACQUISITION OF HYDRO BUSINESS - RATIONALE
Hydroelectric plants
ERG Renew wind farms
JAN FEB MAR APR MAY JUN JUL AUG SEPT OCTNOV DEC
WIND
HYDRO
•Complementary seasonality between Hydro and Wind generation
Balancing of ERG Generation Portfolio
High complementarity between Wind and Hydro generation
Asset Positioning and Production Profile
Asset Diversification
Main European Players total Renewables capacity breakdown
WIND HYDRO PHOTOVOLTAIC BIOGAS/OTHER
97.1%
19.5%11.5%
48.6%56.9%
99.4%82.6% 84.9%
56.4%
100%
72%
2.2%
72.4% 84.9%
50.2% 30.2%
12% 1.7%
13.9%
28%0.5%7.6% 3.5%
1.2%0.4%
2.9%10.0%
0.6%4.6%
0.9%11.4%1.9%
29.6%
Value Creation through Energy Management
THERMALHYDROWIND
MW installed(2)
20%
23%57%
Hydro
CCGT
Wind
Discontinous - low
modulation
Flexible - high
modulationFlexible -
modulation
Solar
Partial modulation
2.6
1.4
2.6
TWh Production(3)
ERG Group
•ERG reaches a more balanced generation portfolio in line with other renewable players
•Adding value through enlargement of electricity sources
?
(1) It includes ERG Renew wind capacity and E.ON. Produzione Hydro capacity (527MW)(2) It refers to ERG Group installed capacity at the end of December 2014 plus E.ON. Produzione Hydro capacity(3) It refers to ERG Group production at the end of 2014; production for E.ON. Produzione Hydro capacity is based on last 30 years average
(1)
Acquisition of Hydro Business

9
OTHER DEVELOPMENTS IN 2Q 2015
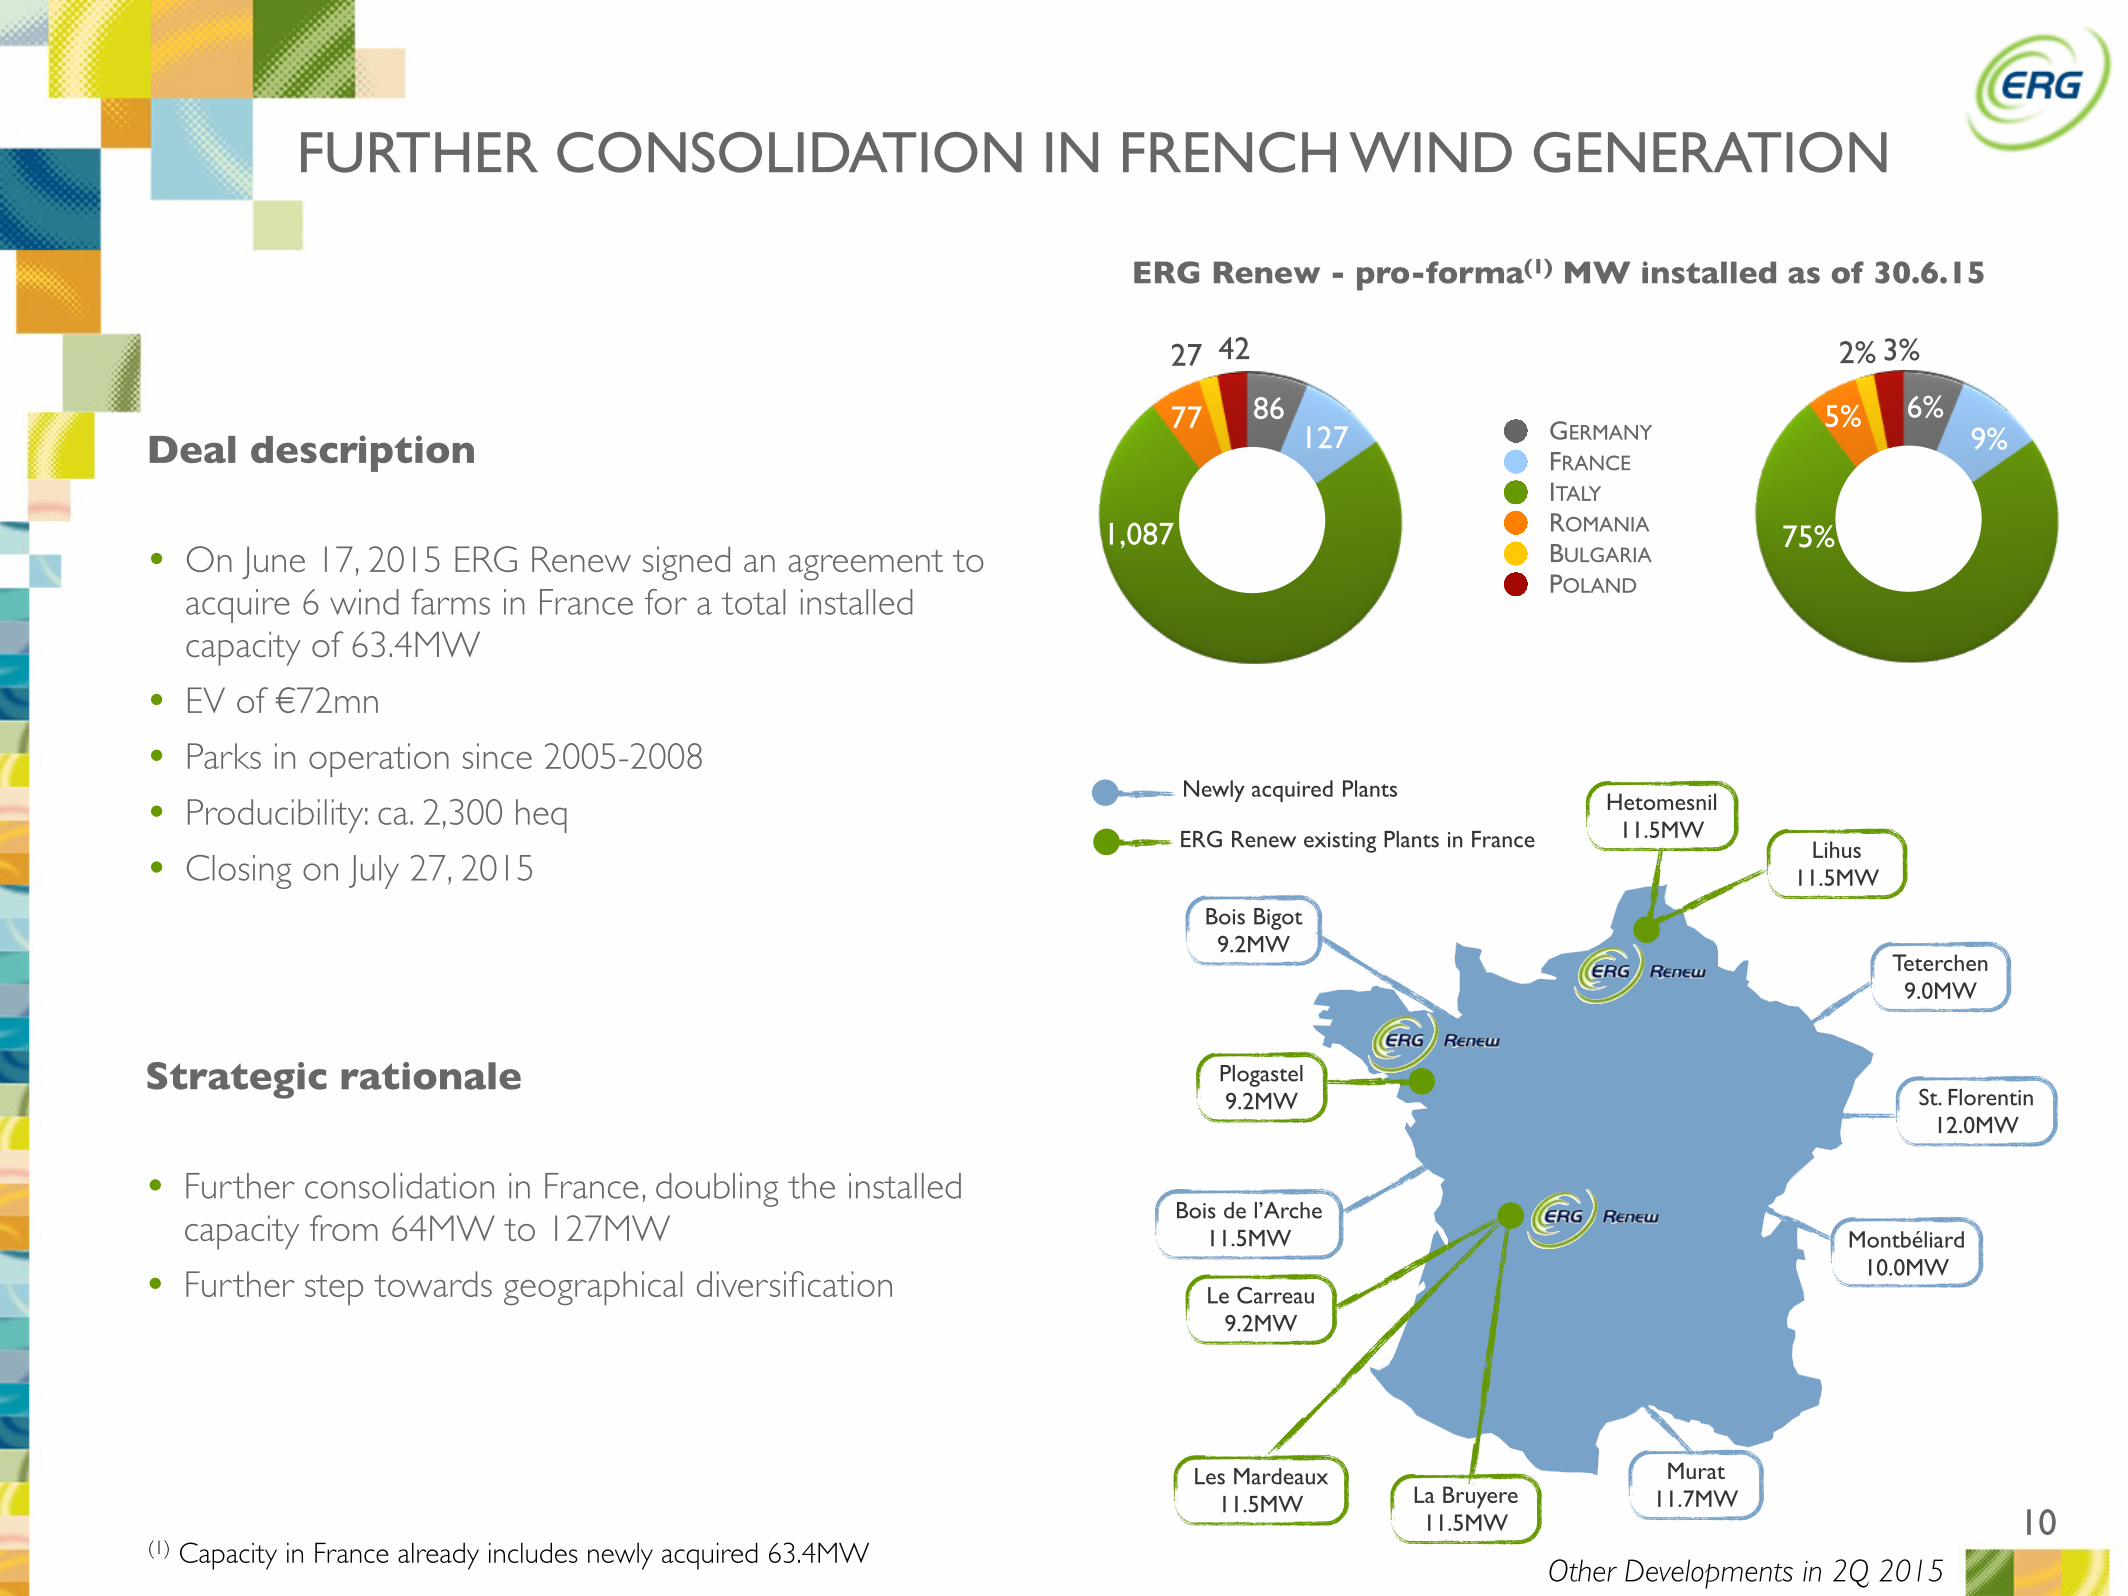
FURTHER CONSOLIDATION IN FRENCH WIND GENERATION
10
Plogastel9.2MW
Le Carreau9.2MW
Les Mardeaux11.5MW La Bruyere
11.5MW
Hetomesnil11.5MW
Lihus11.5MW
Teterchen9.0MW
St. Florentin12.0MW
Montbéliard10.0MW
Murat11.7MW
Bois de l’Arche11.5MW
Bois Bigot9.2MW
Newly acquired Plants
ERG Renew existing Plants in France
• On June 17, 2015 ERG Renew signed an agreement to acquire 6 wind farms in France for a total installed capacity of 63.4MW
• EV of €72mn
• Parks in operation since 2005-2008
• Producibility: ca. 2,300 heq
• Closing on July 27, 2015
Deal description
• Further consolidation in France, doubling the installed capacity from 64MW to 127MW
• Further step towards geographical diversification
Strategic rationale
Other Developments in 2Q 2015
GERMANYFRANCEITALYROMANIABULGARIAPOLAND
ERG Renew - pro-forma(1) MW installed as of 30.6.15
75%
5%
2% 3%
9%6%
1,087
77
27 42
12786
(1) Capacity in France already includes newly acquired 63.4MW

11
LUKERG ASSETS SPLIT
• Increase ERG Renew presence in Eastern Europe
• ERG Renew takes full control of 3 good quality assets
• More direct control on wind farms operations in Eastern Europe
• Option to internalize O&M activities
• Possibility to pursue other growth opportunities in those countries
Key figures of the deal
Strategic rationale of the deal
ROMANIA
BULGARIA
Before Asset Split
After Asset Split
DeltaDelta
Tcherga 20 40 20
Hrabrovo 7 14 7
Total MW in Bulgaria 27 54 27 +100%
Topolog 42 -42
Gebeleisis 35 70 35
Total MW in Romania 77 70 -7 -9%
Total MW 104 124 20 +19%
Direct control on good quality assets in Eastern Europe
Topolog
Gebeleisis
Hrabrovo
Tcherga
Other Developments in 2Q 2015
• On June 25, 2015 ERG and LUKOIL agreed to close the JV LUKERG Renew and to break up the assets
• ERG Renew will take Tcherga wind farm (40MW) and Hrabrovo (14MW) in Bulgaria, Gebeleisis (70MW) in Romania
• LUKOIL will keep Topolog (84MW) in Romania
• EV of €27mn related to the additional 20MW
• Implied EV/MW is €1.3mn per MW
• Closing expected in 4Q 2015
12
RESULTS REVIEW
CFO
PAOLO MERLI
13
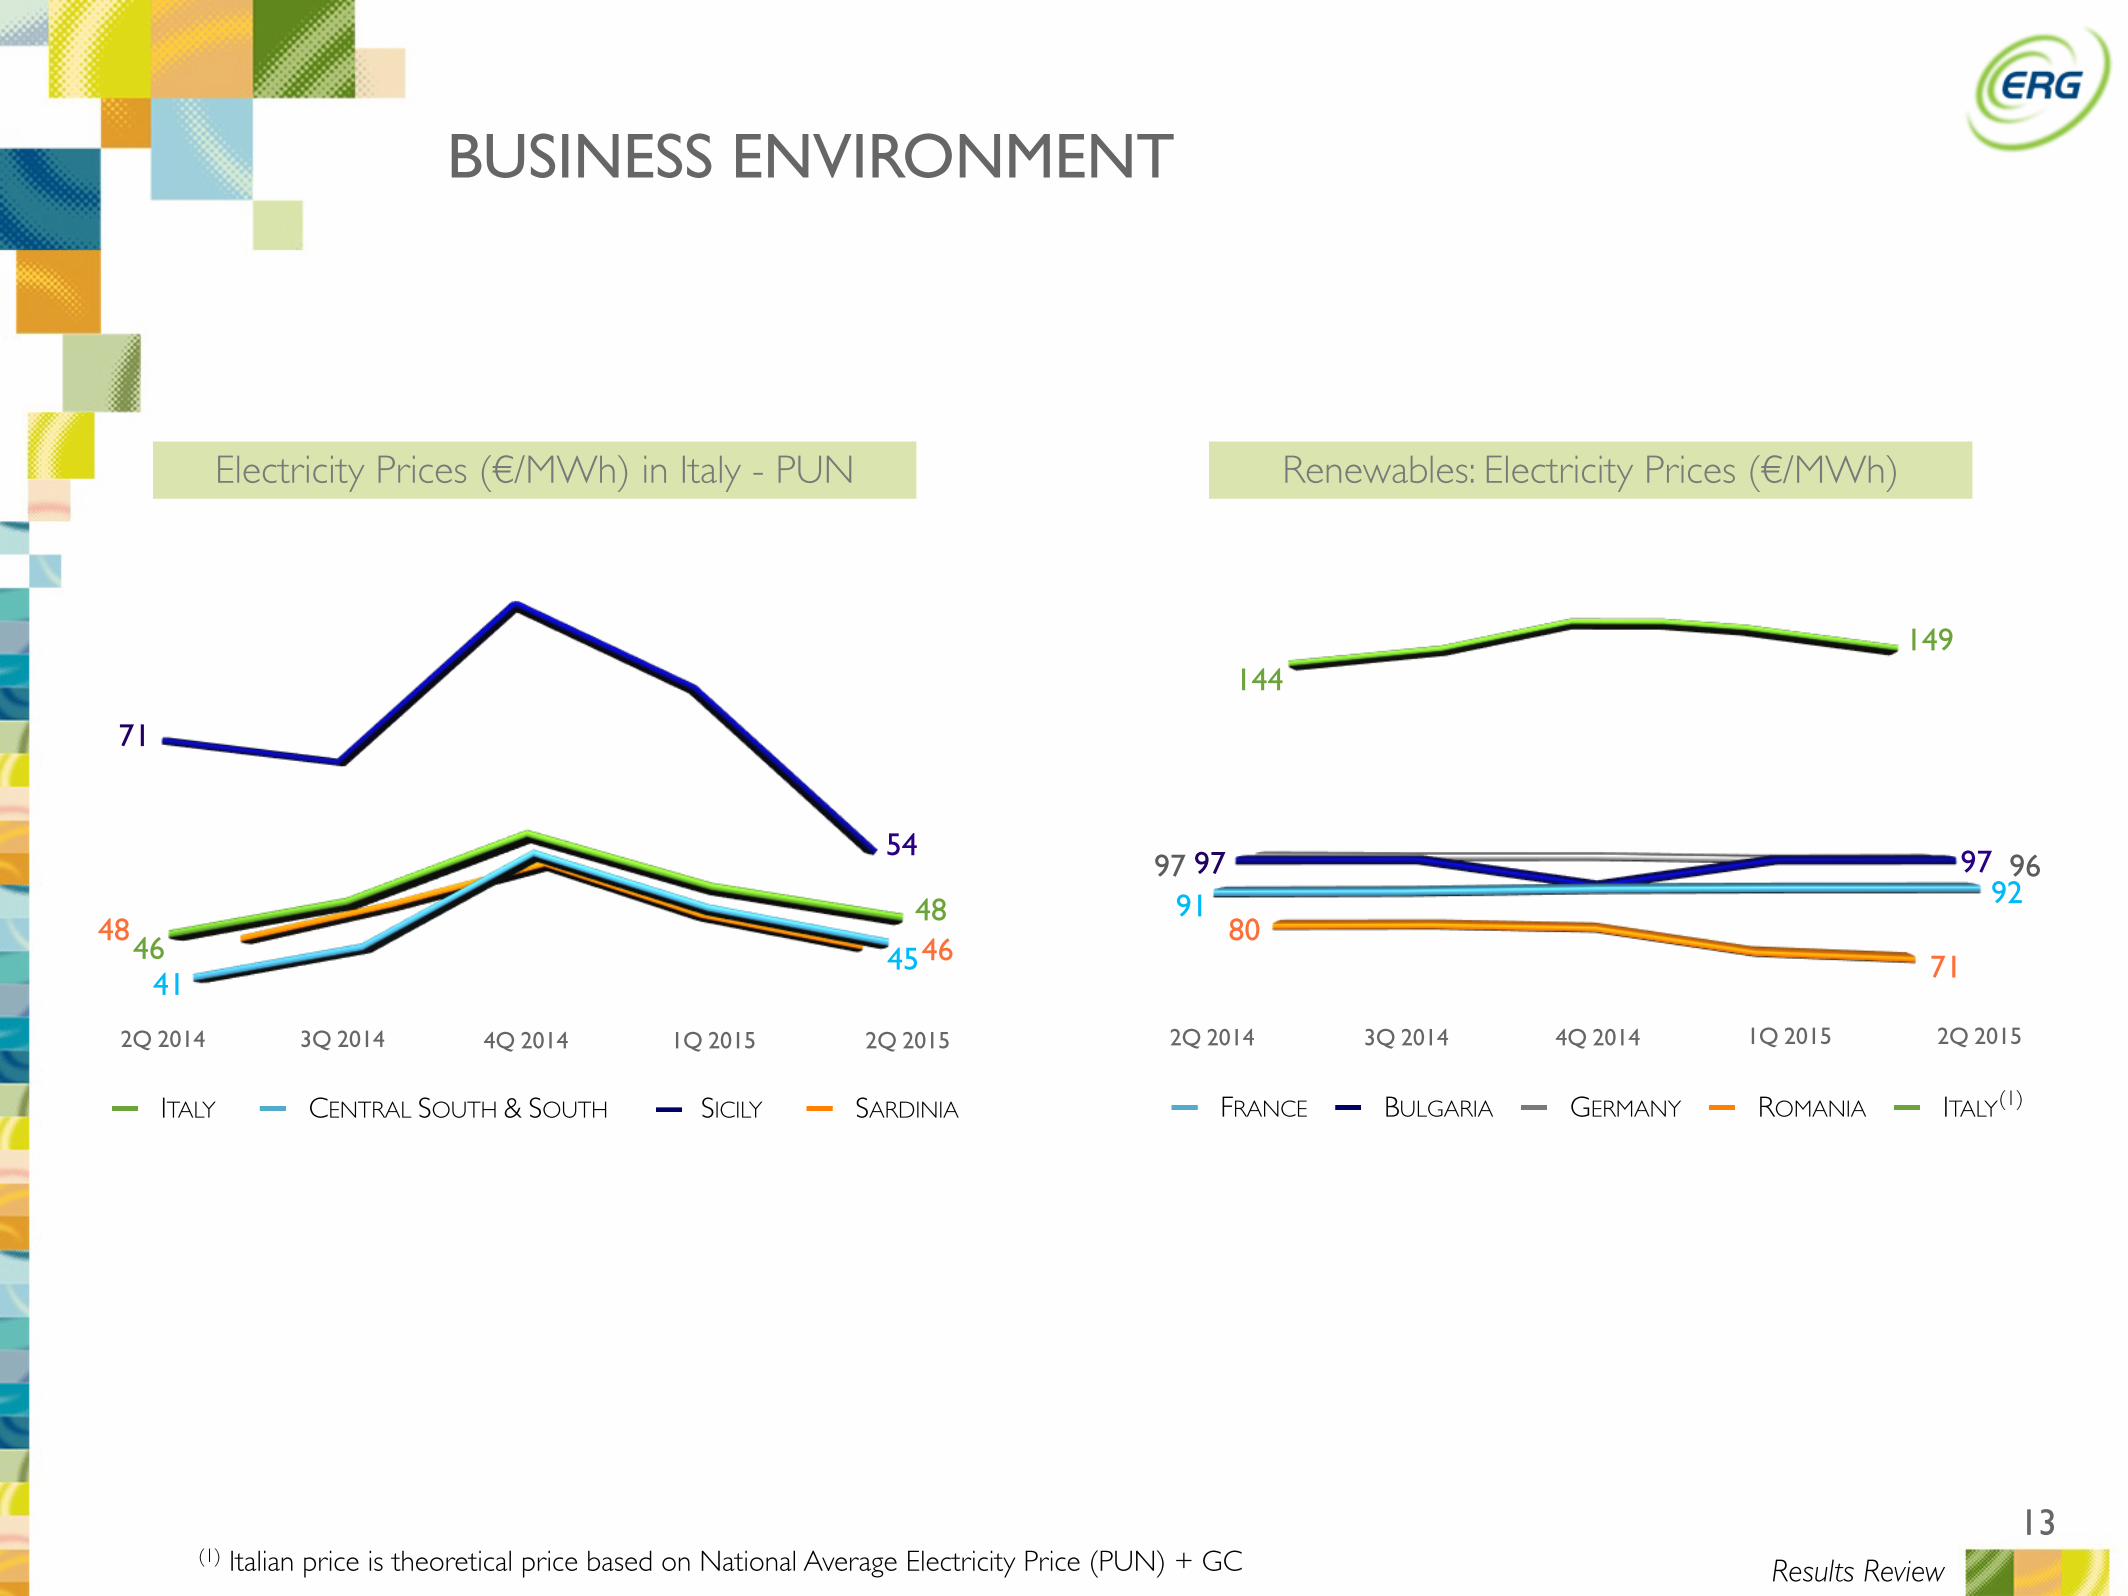
BUSINESS ENVIRONMENT
Results Review
2Q 2014 3Q 2014 4Q 2014 1Q 2015 2Q 2015
Electricity Prices (€/MWh) in Italy - PUN
4648
4145
54
71
(1) Italian price is theoretical price based on National Average Electricity Price (PUN) + GC
46
ITALY CENTRAL SOUTH & SOUTH SICILY SARDINIA (1)
48
2Q 2014 3Q 2014 4Q 2014 1Q 2015 2Q 2015
FRANCE BULGARIA GERMANY ROMANIA ITALY
Renewables: Electricity Prices (€/MWh)
91 9297 97 97
71 80
96
144149
14
1,292
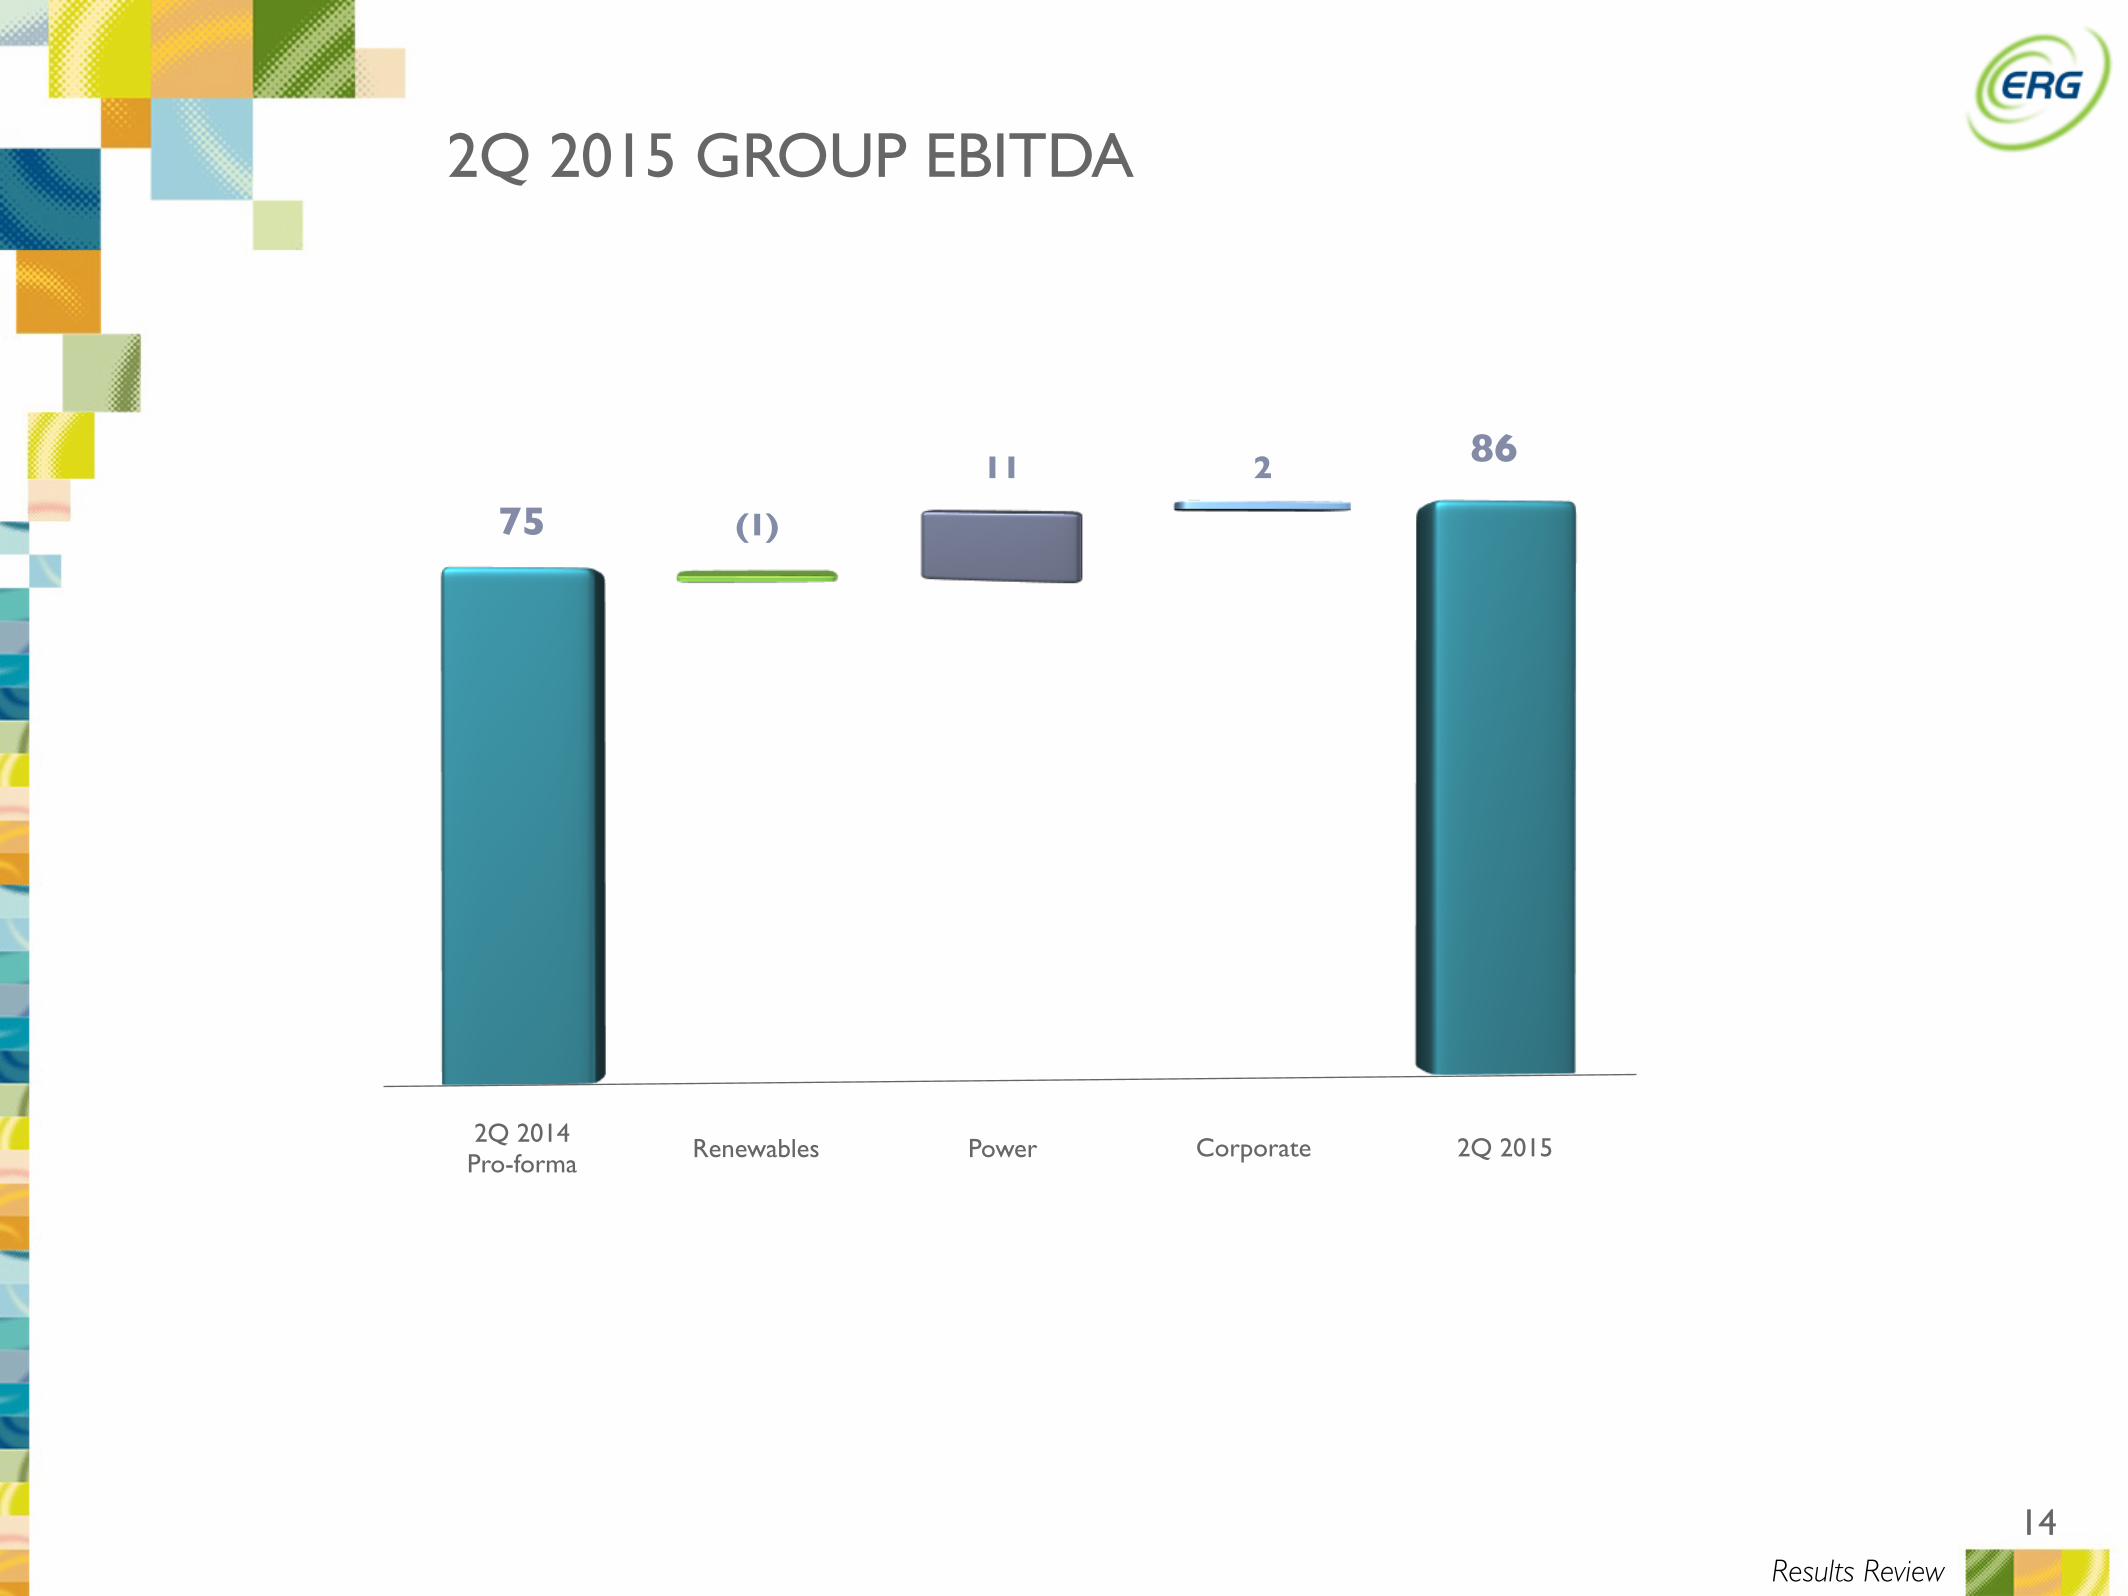
2Q 2014 Pro-forma
75 (1)
11 2
PowerRenewables Corporate 2Q 2015
86
2Q 2015 GROUP EBITDA
Results Review

15
RC Ebitda (€ mn)
RENEWABLES RESULTS
1,408
Volumes (GWh)
7
131
Results Review
5
(1) LUKERG: ERG ‘s stake = 50% in Bulgaria and Romania
7
602
149
63
57
2
ITALY FRANCE LUKERG(1)GERMANY
3 1
2Q 2014
1H 2014
2Q 2015
1H 2015
Overall higher production; 2Q 2014 boosted by a positive one-off
1,482
1,181
148
7182
501
3358
27
620
157
62
8
138
56
54
33
2
1,128
131
7277
491
2957
25
2Q 2014
1H 2014
2Q 2015
1H 2015
16
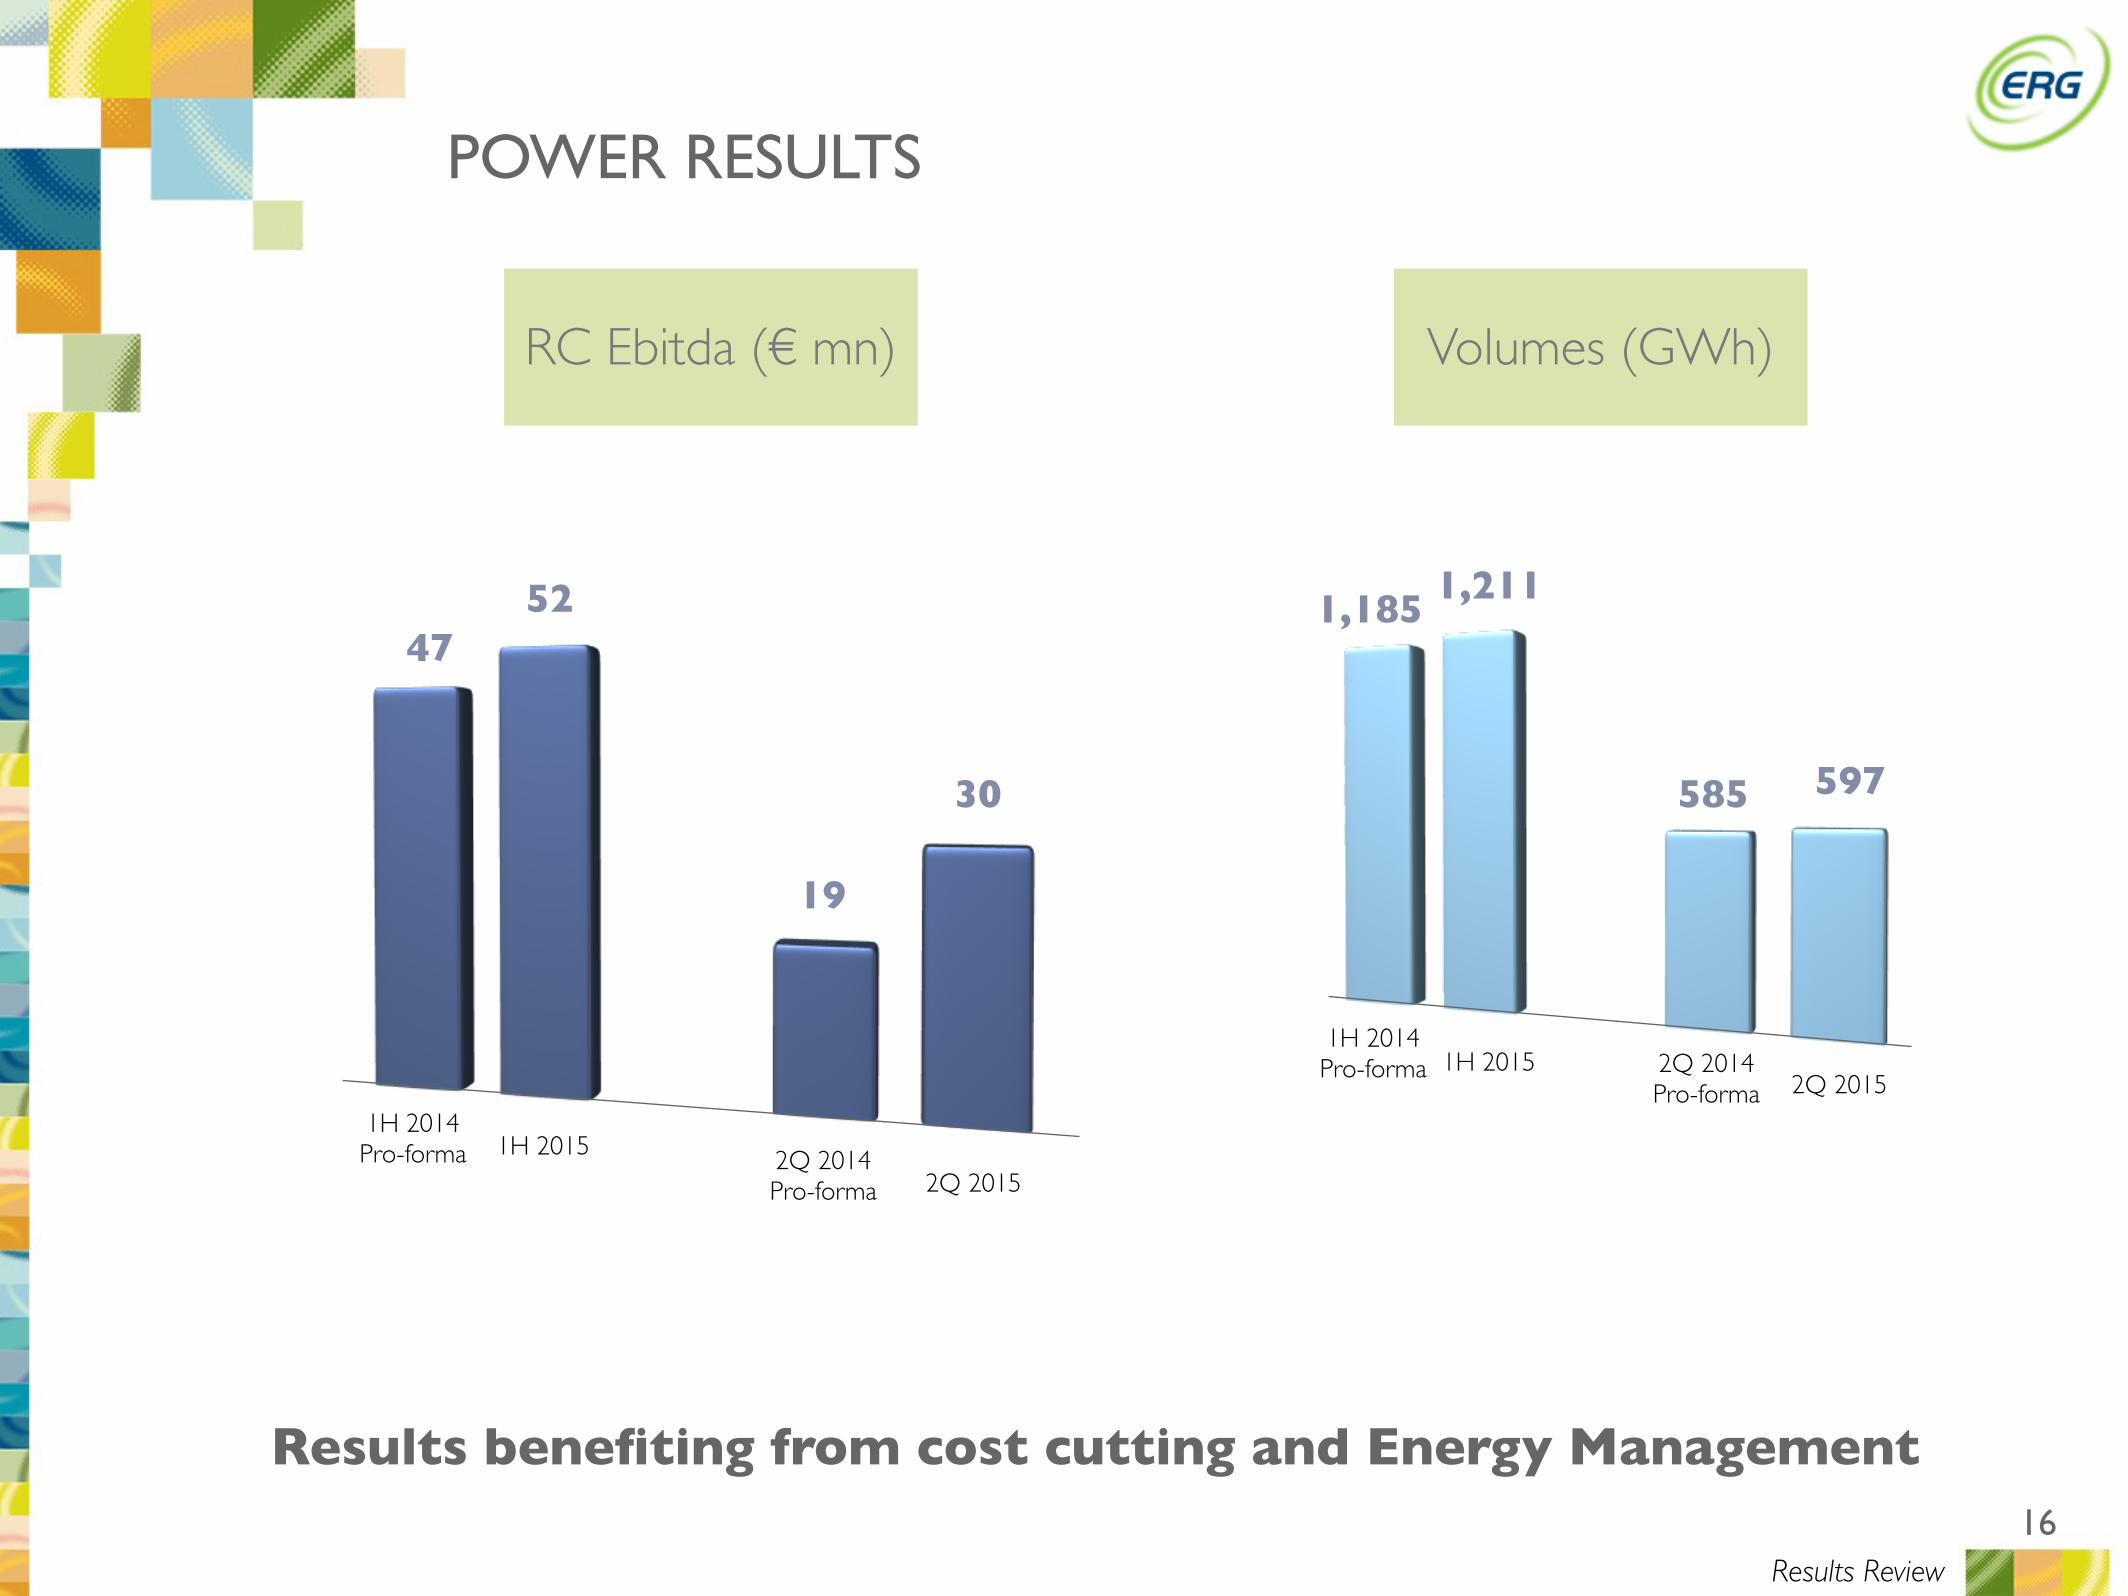
RC Ebitda (€ mn)
POWER RESULTS
Volumes (GWh)
Results benefiting from cost cutting and Energy Management
Results Review
1H 2014 Pro-forma
2Q 2015
19
1,211
30 597
1H 2015 2Q 2014 Pro-forma
4752
2Q 20151H 2015
585
1,185
1H 2014 Pro-forma 2Q 2014
Pro-forma
17
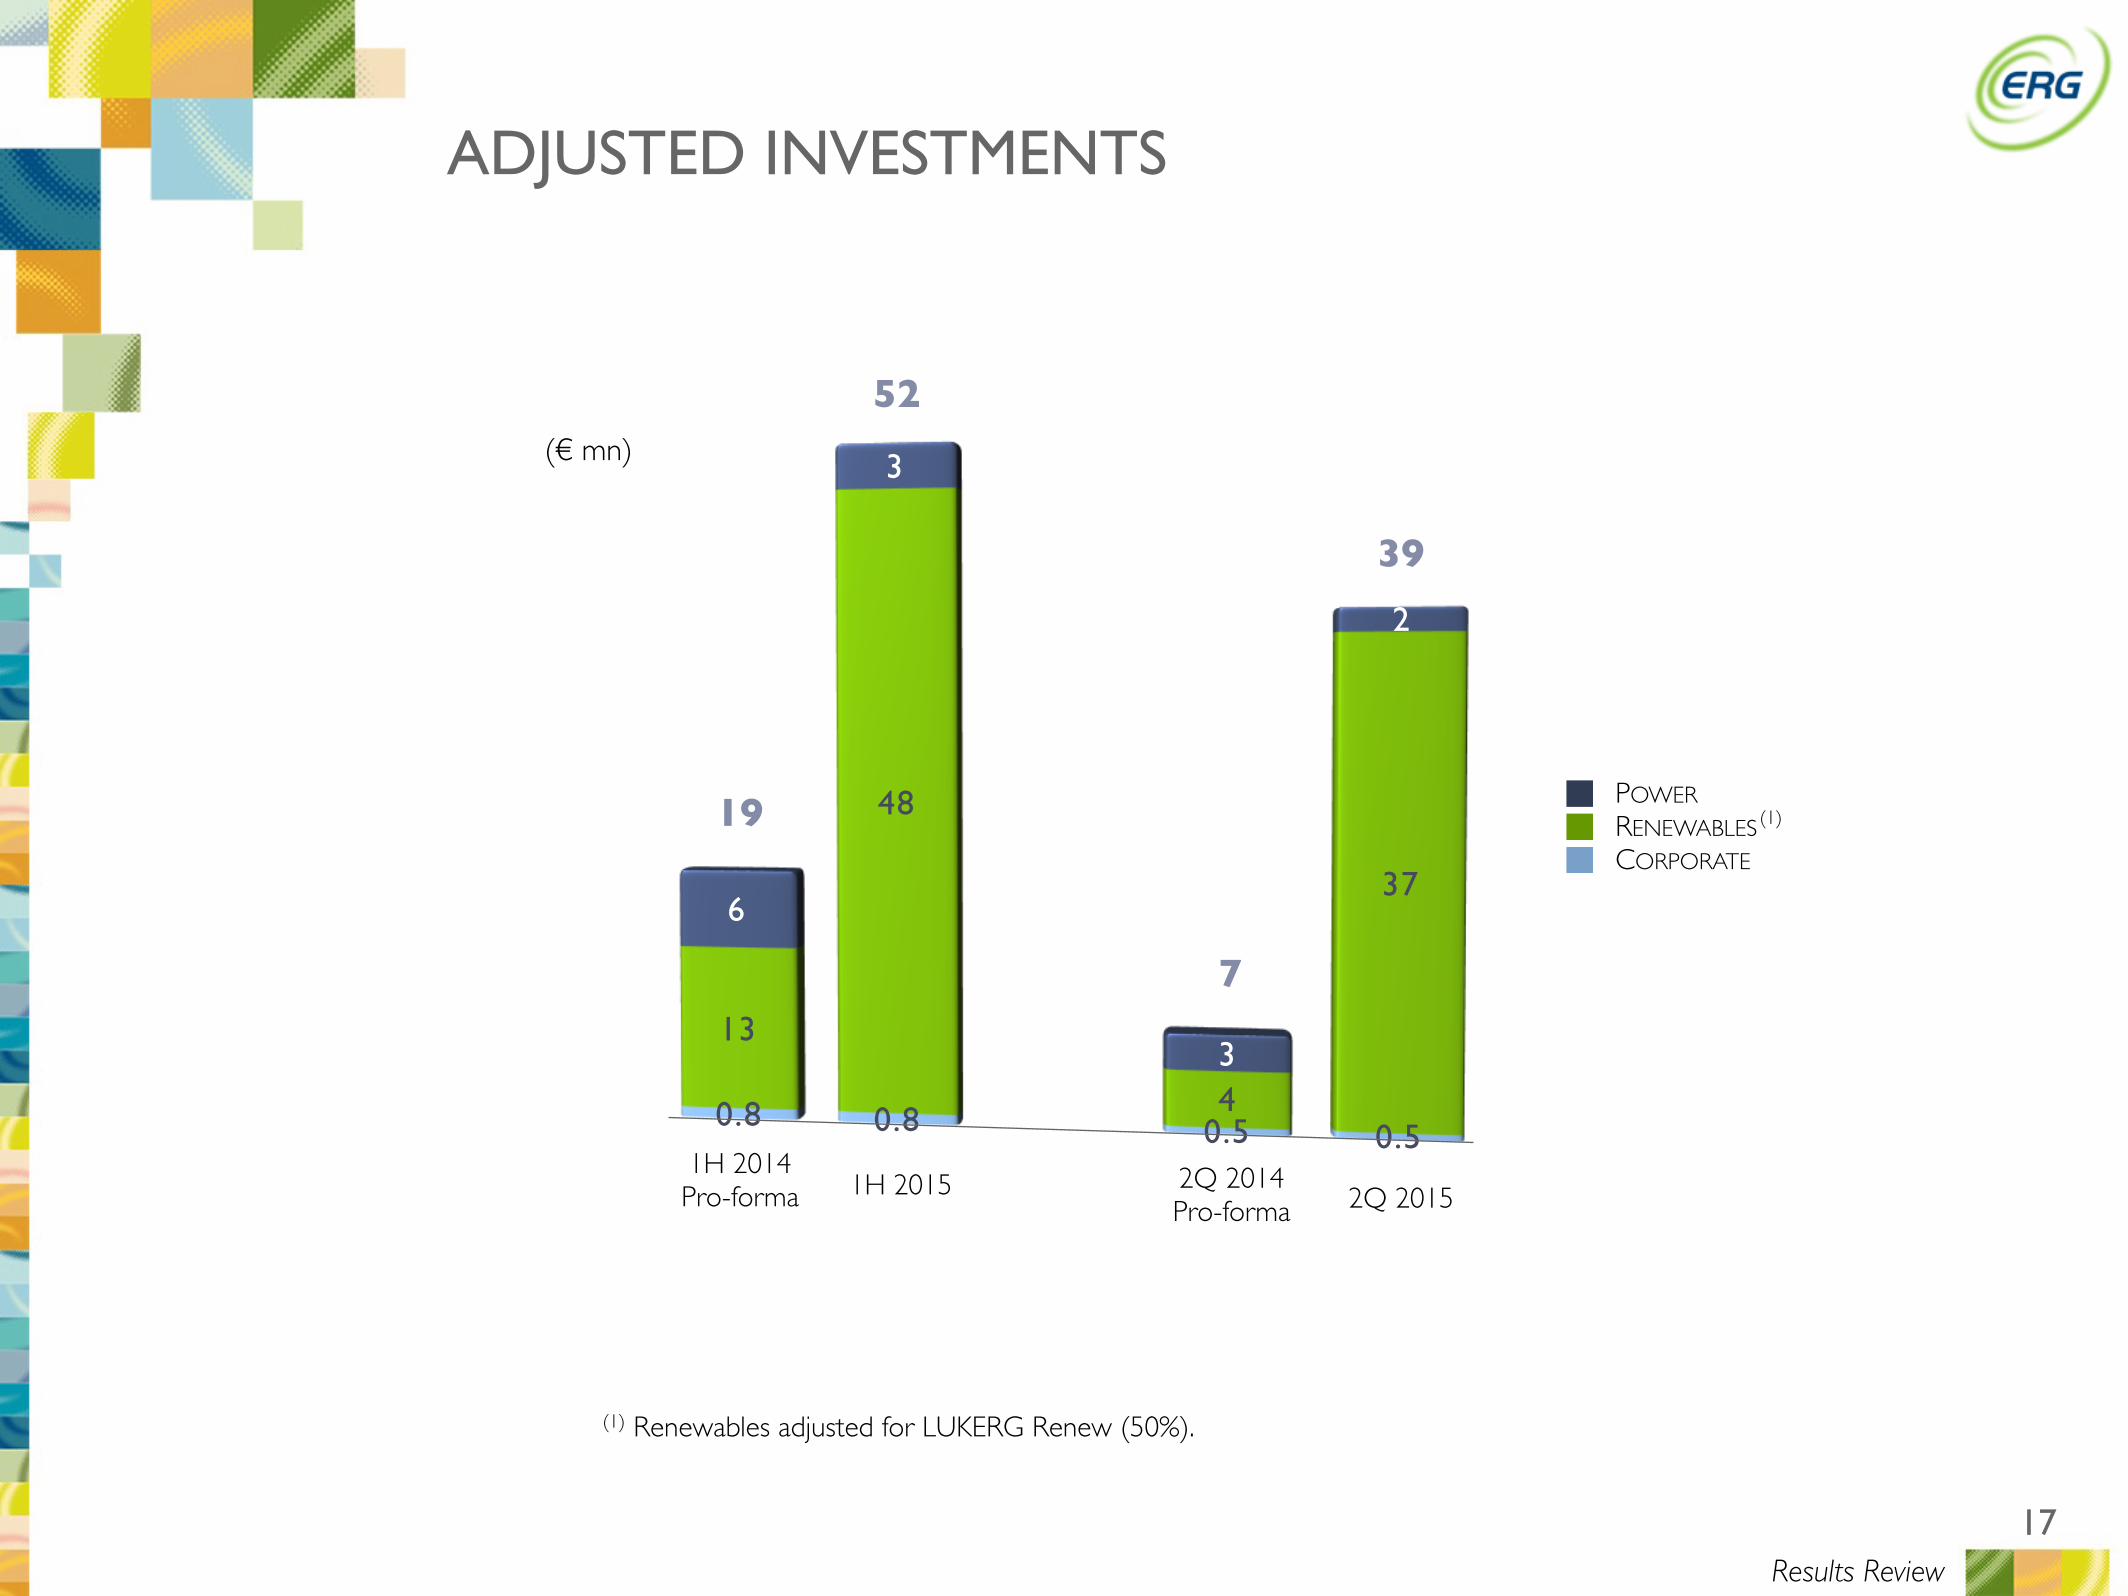
ADJUSTED INVESTMENTS
(1) Renewables adjusted for LUKERG Renew (50%).
2Q 2014 Pro-forma
0.8 0.8 0.5 0.5
13
48
4
376
3
3
2
19
(€ mn)
CORPORATERENEWABLESPOWER
(1)
52
Results Review
2Q 20151H 2014 Pro-forma 1H 2015
7
39
18
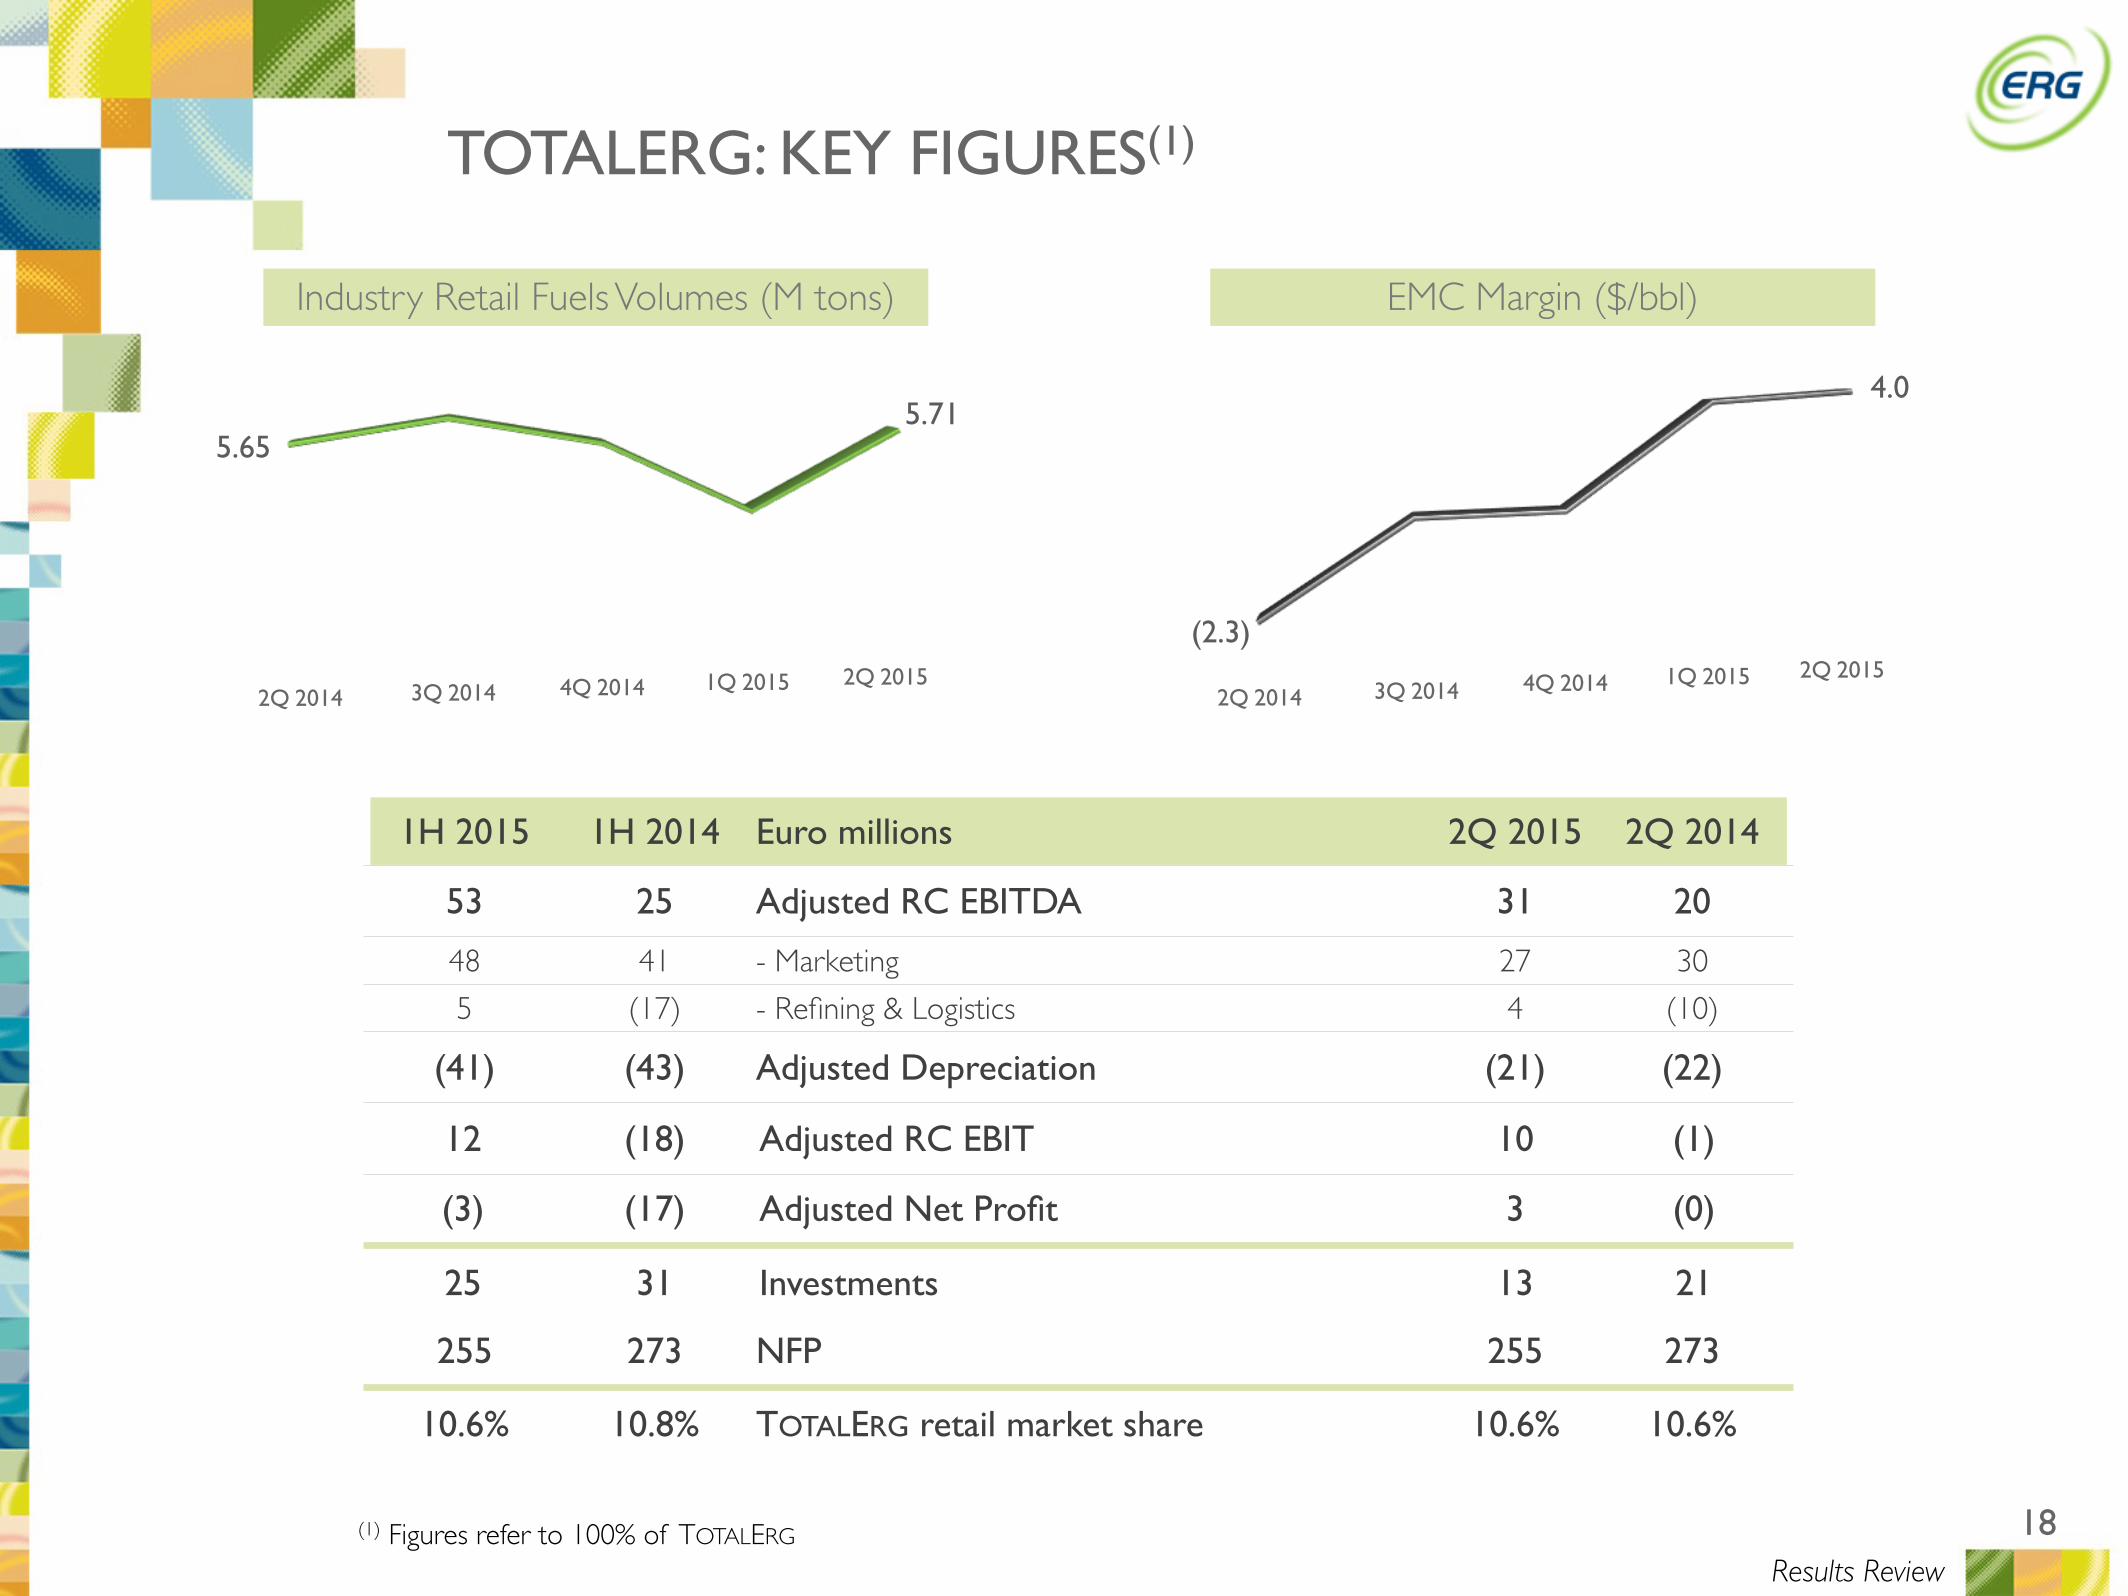
TOTALERG: KEY FIGURES(1)
(1) Figures refer to 100% of TOTALERG
1H 2015 1H 2014 Euro millions 2Q 2015 2Q 2014
53 25 Adjusted RC EBITDA 31 20
48 41 - Marketing 27 30
5 (17) - Refining & Logistics 4 (10)
(41) (43) Adjusted Depreciation (21) (22)
12 (18) Adjusted RC EBIT 10 (1)
(3) (17) Adjusted Net Profit 3 (0)
25 31 Investments 13 21
255 273 NFP 255 273
10.6% 10.8% TOTALERG retail market share 10.6% 10.6%
2Q 2014 3Q 2014 4Q 2014 1Q 2015 2Q 2015
Industry Retail Fuels Volumes (M tons)
5.655.71
2Q 2014 3Q 2014 4Q 2014 1Q 2015 2Q 2015
EMC Margin ($/bbl)
(2.3)
4.0
Results Review

19
KEY FINANCIALS

20
PRO-FORMA REPLACEMENT COST P&L
Note: figures based on NO GAAP measures
Key Financials
1H 20151H 2014
Pro-formaEuro millions 2Q 2015
2Q 2014
Pro-forma
198 183 RC Adjusted EBITDA 86 75
(81) (80) Amortization and depreciation (41) (41)
116 102 RC Adjusted EBIT 46 34
(31) (26) Net financial income (expenses) (15) (15)
(1) (8) Net income (loss) from equity investments 2 0
84 68 RC Results before taxes 32 19
(24) (25) Income taxes (9) (8)
60 43 RC Results for the period 23 11
(3) (3) Minority interests (1) (1)
57 40 RC Net profit 23 10

21
402
22%
16%
19%
Adj. Net Debt31/03/2015 EBITDA
WorkingCapital CAPEX
Financial Charges
Adj. Net Debt
30/06/2015
NFP 50% LUKERG Renew
Net Debt30/06/2015reported
Leverage
2Q 2015 ADJUSTED CASH FLOW STATEMENT
(75)
Taxesand Other(1)
(86)
477
Dividends
33520
83
71
(1) It includes ca. €100mn of taxes mainly related to ISAB Energy disposal, which took place on June 30, 2014
Key Financials
3915

22
2015 GUIDANCE AND CONCLUSIONS
CEO
LUCA BETTONTE
23
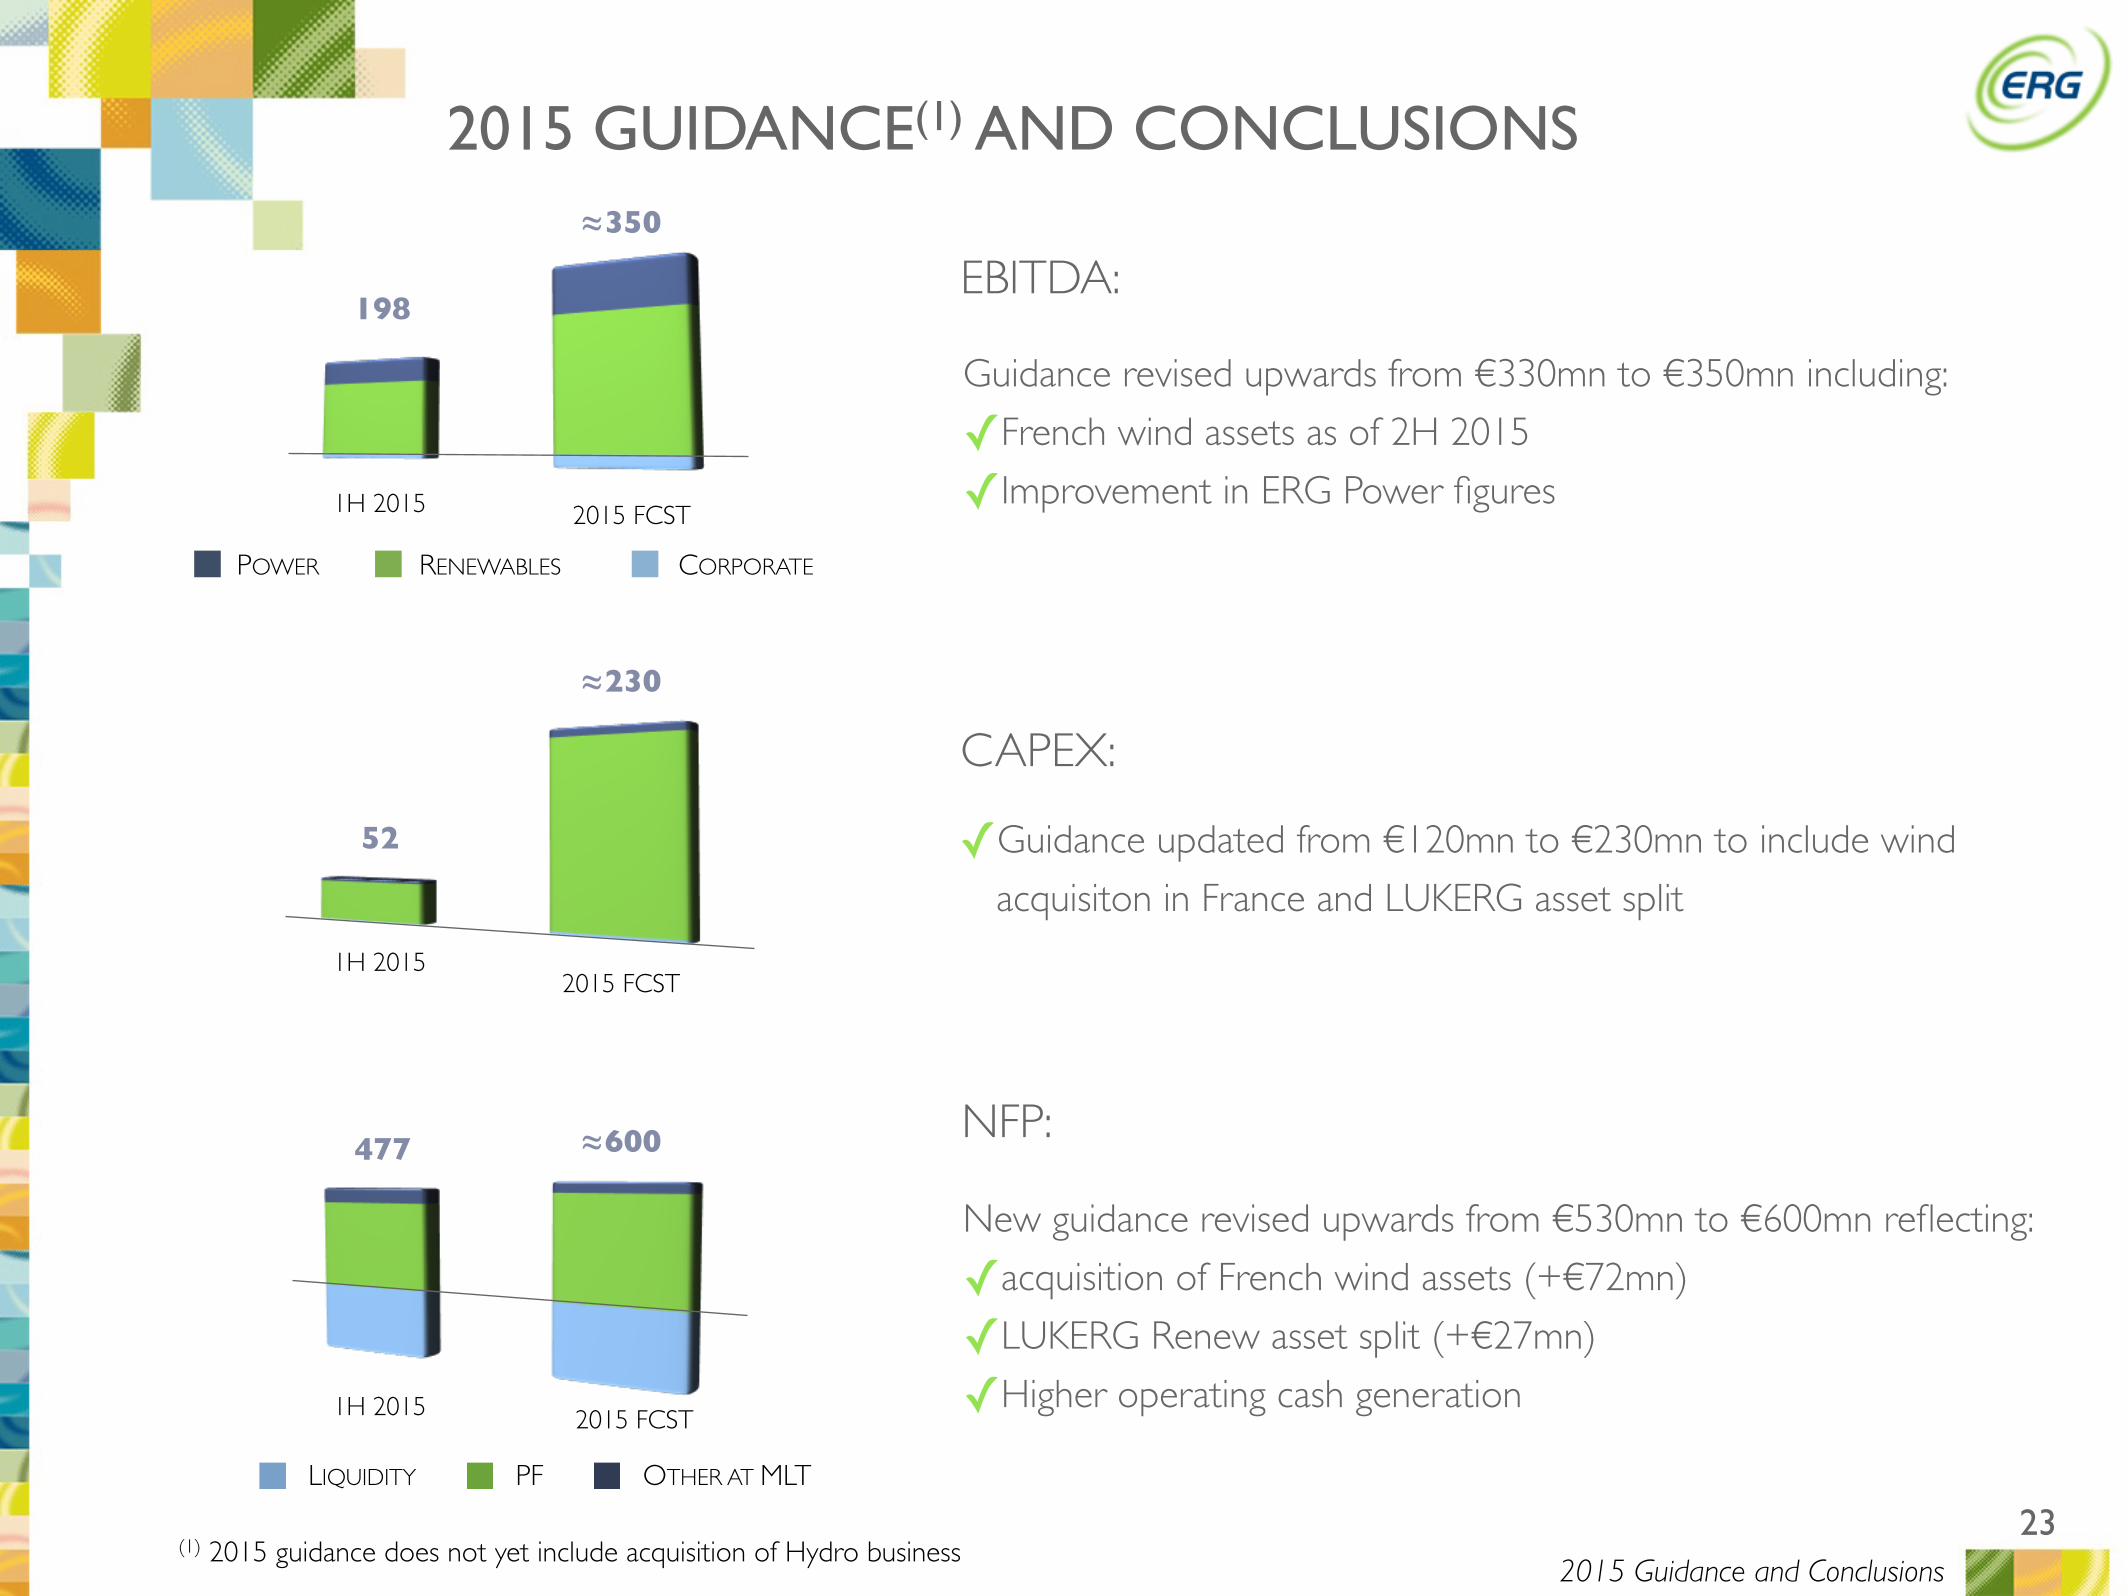
198
1H 2015
2015 GUIDANCE(1) AND CONCLUSIONS
2015 FCST
52
LIQUIDITY PF OTHER AT MLT
477
RENEWABLES CORPORATEPOWER
EBITDA:
CAPEX:
NFP:
✓Guidance updated from €120mn to €230mn to include wind
acquisiton in France and LUKERG asset split
≈350
2015 FCST
1H 2015 2015 FCST
New guidance revised upwards from €530mn to €600mn reflecting:
✓acquisition of French wind assets (+€72mn)
✓LUKERG Renew asset split (+€27mn)
✓Higher operating cash generation
1H 2015
(1) 2015 guidance does not yet include acquisition of Hydro business
Guidance revised upwards from €330mn to €350mn including:
✓French wind assets as of 2H 2015
✓Improvement in ERG Power figures
≈600
≈230
2015 Guidance and Conclusions

24
APPENDIX
25
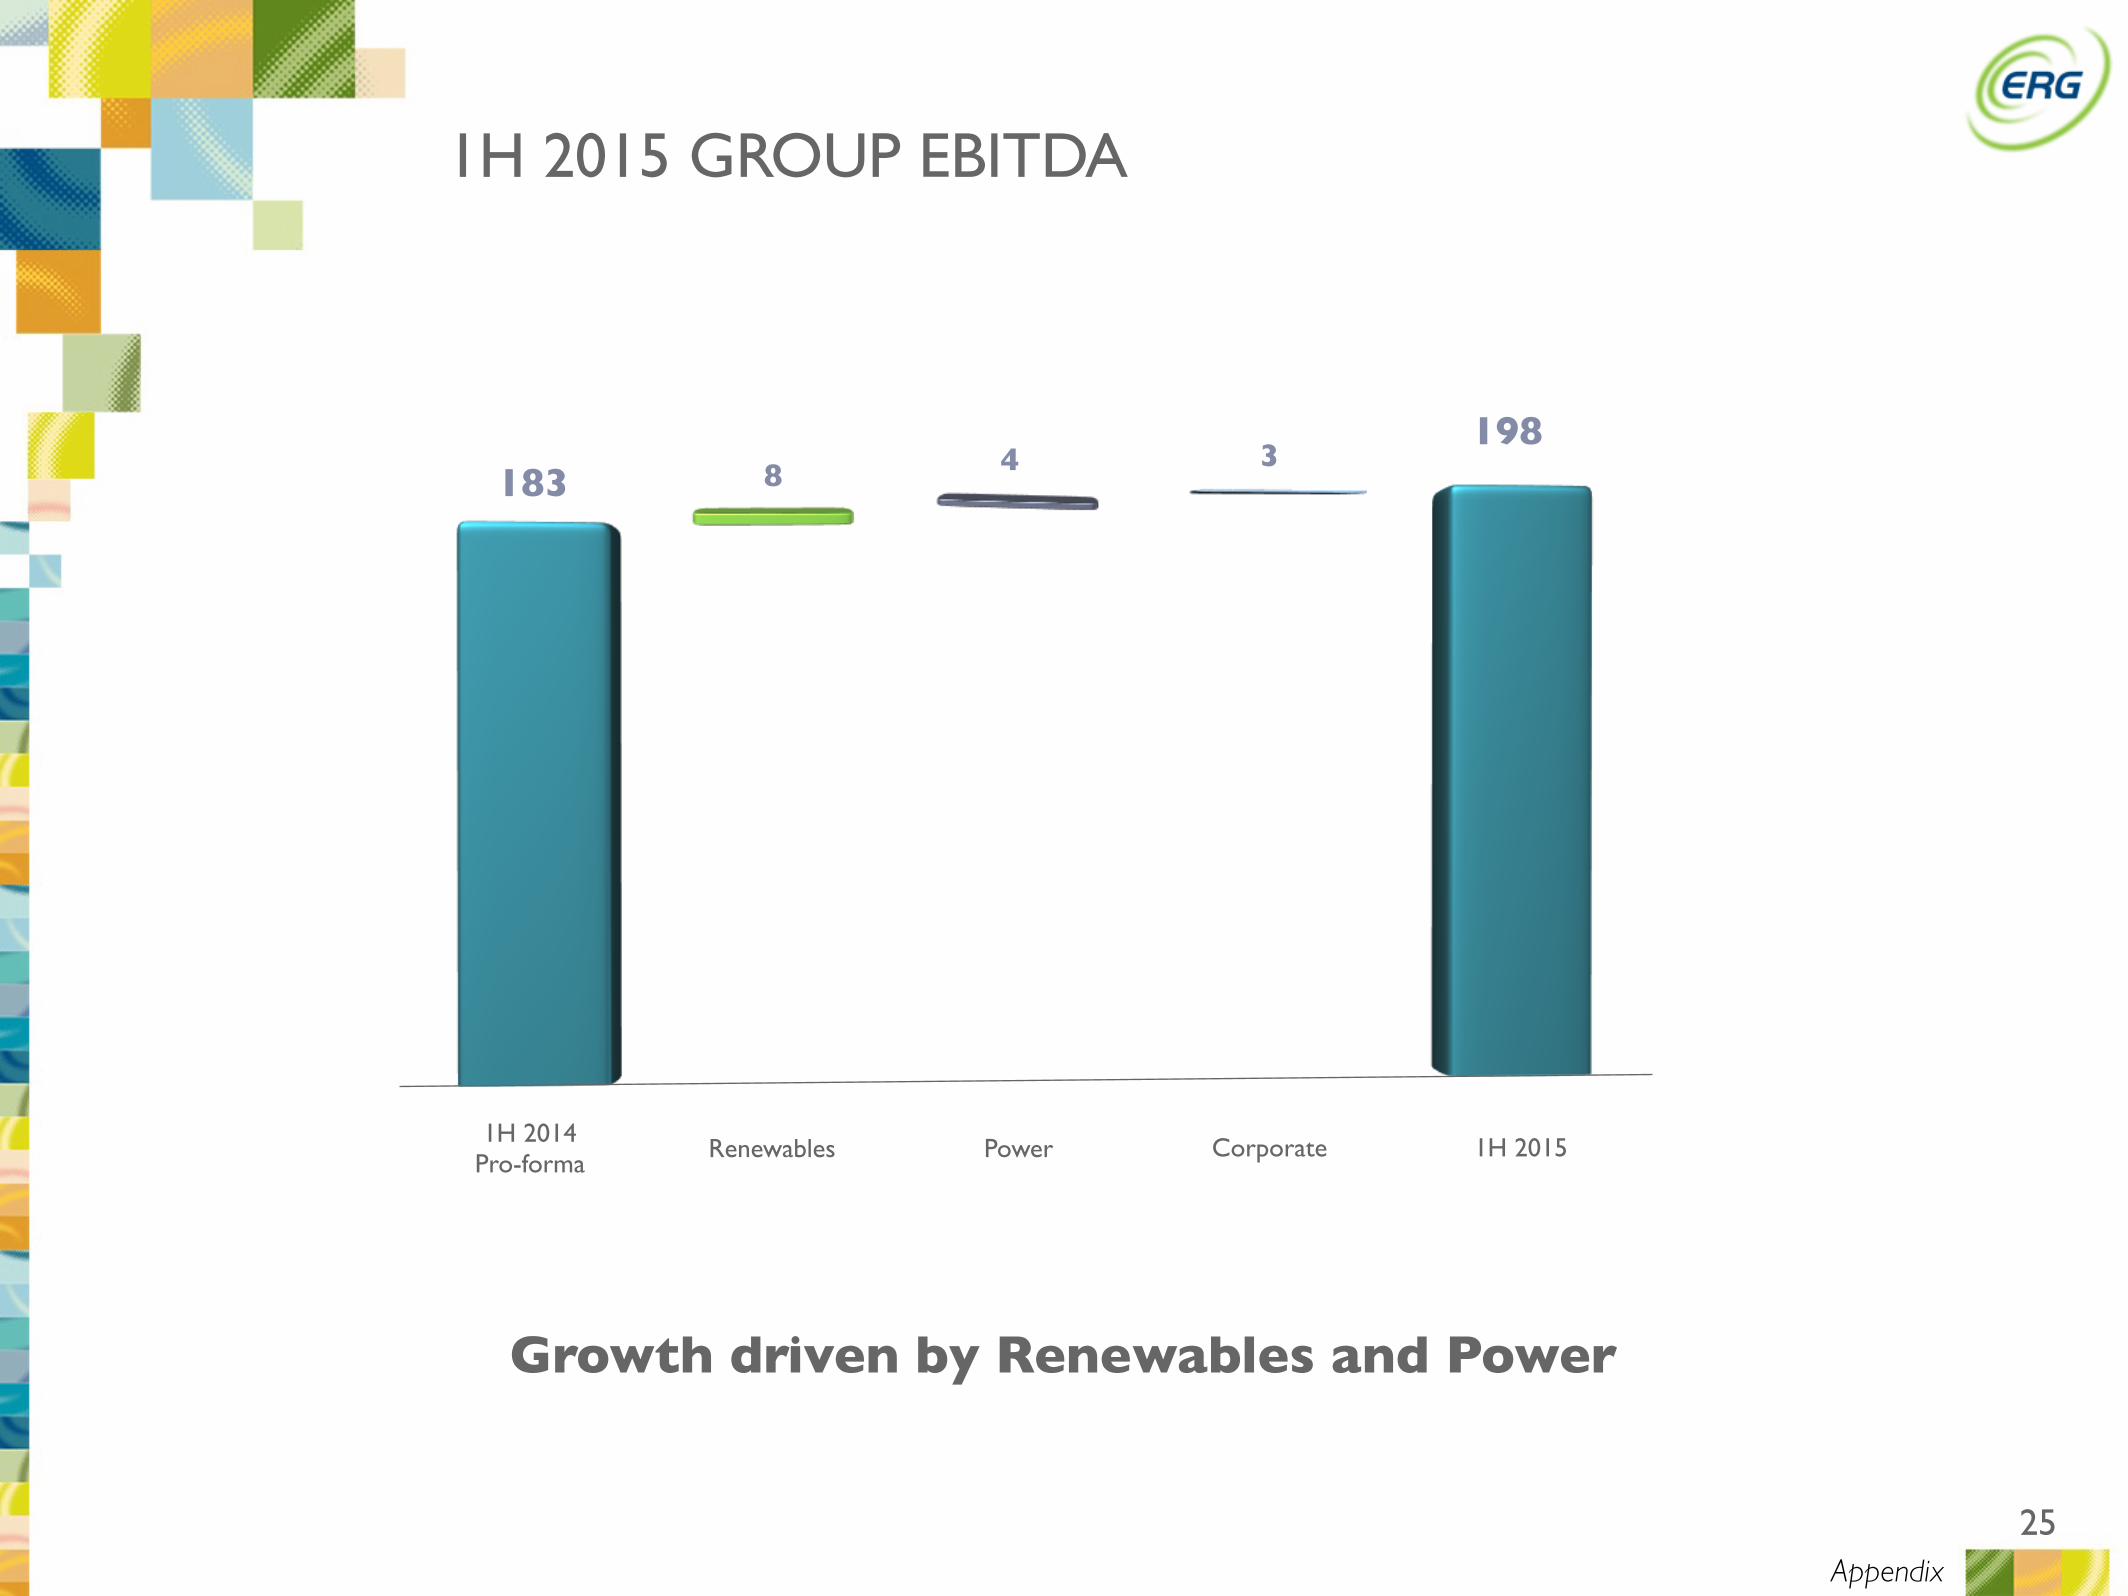
1,292
1H 2014 Pro-forma
183 8 4 3
PowerRenewables Corporate 1H 2015
198
1H 2015 GROUP EBITDA
Growth driven by Renewables and Power
Appendix
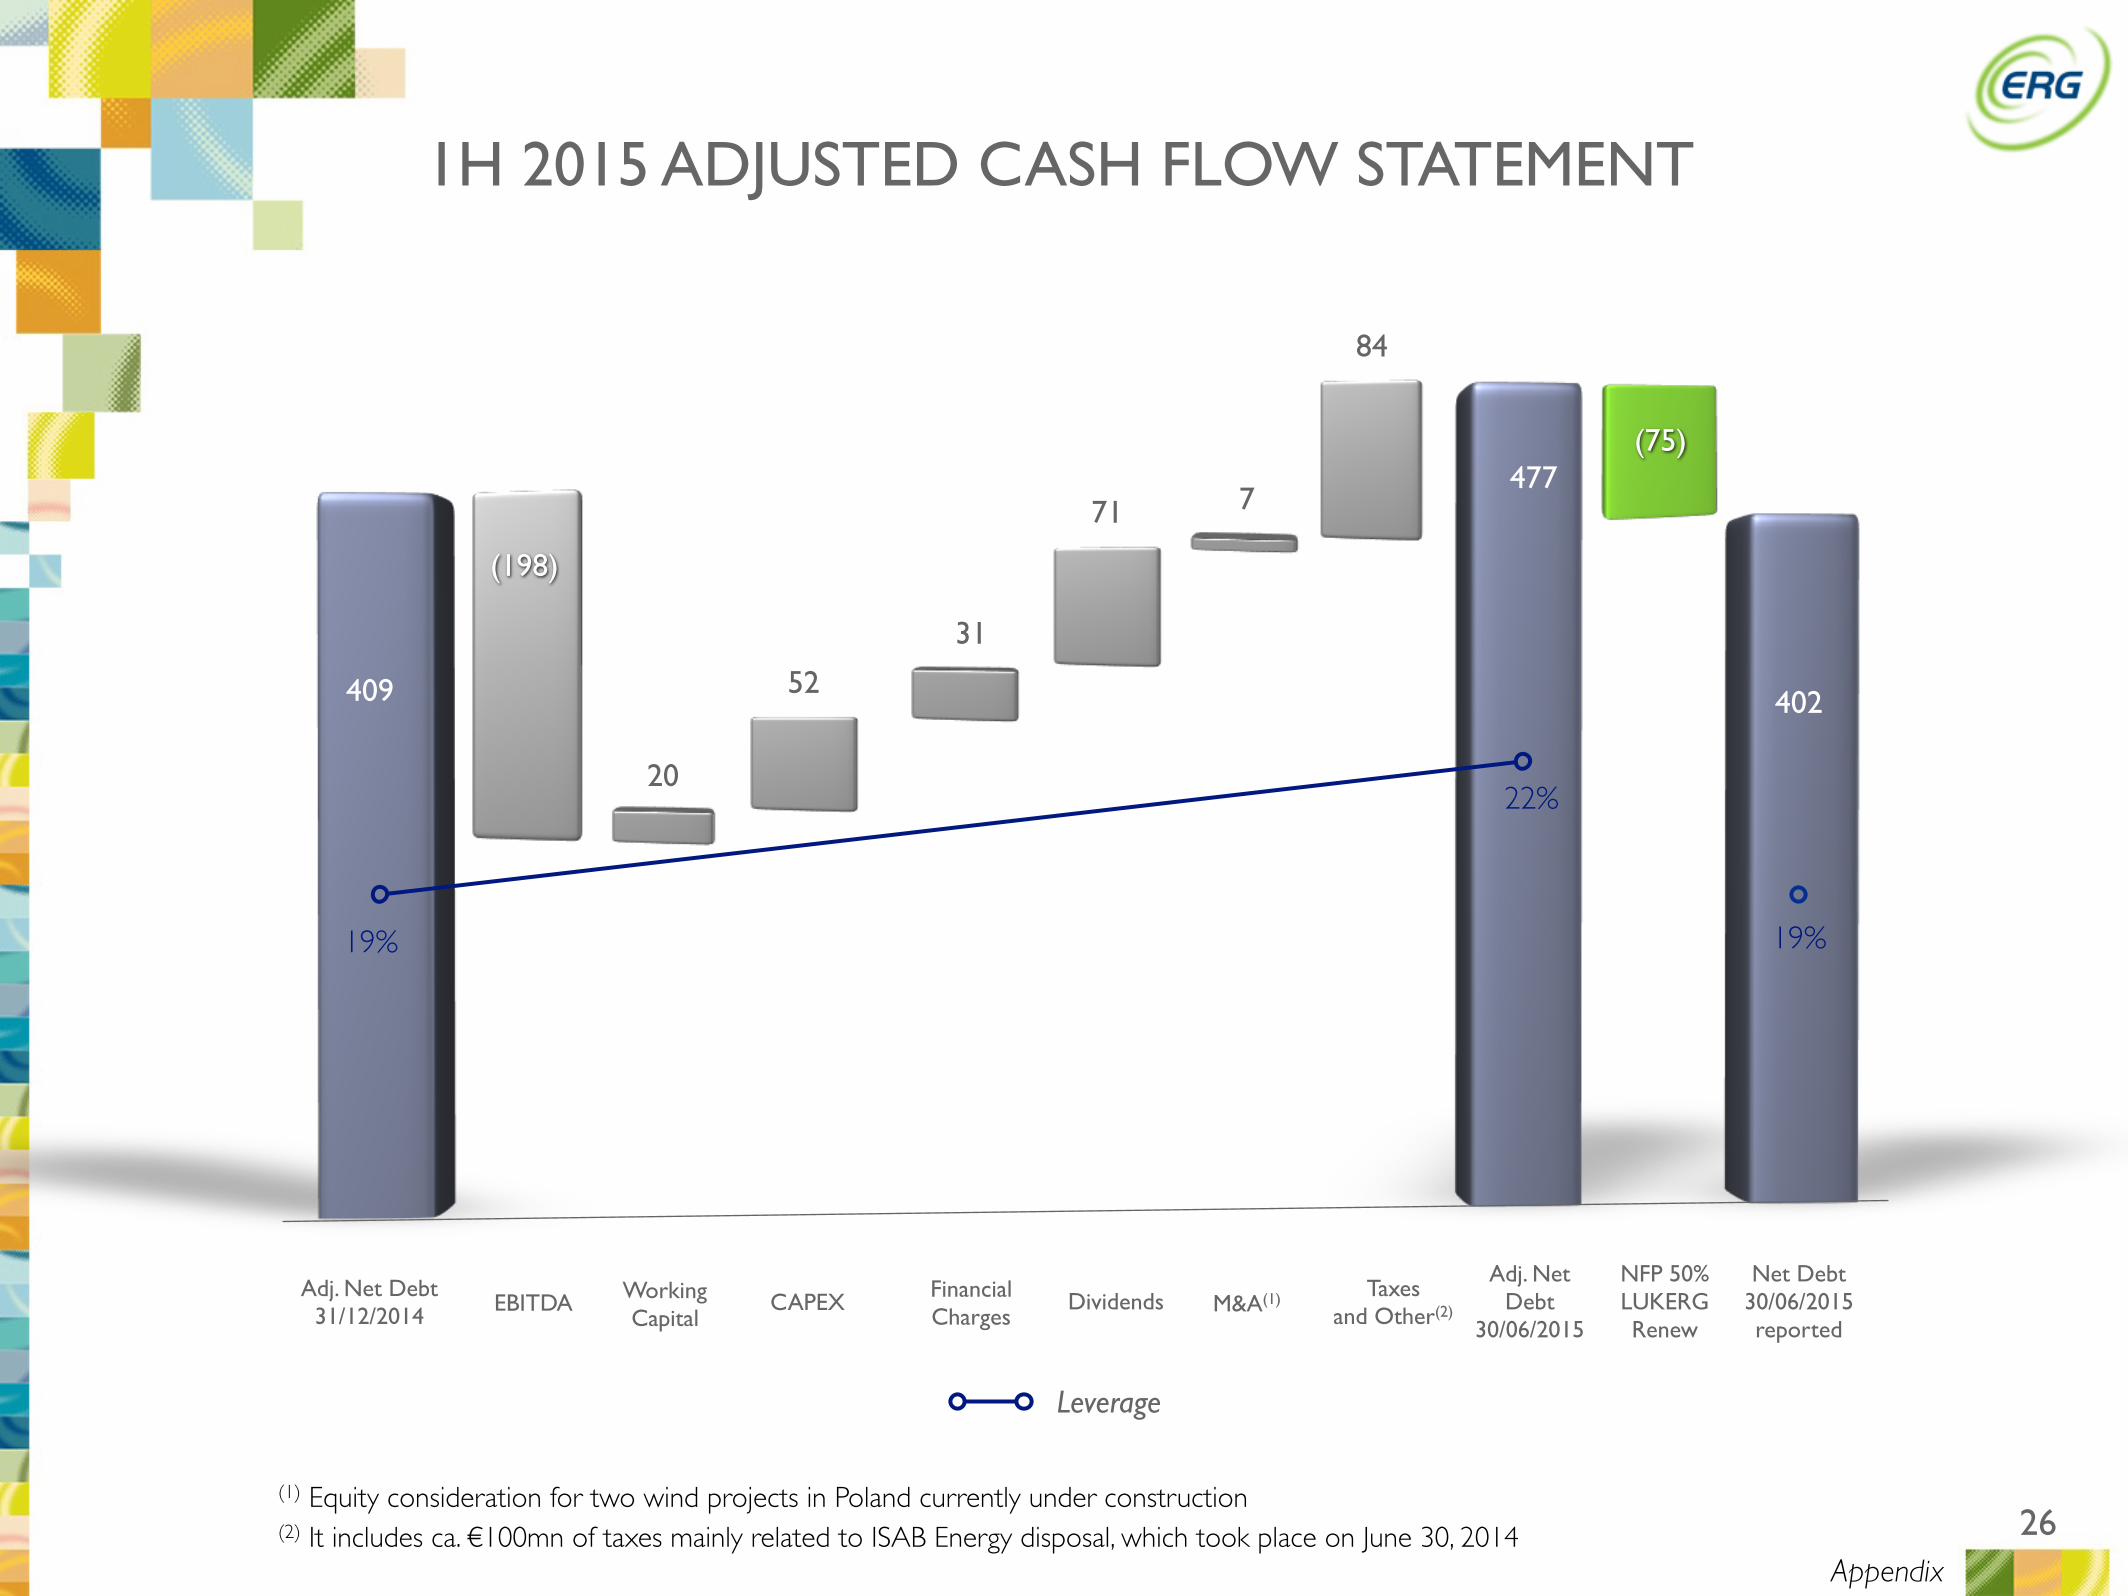
26
402
22%
19% 19%
Adj. Net Debt31/12/2014 EBITDA Working
CapitalCAPEX Financial
Charges
Adj. Net Debt
30/06/2015
NFP 50% LUKERG Renew
Net Debt30/06/2015reported
Leverage
1H 2015 ADJUSTED CASH FLOW STATEMENT
(75)
(198)
477
Dividends
409
20
84
71
(1) Equity consideration for two wind projects in Poland currently under construction(2) It includes ca. €100mn of taxes mainly related to ISAB Energy disposal, which took place on June 30, 2014
52
31
Appendix
M&A(1)
7
Taxesand Other(2)
27
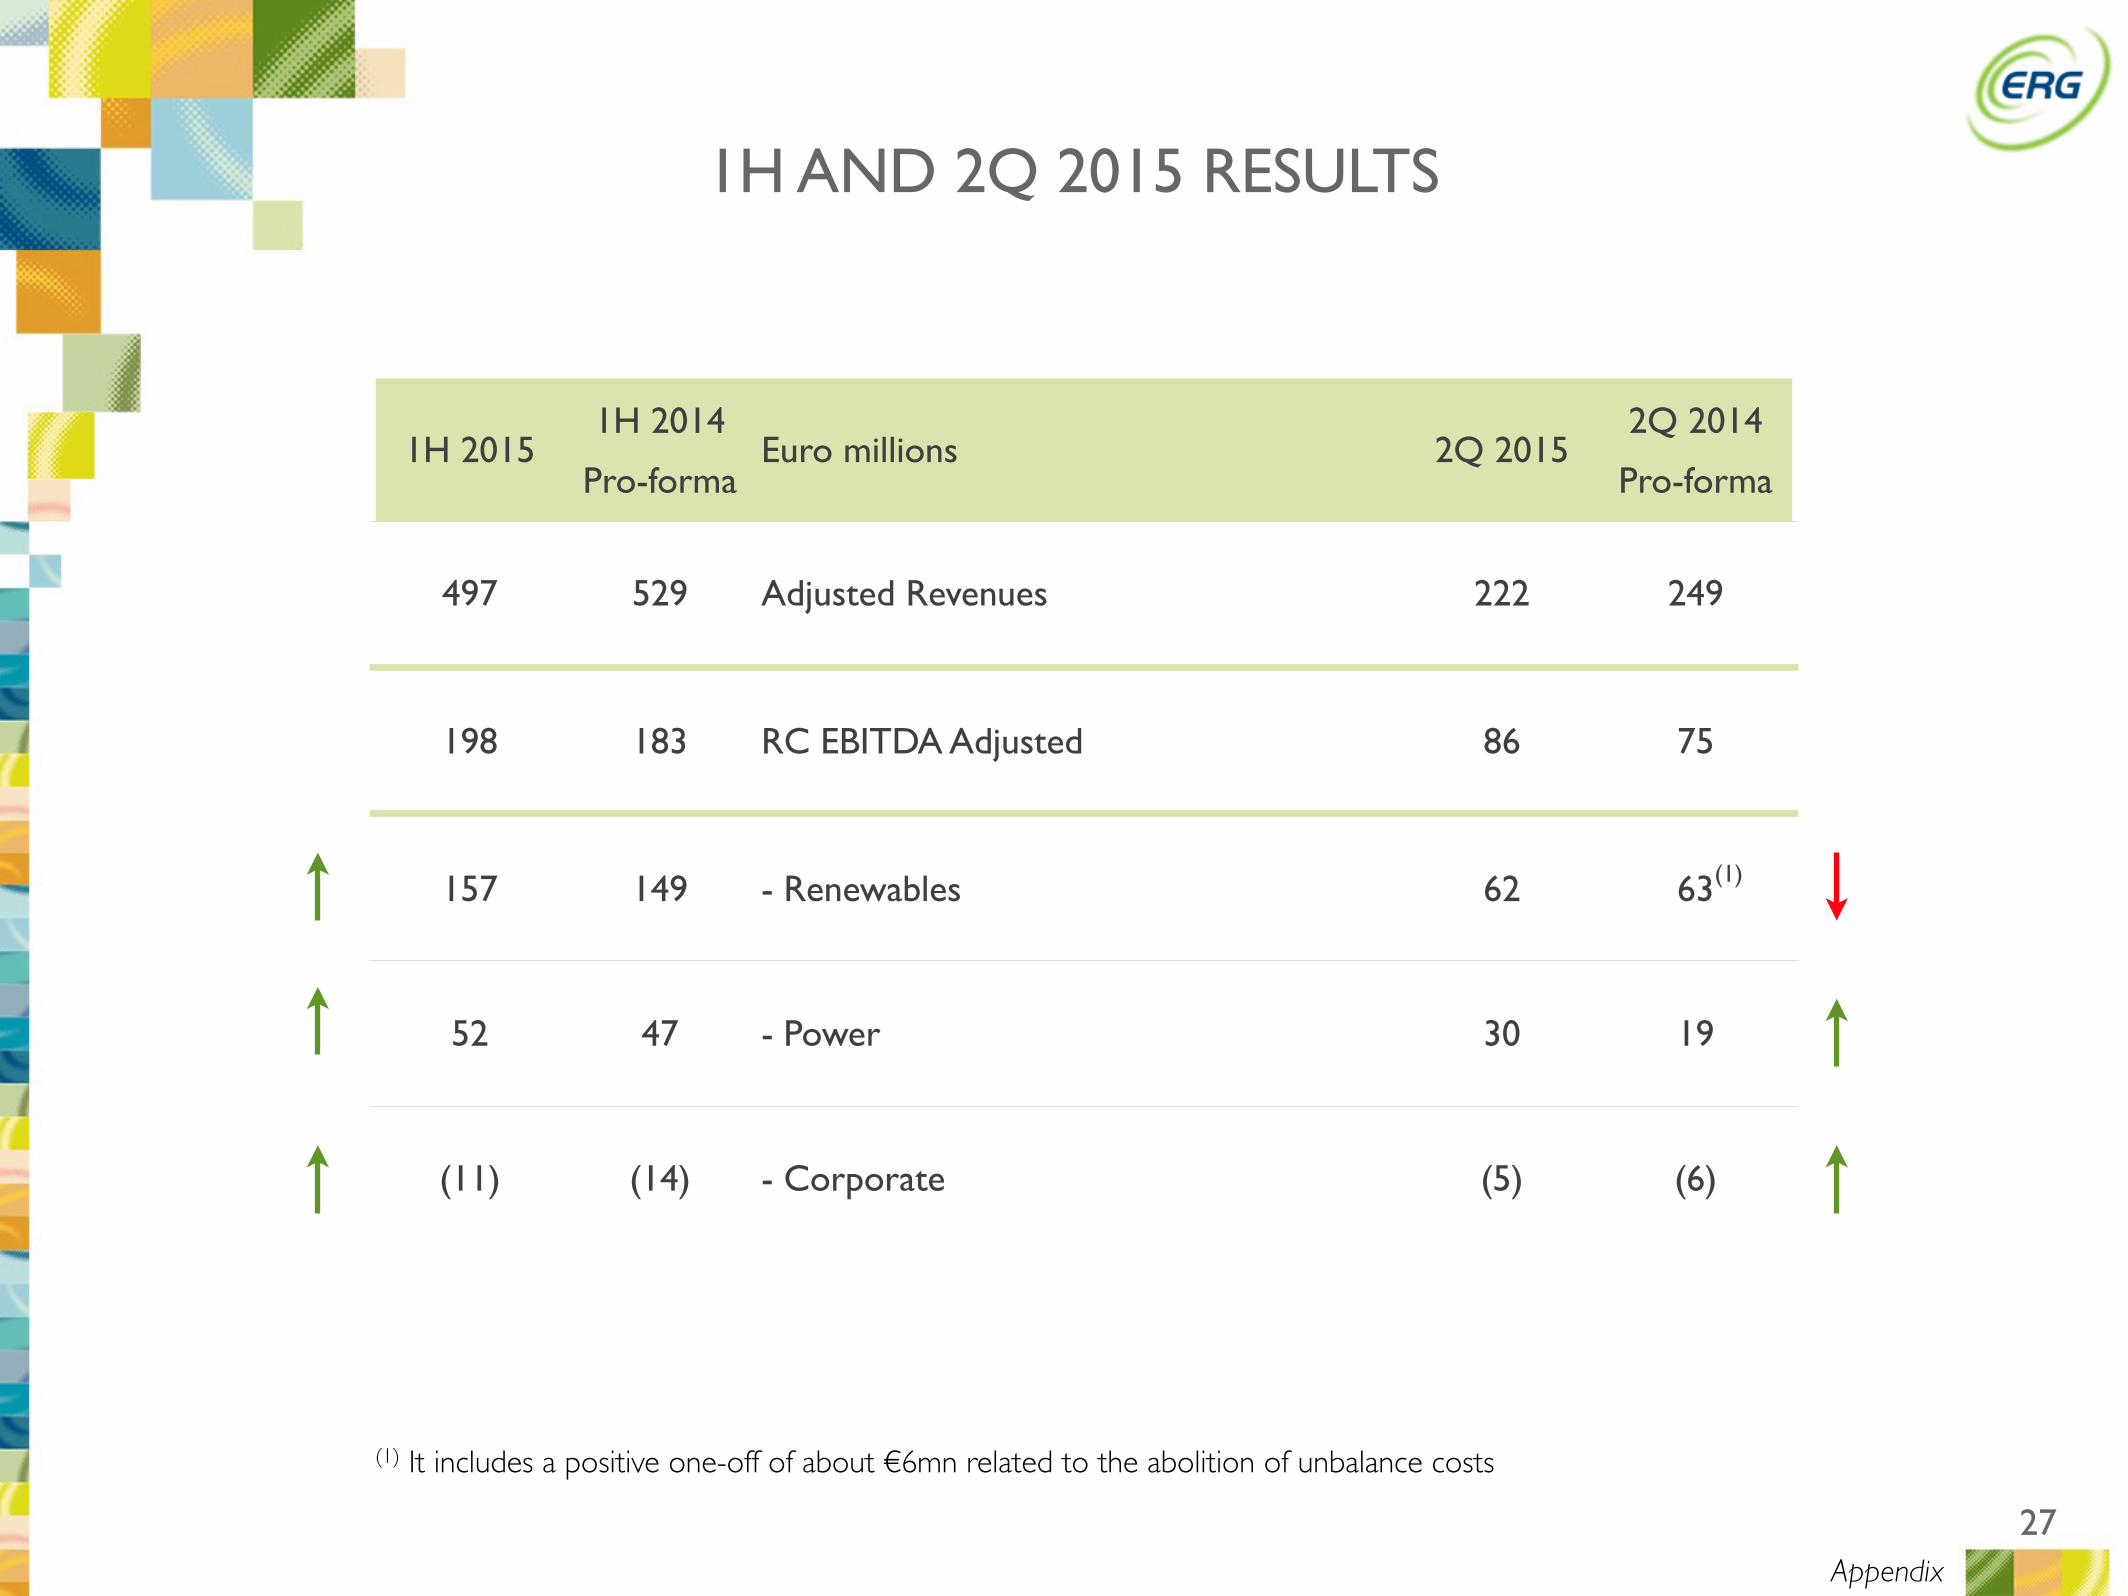
1H AND 2Q 2015 RESULTS
Appendix
(1) It includes a positive one-off of about €6mn related to the abolition of unbalance costs
1H 20151H 2014
Pro-formaEuro millions 2Q 2015
2Q 2014
Pro-forma
497 529 Adjusted Revenues 222 249
198 183 RC EBITDA Adjusted 86 75
157 149 - Renewables 62 63
52 47 - Power 30 19
(11) (14) - Corporate (5) (6)
(1)
28
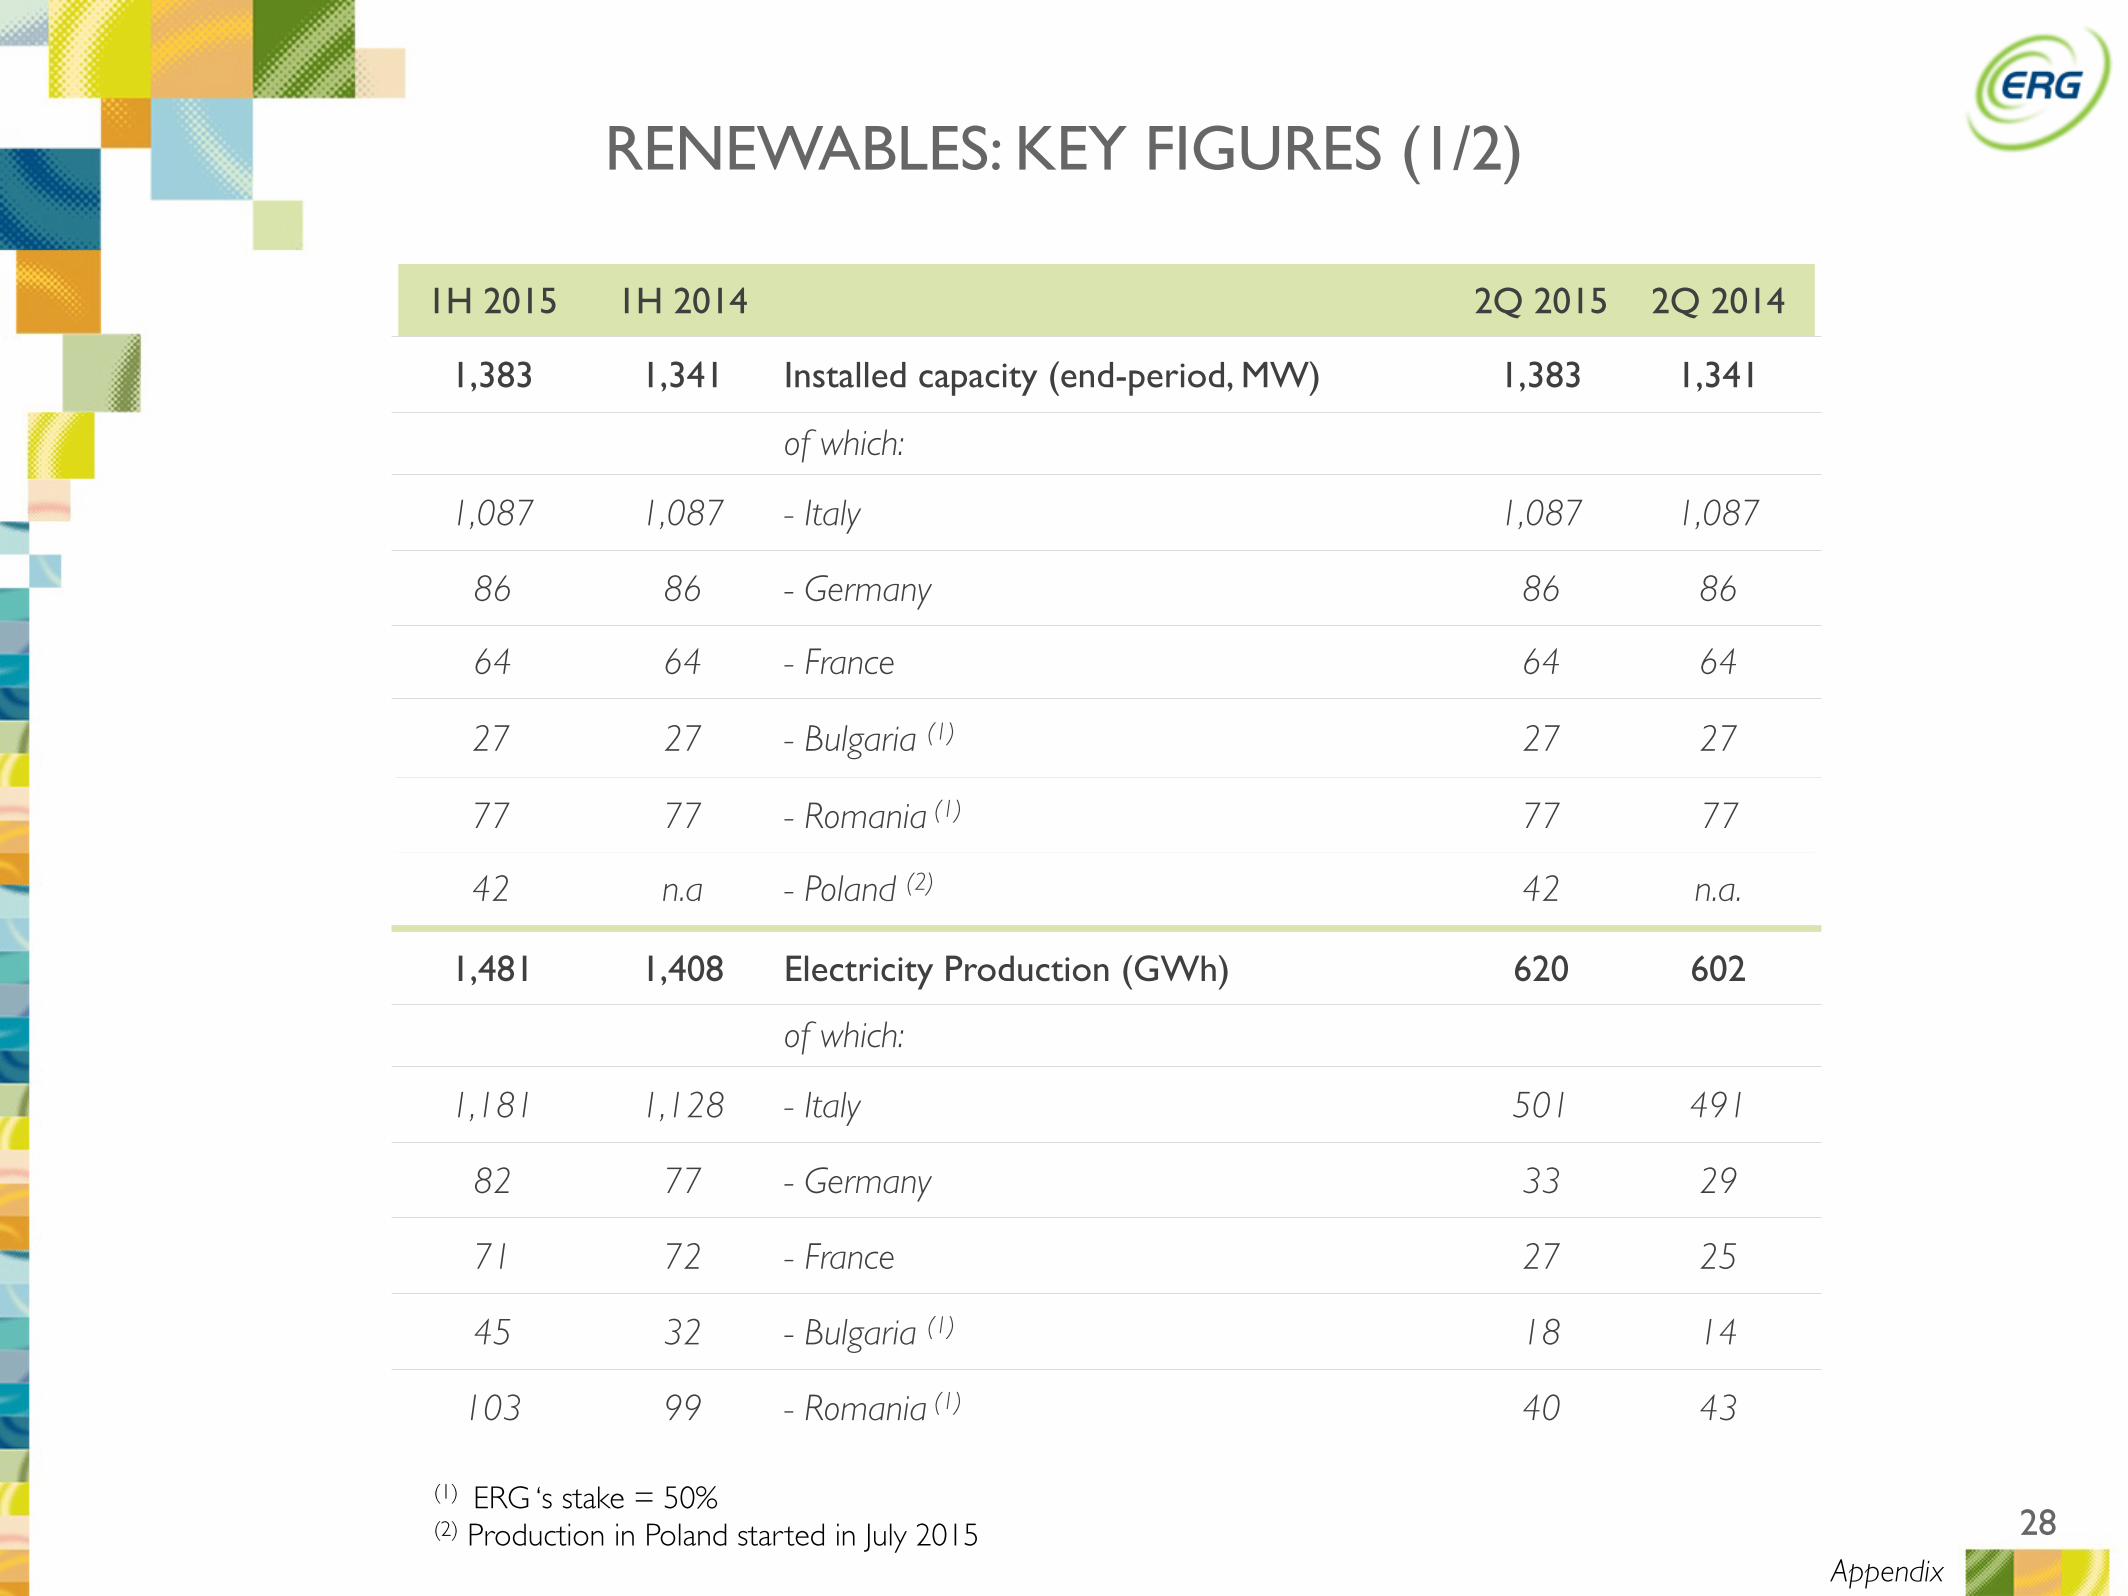
1H 2015 1H 2014 2Q 2015 2Q 2014
1,383 1,341 Installed capacity (end-period, MW) 1,383 1,341
of which:
1,087 1,087 - Italy 1,087 1,087
86 86 - Germany 86 86
64 64 - France 64 64
27 27 - Bulgaria (1) 27 27
77 77 - Romania (1) 77 77
42 n.a - Poland (2) 42 n.a.
1,481 1,408 Electricity Production (GWh) 620 602
of which:
1,181 1,128 - Italy 501 491
82 77 - Germany 33 29
71 72 - France 27 25
45 32 - Bulgaria (1) 18 14
103 99 - Romania (1) 40 43
RENEWABLES: KEY FIGURES (1/2)
Appendix
(1) ERG ‘s stake = 50%(2) Production in Poland started in July 2015
29
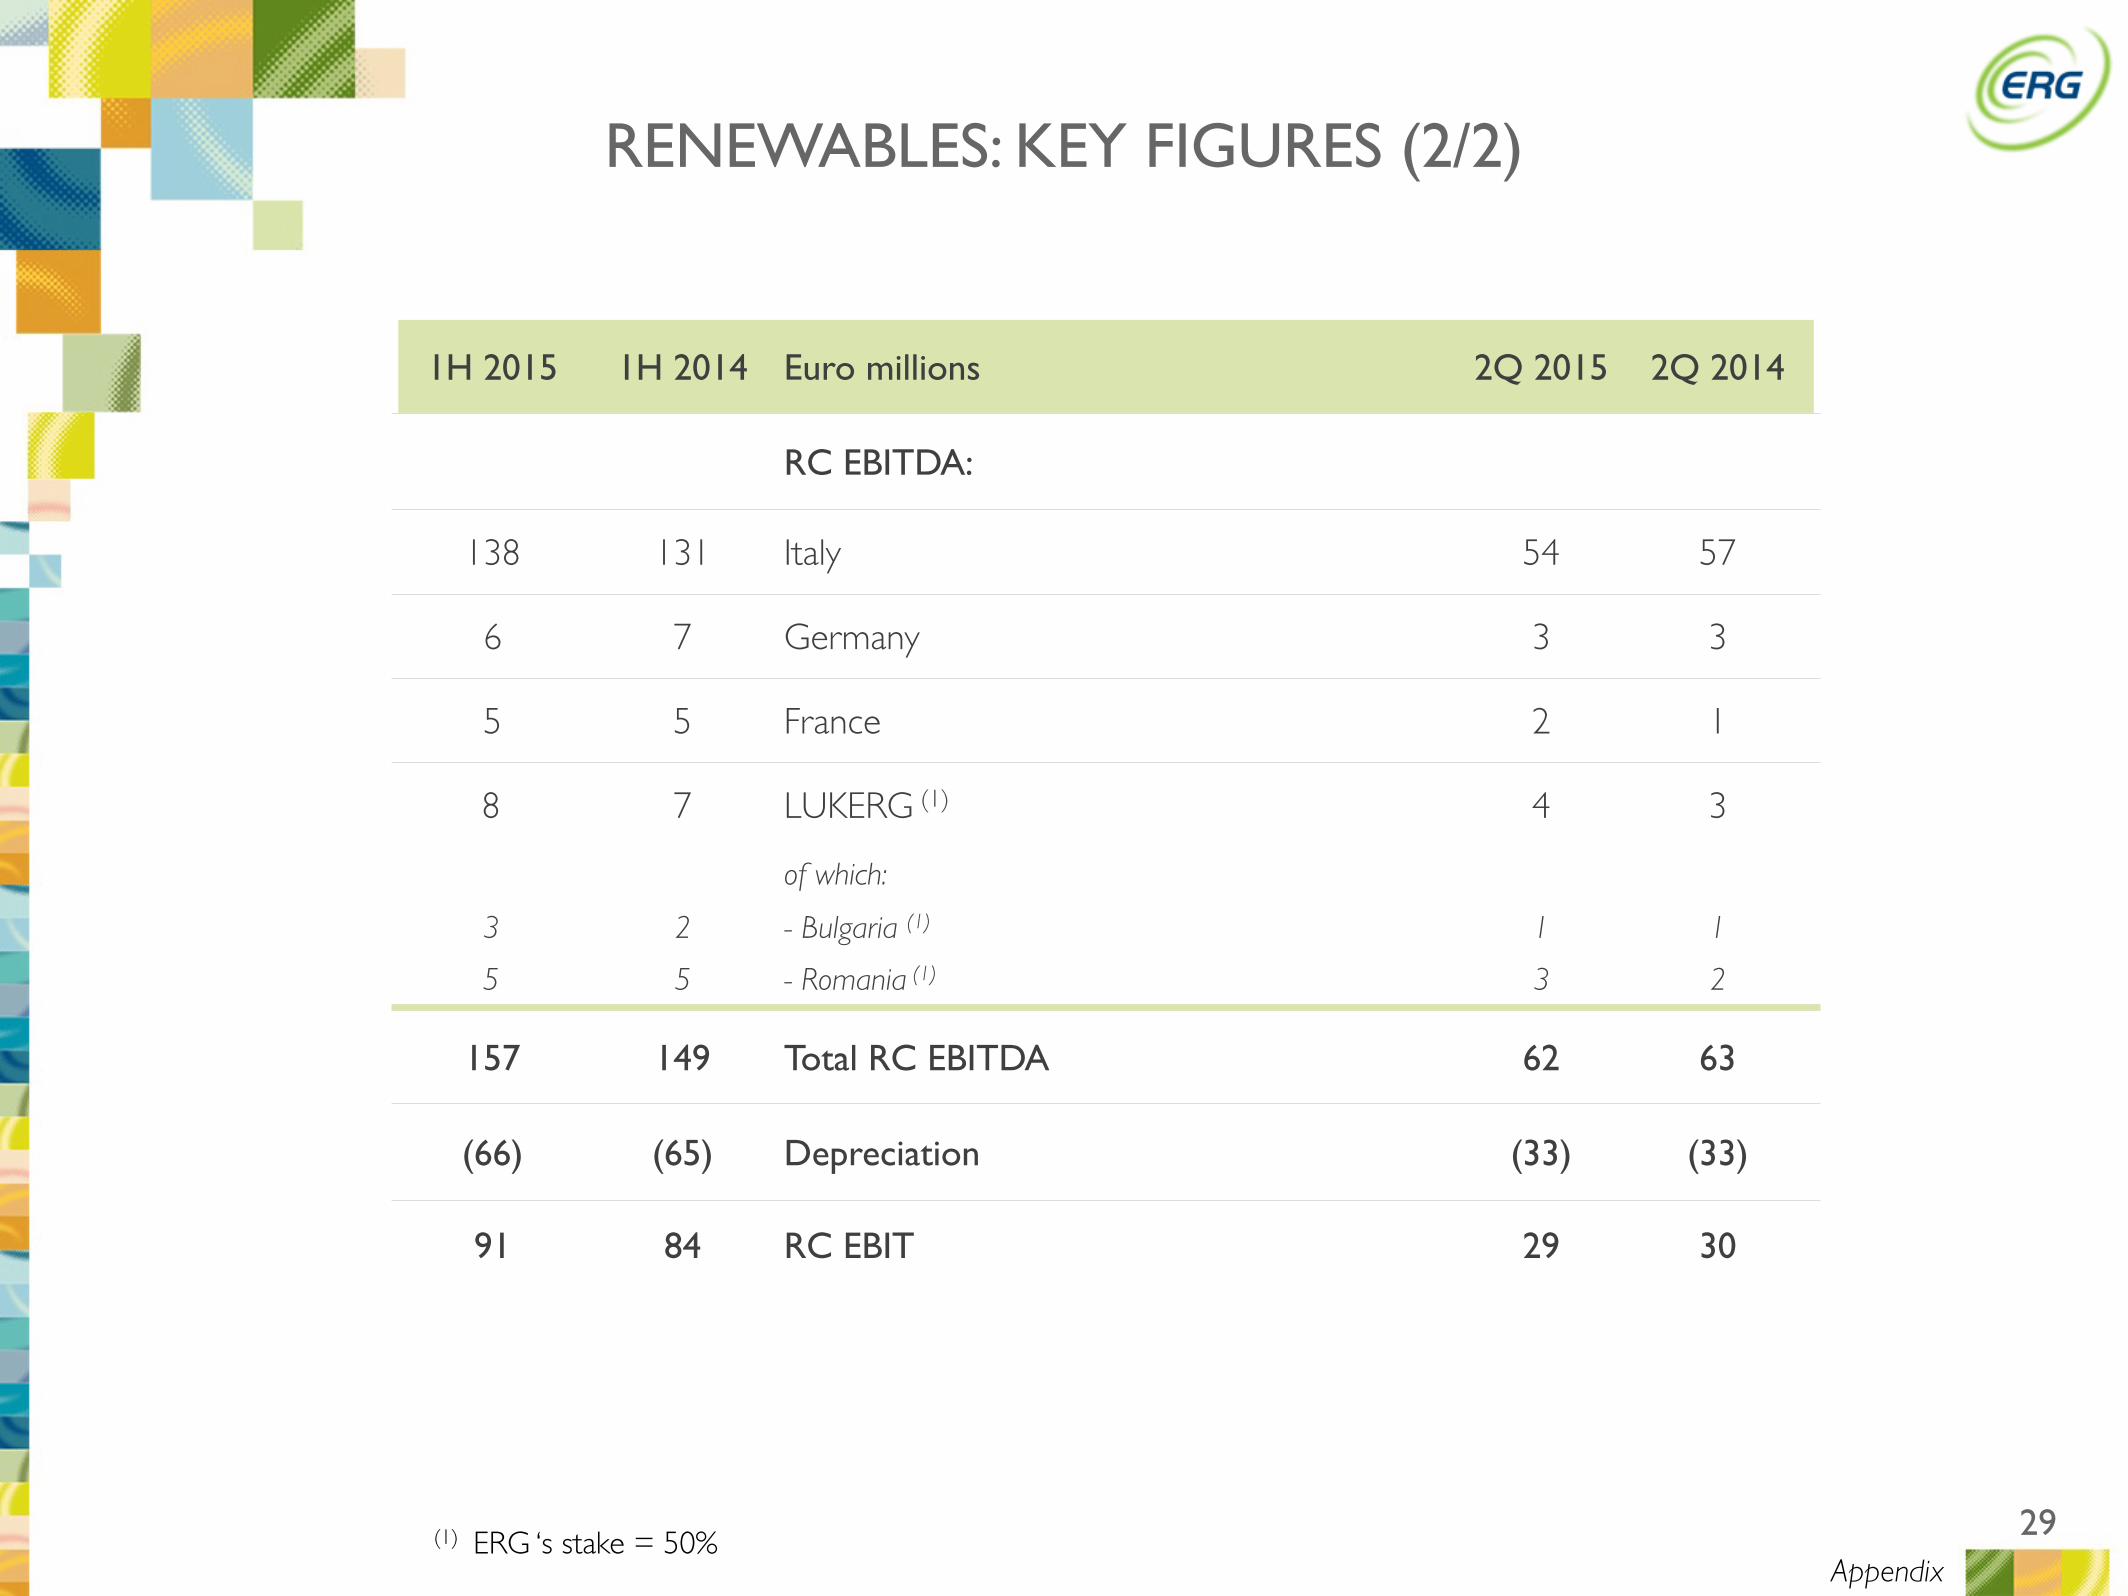
1H 2015 1H 2014 Euro millions 2Q 2015 2Q 2014
RC EBITDA:
138 131 Italy 54 57
6 7 Germany 3 3
5 5 France 2 1
8 7 LUKERG (1) 4 3
of which:
3 2 - Bulgaria (1) 1 1
5 5 - Romania (1) 3 2
157 149 Total RC EBITDA 62 63
(66) (65) Depreciation (33) (33)
91 84 RC EBIT 29 30
Appendix(1) ERG ‘s stake = 50%
RENEWABLES: KEY FIGURES (2/2)
30
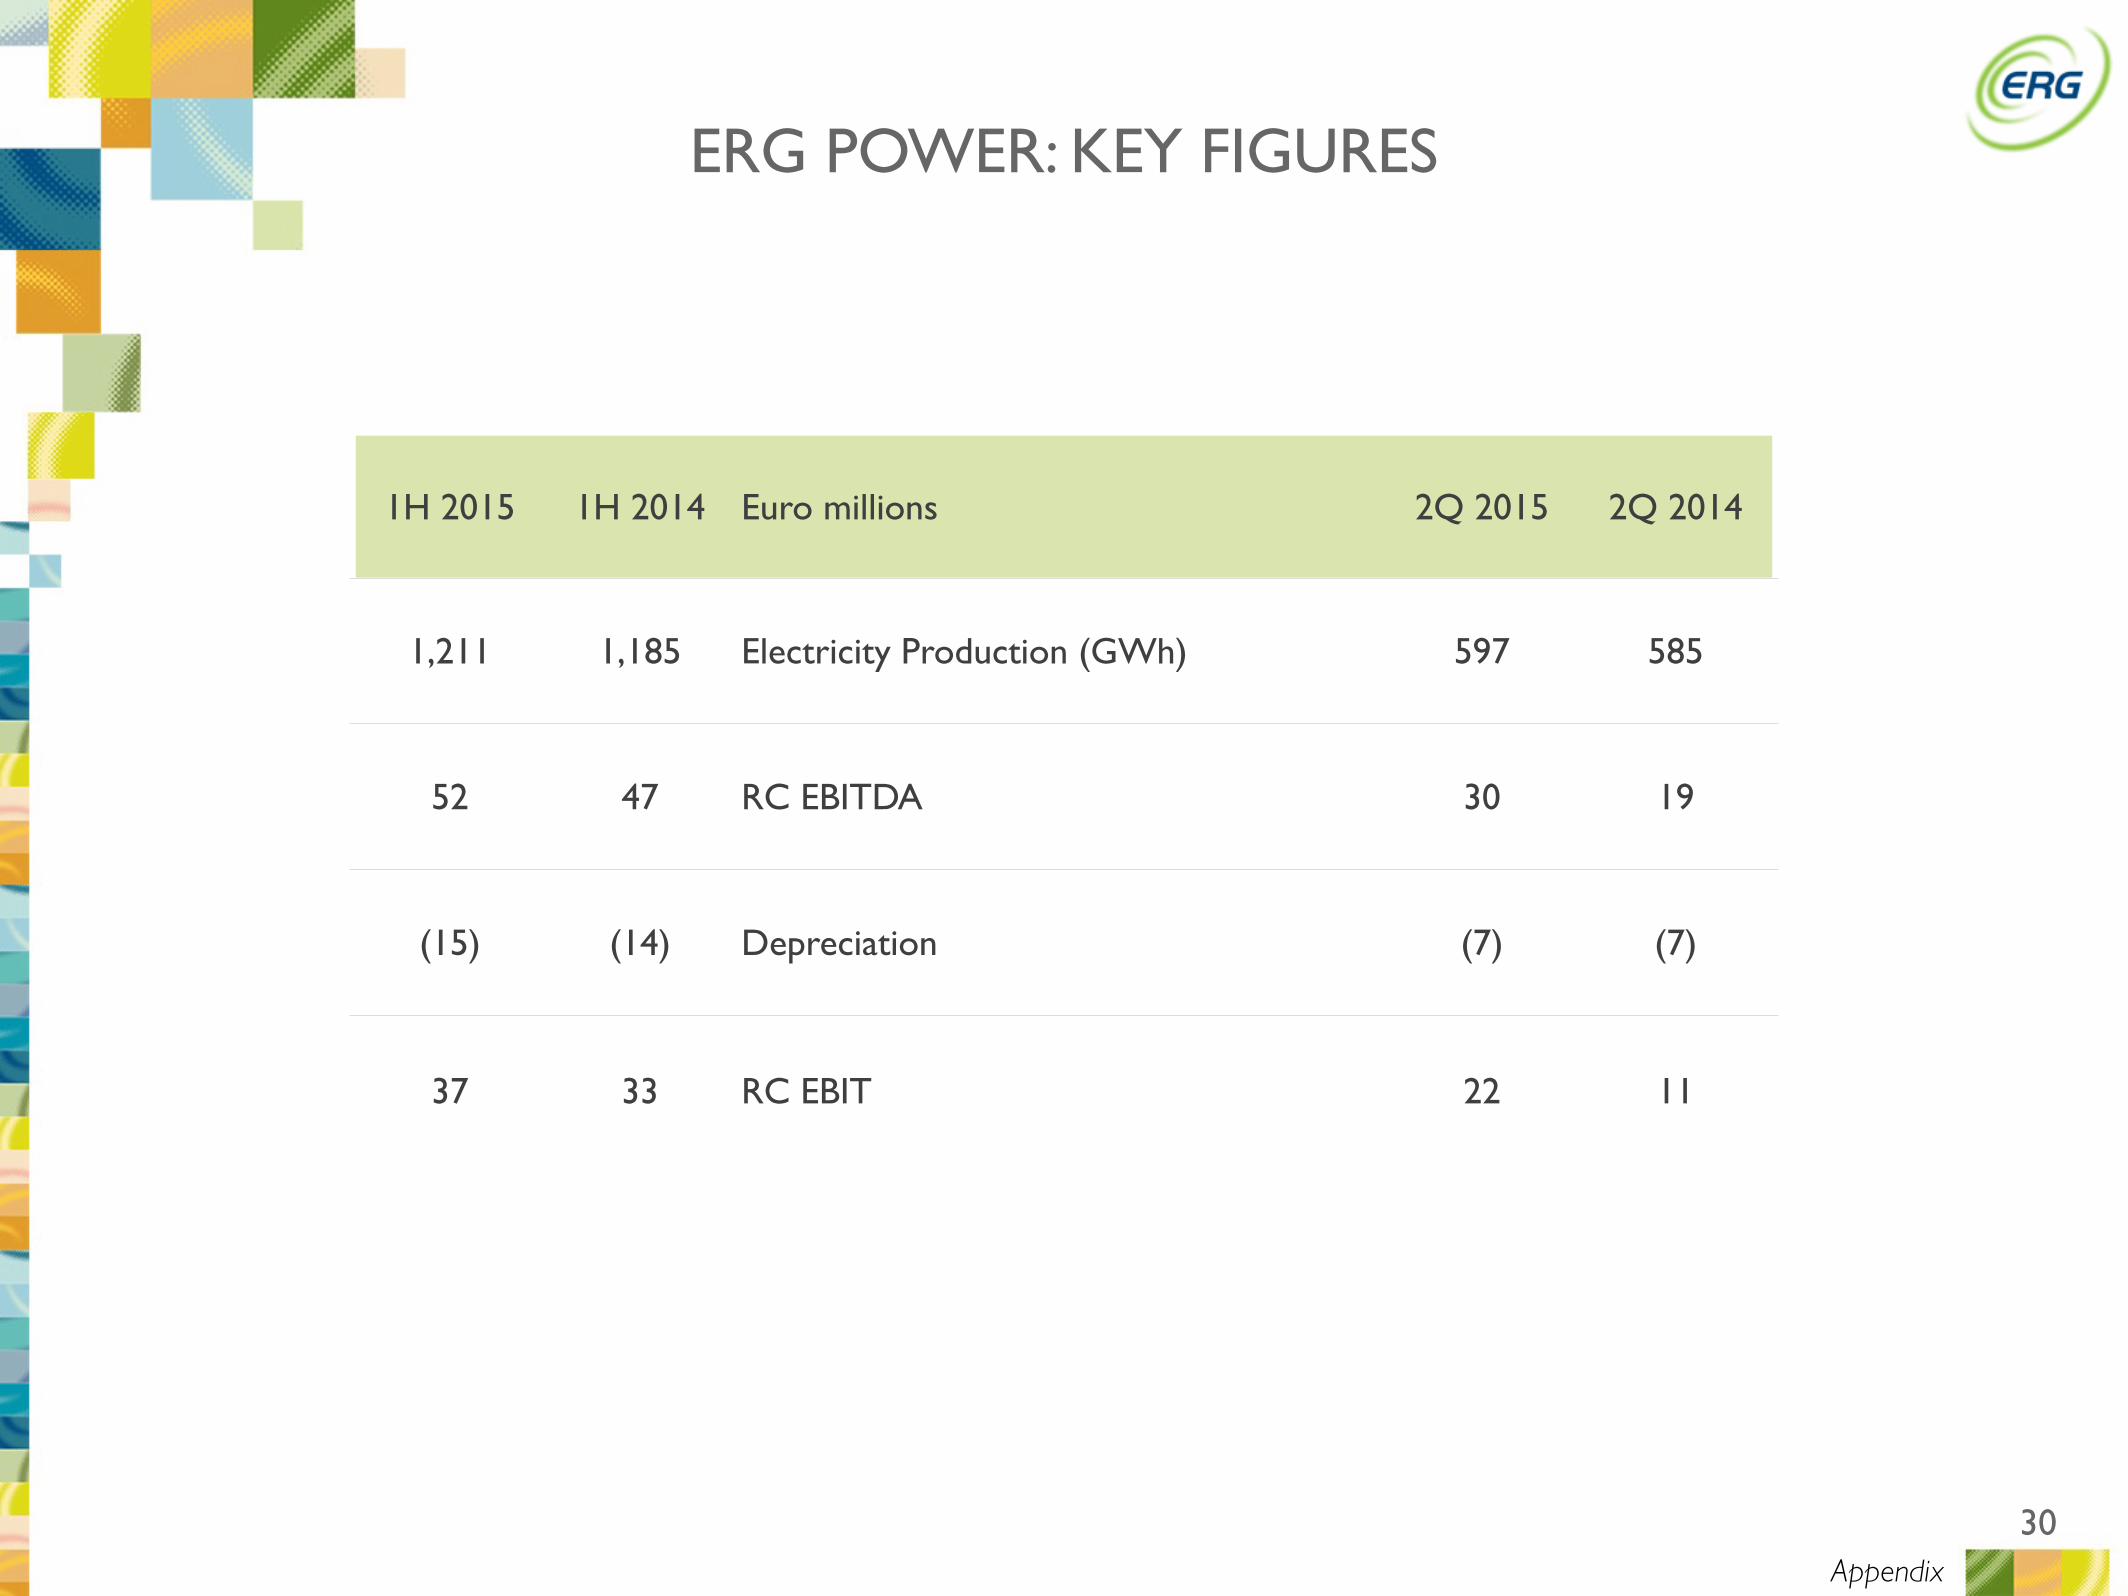
ERG POWER: KEY FIGURES
Appendix
1H 2015 1H 2014 Euro millions 2Q 2015 2Q 2014
1,211 1,185 Electricity Production (GWh) 597 585
52 47 RC EBITDA 30 19
(15) (14) Depreciation (7) (7)
37 33 RC EBIT 22 11
31
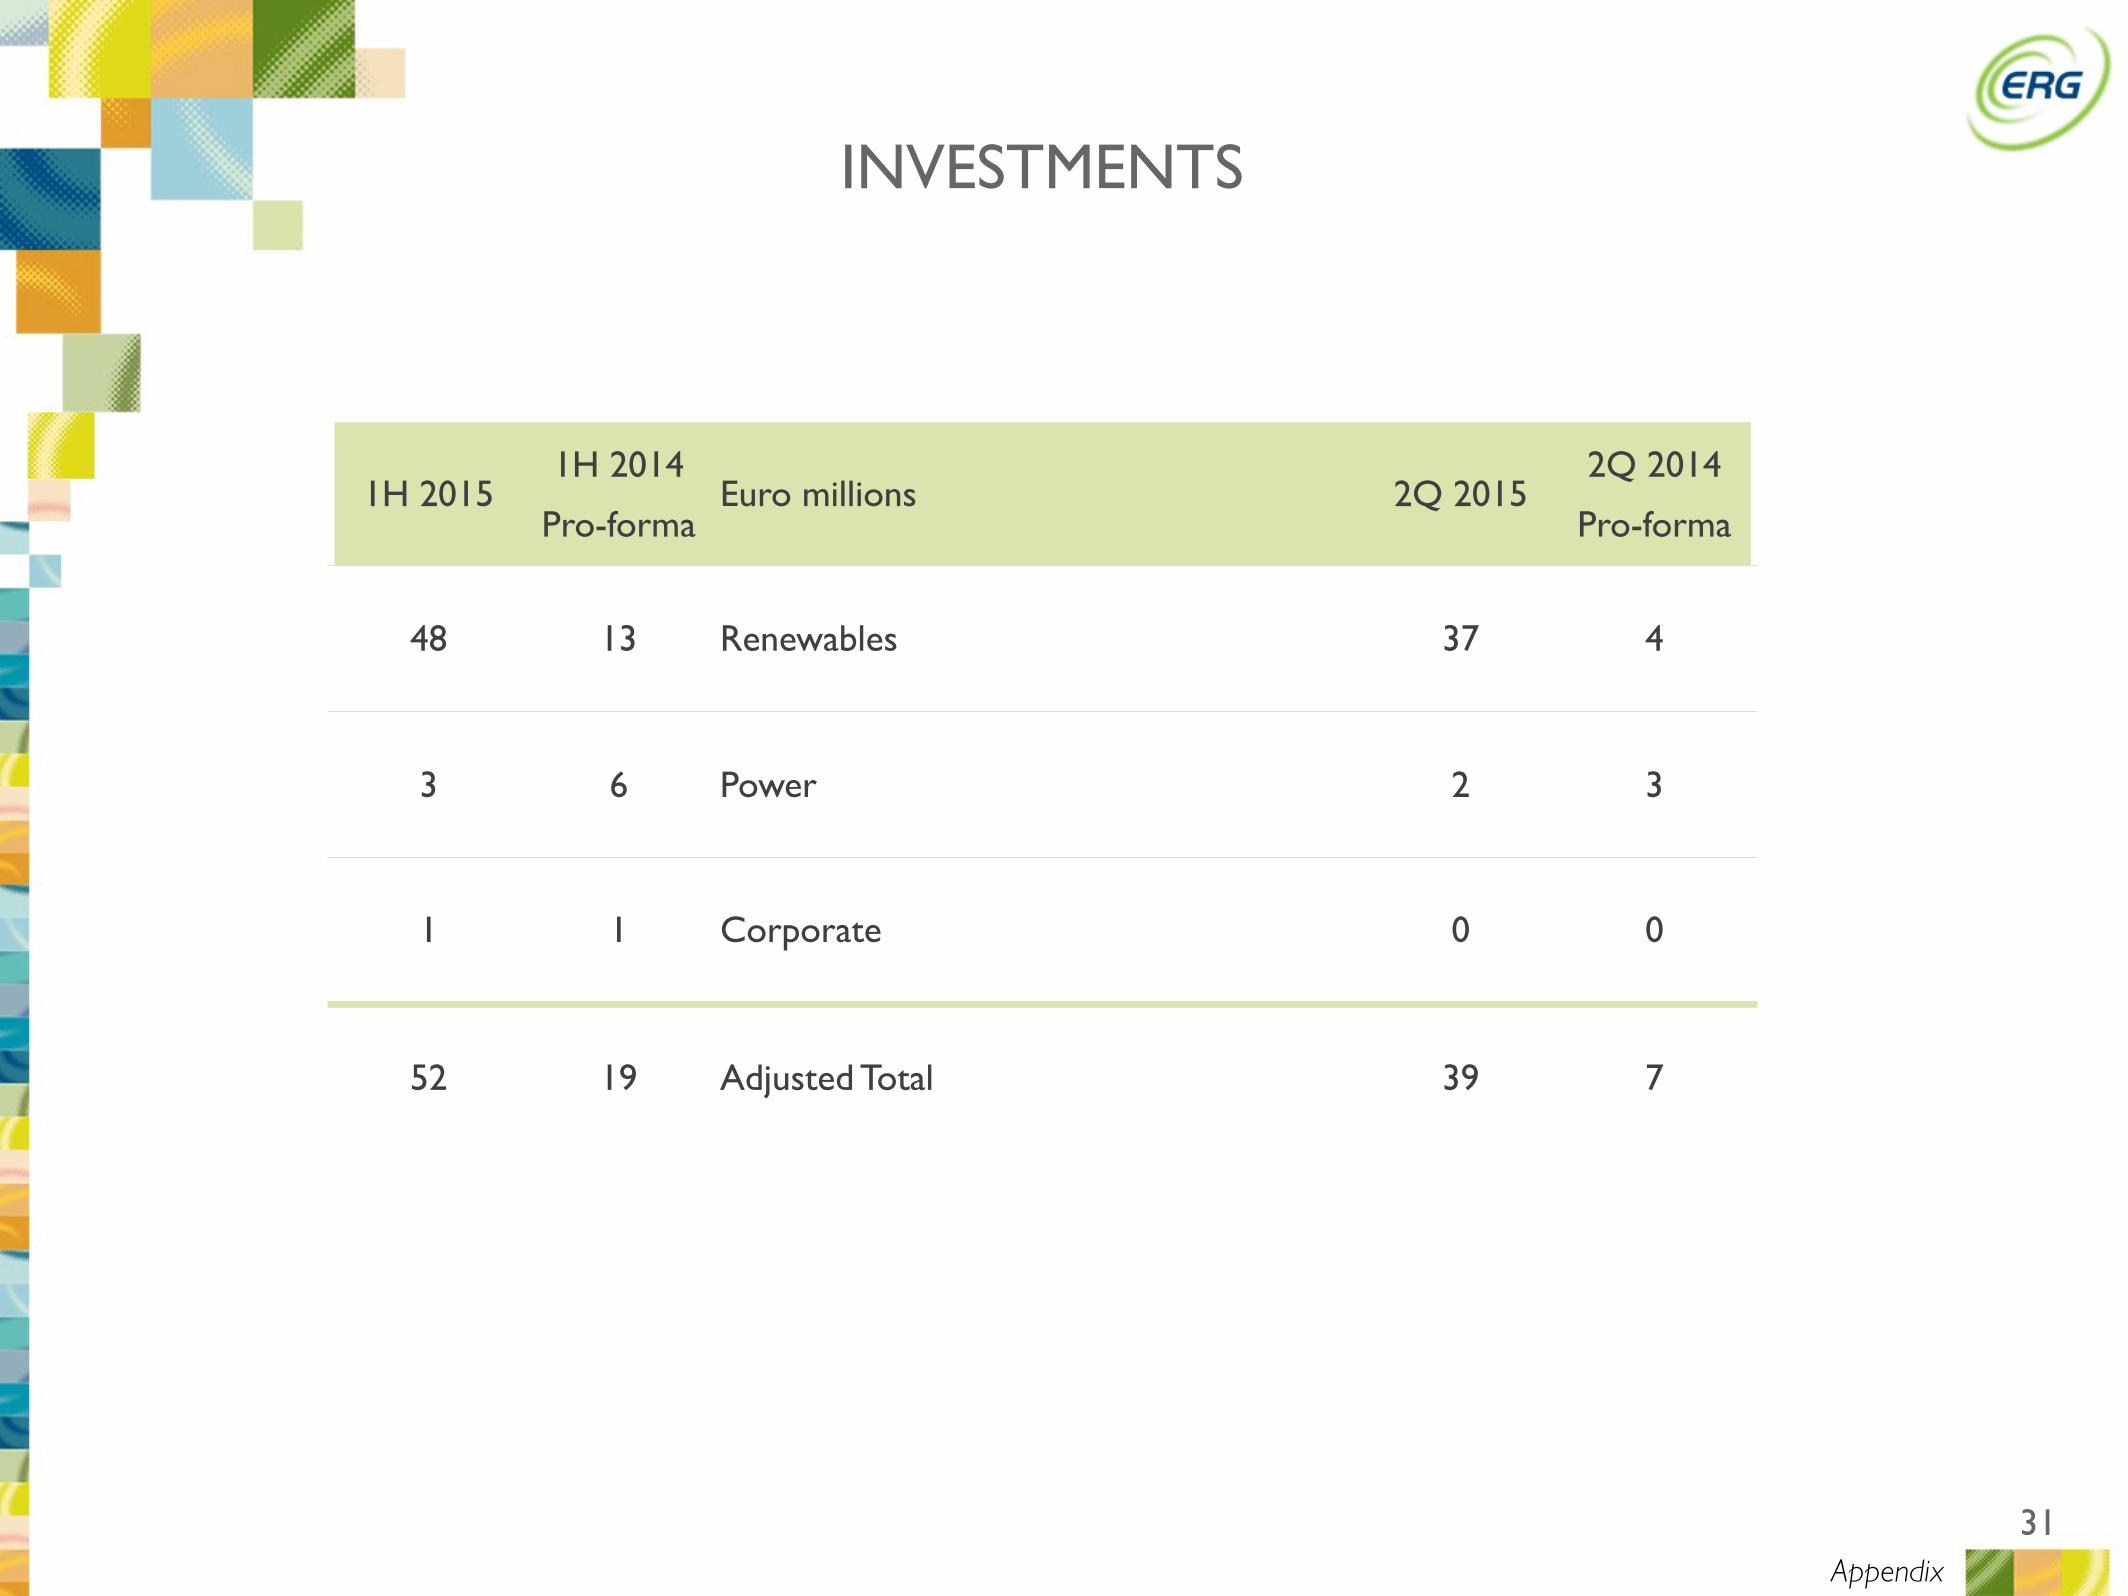
1H 20151H 2014
Pro-formaEuro millions 2Q 2015
2Q 2014
Pro-forma
48 13 Renewables 37 4
3 6 Power 2 3
1 1 Corporate 0 0
52 19 Adjusted Total 39 7
INVESTMENTS
Appendix