2015 annual results announcement -...
TRANSCRIPT
2015 Annual Results Announcement
2
This presentation contains forward-looking statements that involve
risks and uncertainties. These statements are generally indicated by the
use of forward-looking terminology such as believe, expect, anticipate,
estimate, plan, project, target, may, will or other similar words that
express an indication of actions or results of actions that may or are
expected to occur in the future. You should not place undue reliance on
these forward-looking statements, which apply only as of the date of this
presentation. These forward-looking statements are based on our own
information and on information from other sources we believe to be
reliable. Our actual results may be materially less favorable than those
expressed or implied by these forward-looking statements which could
affect the market price of our shares.
Disclaimer

3
Board and Management
Mr. WANG Yilin Chairman
Mr. WANG Dongjin Vice Chairman and President
Mr. SUN Longde Vice President
Mr. WU Enlai Secretary to the Board of Directors
Mr. Zhao Dong Chief Financial Officer

4
Agenda
Remarks by the Chairman
2015 Financial Results Review and Analysis
2015 Operating Results & 2016 Business Outlook

Remarks by the Chairman
6
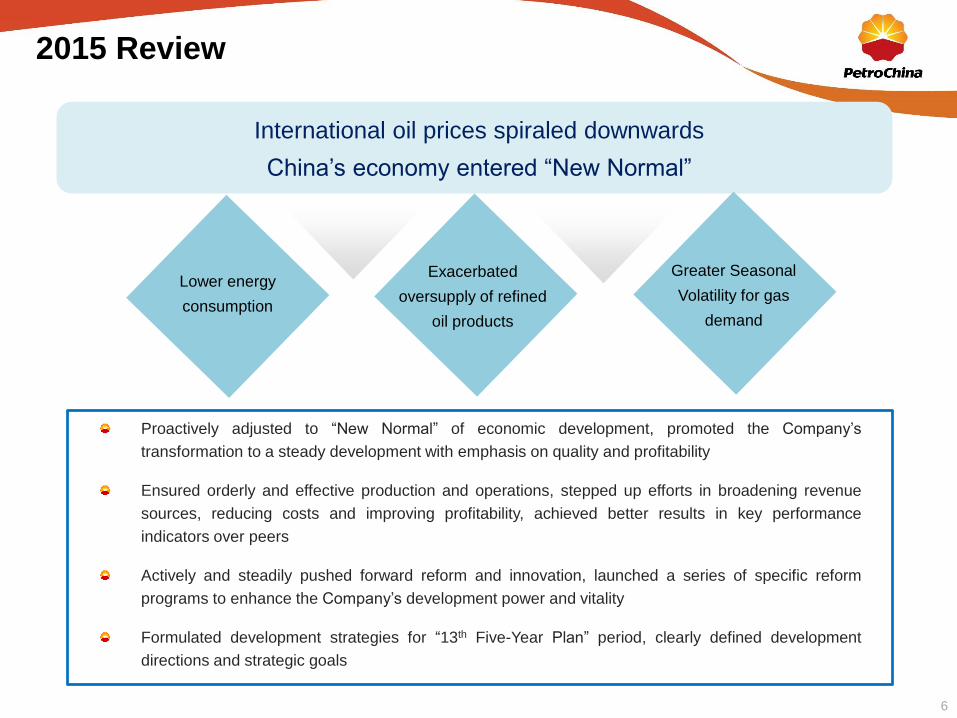
2015 Review
International oil prices spiraled downwards
China’s economy entered “New Normal”
Proactively adjusted to “New Normal” of economic development, promoted the Company’s
transformation to a steady development with emphasis on quality and profitability
Ensured orderly and effective production and operations, stepped up efforts in broadening revenue
sources, reducing costs and improving profitability, achieved better results in key performance
indicators over peers
Actively and steadily pushed forward reform and innovation, launched a series of specific reform
programs to enhance the Company’s development power and vitality
Formulated development strategies for “13th Five-Year Plan” period, clearly defined development
directions and strategic goals
Exacerbated
oversupply of refined
oil products
Greater Seasonal
Volatility for gas
demand
Lower energy
consumption
7
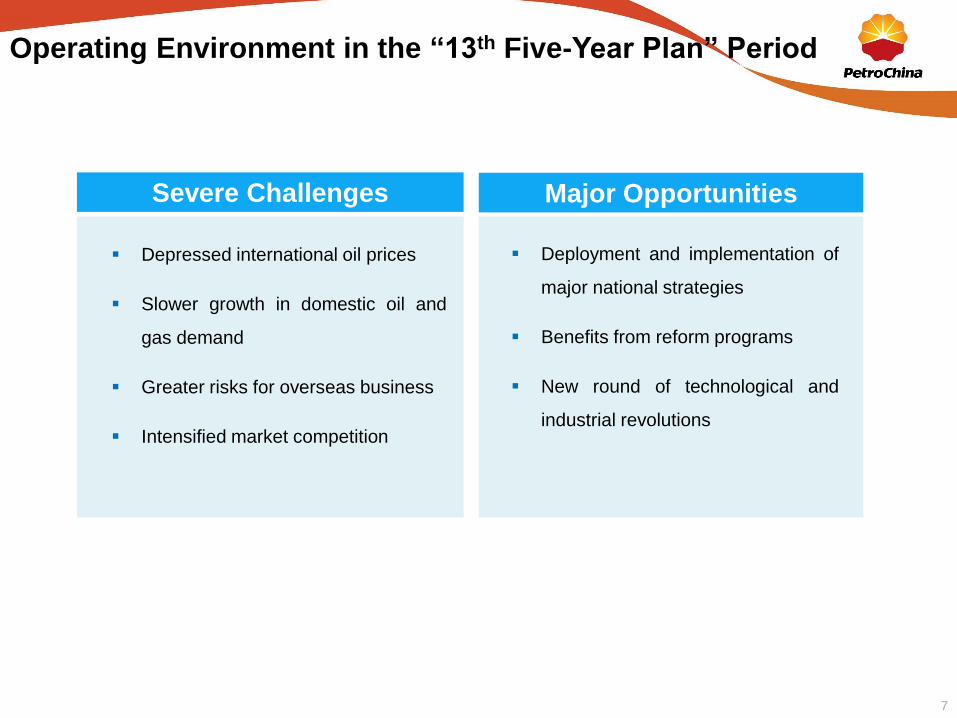
Operating Environment in the “13th Five-Year Plan” Period
Severe Challenges Major Opportunities
Depressed international oil prices
Slower growth in domestic oil and
gas demand
Greater risks for overseas business
Intensified market competition
Deployment and implementation of
major national strategies
Benefits from reform programs
New round of technological and
industrial revolutions

8
Guiding Principles for the Company’s Development
To develop the Company into a world-class international energy
enterprise — after five years of efforts, we plan to maintain our business
scale and strength at world-leading level, with operating results and
international competitiveness comparable to global oil majors
To strive for stable and healthy development — we will drive steady
growth and enhance the quality and profitability of our development, thereby
ensuring steady increases in production targets, continuous improvement of
operating results, effective risk control, a stable and harmonious development
environment, enhanced corporate image, and achieve a more stable,
healthier, and more sustainable development
To fully implement the “Four Strategies” — While implementing and
optimizing our three strategies of resources, market and internationalization,
we will also incorporate “innovation” into the Company’s overall strategy and
make it the key driver of our future growth.
9
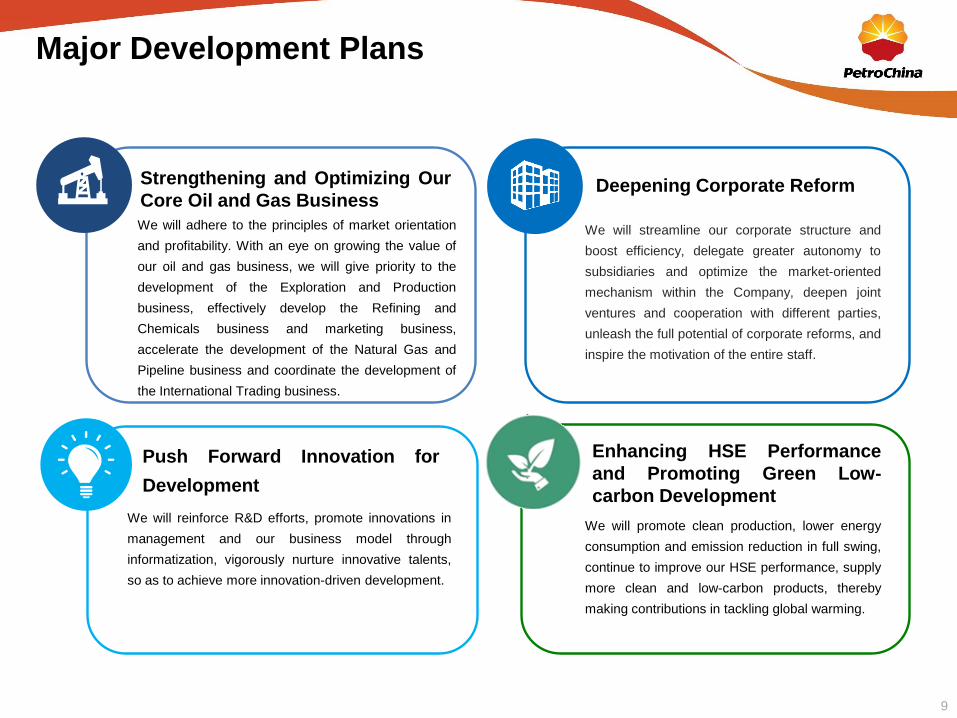
Major Development Plans
Push Forward Innovation for
Development
Strengthening and Optimizing Our
Core Oil and Gas BusinessDeepening Corporate Reform
Enhancing HSE Performance
and Promoting Green Low-
carbon Development
We will adhere to the principles of market orientation
and profitability. With an eye on growing the value of
our oil and gas business, we will give priority to the
development of the Exploration and Production
business, effectively develop the Refining and
Chemicals business and marketing business,
accelerate the development of the Natural Gas and
Pipeline business and coordinate the development of
the International Trading business.
We will streamline our corporate structure and
boost efficiency, delegate greater autonomy to
subsidiaries and optimize the market-oriented
mechanism within the Company, deepen joint
ventures and cooperation with different parties,
unleash the full potential of corporate reforms, and
inspire the motivation of the entire staff.
We will reinforce R&D efforts, promote innovations in
management and our business model through
informatization, vigorously nurture innovative talents,
so as to achieve more innovation-driven development.
We will promote clean production, lower energy
consumption and emission reduction in full swing,
continue to improve our HSE performance, supply
more clean and low-carbon products, thereby
making contributions in tackling global warming.

2015 Financial Results Review and Analysis
11
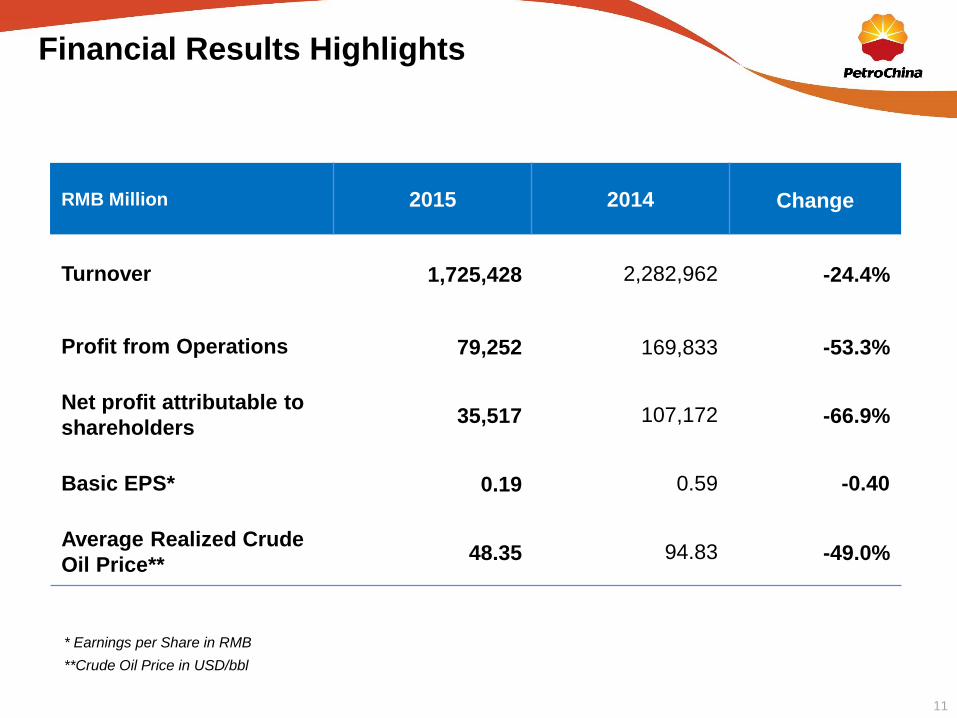
Financial Results Highlights
* Earnings per Share in RMB
**Crude Oil Price in USD/bbl
RMB Million 2015 2014 Change
Turnover 1,725,428 2,282,962 -24.4%
Profit from Operations 79,252 169,833 -53.3%
Net profit attributable to
shareholders35,517 107,172 -66.9%
Basic EPS* 0.19 0.59 -0.40
Average Realized Crude
Oil Price**48.35 94.83 -49.0%
12
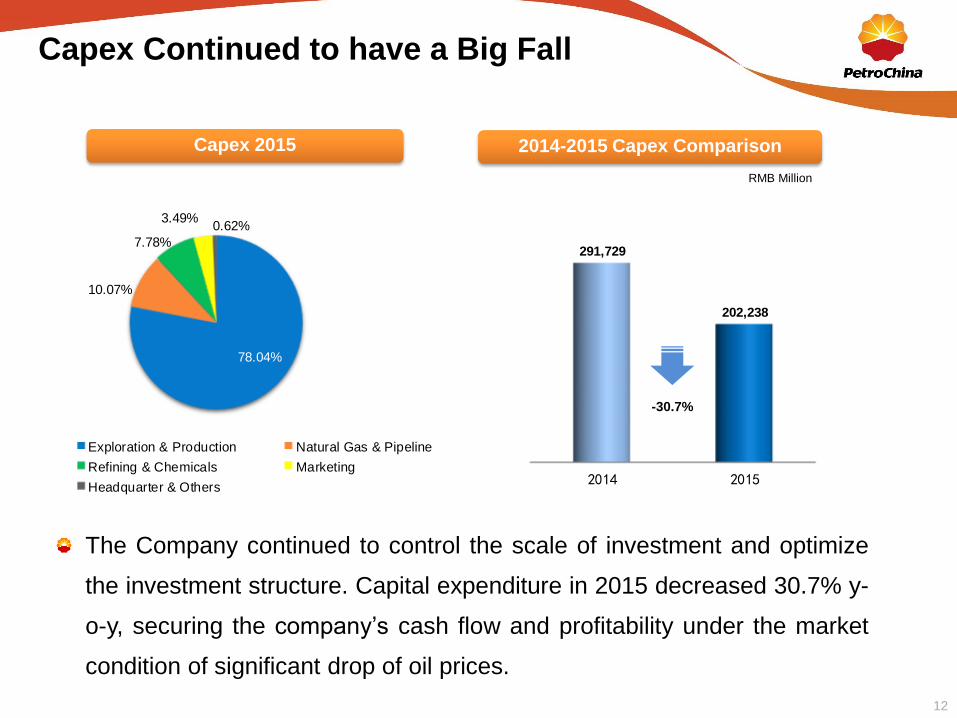
Capex Continued to have a Big Fall
Capex 2015 2014-2015 Capex Comparison
RMB Million
2014 2015
291,729
202,238
-30.7%
78.04%
10.07%
7.78%
3.49%0.62%
Exploration & Production Natural Gas & Pipeline
Refining & Chemicals Marketing
Headquarter & Others
The Company continued to control the scale of investment and optimize
the investment structure. Capital expenditure in 2015 decreased 30.7% y-
o-y, securing the company’s cash flow and profitability under the market
condition of significant drop of oil prices.

13
2014 2015
Effective Control over Major Costs
Depreciation, Depletion and Amortization Oil and Gas Lifting Cost
Exploration ExpenssesStaff Costs
2014 2015
2014 2015 2014 2015
-2.3%-16.7%
14.3%*
-5.7%
118,082120,822
RMB Million
22,064
18,380
177,463202,875
13.7512.98
*Grew 2.3% y-o-y in same cliber. Growth Rate declined 6.3 percentage
points y-o-y
RMB Million
RMB Million USD/bbl
14
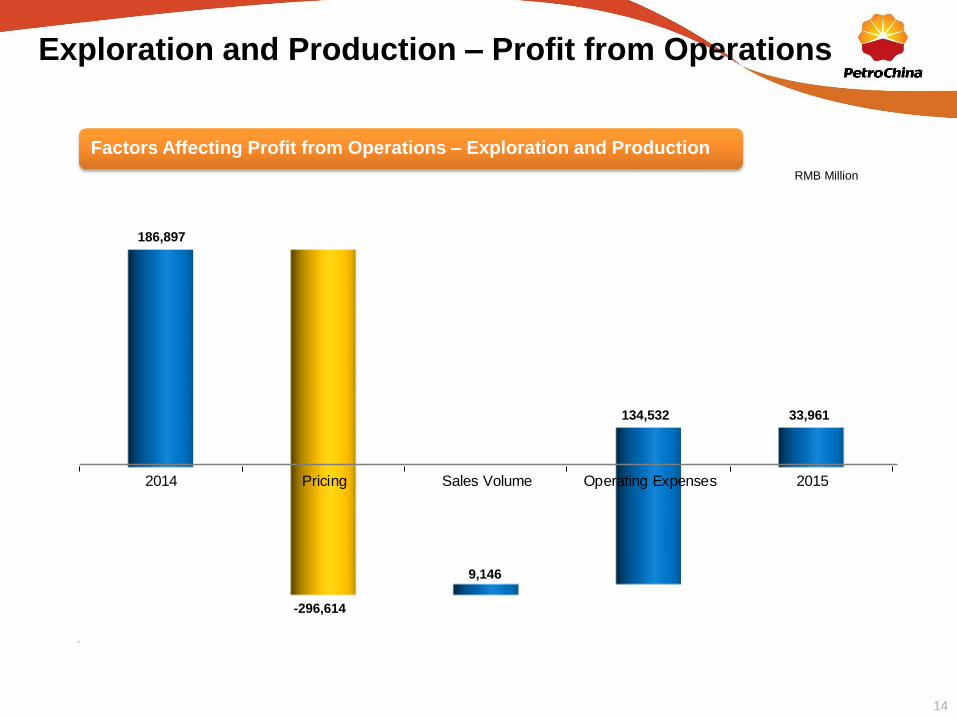
Exploration and Production – Profit from Operations
Factors Affecting Profit from Operations – Exploration and Production
RMB Million
2014 Pricing Sales Volume Operating Expenses 2015
33,961
186,897
-296,614
9,146
134,532

15
Refining
2014
Gross Profit Processed
Volume
Operating
Expenses
Refining
2015
Chemicals
2014
Pricing Sales
Volume
Operating
Expenses
Chemicals
2015
Refining and Chemicals – Profit from Operations
Factors Affecting Profit from Operations – Refining Factors Affecting Profit from Operations – Chemicals
-7,155
-16,405
4,690
193
13,878
-244 -1,789
-46,782
9,866
53,514
RMB Million

16
Marketing – Profit from Operations
RMB Million
Factors Affecting Profit from Operations – Marketing
2014 Gross Profit Sales Volume Operating Expenses &
Others
2015
-500
5,421
-6,651
2,333
-1,603

17
Natural Gas and Pipeline – Profit from Operations
Factors Affecting Profit from Operations – Natural Gas and Pipeline
RMB Million
13,126
51,231
-2,018
22,807
18,721
-1,405
Gross Profit
from Domestic
Gas and
Pipeline
Transmission
Gross Profit
from Imported
Gas
Integration of
Pipeline
Assets
Others 20152014

18
Overall Sound Financial Position
Free Cash Flow as of 31 Dec
RMB Million
2014 2015
2,405,473 2,393,844
RMB Million
Total Assets
-0.5%
2014 2015
49,926
43,562
-12.7%
2014 2015
45.2%43.9%
-1.3ppt
2014 2015
29.0% 28.7%
-0.3ppt
Debt-to-asset ratio Debt-to-capital ratio

19
2015 Dividend Distribution
RMB
2014-2015 Dividend Comparison
20152014
0.08733
2015 annual dividend policy
remains unchanged, with dividend
payout ratio at 45%
The Board of Directors has
resolved to pay a final dividend of
RMB 0.02486 per share
0.26351
2015 Operating Results & 2016 Business Outlook
21
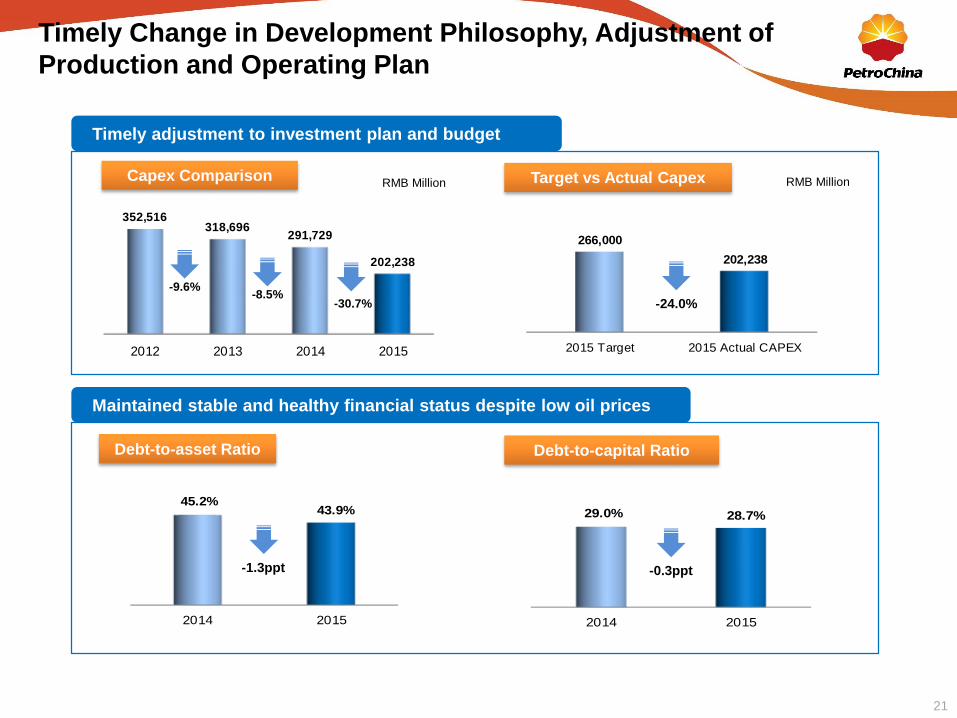
2015 Target 2015 Actual CAPEX
266,000
202,238
Capex Comparison
Timely adjustment to investment plan and budget
Target vs Actual Capex
-24.0%
Maintained stable and healthy financial status despite low oil prices
Debt-to-asset Ratio Debt-to-capital Ratio
2014 2015
45.2%43.9%
-1.3ppt
2014 2015
29.0% 28.7%
-0.3ppt
2012 2013 2014 2015
352,516318,696
291,729
202,238
-30.7%-8.5%
-9.6%
Timely Change in Development Philosophy, Adjustment of
Production and Operating Plan
RMB Million RMB Million
22
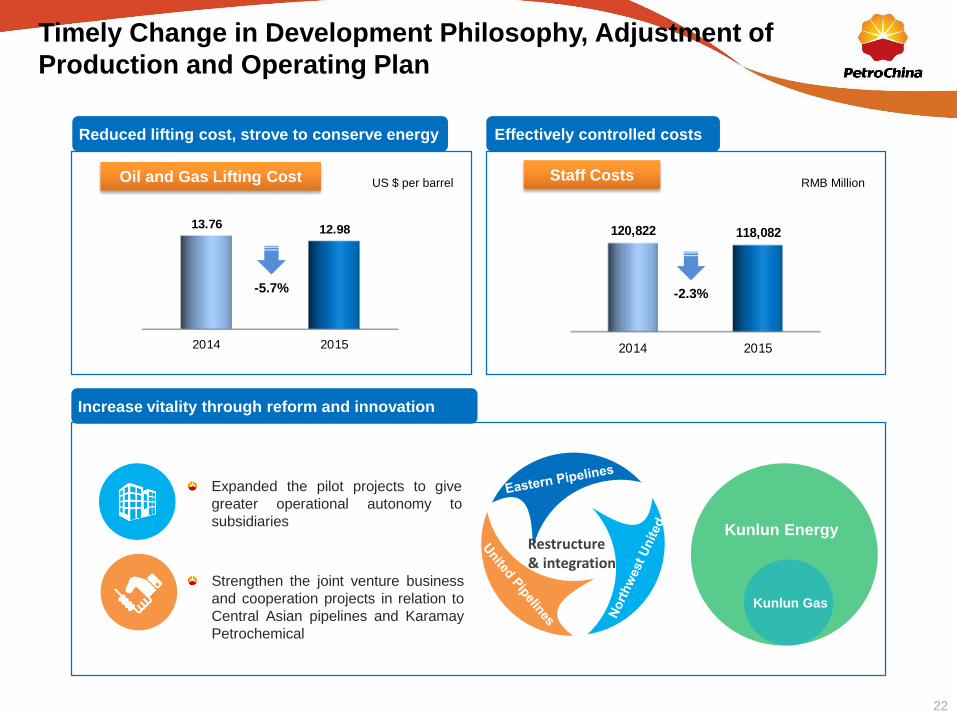
2014 2015
13.76 12.98
Oil and Gas Lifting Cost
Reduced lifting cost, strove to conserve energy
Increase vitality through reform and innovation
-5.7%
Staff Costs
Effectively controlled costs
2014 2015
120,822 118,082
-2.3%
Restructure & integration
Strengthen the joint venture business
and cooperation projects in relation to
Central Asian pipelines and Karamay
Petrochemical
Expanded the pilot projects to give
greater operational autonomy to
subsidiaries
Kunlun Gas
Kunlun Energy
US $ per barrel RMB Million
Timely Change in Development Philosophy, Adjustment of
Production and Operating Plan
23
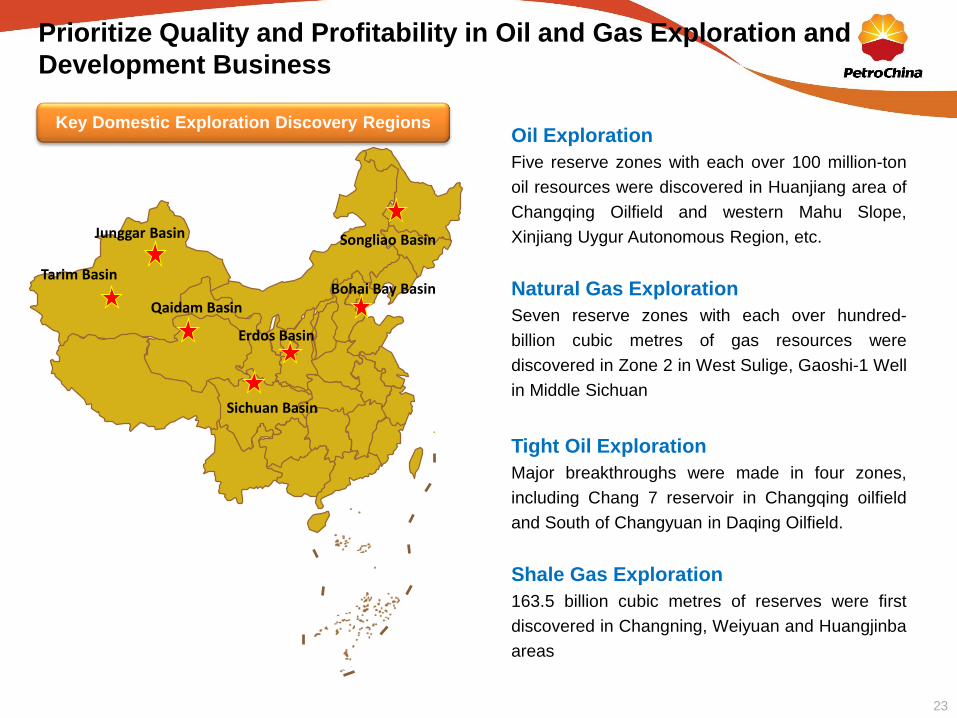
Prioritize Quality and Profitability in Oil and Gas Exploration and
Development Business
Key Domestic Exploration Discovery Regions
Junggar Basin
Sichuan Basin
Erdos Basin
Tarim Basin
Qaidam Basin
Songliao Basin
Bohai Bay Basin
Oil Exploration
Five reserve zones with each over 100 million-ton
oil resources were discovered in Huanjiang area of
Changqing Oilfield and western Mahu Slope,
Xinjiang Uygur Autonomous Region, etc.
Natural Gas Exploration
Seven reserve zones with each over hundred-
billion cubic metres of gas resources were
discovered in Zone 2 in West Sulige, Gaoshi-1 Well
in Middle Sichuan
Tight Oil Exploration
Major breakthroughs were made in four zones,
including Chang 7 reservoir in Changqing oilfield
and South of Changyuan in Daqing Oilfield.
Shale Gas Exploration
163.5 billion cubic metres of reserves were first
discovered in Changning, Weiyuan and Huangjinba
areas

24
Oil and Gas Output
2015 2014 Change
Oil and Gas Equivalent Output (MM boe) 1,493.9 1,450.4 +3.0%
Crude Output (MM bbl) 971.9 945.5 +2.8%
Domestic (MM bbl) 806.3 823.2 -2.1%
Overseas (MM bbl) 165.6 122.3 +35.4%
Average Realized Crude Price (USD/bbl) 48.35 94.83 -49.0%
Marketable Natural Gas Output (bcf) 3,131.0 3,028.8 +3.4%
Domestic (bcf) 2,903.6 2,879.3 +0.8%
Overseas (bcf) 227.4 149.5 +52.1%
Average Realized Natural Gas Price
(USD/’000 cubic feet)6.23 6.30 -1.1%
Domestic Average Realized Natural Gas Price
(USD/’000 cubic feet)6.67 6.49 +2.8%
Lifting Cost (USD/bbl) 12.98 13.76 -5.7%
Domestic (USD/bb) 14.26 14.51 -1.7%
Overseas (USD/bb) 5.77 7.05 -30.7%
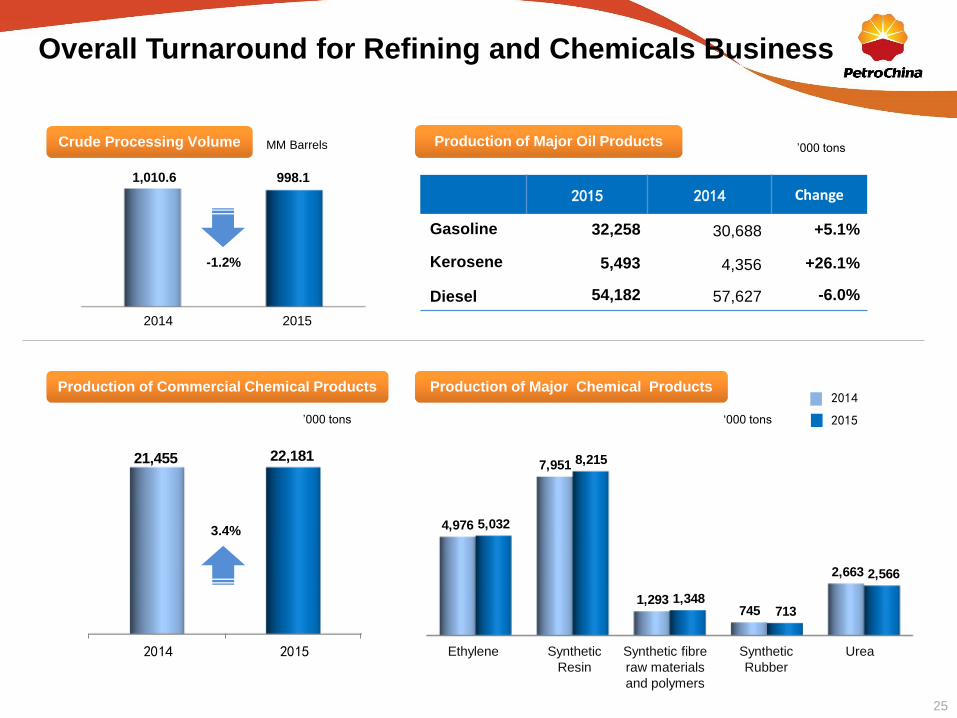
25
2014 2015
21,455 22,181
4,976
7,951
1,293 745
2,663
5,032
8,215
1,348 713
2,566
Overall Turnaround for Refining and Chemicals Business
Production of Major Oil ProductsCrude Processing Volume
2015 2014 Change
Gasoline 32,258 30,688 +5.1%
Kerosene 5,493 4,356 +26.1%
Diesel 54,182 57,627 -6.0%
Production of Commercial Chemical Products Production of Major Chemical Products
-1.2%
2014 2015
998.11,010.6
3.4%
2014
2015
MM Barrels ’000 tons
’000 tons ‘000 tons
Ethylene Synthetic
Resin
Synthetic fibre
raw materials
and polymers
Synthetic
Rubber
Urea
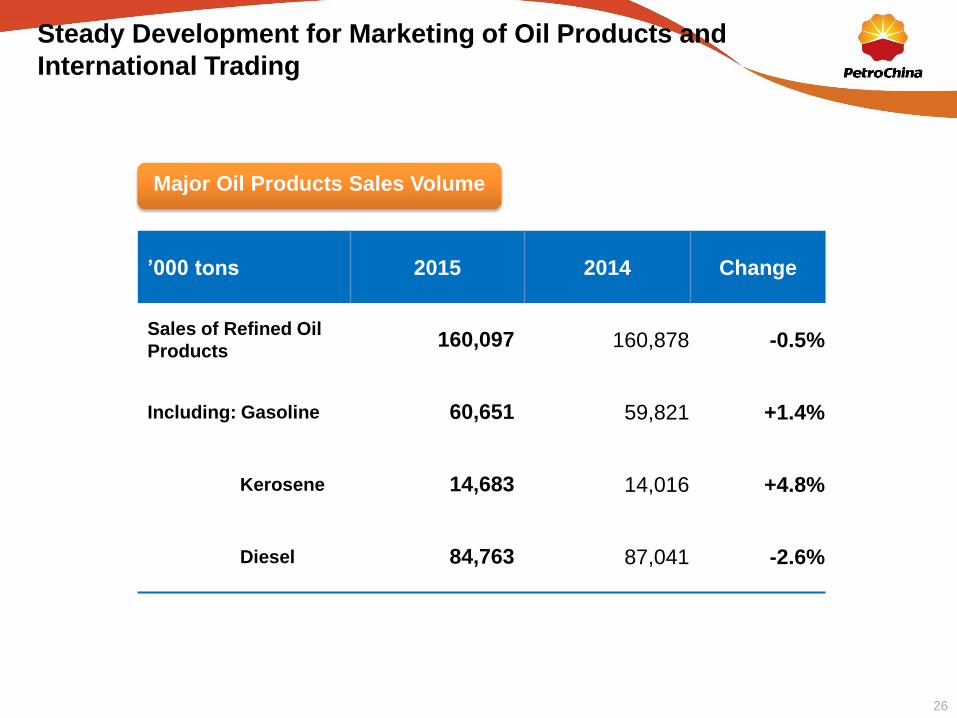
26
Steady Development for Marketing of Oil Products and
International Trading
Major Oil Products Sales Volume
’000 tons 2015 2014 Change
Sales of Refined Oil
Products160,097 160,878 -0.5%
Including: Gasoline 60,651 59,821 +1.4%
Kerosene 14,683 14,016 +4.8%
Diesel 84,763 87,041 -2.6%
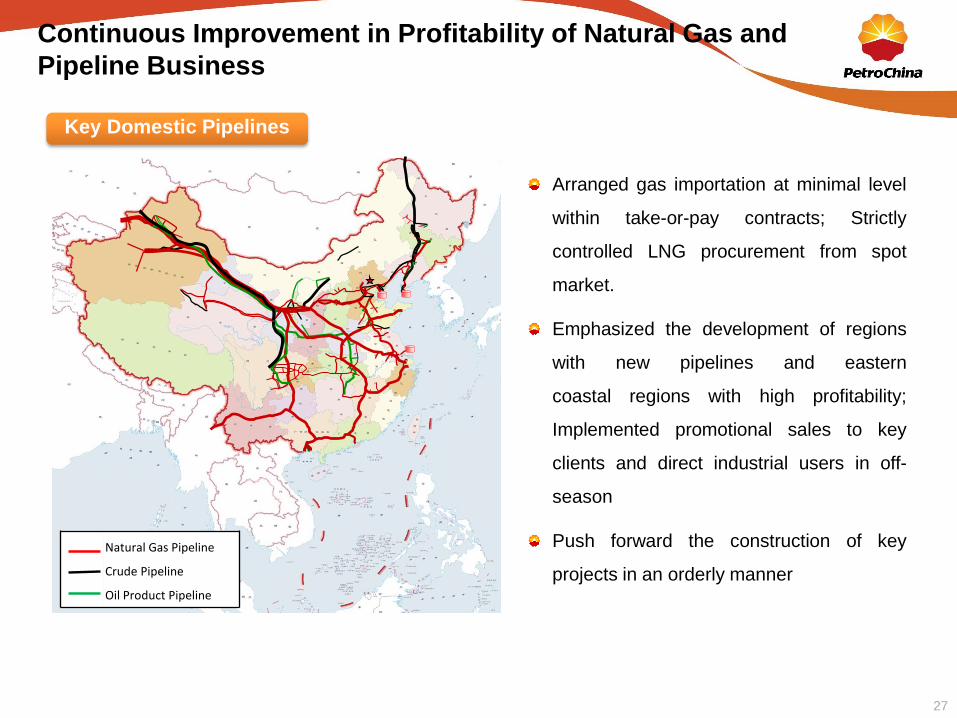
27
Continuous Improvement in Profitability of Natural Gas and
Pipeline Business
Arranged gas importation at minimal level
within take-or-pay contracts; Strictly
controlled LNG procurement from spot
market.
Emphasized the development of regions
with new pipelines and eastern
coastal regions with high profitability;
Implemented promotional sales to key
clients and direct industrial users in off-
season
Push forward the construction of key
projects in an orderly manner
Key Domestic Pipelines
Natural Gas Pipeline
Crude Pipeline
Oil Product Pipeline
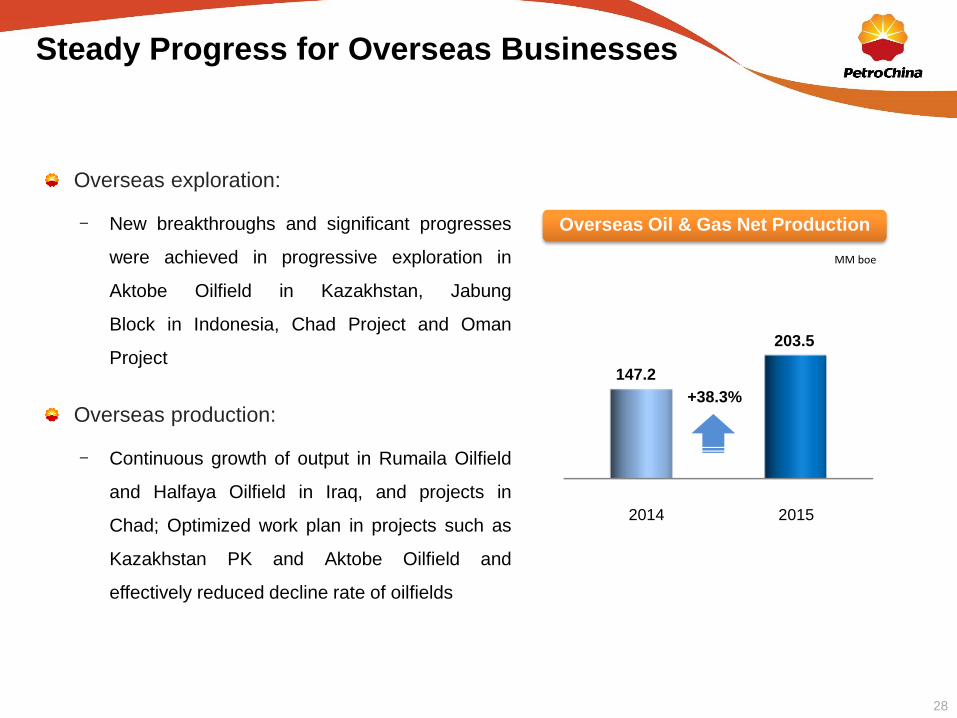
28
Steady Progress for Overseas Businesses
MM boe
2014 2015
+38.3%
147.2
Overseas exploration:
- New breakthroughs and significant progresses
were achieved in progressive exploration in
Aktobe Oilfield in Kazakhstan, Jabung
Block in Indonesia, Chad Project and Oman
Project
Overseas production:
- Continuous growth of output in Rumaila Oilfield
and Halfaya Oilfield in Iraq, and projects in
Chad; Optimized work plan in projects such as
Kazakhstan PK and Aktobe Oilfield and
effectively reduced decline rate of oilfields
Overseas Oil & Gas Net Production
203.5

29
Number of accidents and fatalities decreased by 57.1% and
54.5% year-on-year respectively
Energy consumption saving equivalent to1.04 million ton
standard coal
Reduced water consumption by 16.83 million cubic meters
Steadily Improved HSE Performance

30
Technological Innovation Fostering the Emergence of Strategic
New Businesses and New Growth Points
Exploration and
development of
tight oil
Quality upgrading
of oil products
Restructuring of
the chemicals
business
Technological
Innovation
Technological Innovation Achievements
Evaluation system of
global conventional
and unconventional
oil and gas resources
Four major achievements honored State
science and technology awards
Led the formulation of four sets of domestic
and international standards
3,266 patents applied;2,505 patents issued
Six patents awarded the China Patent
Excellence Award
Internet of Things
Platform
Online Sales Platform
• Significantly boost
the frontline
productivity
Broaden channels of customer
services, strengthen market
competitiveness
Exploration and
development of tight gas
Exploration and
development of
shale gas
Exploration and development
of deep-seated gas
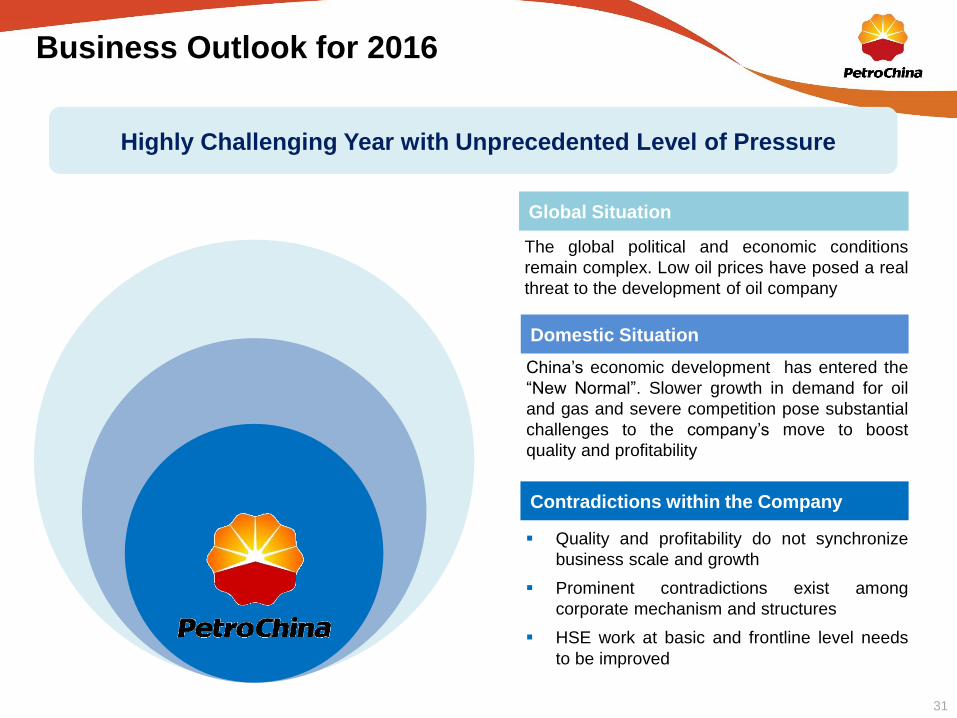
31
Business Outlook for 2016
Global Situation
Domestic Situation
Contradictions within the Company
The global political and economic conditions
remain complex. Low oil prices have posed a real
threat to the development of oil company
China’s economic development has entered the
“New Normal”. Slower growth in demand for oil
and gas and severe competition pose substantial
challenges to the company’s move to boost
quality and profitability
Quality and profitability do not synchronize
business scale and growth
Prominent contradictions exist among
corporate mechanism and structures
HSE work at basic and frontline level needs
to be improved
Highly Challenging Year with Unprecedented Level of Pressure
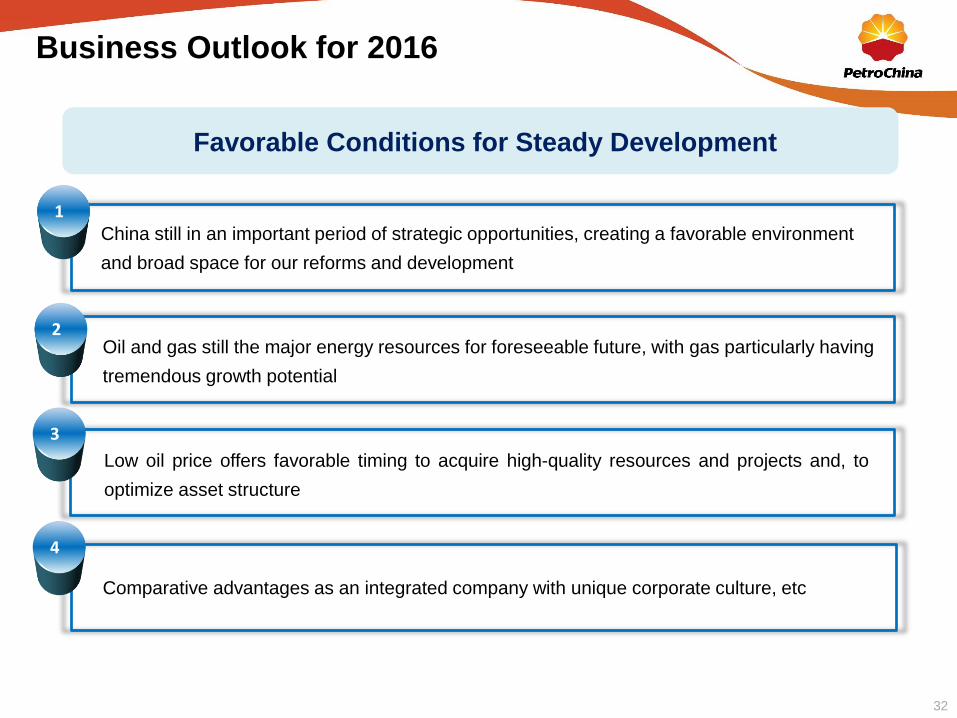
32
China still in an important period of strategic opportunities, creating a favorable environment
and broad space for our reforms and development
Oil and gas still the major energy resources for foreseeable future, with gas particularly having
tremendous growth potential
Comparative advantages as an integrated company with unique corporate culture, etc
Favorable Conditions for Steady Development
1
2
3
4
Low oil price offers favorable timing to acquire high-quality resources and projects and, to
optimize asset structure
Business Outlook for 2016
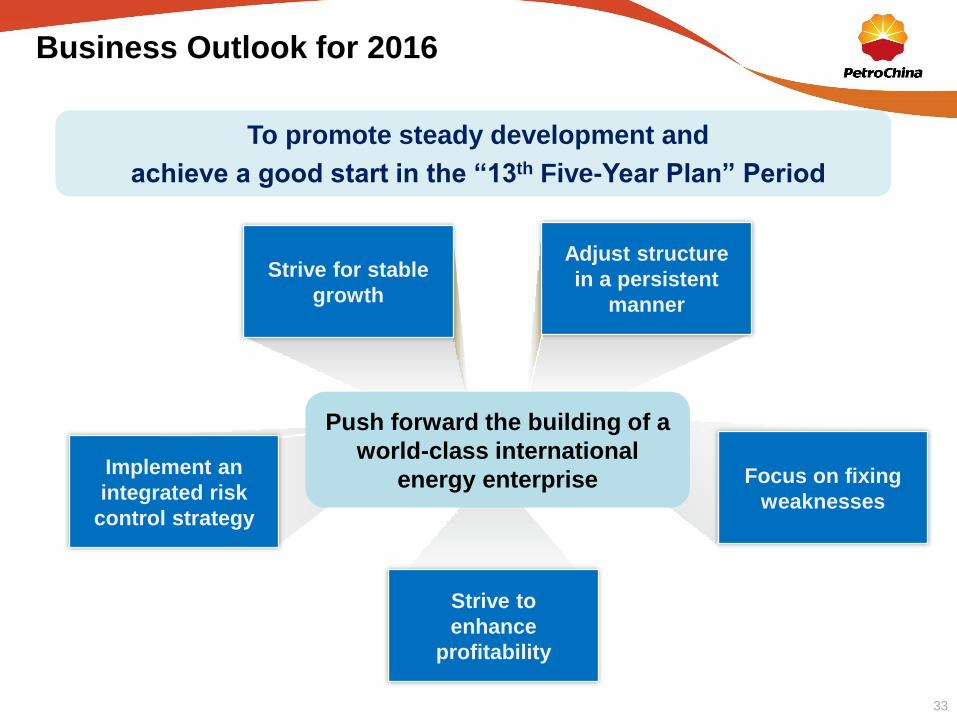
33
To promote steady development and
achieve a good start in the “13th Five-Year Plan” Period
Implement an
integrated risk
control strategy
Focus on fixing
weaknesses
Strive for stable
growth
Adjust structure
in a persistent
manner
Strive to
enhance
profitability
Push forward the building of a
world-class international
energy enterprise
Business Outlook for 2016
Investor Relations
Tel: (852)2899-2010
Fax: (852)2899-2390
Email: [email protected]
Media Relations
Tel: (852)2894-6315
Fax: (852)2576-1990
Email: [email protected]