2015-2016 budget presentation · 2015-2016 budget presentation ... open study hall time ......
TRANSCRIPT

2015-2016 Budget Presentation
Dr. John E. Bormann – Superintendent Mr. Nick Mackres – Business Administrator

The 2015-2016 Budget supports the “thorough and efficient” education of 309 students PK – 12
▪ 224 – Elementary School Students
▪ 64 – Other Districts – Regular Ed
▪ 14.5 – Other Districts – Special Ed
▪ 6.5– Private School – Special Ed
Note: Includes Tuition Students

The 2015-2016 Budget supports effective programming and high student performance through… Transition to the Next Generation Science Standards Maintenance of all academic, social/emotional programming
and the personnel to support such programming Continuation of implementation of a digital student
information and data analysis system Continuation of job-embedded professional development
opportunities for our staff to support student learning Continuation of enhancement of our early childhood education
program Implementation of phase 3 of our 3-year technology plan Continued maintenance of our facilities

The 2015-2016 Budget protects all of the programs that make growth in student performance possible… Accelerated Courses in ELA and Math in 6-8 Increased time in ELA and Math at all grade levels Gifted & Talented Student Identification and Opportunities in 3-8 Specialized Science Teacher in K-5 Best-Practices in Pre-School Education Accelerated Spanish Program in 6-8 World Cultures Program in K-2 1:1 Technology Initiative in 2-8 21st Century Digital Teaching , Learning, & Assessment Resources Exposure to all special area subjects at all grade levels- art, music, PE, health, technology, library, world language Flex periods for Intervention and Enrichment Character Education class periods with research-based programs- Stop & Think, Social Decision Making, Bar
Foundation, Bucket Filler, Lunch Bunch Responsive Classroom Morning Meetings Community Building programs- Buddy Activities & Community Service Comprehensive social and emotional supports for students Comprehensive Special Education programs with strong support systems Multi-media/Research Skills Instruction Professional Learning Team time built into teachers’ schedules Data Team time built into teachers’ schedules Open Study Hall time Before and After School Intervention & Extra Help
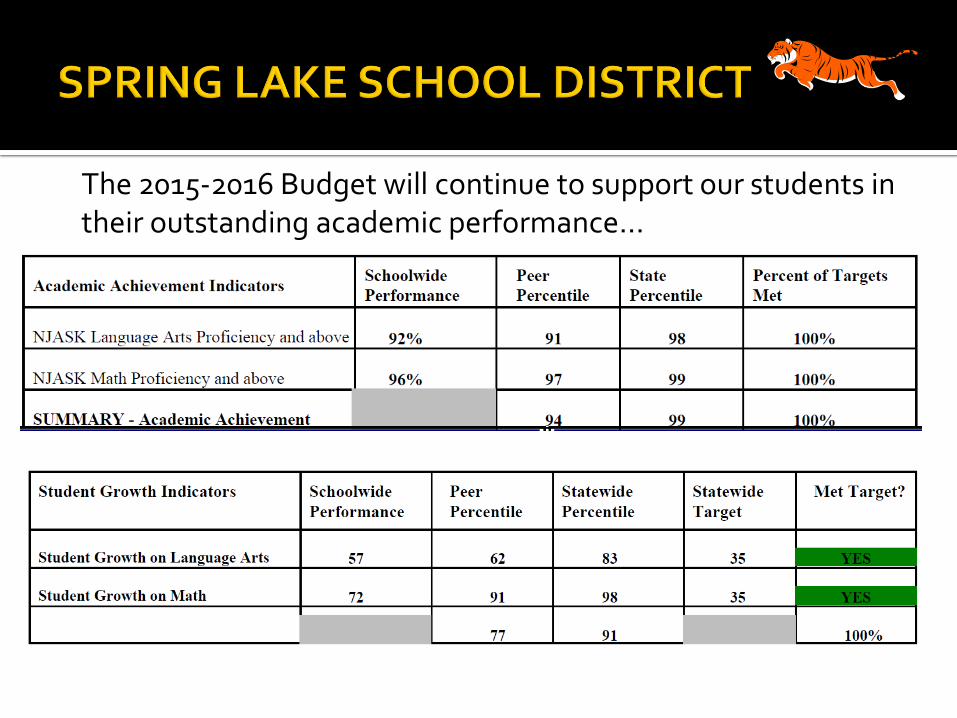
The 2015-2016 Budget will continue to support our students in their outstanding academic performance…

The 2015-2016 Budget will continue to support our staff in promoting students’ outstanding academic growth…
11-12
12-13
13-14

The 2015-2016 Budget will continue to support our students in their outstanding academic growth…
Area 2011-2012 2013-2104
English Language Arts 23% Peer Ranking 80% State Ranking
91% Peer Ranking 98% State Ranking
Mathematics 84% Peer Ranking 97% State Ranking
96% Peer Ranking 99% Peer Ranking
Absenteeism 13% Peer Ranking 87% State Ranking
55% Peer Ranking 92% State Ranking

The 2015-2016 Budget maximizes each dollar through shared services with… Spring Lake Department of Public Works
Spring Lake Police Department
Monmouth-Ocean Educational Services Commission
Middlesex Regional Educational Services (Purchasing)
A.C.T.
A.C.E.S. (Utilities)
E-Rate (Communications/Internet/I.T.)
Other Local Districts - Cooperative purchasing, Shared Professional Development, Transportation, & Gifted and Talented Programs
Monmouth County – joint advertising
NJSBAIG/MOCSSIF – Insurance

The 2015-2016 Budget maximizes each dollar through collaborative efforts with… Parent- Teacher Association Spring Lake Educational Foundation Booster Club …including…
▪ Professional development ▪ Class trips ▪ Extra-curricular activities ▪ Assemblies ▪ Curricular enhancements ▪ Technology ▪ Facility maintenance and improvements

County
17%
Municipalities
24% Schools
59%
School
28%
Municipal
32%
County
40%
Spring Lake Property Taxes
2014 Distribution
Monmouth County Total
General Taxes 2014

2014 School Tax Rates by Municipality (Operating District):
Roosevelt Boro 1.941
Millstone Twp 1.923
Upper Freehold Twp 1.747
Howell Twp 1.745
Hazlet Twp 1.701
Aberdeen Twp 1.691
Allentown Boro 1.690
Wall Twp 1.666
Matawan Boro 1.632
Freehold Twp 1.631
Marlboro Twp 1.449
Neptune City Boro 1.413
Union Beach Boro 1.412
Ocean Twp 1.408
Manalapan Twp 1.381
Keyport Boro 1.363
Holmdel Twp 1.363
Middletown Twp 1.357
Atlantic Highlands Boro 1.347
Farmingdale Boro 1.325
Little Silver Boro 1.316
Loch Arbour Village 1.303
West Long Branch Boro 1.294
Shrewsbury Boro 1.283
Neptune Twp 1.259
Fair Haven Boro 1.252
Freehold Boro 1.244
Tinton Falls Boro 1.238
Highlands Boro 1.208
Englishtown Boro 1.184
Oceanport Boro 1.158
Eatontown Boro 1.156
Colts Neck Twp 1.152
Shrewsbury Twp 1.146
Red Bank Boro 1.079
Keansburg Boro 0.959
Manasquan Boro 0.873
Long Branch City 0.870
Brielle Boro 0.867
Rumson Boro 0.820
Belmar Boro 0.787
Sea Bright Boro 0.708
Spring Lake Heights Boro 0.686
Monmouth Beach Boro 0.644
Asbury Park City 0.573
Bradley Beach Boro 0.510
Avon By The Sea Boro 0.372
Interlaken Boro 0.368
Sea Girt Boro 0.211
Spring Lake Boro 0.181
Deal Boro 0.108
Note: 2nd lowest out of 53 townships, with operating school district from County Abstract of Ratables

Comparison General Tax Rate 2014
Per $100,000 of Assessed Value
SCHOOL TAX RATE
SCHOOL TAXES
TOTAL TAX RATE
TOTAL TAXES
SPRING LAKE .181 $181 0.686 $686
SEA GIRT .211 $211 0.789 $789
AVON .372 $372 1.069 $1,069
SPRING LAKE HEIGHTS .686 $686 1.343 $1,343
LAKE COMO .781 $781 1.700 $1,700
BELMAR .787 $787 1.935 $1,935
BRIELLE .867 $867 1.558 $1,558
MANASQUAN .873 $873 1.659 $1,659
WALL TWP 1.666 $1,666 2.825 $2,825
2014 Tax Rates Comparison:
Note: Based on general tax rates, not equalized value from County Abstract of Ratables

Local Tax Levy History:
LOCAL TAXES
Name 2007 - 08 2008 - 09 2009 - 10 2010 - 11 2011 - 12 2012 - 13 2013 - 14 2014 - 15 2015 - 16
Total School Tax* $6,475,010 $6,468,535 $5,956,825 $6,097,605 $6,036,207 $6,036,462 $6,080,639 $6,211,100 $6,388,856
$ Increase over PY ($6,475) ($511,710) $140,780 ($61,398) $255 $44,177 $130,461 $177,756
% Increase over PY -0.10% -7.91% 2.36% -1.01% 0.00% 0.73% 2.15% 2.86%
Tax Rate per $100** $0.1925 $0.1772 $0.1812 $0.1783 $0.1777 $0.1789 $0.1827 $0.1849
* Includes Debt Service ** Without Equalization
Banked Cap:
• Expiring: $116,207
• Remaining for future budgets: $82,819
Note: Used historical info from previous BA
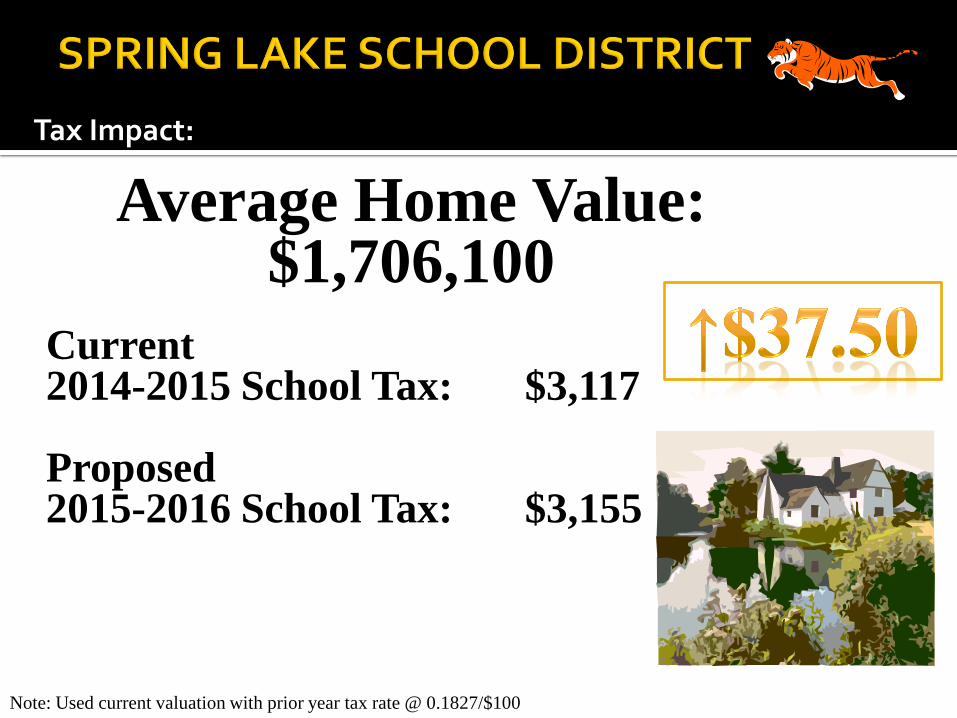
Average Home Value: $1,706,100
Current 2014-2015 School Tax: $3,117 Proposed 2015-2016 School Tax: $3,155
Tax Impact:
Note: Used current valuation with prior year tax rate @ 0.1827/$100

Revenues:
85%
7%
4% 3% 1%
Revenues: $7,490,221
Local Tax Levy
Reserves
State Aid
Grants
Misc./Tuition

State Aid:
$(50,000)
$-
$50,000
$100,000
$150,000
$200,000
$250,000
$300,000
$350,000
2009 - 2010 2010 - 2011 2011 - 2012 2012 - 2013 2013-2014 2014-2015 2015-2016
State Aid
Transportaion Aid Special Education Aid Security Aid
Adjustment Aid PARCC Readiness Per Pupil Growth
Prior Year Adjust - Non-Public
Note: Total losses since SY210/11 is $1,189,106
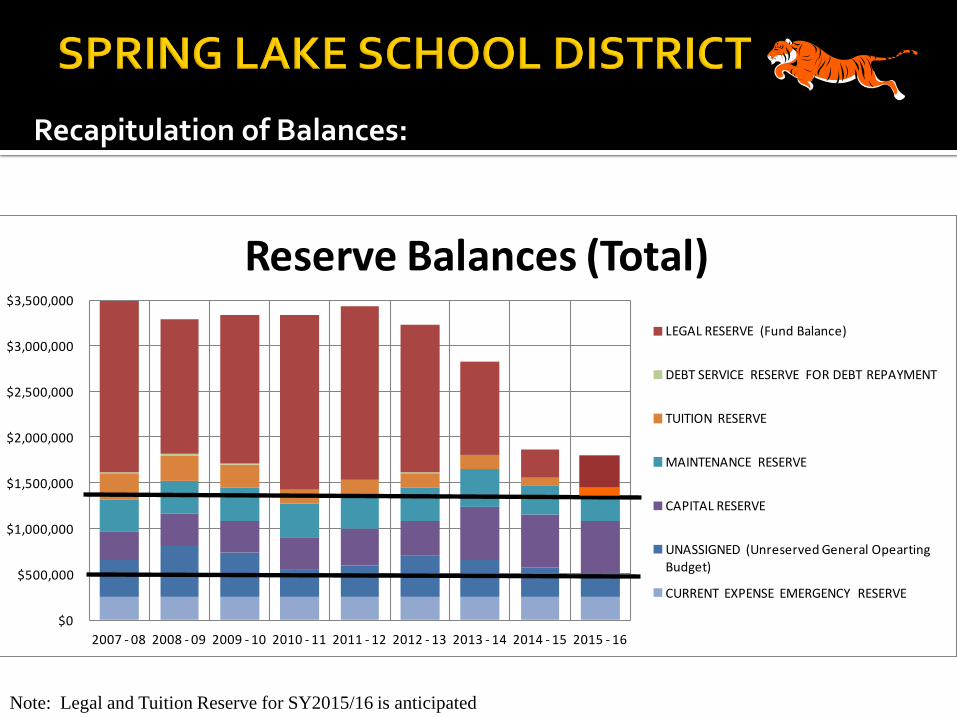
Recapitulation of Balances:
$0
$500,000
$1,000,000
$1,500,000
$2,000,000
$2,500,000
$3,000,000
$3,500,000
2007 - 08 2008 - 09 2009 - 10 2010 - 11 2011 - 12 2012 - 13 2013 - 14 2014 - 15 2015 - 16
Reserve Balances (Total)
LEGAL RESERVE (Fund Balance)
DEBT SERVICE RESERVE FOR DEBT REPAYMENT
TUITION RESERVE
MAINTENANCE RESERVE
CAPITAL RESERVE
UNASSIGNED (Unreserved General Opearting Budget)
CURRENT EXPENSE EMERGENCY RESERVE
Note: Legal and Tuition Reserve for SY2015/16 is anticipated

Expenses:
44%
10%
20%
5%
1%
1%
1%
3%
15%
Expenses: $7,490,221Salaries
Benefits
Tuition
Transportation
Insurance
Utilities
Capital Outlay
Debt
Misc Instruction
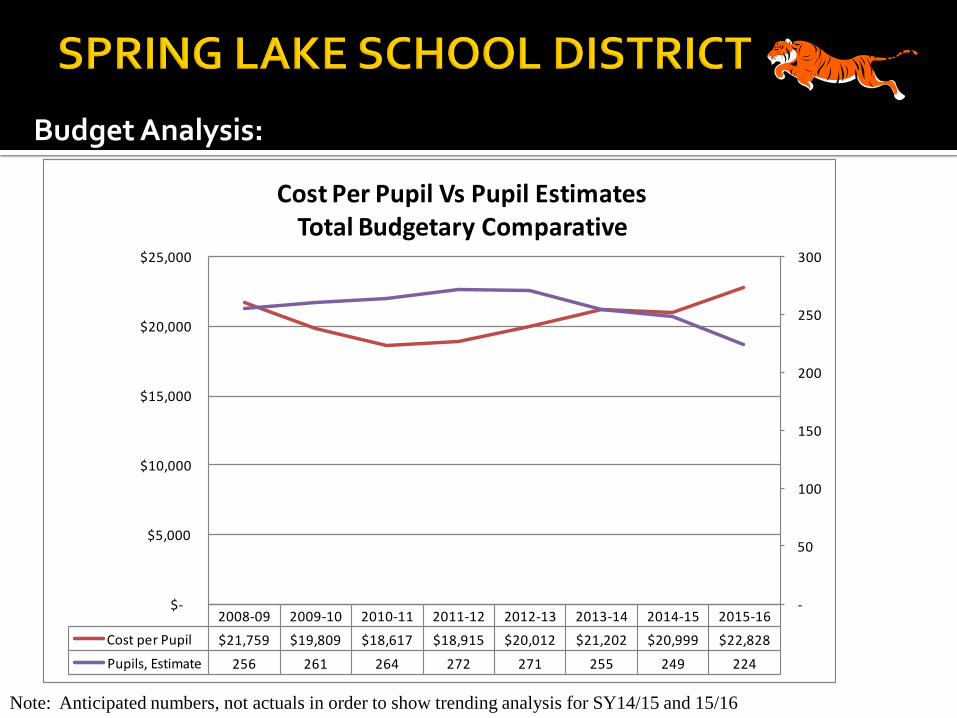
Budget Analysis:
2008-09 2009-10 2010-11 2011-12 2012-13 2013-14 2014-15 2015-16
Cost per Pupil $21,759 $19,809 $18,617 $18,915 $20,012 $21,202 $20,999 $22,828
Pupils, Estimate 256 261 264 272 271 255 249 224
-
50
100
150
200
250
300
$-
$5,000
$10,000
$15,000
$20,000
$25,000
Cost Per Pupil Vs Pupil EstimatesTotal Budgetary Comparative
Note: Anticipated numbers, not actuals in order to show trending analysis for SY14/15 and 15/16
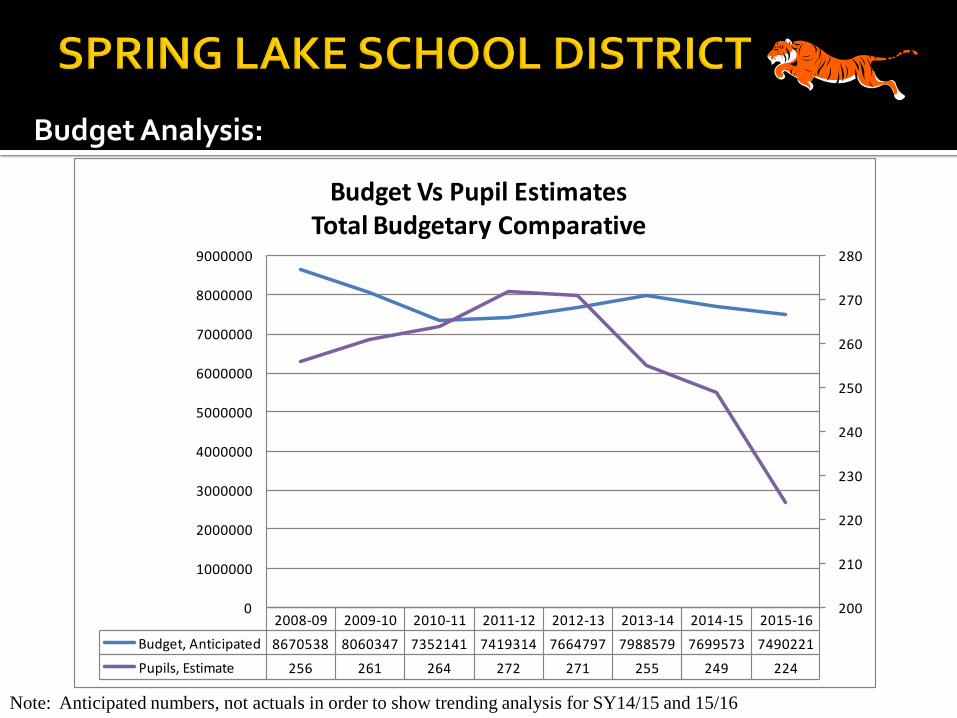
Budget Analysis:
2008-09 2009-10 2010-11 2011-12 2012-13 2013-14 2014-15 2015-16
Budget, Anticipated 8670538 8060347 7352141 7419314 7664797 7988579 7699573 7490221
Pupils, Estimate 256 261 264 272 271 255 249 224
200
210
220
230
240
250
260
270
280
0
1000000
2000000
3000000
4000000
5000000
6000000
7000000
8000000
9000000
Budget Vs Pupil EstimatesTotal Budgetary Comparative
Note: Anticipated numbers, not actuals in order to show trending analysis for SY14/15 and 15/16

Thank you for supporting TEAM MOUNTZ…
“Achieving Excellence Together!”