2015-16 fresh prescription final report
TRANSCRIPT

The Ecology Center
Fresh Prescription Program Final Evaluation Report
April 2016
Email: [email protected] Phone: 734-615-3367
1080 S. University Ave. Ann Arbor, MI 48109
http://ssw.umich.edu/research/curtis-center/program-evaluation

2
Curtis Center Program Evaluation Group
The Curtis Center Program Evaluation Group trains and professionally prepares students and recent social work graduates in program evaluation by providing evaluation services to a broad range of community-based agencies. Established in September 2011, the Curtis Center Program Evaluation Group at the University of Michigan School of Social Work engages the community to provide professional evaluation services and matches students’ educational goals with projects. Employing a utilization-focused approach to evaluation, the Program Evaluation Group provides high-quality, professional evaluation services through a social work lens.
Program Evaluation Staff
Sue Ann Savas, MSW Principle Investigator Sarah J. Lewis-Crow, MSW Lead Evaluator Meredith Philyaw, MS Evaluator Chad Jobin, LLMSW Evaluator Abigail Anderson Evaluation Assistant Alexandra Albers Evaluation Assistant Courtney Coleman Evaluation Assistant Savannah O’Neil Evaluation Assistant
Fresh Prescription Program Final Evaluation Report
3
Executive Summary
The Fresh Prescription program, first implemented at Community Health and Social Services (CHASS) in 2013, is a community-based fruit and vegetable prescription program that bridges the gap between the food and health care systems in Detroit, Michigan. Participants in the Fresh Prescription program receive a “prescription to eat more fresh fruits and vegetables” from their health care provider, and receive program dollars to spend at participating local farmers’ markets or through a food share program. Participants also engage in nutrition education throughout the Fresh Prescription program, learning how to eat a healthy diet, how to select, prepare, and store fresh fruits and vegetables, and how to find fresh fruits and vegetables in their local communities.
Five unique sites participated in Fresh Prescription during the 2015-16 season: (1) American Indian Health and Family Services (AIHFS), (2) Community Health and Social Services (CHASS), (3) Henry Ford Health System (HFHS), (4) Joy-Southfield Community Development Corporation, and (5) Mercy Primary Care Center. Each site tailored the fundamental Fresh Prescription model to meet the needs of the specific communities that they serve. Together, these five sites formed the Fresh Prescription Network – in partnership with Eastern Market and with the leadership of the Ecology Center – meeting regularly to collaborate and discuss the progress of the program overall.
This report presents the findings of a process and outcome evaluation project completed by the University of Michigan School of Social Work Curtis Center Program Evaluation Group. This report also presents findings on the experiences of local vendors participating in the Fresh Prescription program, and the benefits of the Fresh Prescription Network on both the site and program levels. The report includes both quantitative and qualitative data, collected from program participants, program staff, health care providers, and local vendors.
Fresh Prescription Program Implementation
An estimated 311 program participants took part in the 2015-16 Fresh Prescription season, which started in July 2015 and continued into early 2016. The Fresh Prescription program reached a total of 1,000 individuals, including 369 children. Low-income women of color who reported high rates of food insecurity and limited access to fresh fruits and vegetables were the program’s primary service recipients. 81% of all Fresh Prescription participants consumed two cups or less of fruit and vegetables each day at the start of the program, which is less than the United States Department of Agriculture’s recommended daily value of two cup-equivalents of fruit and two and a half cup-equivalents of vegetables.
Overall, participants, program staff, and providers reported that the 2015-16 Fresh Prescription season was a success. Program participants spent over $8,600 on fresh fruits and vegetables, which accounts for about 91% of the “prescribed” produce made available through the Fresh Prescription program. Program dollars spent by program participants supported local food vendors.
Key factors that reportedly facilitated program success included the financial accessibility of the Fresh Prescription program, engaging site atmospheres, convenient schedules, and the buy-in of program staff and health care providers. Nonetheless, the season was not without its challenges. Key

4
barriers to program implementation included participants’ limited access to reliable transportation, difficulty in meeting the sites’ goals for referrals, market timing, and the pressure of limited funding.
Fresh Prescription Program Outcomes
Despite the unique characteristics of the five 2015-16 Fresh Prescription sites, largely similar outcomes emerged across the different organizations. Key program outcomes include:
Participant Outcomes
Positive outcomes among participants include increased access to fresh food, changes in knowledge and attitudes, positive behavior changes, and positive changes in health. Overall, participants also reported a high level of satisfaction with the Fresh Prescription program.
Fresh Food Access
• There was a statistically significant change in the frequency of participants shopping at farmers’ markets or farm stands from the start of the program to the end.
• While 23% of participants identified themselves as food secure at the start of the program, about 32% identified as food secure at the end of the program.
• Participants’ perceived ability to find the fresh fruits and vegetables they were looking for in their community rose from 65% at the beginning of the Fresh Prescription program to 80% at the end of the program.
Knowledge & Attitude Changes
• 88% of participants reported an increase in their knowledge about the importance of eating fruits and vegetables.
• There was evidence that, by the end of the program, Fresh Prescription participants who believed in the importance of eating more fruits and vegetables also reported positive changes in their self-reported health status.
• Statistics suggest that participants who reported a high level of confidence in their ability to eat more fruits and vegetables also reported a change in vegetable intake over the course of the program.
• There was also evidence that, by the end of the program, participants who were confident in their ability to eat more fruits and vegetables also reported an increase in the amount of fruits and vegetables eaten each day.
• There was a statistically significant change in knowledge regarding how to prepare and cook fresh fruits and vegetables from the start of the program to the end of the program.
• There was a statistically significant change in knowledge regarding how to store fresh fruits and vegetables to increase their shelf life from the start to the end of the program.
• There was a statistically significant change in participants’ perceived ability to count on the people around them for support in eating more fresh fruits and vegetables from the start of the program to the end of the program.

Fresh Prescription Program Final Evaluation Report
5
Behavior Changes
• There was a statistically significant change in both participants’ daily fruit consumption and participants’ daily vegetable consumption from the start of the program to the end. Specifically, the data shows that the percentage of participants eating 0-1 cups of fresh fruits dropped from 53% to 34% while the percentage of participants eating 0-1 cups of fresh vegetables dropped from 53% to 37% from the start of the program to the end of the program. Meanwhile, the percentages of participants eating 1-2, 2-3, or 3+ cups of fruit and vegetables all increased over the course of the Fresh Prescription program.
• 80% of participants report cooking with fruits and vegetables that they did not cook before. • 81% of participants reported trying new fruits and vegetables that they had not eaten before. • 82% of participants reported buying new fruits and vegetables that they did not buy before. • 82% of participants reported an increase in knowledge about where to buy fresh fruits and
vegetables. • 88% of Fresh Prescription participants reported an increase in the amount of fresh fruits and
vegetables that they eat each day. • 87% of Fresh Prescription participants reported an increase in the amount of fresh fruits and
vegetables that their families eat each day.
53%
34%
28%
33%
14%
26%
5%8%
53%
37%
28%
38%
10%9%
13%
0-1 Cups 0-1 Cups
1-2 Cups
2-3 Cups
3+ Cups 3+ Cups
2-3 Cups
1-2 Cups
Changes in Fresh Prescription participants’ vegetable consumption
Changes in Fresh Prescription participants’ fruit consumption

6
• Statistics suggest that Fresh Prescription participants with high attendance rates also reported an increase in participants eating fruits and vegetables by the end of the program.
• There was a statistically significant change in the number of times that Fresh Prescription participants ate unhealthy foods each day; the average number of times that participants ate unhealthy foods decreased from an average of 2.09 times per day at the start of the Fresh Prescription program to just 1.62 times per day at the end of the program.
Changes in Health
• The percentage of participants who identified themselves as in “poor” health decreased from 12% of participants to 5% of participants from the start to the end of the program.
• The percentage of participants who identified themselves as in “fair” health stayed steady at 43% of participants from the start of the participants to the end of the program.
• The percentage of participants who identified themselves as in “good,” “very good,” or “excellent” health increased from 46% of participants to 53% of participants from the start of the program to the end of the program.
• Evidence suggests that participants who reported an increase in fruit consumption (number of cups eaten each day) also reported a change in self-reported health status.
• There was also evidence to suggest that participants who frequently shopped at farmers’ markets or farm stands also reported a change in self-reported health status by the end of the Fresh Prescription program.
• There was a statistically significant change in participants’ A1C levels at CHASS and Mercy Primary Care Center (N=69); the average A1C level among participants at the start of the program was 9.3, and the average A1C level at the end of the program was 8.5.
• 90% of participants report that they are able to manage their health conditions better.
Participant Satisfaction
• 95% of participants reported being “somewhat satisfied” or “very satisfied” with their participation in the Fresh Prescription program.
• 85% of participants report that they would continue shopping at the Fresh Prescription sites, even if they did not have Fresh Prescription program dollars.
• 97% of participants would recommend the program to a friend or relative.
Provider Outcomes
Health care providers at the Fresh Prescription sites noted subtle, yet meaningful changes in clinical interactions. In interviews with Curtis Center evaluators, providers noted that by bridging the food and health care systems, the Fresh Prescription program helped participants to see “food as medicine.” Participation in the program also helps participants to see healthy eating as a way of preventing health problems later in life. Furthermore, providers noted a slight increase in participants’ motivation and involvement in their own health. Through involvement in the Fresh Prescription program, participants seemed to be empowered to improve their own health.
Fresh Prescription Program Final Evaluation Report
7
Organization Outcomes
Participation in the Fresh Prescription program helped organizations to expand their constituencies and engage with health education and food access in an innovative, holistic way. Program staff at the five Fresh Prescription sites also talked about how their participation in the Fresh Prescription program had helped their organizations form partnerships with other agencies and local vendors.
Vendor Outcomes
Local vendors participating in the 2015-16 Fresh Prescription season reported a high level of satisfaction and engagement with program participants. Key findings include:
• 75% of vendors participated in the Fresh Prescription program for the first time this year. • Overall, vendors were content with the onboarding process, but expressed some uncertainty
about expectations for the first market day and their ability to answer participants’ questions. • 92% of vendors reported talking to participants about fresh food and healthy eating. • 100% of vendors reported developing new relationships with program staff and 85%
reported developing new relationships with customers and health educators. • 70% of vendors reported strengthening existing relationships with Fresh Prescription
program staff and 60% reported enhancing existing relationships with other vendors. • 57% of vendors reported an increase in revenue at farmers’ markets which offered the Fresh
Prescription program during the 2015-16 season.
Feedback on the Fresh Prescription Network
Participation in the Fresh Prescription Network was beneficial both for individual sites and for the Fresh Prescription program overall. Individual sites benefitted from the peer support and shared resources of the Fresh Prescription Network. On the program level, the existence of the Fresh Prescription Network allowed members to share ideas, facilitated connections among organizations, and created the opportunity for collaborative and centralized fundraising efforts.

8
Table of Contents
Curtis Center Program Evaluation Group ..................................................................................................... 2
Program Evaluation Staff ................................................................................................................................. 2
Executive Summary ........................................................................................................................................... 3
Table of Contents .............................................................................................................................................. 8
Purpose of the Report ..................................................................................................................................... 10
Background ....................................................................................................................................................... 12
Methodology ..................................................................................................................................................... 14
Data Collection ............................................................................................................................................ 14
Data Collection Limitations ....................................................................................................................... 17
Data Analysis ................................................................................................................................................ 19
Fundamental Fresh Prescription Model & Timeline .............................................................................. 20
Results ................................................................................................................................................................ 21
Prescription Utilization ............................................................................................................................... 21
Participant Outcomes.................................................................................................................................. 23
Number of People Reached by the Fresh Prescription Program ..................................................... 23
Participant Demographics ...................................................................................................................... 23
Participant Fresh Food Access .............................................................................................................. 26
Knowledge & Attitude Changes............................................................................................................ 29
Behavior Changes .................................................................................................................................... 33
Changes in Health ................................................................................................................................... 39
Participant Satisfaction ........................................................................................................................... 42
Provider Outcomes ..................................................................................................................................... 45
Organization Outcomes ............................................................................................................................. 47
2015-16 Fresh Prescription Implementation ........................................................................................... 49
Feedback on the Fresh Prescription Network ........................................................................................ 53
Vendor & Food System Outcomes........................................................................................................... 55
Considerations for Next Steps ....................................................................................................................... 64

Fresh Prescription Program Final Evaluation Report
9
Appendices........................................................................................................................................................ 68
Appendix I: Logic Models & Site Snapshots ............................................................................................... 68
Site Snapshot: American Indian Health & Family Services ................................................................ 69
Site Snapshot: Community Health & Social Services (CHASS) ......................................................... 72
Site Snapshot: Henry Ford Health System ............................................................................................ 76
Site Snapshot: Joy-Southfield Community Development Corporation ............................................ 80
Site Snapshot: Mercy Primary Care Center ........................................................................................... 84
Appendix II: AIHFS Survey Results ............................................................................................................. 87
Appendix III: Site-by-Site Breakdown of Survey Results .......................................................................... 93

10
Purpose of the Report
The Curtis Center Program Evaluation Group prepared the following report to provide stakeholders at the Ecology Center and Community Health and Social Services Center (CHASS) with data from and pertaining to the 2015-16 Fresh Prescription program. The report focuses on the analysis of qualitative and quantitative data to address the following key evaluation questions: Process Questions
General Program
• What are the main components of a typical Fresh Prescription program? • What is the timeline of activities for a typical Fresh Prescription program? • What factors affected implementation of the Fresh Prescription program at each site?
o To what extent are these factors similar across sites? Fresh Prescription Network
• In what ways has the Fresh Prescription Network helped Network members develop new collaborations?
• What resources have the sites received as a result of their involvement in the Fresh Prescription Network?
• What do Network members perceive to be the strengths and weaknesses of the Network? Providers
• To what extent were providers engaged in the program? Program Staff
• To what extent were program staff engaged in the program? Local Food Vendors
• What is the onboarding process like for new market vendors? • To what extent were vendors satisfied with their experience as a program vendor? • What do vendors perceive to be the strengths and weaknesses of the market at each site?
Participants
• To what extent were participants engaged in the program? • What factors affected participants’ engagement in the program? • To what extent were participants satisfied with the program? • What do participants perceive to be the strengths and weaknesses of the program?

Fresh Prescription Program Final Evaluation Report
11
Outcome Questions
Sites
• How did the program impact participating sites? • How did being a member of the Fresh Prescription Network benefit the sites? • What new partnerships did the sites develop as a result of the Fresh Prescription program?
Providers
• In what ways did clinical interactions change between providers and patients whom they referred to the Fresh Prescription program?
• In what ways did involvement in the Fresh Prescription program change the clinical interactions between providers and patients who were not involved in the program?
• To what extent are provider outcomes similar across sites?
Local Food Vendors
• In what ways did the customer mix of participating vendors change through the program? • To what extent did the revenue of participating vendors change as a result of the program? • In what ways did the variety of foods sold by participating vendors change as a result of the
Fresh Prescription program? • What new partnerships did the vendors develop as a result of the program?
Participants
• In what ways did participants’ access to fresh fruits and vegetables change from the beginning to the end of the Fresh Prescription program?
• To what extent did participants’ awareness about being able to use their benefits at local farmers markets change from the beginning to the end of the Fresh Prescription program?
• In what ways did participants’ knowledge about how to select fresh fruits and vegetables change from the beginning to the end of the Fresh Prescription program?
• In what ways did participants’ knowledge about how to store fresh fruits and vegetables change from the beginning to the end of the Fresh Prescription program?
• In what ways did participants’ attitudes about the importance of eating more fruits and vegetables change from the beginning to the end of the Fresh Prescription program?
• To what extent did participants’ confidence in their ability to eat more fruits and vegetables change from the beginning to the end of the Fresh Prescription program?
• In what ways did participants’ food shopping behaviors change from the beginning to the end of the Fresh Prescription program?
• In what ways did participants’ meal preparation activities change from the beginning to the end of the Fresh Prescription program?
• In what ways did participants’ eating patterns change from the beginning to the end of the Fresh Prescription program?
• How did participants’ health indicators change from the beginning to the end of the Fresh Prescription program?
• To what extent are participant outcomes similar across sites?

12
Background
The Fresh Prescription program, previously known as Health Rx, is a community-based fruit and vegetable prescription program in Detroit, Michigan designed to: (1) increase access to fresh, locally-grown produce among vulnerable patients at participating local health centers; and (2) build a collaborative network of local health centers, food retailers, and community partners with a shared vision of providing fresh produce and nutrition education activities to patients in Detroit. The program was piloted at the Community Health and Social Service Center (CHASS) in July 2013 and recently completed its third year of implementation. Five sites participated in the 2015-16 market season: CHASS, American Indian Health and Family Services (AIHFS), Henry Ford Health System (HFHS), Joy-Southfield Community Development Center, and Mercy Primary Care Center. Each participating site implements their own variant of the Fresh Prescription program, with differing eligibility criteria, program timelines, variety of services and education offered, and mode of service delivery.
During Years 1 and 2 of the Fresh Prescription program, the Curtis Center Program Evaluation Group’s evaluation activities focused on documenting: (1) program implementation of the CHASS pilot; (2) program participation at the CHASS, AIHFS, and Joy-Southfield sites; and (3) short-term outcomes among CHASS program participants. Year 3 of the evaluation was intended to build on previous evaluation activities, via continued tracking of program implementation and participant outcomes at all five participating sites1. These activities were conducted with the broader intent of investigating: (1) what common elements emerge across the Fresh Prescription program variants implemented at each site; (2) the overall impact of the program on participants, providers, participating local vendors, and sites; and (3) to what extent outcomes are similar across Fresh Prescription program sites.
1 Please note that this graphic is intended to demonstrate how the evaluation project developed over the course of 2013, 2014, and 2015. The size of the gears in the graphic reflects the number of participants at each of the sites.
Year 3: HFHS
Year 3: Mercy
Year 2: Joy-Sfld.
Year 1: CHASS
Year 2: AIHFS

Fresh Prescription Program Final Evaluation Report
13
Site Overviews
As noted above, the Fresh Prescription program’s 2015-16 season took place at five distinct sites in Detroit, Michigan: (1) AIHFS, (2) CHASS, (3) HFHS, (4) Joy-Southfield, and (5) Mercy Primary Care Center. The following provides a brief overview of each site:
American Indian Health & Family Services
At American Indian Health and Family Services (AIHFS), participants are referred by staff to a nutritionist. The target population includes those with chronic disease, pregnant women, and children. Participants pick up fresh produce boxes monthly and the program runs year-round.
Community Health & Social Services Center
At the Community Health and Social Services (CHASS) site, participants are referred to the program by their health care provider. CHASS targets individuals with high blood pressure, high cholesterol, diabetes, pregnant women, and caregivers of children 0-5 years old. Fruit and vegetable prescriptions may be filled at the CHASS market in southwest Detroit from July to early October.
Henry Ford Health System
At the Henry Ford Health System (HFHS) site, participants are referred to the program by a provider. HFHS targets patients with a BMI of 30 or higher. From June to November, HFHS participants can go to the weekly market, visit Peaches and Greens, or choose a delivery option.
Joy-Southfield Community Development Corporation
At the Joy-Southfield Community Development Corporation site, participants are referred by a provider at Covenant Community Care. Joy-Southfield focuses on those who live in the nearby neighborhoods, those without fresh food access, and those who are overweight. The program runs from June to October and participants can go to the market weekly across from the clinic.
Mercy Primary Care Center
At the Mercy Primary Care Center site, participants are referred to the program by a provider. The target population includes those with chronic diseases such as hypertension and diabetes, and those with food insecurity. The program runs from July to September and participants can go to the weekly market at the entrance to the Samaritan Center.

14
Methodology
Data Collection
Both quantitative and qualitative data were collected to answer the key evaluation questions. The following data collection tools were used in the Fresh Prescription evaluation:
Biometric Data
AIHFS, CHASS, and Mercy Primary Care Center provided the Curtis Center evaluators with a sample of Fresh Prescription program participants’ biometric data including A1C test results, weight, height, blood pressure, cholesterol, low density lipoprotein (LDL), and waist circumference.
Card Utilization Data
Spending data from program debit cards used by participants at CHASS, HFHS, Joy-Southfield, and Mercy Primary Care Center was provided to Curtis Center evaluators by My Epic Idea, the creators of the application used for tracking Fresh Prescription debit card usage.
Key Informant Interviews
Between October 2015 and January 2016, Curtis Center evaluators conducted 20 semi-structured key informant interviews with Fresh Prescription program stakeholders (i.e. participating sites’ staff, administrators, and health care providers), participants, and vendors. Key informant interviews were conducted both in person and over the phone. Interview participants were asked about their roles in the Fresh Prescription program, their opinion of how the program went this year, and the level of engagement that they observed. Depending upon the interview participant’s role, specific questions were also included (e.g. providers were asked if they observed any changes in the nature of their clinical visits). Interview participants were also asked about the program’s overall strengths and areas for improvement, as well as what advice they would give to someone in their position in the future.
Participant Focus Groups
Curtis Center evaluators conducted focus groups with Fresh Prescription program participants from the following sites: CHASS (conducted in both English and Spanish), Joy-Southfield, and Mercy Primary Care Center. Focus group questions gauged participants’ level of participation in the program, barriers that may have prevented their participation, program strengths and areas for improvement, as well as changes in participants’ health, attitudes, knowledge, and beliefs regarding healthy eating. Specifically, participants were asked to talk about any changes that they noticed in their own or their family’s health; what they learned from participating in the Fresh Prescription program; and how participation in the program impacted their everyday life. Participants were also asked how they found out about the Fresh Prescription program; typical food purchasing habits; and whether they would continue to shop at the sites without program dollars.

Fresh Prescription Program Final Evaluation Report
15
Participant Pre-Program Surveys
A 28-item closed-ended survey, co-created by stakeholders at the Ecology Center and CHASS, was administered to Fresh Prescription participants at the start of the program.
The pre-program survey assessed program participants’ current access to fresh fruits and vegetables, their self-reported health status, and their household’s level of food security. Participants were also asked about their typical daily fruit and vegetable consumption, how often they ate unhealthy foods (such as chips, fast food, or soda/pop), and whether their children helped to prepared fruits or vegetables for snacks or meals (if applicable). Surveys also assessed participants’ attitudes, knowledge, and beliefs regarding healthy eating. Near the end of the survey, program participants were asked to share demographic information such as age, gender, race or ethnicity, household composition (i.e. number of adults, children ages 6-17, and ages 0-5), household income, and participation in assistance programs like SNAP, WIC, Project FRESH, and Double Up Food Bucks. Women were asked whether or not they were currently pregnant or breastfeeding. Lastly, participants were asked whether or not they had a smartphone or tablet, and whether or not they were interested in a diet, exercise, and healthy living application. At CHASS, pre-program surveys were available in both English and Spanish.
Participant Post-Program Surveys
A 30-item closed-ended survey, co-created by Curtis Center evaluators and representatives of the Ecology Center and CHASS, was administered to Fresh Prescription program participants at the end of their participation in the program.
The post-program survey assessed program participants’ level of satisfaction with the program, the likelihood of them recommending the program to a friend or relative, and their intention to shop at the market or site in the future if they did not have Fresh Prescription dollars. The survey also asked participants to report any changes in their behaviors, such as eating more fruits and vegetables, managing a health condition, or buying and cooking with fresh fruits and vegetables that they had not tried before. Participants were also asked to report how frequently they shopped at a farmers’ market or farm stand, how much money they spent in cash on fresh fruits and vegetables (beyond program dollars), and how many adults came to the market with them. The post-survey also repeated the questions regarding the participants’ self-reported health status, their household’s level of food security, typical daily fruit and vegetable consumption, how often they ate unhealthy foods (such as chips, fast food, or soda/pop), and whether their children helped to prepared fruits or vegetables for snacks or meals (if applicable). The survey also re-assessed participants’ attitudes, knowledge, and beliefs regarding healthy eating. At CHASS, post-program surveys were again available in both English and Spanish.

16
Program Attendance Records
The five Fresh Prescription sites provided Curtis Center evaluators with the following program participant attendance data:
• AIHFS: attendance data is conveyed in terms of prescriptions picked-up by Fresh Prescription program participants.
• CHASS: data consists of total markets attended by Fresh Prescription program participants, with denotation for attendance at all four markets.
• HFHS: data includes visits to HFHS market, but specific data pertaining to affiliated box delivery and participants’ visits to the Peaches and Greens store were not available.
• Joy-Southfield: data consists of Fresh Prescription program participants’ number of visits to the Joy-Southfield market.
• Mercy Primary Care Center: data consists of Fresh Prescription program participants’ total number of visits to the Mercy Primary Care Center market.
Site Observations
Curtis Center evaluators conducted in-person, largely non-participatory observations at each of the five Fresh Prescription sites. Curtis Center evaluators noted the setting and layout of the site, the atmosphere and general mood, the presence of educational materials, and interactions amongst program participants, program staff, and local vendors.
Vendor Surveys
Curtis Center evaluators created an online Qualtrics survey containing 11 items to be answered by all respondents and unique blocks of questions for vendors who participated in Fresh Prescription at AIHFS (17 questions), CHASS (16 questions), HFHS (16 Questions), Joy-Southfield (16 Questions), and Mercy Primary Care Center (16 Questions). The survey assessed the vendors’ satisfaction with their overall experience, and asked them to evaluate the onboarding process and the support of program staff. The survey also asked vendors about their interactions with program participants, what they talked about, what handouts the vendors had available, what factors were important when selecting produce for the sites. Vendors also reported whether they noticed changes in their customer mix, the types of foods sold, their revenue, or any community partnerships.

Fresh Prescription Program Final Evaluation Report
17
Data Collection Limitations
Evaluation Timing
As Curtis Center evaluators came onto the project after participants had already been enrolled at some sites, detailed and consistent tracking systems for biological indicators and activities received by participants (e.g. nutritional counseling) were not created.
Tracking Providers and Referrals
For this evaluation project, the tracking of Fresh Prescription program participants began with the completion of the pre-program survey. Accordingly, no data was collected on those patients who received a referral, but did not complete the pre-program survey. These patients may have a) never formally enrolled in the program, or b) enrolled in the program but did not complete the survey. In future evaluation projects, it would be beneficial to track the number of health care providers involved in referring patients at each participating clinic, as well as the number of referrals that providers make over the course of the market season.
Differences in Program Timelines
Among the differences between the five Fresh Prescription sites was a difference in program timelines. The programs at CHASS, HFHS, Joy-Southfield, and Mercy Primary Care Center began in the early summer and continued until early autumn. However, the Fresh Prescription program at AIHFS (Fresh Food Share) continued past the end of data collection on March 3, 2016. The AIHFS program was further extended since participants at AIHFS receive their prescriptions monthly, as opposed to being available each week throughout the summer. As a result, AIHFS participants were still receiving prescriptions at the end of data collection and 52% of AIHFS participants (N = 31) had not yet completed the post-program survey.
Survey Question Differences
While the pre-program and post-program surveys administered at CHASS, HFHS, Joy-Southfield, and Mercy Primary Care Center included the same set of survey questions, the AIHFS surveys included a number of distinct differences. Accordingly, direct comparisons of survey results across all five sites was not possible for some survey questions. The survey results and analysis from AIHFS participants is included in Appendix II of this report.
Consistency of Biometric Measures
Curtis Center evaluators received biometric data from only three of the five Fresh Prescription sites: AIHFS, CHASS, and Mercy Primary Care Center. At those sites, biometric data was only available from some of the participants for a variety of reasons. At AIHFS, numerous participants were still in the midst of the program and did not have both pre- and post-program data available. At CHASS, biometric data was collected as a part of an optional ad hoc study and included only those participants who had been diagnosed with diabetes and had an A1C level over 6.5 within three months before the start of the program. At Mercy Primary Care Center, some participants expressed concern about sharing their biometric data in spite of assurances that the biometric data would be de-identified. Furthermore, there was no one biometric measure that was consistent across the three
18
sites: AIHFS reported height, weight, body-mass index (BMI), and waist circumference. CHASS reported A1C, weight, and blood pressure. Mercy Primary Care Center reported A1C, BMI, blood pressure, cholesterol, and LDL. Accordingly, it was not possible to conduct statistical analyses comparing the biometric outcomes across the three Fresh Prescription sites.
Participant Qualitative Data Collection at HFHS
Given the relatively small number of Fresh Prescription program participants at HFHS (8 total participants) and the transportation concerns faced by those participants, the determination was made to conduct key informant interviews with participants instead of conducting a focus group. Due to various timing and staffing constraints, the participant key informant interviews could not be completed. Future evaluation activities should include the collection of qualitative data from HFHS program participants via either focus groups or key informant interviews.
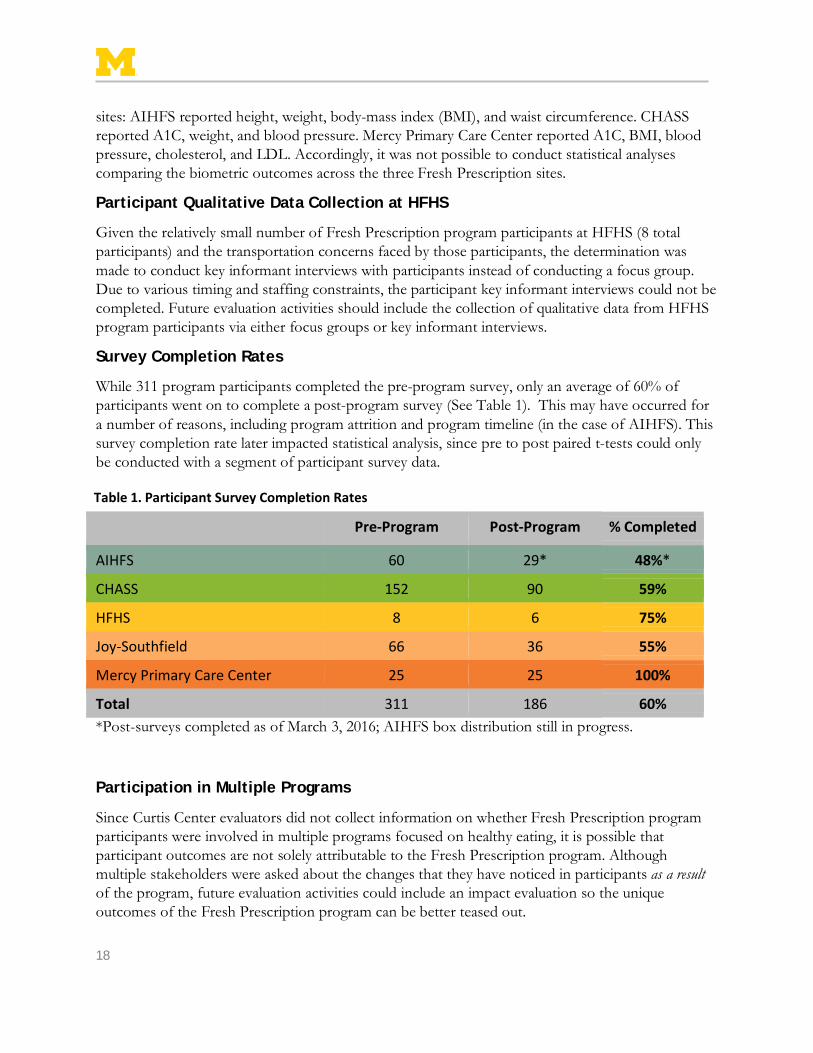
Survey Completion Rates
While 311 program participants completed the pre-program survey, only an average of 60% of participants went on to complete a post-program survey (See Table 1). This may have occurred for a number of reasons, including program attrition and program timeline (in the case of AIHFS). This survey completion rate later impacted statistical analysis, since pre to post paired t-tests could only be conducted with a segment of participant survey data.
Pre-Program
Post-Program
% Completed
AIHFS 60 29* 48%*
CHASS 152 90 59%
HFHS 8 6 75%
Joy-Southfield 66 36 55%
Mercy Primary Care Center 25 25 100%
Total 311 186 60% *Post-surveys completed as of March 3, 2016; AIHFS box distribution still in progress.
Participation in Multiple Programs
Since Curtis Center evaluators did not collect information on whether Fresh Prescription program participants were involved in multiple programs focused on healthy eating, it is possible that participant outcomes are not solely attributable to the Fresh Prescription program. Although multiple stakeholders were asked about the changes that they have noticed in participants as a result of the program, future evaluation activities could include an impact evaluation so the unique outcomes of the Fresh Prescription program can be better teased out.
Table 1. Participant Survey Completion Rates

Fresh Prescription Program Final Evaluation Report
19
Data Analysis
Quantitative Analysis
IBM Statistical Package for the Social Sciences (SPSS; Version 22.0) was used to analyze all quantitative data. Descriptive statistics, such as frequencies, will be employed to summarize program participation and participant responses to survey questions asked at one time point. For data collected at two time points, bivariate and multivariate statistical tests were conducted to identify statistically significant changes in participant responses between pre- and post-program, as well as statistically significant differences in participant outcomes between sites. Pearson Correlations were also conducted to help us understand the relationships between variables. Qualitative Analysis
Qualitative data collected through key informant interviews and focus groups was audio recorded and later transcribed. Curtis Center evaluators then created pre-set codes and a code book based on an initial high-level reading of the transcriptions. Following a brief test of inter-coder reliability, the qualitative data was coded and analyzed using NVivo 10 to identify themes and patterns in responses. Emergent codes were added to the coding scheme throughout the coding process. Matrix queries were used to highlight differences between the sites on key themes and patterns.

20
Fundamental Fresh Prescription Model & Timeline
While each of the five 2015-16 Fresh Prescription sites adapted the Fresh Prescription model to meet the needs of the communities that they serve, each site was guided by the same basic principles. The Fresh Prescription model merges the healthcare system and food system by bringing together participants, healthcare providers, social sector staff, and local food vendors in Detroit, Michigan. The fundamentals of the Fresh Prescription program include:
Referral
A health care provider or other social sector staff member refers a prospective participant to the Fresh Prescription program. In some cases, this is done via a screening process; patients who meet specific eligibility requirements may be sent a letter inviting them to participate.
Assessment
A clinician, community health worker, community educator, or dietitian determines if a prospective participant is a good fit for the Fresh Prescription program. The participant is assessed based on their current access to fresh fruits and vegetables, their knowledge, attitudes, and behaviors in regards to healthy eating, as well as their interest and availability to participate in the program.
Receiving the Prescription
Participants receive a prescription to “eat more fruits and vegetables” from their clinician, community health worker, community educator, or dietitian, and set goals for healthy eating.
Filling the Prescription
Participants receive up to $60 to spend at participating farmers’ markets, farm stands, or to order boxes of fresh fruits and vegetables. These prescription dollars are distributed in set increments (typically $10 each time) over the course of a set time period. In most cases, participants receive $10 on a weekly basis, and in other cases participants receive a larger sum on a monthly basis.
Educational Activities
To complement the prescription dollars, participants engage in a variety of health education activities such as nutrition education, cooking demonstrations, or exercise classes. Participants also receive a variety of materials, such as recipes for cooking with fresh fruits and vegetables or maps to help participants find local farmers’ markets or farm stands in their communities.

Results
The following section presents the overall results of the 2015-16 Fresh Prescription season, including prescription utilization, participant outcomes, provider and organization outcomes, feedback on the Fresh Prescription Network., and new insights on vendor experiences.
Prescription Utilization
Using data provided by the My Epic Idea application creators on Fresh Prescription debit card usage, Curtis Center evaluators determined that participants spent an average of $32.96 per participant over the course of the season (see Figure 1). The average dollar amount loaded onto each card was $36.37. Accordingly, participants2 used about 91% of prescribed program dollars.
2 This debit card spending data does not include AIHFS participants.
Figure 1. Average total spending by Fresh Prescription participants in 2015-16 season

22
In total, over $8,600 was spent on fresh fruit and vegetables by Fresh Prescription participants this year. That figure is equivalent to about 91% of the fresh fruits and vegetables “prescribed” to participants throughout the 2015-16 market season (Figure 2).
Additional Cash Spending on Fruits & Vegetables
Fresh Prescription participants were also asked about how much they typically spend in cash on fruits and vegetables. The intent of this question was to understand how much cash participants spent in addition to their prescription dollars. However, there appears to have been some confusion among participants regarding the wording of the question (specifically regarding the amount spent with prescription dollars versus cash); there does not appear to be a clear pattern among responses. Overall, 10% of participants reported spending $0, 9% of participants reported spending $1-$5, 28% of participants reported spending $6-$10, 18% of participants reported spending $11-$15, 8% of participants reported spending $16-$20, and 27% of participants reported spending $20 or more (Table 59, Appendix III).
Figure 2. Percent of program dollars used by Fresh Prescription participants this season

Fresh Prescription Program Final Evaluation Report
23
Participant Outcomes
This section outlines the number of people reached by the Fresh Prescription program, participant demographics, participant fresh food access, changes in participants’ knowledge and attitudes, changes in participants’ behaviors, changes in health, and participant satisfaction.
Number of People Reached by the Fresh Prescription Program
Number of Participants
Curtis Center evaluators collected pre-program surveys from a total of 311 Fresh Prescription participants. The site with the largest number of participants in the 2015-16 season was CHASS (152 participants), while the site with the smallest number of participants was HFHS (8 participants) (Table 1, Appendix III).
Number of Household Members Reached
Overall, the 2015-16 Fresh Prescription program reached an estimated 1,000 household members. The majority of these household members (631 people) were adults. The program also reached 222 children ages six to seventeen, as well as 147 children ages zero to five (Table 3, Appendix III).
Participant Demographics
Participants from Last Year
Participants at AIHFS, CHASS, and Joy-Southfield were asked whether they or someone in their household had participated in the Fresh Prescription program in the past. 35% of participants in the 2015-16 Fresh Prescription program also took part in the program in 2014.
Participant Age
Across program sites, the average participant age was 49 years old. The youngest program participant was reportedly 18 years of age. Conversely, the oldest participant in the 2015 market season was 90 years of age. At the site level, the average age ranged from 48 years of age (AIHFS) to 53 years of age (HFHS) (Table 5, Appendix III).
Participant Gender
Across program sites, 81% of Fresh Prescription participants identified as “female;” 19% of program participants identified as “male” (n=57). This narrative remained consistent at individual program sites as AIHFS, CHASS, HFHS, and Mercy Primary Care Center; all reported having at least 83% of program participants identify as female. Joy-Southfield had the lowest number of female Fresh Prescription program participants, at 62% (Table 6, Appendix III).

24
New & Expecting Mothers
Across sites, the 2015 Fresh Prescription program had few participants who were expectant mothers (4%; n=9). Among individual sites, AIHFS had the largest number of expectant mothers (6%; n=5) who took part in the Fresh Prescription program. There were 13 individuals who reported breastfeeding during the 2015-16 market season. At the site level, CHASS had the largest number of breastfeeding mothers (9%) (Table 7 and Table 8, Appendix III).
Households with Young Children
Thirty one percent of all 2015 Fresh Prescription participants reported having at least one child between the ages of 0 and five years of age living in their household. At the site level, CHASS (39%) and AIHFS (32%) had the highest percentages of program participant households with young children (Table 4, Appendix III).
Race & Ethnicity
Forty four percent of all 2015 Fresh Prescription program participants identified as African American or Black. The second largest group of participants (37%) identified as Latino, Hispanic, or Spanish origin. The remaining 19% of program participants identified as either Caucasian/white, Native American or American Indian, two or more races/ethnicities, or “other.”
African American or Black participants represented the largest group of program participants at HFHS (88%), Joy-Southfield (88%), and Mercy Primary Care Center (100%). Among participants at CHASS, 74% identified as Latino, Hispanic, or of Spanish origin. The largest group of AIHFS participants (26.7%) identified as Native American or American Indian. (Table 9, Appendix III).
Household Income & SNAP Usage
Fifty two percent of all 2015-16 Fresh Prescription program participants reported an annual household income of less than $15,000. The next largest segment of participants (27%) reported household income between $15,000 and $24,999. 14% of participants said that they were “not sure” about their annual household income.
At the site level, AIHFS (65%), Joy-Southfield (65%), and HFHS (75%) reported the highest number of Fresh Prescription program participants who had a household income of less than $15,000. Conversely, Joy-Southfield (2%) was the only program site to have participants with a household income above $55,000 (Table 10, Appendix III).
Both at the start and end of the 2015-16 Fresh Prescription program, 57% of participants reported receiving EBT, Bridge Card, Food Stamp, or SNAP benefits (Table 11 and Table 12, Appendix III).

Fresh Prescription Program Final Evaluation Report
25
Where Participants Buy Food
Sixty four percent of Fresh Prescription program participants indicated using grocery stores as their primary spot for purchasing food (Figure 1). Produce markets such as Randazzo’s (45%) and “supercenters” such as Walmart (26%) were also frequently mentioned as shopping destinations among Fresh Prescription program participants (Table 19, Appendix III).
Barriers to Accessing Fresh Fruits & Vegetables
Many 2015-16 Fresh Prescription program participants (42%) indicated that the main barrier to accessing fresh fruits and vegetables was that they are too expensive. The second largest group of participants (28%) said that nothing was a barrier to such access. Program participants also cited unreliable means of transportation (27%) and the distance to stores and/or markets (20%) as barriers to acquiring fresh fruits and vegetables (Figure 4).
Counter to the overall averages described above, the largest group of program participants at Mercy Primary Care Center (40%) indicated that distance was the primary barrier to acquiring fresh fruits and vegetables (Table 20, Appendix III).
3%6%6%
20%26%
45%64%
Community Garden
Corner/Party Store
Food Pantry
Farmers' Markets
Supercenter
Produce Market
Grocery Store
8%
13%
20%
27%
28%42%
Don't know how to select the best produce
Not available where I shop
Store/market too far away
No reliable transportation
Nothing
Too expensive
Figure 3. Participants primarily purchase food at grocery stores and produce markets
Figure 4. Barriers to accessing fresh fruits & vegetables
26
Consumption of Fruits & Vegetables at the Start of the Program
Upon starting the 2015-16 Fresh Prescription program, over a quarter of participants (29%) reported eating a half cup or less of fruit per day. Over half (51%) reported eating between a half cup and two cups of fruit per day, which is less than the USDA recommended two cups of fruit per day3 (Table 25, Appendix III).
At the start of the program, almost a quarter (23%) of participants reported eating a half cup or less of vegetables each day. Over half (58%) reported eating a half cup to two cups of vegetables per day, again less than the USDA recommended minimum of two and a half cups of vegetables per day (Table 27, Appendix III).
Participant Smartphone & Tablet Access
At the beginning of their involvement in the 2015-16 Fresh Prescription program, about 53% of participants across sites indicated that they had access to a smartphone or tablet. At 53%, CHASS had the largest number of program participants who lacked access to such technology. Of those participants with access to a smartphone, about 75% of participants reported that the smartphone was an Android (Table 13 and Table 14, Appendix III).
Participant Fresh Food Access
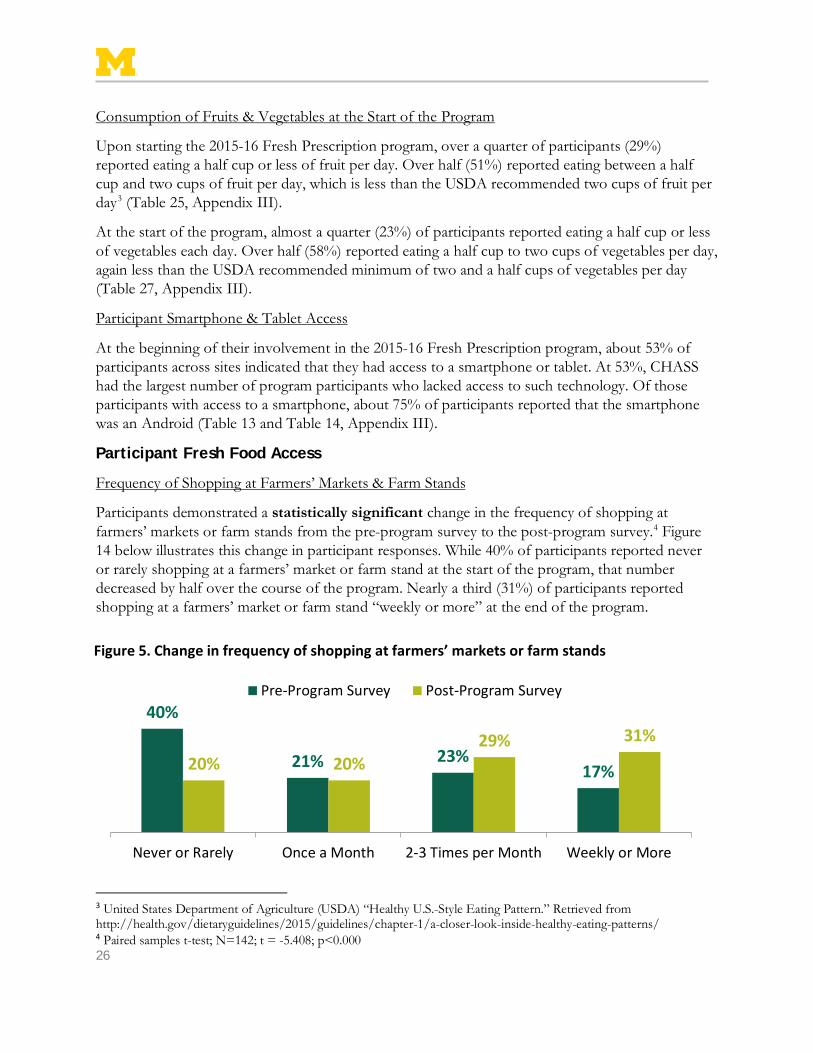
Frequency of Shopping at Farmers’ Markets & Farm Stands
Participants demonstrated a statistically significant change in the frequency of shopping at farmers’ markets or farm stands from the pre-program survey to the post-program survey.4 Figure 14 below illustrates this change in participant responses. While 40% of participants reported never or rarely shopping at a farmers’ market or farm stand at the start of the program, that number decreased by half over the course of the program. Nearly a third (31%) of participants reported shopping at a farmers’ market or farm stand “weekly or more” at the end of the program.
3 United States Department of Agriculture (USDA) “Healthy U.S.-Style Eating Pattern.” Retrieved from http://health.gov/dietaryguidelines/2015/guidelines/chapter-1/a-closer-look-inside-healthy-eating-patterns/ 4 Paired samples t-test; N=142; t = -5.408; p<0.000
40%
21% 23%17%20% 20%
29% 31%
Never or Rarely Once a Month 2-3 Times per Month Weekly or More
Pre-Program Survey Post-Program Survey
Figure 5. Change in frequency of shopping at farmers’ markets or farm stands

Fresh Prescription Program Final Evaluation Report
27
Using SNAP Benefits at Local Famers’ Markets
Participants’ knowledge about SNAP benefits at local farmers’ markets also expanded over the course of the Fresh Prescription program. At the start of the program, just over half (53%) of participants reported that they were aware that people can use SNAP benefits at local farmers’ markets. By the end of the program, that statistic had increased to over two thirds of participants; 66% of participants reported being aware that people can use SNAP at local farmers’ markets.
While participants’ use of SNAP stayed steady at 57% throughout the program, the use of WIC decreased from 25% to 19%, use of Project FRESH increased from 6% to 18%, and use of Double Up Food Bucks increased from 4% to 12% by the end of the program (Table 11, Appendix III).
Change in Food Insecurity Levels
There was a statistically significant change in participants’ reported food insecurity levels from the pre-program survey to the post-program survey.5 Overall, about three quarters of the Fresh Prescription participants identified themselves as some level of food insecure throughout the course of the program (Figure 6). At the start of the program, only 23% of participants identified themselves as food secure (“I/We always have enough to eat and the kinds of food we want”). At the end of the program, the percentage of food secure participants had increased to about 32%. The category “I/We always have enough to eat, but not always the kinds of food we want” was selected by the largest group of participants on both the pre- and post-program surveys; 49% of participants selected this category at the start of the program, and 53% of participants selected this category at the end of the program (Table 34 and Table 35, Appendix III).
5 Paired samples t-test; N=143; t=-2.627; p=0.010
23%
49%
21%7%
32%
53%
12%3%
Pre-Program Survey Post-Program Survey
Figure 6. Change in participant food insecurity levels
I/We always have enough to eat & the kinds of food
we want
I/We always have enough to eat, but
not always the kinds of food we want
Sometimes I/We do not have
enough to eat
“I’ve eaten fruit that I haven’t eaten in a lot of years. Because of cost and
limited transportation… I haven’t eaten a plum or pear in probably
almost 30 years.”– Participant
Often I/We do not have enough
to eat
28
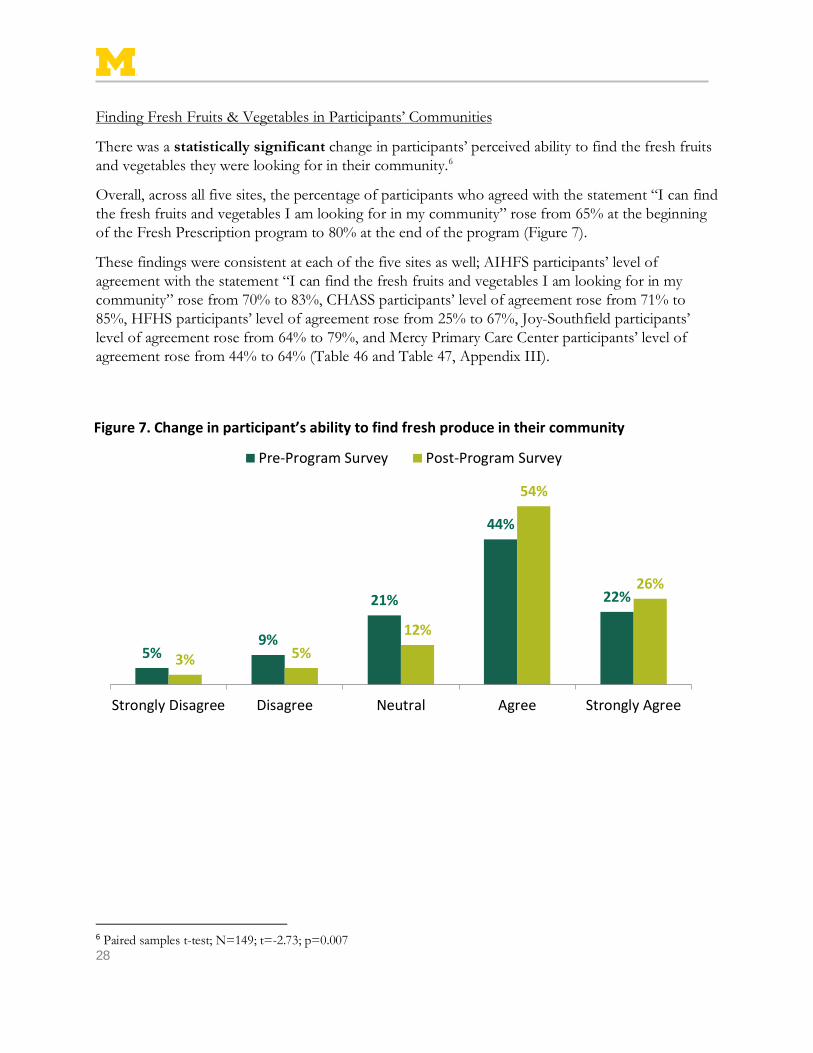
Finding Fresh Fruits & Vegetables in Participants’ Communities
There was a statistically significant change in participants’ perceived ability to find the fresh fruits and vegetables they were looking for in their community.6
Overall, across all five sites, the percentage of participants who agreed with the statement “I can find the fresh fruits and vegetables I am looking for in my community” rose from 65% at the beginning of the Fresh Prescription program to 80% at the end of the program (Figure 7).
These findings were consistent at each of the five sites as well; AIHFS participants’ level of agreement with the statement “I can find the fresh fruits and vegetables I am looking for in my community” rose from 70% to 83%, CHASS participants’ level of agreement rose from 71% to 85%, HFHS participants’ level of agreement rose from 25% to 67%, Joy-Southfield participants’ level of agreement rose from 64% to 79%, and Mercy Primary Care Center participants’ level of agreement rose from 44% to 64% (Table 46 and Table 47, Appendix III).
6 Paired samples t-test; N=149; t=-2.73; p=0.007
5%9%
21%
44%
22%
3% 5%12%
54%
26%
Strongly Disagree Disagree Neutral Agree Strongly Agree
Pre-Program Survey Post-Program Survey
Figure 7. Change in participant’s ability to find fresh produce in their community

Fresh Prescription Program Final Evaluation Report
29
Knowledge & Attitude Changes
Changes in participants’ knowledge and attitudes about healthy eating emerged across all five Fresh Prescription program sites. The following section outlines specific knowledge and attitude changes:
Importance of Eating Fresh Fruits & Vegetables
Participants rated the importance of eating fresh fruits and vegetables on a 1 to 10 scale, where 10 was very important and 1 was not important. Overall, participants rated eating more fruits and vegetables as highly important; the average rating was above 9 for both the pre-program survey and the post-program survey. Specifically, there was a slight positive increase in participants’ average ratings overall, from 9.21 on the pre-program survey to 9.28 on the post-program survey. This increase in importance ratings was mirrored at the CHASS and Mercy Primary Care Center sites, however there was a slight decrease in importance ratings among participants at HFHS and Joy-Southfield from the start to the end of the program (Table 50 and Table 51, Appendix III).
At the end of the Fresh Prescription program, Curtis Center evaluators asked participants if they had noticed an increase in their knowledge about the importance of eating fresh fruit and vegetables. About 88% of participants noted some level of increase in their knowledge about the importance of fresh fruits and vegetables in their family’s diet (Figure 8). Findings were fairly consistent across sites (Table 54, Appendix III). For example, program participants at Mercy Primary Care Center reported learning more about the importance of incorporating produce in their diets.
Statistics suggest that there is a weak positive correlation between participants’ belief in the importance of eating more fruits and vegetables and a change in self-reported health status.7 In other words, participants with high importance ratings for eating more fruits and vegetables also tend to report positive changes in their perceived health status at the end of the program.
7 Pearson correlation; N=153; r=0.228; p=0.005
12%
22%
26%
41%
Stayed the Same
Increased a Little
Increased Some
Increased a Lot
Figure 8. 88% of Fresh Prescription participants reported some level of increase in their knowledge about the importance of eating fruits & vegetables

30
Participants’ Confidence in Their Ability to Eat More Fresh Fruits & Vegetables
Participants rated their confidence in their own ability to eat more fresh fruits and vegetables, on a 1 to 10 scale, where 10 was very confident and 1 was not confident. There was a slight positive increase in participants’ average confidence ratings overall, from 8.80 on the pre-program survey to 8.85 on the post-program survey. However, this increase was not consistent across all sites; while there was an increase in confidence ratings from 8.59 to 9.03 among CHASS participants, the confidence ratings at the HFHS, Joy-Southfield, and Mercy Primary Care Center decreased slightly (Table 52 and Table 53, Appendix III).
Statistics suggest that there is a weak positive correlation between participants’ confidence rating for eating more fruits and vegetables, and a difference in vegetable intake over the course of the program.8 Those participants with a high confidence rating for eating more fresh fruits and vegetables tend to also report a change in the number of cups of vegetables eaten each day from when they started the Fresh Prescription program to when they completed the program.
Statistics also suggest that there is a moderate positive correlation between participants’ level of confidence in eating more fruits and vegetables, and an increase in the amount of fruits and vegetables eaten each day.9 Participants with a high confidence rating for eating more fruits and vegetables tend to also report a greater increase in the amount of fruits and vegetables eaten each day (Post-program survey question “The amount of fruits and vegetables I eat each day has…”).
Belief that Eating Fruits & Vegetables Helps Improve One’s Health
Participants across all Fresh Prescription sites reported an increase in the belief that eating fruits and vegetables helps improve one’s health. This change was not statistically significant. The percentage of participants who “agreed” or “strongly agreed” with the
statement “Eating fruits and vegetables helps improve my health” increased from 90% at the start of the program to 95% at the end (Table 44 and Table 45, Appendix III).
8 Pearson correlation; N=141; r=0.220; p=0.009 9 Pearson correlation; N=153; r=0.330, p<0.000
“I think their attitudes changed from the time too. At the beginning it’s kind of like, “eh, like we’ll see how this goes,” it’s something new and then towards the end their just they’re
grateful, they’re happy they participated in the program.” – Program Staff
“I think that as people felt more proficient, their attitudes improved. So it didn’t become
as much as, ‘that’s too expensive,’ to yes, I know this is healthy and I know what to do
with it.” – Program Staff
“I am not a veggie or a fruit eater, so that was kinda new for me because I was trying to
change style a little bit, you know, and the program really helped me…and that will save
me, you know?” –Participant

Fresh Prescription Program Final Evaluation Report
31
How to Select High Quality Fresh Fruits & Vegetables
Participants across all sites reported an increase in knowledge about how to select high quality fresh fruits and vegetables. However, this change was not statistically significant. Overall, the percentage of participants who “agreed” or “strongly agreed” with the statement “I know how to select high quality fruits and vegetables” increased from 65% at the start of the program to 75% at the end (Table 38 and Table 39, Appendix III).
How to Prepare & Cook Fresh Fruits & Vegetables
There was a statistically significant change in knowledge regarding how to prepare and cook fresh fruits and vegetables from the start of the program to the end of the program, across all sites.10 For example, participants at Joy-Southfield reported learning new recipes and new cooking techniques during the cooking demonstrations.
Overall, the percentage of Fresh Prescription participants who “agreed” or “strongly agreed” with the statement “I know how to prepare and cook fresh fruits and vegetables” increased from 67% at the start of the program to 79% at the end (Figure 9) (Table 40 and Table 41, Appendix III).
10 Paired samples t-test; N=144; t=-3.836; p<0.000
9% 12% 12%
38%29%
4% 1%
17%
51%
27%
Strongly Disagree Disagree Neutral Agree Strongly Agree
Pre-Program Survey Post-Program Survey
“[The participants] say ‘well I know I need to incorporate more color in my diet.’”
– Program Staff
“Patients felt empowered with the recipes and knowledge learned, and
were grateful.” – Provider
“[The chef] gives us ideas from what he cooks or prepares for everybody… I sort
of take that back and try to sauté and do the things that he does.”
– Participant
Figure 9. Change in knowledge about how to prepare & cook fresh fruits & vegetables
“A lot of people now started reading the labels.” – Participant
32
“A lot of the changes I’ve seen are…social changes… a sense of community, and a
lot of…personal changes in terms of them changing their attitudes” – Program Staff
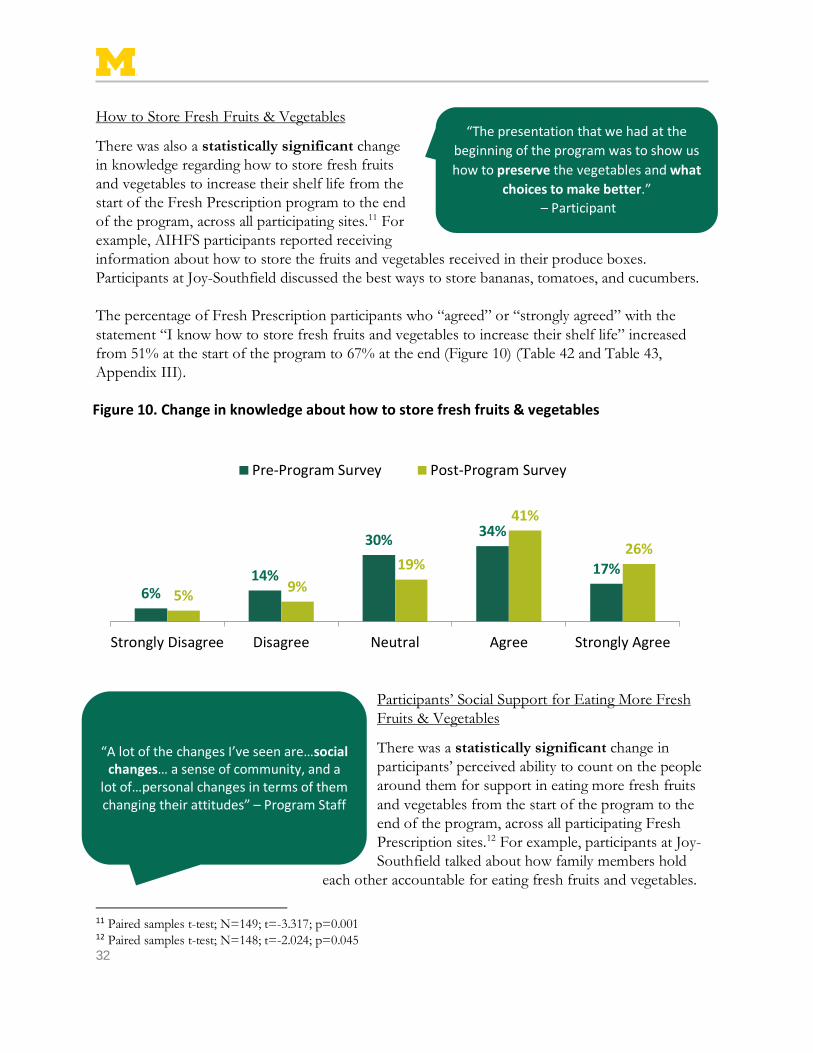
How to Store Fresh Fruits & Vegetables
There was also a statistically significant change in knowledge regarding how to store fresh fruits and vegetables to increase their shelf life from the start of the Fresh Prescription program to the end of the program, across all participating sites.11 For example, AIHFS participants reported receiving information about how to store the fruits and vegetables received in their produce boxes. Participants at Joy-Southfield discussed the best ways to store bananas, tomatoes, and cucumbers. The percentage of Fresh Prescription participants who “agreed” or “strongly agreed” with the statement “I know how to store fresh fruits and vegetables to increase their shelf life” increased from 51% at the start of the program to 67% at the end (Figure 10) (Table 42 and Table 43, Appendix III).
Participants’ Social Support for Eating More Fresh Fruits & Vegetables
There was a statistically significant change in participants’ perceived ability to count on the people around them for support in eating more fresh fruits and vegetables from the start of the program to the end of the program, across all participating Fresh Prescription sites.12 For example, participants at Joy-Southfield talked about how family members hold
each other accountable for eating fresh fruits and vegetables.
11 Paired samples t-test; N=149; t=-3.317; p=0.001 12 Paired samples t-test; N=148; t=-2.024; p=0.045
6%14%
30% 34%
17%
5% 9%19%
41%
26%
Strongly Disagree Disagree Neutral Agree Strongly Agree
Pre-Program Survey Post-Program Survey
“The presentation that we had at the beginning of the program was to show us how to preserve the vegetables and what
choices to make better.” – Participant
Figure 10. Change in knowledge about how to store fresh fruits & vegetables

Fresh Prescription Program Final Evaluation Report
33
The percentage of participants who “agreed” or “strongly agreed” with the statement “I can count on the people around me to support me to eat more fruits and vegetables” increased from 65% at the start of the program to 75% at the end (Figure 11) (Table 48 and Table 49, Appendix III).
Behavior Changes
Fresh Prescription participants reported a number of positive behavior changes as a result of their participation in the program. This section describes key behavior changes, such as buying new fruits and vegetables that participants had not tried before, cooking with fruits and vegetables that participants had not cooked before, and eating more fresh fruits and vegetables each day.
7% 9%
21%
36%28%
4% 4%
15%
51%
25%
Strongly Disagree Disagree Neutral Agree Strongly Agree
Pre-Program Survey Post-Program Survey
“I buy new fruits & vegetables that I did not buy before”
“I cook with fruits & vegetables that I did not cook before” 80%
81%
82%“I have tried new fruits & vegetables
that I had not eaten before”
Figure 12. Positive behavior changes among Fresh Prescription participants
Figure 11. Change in ability to count on social support for eating fruits & vegetables
34
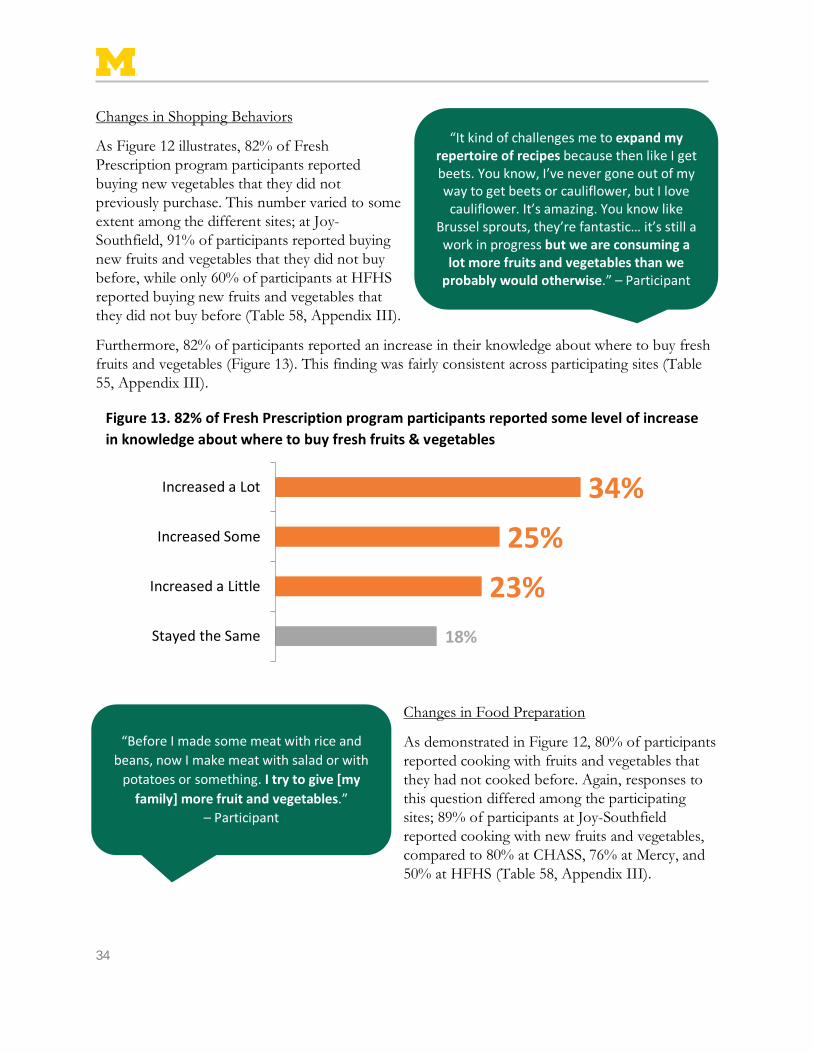
Changes in Shopping Behaviors
As Figure 12 illustrates, 82% of Fresh Prescription program participants reported buying new vegetables that they did not previously purchase. This number varied to some extent among the different sites; at Joy-Southfield, 91% of participants reported buying new fruits and vegetables that they did not buy before, while only 60% of participants at HFHS reported buying new fruits and vegetables that they did not buy before (Table 58, Appendix III).
Furthermore, 82% of participants reported an increase in their knowledge about where to buy fresh fruits and vegetables (Figure 13). This finding was fairly consistent across participating sites (Table 55, Appendix III).
Changes in Food Preparation
As demonstrated in Figure 12, 80% of participants reported cooking with fruits and vegetables that they had not cooked before. Again, responses to this question differed among the participating sites; 89% of participants at Joy-Southfield reported cooking with new fruits and vegetables, compared to 80% at CHASS, 76% at Mercy, and 50% at HFHS (Table 58, Appendix III).
18%
23%25%
34%
Stayed the Same
Increased a Little
Increased Some
Increased a Lot
Figure 13. 82% of Fresh Prescription program participants reported some level of increase in knowledge about where to buy fresh fruits & vegetables
“It kind of challenges me to expand my repertoire of recipes because then like I get beets. You know, I’ve never gone out of my way to get beets or cauliflower, but I love
cauliflower. It’s amazing. You know like Brussel sprouts, they’re fantastic… it’s still a work in progress but we are consuming a lot more fruits and vegetables than we
probably would otherwise.” – Participant
“Before I made some meat with rice and beans, now I make meat with salad or with
potatoes or something. I try to give [my family] more fruit and vegetables.”
– Participant

Fresh Prescription Program Final Evaluation Report
35
Children Helping to Prepare Fruits & Vegetables for Snacks or Meals
Participants reported a very slight increase in their children helping to prepare fresh fruits and vegetables for snacks of meals. While it was not a statistically significant change, the percentage of participants who reported that their children helped to prepare fruits and vegetables for snacks or meals increased from 37% to 39% (Figure 14). The largest increase was at Mercy Primary Care Center, where this statistic shifted from 17% to 26% (Table 32 and Table 33, Appendix III).
Trying New Fruits & Vegetables
Figure 12 shows how 81% of participants reported trying new fruits and vegetables that they had not eaten before. For example, participants at Mercy Primary Care Center indicated experimenting with new and different vegetables, especially given that they were not using their own spending money.
This statistic was highest among Joy-Southfield participants, 94% of whom reported trying new fruits and vegetables. The statistic was lowest among participants at Mercy Primary Care Center, only 64% of whom reported trying new fruits and vegetables that they had not eaten before (Table 58 in Appendix III).
37% 34%28%
39%27%
33%
Yes No Not Applicable
Pre-Program Survey Post-Program Survey
“Patients come in and say, ‘We talked about trying new things and at the market they
have Swiss chard and I never had Swiss chard. I don’t know how to cook it, but
could you give me some tips…?’” – Program Staff
Figure 14. Only a slight increase in participants’ children helping to prepare fruits & vegetables for snacks or meals
“I’ve actually given them tools on how to get [their kids] to like a variety of veggies
and they’ve actually come back and tell me how they got their children to actually eat a variety of veggies instead of just one.”
— Program Staff
“[The participants] say…I never had sweet potato and this is a good opportunity to try sweet potato because if I try it and
don’t like it, I don’t have to pay because the money is not coming from my
pocket.’” –Program Staff

36
Eating More Fruits & Vegetables
Participants were asked about their daily consumption of fruit and vegetables both at the start of the Fresh Prescription program, and when they completed the post-program survey. Analysis shows that there was a statistically significant change in both participants’ daily fruit consumption13 and participants’ daily vegetable consumption14 from the start of the Fresh Prescription program, to program completion.
Figure 15 and Figure 16 demonstrate how, for both fruit and vegetable consumption, the percentage of participants eating just 0-1 cup of fruit or vegetables decreased over the course of the program,
13 Paired samples t-test; N=142; t=-4.577; p<0.000 14 Paired samples t-test; N=142; t=-3.903; p<0.000
53%
28%
14%5%
34% 33%26%
8%
0-1 Cup 1-2 Cups 2-3 Cups 3+ Cups
At start of program At end of program
53%
28%
10% 9%
37% 38%
13% 13%
0-1 Cup 1-2 Cups 2-3 Cups 3+ Cups
At start of program At end of program
Figure 15. Change in participant fruit consumption
Figure 16. Change in participant vegetable consumption
“Usually there would just be one portion on my plate. Like meat... But now, since [the dietitian] asks for the three portions on the plate like vegetables, fruits, and
them, I normally do that with every meal now, since the market.” – Participant

Fresh Prescription Program Final Evaluation Report
37
while the percentages of participants eating 1-2 cups, 2-3 cups, and 3+ cups increased (Table 25, Table 26, Table 27, and Table 28, Appendix III).
Data also suggests that participants are conscious of this change in eating behavior; overall, 88% of participants reported some level of increase in the amount of fruits and vegetables that they eat each day (Figure 17). This finding is largely consistent across sites (Table 56, Appendix III).
Increased consumption of fruits and vegetables was not only reported among program participants, but also among participants’ families. 87% of participants reported some level of increase in the amount of fruits and vegetables that their family eats each day (Figure 18). This finding was also largely consistent across sites (Table 57, Appendix III).
12%
23%
31%
34%
Stayed the Same
Increased a Little
Increased Some
Increased a Lot
13%
20%
33%
33%
Stayed the Same
Increased a Little
Increased Some
Increased a Lot
Figure 17. 88% of Fresh Prescription program participants reported some level of increase in the amount of fresh fruits & vegetables that they eat each day
Figure 18. 87% of Fresh Prescription program participants reported some level of increase in the amount of fresh fruits & vegetables that their families eat each day

38
Statistics suggest that there may be a relationship between this increase in eating fruits and vegetables, and the frequency of market attendance/box pick-ups. There was a weak positive correlation between participants’ attendance rate, and an increase in eating fruits and vegetables.15
Decrease in Eating Unhealthy Foods
In addition to adding more fresh fruits and vegetables to their diets, Fresh Prescription participants are also cutting back on the number of unhealthy foods (such as fast food, chips, soda, etc.) that they eat each day. For example, participants at Joy-Southfield reported substituting fruits and vegetables for unhealthy foods. At the start of the program, participants reported eating unhealthy foods an average of 2.09 times per day. At the end of the Fresh Prescription program, participants reported eating unhealthy foods just 1.62 times per day. Statistics confirm that there was a statistically significant decrease in the number of times that Fresh Prescription participants ate unhealthy foods each day.16
15 Pearson correlation; N=148; r=0.229; p=0.005 16 Paired samples t-test; N=132; t=3.274; p=0.001
“One of the participants… gained custody of her granddaughter and she
was a diabetic and she said: ‘now I know what it’s like to be diabetic…I
don’t want my granddaughter have to grow up and have to deal with this
condition like I am. So I know I need to set an example for her and when I’m
eating more fruits and vegetables, she’s eating by me. She’s eating directly what
I’m eating.’” – Program Staff
“I didn’t buy junk this time, I bought more fruit...my ten year old likes the
honey buns, he likes also those hot chips. But when I did the grocery shopping I was
like ‘I’m not going to buy it this time.’ I brought fruit, he mashed them grapes before I could even get up through the
door.” – Participant
“Instead of eating candy, I eat a piece of fruit now!” – Participant

Fresh Prescription Program Final Evaluation Report
39
Changes in Health
Fresh Prescription participants demonstrated several positive health outcomes, including a slight improvement in self-reported health status, a decrease in A1C levels, and an improved ability to manage their existing health conditions.
Self-reported Health Status
Participants were asked to rate their own health status at the start of the Fresh Prescription program, and again at the end of the program. At the start, a total of 12% of Fresh Prescription participants described themselves as being in “poor” health and only 46% identified themselves as being in “good,” “very good,” or “excellent” health.
At the end of the program, the percentage of Fresh Prescription participants who identified themselves as being in “poor” health had dropped to 5%, and the percentage of participants who identified themselves as being in “good,” “very good,” or “excellent” health had increased to 53%.
For example, participants at CHASS suggested that they felt better overall, noting weight loss and increased bowel movements. Additionally, it was suggested that the shift to eating more produce inspired other changes, such as increased water consumption and exercise. At Joy-Southfield, program participants reported losing weight since beginning the program. Interviews also suggested that some program participants had more energy, were able to sleep at night, and experienced improved concentration and moods. Some program participants at Mercy Primary Care Center stated that they were sleeping better and had more energy. Participants reported “feeling lighter” and having lost some weight. One participant noted their skin complexion seemed to be “brighter.”
“I’ve noticed that when I eat more fruits and vegetables, I do feel better.”
– Participant
“I feel like I have more energy now. Now I’m motivated to walk more. I come and
go, and I always walk.” – Participant
“Something as simple as eating more produce, they start exercising, drinking
more water, it gets the ball rolling. It gets them more motivated overall.”
– Provider
“For a lot of these people it’s a good time to get out of the house. It’s a break from their routine and do something different. You know get out and come out and meet new people... And
sometimes we have activities for kids. So, it’s I think it’s a good time to come and interact with other people.” – Program Staff
“Before, I could not see a reason to apologize. My whole behavior has changed. My mental attitude has
changed.”– Participant

40
Start of Program
Both at the start of the program and at the end, the largest group of participants (43%) identified themselves as being in “fair” health (Figure 19).
Participants’ self-reported health status differed to some extent between sites, however the percentage of participants who identified themselves as being in “poor” health decreased over the course of the program at all five sites. The percentage of participants who identified as in “good,” “very good,” or “excellent” health stayed the same at Mercy Primary Care Center, and increased at AIHFS, CHASS, HFHS, and Joy-Southfield (Table 23 and Table 24, Appendix III).
Self-reported health status appears to have some relationship with increased fruit consumption, and with participants’ frequency of shopping at farmers’ markets or farm stands. Specifically, there was a weak positive correlation between a change in fruit consumption and a change in self-reported health status.17 There was also a weak positive correlation between participants’ frequency of shopping at a farmers’ market or farm stand and a change in self-reported health status.18
Changes in Biometric Indicators
Overall, participants’ biometric measures showed little change over the course of the program; statistical analyses did not reveal any statistically significant changes in blood pressure, BMI, cholesterol, LDL, waist circumference, or weight. However, the analysis of participants’ A1C levels reveled some promising results.
Participants’ A1C levels were tested before the start of the Fresh Prescription program, and within the three months immediately following their program participation. The A1C test is a blood test that helps diabetic patients monitor their blood sugar levels. Specifically, the test measures a patient’s average blood sugar level over the course of the three months previous to the test. A normal range
17 Pearson correlation; N=141; r=0.268; p=0.001 18 Pearson correlation; N=143; r=0.206; p=0.014
Figure 19. Changes in participants’ self-reported health status
End of Program 5%
12%
43%
43%
38%
37%
11%
7%
4%
Poor Fair Good Very Good Excellent

Fresh Prescription Program Final Evaluation Report
41
for A1C levels is below 5.7; patients with an A1C level from 5.7 to 6.4 are considered to be pre-diabetic, while those with an A1C level of 6.5 or higher are considered to be diabetic.19
Fresh Prescription participants’ A1C levels ranged from 5.1 (normal) to 14.0 (diabetic). The average A1C level among participants at the start of the program was 9.3, while the average A1C level at the end of the program was 8.5 (Figure 20). Statistical analysis confirms that among Fresh Prescription program participants at CHASS and Mercy Primary Care Center (N=69), there was a statistically significant change in A1C levels from the start to the end of the program.20
Managing Health Conditions
Participants also reported improvement in their ability to manage existing health conditions; 90% reported that the statement “I am able to manage my health conditions better” was true (Figure 21). This finding was fairly consistent across sites (Table 58, Appendix III).
19 National Institute of Diabetes and Digestive and Kidney Diseases. Retrieved from http://www.niddk.nih.gov/health-information/health-topics/diagnostic-tests/a1c-test-diabetes/Pages/index.aspx#2 20 Paired samples t-test; N=69; t=3.902; p<0.000
90%
9.38.5
Start of Program End of
Program
Figure 20. Decrease in Fresh Prescription participants’ average A1C levels
“I am able to manage my health conditions better”
Figure 21. Participants’ improved ability to manage health conditions
“I had GI problems and I find that when I eat more fruits and vegetables, I feel
much better health-wise.”– Participant

42
5% 10% 85%
Very Dissatisfied Somewhat Dissatisfied Neither Somewhat Satisfied Very Satisfied
Participant Satisfaction
Participant Satisfaction with the Program
Overall, the majority of participants were satisfied with their participation in the Fresh Prescription program; 95% of participants reported being either “somewhat satisfied” or “very satisfied” with their experience. Overall, 85% of participants reported being “very satisfied” (Figure 22).
Satisfaction rates differed to some extent among the five Fresh Prescription sites. At Mercy Primary Care Center, 100% of participants reported that they were either “somewhat satisfied” or “very satisfied.” At CHASS, 95% of participants reported that they were either “somewhat satisfied” or “very satisfied,” while 5% reported that they were “very dissatisfied” (n=4). Joy-Southfield had both the highest rate of “very satisfied” participants (86%) and the most variety in other responses: 92% of participants reported that they were either “somewhat satisfied” or “very satisfied,” 3% reported being neither satisfied nor dissatisfied, and 6% reported being “very dissatisfied” (n=2). At HFHS, 84% of participants reported being “very satisfied” and 17% reported being “very dissatisfied” (n=1) (Table 61, Appendix III).
“For the people who participated, it went well. I think that they were
happy with what they got.” – Program Staff
Figure 22. Participant satisfaction
“I think the patients that were involved were very engaged. They definitely asked for additional tips, additional resources.”
– Program Staff

Fresh Prescription Program Final Evaluation Report
43
Participants Would Continue Shopping at Fresh Prescription Sites
The majority of participants (85%) report that they would continue shopping at Fresh Prescription markets or participating in the Fresh Food Share program, without program dollars (Figure 23). There was slight variation in this statistic among sites; at HFHS, 100% or participants report that they would continue shopping at the site, compared to 88% at Joy-Southfield, 84% at Mercy Primary Care Center, and 83% at CHASS (Table 62, Appendix III).
Figure 23. Majority of participants would continue shopping at the sites
“I really like the people in the neighborhood. Everyone, at least at our market, we try to make it a community destination so I don’t know if that puts
people in a good mood. Everyone seemed to be very thrilled with the Fresh
Prescription program.” – Program Staff
“They were really excited to come back every week and see new recipes and
produce. They came back usually very engaged and telling us something they had done that previous week which is… I think that’s unusual for a program. They usually don’t have that type of enthusiasm for a
program.” – Program Staff

44
Participants Would Recommend the Program
Nearly all participants (97%) would recommend the Fresh Prescription program to a friend or relative (Figure 24). This statistic is fairly consistent among sites: 100% at HFHS, 100% at Mercy Primary Care Center, 67% at Joy-Southfield, and 96% at CHASS (Table 63, Appendix III).
Figure 24. Nearly all participants would recommend Fresh Prescription
“We’ve had people who participated in the program last year and they’re on a waiting list because we want to make sure we get new people. We have a lot
of interest.” – Program Staff
“It’s a very popular program. I mean, it’s for prescription for fruit and vegetables for free, I mean what, how much better
can you get right?” – Program Staff
“Word of mouth was the way the prescription program really blossomed.
Some of the people really liked it and told their friends and they came to our door
and asked to be a part of the program…They got their family and
neighbors involved.” – Program Staff

Fresh Prescription Program Final Evaluation Report
45
Provider Outcomes
Interviews with health care providers at the Fresh Prescription sites offered a glimpse into the important role that fresh fruits and vegetables can play in our healthcare system, and how the Fresh Prescription program may have an impact on clinical interactions.
Fresh Prescription strives to bring together the food system and the health system. One of the key themes that emerged from interviews with Fresh Prescription providers is the importance of “food as medicine,” and the important role that healthy eating can play in preventing health problems later in life. Eating more fresh fruits and vegetables is a practical way in which patients can make a difference in their long-term wellbeing, and take control of their own health.
Interviews also revealed how the Fresh Prescription program benefits health care providers by providing a rewarding way for them to offer additional to support to their patients, and by encouraging providers to “practice what they preach” with healthy eating.
Changes in Clinical Interactions
Health care providers and staff at each of the sites shared their perspectives on Fresh Prescription participants’ clinical visits and provider-patient interactions. Overall, providers appeared to support the Fresh Prescription program, but were also constrained by limited time and availability.
Providers typically played the crucial role of introducing prospective participants to the Fresh Prescription program and encouraging them to participate; without the support of health care providers, the Fresh Prescription program would have difficulty gaining momentum. Accordingly, while only subtle changes emerge in clinical interactions, they remain worthy of consideration.
“[Participants are] exposed to more produce, and as hard as it might be for some people,
their understanding and their desire to include more produce in their daily life
definitely does improve. I’ve seen some that have realized that this is a way to prevent
problems down the road. I think that’s really encouraging.” – Provider
“It’s a good way to provide education and actually make more of an impact … These kinds of programs are a nice way
to provide extra resources for [patients].” – Provider
“Knowing that I have this resource… I need to practice what I preach.”
– Provider
“I think this program is very innovative and is helping a lot of the providers tie those two
systems [together]. Because those two systems, they kind of feed off each other –
it’s like a continuous circle between the health system and food system.”
– Program Staff

46
For example, some providers noted an increase in patient motivation and involvement in their own health care. Providers reported that some participants started to readily volunteer information about their health. The Fresh Prescription participants seemed to be empowered by the fact that they were actively doing something to improve their own health.
Through building relationships with Fresh Prescription program participants, the health care providers also gain a more nuanced understanding of the barriers facing their patients and can provide education accordingly
Providers at Mercy Primary Care Center also noted that patients who were not enrolled in the Fresh Prescription program sometimes inquired about the program, hoping to get involved in the future.
“I would say that the vast majority of them felt a lot healthier and just felt like really doing something for their
own health.” – Provider
“Instead of me having to ask how much water they drink, etc., they bring it up to
me. They’ll tell me that they’ve been exercising, they feel better, their sugars are better, it all gets intertwined with all the positive health aspects.” – Provider
“I love building relationships with [participants]... they say, ‘Well our electricity is out this week and we don’t have a refrigerator right now.’ You know, I feel like if they weren’t comfortable with me, I don’t know if they would’ve revealed that kind of information. And knowing that
gives me a different perceptive and I can change the type of education that I give.” – Program Staff
“One of the main things that I think is most important for managing health conditions is the diet, and I think that a lot of times in a medical setting the providers … focus on medications because
that’s also extremely important. One of the things that the providers have said is that their time and their office visits are limited, and they often can’t spend as much time as they would to like to on
diet. So I think that I love being involved in the program because it gave me an opportunity to talk a little bit about that with them – meal planning, and the importance of fresh fruits and vegetables, and the importance of an overall healthy lifestyle, in conjunction with taking
medications to manage chronic illnesses.” – Program Staff

Fresh Prescription Program Final Evaluation Report
47
Organization Outcomes
Beyond the impacts on program participants and health care providers, the Fresh Prescription program also strengthened organizations. Interviews with stakeholders at each of the sites illustrated how the Fresh Prescription program helped organizations address health in a new and innovative way, and facilitated the development of partnerships with other organizations in the community.
Program Impact
Key stakeholders at each of the sites talked to Curtis Center evaluators about the impact that the Fresh Prescription program had on their organizations overall, including how the program helps expand the organization’s services and address health care in a unique way.
For example, program staff at AIHFS explained that the Fresh Prescription program allows their organization to assist low-income, food insecure clients who they might not otherwise be able to reach. Program staff at HFHS felt that participation in the Fresh Prescription program demonstrated their organization’s commitment to caring for patients holistically. At Joy-Southfield, program staff noted that the program helps their organization address health disparities and provide fresh food access to those living in the surrounding neighborhoods. Interviews at CHASS suggested that the program increased the understanding of healthy eating among CHASS staff, as well as the program participants.
“This has been a huge impact on our clinic. This has actually brought
more clientele in [because] we have WIC also so I’m able to
advertise to WIC clients too.” – Provider
“The staff really likes [the program] and that’s something they look forward to and that’s
something that brings us all together – that shared
anticipation.” – Program Staff
“It just showed our commitment to treating the
patients more holistically…we are not just going to give you drugs and send you on your
way. We’re going to talk to you about nutrition and give you the tools to better improve your diet.” – Program Staff
“[The program] does a good job of helping people understand where their food comes from, and why is it good for you. It drives home the point that
medicine doesn’t necessarily have to come in the form of a pill. It’s what you put in your
body.” – Program Staff
“We were excited to be involved because it gives us a chance to talk about the importance that diet has on health. Providers don’t always have that time in the
office to stress it. It’s great being part of it and we just hope that the things that the participants have learned
will continue to be used.” – Program Staff
48
Partnerships & Shared Resources
Stakeholders also discussed how participation in the Fresh Prescription program had facilitated partnerships between their organization and other local organizations. For example, several organizations mentioned that participation in the Fresh Prescription led to a closer partnership with the Ecology Center. Program staff at AIHFS noted that participation in the Fresh Prescription facilitated stronger connections between agencies serving the same community. Staff at HFHS mentioned the development of their relationship with vendor Peaches and Greens.
Advice for Any New Sites
Program staff also offered their advice for any new sites joining the Fresh Prescription program in the coming years. Key themes that emerged included:
Have Patience & Be Flexible
Fresh Prescription program staff advised new sites to be patient and flexible; starting a new program takes time, particularly gaining buy-in from key stakeholders and recruiting new participants to join a program that they may have never heard of before.
Get the Whole Organization Involved
Program staff encouraged future sites to involve all members of their team – from the doctors to medical assistants to interns – in promoting the Fresh Prescription program to participants.
Get the Word Out, But Emphasize Quality
Program staff advised new sites to start promoting the program as early and as widely as possible, and yet keep in mind program quality over quantity.
Choose Locations & Schedules Strategically
It is important to have the prescribing clinic and the market or box pick up located at the same site, and to align clinic hours and food distribution schedules to accommodate the transportation needs of the target population. Be prepared, think strategically, and walk through each and every step.
“It’s really strengthening those connections within this
community [because] we all serve the same community but there’s so many of us and we’re all doing
different things.” – Program Staff
“Some people they talk to the patients and connect to the patients
and if the medical assistant is passionate, they might advise the patient and would tell them, “Hey, ask your doctor about this!” Just to
not leave the whole responsibility on the doctor... It needs to be a team
effort.” – Program Staff
“Think quality over quantity… It’s one thing when you have to reach a 100
people and have them only come twice and it’s another thing to have
them reach 50 people and have them complete the entire 4 weeks.”
– Program Staff

Fresh Prescription Program Final Evaluation Report
49
2015-16 Fresh Prescription Implementation
Each Fresh Prescription site tailored the fundamental program model to meet the needs of their constituents. This section describes the key factors that facilitated program success across sites, as well as those factors that may have interfered with program implementation.
Please consult the logic models and “Site Snapshots” in Appendix I for more details on how each 2015-16 Fresh Prescription site structured their program.
The logic models outline the inputs, key activities, outputs, and expected outcomes at each Fresh Prescription site and for the program overall. The purpose of these logic models is to help sites visualize and set goals for the Fresh Prescription program in the years to come.
The “Site Snapshots” describe each Fresh Prescription sites’ scope, implementation, engagement, market/box pick-up attendance rates, strengths, and areas for improvement. Furthermore, they include factors that facilitated implementation, factors that interfered with implementation, and the benefits of the Fresh Prescription Network to each site. The “Snapshots” also summarize the key themes that emerged from the qualitative data collected through interviews at each site.
Figure 25. 2015-16 Fresh Prescription Site Locations

50
Table 2. Key Facilitating Factors that Emerged Across Multiple Fresh Prescription Sites
Factors that Facilitated Program Implementation
Program stakeholders identified a number of key factors that facilitate program success: financial accessibility for participants, an engaging market atmosphere, consistent market schedules that align with clinical visits, and provider/staff engagement (see Table 2).
Financial Accessibility
The ability for Fresh Prescription participants to receive nutrition consultation and fresh fruits and vegetables free of charge was central to the success of the program. For example, participants at HFHS suggested that not having to spend one’s own money facilitates participants trying new fruits and vegetables.
Market/Box Pick-Up Atmosphere
Lively and interactive market/box pick up atmospheres help to encourage participant attendance and engagement. For example, having a cooking demonstration and multiple vendors at CHASS was appreciated by participants. Similarly, the engaged vendors, chef, music, and community-oriented feeling at Joy-Southfield was very important to the success of the program.
Market/Box Pick-Up Schedule
Aligning the purchase or pick up of produce with other activities (e.g. appointments at the health care clinic, exercise classes) was helpful for participants. For example, program staff at HFHS noted that having the market on the same day as clinical appointments was convenient, because the participants did not have to return to HFHS on another day.
Provider & Staff Engagement
The engagement of health care providers and program staff facilitated the initial referral process for program participants. For example, a program staff member at CHASS noted that health care providers “who were committed and engaged in the program and who really believed in the nutrition side of disease control” facilitated program success.
Financial
Accessibility Market
Atmosphere Market
Schedule Provider/Staff Engagement
AIHFS
CHASS
HFHS
Joy-Southfield
Mercy Primary Care Center
“You know I’m not wasting any money and I think that’s a huge
factor in terms of trying new fruits and vegetables. ‘Okay. I want to try it,
but if I try it and I don’t like it I’m going to waste my money.’”
– Participant

Fresh Prescription Program Final Evaluation Report
51
Factors that Interfered with Program Implementation
During the interview process, program staff and other key constituents also identified a number of challenges faced by the Fresh Prescription program at each of the participating sites. The four key challenges that emerged across multiple Fresh Prescription sites were a lack of access to reliable transportation, market schedules, limited referrals, and a lack of sustainable funding (see Table 3).
Funding
Sites cited the lack of sustainable funding as a point of concern. The pressure of not receiving ample funding, or receiving funding too late in the season, caused a level of stress among program staff. For example, program staff at CHASS noted that funding for the 2015-16 season was confirmed just two weeks prior to the start of the market. This uncertainty makes it difficult for staff to make plans.
Market Schedule
Participants and program staff both noted concerns about market schedules. For example, participants at Mercy Primary Care Center noted that the market time did not coincide with available appointment times, and talked about the difficulty of conflicting work schedules. Participants at CHASS observed that those individuals who could not visit CHASS on Thursday mornings were unable to pick up their prescription dollars. Participants also talked about scheduling the market at the beginning of the week, so that they could plan the rest of their shopping accordingly.
Limited Referrals
Without a certain number of referrals from health care providers, it is difficult for sites to meet their enrollment goals. For example, the fact that participant recruitment at HFHS only took place on Monday mornings limited the scope of their program; because there was a limited number of appointments on Monday mornings, only so many referrals could be made. Furthermore, because the dietitian was only available on Mondays, those participants who visited the clinic later in the week would have to return again on Monday.
Moreover, program staff across sites noted that provider engagement takes time to cultivate. Accordingly, a lack of provider engagement can be particularly challenging for first-year sites. Interviews with program staff indicated that while health care providers support the idea of the Fresh Prescription program, referring patients to the program was not always a top priority. With lots of responsibilities and limited time, providers are not always able to discuss the Fresh Prescription program with eligible patients.
“Unfortunately, we did not meet that target of 30… when it came down to
referring participants to the program, [the referrals] just happened to fall to the
way side. I know as a provider, they are seeing a lot of patients in a short amount of time and they have just a few minutes
with one patient… asking them to implement this, I think, it was a little bit
of a challenge for them… and I don’t necessarily think that was a priority. Not that they didn’t care, it’s just not on their
list of priorities.’” – Program Staff
“It was one of these things where you have to remember [the program’s] going on.’”
– Provider

52
Table 3. Key Challenges that Emerged Across Multiple Fresh Prescription Sites
Transportation The most frequently mentioned factor limiting program implementation was participants’ lack of access to reliable transportation. Particularly for participants with mobility issues or participants who lived far away from the sites, it was difficult to get to the sites to receive education and purchase fresh fruits and vegetables. For example, program staff at AIHFS discussed how difficult it was for participants with wheelchairs, walkers, or canes to come to AIHFS to pick up their box of produce. At Joy-Southfield, program staff noted that transportation was difficult for participants who did not live close enough to walk, particularly due to the construction on Joy Rd this season and limited bus availability.
Funding Market Schedule Referrals Transportation
AIHFS
CHASS
HFHS
Joy-Southfield
Mercy Primary Care Center
“…I see this woman and she’s in a wheel chair and she needs help… and you know,
in theory it was a good idea to give her this prescription because she obviously
needs it, but how is she gonna get here?” – Program Staff

Fresh Prescription Program Final Evaluation Report
53
Feedback on the Fresh Prescription Network
Over the course of the 2015-16 market season, central Fresh Prescription stakeholders – Ecology Center staff, program staff, key providers, and key vendors – had the chance to meet together periodically to share updates, discuss successes and challenges, and collaborate. This group of stakeholders was referred to as the Fresh Prescription Network. This section outlines the ways that this Network benefits Fresh Prescription sites, as well as areas for improvement in the future.
Benefit to Fresh Prescription Sites
Fresh Prescription Network members reported benefits to participating in the Network, both on site and program levels.
On the site level, participation in the Network allowed program staff to form a peer support network of like-minded individuals who, as a CHASS staff member noted, “believe in what food can actually do for health.” Participation in the Network also allowed sites to standardize some materials, such as the pre-program and post-program surveys. The support and leadership of the Ecology Center also helped sites to stay on track and connect with each other.
On the program level, the existence of the Fresh Prescription Network allowed members to compare the pros and cons of different models, and helped them to understand the “big picture” impact of their work on the food and health systems. The Network strengthened the Fresh Prescription program as a whole by encouraging members to share ideas and learn from one another. Furthermore, the Network may catalyze the process of applying for program funding.
Network Collaborations
Participation in the Fresh Prescription Network also facilitated collaboration among sites, vendors, and other local food system organizations. Existing collaborations were strengthened, and new collaborations formed. For instance, program staff at Joy-Southfield noted that participating in the Network helped the site to connect and collaborate with vendors. Program staff at Mercy Primary Care Center noted that it was helpful know about other Fresh Prescription program locations to which participants could be referred if it would was more convenient for them.
“[The Fresh Prescription Network] is a group of people who are thought
provoking… and can talk about past successes and can talk about what
worked here and what worked there. That’s been huge.” – Program Staff
“[The Ecology Center is] a wonderful partner. They go above and beyond,
helping us to make sure that everything runs smoothly with their leadership.
Wow! They do good work…so it’s nice to have a network that everyone helps for
the greater good.” – Program Staff

54
Resources Fresh Prescription sites identified three key resources gained through participation in the Network: shared data, knowledge and experience, and helpful technology. Participation in the Network allowed for shared data of the same kind to be collected to demonstrate the impact of Fresh Prescription on a larger scale. Through the Network, helpful knowledge and experience was shared that enabled the markets to run well. The Network also provided access to helpful technology, specifically the iPads and debit cards received through the Ecology Center.
Network Areas for Improvement
Fresh Prescription stakeholders identified a number of areas for improvement. First and foremost was a concern for the sustainability of the program, specifically how to make the program sustainable and what measurements to use to track program impact long-term.
There was also a request for greater engagement by the Ecology Center; the Ecology Center was reportedly instrumental in program development for the last couple of years, but was less present this year. Additionally, it was suggested that the last year of the program was more disorganized and chaotic, perhaps in part because “people were pulled in a lot of directions.” More organization of the program would be helpful. Along these lines, it may be helpful to have a “common vision that becomes customized for individual programs.”
It was also suggested that some Fresh Prescription Network processes could be streamlined and grounded in evidence-based practices moving forward.
“A challenge for all of us is to really think about and come to the realization how to make it
bigger, better, and more sustainable...We don’t know what the measures are going to be to make
this program successful.” – Program Staff
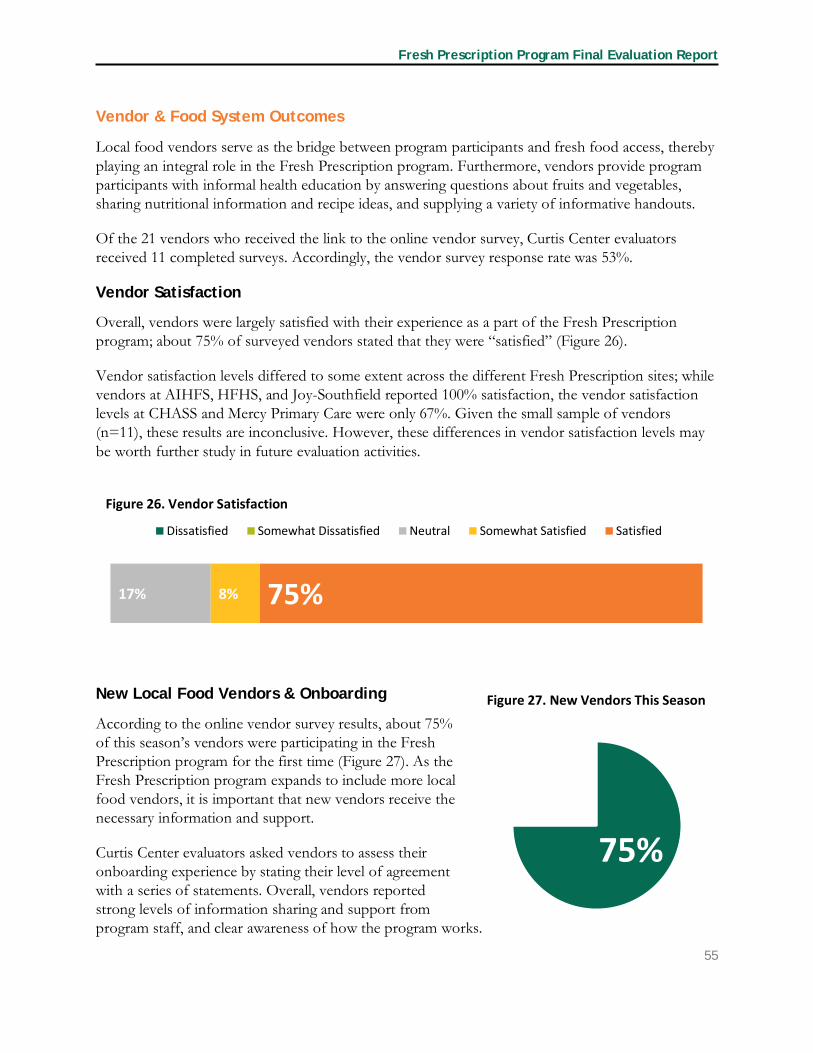
Fresh Prescription Program Final Evaluation Report
55
Figure 27. New Vendors This Season
Vendor & Food System Outcomes
Local food vendors serve as the bridge between program participants and fresh food access, thereby playing an integral role in the Fresh Prescription program. Furthermore, vendors provide program participants with informal health education by answering questions about fruits and vegetables, sharing nutritional information and recipe ideas, and supplying a variety of informative handouts.
Of the 21 vendors who received the link to the online vendor survey, Curtis Center evaluators received 11 completed surveys. Accordingly, the vendor survey response rate was 53%.
Vendor Satisfaction
Overall, vendors were largely satisfied with their experience as a part of the Fresh Prescription program; about 75% of surveyed vendors stated that they were “satisfied” (Figure 26).
Vendor satisfaction levels differed to some extent across the different Fresh Prescription sites; while vendors at AIHFS, HFHS, and Joy-Southfield reported 100% satisfaction, the vendor satisfaction levels at CHASS and Mercy Primary Care were only 67%. Given the small sample of vendors (n=11), these results are inconclusive. However, these differences in vendor satisfaction levels may be worth further study in future evaluation activities.
New Local Food Vendors & Onboarding
According to the online vendor survey results, about 75% of this season’s vendors were participating in the Fresh Prescription program for the first time (Figure 27). As the Fresh Prescription program expands to include more local food vendors, it is important that new vendors receive the necessary information and support.
Curtis Center evaluators asked vendors to assess their onboarding experience by stating their level of agreement with a series of statements. Overall, vendors reported strong levels of information sharing and support from program staff, and clear awareness of how the program works.
17% 8% 75%
Dissatisfied Somewhat Dissatisfied Neutral Somewhat Satisfied Satisfied
75%
2…
Figure 26. Vendor Satisfaction

56
Fresh Prescription vendors were less secure about using the scanner on the iPads to swipe participants’ reloadable cards, what to expect at the market or box pick-up, and about feeling prepared to answer questions from program participants (Figure 28).
10%
8%
10%
30%
27%
8%
8%
20%
36%
50%
50%
42%
42%
27%
40%
36%
33%
40%
50%
58%
73%
Strongly Disagree Disagree Neutral Agree Strongly Agree
Figure 28. Vendor Onboarding Process
I felt prepared to answer questions
Staff answered any questions I had
I was aware that participants would attend the market/pick up boxes
I felt supported
I felt comfortable using the scanner to swipe participants’ reloadable cards
I felt prepared to on my first day
I knew what to expect

Fresh Prescription Program Final Evaluation Report
57
Engaging with Fresh Prescription Participants
Local food vendors became crucial program allies, engaging with program participants and teaching them about healthy eating. Interacting with Fresh Prescription participants on a regular basis, vendors developed a unique perspective. The vast majority of vendors (92%) reported talking to participants about fresh food and healthy eating. Specifically, vendors and participants discussed what to look for in produce, the nutritional value and health benefits of specific items, recipes and creative ways to use produce, storage techniques, and “smart shopping.”
Vendors also emphasized so-called “gateway produce;” these produce items – typically hand held fruit like apples – are easily accessible and easy to work into one’s diet, particularly if you are not accustomed to eating fresh produce often. The idea is that once a participant incorporates “gateway produce” into their diet, it then becomes easier to start cooking with other types of produce that take more effort – like kale or Swiss chard.
Vendors also noted the importance of selling participants the fruits and vegetables that they request or relate to– even if it is not and could not be grown locally.
Changes in Foods Sold by Vendors
Vendors were also asked whether they changed the variety of foods that they sold and if so, in what ways. About 93% of Fresh Prescription vendors reported a change in the variety of foods that they sold to program participants, and provided various reasons. The reasons for changing the variety of foods sold included seasonal changes, the availability of foods at local wholesale markets, price, and the popularity of certain foods with program participants.
Curtis Center evaluators also asked vendors about the importance of various factors in selecting fruits and vegetables to sell. The top factor for vendors was the freshness of the produce; 100% of survey respondents characterized freshness as either “Important” or “Very Important.” Other top
“I was definitely giving people recipes that I use. I learned just as much from
customers about preparation as they did
from me.” – Vendor
“I think fruit and especially small hand
held fruit like apples and oranges are really the
gateway produce item to the more nutrient dense fruits and vegetables and can really help people get
them on the table.” – Vendor
“Next year we are going to break that mold a little bit and offer some more out of region world produce such as avocados and bananas and eventually respond to what the customer wants right? If our first mission is first and foremost get people to eat fruits and vegetables regardless of where
they come from.” – Vendor
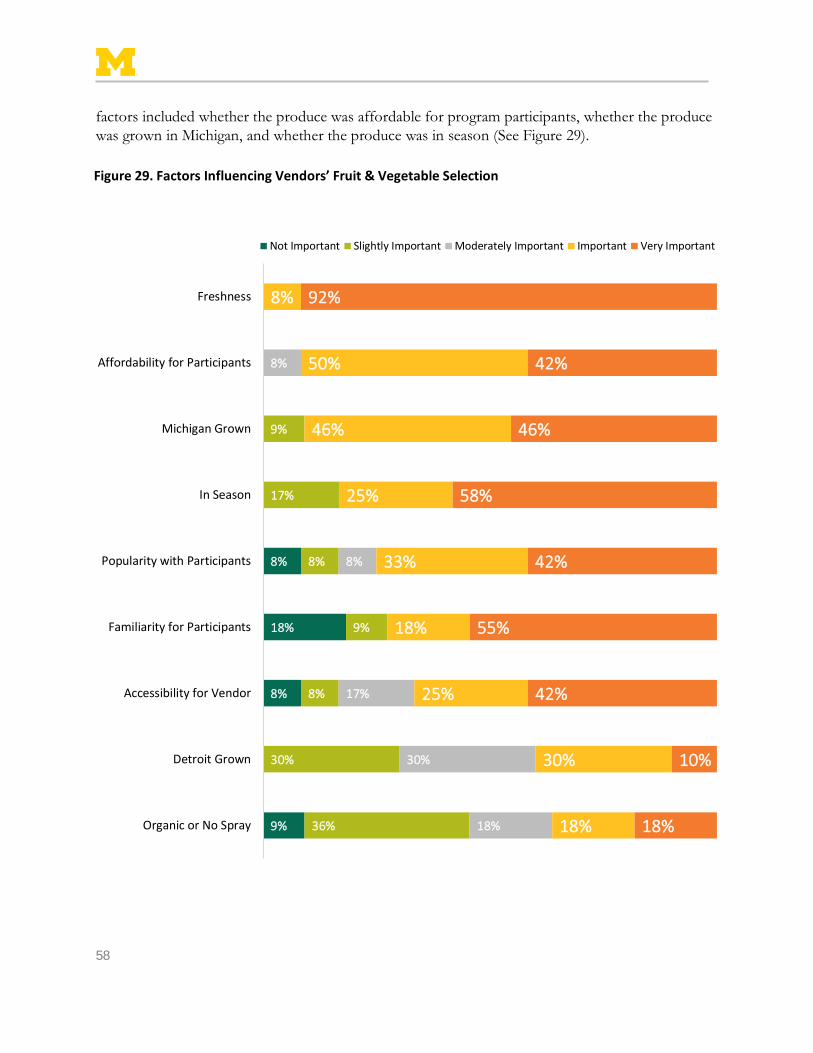
58
factors included whether the produce was affordable for program participants, whether the produce was grown in Michigan, and whether the produce was in season (See Figure 29).
9%
8%
18%
8%
36%
30%
8%
9%
8%
17%
9%
18%
30%
17%
8%
8%
18%
30%
25%
18%
33%
25%
46%
50%
8%
18%
10%
42%
55%
42%
58%
46%
42%
92%
Organic or No Spray
Detroit Grown
Accessibility for Vendor
Familiarity for Participants
Popularity with Participants
In Season
Michigan Grown
Affordability for Participants
Freshness
Not Important Slightly Important Moderately Important Important Very Important
Figure 29. Factors Influencing Vendors’ Fruit & Vegetable Selection

Fresh Prescription Program Final Evaluation Report
59
Vendors were also asked about the source of the produce sold at Fresh Prescription markets or box pick up. Overall, 73% of respondents state that the food they sold was purchased from a local farmer, wholesale market, or similar organization. Only 18% of respondents stated that their produce was grown by the vendor themselves or by an affiliated organization (See Figure 30).
Changes in Vendors’ Customer Mix
Curtis Center evaluators asked vendors whether or not they noticed changes in the mix of customers that purchased food from them as a result of the Fresh Prescription program. Vendors were relatively split on the issue: about 45% of vendors reported that they did notice a change in their mix of customers as a result of the program, while about 55% reported no change.
Vendors who reported a change in their mix of customers noted that the Fresh Prescription program allowed low-income individuals and families to buy fresh fruits and vegetables. The quotes below illustrate this change at the AIHFS box pick-up and the Joy-Southfield market:
9%
18%
73%
Figure 30. Vendor Produce Sources
Food purchased from local farmer, wholesale market, or organization
Food grown by the vendor or an affiliated organization
Combination of purchased food & food grown by the vendor
“All of the programs at AIHFS have been referring their clients to this program.
People that usually don't have the means have been able to participate in this
program.” – Vendor
“It seems low-income customers often come to the market more for the community
experience rather than the shopping experience. However, they are more willing
to purchase produce with Fresh Prescription.” – Vendor

60
Community Partnerships
Vendors were asked to report whether they had developed any new community partnerships through their involvement in the Fresh Prescription program, and whether they had enhanced any existing community partnerships. Figure 31 illustrates how 100% of vendors reported developing new relationships with Fresh Prescription program staff. About 85% of vendors also reported developing new relationships with customers and with health educators.
Figure 32 shows that vendors primarily enhanced existing relationships among Fresh Prescription program staff (70%) and other food vendors (60%).
38%
46%
54%
54%
85%85%
100%
Other participating sites
Other food vendors
Cooking demonstrators
Educational staff
Health educators
New customers
Program staff
20%
30%
30%
50%
50%
60%70%
Educational staff
Other participating sites
Cooking demonstrators
Health educators
New customers
Other food vendors
Program staff
Figure 31. Vendors who created new community partnerships
Figure 32. Vendors who strengthened existing community partnerships

Fresh Prescription Program Final Evaluation Report
61
Strengths & Areas for Improvement for Each Market or Site
The survey asked vendors to describe both the strengths and areas for improvement at each of the Fresh Prescription sites where they distributed produce. Here is how vendors described the sites:
AIHFS
Strengths: Vendors and staff described the fact that AIHFS strives to be a “one stop shop” as a strength, as well as that many participants are familiar with the space and go there frequently.
Areas for improvement: Given the mobility issues faced by multiple participants, the suggestion was made to add a delivery option. While picking up a box of fresh produce at AIHFS was convenient for participants who go to AIHFS regularly, it was difficult for people who use wheelchairs, walkers, and canes to go to AIFHS just to pick up their box.
CHASS
Strengths: Vendors enjoyed the “very nice atmosphere” at the CHASS Mercado, particularly the music, good mix of vendors, and support from friendly and passionate staff. The market was also described the Mercado as “versatile,” well-organized, and well-attended. Specific strengths included the activities, the emphasis on involving children in food selection, the food samples available at the Henry Ford table, and the fact that one vendor offered hot corn-on-the-cob at the Mercado.
Areas for improvement: A key suggestion among vendors was an increase in the number of customers, including customers from the surrounding neighborhood who may not go to the CHASS clinic. Vendors also recommended the addition of more culturally relevant products, and regularly-attending language interpreters to help vendors communicate with Spanish-speaking participants.
HFHS
Strengths: Vendors noted the foot traffic at the market, and customers’ enthusiasm for healthy eating.
Areas for improvement: Suggestions included better visibility, a larger marketing effort to promote the market, and increased participation from the employees at HFHS.
Joy-Southfield
Strengths: Vendors described the market as having a “very tight-knit” community, and were impressed by its loyal customer base. The chef who attended every week was mentioned by name, and a vendor suggested, “I believe his presence and the free food he cooked for community members attracted many people to Joy-Southfield.” Vendors also commented on the diverse, friendly, and happy nature of the customers.
“One of the biggest strengths is that the customer base was
very loyal, even though it’s small. I saw the same people every week and they seemed excited about the market. It’s not just about being able to
buy the produce, they seemed to like it just for the
community aspect of it. It was a weekly hangout spot. People sat at tables and
talked.” – Vendor

62
Areas for improvement: Vendors noted that there were a limited number of customers at the beginning of the farm stand season, likely in part to the fact that the Fresh Prescription had not yet started. The suggestion was made to increase the number of customers.
Mercy Primary Care Center
Strengths: Vendors noted the helpful staff support and the farm’s stand’s community location as key strengths. They also remarked on the potential that the site has to reach a lot of people.
Areas for improvement: Vendors from the Mercy Primary Care Center farm stand hope to see additional vendors in the future, as well as increased involvement from the other organizations that work at the Samaritan Center. Vendors also asked for access to Wi-Fi at the site.
Similarities & Differences in Food System Impacts Across Sites
The Fresh Prescription program impacts the local food system in Detroit by supporting both participants and (via the participants) local produce vendors. Overall, Fresh Prescription participants spent over $8,600 on fresh produce, and each dollar went on to support this season’s participating vendors: Burda’s Berries, Drifter Coffee, Eastern Market, Fisheye Farms, Gleaners Community Food Bank, HEY Detroit, Peaches and Greens, and Rudich Farms. The most engaged of these vendors was Eastern Market which, distributed produce at three of the five Fresh Prescription sites.
On average, each individual transaction was about $6.60.
The Fresh Prescription program further supports the local food system by encouraging participants to attend local farmers’ markets and engage in local food share programs. At the start of the 2015-16 season, 40% of participants reported “never” or “rarely” shopping at a farmers’ market or farm stand. Accordingly, the Fresh Prescription program expands the customer base for local vendors.
Site-By-Site Fresh Prescription Vendor Revenue21
CHASS: Fresh Prescription participants spent an estimated $5,500 at the CHASS Mercado in 2015-16. According to data collected by Eastern Market and shared with Curtis Center evaluators, Fresh Prescription purchases accounted for about 54% of Eastern Market’s total sales at CHASS.
HFHS: Fresh Prescription participants spent an estimated $250 during the 2015-16 season. Of that amount, about $226 were spent via the brick-and-mortar store and box delivery options.
Joy-Southfield: Fresh Prescription participants spent an estimated $2,000 at the Joy-Southfield market in 2015-16. According to data collected by Eastern Market, Fresh Prescription purchases accounted for about 44% of Eastern Market’s total sales at the Sowing Seeds, Growing Futures farmers’ market.
21 No site-level data available for AIHFS.

Fresh Prescription Program Final Evaluation Report
63
Mercy Primary Care Center: Fresh Prescription participants spent an estimated $800 at the Mercy Primary Care Center farm stand during the 2015-16 season. Fresh Prescription purchases accounted for about 26% of Eastern Market’s total sales at the Mercy Primary Care/Samaritan Center site.
Ensuring that Participation Remains Worthwhile for Vendors
Address language barriers: In order for vendors and participants at CHASS to be able to share meaningful information on healthy eating, language interpreters are invaluable. Both participants and vendors noted the importance of having Spanish language interpreters on site on a regular basis.
Customers are key: The Fresh Prescription program helps support local growers by expanding the customer base at local markets. Particularly for small-scale local growers, that increase in the customer base can be vital. If markets do not attract enough customers, it will become unfeasible for vendors to attend.
Technical assistance: In order to facilitate vendors’ experience at Fresh Prescription site, it is also important to provide them with the necessary technical support – particularly get used to using the iPads.
Changes in Vendor Revenue
Vendors were asked if they noticed a change in revenue as a result of the Fresh Prescription program, and the majority of respondents reported an increase in revenue. Table 4 below shows how vendors responded across the Fresh Prescription sites. Overall, it appears that 57% of vendors experienced an increase in revenues by participating in the Fresh Prescription program.
Increased Stayed the Same Decreased N
AIHFS 100% 0% 0% 1
CHASS 33% 50% 17% 6
HFHS 100% 0% 0% 1
Joy-Southfield 67% 33% 0% 3
Mercy Primary Care Center 67% 0% 33% 3
Average 57% 29% 14% 14
“It was a lifeline at that market for our business… it was the reason we kept going to that market, because we knew we had Fresh Prescription customers there. I guess that kind of means that Fresh Prescription was supporting us as well through the
customers. ”– Vendor
“A lot of vendors hadn’t used technology like that, and it was
interesting to see everyone getting used to using an iPad. There was a bit
of a learning curve there too! ” – Program Staff
Table 4. Changes in Vendor Revenue

64
Considerations for Next Steps
Share the Program’s Strengths
The Fresh Prescription program positively impacts not only program participants and their families, but also the organizations that participate in Fresh Prescription, affiliated health care providers, and local food vendors. Sharing the positive results of this report will help capture the attention of potential allies in the local food and health care spheres, and increase the Fresh Prescription program’s potential do good in the community.
Community
Sharing the strengths of the Fresh Prescription program with the larger Detroit community may help increase awareness of the program and attract new participants. Learning more about the program may also encourage other clinics, farmers’ markets, or food share programs to get involved.
Health Care Providers
Sharing the results of the Fresh Prescription season with health care providers may help to increase buy-in among providers and assist in recruiting “champion” physicians. Specifically, health care providers may be interested in the data on participants’ A1C levels, self-reported health status, and managing chronic health conditions. Providers may also be interested to hear about the subtle changes in clinical interactions, and the impact of the program on participant attitudes and behavior.
Local Vendors
Sharing the results of the 2015-16 season with local food vendors may help to attract new vendors for the Fresh Prescription program and increase the variety of produce available to participants. In particular, sharing sales data and the data on how the Fresh Prescription program increases the number of customers at farmers’ markets may interest vendors in getting involved.
Potential Funders
Sharing the results from the 2015-16 Fresh Prescription season may also help to attract potential sources of funding. Data on the participant, provider, organization, and vendor outcomes may help stakeholders to make the case for Fresh Prescription’s continued growth.

Fresh Prescription Program Final Evaluation Report
65
Address Existing Challenges
Collaboration & Organization
Strengthening and further organizing Fresh Prescription Network efforts may help to support sites’ program staff and facilitate collaboration among the sites. In addition, actively and systematically seeking funding as a group may help to limit the pressure on individual Fresh Prescription sites.
Increase Number of Referrals
By enhancing buy-in among participating health care providers and recruiting more individual health care providers, the Fresh Prescription program may increase the number of referrals. Implementing the ERM screening process utilized at CHASS may also facilitate this process and relieve some of the pressure off the health care providers. While hearing about the Fresh Prescription program from one’s health care provider is ideal, receiving a letter marketing the program and clearly explaining the key benefits of the program may help Fresh Prescription to reach more individuals across sites.
Increase Staff Support for Program
Additional staff support at Fresh Prescription sites, particularly those with lower attendance rates, may help to further improve participants’ experience. Such staff support may come in the form of assistance with follow-up phone calls to participants; the engagement of new interns in the program; or staff collaboration and assistance across Fresh Prescription sites.
Limit Transportation Issues
Given the transportation barriers described at each of the five Fresh Prescription sites, it may be helpful to expand fresh fruit and vegetable delivery options or provide access to transportation services for participants. Delivery options may be particularly helpful for participants experiencing mobility issues or participants who provide care for family members at home. Transportation to Fresh Prescription sites may be helpful for participants who are better able to leave their homes, as it would allow for the participants to engage in the peer-support aspect of the program.
Improve Program Logistics
Another key challenge to address is the issues regarding Fresh Prescription market and pick-up schedules. Specifically, the program may benefit from coordinating timing for participant convenience, i.e. coordinating with clinic schedules, adjusting market frequency, days, and times.
Address Contextual & Language Differences
It is important to ensure that sites address contextual and language differences, as they arise. Specifically, this may include the regular attendance of language interpreters at sites with a significant percentage of non-English speakers, incorporating culturally-relevant foods into cooking demonstrations or produce vendors’ selections (even if the produce items are not locally grown), and including contextually sensitive recipes and other program materials. It is also important to take context into account when designing markets and when providing education, considering the specific needs of the community and individual when possible.

66
Additional Support for Vendors
Supporting the participation of local food vendors is also central to the continued success of Fresh Prescription. Some specific ways to encourage the participation of vendors include:
• Specifically address language barriers between vendors and participants by engaging the assistance of language interpreters or bilingual staff members.
• Offer a comprehensive vendor orientation to new vendors, including a brief tutorial on how to work the Fresh Prescription app on the iPad and a list of frequently asked questions.
• Start the program earlier in the season and advertise more to increase the number of customers at the markets or box pick up programs, which could help to boost sales. This may involve handing out flyers in the neighborhoods surrounding the Fresh Prescription sites, posting flyers in clinic waiting rooms or consultation rooms, or using social media.
Implement Facilitating Factors
Market Atmosphere
Providing additional educational opportunities, cooking demonstrations, music, and fostering community could help sites create more inviting and engaging market/box pick-up atmospheres.
Participant Engagement
Including a comprehensive orientation to the program, conducting follow-up phones calls both during and after the program, and implementing additional incentive programs could help increase participant engagement.
Provider Buy-In
Engaging dedicated health care providers who believe in the goals of the program could increase the promotion of the program to potential participants and increase the number of referrals.
Consider Next Steps for Evaluation
Ensure Consistency in Data Collection Across All Sites
Uniform data collection across the participating sites will strengthen evaluation efforts and support program sustainability in future years. Here are a few ways to do this:
• Ensure that the same pre-program surveys and post-program surveys are utilized across all sites. This may involve some minor edits to the questions (i.e. including references to both markets and box pick up programs), however using the same surveys will enable participants’ results to be compared across all sites and – by increasing the N for more program outcomes and satisfaction ratings – allow for additional statistical analyses to be conducted.
• Develop a consistent list of biometric measures to collect across all sites. Similarly, collecting same type of biometric measures across Fresh Prescription sites will allow data to be

Fresh Prescription Program Final Evaluation Report
67
compared across all sites and – by increasing the N for more biometric outcomes – allow for more rigorous statistical analysis of biometric data.
Re-visit Data Collection Protocols
After seeing the results from this year’s pilot of the post-program participant survey, it may be worth re-wording a couple of questions to clarify the meaning for program participants:
• The post-program survey Question 2. “On weeks when you visited the farmers’ market, about how much did you typically spend in cash, if any, on fruits and vegetables?” should be amended to ensure that participants refer to the cash that they spend in addition to Fresh Prescription dollars. Amending this question in advance of future evaluation activities may help ensure quality data and allow a clearer spending pattern to emerge. For example, the question could be amended to: 2a. “On weeks when you visited the farmers’ market, did you spend any of your own money in addition to your Fresh Prescription dollars?” (Yes/No) and 2b. “If so, how much of your own money did you typically spend on fruits and vegetables each week?”($0/$1-$5/$6-10/$11-$15/$16-$20/$20+).
• Clarify “health” versus “health condition” in post-program survey Question 17. “I am able to manage my health conditions better” (True/False/Not Applicable [I do not have any health conditions]). Some Fresh Prescription stakeholders expressed concern that this question may have been unclear to participants. Of the 155 program participants who completed the post-program survey, only 7% of respondents (n=10) selected “Not Applicable.” This statistic may be correct due to the fact that many Fresh Prescription participants are dealing with chronic health conditions, however it may be helpful to clarify this question in the future to: 17a. “I am able to manage my overall health better.” (True/False) and 17b. “I am able to manage my chronic health condition (e.g. diabetes, hypertension, or high cholesterol) better.” (True/False/Not Applicable).
Establish Logic Models at the Start of Each Season
In the years to come, it may be helpful to establish a working logic model for the Fresh Prescription program overall and each of the participating sites at the start of each market season. These logic models may help Fresh Prescription sites to visualize the tasks that need to be accomplished for the upcoming year, and establish realistic goals and metrics for success.

68
Appendices
Appendix I: Logic Models & Site Snapshots
Overall Site Logic Model
AIHFS Logic Model & Site Snapshot
CHASS Logic Model & Site Snapshot
HFHS Logic Model & Site Snapshot
Joy-Southfield Logic Model & Site Snapshot
Mercy Primary Care Center Logic Model & Site Snapshot

Fresh Prescription Logic Model: Overall Program
Individual & System Conditions
Activities Expected Outcomes** Expected Outputs
1.1 Participants: target populations includes those with chronic diseases, with kids 0-5, pregnant women, BMI 30+, food insecurity.
1.2 Program Staff: ~25 staff including clinic staff, health educators, dietitians, nutritionists, CHWs, CSRs, market supervisors, & interns.
1.3 Providers: total # of referring providers.
1.4 Vendors: 8 vendors, including Burda’s Berries, Drifter Coffee, Eastern Market, Fisheye Farms, Gleaners Community Food Bank, HEY Detroit, Peaches & Greens, Rudich Farms.
1.5 Resource Partners: foundation & public funding sources.
1.6 Network Partners: Ecology Center, AIHFS, CHASS, HFHS, Joy-Southfield, MPCC, collaborating organizations.
1.7 Evaluation: external evaluation group.
3.1 Recruitment: Referrals by providers or program staff; EMR screening at CHASS; Marketing.
3.2 Initial Engagement: 3.2a Assessments by clinicians. 3.2b Program orientations. 3.2c Nutrition education. 3.2d Goal setting.
3.3 Produce distribution: 3.3a Seasonal or year-round. 3.3b Weekly or monthly. 3.3c Market or box pick-up. 3.3d Up to $60; loaded in $10 increments weekly or used to pay for produces box for 3 months.
3.4 Activities offered to participants: Activities include nutrition education, cooking demonstrations/tastings, exercise or dance classes, recipe cards, & activities for kids.
3.5 “Behind-the-Scenes” 3.5a Staff/program planning. 3.5b Phone outreach. 3.5c Vendor engagement/pay. 3.5d Network participation.
3.6 Sustainability Efforts: 3.6a Gather data for evaluation. 3.6b Dissemination of results. 3.6c Funding efforts.
Participants: 1. Increase knowledge of how
food impacts health. 2. Increase servings per day of
fruits & vegetables. 3. Increase knowledge of how to
select, prepare, & store fresh fruits & vegetables.
4. Decrease in servings of unhealthy foods per day.
5. Increase knowledge of where to access healthy food options year-round.
6. Improve overall health status & management of chronic health conditions.
Program: 1. Ensure sustainable funding for
the program. 2. Organized collaborations
among sites, vendors. 3. Consistent data on program
outcomes across all sites. 4. Increase commitment to
health promotion through preventative lifestyle changes.
Community: 1. Collaboration between health
care & food systems. 2. Foster preventative health
measures. 3. Decrease health disparities. 4. Decease food insecurity.
4.1 # referrals, # participants, # household members reached, # of new & returning vendors.
4.2 % participants who set goals, # of participant assessments.
4.3 $ spent/$ loaded, # boxes distributed, attendance data, % change in food insecurity levels, % change in ability to find produce in community, % increase in fruit and vegetable consumption, % improved health status (reported and biometric data).
4.4 # of activities offered, # of attendees at activities, # of incentives distributed, % with increase in knowledge about produce consumption, preparation, & storage.
4.5 % initial/follow-up phone calls made, #/% Network meetings attended by program staff.
4.6 % completion pre-program and post-program surveys, # public presentations, $ secured to sustain the program/timing of funding.
Major Components
* The italicized items are suggested items that can be defined by the Network or removed if not applicable. ** These outcomes are consistent across all sites; they represent the overall goals of the Fresh Prescription program.
2.6 Program Sustainability
2.5 Program Administration
2.4 Education & Activities
2.3 Filling the Prescription
2.2 Participant Assessment
2.1 Initial Engagement

Fresh Prescription Logic Model: American Indian Health & Family Services*
Individual & System Conditions
Activities Expected Outcomes** Expected Outputs
1.1 Participants: AIHFS clients with chronic disease, pregnant women, & caregivers of children.
1.2 Program Staff: Ashley Toumi, CEO; Rosebud Schnieder, Healthy Start CHW/ WIC Breastfeeding Peer; Michele Ramsey, Nutritionist/Fitness Instructor; Shiloh Maples, SNAP-Ed & BALAC; Chantel Henry, REACH Coord; & Interns.
1.3 Providers: n/a; referrals made by AIHFS staff members.
1.4 Vendors: 1 vendor; Gleaners Community Food Bank (GCFB).
1.5 Resource Partners: foundation & public funding sources.
1.6 Network Partners: Ecology Center, GCFB, Nutritionist through Healthy Start.
1.7 Evaluation: external evaluation group.
3.1 Recruitment: Referred by staff to nutritionist; Recruitment through all departments; Screening process; Marketing of program.
3.2 Initial Engagement: 3.2a Weight, height, & waist circumference measurements, dietary questionnaire. 3.2b Program orientation. 3.2c Nutrition education from nutritionist. 3.2d Goal setting with nutritionist.
3.3 Produce distribution: 3.3a Year round. 3.3b Monthly pick-up. 3.3c Produce box pick-up. 3.3d Small or large box options.
3.4 Activities offered to participants: Nutrition education, recipe cards, & exercise classes.
3.5 “Behind-the-Scenes” 3.5a Staff/program planning. 3.5b Calls during the week before & day of delivery. 3.5c Vendor engagement/ payment. 3.5d Network participation.
3.6 Sustainability Efforts: 3.6a Gather data for evaluation. 3.6b Dissemination of results. 3.6c Funding efforts.
Participants: 1. Increase knowledge of how
food impacts health. 2. Increase servings per day of
fruits & vegetables. 3. Increase knowledge of how to
select, prepare, & store fresh fruits & vegetables.
4. Decrease in servings of unhealthy foods per day.
5. Increase knowledge of where to access healthy food options year-round.
6. Improve overall health status & management of chronic health conditions.
Program: 1. Ensure sustainable funding
for the program. 2. Organized collaborations
among sites, vendors. 3. Consistent data on program
outcomes across all sites. 4. Increase commitment to
health promotion through preventative lifestyle changes.
Community: 1. Collaboration between health
care & food systems. 2. Foster preventative health
measures. 3. Decrease health disparities. 4. Decease food insecurity.
4.1 # referrals, # participants, # household members reached, # of new & returning vendors.
4.2 % participants who set goals, # of participant assessments.
4.3 $ spent/$ loaded, # boxes distributed, attendance data, % change in food insecurity levels, % change in ability to find produce in community, % increase in fruit and vegetable consumption, % improved health status (reported and biometric data).
4.4 # of activities offered, # of attendees at activities, # of incentives distributed, % with increase in knowledge about produce consumption, preparation, & storage.
4.5 % initial/follow-up phone calls made, #/% Network meetings attended by program staff.
4.6 % completion pre-program and post-program surveys, # public presentations, $ secured to sustain the program/timing of funding.
Major Program Components
2.6 Program Sustainability
2.5 Program Administration
2.4 Education & Activities
2.3 Filling the Prescription
2.2 Participant Assessment
2.1 Initial Engagement
* The italicized items are suggested items that can be defined by the organization or removed if not applicable. ** These outcomes are consistent across all sites; they represent the overall goals of the Fresh Prescription program.

Fresh Prescription Program Final Evaluation Report
69
Site Snapshot: American Indian Health & Family Services
Overview
Scope: For the sake of this report, Curtis Center evaluators analyzed data from 60 AIHFS participants from the 2015-16 season. The AIHFS “Fresh Food Share” program (Fresh Prescription) differed from the other sites’ programs in that its fruit and vegetable prescription program is available year-round, as opposed to just during the summer and early autumn. Accordingly, participants were still receiving prescriptions at the time that data collection ended.
Implementation: Participants received a monthly prescription to participate in the fresh fruit and vegetable box pick up program – in partnership with Gleaners Community Food Bank – for a total of three months. Referrals were made by program staff, with a focus on individuals with chronic disease, pregnant women, and individuals with children. Assessments were conducted by a nutritionist, who then assigned each participant a size and type of box, depending upon the participant’s specific need and household size. The box options included (1) a small fruit box, (2) a small fruit and vegetable box, and (3) a large fruit and vegetable box. Participants received nutrition education and recipe cards from AIHFS program staff, and had access to exercise classes that took place on the same day as the
monthly fruit and vegetable box pick up days (Fridays). The AIHFS program staff see Fresh Prescription as a great way to get participants involved in the box pick up program, and encourage them to stay with the program once their prescription dollars are gone.
Engagement: According to interviews with program staff, AIHFS participants were reportedly “very engaged” in the program, participating in education activities, picking up their fresh produce boxes, and even continuing to order fruit and vegetable boxes after their prescription dollars were spent. One participant indicated in an interview that they would continue ordering the produce boxes even without the prescription dollars because of the “great value” of the program.
Participant Outcomes
Attendance & Prescription Utilization
While box pick-ups were still in progress at the end of data collection, Curtis Center evaluators received box pick up data on 30 AIHFS participants. Of those participants, about 82% had picked up all three of their prescribed boxes. About 15% of participants had dropped out of the program.
15%3%
82%
Discontinued 2 Boxes All 3 Boxes
Majority of AIHFS participants picked up all three prescribed produce boxes

70
Knowledge & Attitude Changes
The boxes of produce picked up by AIHFS participants included pamphlets with recipes, especially for items that the participants may have never seen before. One participant mentioned that the boxes included helpful information about how to store food and make it last. These materials helped participants learn how to cook healthy meals for their families, and how to store fresh fruits and vegetable to effectively increase their shelf life. Participants also appeared to be learning about healthy living by participating in fitness and cooking classes.
Positive Behavior Changes
Program staff and participant interviews indicate that participants are eating more fruits and vegetables, as well as expanding the variety of fruits and vegetables they are eating.
Additionally, AIHFS participants have learned to eat more frequent small meals, and to include vegetables – and not just fruit – into their diets as snacks.
Positive Health Changes
An interviewee suggested that some participants may lose weight or lose inches off their waist. A staff member noted that some participants were getting sick less frequently.
Participant Satisfaction
Participants reportedly “love the program,” and some have continued to purchase food boxes even after they no longer have the prescription. There is a waiting list with participants from the previous market season because the program prioritizes new participants. In some cases, family members of past participants enrolled so they were able to still have access to the program benefits.
Provider & Organization Outcomes
Providers: Since all AIHFS staff members were able to refer prospective participants to the Fresh Food Share program, staff members were motivated to learn about the program in order to be prepared to answer any questions posed by prospective program participants.
Organization: The Fresh Prescription program allowed the AIHFS site to offer “much needed services to [its] community and to help them increase their produce consumption.” It also allowed the site to assist low-income clients and seniors facing food insecurity, and provided a forum for nutrition education. Furthermore, it was “really motivating for staff to be able to participate and work with clients at this level.”
Partnerships: The Fresh Prescription program facilitated stronger connections between agencies, particularly those serving the same community. Program staff also mentioned exploring the possibility of a delivery option through new partnerships with Fresh Prescription-affiliated organizations.
Program Strengths
Community exchange: Participants share the information they learn and about healthy eating habits and information about the program in general with family and friends.
Education: The Fresh Prescription program provided education to parents, giving them the knowledge to “help their children eat healthy and develop properly.” The nutrition education for participants was important in increasing produce consumption.
Empowering participants: The prescription was not renewed after initial participation, in order for clients to be empowered to take responsibility in accessing their own produce.

Fresh Prescription Program Final Evaluation Report
71
Free program: The program provided food for families facing food insecurity that may not have had access to fresh produce or otherwise have been able to participate.
Use of Bridge Card: Once the funding through Fresh Prescription ended, eligible participants were able to use their Bridge Card to continue ordering boxes produce.
Variety of produce: Participants had the opportunity to try new fruits and vegetables in their produce boxes that they may not otherwise have been exposed to or selected.
Program Areas for Improvement
One-time participation: Participants often want to renew their prescription, but the program only allows for participation once.
Transportation & mobility issues: Some potential participants have mobility issues, are older adults and perhaps do not drive, or possibly are unable to get to AIHFS because they have to care for family members. Having the option of delivering to such participants could be beneficial.
Process & Implementation
Factors that Facilitated Program Implementation
Client understanding: Clarity around participants’ responsibilities is very important, especially highlighting that they have to be able to pick up the boxes.
Phone outreach: An interviewee highlighted the importance of outreach, including making phone calls to encourage people to return after their prescription is done.
Staff engagement: Engagement of program staff from other AIHFS programs facilitated referrals for the Fresh Prescription program.
Factors that Interfered with Program Implementation
Client follow through: At times, participants enrolled in the Fresh Food Share program and then, for various reasons, did not follow through and pick up their boxes from AIHFS.
Produce quantity: A program participant indicated that the quantities of produce were a challenge in some cases, and described a time when they did not know what to do with the large quantity of jalapeño peppers that they received in their produce box.
Storage space: Program staff noted that it was challenging to find room to store leftover fruits and vegetables, and to make time to prepare the food before it expired.
Transportation: Participants were sometimes unable to access the boxes of food because they lacked the transportation needed to get to AIHFS, and AIHFS does not have a formal delivery mechanism.
Participation in the Fresh Prescription Network
Benefits to the Site: Participation in the Network gave sites the opportunity to learn from one another, even though the sites do not operate exactly the same as one another. It was also encouraging to see on a larger scale what is going on “in Detroit around food sovereignty issues.”
Network Collaborations: A clinic expressed interest in securing funding to refer some clients to the year-round box program.

Fresh Prescription Logic Model: Community Health & Social Services (CHASS)*
Individual & System Conditions
Activities Expected Outcomes** Expected Outputs
1.1 Participants: clients with high blood pressure, cholesterol, diabetes, pregnant women, caregivers of children ages 0 – 5.
1.2 Program Staff: Denise Pike, Program Coordinator/CHASS Development Director; Tamara/Antonio, nutrition education; Claudia/Deliana, CHWs; & Interns.
1.3 Providers: Dr. Bryce, # of referring providers.
1.4 Vendors: 5 vendors; Eastern Market, Peaches & Greens, Burda’s Berries, Rudich Farms, & Drifter Coffee.
1.5 Resource Partners: foundation & public funding sources.
1.6 Network Partners: Ecology Center, Eastern Market, HF Generation with Promise/SNAP-Ed.
1.7 Evaluation: external evaluation group.
3.1 Recruitment: Referrals by health care providers; EMR screening for eligibility criteria; letter/calls; Marketing of program.
3.2 Initial Engagement: 3.2a Assessment with CHW. 3.2b Program orientation. 3.2c Initial nutrition education session with CHWs. 3.2d Goal setting with $10 incentive/extra week.
3.3 Produce distribution: 3.3a July to October. 3.3b Thursdays. 3.3c Market with vendors. 3.3d $10/week.
3.4 Activities offered to participants: Recipe cards, cooking demonstration, educational information, music, welcome table with info about other programs, & kids coupons.
3.5 “Behind-the-Scenes” 3.5a Staff/program planning. 3.5b Outreach phone calls. 3.5c Vendor engagement/pay. 3.5d Network participation.
3.6 Sustainability Efforts: 3.6a Gather data for evaluation. 3.6b Dissemination of results. 3.6c Funding efforts.
Participants: 1. Increase knowledge of how
food impacts health. 2. Increase servings per day of
fruits & vegetables. 3. Increase knowledge of how to
select, prepare, & store fresh fruits & vegetables.
4. Decrease in servings of unhealthy foods per day.
5. Increase knowledge of where to access healthy food options year-round.
6. Improve overall health status & management of chronic health conditions.
Program: 1. Ensure sustainable funding for
the program. 2. Organized collaborations
among sites, vendors. 3. Consistent data on program
outcomes across all sites. 4. Increase commitment to
health promotion through preventative lifestyle changes.
Community: 1. Collaboration between health
care & food systems. 2. Foster preventative health
measures. 3. Decrease health disparities. 4. Decease food insecurity.
4.1 # referrals, # participants, # household members reached, # of new & returning vendors.
4.2 % participants who set goals, # of participant assessments.
4.3 $ spent/$ loaded, # boxes distributed, attendance data, % change in food insecurity levels, % change in ability to find produce in community, % increase in fruit and vegetable consumption, % improved health status (reported and biometric data).
4.4 # of activities offered, # of attendees at activities, # of incentives distributed, % with increase in knowledge about produce consumption, preparation, & storage.
4.5 % initial/follow-up phone calls made, #/% Network meetings attended by program staff.
4.6 % completion pre-program and post-program surveys, # public presentations, $ secured to sustain the program/timing of funding.
Major Components
* The italicized items are suggested items that can be defined by the organization or removed if not applicable. ** These outcomes are consistent across all sites; they represent the overall goals of the Fresh Prescription program.
2.6 Program Sustainability
2.5 Program Administration
2.4 Education & Activities
2.3 Filling the Prescription
2.2 Participant Assessment
2.1 Initial Engagement

72
Site Snapshot: Community Health & Social Services (CHASS)
Overview
Scope: With 152 participants, the CHASS Fresh Prescription program was the largest 2015-16 Fresh Prescription site. CHASS participants spoke both English and Spanish.
Implementation: Participants received prescriptions to the CHASS Fresh Prescription program in one of two ways: (1) a direct referral from their health care provider, or (2) identification via a screening process, followed by a letter inviting individuals to participate. Assessments were conducted by community health workers, with a focus on individuals with high blood pressure, high cholesterol, or diabetes, pregnant women, or caregivers of children ages zero to five. Participants received $10 per week for four weeks via a reloadable debit card, plus an extra $10 on week five if the participants completed the goals that they set at the start of the program. Participants were encouraged to spend their prescription dollars at the weekly CHASS Mercado on Thursday mornings, which featured numerous local produce vendors, a cooking demonstration, and other health education activities. Participants were also able to visit other sites using their prescription dollars.
Engagement: CHASS participants indicated in focus groups that they would continue to buy produce at the CHASS Mercado without
program dollars, especially if the produce was priced competitively or lasted longer than produce purchased elsewhere. The fruit quality was particularly important to CHASS participants. Participants who attended the markets at least three or four times were highly engaged, while those participants with limited attendance were less engaged.
The largest group of CHASS participants (43%) reported that they visit the CHASS Mercado by themselves. About 29% of participants reported that they visit with one other adult, 20% reported going with two other adults, and 4% reported going with three other adults.
Participant Outcomes
Market Attendance & Prescription Utilization
Sixty-seven percent of CHASS participants attended the Mercado four times or more over the course of the 2015-16 season.
8% 7%
18%
67%
Once Twice ThreeTimes
Four OrMoreTimes
Over two thirds of CHASS participants attended the market 4 times or more

Fresh Prescription Program Final Evaluation Report
73
Knowledge & Attitude Changes
Program participants noted that learning more about nutrition through education and reading labels encouraged them to try new things and incorporate more fruits and vegetables into their diets. Interviews indicated that participants were initially tentative, but became more motivated to eat fresh produce and were grateful for the program, as they became more engaged.
Positive Behavior Changes
Interviews suggest that participants are including more fruits and vegetables in their diets, and that they are able to use the money they save because of the Fresh Prescription program on other food items.
Positive Health Changes
A1C levels, cholesterol, and blood pressure were reported to have decreased for some Fresh Prescription program participants.
The interviews also suggested that some people feel better overall, with some noting increased bowel movements. Additionally, it was suggested that the shift to eating more produce can inspire other important changes, such as increased water consumption and exercise.
The market also provides a space for social engagement that may be beneficial to participants.
Interviews also revealed that some participants lost weight. One participant attributed weight loss to increased fruit and water consumption and increased energy, which motivated them to walk more.
Participant Satisfaction
Participants indicated that they would continue shopping at the market even without the prescription, thereby suggesting satisfaction with the program. Participants mentioned that they appreciated the quality of the food sold, noting that it is “more organic” and that the food was fresher than produce purchased in the grocery store. Saving $40 was also identified as important for some participants, as they were able to use those resources to buy other food items. Enthusiasm regarding the program also shows in that participants are telling family and friends about the program, and inquiring about whether it will continue next year. Those who attended three or four markets were more engaged than those who attended less frequently.
Provider & Organization Outcomes
Providers: Providers at CHASS have become increasingly engaged with the Fresh Prescription program as it has grown. Interviews suggested that the program allowed the providers, at least to an extent, to engage in goal setting with the participants and demonstrate their concern for the participants’ health. A provider also reported that clients now raise questions about healthy living that they may not have brought up before.
A provider also suggested that they are now personally motivated to purchase produce more often – and encourage those who do not qualify for the Fresh Prescription program to do the same – recognizing the importance of fresh fruits and vegetables in addressing chronic disease.

74
Organization: The program promoted health in a different way than other programs; the program did not focus strictly on giving participants’ medications, but also helping people understand the importance of healthy eating and empowering them to make changes in their diets. Staff also participated in the program and may have increased their understanding of healthy eating as well. Additionally, the program allowed people to connect with other programs at CHASS.
Partnerships: The Fresh Prescription program led to a closer partnership with the Ecology Center, as well as other Fresh Prescription sites and vendors. However, a relationship was not forged with a permanent funding source, at least to the desired degree.
Program Strengths
Education: Program education on the connection between what one eats and how it affects their health was important, especially considering the impact on chronic conditions. Additionally, the cooking demonstrations were a helpful educational tool.
Food quality: Participants appreciated the quality of the produce offered at the market.
Goal setting: Encouraging participants to set goals was potentially helpful, although there was not enough support to follow up with participants regarding the goals as desired.
Free program: The program provided food for families facing food insecurity that may not otherwise be able access to fresh produce, and enabled them to spend their money on other food items.
Produce access: Many participants may not have had frequent exposure to produce in the urban Detroit context, and providing access
gave participants a chance to incorporate produce into their diets.
Program Areas for Improvement
Staffing: The program could have benefitted from additional staffing support, which would facilitate the implementation of nutrition education and allow for more follow up on participants’ goals.
Process & Implementation
Factors that Facilitated Program Implementation
Market atmosphere: The cooking demonstrations and the vendors’ presence made it “feel more like a market,” and was appreciated by participants.
Market schedule: The fact that the market took place on the same day each week was helpful for participants.
Provider engagement: Increased engagement of providers “who were committed and engaged in the program and who really believed in the nutrition side of disease control” were thought to facilitate program success.
Returning participants: It also helped having participants who had previously participated in Fresh Prescription and “knew what to expect.”
Volunteer support and enthusiasm: Having dedicated volunteers further added to the program’s success.
Factors that Interfered with Program Implementation
Funding: Interviewees at CHASS indicated the difficulty in funding, noting that in 2015
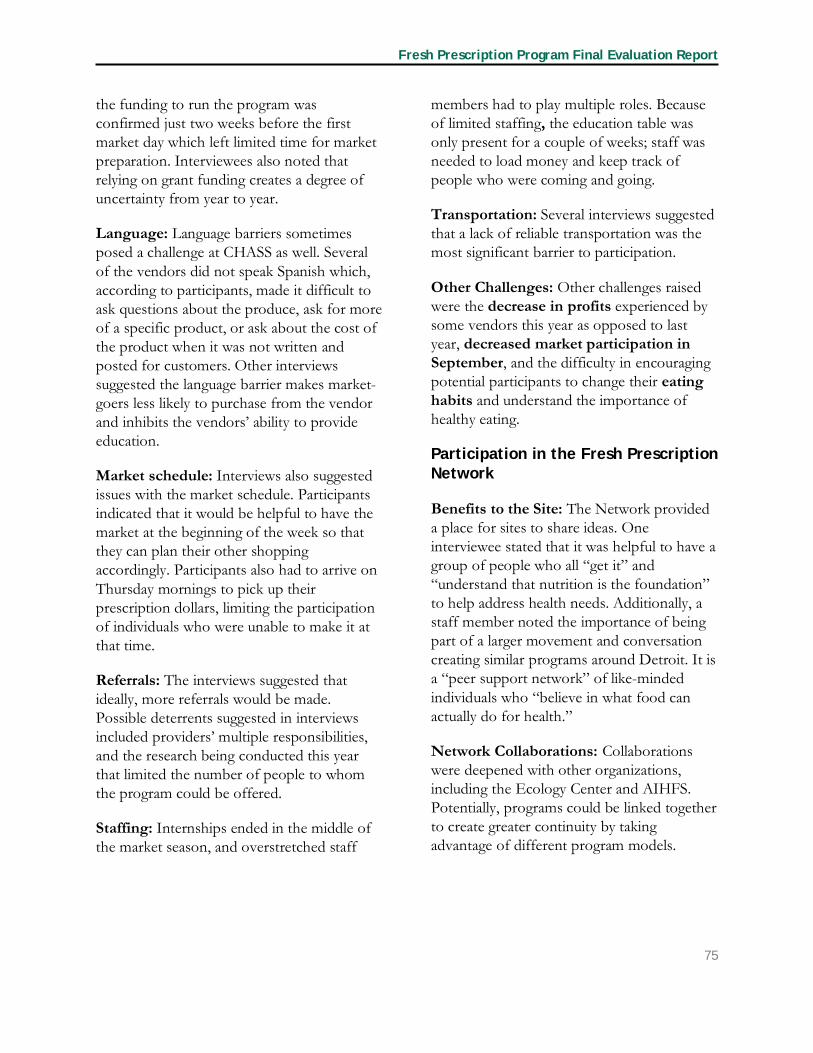
Fresh Prescription Program Final Evaluation Report
75
the funding to run the program was confirmed just two weeks before the first market day which left limited time for market preparation. Interviewees also noted that relying on grant funding creates a degree of uncertainty from year to year.
Language: Language barriers sometimes posed a challenge at CHASS as well. Several of the vendors did not speak Spanish which, according to participants, made it difficult to ask questions about the produce, ask for more of a specific product, or ask about the cost of the product when it was not written and posted for customers. Other interviews suggested the language barrier makes market-goers less likely to purchase from the vendor and inhibits the vendors’ ability to provide education.
Market schedule: Interviews also suggested issues with the market schedule. Participants indicated that it would be helpful to have the market at the beginning of the week so that they can plan their other shopping accordingly. Participants also had to arrive on Thursday mornings to pick up their prescription dollars, limiting the participation of individuals who were unable to make it at that time.
Referrals: The interviews suggested that ideally, more referrals would be made. Possible deterrents suggested in interviews included providers’ multiple responsibilities, and the research being conducted this year that limited the number of people to whom the program could be offered.
Staffing: Internships ended in the middle of the market season, and overstretched staff
members had to play multiple roles. Because of limited staffing, the education table was only present for a couple of weeks; staff was needed to load money and keep track of people who were coming and going.
Transportation: Several interviews suggested that a lack of reliable transportation was the most significant barrier to participation.
Other Challenges: Other challenges raised were the decrease in profits experienced by some vendors this year as opposed to last year, decreased market participation in September, and the difficulty in encouraging potential participants to change their eating habits and understand the importance of healthy eating.
Participation in the Fresh Prescription Network
Benefits to the Site: The Network provided a place for sites to share ideas. One interviewee stated that it was helpful to have a group of people who all “get it” and “understand that nutrition is the foundation” to help address health needs. Additionally, a staff member noted the importance of being part of a larger movement and conversation creating similar programs around Detroit. It is a “peer support network” of like-minded individuals who “believe in what food can actually do for health.”
Network Collaborations: Collaborations were deepened with other organizations, including the Ecology Center and AIHFS. Potentially, programs could be linked together to create greater continuity by taking advantage of different program models.

Fresh Prescription Logic Model: Henry Ford Health System*
Individual & System Conditions
Activities Expected Outcomes** Expected Outputs
1.1 Participants: patients with a BMI of 30 or higher.
1.2 Program Staff: Chinyere Uju-Eke, Program Coordinator; Dr. Omar, provider; Julie Fromm, RD; Christian Patterson, CSR; Barbara Blum-Alexander, Generation with Promise Director.
1.3 Providers: Dr. Omar, # of other referring health care providers.
1.4 Vendors: 1 vendor; Peaches & Greens.
1.5 Resource Partners: foundation & public funding sources.
1.6 Network Partners: Ecology Center, Generation with Promise, downtown Henry Ford Health System Clinic, SNAP-Ed, Peaches & Greens.
1.7 Evaluation: external evaluation group.
3.1 Recruitment: Referral by provider; Screening process; Marketing of program.
3.2 Initial Engagement: 3.2a Assessment by dietitian. 3.2b Program orientation. 3.2c Nutrition education upfront by registered dietitian. 3.2d Goal setting.
3.3 Produce distribution: 3.3a June – November. 3.3b Weekly. 3.3c Market (Mon.), Peaches & Greens (Tues.-Sat.) & box delivery (Tues). 3.3d $10/week (card could be loaded remotely).
3.4 Activities offered to participants: What, who, when, how, for whom? Nutrition phone education by community educator (one-on-one).
3.5 “Behind-the-Scenes” 3.5a Staff/program planning. 3.5b Outreach phone calls. 3.5c Vendor engagement/pay. 3.5d Network participation.
3.6 Sustainability Efforts: 3.6a Gather data for evaluation. 3.6b Dissemination of results. 3.6c Funding efforts.
Participants: 1. Increase knowledge of how
food impacts health. 2. Increase servings per day of
fruits & vegetables. 3. Increase knowledge of how to
select, prepare, & store fresh fruits & vegetables.
4. Decrease in servings of unhealthy foods per day.
5. Increase knowledge of where to access healthy food options year-round.
6. Improve overall health status & management of chronic health conditions.
Program: 1. Ensure sustainable funding for
the program. 2. Organized collaborations
among sites, vendors. 3. Consistent data on program
outcomes across all sites. 4. Increase commitment to
health promotion through preventative lifestyle changes.
Community: 1. Collaboration between health
care & food systems. 2. Foster preventative health
measures. 3. Decrease health disparities. 4. Decease food insecurity.
4.1 # referrals, # participants, # household members reached, # of new & returning vendors.
4.2 % participants who set goals, # of participant assessments.
4.3 $ spent/$ loaded, # boxes distributed, attendance data, % change in food insecurity levels, % change in ability to find produce in community, % increase in fruit and vegetable consumption, % improved health status (reported and biometric data).
4.4 # of activities offered, # of attendees at activities, # of incentives distributed, % with increase in knowledge about produce consumption, preparation, & storage.
4.5 % initial/follow-up phone calls made, #/% Network meetings attended by program staff.
4.6 % completion pre-program and post-program surveys, # public presentations, $ secured to sustain the program/timing of funding.
Major Components
* The italicized items are suggested items that can be defined by the organization or removed if not applicable. ** These outcomes are consistent across all sites; they represent the overall goals of the Fresh Prescription program.
2.6 Program Sustainability
2.5 Program Administration
2.4 Education & Activities
2.3 Filling the Prescription
2.2 Participant Assessment
2.1 Initial Engagement

76
Site Snapshot: Henry Ford Health System
Overview
Scope: The HFHS Fresh Prescription program engaged a total of 8 participants this year – the site’s first year participating. This site was the smallest 2015-16 Fresh Prescription program site.
Implementation: Participants were referred by a healthcare provider, and assessments were conducted by a community educator or registered dietitian. The HFHS program focused on individuals with a BMI of 30 or higher. Given the transportation concerns expressed by a number of HFHS program participants, the HFHS program offered alternatives. Participants had the option to complete their nutrition education via phone and have $10 loaded remotely onto their debit card, visit the on-site market at HFHS on Mondays, and/or visit the brick-and-mortar Peaches and Greens store on 3rd Avenue – open five days a week. HFHS participants also had the option of getting produce delivered to their home, assuming a minimum delivery amount was reached; interviews with program staff indicated that participants saved prescription dollars from multiple weeks to meet the minimum delivery order amount.
Engagement: HFHS participants genuinely sought understanding, engaging with program staff by asking for tips, additional resources and information, and by trying new produce.
Some asked for specific recipes to use these new fruits and vegetables.
HFHS participants all reported visiting the market with one other adult (100%). No participants reported attending the market by themselves or with two or more adults.
Participant Outcomes
Market Attendance & Prescription Utilization
While market attendance rates at HFHS were low, it is evident that HFHS participants utilized alternative options to engage in the Fresh Prescription program. Sixty-three percent of participants attended the HFHS market only one time, and no participants attended the market more than twice. However, 88% of total HFHS prescription dollars were spent – 89% of which was spent at the Peaches and Greens store or for the produce box delivery option. This suggests that HFHS participants took advantage of the alternative options offered by the HFHS site.
of HFHS prescription dollars spent 88% of dollars spent at store or on delivery 89%
63%38%
Once Twice
HFHS market attendance

Fresh Prescription Program Final Evaluation Report
77
Knowledge & Attitude Changes
Interviews indicated a positive change in participants’ posture toward healthy eating. Participants at HFHS reportedly became more enthused to eat fruits and vegetables as they were exposed to new items and gained confidence in their ability to build produce into their diets. It was also suggested that participants began incorporating produce into their diets in a way that made sense given their unique sociocultural context.
Positive Behavior Changes
Participants at HFHS noted an increase their motivation to eat fruits and vegetables because of the positive effects on the participants themselves, as well as the positive effect on their families.
Positive Health Changes
Participants reported feeling better and being “regular,” or having healthy bowel movements. Market participation provides a community and meaningful exchanges.
Participant Satisfaction
Participants were reportedly genuinely engaged, inquiring regarding recipes, resources, and new food items. They reported positive feedback about the program
Provider & Organization Outcomes
Providers: The program allows providers, dieticians, and community educators to interact with patients regarding nutrition, and cater the education to the specific participant. By building relationships with program participants, clinicians gain a more nuanced understanding of the barriers facing the clients and can provide education accordingly.
Providers also gain the satisfaction of providing their patients with a healthy, tangible resource.
Organization: Participation in the Fresh Prescription program demonstrated the HFHS site’s commitment to caring for patients holistically. The program at HFHS was small this year, and it was suggested that it may not have had a huge impact overall. However, the pilot program this year was an important step for HFHS and helped the organization pursue innovation by bringing together the food and health care systems.
Partnerships: The relationship developed with Peaches and Greens was positive overall; an interviewee mentioned the importance of their feedback regarding recipes. Through participating in the Fresh Prescription program, connections were made with potential program participants, other health care providers, and organizations requesting nutrition education.
Program Strengths
Delivery: The option of having the fresh fruits and vegetables delivered to one’s home helped address the barrier to produce access posed by transportation and mobility issues.
Free program: Participants did not have to pay for the produce nor pay a co-pay for the consultation with a dietitian, thereby facilitating participation. Additionally, participants were able to try new foods without the risk of spending their own money on items they potentially would not like.
Market schedule: Participants were able to access the market and attend their health care appointments at HFHS on the same trip, making market attendance more convenient.

78
Staff availability: Having someone available during the market was important for participants.
Program Areas for Improvement
Increased participation: Interviews suggested a desire to increase the number of program participants enrolled in Fresh Prescription. Improved promotion of the program in general – and especially by providers – were suggested as avenues to encourage enrollment.
Personalized education: Interviews suggested that it would be helpful for those providing education to have information about the specific dietary needs of each participant. This would enable nutrition education and produce recommendations to be catered to the individual participant. Having specific required nutrition education for all participants may be helpful.
Private space: It may be helpful to have access to a quiet space for the dietician to ask about the participants’ health and dietary needs in private.
Provider buy-in: Having additional buy-in from the providers involved with the program is vital.
Program logistics: Given that the participants may be using the produce to feed families rather than just themselves, providing larger amounts of money to spend could be helpful. Additionally, extending the program beyond four weeks may also be beneficial in establish healthy eating behaviors.
Process & Implementation
Factors that Facilitated Program Implementation
Education: It was suggested that having health education encouraging the consumption of new foods, in addition to the availability of more fruits and vegetables, facilitated the purchase of new foods.
Financial accessibility: The fact that participants were able to receive nutrition consultations without paying a co-pay was helpful. Interviews suggested that participants not having to use their own money is also helpful in getting participants to try new fruits and vegetables.
Market schedule: According to our interviews, it was helpful to have the market the same day as the clinical appointment so that participants did not have to return on another day.
Provider engagement: Provider support was noted as important facilitating factor in program success.
Type of payment: The reloadable debit cards were helpful at the market in facilitating the purchases.
Factors that Interfered with Program Implementation
Financial accessibility: The lack of free parking at HFHS was a barrier for participants.

Fresh Prescription Program Final Evaluation Report
79
Market schedule: It was suggested that the market schedule posed a significant barrier at HFHS. The market was held on Mondays from 11 am to 1 pm, which was also the only time the registered dietician was present. This made it difficult for patients who had early appointments and would have to wait for hours to see the dietician, as well as for those who came to the clinic on other days. Having such a limited window to see the dietician and to access the market was a barrier.
Referrals: Interviews suggested that because physicians have many responsibilities and a limited amount of time with patients, it may have been difficult for clinicians to propose the program to potential participants, especially because this would likely garner follow-up questions.
Transportation: Scheduling was particularly important given that many participants lacked access to reliable transportation. The lack of transportation made it difficult for participants to come to an appointment and
return for a consultation with the dietician and/or for the market.
Participation in the Fresh Prescription Network
Benefits to the Site: The Network provided a space to hear from others doing the same work, and to learn from different methods of program implementation and different perceptions.
Network Collaborations: The Network allowed for collaborations with Joy-Southfield, including education and other resources during their “off season.” Additionally, there have been relationships built with people and programs working with food systems and food security in Detroit, which has provided education and provides the potential for collaborative efforts.
HFHS also collaborated with other institutions to provide nutrition education in different settings, including schools.

Fresh Prescription Logic Model: Joy-Southfield Community Development Corp.*
Individual & System Conditions
Activities Expected Outcomes** Expected Outputs
1.1 Participants: focus on individuals who live in the neighborhood, those without fresh food access, & those who are overweight.
1.2 Program Staff: Trish Hopkins, Program Coordinator; Ethan Firestone, Market Supervisor; & Interns.
1.3 Providers: Dr. Palm; Dr. Prince, # of referring health care providers.
1.4 Vendors: 4 vendors; Eastern Market, HEY Detroit, Peaches & Greens, Fisheye Farms.
1.5 Resource Partners: foundation & public funding sources.
1.6 Network Partners: Ecology Center, Covenant Community Care; Generation with Promise, Eastern Market, NOF Fund.
1.7 Evaluation: external evaluation group.
3.1 Recruitment: Referred by provider; Screening process; Facebook marketing of market.
3.2 Initial Engagement: 3.2a Participant assessment by health care provider. 3.2b Program orientation. 3.2c Nutrition education with Generation with Promise table. 3.2d Goal setting at Generation with Promise table.
3.3 Produce distribution: 3.3a June – November. 3.3b Weekly, on Tuesdays. 3.3c Vendors at market. 3.3d $10/week for 4-5 weeks.
3.4 Activities offered to participants: Exercise/dance programs, music, recipes, health education classes, cooking demonstrations & tastings.
3.5 “Behind-the-Scenes” 3.5a Staff/program planning. 3.5b Outreach. 3.5c Vendor engagement/pay. 3.5d Network participation.
3.6 Sustainability Efforts: 3.6a Gather data for evaluation. 3.6b Dissemination of results. 3.6c Funding efforts.
Participants: 1. Increase knowledge of how
food impacts health. 2. Increase servings per day of
fruits & vegetables. 3. Increase knowledge of how to
select, prepare, & store fresh fruits & vegetables.
4. Decrease in servings of unhealthy foods per day.
5. Increase knowledge of where to access healthy food options year-round.
6. Improve overall health status & management of chronic health conditions.
Program: 1. Ensure sustainable funding for
the program. 2. Organized collaborations
among sites, vendors. 3. Consistent data on program
outcomes across all sites. 4. Increase commitment to
health promotion through preventative lifestyle changes.
Community: 1. Collaboration between health
care & food systems. 2. Foster preventative health
measures. 3. Decrease health disparities. 4. Decease food insecurity.
4.1 # referrals, # participants, # household members reached, # of new & returning vendors.
4.2 % participants who set goals, # of participant assessments.
4.3 $ spent/$ loaded, # boxes distributed, attendance data, % change in food insecurity levels, % change in ability to find produce in community, % increase in fruit and vegetable consumption, % improved health status (reported and biometric data).
4.4 # of activities offered, # of attendees at activities, # of incentives distributed, % with increase in knowledge about produce consumption, preparation, & storage.
4.5 % initial/follow-up phone calls made, #/% Network meetings attended by program staff.
4.6 % completion pre-program and post-program surveys, # public presentations, $ secured to sustain the program/timing of funding.
Major Components
* The italicized items are suggested items that can be defined by the organization or removed if not applicable. ** These outcomes are consistent across all sites; they represent the overall goals of the Fresh Prescription program.
2.6 Program Sustainability
2.5 Program Administration
2.4 Education & Activities
2.3 Filling the Prescription
2.2 Participant Assessment
2.1 Initial Engagement

80
Site Snapshot: Joy-Southfield Community Development Corp.
Overview
Scope: The 2015-16 Joy-Southfield Fresh Prescription Program engaged a total of 66 participants.
Implementation: Participants at Joy-Southfield were referred by healthcare providers at Covenant Community Care on Joy Road, directly across the street from the Sowing Seeds, Growing Futures farmers’ market. Assessments were made in partnership with health educators and dietitian from Henry Ford Health System Generation with Promise. The Joy-Southfield site focused on those living in the surrounding northwest Detroit neighborhoods, those without fresh food access, and those who are overweight. Participants received $10 per week for a total of four or five weeks via a reloadable debit card, as well as a variety of healthy eating-oriented incentives (for example, a spatula or a colander). Participants could fill their prescriptions at the Sowing Seeds, Growing Futures farmers’ market on Tuesday afternoons and early evenings. In addition to providing multiple local vendors, this market provided a chance for participants to speak
with a community educator or registered dietitian, check up on healthy eating goals, see a cooking demonstration (and taste new recipes), or participate in a dancing/exercise class. Each week at the market, participants were also encouraged to sit down to eat with their fellow participants and community members.
Engagement: Program staff indicated in interviews that participant engagement with the market was very high at Joy-Southfield. Participants “were really excited to come back every week” and routinely all of the available produce was bought from the market. They seemed to exhibit more enthusiasm for the Fresh Prescription program than is commonly seen, reporting healthy eating patterns during the week at the market. Some participants became and loyal attendees of the market, and wanted to come back and volunteer. A vendor noted that Fresh Prescription participants were “more adventurous” in their selection of produce, that participants had more conversations with the vendors because of their increased engagement.
Of all of the sites, participants at Joy-Southfield were the most likely to visit the farmers’ market with other people; only about 8% of participants reported visiting the market by themselves – compared to 34% across all sites. About 33% of Joy-Southfield participants visited the market with one other adult, and 22% visited the market with two other adults. About 22% of participants reported visiting the market with three other adults – compared to just 8% across all sites. (Table 60, Appendix III).
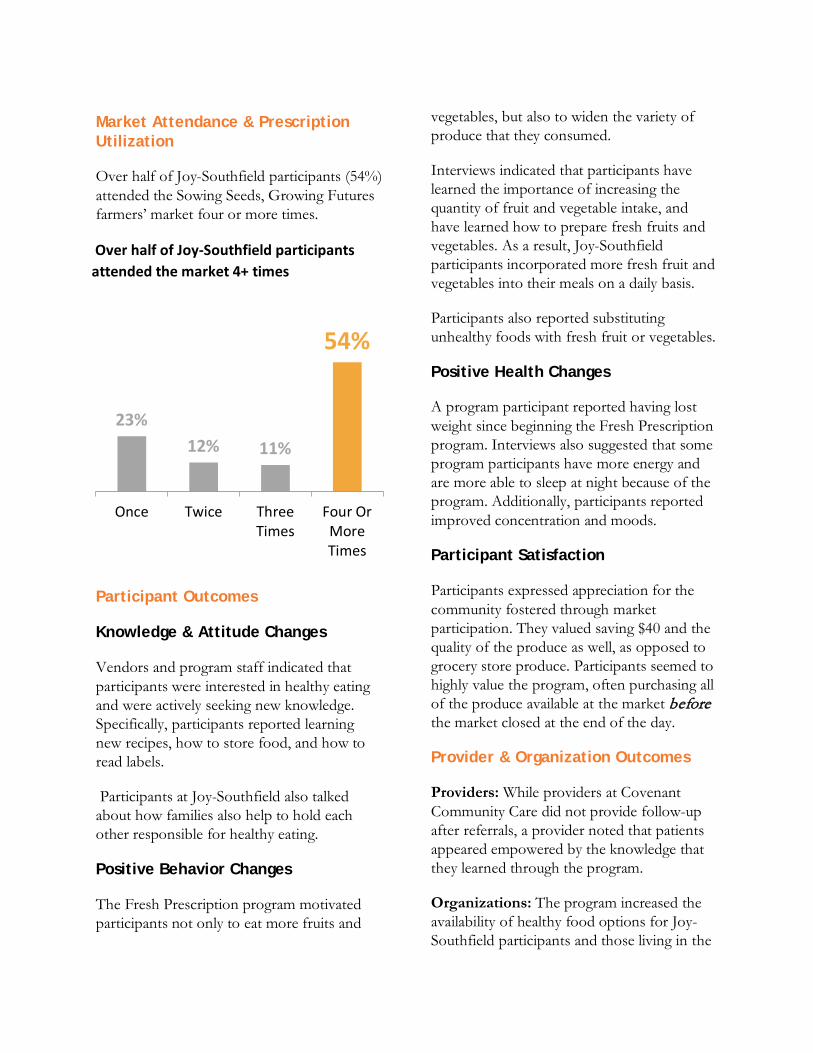
Market Attendance & Prescription Utilization
Over half of Joy-Southfield participants (54%) attended the Sowing Seeds, Growing Futures farmers’ market four or more times.
Participant Outcomes
Knowledge & Attitude Changes
Vendors and program staff indicated that participants were interested in healthy eating and were actively seeking new knowledge. Specifically, participants reported learning new recipes, how to store food, and how to read labels.
Participants at Joy-Southfield also talked about how families also help to hold each other responsible for healthy eating.
Positive Behavior Changes
The Fresh Prescription program motivated participants not only to eat more fruits and
vegetables, but also to widen the variety of produce that they consumed.
Interviews indicated that participants have learned the importance of increasing the quantity of fruit and vegetable intake, and have learned how to prepare fresh fruits and vegetables. As a result, Joy-Southfield participants incorporated more fresh fruit and vegetables into their meals on a daily basis.
Participants also reported substituting unhealthy foods with fresh fruit or vegetables.
Positive Health Changes
A program participant reported having lost weight since beginning the Fresh Prescription program. Interviews also suggested that some program participants have more energy and are more able to sleep at night because of the program. Additionally, participants reported improved concentration and moods.
Participant Satisfaction
Participants expressed appreciation for the community fostered through market participation. They valued saving $40 and the quality of the produce as well, as opposed to grocery store produce. Participants seemed to highly value the program, often purchasing all of the produce available at the market before the market closed at the end of the day.
Provider & Organization Outcomes
Providers: While providers at Covenant Community Care did not provide follow-up after referrals, a provider noted that patients appeared empowered by the knowledge that they learned through the program.
Organizations: The program increased the availability of healthy food options for Joy-Southfield participants and those living in the
23%12% 11%
54%
Once Twice ThreeTimes
Four OrMoreTimes
Over half of Joy-Southfield participants attended the market 4+ times

82
surrounding neighborhood, providing fresh food access to people who might otherwise not have access. It was especially beneficial to individuals without a dependable food source.
The Fresh Prescription program also helped address health disparities “upstream” by providing educational workshops and access to produce as part of an effort to affect the “health outlook” in the community. The program also supported the Sowing Seeds, Growing Futures farmers’ market financially, by “over doubling” the number of customers who attended the market. Furthermore, the program helped to build a community, which was important both to the organization and to the Fresh Prescription program participants.
Partnerships: Participation in the Fresh Prescription program built and solidified relationships with the Ecology Center and some of the other Fresh Prescription sites. Additionally, Joy-Southfield created partnerships with new vendors and continued relationships with longstanding vendors. In some cases, longstanding vendors helped reach out to other vendors to invite them to the Sowing Seeds, Growing Futures market.
Program Strengths
Added business: There were reportedly about twice as many costumers at the Sowing Seeds, Growing Futures farmers’ market because of the Fresh Prescription program.
Community exchange: The market became a place for people to engage with their community and “hang out.” The customer base was loyal, and some even volunteered to help. As staff member said, participants “felt like they were part of something; they knew they were welcome.”
Education: The Fresh Prescription program educated participants regarding the health implications of food consumption.
Free program: The program was offered for free, thereby encouraging participation. One staff member noted that the “free money” served as an incentive to get involved, motivating participants to engage in the nutrition education that they might not have otherwise signed up for.
Market activities: The cooking demonstrations gave participants ideas regarding how to use fruits and vegetables on a daily basis, and helped to motivate participants to try new foods.
Produce access: Because of the program, individuals from the neighborhood who would otherwise not have had access to healthy food options were provided access to fresh produce.
Produce quality: Participants reported an appreciation for the quality of the produce sold at the market.
System of payment: the card system of payment was described as easy for participants to use.
Program Areas for Improvement
Cross-site collaboration: Increased exchanges between Fresh Prescription sites would be helpful in providing insight and support among program sites.
Diverse market items: Interviews suggested having more herbs at the market, and a greater variety of offerings in general. Increasing the number of produce vendors may help this.

Fresh Prescription Program Final Evaluation Report
83
Funding: Having an organized resource-seeking effort could address the current need for funding and relieve some of the pressure on program staff. With more funding, the program could serve more people for an extended period of time.
Market schedule: Interviews suggested that extending the program to year round would be ideal. Additionally, having the market twice a week rather than once a week would be preferable according to participants. This would enable participants to access the freshest possible produce.
Program marketing: Currently, the program is spread primarily by word of mouth. It would be helpful to have an organized marketing strategy, taking into account the specific population. This may entail strategies in the community and within the clinic.
Process & Implementation
Factors that Facilitated Program Implementation
Financial accessibility: Interviews indicated the importance of “free money” to spend at the market.
Market atmosphere: Additionally, the community and atmosphere was noted as very important.
Factors that Interfered with Program Implementation
Funding: Lack of funding could limit program participation, and an organized effort to secure sustainable funding was proposed.
Market schedule: Interviews suggested that it would be helpful if the market schedule
overlapped with the Covenant Community Care schedule to a greater degree.
Payment method: The type of payment was difficult for participants in some cases, as some vendors reportedly only accepted cash. It was also suggested that payment was difficult because of issues that arose with new technology; tokens were used previously, and it took time for individuals to get accustomed to the new technology.
Referrals: Raising awareness about the existence of the Fresh Prescription program was thought to be important, as many may not know that the program was available. Once involved, participants tended to be engaged in the program.
Transportation: Transportation was mentioned as a difficulty for participants who did not live not close enough to walk to the market, particularly because of construction and limited bus availability.
Participation in the Fresh Prescription Network
Benefits to the Site: The Network was beneficial in enabling sites to standardize some materials, such as pre-program and post-program surveys. It was also helpful to share ideas regarding enrollment criteria and other aspects of program implementation, even though the programs vary from site to site.
Network Collaborations: The Network allowed for collaboration in connecting with other vendors, planning for staffing, and applying for funding. The Network was very helpful in this process.

Fresh Prescription Logic Model: Mercy Primary Care Center*
Individual & System Conditions
Activities Expected Outcomes** Expected Outputs
1.1 Participants: individuals with chronic disease, individuals & families experiencing food insecurity.
1.2 Program Staff: Alex Pipcho, Program Coordinator; Dr. Williams, “champion” provider & educator; Dr. Meyers, MPCC Medical Director.
1.3 Providers: Dr. Williams, # of referring health care providers.
1.4 Vendors: 1 vendor; Eastern Market.
1.5 Resource Partners: foundation & public funding sources.
1.6 Network Partners: Ecology Center, collaborating sites & organizations.
1.7 Evaluation: external evaluation group.
3.1 Recruitment: Referred by provider; contacted by phone; Marketing of program.
3.2 Initial Engagement: 3.2a Assessment by clinician. 3.2b Program orientation. 3.2c Initial nutrition education by Dr. Williams. 3.2d Goal setting.
3.3 Produce distribution: 3.3a June – late September. 3.3b Weekly, Tuesdays. 3.3c Vendors at farm stand. 3.3d $10/week for 4 weeks.
3.4 Activities offered to participants: Cooking matters, shopping matters (education with provider); nutrition education; recipe cards.
3.5 “Behind-the-Scenes” 3.3a Staff/program planning. 3.3b Outreach phone calls. 3.3c Vendor engagement/pay. 3.3d Network participation.
3.6 Sustainability Efforts: 3.6a Gather data for evaluation. 3.6b Dissemination of results. 3.6c Funding efforts.
Participants: 1. Increase knowledge of how
food impacts health. 2. Increase servings per day of
fruits & vegetables. 3. Increase knowledge of how to
select, prepare, & store fresh fruits & vegetables.
4. Decrease in servings of unhealthy foods per day.
5. Increase knowledge of where to access healthy food options year-round.
6. Improve overall health status & management of chronic health conditions.
Program: 1. Ensure sustainable funding for
the program. 2. Organized collaborations
among sites, vendors. 3. Consistent data on program
outcomes across all sites. 4. Increase commitment to
health promotion through preventative lifestyle changes.
Community: 1. Collaboration between health
care & food systems. 2. Foster preventative health
measures. 3. Decrease health disparities. 4. Decease food insecurity.
4.1 # referrals, # participants, # household members reached, # of new & returning vendors.
4.2 % participants who set goals, # of participant assessments.
4.3 $ spent/$ loaded, # boxes distributed, attendance data, % change in food insecurity levels, % change in ability to find produce in community, % increase in fruit and vegetable consumption, % improved health status (reported and biometric data).
4.4 # of activities offered, # of attendees at activities, # of incentives distributed, % with increase in knowledge about produce consumption, preparation, & storage.
4.5 % initial/follow-up phone calls made, #/% Network meetings attended by program staff.
4.6 % completion pre-program and post-program surveys, # public presentations, $ secured to sustain the program/timing of funding.
Major Components
* The italicized items are suggested items that can be defined by the organization or removed if not applicable. ** These outcomes are consistent across all sites; they represent the overall goals of the Fresh Prescription program.
2.6 Program Sustainability
2.5 Program Administration
2.4 Education & Activities
2.3 Filling the Prescription
2.2 Participant Assessment
2.1 Initial Engagement

84
Site Snapshot: Mercy Primary Care Center
Overview
Scope: Like HFHS, the Mercy Primary Care Center Fresh Prescription program was also in its first year. The Mercy Primary Care Center site engaged a total of 25 participants.
Implementation: Participants were referred to the Mercy Primary Care Center Fresh Prescription program by a health care provider, and a clinician conducted the initial assessment. The Mercy Primary Care Center program focused on individuals with chronic diseases, including hypertension and diabetes, as well as those experiencing food insecurity. Participants received $10 per week for a total of four weeks, as well as nutrition education and recipe cards. Mercy Primary Care Center participants could fill their fruit and vegetable prescriptions at the farm stand located outside the Samaritan Center on Tuesdays in the late morning and early afternoon.
Engagement: Overall, Mercy Primary Care Center participants were involved and excited to come to the farm stand each week. They engaged in conversations about recipes, selecting produce, and food preparation techniques, both with other participants and program staff.
Participants at Mercy Primary Care Center typically visited the farm stand by themselves (44%) or with one other adult (44%). About 16% of participants visited the farm stand with two other adults.
Market Attendance & Prescription Utilization
Almost half of Mercy Primary Care Center participants (48%) attended the farm stand near the entrance to the Samaritan Center four or more times.
Participant Outcomes
Knowledge & Attitude Changes
Program participants reported learning more about the importance of incorporating produce in their diets, how to store food, and how to prepare certain produce items. Some noted positive changes in attitudes toward eating produce as well.
Positive Behavior Changes
Participants report experimenting more with new and different vegetables, especially given that they are not using their own spending money. Additionally, it has motivated some participants to eat more fruit and vegetables, even purchasing them instead of ‘junk food.’
12%20% 20%
48%
Once Twice ThreeTimes
Four OrMoreTimes
Almost half of Mercy Primary Care Center participants attended the market 4+ times

Fresh Prescription Program Final Evaluation Report
85
Positive Health Changes
Some program participants stated they are sleeping better, feel less tired, and have more energy. Participants reported “feeling lighter” and having lost some weight. One participant noted their skin complexion seemed to be “brighter.” The interviews also suggested increased participant motivation for improving their own health.
Participant Satisfaction
According to the interviews and focus groups, participants loved the Fresh Prescription program and the opportunity to have fresh produce in their homes. They liked to be able to try new things, and were more apt to do so because of the free prescription dollars.
Provider & Organization Outcomes
Providers: While the clinical interactions with program participants may not have changed, non-participating patients have inquired about the program in visits, hoping to participate the subsequent year. A provider also described how participants are now empowered do something for their own health.
Organization: The program created an opportunity for participants to receive free nutrition education. The clinic’s focus also shifted more to eating well, “along with medications to manage chronic illnesses.” The education piece helped shape attitudes that participants could then put into practice with produce from the market. The program was also helpful in shifting attitudes regarding diet.
Partnerships: As the sole vendor during this pilot year, the relationship with Eastern Market was important to the Mercy Primary Care Center site.
Program Strengths
Education: The program allowed participants to receive education surrounding the importance of diet in managing health conditions. This was particularly important given health care providers’ limited amount of available time.
Produce access: The program allowed individuals who may otherwise not have fresh produce the ability to access healthy food and experiment with new items.
Program Areas for Improvement
Market activities: Having more education sessions, cooking demonstrations, and possibly healthy living tips would be helpful in motivating market participation and for the participants overall.
Market items: A greater variety of produce offering, especially greens.
Market schedule: Interviews suggested that having more markets, more often, and longer would be helpful, ideally expanded to beyond the summer months.
Produce access: Expanding the locations where participants could access the produce could be helpful.
Program dissemination: Interviewees suggested that more people would be interested in the program if they knew about it. One proposed area for growth is extending the program to a larger group.
86
Process & Implementation
Factors that Facilitated Program Implementation
Staff engagement: One element that was reported to facilitate the program at Mercy Primary Care was having an engaged staff member available in the office to check in with participants and walk with them to the farm stand location.
Factors that Interfered with Program Implementation
Data: Program staff suggested that ideally insurance companies would fund the Fresh Prescription program, but that additional data is needed to demonstrate program impact.
Funding: According to program staff, a lack of funding prevented Mercy Primary Care Center from providing education surrounding storing and cooking produce for example, and could limit the number of individuals to whom they could offer the program.
Market schedule: The market schedule was also presented as a barrier in the interviews. Some prospective participants were unable to attend the market on Tuesday mornings, especially given that the market time did not
coincide with available appointment times. Conflicting work schedules also presented a barrier for potential participants.
Transportation: Transportation to the market was noted as a challenge and prevented enrollment for some prospective participants, especially those participants who lived further away from the sites.
Participation in the Fresh Prescription Network
Benefits to the Site: The Network was important in allowing program staff to hear about the challenges and strengths of other programs and how barriers were addressed. It was also helpful to know that there were other locations to which participants could be referred if it would be more convenient for them. The Network was also noted as a resource to help secure funding if that became an issue.
Network Collaborations: Collaborations developed through the Ecology Center, especially at the conference where leaders from the medical community and from local food systems were present. This provided information regarding sustainability and barriers faced by programs like Fresh Prescription.

Fresh Prescription Program Final Evaluation Report
87
Appendix II: AIHFS Survey Results
Survey Data Collection Summary • Pre-Surveys Collected: 60 surveys. • Post-Surveys Collected: 29 surveys (program still in progress at end of data collection).
Note: N refers to the number of participants who responded to each question.
Fresh Food Share Box Type Table 1. Prescribed Box Size (N=58) Small Fruit Box 5.2% Small Mixed Box 19.0% Large Mixed Box 75.9% AIFHS Participant Profile Table 2. Household Members Impacted Pre-Survey (N=57) Post-Survey (N=28) Adults 111 56 Children Ages 6-17 48 16 Children Ages 0-5 27 12 Total Household Members 186 84 Table 3. Households with Young Children Pre-Survey (N=60) Post-Survey (N=29) At least one child age 0-5 32.2% 31.0% Table 4. Participant Age Pre-Survey (N=60) Post-Survey (N=28) Average Age 48 years old 51 years old Youngest Participant 20 years old 23 years old Oldest Participant 90 years old 81 years old Table 5. Participant Gender Pre-Survey (N=60) Post-Survey (N=29) Female 85.0% 96.6% Male 15.0% 3.4% Table 6. New and Expecting Mothers Pre-Survey (N=50) Post-Survey (N=27) Breastfeeding 4.3% 0.0% Pregnant 6.0% 3.7%

88
Table 7. Race & Ethnicity
Pre-Survey (N=60) Post-Survey (N=27) Native American/American Indian 26.7% 22.2% Two or more races/ethnicities 20.0% 25.9% African American/Black 20.0% 22.2% Caucasian/White 20.0% 11.1% Latino/Hispanic/Spanish 13.3% 18.5% Table 8. Household Income Pre-Survey (N=59) Post-Survey (N=29) Less Than $15,000 66.1% 44.8% $15,000-$24,999 22.0% 17.2% $25,000-$34,999 3.4% 13.8% $35,000-$44,999 1.7% 3.4% Don’t Know/Not Sure 6.8% 20.7% Table 9. Use of Assistance Programs Pre-Survey (N=54) Post-Survey (N=28) EBT/Bridge Card/SNAP 61.1% 67.9% WIC 23.3% 21.1% Project FRESH 10.0% 39.1% Double Up Food Bucks 5.1% 23.5% AIHFS Participant Shopping & Eating Behaviors Table 10. How do you rate your own health? Pre-Survey (N=60) Post-Survey (N=29) Poor 15.0% 6.9% Fair 35.0% 41.4% Good 40.0% 44.8% Very Good 8.3% 3.4% Excellent 1.7% 3.4% Table 11. How many total cups of fruits & vegetables do you usually eat a day? Pre-Survey (N=60) Post-Survey (N=29) Mean 1.7 cups 2.3 cups Minimum 0 cups 1 cup Maximum 4 cups 6 cups Note: There was a statistically significant change in fruit & vegetable consumption from pre to post among AIHFS participants. On average, fruit and vegetable consumption increased by about 0.6 cups per day. (Paired-Samples T Test; N = 29, t = -2.339, p = .027).

Fresh Prescription Program Final Evaluation Report
89
Table 11. In general, how healthy do you eat overall?
Pre-Survey (N=60) Post-Survey (N=29) Poor 8.5% 0.0% Fair 45.8% 44.8% Good 44.1% 31.0% Very Good 1.7% 24.1% Excellent 0.0% 0.0% Table 12. Where do you or someone in your household buy fresh fruits & vegetables? Pre-Survey (N=60) Post-Survey (N=29) Grocery Store 51.7% 51.7% Multiple locations 30.0% 34.5% Fruit Market 6.7% 6.9% Farmers’ Market 6.7% 3.4% Food Truck 1.7% 0.0% Corner Store 1.7% 0.0% Gas Station 1.7% 0.0% Other 0.0% 3.4% Table 13. Have you or anyone in your family ever shopped at a farmers’ market? Pre-Survey (N=60) Post-Survey (N=29) Yes 63.3% 69.0% Table 14. Last year, did you/someone in your household participate in the program? Pre-Survey (N=58) Post-Survey (N=29) Yes 3.4% 27.6% Table 15. What gets in the way of you shopping for fresh fruits & vegetables? Pre-Survey (N=58) Post-Survey (N=28) Multiple reasons 56.9% 28.6% Fresh fruit & vegetables are too expensive 22.4% 14.3% Nothing 5.2% 14.3% The market or store is too far away 3.4% 3.6% I/We don’t have reliable transportation 1.7% 17.9% Fresh fruit & vegetables are not available at all/some of the places that I shop 1.7% 0.0%
Fresh fruit & vegetables are poor quality 1.7% 3.6% Fresh fruit & vegetables are too difficult to prepare/cook 1.7% 0.0%
It is difficult to shop with children 1.7% 0.0% I/We don’t know how to select the best produce 0.0% 7.1%
Other 3.4% 10.3%

90
Table 16. During the past 7 days, how many times did you or someone else in your family cook dinner or supper at home?
Pre-Survey (N=60) Post-Survey (N=28) Minimum 0 1 Maximum 10 14 Mean 4.8 times 5.7 times Table 17. How many of these meals included vegetables? Pre-Survey (N=59) Post-Survey (N=27) Minimum 0 2 Maximum 7 14 Mean 3.5 times 5.4 times Table 18. During the past 7 days, how many times did you eat unhealthy foods? Pre-Survey (N=59) Post-Survey (N=28) Minimum 0 0 Maximum 21 7 Mean 4.0 times 3.1 times Table 19. Do your children help you prepare fruits or vegetables for snacks or meals? Pre-Survey (N=59) Post-Survey (N=28) Yes 33.9% 35.7% No 30.5% 25.0% Not Applicable 35.6% 39.3% Table 20. Do you ask your children if they want to help you pick out fruits or vegetables? Pre-Survey (N=59) Post-Survey (N=27) Yes 27.1% 40.7% No 35.6% 22.2% Not Applicable 37.3% 37.0% Table 21. In the last 12 months, did you or others in your household ever cut the size of your meals or skip meals because there wasn’t enough food? Pre-Survey (N=58) Post-Survey (N=28) Yes 53.4% 46.4% Table 22. Participant Food Security Pre-Survey (N=60) Post-Survey (N=28) I/We always have enough to eat & the kinds of food we want.
22.0% 28.6%
I/We always have enough to eat, but not always the kinds of food we want.
41.7% 50.0%
Sometimes I/we do not have enough to eat. 26.7% 17.9% Often I/we do not have enough to eat. 11.7% 3.6%

Fresh Prescription Program Final Evaluation Report
91
AIHFS Participant Knowledge & Beliefs
Table 23. “I know how to select high quality fruits & vegetables.” Pre-Survey (N=60) Post-Survey (N=29) Strongly Disagree 3.3% 0.0% Disagree 10.0% 10.3% Neutral 18.3% 24.1% Agree 35.0% 44.8% Strongly Agree 33.3% 20.7% Table 24. “I know how to prepare & cook fresh fruits & vegetables.” Pre-Survey (N=60) Post-Survey (N=29) Strongly Disagree 1.7% 0.0% Disagree 8.3% 3.4% Neutral 18.3% 10.3% Agree 40.0% 55.2% Strongly Agree 31.7% 31.0% Table 25. “I know how to store fresh fruits & vegetables to increase their shelf life.” Pre-Survey (N=60) Post-Survey (N=29) Strongly Disagree 0.0% 0.0% Disagree 10.2% 20.7% Neutral 22.0% 13.8% Agree 44.1% 48.3% Strongly Agree 23.7% 17.2% Table 26. “I feel that I am helping my body by eating more fruits & vegetables.” Pre-Survey (N=60) Post-Survey (N=29) Strongly Disagree 0.0% 3.4% Disagree 0.0% 3.4% Neutral 8.3% 0.0% Agree 43.3% 44.8% Strongly Agree 48.3% 48.3% Table 27. “I may develop health problems, or my current health problems may worsen, if I do not eat fruits & vegetables.” Pre-Survey (N=60) Post-Survey (N=29) Strongly Disagree 1.7% 10.3% Disagree 10.0% 3.4% Neutral 6.7% 6.9% Agree 48.3% 41.4% Strongly Agree 38.3% 37.9%

92
Table 28. “I can find the fresh fruits & vegetables I am looking for in my community.”
Pre-Survey (N=60) Post-Survey (N=29) Strongly Disagree 1.7% 3.4% Disagree 6.8% 3.4% Neutral 22.0% 10.3% Agree 49.2% 58.6% Strongly Agree 20.3% 24.1% Table 29. “I can count on the people around me to support me to eat more fruits & vegetables.” Pre-Survey (N=60) Post-Survey (N=29) Strongly Disagree 6.7% 3.4% Disagree 3.3% 6.9% Neutral 16.7% 24.1 % Agree 36.7% 51.7% Strongly Agree 36.7% 13.8% Table 30. “It is important to me to eat fruits & vegetables.” Pre-Survey (N=59) Post-Survey (N=29) Strongly Disagree 0.0% 3.4% Disagree 0.0% 0.0% Neutral 3.4% 10.3% Agree 33.9% 41.4% Strongly Agree 62.7% 44.8% Table 31. “If I decided to eat more fruits & vegetables, I am confident I could succeed.” Pre-Survey (N=60) Post-Survey (N=29) Strongly Disagree 0.0% 3.4% Disagree 0.0% 0.0% Neutral 3.3% 6.9% Agree 38.3% 37.9% Strongly Agree 58.3% 51.7% Table 32. Did you know that people can use their EBT/Bridge Card at many local farmers’ markets? Pre-Survey (N=57) Post-Survey (N=28) Yes 45.6% 64.3%

Fresh Prescription Program Final Evaluation Report
93
Appendix III: Site-by-Site Breakdown of Survey Results
Table 1. Survey Data Collection Summary AIHFS CHASS HFHS Joy-Sfld. Mercy Total Number of pre-surveys 60 152 8 66 25 311 Number of post-surveys 29* 90 6 36 25 186 *29 AIHFS post-surveys collected, however program was still in progress at end of data collection.
Note: N refers to the total number of participants who responded to each question.
Participant Profile Table 2. Did you participate in the Fresh Prescription Program last year?
AIHFS (n=60)
CHASS (n=136)
HFHS (n=8)
Joy-Sfld. (n=64)
Mercy (n=0)
Total (N=268)
Yes 3.3% 58.1% - 20.3% - 35.1%
No 93.3% 39.7% - 79.7% - 63.1%
Not Sure 3.3% 2.2% - 0.0% - 1.9%
Table 3. Household Members Impacted AIHFS CHASS HFHS Joy-Sfld. Mercy Total Adults 111 338 19 112 51 631 Children Ages 6-17 48 125 0 36 13 222 Children Ages 0-5 27 97 2 17 4 147 Total Household Members 186 560 21 165 68 1,000
Table 4. Households with Young Children
AIHFS (n=59)
CHASS (n=134)
HFHS (n=8)
Joy-Sfld. (n=63)
Mercy (n=24)
Total (N=288)
At least one child 0-5 32.2% 38.8% 25.0% 20.6% 8.3% 30.5% Table 5. Participant Age
AIHFS (n=60)
CHASS (n=136)
HFHS (n=8)
Joy-Sfld. (n=63)
Mercy (n=25)
Total (N=292)
Average Age 48 years 49 years 53 years 50 years 49 years 49 years Youngest Participant 20 years 21 years 46 years 18 years 29 years 18 years Oldest Participant 90 years 74 years 63 years 84 years 64 years 90 years Table 6. Participant Gender
AIHFS (n=60)
CHASS (n=135)
HFHS (n=8)
Joy-Sfld. (n=65)
Mercy (n=25)
Total (N=293)
Female 85.0% 83.0% 100.0% 61.5% 100.0% 80.5% Male 15.0% 17.0% 0.0% 38.5% 0.0% 19.5%
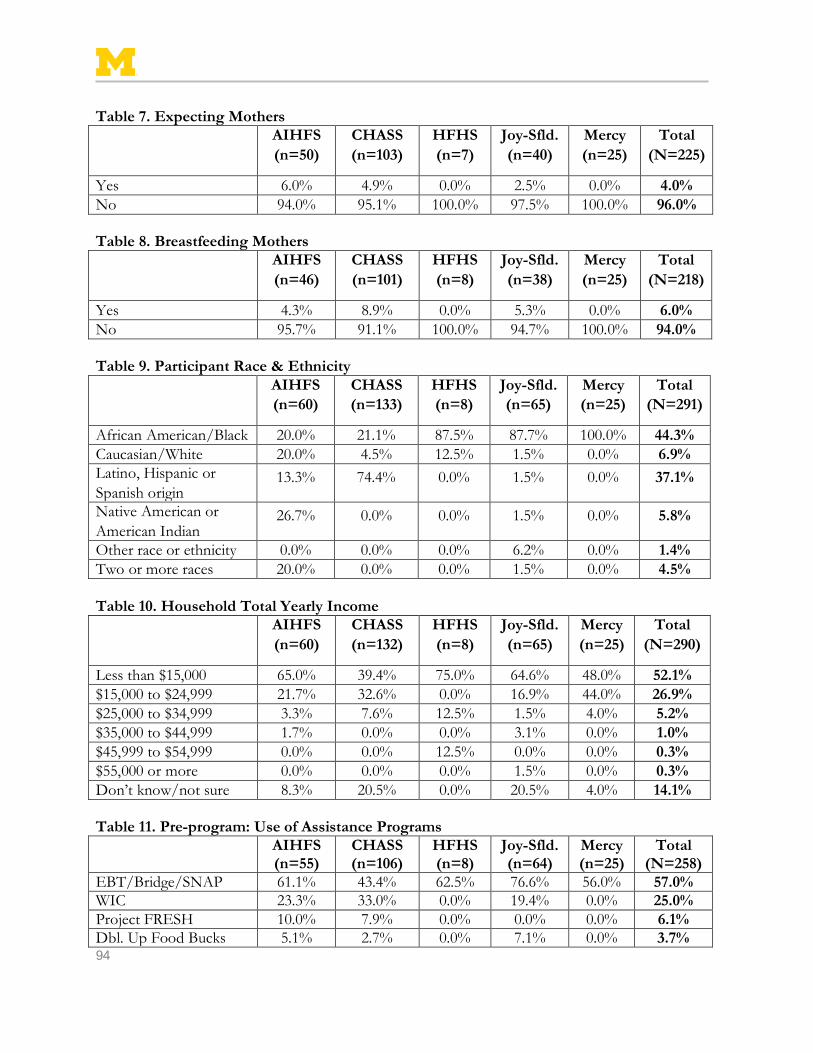
94
Table 7. Expecting Mothers AIHFS
(n=50) CHASS (n=103)
HFHS (n=7)
Joy-Sfld. (n=40)
Mercy (n=25)
Total (N=225)
Yes 6.0% 4.9% 0.0% 2.5% 0.0% 4.0% No 94.0% 95.1% 100.0% 97.5% 100.0% 96.0% Table 8. Breastfeeding Mothers AIHFS
(n=46) CHASS (n=101)
HFHS (n=8)
Joy-Sfld. (n=38)
Mercy (n=25)
Total (N=218)
Yes 4.3% 8.9% 0.0% 5.3% 0.0% 6.0% No 95.7% 91.1% 100.0% 94.7% 100.0% 94.0% Table 9. Participant Race & Ethnicity AIHFS
(n=60) CHASS (n=133)
HFHS (n=8)
Joy-Sfld. (n=65)
Mercy (n=25)
Total (N=291)
African American/Black 20.0% 21.1% 87.5% 87.7% 100.0% 44.3% Caucasian/White 20.0% 4.5% 12.5% 1.5% 0.0% 6.9% Latino, Hispanic or Spanish origin
13.3% 74.4% 0.0% 1.5% 0.0% 37.1%
Native American or American Indian
26.7% 0.0% 0.0% 1.5% 0.0% 5.8%
Other race or ethnicity 0.0% 0.0% 0.0% 6.2% 0.0% 1.4% Two or more races 20.0% 0.0% 0.0% 1.5% 0.0% 4.5% Table 10. Household Total Yearly Income AIHFS
(n=60) CHASS (n=132)
HFHS (n=8)
Joy-Sfld. (n=65)
Mercy (n=25)
Total (N=290)
Less than $15,000 65.0% 39.4% 75.0% 64.6% 48.0% 52.1% $15,000 to $24,999 21.7% 32.6% 0.0% 16.9% 44.0% 26.9% $25,000 to $34,999 3.3% 7.6% 12.5% 1.5% 4.0% 5.2% $35,000 to $44,999 1.7% 0.0% 0.0% 3.1% 0.0% 1.0% $45,999 to $54,999 0.0% 0.0% 12.5% 0.0% 0.0% 0.3% $55,000 or more 0.0% 0.0% 0.0% 1.5% 0.0% 0.3% Don’t know/not sure 8.3% 20.5% 0.0% 20.5% 4.0% 14.1% Table 11. Pre-program: Use of Assistance Programs AIHFS
(n=55) CHASS (n=106)
HFHS (n=8)
Joy-Sfld. (n=64)
Mercy (n=25)
Total (N=258)
EBT/Bridge/SNAP 61.1% 43.4% 62.5% 76.6% 56.0% 57.0% WIC 23.3% 33.0% 0.0% 19.4% 0.0% 25.0% Project FRESH 10.0% 7.9% 0.0% 0.0% 0.0% 6.1% Dbl. Up Food Bucks 5.1% 2.7% 0.0% 7.1% 0.0% 3.7%

Fresh Prescription Program Final Evaluation Report
95
Table 12. Post-program: Use of Assistance Programs AIHFS
(n=55) CHASS (n=106)
HFHS (n=8)
Joy-Sfld. (n=64)
Mercy (n=25)
Total (N=258)
EBT/Bridge/SNAP 67.9% 39.3% 83.3% 86.1% 56.0% 56.5% WIC 26.3% 27.3% 0.0% 13.9% 4.0% 20.1% Project FRESH 34.8% 17.4% 0.0% 17.1% 12.0% 18.3% Dbl. Up Food Bucks 11.8% 3.4% 0.0% 27.8% 20.0% 11.6% Table 13. Participant Access to Smartphones or Tablets AIHFS
(n=0)* CHASS (n=132)
HFHS (n=8)
Joy-Sfld. (n=62)
Mercy (n=25)
Total (N=227)
Yes - 47.0% 62.5% 61.3% 64.0% 53.3% No - 53.0% 37.5% 38.7% 36.0% 46.7% *Question not included on the AIHFS surveys.
Table 14. Smartphone Type AIHFS
(n=0)* CHASS (n=63)
HFHS (n=4)
Joy-Sfld. (n=36)
Mercy (n=16)
Total (N=119)
Apple/iPhone - 17.5% 25.0% 19.4% 6.3% 16.8% Android - 74.6% 75.0% 69.4% 87.5% 74.8% Other - 7.9% 0.0% 11.1% 6.3% 8.4% *Question not included on the AIHFS surveys. Table 15. Interest in Smartphone App to Track Diet AIHFS
(n=0)* CHASS (n=116)
HFHS (n=7)
Joy-Sfld. (n=58)
Mercy (n=24)
Total (N=205)
Yes - 65.5% 71.4% 58.6% 58.3% 62.9% No - 15.5% 28.6% 24.1% 4.2% 17.1% Maybe - 19.0% 0.0% 17.2% 37.5% 20.0% *Question not included on the AIHFS surveys. Table 16. Interest in Smartphone App to Track Exercise AIHFS
(n=0)* CHASS (n=109)
HFHS (n=6)
Joy-Sfld. (n=56)
Mercy (n=24)
Total (N=195)
Yes - 67.9% 50.0% 58.9% 58.3% 63.6% No - 14.7% 33.3% 21.4% 4.2% 15.9% Maybe - 17.4% 16.7% 19.6% 37.5% 20.5% *Question not included on the AIHFS surveys. Table 17. Interest in Smartphone App to Find Nearby Healthy Food Options AIHFS
(n=0)* CHASS (n=121)
HFHS (n=7)
Joy-Sfld. (n=58)
Mercy (n=25)
Total (N=211)
Yes - 67.8% 57.1% 79.3% 88.0% 73.0% No - 12.4% 28.6% 6.9% 0.0% 10.0% Maybe - 19.8% 14.3% 13.8% 12.0% 17.1% *Question not included on the AIHFS surveys.
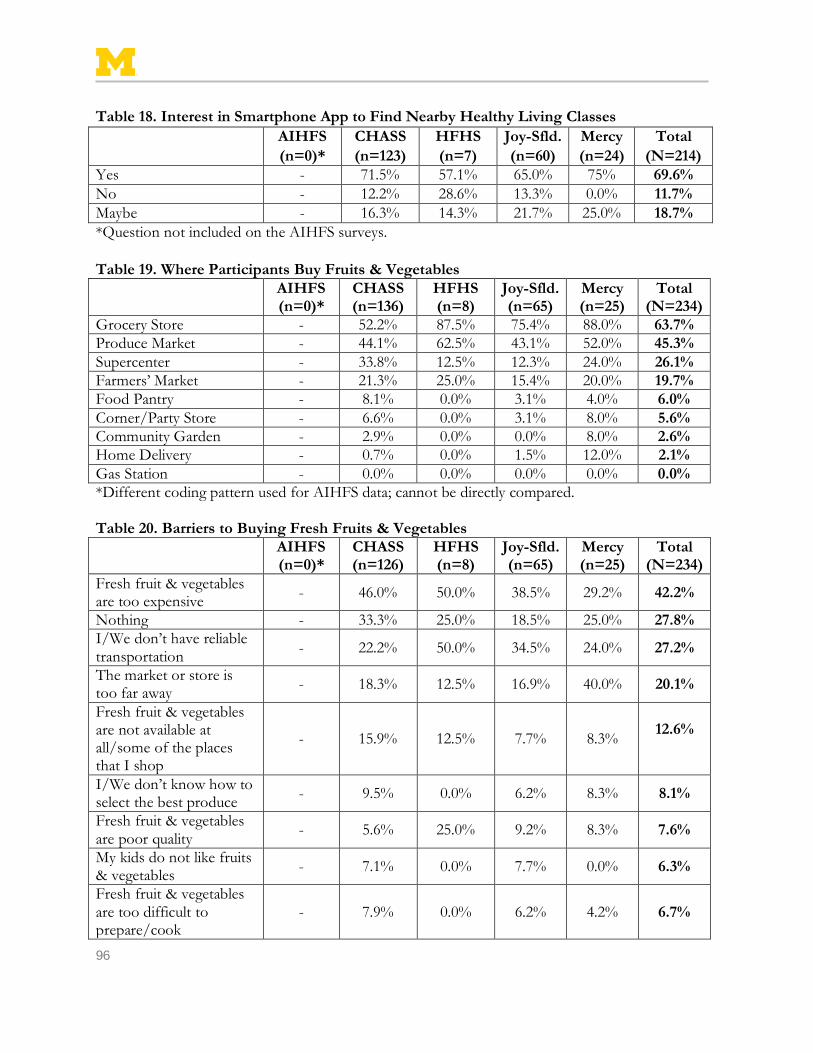
96
Table 18. Interest in Smartphone App to Find Nearby Healthy Living Classes AIHFS
(n=0)* CHASS (n=123)
HFHS (n=7)
Joy-Sfld. (n=60)
Mercy (n=24)
Total (N=214)
Yes - 71.5% 57.1% 65.0% 75% 69.6% No - 12.2% 28.6% 13.3% 0.0% 11.7% Maybe - 16.3% 14.3% 21.7% 25.0% 18.7% *Question not included on the AIHFS surveys. Table 19. Where Participants Buy Fruits & Vegetables AIHFS
(n=0)* CHASS (n=136)
HFHS (n=8)
Joy-Sfld. (n=65)
Mercy (n=25)
Total (N=234)
Grocery Store - 52.2% 87.5% 75.4% 88.0% 63.7% Produce Market - 44.1% 62.5% 43.1% 52.0% 45.3% Supercenter - 33.8% 12.5% 12.3% 24.0% 26.1% Farmers’ Market - 21.3% 25.0% 15.4% 20.0% 19.7% Food Pantry - 8.1% 0.0% 3.1% 4.0% 6.0% Corner/Party Store - 6.6% 0.0% 3.1% 8.0% 5.6% Community Garden - 2.9% 0.0% 0.0% 8.0% 2.6% Home Delivery - 0.7% 0.0% 1.5% 12.0% 2.1% Gas Station - 0.0% 0.0% 0.0% 0.0% 0.0% *Different coding pattern used for AIHFS data; cannot be directly compared. Table 20. Barriers to Buying Fresh Fruits & Vegetables AIHFS
(n=0)* CHASS (n=126)
HFHS (n=8)
Joy-Sfld. (n=65)
Mercy (n=25)
Total (N=234)
Fresh fruit & vegetables are too expensive - 46.0% 50.0% 38.5% 29.2% 42.2%
Nothing - 33.3% 25.0% 18.5% 25.0% 27.8% I/We don’t have reliable transportation - 22.2% 50.0% 34.5% 24.0% 27.2%
The market or store is too far away - 18.3% 12.5% 16.9% 40.0% 20.1%
Fresh fruit & vegetables are not available at all/some of the places that I shop
- 15.9% 12.5% 7.7% 8.3% 12.6%
I/We don’t know how to select the best produce - 9.5% 0.0% 6.2% 8.3% 8.1%
Fresh fruit & vegetables are poor quality - 5.6% 25.0% 9.2% 8.3% 7.6%
My kids do not like fruits & vegetables - 7.1% 0.0% 7.7% 0.0% 6.3%
Fresh fruit & vegetables are too difficult to prepare/cook
- 7.9% 0.0% 6.2% 4.2% 6.7%

Fresh Prescription Program Final Evaluation Report
97
It is difficult to shop with children - 6.3% 12.5% 7.7% 4.0% 6.7%
Fresh fruit & vegetables are poor quality
- 5.6% 25.0% 9.2% 8.3% 7.6%
I do not like fruits & vegetables
- 3.2% 0.0% 1.5% 0.0% 2.2%
*Different coding pattern used for AIHFS data; cannot be directly compared. Table 21. Pre-program: How often did you shop at a farmers’ market or farm stand? AIHFS
(n=0)* CHASS (n=137)
HFHS (n=8)
Joy-Sfld. (n=65)
Mercy (n=25)
Total (N=235)
Never or Rarely - 31.4% 50.0% 44.6% 68.0% 39.6% Once a month - 17.5% 50.0% 26.2% 20.0% 21.3% 2-3 times per month - 24.8% 0.0% 24.6% 12.0% 22.6% Weekly or more - 26.3% 0.0% 4.6% 0.0% 16.6% *Question not included on the AIHFS surveys. Table 22. Post-program: How often did you shop at a farmers’ market or farm stand? AIHFS
(n=0)* CHASS (n=90)
HFHS (n=6)
Joy-Sfld. (n=36)
Mercy (n=25)
Total (N=157)
Never or Rarely - 20.0% 50.0% 13.9% 20.0% 19.7% Once a month - 12.2% 50.0% 27.8% 32.0% 20.4% 2-3 times per month - 33.3% 0.0% 22.2% 32.0% 29.3% Weekly or more - 34.4% 0.0% 36.1% 16.0% 30.6% *Question not included on the AIHFS surveys. Table 23. Pre-program: How do you rate your own health? AIHFS
(n=60) CHASS (n=138)
HFHS (n=8)
Joy-Sfld. (n=65)
Mercy (n=25)
Total (N=296)
Poor 15.0% 12.3% 12.5% 6.2% 12.0% 11.5% Fair 35.0% 49.3% 62.5% 43.1% 24.0% 43.2% Good 40.0% 31.9% 12.5% 38.5% 56.0% 36.5% Very Good 8.3% 5.8% 0.0% 10.8% 4.0% 7.1% Excellent 1.7% 0.7% 12.5% 1.5% 4.0% 1.7% Table 24. Post-program: How do you rate your own health? AIHFS
(n=29) CHASS (n=90)
HFHS (n=6)
Joy-Sfld. (n=36)
Mercy (n=25)
Total (N=186)
Poor 6.9% 5.6% 16.7% 0.0% 4.0% 4.8% Fair 41.4% 52.2% 50.0% 25.0% 32.0% 42.5% Good 44.8% 28.9% 33.3% 47.2% 52.0% 38.2% Very Good 3.4% 7.8% 0.0% 25.0% 12.0% 10.8% Excellent 3.4% 5.6% 0.0% 2.8% 0.0% 3.8%

98
Table 25. Pre-program: How many total cups of fruit do you eat each day? AIHFS
(n=0)* CHASS (n=138)
HFHS (n=8)
Joy-Sfld. (n=66)
Mercy (n=24)
Total (N=236)
None - 3.6% 12.5% 9.1% 16.7% 6.8% .5 cup or less - 22.5% 37.5% 24.2% 12.5% 22.5% .5-1 cup - 24.2% 37.5% 25.8% 29.2% 23.3% 1-2 cups - 34.8% 0.0% 16.7% 29.2% 28.0% 2-3 cups - 14.5% 12.5% 15.2% 12.5% 14.4% 3-4 cups - 1.4% 0.0% 6.1% 0.0% 2.5% 4 cups or more - 2.9% 0.0% 3.0% 0.0% 2.5% *Question not included on the AIHFS surveys; fruit and vegetables combined. Table 26: Post-program: How many total cups of fruit do you eat each day? AIHFS
(n=0)* CHASS (n=90)
HFHS (n=6)
Joy-Sfld. (n=36)
Mercy (n=25)
Total (N=157)
None - 0.0% 0.0% 2.8% 4.0% 1.3% .5 cup or less - 10.0% 16.7% 5.6% 12.0% 9.6% .5-1 cup - 25.6% 0.0% 22.2% 20.0% 22.9% 1-2 cups - 28.9% 16.7% 44.4% 36.0% 33.1% 2-3 cups - 26.7% 50.0% 16.7% 28.0% 25.5% 3-4 cups - 7.8% 16.7% 5.6% 0.0% 6.4% 4 cups or more - 1.1% 0.0% 2.8% 0.0% 1.3% *Question not included on the AIHFS surveys; fruit and vegetables combined. Table 27. Pre-program: About how many cups of vegetables do you eat each day? AIHFS
(n=0)* CHASS (n=138)
HFHS (n=8)
Joy-Sfld. (n=65)
Mercy (n=24)
Total (N=235)
None - 4.3% 7.1% 7.7% 8.3% 6.0% .5 cups or less - 15.2% 25.0% 16.9% 20.8% 16.6% .5-1 cup - 32.6% 37.5% 23.1% 33.3% 30.2% 1-2 cups - 28.3% 25.0% 27.7% 29.2% 28.1% 2-3 cups - 11.6% 0.0% 10.8% 0.0% 9.8% 3-4 cups - 3.6% 0.0% 4.6% 8.3% 4.3% 4 cups or more - 4.3% 0.0% 9.2% 0.0% 5.1% *Question not included on the AIHFS surveys; fruit and vegetables combined. Table 28. Post-program: How many total cups of vegetables do you eat each day? AIHFS
(n=0)* CHASS (n=90)
HFHS (n=6)
Joy-Sfld. (n=36)
Mercy (n=25)
Total (N=157)
None - 0.0% 16.7% 0.0% 0.0% 0.6% .5 cups or less - 15.6% 16.7% 5.6% 24.0% 14.6% .5-1 cup - 22.2% 0.0% 27.8% 16.0% 21.7% 1-2 cups - 38.9% 33.3% 33.3% 40.0% 37.6%
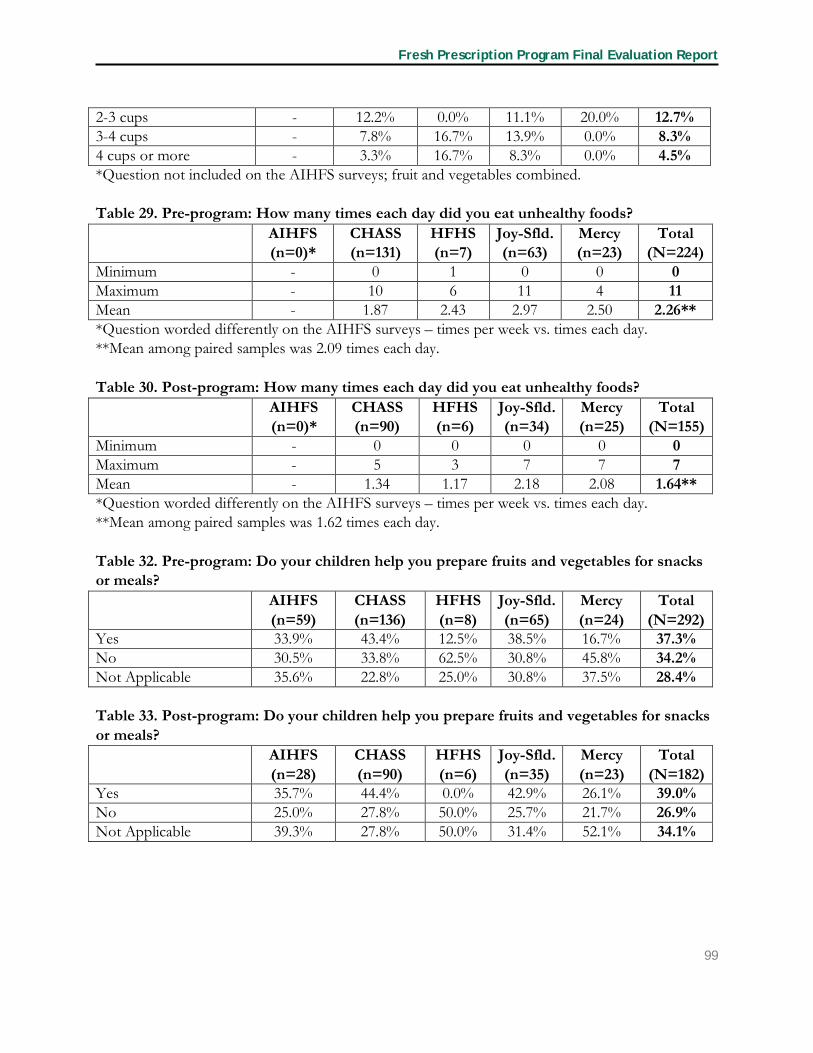
Fresh Prescription Program Final Evaluation Report
99
2-3 cups - 12.2% 0.0% 11.1% 20.0% 12.7% 3-4 cups - 7.8% 16.7% 13.9% 0.0% 8.3% 4 cups or more - 3.3% 16.7% 8.3% 0.0% 4.5% *Question not included on the AIHFS surveys; fruit and vegetables combined. Table 29. Pre-program: How many times each day did you eat unhealthy foods? AIHFS
(n=0)* CHASS (n=131)
HFHS (n=7)
Joy-Sfld. (n=63)
Mercy (n=23)
Total (N=224)
Minimum - 0 1 0 0 0 Maximum - 10 6 11 4 11 Mean - 1.87 2.43 2.97 2.50 2.26** *Question worded differently on the AIHFS surveys – times per week vs. times each day. **Mean among paired samples was 2.09 times each day. Table 30. Post-program: How many times each day did you eat unhealthy foods? AIHFS
(n=0)* CHASS (n=90)
HFHS (n=6)
Joy-Sfld. (n=34)
Mercy (n=25)
Total (N=155)
Minimum - 0 0 0 0 0 Maximum - 5 3 7 7 7 Mean - 1.34 1.17 2.18 2.08 1.64** *Question worded differently on the AIHFS surveys – times per week vs. times each day. **Mean among paired samples was 1.62 times each day. Table 32. Pre-program: Do your children help you prepare fruits and vegetables for snacks or meals? AIHFS
(n=59) CHASS (n=136)
HFHS (n=8)
Joy-Sfld. (n=65)
Mercy (n=24)
Total (N=292)
Yes 33.9% 43.4% 12.5% 38.5% 16.7% 37.3% No 30.5% 33.8% 62.5% 30.8% 45.8% 34.2% Not Applicable 35.6% 22.8% 25.0% 30.8% 37.5% 28.4% Table 33. Post-program: Do your children help you prepare fruits and vegetables for snacks or meals? AIHFS
(n=28) CHASS (n=90)
HFHS (n=6)
Joy-Sfld. (n=35)
Mercy (n=23)
Total (N=182)
Yes 35.7% 44.4% 0.0% 42.9% 26.1% 39.0% No 25.0% 27.8% 50.0% 25.7% 21.7% 26.9% Not Applicable 39.3% 27.8% 50.0% 31.4% 52.1% 34.1%

100
Table 34. Pre-program: Participant Food Security AIHFS
(n=60) CHASS (n=131)
HFHS (n=8)
Joy-Sfld. (n=65)
Mercy (n=24)
Total (N=288)
I/we always have enough to eat and the kinds of food we want
20.0% 27.5% 25.0% 16.9% 20.8% 22.9%
I/we always have enough to eat but not always the kinds of food we want to eat
41.7% 48.1% 50.0% 55.4% 58.3% 49.3%
Sometimes I/we do not have enough to eat
26.7% 20.6% 25.0% 16.9% 20.8% 21.2%
Often I/we do not have enough to eat
11.7% 3.8% 0.0% 10.8% 0.0% 6.6%
Table 35. Post-program: Participant Food Security AIHFS
(n=28) CHASS (n=89)
HFHS (n=6)
Joy-Sfld. (n=32)
Mercy (n=25)
Total (N=180)
I/we always have enough to eat and the kinds of food we want
28.6% 30.3% 33.3% 34.4% 36.0% 31.7%
I/we always have enough to eat but not always the kinds of food we want to eat
50.0% 48.3% 33.3% 59.4% 60.0% 51.7%
Sometimes I/we do not have enough to eat
17.9% 15.7% 33.3% 6.3% 4.0% 13.3%
Often I/we do not have enough to eat
3.6% 5.6% 0.0% 0.0% 0.0% 3.3%
Participant Knowledge & Beliefs Table 36. Pre-program: Before today, did you know that people can use their EBT/Bridge Card/SNAP (food stamps) at many local farmers markets? AIHFS
(n=57) CHASS (n=127)
HFHS (n=8)
Joy-Sfld. (n=63)
Mercy (n=25)
Total (N=280)
Yes 45.6% 53.5% 62.5% 57.1% 52.0% 52.9% No 54.4% 46.5% 37.5% 42.9% 48.0% 47.1%
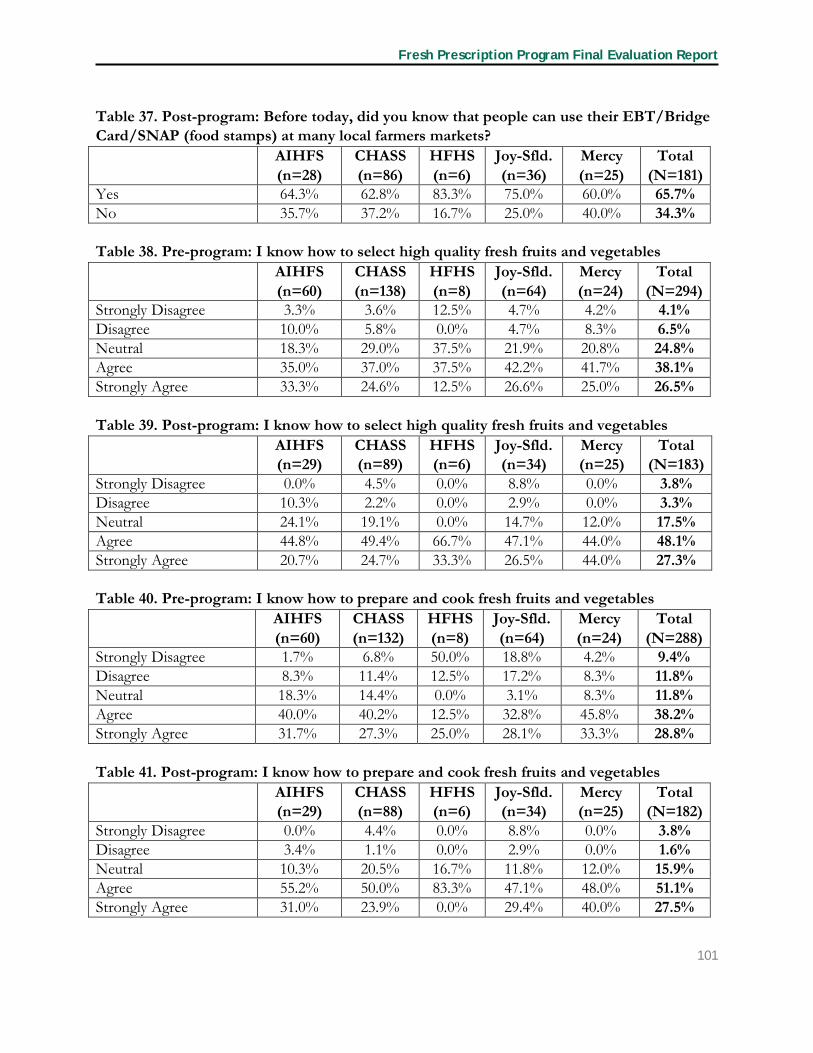
Fresh Prescription Program Final Evaluation Report
101
Table 37. Post-program: Before today, did you know that people can use their EBT/Bridge Card/SNAP (food stamps) at many local farmers markets? AIHFS
(n=28) CHASS (n=86)
HFHS (n=6)
Joy-Sfld. (n=36)
Mercy (n=25)
Total (N=181)
Yes 64.3% 62.8% 83.3% 75.0% 60.0% 65.7% No 35.7% 37.2% 16.7% 25.0% 40.0% 34.3% Table 38. Pre-program: I know how to select high quality fresh fruits and vegetables AIHFS
(n=60) CHASS (n=138)
HFHS (n=8)
Joy-Sfld. (n=64)
Mercy (n=24)
Total (N=294)
Strongly Disagree 3.3% 3.6% 12.5% 4.7% 4.2% 4.1% Disagree 10.0% 5.8% 0.0% 4.7% 8.3% 6.5% Neutral 18.3% 29.0% 37.5% 21.9% 20.8% 24.8% Agree 35.0% 37.0% 37.5% 42.2% 41.7% 38.1% Strongly Agree 33.3% 24.6% 12.5% 26.6% 25.0% 26.5% Table 39. Post-program: I know how to select high quality fresh fruits and vegetables AIHFS
(n=29) CHASS (n=89)
HFHS (n=6)
Joy-Sfld. (n=34)
Mercy (n=25)
Total (N=183)
Strongly Disagree 0.0% 4.5% 0.0% 8.8% 0.0% 3.8% Disagree 10.3% 2.2% 0.0% 2.9% 0.0% 3.3% Neutral 24.1% 19.1% 0.0% 14.7% 12.0% 17.5% Agree 44.8% 49.4% 66.7% 47.1% 44.0% 48.1% Strongly Agree 20.7% 24.7% 33.3% 26.5% 44.0% 27.3% Table 40. Pre-program: I know how to prepare and cook fresh fruits and vegetables AIHFS
(n=60) CHASS (n=132)
HFHS (n=8)
Joy-Sfld. (n=64)
Mercy (n=24)
Total (N=288)
Strongly Disagree 1.7% 6.8% 50.0% 18.8% 4.2% 9.4% Disagree 8.3% 11.4% 12.5% 17.2% 8.3% 11.8% Neutral 18.3% 14.4% 0.0% 3.1% 8.3% 11.8% Agree 40.0% 40.2% 12.5% 32.8% 45.8% 38.2% Strongly Agree 31.7% 27.3% 25.0% 28.1% 33.3% 28.8% Table 41. Post-program: I know how to prepare and cook fresh fruits and vegetables AIHFS
(n=29) CHASS (n=88)
HFHS (n=6)
Joy-Sfld. (n=34)
Mercy (n=25)
Total (N=182)
Strongly Disagree 0.0% 4.4% 0.0% 8.8% 0.0% 3.8% Disagree 3.4% 1.1% 0.0% 2.9% 0.0% 1.6% Neutral 10.3% 20.5% 16.7% 11.8% 12.0% 15.9% Agree 55.2% 50.0% 83.3% 47.1% 48.0% 51.1% Strongly Agree 31.0% 23.9% 0.0% 29.4% 40.0% 27.5%

102
Table 42. Pre-program: I know how to store fresh fruits and vegetables to increase their shelf life AIHFS
(n=59) CHASS (n=137)
HFHS (n=8)
Joy-Sfld. (n=64)
Mercy (n=25)
Total (N=293)
Strongly Disagree 0.0% 4.4% 12.5% 4.7% 28.0% 5.8% Disagree 10.2% 13.9% 25.0% 12.5% 16.0% 13.3% Neutral 22.0% 29.9% 25.0% 39.1% 24.0% 29.7% Agree 44.1% 36.5% 37.5% 28.1% 16.0% 34.5% Strongly Agree 23.7% 15.3% 0.0% 15.6% 16.0% 16.7% Table 43. Post-program: I know how to store fresh fruits and vegetables to increase their shelf life AIHFS
(n=29) CHASS (n=89)
HFHS (n=6)
Joy-Sfld. (n=34)
Mercy (n=25)
Total (N=183)
Strongly Disagree 0.0% 4.5% 0.0% 11.8% 0.0% 4.4% Disagree 0.0% 6.7% 16.7% 8.8% 0.0% 8.7% Neutral 8.0% 24.7% 33.3% 17.6% 8.0% 19.7% Agree 44.0% 42.7% 50.0% 35.3% 44.0% 42.6% Strongly Agree 48.0% 21.3% 0.0% 26.5% 48.0% 24.6% Table 44. Pre-program: Eating fruits and vegetables helps improve my health AIHFS
(n=0)* CHASS (n=136)
HFHS (n=8)
Joy-Sfld. (n=63)
Mercy (n=25)
Total (N=232)
Strongly Disagree - 4.4% 37.5% 4.8% 4.0% 5.6% Disagree - 0.7% 0.0% 3.2% 0.0% 1.3% Neutral - 2.9% 0.0% 6.3% 0.0% 3.4% Agree - 30.9% 25.0% 25.4% 16.0% 27.6% Strongly Agree - 61.0% 37.5% 60.3% 80.0% 62.1% *Question not included on the AIHFS surveys; replaced with two health-related questions. Table 45. Post-program: Eating fruits and vegetables helps improve my health AIHFS
(n=0)* CHASS (n=89)
HFHS (n=6)
Joy-Sfld. (n=34)
Mercy (n=25)
Total (n=154)
Strongly Disagree - 3.4% 0.0% 5.9% 0.0% 3.2% Disagree - 0.0% 0.0% 0.0% 0.0% 0.0% Neutral - 0.0% 0.0% 2.9% 8.0% 1.9% Agree - 39.3% 66.7% 38.2% 28.0% 38.3% Strongly Agree - 57.3% 33.3% 52.9% 64.0% 56.5% *Question not included on the AIHFS surveys; replaced with two health-related questions.

Fresh Prescription Program Final Evaluation Report
103
Table 46. Pre-program: I can find the fresh fruits and vegetables I am looking for in my community AIHFS
(n=59) CHASS (n=136)
HFHS (n=8)
Joy-Sfld. (n=64)
Mercy (n=25)
Total (N=292)
Strongly Disagree 1.7% 4.4% 25.0% 7.8% 0.0% 4.8% Disagree 6.8% 9.6% 0.0% 7.8% 16.0% 8.9% Neutral 22.0% 15.4% 50.0% 20.3% 40.0% 20.9% Agree 49.2% 48.5% 25.0% 39.1% 24.0% 43.8% Strongly Agree 20.3% 22.1% 0.0% 25.0% 20.0% 21.6% Table 47. Post-question: I can find the fresh fruits and vegetables I am looking for in my community AIHFS
(n=29) CHASS (n=89)
HFHS (n=6)
Joy-Sfld. (n=34)
Mercy (n=25)
Total (N=183)
Strongly Disagree 3.4% 1.1% 0.0% 8.8% 0.0% 2.7% Disagree 3.4% 3.4% 16.7% 8.8% 4.0% 4.9% Neutral 10.3% 10.1% 16.7% 2.9% 32.0% 12.0% Agree 58.6% 53.9% 66.7% 61.8% 44.0% 55.2% Strongly Agree 24.1% 31.5% 0.0% 17.6% 20.0% 25.1% Table 48. Pre-program: I can count on the people around me to support me to eat more fruits and vegetables AIHFS
(n=60) CHASS (n=136)
HFHS (n=8)
Joy-Sfld. (n=64)
Mercy (n=25)
Total (N=293)
Strongly Disagree 6.7% 4.4% 37.5% 9.4% 0.0% 6.5% Disagree 3.3% 11.8% 0.0% 6.3% 12.0% 8.5% Neutral 16.7% 19.9% 12.5% 26.6% 20.0% 20.5% Agree 36.7% 36.8% 37.5% 34.4% 36.0% 36.2% Strongly Agree 36.7% 27.2% 12.5% 23.4% 32.0% 28.3% Table 49. Post-program: I can count on the people around me to support me to eat more fruits and vegetables AIHFS
(n=29) CHASS (n=86)
HFHS (n=6)
Joy-Sfld. (n=35)
Mercy (n=25)
Total (N=181)
Strongly Disagree 3.4% 2.3% 0.0% 8.6% 0.0% 3.3% Disagree 6.9% 3.5% 0.0% 5.7% 4.0% 4.4% Neutral 31.0% 10.5% 33.3% 17.1% 20.0% 17.1% Agree 44.8% 60.5% 50.0% 45.7% 36.0% 51.4% Strongly Agree 13.8% 23.3% 16.7% 22.9% 40.0% 23.8%

104
Table 50. Pre-program: On a scale of 1 to 10 (where 10 is very important and 1 is not important) how important is it to you to eat more fruits and vegetables? AIHFS
(n=0)* CHASS (n=136)
HFHS (n=7)
Joy-Sfld. (n=64)
Mercy (n=25)
Total (N=291)
Minimum - 1 8 2 8 1 Maximum - 10 10 10 10 10 Mean - 9.35 9.71 8.66 9.68 9.21 *Question posed as a Likert scale question on AIHFS surveys. Table 51. Post-program: On a scale of 1 to 10 (where 10 is very important and 1 is not important) how important is it to you to eat more fruits and vegetables? AIHFS
(n=0)* CHASS (n=89)
HFHS (n=6)
Joy-Sfld. (n=36)
Mercy (n=25)
Total (N=185)
Minimum - 7 8 1 9 1 Maximum - 10 10 10 10 10 Mean - 9.57 9.50 8.64 9.92 9.28 *Question posed as a Likert scale question on AIHFS surveys. Table 52. Pre-program: On a scale of 1 to 10 (where 10 is very confident and 1 is not confident) how confident are you that you could eat more fruits and vegetables? AIHFS
(n=0)* CHASS (n=134)
HFHS (n=8)
Joy-Sfld. (n=64)
Mercy (n=25)
Total (N=291)
Minimum - 1 5 2 7 1 Maximum - 10 10 10 10 10 Mean - 8.59 8.88 8.67 9.48 8.80 *Question posed as a Likert scale question on AIHFS surveys. Table 53. Post-program: On a scale of 1 to 10 (where 10 is very confident and 1 is not confident) how confident are you that you could eat more fruits and vegetables? AIHFS
(n=0)* CHASS (n=89)
HFHS (n=6)
Joy-Sfld. (n=36)
Mercy (n=25)
Total (N=185)
Minimum - 3 5 1 5 1 Maximum - 10 10 10 10 10 Mean - 9.03 8.00 8.42 9.40 8.85 *Question posed as a Likert scale question on AIHFS surveys.

Fresh Prescription Program Final Evaluation Report
105
Table 54. Post-program: My knowledge about the importance of fresh fruits and vegetables in my family’s diet has… AIHFS
(n=0)* CHASS (n=89)
HFHS (n=6)
Joy-Sfld. (n=33)
Mercy (n=25)
Total (N=153)
Stayed the same - 12.4% 33.3% 6.1% 12.0% 11.8% Increased a little - 23.6% 0.0% 27.3% 12.0% 21.6% Increased some - 22.5% 33.3% 27.3% 36.0% 21.6% Increased a lot - 41.6% 33.3% 39.4% 40.0% 40.5% *Question not included on the AIHFS survey. Table 55. Post-program: My knowledge about where to buy fresh fruits and vegetables in my community has… AIHFS
(n=0)* CHASS (n=89)
HFHS (n=6)
Joy-Sfld. (n=34)
Mercy (n=25)
Total (N=154)
Stayed the same - 19.1% 16.7% 17.6% 16.0% 18.2% Increased a little - 25.8% 33.3% 23.5% 8.0% 22.7% Increased some - 23.6% 33.3% 20.6% 32.0% 24.7% Increased a lot - 31.5% 16.7% 38.2% 44.0% 34.4% *Question not included on the AIHFS survey. Table 56. Post-program: The amount of fruits and vegetables I eat each day has… AIHFS
(n=0)* CHASS (n=90)
HFHS (n=6)
Joy-Sfld. (n=34)
Mercy (n=24)
Total (N=154)
Stayed the same - 12.2% 16.7% 11.8% 12.5% 12.3% Increased a little - 23.3% 16.7% 20.6% 25.0% 22.7% Increased some - 32.2% 50.0% 29.4% 25.0% 31.2% Increased a lot - 32.2% 16.7% 38.2% 37.% 33.8% *Question not included on the AIHFS survey. Table 57. Posttest Question: The amount of fruits and vegetables my family members eat each day has… AIHFS
(n=0)* CHASS (n=86)
HFHS (n=5)
Joy-Sfld. (n=34)
Mercy (n=25)
Total (N=150)
Stayed the same - 12.8% 40.0% 8.8% 16.0% 13.3% Increased a little - 20.9% 0.0% 20.6% 20.0% 20.0% Increased some - 33.7% 0.0% 44.1% 24.0% 33.3% Increased a lot - 32.6% 60.0% 26.5% 40.0% 33.3% *Question not included on the AIHFS survey.

106
Table 58. Post-program: Behavior Changes (“True” Responses to True/False Statements) AIHFS
(n=0)* CHASS (n=90)
HFHS (n=6)
Joy-Sfld. (n=35)
Mercy (n=25)
Total (N=155)
I have tried new fruits and vegetables that I had not eaten before
- 80.7% 83.3% 94.3% 64.0% 81.2%
I buy fruits and vegetables that I did not buy before - 82.2% 60.0% 91.4% 70.8% 81.8%
I cook with fruits and vegetables that I did not cook with before
- 79.8% 50.0% 88.6% 76.0% 80.0%
I am able to manage my health conditions better - 92.1% 83.3% 88.6% 84.0% 89.7%
*Questions not included on the AIHFS survey. Market Utilization & Satisfaction Table 59. Post-program: On weeks when you visited the farmers’ market, about how much did you typically spend in cash, if any, on fruits and vegetables? AIHFS
(n=0)* CHASS (n=90)
HFHS (n=6)
Joy-Sfld. (n=36)
Mercy (n=25)
Total (N=157)
None/$0 - 10.0% 16.7% 8.3% 12.0% 10.2% $1-$5 - 5.6% 16.7% 16.7% 8.0% 8.9% $6-$10 - 25.6% 0.0% 36.1% 32.0% 28.0% $11-$15 - 18.9% 0.0% 16.7% 20.0% 17.8% $16-$20 - 7.8% 0.0% 8.3% 12.0% 8.3% $20 or more - 32.2% 66.7% 13.9% 16.0% 26.8% *Question not included on the AIHFS survey. Table 60. Post-program: On weeks you visited the market, about how many other adults, if any, came with you to the market? AIHFS
(n=0)* CHASS (n=90)
HFHS (n=6)
Joy-Sfld. (n=36)
Mercy (n=25)
Total (N=157)
None - 43.3% 0.0% 8.3% 44.0% 33.8% One - 28.9% 100.0% 33.3% 40.0% 34.4% Two - 20.0% 0.0% 22.2% 16.0% 19.1% Three - 4.4% 0.0% 22.2% 0.0% 7.6% Four - 1.1% 0.0% 8.3% 0.0% 2.5% Five or More - 2.2% 0.0% 5.6% 0.0% 2.5% *Question not included on the AIHFS survey.

Fresh Prescription Program Final Evaluation Report
107
Table 61. How satisfied or dissatisfied are you with your participation in the program? AIHFS
(n=0)* CHASS (n=89)
HFHS (n=6)
Joy-Sfld. (n=35)
Mercy (n=25)
Total (N=155)
Very Dissatisfied - 4.5% 16.7% 5.7% 0.0% 4.5% Neither satisfied nor dissatisfied - 0.0% 0.0% 2.9% 0.0% 0.6%
Somewhat satisfied - 10.1% 0.0% 5.7% 20.0% 10.3% Very satisfied - 85.4% 83.3% 85.7% 80.0% 84.5% *Question not included on the AIHFS survey. Table 62. Would you shop at _______ in the future if you did not have program dollars? AIHFS
(n=0)* CHASS (n=88)
HFHS (n=6)
Joy-Sfld. (n=34)
Mercy (n=25)
Total (N=153)
Yes - 83.0% 100.0% 88.2% 84.0% 85.0% No - 2.3% 0.0% 2.9% 4.0% 2.6% Maybe - 11.4% 0.0% 8.8% 4.0% 9.2% I don’t know - 3.4% 0.0% 0.0% 8.0% 3.3% *Question not included on the AIHFS survey. Table 63. Would you recommend the Fresh Prescription program to a friend or relative? AIHFS
(n=0)* CHASS (n=89)
HFHS (n=6)
Joy-Sfld. (n=35)
Mercy (n=25)
Total (N=155)
Yes - 95.5% 100.0% 97.1% 100% 96.8% Maybe - 4.5% 0.0% 2.9% 0.0% 3.2% *Question not included on the AIHFS survey.