2015-03-20 präsentation englisch · statements may be subject to changes and/or uncertain general...
TRANSCRIPT

Drillisch AGCompany Presentation
March 2015

Disclaimer and Contact
Page 2
This presentation contains statements and forecasts related to future developments; they express the current assessments of the Drillisch AG management. These assessments and statements may be subject to changes and/or uncertain general conditions which, in the majority of cases, are difficult to predict and are beyond the control of Drillisch AG.
Drillisch AG does not assume any obligation in the event of changes in these general conditions to publish the information on which the assessments and statements are based or to announce any revisions of the information.
Drillisch AGInvestor RelationsWilhelm-Röntgen-Strasse 1-5D–63477 MaintalPhone: + 49 (0) 61 81 / 412 218Internet: www.drillisch.deEmail: [email protected]

Highlights 2014
Market Development
Financial Indicators
Outlook
Agenda
Page 3

Financial Indicators
Market Development
Conclusion of the acquisition of yourfone for €51.4m(1) in January 2015
Established brand on German wireless services market offering potential for further growth
Page 4
Highlights 2014
Outlook and Takeaways
Overview of the Highlights
MBA MVNO Agreement
Acquisition of yourfone
EU and LTE Rate Plans
Conclusion of the MBA MVNO agreement with Telefónica Germany in June 2014 European Commission confirms agreement on the usage of network capacities with
Drillisch In August 2014 After completion of the technical realisation in July 2015, Drillisch will be on equal
footing with the network operators
April 2014: Attractive portfolio of new package and flat-rate plans for use all across Europe October 2014: Successful introduction and various awards for the new LTE and data rate
plans(2)
(1) Final calculation of the purchase price not yet available(2) Stiftung Warentest All-net Flat Rate Test Winner (10/14) and Stiftung Warentest Finance Test All-net LTE Rate Plans Test Winner (03/15)
Acquisition of GTCom
Offline Sales Establishment of the offline distribution channel, laying the foundation for continued
growth in subscriber numbers and revenue Selection of about 300 shop locations in the first half of 2015
Acquisition of 97.5% interest in the prepaid provider GTCom for €1.6m(1) at the beginning of February 2015
Expansion of the distribution platform in cooperation with interesting partners

MVNO Subscribers
Gross Profit
EBITDA
Cash Flow
856 1.211
848 7171,705 1,928
2013 2014
57.0 71.8
2013 2014
70.885.2
2013 2014
119.0
142.6
2013 2014
Overview of Fiscal Year 2014Highlights 2014
Market Development
Financial Indicators
Outlook and Takeaways
Positive development in fiscal year 2014 — all expectations were met or exceeded
Rise in total number of subscribersIncrease in more valuable MVNO budget subscribers
Rise in gross profit by €23.6mIncrease in gross profit margin by 8.2%
Increase for 13th year in successionAnnual growth rates of 14.7% during the period 2010–2014
Strong op. cash flow development reflecting quality of business
BudgetVolume
€m
€m
€m
Margin
Margin
(thousands)
41.0% 49.2%
24.4% 29.4%
Page 5

1,531 1,593 1,648 1,705 1,760 1,815 1,869 1,928
320 230 207 195 175 162 152 1421,851 1,823 1,855 1,900 1,935 1,977 2,021 2,070
Q1-13 Q2-13 Q3-13 Q4-13 Q1-14 Q2-14 Q3-14 Q4-14
Page 6
Drillisch Subscriber Development
Subscriber Development
MVNO MSP Volume Budget
Subscriber Focus in MVNO Business
580 657 733 856 946 1,023 1,118 1,211
951936
915848
814792
751717
1,531 1,593 1,648 1,705 1,760 1,815 1,869 1,928
Q1-13 Q2-13 Q3-13 Q4-13 Q1-14 Q2-14 Q3-14 Q4-14
Sustained MVNO subscriber growth focusing on budget subscriber segment
(thousands) (thousands)
MVNO subscriber growth+223,000 to 1,928,000 (PY: 1,705,000)
Total subscribers+170,000 to 2,070,000 (PY: 1,900,000)
Budget subscribers+355,000 to 1,211,000 (PY: 856,000)
Volume subscribers -131,000 to 717,000 (PY: 848,000)
Highlights 2014
Market Development
Financial Indicators
Outlook and Takeaways

Page 7
MBA MVNO contract opens up new strategic opportunities
MBA MVNO contract gives Drillisch the chance to expand its leadership in pricing and innovation on the market for wireless services
Highlights 2014
Market Development
Financial Indicators
Outlook and Takeaways
Access to network capacity Expansion of distribution network
Participation in technology and network development Attractive terms and conditions
Access to up to 30% of network capacityUnrestricted 4G access no less than 12 months before other non-MNOs from 1 July 2015
Significant increase in distribution capacity with access to new customer groupsExpansion of the “best in class” online distribution channel for additional capacitiesAcquisition of shops for establishment of offline channel
Unlimited access to all current and future technologies (4G, 5G, etc)Option to become a Full MVNO or a “MNO light”On equal footing with network operators for future network developments
Contract security at attractive terms and conditionsNetwork access guaranteed for up to 15 years (contract term of 5 years and 2 options for renewal of 5 years each)Planning security thanks to fixed long-term terms and conditions of purchasing
Benefits of the MBA MVNO Contract

High customer satisfaction and willingness to recommend to others (as high as 90%)
Success with innovative services and transparent products
Awards for pricing and quality (excerpt)Drillisch portfolio (excerpt) Sustained high standardin quality management
again confirmed byexternal audits
Mobile Awards 2014: The winners have been crowned
Drillisch Brand PortfolioHighlights 2014
Market Development
Financial Indicators
Outlook and Takeaways
Multiple Brand Strategy
All-net FlatTest Winner (10/14)
Premium Brands
Page 8
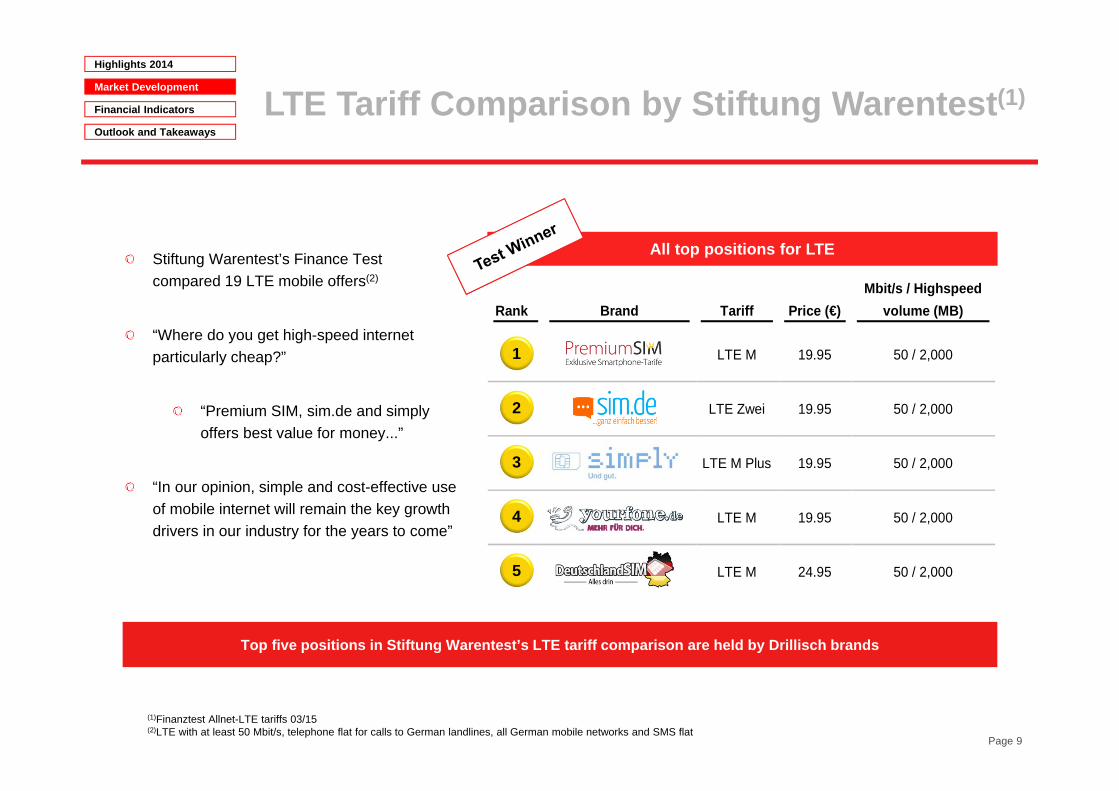
(1)Finanztest Allnet-LTE tariffs 03/15(2)LTE with at least 50 Mbit/s, telephone flat for calls to German landlines, all German mobile networks and SMS flat
Stiftung Warentest’s Finance Test compared 19 LTE mobile offers(2)
“Where do you get high-speed internet particularly cheap?”
“Premium SIM, sim.de and simply offers best value for money...”
“In our opinion, simple and cost-effective use of mobile internet will remain the key growth drivers in our industry for the years to come”
All top positions for LTE
Rank Brand Tariff
Price (€) Mbit/s / Highspeed
volume (MB)
LTE M 19.95 50 / 2,000
LTE Zwei 19.95 50 / 2,000
LTE M Plus 19.95 50 / 2,000
LTE M 19.95 50 / 2,000
LTE M 24.95 50 / 2,000
1
Top five positions in Stiftung Warentest’s LTE tariff comparison are held by Drillisch brands
LTE Tariff Comparison by Stiftung Warentest(1)
2
3
4
5
Highlights 2014
Market Development
Financial Indicators
Outlook and Takeaways
Page 9

Page 10
VOD Smart L €29.99DTE Magenta Mobil S €28.45TEF D Select €19.99
DTE Magenta Mobil M €37.95VOD Red 1,5 GB €34.99TEF D All in M 1 GB €29.99
DTE Magenta Mobil L €47.45TEF D All-in L €39.99VOD Red 3 GB €39.99
DTE Magenta Mobil L Prem €109.95DTE Magenta Mobil L Plus €75.95TEF D All-in XL €49.99
TEF D All-in Premium €79.99
Drillisch Product World
With 4G rate plans — with outstanding quality and transparent products successful today...
...tomorrow the only MBA MVNO with the features of a network operator
Our competitors with 4G products*
Highlights 2014
Market Development
Financial Indicators
Outlook and Takeaways
*Rate plans are not the same in all of their components and can differ slightly, e.g. in data package and speed
5 GB at 50 Mbit/s (Voice + SMS Flat)
10 GB at 50 Mbit/s (Voice + SMS Flat)
500 MB at 50 Mbit/s (Voice + SMS Flat)
1,5 GB at 50 Mbit/s (Voice + SMS Flat)
3 GB at 50 Mbit/s (Voice + SMS Flat)

Mobile Data Traffic as Growth Driver
(1)Source: Ericsson Mobility Report, Nov-2014(2)Including users over the age of 10 years
Exabytes per month
3.25.0
7.5
10.8
14.9
19.5
25.3
2014 2015 2016 2017 2018 2019 2020
40% CAGR 2014–2020
Global mobile data traffic growth of 40% p.a. in 2014–2020
In 2014, mobile internet users(2) in Germany grew by 5% to 37m citizens
Projection of global mobile data traffic until 2020 (1) Growth in mobile data utilisation based on various devices (2014 vs 2020)(1)
Monthly utilisation of smartphones and tablets expected to increase significantly by 25% p.a. until 2020
Main drivers of future mobile data traffic expected to be video and streaming offers
0.9
1.9
3.5
7.6
Gigabytesper month
Smartphone Tablet
+25%
+25%
2014
2020
CAGR
Highlights 2014
Market Development
Financial Indicators
Outlook and Takeaways
Page 11

Service Revenue
Gross Profit
EBITDA
Key Financial Indicators
Page 12
Increase of earnings figures from relatively stable service revenues
Highlights 2014
Market Development
Financial Indicators
Outlook and Takeaways
Enhanced profitability from stable revenues leads to an improvement in earnings position
Fiscal year Quarterly results
277.2 284.6
2013 2014
119.0 142.6
2013 2014
70.0 74.8
Q4-13 Q4-14
31.9 37.4
Q4-13 Q4-14
70.8 85.2
2013 2014
18.7 20.6
Q4-13 Q4-14
Dynamic growth in Q4 2014 of +6.9%Service revenues rose by 2.7% over the entire year
Increase in gross profit by about 20% to €142.6m49.2% gross profit margin
+20.3% growth in EBITDA29.4% EBITDA margin
€m
€m
€m
41.0% 49.2% 44.0% 48.7%
26.9%25.7%29.4%24.4%
Margin
Margin
2013 2014
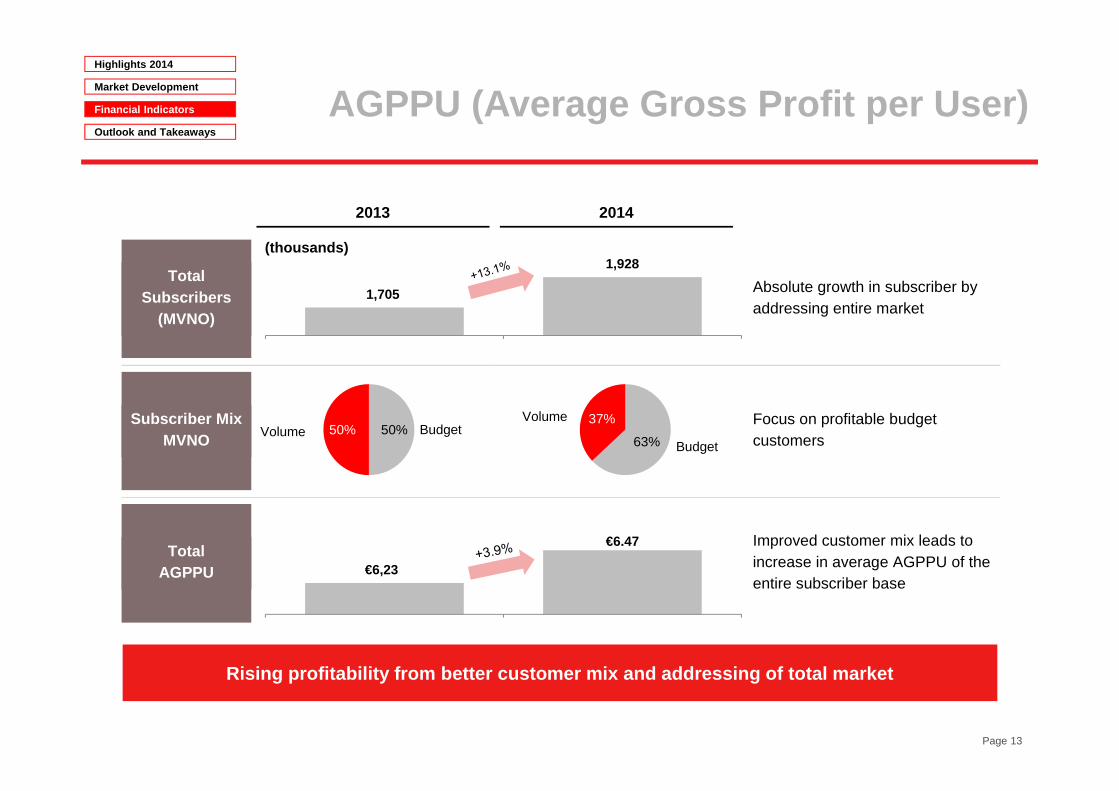
Total Subscribers
(MVNO)
Absolute growth in subscriber by addressing entire market
Subscriber Mix MVNO
Focus on profitable budget customers
Total AGPPU
Improved customer mix leads to increase in average AGPPU of the entire subscriber base
Page 13
AGPPU (Average Gross Profit per User)Highlights 2014
Market Development
Financial Indicators
Outlook and Takeaways
Rising profitability from better customer mix and addressing of total market
1,705
1,928
€6,23
€6.47
(thousands)
63%
37%50%50% BudgetVolume
Budget
Volume
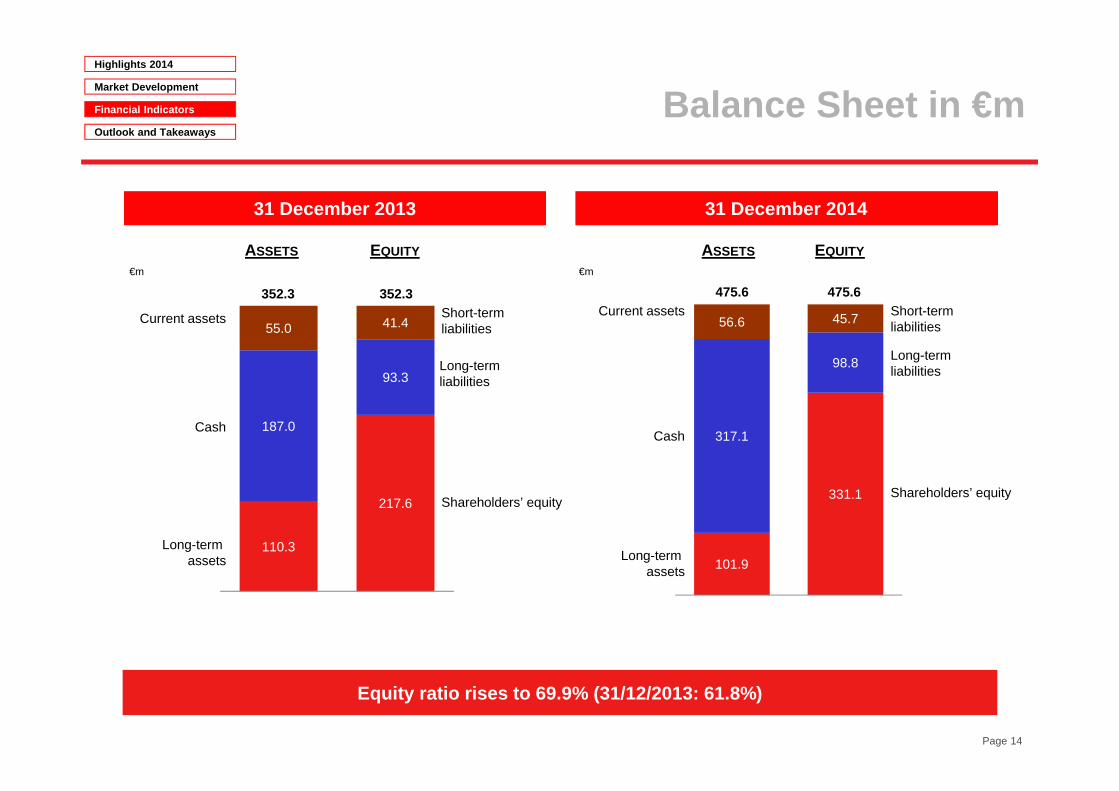
110.3
217.6
187.0
93.3
55.0 41.4
Balance Sheet in €m
Page 14
Long-term assets
Cash
Current assets
Shareholders’ equity
Long-term liabilities
Short-term liabilities
ASSETS EQUITY
31 December 2013 31 December 2014
352.3 352.3
ASSETS EQUITY
101.9
331.1
317.1
98.8
56.6 45.7
475.6 475.6
Shareholders’ equity
Long-term liabilities
Short-term liabilities
Long-term assets
Cash
Current assets
Highlights 2014
Market Development
Equity ratio rises to 69.9% (31/12/2013: 61.8%)
Outlook and Takeaways
€m €m
Financial Indicators

Cash Flow Development
(1)Definition of free cash flow: cash flow from current business activities less CAPEX
Highlights 2014
Market Development
Financial Indicators
Outlook and Takeaways
€m 2013 2014
Cash flow fromcurrent business activities
57.0 71.8
Cash flow from investment activities 350.5 -4.8
Cash flow from financing activities -297.7 63.1
Free cash flow (1) 34.9 66.5
Substantial increase in cash flow from current business activities
Reflects the strength of operating business
2013: Repayment of a debenture bond (€125m), repayment of finance loans (€159.3m) and interest payments (€43.7m)2014: Payments of €139.7m from the sale of treasury stock and €76.8m in paid dividends
2013: Marked by sale of freenet stock (€357.3m) and received dividends of (€11.7m)2014: Investment in tangible assets
FCF 2015 will be affected through increase in capex and upfront payment (TEF D)
Page 15

85,2 1,2 -14,6
-5,366,5
EBITDA Change NetWorking Capital
Taxes Capex Free Cashflow
EBITDA to FCFMarket Development
Outlook and Takeaways
Free Cash Flow Bridge January–December 2014
Financial Indicators
Page 16
Highlights 2014
€m

Overview of Liabilities and Cash
Future growth financed by earning power and current cash reserves
2013 2014
Bank loans and overdrafts 0.0 0.0 Convertible bond 86.2 88.8
Leasing liabilities 1.1 2.1 Financial liabilities 87.3 90.9 Cash and cash equivalents -187.0 -317.1 Net financial liabilities -99.7 -226.2 EBITDA 70.8 85.2
Page 17
Highlights 2014
Market Development
Financial Indicators
Outlook and Takeaways
Development in net financial liabilities Secured financing from available cash
€m Beginning of 2015
Cash 317.1
Credit line since December 2014(not utilised) Up to 100
Up-front payment MBA MVNO contract -[150]
Dividend 2014 -[85]
€m
-1,4
-2,7
2013 2014
Net financial liabilities/EBITDA Even after the yourfone acquisition, Drillisch has high cash reserves which can be used to drive growth

New offline competence with existing management, workforce and systemsFrom HY2 2015, nationwide distribution network with wide-area coverage at attractive locations (ca. 300 shops)
Outstanding position for continued growth
Drillisch Group Structure
Future strengthening of offline competence
IT competence within own company (e.g. own billing, own source code etc)
Low-cost and efficient online salesPrice, innovation and technology leader with clear transparency and high quality standardMultiple brand strategy with attractive product portfolio and own IT platform
IQ Optimize
Group structure provides the framework for consistent realisation of the strategy
Highlights 2014
Market Development
Financial Indicators
Outlook and Takeaways
Online AG yourfone GmbH Shop AG
Offline salesOnline sales
“Premium” Brand World – Offline and OnlineBrand Portfolio
Page 18

+223,000
Forecast 2015
MVNO Subscribers
EBITDA
Dividends
85.2
95-100€m
€ per share
1.70 min. 1.70
Page 19
Continuation of the success story — profitable growth planned for 2015 as well
Highlights 2014
Market Development
Financial Indicators
Outlook and Takeaways
FORECAST 20152014

Full financial flexibility and liquidity the foundation for continued growth
Take-Aways
Page 20
Highlights 2014
Market Development
Financial Indicators
Outlook and Takeaways
EBITDA forecast exceeded and profitability increased again
EBITDA increase planned for 2015 as well
Attractive dividend policy — €1.70 for fiscal year 2014; minimum for 2015 & 2016
Total yield for shareholders, including dividend, of 48%(1) in 2014
(1)Share price increase in 2014 plus dividend, based on closing price 2013

Annex
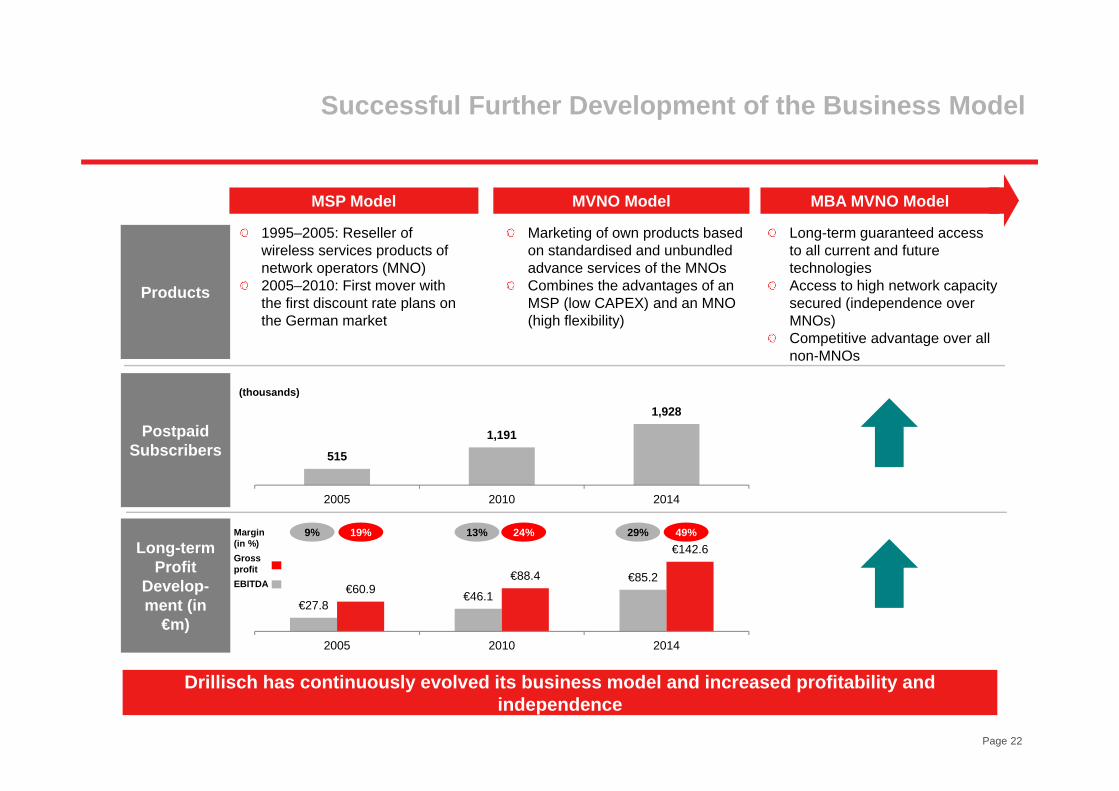
Successful Further Development of the Business Model
Drillisch has continuously evolved its business model and increased profitability and independence
MSP Model MVNO Model MBA MVNO Model
Products
Postpaid Subscribers
Long-term Profit
Develop-ment (in
€m)€27.8
€46.1€85.2
€60.9€88.4
€142.6
2005 2010 2014
515
1,191
1,928
2005 2010 2014
19%9% 24%13% 49%29%
EBITDA
Gross profit
(thousands)
Margin (in %)
1995–2005: Reseller of wireless services products of network operators (MNO)2005–2010: First mover with the first discount rate plans on the German market
Marketing of own products based on standardised and unbundled advance services of the MNOsCombines the advantages of an MSP (low CAPEX) and an MNO (high flexibility)
Long-term guaranteed access to all current and future technologiesAccess to high network capacity secured (independence over MNOs)Competitive advantage over all non-MNOs
Page 22

EBITDA (adjusted) Forecast
2009 2010 2011 2012 2013 2014 2015
FY Positive
Development Positive
Development €52m €58m €67-70m
(prev.: €77-80m) €82-85m
€95-100m
Q1 €41-42m €46m
Q2 €60-61m Upper range Upper range
Q3 €43m €48m €70m
EBITDA (IFRS) €43.5m €49.3m €52.6m €61.9m €70.8m €85.2m
EBITDA Growth (YoY) 7.1% 13.3% 6.7% 17.8% 14.4% 20.3% ~ +[14]%
Exceeded
Exceeded
Exceeded
Exceeded
Exceeded
Exceeded
EBITDA Forecast vs Achieved EBITDA
Drillisch achieves sustained increases in profitability (annual growth in EBITDA of 14.4% over the period from 2009 to 2014), whereby the forecast has always been exceeded
Comparison with forecast:
Source: Company dataPage 23

Internet Flat 1 GB | S Internet Flat 2 GB | M Internet Flat 3 GB | L Internet Flat 5 GB | XL
Internet flat rate 1 GB 2 GB 3 GB 5 GB
Speed LTE 21.1 Mbit/s LTE 50 Mbit/s LTE 50 Mbit/s LTE 50 Mbit/s
Network o2 o2 o2 o2
Basic monthly rate term 1 month
€6.99 €9.99 €12.99 €17.99
Basic monthly rate for of 24 months
€2.99 first 12 months, then €6.99
€4.99 first 12 months, then €9.99
€7.99 first 12 months, then €12.99
€9.99 first 12 months, then €17.99
Installation fee €29.99 €29.99 €29.99 €29.99
Starting credit €0.00 €0.00 €0.00 €0.00
Telephony and voice €0.15 €0.15 €0.15 €0.15
Term 1 month or 24 months 1 month or 24 months 1 month or 24 months 1 month or 24 months
Page 24
The New LTE Data Rate Plans from Drillisch(1)
Source: Company data(1) All prices shown including VAT

Provider Rate Plan Basic Rate Phoning Text Message Data Speed MBit/s Installation Fee Total Costs 24
Months(1)
LTE 500Drillisch LTE 500 €12.99 Flat Flat 500 50.00 €29.99 €341.75
o2 Select €19.99Flat O2 + 100
minutes + flat rate to one network
Flat 500 21.60 €0.00 €455.76
Vodafone VF SMART L €29.99 Flat Flat 500 21.60 €29.99 €659.78Telekom Telekom Magenta Mobil S €28.45 Flat Flat 500 16.00 €29.95 €712.75LTE 1500Drillisch LTE 1500 €19.99 Flat Flat 1500 50.00 €29.99 €509.75o2 All In M 1 GB €29.99 Flat Flat 1000 21.10 €0.00 €719.76Vodafone RED 1.5 GB €34.99 Flat Flat 1500 100.00 €29.99 €764.78Telekom Telekom Magenta Mobil M €37.95 Flat Flat 1500 50.00 €29.95 €940.75LTE 3000Drillisch LTE 3000 €24.99 Flat Flat 3000 50.00 €29.99 €629.75Vodafone RED 3 GB €39.99 Flat Flat 3000 100.00 €29.99 €869.78o2 ALL In L €39.99 Flat Flat 3000 50.00 €0.00 €911.76Telekom Telekom Magenta Mobil L €47.45 Flat Flat 3000 100.00 €29.95 €1168.75Telekom Telekom Magenta Mobil L Premium €79.95 Flat Flat 3000 100.00 €29.95 €1948.75LTE 5000Drillisch LTE 5000 €39.99 Flat Flat 5000 50.00 €29.99 €989.75o2 ALL In XL €49.99 Flat Flat 5000 50.00 €0.00 €1139.76Telekom Telekom Magenta Mobil L Plus €75.95 Flat Flat 5000 100.00 €29.95 €1852.75
Telekom Telekom Magenta Mobil L Plus Premium €109.95 Flat Flat 5000 100.00 €29.95 €2668.75
LTE 10000Drillisch LTE 10000 €69.99 Flat Flat 10000 50.00 €29.99 €1709.75o2 ALL IN Premium €79.99 Flat Flat 10000 50.00 €0.00 €1823.76
Page 25
Overview of Competing LTE Rate Plans
Source: Company data(1) Including VAT and rebate campaigns

Shareholder in % in shares
Free Float 82.46% 43,863,191
Allianz Global 5.15% 2,737,449
Union Investment Privatfonds 5.07% 2,694,500
FMR LLC 3.72% 1,978,464
M. Brucherseifer 2.03% 1,077,565
P. Choulidis 0.80% 425,000
V. Choulidis 0.75% 400,000
J. Weindl 0.02% 10,439
Dr. H. Lennertz 0.01% 2,407
Total 100.00% 53,189,015
Page 26
Drillisch Stock
Shareholder structure per 16 March 2015
Source: Reports to the company pursuant to Sections 21 et seqq. WpHG 100% free float according to Dt. Börse AG
Drillisch position in the index family (February)
Index Market cap. Revenue
TecDAX 30 8 6
Blue Chip Indices Germany 62 53