2014 stock performance - petroquest energy · low cost: normal pressure drilling environment,...
TRANSCRIPT

October 2017
Forward-Looking Statements
2
This presentation contains "forward-looking statements" within the meaning of Section 27A of the Securities Act of 1933, as amended, and Section 21E of the Securities Exchange Act of 1934, as amended. All statements other than statements of historical fact included in this presentation are forward-looking statements. Although PetroQuest believes that the expectations reflected in these forward-looking statements are reasonable, these statements are based upon assumptions and anticipated results that are subject to numerous uncertainties and risks. Actual results may vary significantly from those anticipated due to many factors, our ability to successfully close the previously disclosed commitment for a four-year multi-draw term loan facility or receive any proceeds from draws thereunder; the sufficiency of our current liquidity; the volatility of oil and natural gas prices and significantly depressed oil prices since the end of 2014; our indebtedness and the significant amount of cash required to service our indebtedness; our ability to improve our liquidity position and refinance or restructure our indebtedness, including our 2017 Notes and 2021 2L Notes; the potential need to sell assets or seek bankruptcy protection; our estimate of the sufficiency of our existing capital sources, including availability under our bank credit facility and the result of any borrowing base redetermination; our ability to post additional collateral to satisfy our offshore decommissioning obligations; our ability to hedge future production to reduce our exposure to price volatility in the current commodity pricing market; ceiling test write-downs resulting, and that could result in the future, from lower oil and natural gas prices; our ability to raise additional capital to fund cash requirements for future operations; limits on our growth and our ability to finance our operations, fund our capital needs; our ability to find, develop and produce oil and natural gas reserves that are economically recoverable and to replace reserves and sustain production; approximately 50% of our production being exposed to the additional risk of severe weather, including hurricanes, tropical storms and flooding, and natural disasters; losses and liabilities from uninsured or underinsured drilling and operating activities; changes in laws and governmental regulations as they relate to our operations; the operating hazards attendant to the oil and gas business; the volatility of our stock price; and our ability to meet the continued listing standards of the New York Stock Exchange with respect to our common stock or to cure any deficiency with respect thereto. In particular, careful consideration should be given to cautionary statements made in the various reports the Company has filed with the SEC. The Company undertakes no duty to update or revise these forward-looking statements. In particular, careful consideration should be given to cautionary statements made in the various reports PetroQuest has filed with the Securities and Exchange Commission. PetroQuest undertakes no duty to update or revise these forward-looking statements.
Prior to 2010, the Securities and Exchange Commission generally permitted oil and gas companies, in their filings, to disclose only proved reserves that a company has demonstrated by actual production or conclusive formation tests to be economically and legally producible under existing economic and operating conditions. Beginning with year-end reserves for 2009, the SEC permits the optional disclosure of probable and possible reserves. We have elected not to disclose our probable and possible reserves in our filings with the SEC. We use the terms “reserve inventory,” “gross unrisked reserves,” “EUR,” “inventory”, “unriskedresource potential”, 3P reserves or other descriptions of volumes of hydrocarbons to describe volumes of resources potentially recoverable through additional drilling or recovery techniques that the SEC’s guidelines prohibit us from including in filings with the SEC. Estimates of reserve inventory, gross unrisked reserves EUR, inventory, unrisked 3P reserves do not reflect volumes that are demonstrated as being commercially or technically recoverable. Even if commercially or technically recoverable, a significant recovery factor would be applied to these volumes to determine estimates of volumes of proved reserves. Accordingly, these estimates are by their nature more speculative than estimates of proved reserves and accordingly are subject to substantially greater risk of being actually realized by the Company. The methodology for estimating unrisked inventory, gross unrisked reserves, EUR, or unrisked resource potential or 3P reserves may also be different than the methodology and guidelines used by the Society of Petroleum Engineers and is different from the SEC’s guidelines for estimating probable and possible reserves.

Underlying Fundamentals Decoupled From Market Valuation
56.8
50.0
58.1
69.5
82.0
$3.46
$3.31
$2.74
$1.98
$1.00
$1.50
$2.00
$2.50
$3.00
$3.50
$4.00
40
45
50
55
60
65
70
75
80
85
9/30/16 12/31/16 3/31/17 6/30/17 9/30/17E
Production
Stock Price
(1) Based on the mid-point of 3Q17E production guidance 3
Production up 44%Stock price down 43%
MM
CFE
/D
(1)

2017 Production & EBITDA Growth Profiles
4
50
58
69
82
~100
40
50
60
70
80
90
100
4Q16 1Q17 2Q17 3Q17E (1) 4Q17E Exit (2)
17.9
54.9
0
10
20
30
40
50
60
2016 EBITDA 2017E EBITDA (3)
Production (MMcfe/d)
(1) Based upon mid-point of guidance(2) 4Q16 to 4Q17 production goal(3) Factset average analyst estimate
EBITDA ($MM)
2017 Capex
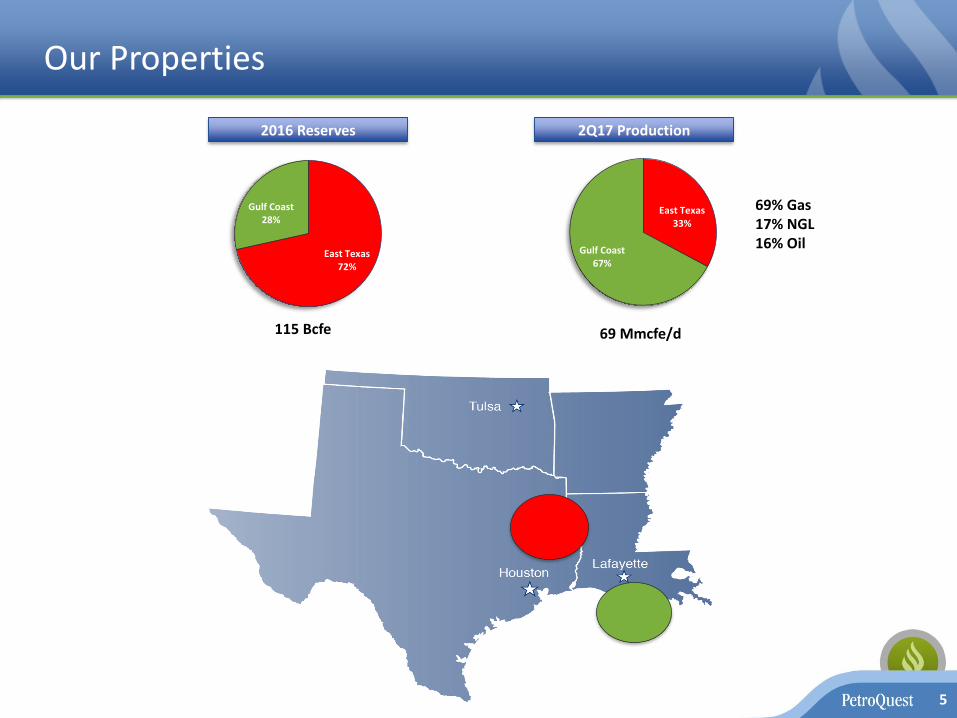
Our Properties
5
East Texas72%
Gulf Coast28%
2016 Reserves
115 Bcfe
2Q17 Production
69 Mmcfe/d
69% Gas17% NGL16% Oil
East Texas33%
Gulf Coast67%

Industry Activity - Cotton Valley Trend
6
Relative Rock Quality Comparison
PorosityHaynesville
(3-14%)PQ Cotton Valley
(10%)
PermeabilityHaynesville
(<1 MD)PQ Cotton Valley
(10 MD)
County/Parish Operator Rig Count
Desoto Exco Oper Co 1Indigo 1
Lincoln Range Louisiana 3
Wildhorse Res Mgmt 2
Panola Brammer Engineering 1
Memorial/Amplify 1
PetroQuest Energy 1
Tanos Exploration II 1
Rusk Tanos Exploration II 1
Valence Operating Co 1
Verado Energy 1

Advantages of PQ’s Cotton Valley
7
▪ Geology: high permeability sandstones relative to low permeability shales
▪ Multiple targets: >1,400’ thick sand column with seven benches to target
▪ Low risk: hundreds of vertical wells with decades of production history, cores and logs
▪ Large resource potential: previous vertical wells didn’t efficiently drain the producing zone – perfect application for horizontal development
▪ Low cost: normal pressure drilling environment, simple frac design and low operating costs
▪ Superior location: premium Gulf Coast pricing, supportive land owners and state/local agencies
▪ Exceptional returns: 67% IRR using a $3.00/Mcf natural gas price assumption and most recent well cost
8
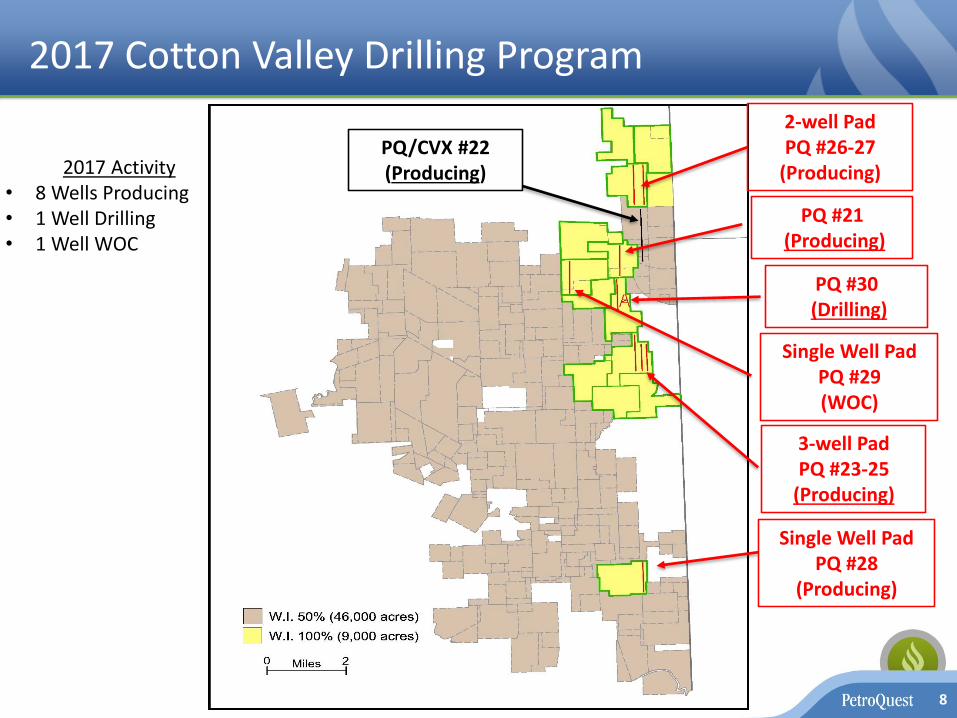
2017 Cotton Valley Drilling Program
3-well PadPQ #23-25
(Producing)
2-well PadPQ #26-27
(Producing)PQ/CVX #22(Producing)
PQ #21(Producing)
Single Well PadPQ #28
(Producing)
2017 Activity• 8 Wells Producing• 1 Well Drilling• 1 Well WOC
Single Well PadPQ #29(WOC)
PQ #30(Drilling)
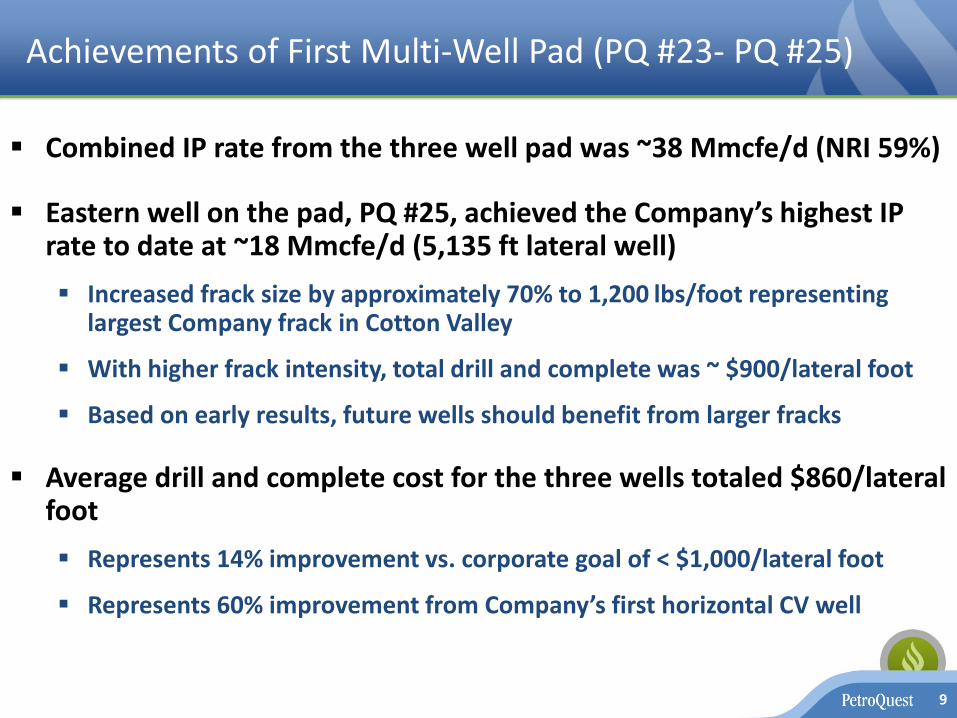
Achievements of First Multi-Well Pad (PQ #23- PQ #25)
9
▪ Combined IP rate from the three well pad was ~38 Mmcfe/d (NRI 59%)
▪ Eastern well on the pad, PQ #25, achieved the Company’s highest IP rate to date at ~18 Mmcfe/d (5,135 ft lateral well)
▪ Increased frack size by approximately 70% to 1,200 lbs/foot representing largest Company frack in Cotton Valley
▪ With higher frack intensity, total drill and complete was ~ $900/lateral foot
▪ Based on early results, future wells should benefit from larger fracks
▪ Average drill and complete cost for the three wells totaled $860/lateral foot
▪ Represents 14% improvement vs. corporate goal of < $1,000/lateral foot
▪ Represents 60% improvement from Company’s first horizontal CV well
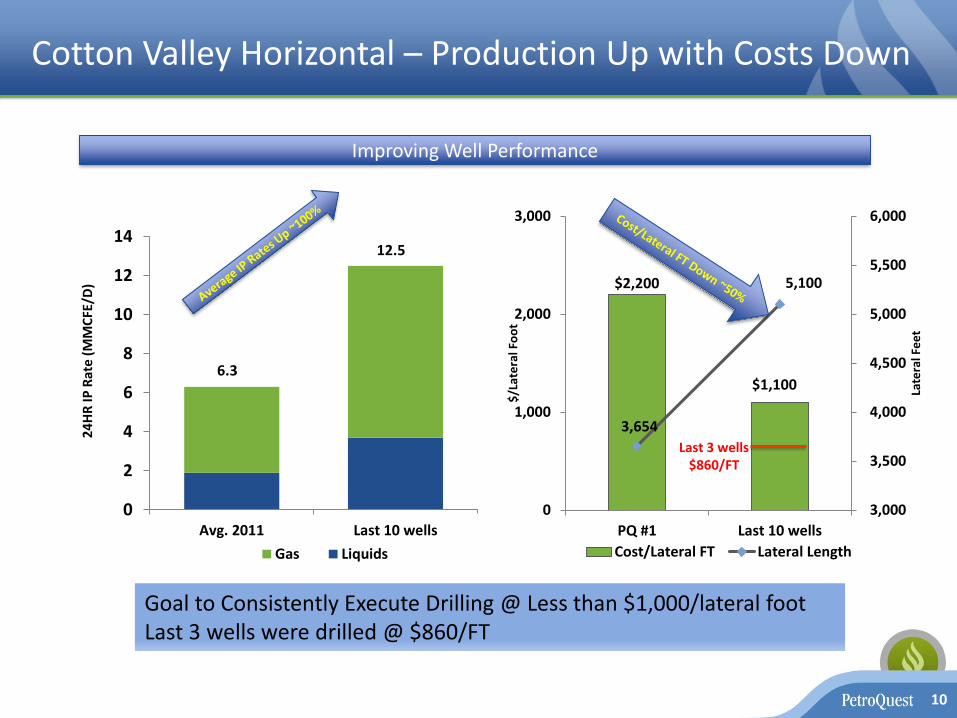
Cotton Valley Horizontal – Production Up with Costs Down
10
Improving Well Performance
$2,200
$1,100
3,654
5,100
3,000
3,500
4,000
4,500
5,000
5,500
6,000
0
1,000
2,000
3,000
PQ #1 Last 10 wells
Late
ral F
ee
t
$/L
ate
ral F
oo
t
Cost/Lateral FT Lateral Length
0
2
4
6
8
10
12
14
Avg. 2011 Last 10 wells
Gas Liquids
6.3
12.5
24
HR
IP R
ate
(MM
CFE
/D)
Goal to Consistently Execute Drilling @ Less than $1,000/lateral footLast 3 wells were drilled @ $860/FT
Last 3 wells $860/FT

Cotton Valley Horizontal Economics
11
Assumptions
Gross Well Cost ($MM) 4.0 (~$900/lateral foot)
EUR (Bcfe) (1) 8.0
IP Rate (Mmcfe/d) (1) 11
% Gas / Liquids 70% / 30%
IRR (%) 67%(1) 2015 Avg. well performance with laterals in excess of
4,500 feet - $3.00/Mcf gas, $18 NGL/Bbl and $50 oil/Bbl
Sensitivity to Gas Prices
Economic Assumptions
$4.0 MM D&C
42%
67%
98%
0%
20%
40%
60%
80%
100%
$2.50 $3.00 $3.50
Horizontal CV Well Economics

MCFADDEN-BAGLEY UNI
142365359740000
CUMGAS : 153,052 MCFCUMOIL : 835 BBLS
CUMWTR : 22,183 BBLS2/15/2006
8200
8250
8300
8350
8400
8450
8500
8550
8600
8650
8700
8750
8800
8850
8900
8950
9000
9050
9100
9150
9200
9250
9300
9350
9400
9450
9500
9550
9600
9650
9700
9750
9800
9850
9900
9950
1000
010
050
1010
010
150
1020
010
250
1030
010
350
8250 8250
8300 8300
8350 8350
8400 8400
8450 8450
8500 8500
8550 8550
8600 8600
8650 8650
8700 8700
8750 8750
8800 8800
8850 8850
8900 8900
8950 8950
9000 9000
9050 9050
9100 9100
9150 9150
9200 9200
9250 9250
9300 9300
9350 9350
9400 9400
9450 9450
9500 9500
9550 9550
9600 9600
9650 9650
9700 9700
9750 9750
9800 9800
9850 9850
9900 9900
9950 9950
10000 10000
10050 10050
10100 10100
10150 10150
10200 10200
10250 10250
10300 10300
10350 10350
10400 10400
10450 10450
10500 10500
10550 10550
SE CARTHAGE
PETRA 6/17/2013 10:36:53 AM
“C&D” Sands
Davis Sand
E4 Sands
Roseberry/Eberry Sand
Vaughn Sand
PetroQuest -- McFadden Bagley #1
GR Resistivity Den. Porosity
Cotton Valley Benches
9,000’
10,000’
9,500’
8,500’
E Sands
Multi Bench Cotton Valley Opportunities
12
Taylor/Sexton
Bench Gross Drilling Locations*
C&D 90
Vaughn 114
Davis 182
E4 65
E 95
Eberry/Roseberry 41
Sexton/Taylor 14
Total Gross Drilling Locations 601
* Locations based on 1500’ spacing within area of estimated economic net feet of pay determined by offsetting vertical well logs
Cotton Valley Drilling Locations
NOTE> All of the above benches are productive on PQ acreage through >140 vertical wells and all benches have been tested horizontally in close proximity to PQ acreage
13
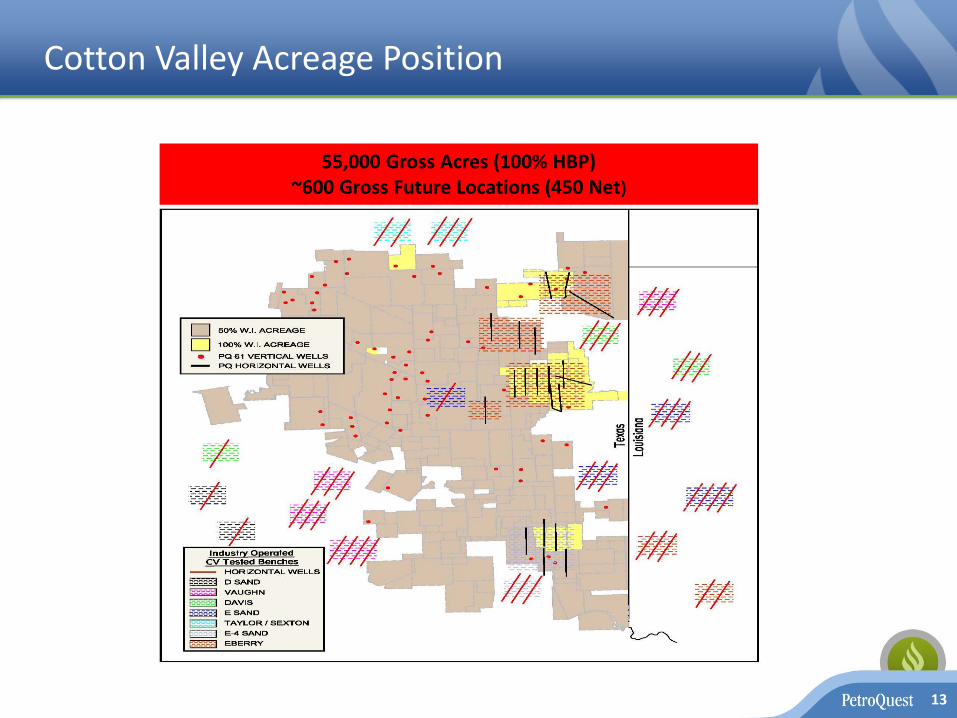
Cotton Valley Acreage Position
55,000 Gross Acres (100% HBP)~600 Gross Future Locations (450 Net)
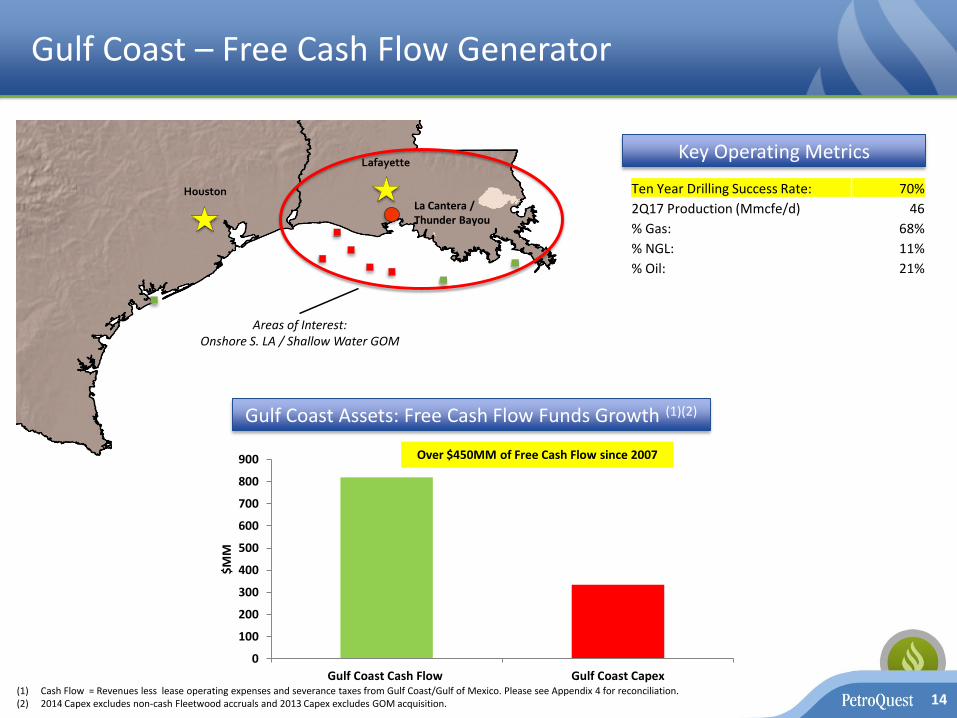
Gulf Coast – Free Cash Flow Generator
14
Houston
Lafayette
Areas of Interest:Onshore S. LA / Shallow Water GOM
Key Operating Metrics
(1) Cash Flow = Revenues less lease operating expenses and severance taxes from Gulf Coast/Gulf of Mexico. Please see Appendix 4 for reconciliation. (2) 2014 Capex excludes non-cash Fleetwood accruals and 2013 Capex excludes GOM acquisition.
Gulf Coast Assets: Free Cash Flow Funds Growth (1)(2)
La Cantera / Thunder Bayou
Ten Year Drilling Success Rate: 70%
2Q17 Production (Mmcfe/d) 46
% Gas: 68%
% NGL: 11%
% Oil: 21%
Over $450MM of Free Cash Flow since 2007
0
100
200
300
400
500
600
700
800
900
Gulf Coast Cash Flow Gulf Coast Capex
$M
M

Thunder Bayou Recompletion
15
Bottom Zone Cum Prod: 14.6 BcfeOriginal 1P: 8.6 Bcfe
RecompletionCurrent Production:
~61 MMCFE/D39 MMCF/D of Gas
1,500 Bbls/D Oil2,200 Bbls/D NGLs 3P Est: ~140 Bcfe
~$35MM in field level cash flow
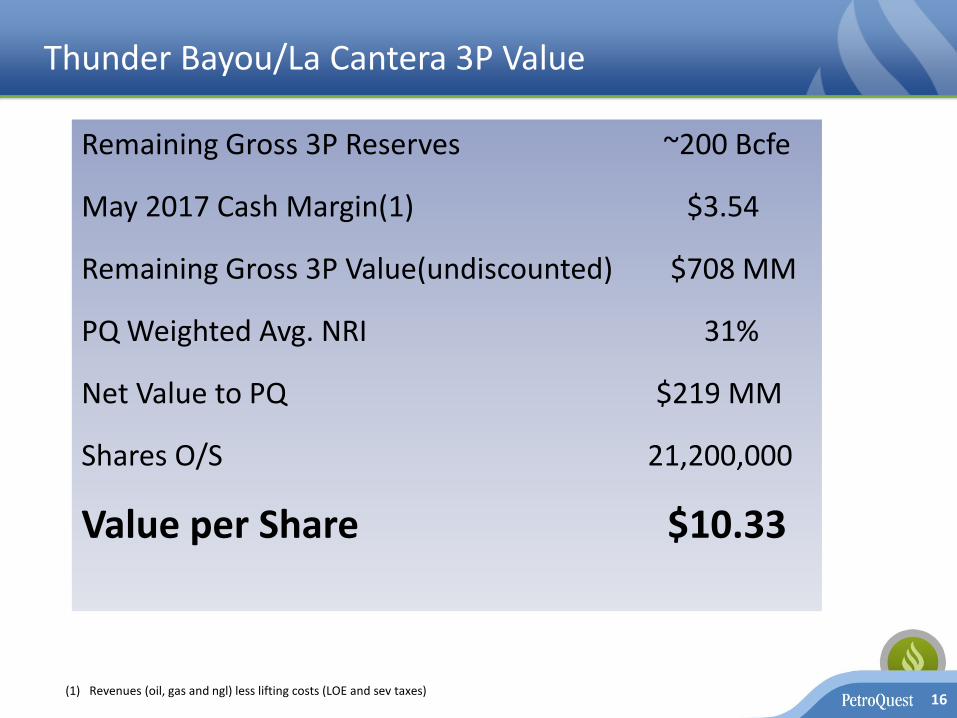
Thunder Bayou/La Cantera 3P Value
Remaining Gross 3P Reserves ~200 Bcfe
May 2017 Cash Margin(1) $3.54
Remaining Gross 3P Value(undiscounted) $708 MM
PQ Weighted Avg. NRI 31%
Net Value to PQ $219 MM
Shares O/S 21,200,000
Value per Share $10.33
16(1) Revenues (oil, gas and ngl) less lifting costs (LOE and sev taxes)

Sequential Growth Profile ($mm)
16.2
3.6
20.8
9.3
24.3
11.3
0
5
10
15
20
25
30
Revenues Cash Flow
4Q16 1Q17 2Q17
17
Revs up 50% from 4Q
CF up 214% from 4Q

Relative Deleveraging Through Cash Flow Growth
18
21.3x
13.4x
6.9x5.8x
4.9x4.1x
0
5
10
15
20
25
3Q16 4Q16 1Q17 2Q17 3Q17E (3) 4Q17E (3)
Debt/EBITDA (1) (2)
(1) Debt balance assumes PIK option is selected(2) Quarterly EBITDA annualized(3) FactSet quarterly average analyst estimate annualized
Deb
t/EB
ITD
A
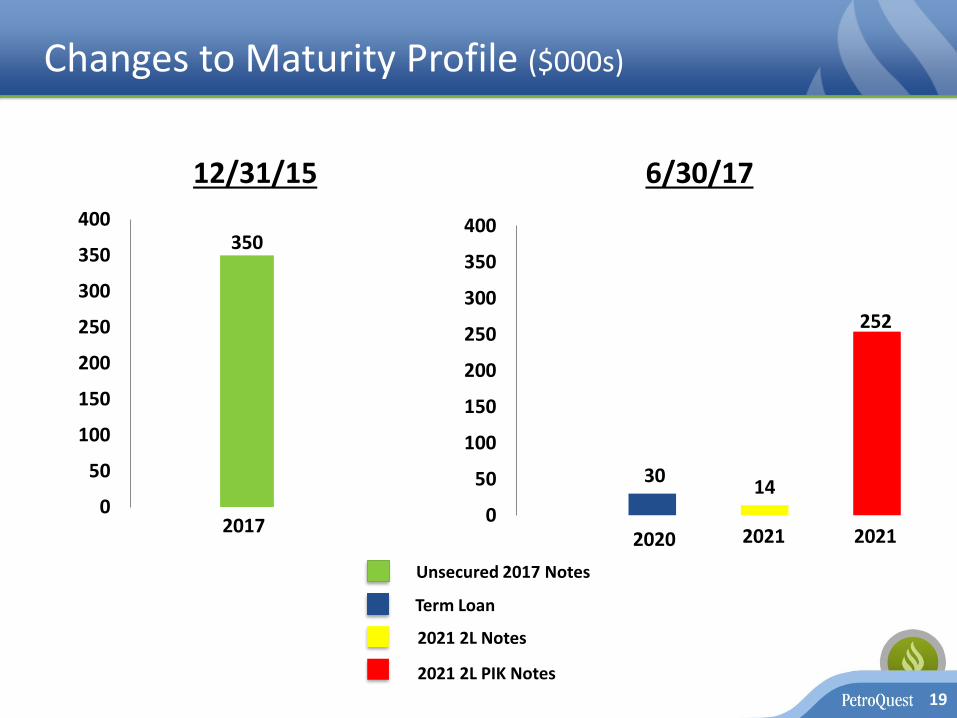
Changes to Maturity Profile ($000s)
19
350
0
50
100
150
200
250
300
350
400
2017
30 14
0
50
100
150
200
250
300
350
400
2020 2021 2021
12/31/15 6/30/17
252
Unsecured 2017 Notes
2021 2L Notes
2021 2L PIK Notes
Term Loan

2Q16 vs 2Q17 Comparison
20
2Q16 2Q17 % Change
EBITDA ($MM) $5.5 $12.7 131%
Disc. Cash Flow ($MM) ($1.0) $11.3 1200%
2017 Debt Maturity($MM) $144 - N/A
Realized Gas Price ($/Mcf) $2.07 $3.16 53%
$58
$45
20
25
30
35
40
45
50
55
60
6/30/16 Market Cap 9/1/17 Market Cap
$M
M

2017 Gas Hedge Position (MMcf/d)
21
-
10,000
20,000
30,000
40,000
50,000
60,000
70,000
80,000
1Q17 2Q17 3Q17E 4Q17E Exit Rate
Hedged Volumes Gas Production
*
* Assumes 4Q16 to 4Q17E exit growth of ~100%
Average floor gas price: $3.21Cotton Valley IRR @ $3.00: 67%

Summary
▪ Significant Growth through Cotton Valley development and Thunder Bayou recompletion
▪ 3Q17E production up 64% from 4Q16
▪ 2Q17 EBITDA up 20% from 4Q16▪ Annualized Debt/EBITDA at 6/30/17 down 57% from 12/31/16
▪ Latest Cotton Valley well achieves highest IP rate in conjunction with larger frack job (~$900/ft)
▪ 2016 Exchanges Provide Window for Growth
▪ Refinanced or repaid 100% of the YE15 debt of $350MM
▪ No material near-term maturities until 2021
▪ Generating significant cash interest savings via debt reduction/PIK
22

23
Appendix

Appendix 1 - Hedging Positions
24
Natural Gas Hedged Volumes (Bcfe) Price
2017 11.0 $3.21
1Q18 3.2 $3.24
$35.2 MM of revenue hedged for 2017$10.2 MM of revenue hedged for 2018
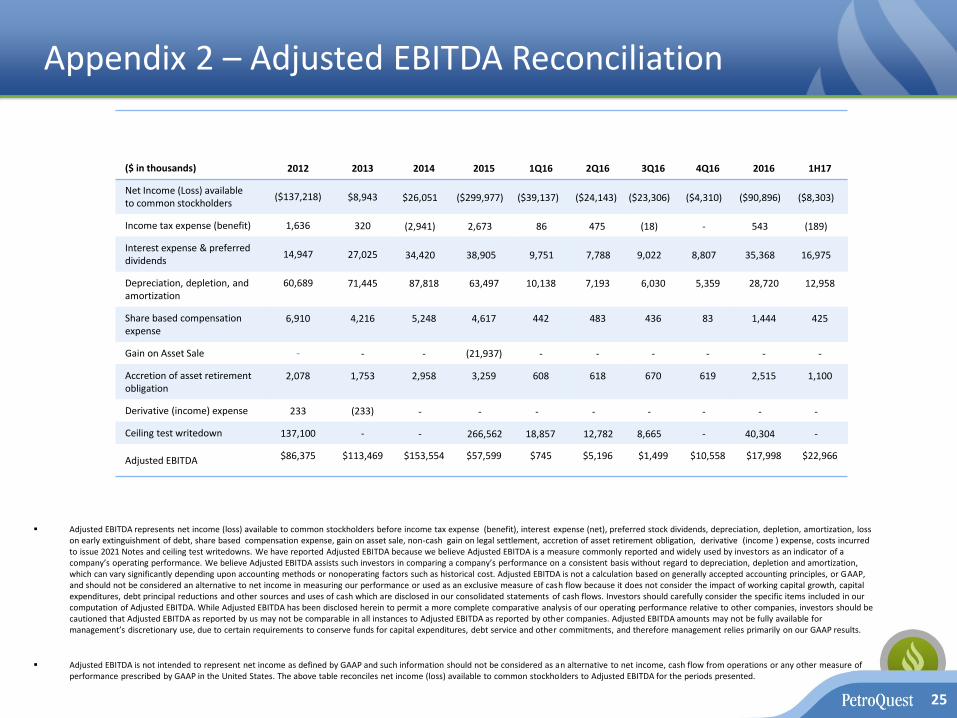
Appendix 2 – Adjusted EBITDA Reconciliation
▪ Adjusted EBITDA represents net income (loss) available to common stockholders before income tax expense (benefit), interest expense (net), preferred stock dividends, depreciation, depletion, amortization, loss on early extinguishment of debt, share based compensation expense, gain on asset sale, non-cash gain on legal settlement, accretion of asset retirement obligation, derivative (income ) expense, costs incurred to issue 2021 Notes and ceiling test writedowns. We have reported Adjusted EBITDA because we believe Adjusted EBITDA is a measure commonly reported and widely used by investors as an indicator of a company’s operating performance. We believe Adjusted EBITDA assists such investors in comparing a company’s performance on a consistent basis without regard to depreciation, depletion and amortization, which can vary significantly depending upon accounting methods or nonoperating factors such as historical cost. Adjusted EBITDA is not a calculation based on generally accepted accounting principles, or GAAP, and should not be considered an alternative to net income in measuring our performance or used as an exclusive measure of cash flow because it does not consider the impact of working capital growth, capital expenditures, debt principal reductions and other sources and uses of cash which are disclosed in our consolidated statements of cash flows. Investors should carefully consider the specific items included in our computation of Adjusted EBITDA. While Adjusted EBITDA has been disclosed herein to permit a more complete comparative analysis of our operating performance relative to other companies, investors should be cautioned that Adjusted EBITDA as reported by us may not be comparable in all instances to Adjusted EBITDA as reported by other companies. Adjusted EBITDA amounts may not be fully available for management’s discretionary use, due to certain requirements to conserve funds for capital expenditures, debt service and other commitments, and therefore management relies primarily on our GAAP results.
▪ Adjusted EBITDA is not intended to represent net income as defined by GAAP and such information should not be considered as an alternative to net income, cash flow from operations or any other measure of performance prescribed by GAAP in the United States. The above table reconciles net income (loss) available to common stockholders to Adjusted EBITDA for the periods presented.
25
($ in thousands) 2012 2013 2014 2015 1Q16 2Q16 3Q16 4Q16 2016 1H17
Net Income (Loss) available to common stockholders
($137,218) $8,943 $26,051 ($299,977) ($39,137) ($24,143) ($23,306) ($4,310) ($90,896) ($8,303)
Income tax expense (benefit) 1,636 320 (2,941) 2,673 86 475 (18) - 543 (189)
Interest expense & preferred dividends
14,947 27,025 34,420 38,905 9,751 7,788 9,022 8,807 35,368 16,975
Depreciation, depletion, and amortization
60,689 71,445 87,818 63,497 10,138 7,193 6,030 5,359 28,720 12,958
Share based compensation expense
6,910 4,216 5,248 4,617 442 483 436 83 1,444 425
Gain on Asset Sale - - - (21,937) - - - - - -
Accretion of asset retirement obligation
2,078 1,753 2,958 3,259 608 618 670 619 2,515 1,100
Derivative (income) expense 233 (233) - - - - - - - -
Ceiling test writedown 137,100 - - 266,562 18,857 12,782 8,665 - 40,304 -
Adjusted EBITDA $86,375 $113,469 $153,554 $57,599 $745 $5,196 $1,499 $10,558 $17,998 $22,966

Appendix 3 - Discretionary Cash Flow Reconciliation
($ in thousands) 2011 2012 2013 2014 2015 1Q16 2Q16 3Q16 4Q16 2016 1H17
Net income (loss) $10,548 ($132,079) $14,082 $31,190 ($294,838) ($37,643) ($22,858) ($22,021) ($8,374) ($90,896) ($5,733)
Reconciling items:
Income tax expense (benefit) (1,810) 1,636 320 (2,941) 2,673 86 475 (18) - 543 (189)
Depreciation, depletion and amortization 58,243 60,689 71,445 87,818 63,497 10,138 7,193 6,030 5,359 28,720 12,958
Share based compensation expense 4,833 6,910 4,216 5,248 4,617 442 483 436 83 1,444 825
Gain on Asset Sale - - - - (21,937) - - - - - -
Ceiling test write down 18,907 137,100 - - 266,562 18,857 12,782 8,665 - 40,304 --
Accretion of asset retirement obligation 2,049 2,078 1,753 2,958 3,259 608 618 670 619 2,515 1,100
Costs incurred to issue 2021 Notes - - - - - 4,740 68 5,265 66 10,139 -
Non-cash PIK interest - - - - - - - - 5,722 5,722 11,179
Other 625 1,114 1,240 2,188 2,259 562 248 1,180 116 2,106 450
Discretionary cash flow $93,395 $77,448 $93,056 $126,461 $26,092 ($2,210) ($991) 207 3,591 597 20,590
Changes in working capital accounts 26,686 13,770 (29,867) 55,370 6,789 (23,516) 3,166 (25,509) (8,167) (54,026) (5,539)
Payments to settle asset retirement obligations (905) (2,627) (3,335) (3,623) (2,776) (464) (2,051) (369) (285) (3,169) (1,357)
Net cash flow provided by operating activities $119,176 $88,591 $59,854 $178,208 $30,105 ($26,190) $124 ($25,671) ($4,861) ($56,598) $13,694
Note: Management believes that discretionary cash flow is relevant and useful information, which is commonly used by analysts, investors and other interested parties in the oil and gas industry as a financial indicator of an oil and gas company’s ability to generate cash used to internally fund exploration and development activities and to service debt. Discretionary cash flow is not a measure of financial performance prepared in accordance with generally accepted accounting principles (“GAAP”) and should not be considered in isolation or as an alternative to net cash flow provided by operating activities. In addition, since discretionary cash flow is not a term defined by GAAP, it might not be comparable to similarly titled measures used by other companies.
26

Appendix 4 – Gulf Coast/GOM Free Cash Flow Reconciliation
($ in thousands) 2007-2016
Revenues $1,048,762
Lease Operating Expense (203,456)
Severance Tax (26,300)
Field level cash flow $819,006
Capital Expenditures (1) (367,023)
Free Cash Flow $451,983
27
(1) 2013 Capex excludes GOM acquisition.

Appendix 5 - Panola County Cotton Valley – Room to Run
28
Legend
Cotton Valley Wells
PQ CV Vertical Wells
PQ CV Horizontal Wells
PQ Area
of Mutual
InterestCarthage Field Area
– 4.4 TCF of
Unrisked Resource
Potential
2.2 Tcfe of
CV/TP/Bossier
Unrisked
Resource
Potential

Appendix 6 – Cotton Valley Production Profile
29
Recent Horizontal Cotton Valley Results
PQ#15 PQ#16 PQ#17 PQ#18 PQ #19 PQ #20 PQ #21 PQ #22 PQ #23 PQ #24* PQ #25 Avg.% of
IP
IP Rate (Mmcfe/d) 11.4 16.7 14.2 11.7 12.5 14.8 7.1 10.6 14.5 5.4 18.3 12.5 N/A
30 Day Avg. Rate (Mmcfe/d) 13.6 16.4 14.1 11.9 11.4 11.5 6.0 7.6 N/A N/A N/A 11.6 93%
60 Day Avg. Rate(Mmcfe/d) 13.5 13.9 13.2 11.3 10.6 10.4 5.2 7.7 N/A N/A N/A 10.7 86%
90 Day Avg. Rate(Mmcfe/d) 13.0 12.3 12.2 10.9 9.8 9.9 4.6 N/A N/A N/A N/A 10.4 83%
* PQ #24 experienced mechanical issues (directional equipment failure) during the drilling process resulting in 50% of the well being drilled out of section

30
Appendix 7 - Cotton Valley Wells: Maximum Growth with Minimal Wells
5.7
11.1
4
5
6
7
8
9
10
11
12
BC
FE
95% Growth
in Production
12/31/13 12/31/15
• Growth metrics above achieved with only 9 gross wells.
47.6
114
20
30
40
50
60
70
80
90
100
110
120
BC
FE
140% Growth
in Reserves
12/31/15
PROVED RESERVES PRODUCTION
12/31/13

Company Information
31
400 East Kaliste Saloom Road, Suite 6000
Lafayette, Louisiana 70508
Phone: (337) 232-7028
Fax: (337) 232-0044
www.petroquest.com
V2