2014 - metair
TRANSCRIPT

2014INTEGRaTEDaNNUaLREPORT

b METaIR 2014 INTEGRATED ANNUAL REPORT
Metair manufactures and distributes automotive components for original equipment manufacturers and aftermarket, while batteries are also manufactured and distributed for use in non-automotive sectors. The group’s 6 607 permanent employees work at operations in South Africa, Romania and Turkey, and export Metair’s products to more than 46 countries. The group is now the third largest battery manufacturer supplying Europe, Middle East, Africa and Russia.
Each year, Metair’s Integrated Annual Report presents the information in the report against the backdrop of a theme that is encapsulated in the IAR cover and visual representation throughout the report.
The theme chosen for 2014 is that of brand excellence, focusing on the group’s brands, brand value and customer’s brand loyalty.
EXCELLENCE THROUGH TOP bRaNDSThe cover of our 2014 Integrated Annual Report shows a brand wall of Metair’s main consumer-facing products. While our automotive components are integrated into vehicles that carry the original equipment manufacturer’s marque, our aftermarket
products, particularly our batteries, carry our own branding. Our RARE* marketing programme drives our brand building, supports our focus on customer satisfaction and provides the opportunity to raise the profile of the group’s products in the large automotive aftermarket.
The brands on our cover are presented as VIN (vehicle identification number) plates – the unique identifiers carried by every vehicle. Each VIN combines a sequence of digits that confirm the vehicle’s manufacturer, the vehicle’s general characteristics, model, year and place of manufacture. VIN numbers also include check digits to verify that the vehicle is genuine. In the same way, our brands identify our company’s unique product and service offerings, and underscore their high quality.
*WHaT IS R.a.R.E?R ESPONSIVENESS
a VaILabILITY
R EPRESENTaTION
E aSY TO DEaL WITH

1METaIR 2014 INTEGRATED ANNUAL REPORT
METAIR GROUP IS THE THIRD- LARGEST PLAYER IN THE EMEa BATTERY MARKET.
About this report 2
Highlights for 2014 2
Who we are 3
Our business model 4
Our strategy 6
Financial highlights 10
What we do 12
Chairman’s statement 14
Managing director’s report 16
Group structure 20
Material issues 30
Progress in 2014 34
Awards 35
Directors and officers of the company 36
Financial review 38
Operational review 40
Our approach to sustainability 43
Stakeholder relationships 44
Financial sustainability 46
Value-added statement 48
Transformation 49
Human capital 52
Environment 56
Corporate governance 59
Board audit and risk committee 67
Social and ethics committee report 69
Remuneration report 70
Shareholder analysis 74
Independent assurance statement 77
Appendix I – Accreditation 79
Appendix II – B-BBEE certification 80
Appendix III – Sustainability data table 81
Appendix IV – Human capital 83
Appendix V – King III checklist 84
Annual financial statements 88
Notice to shareholders 167
Shareholders’ diary 170
Form of proxy 171

2 METAIR 2014 INTEGRATED ANNUAL REPORT
Metair reports to stakeholders through various channels throughout the year and annually through the Integrated Annual Report. The 2014 Integrated Annual Report presents an overview of Metair’s activities for the period 1 January to 31 December 2014, although information up to the date of this report has been included where relevant. It aims to provide all stakeholders with an understanding of the group’s strategy and how this positions the group to negotiate the most significant risks it faces and realise the opportunities it has identified. It also details our performance for the year and how the group’s strategy positions it to create value in the long term.
In line with the group’s integrated approach to doing business, the report discusses both the group’s material financial issues and the environmental, social and governance issues that could have a significant impact on the long-term success of the group or its stakeholders. Mutlu Akü is included in the 2014 results for the full year. In 2013, their results were only included for three weeks. Apart from this consideration, there have been no significant changes to our business that affect the comparability of our reporting against the 2013 report. There have been no material restatements of information provided in previous reports.
The group consists of a number of subsidiaries, associates, management services companies and property companies that operate autonomously. While financial information is included for all subsidiaries and associates in accordance with International Financial Reporting Standards, reference should be made to the relevant sections of this report to ascertain which of the operations are included in the non-financial sustainability information disclosed. The transformation information on page 49 includes all South African subsidiaries and their material holdings, but excludes Rombat and Mutlu Akü. Hesto is reported on in the annual financial statements as an associate, but included fully in the non-financial reporting.
In preparing this report, we have been guided by the recommendations of the International Integrated Reporting Council’s (IIRC) Integrated Reporting <IR> Framework as it applies to our business. Sustainability information is presented in alignment with the Global Reporting Initiative (GRI) G4 reporting guidelines. We report in accordance with the Core option and our GRI Index is available on our website at www.metair.co.za. A copy of our sustainability Data Transparency Index report is also available on our website.
The report of Integrated Reporting and Assurance Services, who provided external assurance on the sustainability information included in this integrated report, appears on page 77.
All targets, intentions and forecasts stated in this report are accurate based on the information we have available to us at the time of writing. We are well aware that these may be invalidated should current conditions change significantly and will report on our progress in our next Integrated Annual Report.
The audit and risk committee and the board of Metair have reviewed this report and believe that it accurately represents the affairs of the company for the year under review.
For further information regarding this report, please contact the company secretary, Sanet Vermaak:Telephone: +27 11 646 3011Fax: +27 11 646 3102Email: [email protected]
ABOUT THIS REPORT
Our vision is to generate value for all our stakeholders by managing and controlling businesses that, through marketing, manufacturing and/or logistical excellence, deliver quality, cost-competitive products to our customers in a sustainable manner.
HIGHLIGHTS FOR 2014
303 cents
Headline earnings per share increased by 38% to
per share
R7.3 billion
Revenue increased 39% to
MutluStrong results from
focusIncreased customer sales
80 cents
Dividend per share of
declared in 2015 in respect of the 2014 financial year
groupExcellent progress on
delivery of the
strategy
Mutlu Aküintegration progressing well and on schedule
Most of the South African subsidiaries at
B-BBEE Level 3
Carbon footprint of South African subsidiaries
decreased
2.3%
Production-adjusted
energy consumption limited to a
across the group4.3% increase
Battery research and development centre approved

3METAIR 2014 INTEGRATED ANNUAL REPORT
LOGO COMPANYOWNER-
SHIPKEY BUSINESS AREA AND PRODUCTS
OE DESIGN PARTNERS WITH IP IN PRODUCT DEVELOPMENT
MANUFAC- TURING
PARTNERSHIPS
KEY OE RELATIONSHIPS
Mutlu Akü 100.0%* Batteries, solar systems, backup systems, standby systems, charging systems
First National Battery
100.0%Batteries, solar systems, backup systems, standby systems, charging systems, Battery Centre franchise
Rombat 99.4%Batteries, solar systems, backup systems, standby systems, charging systems
Supreme Spring
100.0%Coil springs, leaf springs, stabilisers, torsion bars
ATE 100.0%Brake pads, brake discs, brake shoes, hydraulics and other braking components
Lumotech 100.0%Headlights, tail lights, reflectors, plastic injection mouldings, commercial lighting e.g. streetlights & warehouse lights
Tenneco Automotive
25.1% Shock absorbers, struts, track control arm
Hesto Harnesses
74.9%Wiring harnesses, instrument cluster/combination meter
Valeo SA 49.0% Front end modules
Smiths Plastics
100.0% Plastic injection moulding
Automould 100.0% Plastic injection moulding
Smiths Manufacturing
75.0%
Climate control systems, airconditioning systems, air cleaners, radiators, wiper systems, electronic control units, alternators and starters
Unitrade 100.0% Automotive cable, automotive wire
Metair Investments Ltd (Metair) is a publicly-owned company, headquartered in Johannesburg and listed on the Johannesburg Stock Exchange. The group manages an international portfolio of companies that manufacture and distribute products predominantly for the automotive industry and exports to approximately 46 countries.
Mutlu Akü is a public company listed on the Borsa Istanbul. At the end of 2014, Metair owned 98.5% of Mutlu Akü and the remaining shareholders were squeezed out early in 2015 and the company became a wholly-owned subsidiary of Metair.
The group’s operations manufacture and assemble products serving three broad markets:
ORIGINAL EQUIPMENT (OE)Original equipment components are used in the assembly of new vehicles by original equipment manufacturers (OEMs). The group produces and supplies components to all major OEMs in South Africa and to OEMs in Europe, Romania, Turkey and Russia through subsidiaries in Romania (Rombat) and Turkey (Mutlu Akü).
Key areas served: Romania, Russia, South Africa and Turkey.
AFTERMARKETSpare parts and other products are used in the automotive aftermarket and include batteries, brake pads, shock absorbers, lights, radiators and air conditioners. The group also produces generic aftermarket products for use in the increasing number of imported vehicles. The group exports
to approximately 46 destinations from its three countries of operation.
Key areas served: Africa, Europe, Middle East, Russia and Turkey.
NON-AUTOMOTIVE Products mostly relate to telecoms, utility, mining, retail and materials/products handling sectors.
Key areas served: sub-Saharan Africa and Turkey.
The group’s properties are owned and managed by the respective operating subsidiaries in South Africa, Romania and Turkey.
OUR KEY BUSINESSES
WHO WE ARE
* As at the date of this report

FINANCIAL CAPITAL
MANUFACTURED CAPITAL
HUMAN CAPITAL
INTELLECTUAL CAPITAL
SOCIAL AND RELATIONSHIP CAPITAL
NATURAL CAPITAL
• Capital restructuring in 2014• R754 million reinvested
in the group
• Investments to increase capacity and efficiency • Steel and alloys used in manufacturing products • Plant and equipment
• 6 607 skilled permanent employees in three countries of operation
• Skilled and experienced employees
• Technical expertise shared across operations
• Stakeholder-inclusive business model
• Close operational relationships with customers
• Partner model in certain operating businesses
• Electricity, water and air• Lead and other base metals
ME
THO
DM
AN
MA
CH
INE
MO
NE
YC
US
TOD
IAN
SH
IPM
ATE
RIA
L
METAIR MANUFACTURING OPERATIONS
7.6 MILLION AUTOMOTIVE BATTERIES PRODUCED
148 THOUSAND NON-AUTOMOTIVE BATTERIES PRODUCED
OVER
1.5 MILLION CARS SUPPLIED WITH COMPONENTS
INPUTS
4 METaIR 2014 INTEGRATED ANNUAL REPORT
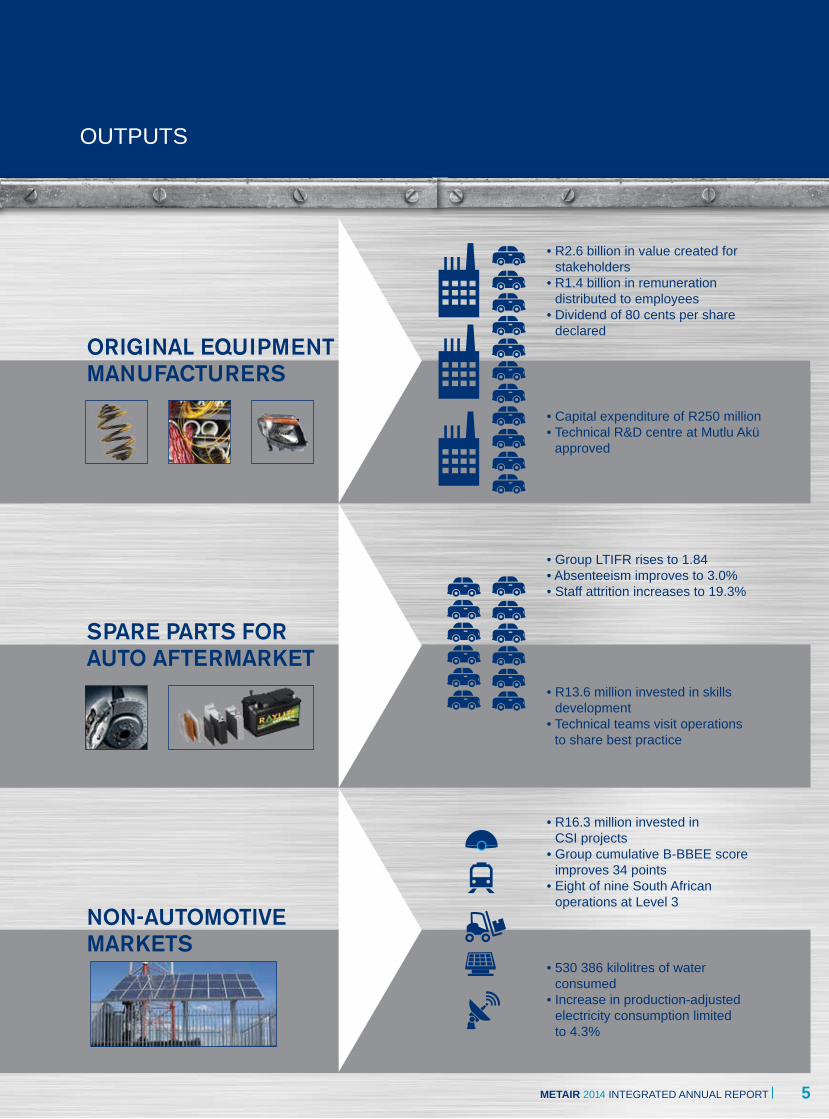
• R2.6 billion in value created for stakeholders
• R1.4 billion in remuneration distributed to employees
• Dividend of 80 cents per share declared
• Capital expenditure of R250 million • Technical R&D centre at Mutlu Akü
approved
• Group LTIFR rises to 1.84 • Absenteeism improves to 3.0% • Staff attrition increases to 19.3%
• R13.6 million invested in skills development
• Technical teams visit operations to share best practice
• R16.3 million invested in CSI projects
• Group cumulative B-BBEE score improves 34 points
• Eight of nine South African operations at Level 3
• 530 386 kilolitres of water consumed
• Increase in production-adjusted electricity consumption limited to 4.3%
ORIGINAL EQUIPMENT MANUFACTURERS
SPARE PARTS FOR AUTO AFTERMARKET
NON-AUTOMOTIVE MARKETS
OUTPUTS
5METaIR 2014 INTEGRATED ANNUAL REPORT

6 METaIR 2014 INTEGRATED ANNUAL REPORT
Metair does business by design and our strategy has evolved as the group has developed. Our success has been built on Manufacturing Excellence – the ‘ME’ in Metair. Manufacturing excellence is essential to meet the exacting quality and reliability required of our products as well as to ensure that we can generate sustainable economic returns in the highly competitive markets in which we operate.
METaNUFaCTURING
X
C
E
L
L
E
N
C
E
E
C
H
N
O
L
O
G
Y
AUTOMOTIVE
INDUSTRIaL
RETaIL
OUR STRATEGY
The company began in 1948 and started to supply automotive components to a single OEM in South Africa in 1964. In 2014, Metair is a truly international company, with multiple OEM customers, a broad range of aftermarket and non-automotive products, operations in three countries and ambitions to grow into five continents in the next four years.
SEVEN KEY STRaTEGIC FOCUS POINTS FOR 2015
1. Continue to target balance in the businessBalance is a critical concept in our strategy. Since 2006, we have concentrated on broadening our customer base, our product range and our international presence to balance our revenue source between OE and aftermarket, with an added intention to increase the proportion of earnings from batteries in both markets.
Developing this balance has been an important part of ensuring the financial sustainability of the organisation by diversifying revenue streams across customers, geographies and products. It also applies to the balance between the need to generate acceptable financial returns for our stakeholders with our environmental and social responsibilities. Material balance in the components we produce is closely scrutinised to ensure these meet the stringent European and Japanese quality and environmental requirements. Running a profitable business requires that we balance OE pricing demands with the realities of high rates of inflation in input costs.
Our acquisitions in Romania and Turkey have brought increased geographic balance to the business. South Africa represents the historical roots of the company, has a strong OEM presence and provides access into the rest of the African continent. Romania is a low cost manufacturing destination that offers proximity to OEMs and aftermarket opportunities both within the country and in Western
40+60 28+72100 85+1515%
100%40%
28%72%
85%60%
n Single OE
1964 2005 2010 2014
n Single OE n Single OE n Single OE

7METaIR 2014 INTEGRATED ANNUAL REPORT
and Eastern Europe. Turkey is the number one heavy vehicle and bus manufacturer in Europe with an aftermarket of around 18 million cars and light commercial vehicles. It also gives the group access to markets in North Africa, Europe, Eastern Europe and the Middle East.
With the integration of Rombat and Mutlu Akü we have achieved our ‘3 x 50%’ vision set in place in 2010 at a group level. This set us on the course to increase the proportion of aftermarket business to 50% to balance it with the OEM business, at the same time growing our battery business to 50% of revenue across both aftermarket and OE businesses. Our ongoing aim is to achieve the ‘3 x 50’ balance within the South African businesses as well as at a group level.
2. Nurture the Original Equipment (OE) business and expand the Original Equipment Manufacturer (OEM) customer baseWhile our strategy has focused on reducing our overall reliance on the OE business, OEMs remain extremely important customers. The OE business maintains the legacy business of the company and helps to hone our focus on quality, delivery and cost-competitiveness. Technical exchanges enhance our manufacturing expertise. Supply is linked to a particular vehicle model, so the group benefits from long industry product lifecycles that make production volumes and revenues generally predictable.
The Automotive Production and Development Programme (APDP) that came into effect in 2013 appears to be working effectively and brings structural integrity and stability to market. This should support the future of the automotive industry in South Africa until after 2020, provided that the ongoing labour challenges in the country can be addressed.
The APDP was intended to lift automotive production in South Africa to 1.2 million vehicles a year by 2020 from current levels of between 500 000 to 600 000 a year. We believe this target will be extremely difficult to achieve and our forecasts do not anticipate a significant increase in production volumes from current levels.
Our goal is to secure replacement business with our current OEM customers at economic rates. Nurturing the OE business requires us to be where the vehicles are manufactured. Through our presence in Romania and Turkey we can grow our existing OE relationships into much larger new markets. Almost 20 million vehicles were produced in Europe in 2013 – nearly a quarter of global production.
n 2012 n 2013 n 2014 – Target* Includes aftermarket, non-automotive and exports
OE Aftermarket* Batteries
PERFORMaNCE aGaINST OUR ‘3 X 50’ STRaTEGY70%
60%
50%
40%
30%
20%
10%
0%
57%60%
54%
46% 46%
38%
45%
54%
40
The automotive Production and Development ProgrammeThe Automotive Production and Development Programme (APDP) replaced the Motor Industry Development Programme on 1 January 2013. The APDP supports OEMs and automotive component manufacturers and gives policy certainty for the South African automotive industry to 2020.
The programme consists of a combination of:l import duties on vehicle imports and component imports;l rebates on vehicle assembly;l rebates in the form of production incentives; andl cash incentives through the automotive investment
scheme.
During 2014, the government initiated a review of the APDP. Minor amendments arising from the review could be effective during 2016, while more significant changes are likely to be phased in over time. We anticipate that the changes from the review will promote additional localisation and employment.
3. Focus intently on cost OE business is won or lost primarily on cost competitiveness. South African component manufacturers are measured against global cost benchmarks and we consequently manage production efficiencies extremely closely to ensure we can win business at a reasonable economic return. Cost efficiency is also extremely important in the aftermarket business, where increasing local and imported competition continue to pressurise margins.
Cost management becomes extremely challenging when the manufacturing environment is destabilised by labour disruptions and interrupted electricity supply.
4. Secure and grow the aftermarket product rangeOur aftermarket business provides spare parts and other products required to keep existing vehicles on the road throughout their life. The replacement cycle starts between two and four years after a vehicle is manufactured and generates repeat revenue from the manufactured car parc – the total vehicle population on the road. The aftermarket not only offers a potential market many times larger than the new vehicle market served by our OE segment, it also tends to be non-discretionary – while customers may postpone the purchase of a new vehicle, they can’t postpone replacing the battery or brake pads on their existing vehicle.
The aftermarket also provides access to the imported vehicle market through generic parts. Growing the aftermarket business requires us to be where the vehicles are sold, rather than where they are made. Rombat and Mutlu Akü nearly triple the group’s potential aftermarket customer base and provide access to the broader European market where total vehicles in use exceed 350 million.
The products we supply to the aftermarket also provide us an opportunity to build our brands. This has driven a focus on complementing our Manufacturing Excellence with Marketing Excellence through our RARE marketing programme, launched in February 2014. The programme provides a focused and dedicated brand awareness and marketing strategy that runs across all subsidiaries to secure the number one brand position in each of

8 METaIR 2014 INTEGRATED ANNUAL REPORT
OUR STRATEGYCONTINUED
our respective domestic markets. Automotive industry veteran and marketing expert Brand Pretorius was appointed to the board in 2014 to drive the development of marketing excellence in the group.
5. Grow our africa footprintAfrica represents an attractive market with its large population, solid economic growth forecasts and relatively low levels of current motorisation. Our components are used in cars that are exported by our OEM customers into the rest of Africa. However, with the growth in the African automotive market, countries are starting to protect their auto manufacturers. Sales volumes into Africa were reset in 2014 as a result of import duty regulations in Nigeria and Algeria.
Where OEMs set up production facilities in other African countries as a result of these regulatory changes, there is an opportunity for us to supply into those markets or partner with a local component manufacturer.
As the pool of vehicles in Africa grows the aftermarket opportunity will increase. This will be supported by the trend of second hand vehicles from developed markets, with their shorter ownership periods, making their way to developing markets such as countries
in Africa. As newer vehicles make their way into the African vehicle parc, replacement Start/Stop batteries are likely to be required in increasing quantities.
6. Focus on transfer of battery technologies to facilitate In 2010, First National Battery released its award-winning AGM battery for use in top-end Start/Stop systems. The Rombat and Mutlu Akü acquisitions introduced expertise in producing EFB batteries and exposed the group to further improvements in AGM technology. By combining the expertise in both technologies in the group, Metair is able to offer Start/Stop batteries to both top-end and entry-level Start/Stop systems.
7. To establish the principle of being an exemplary custodian within every employee that underpins the group’s core social and ethical values The principle of custodianship defines our approach to building a sustainable business and is enshrined in the group social and ethics framework. As the group continues to expand, it is essential that the group’s core social and ethical values are clearly communicated to every employee and integrated into our daily actions.
Romania
South africa
Turkey
Source: www.oica.net
VEHICLES IN USE 2013 (MILLION)
5.5
9.5
13.6
Source: www.oica.net
MOTORISaTION (2013) (VEHICLES PER 1 000 POPULaTION)
Indiaafrica
China
South africa
asia/Oceania/Middle East
Central & South america
EUNorth america
Russia, Turkey & Other Europe
2043
91
180
93
167
253
564649
Source: www.oica.net
VEHICLE PRODUCTION 2014 (THOUSaNDS)
Romania
South africa
Turkey
France
Russia
Germany
391
533
1 219
1 817
1 887
5 908
Germany 47.0
Russia 44.0
France 38.2

9METaIR 2014 INTEGRATED ANNUAL REPORT
STaRT/STOP baTTERIESIncreasing fuel efficiency is being driven by the need for OEMs to reduce automotive CO2 emissions as emission regulations continue to tighten. Europe has the most stringent CO2 emission regulations, requiring OEMs to produce vehicles emitting no more than of 130 grams of CO2 per kilometre by 2015, equivalent to a fuel consumption of about 5.2 litres/100km. From 2020, the target shifts to 95 gCO2/km (3.8 litres/100km).
Start/Stop systems using EFB and AGM lead acid batteries offer improved fuel efficiency at a relatively low cost and require minimal re-engineering of vehicle components compared to hybrid and electrical vehicles. The lead battery-powered 12-volt system has been the standard motor vehicle electrical system for many years. Redesigning and creating automotive components for the higher-voltage alternative battery systems used for full hybrid and electrical vehicles – such as nickel-metal hydride and lithium-ion batteries – is likely
to take many years and increase vehicle cost significantly. Hybrid and full electrical vehicles seem set to continue to rely on auxiliary lead-based batteries to power comfort features, redundancy and safety features in the medium term.
Hybrid vehicles comprised 1.4% of new car sales in the EU in 2013, while plug-in hybrid and battery-electric vehicles made up less than 0.5% of vehicle registrations. The figures are even lower for most other countries implying that lead-acid batteries will dominate the global vehicle parc for the foreseeable future.
Metair’s world-class proprietary Start/Stop battery technology and manufacturing capability positions us strategically to act as a global industry consolidator, creating significant value through technology transfer and increased relevance to OEMs.
baTTERY TECHNOLOGIESDry cell batteries, or alkaline batteries, include those used in household electronics such as torches and TV remote controls. They are primary batteries and cannot be recharged due to the chemical nature of the materials used inside the battery, hence making them not suitable for use in cars.
Traditional lead acid batteries are known as ‘flooded’ batteries since they use the chemical reaction between ‘wet’ acid and the battery’s lead plates to generate electricity. While these batteries are suitable for most cars, they cannot handle the increased demands of modern Start/Stop systems in cars.
Enhanced flooded batteries (EFB) improve on the traditional lead acid battery and can deliver the performance necessary for Start/Stop systems due to their improved durability. These batteries have improved charge acceptance and a longer life than traditional car batteries and are suitable for all cars on the road. EFB technology provides a cost-effective solution for Start/Stop systems but does not have the rapid charging characteristics required for regenerative braking systems employed in modern upmarket cars.
absorbed glass mat (aGM) batteries are classified as a valve regulated lead acid (VRLA) battery. These batteries immobilise the acid in the battery using fibreglass separators between the battery plates and provide the superior performance required in higher-specification Start/Stop systems. AGM batteries are suitable for regenerative braking systems, have more power and longer lives than other types of batteries.
aUTOMOTIVE CO2 EMISSION REGULaTIONS
n australia n China n USa n Japan n Europe
Source: International Council on Clean Transportation
2802602402202001801601401201008060
Gra
ms
CO
2/km
(equ
ival
ent)
2003 2006 2009 2012 2015 2018 2021 2024 2027 2030
USaJapan
China
Europe
australia
10 METaIR 2014 INTEGRATED ANNUAL REPORT
Restated based on results with Hesto consolidated2014
R’0002013
R’0002012
R’0002011
R’0002010
R’0002009
R’0002008
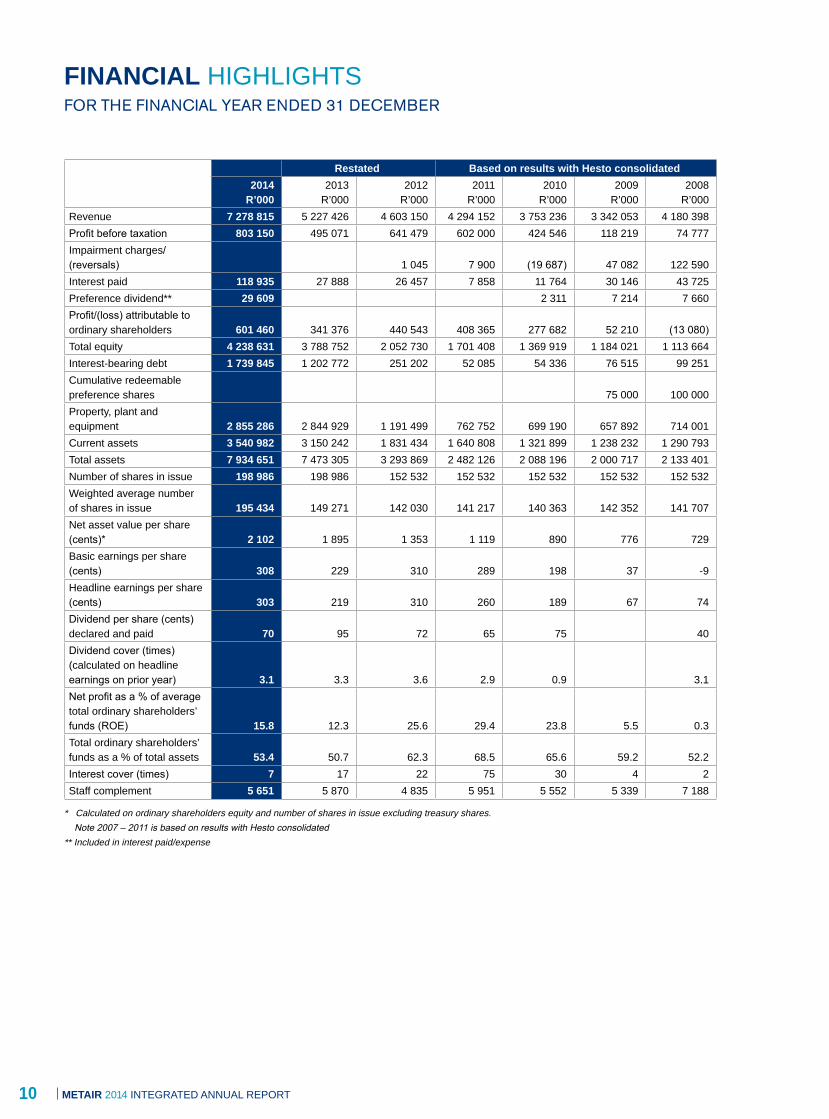
R’000Revenue 7 278 815 5 227 426 4 603 150 4 294 152 3 753 236 3 342 053 4 180 398Profit before taxation 803 150 495 071 641 479 602 000 424 546 118 219 74 777Impairment charges/ (reversals) 1 045 7 900 (19 687) 47 082 122 590Interest paid 118 935 27 888 26 457 7 858 11 764 30 146 43 725Preference dividend** 29 609 2 311 7 214 7 660Profit/(loss) attributable to ordinary shareholders 601 460 341 376 440 543 408 365 277 682 52 210 (13 080)Total equity 4 238 631 3 788 752 2 052 730 1 701 408 1 369 919 1 184 021 1 113 664Interest-bearing debt 1 739 845 1 202 772 251 202 52 085 54 336 76 515 99 251Cumulative redeemable preference shares 75 000 100 000Property, plant and equipment 2 855 286 2 844 929 1 191 499 762 752 699 190 657 892 714 001Current assets 3 540 982 3 150 242 1 831 434 1 640 808 1 321 899 1 238 232 1 290 793Total assets 7 934 651 7 473 305 3 293 869 2 482 126 2 088 196 2 000 717 2 133 401Number of shares in issue 198 986 198 986 152 532 152 532 152 532 152 532 152 532Weighted average number of shares in issue 195 434 149 271 142 030 141 217 140 363 142 352 141 707Net asset value per share (cents)* 2 102 1 895 1 353 1 119 890 776 729Basic earnings per share (cents) 308 229 310 289 198 37 -9Headline earnings per share (cents) 303 219 310 260 189 67 74Dividend per share (cents) declared and paid 70 95 72 65 75 40Dividend cover (times) (calculated on headline earnings on prior year) 3.1 3.3 3.6 2.9 0.9 3.1Net profit as a % of average total ordinary shareholders’ funds (ROE) 15.8 12.3 25.6 29.4 23.8 5.5 0.3Total ordinary shareholders’ funds as a % of total assets 53.4 50.7 62.3 68.5 65.6 59.2 52.2Interest cover (times) 7 17 22 75 30 4 2Staff complement 5 651 5 870 4 835 5 951 5 552 5 339 7 188
* Calculated on ordinary shareholders equity and number of shares in issue excluding treasury shares. Note 2007 – 2011 is based on results with Hesto consolidated** Included in interest paid/expense
FINaNCIaL HIGHLIGHTSFOR THE FINANCIAL YEAR ENDED 31 DECEMBER
11METaIR 2014 INTEGRATED ANNUAL REPORT
2008 2009
2009
2010 2011 2012 2013 2014
HEaDLINE EaRNINGS PER SHaRE (CENTS)
REVENUE (R MILLION) SHaRE PRICE aT 31 DECEMbER (CENTS)
DIVIDENDS PER SHaRE (CENTS)350
300
250
200
150
100
50
0
8 000
7 000
6 000
5 000
4 000
3 000
2 000
1 000
0
4 500
4 000
3 500
3 000
2 500
2 000
1 500
1 000
500
0
1009080706050403020100
2013
5 227
2014
7 279
2012
4 603
2011
4 294
2010
3 753
2009
3 342
2008
4 180
310
2012
260
2011
189
2010
67
2009
74
2008 2014
303
2013
21970
2014
95
2013
72
2012
65
2011
75
2010
40
2008

12 METAIR 2014 INTEGRATED ANNUAL REPORT
THE SHADING ON THE VIN PLATES SHOWS THE RELATIVE REVENUE CONTRIBUTION, PRODUCT SPLIT AND METAIR’S HOLDING.
KEY
REVENUE CONTRIBUTION METAIR HOLDING ORIGINAL EQUIPMENT AFTERMARKET NON-AUTOMOTIVE
MATERIAL OPERATIONS AND MARKET SEGMENTS
MUTLU GROUP
100%*27%
FIRST NATIONAL BATTERY
100%19%
79%
55% 27%18%
9%12 %
* As at the date of this report
(% of segmental revenue before property rental and reconciling items)

13METAIR 2014 INTEGRATED ANNUAL REPORT
SMITHS MANUFACTURING
75%15%
ROMBAT
99.4%11%
HESTO
74.9%10%SMITHS PLASTICS
100%6%
SUPREME SPRING
100%5% LUMOTECH
100%4% UNITRADE
100%2% ATE
100%1%
84% 16%
84% 1%
99%3%
2%1%95%
94% 6%
15%
17%83% 88% 12% 100%

14 METaIR 2014 INTEGRATED ANNUAL REPORT
When I stepped into the role of chairman of Metair in 2007, it was very different to the company it is today. At the time, 85% of our business came from a single original equipment manufacturer (OEM) customer. In the seven years since, the business has grown its turnover from R3.0 billion to R7.3 billion, now supplies all of the OEMs in the South African market, broadened and deepened our aftermarket offering, made two strategic acquisitions in key international markets, developed and launched award-winning products and even introduced a range of products to meet the needs of our increasingly environmentally aware customers. And all of this was achieved while negotiating the biggest financial crisis of the last 100 years.
If I had to sum up our strategy in one word, that word would be ‘balance’. In the past seven years we have rebalanced our OE business to bring in other OEMs. We have also balanced our overall business between OE and aftermarket and evolved our product mix so that 50% of our business comes from the sale of batteries.
I would argue that the Start/Stop systems served by our flagship car batteries themselves represent a practical balance – a point of equilibrium between the need to find a technology to reduce vehicle emissions quickly and cost-effectively, and the need to identify and develop the next generation of technologies over the coming 10 to 20 years that will reduce emissions even further.
Even within this category of products there is balance. The VRLA AGM Start/Stop batteries developed by First National Battery more than meet the demands of high-end Start/Stop systems. The Enhanced Flooded Battery range perfected at our Turkish subsidiary Mutlu Akü suits the needs of the lower-spec systems that currently dominate the Start/Stop market.
As we continue to grow, it is critical that we measure the need to capitalise on further opportunities against the importance of fully realising the synergies that justified our recent acquisitions, while not neglecting our legacy businesses. In this regard, I believe the appointment of Ken Lello as chief operating officer is an important development that brings more balance to the roles allocated across the management team.
Developing balance has been essential to ensure the sustainability of the business and applies equally to the broader concepts of sustainability too. Profitability considerations are balanced with the need to ensure that our employees are fairly remunerated for their hard work. We seek to offset the impacts of our operations on the communities around us with a commitment to assisting with the development of infrastructure within these communities, to help members to realise their full potential. We endeavour to balance the need to generate an acceptable financial return with the need to be responsible custodians of our natural capital.
AS WE CONTINUE TO GROW, IT IS CRITICAL THAT WE MEASURE THE NEED TO CAPITALISE ON FURTHER OPPORTUNITIES AGAINST THE IMPORTANCE OF FULLY REALISING THE SYNERGIES THAT JUSTIFIED OUR RECENT ACQUISITIONS, WHILE NOT NEGLECTING OUR LEGACY BUSINESSES.
Mpueleng Pooe
THE BOARD HAS PLAYED AN IMPORTANT ROLE IN ENSURING
CORPORATE GOVERNANCE AND SUSTAINABILITYOF THE BUSINESS
15METaIR 2014 INTEGRATED ANNUAL REPORT
This idea of custodianship is the principle we aspire to in the way we conduct ourselves as a company and as individuals. Custodianship to us means that we take great care of the things within our area of responsibility and that we understand that we are part of a bigger whole in which we play a critical role. We have explicitly added the concept of custodianship to our strategy pillars to reflect the importance we believe a strong ethical base plays in responsible business.
During the past year, the board has played an important role in ensuring corporate governance and sustainability of the business, and will continue to offer oversight to ensure we practice the principles of openness, integrity and accountability in achieving high standards of business integrity and ethics across all our activities.
The role of the board is critical to governance and the success of any organisation, and thus requires the appropriate balance of skills and experience among its members to fulfil its mandate. Our performance, our level of involvement, our approach to good governance and ethics, our experience and skills, and our preparedness in meetings – all affect our ability to add value to the business and ensure the success of the organisation. We need to continuously review our performance to ensure that we grow and improve our input and do not operate in a vacuum.
In the past year, the boards of various companies have come under immense scrutiny – having been questioned on their role in leading and managing a business; whether they are sufficiently independent of management; their composition; their decision-making; committee charters; and the incorporation of strategy, risk, performance and sustainability into the decision making philosophy among various other issues. It has necessitated us to pause and reflect and review our own board, our systems and processes, and our exposure to risk, and we will continue to assess these closely in the future.
I also want to highlight the principle that governance, strategy and sustainability are inseparable – this is one of the fundamental tenets of King III. It requires us to ensure that we continue to balance corporate citizenship, sustainability and stakeholder inclusivity in our decisions, so that we identify and manage both risks and opportunities.
The board is committed to sound corporate governance and best practices in this regard as advocated by the King III Code on Corporate Governance, and will continue to receive the consideration of both the board and its committees, as well as the management team during the year ahead.
I want to thank the board and the various sub-committees for their ongoing guidance, commitment and valuable insights to the business of Metair.
I would like to thank Ms Aziza Galiel for her contribution to the company in her years on the board. She was a valued member of our audit and risk committee and chaired the social and ethics committee. We will miss the principled perspectives she brought to our deliberations.
Mr Brian Jacobs stepped down as finance director after six years in the position. I thank him for his dedication and the value he brought to the company, and wish him well in his future endeavours.
I have already welcomed our new finance director, Mr Sjoerd Douwenga, to the board in person, but take this opportunity to repeat that welcome in these pages.
A business is only as good as the people that work in it. Our ongoing success is entirely dependent on the diligence and commitment of our employees. I would like to thank all of the group’s people, around the world, for their hard work in negotiating the bumpy road we have travelled in the last year, and conclude by thanking our managing director, Theo Loock, and his management team for their determination and drive in executing the strategy that has developed Metair into the company it is today.
As is evident from the cover and tone of this report, the next stage of our journey requires us to raise the profile of our brands and entrench our commitment to developing marketing excellence. Metair’s success to date has been built on our commitment to manufacturing excellence, which has enabled us to excel in a highly competitive industry. The components we manufacture work anonymously in the cars built by our OEM customers. As a result, Metair’s excellent reputation for high-quality, reliable and durable products is largely unknown outside the OE industry. Our growing presence in the aftermarket gives us the opportunity to let our brands find their voice and communicate this message to a much larger market.
With the group now established as an international company, let us aim to generate value in a sustainable manner for all our shareholders, by developing Metair into a truly global company.
OME Pooe Chairman

16 METaIR 2014 INTEGRATED ANNUAL REPORT
REPORT
Theo Loock
Metair is a business built around manufacturing excellence, so everything we do is done by design, rather than as a result of opportunism or chance. Our vision, our values and our strategic blueprint determine our actions and our guiding principle of custodianship means that we integrate social, governance and environmental priorities alongside the financial.
bUSINESS IN REDESIGNThe two significant international acquisitions we made in the last three years triggered the start of a redesign phase. With the Mutlu Akü acquisition we achieved our goal of balancing the contribution from original equipment (OE) and non-OE business, and between battery and non-battery business. The success of the early stages of integration of our acquisitions sets a high standard and we are now focused on realising the cost savings, technology transfers and synergies that were the rationale for the transactions.
EXCELLENT RESULTS IN a CHaLLENGING ECONOMIC ENVIRONMENTThe group produced an excellent set of results in another challenging operating year. Revenue grew 39% to R7.3 billion and EBITDA rose to R1.2 billion from R729 million (excluding transaction costs) in 2013. Operating profit margins increased by 2.9% to 11.4%. Headline earnings rose to R593 million and headline earnings per share increased 38% to 303 cents per share.
Despite the impact of additional interest and depreciation charges associated with the Mutlu acquisition, operating profit and profit before tax improved by R384 million and R308 million respectively.
Given the redesign cycle that Metair is going through, the group strives to ensure that it has an efficient capital structure without introducing increased levels of financial risk. As a result, our capital structure remains conservatively leveraged and reflects a debt/equity ratio of 30%. The group has borrowings from third parties of R1.7 billion and these have been used mainly for the acquisition of Mutlu Akü. The group is in compliance with all of its lenders’ covenants and, as at 31 December 2014, had unutilised facilities of approximately R3.5 billion.
MUTLU aKÜ INTEGRaTION aND aCQUISITIONMetair is very pleased with the improved financial performance of Mutlu Akü on a standalone basis, which increased EBITDA (excluding foreign exchange gains and losses) by 17% compared to the previous year, primarily through the intense focus on manufacturing efficiencies and operational expense control.
With the fast-changing geopolitical environment, our efforts were directed at the elements under our control while declining market demand in Turkey, neighbouring countries and Russia were closely monitored and where possible contained.
Although the combination of OEM model changes and the geopolitical climate brought about a year-on-year volume decline of 7%, Mutlu Akü proved to be resilient as the operating performance improved significantly to R300 million from R249 million in the previous full-year period.
WITH TWO MAJOR ACQUISITIONS IN FOREIGN JURISDICTIONS OVER THE LAST THREE YEARS, METAIR HAS PROVEN OUR ACQUISITION EXECUTION CAPABILITIES.
REDESIGNOF METAIR WILL CONTINUE IN THE YEAR AHEAD

17METaIR 2014 INTEGRATED ANNUAL REPORT
The resilience of Mutlu Akü proved to be on par with expectations as it still managed to improve its financial performance under these challenging trading conditions.
The potential for the Mutlu Akü acquisition to dilute earnings was always critical for Metair as half of the acquisition value of R2.9 billion was supported by a vendor placement of 46.5 million shares.
The debt financing increased the group’s net debt/equity ratio to 30% and added an interest charge of R87 million. The depreciation charge increased by R29 million as a result of the Purchase Price Allocation (PPA) and the combination of these factors set a relatively high earnings accretion target.
Metair is very grateful and pleased that on a standalone Mutlu group basis, the first full year’s performance of Mutlu group proved to be accretive on the 46.5 million shares issued as set out below.
Mutlu group profit after tax R275 millionLess Mutlu group acquisition interest R87 million Mutlu group PPA depreciation R29 millionNet Attributable Profit R159 millionAcquisition shares issued 46.454 millionEPS from Mutlu group placed shares (cents) 342
This is higher than the average EPS for the group.
STRONG GROWTH IN STaRT/STOP baTTERIESStart/Stop systems continue to cement their position as the most viable current technology available to meet tightening emissions targets in the short and medium term. According to Eurobat, in the three years to 2013, Start/Stop batteries sold in the EU increased from 3.8 million to 11.3 million and now comprise roughly 20% of all batteries sold in the region. Frost and Sullivan expect the market for Start/Stop batteries to grow at 20% a year, requiring 57 million batteries by 2020. Metair’s established presence in the Start/Stop market, through our Absorbed Glass Matt (AGM) and Enhanced Flooded Battery (EFB) Start/Stop batteries, positions us extremely well to meet the projected growth.
We have been very pleased with the high levels of technical expertise and innovation we found in Mutlu Akü and are now centralising the group’s research and development centre at our
Turkish operation. At the time of the acquisition, Mutlu Akü was supplying three OEM customers with EFB batteries and they added a contract to supply Renault during the year. Rombat was also awarded a contract to supply Renault with EFB batteries in 2015. Cross-pollinating Mutlu Akü’s expertise in EFB technology into the rest of the group helped fast track First National Battery (FNB) to supply EFB batteries into the South African OE market.
UPTaKE OF EXCESS baTTERY CaPaCITYWith two major acquisitions in foreign jurisdictions over the last three years, Metair has proven our acquisition execution capabilities. The initial acquisition integration and excellent first year financial performance have been set as standard. The challenge remains in the medium- to long-term delivery of these acquisitions on the strategic objective set for them.
In both the Mutlu Akü and Rombat acquisitions, one of the strategic objectives revolved around the transfer of technologies to enable the utilisation of identified spare capacity.
As Rombat’s acquisition was the first acquisition, executed in March of 2012, it has now reached the critical phase of selling the spare capacity.
Our battery manufacturing facilities have a total manufacturing capacity of around 10.9 million batteries per year – 2.4 million at FNB in South Africa, 2.8 million at Rombat in Romania and 5.7 million at Mutlu Akü in Turkey. Accessing spare battery manufacturing capacity in strategic countries was one of the key reasons for the acquisitions, and at the start of 2014 we had approximately 2.5 million of spare capacity across the three operations.
The increased take-up of AGM batteries in South Africa and Romania has decreased the excess capacity somewhat, as AGM batteries are larger and have tighter specifications than traditional lead acid batteries and EFBs. We estimate the spare capacity available in the group currently to be around 2.25 million. Our intent is to sell this capacity in the medium term.
The fact that we were unable to secure a large OEM Start/Stop battery supply contract at the start of 2014 was extremely disappointing. While we met all the interim technical criteria, it finally came down to pricing and supply logistics. The proposed raw material price balance skewed the risk/reward calculation on

18 METaIR 2014 INTEGRATED ANNUAL REPORT
the pricing to a degree that any further improvements would have made the contract unviable. We are making excellent progress on combining raw material procurement across the group’s international operations. As we deepen our presence in the broader European markets and unlock further synergies, I have no doubt we will be strongly competitive in future enquiries.
The excess battery capacity will be taken up in a number of ways:l Organic growth in the markets we currently serve, particularly
Turkey, will absorb some of the capacity. Turkey currently produces around 1.1 million vehicles a year and is targeting an increase to 2.6 million vehicles in 2016. This increase will absorb around a third of the excess capacity, assuming we retain our current market share in the Turkish market.
l Adding further OE customers in Europe, Eastern Europe, North Africa and the Middle East by leveraging our existing strong relationships with OEs in South Africa, Turkey and Romania. This approach has already shown positive progress in a number of negotiations.
l The first Start/Stop vehicles sold in Europe are approaching the time when their batteries will need to be replaced. The group has entered into an international brand distribution agreement to supply Start/Stop batteries across a large portion of the central European vehicle aftermarket.
REFINaNCE aND GROUP RESTRUCTURE TO SUPPORT OUR GROWTHWe were very pleased with the tremendous support we received from shareholders during the Mutlu Akü acquisition. In the second half of 2014 we refinanced the short-term bridging debt facilities raised for the acquisition through the issue of preference shares. Again, we received strong support for the redesign and strategic direction of Metair from our bankers and managed to secure the preference shares at a rate of 69% of prime. The refinance required a group restructuring to facilitate a streamlined dividend flow through our funding structure. As part of the refinance, we also raised a R750 million revolving credit facility for working capital and capital expenditure requirements.
LabOUR INSTabILITY aND ELECTRICITY SUPPLY DISRUPTIONS WEaKEN SOUTH aFRICa’S STRaTEGIC POSITION IN THE INDUSTRYThe labour challenges in South Africa continued in 2014 with a four-
week strike in the Steel/Metal and Engineering sector, which impacted on the OEM sector. Our excellent relationships with our workforce prevented strikes at our operations; however, OEMs were disrupted for two weeks. We find it concerning that labour and business appear to have such divergent views when the future prosperity of each is so deeply dependent on the other.
Industrial action in the automotive industry affects us in a number of ways. In the short term, strikes are extremely disruptive, leading to loss of sales and profit, stressing labour relations and putting pressure on our relationships with our clients.
In the medium-term, they may be positive as our OE customers recoup lost volumes. But these catch-back programmes involve overtime and weekend work that erode profitability and increase workload. Labour disruptions and other disruptions such as electricity supply disruptions cause instability in the manufacturing process, affect our ability to structure our operations appropriately and undermine financial sustainability.
The group increased its electricity standby capacity during the period to prevent any loss of production due to interruptions to continuous manufacturing processes that could paralyse our facilities for long periods.
These contingency plans can only be implemented in the fabrication environment in which Metair operates but unfortunately will be more difficult to replicate in their upstream beneficiation processes for our raw material suppliers.
We were therefore fortunate that no major production losses were experienced due to the instability of the electrical supply chain in South Africa.
Electricity supply outages that result in the interruption of a continuous manufacturing process for a prolonged period at a major base-material supplier in the automotive industry is a challenge that needs to be urgently addressed on a macroeconomic basis in South Africa.
The longer-term effects of these labour and electricity supply interruptions are less obvious. One impact is that OEMs may reconsider South Africa as a manufacturing destination. OEMs are reportedly evaluating other countries in Africa as possible manufacturing destinations and some have called a halt to studies into further increasing production on current models in the country. BMW chose not to launch their second platform production in South Africa.
The extended strike in the platinum mining industry also had an unexpected long-term consequence through its effects on our strategic empowerment shareholder, Royal Bafokeng Holdings. We are disappointed to lose RBH as a shareholder as they have a long-term focus and have supported Metair’s vision and strategy. This is particularly important due to the capital commitments necessary in our current phase of redesign.
ORIGINaL EQUIPMENTVehicle production in South Africa increased 4% in 2014 to 533 120. NAAMSA forecasts 593 000 vehicles for 2015 and 645 000 in 2016. Despite the solid support from the Automotive Production and Development Programme, we believe that the ceiling for South African production has prematurely hardened around these levels – well short of the ambitious 1.2 million vehicles a year announced when the programme was first proposed.
The South African OE business performed well despite the labour disruptions that affected our customers. Our OE businesses in
REPORT
(CONTINUED)
19METaIR 2014 INTEGRATED ANNUAL REPORT
Turkey and Romania traded at an acceptable level against the backdrop of model changes and rising inflation in Turkey, and in the context of the geopolitical challenges in the region, including sanctions against Russia and that country’s conflict with the Ukraine.
Turnover for the original equipment segment (as disclosed in the segmental review) increased 15% to R3.7 billion, contributing 46% to group revenue and 28% to operating profit.
aFTERMaRKETCompetition in the aftermarket continues to intensify. The South African operations have seen increased competition from cheap imports from China and Korea. Volumes were suppressed in Romania and Turkey due to the unusually warm northern hemisphere winter and geopolitical instability in our export destinations. The fire at FNB during the year interrupted production and cost us market share, which we are slowly gaining back. Our strategy remains to focus on quality and raise the profile of our brands.
While the labour disputes in the mining industry were resolved in the first half of 2014, our non-automotive segment is seeing very little activity from the sector.
The aftermarket segment achieved a 66% increase in turnover to R3.7 billion, which represents 45% of group turnover. Margins improved to 15.2% (2013: 12.9%) as a result of the strong contribution from Mutlu Akü and the group’s focus on overall efficiency.
HUMaN CaPITaLWe implemented a number of HR projects in 2014 that aimed to ensure that we appropriately reward and retain the skills we have in the group. We commissioned a grading exercise to objectively benchmark every job in the group against international peers. For the ninth year in a row, increases for salaried workers remained 2% to 4% below the rates of increase in wages for hourly employees, to ensure that the largest cohort of our employees experience the biggest benefit. The unintended consequence of this approach is that basic wages at some of our operators are now 50% or more higher than the bargaining council rates at which new competitors enter the market.
It is instructive that the higher efficiencies and lower labour costs in our other countries of production mean that we can import batteries from our overseas facilities and land them in South Africa at below our local production costs.
We also increased the number of subsidiary directors on our long-term incentive scheme in order to ensure that we continue to develop and retain the skills and competencies needed to execute our ambitious strategy and more closely align the interests of management with those of the group’s shareholders.
CONTINUED COMMITMENT TO TRaNSFORMaTIONThe improved B-BBEE scores of our South African operations demonstrate the group’s ongoing commitment to transformation. At year end, eight of our nine South African operations were at Level 3 and one achieved Level 4. These scores will drop when the revised codes are gazetted, but we have implemented action plans to counter this and anticipate that all operations should be able to achieve Level 4.
Each operation in the group invests time and money into their local communities through socio-economic development projects. Many of these projects focus on developing school infrastructure, resources and capacity to improve educational outcomes. This will ultimately contribute to the pool of technical skills that will be required to support South African manufacturing in the future.
At a group level, our investment in the Khaya Community Centre in Lehae near Johannesburg is a great example of the kind of sustainable project we like to support. The centre makes a difference in the lives of hundreds of people a day and involves a range of stakeholders working together for a common cause.
THE ENVIRONMENT Our increased geographic footprint has brought with it an increased environmental footprint, evident in the increases in our key environmental indicators – our carbon footprint, electricity consumption and water consumption. However, on a comparable basis – stripping out Mutlu Akü from the 2014 numbers – each of these indicators showed a decline year-on-year. Our constant focus on improving efficiencies in our manufacturing processes has the effect of reducing our consumption of electricity and water as well as limiting our greenhouse gas emissions.
LOOKING aHEaD The redesign of Metair will continue in the year ahead as we adjust to the challenges and opportunities that have been identified and set out in the integrated report. Acquisitions executed during the redesign process, although both aggressive and defensive in design, were always weighted on the aggressive side.
We will continue to seek acquisitions that leverage the group’s technology, expertise and balance sheet.
During 2015 and 2016 our OE customers will be undergoing a number of model changes. Although challenging in the short term this represents an opportunity in the medium to long term. We are extremely pleased that we have secured our participation in these planned model changes, especially at one of our major customers in South Africa. The nature of our OE business is that it requires higher levels of capital investment in periods of model changes combined with temporary reductions in production volumes. The opportunity lies in the successful launch of these new models with volume growth potential depending on the market penetration of the new models in the long run.
In the year ahead, we will continue to unlock the synergies in our acquisitions, keep our focus on manufacturing excellence in all of our operations, grow our brands in the aftermarket and focus on selling the spare capacity in our batteries business.
Metair’s performance in the year ahead is dependent upon, inter alia, the successful execution of our strategy, OE volumes, geopolitical conditions, a peaceful labour environment, continuous supply of electricity, efficiency improvements, internal inflation recoveries and the exchange rate. Subject to such factors, we expect 2015’s financial performance to be satisfactory but more challenging than 2014.
We continue to evaluate opportunities internationally and closer to home on the African continent, but as with our approach to the other areas of our business, we will only move on the opportunities that make financial sense, match our broader values and align with our strategy.
In closing, I would like to thank our customers for their business, my executive team for their support, the board for their guidance and counsel, our employees for their hard work and all stakeholders for their interaction and participation.
CT Loock Managing director
20 METAIR 2014 INTEGRATED ANNUAL REPORT
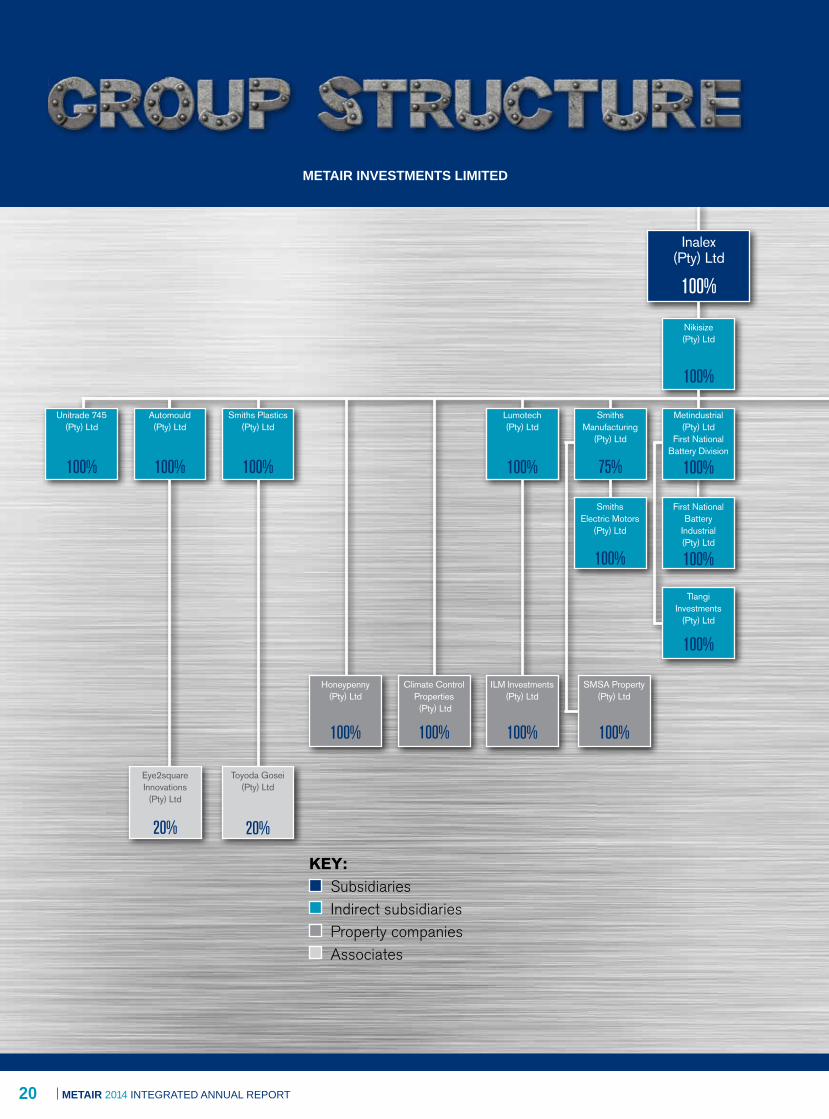
Inalex (Pty) Ltd
100%
Nikisize (Pty) Ltd
100%
Unitrade 745 (Pty) Ltd
100%
Automould (Pty) Ltd
100%
Smiths Plastics (Pty) Ltd
100%
Lumotech (Pty) Ltd
100%
Smiths Manufacturing
(Pty) Ltd
75%
Metindustrial (Pty) Ltd
First National Battery Division
100%
Smiths Electric Motors
(Pty) Ltd
100%
First National Battery
Industrial (Pty) Ltd
100%
Tlangi Investments
(Pty) Ltd
100%
SMSA Property (Pty) Ltd
100%
ILM Investments (Pty) Ltd
100%
Climate Control Properties (Pty) Ltd
100%
Honeypenny (Pty) Ltd
100%
Toyoda Gosei (Pty) Ltd
20%
Eye2square Innovations
(Pty) Ltd
20%
METAIR INVESTMENTS LIMITED
KEY: Subsidiaries Indirect subsidiaries Property companies Associates
21METaIR 2014 INTEGRATED ANNUAL REPORT
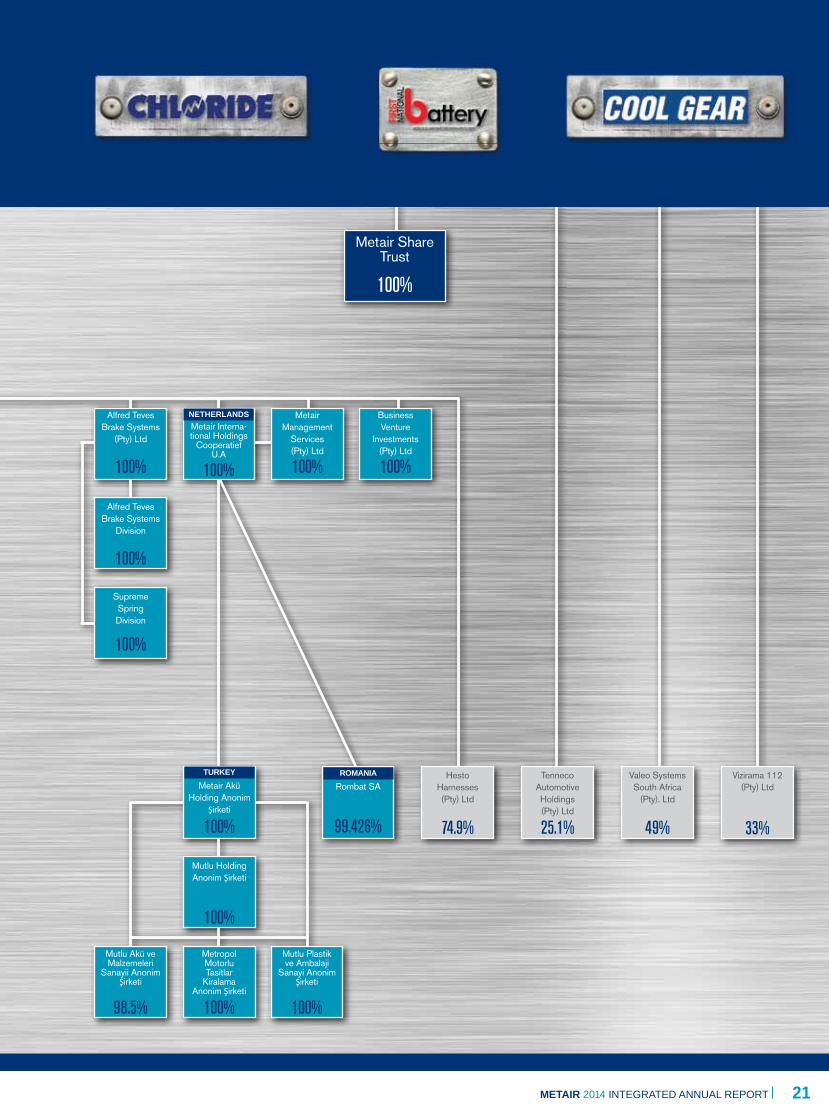
Metair Share Trust
100%
Alfred Teves Brake Systems
(Pty) Ltd
100%
Metair Interna-tional Holdings
Cooperatief U.A
100%
Metair Management
Services (Pty) Ltd
100%
Business Venture
Investments (Pty) Ltd
100%
Tenneco Automotive Holdings (Pty) Ltd
25.1%
Valeo Systems South Africa
(Pty). Ltd
49%
Vizirama 112 (Pty) Ltd
33%
Alfred Teves Brake Systems
Division
100%
Supreme Spring Division
100%
Hesto Harnesses (Pty) Ltd
74.9%
TURKEYMetair Akü
Holding Anonim Şirketi
100%
ROMaNIaRombat SA
99.426%
Mutlu Holding Anonim Şirketi
100%
Mutlu Akü ve Malzemeleri
Sanayii Anonim Şirketi
98.5%
Metropol Motorlu Tasitlar
Kiralama Anonim Şirketi
100%
Mutlu Plastik ve Ambalaji
Sanayi Anonim Şirketi
100%
NETHERLaNDS

22 METaIR 2014 INTEGRATED ANNUAL REPORT
THE INFORMATION ON THE PAGES THAT FOLLOW SHOWS THE MAJOR OPERATIONS AND THE PERCENTAGE OF METAIR’S HOLDING IN THE SUBSIDIARIES/ASSOCIATES.
(CONTINUED)
MaTERIaL METaIR HOLDINGS – SOUTH aFRICaN OPERaTIONS
METINDUSTRIaL
First National Battery division
100% holding
Products:BatteriesSolar systemsBack-up systemsStandby systemsCharging systemsBattery Centre franchise
Location:East London, Cape Town, Durban, Carletonville, Benoni, Rustenburg, Klerksdorp

23METaIR 2014 INTEGRATED ANNUAL REPORT
VaLEO SYSTEMS SOUTH aFRICa
49% holding
aLFRED TEVES bRaKE SYSTEMS
including Supreme Spring
100% holding
Products:Front-end modules
Location:Uitenhage
a
Products:Brake pads Brake discs Brake shoes Hydraulics Other braking components Coil springs Leaf springs Stabilisers Torsion bars
Location:Nigel, Boksburg

24 METaIR 2014 INTEGRATED ANNUAL REPORT
(CONTINUED)
MaTERIaL METaIR HOLDINGS – SOUTH aFRICaN OPERaTIONS
LUMOTECH
100% holding
Products:HeadlightsPlastic injection mouldingsLampsWheel trimsHornsTail lightsStreetlightsWarehouse lights
Location:Uitenhage

25METaIR 2014 INTEGRATED ANNUAL REPORT
TENNECO AUTOMOTIVE HOLDINGS SA
25.1% holding
SMITHS MANUFACTURING
75% holding
TENNECO AUTOMOTIVE SMITHS MANUFACTURING
Products:Shock absorbersStrutsTrack control arms
Location:Port Elizabeth
Products:Climate control systemsAir-conditioning systemsCooling modulesRadiatorsAir cleanersWiper systemsElectronic control unitsAlternators and starters
Location:Pinetown, Durban

26 METaIR 2014 INTEGRATED ANNUAL REPORT
SMITHS PLaSTICS aND aUTOMOULD
100% holding
Products:Plastic injection mouldings
Location:Pinetown, Durban
SMITHS PL
MaTERIaL METaIR HOLDINGS – SOUTH aFRICaN OPERaTIONS
(CONTINUED)

27METaIR 2014 INTEGRATED ANNUAL REPORT
Products:Automotive cableAutomotive wire
Location:Stanger
HESTO
74.9% holding
Products:Wiring harnesses
Location:Stanger
HESTOUNITRaDE
100% holding

28 METaIR 2014 INTEGRATED ANNUAL REPORT
MaTERIaL METaIR HOLDINGS – INTERNaTIONaL OPERaTIONS
ROMbaT
99.4% holding
MUTLU aKÜListed company on the Borsa Istanbul, battery production facility
100.0%* holding
Products:BatteriesBattery distribution networks
Location:Bistritsa and Copsa Mica, Romania
Products:Automotive and industrial batteries
Location:Istanbul and Gediz, Turkey
(CONTINUED)
* As at the date of this report

29METaIR 2014 INTEGRATED ANNUAL REPORT
MUTLU HOLDINGSOwns 75% of Mutlu Akü and responsible for the management of the Mutlu group
100% holding
MUTLU PLaSTIKProduction of plastic battery boxes
100% holding
Products:Plastic parts of batteries, covers and lids
METROPOL
Car fleet management
100% holding

30 METaIR INTEGRATED ANNUAL REPORT
MaTERIaL ISSUES
Our material issues are those challenges and opportunities that have the most potential to significantly affect the group’s long-term sustainability, or impact our stakeholders.
These issues arise from our risk assessment process. Monitoring and oversight of risk management in the group is the responsibility of the audit and risk committee. Each operation drafts a register of key risks that is consolidated at group level to create a group risk register. These risks include both financial and non-financial considerations.
Group risks are then assessed against other criteria to establish their materiality to the group. These criteria include:l input derived from our engagements with our key stakeholders,
which is useful to identify additional issues that may not have arisen in the internal risk assessment process;
l developments in relevant legislation and regulation;l review of local and international media reports on the automotive
and other target industries; andl peer reports and industry benchmarks.
The resulting list of material issues is then assessed against our combined assurance model to ensure that each issue is subject to an appropriate level of assurance.
The table below lists the group’s material issues, the stakeholders these affect, how we manage them, where in this report we discuss them and the aspects of our combined assurance model that support them.
Issues RelevanceStrategy component Stakeholder
Governance structure Report section
Material issue: Competitiveness• Competition from
low-cost countries
• Country competitiveness of South Africa
• Entry of international competitors
• Competing subsidised imported products
• Labour
• Unreliable energy supply
• Raw material supply
• Product quality
Metair competes in a global industry against competitors in low-cost manufacturing destinations.
Quality and cost-efficiency are important differentiators.
The aftermarket sector is characterised by increasing competition from low cost imported components supported by foreign government export incentives.
Recurring labour unrest undermines South Africa’s status as a preferred manufacturing destination.
An unstable manufacturing environment undermines cost-efficient production and product quality which may increase product recalls.
1. Nurture and expand OEM business
2. Focus intently on costs
All stakeholders Board and executive committee monitor efficiencies.
Managing director’s report
Stakeholder engagement
Financial sustainability
Human capital
Combined assurance: Policies and procedures, internal controls, risk management function, regular management reviews, internal audit, OE supplier quality reviews, external accreditation (ISO 9001, SABS SANS, VCA, ISD/TS 16949, ISO 14001, ISO 50001 etc.).

31METaIR 2014 INTEGRATED ANNUAL REPORT
Issues RelevanceStrategy component Stakeholder
Governance structure Report section
Material issue: Macroeconomic factors• Slow economic
recovery in Europe
• Currency volatility
• Continuity of supply
• Socio-economic stability in key markets
International developments affect Metair’s customers and the economic environments in which they operate.
Currency volatility creates uncertainty in budgeting and margins realised.
Interruptions to operations due to natural disasters, explosions, conflagrations or IT and other electronic system failure results in loss of production and loss of market share in highly competitive markets.
1. Target balance in the business
2. Nurture and expand OEM business
3. Focus intently on costs
4. Secure and grow aftermarket product range
All stakeholders Board and executive committee develops and executes strategies to respond to international developments and business interruptions.
Managing director’s report
Group risk management
Combined assurance: Policies and procedures, internal controls, risk management function and regular management reviews.
Material issue: balanced business• Balance across
customers, industries, geographies and between customer requirements and the need to earn a sustainable economic return
• Successful integration of acquisitions
Metair’s strategy is to minimise risk through diversification, by proactively managing customer relationships and best-practice manufacturing processes.
Execution of group strategy requires the successful integration of our international acquisitions, the uptake of the additional capacity acquired and the realisation of the medium-term synergies identified.
1. Target balance in the business
2. Nurture and expand OEM business
4. Secure and grow aftermarket product range
6. Focus on transfer of battery technologies to facilitate AGM and EFB growth
• All shareholders
• Analysts
• Customers (existing and potential)
• Government
• Employees and trade unions
Board and executive committee monitors balance and develops and executes strategies to balance the business.
Managing director’s report
Our strategy
Operational review
Environment
Combined assurance: Operational reviews, risk management function, internal audit and external assurance of financial information.
Material issue: business partnerships• International
business partners
• Customer relationships
• Government relationships
• Supply chain relationships
• Governance
Metair’s business depends on close relationships with key stakeholders.
Government is a particularly important industry stakeholder in terms of incentive programmes such as the APDP and ensuring that the South African market is protected from foreign government subsidised imports.
1. Target balance in the business
2. Nurture and expand OEM business
3. Focus intently on costs
4. Secure and grow aftermarket product range
5. Grow our Africa footprint
• Customers (existing and potential)
• Suppliers and trading partners
• Government
• Employees and trade unions
• Regulatory bodies
• Industry bodies (NAACAM, NAAMSA)
• Media
Board and executive committee manages relationships with key stakeholders.
Stakeholder engagement
Corporate governance report
Combined assurance: Regular management review, risk management function, internal audit, policies and procedures.

32 METaIR 2014 INTEGRATED ANNUAL REPORT
Issues RelevanceStrategy component Stakeholder
Governance structure Report section
Material issue: Transformation• Finding suitable
long-term empowerment shareholders to replace RBH
• Representative management, shareholding and workforce
• Corporate social investment
Metair needs long-term shareholders that understand and support our strategy, including the capital investment required to realise it.
Transformation is a moral imperative, a customer requirement and good business practice.
2. Nurture and expand OEM business
3. Focus intently on costs
• All shareholders
• Analysts
• Customers (existing and potential)
• Suppliers and trading partners
• Government
• Employees and trade unions
• Regulatory bodies
• Industry bodies (NAACAM, NAAMSA)
• Board and executive committee
Employment equity and transformation committees develop strategies and measure progress against stated targets.
Transformation human resource functions execute strategies.
Managing director’s report
Transformation
Human capital
Combined assurance: Regular management review, policies and procedures, external verification of B-BBEE information and OE supplier reviews.
Material issue: Human capital• Labour productivity
and efficiency
• Labour relations
• Labour cost
• Health and safety
• Skills retention and staff development
Labour is a key input in Metair’s cost efficiency and competitiveness and must be closely managed.
Succession planning for senior management must be managed.
Need to maintain skills base to remain competitive.
Human capital
1. Target balance in the business
2. Nurture and expand OEM business
3. Focus intently on costs
7. Custodianship
• Customers (existing and potential)
• Suppliers and trading partners
• Government
• Employees and trade unions
• Regulatory bodies
• Industry bodies (NAACAM, NAAMSA)
• Media
• Consultants and service providers
Remuneration committee, board and executive committees develop human capital strategy, manage key relationships and monitor progress against stated KPIs and targets.
Human capital
Combined assurance: Regular management review, policies and procedures, risk management function, internal audit, external verification of B-BBEE information, external accreditation (OHSAS 18001, ISO 14001) and external assurance of sustainability information.
MaTERIaL ISSUESCONTINUED

33METaIR 2014 INTEGRATED ANNUAL REPORT
Issues RelevanceStrategy component Stakeholder
Governance structure Report section
Material issue: The environment• Energy
consumption
• Carbon footprint
• Waste management
• Water
• Environmentally friendly products
• Environmental impacts
Metair’s alignment with the principle of custodianship aims to ensure that we actively manage our impact on the environment.
1. Target balance in the business
2. Nurture and expand OEM business
3. Focus intently on costs
7. Custodianship
• Strategic shareholders
• Minority shareholders and analysts
• Customers (existing and potential)
• Suppliers and trading partners
• Government
• Employees and trade unions
• Regulatory bodies
• Industry bodies (NAACAM, NAAMSA)
• Media
• Consultants and service providers
Board and executive committees develop environmental strategy and monitor progress against targets.
Environment
Combined assurance: Regular management review, risk management function, internal audit, policies and procedures, external accreditation (ISO 14001, ISO 50001), external preparation of carbon footprint data and external assurance of sustainability information.
34 METaIR 2014 INTEGRATED ANNUAL REPORT
PROGRESS IN 2014
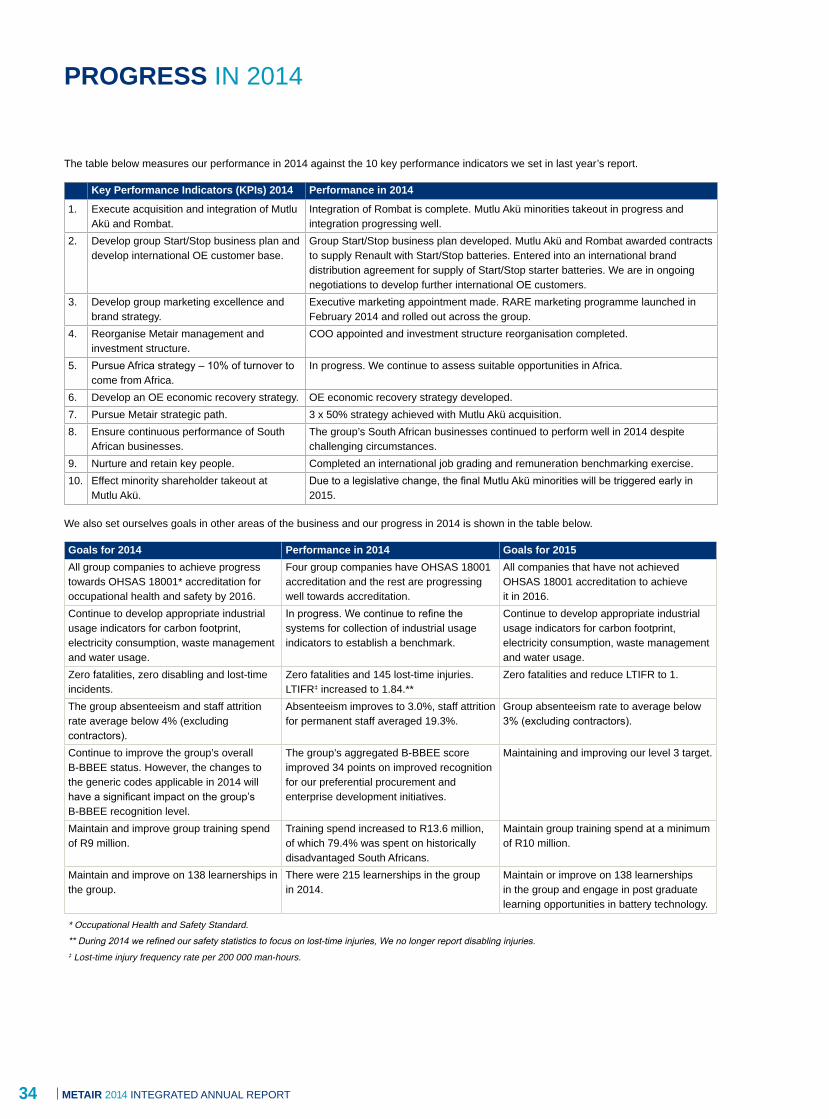
The table below measures our performance in 2014 against the 10 key performance indicators we set in last year’s report.
Key Performance Indicators (KPIs) 2014 Performance in 2014
1. Execute acquisition and integration of Mutlu Akü and Rombat.
Integration of Rombat is complete. Mutlu Akü minorities takeout in progress and integration progressing well.
2. Develop group Start/Stop business plan and develop international OE customer base.
Group Start/Stop business plan developed. Mutlu Akü and Rombat awarded contracts to supply Renault with Start/Stop batteries. Entered into an international brand distribution agreement for supply of Start/Stop starter batteries. We are in ongoing negotiations to develop further international OE customers.
3. Develop group marketing excellence and brand strategy.
Executive marketing appointment made. RARE marketing programme launched in February 2014 and rolled out across the group.
4. Reorganise Metair management and investment structure.
COO appointed and investment structure reorganisation completed.
5. Pursue Africa strategy – 10% of turnover to come from Africa.
In progress. We continue to assess suitable opportunities in Africa.
6. Develop an OE economic recovery strategy. OE economic recovery strategy developed.7. Pursue Metair strategic path. 3 x 50% strategy achieved with Mutlu Akü acquisition. 8. Ensure continuous performance of South
African businesses.The group’s South African businesses continued to perform well in 2014 despite challenging circumstances.
9. Nurture and retain key people. Completed an international job grading and remuneration benchmarking exercise. 10. Effect minority shareholder takeout at
Mutlu Akü.Due to a legislative change, the final Mutlu Akü minorities will be triggered early in 2015.
We also set ourselves goals in other areas of the business and our progress in 2014 is shown in the table below.
Goals for 2014 Performance in 2014 Goals for 2015All group companies to achieve progress towards OHSAS 18001* accreditation for occupational health and safety by 2016.
Four group companies have OHSAS 18001 accreditation and the rest are progressing well towards accreditation.
All companies that have not achieved OHSAS 18001 accreditation to achieve it in 2016.
Continue to develop appropriate industrial usage indicators for carbon footprint, electricity consumption, waste management and water usage.
In progress. We continue to refine the systems for collection of industrial usage indicators to establish a benchmark.
Continue to develop appropriate industrial usage indicators for carbon footprint, electricity consumption, waste management and water usage.
Zero fatalities, zero disabling and lost-time incidents.
Zero fatalities and 145 lost-time injuries. LTIFR‡ increased to 1.84.**
Zero fatalities and reduce LTIFR to 1.
The group absenteeism and staff attrition rate average below 4% (excluding contractors).
Absenteeism improves to 3.0%, staff attrition for permanent staff averaged 19.3%.
Group absenteeism rate to average below 3% (excluding contractors).
Continue to improve the group’s overall B-BBEE status. However, the changes to the generic codes applicable in 2014 will have a significant impact on the group’s B-BBEE recognition level.
The group’s aggregated B-BBEE score improved 34 points on improved recognition for our preferential procurement and enterprise development initiatives.
Maintaining and improving our level 3 target.
Maintain and improve group training spend of R9 million.
Training spend increased to R13.6 million, of which 79.4% was spent on historically disadvantaged South Africans.
Maintain group training spend at a minimum of R10 million.
Maintain and improve on 138 learnerships in the group.
There were 215 learnerships in the group in 2014.
Maintain or improve on 138 learnerships in the group and engage in post graduate learning opportunities in battery technology.
* Occupational Health and Safety Standard.
** During 2014 we refined our safety statistics to focus on lost-time injuries, We no longer report disabling injuries.‡ Lost-time injury frequency rate per 200 000 man-hours.

35METaIR 2014 INTEGRATED ANNUAL REPORT
aWaRDS
Company awarded in 2014
First National Batteries General Motors South Africa – Supplier Quality Excellence Award 2014ATE NAPA Supplier of the Year Finalist – 2014 Emerald AwardHesto Toyota Motor Corporation – Global Contribution Awards (Regional Award Winner)
Toyota South Africa Motors – Superior Award for Stable Production
South African Automotive Benchmark Club – Manufacturing Excellence Award for 2014Mutlu Akü Toyota Motor Europe – Certificate of recognition in the area of supply
Automechanika Moscow – Best Stand
Ranked number 281 in Top 500 companies in Turkey by FortuneSmiths Manufacturing Toyota South Africa Motors – Supplier Award for achievement in Stable Production – 2013
Toyota South Africa Motors – Supplier Award for achievement in Cost Management – 2013Metair Investments Sunday Times Top 100 Companies awards – Ranked Third in 2014
IRAS Sustainability Data Transparency Index awards – Highest SDTI score in General Industry 2014
Sake USB Financial Reporting Awards – Second place in 2014

36 METaIR 2014 INTEGRATED ANNUAL REPORT
a Joffe (46)Non-executive directorB Comm (Hons)GDA CA (SA)
AND OFFICERS OF THE COMPANY
OME Pooe (56)Independent non-executive chairmanB ProcManagement Development Programme Certificate in Advanced Corporate and Securities Law
Mr Pooe is Royal Bafokeng Platinum Ltd’s (RBPlat) Corporate Affairs executive. Prior to joining RBPlat he was Public Affairs executive for Royal Bafokeng Holdings (Pty) Ltd (RBH). He began his career as a lawyer with Bell Dewar and Hall and was later appointed director responsible for advising clients on all aspects of employment law. He then worked at AngloGold Ltd as legal counsel advising on corporate commercial agreements before joining RBH. He was appointed to the Metair board in April 2007 as non-executive chairman. As a result of Royal Bafokeng Holdings scaling back their interest in Metair, the Metair board believe that Mr Pooe is now considered independent. He was appointed as an independent non-executive chairman of the board with effect from 10 December 2014. He is current president of the National Association of Automotive Components and Allied Manufacturers.
Company secretary SM Vermaak
Transfer secretary Computershare Investor Services (Pty) Ltd 70 Marshall Street, Johannesburg 2001
Registered office 10 Anerly Road, Parktown, Johannesburg 2193
Registration number 1948/031013/06
S Douwenga (35)Finance directorB Comm (Hons) CA (SA)
CT Loock (50)Managing directorB Eng (Industrial)
L Soanes (78)*Independent non-executive directorNational Certificate of Engineering
Mr Douwenga qualified as a Chartered Accountant after completing his articles with PwC and then spent approximately eight years in PwC’s deals division where he gained extensive experience in acquisitions across various sectors within South Africa, Africa and recently in Romania and Turkey for Metair. Mr Douwenga first started working with Metair in 2011 when Metair acquired Rombat, and was appointment as business development director at First National Battery during 2013. In 2014 he was appointed group financial director. He was Metair’s project leader on the execution of the Mutlu acquisition and has been appointed as a board member in each entity of the Mutlu Group.
Mr Loock is a professional industrial engineer with supplementary business and economic studies. He obtained his engineering degree from the University of Pretoria in 1986. His 25 years of manufacturing experience started at Dorbyl Automotive Technologies combined with mining experience at Sasol Coal. The listing of two family businesses on the local securities exchange gave him insight into managing and growing publicly owned businesses. He served as operational director of various local listed companies. Before his appointment to the Metair board as managing director in March 2006, he was group divisional director at Aveng Ltd-owned Trident Steel.
Mr Joffe is a chartered accountant. He has been with CoroCapital Ltd since 1999. Mr Joffe was appointed as non-executive director of Metair in December 2006. He is a member of the Metair board remuneration committee.
Mr Soanes was managing director of Armstrong Hydraulics (Pty) Ltd from February 1979 to February 1999. He retired from Armstrong in March 1999 and was appointed as non-executive director of Metair in May 1999. In terms of the Listings Requirements of the JSE Limited (section 3.84(f)), he is classified as an independent non-executive director of Metair. He is a member of the Metair board remuneration committee as well as the Metair board audit and risk committee.
37METAIR 2014 INTEGRATED ANNUAL REPORT
SM Vermaak (49)Company secretary B Comm (Fin M) AIRMSA
* British
JG Best (66)Independent non-executive directorAICMA ACIS MBA
SG Pretorius (67)Independent non-executive directorM Comm (Business Economics)
Mr Best has spent most of his career in the mining industry in various senior financial and managing roles. When he retired in July 2005 he was an executive director and chief financial officer of AngloGold Ashanti. He currently serves on various boards as a non-executive director, these being AngloGold Ashanti Holdings plc where he is a member of the audit committee, Polymetal International plc (a company listed on the London Stock Exchange) where he is chairman of the audit committee and a member of the remuneration committee. He is chairman of Bauba Platinum Ltd (JSE-listed) and is a member of its remuneration committee. Mr Best’s qualifications include: associate of the Chartered Institute of Management Accountants, associate of the Institute of Chartered Secretaries and Administrators, and an MBA from the University of Witwatersrand. Mr Best was appointed to the Metair board as an independent non-executive director in February 2009. He is also the chairman of the Metair board audit and risk committee.
Mr Pretorius holds an M Com Business Economics from the University of the Free State and served as managing director of Toyota SA Marketing and then as chief executive officer of McCarthy Ltd. He retired as an executive director of McCarthy and its controlling shareholder, Bidvest, on 1 March 2011. He has received numerous national marketing and leadership awards including Marketing Person of the Year and Boss of the Year. He holds honorary professorships at the University of Johannesburg, University of Pretoria, University of the Free State and an honorary doctorate in marketing from the Durban University of Technology. Brand is a Fellow in Leadership at the Gordon Institute of Business Science and serves on the board of the READ Educational Trust, Africum Limited and Afrinet Limited. He is also the vice-chairman of Business Against Crime South Africa. Mr Pretorius serves as non-executive director on the boards of Tongaat Hulett, Reunert, Tata Africa Holdings, and Italtile Ltd. In January 2014, Mr Pretorius was appointed as an independent non-executive director to the Metair board.
DR Wilson (44)Independent non-executive directorCA (SA)
Mr Wilson is a Chartered Accountant and has extensive investment banking and corporate finance experience, having previously worked at Deutsche Bank as a director and head of M&A for sub-Saharan Africa. He was appointed to the Metair board on 1 January 2014 as a non-executive director and previously represented Royal Bafokeng Holdings (Pty) Ltd. As a result of Royal Bafokeng Holdings scaling back their interest in Metair, the Metair board believe that Mr Wilson is now considered independent. He was appointed as an independent non-executive director of the board with effect from 10 December 2014. He was appointed as a member of the Metair board audit and risk committee in December 2014.
RS Broadley (82)Independent non-executive directorAdvanced Technical Certificate (Engineering)
After completing 21 years of service with Ford Motor Company, Mr Broadley joined Toyota South Africa in 1972 as director in charge of assembly and manufacturing. He retired as managing director of the manufacturing arm of Toyota South Africa in 1997 having served in that capacity since 1988. After retirement he continued as a consultant to the company until 2002. He served on the main board of Toyota South Africa from 1984 to 2002. He was appointed to the Metair board as a non-executive director in April 2001 and is now classified as an independent non-executive director. He is chairman of the Metair board remuneration committee. He was appointed as acting chairman of the social and ethics committee in November 2014.
Mrs Vermaak joined the company in August 1998 and was appointed as company secretary in March 2001 and group finance manager in July 2003. She completed her B Comm Financial Management degree (cum laude) in 2005 on a part time basis and has more than 14 years’ experience in the listed company environment.

38 METaIR 2014 INTEGRATED ANNUAL REPORT
GROUP OPERaTING PERFORMaNCEGroup revenue increased 39% to R7 279 million (2013: R5 227 million) mainly due to the inclusion of Mutlu for the full reporting period. Operating profit margin increased to 11.4% (2013: 8.5%) as the increased proportion of higher-margin aftermarket revenue offset the numerous challenges in the operating environment. These challenges include increased competition in the South African battery market due to low cost foreign imports in the aftermarket segment, pressure on manufacturing margins in the OE segment due to labour disruptions and consequent manufacturing instability, as well as the impact of ongoing geo-political instability in Russia, Ukraine and the Middle East.
Group operating profit of R829 million represents an 86% increase on 2013 (R446 million), largely attributable to Mutlu Akü’s (standalone) contribution to operating profit which amounted to R300 million (2013: R58 million). This was supported by an improved aftermarket performance in South Africa which offset the effect of the four week industry strike, the impact of tighter margins in the OE segments as well as additional depreciation associated with the Mutlu Akü transaction. The 2013 figures also included transaction costs of R78 million for the Mutlu Akü acquisition which were not repeated this year.
The effective taxation rate for the year was 21% (2013: 24%), based on a taxation charge of R171 million. This comprised R173 million of current taxation less R2 million of deferred taxation. The group’s taxation rate is reduced by the lower rates of taxation in Romania (16%) and Turkey (20%) and was also positively impacted by the raising of previously unrecognised deferred tax assets as part of the group restructure.
The group was restructured in order to refinance the bridging facility put in place for the acquisition of Mutlu Akü. The restructuring introduced two new funding entities between Metair Investments Ltd and the subsidiary companies. This enabled the issue of R1 400 million preference shares at 69% of prime and introduced a five-year R750 million revolving credit facility which will be available for working capital and capital expenditure requirements.
As a result of the increased gearing in the company net financing expenses increased to R96 million (2013: R12 million).
Headline earnings increased 81% to R593 million. Headline earnings adjusts for profits (or losses) on the disposal of property, plant and equipment, including insurance recoveries. This translated to an increase in headline earnings per share of 38% to 303 cents per share (2013: 219 cents) despite the dilutionary effect of the additional 46.4m shares issued to acquire Mutlu Akü and the interest charge arising from the acquisition debt of R1.4 billion.
MUTLU aKÜThe financial performance of Mutlu Akü improved due to an intense focus on improving manufacturing efficiencies, financial discipline and operating expense controls. High inflation in the region, a slowdown in the Turkish economy as well as a relatively warm 2014 resulted in reduced aftermarket demand in Turkey and neighbouring countries. In addition, exports to Russia decreased due to the weak Rouble and geopolitical instability. This was closely monitored and contained where possible.
OE volumes in Turkey were negatively affected by model changes at Ford in the first half of the year. But despite these factors, Mutlu Akü still delivered a very pleasing operating performance.
GROUP FINaNCIaL POSITIONGroup net asset value per share increased from 1 895 cents per share to 2 102 cents per share. Working capital investment increased by R249 million on 2013 due to lower than planned aftermarket sales volumes in December 2014.This was mainly a result of a warm northern hemisphere December combined with the impact of the devaluation in the Russian Rouble which caused delays in the placing of orders.
Cash generated from operations increased by 44% to R847 million (2013: R588 million) reflecting the increased profitability which was offset by the additional investment in working capital. This resulted in cash and cash equivalents increasing to R472 million from R408 million in 2013. Net debt (borrowings less cash and cash
2014Rmillion
2013Rmillion % Change
Revenue 7 279 5 227 39%Gross profit 1 583 1 049 51%EBITDA 1 158 651 78%Profit before taxation 803 495 62%Profit attributable to ordinary shareholders 601 341 76%Total equity 4 239 3 789 12%Interest-bearing debt excluding cash and overdrafts 1 740 1 203 45%Property, plant and equipment 2 855 2 845 0%Current assets 3 541 3 150 12%Total assets 7 935 7 473 6%Net asset value per share (cents)* 2 102 1 895 11%Basic earnings per share (cents) 308 229 35%Headline earnings per share (cents) 303 219 38%
*Calculated on ordinary shareholders’ equity and number of shares in issue, excluding treasury shares.
FINaNCIaL REVIEW

39METaIR 2014 INTEGRATED ANNUAL REPORT
equivalents) increased to R1.3 billion at year-end. The R472 million increase from 2013 was largely due to additional funding used to buy out minorities of Mutlu Akü during the mandatory tender offer process.
Our capital structure remains conservatively leveraged and reflects a debt/equity ratio of 30%. The group is in compliance with all of its lenders’ covenants and, as at 31 December 2014, had unutilised facilities of approximately R3.5 billion.
Note 16 in the financial statements provides detailed information on the group’s borrowing facilities. The group has sufficient short term borrowing facilities, including overdraft facilities, which are annually renewable.
CaPITaL EXPENDITURE aND CaPITaL COMMITMENTSCapital expenditure totalled R250 million in 2014 (2013: R135 million). R117 million of this amount was spent on expansion capital and R133 million on maintenance. Our policy is to invest for future growth while ensuring optimal utilisation of the group’s resources.
Capital expenditure for 2015 will focus on:l OE business to equip operations for model changes coming into
effect in future years;l capital expenditure to meet our commitment to improve our
competitiveness; andl localisation initiatives.The allocation of capital for 2015 is detailed in the table that follows.
(R’000) Maintenance
Expansion/competitive
and efficiency improvement Total
OE 40.3 135.7 176.0Aftermarket 169.4 111.4 280.8Property 2.3 2.6 4.9Total 212.0 249.7 461.7
We continue to focus on cost-saving initiatives, cash management and working capital management. Identifying cost-saving measures is a key performance measurement for all group companies.

40 METaIR 2014 INTEGRATED ANNUAL REPORT
n 2010 n 2011 n 2012 n 2013 n 2014
* Includes Hesto
Important note: The turnover and profit figures quoted in this section include Hesto, consistent with the presentation in the segmental review on page 111. The reconciling items, which relate to Metair head office and property rental, have not been eliminated in the turnover and profit graphs.
The original equipment (OE) and aftermarket segments contributed 46% and 45% respectively to group turnover in 2014, while the non-auto segment contributed 9%. The increase in contribution from the aftermarket segment was supported by the inclusion of Mutlu Akü for a full year (2013: three weeks).
Turnover from the OE segment grew 15% to R3 746 million and combined turnover from the aftermarket and non-auto segments grew 59% to R4 353 million.
At an operating profit level, the OE segment contributed R240 million and the combined aftermarket, non-auto and property businesses contributed R706 million, an increase of 79% on 2013.
Margins improved in the aftermarket and non-auto segments, but declined in the OE segment due to the continued disruptions caused by strikes that affected production efficiency ratios.
ORIGINaL EQUIPMENTSouth African vehicle production increased 4% to 533 000 in 2014 (2013: 514 000). Exports increased 0.1% to 274 000 and total vehicle sales declined 0.9% to 615 000. NAAMSA’s forecast for South African production in 2015 is 593 000 vehicles, an increase of 11% on 2014 production.
Vehicle production in Romania decreased to 391 000 vehicles (2013: 411 000) and Turkey produced 1.22 million vehicles (2013: 1.17 million).
Turnover in the OE business (including exports) increased 15% to R3 746 million (2013:R3 249 million). Margins declined to 6.4% in 2014 (2013: 6.7%) due to the continued disruptive production environment, volumes which were negatively affected by a number of model changes as well as by the imposition of higher import duties in Nigeria and Algeria which reduced exports into Africa. The labour disruptions at certain component manufacturers which affected OEMs in July 2014 were limited to two weeks by effective contingency planning.
Mutlu Akü was included for a full year in the results for the first time (2013: three weeks) which supported the significant increase in turnover and operating profit for the segment.
aFTERMaRKETThe aftermarket segment (including exports) increased turnover 66% to R3 682 million (2013: R2 212 million). Operating profit increased 96% to R560 million. These significant increases were due to both a solid underlying performance and the inclusion of Mutlu Akü for a full year.
Margins increased to 15.2% as a result of the strong Mutlu Akü performance as well as improved input cost procurement and volume growth in our non-Turkish operations. Warranty claims declined in 2014 as the steps taken last year to address warranty issues worked effectively.
NON-aUTOMOTIVE Revenue (including exports) increased 26% to R671 million (2013: R531 million). Profit increased to R52 million (2013: R20 million) mainly due to Mutlu Akü’s inclusion. Despite the resolution of the strikes in the mining sector, activity in the mining industry remains extremely subdued.
TURNOVER (R MILLION)
OE* Combined non-OE aftermarket Non-auto
4 5004 0003 5003 0002 5002 0001 5001 000
5000
671531498478389
3 682
2 212
1 634
1 0321 007
4 353
2 7432 132
1 5101 395
3 7463 2493 230
2 784
2 358

41METaIR 2014 INTEGRATED ANNUAL REPORT
EXPORTSExports increased 64% to R1 514 million (2013: R922 million), supported by the inclusion of Mutlu Akü for a full year for the first time. Metair exports aftermarket, OE and non-auto products to Europe from South Africa, Romania and Turkey.
Profit from exports improved 161% to R154 million (2013: R59 million), while profit margin improved to 10.1% due to the increased business conducted in Russia through Mutlu Akü.
PROPERTYThe group has built a significant property portfolio in South Africa, Turkey and Romania through its ownership of its strategic manufacturing properties. Internal property rental is market-related based on properties used. Gross rental allocation increased to R95 million in 2014 (2013: R91 million) and net rentals increased 4% to R93 million (2013: R90 million) due to inflationary increases.
n 2010 n 2011 n 2012 n 2013 n 2014* Includes Hesto
PROFIT bEFORE INTEREST aND TaXaTION (R MILLION)
OE* Combined non-OE aftermarket Non-auto Property
800
700
600
500
400
300
200
100
0
609390
66585220626228
560
285243
215169
706
395371337254240218
319269
151
8+46+45+1PROFIT bEFORE INTEREST aND TaXaTION MaRGIN (%)
25%
20%
15%
10%
5%
0%2010 2011 2012 2013 2014
n OE* n aftermarket n Non-auto
* includes Hesto
9+53+36+2REVENUE CONTRIbUTION (%)
20142013
45 %
46%
8%
36%
9%2%
n OE* n aftermarket n Non-auto n Property* Includes Hesto
53%
ORIGINaL EQUIPMENT* (R MILLION)
4 000
3 500
3 000
2 500
2 000
1 500
1 000
500
0
14%
12%
10%
8%
6%
4%
2%
0%
-2%
-4%
9.7%
n Turnover – PbIT margin* includes Hesto
2010 2011 2012 2013 2014n Turnover – PbIT margin
aFTERMaRKET (R MILLION)
4 000
3 500
3 000
2 500
2 000
1 500
1 000
500
02010 2011 2012 2013 2014
9.9%
6.7% 6.4%2 358
2 784
3 230 3 249
3 746
6.4%
1 007 1 032
1 634
2 212
3 68225%
20%
15%
10%
5%
0%
16.8%20.8%
14.9% 15.2%12.9%
1%

42 METaIR 2014 INTEGRATED ANNUAL REPORT
14%12%10%
8%6%4%2%0%
-2%-4%
NON-aUTOMOTIVE (R MILLION)
800
700
600
500
400
300
200
100
14%12%10%8%6%4%2%0%
-2%-4%
7.2%
12.9% 12.4%
7.8%
3.7%369
478 498531
671
n Turnover – PbIT margin n Turnover – PbIT margin
2010 2011 2012 2013 2014
231 262
602
922
1 514
EXPORTS (R MILLION)
1 6001 4001 2001 000
800600400200
0
0.7%
5.9% 6.4%10.1%8.9%
2010 2011 2012 2013 2014
n Total production – Total production growthSource: Naamsa
SOUTH aFRICaN VEHICLE PRODUCTION (’000) aND GROWTH
2007 2008 2009 2010 2011 2012 2015F 2016F20142013
700
600
500
400
300
200
100
0
30%
20%
10%
0%
-10%
-20%
-30%
-40%
497527
354449
505517
514533
593 645
-10%
6%
27%
-33%
2% -1% 4%11% 9%
12%
n PbIT
EXPORT REVENUE bY SEGMENT (%)
7+88+55%
88%
7%
n OE n aftermarket n Non-auto
20142013
11+84+5 58 6066
90 93
PROPERTY – NET RENTaL (R MILLION)
1009080706050403020100
2010 2011 2012 2013 2014
5%
84%
11%
(CONTINUED)

43METaIR 2014 INTEGRATED ANNUAL REPORT
We strive to be exemplary custodians of the capitals available to us and are committed to conducting business in a sustainable way.
Our approach to sustainability is defined in our core value of custodianship: we are custodians of the capitals available to us – natural, human, financial, intellectual, social and relationship, and manufactured. As custodians, we manage these capitals in a responsible way for the benefit of our stakeholders. In considering our impacts on the environment and the communities around us, we apply the precautionary principle in line with our commitment to good custodianship.
A narrow focus on only certain of the capitals while neglecting the others will result in business failure. For example, focusing only on generating financial returns without considering our environmental impact would damage our social and relationship capital with customers, communities and government. This would lead to declining financial returns, the withdrawal of operating licences and ultimately our social licence to operate. On the other hand, a focus on maximising value creation for management and employees – our human capital – risks misallocation of capital and unsatisfactory financial returns which would alienate shareholders and providers of finance, and compromise the financial sustainability of the group.
HOW WE MaNaGE SUSTaINabILITYSustainability is the ultimate responsibility of the board, which has delegated this function to the social and ethics committee. The CEO is a member of the social and ethics committee. The group’s social and ethics framework defines and guides our approach to integrating sustainability into our strategy and operations.
Sustainability is managed at our operations through the relevant operational functions, such as human resources and safety, health and environment (SHE) in terms of group policies and principles.
Our sustainability initiatives draw on the guidance of relevant legislation and frameworks including:l King III;l the JSE Listings Requirements;l the UN Global Compact;l the Global Reporting Initiative’s G4 guidelines (GRI G4); and
TO SUSTAINABILITY
l the International Integrated Reporting Council’s (IIRC) Integrated Reporting <IR> Framework.
We continue to refine the collection of our non-financial data and engaged external consultants to set up data reporting templates to facilitate regular reporting by subsidiaries in a consistent and comparable way. The business intelligence and performance management system currently being implemented in the group will be expanded to include non-financial information in the next phase of the project.
The external assurance process conducted on the non-financial sustainability information contained in this report included site visits to various operations and an assessment of data collection techniques and controls.

44 METaIR 2014 INTEGRATED ANNUAL REPORT
RELATIONSHIPS
Stakeholder How we engage Stakeholder concerns How we address these
All shareholders • Annual general meeting
• Results presentations
• One-on-one meetings
• Investor perception surveys
• Site visits
• Website
Acceptable return on equity
Sustainability of the business
Implementation of strategy
Balancing business by customer, product and geography
Analysts • Results presentations
• One-on-one meetings
• Site visits
• Website
Acceptable return on capital
Sustainability of the business
Access to management
Implementation of strategy
Balancing business by customer, product and geography
Management aims to be appropriately accessible within operational constraints
Customers (existing and potential)
• Contract negotiations
• Ongoing interactions in the ordinary course of business
• Quality reviews
Product quality
Delivery standards
Cost competitiveness
Sustainability of our business
B-BBEE and transformation
Focus on manufacturing excellence
Focus on costs
Implementation of strategy
ISO 9001 and ISO/TS 16949 accreditation
External verification of B-BBEE statusSuppliers and trading partners
• Contract negotiations
• Ongoing interactions in the ordinary course of business
• Supplier audits
• Service level agreement negotiations
Fair payment terms
Fair treatment
Metair’s payment terms align with industry norms
We take an ethical approach to doing business
Business partners (joint ventures and associates)
• Ongoing interactions in the ordinary course of business
Financial performance
Fair treatment
Implementation of strategy
We take an ethical approach to doing business
We recognise the legitimate interests and concerns of our key stakeholders.
In line with our custodianship philosophy, we engage with our key stakeholders to understand their legitimate interests and
concerns and seek to address these where relevant. The interests and concerns of a particular group of stakeholders are balanced against those of other stakeholders and against the long-term interests of the company.
We define our stakeholders as those who are impacted by our business, or who impact our business, and who play a role in our ability to deliver on our strategic objectives.
The board has delegated responsibility for managing stakeholder relationships to the management team. Key stakeholders are identified in the course of the engagements that take place regularly in the running of the business.
Our engagements are guided by the group stakeholder engagement policy and the code of conduct guides management and employees in their dealings with stakeholders to ensure their equitable treatment.
The process of integrating Mutlu Akü into the Metair group involved extensive engagements with a range of stakeholders during the year, including suppliers, employees, distributors, customers, community representatives and government officials. No specific engagements were conducted specifically as part of the preparation of this report.
The table that follows lists Metair’s key stakeholder groupings.

45METaIR 2014 INTEGRATED ANNUAL REPORT
Stakeholder How we engage Stakeholder concerns How we address theseGovernment • Engagements on specific policy
issues
• Representation on industry bodies
Transformation
Health and safety
Environmental responsibility
Implementation of strategy
We take an ethical approach to doing business
Employees and trade unions
• Operational performance reviews
• Feedback sessions
• MD site visits
• Electronic communication
• Anonymous Tip-Offs hotline
• Company website
• Union interactions as required
Remuneration
Training
Health and safety
Transformation
We take an ethical approach to doing business, including fair treatment and remuneration of our workers
Substantial investment in skills development
Metair aims to maintain good relationships with unions as representatives of our employees
Remuneration benchmarkingRegulatory bodies • Regular submissions
• Interactions as required
Regulatory compliance Metair has policies and procedures to ensure compliance with all relevant regulations
Industry bodies (NAACAM, NAAMSA)
• Representation in industry bodies
• Member of the South African Battery Manufacturers Association
• Member of NAACAM
Good corporate conduct
Support in engaging government and regulators
We take an ethical approach to doing business and engage with regulators and government to further the interests of the company and broader industry
Media • Interactions as requested
• Press releases
• Website
Access to management Management aims to be appropriately accessible within operational constraints
Consultants and service providers
• Ongoing engagements in the normal course of business
Fair payment termsFair treatment
Metair’s payment terms align with industry norms
We take an ethical approach to doing business
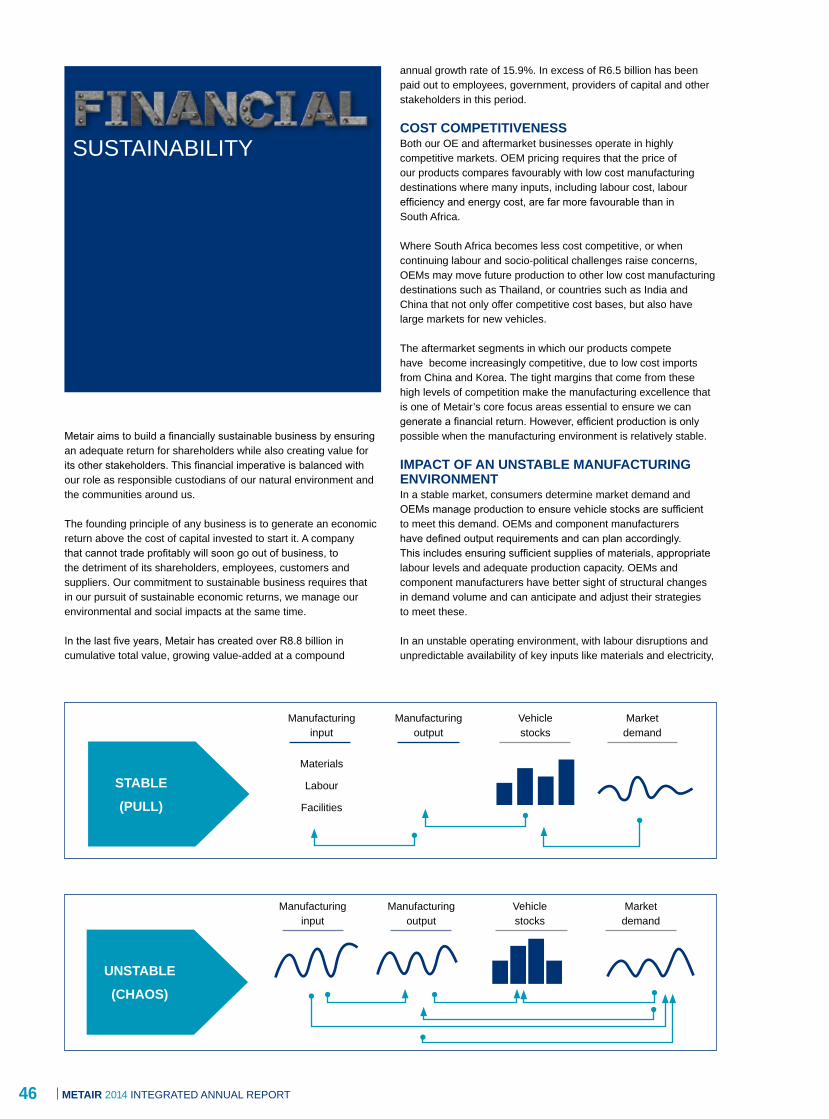
46 METaIR 2014 INTEGRATED ANNUAL REPORT
SUSTAINABILITY
Metair aims to build a financially sustainable business by ensuring an adequate return for shareholders while also creating value for its other stakeholders. This financial imperative is balanced with our role as responsible custodians of our natural environment and the communities around us.
The founding principle of any business is to generate an economic return above the cost of capital invested to start it. A company that cannot trade profitably will soon go out of business, to the detriment of its shareholders, employees, customers and suppliers. Our commitment to sustainable business requires that in our pursuit of sustainable economic returns, we manage our environmental and social impacts at the same time.
In the last five years, Metair has created over R8.8 billion in cumulative total value, growing value-added at a compound
annual growth rate of 15.9%. In excess of R6.5 billion has been paid out to employees, government, providers of capital and other stakeholders in this period.
COST COMPETITIVENESSBoth our OE and aftermarket businesses operate in highly competitive markets. OEM pricing requires that the price of our products compares favourably with low cost manufacturing destinations where many inputs, including labour cost, labour efficiency and energy cost, are far more favourable than in South Africa.
Where South Africa becomes less cost competitive, or when continuing labour and socio-political challenges raise concerns, OEMs may move future production to other low cost manufacturing destinations such as Thailand, or countries such as India and China that not only offer competitive cost bases, but also have large markets for new vehicles.
The aftermarket segments in which our products compete have become increasingly competitive, due to low cost imports from China and Korea. The tight margins that come from these high levels of competition make the manufacturing excellence that is one of Metair’s core focus areas essential to ensure we can generate a financial return. However, efficient production is only possible when the manufacturing environment is relatively stable.
IMPaCT OF aN UNSTabLE MaNUFaCTURING ENVIRONMENTIn a stable market, consumers determine market demand and OEMs manage production to ensure vehicle stocks are sufficient to meet this demand. OEMs and component manufacturers have defined output requirements and can plan accordingly. This includes ensuring sufficient supplies of materials, appropriate labour levels and adequate production capacity. OEMs and component manufacturers have better sight of structural changes in demand volume and can anticipate and adjust their strategies to meet these.
In an unstable operating environment, with labour disruptions and unpredictable availability of key inputs like materials and electricity,
Marketdemand
Materials
Labour
Facilities
Vehiclestocks
Manufacturinginput
Manufacturingoutput
Manufacturinginput
Manufacturingoutput
Marketdemand
Vehiclestocks
UNSTabLE
(CHaOS)
STabLE
(PULL)

47METaIR 2014 INTEGRATED ANNUAL REPORT
manufacturing output becomes unpredictable and vehicle stocks cannot be matched to market demand. It becomes extremely difficult for manufacturers to plan, which has a serious impact on industry margins, affecting the financial performance of the industry and ultimately its long-term sustainability.
The APDP brings stability to OEMs until 2020, which offsets to some degree the negatives of the ongoing instability in the manufacturing sector. However, we believe that this instability will limit the sustainable volumes the South African automotive industry will be able to produce to well below the target underlying the APDP.
CURRENCY VOLaTILITYA volatile currency also makes planning challenging. A strong Rand increases the relative cost of production in South Africa compared to production in a country with a weaker currency. While a weaker Rand makes South African products more competitive in a global sourcing environment, it also makes Dollar denominated inputs more expensive and pressures margins.
CONTINUITY OF SUPPLY aND PRODUCTIONCost competitive production requires a reliable supply of high-quality raw materials. With OEM costings so tight, even when we meet all the technical requirements, we may be unable to submit cost-competitive quotes if we are unable to secure adequate supplies of quality material at a realistic price. This is particularly true of the lead required in battery manufacture, where in certain instances we have been competitive on a regional basis, but not on a global basis.
We increased electricity standby capacity at our production facilities so that continuous manufacturing processes would not be affected by power supply interruptions. We are concerned that upstream suppliers may not have similar contingency plans in place, which could interrupt raw material supplies.
Production can potentially be interrupted by natural disasters, explosions, fires or IT and other electronic system failures. In the highly competitive markets in which we operate, market share can be quickly lost when production is interrupted. Our operations have
controls in place as well as recovery plans to minimise the impact of such disasters should they occur. Despite these controls, there were two fires at group operations during the year – one at FNB and one at Supreme Spring. Both fires were rapidly contained and production was restored quickly. Batteries were imported from our international operations to make up FNB’s production shortfall.
The group’s supply chain includes suppliers of raw materials such as steel and lead, and suppliers of tooling and parts. While many of our suppliers are located in the countries in which we have manufacturing facilities, some are located in other countries, including China, Japan, the US and Europe.
FaIR COMPETITIONMetair’s RARE Marketing Excellence programme is designed to raise the profile of the group’s brands in the aftermarket and to combat pressure from new market entrants in the aftermarket. In addition, the dumping of Korean government-subsidised batteries into South Africa is the subject of an investigation by the International Trade Administration Commission of South Africa (ITAC). An application for an import duty of 30% is currently awaiting final approval by ITAC
PRODUCT QUaLITYIt is essential that we continue to produce products of an extremely high quality. This is directly linked to our commitment to manufacturing excellence across all facilities. All of our operations are externally certified in the quality management systems relevant to their business, including ISO 9001 and ISO/TS 16949. Warranty claims showed an ongoing decline in 2014.
CaRbON TaXSouth Africa’s proposed carbon tax has been initially set at R120/tCO2, although the final impact could be higher if Eskom passes through their portion of the tax to consumers. We are in favour of any initiative that encourages responsible use of natural resources and reduces carbon emissions. However, we believe that any such initiative needs to be implemented responsibly to avoid further eroding South Africa’s manufacturing cost competitiveness.

48 METaIR 2014 INTEGRATED ANNUAL REPORT
The value-added statement calculates the value created by the company and its employees. This value is then distributed to stakeholders or reinvested in the business as shown in the ‘Wealth Distribution’ section of the statement.
54% of the wealth created was distributed to employees in the form of remuneration and benefits and 7% to government in the form of taxes and 10% to providers of capital. R754 million (29%) was retained in the group and of this, 19% was set aside for future expansion. 10+54+29+7
DISTRIbUTION OF VaLUE-aDDED (%)
n Providers of capital n Employees n Reinvested n Taxation
10%
54%
29%
7%
VaLUE-aDDED STATEMENT
GROUP
2014R’000
2013R’000
2012Restated
R’000WEaLTH CREaTEDRevenue 7 278 815 5 227 426 4 603 150 Less: Net cost of products and services (4 820 683) (3 648 523) (3 031 482)Value added 2 458 132 1 578 903 1 571 668 Add: Income from investments 92 704 77 345 98 127 Wealth created 2 550 836 1 656 248 1 669 795 WEaLTH DISTRIbUTION 2014
%2013
%EmployeesSalaries, wages and other benefits (note 1) 54 60 1 369 926 990 028 889 261 Providers of capital 10 10 255 757 166 937 128 341 Interest on borrowings 5 2 118 935 27 888 26 457 Dividends to shareholders 5 7 136 822 139 049 101 884 Government taxation (note 3) 7 7 170 845 121 172 166 903 Retained in the group 29 23 754 308 378 111 485 291 To provide for the maintenance of capital 10 9 258 825 143 261 112 599 To provide for expansion 19 14 495 483 234 850 372 692
100 100 2 550 836 1 656 248 1 669 795 1) Salaries, wages and other benefits 1 369 926 990 028 889 261 Wages and salaries 1 164 284 860 124 771 924 Share based payment expenses 15 348 9 747 8 574 Termination benefits 10 162 Social security costs 113 088 60 058 52 839 Pension costs – defined contribution plans 58 451 57 417 53 227 Defined benefit plans 5 633 Post-employment medical benefits 2 960 2 682 2 697 2) Value added ratiosTotal number of employees at year end 5 651 5 870 4 835 Hourly 3 385 3 837 3 018 Monthly 2 266 2 033 1 817 Revenue per employee 1 288 891 952 Value added per employee 435 269 325 Wealth created per employee 451 282 345 3) Monetary exchanges with governmentsSA normal Tax / Income tax 170 845 121 172 166 903 South Africa 100 572 96 518 Romania 6 993 10 510 Turkey 63 280 14 144

49METaIR 2014 INTEGRATED ANNUAL REPORT
Metair is committed to the principles of transformation and broad-based black economic empowerment (B-BBEE).
The stability of the future business landscape in South Africa depends on increased financial inclusion of previously disadvantaged race groups and a more demographically representative business environment. Failure to embrace transformation at a company level risks being sidelined by customers, suppliers, government and communities.
Transformation is also a key consideration with South African OEM customers, who require a minimum Level 4 status when evaluating sourcing decisions.
The group’s transformation is monitored and managed by the employment equity and transformation committees, which report to the board. During 2014, the transformation policy and the group equal opportunity policy were approved by the board.
We measure our progress using the Department of Trade and Industry Codes of Good Practice (dti CoGP). Executive variable remuneration is linked to achieving the group’s B-BBEE targets.
Each major South African subsidiary (excluding associates) undergoes an annual B-BBEE certification process and the points are totalled for each company to give an aggregate score for the group. The group targeted all companies to reach Level 4 status by 2014 and achieved this in 2013, a year ahead of plan.
At the end of December 2014, eight of the nine operating companies achieved Level 3 contributor status, with the remaining company achieving Level 4 status. The group’s combined B-BBEE scorecard is reproduced in Appendix II on page 80.
The group’s cumulative B-BBEE score improved 34 points to 693.92 (2013: 659.99) due to improvements in the enterprise development and preferential procurement categories.
We expect our contributor status to drop when the revised B-BBEE Codes are gazetted in the first half of 2015. However, despite the threshold for Level 4 moving from 60 points under the old codes to 80 points, we believe all of our operations will achieve Level 4.
OWNERSHIPRoyal Bafokeng Holdings (RBH) disposed of some of their shareholdings to the PIC in October 2014 and held a direct stake of 2.99% in Metair as at the end of December 2014. The disposed shares are still recognised in the ownership calculation using the sale/loss of share principle. RBH maintained their 12.52% voting rights within the Royal Bafokeng Metair Trust (RBMT). Taking into account the issue of new Metair shares, a reduction in treasure stock and a slight change in the demographics in the empowerment shareholder, Metair achieved 20.97 points for the 2014 ownership assessment, which flows down to subsidiary levels.
The table below shows the results of an independent analysis of Metair’s ownership at 31 December 2014.
Economic interest
Votingrights
B-BBEE shareholders 33.41% 42.70%Female B-BBEE shareholders 15.25% 16.05%Designated group B-BBEE shareholders 9.66%
MaNaGEMENT CONTROLMetair operates in a highly technical industry which makes it challenging to transform the management control categories in the short term. Management candidates tend to have engineering or other technical qualifications or have developed their skills through long practical experience and training. These skills and experience are highly sought after in a global context, and even more so in South Africa when matched to an equity candidate, which makes long-term retention challenging. We believe that over time, our skills development and employment equity programmes will support transformation at the management level.
Historically disadvantaged South Africans (HDSAs) comprised 92% of the total permanent workforce (excluding Mutlu Akü and Rombat) at the end of 2014. HDSA in top management improved to 38% in 2014 (2013: 27%) and HDSA in senior management improved to 36% (2013: 33%). The group’s aggregate B-BBEE score for management control improved 3.39 points on last year (35.82).
EMPLOYMENT EQUITYAs with the management control category, identifying, attracting and retaining qualified candidates to support our employment equity targets is challenging. Subsidiaries have five-year employment equity plans and group employment equity and transformation committees monitor and measure performance
n HDSa in top management n HDSa in senior management– Total HDSa in workforce 2014
HDSa IN WORKFORCE (EXCL ROMbaT aND MUTLU aKÜ
100%90%80%70%60%50%40%30%20%10%0%
2010 2011 2012 2013 2014
27% 30% 29% 32% 33%
54%
27%33%
38% 36%
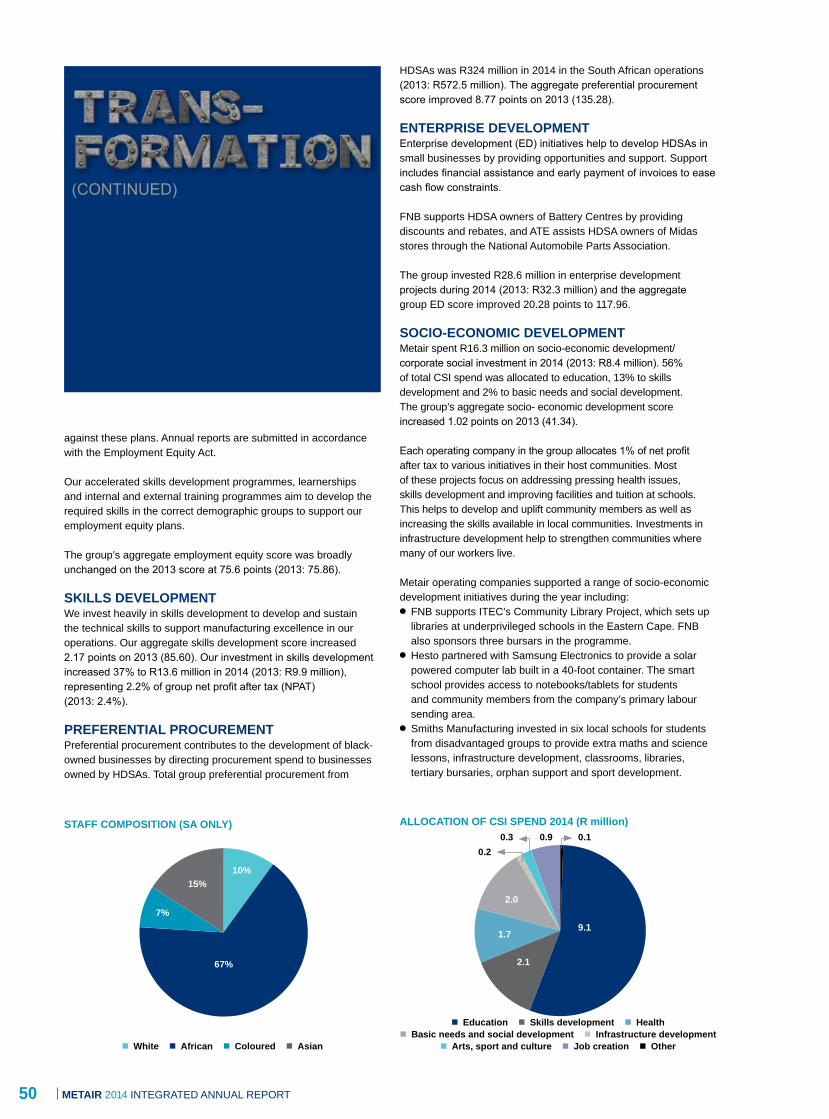
50 METAIR 2014 INTEGRATED ANNUAL REPORT
against these plans. Annual reports are submitted in accordance with the Employment Equity Act.
Our accelerated skills development programmes, learnerships and internal and external training programmes aim to develop the required skills in the correct demographic groups to support our employment equity plans.
The group’s aggregate employment equity score was broadly unchanged on the 2013 score at 75.6 points (2013: 75.86).
SKILLS DEVELOPMENTWe invest heavily in skills development to develop and sustain the technical skills to support manufacturing excellence in our operations. Our aggregate skills development score increased 2.17 points on 2013 (85.60). Our investment in skills development increased 37% to R13.6 million in 2014 (2013: R9.9 million), representing 2.2% of group net profit after tax (NPAT) (2013: 2.4%).
PREFERENTIAL PROCUREMENTPreferential procurement contributes to the development of black-owned businesses by directing procurement spend to businesses owned by HDSAs. Total group preferential procurement from
10+66+8+16n White n African n Coloured n Asian
n Education n Skills development n Health n Basic needs and social development n Infrastructure development
n Arts, sport and culture n Job creation n Other
STAFF COMPOSITION (SA ONLY) ALLOCATION OF CSI SPEND 2014 (R million)
HDSAs was R324 million in 2014 in the South African operations (2013: R572.5 million). The aggregate preferential procurement score improved 8.77 points on 2013 (135.28).
ENTERPRISE DEVELOPMENTEnterprise development (ED) initiatives help to develop HDSAs in small businesses by providing opportunities and support. Support includes financial assistance and early payment of invoices to ease cash flow constraints.
FNB supports HDSA owners of Battery Centres by providing discounts and rebates, and ATE assists HDSA owners of Midas stores through the National Automobile Parts Association.
The group invested R28.6 million in enterprise development projects during 2014 (2013: R32.3 million) and the aggregate group ED score improved 20.28 points to 117.96.
SOCIO-ECONOMIC DEVELOPMENTMetair spent R16.3 million on socio-economic development/corporate social investment in 2014 (2013: R8.4 million). 56% of total CSI spend was allocated to education, 13% to skills development and 2% to basic needs and social development. The group’s aggregate socio- economic development score increased 1.02 points on 2013 (41.34).
Each operating company in the group allocates 1% of net profit after tax to various initiatives in their host communities. Most of these projects focus on addressing pressing health issues, skills development and improving facilities and tuition at schools. This helps to develop and uplift community members as well as increasing the skills available in local communities. Investments in infrastructure development help to strengthen communities where many of our workers live.
Metair operating companies supported a range of socio-economic development initiatives during the year including:l FNB supports ITEC’s Community Library Project, which sets up
libraries at underprivileged schools in the Eastern Cape. FNB also sponsors three bursars in the programme.
l Hesto partnered with Samsung Electronics to provide a solar powered computer lab built in a 40-foot container. The smart school provides access to notebooks/tablets for students and community members from the company’s primary labour sending area.
l Smiths Manufacturing invested in six local schools for students from disadvantaged groups to provide extra maths and science lessons, infrastructure development, classrooms, libraries, tertiary bursaries, orphan support and sport development.
10%
9.1
67% 2.1
7%
1.7
15%2.0
0.20.3 0.10.9
(CONTINUED)

51METaIR 2014 INTEGRATED ANNUAL REPORT
l Supreme Spring supported a local feeding scheme, a hospital and an orphanage.
l Unitrade supported a project to establish libraries in four local schools, supplying more than 5 000 books, shelving and computers.
l Mutlu Akü supported the Cemil Türker Elementary School through the provision of shoes, scholarships to three top students, painting, maintenance and repair of school facilities and construction of a library.
l Mutlu Akü also constructed a prayer room for workers at their plant and donated batteries for 67 wheelchairs and 22 police cars.
l Mutlu Akü donated US$ 500 000 to Tuzla Municipality for social responsibility projects which has been allocated to construct a new school with other donors and stakeholders.
l Rombat provides free utilisation of spare land for agricultural farming by rehabilitated ex-convicts in Bistritsa.
l Rombat donates daily meals to the Bucurie Foundation, which provides psychological counselling, daytime accommodation and community reintegration for young people between 18 and 26 years with disabilities.
GROUP SOCIO-ECONOMIC DEVELOPMENTIn addition to the projects supported by the operating companies, 1% of group net profit after tax is allocated to community projects. These projects are carefully chosen to ensure that they meet a real need, reach a significant number of beneficiaries (preferably an entire community), operate in partnership with NGOs and government and demonstrate spend effectiveness. Our intention is that these projects should have a significant impact on as many people as possible on a daily basis and have a high chance of being sustainable through the involvement of a range of stakeholders.
Mutlu Akü opened Cemil Türker Elementary School in Akfırat in 1987 and continues to provide support to the school on an ongoing basis. The school has 12 classrooms and 430 students.
Rombat supports a programme that aims to reintegrate former convicts back into society by helping create new jobs for the community. In 2014, Rombat provided free use of three hectares of land to develop into a farming project.
KHaYa COMMUNITY CENTREMetair head office funded an extension to the Khaya Community Centre in Lehae, Johannesburg, that was officially opened at the end of November 2014. The Khaya Centre is the only community centre in the community and touches the lives of hundreds of people each day. The extension offers an improved early childhood learning facility for 100 pre-schoolers, educational facilities for school-going children, as well as a larger bakery and kitchen to better serve the 750 children fed from the centre each day. Other facilities include a sewing room, training rooms, a victim support centre and a primary health care facility.
Educational facilities in the centre include four fully equipped classrooms, a secure play area, two counselling rooms and a library. The new computer room supports the centre’s Young Life Campaign, which aims to teach vulnerable youth the skills required to be work-ready and improve employability.
The project is a partnership with Orange Babies and involves the local municipality to ensure the sustainability of the facility and the project.

52 METaIR 2014 INTEGRATED ANNUAL REPORT
Metair’s 6 607 motivated and skilled permanent employees represent a key asset to the business. We are committed to investing in our human capital to ensure that we develop and retain the skills we need to execute our strategy, and ensure that we provide a safe working environment.
Our ability to sustain manufacturing excellence and thereby produce high quality products as cost effectively as possible is crucially dependent on the skills, diligence and commitment of our employees. Failure to maintain good labour relations leads to an unstable manufacturing environment and undermines our cost competitiveness.
To ensure we can continue to implement our long-term strategy we need to ensure that we invest to develop the skills we need, make sure we retain our skilled employees and develop a pipeline of future employees with the right technical skills. We also have a duty to ensure that the workplace environment is safe and that we provide the facilities to support employees to manage their health and wellness.
Note that the headcount figures reported in this section include Hesto employees as Metair is responsible for the day to day management of this associate.
Since Hesto is not a subsidiary in terms of IFRS 10, employees are excluded from the headcount figures reported in the value added statement on page 45.
Total headcount increased 19% to 7 851, as the total now includes 771 employees and contractors at Mutlu Akü. In 2014 81% of our employees work in our South African operations, 10% in Turkey and 9% in Romania. Contractors comprised 7.5% of the total staff complement in 2014 compared to 2.3% in 2013.
FNB and Hesto together employ nearly half of the group workforce, with Mutlu Akü, Smiths Manufacturing and Rombat each employing around 10%. Historically Disadvantaged South Africans (HDSA) represent 92% of the South African workforce (2013: 90%) and women comprise 31% (2013: 35%).
LabOUR RELaTIONSAcross the group, 67% of employees belong to a union (2013: 79%). Union engagement takes place at national, provincial and company level through formalised recognition agreements.
Most South African operations fall under Chapter III of the motor industry bargaining council, while First National Battery is covered at plant level.
The OEM sector was impacted by strikes in the Steel/Metal and Engineering sector which affected the automotive industry for four weeks during 2014. Excellent contingency planning meant that most OEMs only halted production for two of those weeks. There were no strikes at any group company, although certain subsidiaries worked short-time to align with the production disruptions at our OEM customers.
Minimum notice periods regarding operational changes range from 48 hours to 12 weeks, with most subsidiaries having two- to four- week notice periods. Notice periods and provisions for consultation and negotiation are specified in collective agreements at eight of the 11 subsidiaries.
68 employees were retrenched in the first half of 2014 as the Section 189A labour restructuring exercise continued at Smiths Plastics. A further 23 employees at Smiths Plastics and 46 at Mutlu Akü took voluntary severance packages during the year.
Companies in the group do not currently provide transition assistance programmes to facilitate continued employability and assist the management of career endings. Employee assistance programmes at certain subsidiaries provide counselling to employees and appoint financial consultants to offer investment advice on withdrawal of retirement benefits.
STaFF COMPLEMENT (INCL HESTO)*
9 0008 0007 0006 0005 0004 0003 0002 0001 000
02010 2011 2012 2013 2014
n Turkey n South africa n Romania
10+81+910%
5 552 5 9516 478 6 612
7 851
81%
9%
STaFF bY REGION
* includes temporary workers and contractors

53METAIR 2014 INTEGRATED ANNUAL REPORT
ATTRACTION, RETENTION AND DEVELOPMENTMetair relies on world class technical and engineering skills to drive manufacturing excellence in the group and meet the quality and cost-efficiency demands of our customers. We aim to be the employer of choice in our industry and consequently make significant investments in our skills development and training initiatives.
Retaining our skilled employees is challenging as their skills are much in demand in the global jobs market. We aim to retain talented employees through competitive remuneration packages, quality training programmes and practical learning opportunities. Where employees show the necessary commitment and potential, they may benefit from career opportunities and broader experience across the group and in our international operations.
Permanent staff turnover averaged 19.3% in 2014 (2013: 6.4%) with the increase largely due to the retrenchments in Smiths Plastics. Absenteeism decreased to 3.0% (2013: 3.4%), remaining below our target rate of 4.0%.
During 2014 a job grading exercise was done for all positions in the company. This allowed objective external benchmarking of job grades and remuneration and enabled identification of over- and under-remunerated employees. Salaries were adjusted where necessary to bring them into line with the benchmarks. This year marked the ninth year that the percentage increase in salaried pay lagged the increase in hourly wages. More information on the job grading exercise is available in the remuneration report on page 70.
SKILLS DEVELOPMENTThe group invested R13.6 million in skills development initiatives during 2014. This represents 2.6% of net profit after tax, compared to 2.4% in 2013. Training spend per employee increased to R2 058 from R1 527 in 2013. In total there were 16 834 training interventions during the year, including both internal and external training interventions.
Metair offers a range of practical learning programmes that provide opportunities for promising candidates and help us to build a skills pipeline for future potential employment. These include a 40-week production learnership programme, a 24-month apprenticeship programme, a 24-month candidate technician internship, a 24-month candidate engineers programme and a 24-month graduate in-training programme. Hesto is running an accelerated artisan training programme in collaboration with the Department of Labour and the Manufacturing, Engineering and Related Services SETA (MERSETA), and Hesto’s training school achieved accreditation with MERSETA during the year.
Various operations also run adult basic education and training (ABET) courses.
There were 215 learnerships in the group in 2014, (2013: 198), exceeding our target of 198 for the year. The group also supported 100 promising bursary students studying in engineering, finance and technical fields (2013: 112).
HEALTH AND SAFETYHealth and safety is managed at operational level and our health and safety policies align our approach with the relevant legal frameworks, including the Occupational Health and Safety Act. Four of our thirteen operations are OHSAS 18001 accredited, the international health and safety standard. A fifth is awaiting audit and certification. We plan on all group companies being OHSAS 18001 accredited by 2016.
Each subsidiary has its own safety, health and environmental (SHE) policy which aligns with the group SHE policy, which is available on our website at www.metair.co.za/health_safety.asp.
We monitor health and safety incidents and near-misses, and we target zero fatalities, disabling injuries and lost-time incidents. Each company has a benchmark lost-time injury frequency rate (LTIFR) against which it is measured.
There were no fatalities in the group in 2014 and 145 lost-time injuries (2013: 66), which represents a lost-time injury frequency rate (LTIFR) of 1.84 per 200 000 person hours (2013: 1.12). Lost-time injuries are injuries where an employee is deemed unfit to return to work the next day.
HAZARDOUS SUBSTANCESWhere particular products involve working with potentially dangerous substances, standard health and safety procedures are applied around each such substance. We ensure that our procedures comply with both South African legislation and the standards governing our OE customers in other jurisdictions.
Lead is a banned substance under EU directive 2000/53/EC, which pushes producers to manufacture new vehicles without the hazardous substances it targets. Lead is used at our First National Battery, Mutlu Akü and Rombat battery manufacturing facilities. Baseline blood lead levels are tested when employees at these facilities join the company and regularly re-tested thereafter to measure ongoing exposure. Where blood lead levels rise above benchmark levels, employees receive counselling in the clinic, are restricted from working overtime and are removed from areas
n Automould n FNB n Hesto n Lumotech n Mutlu Akü n Smiths Manufacturing n Smiths Plastics n Supreme n Rombat n ATE
STAFF BY OPERATION ABSENTEEISM
4.5%
4.0%
3.5%
3.0%
2.5%
2.0%
1.5%
1.0%
0%2012 2013 2014
– Target
1.6%
3.4%3.0%
2%
3%
22%
25%
7%
10%
10%
5%
7%
9%

54 METaIR 2014 INTEGRATED ANNUAL REPORT
where there is a chance of further exposure until their blood lead levels return to within the acceptable limits.
HIV/aIDSOur major South African operations offer voluntary counselling and testing (VCT) for employees and contractors. Awareness-raising activities include competitions, promotions, banners, speeches on wellness days and World AIDS Awareness Day activities. Employees on the group’s medical aid programmes can access AIDS management programmes. HIV/Aids prevalence rates at our South African operations are
around 11%. In 2014 1 002 employees and contractors received counselling for HI/AIDS and 972 were tested (2013: 433).
HUMaN RIGHTSMetair is committed to the ten principles of the United Nations Global Compact, which include provisions relating to human rights, the rights of labour and a commitment to working against corruption. Incidents of discrimination within the company are taken extremely seriously and are subject to the normal disciplinary procedures, including dismissal.
We respect the rights of our employees and those of our suppliers to freedom of association. We support the elimination of child labour, forced and compulsory labour and select our suppliers carefully to ensure that they share these ideals. We apply the same principles to our international operations to ensure that the rights of employees are protected at all our operations.
SKILLS DEVELOPMENT (R MILLION)
16
14
12
10
8
6
4
2
02010 2011 2012 2013 2014
6.8
9.411.0
9.9
13.6
TRaINING SPEND PER PERMaNENT EMPLOYEE (R)
2 500
2 000
1 500
1 000
02010 2011 2012 2013 2014
1 392
1 972 1 762
1 527
2 058
aNNUaL INCREaSE %
12.0
10.0
8.0
6.0
4.0
2.0
02006 2007 2008 2009 2010
– Salaries – Wages
2011 2012 2013 2014 2015
LTIFR
10
8
6
4
2
02012
3.82
1.121.84
2013 2014
(CONTINUED)

55METaIR 2014 INTEGRATED ANNUAL REPORT
PROGRESS IN 2014Target for 2014 Progress in 2014Zero disabling and lost-time incidents and each subsidiary has set a specific LTIFR target.
ò 145 lost-time injuries. Group LTIFR was 1.84. Lost-time injuries and LTIFR deteriorated compared to 2013 and we did not reach our target of zero harm to employees.*
Absenteeism and staff attrition rate for the group should average below 4.0%.
ñ Absenteeism improved to 3.0%, within our target of 4.0%. Staff turnover (excluding contractors) averaged 19.3% but was distorted by the ongoing retrenchment process at Smiths Plastics.
Regain and improve on our 2011 Employment Equity position. ñ Eight out of nine operations achieved Level 3 Contributor status and one achieved Level 4
Maintain or improve group training spend target of R9 million. ñ Training spend totalled R13.6 million.
Maintain or improve the target of 138 learnerships in the group. ñ 215 learnerships.
* During 2014 we refined our safety statistics to focus on lost-time injuries. We no longer report disabling injuries.
HUMaN CaPITaL TaRGETS FOR 2015l Zero fatalities and reduce LTIFR to 1.0 or below. l Absenteeism and staff attrition rate for the group should average
below 3.0%.l Regain and improve on our 2012 employment equity position
under the new B-BBEE codes.l Maintain group training spend at a minimum of R10 million. l Maintain or improve the target of 138 learnerships in the group
and engage in post-graduate learning opportunities in battery technology.

56 METAIR 2014 INTEGRATED ANNUAL REPORT
29%
27%
19%
2014 CARBON FOOTPRINT BY OPERATION
n Stationary fuels n Electricity n Raw materials
n Downstream transport and distribution n Other
7+27+58+3+57%
58%
27%
3% 5%
2014 CARBON FOOTPRINT BY SOURCE
We are committed to doing business responsibly and take care to actively manage the impacts of our operations on the environment around us.
Our main impacts on natural capital and the environment are through our carbon footprint, energy consumption, water consumption and waste management. Led by our value of custodianship, we actively manage our impact on the natural environment. This also helps us to build a positive reputation with customers, communities and regulators. Failure to manage our environmental impact risks reputational damage, fines and the loss of our social licence to operate.
We also manufacture certain products that help customers to reduce their energy consumption, carbon footprint and environmental impact.
Environmental management forms part of the safety, health and environment (SHE) function at operations. Environmental issues are monitored by the social and ethics committee, which reports to the board. The CEO is a member of the social and ethics committee. The group’s operating subsidiaries are accredited under ISO 14001, the environmental management standard.
CLIMATE CHANGEWe are cognisant of the potential impact of climate change on society, on our industry and directly on our business.
We are committed to making a contribution to addressing the challenges posed by climate change.
Concerns about climate change provided the impetus for the stringent emissions regulations that affect the automotive industry, our OE customers and the vehicles they produce. OEMs are required to focus closely on their supply chain and the practices of their suppliers in terms of human rights, health and safety, environmental impact and (in South Africa) transformation.
The EU emission regulations provided an opportunity for Metair to reposition the AGM technology it had developed for mining light applications to supply car batteries for Start/Stop systems. These systems in turn cost-effectively reduce fuel consumption and the carbon footprint of the vehicles in which they are installed.
Direct impacts of climate change include the effects of extreme weather events on distribution chains, increased risk of tooling for new projects being lost while shipped due to severe storms and increased energy costs in cooling manufacturing processes.
We consider our energy consumption and carbon footprint to be sensitive information from a competitive point of view. We therefore do not report absolute energy consumption or carbon footprint information, but rather report the increase or decrease in these figures year-to-year. For the same reason, we do not make a CDP submission.
CARBON FOOTPRINTThis year, our carbon footprint calculation was expanded to include Rombat and Mutlu Akü as well as the nine South African operations. As a result the group’s total carbon footprint increased 85% on 2013. Excluding Rombat and Mutlu Akü, the carbon footprint attributable to the nine South African entities decreased 2.3%. The increases in scope one and two emissions were offset by a larger decline in scope three emissions, arising from more efficient use of raw materials.
Emissions embedded in raw materials accounted for 58% of the group’s total carbon footprint and electricity for 27%. The three battery manufacturing operations – First National Battery, Rombat and Mutlu Akü – together contributed 75% of the group’s carbon footprint.
Battery manufacture consumes carbon dense materials and is very energy intensive. First National Battery has operations spread over a relatively wide area, so downstream logistical costs are higher too.
The consumption of raw materials, electricity and stationary fuels account for more than 90% of the group’s total carbon footprint. The group’s focus on constant improvement of manufacturing efficiencies supports our efforts to manage our carbon footprint by ensuring that we continually improve our efficiency of use of these expensive inputs.
n FNB n Smiths Manufacturing n Smiths Plastics n Supreme n Unitrade n Mutlu Akü n Rombat n ATE n Automould n Hesto n Lumotech
4%
5%
5%6%
1%
1%
2%1%

57METAIR 2014 INTEGRATED ANNUAL REPORT
21.6%
2.2%
1%
2%
1%
2%1%
6%3%
1%
4.9%
20.2%
9.8%
16.6%
17.6%
2.2% 1.4%WATER CONSUMPTION BY OPERATION ELECTRICITY CONSUMPTION BY OPERATION
The carbon footprint was calculated using the GHG Accounting Protocol (WRI, WBCSD) as a guideline, and the equity share approach to consolidate carbon emissions. For 2014 emissions calculations, DEFRA 2014 emission factors were used and for previous years, that year’s relevant DEFRA factors were used. For 2014 the grid emission factor of 1.03 kg CO2e per kWh was used (Eskom 2014). The calculation included CO2, CH4 and N20. Refrigerant gases included hydrofluorocarbons (HFCs) and hydrochlorofluorocarbons (HCFCs R22).
Scope one and two emissions for South African operations per person hour worked decreased 0.5% on 2013.
ENERGY CONSUMPTIONEnergy consumed includes fuels, such as petrol and diesel, gases and electricity. Electricity is a key input in both our manufacturing facilities and our costings. With electricity prices in South Africa increasing well ahead of inflation, initiatives that improve energy efficiency have a direct financial impact. Our focus on manufacturing excellence results in initiatives to constantly improve production efficiencies, which translate into more efficient use of machines and electricity. These include the redesign of processes to improve efficiencies and maintaining a high awareness among employees about the need to minimise inefficiencies. Newer machinery introduced into production processes tends to be more energy efficient and improves overall process efficiencies.
Examples of efficiency improvements that also reduce electricity consumption include:l the use of air scrubbers in furnaces to reduce energy
consumption;l using natural gas as an energy source rather than electricity;l using oxygen fired lances in furnaces;l installing variable drive cycles;l adjusting running speed to output;l running variable speed compressors rather than constant speed;l installation of Inbatec formation units at FNB that reduce
battery formation from 20 hours to nine hours, saving electricity and water;
l Supreme Spring changed their shift pattern for the torsion line to night shift only in the peak winter season. The move saved R206 000 and moved the maximum demand period from a peak time to an off peak time; and
l Mutlu Akü introduced a system that increased capacity 30%.
Total electricity use in the group increased 40%. Excluding Mutlu Akü, which was not included in last year’s electricity consumption figure, group electricity consumption decreased 5%. Including Mutlu Akü in 2014, electricity consumption per person hour worked increased 5%. FNB, Mutlu Akü and Rombat together account for 74% of group electricity consumption.
It should be noted that the battery operations are reporting electricity purchased, rather than electricity consumed. This is because batteries are shipped from the factory fully charged, so around 40% of the electricity purchased by the operation is being sold in the battery, rather than used.
Metair’s operations are planning to implement the ISO 50001 Energy Management System. One of Metair’s associate companies – Tenneco – became the first company in the South African automotive component industry to obtain ISO 50001 accreditation during 2013.
The group aims to ensure an organisational focus on continual improvement in efficiencies. Improvements are measured in terms of actual electricity consumption per operation against the representative products they produce.
WASTE MANAGEMENTMinimising waste from production is an important tool for improving production efficiency and sustaining manufacturing excellence. Each subsidiary sets stringent scrap reduction targets for primary and secondary materials. We track yield on lead recycling and plastic recycling percentage as measurement criteria for waste management.
Where we are unable to reuse or recycle waste, we dispose of it in a responsible manner and according to the relevant legislation. Hazardous waste is disposed of using registered disposal companies.
The group recycled 67% of its non-hazardous waste (4 470 tonnes) in 2014 (2013: 3 308 tonnes) mainly in the form of plastic, cardboard and metal. We also recycled 66 690 litres of used oil during the year.
The weight of waste paper reported is based on data provided by waste disposal contractors or estimated using our default rates.
BATTERIES AND RECYCLINGRecycling batteries not only removes potentially harmful plastic, lead and acid from the environment, it makes financial sense. Our goal as a battery manufacturer is to take more lead out of the environment than we put into it and dispose of the other components of a battery in a responsible way. We incentivise customers to return old batteries when buying new ones and also go underground to collect discarded batteries in mines.
Car batteries are nearly 100% recyclable and First National Battery, Rombat and Mutlu Akü all have recycling plants. The battery acid is neutralised and processed through an effluent plant. Plastic from the casing is processed into pellets which go to make new battery casings. Battery plates, terminals and other extracted lead are refined and blended to produce high-quality lead alloys for new batteries.
Recycling lead uses around a third of the energy needed to produce virgin lead from ore, saving energy and reducing emissions.
27%
32%7%
6%
15%
n FNB n Hesto n Lumotech n Mutlu Akü n Smiths Manufacturing n Smiths Plastics n Supreme n Unitrade n Rombat n ATE n Automould
n FNB n Hesto n Lumotech n Mutlu Akü n Smiths Manufacturing n Smiths Plastics n Supreme n Unitrade n Rombat n ATE n Automould
58 METaIR 2014 INTEGRATED ANNUAL REPORT
The group recycled nearly 60 000 tonnes of lead in 2014.
WaTER CONSUMPTIONThe group withdrew 530 386m3 of water in 2014 from municipal sources, an increase of 13% on 2013 (468 285 m3). Removing Mutlu Akü from the 2014 figure (since it was not included in 2013), shows that water consumption across the rest of the group declined 10%. Battery manufacturing uses a lot of water and the three battery operations together account for 61% of group consumption.
Group water consumption (including Mutlu Akü in 2014) per person hour worked decreased 15% to 33.6 litres (2013: 39.6).
The water consumption for the group is calculated from municipal meter readings, corroborated by readings from internal meters where these are installed.
There are various water saving initiatives in place at operations:l FNB installed rainwater collection tanks at their Fort Jackson
facility and at Buffalo View. Harvested rainwater is used in cooling towers, in battery washing machines and in toilets.
l Smiths manufacturing installed a water purification plant to recycle and recover 90% of the water projected to be used in a new water-intensive process.
l Supreme saved 3 875kl of water by automating the switching off of water when the paint lines are not running and fitting flow control metering valves on rinse tanks.
l Mutlu Akü automated the battery washing machine to reduce water use.
We did not make a water disclosure project submission in 2014 and will consider making a submission in future periods.
ENVIRONMENTaLLY FRIENDLY PRODUCTSThe intellectual capital, culture of innovation and technical expertise in Metair’s research and development and manufacturing resources position the group well to develop energy efficient and environmentally friendly products. In addition to the Start/Stop batteries, there are a range of other environmentally friendly products, including:l Envirolights – high-efficiency streetlights, warehouse lights
and commercial lights.l Heat pumps – locally manufactured on-demand water heaters
that require one third of the energy consumed by traditional water heaters.
l High-power lithium ion cap lamps that are smaller, lighter and last much longer.
l Durable M Solar batteries for solar powered installations.l Spill-proof Gel VRLA batteries.
ENVIRONMENTaL IMPaCTSThere were no spills or other environmental incidents at any of the group’s subsidiaries during 2014. The environmental impact of our products is directly linked to the stringent environmental regulatory regimes in Europe and Japan. Initiatives such as the Global Automotive Stakeholder Group focus attention on the environmental impacts of substances in automotive parts. We carefully monitor the material makeup and characteristics of our products so that we adhere to these requirements and thereby mitigate the environmental impact of our products. Raw material inputs and processes are adjusted to ensure that we maintain compliance as environmental legislation continues to develop.
As our OE products end up as components in vehicles that may be manufactured in, or exported to other countries, we have limited ability to reclaim products or packaging from end users. End of vehicle life regulations, such as the end-of-life vehicles directive in the EU and similar legislation in Japan, US and other countries, are driving the reduction of waste arising from end-of-life vehicles.
Environmental protection expenditure totalled R16.8 million in 2014.
R millionWaste disposal, emissions treatment and remediation costs
14.0
Prevention and environment management costs 2.8Total 16.8
Target for 2014 Progress in 2014Continue to refine processes to increase efficiency and reduce scrap
Initiatives are in place at all subsidiaries that focus on improving efficiency in our manufacturing processes including the reduction of scrap. Most subsidiaries reported a reduction in scrap produced during the year.
Keep the volume-adjusted increase in group electricity consumption below 15%
Despite the manufacturing inefficiencies arising from production disruptions, the volume-adjusted increase in group electricity consumption was limited to 4.3%.
Increase the proportion of waste recycled The group recycled 67% of its non-hazardous waste in 2014.
ENVIRONMENTaL TaRGETS FOR 2015l Continue to refine processes to increase efficiency and reduce
scrap.l Keep the increase in group electricity consumption per person
hour worked below 10%.
l Increase the proportion of waste recycled by 10%.l Reduce municipal water consumption per person per hour
worked by 10%.
(CONTINUED)

59METaIR 2014 INTEGRATED ANNUAL REPORT
ETHICaL LEaDERSHIP aND CORPORaTE CITIZENSHIPThe board provides effective leadership based on a foundation of high ethical standards. The group is committed to a policy of fair dealing and integrity in the conduct of its business. This commitment is based on a fundamental belief that business should be conducted honestly, fairly and legally. The group requires all employees to share its commitment to high moral and ethical standards as well as the adherence to all legal requirements. The core principle of the group’s ethical policy is for all employees to strive to be exemplary custodians in their respective areas of responsibility in their workplace, home, community, country and the world. This policy was reinforced throughout the group during 2014. The group also has a whistle blowing programme including all subsidiaries whereby employees can report any unethical behaviour without fear of being victimised.
Ethical behaviour requires the directors, management and employees to:l Obey the law;l Respect others;l Be fair;l Be honest; and l Protect the environment.
The board and management recognise that the group is not only an economic entity but also a corporate citizen and, as such, it has social and moral responsibilities to society. The group also has a code of ethics which incorporates corporate citizenship and ethical leadership policies. The group is involved in a number of corporate social investment projects, some which are reported in detail in the Transformation section on page 50.
The board established a social and ethics committee during 2012. Refer to the social and ethics committee section in the corporate governance report for more information.
CORPORaTE GOVERNaNCEThe company and its subsidiaries subscribe to the principles of the King Report on Corporate Governance for South Africa (King III) released in 2009, and apply these principles. A review is performed by the audit and risk committee annually to ensure that the group has applied the principles and recommended practices in King III.
This analysis identifies areas for improvement or ways in which our governance practices could be enhanced. A copy of our King III Checklist appears on page 84.
We confirm that the group applied the governance principles contained in King III during the 2014 financial year and continues to strive to improve on the application of the recommended practices in our governance systems, processes and procedures.
The group ensures that it complies with all applicable laws and regulations in each jurisdiction in which it operates and where applicable adheres to non-binding rules, codes and standards in all of the jurisdictions in which it operates. The group complied with the JSE Listings Requirements by fulfilling its obligations such as advising the JSE and posting on SENS the resignation and appointment of directors, announcing details of corporate actions that may lead to a material movement in the share price, and publishing interim and annual reports. The company secretary and sponsor are responsible for assisting the board in monitoring compliance with relevant legislation Including the JSE Listings Requirements as well as those of the Borsa Istanbul, Turkey.
THE bOaRDThe board functions in accordance with a formal charter and its responsibilities and duties as provided in the company’s memorandum of incorporation.
The board comprises nine directors, of whom two are executive directors (the managing director and the finance director), one non-executive director and six independent non-executive directors (one being the chairman). No employees aside from the executive directors are deemed to be prescribed officers. The average age of directors is 58 years and the average length of service is 7.7 years. The chairman of the board is a historically disadvantaged South African.
In the past, it was the company’s practice, given the quantum of the direct and indirect shareholding of the major shareholder, Royal Bafokeng Holdings (RBH), to appoint one of its nominees as the non-independent chairman of the board. With effect from 1 October 2013 Mr OME Pooe ceased to be a nominee of RBH. On 24 October 2014 RBH sold the majority of its interest in Metair held through the Royal Bafokeng Metair Trust and RBH has undertaken to relinquish control of the Royal Bafokeng Metair Trust. As a consequence the board determined on 12 December 2014 that Mr OME Pooe and Mr DR Wilson, an employee of RBH, now meet the requirements of an independent director and that the role of a lead independent director, currently filled by Mr JG Best, is no longer required. The board also decided that Mr Pooe, given his knowledge and experience of the company and as president of NAACAM, should continue as chairman and Mr DR Wilson who was appointed to the Metair board on 1 January 2014 as a non-executive director, be appointed to the audit and risk committee.
Mr BM Jacobs resigned from the Metair board on 25 March 2014 and was replaced by Mr S Douwenga on the same day. Ms A Galiel resigned from the board on 5 November 2014. Details of directors in office are provided on page 30.
In terms of the memorandum of incorporation all new directors appointed during the year, as well as one-third of the existing non-executive directors, have to retire on a rotational basis each year, but they may offer themselves for re-election. The board meets at least once a quarter and is responsible for strategic direction, policy decisions and control of the company, through, among other activities, the approval of budgets and the monitoring of group performance.
60 METaIR 2014 INTEGRATED ANNUAL REPORT
A self-evaluation was conducted during the year on the board as a whole. This process was coordinated by the company secretary and the results were discussed at the board meeting in November 2014. The chairman concluded that the board is functioning well and noted areas for minor improvement. This process is coordinated and repeated annually to assess board functionality and progress on areas requiring improvement. In addition once every three years a board evaluation is done by the board chairman or by an outside service provider on the individual board members and the board as a whole.
Board members are required to regularly declare any shareholding and any interest that they might have in transactions with the group. Mr L Soanes (independent non-executive director) disposed of 120 000 Metair shares on 18 December 2014 which resulted in his direct beneficial interest in Metair securities decreasing from
240 000 Metair shares to 120 000. A trust of whom Mr A Joffe (non-executive director) is a beneficiary acquired an indirect beneficial interest in Metair ordinary shares on 19 November 2014. As a result of this transaction, Mr Joffe’s indirect beneficial interest in Metair securities increased by 73 185 shares. A disposal by CoroCapital (Pty) Ltd, of which Mr Joffe holds an indirect beneficial interest, of an equity interest in an entity which holds Metair shares, on 4 April 2014 has resulted in Mr Joffe’s indirect beneficial interest in Metair shares decreasing by 691 613 shares.
Metair executive directors participated in the Metair Investments 2009 Share Plan during the year. Proceeds on the vesting of the shares are disclosed in note 3 of the annual financial statements and further details on allocations to the Metair executive directors are disclosed in note 14.2 of the annual financial statements.
board meeting attendance
19 Feb 2014
24 Mar 2014
16 apr 2014
26 Jun 2014
7 aug 2014
15 aug 2014
27 aug 2014
27 Oct2014
27 Nov2014
board and committee attendance
OME Pooe P P P P P P P P P 100%
CT Loock P P P P P P P P P 100%
BM Jacobs* P P 100%***
S Douwenga P P P P P P P P P 100%
RS Broadley P P P P P P P P P 100%
A Joffe P P P P P P P P P 100%
L Soanes P P P P P P P P P 100%
A Galiel** P P P P P P P P 100%***
JG Best P P P P P P P P P 100%
DR Wilson P P P P P P P P P 100%
SG Pretorius P P P A P P P A P 78%
Overall director board attendance 98%
P = Present A = Apologies* Mr BM Jacobs resigned on 25 March 2014 as financial director and was replaced by Mr S Douwenga.** Ms A Galiel resigned as a board member on 5 November 2014.*** Attendance percent calculated on board and committee attendance during the tenure of directorship.‡ Attended as invitee
‡
(CONTINUED)
61METaIR 2014 INTEGRATED ANNUAL REPORT
Board training is aimed to be done annually on topical subjects by external trainers. During 2014 the following external training programmes were done:
External trainer Training topicKAR Presentations
• Refresher course for JSE listed company directors and officers
• JSE LR amendments KPMG • Social and ethics training to the boardIRAS • Integrated reporting
• Sustainability• Assurance• GRI G4
SUbSIDIaRY aND DIVISIONaL bOaRDSIn line with the decentralised nature of the group’s operations, subsidiary and divisional boards manage the day-to-day affairs within their areas of responsibility, according to Metair board-approved authority limits. The Metair board remuneration committee approves and the company board ratifies the appointments to the boards of major subsidiaries. A governance framework, including strategic objectives of the framework, has been agreed between the group and its subsidiary boards.
bOaRD aUDIT aND RISK COMMITTEEThe committee comprises three independent non-executive directors, namely Mr JG Best (audit and risk committee chairman), Mr L Soanes and Mr DR Wilson. Ms A Galiel resigned on 5 November 2014 and was replaced by Mr DR Wilson on 10 December 2014.
The executive directors, the external auditors and the internal auditors attend the meetings by invitation.
The committee functions according to board-approved terms of reference and performs an annual self-evaluation of its effectiveness.
The committee has an independent role with accountability to both the board and shareholders. The role of the committee is to assist the board in carrying out its duties relating to accounting policies, internal controls, financial reporting practices and identification of exposure to significant risk.
The audit and risk committee has specific responsibilities relating to the monitoring and oversight of:l the preparation of accurate financial reporting and financial
statements in accordance with International Financial Reporting Standards;
l integrated reporting;l combined assurance;l internal audit;l external audit;l information technology; andl group risk management.
The group reviews its combined assurance model annually based on identified key risks and the committee confirmed that all areas are adequately covered by external audit, internal audit, management or specialist consultants. Key strategic risks were included in the combined assurance model. A regulatory universe, set up by subsidiary, is being monitored and compliance affirmed by the relevant responsible person on a regular basis.
The committee reviews the interim results, annual financial statements and trading statements and the integrated report and recommends them to the board for approval.
It nominates, for approval by the board and shareholders, a registered auditor who complies with independence requirements and determines the fee structure for audit fees.
In this respect the committee confirms that it is satisfied that PricewaterhouseCoopers Incorporated met the test of independence. PricewaterhouseCoopers Incorporated rotates partners every five years and has been the lead auditor of the company since 1998.
The committee also sets the policy for the provision of non-audit services and approves expenditure on these services where applicable.
Where an external party provides assurance over non-financial data and information disclosed in the integrated report, the audit and risk committee assess the qualifications and suitability of the external party and approves their appointment.
For the purpose of determining the effectiveness of management systems and internal controls during the course of the year, the committee reviewed the internal and external audit scope, plans and the resultant findings as well as management reports.
KPMG is appointed to perform the function of internal audit and the committee is satisfied that they met the test of independence.
Internal audits were performed at most subsidiaries and no significant breakdowns in internal controls were identified during the past year. Internal audit includes a risk-based approach to its plan. The written internal audit assessment to the board and audit and risk committee on the overall internal control environment confirms that the group has a good control framework in place and there were no material breakdowns in internal controls.
Five meetings were held during the year and the chairman reported to the board after each meeting.
The first meeting of 2015 was held in March.
audit and risk committee meeting attendance
24 Mar 2014
16 apr 2014
15 aug 2014
27 aug 2014
3 Nov 2014
JG Best P P P P P
A Galiel P P P P P
L Soanes P P P P P
P = Present A = Apologies
GROUP RISK MaNaGEMENTRisk management is the responsibility of the board with the reporting and monitoring function being delegated to the board audit and risk committee. An enterprise-wide risk management policy framework forms part of the audit and risk committee charter.
The audit and risk committee is responsible for ensuring that the primary objective and functions with respect to risk, as set out below, are adequately and effectively achieved. The board is responsible for ensuring that the actions recommended by the committee are addressed and that management allocates the appropriate resources.
The audit and risk committee reviews and assesses the effectiveness of risk management and control processes within the organisation and presents its findings to the board.

62 METaIR 2014 INTEGRATED ANNUAL REPORT
The main functions of the committee relating to risk are to:l identify and agree on the risk profile of the group;l establish and maintain a common understanding of the risk
universe that needs to be addressed in order to achieve corporate objectives;
l ensure that management has effectively identified the key business risks and incorporated them into their activities;
l assess the appropriateness of management responses to significant risks;
l consider the control environment directed towards the proper management of risk;
l co-ordinate the group’s assurance efforts – to avoid duplication, ensure adequate coverage of the risks and decide on what assurance efforts are appropriate;
l assess the adequacy of the assurance provided by management, internal audit and external audit, and specialist consultants (as and when used);
l keep abreast of all changes to the risk management and control system and ensure that the risk profile and common understanding is updated, where appropriate;
l report to the board on the work undertaken in establishing and maintaining the understanding of the risks that need to be managed and the adequacy of action taken by management to address identified areas for improvement;
l satisfy the corporate governance reporting requirements; andl use AAA grade insurance underwriters to insure against major
incidents and losses.
The board of Metair is committed to a process of risk management that is aligned to the principles of King III and uses a well-structured and tested risk rating methodology.
The realisation of the group strategy depends on being able to manage risks in a manner that does not jeopardise the interests of stakeholders. Sound management of risk will enable the group to anticipate and respond to changes in the environment, as well as to enable it to make informed decisions under conditions of uncertainty. An enterprise-wide approach to risk management has been adopted, which means that every key risk in each part of Metair is included in a structured and systematic process of risk management. All key risks are managed within a unitary framework that is aligned to Metair’s corporate governance responsibilities. Metair also links all the risks to its strategy which can be seen in the risk table.
Each subsidiary as well as the Metair corporate office completes a risk identification process. At a group level the major risks of the subsidiaries together with the Metair corporate level risks are combined to arrive at a Metair group risk matrix. Mitigating controls have been applied to the inherent risks to arrive at residual risks. Compliance with laws, rules, codes and standards form an integral part of the company’s risk management process. Risks are continuously reviewed by management to ensure that responses to risk remain current and dynamic. The audit and risk committee bi-annually reviews the risks.
Risk and IT governance is included as an agenda item at all subsidiary board meetings and is continuously monitored. Meetings have been held at all subsidiaries.
Metair believes that risks are addressed through avoidance, capital, systems, processes, people, insurance and assurance and/or a combination of these and must always be reflected in business planning and be evident in budgets. A risk management plan is in place and updated annually.
The group has identified an overall group financial risk tolerance level as well as individual tolerance levels per risk and during the year completed a risk dashboard which indicates the inherent and residual risk exposure of each risk as well as a graph to indicate where the group consolidated tolerance level falls. One new strategic risk was identified which is ranked number two.
The table below sets out the top 10 risks of the Group.
Previous rank Rank Move Risk name Risk category
Residual vs inherent risk exposure Link to
strategyLow High1, 4 1 ñ Cost and quality competitiveness of group products
measured against the supply from global industry leaders and emerging suppliers from low-cost countries like India, China and Korea
Strategic uu 1/2/3/4/6/7
New 2 ñ Successful execution of the Metair redesign process linked to the integration and execution of acquisitions in foreign jurisdictions with challenging geopolitical environments
Strategic uu 1/2/4/5/6/7
3 3 ð Mismatch of employee and management expectations resulting in unrealistic demands exacerbated by interference both from government and unions
Strategic uu 2/3/7
(CONTINUED)
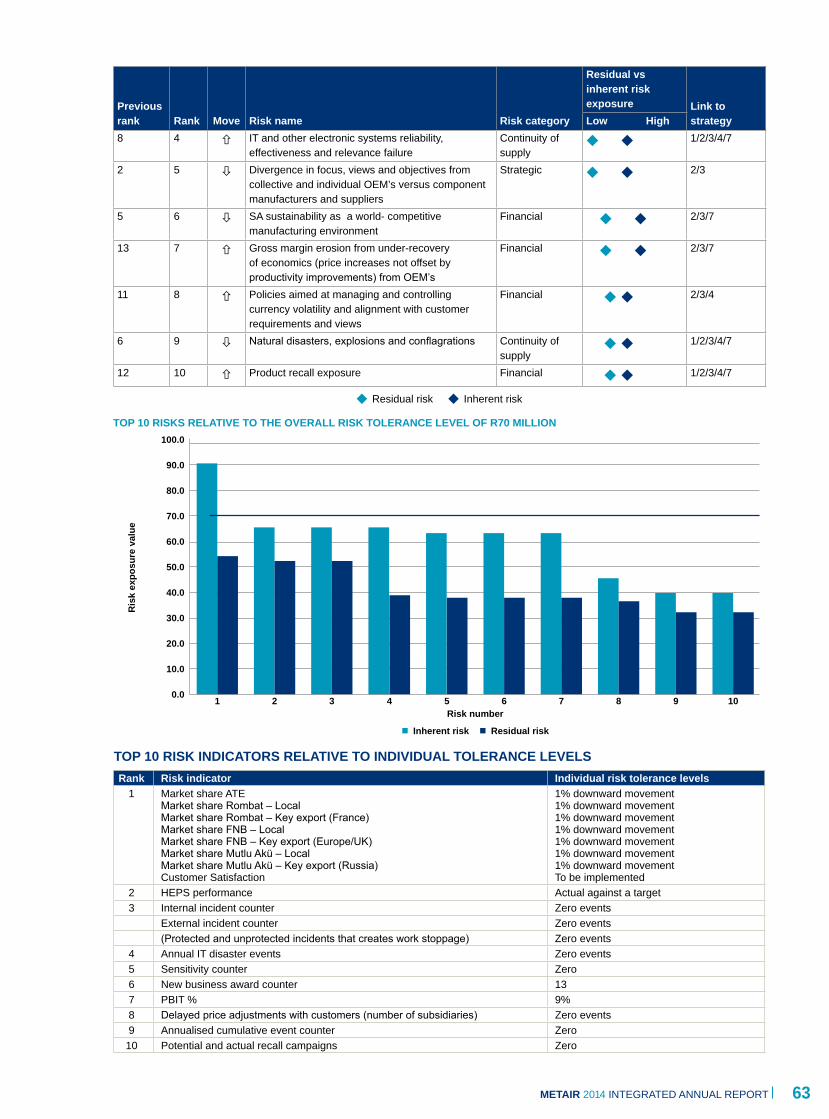
63METaIR 2014 INTEGRATED ANNUAL REPORT
Previous rank Rank Move Risk name Risk category
Residual vs inherent risk exposure Link to
strategyLow High8 4 ñ IT and other electronic systems reliability,
effectiveness and relevance failure Continuity of supply
uu 1/2/3/4/7
2 5 ò Divergence in focus, views and objectives from collective and individual OEM’s versus component manufacturers and suppliers
Strategic uu 2/3
5 6 ò SA sustainability as a world- competitive manufacturing environment
Financial uu 2/3/7
13 7 ñ Gross margin erosion from under-recovery of economics (price increases not offset by productivity improvements) from OEM’s
Financial uu 2/3/7
11 8 ñ Policies aimed at managing and controlling currency volatility and alignment with customer requirements and views
Financial uu 2/3/4
6 9 ò Natural disasters, explosions and conflagrations Continuity of supply
uu 1/2/3/4/7
12 10 ñ Product recall exposure Financial uu 1/2/3/4/7
TOP 10 RISKS RELaTIVE TO THE OVERaLL RISK TOLERaNCE LEVEL OF R70 MILLION100.0
90.0
80.0
70.0
60.0
50.0
40.0
30.0
20.0
10.0
0.0
Ris
k ex
posu
re v
alue
Risk number
n Inherent risk n Residual risk
1 2 3 4 5 6 7 8 9 10
Rank Risk indicator Individual risk tolerance levels1 Market share ATE
Market share Rombat – LocalMarket share Rombat – Key export (France)Market share FNB – LocalMarket share FNB – Key export (Europe/UK)Market share Mutlu Akü – LocalMarket share Mutlu Akü – Key export (Russia)Customer Satisfaction
1% downward movement1% downward movement1% downward movement1% downward movement1% downward movement1% downward movement1% downward movementTo be implemented
2 HEPS performance Actual against a target 3 Internal incident counter Zero events
External incident counter Zero events(Protected and unprotected incidents that creates work stoppage) Zero events
4 Annual IT disaster events Zero events5 Sensitivity counter Zero6 New business award counter 137 PBIT % 9%8 Delayed price adjustments with customers (number of subsidiaries) Zero events9 Annualised cumulative event counter Zero10 Potential and actual recall campaigns Zero
TOP 10 RISK INDICaTORS RELaTIVE TO INDIVIDUaL TOLERaNCE LEVELS
uResidual risk uInherent risk
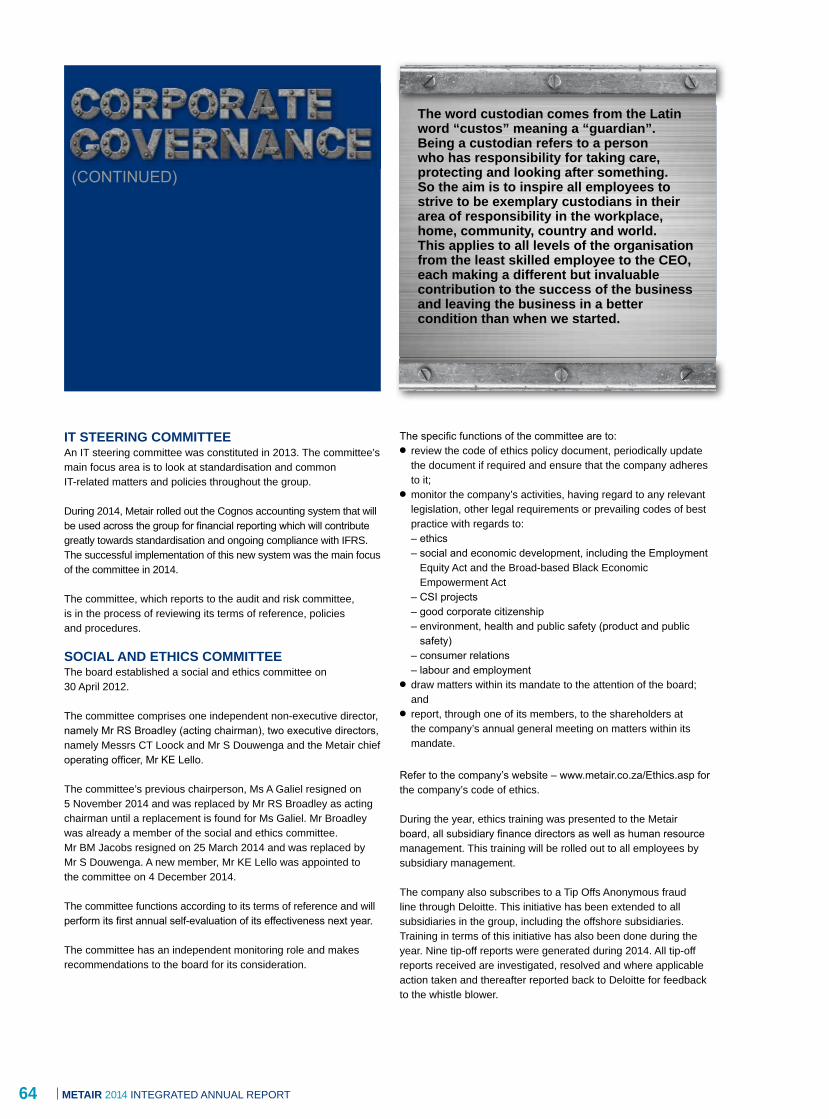
64 METaIR 2014 INTEGRATED ANNUAL REPORT
IT STEERING COMMITTEEAn IT steering committee was constituted in 2013. The committee’s main focus area is to look at standardisation and common IT-related matters and policies throughout the group.
During 2014, Metair rolled out the Cognos accounting system that will be used across the group for financial reporting which will contribute greatly towards standardisation and ongoing compliance with IFRS. The successful implementation of this new system was the main focus of the committee in 2014.
The committee, which reports to the audit and risk committee, is in the process of reviewing its terms of reference, policies and procedures.
SOCIaL aND ETHICS COMMITTEEThe board established a social and ethics committee on 30 April 2012.
The committee comprises one independent non-executive director, namely Mr RS Broadley (acting chairman), two executive directors, namely Messrs CT Loock and Mr S Douwenga and the Metair chief operating officer, Mr KE Lello.
The committee’s previous chairperson, Ms A Galiel resigned on 5 November 2014 and was replaced by Mr RS Broadley as acting chairman until a replacement is found for Ms Galiel. Mr Broadley was already a member of the social and ethics committee. Mr BM Jacobs resigned on 25 March 2014 and was replaced by Mr S Douwenga. A new member, Mr KE Lello was appointed to the committee on 4 December 2014.
The committee functions according to its terms of reference and will perform its first annual self-evaluation of its effectiveness next year.
The committee has an independent monitoring role and makes recommendations to the board for its consideration.
The specific functions of the committee are to:l review the code of ethics policy document, periodically update
the document if required and ensure that the company adheres to it;
l monitor the company’s activities, having regard to any relevant legislation, other legal requirements or prevailing codes of best practice with regards to:
– ethics – social and economic development, including the Employment
Equity Act and the Broad-based Black Economic Empowerment Act
– CSI projects – good corporate citizenship – environment, health and public safety (product and public
safety) – consumer relations – labour and employmentl draw matters within its mandate to the attention of the board;
andl report, through one of its members, to the shareholders at
the company’s annual general meeting on matters within its mandate.
Refer to the company’s website – www.metair.co.za/Ethics.asp for the company’s code of ethics.
During the year, ethics training was presented to the Metair board, all subsidiary finance directors as well as human resource management. This training will be rolled out to all employees by subsidiary management.
The company also subscribes to a Tip Offs Anonymous fraud line through Deloitte. This initiative has been extended to all subsidiaries in the group, including the offshore subsidiaries. Training in terms of this initiative has also been done during the year. Nine tip-off reports were generated during 2014. All tip-off reports received are investigated, resolved and where applicable action taken and thereafter reported back to Deloitte for feedback to the whistle blower.
The word custodian comes from the Latin word “custos” meaning a “guardian”. being a custodian refers to a person who has responsibility for taking care, protecting and looking after something. So the aim is to inspire all employees to strive to be exemplary custodians in their area of responsibility in the workplace, home, community, country and world. This applies to all levels of the organisation from the least skilled employee to the CEO, each making a different but invaluable contribution to the success of the business and leaving the business in a better condition than when we started.
(CONTINUED)

65METAIR 2014 INTEGRATED ANNUAL REPORT
The first meeting in 2015 was held in March.
Social and ethics committee meeting attendance
24 March 2014 27 November 2014
A Galiel* P
RS Broadley** P P
CT Loock P P
BM Jacobs*** P
S Douwenga*** P
P = Present * Ms A Galiel resigned as a committee chairperson on
5 November 2014.** Mr RS Broadley was appointed as acting committee
chairperson*** Mr BM Jacobs resigned on 25 March 2014 and was replaced
by Mr Douwenga
The chairperson reported to the board after each meeting that was held in 2014.
The committee is scheduled to meet at least twice a year and social and ethics is a standard agenda item on the board agenda throughout the year.
SOCIAL AND ETHICS PLAN AND PROCEDURE The Metair board is responsible and accountable for directing and monitoring Metair’s social and ethics management performance in a structured framework.
Arising from the committee’s terms of reference, during the year the committee developed the social and ethics plan and procedure, which is designed to form the basis of the work of the committee, and the platform around which the social and ethics work plan is implemented within the business operations. A detailed work plan for 2014 was drawn up as a guideline to ensure that all set plans are carried out.
The core principle of the social and ethics framework is custodianship and the core values are unity, harmony, equality, respect for human dignity and doing what is right, fair, reasonable, lawful and just. Metair’s strategy has also been expanded to include ‘custodianship in the business and society’ as one of its elements.
Being a custodian has the built-in notion that as individuals we play a role in a bigger long-term plan and that it is not the size of the role that matters but rather how well one performs their role.
Custodianship encompasses the key elements of long-term sustainability and continuity. It elevates the focus beyond individual or personality interests, to build a sustainable legacy, while recognising the broad responsibilities we have as corporate citizens to our various stakeholders, and in so doing contributing to the development of our society.
Metair’s social and ethics framework is therefore designed around the concept of being an excellent guardian of the aspects shown in the graphic on the right.
The responsibility assigned with being a custodian also requires accountability, and evaluation against the measures set for being an excellent custodian.
Metair’s social and ethics framework, which is the soft thread that runs through the business, intertwines with the hard threads
METAIR’S SOCIAL AND ETHICS FRAMEWORK
Business
Stakeholders
Human Capital
Metair Custodian
Consumers
Society
• Community
• Country
• World
Environment
associated with financial economic performance. Reporting on these annually, we are guided by the group’s corporate image and theme. The past themes of ‘Transformation’, ‘Transparency’, ‘Balance’, ‘Measure’, ‘Adjust’, ‘Reflection’ and ‘Growing an international footprint’ provide the specific focal points for the social and ethics framework.
Metair commissioned an independent competent persons’ report to establish the effective B-BBEE shareholding in the company at the end of 2014. As a result of the disposal by RBH of its shareholding, Metair elected to use the inclusion principle together with the sale/loss of shares principle to conduct the ownership verification. In previous years, the exclusion principle was used. The competent persons’ report established total BEE shareholding and voting rights of 33.57% and total female BEE shareholding of 15.31% with voting rights of 16.12%. Designated group BEE shareholders comprised 2.22% of the share register. The ownership score increased against the dti Codes of Good Practice to 20.97 points from 20.8 points in 2013.
INSIDER TRADINGNo employee (directors and officers included) may trade directly or indirectly in the shares of the company during a closed period or a prohibited period. Closed periods are imposed from 31 December and 30 June until the publication of the results.
Where appropriate, a prohibited period is also imposed on certain employees during periods when they are in possession of undisclosed price-sensitive information.
EMPLOYMENT EQUITY AND TRANSFORMATIONThe group, through each of its subsidiaries, has:
l submitted the relevant employment equity reports (in October 2014), after thorough consultation with staff and union representatives;
l through the employment equity and transformation committees monitored and measured performance against the five-year employment equity plan and instituted corrective action where necessary; and

66 METaIR 2014 INTEGRATED ANNUAL REPORT
l addressed barriers such as skills shortages among previously disadvantaged groups, through accelerated skills development programmes, learnership programmes, and intensive internal and external training.
The group consequently complies with all the requirements of the Employment Equity Act. Refer to the transformation section on page 49.
bROaD-baSED bLaCK ECONOMIC EMPOWERMENTMetair achieved a score of 20.97 points for the ownership element on the generic broad-based black economic empowerment
scorecard. The transfer of these points to the subsidiaries results in all subsidiary companies being compliant during the period. Subsidiary companies have all reached their goal by achieving and even improving on the targeted Level 4 contributor level already in 2013 instead of the budgeted 2014. Focus remains on employment equity, preferential procurement, skills development and corporate social investment. This is in line with customer requirements of a targeted contributor Level 4 for participation in new projects. Refer to the transformation section on page 49 for more information.
COMPaNY SECRETaRYMs SM Vermaak has filled the position of company secretary since 2001. Ms Vermaak is not a director of the company and the board is therefore satisfied that an arm’s length relationship between the board and the company secretary, in accordance with the recommended practice of King III, is maintained. The board has assessed her competence, qualifications and experience during the year and found her to be competent and suitably qualified to act as company secretary.
All directors have access to the advice and services of the company secretary to enable them to perform their duties and responsibilities and for the board to function effectively. The company secretary fulfils the duties as set out in section 88 of the Companies Act, 71 of 2008 and is also responsible to ensure compliance with the Listings Requirements of the JSE.
SPONSOROne Capital Advisory (Pty) Ltd acts as sponsor to the company in compliance with the Listings Requirements of the JSE Limited.
KING III COMPLIaNCE The company performed a review of the requirements of King III, the full results of which are shown in Appendix VI on page 84. At the date of the report the group applied all the principles of King III.
(CONTINUED)

67METaIR 2014 INTEGRATED ANNUAL REPORT
The audit and risk committee is constituted as a statutory committee of Metair Investments Ltd in respect of its statutory duties in terms of section 94(7) of the Companies Act, 71 of 2008 (the Act) and a committee of the board in respect of all other duties assigned to it by the board. The committee has complied with its legal and regulatory responsibilities for the 2014 financial year.
NaMES aND QUaLIFICaTIONS OF COMMITTEE MEMbERSJG Best (Chairman) ACMA, ACIS, MBAL Soanes National Certificate of EngineeringDR Wilson CA (SA)
TERMS OF REFERENCEThe committee has adopted formal terms of reference approved by the board. These terms of reference are reviewed on an annual basis and updated where necessary. During the past year, the committee has executed its duties in accordance with the terms of reference. The terms of reference can be found on the company’s website at www.metair.co.za/pdf/Audit%20%20Risk%20Committee%20Charter%202014.pdf.
INTERNaL aUDIT TERMS OF REFERENCEThe committee has considered and approved the internal audit terms of reference.
COMPOSITIONThe committee comprises of three independent non-executive directors of which one is the chairman. The governance of risk forms part of the audit and risk committee’s duties. All members of the committee are suitably skilled and experienced. The chairman of the board is not eligible to be the chairman or a member of the audit and risk committee.
MEETINGSFive meetings were held during the year and were attended by all members.
STaTUTORY DUTIESThe following statutory duties were executed by the committee in terms of the Act:l nominated and re-appointed PricewaterhouseCoopers Inc.
(PwC) as external auditors and Mr G Hauptfleisch as the
individual auditor, after confirmation of their independence;l the committee confirmed that PwC and the designated auditor
are approved by the JSE;l the external auditor fees, as per note 3 of the annual financial
statements, and their terms of engagement were approved;l all non-audit services provided by PwC were reviewed and
approved;l meetings were held with PwC after the audit and risk committee
meetings, without executive management present, and no matters of concern were raised;
l no reportable irregularities were noted by PwC;l the role of the committee is set out on page 61 of this report;l the committee reviewed the annual financial statements,
integrated annual report as well as the interim report during the year with the external auditors present before recommending them to the board for approval; and
l all trading statements were reviewed by the audit and risk committee before recommending them to the board for approval.
RISK MaNaGEMENTThe board has assigned oversight of the risk management function to the audit and risk committee.
The committee satisfied itself that the process and procedures followed in terms of identifying, managing and reporting on risk are adequate and that the following areas have been appropriately addressed:l financial reporting risks;l internal financial controls;l fraud risk relating to financial reporting; andl IT risk as it relates to financial reporting.
The committee mandate and enterprise-wide risk management policy framework are in place.
INTERNaL FINaNCIaL CONTROLSFor the purpose of determining the effectiveness of management systems and internal controls during the course of the year, the committee reviewed the internal and external audit scope, plans and the resultant findings to determine the effectiveness of management systems and internal controls. Assurance was received from management, internal and external audit and, based on this combined assurance, the committee is satisfied that the internal controls of the group are adequate and that there was no material breakdown in internal controls.
REGULaTORY COMPLIaNCEThe group complied with all relevant laws and regulations and considers adherence to non-binding rules, codes and standards. Compliance forms an integral part of the company’s risk management process.
EXTERNaL aUDITThe committee has no concerns regarding the external auditor’s independence and PwC has been recommended to the board and shareholders to be re-appointed. Refer to note 3 of the annual financial statements for audit fees paid.
INTERNaL aUDITThe committee is responsible for overseeing internal audit. The audit and risk committee:l approved the re-appointment of KPMG as internal auditor;l approved the internal audit plan; andl ensured that KPMG is subject to an independent quality review,
as and when the committee determines it appropriate.
AND RISK COMMITTEE REPORT
68 METaIR 2014 INTEGRATED ANNUAL REPORT
The committee has a good working relationship with KPMG.
FINaNCIaL DIRECTOR REVIEWThe committee has reviewed the performance, appropriateness and expertise of the financial director, Mr S Douwenga, and confirms his suitability in terms of the JSE Listings Requirements.
INTEGRaTED aNNUaL REPORTThe committee has evaluated the annual financial statements of Metair Investments Ltd and the group for the year ended 31 December 2014 and based on the information provided to the committee, consider that the group complies in all material respects with the requirements of the Companies Act and International Financial Reporting Standards. The committee has reviewed the integrated annual report and the committee recommends the report to the board and shareholders for approval.
On behalf of the board audit and risk committee
JG bestaudit and risk committee chairman25 March 2015
AND RISK COMMITTEE REPORT
(CONTINUED)

69METaIR 2014 INTEGRATED ANNUAL REPORT
COMMITTEE REPORT
The board established a social and ethics committee with effect from 30 April 2012.
The social and ethics committee is constituted as a statutory committee of Metair Investments Ltd in respect of its statutory duties in terms of the Companies Act, 71 of 2008 (the Act) and a committee of the board in respect of all other duties assigned to it by the board. The committee assists the board in providing effective leadership and being a good corporate citizen.
The committee has complied with its statutory duties and other duties assigned to it by the board for the 2014 financial year.
NaMES aND QUaLIFICaTIONS OF COMMITTEE MEMbERSRS Broadley Advanced Technical Certificate (Engineering)CT Loock B. Eng (Industrial)S Douwenga B. Comm B. Acc CA (SA)K Lello NHDip Mech Eng, MBA
TERMS OF REFERENCEThe committee has adopted formal terms of reference approved by the board. These terms of reference are reviewed on an annual basis and updated where necessary. During the past year, the committee has executed its duties in accordance with the terms of reference. The terms of reference can be found on the company’s web site at www.metair.co.za/pdf/Social%20and%20Ethics%20Committee%20Charter%202014.pdf.
The committee has an independent role and makes recommendations to the board for its consideration.
The specific functions of the committee are to:l review the code of ethics policy document, periodically update
the document if required and ensure that the company adheres to it;
l monitor the company’s activities, having regard to any relevant legislation, other legal requirements or prevailing codes of best practice with regards to:
– social and economic development, including, the Employment Equity Act and the Broad-based Black Economic Empowerment Act
– good corporate citizenship – environment, health and public safety (product and public
safety) – consumer relations – labour and employmentl draw matters within its mandate to the attention of the
board; andl report, through one of its members, to the shareholders at
the company’s annual general meeting on matters within its mandate.
COMPOSITIONThe committee comprises one independent non-executive director, namely Mr RS Broadley (acting chairman), two executive directors, namely Messrs CT Loock and S Douwenga and the Metair chief operating officer, Mr KE Lello.
MEETINGSTwo meetings were held during the year and were attended by all members.
No material non-compliance with legislation or best practice, relating to the areas within the committee mandate, has been brought to the attention of the committee. Based on its monitoring activities to date, the committee has no reason to believe that such non-compliance has occurred.
The group incurred no material penalties, fines or convictions during the year.
On behalf of the social and ethics committee
RS broadleySocial and ethics committee chairperson25 March 2015
70 METaIR 2014 INTEGRATED ANNUAL REPORT
bOaRD REMUNERaTION aND NOMINaTIONS COMMITTEEThe committee comprises three non-executive directors: Messrs RS Broadley, who is also the chairman, L Soanes and A Joffe.
The main purpose of the committee is to:l assist the board in carrying out its responsibilities relating to
all compensation, including share-based compensation, of the Metair group executives;
l establish and administer the agreed Metair group executive remuneration policy with the broad objectives of:
– aligning executive remuneration with the group strategy; – aligning executive remuneration with group performance and
shareholder interests; – setting remuneration standards which attract, retain and
motivate a competent executive team; and – evaluating compensation of executives, including approval of
salary, share-based and other incentive-based awards.l review the trends and appropriateness of remuneration of
directors of subsidiary companies; andl act as a sub-committee for the board in terms of reviewing and
recommending subsidiary director appointments.
In addition to the above, the committee has the following responsibilities relating to its nominations function:l the committee shall make recommendations to the board on
the appointment of new executive directors at subsidiary level, including making recommendations on the composition of the board generally and the balance between executive and non-executive directors appointed to the board. All appointments to the board will be handled by the Metair board directly;
l ensure the establishment of a formal process for the appointment of subsidiary directors, including:
– identification of suitable members of the board; – performing reference and background checks of candidates
prior to nomination; and – formalising the appointment of directors through an agreement
between the company and the director; l in respect of the subsidiary companies, the committee: – regularly reviews the board structure, size and composition
and makes recommendations to the board with regards to any adjustments that are deemed necessary;
– ensures that formal succession plans for the board, managing director and senior management appointments are developed and implemented and are responsible for identifying and nominating candidates for the approval of the board to fill vacancies as and when they arise;
– oversees the development of a formal induction programme for new directors and ensures that inexperienced directors are developed through a mentorship programme as well as overseeing the development and implementation of continuing professional development programmes for directors;
– makes recommendations to the board for the continued (or not) service of any director who has reached the age of 70; and
– recommends directors that are retiring by rotation for re-election after considering their performance as directors.
Service contracts with executive directors are reviewed and renewed on an annual basis.
Two meetings were held during the year – in April and November 2014. The chairman reported to the board after each meeting.
Remuneration committee meeting attendance
16 apr 2014
3 Nov 2014
RS Broadley P P
L Soanes P P
A Joffe P P
P = Present
The next meetings are scheduled for May and November 2015.
JOb EVaLUaTIONDuring the year the company embarked on a job evaluation exercise grading all jobs throughout the group. The jobs were graded in terms of the Towers Watson Global Grading system, an internationally recognised system. A general staff pay-line with salary scales was compiled for the Metair South African operations, using global grades and market remuneration data from comparable jobs in the automotive industry. The pay-scales, reflected in Rand per annum, enable Metair to review the competitiveness of all general staff salaries, per company and group. Pay anomalies, i.e. actual pay outside the scales can be identified and rectified if necessary.
Hourly rated/weekly paid jobs are paid in terms of labour union agreements.
Remuneration for executive level jobs i.e. Global Grades 15 and upwards, is underpinned by Global Grades in combination with an EXSYS score which fine tunes the job size within each Global Grade for pay purposes. The market pay data is based on related job families with similar Global Grade/EXSYS scores.
This job evaluation exercise will be kept up to date and will be used as the base for all increases going forward.
REMUNERaTION POLICYThe remuneration policy is formulated to attract, retain, motivate and reward executive management who are able to influence the performance of Metair and its subsidiaries on a basis which aligns their interests with those of the group and its shareholders. It is based on the following principles:l Remuneration will be measured against the manufacturing
industry median taking into account the size and business complexity of subsidiaries for subsidiary director remuneration.

71METaIR 2014 INTEGRATED ANNUAL REPORT
aLL bUSINESS UNIT SaLaRIES VS PaY-SCaLE
1 410 000
1 210 000
1 010 000
810 000
610 000
410 000
210 000
10 000
Gua
rant
eed
sala
ry
3 4
– Min – Mid – Max Employees
5 6
Global grade
8 9 10 11 12 13 14 15
l Individual performance and the achievement of certain key performance measures will also be taken into account in determining executive remuneration.
l A market remuneration database will be used and updated every three years.
l Remuneration consists of a guaranteed portion (base pay) and a variable portion consisting of a short-term incentive plan (STIP) and a long-term incentive plan (LTIP).
The table below depicts the various components of total remuneration. Base pay is shown as 100% while the STIP and LTIP elements are reflected as a percentage of base pay.
REMUNERaTION STRaTEGYMetair recognises that the group’s reward strategy will have a direct impact on operational expenditure, group culture, employee behaviour and ultimately, with correct alignment, on the group’s ongoing strategic sustainability. Metair will reward its employees in a way that reflects the dynamics of the market and context in which it operates. All components of the group reward strategy, including fixed pay, variable pay and performance management, should be aligned to the strategic direction and business-specific value drivers of Metair and its subsidiaries.
EXECUTIVE MaNaGEMENT REMUNERaTIONExecutive remuneration consists of a guaranteed portion (base pay) and a variable portion consisting of a short-term incentive plan (STIP) and a long-term incentive plan (LTIP) and these elements are described below. Director service contracts are renewed on an annual basis. Refer to note 3 of the financial statements for details of executive director remuneration.
baSE PaYBase pay for executive management comprises an annual cash amount based on total cost to company.
SHORT-TERM INCENTIVE PLaN (STIP)Executive management participates in a short-term incentive programme, which is based on the achievement of various short-term financial and non-financial performance targets, including profit before interest and tax, profit after tax, return on equity, return on assets and B-BBEE targets. An additional item has been added for subsidiary companies being economic recovery targets. This is paid out annually and is calculated as a percentage of basic salary depending on the management level.
At the group level specific overperformance targets based on HEPS included the following:l Level 1 – 304 cpsl Level 2 – 324 cps
Management levelRemuneration
elements % weightingMetair MD Base pay 100
STIP1 20LTIP5 59
179Metair COO Base pay 100
STIP2 20LTIP5 53
173Metair FD Base pay 100
STIP2 20LTIP5 47
167MD of subsidiary Base pay 100
STIP3 24LTIP5 47
171 Directors of subsidiary Base pay 100
STIP4 18LTIP5 28
146Notes:1. Can increase to 100% for exceptional performance 2. Can increase to 70% for exceptional performance3. Can increase to 60% for exceptional performance4. Can increase to 50% for exceptional performance5. Depends on Metair share performance in terms of share appreciation
and an exceptional ROE

72 METaIR 2014 INTEGRATED ANNUAL REPORT
For details of performance bonuses paid, refer to note 3 in the financial statements.
The table at the bottom of the page indicates the level of relative percentages per performance criteria for the short-term incentive programme per management classification and is based on total cost to company.
LONG-TERM INCENTIVE PLaN (LTIP)The remuneration committee and shareholders approved The Metair Investments Ltd 2009 Share Plan (the plan), which replaced all previous long-term share incentive structures, which will be phased out in due course. Under the plan, executives, senior managers and/or key employees of the group will annually be offered a combination of share appreciation rights and performance shares. Bonus shares will in future be allocated purely on a discretional basis and will not be guaranteed.
The group’s long-term incentive target for performance shares are based on three year average return on equity measurements. Performance shares may be issued depending on levels of performance. The current targets are:l ROE at 16% = 0.5 times performance shares issuedl ROE at 20% = 1.0 times performance shares issuedl ROE at 20% – 24% will have a multiplier effect of one to three
times of performance shares issued.
Refer to note 14 in the financial statements for details of all awards/allocations and vesting. In terms of approval for the 2014
remuneration policy, the following awards/allocations were made in 2014 and will be presented for approval at the annual general meeting:
Share appreciation rightsallocation 1 allocation 2
Metair 56 996 322 225*Group executives
263 361 315 782
Total allocation
320 357 638 007
Allocation date
2 April 2014 26 November 2014
Allocation price
R42.77 R34.35
Vesting date From 3 April 2017 in three equal portions annually
From 26 November 2017 in three equal portions annually
* A special allocation of 250 000 share appreciation rights was made to Mr S Douwenga for retention purposes. Vesting will be from 26 November 2017 at 20% over five years.
Performance shares
Metair 32 987
Group executives 179 692
Total allocation 212 679
Award date 2 April 2014
Vesting date 3 April 2017
All the other awards/allocations and vesting in note 14 relate to previously approved allocations.
The purpose of the plan is in line with the remuneration policy to attract, retain, motivate and reward executives and managers who are able to influence the performance of the company and its subsidiaries on a basis which aligns their interest with those of the company’s shareowners.
The plan is in line with global best practice, and emerging South African practice, and serves to reward the required attributes of shareholder alignment, retention of key talent and long-term, sustained performance. The plan consists of three elements described below.
Share appreciation rights are an annual allocation of the right to a value equal to the appreciation of the share price with a three-year phased vesting period from the third year. The exercise horizon is a maximum of six years from allocation date.
Performance shares are an annual award with a three-year vesting period and vest to the extent that performance criteria are met.
STIP (%)
Element
Economic recovery PBIT/PAT/HEPS ROE/ROA
Transfor-mation Total Grand
TotalBudget Budget Target Budget Target Target Budget Target
Metair MD 20 50 20 10 20 80 100Metair FD and COO 20 30 10 10 20 50 70MDs 8 16 20 8 8 24 36 60Directors 6 12 20 6 6 18 32 50Exco 3 6 10 3 3 9 16 25
(CONTINUED)

73METaIR 2014 INTEGRATED ANNUAL REPORT
bonus shares are equivalent to cash awards earned by management and the vesting period is three years conditional on continued employment. Bonus shares will in future be allocated purely on a discretional basis and will not be guaranteed.
It is envisaged that the combined, weighted implementation of the above long-term incentive elements will allow the group to remain competitive in annual and share-based incentives, reward long-term sustainable group performance, act as a retention tool, and ensure that executives share a significant level of personal risk with the company’s shareholders.
The table below indicates the level of the relative percentages for the long-term incentive per management classification.
LTIP (%)
Element
Share appreciation rights (CTC)
Performance shares (CTC)
Expected Total (CTC)
Metair MD 40 19 59
Metair COO 36 17 53
Metair FD/MDs 32 15 47
Senior executive 17 11 28
Junior executive 12 10 22
In accordance with the recommendations of King III, we disclose below the remuneration of the top three executives of the group excluding the Metair holding company executives, details of which can be found in note 3 of the financial statements:
Executive emoluments (R’000)
Executive 1
Executive 2
Executive 3
Salaries and allowances 2 386 1 884 2 273
Performance bonuses 1 592 1 246 1 391
Pension and provident fund contributions
251 223 314
Company contributions 17 72 92
Gain on exercise of share options
6 008 5 936 4 532
Total 10 254 9 361 8 602
NON-EXECUTIVE MaNaGEMENT REMUNERaTIONNon-executive directors’ fees remained unchanged for the year, but will be presented for re-approval by shareholders’ at the next annual general meeting. Directors’ fees thus proposed for 2015 are as follows:
Metair board chairman R 340 000 per annumNon-executive directors R 215 000 per annumAudit and risk committee chairman R 36 000 per meetingAudit and risk committee member R 22 000 per meetingRemuneration committee chairman R 26 700 per meetingRemuneration committee member R 16 700 per meeting Social and ethics committee chairperson R 23 400 per meetingSocial and ethics committee member R 12 000 per meeting
Refer to note 3 in the financial statements for details on executive and non-executive director emoluments.

74 METaIR 2014 INTEGRATED ANNUAL REPORT
SHaREHOLDER ANALYSIS
aNNUaL REPORT SHaREHOLDER aNaLYSISCompany: Metair Investments LtdRegister date: 2 January 2015Issued share capital: 198 985 886
No. of shareholdings % No. of shares %SHaREHOLDER SPREaD
1 – 1 000 shares 1 208 42.69 577 924 0.291 001 – 10 000 shares 1 078 38.09 3 870 731 1.9510 001 – 100 000 shares 357 12.61 11 753 662 5.91100 001 – 1 000 000 shares 156 5.51 53 335 260 26.801 000 001 shares and over 31 1.10 129 448 309 65.05
Totals 2 830 100.00 198 985 886 100.00DISTRIbUTION OF SHaREHOLDERS
Banks/brokers 47 1.66 32 153 750 16.16Close corporations 38 1.34 397 661 0.20Endowment funds 37 1.31 1 185 751 0.60Individuals 1 945 68.73 7 472 800 3.76Insurance companies 34 1.20 3 656 416 1.84Investment companies 3 0.11 2 159 027 1.09Medical schemes 12 0.42 545 362 0.27Mutual funds 172 6.08 69 005 231 34.68Nominees and trusts 277 9.79 28 201 429 14.17Other corporations 17 0.60 71 140 0.04Private companies 71 2.51 3 678 420 1.85Public companies 4 0.14 231 311 0.12Retirement funds 172 6.08 48 119 276 24.18Treasury stock 1 0.04 2 108 312 1.06
Totals 2 830 100.00 198 985 886 100.00PUbLIC/NON-PUbLIC SHaREHOLDERSNon – Public Shareholders 10 0.23 75 013 199 37.70Directors and associates of the company
2 0.07 2 167 506 1.09
Treasury stock 1 0.06 2 108 312 1.06Strategic holders of more than 10%
6 0.06 45 833 812 23.03
Royal Bafokeng Metair Trust
1 0.04 24 903 569 12.52
Public shareholders 2 820 99.77 123 972 687 62.30Totals 2 830 100.00 198 985 886 100.00Beneficial shareholders holding 3% or moreGovernment Employees Pension Fund
25 833 812 12.98
Royal Bafokeng Metair Trust
24 903 569 12.52
Berkeley Private Wealth Ltd
20 000 000 10.05
Investment Solutions 14 283 179 7.18Foord 10 950 751 5.50Investec 8 831 901 4.4436ONE Asset Management 7 896 582 3.97Totals 112 699 794 56.64
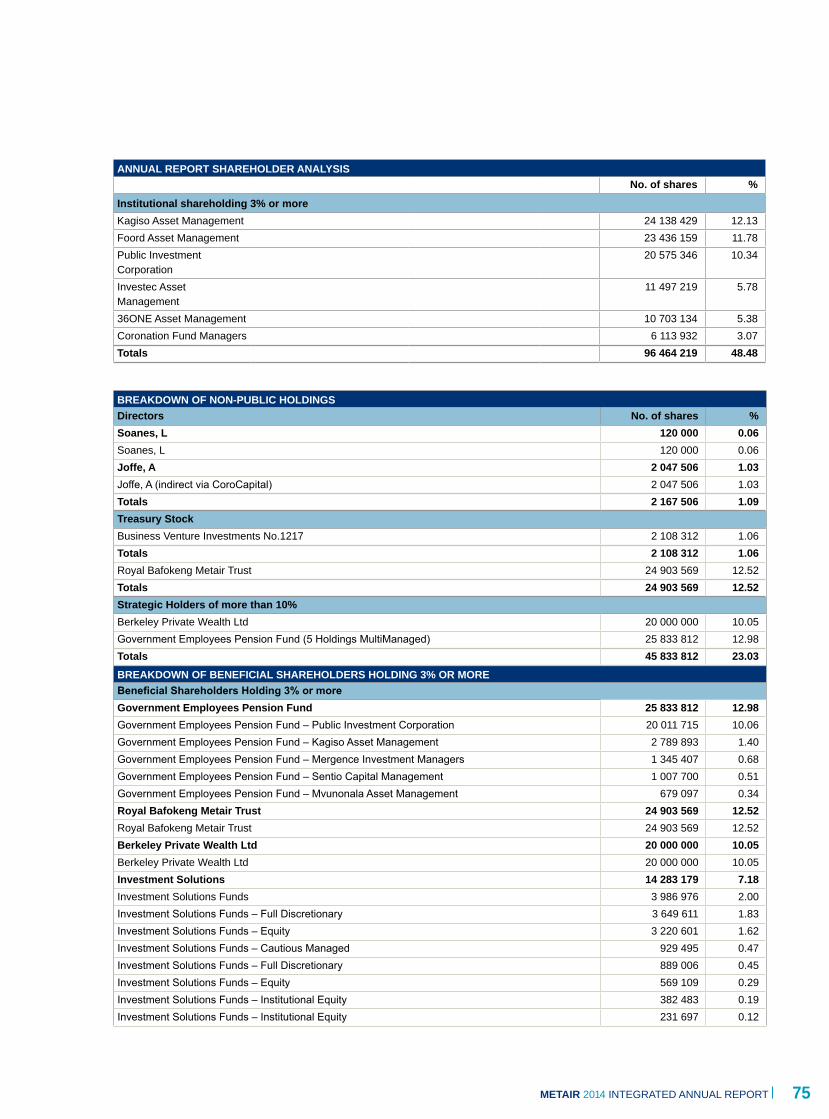
75METaIR 2014 INTEGRATED ANNUAL REPORT
aNNUaL REPORT SHaREHOLDER aNaLYSISNo. of shares %
Institutional shareholding 3% or moreKagiso Asset Management 24 138 429 12.13Foord Asset Management 23 436 159 11.78Public Investment Corporation
20 575 346 10.34
Investec Asset Management
11 497 219 5.78
36ONE Asset Management 10 703 134 5.38Coronation Fund Managers 6 113 932 3.07Totals 96 464 219 48.48
bREaKDOWN OF NON-PUbLIC HOLDINGSDirectors No. of shares %Soanes, L 120 000 0.06Soanes, L 120 000 0.06Joffe, a 2 047 506 1.03Joffe, A (indirect via CoroCapital) 2 047 506 1.03Totals 2 167 506 1.09Treasury StockBusiness Venture Investments No.1217 2 108 312 1.06Totals 2 108 312 1.06Royal Bafokeng Metair Trust 24 903 569 12.52Totals 24 903 569 12.52Strategic Holders of more than 10%Berkeley Private Wealth Ltd 20 000 000 10.05Government Employees Pension Fund (5 Holdings MultiManaged) 25 833 812 12.98Totals 45 833 812 23.03bREaKDOWN OF bENEFICIaL SHaREHOLDERS HOLDING 3% OR MOREBeneficial Shareholders Holding 3% or moreGovernment Employees Pension Fund 25 833 812 12.98Government Employees Pension Fund – Public Investment Corporation 20 011 715 10.06Government Employees Pension Fund – Kagiso Asset Management 2 789 893 1.40Government Employees Pension Fund – Mergence Investment Managers 1 345 407 0.68Government Employees Pension Fund – Sentio Capital Management 1 007 700 0.51Government Employees Pension Fund – Mvunonala Asset Management 679 097 0.34Royal bafokeng Metair Trust 24 903 569 12.52Royal Bafokeng Metair Trust 24 903 569 12.52berkeley Private Wealth Ltd 20 000 000 10.05Berkeley Private Wealth Ltd 20 000 000 10.05Investment Solutions 14 283 179 7.18Investment Solutions Funds 3 986 976 2.00Investment Solutions Funds – Full Discretionary 3 649 611 1.83Investment Solutions Funds – Equity 3 220 601 1.62Investment Solutions Funds – Cautious Managed 929 495 0.47Investment Solutions Funds – Full Discretionary 889 006 0.45Investment Solutions Funds – Equity 569 109 0.29Investment Solutions Funds – Institutional Equity 382 483 0.19Investment Solutions Funds – Institutional Equity 231 697 0.12

76 METAIR 2014 INTEGRATED ANNUAL REPORT
SHAREHOLDER ANALYSISCONTINUED
BREAKDOWN OF NON-PUBLIC HOLDINGSBREAKDOWN OF BENEFICIAL SHAREHOLDERS HOLDING 3% OR MOREBeneficial Shareholders Holding 3% or more No. of shares %Investment Solutions Funds – Life Equity 122 257 0.06Investment Solutions Funds – Aggressive Equity 98 067 0.05Investment Solutions Funds – Performer Balanced 63 510 0.03Investments Solution Real Return Focus Fund 58 670 0.03Investment Solutions Funds – Institutional Equity 47 481 0.02Investment Solutions Funds – Institutional Equity 17 421 0.01Investment Solutions Funds – SWIX ALSU Tracker 9 506 0.00Investment Solutions Funds – Real Return Medical Aid 4 662 0.00Investment Solution Real Return Focus Fund 2 627 0.00Foord 10 950 751 5.50Foord Equity Fund 5 109 966 2.57Foord Balanced Fund 4 486 567 2.25Foord Absolute Return Fund 985 790 0.50Foord Domestic Balanced Fund 368 428 0.19Investec 8 831 901 4.44Investec Cautious Managed Fund 2 940 802 1.48Investec Emerging Companies Fund 2 824 060 1.42Investec Special Focus Fund 1 453 147 0.73Investec Absolute Balanced Fund 950 018 0.48Investec Equity Fund 532 535 0.27Investec Balanced Fund 121 760 0.06IAL SA Equity Fund 9 579 0.0036ONE Asset Management 7 896 582 3.9736ONE Hedge Fund 3 674 511 1.8536ONE Flexible Opportunity Fund 1 701 968 0.8636ONE Target Return Fund 1 100 000 0.5536One Offshore Master Lp 1 050 484 0.5336ONE Fund 369 619 0.19Totals 86 865 982 43.65
The GRI statement can be found on Metair’s website – www.metair.co.za.
77METaIR 2014 INTEGRATED ANNUAL REPORT
INDEPENDENT ASSURANCE STATEMENTTO THE BOARD AND STAKEHOLDERS OF METAIR INVESTMENTS LIMITED (METAIR)
Integrated Reporting & Assurance Services (IRAS) was commissioned by Metair to provide independent third-party assurance (ITPA) over the sustainability content within the 2014 Integrated Annual Report (hereafter, referred to as the report), covering the period 1 January to 31 December 2014. The assurance team consisted of Michael H. Rea, our Lead Certified Sustainability Assurance Practitioner, with more than 16 years’ experience in environmental and social performance measurement, including sustainability reporting and assurance, and our team of junior associates.
aCCOUNTabILITY aa1000S (REVISED, 2008)To the best of our ability, this assurance engagement has been managed in accordance with AccountAbility’s AA1000AS (2008) assurance standard, where the format of the engagement was structured to meet the AA1000AS Type II (Moderate) requirements.
INDEPENDENCEIRAS was not responsible for the preparation of any part of the Report and has not undertaken any commissions for Metair in the reporting period. IRAS has, however, conducted assurance engagements for Metair’s 2011 and 2012 Reports (AA1000AS Type I in both cases), including the identification of reporting gaps that ultimately have been incorporated into their reporting processes. However, this work has not compromised our ability to afford ITPA over this year’s Report. IRAS’s responsibility in performing its assurance activities is to the management of Metair alone and in accordance with the terms of reference agreed with them.
aSSURaNCE ObJECTIVES The objectives of the assurance process were to provide Metair’s stakeholders an independent ‘moderate level assurance’ opinion on whether the report meets the AA1000AS (2008) principles of Inclusivity, Materiality and Responsiveness, as well as to assess the degree to which the Report is consistent with the Global Reporting Initiative (GRI) G4 guidelines, with the objective of establishing whether or not the Report has met the Core level of reporting requirements. In meeting the Type II assurance objectives, IRAS undertook a review of selected sustainability performance indicators at the following Metair operational sites: to Hesto Harnesses, Smiths Plastics and First National Battery.
SCOPE OF WORK PERFORMEDaa1000aS (2008) ComplianceThe process used in arriving at this assurance statement is based on AccountAbility’s AA1000AS (2008) guidance, as well as other best practices in assurance. Our approach to assurance included the following:l A review of sustainability measurement and reporting procedures
at Metair’s head offices, via management interviews with the reporting team, as well as through desktop research;
l A review of data collection, collation and reporting procedures at the selected operational sites, with specific reference to the following selected sustainability performance indicators:
1. Total number of person hours worked (PHW) for all employees and contractors.
2. Fatal Injury Frequency Rate (FIFR), calculated as the total number of fatal injuries (FIs) per 200 000 PHW – for employees and contractors.
3. Lost Time Injury Frequency Rate (LTIFR), calculated as the total number of lost time injuries (LTIs) per 200 000 PHW – for employees and contractors
4. Total Injury Frequency Rate (TIFR), calculated as the total number of injuries – inclusive of FIs, LTIs, Medical Treatment Cases (MTCs) and First Aid Cases (FACs) per 200 000 PHW – for employees and contractors
5. Total direct and indirect consumption of electricity for primary purposes
6. Total direct and indirect consumption of petrol for primary purposes
7. Total direct and indirect consumption of diesel for primary purposes
8. Total volume of water consumed – from all sources (i.e., municipal servers, boreholes, etc.) – for primary purposes
9. Total volume of generated non-hazardous waste sent to landfill 10. Total volume of generated non-hazardous waste sent for
recycling 11. Number of persons – excluding non-executive directors
– who are classified as Historically Disadvantaged South Africans (HDSA) in management positions
12. Number of women in management positions – excluding non-executive directors
13. Total number of person days lost due to all forms of absenteeism (i.e., sick, abscond, etc.), including formal/annual leave.
14. Total Rand value of Corporate Social Investment (CSI)/Socio-economic development (SED) Spend.
15. Presence and application of policies, procedures, systems and controls to ensure CSI/SED Monitoring and Evaluation (M&E) is applied to measure the developmental impacts of projects.
l Reviews of drafts of the Report for any significant errors and/or anomalies; and,
l A series of interviews with the individuals responsible for collating and writing various parts of the Report in order to ensure selected claims were reported and substantiated.
It should be noted that due to the scope and nature of this AA1000AS (Type II, Moderate) assurance engagement, the site visits were designed to test the authenticity of data at the primary source of collection and collation, and this report has been assessed at the point of data aggregation for accuracy of reporting.
GRI COMPLIaNCEIn determining the GRI G4 ‘Core Level’ of the Report, we performed the following exercises:l A review of the process used to define the content of the Report
by looking at materiality of issues included in the Report, stakeholder engagement response to stakeholder issues identified, determination of sustainability context and coverage of material issues;
l A review of the approach of management to addressing topics discussed in the Report; and
l A confirmation that the requisite number of performance indicators had been covered in the Report.
FINDINGSIn general, Metair’s sustainability reporting processes are adequate, and it was noted that:
aa1000aS (Type II)l The content of the Report does not differ, in any significant
way, from an analysis of the material issues discussed within
78 METaIR 2014 INTEGRATED ANNUAL REPORT
INDEPENDENT ASSURANCE STATEMENTTO THE BOARD AND STAKEHOLDERS OF METAIR INVESTMENTS LIMITED (METAIR)CONTINUED
Metair, or within its sphere of influence, as per our internal and external materiality scans.
l Metair is developing and refining systems for data collection, collation and reporting, at both the operation and group level, and appear to be in a constant state of continuous improvement through the development and implementation of enhanced sustainability data policies, procedures, systems and controls. While the ongoing reliance on multiple Excel spreadsheets to collect, collate and report data will create opportunities for simple data transcription errors – affecting the accuracy and/or reliability of some data at some collection points at the sites – procedures appear to be improving to address these potential problems.
l Aside from the following exceptions, the tested site-specific data was found to be reasonably accurate and/or reliable, although process improvements at some sites may still be required with respect to the implementation of internal control procedures for data accuracy and reliability. Exceptions:
– Systems to collect and collate Contractor Hours Worked were inadequate to provide ‘actual data’, leading to the potential for over-reporting injury frequency rates, and thus decreasing the comparability of this data within Metair and against other companies.
– A lack of consistent application of group-wide occupational health & safety definitions has led to the incomplete reporting of work-related injuries among contractors, while resulting in significant over-reporting of First Aid Case injuries as Medical Treatment Cases and/or allowing for the over-prescription of time off due to injury, thus resulting in non-serious injuries frequently recorded as Lost Time Injuries.
– Despite the above, it should be noted that Metair’s overall safety performance – as measured by Lost Time Injury Frequency Rate (LTIFR) – is well below industry and national norms.
– Waste management systems and controls (waste separation and recycling) are in place at all operations, but opportunities for improved waste separation and recycling were identified.
– While CSI/SED Spend data is accurately reported, more could be done to ensure that all significant community projects are structured in such a way as to track the developmental outcomes of Metair’s projects.
l As per management assertions, Metair engages key stakeholders, as defined within this Report, based on the evidence reviewed.
l Within the parameters of a ‘Moderate Level Type II assurance assessment’, the Report reasonably reflects an accurate accounting of Metair’s performance, including the review of data supplied by the team (excluding those indicators mentioned above) at the selected sites.
GRI G4 (CORE) l Based on our review of the Report, as well as the processes
employed to collect and collate information reported herein, it is our assertion that this Report meets the GRI G4 requirements for the Core level of application. However, the reporting of performance against some GRI G4 indicators continues to require either data quality improvements, or further detail in disclosure.
RECOMMENDaTIONSaa1000aS (Type II)l Metair should continue to improve its sustainability policies,
procedures systems and controls – particularly with respect to the enhancement of group definitions and reporting guidance,
for Health & Safety and Waste Management, inclusive of target setting – to ensure that best practices within the group can be shared between operations for overall group-level improvement.
l Metair should ensure that improvement continues to occur with respect to stakeholder engagement procedures, including an independent assessment of whether or not this Report, and all future Reports, adequately reflects the reporting requirements of key stakeholders.
l With respect to the findings identified above, for the selected sustainability indicators reviewed, Metair should ensure the following recommendations are duly considered:
– PHW and injury data ought to be recorded and reported for not only Metair personnel, but also for employees of all significant contractors.
– All injuries – inclusive of first aid cases (FACs) – should be duly reported in order to ensure that safety risks are pro-actively identified and managed before more serious injuries occur (inclusive of within contractor activities).
– Metair should ensure that Group sustainability indicator definitions are duly refined and rolled out to all operations to ensure that there is a consistency of reporting on all required data indicators.
– Metair should ensure that Group CSI/SED guidance is enhanced to provide greater guidance on how to report against baseline key performance indicators, beyond whether or not budgets are managed effectively (i.e., on-time, on budget, as per project commitments).
– Metair should ensure that an additional layer or control is implemented for the reporting of all sustainability data, to increase the reliability of all data submitted for Group consolidation.
l Metair should continue to employ a sustainability reporting cycle that accommodates for AA1000AS (Type II) assurance over key sustainability performance data at selected sites (3 per annum). At bare minimum, this should include an overhaul of guidance around reporting definitions, to ensure that data submitted by all sites is both consistent and comparable.
GRI G4l Having addressed the requirements of GRI G4 Core level of
application, it is our recommendation that Metair continue to make further improvements on the quality of data included in future reports, while continuing to apply the GRI’s G4 Guidelines (at the Core level).
CONCLUSIONSBased on the information reviewed, IRAS is confident that this Report provides a comprehensive and balanced account of the environmental, safety and social performance of Metair during the period under review. The data presented is based on a systematic process and we are satisfied that, aside from the exceptions stated above, the reported performance data accurately represents the current environmental, safety and social performance of Metair, while meeting the AA1000AS (2008) principles of Inclusivity, Materiality and Responsiveness. Moreover, and although the quality or quantity of data of some GRI G4 indicators can be improved, this Report – inclusive of the supplemental GRI Content Index (available via Metair’s website) – appears to meet the GRI G4 requirements for Core Level of application.
Integrated Reporting & Assurance Services (IRAS)Johannesburg25 March 2015
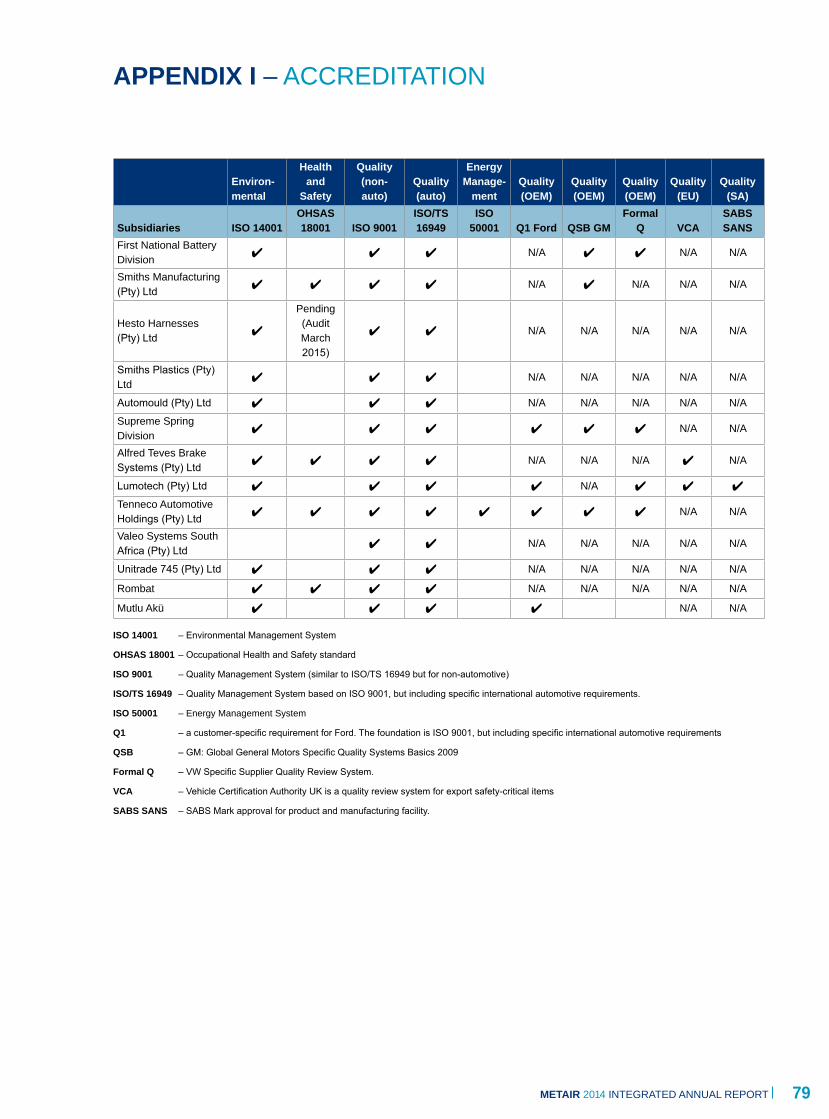
79METaIR 2014 INTEGRATED ANNUAL REPORT
Environ-mental
Health and
Safety
Quality (non-auto)
Quality (auto)
Energy Manage-
mentQuality (OEM)
Quality (OEM)
Quality (OEM)
Quality (EU)
Quality (Sa)
Subsidiaries ISO 14001OHSaS 18001 ISO 9001
ISO/TS 16949
ISO 50001 Q1 Ford QSb GM
Formal Q VCa
SabS SaNS
First National Battery Division 4 4 4 N/A 4 4 N/A N/A
Smiths Manufacturing (Pty) Ltd 4 4 4 4 N/A 4 N/A N/A N/A
Hesto Harnesses (Pty) Ltd 4
Pending (Audit March 2015)
4 4 N/A N/A N/A N/A N/A
Smiths Plastics (Pty) Ltd 4 4 4 N/A N/A N/A N/A N/A
Automould (Pty) Ltd 4 4 4 N/A N/A N/A N/A N/A
Supreme Spring Division 4 4 4 4 4 4 N/A N/A
Alfred Teves Brake Systems (Pty) Ltd 4 4 4 4 N/A N/A N/A 4 N/A
Lumotech (Pty) Ltd 4 4 4 4 N/A 4 4 4
Tenneco Automotive Holdings (Pty) Ltd 4 4 4 4 4 4 4 4 N/A N/A
Valeo Systems South Africa (Pty) Ltd
4 4 N/A N/A N/A N/A N/A
Unitrade 745 (Pty) Ltd 4 4 4 N/A N/A N/A N/A N/A
Rombat 4 4 4 4 N/A N/A N/A N/A N/A
Mutlu Akü 4 4 4 4 N/A N/A
ISO 14001 – Environmental Management System
OHSaS 18001 – Occupational Health and Safety standard
ISO 9001 – Quality Management System (similar to ISO/TS 16949 but for non-automotive)
ISO/TS 16949 – Quality Management System based on ISO 9001, but including specific international automotive requirements.
ISO 50001 – Energy Management System
Q1 – a customer-specific requirement for Ford. The foundation is ISO 9001, but including specific international automotive requirements
QSb – GM: Global General Motors Specific Quality Systems Basics 2009
Formal Q – VW Specific Supplier Quality Review System.
VCa – Vehicle Certification Authority UK is a quality review system for export safety-critical items
SabS SaNS – SABS Mark approval for product and manufacturing facility.
aPPENDIX I – ACCREDITATION

80 METaIR 2014 INTEGRATED ANNUAL REPORT
aPPENDIX II – B-BBEE SCORECARD
Date of latest verified scorecard 30/09/14 13/01/14 17/08/14 27/05/14 15/08/14 25/11/14 20/03/14 14/07/14 30/10/14
b-bbEE ELEMENTS
SmithsPlastics
SmithsManufac-
turingLumo-
tech Supreme Hesto Unitrade FNbauto-
mould aTEGroup
totalOwnership 23 20.59 20.35 22.49 20.59 20.59 20.59 20.59 20.59 20.59 186.97
Management control 11 6.6 3.65 0 2.69 3.75 10.00 2.67 5 4.85 39.21
Employment equity 18 9.69 7.11 8.99 5.45 13.79 15.83 3.02 8.51 3.21 75.60
Skills development 15 0.44 9.25 12.23 9.66 9.55 12.07 10.57 12.00 12.00 87.77
Preferential procurement
20 15.05 19.77 13.61 17.02 13.57 15.4 18.16 16.47 15.00 144.05
Enterprise development
15 15.00 15.00 15.00 15.00 15.00 3.66 15.00 9.30 15.00 117.96
Socio-Economic development
5 3.65 4.90 5.00 5.00 5.00 4.34 5.00 5.00 4.47 42.36
TOTaL 71.02 80.03 77.32 75.41 81.25 81.89 75.01 76.87 75.12 693.92
Level contributor 4 3 3 3 3 3 3 3 3

81METaIR 2014 INTEGRATED ANNUAL REPORT
aPPENDIX III – SUSTAINABILITY DATA TABLE
Metair – 2014 Sustainability Data Table 2014 2013 2012LabourTotal number of permanent employees Number 6 607 6457 6223Total number of temporary employees Number 655 N/R N/RTotal number of contractors Number 589 155 255Total employees 7 851 6 612 6 478Percentage of employees who are deemed ‘HDSA’ (South Africa only) % 92.0% 90.0% 89.5%Percentage of employees who are women % 31.4% 35.1% 34.4% Percentage of employees who are permanent % 84.2% 97.7% 96.1%Percentage of employees who belong to a trade union % 67.3% 79.1% 67.8Total number of employee terminations Number 1 399 771 877Employee turnover rate % 19.3% 6.4% N/RTotal number of person hours worked – all employees and contractors 15 733 797 11 832 172 N/RTotal number of person days lost due to absenteeism Number 59 105 N/R N/RAbsenteeism rate % 3.0% 3.4% 1.7%Total number of person days lost due to industrial action Number 0 65 272 N/RIndustrial action rate % 0% 0.6% N/RTotal number of employees trained Number 5 021 5 396 N/RTotal number of training interventions Number 16 834 N/R N/RRand value of employee training spend R (million) 13.6 9.9 11.0Rand value of research and development spend R (million) 22.5 31.6 N/RHealth and safetyTotal number of fatalities – all employees and contractors Number 0 0 0Total number of lost time injuries – all employees and contractors Number 145 66 160Total number of medical treatment cases – all employees and contractors
Number 146 116 N/R
Total number of first aid cases – all employees and contractors Number 389 N/R N/RTotal number of recordable injuries – all employees and contractors Number 291 182 N/RFatal injury frequency rate – all employees and contractors Rate 0.00 0.00 0.00Lost time injury frequency rate – all employees and contractors Rate 1.84 1.12 3.82Total recordable injury frequency rate – all employees and contractors Rate 3.69 3.08 N/RTotal number of employees and contractors receiving Voluntary Counselling and Testing (VCT) for HIV/Aids (i.e. counselled)
Number 1 002 433 N/R
Total number of employees and contractors tested for HIV/Aids Number 972 433 N/REnvironmentalFlightsTotal number of flights taken for business purposes Number 3 276 N/R N/RWaterTotal water consumption m3 530 386 468 285 360 177Total volume of water discharged m3 1 769 450 N/R N/R
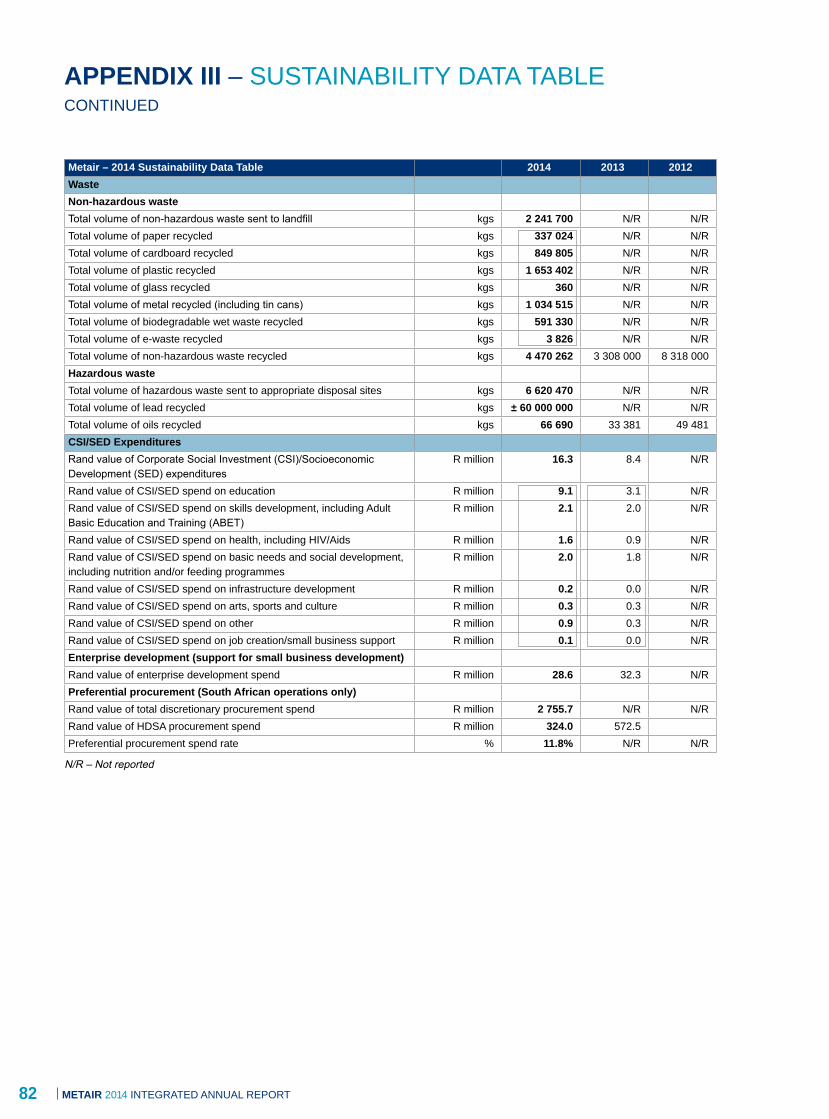
82 METaIR 2014 INTEGRATED ANNUAL REPORT
aPPENDIX III – SUSTAINABILITY DATA TABLECONTINUED
Metair – 2014 Sustainability Data Table 2014 2013 2012WasteNon-hazardous wasteTotal volume of non-hazardous waste sent to landfill kgs 2 241 700 N/R N/RTotal volume of paper recycled kgs 337 024 N/R N/RTotal volume of cardboard recycled kgs 849 805 N/R N/RTotal volume of plastic recycled kgs 1 653 402 N/R N/RTotal volume of glass recycled kgs 360 N/R N/RTotal volume of metal recycled (including tin cans) kgs 1 034 515 N/R N/RTotal volume of biodegradable wet waste recycled kgs 591 330 N/R N/RTotal volume of e-waste recycled kgs 3 826 N/R N/RTotal volume of non-hazardous waste recycled kgs 4 470 262 3 308 000 8 318 000 Hazardous wasteTotal volume of hazardous waste sent to appropriate disposal sites kgs 6 620 470 N/R N/RTotal volume of lead recycled kgs ± 60 000 000 N/R N/RTotal volume of oils recycled kgs 66 690 33 381 49 481CSI/SED ExpendituresRand value of Corporate Social Investment (CSI)/Socioeconomic Development (SED) expenditures
R million 16.3 8.4 N/R
Rand value of CSI/SED spend on education R million 9.1 3.1 N/RRand value of CSI/SED spend on skills development, including Adult Basic Education and Training (ABET)
R million 2.1 2.0 N/R
Rand value of CSI/SED spend on health, including HIV/Aids R million 1.6 0.9 N/RRand value of CSI/SED spend on basic needs and social development, including nutrition and/or feeding programmes
R million 2.0 1.8 N/R
Rand value of CSI/SED spend on infrastructure development R million 0.2 0.0 N/RRand value of CSI/SED spend on arts, sports and culture R million 0.3 0.3 N/RRand value of CSI/SED spend on other R million 0.9 0.3 N/RRand value of CSI/SED spend on job creation/small business support R million 0.1 0.0 N/REnterprise development (support for small business development)Rand value of enterprise development spend R million 28.6 32.3 N/RPreferential procurement (South african operations only)Rand value of total discretionary procurement spend R million 2 755.7 N/R N/RRand value of HDSA procurement spend R million 324.0 572.5Preferential procurement spend rate % 11.8% N/R N/R
N/R – Not reported

83METaIR 2014 INTEGRATED ANNUAL REPORT
aPPENDIX IV – HUMAN CAPITAL
Total headcount Male Female TotalSouth africa Permanent 3 388 1 908 5 296 Temporary 216 279 495 Contractors 362 219 581Total 3 966 2 406 6 372Romania Permanent 616 92 708 Temporary ContractorsTotal 616 92 708Turkey Permanent 603 603 Temporary 160 160 Contractors 8 8Total 771 771
Total 5 353 2 498 7 851
New employee hiresMale Female Total Male Female
< 30y 489 753 1 242South Africa 872 1 598
30 – 50y 439 796 1 235 Romania 87 6> 50y 72 55 127 Turkey 41Total 1 000 1 604 2 604 Total 1 000 1 604
y – years
TerminationsMale Female Total Male Female
< 30y 238 422 660South Africa 531 710
30 – 50y 319 261 580 Romania 85 5> 50y 127 32 159 Turkey 68Total 684 715 1 399 Total 684 715
y – years
Safety statisticsMale Female Total South
africaRomania Turkey
Contractors only Injury rate* 1.87 0.41 1.31 1.20 11.57#
Occupational disease rate** Lost-time injury frequency rate*** 0.19 0.12 0.12all employees and contractors Injury rate* 11.45 4.59 8.61 9.61 0.88 5.71 Occupational disease rate** 0.02 0.01 0.13 Lost-time injury frequency rate*** 2.55 0.74 1.84 2.00 0.88 1.20 Absentee rate 3.4% 2.8% 3.0% 2.6% 6.0% 4.6%
* Total lost-time injuries, medical treatment cases and first aid cases per 200 000 person hours worked.** Occupational disease incidence per 200 000 person hours worked.*** Lost-time injuries per 200 000 person hours worked.# Mutlu employed eight contractors during 2014, one of whom had a medical treatment case. The small number of contractors employed distorts the
reported ratio. Types of workplace injuries include soft tissue injuries, burns, cuts, back injuries, fractures, sprains, chemical burns, bruising and abrasions.
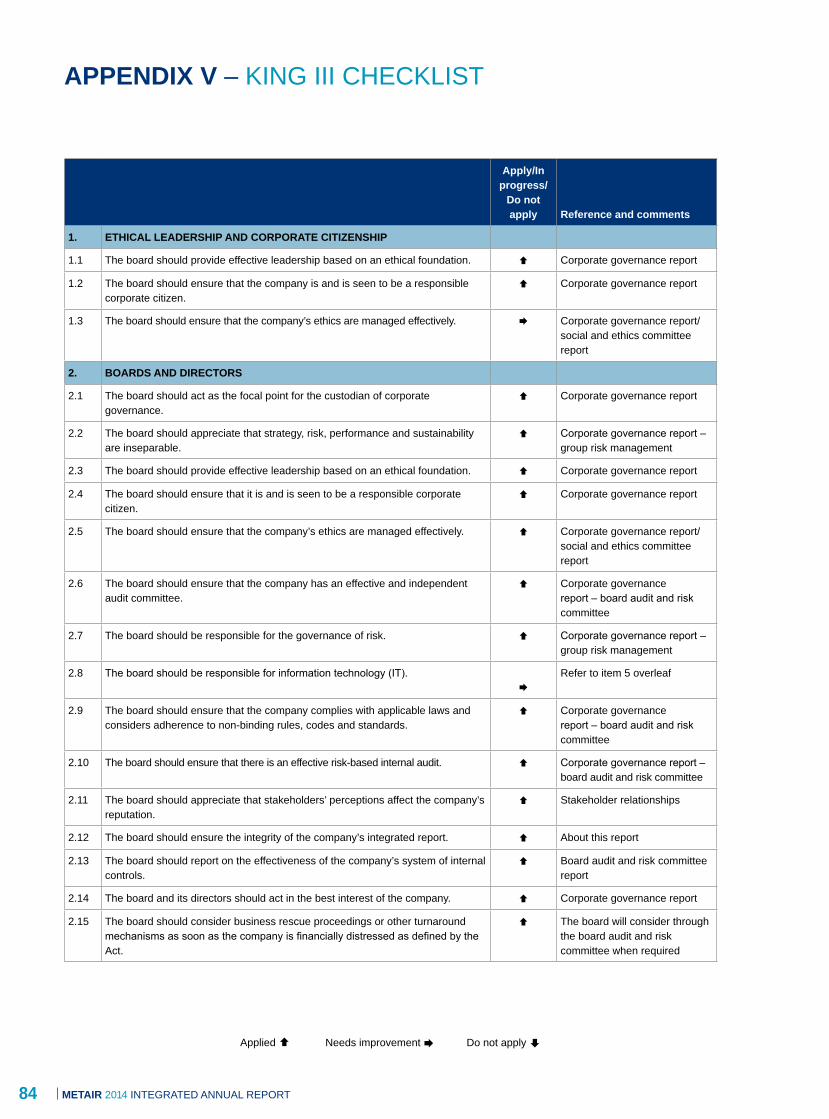
84 METaIR 2014 INTEGRATED ANNUAL REPORT
aPPENDIX V – KING III CHECKLIST
apply/In progress/
Do not apply Reference and comments
1. ETHICaL LEaDERSHIP aND CORPORaTE CITIZENSHIP
1.1 The board should provide effective leadership based on an ethical foundation. Ç Corporate governance report
1.2 The board should ensure that the company is and is seen to be a responsible corporate citizen.
Ç Corporate governance report
1.3 The board should ensure that the company’s ethics are managed effectively. Æ Corporate governance report/social and ethics committee report
2. bOaRDS aND DIRECTORS
2.1 The board should act as the focal point for the custodian of corporate governance.
Ç Corporate governance report
2.2 The board should appreciate that strategy, risk, performance and sustainability are inseparable.
Ç Corporate governance report – group risk management
2.3 The board should provide effective leadership based on an ethical foundation. Ç Corporate governance report
2.4 The board should ensure that it is and is seen to be a responsible corporate citizen.
Ç Corporate governance report
2.5 The board should ensure that the company’s ethics are managed effectively. Ç Corporate governance report/social and ethics committee report
2.6 The board should ensure that the company has an effective and independent audit committee.
Ç Corporate governancereport – board audit and risk committee
2.7 The board should be responsible for the governance of risk. Ç Corporate governance report – group risk management
2.8 The board should be responsible for information technology (IT).Æ
Refer to item 5 overleaf
2.9 The board should ensure that the company complies with applicable laws and considers adherence to non-binding rules, codes and standards.
Ç Corporate governancereport – board audit and risk committee
2.10 The board should ensure that there is an effective risk-based internal audit. Ç Corporate governance report – board audit and risk committee
2.11 The board should appreciate that stakeholders’ perceptions affect the company’s reputation.
Ç Stakeholder relationships
2.12 The board should ensure the integrity of the company’s integrated report. Ç About this report
2.13 The board should report on the effectiveness of the company’s system of internal controls.
Ç Board audit and risk committee report
2.14 The board and its directors should act in the best interest of the company. Ç Corporate governance report
2.15 The board should consider business rescue proceedings or other turnaround mechanisms as soon as the company is financially distressed as defined by the Act.
Ç The board will consider through the board audit and risk committee when required
Applied Ç Needs improvement Æ Do not apply È
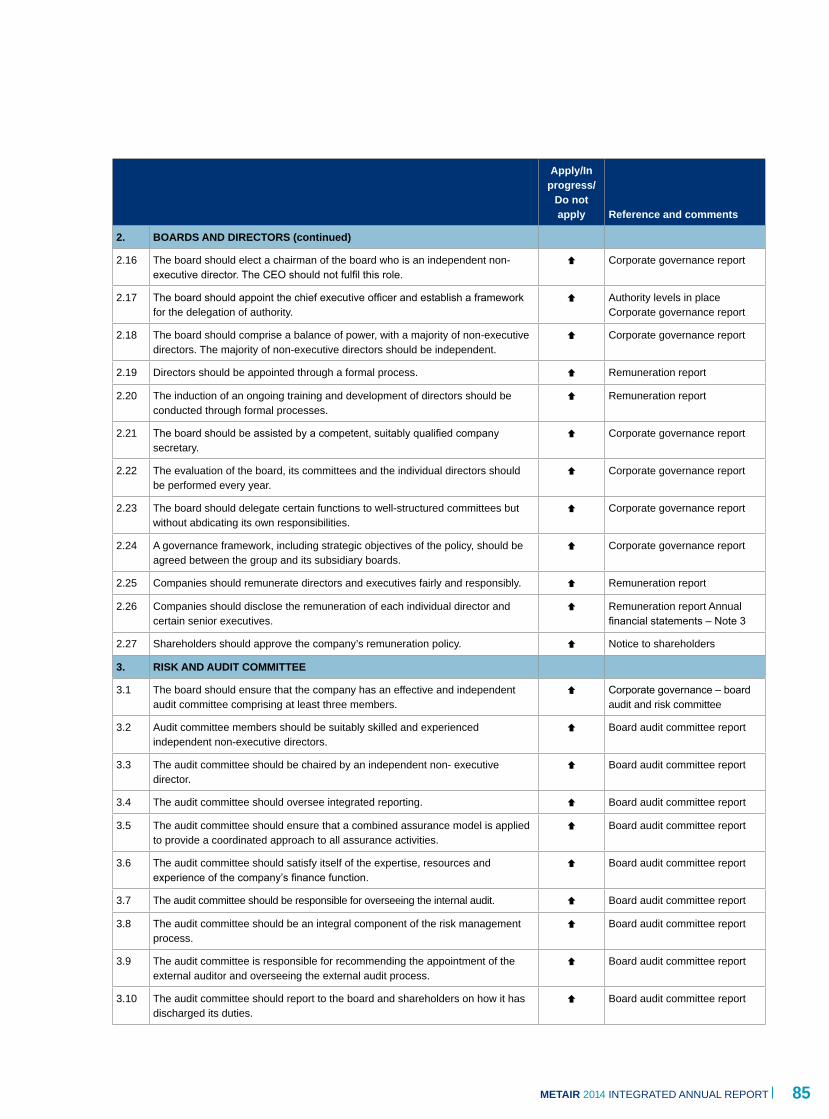
85METaIR 2014 INTEGRATED ANNUAL REPORT
apply/In progress/
Do not apply Reference and comments
2. bOaRDS aND DIRECTORS (continued)
2.16 The board should elect a chairman of the board who is an independent non-executive director. The CEO should not fulfil this role.
Ç Corporate governance report
2.17 The board should appoint the chief executive officer and establish a framework for the delegation of authority.
Ç Authority levels in place Corporate governance report
2.18 The board should comprise a balance of power, with a majority of non-executive directors. The majority of non-executive directors should be independent.
Ç Corporate governance report
2.19 Directors should be appointed through a formal process. Ç Remuneration report
2.20 The induction of an ongoing training and development of directors should be conducted through formal processes.
Ç Remuneration report
2.21 The board should be assisted by a competent, suitably qualified company secretary.
Ç Corporate governance report
2.22 The evaluation of the board, its committees and the individual directors should be performed every year.
Ç Corporate governance report
2.23 The board should delegate certain functions to well-structured committees but without abdicating its own responsibilities.
Ç Corporate governance report
2.24 A governance framework, including strategic objectives of the policy, should be agreed between the group and its subsidiary boards.
Ç Corporate governance report
2.25 Companies should remunerate directors and executives fairly and responsibly. Ç Remuneration report
2.26 Companies should disclose the remuneration of each individual director and certain senior executives.
Ç Remuneration report Annual financial statements – Note 3
2.27 Shareholders should approve the company’s remuneration policy. Ç Notice to shareholders
3. RISK aND aUDIT COMMITTEE
3.1 The board should ensure that the company has an effective and independent audit committee comprising at least three members.
Ç Corporate governance – board audit and risk committee
3.2 Audit committee members should be suitably skilled and experienced independent non-executive directors.
Ç Board audit committee report
3.3 The audit committee should be chaired by an independent non- executive director.
Ç Board audit committee report
3.4 The audit committee should oversee integrated reporting. Ç Board audit committee report
3.5 The audit committee should ensure that a combined assurance model is applied to provide a coordinated approach to all assurance activities.
Ç Board audit committee report
3.6 The audit committee should satisfy itself of the expertise, resources and experience of the company’s finance function.
Ç Board audit committee report
3.7 The audit committee should be responsible for overseeing the internal audit. Ç Board audit committee report
3.8 The audit committee should be an integral component of the risk management process.
Ç Board audit committee report
3.9 The audit committee is responsible for recommending the appointment of the external auditor and overseeing the external audit process.
Ç Board audit committee report
3.10 The audit committee should report to the board and shareholders on how it has discharged its duties.
Ç Board audit committee report

86 METaIR 2014 INTEGRATED ANNUAL REPORT
apply/In progress/
Do not apply Reference and comments
4. THE GOVERNaNCE OF RISK
4.1 The board should be responsible for the governance of risk. Ç Corporate governance report – group risk management
4.2 The board should determine the levels of risk tolerance. Ç Corporate governance report – group risk management
4.3 The risk committee or audit committee should assist the board in carrying out its risk responsibilities.
Ç Corporate governance report – group risk management
4.4 The board should delegate to management the responsibility to design, implement and monitor the risk management plan.
Ç Corporate governance report – group risk management
4.5 The board should ensure that risk assessments are performed on a continual basis.
Ç Corporate governance report – group risk management
4.6 The board should ensure that frameworks and methodologies are implemented to increase the probability of anticipating unpredicted risks.
Ç Corporate governance report – group risk management
4.7 The board should ensure that management considers and implements appropriate risk responses.
Ç Corporate governance report – group risk management
4.8 The board should ensure continuous risk monitoring by management. Ç Corporate governance report – group risk management
4.9 The board should receive assurance regarding the effectiveness of the risk management process.
Ç Corporate governance report – group risk management
4.10 The board should ensure that there are processes in place enabling complete, timely, relevant, accurate and accessible risk disclosures to stakeholders.
Ç Corporate governance report – group risk management
5. THE GOVERNaNCE OF INFORMaTION TECHNOLOGY
5.1 The board should be responsible for information technology (IT).Æ
The board takes responsibility for IT; however, the IT policy and governance framework will be done and linked to company strategy
5.2 IT should be aligned with the performance and sustainability objectives of the company.
Ç Forms part of risk management
5.3 The board should delegate to management the responsibility for the implementation of an IT governance framework.
Ç Corporate governance report – group risk management
5.4 The board should monitor and evaluate significant IT investments and expenditure.
Ç Forms part of risk management, Financial review
5.5 IT should form an integral part of the company’s risk management. Ç Corporate governance report – group risk management
5.6 The board should ensure that information assets are managed effectively. Æ To be reviewed
5.7 A risk committee and audit committee should assist the board in carrying out its IT responsibilities.
Ç Corporate governance report – group risk management
Applied Ç Needs improvement Æ Do not apply È
aPPENDIX V – KING III CHECKLISTCONTINUED

87METaIR 2014 INTEGRATED ANNUAL REPORT
apply/In progress/
Do not apply Reference and comments
6. COMPLIaNCE WITH LaWS, RULES, CODES aND STaNDaRDS
6.1 The board should ensure that the company complies with applicable laws and considers adherence to non-binding rules, codes and standards.
Ç Board audit committee report
6.2 The board and each individual director should have a working understanding of the effect of the applicable laws, rules, codes and standards on the company and its business.
Ç Corporate governance report
6.3 Compliance should form an integral part of the company’s risk management process.
Ç Corporate governance report – group risk management
6.4 The board should delegate to management the implementation of an effective compliance framework and processes.
Ç Corporate governance report
7. INTERNaL aUDIT
7.1 The board should ensure that there is an effective risk-based internal audit. Ç Board audit committee report
7.2 Internal audit should follow a risk-based approach to its plan. Ç Corporate governance report
7.3 Internal audit should provide a written assessment of the effectiveness of the company’s system of internal controls and risk management.
Ç Corporate governance report
7.4 The audit committee should be responsible for overseeing the internal audit. Ç Corporate governance report
7.5 Internal audit should be strategically positioned to achieve its objectives. Ç Corporate governance report
8. GOVERNING STaKEHOLDER RELaTIONSHIPS
8.1 The board should appreciate that stakeholders’ perceptions affect the company’s reputation.
Ç Stakeholder relationships
8.2 The board should delegate to management to proactively deal with stakeholder relationships.
Ç Stakeholder relationships
8.3 The board should strive to achieve the appropriate balance between its various stakeholder groupings, in the best interests of the company.
Ç Stakeholder relationships
8.4 Companies should ensure the equitable treatment of shareholders. Ç Stakeholder relationships
8.5 Transparent and effective communications with stakeholders is essential for building and maintaining their trust and confidence.
Ç Stakeholder relationships
8.6 The board should ensure that disputes are resolved as effectively, efficiently and expeditiously as possible.
Ç Stakeholder relationships
9. INTEGRaTED REPORTING aND DISCLOSURE
9.1 The board should ensure the integrity of the company’s integrated report. Ç About this report
9.2 Sustainable reporting and disclosure should be integrated with the company’s financial reporting.
Ç Integrated annual report 2013
9.3 Sustainability reporting and disclosure should be independently assured. Ç Sustainability assurance statement
88 METaIR 2014 INTEGRATED ANNUAL REPORT
Statement of responsibility 89
Certificate by company secretary 89
Directors’ report 90
Independent auditor’s report 93
Accounting policies 94
Balance sheets 105
Income statements 106
Statements of comprehensive income 107
Statements of changes in equity 108
Statements of cash flows 110
Notes to the annual financial statements 111
Investments in subsidiaries and associates 165
Notice to shareholders 167
Shareholders’ diary 170
Form of proxy 171
LEVEL OF ASSURANCE
These annual financial statements have been audited in
compliance with the applicable requirements of the Companies
Act of South Africa.
PREPARER
The annual financial statements were prepared under the
supervision of Mr S Douwenga (Finance director)
B Comm (Hons), CA (SA) .
PUBLISHED
25 March 2014
Company secretary: Sanet VermaakRegistration number: 1948/031013/06ISIN: ZAE 000090692JSE share code: MTA
Head office and physical addressWesco House10 Anerley RoadParktown2132
Postal addressPO Box 2077Saxonwold2193
Further information on this report and its contents can be obtained from the company secretary:Telephone: +27 11 646 3011Fax: +27 11 646 3102Email: [email protected]

89METaIR 2014 INTEGRATED ANNUAL REPORT
STATEMENT OF RESPONSIBILITY BY THE BOARD OF DIRECTORS
METAIR 2014 INTEGRATED ANNUAL REPORT 89
The directors are responsible for maintaining proper accounting records and the preparation, integrity, and fair presentation of the financial statements of Metair Investments Limited (Metair) and its subsidiaries. The accounting records disclose with reasonable accuracy the financial position of the company. The directors acknowledge that they are ultimately responsible for the system of internal controls established by the group and place considerable importance on maintaining a strong control environment. The directors are of the opinion, based on the information and explanations given by management and the internal auditors that the system of internal controls provides reasonable assurance that the financial records may be relied on for the preparation of the annual financial statements. The directors are of the opinion that the group and the company have adequate resources to continue in operation for the foreseeable future and accordingly the annual financial statements have been prepared on a going concern basis. The auditor is responsible for reporting on whether the group annual financial statements and the annual financial statements of the company are fairly presented in accordance with the applicable reporting framework. The consolidated and separate annual financial statements as set out in this report have been prepared by the directors in accordance with International Financial Reporting Standards (IFRS) and the requirements of the South African Companies Act No 71 of 2008 (Companies Act of South Africa). They are based on appropriate accounting policies which have been applied consistently and are supported by reasonable and prudent judgements and estimates. The directors also prepared
the other information included in the annual report and are responsible for both its accuracy and its consistency with the annual financial statements. The annual financial statements have been audited by the independent auditors, PricewaterhouseCoopers Incorporated (PwC), who were given unrestricted access to all financial records and related data, including minutes of all meetings of shareholders, the board of directors and committees of the board. The directors believe that all representations made to the independent auditors during their audit are valid and appropriate.
APPROVAL OF ANNUAL FINANCIAL STATEMENTS
The group annual financial statements and the annual financial statements of the company for the year ended 31 December 2014 set out on pages 90 to 166 were approved by the board of directors and signed on its behalf by:
OME Pooe CT Loock Chairman Managing director
The audit report of PricewaterhouseCoopers Incorporated is presented on page 93.
CERTIFICATE BY COMPANY SECRETARY
In my capacity as company secretary, I hereby confirm, in terms of section 33(1) of the Companies Act of South Africa, that for the year ended 31 December 2014, the company has lodged with the Companies and Intellectual Property Commission (CIPC) all such returns as are required of a public company in terms of this Act and that all such returns are true, correct and up to date. SM Vermaak 25 March 2015

90 METaIR 2014 INTEGRATED ANNUAL REPORT
DIRECTORS’ REPORT FOR THE YEAR ENDED 31 December 2014
90 METAIR 2014 INTEGRATED ANNUAL REPORT
The directors have pleasure in submitting their report for the year ended 31 December 2014.
GENERAL REVIEW
The main business of the group is the manufacture and supply of motor vehicle components for the original equipment (OE) and aftermarket sector in both local and export markets. The group also manufactures non-automotive products. The annual financial statements on pages 94 to 166 set out fully the financial position, results of operations and cash flows of the group for the financial year.
FINANCIAL RESULTS
The consolidated net profit for the year attributable to equity holders of the company was R601.5 million (2013: R341.4 million).
DIVIDENDS
The following dividends were declared for ordinary shares: Declared and paid - 2013 Ordinary dividend - 70 cents per share Declared and paid - 2012 Ordinary dividend - 95 cents per share A dividend of 80 cents per share was declared on 25 March 2015 in respect of the year ended 31 December 2014.
STATED CAPITAL
Full details on the present position of the company's stated capital are set out in the notes to the financial statements. There were no changes to stated capital for the year under review. Share incentive scheme particulars relating to options under the share option scheme and awards under the share plans are given in note 14 to the annual financial statements.
CHANGES IN NON-CURRENT ASSETS
The main changes to the property, plant and equipment of the company and its subsidiaries were as follows: R’000 Additions 250 100 The main changes to the intangible assets of the company and its subsidiaries were as follows: R’000 Additions 16 467
DIRECTORS
The composition of the board of directors is set out on page 30. OME Pooe (appointed April 2007) CT Loock (appointed March 2006) S Douwenga (appointed March 2014) BM Jacobs (appointed December 2008 and resigned March 2014) A Joffe (appointed December 2006) L Soanes (appointed May 1999) RS Broadley (appointed April 2001) DR Wilson (appointed January 2014) JG Best (appointed February 2009) SG Pretorius (appointed January 2014) A Galiel (appointed July 2008 and resigned November 2014)
SECRETARY
SM Vermaak Business address 10 Anerley Road, Parktown, Johannesburg, 2193 Postal address PO Box 2077, Saxonwold, 2132
INTEREST OF DIRECTORS
Interest of directors in the company's stated capital are disclosed in note 14 of the annual financial statements. The directors have no material interest in contracts with the group.
SUBSIDIARIES
Details of the company's investments in its subsidiaries are disclosed on page 165. During the prior year the group acquired a controlling interest in Mutlu Holding Anonim irketi and other companies within the group (Mutlu group) (refer note 9 and note 28.1).
HOLDING COMPANY
The company has no holding company.
AUDITORS
PricewaterhouseCoopers Incorporated are the current appointed auditors in accordance with section 90(6) of the Companies Act of South Africa.

91METaIR 2014 INTEGRATED ANNUAL REPORT
METAIR 2014 INTEGRATED ANNUAL REPORT 91
RESOLUTIONS
The following special resolutions, the nature of which might be significant to members in their appreciation of the state of affairs of the group were passed at a general meeting held on 31 December 2014: Special resolution 1 Resolved as a special resolution in terms of section 66(9) of the Companies Act, that the remuneration of the non-executive directors with effect from 1 January 2014 to 31 December 2014 be and is hereby approved. The reason for and effect of special resolution number 1 is to approve, to the extent required, the remuneration for non-executive directors for the period commencing 1 January 2014 and ending 31 December 2014. Special resolution number 2 Resolved as a special resolution in accordance with section 45 of the Companies Act, that the board be and is hereby authorised, by way of a general authority to, at any time and from time to time during the period of two years commencing on the date of passing of this special resolution to provide, any direct or indirect financial assistance (but subject to the provisions of section 45(1) of the Companies Act and the JSE Listing Requirements) in such amount and in any form (including, but not limited to, by way of loan (on an interest-free or a market-related interest basis), guarantee, the provision of security or otherwise) to any of its present or future subsidiaries and/or any juristic person that the company directly or indirectly controls from time to time (collectively hereinafter the Metair group) and for the time being on such terms and conditions as it in its discretion deems fit, for any purpose whether in the normal course of business of the Metair group or of a transactional nature, subject thereto that the board will, before making such financial assistance available, satisfy itself that: (i) immediately after providing the financial assistance, the company will satisfy the solvency and liquidity test as prescribed in section 46(2) of the Companies Act; and (ii) the terms under which the financial assistance is proposed to be given are fair and reasonable to the company. The effect of the special resolution and the reason therefore is that same is required in terms of Section 45 of the Companies Act to grant the directors the authority to cause the company to provide financial assistance by way of loan, guarantee, the provision of security or otherwise, to any company which is related or inter-related to the company or any other juristic person that the company directly or indirectly controls. The special resolution does not authorise Metair to provide financial assistance to a director or prescribed officer of the company. In accordance with section 45(5) of the Companies Act, the board hereby gives notice to its shareholders of the fact that it has passed a resolution at a meeting of the directors held on 17 April 2013, 28 October 2013 and 4 December 2013 authorising the company to provide financial assistance to certain related and/or inter-related companies which board resolution will take effect, subject to the passing of special resolution number 2 as set out above.
Special resolution number 3 Resolved as a special resolution in terms of the Companies Act and the JSE Listings Requirements, that the authorisation granted to the company in terms of Article 13 of its MOI to acquire the company’s own securities by way of a general approval, upon such terms and conditions and in such amounts as the directors may from time to time decide, subject only to the provisions of the Companies Act and the JSE Listings Requirements, be and is hereby extended, subject to the following terms and conditions: (i) Any repurchase of securities must be effected through the order book operated by the JSE trading system and done without any prior understanding or arrangement between the company and any counterparty; (ii) This general authority shall be valid until the company’s next annual general meeting, provided that it shall not extend beyond 15 months from the date of passing of this special resolution; (iii) Repurchases may not be made at a price greater than 10% above the weighted average of the market value of the securities for the five business days immediately preceding the date on which the repurchase will be effected; (iv) At any point in time, the company may only appoint one agent to give effect to any repurchase; (v) An announcement shall be published as soon as the company has cumulatively repurchased 3% of the initial number (being the number of that class of shares in issue at the time that the general authority was granted) of the relevant class of securities and for each 3% in aggregate of the initial number of that class acquired thereafter, containing the details as required by paragraph 11.27 of the JSE Listings Requirements; (vi) Repurchases shall not, in the aggregate, in any one financial year exceed 20% of the company’s issued share capital of that class; (vii) Repurchases may not be made by the company and/or its subsidiaries during a prohibited period as defined by the JSE Listings Requirements unless a repurchase programme is in place where the dates and quantities of securities to be traded during the relevant period are fixed and full details of the programme have been disclosed in an announcement over the Stock Exchange News Service operated by the JSE prior to the commencement of prohibited period; (viii) The intention of the board is that the repurchase of the company’s securities will be effected within the parameters laid down by this resolution as well as by the Companies Act, the JSE Listings Requirements and the board, as and when the directors deem such repurchases to be appropriate, having regard for prevailing market and business conditions; (ix) The directors will ensure that the requisite prior resolution of the board has been taken authorising such repurchases, confirming that the company and its subsidiaries engaged in such repurchases have passed the solvency and liquidity test envisaged in the Companies Act and confirming that, since such tests were performed, there have been no material changes to the financial position of the Metair group; and (x) The company may not proceed with a repurchase of its securities until the company’s sponsor has discharged its duties in writing to the JSE with regard to the adequacy of the company’s working capital for the purpose of undertaking a repurchase of securities.

92 METaIR 2014 INTEGRATED ANNUAL REPORT
DIRECTORS’ REPORT CONTINUED
92 METAIR 2014 INTEGRATED ANNUAL REPORT
The directors shall not make any repurchases under this general authority unless they are of the opinion that, after considering the effect of the maximum number of shares to be repurchased and for a period of 12 months after the date of the notice of the annual general meeting : a) the company and the Metair group will be able, in the ordinary course of business, to pay their debts; b) the assets of the company and the Metair group will be in excess of the liabilities of the company and the Metair group, the assets and liabilities being recognised and measured in accordance with the accounting policies used in the latest audited annual financial statements; c) the share capital and reserves of the company and the Metair group are adequate for the ordinary business purposes of the company and the Metair group; and d) the working capital of the company and the Metair group will be adequate for ordinary business purposes. The effect of the special resolution and the reason therefore is to extend the general authority given to the directors in terms of the Companies Act and the JSE Listings Requirements for the acquisition by the company and/or its subsidiaries of the company’s securities, which authority may be used at the directors’ discretion during the course of the period authorised.
POST-BALANCE SHEET EVENTS
Following the squeeze out process Metair now owns 100% of Mutlu Akü shares. There were no other significant post-balance sheet events.
APPROVAL OF ANNUAL FINANCIAL STATEMENTS
The directors have approved the annual financial statements on pages 89 to 166 which are signed on their behalf by: OME Pooe CT Loock Chairman Managing director Johannesburg 25 March 2015

93METaIR 2014 INTEGRATED ANNUAL REPORT
INDEPENDENT AUDITOR’S REPORT TO THE SHAREHOLDERS OF METAIR INVESTMENTS LIMITED
METAIR 2014 INTEGRATED ANNUAL REPORT 93
We have audited the consolidated and separate annual financial
statements of Metair Investments Limited, set out on pages 94 to
166, which comprise the balance sheets as at 31 December 2014,
and the income statements, statements of comprehensive income,
statements of changes in equity and statements of cash flows for
the year then ended, and the notes, comprising a summary of
significant accounting policies and other explanatory information.
DIRECTORS’ RESPONSIBILITY FOR THE FINANCIAL STATEMENTS
The company's directors are responsible for the preparation and
fair presentation of these consolidated and separate financial
statements in accordance with International Financial Reporting
Standards and the requirements of the Companies Act of South
Africa, and for such internal control as the directors determine is
necessary to enable the preparation of consolidated and separate
financial statements that are free from material misstatements,
whether due to fraud or error.
AUDITOR’S RESPONSIBILITY
Our responsibility is to express an opinion on these consolidated
and separate financial statements based on our audit. We
conducted our audit in accordance with International Standards on
Auditing. Those standards require that we comply with ethical
requirements and plan and perform the audit to obtain reasonable
assurance about whether the financial statements are free from
material misstatement.
An audit involves performing procedures to obtain audit evidence
about the amounts and disclosures in the financial statements.
The procedures selected depend on the auditor's judgement,
including the assessment of the risks of material misstatement of
the financial statements, whether due to fraud or error. In making
those risk assessments, the auditor considers internal control
relevant to the entity's preparation and fair presentation of the
financial statements in order to design audit procedures that are
appropriate in the circumstances, but not for the purpose of
expressing an opinion on the effectiveness of the entity's internal
control. An audit also includes evaluating the appropriateness of
accounting policies used and the reasonableness of accounting
estimates made by management, as well as evaluating the overall
presentation of the financial statements.
We believe that the audit evidence we have obtained is sufficient
and appropriate to provide a basis for our audit opinion.
OPINION
In our opinion, the consolidated and separate financial statements
present fairly, in all material respects, the consolidated and
separate financial position of Metair Investments Limited as at
31 December 2014, and its consolidated and separate financial
performance and its consolidated and separate cash flows for the
year then ended in accordance with International Financial
Reporting Standards and the requirements of the Companies Act
of South Africa.
OTHER REPORTS REQUIRED BY THE COMPANIES ACT OF SOUTH
As part of our audit of the consolidated and separate financial
statements for the year ended 31 December 2014, we have read
the directors' report, the audit committee's report and the company
secretary's certificate for the purpose of identifying whether there
are material inconsistencies between these reports and the
audited consolidated and separate financial statements. These
reports are the responsibility of the respective preparers. Based on
reading these reports we have not identified material
inconsistencies between these reports and the audited
consolidated and separate financial statements. However, we
have not audited these reports and accordingly do not express an
opinion on these reports.
PricewaterhouseCoopers Inc.
Director: George Hauptfleisch
Registered Auditor
Johannesburg
25 March 2015

94 METAIR 2014 INTEGRATED ANNUAL REPORT
ACCOUNTING POLICIES
94 METAIR 2014 INTEGRATED ANNUAL REPORT
PRINCIPAL ACCOUNTING POLICIES
The principal accounting policies applied in the preparation of these consolidated annual financial statements are set out below. These policies have been consistently applied to all the years presented, unless otherwise stated.
BASIS OF PREPARATION
The consolidated annual financial statements have been prepared in accordance with International Financial Reporting Standards (IFRS) and the requirements of the South African Companies Act. The consolidated annual financial statements have been prepared on the historical cost basis, except as disclosed in the accounting policies below. The consolidated annual financial statements are prepared on the going concern basis. The preparation of financial statements in conformity with IFRS requires the use of certain critical accounting estimates. It also requires management to exercise its judgement in the process of applying the group’s accounting policies. The areas involving a higher degree of judgement or complexity, or areas where assumptions and estimates are significant to the consolidated financial statements are disclosed in note 26.
NEW STANDARDS AND INTERPRETATIONS
Accounting policy developments include new standards issued, amendments to standards, and interpretations issued on current standards. These developments resulted in the adoption of new and revised standards as well as additional disclosures.
(a) Standards, amendments and interpretations effective for the first time for 31 December 2014 year-end Amendments to IAS 32 - Financial Instruments Presentation (effective from 1 January 2014): The IASB has issued amendments to the application guidance in IAS 32 - Financial instruments: Presentation, that clarify some of the requirements for offsetting financial assets and financial liabilities on the balance sheet. However, the clarified offsetting requirements for amounts presented in the statement of financial position continue to be different from US GAAP. The group has adopted the amendment and the impact on the disclosures are not material. Amendments to IFRS 10 - Consolidated Financial Statements, IFRS 12 and IAS 27 for investment entities (effective from 1 January 2014): The amendments mean that many funds and similar entities will be exempt from consolidating most of their subsidiaries. Instead they will measure them at fair value through profit or loss. The amendments give an exception to entities that meet an ‘investment entity’ definition and which display particular characteristics. Changes have also been made in IFRS 12 to introduce disclosures that an investment entity needs to make. The amendment is not applicable as there are no ‘investment entities’ as defined. IASB issues narrow-scope amendments to IAS 36 - Impairment of Assets (effective from 1 January 2014): These amendments address the disclosure of information about the recoverable amount of impaired assets if that amount is based on fair value less cost of disposal.
The amendment is not applicable as there are no impaired assets based on fair value less cost of disposal.
Amendment to IAS 39 on novation of derivatives (effective from 1 January 2014): The IASB has amended IAS 39 to provide relief from discontinuing hedge accounting when novation of a hedging instrument to a CCP meets specified criteria. Similar relief will be included in IFRS 9 - Financial Instruments. The amendment is not applicable to the group. IFRIC 2 - Accounting for Levies (effective from 1 January 2014): This interpretation sets out the accounting for an obligation to pay a levy that is not income tax. The interpretation addresses diversity in practice around when the liability to pay a levy is recognised. The group has adopted the amendment and the impact is not material.
(b) Standards, amendments and interpretations to existing standards that are not yet effective and have not been early adopted by the group
A number of new standards and amendments to standards and interpretations have been issued and have not been applied in preparing these annual financial statements. None of these is expected to have a significant effect on the annual financial statements of the group, as set out below: IFRS 9 - Financial Instruments (2009) (effective date 1 January 2018): This IFRS is part of the IASB’s project to replace IAS 39. IFRS 9 addresses classification and measurement of financial assets and replaces the multiple classification and measurement models in IAS 39 with a single model that has only two classification categories: amortised cost and fair value. The effective date for adoption of this standard is for periods commencing on or after 1 January 2018. We are currently reviewing the effects of the standard and will consider adoption when appropriate. We do not expect the adoption of IFRS 9 to have a significant impact on total assets, total liabilities, equity, earnings and earnings per share. IFRS 9 - Financial Instruments (2010) (effective date 1 January 2018): The IASB has updated IFRS 9 - Financial instruments to include guidance on financial liabilities and derecognition of financial instruments. The accounting and presentation for financial liabilities and for derecognising financial instruments has been relocated from IAS 39 - Financial Instruments: Recognition and Measurement, without change, except for financial liabilities that are designated at fair value through profit or loss. The effective date for adoption of this standard is for periods commencing on or after 1 January 2018. We are currently reviewing the effects of the standard and will consider adoption when appropriate. We do not expect the impact to be material. Amendments to IFRS 9 - Financial Instruments (2011) (effective date 1 January 2018): The IASB has published an amendment to IFRS 9, Financial instruments that delays the effective date to annual periods beginning on or after 1 January 2018. The original effective date was for annual periods beginning on or after from 1 January 2013. This amendment is a result of the board extending its timeline for completing the remaining phases of its project to replace IAS 39 (for example, impairment and hedge accounting) beyond June 2011, as well as the delay in the insurance project. The amendment confirms the importance of allowing entities to apply the requirements of all the phases of the project to replace IAS 39 at the same time. The requirement to restate comparatives and the disclosures required on transition have also been modified.

95METaIR 2014 INTEGRATED ANNUAL REPORT
DIRECTORS’ REPORT CONTINUED
METAIR 2014 INTEGRATED ANNUAL REPORT 95
The effective date for adoption of this standard is for periods commencing on or after 1 January 2018. We are currently reviewing the effects of the standard and will consider adoption when appropriate. We do not expect the impact to be material. IFRS 14 - Regulatory Deferral Accounts (effective date 1 January 2016): The IASB has issued IFRS 14 - Regulatory Deferral Accounts, an interim standard on the accounting for certain balances that arise from rate-regulated activities (regulatory deferral accounts). Rate regulation is a framework where the price that an entity charges to its customers for goods and services is subject to oversight and/or approval by an authorised body. The effective date for adoption of this standard is for periods commencing on or after 1 January 2016. The standard currently has no impact on the group as there are no ‘rate-regulated’ or similar activities that are applicable to the group’s operations. Amendment to IAS 19 regarding defined benefit plan (effective date 1 July 2014): These narrow scope amendments apply to contributions from employees or third parties to defined benefit plans. The objective of the amendments is to simplify the accounting for contributions that are independent of the number of years of employee service, for example, employee contributions that are calculated according to a fixed percentage of salary. The amendment will be effective for the first time for the year ended 31 December 2015. We are currently reviewing the effects of the standard. We do not expect the impact to be material. Amendment to IFRS 11 - Joint Arrangements on acquisition of an interest in a joint operation (effective date 1 January 2016): This amendment adds new guidance on how to account for the acquisition of an interest in a joint operation that constitutes a business. The amendments specify the appropriate accounting treatment for such acquisitions. The effective date for adoption of this standard is for periods commencing on or after 1 January 2016. The standard currently has no impact on the group. Amendment to IAS 16 - Property, Plant and Equipment and IAS 38 - Intangible assets, on depreciation and amortisation (effective date 1 January 2016): In this amendment the IASB has clarified that the use of revenue based methods to calculate the depreciation of an asset is not appropriate because revenue generated by an activity that includes the use of an asset generally reflects factors other than the consumption of the economic benefits embodied in the asset. The IASB has also clarified that revenue is generally presumed to be an inappropriate basis for measuring the consumption of the economic benefits embodied in an intangible asset. The effective date for adoption of this standard is for periods commencing on or after 1 January 2016. This currently has no impact on the group. IFRS 15 - Revenue from Contracts with Customers (effective date 1 January 2017): The FASB and IASB issued their long awaited converged standard on revenue recognition on 29 May 2014. It is a single, comprehensive revenue recognition model for all contracts with customers to achieve greater consistency in the recognition and presentation of revenue. Revenue is recognised based on the satisfaction of performance obligations, which occurs when control of good or service transfers to a customer. The effective date for adoption of this standard is for periods commencing on or after 1 January 2017. We are currently reviewing the effects of the standard and will consider adoption when appropriate.
(c) Annual improvements to existing standards Improvements to IFRSs to make non-urgent but necessary amendments to IFRS are issued in cycles as part of the ‘annual improvements process’. The 2010 - 2012, 2011 - 2013 and 2013-2014 cycles are not yet applicable. Management do not foresee any major adjustments from these amendments which affect the following standards: • IFRS 1 - First-time Adoption of International Financial Reporting
Standards (applicable 1 July 2014).
• Amendments to the Basis of Conclusion clarify the meaning of effective IFRS.
• IFRS 2 - Share-based Payment (applicable 1 July 2014).
• Amendments added the definitions of performance conditions and service conditions and amended the definitions of vesting conditions and market conditions.
• IFRS 3 - Business Combinations (applicable 1 July 2014).
• Amendments to the measurement requirements for all contingent consideration assets and liabilities including those accounted for under IFRS 9 as well as amendments to the scope paragraph for the formation of a joint arrangement.
• IFRS 8 - Operating Segments (applicable 1 July 2014).
• Amendments to some disclosure requirements regarding the judgements made by management in applying the aggregation criteria, as well as those to certain reconciliations. This may require additional disclosure within the segmental report.
• IFRS 9 - Financial Instruments (applicable 1 July 2014).
• Amendments to the measurement requirements for all contingent consideration assets and liabilities included under IFRS 9.
• IFRS 13 - Fair Value Measurement (applicable 1 July 2014).
• The amendments clarify the measurement requirements for short-term receivables and payables and clarifies the portfolio exception.
• IAS 16 - Property, Plant and Equipment and IAS 38 Intangible Assets.
• Amendments to the revaluation method and the proportionate restatement of accumulated depreciation/amortisation (applicable 1 July 2014).
• Amendment to clarify the basis for the calculation of depreciation/amortisation as being the expected pattern of consumption of the future economic benefits of an asset (applicable 1 January 2016).
• IAS 24 - Related Party Disclosures (applicable 1 July 2014).
• Amendments to the definitions and disclosure requirements for key management personnel.
• IAS 40 - Investment Property (applicable 1 July 2014).
• The amendment clarifies the interrelationship between IFRS 3 and IAS 40 when classifying property as investment property or owner-occupied property.
• IFRS 5 - Non-current Assets Held for Sale and Discontinued Operations (applicable 1 January 2016).
• The amendment also clarifies that changing the disposal method does not change the date of classification.
• IFRS 7 - Financial Instruments; Disclosures (applicable 1 January 2016).
• Applicability of the offsetting disclosures to condensed interim financial statements and clarifying that IFRS 7 disclosures are not required in the condensed interim financial statements unless the disclosures provide a significant update to the information reported in the most recent annual report.
• IFRS 7 - Financial Instruments; Disclosures (applicable 1 January 2016).
• The amendment clarifies that a servicing contract that includes a fee can constitute continuing involvement in a financial asset.
• IAS 19 - Employee Benefits (applicable 1 January 2016).
• The amendment clarifies that market depth of high quality corporate bonds is assessed based on the currency in which the obligation is denominated, rather than the country where the obligation is located. When there is no deep market for high

96 METaIR 2014 INTEGRATED ANNUAL REPORT
ACCOUNTING POLICIES CONTINUED
96 METAIR 2014 INTEGRATED ANNUAL REPORT
quality corporate bonds in that currency, government bond rates must be used.
• IAS 34 - Interim Financial Reporting (applicable 1 January 2016). Disclosure of information ‘elsewhere in the interim financial report’.
• The amendment states that the required interim disclosures must either be in the interim financial statements or incorporated by cross-reference between the interim financial statements and wherever they are included within the greater interim financial report.
(d) Standards, amendments and interpretations not yet effective but have been early adopted by the group. There have been no standards, amendments and interpretations early adopted by the group.
BASIS OF CONSOLIDATION (a) Subsidiaries The consolidated annual financial statements incorporate the annual financial statements of Metair Investments Limited and all its subsidiaries from the effective dates of acquisition to the effective dates of loss of control. Subsidiaries are all entities (including structured entities) over which the group has control. The group controls an entity when the group is exposed to, or has rights to, variable returns from its involvement with the entity and has the ability to affect those returns through its power over the entity. Subsidiaries are fully consolidated from the date on which control is transferred to the group. They are no longer consolidated from the date that control is lost. The acquisition method of accounting is used to account for business combinations of subsidiaries by the group. The consideration transferred for the acquisition of a subsidiary is measured at the fair value of the assets transferred, the liabilities incurred to the former owners of the acquiree and the equity instruments issued at the date of exchange. Identifiable assets acquired and liabilities and contingent liabilities assumed in a business combination are measured initially at their fair values at the acquisition date, irrespective of the extent of any non-controlling interest (NCI). Acquisition-related costs are expensed in the period in which the costs are incurred or services received. If the business combination is achieved in stages, the acquisition date fair value of the acquirer’s previously held equity interest in the acquiree is remeasured to fair value at the acquisition date through profit or loss. The excess of the consideration transferred, the amount of any NCI in the acquiree and the acquisition date fair value of any previous equity interest in the acquiree over the fair value of the identifiable net assets acquired is recorded as goodwill. If the total of consideration transferred, NCI recognised and previously held interest measured is less than the fair value of the net assets of the subsidiary acquired in the case of a bargain purchase, the difference is recognised directly in the income statement. Inter-company transactions, balances and unrealised gains on transactions between group companies are eliminated. Unrealised losses are also eliminated but considered an impairment indicator of the asset transferred. Accounting policies of subsidiaries have been changed where necessary to ensure consistency with the policies adopted by the group. Accounting policies of subsidiaries have been changed to ensure consistency with the policies adopted by the Group.
The company accounts for subsidiary undertakings at cost less impairments. Advances to subsidiaries by the company, which do not have fixed terms or repayment, are included in the investments in subsidiaries. For the company, the equity settled share-based payment cost is capitalised to the investment in subsidiaries. Any contingent consideration to be transferred by the group is recognised at fair value at the acquisition date. Subsequent changes to the fair value of the contingent consideration that is deemed to be an asset or liability is recognised in accordance with IAS 39 either in profit or loss or as a change to other comprehensive income. Contingent consideration that is classified as equity is not remeasured and its subsequent settlement is accounted for within equity. Changes in ownership interests in subsidiaries without change of control Transactions with NCI’s that do not result in loss of control are accounted for as equity transactions - that is, as transactions with the owners in their capacity as owners. The difference between the fair value of any consideration paid and the relevant share acquired of the carrying value of net assets of the subsidiary is recorded in equity. Gains or losses on disposals to NCIs are also recorded in equity. Mandatory purchase of non-controlling interests in business combinations (MTO’s) The acquisition of an additional ownership interest in an acquired subsidiary from the NCI arising from a mandatory tender offer required by the local laws and regulations, is accounted for as a single acquisition transaction that is completed over a period of time. The existence of the statutory obligation to the NCI is recognised as a financial liability based on the expected payments. The liability for the mandatory tender offer is recognised at the date control is obtained of the acquiree. Forward and similar contracts over NCI A forward purchase contract is a contract that specifies that the parent will acquire the minority shareholding (NCI) at a date in the future at a price with no ability for either party to avoid the transaction. The ownership risk and rewards of the shares relating to the forwards are analysed to determine whether they remain with the NCI or have transferred to the group. The NCI is recognised to the extent that the risks and rewards relating to ownership remain with them. The terms of the forward contract are analysed to assess whether they provide the group with access to the economic benefits and risks associated with the actual ownership of the shares during the contract period. The NCI is derecognised to the extent that the risks and rewards relating to ownership no longer remain with the outside shareholders. Irrespective of whether the NCI is recognised, a financial liability is recorded to reflect the forward. The liability is recognised at the present value of the forward price. All subsequent changes to the liability are recognised in profit and loss.
97METaIR 2014 INTEGRATED ANNUAL REPORT
DIRECTORS’ REPORT CONTINUED
METAIR 2014 INTEGRATED ANNUAL REPORT 97
Disposals of subsidiaries When the group ceases to have control, any retained interest in the entity is remeasured to its fair value at the date when control is lost, with the change in carrying amount recognised in profit or loss. The fair value is the initial carrying amount for the purposes of subsequently accounting for the retained interest as an associate, joint venture or financial asset. In addition, any amounts previously recognised in other comprehensive income in respect of that entity are accounted for as if the group had directly disposed of the related assets or liabilities. This may mean that amounts previously recognised in other comprehensive income are reclassified to profit or loss.
(b) Non-controlling interest (NCI) NCI is valued at the NCI’s portion of the acquirer’s identifiable assets, liabilities and contingent liabilities at the acquisition date plus the NCI’s portion of post-acquisition reserves excluding the NCI’s portion of share based payment reserve. NCI is not recognised to the extent of mandatory tender offers (refer above). NCI is included in equity on the balance sheet and is also reconciled in the statement of changes in equity.
(c) Associated companies Associates are all entities over which the group has a significant influence but not control, generally accompanying a shareholding of between 20% and 50% of the voting rights. Investments in associates are accounted for using the equity method of accounting and are initially recognised at cost. The group’s investment in associates includes goodwill identified on acquisition, net of any accumulated impairment losses. The group’s share of its associates’ post acquisition profits or losses is recognised in the income statement, and its share of post-acquisition movements in other comprehensive income is recognised in the statement of other comprehensive income with a corresponding adjustment to the carrying amount of the investment. The cumulative post-acquisition movements are adjusted against the carrying amount of the investment. When the group’s share of losses in an associate equals or exceeds its interest in the associate, including any other unsecured receivables, the group does not recognise further losses, unless it has incurred obligations or made payments on behalf of the associate. If the ownership interest in an associate is reduced but significant influence is retained, only a proportionate share of the amounts previously recognised in other comprehensive income is reclassified to profit or loss where appropriate. The group determines at each reporting date whether there is any objective evidence that the investment in the associate is impaired. If this is the case, the group calculates the amount of impairment as the difference between the recoverable amount of the associate and its carrying value and recognises the amount adjacent to ‘share of profit/(loss) of an associate’ in the income statement. Unrealised gains on transactions between the group and its associates are eliminated to the extent of the group’s interest in associates. Unrealised losses are also eliminated unless the transaction provides evidence of an impairment of the asset transferred. Dilution gains or losses arising on investments in associates are recognised in the income statement. If an associated company applies accounting policies that are recognised as being materially different to those adopted by the group, appropriate adjustments are made to the consolidated annual financial statements, prior to equity accounting.
The group’s share of associated earnings less dividends received is transferred to other reserves within the statement of changes in equity. For the purposes of the cash flow statement dividends received from associates are classified as operating cash flows as these enter into the determination of net profit or loss. (d) Joint arrangements Under IFRS 11 investments in joint arrangements are classified as either joint operations or joint ventures depending on the contractual rights and obligations of each investor. The group has assessed the nature of its investments and determined that it has no joint arrangements.
FOREIGN CURRENCY TRANSLATION
(a) Functional and presentation currency
Items included in the annual financial statements of each of the group’s entities are measured using the currency of the primary economic environment in which the entity operates (‘the functional currency’). The consolidated annual financial statements are presented in South African Rands (ZAR), which are the company’s functional and the group’s presentation currency.
(b) Transactions and balances Transactions denominated in foreign currency are translated into the functional currency at the rate of exchange ruling at the transaction date and if remeasured on date of remeasurement. Foreign exchange gains or losses resulting from the settlement of such transactions and from the translation at year end exchange rates of monetary assets and liabilities denominated in foreign currency, are recognised within other operating expenses in the income statement, except when deferred in other comprehensive income as a qualifying cash flow hedge. Monetary items denominated in foreign currency are translated at the rate of exchange ruling at the reporting date.
(c) Group companies The results and financial position of all the group entities (none of which has the currency of a hyper-inflationary economy) that have a functional currency different from the presentation currency are translated into the presentation currency as follows: (i) Assets and liabilities for each balance sheet presented are
translated at the closing rate at the date of that balance sheet;
(ii) Income and expenses for each income statement are translated at average exchange rates (unless this average is not a reasonable approximation of the cumulative effect of the rates prevailing on the transaction dates, in which case income and expenses are translated at the rate on the dates of the transactions); and
(iii) All resulting exchange differences are recognised in other comprehensive income. Goodwill and fair value adjustments arising on the acquisition of a foreign entity are treated as assets or liabilities of the foreign entity and translated at the closing rate. Exchange differences arising are recognised in other comprehensive income.
INTANGIBLES
(a) Goodwill Goodwill arises on the acquisition of subsidiaries and represents the excess of the consideration transferred in an acquisition over the group’s share in net fair value of the net identifiable assets, liabilities and contingent liabilities of the acquired and the amount of the non-controlling interest in the acquiree. Goodwill on acquisitions of subsidiaries is included in intangible assets. Goodwill on acquisitions of associates is included in investments in associates and is tested for impairment as part of the overall balance. Goodwill is tested annually for impairment and carried at cost less accumulated impairment losses. Impairment losses on goodwill are not reversed and is recognised in profit or loss.
98 METaIR 2014 INTEGRATED ANNUAL REPORT
ACCOUNTING POLICIES CONTINUED
98 METAIR 2014 INTEGRATED ANNUAL REPORT
The carrying value of goodwill is compared to the recoverable amount which is the higher of value-in-use and the fair value less cost to sell. Goodwill is allocated to cash-generating units for the purpose of impairment testing. The allocation is made to those cash-generating units or groups of cash-generating units that are expected to benefit from the business combination in which the goodwill arose. Each unit or group of units to which the goodwill is allocated represents the lowest level within the entity at which the goodwill is monitored for internal management purposes. Goodwill is monitored at the operating segment level. Gains or losses on the disposal of an entity include the carrying amount of goodwill relating to the entity sold.
(b) Trademarks and licences Separately acquired trademarks and licences are shown at historical cost. Trademarks and licences acquired in a business combination are recognised at fair value at the acquisition date. Trademarks and licences have a finite useful life and are carried at cost less accumulated amortisation. Amortisation is calculated using the straight-line method to allocate the cost of trademarks and licences over their estimated useful lives of 15 years. The amortisation methods and estimated remaining useful lives are reviewed at least annually.
(c) Customer relationships
Customer relationships are recognised at cost, or if they were acquired in a business combination they are recognised at fair value at the acquisition date. These intangibles have a finite useful life and are carried at cost less accumulated amortisation. Amortisation is charged to the income statement on a straight line basis over their estimated useful lives of 5 to 15 years. The amortisation methods and estimated remaining useful lives are reviewed at least annually.
(d) Brands Brands are recognised at cost, or if they were acquired in a business combination they are recognised at fair value at the acquisition date. Brands are classified into two categories: brands with a finite useful life and are carried at cost less accumulated amortisation (definite lives) and brands which have been assessed by management as an indefinite useful life intangible asset and not subject to amortisation. The Mutlu brand has been assessed as an indefinite useful life intangible asset and is based on an analysis of relevant underlying factors confirming that there is no foreseeable limit to the period over which the asset is expected to generate net cash flows for the group. This assumption is further justified by the strong presence the brand has in Turkey and the rest of its international market place and management’s intention to keep the Mutlu brand indefinitely. Amortisation is charged to the income statement on a straight line
basis over the useful life of the asset of 25 years. The amortisation
methods and estimated remaining useful lives are reviewed at
least annually. The indefinite life intangible assets are tested for
impairment annually. The assessment that the estimated useful
lives of these assets are indefinite is reviewed at least annually.
Subsequent expenditure on acquired intangible assets is capitalised only when the cost meets the definition and recognition criteria of IAS 38 and the costs can be reliably measured.
(e) Computer software Acquired computer software licences are capitalised on the basis of the costs incurred to acquire and bring to use the specific software. These costs are amortised over their estimated useful lives.
Costs associated with maintaining computer software programs are recognised as an expense as incurred. Costs that are directly associated with the production of identifiable and unique software products controlled by the group, and that will probably generate economic benefits exceeding costs beyond one year, are recognised as intangible assets. Direct costs include the costs of software development employees and an appropriate portion of relevant overheads. Computer software development costs recognised as assets are amortised over their estimated useful lives (3 - 5 years).
PROPERTY, PLANT AND EQUIPMENT (a) Owned assets Land and buildings comprise mainly factories and offices. All property, plant and equipment is stated at historical cost less depreciation. Historical cost includes expenditure that is directly attributable to the acquisition of the items. Cost may also include transfers from equity of any gains or losses on qualifying cash flow hedges of foreign currency purchases of property, plant and equipment. Subsequent costs are included in the asset’s carrying amount or recognised as a separate asset, as appropriate, only when it is probable that future economic benefits associated with the item will flow to the group and the cost of the item can be measured reliably. All other repairs and maintenance are charged to the income statement during the financial period in which they are incurred. Land is not depreciated. Depreciation on other assets is calculated using the straight-line method to reduce their cost to their residual values over their estimated useful lives as follows: Buildings 50 years Plant, machinery and equipment 3 - 20 years Vehicles and furniture and fittings 3 - 5 years Where parts of an item of property, plant and equipment have different useful lives, they are accounted for as separate items of property, plant and equipment. Residual values and useful lives of all assets are reviewed, and adjusted if appropriate, on an annual basis. In addition, depreciation of an item of property, plant and equipment is to begin when it is available for use and ceases at the earlier of the date it is classified as held for sale or the date that it is derecognised upon disposal. Expenditure incurred on the construction of property, plant and equipment is capitalised within property, plant and equipment and depreciated once brought into use. An asset’s carrying amount is written down immediately to its recoverable amount if the asset’s carrying amount is greater than its estimated recoverable amount. Gains or losses on disposals are determined by comparing the proceeds with the carrying amount and are recognised within other operating income and expenses in the income statement. (b) Assets held under finance leases Assets leased in terms of finance lease agreements are capitalised. These are leases were a significant portion of the risk and rewards are taken up by the group. At commencement of the lease term, the lessee recognises finance lease assets and liabilities in the balance sheet at an amount equal to the fair value of the leased asset or if lower, the present value of the minimum lease payments. These assets are depreciated on the straight-line basis to their estimated residual value at rates considered appropriate to reduce book values over the shorter of the duration

99METaIR 2014 INTEGRATED ANNUAL REPORT
DIRECTORS’ REPORT CONTINUED
METAIR 2014 INTEGRATED ANNUAL REPORT 99
of the lease agreements or useful life of the assets. Finance costs are charged to the income statement over the period of the lease. Finance leases are capitalised at the estimated present value of the underlying lease payments. Each lease payment is allocated between the liability and the finance charge so as to achieve a constant rate on the finance balance outstanding.
(c) Spare parts and tooling Spare parts are classified as plant and equipment rather than inventory when they meet the definition of property, plant and equipment. Tooling used in the production of a specific project is subjected to an economic analysis of contractual relations with the automaker/customer in order to determine which party has control over the associated future risks and rewards of ownership. Tooling is capitalised as part or plant and equipment only when the group has control over these risks and rewards.
LEASES
Leases in which a significant portion of the risks and rewards of ownership are retained by the lessor are classified as operating leases. Payments made under operating leases (net of any incentives received from the lessor) are charged to the income statement on a straight-line basis over the period of the lease.
IMPAIRMENT OF NON-FINANCIAL ASSETS
Assets that have an indefinite useful life, for example goodwill, are not subject to amortisation and are tested annually for impairment. The group periodically evaluates the carrying value of property, plant and equipment and intangible assets, when events and circumstances warrant such a review. The carrying value of an asset is considered to be impaired, when the recoverable amount of such an asset is less than its carrying value. In that event, a loss is recognised based on the amount by which the carrying value exceeds the recoverable amount. The recoverable amount is the higher of an asset’s fair value less costs to sell and value-in-use. For the purposes of assessing impairment, assets are grouped at the lowest levels for which there are separately identifiable cash flows (cash generating units). In assessing value-in-use, the estimated future cash flows are discounted to their present value using a pre-tax discount rate that reflects current market assessments of time value of money and the risks specific to the asset. Fair value less costs to sell is the amount obtainable from the sale of an asset in an arm’s length transaction between knowledgeable willing parties, less the costs of disposal. Where it is not possible to estimate the recoverable amount of an individual asset, the group estimates the recoverable amount of the cash generating unit to which the asset belongs. Non-financial assets other than goodwill that suffered impairment are reviewed for possible reversal of the impairment at each reporting date.
INVENTORY Inventory is stated at the lower of cost or net realisable value, due
account being taken of possible obsolescence. Cost is determined
on the first-in first-out method. The cost of finished goods and work
in progress comprises design costs, raw materials, direct labour,
other direct costs and related production overheads (based on
normal operating capacity).
Borrowing costs are excluded as manufactured inventories and are not considered to be qualifying assets. Net realisable value is the estimated selling price in the ordinary course of business, less applicable variable selling expenses.
CURRENT AND DEFERRED TAX (a) Income tax expense The tax expense for the period comprises current and deferred tax. Tax is recognised in the income statement, except to the extent that it relates to items recognised in other comprehensive income or directly in equity respectively. The current income tax charge is calculated on the basis of the tax laws enacted or substantively enacted at the reporting date in the countries where the company and its subsidiaries operate and generate taxable income. Management periodically evaluates positions taken in tax returns with respect to situations in which applicable tax regulation is subject to interpretation. It establishes provisions where appropriate on the basis of amounts expected to be paid to the tax authorities. The charge for current tax is predominantly based on results for the year as adjusted for income that is exempt and expenses that are not deductible using tax rates that are applicable to the taxable income and includes any adjustments to tax payable in respect of prior years.
(b) Deferred tax assets and liabilities Deferred income tax is recognised, using the liability method on temporary differences arising between the tax bases of assets and liabilities and their carrying amounts in the consolidated annual financial statements. However, deferred tax liabilities are not recognised if they arise from the initial recognition of goodwill; deferred income tax is not accounted for if it arises from initial recognition of an asset or liability in a transaction other than a business combination that, at the time of the transaction affects neither accounting nor taxable profit or loss. Deferred income tax is determined using tax rates (and laws) that have been enacted by the reporting date and are expected to apply when the related deferred income tax asset is realised or deferred income tax liability is settled. Deferred income tax assets are recognised only to the extent that it is probable that future taxable profit will be available against which the temporary differences can be utilised. Deferred income tax is provided on temporary differences arising on investments in subsidiaries and associates, except where the timing of the reversal of the temporary difference is controlled by the group and it is probable that the temporary difference will not reverse in the foreseeable future. The provision of deferred tax assets and liabilities reflects the tax consequences that would follow from the expected recovery or settlement of the carrying amount of its assets and liabilities. Deferred income tax assets and liabilities are offset when there is a legally enforceable right to offset current tax assets against current tax liabilities and when the deferred income taxes assets and liabilities relate to income taxes levied by the same taxation authority on either the same taxable entity or different taxable entities where there is an intention to settle the balances on a net basis.
PROVISIONS
Provisions are recognised when the group has a present legal or constructive obligation as a result of past events, it is probable that an outflow of resources embodying economic benefits will be required to settle the obligation and a reliable estimate of the amount of the obligation can be made. The group recognises the estimated liability on all products still under warranty at the reporting date. This provision is calculated based on service histories.

100 METaIR 2014 INTEGRATED ANNUAL REPORT
ACCOUNTING POLICIES CONTINUED
100 METAIR 2014 INTEGRATED ANNUAL REPORT
Provisions are measured at the present value of the expenditures expected to be required to settle the obligation using a pre-tax rate that reflects current market assessments of the time value of money and the risks specific to the obligation. The increase in the provision due to the passage of time is recognised as an interest expense.
TRADE PAYABLES
Trade payables are obligations to pay for goods or services that have been acquired in the ordinary course of business from suppliers. Accounts payable are classified as current liabilities if payment is due within one year or less (or in the normal operating cycle of the business if longer). If not, they are presented as non-current liabilities. Trade payables are recognised initially at fair value and subsequently measured at amortised cost using the effective interest method.
REVENUE
Revenue is recognised only when it is probable that the economic benefits associated with a transaction will flow to the group and the amount of revenue can be measured reliably and when specific criteria have been met for each of the group’s activities as described below. The amount of revenue is not considered to be reliably measurable until all contingencies relating to the sale have been resolved. The group bases its estimates on historical results, taking into consideration the type of customer, the type of transaction and the specifics of each arrangement. Revenue comprises the fair value of the consideration received or receivable for the sale of goods and services in the ordinary course of the group’s activities. Revenue is shown net of value added tax, estimated returns, rebates and discounts and after inter-company sales has been eliminated.
(a) Sales of goods - Original Equipment Manufacturers (OEM) and Aftermarket The group manufactures and sells a range of products predominantly for the automotive industry. The group produces and supplies components to major OEM manufactures in South Africa. The group also manufactures and distributes spare parts for use in the motor vehicle aftermarket, and non-automotive products for various other sectors of industry. Sales of goods are recognised when a group entity has delivered products to the customer and there is no unfulfilled obligations that could affect the customer’s acceptance of the products. Delivery does not occur until the products have been shipped to the specified location, the risks of obsolescence and loss have been transferred to the customer, and either the customer has accepted the products and all risks and rewards associated with them, the acceptance provisions have lapsed or the group has objective evidence that all criteria for acceptance have been satisfied. The automotive products are sometimes sold with a right to return faulty products. Accumulated experience is used to estimate and provide for such returns at the time of sale. Sales are recorded at fair value based on the price specified in the sales contracts or agreed pricing. (b) Dividends Dividends are recognised when the right to receive payment is established.
(c) Interest Interest is recognised on a time proportion basis that takes account of the effective yield on the asset.
When a receivable is impaired, the group reduces the carrying amount to its recoverable amount, being the estimated future cash flow discounted at the original effective interest rate of the instrument and continues unwinding the discount as interest income. Interest income on impaired loans is recognised using the original effective interest rate.
GOVERNMENT GRANTS AND SIMILAR INCENTIVES
The group qualifies for certain incentives and allowances mainly linked to investment stimulation and production output such as the Automotive Incentive Scheme (AIS), the Enterprise Investment Programme (EIP), the Productive Asset Allowance (PAA), the Automotive Production and Development Programme (APDP) and other state and schemes (foreign). Government grants that compensate the group for the cost of an asset are recognised in the balance sheet initially as deferred income when there is reasonable assurance that they will be received and that the group will comply with the conditions attached to the grants. The grants are amortised to the income statement as other operating income on a systematic basis over the useful life of the asset. Grants are classified as non-current to the extent that they are long-term in nature. Government grants that compensate the group for expenses incurred are recognised in the income statement as other operating income when there is reasonable assurance that they will be received and that the group will comply with the conditions attached to the grants. These are recognised over the period necessary to match them with the costs that they are intended to compensate. Grants are recognised at their fair value when there is a reasonable assurance that the grant will be received and the group will comply with all attached conditions.
EARNINGS PER SHARE
Basic earnings per share is expressed in cents and is based on the net profit attributable to ordinary shareholders divided by the weighted average number of shares in issue during the year, excluding ordinary shares purchased by the company (treasury shares). Diluted earnings per share is calculated by adjusting the weighted average number of ordinary shares outstanding to assume conversion of all dilutive potential ordinary shares (incentive shares). Headline earnings is earnings as determined by IAS 33, excluding ‘separately identifiable re-measurements’ (as defined in SAICA Circular 2/2013), net of related tax (both current and deferred) and related non-controlling interest, other than re-measurements specifically included in headline earnings ‘included re-measurements’ (as defined in SAICA Circular 2/2013). FINANCIAL INSTRUMENTS
Financial instruments carried at the reporting date include cash and bank balances / overdrafts, investments, receivables, trade creditors, borrowings and derivatives. These also exclude prepayments and certain statutory and employee related payables. Financial assets and liabilities are recognised on the balance sheet when the group and company becomes a party to the contractual provisions of the instrument.

101METaIR 2014 INTEGRATED ANNUAL REPORT
DIRECTORS’ REPORT CONTINUED
METAIR 2014 INTEGRATED ANNUAL REPORT 101
Financial assets and liabilities are offset and the net amount reported in the balance sheet when there is a legally enforceable right to offset the recognised amounts and there is an intention to settle on a net basis or realise the asset and settle the liability simultaneously.
(a) Derivative financial instruments and hedging activities All derivative financial instruments are initially recognised at fair value and are subsequently stated at fair value at the reporting date. Attributable transaction costs are recognised in the income statement when incurred. Resulting gains or losses on derivative instruments, excluding designated and effective hedging instruments, are recognised in the income statement within other operating income and expenses. The group does not hold or issue derivative financial instruments for dealing purposes. The group is exposed to market risks from changes in interest rates, foreign exchange rates and commodity prices. The group uses derivative instruments to hedge its exposure to these risks. The group predominantly uses forward foreign exchange contracts (FEC’s) to limit risk in changes in foreign exchange rates. To the extent that a derivative instrument has a maturity period of longer than one year, the fair value of these instruments will be reflected as a non-current asset or liability. The method of recognising the resulting gain or loss is dependent on whether the derivative is designated as a hedging instrument, and if so, the nature of the item being hedged. The group designates certain derivatives as either: - hedges of the fair value of recognised assets or liabilities or firm commitment (fair value hedge); or - hedges of a particular risk associated with a recognised asset
or liability or a highly probable forecast transaction (cash flow hedge).
The group’s criteria for a derivative instrument to be designated as a hedging instrument at the inception of the transaction require that: - the hedge transaction is expected to be highly effective in
achieving offsetting changes in fair value or cash flows attributable to the hedged risk;
- the effectiveness of the hedge can be reliably measured throughout the duration of the hedge;
- there is adequate documentation of the hedging relationship at the inception of the hedge; and
- for cash flow hedges, the forecast transaction that is the subject of the hedge must be highly probable.
Where a derivative instrument is designated as a cash flow hedge of an asset, liability or highly probable forecast transaction that could affect the income statement, the effective part of any gain or loss arising on the derivative instrument is recognised as other comprehensive income and is classified as a cash flow hedge accounting reserve until the underlying transaction occurs. The ineffective part of any gain or loss is recognised in the income statement. If the hedging instrument no longer meets the criteria for cash flow hedge accounting, expires or is sold, terminated, exercised, or the designation is revoked, then hedge accounting is discontinued prospectively. If the forecast transaction results in the recognition of a non-financial asset or non-financial liability, the associated gain or loss is transferred from the cash flow hedge accounting reserve, as other comprehensive income, to the underlying asset or liability on the transaction date. If the forecast transaction is no longer expected to occur, then the cumulative balance in other comprehensive income is recognised immediately in the income statement as reclassification adjustments. Other cash flow hedge gains or losses are recognised in the income statement at the same time as the hedged transaction occurs.
When derivative instruments, including forward exchange
contracts, are entered into as fair value hedges, no hedge
accounting is applied (held for trading). All gains and losses on fair
value hedges are recognised in the income statement.
The fair values of derivative instruments used for hedging purposes are disclosed in note 21. (b) Financial assets The group classifies its financial assets in the following categories: at fair value through profit or loss and loans and receivables. The classification depends on the purpose for which the financial assets were acquired. Management determines the classification of its financial assets at initial recognition. Financial assets at fair value through profit or loss Financial assets at fair value through profit or loss are ‘financial assets held for trading’. A financial asset is classified in this category if acquired principally for the purpose of selling in the short term. Derivatives are also categorised as ‘held for trading’ unless they are designated as hedges. Assets in this category are classified as current assets if they are either held for trading or are expected to be realised within 12 months of the reporting date. Refer to note 21. Loans and receivables Trade and other receivables are non-derivative financial assets with fixed or determinable payments that are not quoted in an active market. They are included in current assets, except for maturities greater than 12 months after the reporting date. These are classified as non-current assets. Loans and receivables are classified as ‘trade and other receivables’ in the balance sheet (refer note 12), ‘short-term loans - subsidiaries’ (refer note 9) and ‘cash and cash equivalents’ (refer note 13). Recognition and measurement Regular purchases and sales of financial assets are recognised on trade-date - the date on which the group commits to purchase or sell the asset. Financial assets are initially recognised at fair value plus transaction costs for all financial assets not carried at fair value through profit or loss. Financial assets carried at fair value through profit or loss are initially recognised at fair value and transaction costs are expensed in the income statement. Financial assets are derecognised when the rights to receive cash flows from the investments have expired or have been transferred and the group has transferred substantially all risks and rewards of ownership. Financial assets at fair value through profit or loss are subsequently carried at fair value. Loans and receivables are carried at amortised cost using the effective interest method. Gains or losses arising, from changes in the fair value of the ‘financial assets at fair value through profit or loss’ category, including interest and dividend income, are presented in the income statement within ‘other operating income and expenses’, in the period in which they arise. Fair value estimation The fair values of financial assets are based on quoted market prices or amounts derived using a discounted cash flow model. The fair value of forward exchange contracts is determined using forward exchange market rates at the reporting date. The nominal value less estimated credit adjustments of trade receivables is assumed to approximate their fair values. Premiums or discounts arising from the difference between the fair value of a financial asset and the amount receivable at maturity date are charged to the income statement based on the effective interest method.

102 METaIR 2014 INTEGRATED ANNUAL REPORT
ACCOUNTING POLICIES CONTINUED
102 METAIR 2014 INTEGRATED ANNUAL REPORT
Impairment of financial assets An assessment is performed at each reporting date to determine whether objective evidence exists that a financial asset is impaired. Objective evidence that financial instruments are impaired includes indications of a debtor or group of debtors experiencing significant financial difficulty, default or delinquency of payments, the probability of a debtor entering bankruptcy, or other observable data indicating a measurable decrease in estimated future cash flows, such as economic conditions that correlate with defaults. An impairment loss in respect of a financial asset measured at amortised cost is calculated as the difference between its carrying amount and the present value of the estimated future cash flows discounted at the asset’s original effective interest rate. Impairment losses are charged to the income statement and are included in the allowance against loans and receivables. When a subsequent event causes the impairment loss to decrease, the impairment loss is reversed in the income statement. Loans and receivables, together with the associated allowance, are written off when there is no realistic prospect of future recovery. (c) Financial liabilities Financial liabilities are recognised on the transaction date when the group becomes a party to the contract and thus has a contractual obligation and are derecognised when these contractual obligations are discharged, cancelled or expired. The group classifies its financial liabilities as either at fair value through profit or loss (predominantly derivatives) and amortised cost. Financial liabilities are stated initially on the transaction date at fair value including transaction costs. Subsequently, they are stated at amortised cost using the effective interest method, other than those designated at fair value through profit or loss.
TRADE RECEIVABLES
Trade receivables are recognised initially at fair value and subsequently measured at amortised cost using the effective interest method, less provision for impairment. A provision for impairment of trade receivables is established when there is objective evidence that the group will not collect the amount as per the original terms of receivables. The amount of the provision is the difference between the asset’s carrying value and the present value of future cash flows, discounted at the original effective interest rate. Significant financial difficulties of the debtor, probability that the debtor will enter bankruptcy or financial reorganisation, and default or delinquency in payments are considered indicators that the trade receivables are impaired. The amount of the provision is recognised in the income statement. The carrying amount of the asset is reduced through the use of an allowance account. The amount of the loss is recognised in the income statement. When a trade receivable is uncollectible, it is written off against the allowance account for trade receivables. Subsequent recoveries of amounts previously written off are credited in the income statement.
CASH AND CASH EQUIVALENTS
Cash and cash equivalents are carried in the balance sheet at carrying value. Cash and cash equivalents comprise cash on hand, deposits held on call with banks and other short-term, highly liquid investments with original maturities of three months or less, all of which are available for use by the group unless otherwise stated. Bank overdrafts are included within borrowings in current liabilities in the balance sheet.
BORROWINGS
Borrowings are recognised initially at fair value, net of transaction costs incurred. In subsequent periods, borrowings are stated at amortised cost using the effective interest method; any difference between proceeds (net of transaction costs) and the redemption value is recognised in the income statement over the period of the borrowing. Borrowing costs are expensed unless capitalised as part of the cost of a qualifying asset, which are assets that necessarily take a substantial period of time to get ready for their intended use or sale, are added to the cost of those assets, until such time as the assets are substantially ready for their intended use or sale. Borrowings are classified as current liabilities unless the group has an unconditional right to defer settlement of the liability for at least 12 months after the reporting date. Preference shares, which are mandatorily redeemable on a specific date, or at the option of the shareholders, or if dividend payments are not discretionary are classified as liabilities. The dividends on these preference shares are recognised in the income statement as interest expense.
EMPLOYEE BENEFITS
Remuneration of employees is charged to the income statement. Short-term employee benefits are those that are expected to be settled wholly before twelve months after the end of the annual reporting period in which the services have been rendered. Short-term employee benefit obligations are measured on an undiscounted basis and are charged to the income statement as the related service is provided. Long-term employee benefits are those benefits that are expected to be wholly settled more than twelve months after the end of the annual reporting period, in which the services have been rendered and are discounted to their present value. An accrual is recognised for accumulated leave, incentive bonuses and other employee benefits when the group has a present legal or constructive obligation as a result of past service provided by the employee, and a reliable estimate of the amount can be made. Retirement benefits The group operates a number of defined contribution plans, the assets of which are generally held in separate trustee-administered funds. The plans are generally funded by payments from employees and by the relevant group companies taking account of the recommendations of independent qualified actuaries. The group also has an obligation in respect of its operations in Turkey which requires mandatory lump sum payments similar to that of a defined benefit pension plan. Defined benefit plans require a liability to be recognised in the balance sheet at the present value of the expected obligation at reporting date. There are no plan assets.
(a) Defined contribution pension plans For defined contribution pension plans, the group pays contributions to privately administered pension insurance plans on a mandatory, contractual or voluntary basis. The group has no further payment obligations once the contributions have been paid. The contributions are recognised as employee benefit expense when they are due. Prepaid contributions are recognised as an asset to the extent that a cash refund or a reduction in the future payments is available.

103METaIR 2014 INTEGRATED ANNUAL REPORT
DIRECTORS’ REPORT CONTINUED
METAIR 2014 INTEGRATED ANNUAL REPORT 103
(b) Defined benefit (post-employment) medical-aid benefits Some group companies provided post-employment health care benefits to their retirees until 31 December 1996. Employees who joined the group after 1 January 1997 do not receive this benefit. The entitlement to post-retirement health care benefits is based on the employee remaining in service up to retirement age and electing to participate in the scheme. Valuations of these obligations are carried out by independent qualified actuaries. The liability recognised in the balance sheet is the present value of the defined benefit obligation at the reporting date. The plans are unfunded. The defined benefit obligation is calculated annually by independent actuaries using the projected unit credit method. The present value of the defined benefit obligation is determined by discounting the estimated future cash outflows using interest rates of government bonds that are denominated in the currency in which the benefits will be paid and that have terms to maturity approximating to the terms of the related liability. The discount rate used is interest rates of high quality corporate bonds that are denominated in the currency in which the benefits will be paid, and that have terms to maturity approximating to the terms of the related obligation. In South Africa there is no deep and liquid market in such bonds and therefore the market rates on government bonds are used. For Turkey, the rates approved by Capital Markets Board are used. Actuarial gains or losses arising from experience adjustments and changes in actuarial assumptions are charged or credited to other comprehensive income in the statement of comprehensive income as remeasurements, in the period in which they arise. Past-service costs are recognised immediately in the income statement.
(c) Other post-employment benefits In accordance with the existing Turkish social legislation, the group is required to make lump-sum payments to current employees (employed in Mutlu Akü) whose employment is terminated due to retirement or for reasons other than resignation or misconduct. The expected costs of these benefits are accrued on a systematic basis over the expected remaining period of employment, using the accounting methodology described in respect of defined benefit plans above. Valuations of these are carried out by independent qualified actuaries. The obligation is discounted by using the market rate on government bonds or rates approved by the Turkish Markets Board.
(d) Long service The Group pays its employees a long service benefit after each five year period of continuous service. The benefit is paid in the month the employee reaches the milestone. The method of accounting and frequency of valuation are similar to those under the defined schemes. The actuarial valuation to determine the liability is performed annually.
(e) Bonus plans The group recognises a liability and an expense for bonuses and similar items based on a formulae that takes into consideration, amongst others, the profit attributable after certain adjustments. The group recognises a provision where contractually obliged or where there is a past practice that has created a constructive obligation.
(f) Share-based payment transactions
The group operates an equity settled share-based payment compensation plan. The fair value of share options, share appreciation rights, deferred delivery shares, bonus shares and performance shares granted to group directors and senior executives are recognised as an employee expense with a
corresponding increase in equity. The fair value is measured at grant date and expensed over the period during which the employee becomes unconditionally entitled to the equity instruments. The fair value of the instruments granted is measured using generally accepted valuation techniques, taking into account the terms and conditions upon which the instruments are granted excluding the impact of non-market vesting conditions. Fair value is measured using the Black Scholes, Binomial tree and Monte-Carlo option pricing models where applicable. The expected life used in the models has been adjusted, based on management’s best estimate, for the effects behavioural considerations such as volatility, dividend yield and the vesting period. The fair value takes into account the terms and conditions on which these incentives are granted and the extent to which the employees have rendered service to the reporting date. Non-market vesting conditions are included in assumptions about the number of options that are expected to become exercisable. At each reporting date, the entity revises its estimates of the number of options that are expected to become exercisable. It recognises the impact of the revision of original estimates, if any, for equity settled share-based payments, in the income statement, with a corresponding adjustment to equity. The grant by the company of options over its equity instruments to the employees of subsidiary undertakings in the group is treated as a capital contribution. The fair value of employee services received, measured by reference to the grant date fair value of equity instruments granted, is recognised over the vesting period as an increase to investment in subsidiary undertakings, with a corresponding credit to equity in the parent entity accounts. The group’s net vesting impact on the vesting of share-based payment obligations transferred to retained earnings within the statement of changes in equity. The accounting policy has been applied to all equity instruments granted after 7 November 2002 that had not yet vested at 1 January 2004, the date of transition to IFRS 2.
STATED CAPITAL
Ordinary shares are classified as equity. Incremental costs directly attributable to the issue of new shares or options are shown in equity as a deduction, net of tax, from the proceeds. Where a group company purchases the company’s equity stated capital (treasury shares), the consideration paid, including any directly attributable incremental costs (net of income taxes) is deducted from equity attributable to the company’s equity holders until the shares are cancelled, reissued or disposed of. Where such shares are subsequently sold or reissued, any consideration received, net of any directly attributable incremental transaction costs and the related income tax effects, and is included in equity attributable to the company’s equity holders. Dividends received on treasury shares are eliminated on consolidation.
DIVIDENDS PAYABLE
Dividend distribution to the company’s shareholders is recognised as a liability in the annual financial statements in the period in which the dividends are approved by the company in a general meeting or the board.
104 METaIR 2014 INTEGRATED ANNUAL REPORT
ACCOUNTING POLICIES CONTINUED
104 METAIR 2014 INTEGRATED ANNUAL REPORT
DIVIDENDS WITHHOLDING TAX
Dividends withholding tax is a tax on shareholders receiving dividends and is applicable to all dividends declared on or after 1 April 2012. The group withholds dividends tax on behalf of its shareholders at a rate of 15% on dividends declared. Amounts withheld are not recognised as part of the group’s tax charge but rather as part of the dividend paid recognised directly in equity. Where withholding tax is withheld on dividends received, the dividend is recognised at the gross amount with the related withholdings tax recognised as part of tax expense unless it is otherwise reimbursable in which case it is recognised as an asset.
SEGMENT REPORTING
An operating segment is a component of an entity that engages in
business activities from which it may earn revenues and incur
expenses, whose results are reviewed by the executive decision
makers to allocate resources and to assess its performance.
Operating segments are reported in a manner consistent with the
internal reporting provided to the chief operating decision makers.
The chief operating decision makers, who are responsible for
allocating resources and assessing performance of the operating
segments, have been identified as the executive board of directors
that makes strategic decisions. The operating activities of the
Group (predominantly automotive) are structured according to the
markets served. Reportable segments derive their sales from the
manufacture of products.
COMPARATIVE FIGURES
The comparative figures are reclassified or restated as necessary to afford a proper and more meaningful comparison of results as set out in note 29 to the financial statements. Following the acquisition of the Mutlu group on 5 December 2013, the Group determined a provisional fair value opening balance sheet which was presented in the comparative year. During the hindsight period further work has been completed on the assumptions used to establish provisional fair value amounts. As a result of this work the opening balance sheet has changed and further details on the restated balance sheet for 2013 can be found in note 28. There has been no material impact on the consolidated income statement, consolidated statement of comprehensive income or consolidated cash flow statement for the full year 2013. Certain additional disclosure has been provided in respect of the current year. To the extent practicable, comparative information has also been provided.
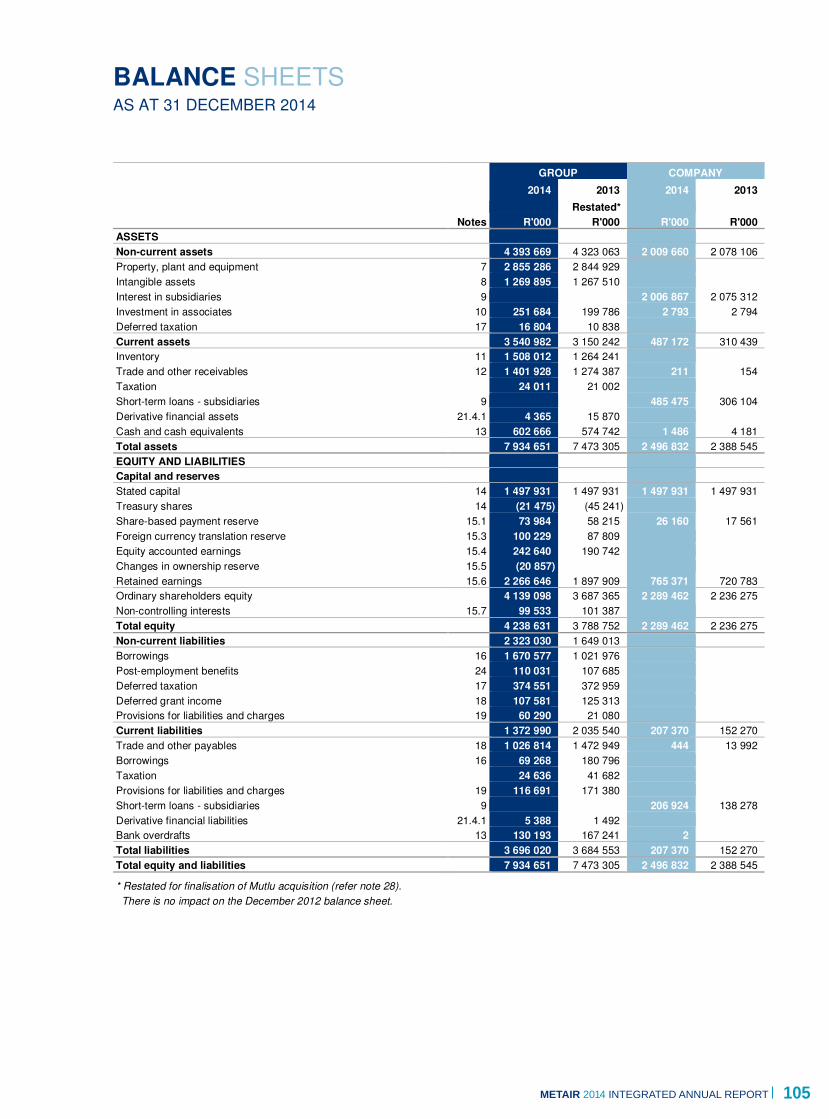
105METaIR 2014 INTEGRATED ANNUAL REPORT
BALANCE SHEETS AS AT 31 DECEMBER 2014
METAIR 2014 INTEGRATED ANNUAL REPORT 105
GROUP COMPANY
2014 2013 2014 2013
Restated*.
Notes R'000 R'000 R'000 R'000
ASSETS
Non-current assets 4 393 669 4 323 063 2 009 660 2 078 106
Property, plant and equipment 7 2 855 286 2 844 929
Intangible assets 8 1 269 895 1 267 510
Interest in subsidiaries 9 2 006 867 2 075 312
Investment in associates 10 251 684 199 786 2 793 2 794
Deferred taxation 17 16 804 10 838
Current assets 3 540 982 3 150 242 487 172 310 439
Inventory 11 1 508 012 1 264 241
Trade and other receivables 12 1 401 928 1 274 387 211 154
Taxation 24 011 21 002
Short-term loans - subsidiaries 9 485 475 306 104
Derivative financial assets 21.4.1 4 365 15 870
Cash and cash equivalents 13 602 666 574 742 1 486 4 181
Total assets 7 934 651 7 473 305 2 496 832 2 388 545
EQUITY AND LIABILITIES
Capital and reserves
Stated capital 14 1 497 931 1 497 931 1 497 931 1 497 931
Treasury shares 14 (21 475) (45 241)
Share-based payment reserve 15.1 73 984 58 215 26 160 17 561
Foreign currency translation reserve 15.3 100 229 87 809
Equity accounted earnings 15.4 242 640 190 742
Changes in ownership reserve 15.5 (20 857)
Retained earnings 15.6 2 266 646 1 897 909 765 371 720 783
Ordinary shareholders equity 4 139 098 3 687 365 2 289 462 2 236 275
Non-controlling interests 15.7 99 533 101 387
Total equity 4 238 631 3 788 752 2 289 462 2 236 275
Non-current liabilities 2 323 030 1 649 013
Borrowings 16 1 670 577 1 021 976
Post-employment benefits 24 110 031 107 685
Deferred taxation 17 374 551 372 959
Deferred grant income 18 107 581 125 313
Provisions for liabilities and charges 19 60 290 21 080
Current liabilities 1 372 990 2 035 540 207 370 152 270
Trade and other payables 18 1 026 814 1 472 949 444 13 992
Borrowings 16 69 268 180 796
Taxation 24 636 41 682
Provisions for liabilities and charges 19 116 691 171 380
Short-term loans - subsidiaries 9 206 924 138 278
Derivative financial liabilities 21.4.1 5 388 1 492
Bank overdrafts 13 130 193 167 241 2
Total liabilities 3 696 020 3 684 553 207 370 152 270
Total equity and liabilities 7 934 651 7 473 305 2 496 832 2 388 545
* Restated for finalisation of Mutlu acquisition (refer note 28).
There is no impact on the December 2012 balance sheet.

106 METaIR 2014 INTEGRATED ANNUAL REPORT
INCOME STATEMENTS FOR THE YEAR ENDED 31 DECEMBER 2014
106 METAIR 2014 INTEGRATED ANNUAL REPORT
GROUP COMPANY
2014 2013 2014 2013
Notes R'000 R'000 R'000 R'000
Revenue 1 7 278 815 5 227 426
Cost of sales (5 695 917) (4 177 984)
Gross profit 1 582 898 1 049 442
Other operating income 3 162 755 98 087 267 532 343 870
Distribution costs (353 166) (222 328)
Administrative expenses (560 431) (451 732) (11 394)
Other operating expenses (2 675) (27 855) (1 783)
Operating profit 3 829 381 445 614 256 138 342 087
Interest income 2 22 698 15 421 13 1
Interest expense 2 (118 935) (27 888)
Share of results of associates 10 70 006 61 924
Profit before taxation 3 803 150 495 071 256 151 342 088
Taxation 4 (170 845) (121 172)
Profit for the year 632 305 373 899 256 151 342 088
Attributable to:
Equity holders of the company 601 460 341 376 256 151 342 088
Non-controlling interests 30 845 32 523
632 305 373 899 256 151 342 088
Earnings per share
Basic earnings per share (cents) 5 308 229
Diluted earnings per share (cents) 5 305 223

107METaIR 2014 INTEGRATED ANNUAL REPORT
STATEMENTS OF COMPREHENSIVE INCOME FOR THE YEAR ENDED 31 DECEMBER 2014
METAIR 2014 INTEGRATED ANNUAL REPORT 107
GROUP COMPANY
2014 2013 2014 2013
Notes R'000 R'000 R'000 R'000
Profit for the year 632 305 373 899 256 151 342 088
Other comprehensive income:
Items that will not be reclassified to profit or loss:
- Actuarial (losses)/gains recognised 24 (13 197) 395
- Taxation effect 17 2 703 (157)
(10 494) 238
Items that may be reclassified to profit or loss:
- Exchange gains arising on translation of foreign operations 15.3 12 338 51 881
- Cash flow hedges 15.2 110 377
12 338 162 258
Other comprehensive income for the year net of taxation 1 844 162 496
Attributable to:
Equity holders of the company 2 042 161 806
Non-controlling interests 15.7 (198) 690
1 844 162 496
Total comprehensive income for the year 634 149 536 395 256 151 342 088
Attributable to:
Equity holders of the company 603 502 503 182 256 151 342 088
Non-controlling interests 15.7 30 647 33 213
634 149 536 395 256 151 342 088

108 METaIR 2014 INTEGRATED ANNUAL REPORT
STATEMENT OF CHANGES IN EQUITY FOR THE YEAR ENDED 31 DECEMBER 2014
108 METAIR 2014 INTEGRATED ANNUAL REPORT
GROUP
Attribu-.
table.
Share. to equity.
capital. holders. Non-.
Stated. and. Treasury. Other. Retained. of the. controlling. Total.
capital. premium. shares. reserves. earnings. company. interests. equity.
Notes R'000 R'000 R'000 R'000 R'000 R'000 R'000 R'000
Year ended 31 December 2014
Balance as at 1 January 2014 14, 15 1 497 931 (45 241) 336 766 1 897 909 3 687 365 101 387 3 788 752
Net profit for the year 15 601 460 601 460 30 845 632 305
Other comprehensive income 15 12 420 (10 378) 2 042 (198) 1 844
Total comprehensive income for the period 15 12 420 591 082 603 502 30 647 634 149
Employee share option scheme 15.1 17 033 17 033 17 033
Vesting of share-based payment obligation 14, 15.1 21 184 (33 625) (12 441) (12 441)
Transfer of net vesting impact to retained earnings 15.1, 15.6 33 625 (33 625)
Loss on settlement of old share scheme 15.1 (1 264) (1 264) (1 264)
Shares disposed by the Metair Share Trust 14.1 2 582 2 582 2 582
Transfer of associate profit and dividend 15.4 51 898 (51 898)
Dividend* 15.6 (136 822) (136 822) (32 501) (169 323)
Acquisition/disposal of non-controlling interests 15.5 (20 857) (20 857) (20 857)
Balance as at 31 December 2014 1 497 931 (21 475) 395 996 2 266 646 4 139 098 99 533 4 238 631
Year ended 31 December 2013 Balance as at 1 January 2013 (restated) 14, 15 42 876 (72 232) 241 842 1 755 168 1 967 654 85 076 2 052 730
Net profit for the year 15 341 376 341 376 32 523 373 899
Other comprehensive income 15 161 526 280 161 806 690 162 496
Total comprehensive income for the period 15 161 526 341 656 503 182 33 213 536 395
Conversion of par value ordinary shares to ordinary
shares of no par value 14 42 876 (42 876)
Proceeds from shares issued 14 1 500 000 1 500 000 1 500 000
Share issue costs 14 (44 945) (44 945) (44 945)
Employee share option scheme 15.1 25 514 25 514 25 514
Vesting of share-based payment obligation 14, 15.1 25 896 (41 019) (15 123) (15 123)
Transfer of net vesting impact to retained earnings 15.1, 15.6 41 019 (41 019)
Loss on settlement of old scheme 15.1 (586) (586) (586)
Shares disposed by the Metair Share Trust 14 1 095 1 095 1 095
Transfer of purchase consideration to subsidiary 15.2 (110 377) (110 377) (110 377)
Transfer of associate profit and dividend 15.4 18 847 (18 847)
Dividend** 15.6 (139 049) (139 049) (16 902) (155 951)
Balance as at 31 December 2013 1 497 931 (45 241) 336 766 1 897 909 3 687 365 101 387 3 788 752
* An ordinary dividend of 70 cents per share was declared in respect of the year ended 31 December 2013.
** An ordinary dividend of 95 cents per share was declared in respect of the year ended 31 December 2012.

109METaIR 2014 INTEGRATED ANNUAL REPORT
STATEMENT OF CHANGES IN EQUITY FOR THE YEAR ENDED 31 DECEMBER 2014
METAIR 2014 INTEGRATED ANNUAL REPORT 109
COMPANY
Attribu-.
table.
Share. Share-. to equity.
capital. based. holders.
Stated. and. Treasury. payment. Retained. of the. Total.
capital. premium. shares. reserves. earnings. company. equity.
Notes R'000 R'000 R'000 R'000 R'000 R'000 R'000
Year ended 31 December 2014
Balance as at 1 January 2014 1 497 931 17 561 720 783 2 236 275 2 236 275
Net profit for the year 15.6 256 151 256 151 256 151
Total comprehensive income for the period 256 151 256 151 256 151
Employee share option scheme 15.1 15 348 15 348 15 348
Purchase of treasury shares 14 (79 022) (79 022) (79 022)
Settlement of share options 14, 15 79 022 (6 749) (72 273)
Dividend* 15.6 (139 290) (139 290) (139 290)
Balance as at 31 December 2014 1 497 931 26 160 765 371 2 289 462 2 289 462
Year ended 31 December 2013
Balance as at 1 January 2013 (restated) 42 876 11 666 613 866 668 408 668 408
Net profit for the year 15.5 342 088 342 088 342 088
Total comprehensive income for the period 15 342 088 342 088 342 088
Conversion of ordinary shares of 2 cents each into ordinary shares of no par value 14 42 876 (42 876)
Proceeds from shares issued 14 1 500 000 1 500 000 1 500 000 Share issue costs 14 (44 945) (44 945) (44 945) Employee share option scheme 15.1 9 747 9 747 9 747 Purchase of treasury shares 14 (94 118) (94 118) (94 118) Settlement of share options 14, 15.1 94 118 (3 852) (90 266) Dividend** 15.6 (144 905) (144 905) (144 905) Balance as at 31 December 2013 1 497 931 17 561 720 783 2 236 275 2 236 275 * An ordinary dividend of 70 cents per share was declared in respect of the year ended 31 December 2013. ** An ordinary dividend of 95 cents per share was declared in respect of the year ended 31 December 2012.

110 METaIR 2014 INTEGRATED ANNUAL REPORT
STATEMENTS OF CASH FLOWS FOR THE YEAR ENDED 31 DECEMBER 2014
110 METAIR 2014 INTEGRATED ANNUAL REPORT
GROUP COMPANY
2014 2013 2014 2013
Restated*
Notes R'000 R'000 R'000 R'000
CASH FLOWS FROM OPERATING ACTIVITIES
Cash generated from/(utilised in) operations 20.1 846 956 587 850 (5 984) (8 314)
Interest paid 2 (89 326) (27 888)
Taxation paid 20.2 (196 110) (88 814)
Dividends paid 20.3 (169 323) (155 951) (139 290) (144 905)
Dividend income from associates 10 18 108 43 077
Net cash inflow/(outflow) from operating activities 410 305 358 274 (145 274) (153 219)
CASH FLOWS FROM INVESTING ACTIVITIES
Acquisition of property, plant and equipment 7 (250 100) (134 643)
Acquisition of intangible assets 8 (16 467) (384)
Cash proceeds on insurance claim relating to property, plant and
equipment 3 6 357 15 342
Acquisition vendor and 'MTO' payment/acquisition of subsidiary 28.1 (593 692) (2 126 188)
Increase in interest in associate 10 (5 000)
Decrease/(increase) in advances to subsidiaries excluding impairment 68 447 (1 482 267)
Interest received 2 22 698 15 421 13 1
Dividends received 3 195 257 184 134
Proceeds on disposal of property, plant and equipment 3, 7 11 135 10 885
Net cash (outflow)/inflow from investing activities (820 069) (2 224 567) 263 717 (1 298 132)
CASH FLOWS FROM FINANCING ACTIVITIES
Preference shares raised 1 400 000
Revolving credit facility utilised 177 894
Absa term loan repaid (150 182)
Absa bridge facility drawdown 580 000 773 055
Absa bridge facility repaid (1 350 000)
Rombat 'RBS' term loan repaid (22 274)
Mutlu 'USD' and 'TRY' borrowings repaid (104 838)
Net movement in asset financing arrangements 6 472
Transactions with non-controlling interests 28.2 (54 144)
Long-term loans repaid (58 189)
Short-term loans raised 524
Short-term loans repaid (56 205) (121 140)
Proceeds from shares issued 14 1 500 000 1 500 000
Share issue costs 14 (44 945) (44 945)
Decrease in treasury shares 1 320 509
Cost of utilisation of treasury shares 15.1 (12 441) (15 123)
Net cash inflow/(outflow) from financing activities 471 807 2 099 626 (121 140) 1 455 055
Net increase/(decrease) in cash and cash equivalents 62 043 233 333 (2 697) 3 704
Cash and cash equivalents at the beginning of the year 407 501 216 428 4 181 477
Exchange gains/(loss) on cash and cash equivalents 2 929 (42 260)
Cash and cash equivalents at end of the year 13 472 473 407 501 1 484 4 181
* Restated for reclassification of transaction costs (refer note 29).
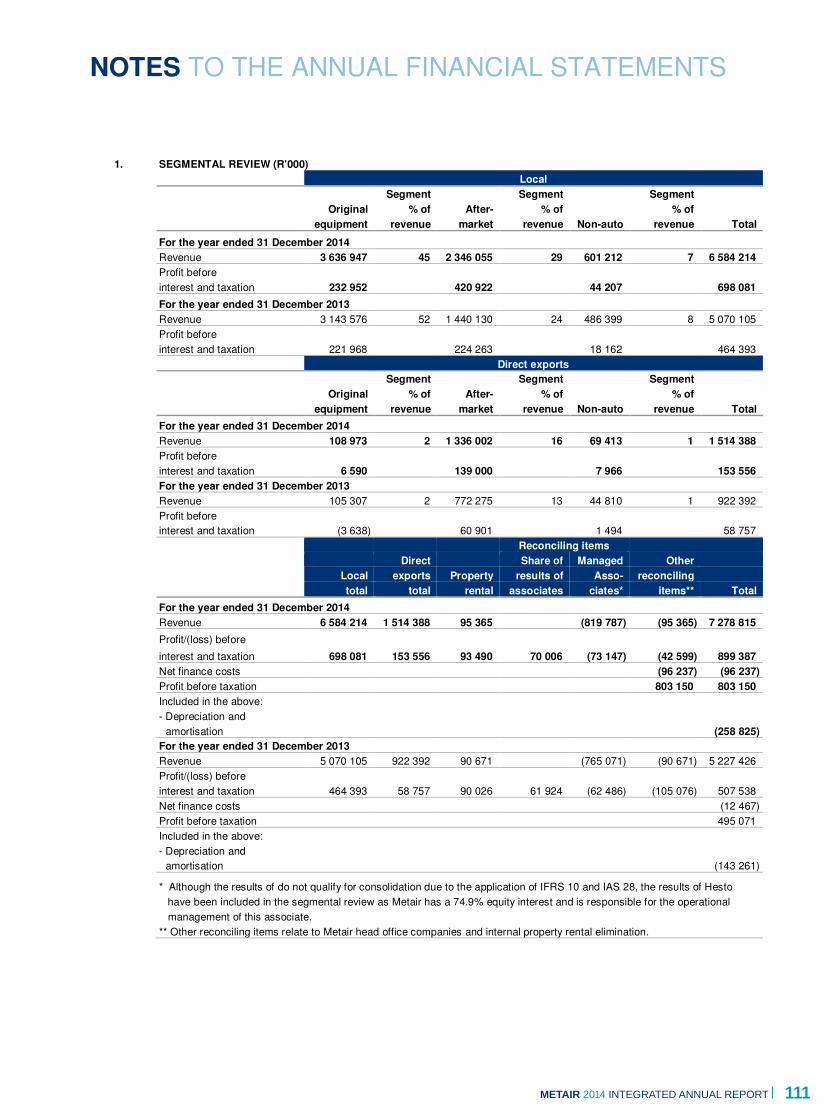
111METaIR 2014 INTEGRATED ANNUAL REPORT
NOTES TO THE ANNUAL FINANCIAL STATEMENTS
METAIR 2014 INTEGRATED ANNUAL REPORT 111
1. SEGMENTAL REVIEW (R'000)
Local
Segment. Segment. Segment.
Original. % of. After-. % of. % of.
equipment. revenue. market. revenue. Non-auto. revenue. Total.
For the year ended 31 December 2014
Revenue 3 636 947 45 2 346 055 29 601 212 7 6 584 214
Profit before
interest and taxation 232 952 420 922 44 207 698 081
For the year ended 31 December 2013
Revenue 3 143 576 52 1 440 130 24 486 399 8 5 070 105
Profit before
interest and taxation 221 968 224 263 18 162 464 393
Direct exports
Segment. Segment. Segment.
Original. % of. After-. % of. % of.
equipment. revenue. market. revenue. Non-auto. revenue. Total.
For the year ended 31 December 2014
Revenue 108 973 2 1 336 002 16 69 413 1 1 514 388
Profit before
interest and taxation 6 590 139 000 7 966 153 556
For the year ended 31 December 2013
Revenue 105 307 2 772 275 13 44 810 1 922 392
Profit before
interest and taxation (3 638) 60 901 1 494 58 757
Reconciling items
Direct. Share of. Managed. Other.
Local. exports. Property. results of. Asso-. reconciling.
total. total. rental. associates. ciates*. items**. Total.
For the year ended 31 December 2014
Revenue 6 584 214 1 514 388 95 365 (819 787) (95 365) 7 278 815
Profit/(loss) before
interest and taxation 698 081 153 556 93 490 70 006 (73 147) (42 599) 899 387
Net finance costs (96 237) (96 237)
Profit before taxation 803 150 803 150
Included in the above:
- Depreciation and
- amortisation (258 825)
For the year ended 31 December 2013
Revenue 5 070 105 922 392 90 671 (765 071) (90 671) 5 227 426
Profit/(loss) before
interest and taxation 464 393 58 757 90 026 61 924 (62 486) (105 076) 507 538
Net finance costs (12 467)
Profit before taxation 495 071
Included in the above:
- Depreciation and
- amortisation (143 261)
* Although the results of do not qualify for consolidation due to the application of IFRS 10 and IAS 28, the results of Hesto
have been included in the segmental review as Metair has a 74.9% equity interest and is responsible for the operational
management of this associate.
** Other reconciling items relate to Metair head office companies and internal property rental elimination.
112 METaIR 2014 INTEGRATED ANNUAL REPORT
NOTES TO THE ANNUAL FINANCIAL STATEMENTS CONTINUED
112 METAIR 2014 INTEGRATED ANNUAL REPORT
1. SEGMENTAL REVIEW (R'000) (continued)
Segment information
The executive directors of the group and company are the chief operating decision-makers (CODM). Management has determined the operating segments based on the information reviewed by the CODM, such as allocating resources and assessing performance.
The group manufactures predominantly automotive components for the automotive market. In order to determine operating and reportable segments, management reviewed various factors, including geographical location, product markets as well as managerial structure. Management considers the original equipment (OE), aftermarket and non-automotive as the key business activities, spit into local and direct exports markets.
The group manages an international portfolio of companies that manufactures and supplies components to all major OE manufacturers in South Africa, Romania and Turkey. The group also manufactures and distributes spare parts for use in the motor vehicle aftermarket and non-automotive products for various other sectors in industry.
Original equipment involves the manufacture and distribution of components used in the assembly of new vehicles. Supply is linked to a particular vehicle model, as the group benefits from long industry product lifecycles. These include (but not limited to) batteries, coil and leaf springs, headlights, wiring harnesses, air-conditioning and climate control systems. Key markets include South Africa, Romania and Turkey.
Aftermarket involves the manufacture and distribution of automotive parts such as batteries, brake pads and spark plugs. Key markets include Africa, Romania and Turkey. The parts are used to service vehicles produced by local OE manufacturers as well as generic parts for imported vehicles. This creates the opportunity for the group to supply products to the same vehicle throughout its life.
Non-automotive markets include manufacture and distribution of products mostly related to industrial, telecoms and utility sectors.
The group owns most of its manufacturing locations, given their strategic nature. Profit in the property division relates to market-related rental cost in the group on the properties used.
Management has determined that the operating segments are sufficiently aggregated. The reportable segments reported in the annual report are identical to the operating segments identified.
After applying quantitative and qualitative thresholds from IFRS 8, the reportable segments were determined on a product market perspective as follows:
- Local and export: - Original Equipment - Aftermarket - Non-auto - Property rental The amounts provided to the executive board of directors do not include regular measures of segment assets and liabilities and have therefore not been disclosed.
The executive board of directors assesses the performance of these operating segments based on earnings before interest and taxation, which include depreciation, amortisation as well as impairment charges.
Goodwill arising in the prior year amounted to R568 685 000 as a result of the acquisition of Mutlu group, a battery manufacturer and distributer in Turkey. Mutlu group operates predominantly in the original equipment (OE) and aftermarket segments (refer note 28.1).
The revenue from external parties reported to the executive board of directors is measured in a manner consistent with that in the income statement.
Entity-wide information:
Major Customers
28% (2013: 37%) of total revenue results from sales to a single external customer of the OE segment.
Geographical information
The group domiciled in South Africa. The result of its revenue from South African operations is R5 024.3 million (2013: R4 772.8 million) and from foreign operations is R3 074.3 million (2013: R1 219.7 million), including managed associates. Foreign domiciled operations consist of predominantly of Romania and Turkey. Non-current assets in foreign operations amounted to R3 413.7 million (2013: R3 488.2 million).
Product information
Revenue generated by battery, other automotive parts and non-automotive parts amounted to R4 594.7 million (2013: R2 715.8 million), R3 479.7 million (2013: R3 242.9 million) and R24 million (2013: R33.8 million) respectively, including managed associates.

113METaIR 2014 INTEGRATED ANNUAL REPORT
NOTES TO THE ANNUAL FINANCIAL STATEMENTS
METAIR 2014 INTEGRATED ANNUAL REPORT 113
GROUP COMPANY
2014 2013 2014 2013
R'000 R'000 R'000 R'000
2. NET FINANCE
Interest income
On bank deposits 19 180 15 421 13 1
Other 3 518
22 698 15 421 13 1
Interest expense
Bank borrowings and overdraft (83 896) (27 471)
Finance leases and hire purchase (1 246) (417)
Dividend on redeemable preference shares (29 609)
Other (4 184)
(118 935) (27 888)
Net finance (expense)/income (96 237) (12 467) 13 1
Dividend on redeemable preference shares was accrued for as at year
end.
3. PROFIT BEFORE TAXATION
Profit before taxation is stated after taking into account the following:
Other operating income
Dividends from subsidiaries (unlisted) 178 281 142 107
Dividends from associates (unlisted) 16 976 42 027
Distribution from subsidiaries 72 275 90 266
Management and committee fees received 4 631 4 673
Government grants 85 575 66 575
Income on scrapping 752 11 776
Bad debts recovered 910 191
Rent received 1 679 2 276
Derivatives at fair value through profit or loss:
- Fair value losses and option premium (25 997) (24 122)
- Fair value gains* (3 157) 1 834 93 592
Insurance proceeds on fire** 42 556 30 934
Insurance proceeds 19 031
Sundry income 10 778 5 825
162 755 98 087 267 532 343 870
* In the prior year the company obtained foreign forward exchange
* contracts in respect of the acquisition of the Mutlu group (refer note 28.1).
* The gains realised at company level was transferred to the hedge reserve
as hedge accounting was applied on a group basis in the prior year.
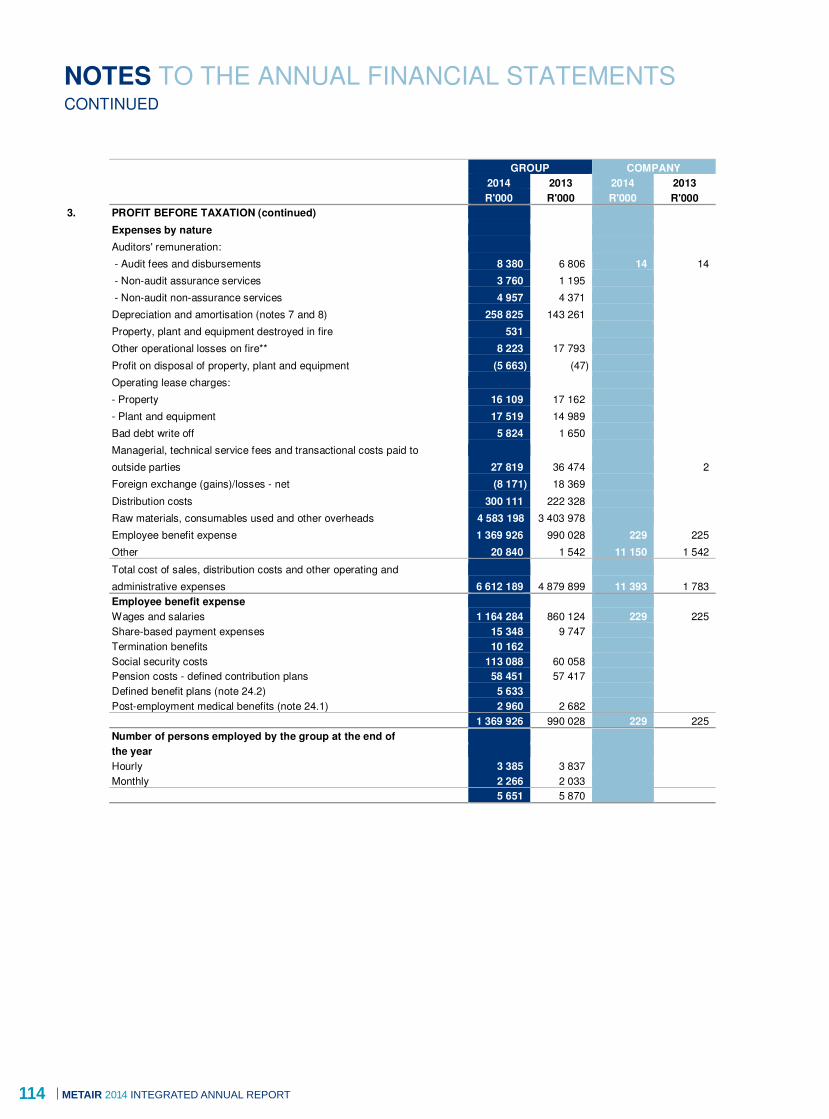
114 METaIR 2014 INTEGRATED ANNUAL REPORT
NOTES TO THE ANNUAL FINANCIAL STATEMENTS CONTINUED
114 METAIR 2014 INTEGRATED ANNUAL REPORT
GROUP COMPANY
2014 2013 2014 2013
R'000 R'000 R'000 R'000
3. PROFIT BEFORE TAXATION (continued)
Expenses by nature
Auditors' remuneration:
- Audit fees and disbursements 8 380 6 806 14 14
- Non-audit assurance services 3 760 1 195
- Non-audit non-assurance services 4 957 4 371
Depreciation and amortisation (notes 7 and 8) 258 825 143 261
Property, plant and equipment destroyed in fire 531
Other operational losses on fire** 8 223 17 793
Profit on disposal of property, plant and equipment (5 663) (47)
Operating lease charges:
- Property 16 109 17 162
- Plant and equipment 17 519 14 989
Bad debt write off 5 824 1 650
Managerial, technical service fees and transactional costs paid to
outside parties 27 819 36 474 2
Foreign exchange (gains)/losses - net (8 171) 18 369
Distribution costs 300 111 222 328
Raw materials, consumables used and other overheads 4 583 198 3 403 978
Employee benefit expense 1 369 926 990 028 229 225
Other 20 840 1 542 11 150 1 542
Total cost of sales, distribution costs and other operating and
administrative expenses 6 612 189 4 879 899 11 393 1 783
Employee benefit expense
Wages and salaries 1 164 284 860 124 229 225
Share-based payment expenses 15 348 9 747
Termination benefits 10 162
Social security costs 113 088 60 058
Pension costs - defined contribution plans 58 451 57 417
Defined benefit plans (note 24.2) 5 633
Post-employment medical benefits (note 24.1) 2 960 2 682
1 369 926 990 028 229 225
Number of persons employed by the group at the end of
the year
Hourly 3 385 3 837
Monthly 2 266 2 033
5 651 5 870
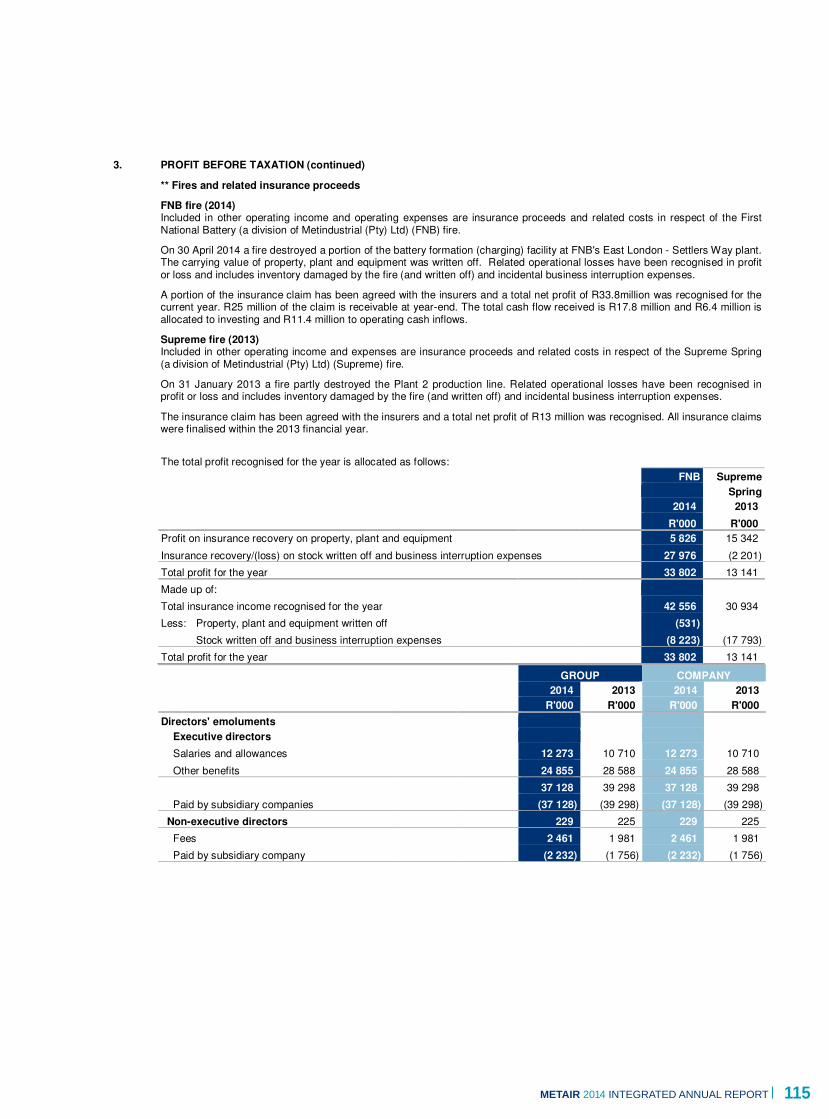
115METaIR 2014 INTEGRATED ANNUAL REPORT
NOTES TO THE ANNUAL FINANCIAL STATEMENTS
METAIR 2014 INTEGRATED ANNUAL REPORT 115
3. PROFIT BEFORE TAXATION (continued)
** Fires and related insurance proceeds
FNB fire (2014) Included in other operating income and operating expenses are insurance proceeds and related costs in respect of the First National Battery (a division of Metindustrial (Pty) Ltd) (FNB) fire.
On 30 April 2014 a fire destroyed a portion of the battery formation (charging) facility at FNB's East London - Settlers Way plant. The carrying value of property, plant and equipment was written off. Related operational losses have been recognised in profit or loss and includes inventory damaged by the fire (and written off) and incidental business interruption expenses.
A portion of the insurance claim has been agreed with the insurers and a total net profit of R33.8million was recognised for the current year. R25 million of the claim is receivable at year-end. The total cash flow received is R17.8 million and R6.4 million is allocated to investing and R11.4 million to operating cash inflows.
Supreme fire (2013) Included in other operating income and expenses are insurance proceeds and related costs in respect of the Supreme Spring (a division of Metindustrial (Pty) Ltd) (Supreme) fire.
On 31 January 2013 a fire partly destroyed the Plant 2 production line. Related operational losses have been recognised in profit or loss and includes inventory damaged by the fire (and written off) and incidental business interruption expenses.
The insurance claim has been agreed with the insurers and a total net profit of R13 million was recognised. All insurance claims were finalised within the 2013 financial year.
The total profit recognised for the year is allocated as follows:
FNB Supreme
Spring
2014 2013
R'000 R'000
Profit on insurance recovery on property, plant and equipment 5 826 15 342
Insurance recovery/(loss) on stock written off and business interruption expenses 27 976 (2 201)
Total profit for the year 33 802 13 141
Made up of:
Total insurance income recognised for the year 42 556 30 934
Less: Property, plant and equipment written off (531)
Stock written off and business interruption expenses (8 223) (17 793)
Total profit for the year 33 802 13 141
GROUP COMPANY
2014 2013 2014 2013
R'000 R'000 R'000 R'000
Directors' emoluments
Executive directors
Salaries and allowances 12 273 10 710 12 273 10 710
Other benefits 24 855 28 588 24 855 28 588
37 128 39 298 37 128 39 298
Paid by subsidiary companies (37 128) (39 298) (37 128) (39 298)
Non-executive directors 229 225 229 225
Fees 2 461 1 981 2 461 1 981
Paid by subsidiary company (2 232) (1 756) (2 232) (1 756)

116 METaIR 2014 INTEGRATED ANNUAL REPORT
NOTES TO THE ANNUAL FINANCIAL STATEMENTS CONTINUED
116 METAIR 2014 INTEGRATED ANNUAL REPORT
3. PROFIT BEFORE TAXATION (continued)
Directors' emoluments (continued)
COMPANY 2014
RS Broadley. L Soanes. A Joffe*. CT Loock. S Douwenga. BM Jacobs.
R'000 R'000 R'000 R'000 R'000 R'000
Executive directors
Salaries and allowances 6 250 1 265 633
Performance bonuses 3 000 525 600
Pension and provident fund contributions 228 78 57
Company contributions 84 31 14
Gain on the exercise of share options 22 151 2 212
31 713 1 899 3 516
Paid by subsidiary companies (31 713) (1 899) (3 515)
Non-executive directors 2 2 2
Fees 314 358 268
Paid by subsidiary company (312) (356) (266)
OME Pooe. JG Best. A Galiel. DR Wilson**. SP Pretorius.
R'000 R'000 R'000 R'000 R'000
Non-executive directors 2 215 2 2 2
Fees 349 404 322 224 222
Paid by subsidiary company (347) (189) (320) (222) (220)
COMPANY 2013
RS Broadley. L Soanes. A Joffe*. CT Loock. BM Jacobs.
R'000 R'000 R'000 R'000 R'000
Executive directors
Salaries and allowances 3 530 1 856
Performance bonuses 3 408 1 916
Pension and provident fund contributions 182 194
Company contributions 76 49
Gain on the exercise of share options 19 065 9 022
26 261 13 037
Paid by subsidiary companies (26 261) (13 037)
Non-executive directors 2 2 2
Fees 307 375 278
Paid by subsidiary company (305) (373) (276)
OME Pooe ***. JG Best. A Galiel.
R'000 R'000 R'000
Non-executive directors 2 215 2
Fees 278 395 348
Paid by subsidiary company (276) (180) (346) *** Paid to CoroCapital (Pty) Ltd.
*** Paid to Royal Bafokeng Management Services (Pty) Ltd in 2014.
*** Paid by Royal Bafokeng Management Services (Pty) Ltd for first three quarters of 2013.
Information regarding share awards/share options granted to executive directors of Metair can be found in note 14.2.

117METaIR 2014 INTEGRATED ANNUAL REPORT
NOTES TO THE ANNUAL FINANCIAL STATEMENTS
METAIR 2014 INTEGRATED ANNUAL REPORT 117
GROUP COMPANY
2014 2013 2014 2013
R'000 R'000 R'000 R'000
4. TAXATION
South African normal taxation 170 842 121 172
Current:
- this year 177 766 110 110
- prior years (4 539) (14 001)
Deferred:
- this year 1 116 28 565
- prior years (3 501) (3 502)
- rate change
Dividend withholding/other Taxes 3
170 845 121 172
%. %. %. %.
Reconciliation of taxation rate:
Standard rate - South Africa 28.0 28.0 28.0 28.0
Effect of change in taxation rate
Associates' results net of taxation (2.4) (3.5)
Prior year adjustment:
- current (0.6) (2.8)
- deferred (0.4) (0.7)
Dividend withholding / other taxes
Exempt income (1.1) (1.0) (29.2) (28.1)
Non-deductible expenses 0.8 4.9 1.2 0.1
Non-deductible expenses for preference dividends and interest 3.1 0.2
Utilisation of previously unrecognised tax losses (3.1)
Foreign tax rate difference (3.8) (2.3)
Taxation losses for which no deferred taxation asset was recognised 0.8 1.4
Effective rate 21.3 24.2
The tax effects relating to items of other comprehensive income and disclosed in notes 15 and 17.
Deferred income taxation assets are recognised for assessable taxation losses to the extent that the realisation of the related taxation benefit through taxable profits is probable and is based primarily on the future forecasted profitability of the relevant entity. Factors considered include future new profit returns and internal reorganisations.
The group did not recognise deferred income taxation assets of R26 162 640 (2013: R39 347 385) in respect of estimated taxation losses amounting to R93 438 002 (2013: R153 154 948) that can be carried forward against future taxable income.

118 METaIR 2014 INTEGRATED ANNUAL REPORT
NOTES TO THE ANNUAL FINANCIAL STATEMENTS CONTINUED
118 METAIR 2014 INTEGRATED ANNUAL REPORT
GROUP COMPANY
2014 2013 2014 2013
5. EARNINGS PER SHARE
Basic earnings per share represents the income in cents attributable 308 229
to each equity share, based on the group’s profit or loss attributable to
equity holders of the parent from ordinary activities divided by the
weighted average number of shares in issue during the year excluding
treasury shares.
Headline earnings per share represent the income in cents 303 219
attributable to each equity share, based on the group’s profit or loss
attributable to equity holders of the parent from ordinary activities,
adjusted as required by SAICA Circular 2/2013, divided by the weighted
average number of shares in issue during the year excluding treasury
shares.
Diluted earnings per share
Dilute earnings per share (cents) 305 223
Diluted headline earnings per share (cents) 301 214
For the diluted earnings per share calculation, the weighted average
number of ordinary shares in issue is adjusted to take account of potential
dilutive share options granted to employees.
The number of shares taken into account is determined by taking the
number of shares that could have been acquired at fair value based on
the monetary value of the subscription rights attached to the outstanding
share options and awards. This calculation is done to determine the
‘purchased’ shares to be added to the ordinary shares outstanding for
the purpose of computing the dilution.
GROUP
Earnings per share Earnings per share
2014 2014 2013 2013
Reconciliation between earnings and headline earnings R'000 cents R'000 cents
Earnings per share
Net profit attributable to ordinary shareholders 601 460 307.8 341 376 228.7
Profit on disposal of property, plant and equipment (4 473) (2.3) (34)
Gross amount (5 663) (47)
NCI effect 63
Taxation effect 1 127 13
Profit on insurance recovery on fire - property, plant and equipment (4 433) (2.3) (14 099) (9.5)
Gross amount (5 826) (15 342)
Taxation effect 1 393 1 243
Headline earnings 592 554 303.2 327 243 219.2
Weighted average number of shares in issue ('000) 195 434 149 271
Diluted earnings per share
Net profit attributable to ordinary shareholders 601 460 305.3 341 376 223.3
Number of shares used for diluted earnings calculation ('000) 196 983 152 856
Diluted headline earnings per share
Headline earnings 592 554 300.8 327 243 214.1
Number of shares used for diluted earnings per share
calculation ('000) 196 983 152 856
Weighted average number of shares in issue ('000) (195 434) (149 271)
Adjustment for dilutive share options ('000) 1 549 3 585

119METaIR 2014 INTEGRATED ANNUAL REPORT
NOTES TO THE ANNUAL FINANCIAL STATEMENTS
METAIR 2014 INTEGRATED ANNUAL REPORT 119
GROUP COMPANY
2014 2013 2014 2013
R'000 R'000 R'000 R'000
6. DIVIDENDS
A dividend of 70 cents (2013: 95 cents) per share in respect of the
2013 (2012) year declared on 25 March 2014 (18 March 2013) and paid
on 26 May 2014 (15 April 2013). 136 822 139 049 139 290 144 905
GROUP
Plant, Vehicles
machinery and
Land and and furniture
buildings equipment and fittings Total
R'000 R'000 R'000 R'000
7. PROPERTY, PLANT AND EQUIPMENT
2014
At cost 1 300 352 2 565 797 70 108 3 936 257
Less: Accumulated depreciation and impairment (50 225) (975 648) (55 098) (1 080 971)
1 250 127 1 590 149 15 010 2 855 286
2013
At cost 1 315 637 2 544 116 9 457 3 869 210
Less: Accumulated depreciation and impairment (60 121) (955 349) (8 811) (1 024 281)
1 255 516 1 588 767 646 2 844 929
Reconciliation of movement:
Year ended 31 December 2014
Opening net book value 1 255 516 1 588 767 646 2 844 929
Transfers 4 539 (18 209) 13 670
Additions 5 163 238 145 6 792 250 100
Disposals (396) (5 564) (43) (6 003)
Depreciation (19 816) (209 090) (5 971) (234 877)
Currency adjustment 5 121 (3 900) (84) 1 137
Closing net book value 1 250 127 1 590 149 15 010 2 855 286
Year ended 31 December 2013
Opening net book value 290 187 901 115 197 1 191 499
Net acquisition of subsidiary 933 570 662 325 1 595 895
Additions 54 089 79 761 793 134 643
Disposals (44) (10 794) (10 838)
Depreciation (10 549) (123 928) (344) (134 821)
Currency adjustment (11 737) 80 288 68 551
Closing net book value 1 255 516 1 588 767 646 2 844 929
A register of land and buildings is open for inspection at the registered offices of the respective subsidiaries owning the respective properties.
Property, plant and equipment amounting to R127 862 078 (2013: R106 477 254) are encumbered as security for bank overdrafts and R372 000 000 (2013: R399 537 353) as security for borrowings.

120 METaIR 2014 INTEGRATED ANNUAL REPORT
NOTES TO THE ANNUAL FINANCIAL STATEMENTS CONTINUED
120 METAIR 2014 INTEGRATED ANNUAL REPORT
7. PROPERTY, PLANT AND EQUIPMENT (continued)
The following items include amounts under construction:
GROUP
2014 2013
R'000 R'000
Land and buildings 539 2 423
Plant and equipment 104 931 38 708
Depreciation expenses are included within cost of sales of R208.4 million (2013: R126.2 million); distribution costs of R2.4 million (2013: R1.8 million); and administrative expenses of R24.1 million (2013: R6.9 million) in the income statement.
Impairment losses are recognised in administrative expenses in the income statement. Reversal of impairment is included in other income. No impairment losses and reversals were recognised in the 2014 and 2013 years of assessment.
Lease rentals amounting to R16 109 178 (2013: R17 162 000) and R17 519 146 (2013: R14 989 000) relating to property, plant and equipment are included in the income statement. The group leases various vehicles and machinery under non-current finance lease and instalment sales agreements. The lease terms are up to a period of 5 years. The net book value of the assets leased amounts to R32.5 million (2013: R24 million).
GROUP
Customer Software
Trade- relation- and
Goodwill marks Licences Brands ship other Total
R'000 R'000 R'000 R'000 R'000 R'000 R'000
8. INTANGIBLE ASSETS
2014
At cost 609 738 54 193 19 190 427 339 226 844 8 783 1 346 087
Less: Accumulated
amortisation and
impairment (17 797) (7 884) (14 917) (8 449) (19 837) (7 308) (76 192)
591 941 46 309 4 273 418 890 207 007 1 475 1 269 895
2013 (Restated)
At cost 604 656 40 313 22 099 423 759 224 918 2 296 1 318 041
Less: Accumulated
amortisation and
impairment (17 797) (4 462) (16 520) (5 091) (4 540) (2 121) (50 531)
586 859 35 851 5 579 418 668 220 378 175 1 267 510
Reconciliation of movement:
Opening net book value 586 859 35 851 5 579 418 668 220 378 175 1 267 510
Transfers 41 (521) (41) 521
Additions 13 924 1 129 1 414 16 467
Amortisation (2 736) (1 845) (3 399) (15 348) (620) (23 948)
Currency adjustments 5 082 (771) (69) 3 662 1 977 (15) 9 866
Closing net book value 591 941 46 309 4 273 418 890 207 007 1 475 1 269 895
Year ended 31 December 2013 (Restated)
Opening net book value 36 218 29 970 1 579 9 593 3 089 4 045 84 494
Acquisition of subsidiary 543 698 429 232 228 301 1 201 231
Finalisation of fair values* 24 988 24 988
Transfers 4 546 (4 546)
Additions 384 384
Amortisation (2 465) (927) (2 882) (1 827) (339) (8 440)
Currency adjustments (18 045) 8 346 (3) (17 275) (9 185) 1 015 (35 147)
Closing net book value 586 859 35 851 5 579 418 668 220 378 175 1 267 510

121METaIR 2014 INTEGRATED ANNUAL REPORT
NOTES TO THE ANNUAL FINANCIAL STATEMENTS
METAIR 2014 INTEGRATED ANNUAL REPORT 121
8. INTANGIBLE ASSETS (continued)
* December 2013 acquisition finalisation
Additions to intangibles through business combinations of R1 226 218 000 related to the acquisition of Mutlu group. This
includes final goodwill of R568 685 000 and is allocated fully to the Mutlu group cash-generating unit. Identifiable brands and
customer relationships acquired amounted to R657 533 000. Brands include the ‘Mutlu’ battery brand which is classified as an
indefinite life intangible asset.
The value of goodwill relating to the Mutlu acquisition was initially determined on a provisional basis. Subsequent to
31 December 2013 the fair values of net identifiable assets have been finalised and goodwill adjusted by R24 988 000 (refer
note 28).
General
Goodwill, trademarks, brands and customer relationships are allocated to their respective underlying cash-generating units. The
respective businesses acquired are defined as the underlying cash-generating units which support the valuation of the goodwill,
trademarks, brands and customer relationships.
Significant trademarks and brands acquired in business combinations comprise Mutlu, Povver, Celik and Rombat.
Brands are recognised as indefinite useful life intangible assets when an analysis of the relevant underlying factors confirm that
there is no foreseeable limit to the period over which the asset is expected to generate net cash flows for the entity. This
assumption is further justified by the strong presence these brands have in their respective marketplace. The Mutlu brand has a
track record of stability, is long established and has demonstrated the ability to survive changes in the economic environment.
Factors considered include the market-leading position of the Mutlu brand in Turkey, the listing on the Istanbul Stock Exchange
since 1994, its wide name-recognition and strong presence in the marketplace, management’s intention to maintain advertising
spend and to keep the brand indefinitely.Amortisation on finite intangible assets of R19.9 million (2013: R7.2 million) is included within cost of sales and R4 million
(2013: R1.2 million) within administration expenses in the income statement. Intangible assets recognised as defined life
intangible assets are carried at cost less accumulated amortisation and impairment. Amortisation is calculated using the
straight-line method to allocate the costs of these assets over their useful lives. Trademarks, brands and customer relationships
are amortised over periods ranging from five to twenty five years. There are no restrictions on title.
Goodwill and indefinite life intangible assets are allocated to the following cash-generating units:
Acquisition. Finalisation.
Opening net. of. of. Currency. Closing net.
book value. subsidiary. fair values. adjustments. book value.
R'000 R'000 R'000 R'000 R'000
2014
Goodwill
- Rombat SA 45 282 (740) 44 542
- Mutlu group 541 578 5 822 547 400
Brands
- Mutlu group 339 233 3 029 342 262
586 860 339 233 8 111 934 204
2013
Goodwill
- Rombat SA 36 218 9 064 45 282
- Mutlu group 543 698 24 988 (27 108) 541 578
Brands
- Mutlu group 353 501 (14 268) 339 233
36 218 897 199 24 988 (32 312) 926 093

122 METaIR 2014 INTEGRATED ANNUAL REPORT
NOTES TO THE ANNUAL FINANCIAL STATEMENTS CONTINUED
122 METAIR 2014 INTEGRATED ANNUAL REPORT
8. INTANGIBLE ASSETS (continued)
Impairment tests on goodwill and indefinite life intangible assets
The recoverable amount of all CGUs has been determined based on value-in-use calculations.
Value-in-use calculations use cash flow projections based on financial budgets approved by management, which include
assumptions on profit before interest and tax, depreciation, working capital movements and capital maintenance expenditure.
Future periods are based on estimated growth rates. Cash flows beyond a five-year period are extrapolated using the estimated
growth rates stated below (terminal value).
The perpetuity growth rate is consistent with long-term industry growth forecasts. The discount rate reflects specific risks
relating to the cash-generating unit. No impairment was required in the current or prior year. Rombat Mutlu
SA group
The summary of key assumptions used for value-in-use calculations are as follows: % %
2014
Growth rate* 3.0 3.8
Discount rate** 9.0 15.1
Period (years) 5 5
2013
Growth rate* 4.0 6.0
Discount rate** 15.4 15.3
* Compounded growth rate used to extrapolate cash flows beyond the budget period.
** Pre-tax discount rate applied to cash flow projections.
Operating cash flows: The main assumptions within forecast operating cash flow include the achievement of future sales prices and volumes (including reference to specific customer relationships, product lines and the use of industry relevant external forecasts of global vehicle production), raw material input costs, the cost structure of each CGU and the ability to realise benefits from annual productivity improvements, the impact of foreign currency rates upon selling price and cost relationships and the levels of ongoing capital expenditure required to maintain forecast production. Pre-tax country risk and inflation adjusted rates of return: Pre-tax risk adjusted discount rates are derived from risk-free rates based upon long-term government bonds in the territory, or territories, within which each CGU operates. A relative risk adjustment (or beta) has been applied to risk-free rates to reflect the risk inherent in each CGU relative to all other sectors on average, determined using an average of the betas of comparable listed companies, relevered. The discount rate for Mutlu (Turkey) is further loaded with an international US basis adjustment for CPI and a small stock premium (SSP). Long-term growth rates: To forecast beyond the detailed cash flows into perpetuity, a long-term growth rate has been used. In each case, this approximates annual growth rates in gross domestic product in the territory where the CGU is primarily based.
Goodwill sensitivity analysis The results of the group’s impairment tests are dependent upon estimates and judgements made by management, particularly in relation to the key assumptions described above. Sensitivity analysis to potential changes in key assumptions has therefore been reviewed. The table below shows the discount rate, long-term growth rate assumptions and operating cash flows used in the calculation of value-in-use and the amount by which each assumption must change in isolation in order for the estimated recoverable amount to equal the carrying value.
Rombat. Mutlu.
SA. group.
Sensitivity analysis of assumptions used in the goodwill impairment test % %
2014
Change required for the carrying value to equal the recoverable amount:
Discount rate 9.0 15.1
Basis points movement +4.5 +1.3
Long-term growth rate 3.0 3.8
Basis points movement -6.3 -2.2
Reduction in pre-discounted forecast period operating cash flow -35.0 -33.0
In the prior year impairment calculations were tested for sensitivity to significant changes in the key assumptions used and
no significant movements were noted that indicated an impairment in either Mutlu or Rombat.
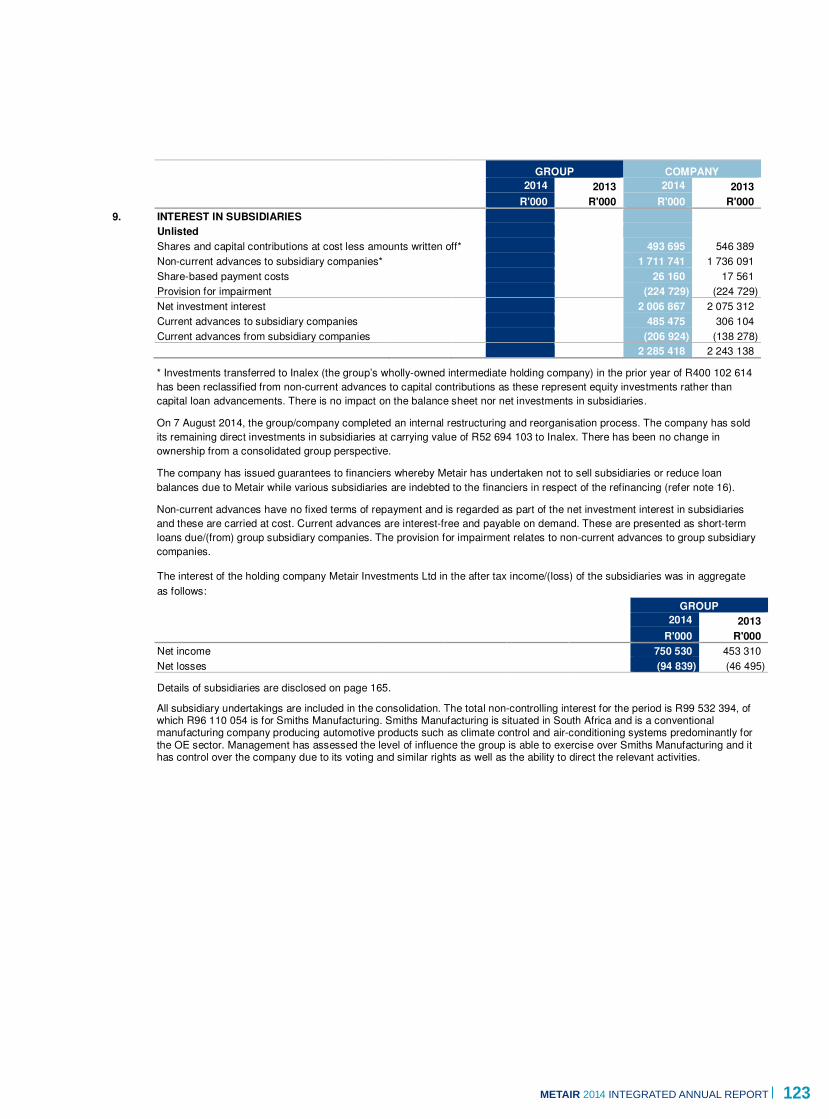
123METaIR 2014 INTEGRATED ANNUAL REPORT
NOTES TO THE ANNUAL FINANCIAL STATEMENTS
METAIR 2014 INTEGRATED ANNUAL REPORT 123
GROUP COMPANY
2014 2013 2014 2013
R'000 R'000 R'000 R'000
9. INTEREST IN SUBSIDIARIES
Unlisted
Shares and capital contributions at cost less amounts written off* 493 695 546 389
Non-current advances to subsidiary companies* 1 711 741 1 736 091
Share-based payment costs 26 160 17 561
Provision for impairment (224 729) (224 729)
Net investment interest 2 006 867 2 075 312
Current advances to subsidiary companies 485 475 306 104
Current advances from subsidiary companies (206 924) (138 278)
2 285 418 2 243 138
* Investments transferred to Inalex (the group’s wholly-owned intermediate holding company) in the prior year of R400 102 614
has been reclassified from non-current advances to capital contributions as these represent equity investments rather than
capital loan advancements. There is no impact on the balance sheet nor net investments in subsidiaries.
On 7 August 2014, the group/company completed an internal restructuring and reorganisation process. The company has sold
its remaining direct investments in subsidiaries at carrying value of R52 694 103 to Inalex. There has been no change in
ownership from a consolidated group perspective.
The company has issued guarantees to financiers whereby Metair has undertaken not to sell subsidiaries or reduce loan
balances due to Metair while various subsidiaries are indebted to the financiers in respect of the refinancing (refer note 16).
Non-current advances have no fixed terms of repayment and is regarded as part of the net investment interest in subsidiaries
and these are carried at cost. Current advances are interest-free and payable on demand. These are presented as short-term
loans due/(from) group subsidiary companies. The provision for impairment relates to non-current advances to group subsidiary
companies.
The interest of the holding company Metair Investments Ltd in the after tax income/(loss) of the subsidiaries was in aggregate
as follows:
GROUP
2014 2013
R'000 R'000
Net income 750 530 453 310
Net losses (94 839) (46 495) Details of subsidiaries are disclosed on page 165.
All subsidiary undertakings are included in the consolidation. The total non-controlling interest for the period is R99 532 394, of which R96 110 054 is for Smiths Manufacturing. Smiths Manufacturing is situated in South Africa and is a conventional manufacturing company producing automotive products such as climate control and air-conditioning systems predominantly for the OE sector. Management has assessed the level of influence the group is able to exercise over Smiths Manufacturing and it has control over the company due to its voting and similar rights as well as the ability to direct the relevant activities.
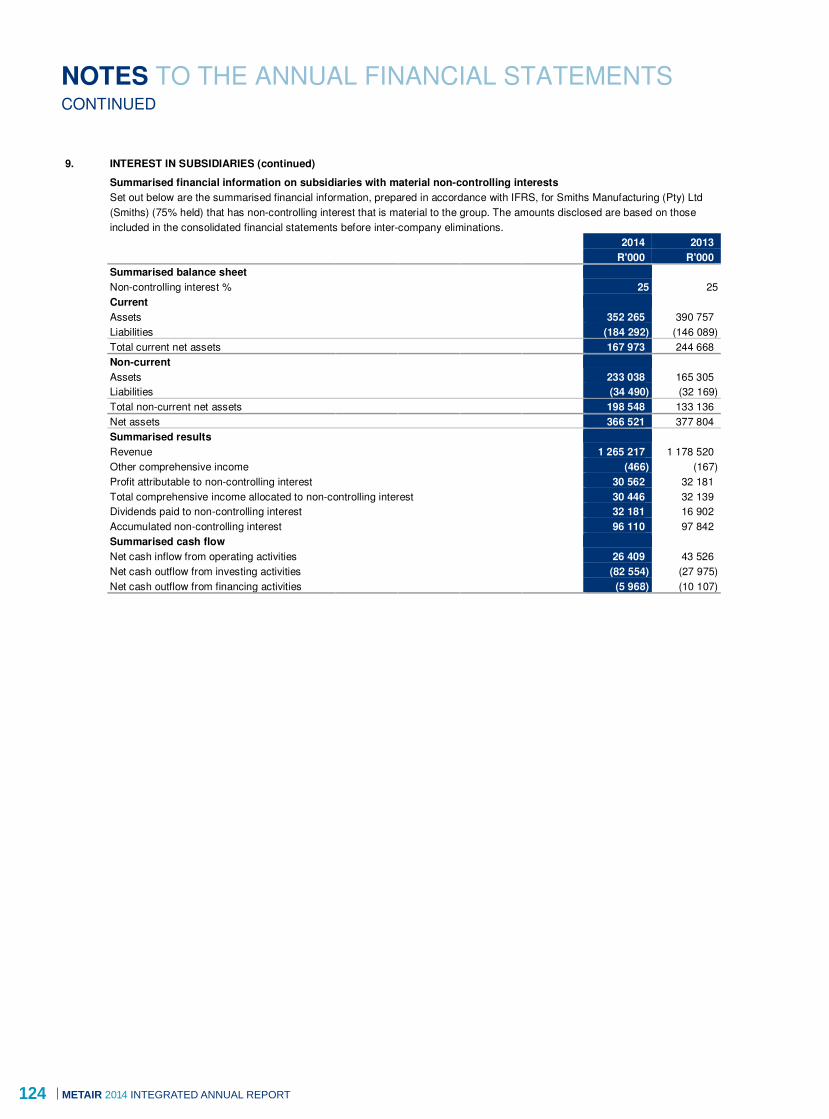
124 METaIR 2014 INTEGRATED ANNUAL REPORT
NOTES TO THE ANNUAL FINANCIAL STATEMENTS CONTINUED
124 METAIR 2014 INTEGRATED ANNUAL REPORT
9. INTEREST IN SUBSIDIARIES (continued) Summarised financial information on subsidiaries with material non-controlling interests
Set out below are the summarised financial information, prepared in accordance with IFRS, for Smiths Manufacturing (Pty) Ltd
(Smiths) (75% held) that has non-controlling interest that is material to the group. The amounts disclosed are based on those
included in the consolidated financial statements before inter-company eliminations.
2014 2013
R'000 R'000
Summarised balance sheet
Non-controlling interest % 25 25
Current
Assets 352 265 390 757
Liabilities (184 292) (146 089)
Total current net assets 167 973 244 668
Non-current
Assets 233 038 165 305
Liabilities (34 490) (32 169)
Total non-current net assets 198 548 133 136
Net assets 366 521 377 804
Summarised results
Revenue 1 265 217 1 178 520
Other comprehensive income (466) (167)
Profit attributable to non-controlling interest 30 562 32 181
Total comprehensive income allocated to non-controlling interest 30 446 32 139
Dividends paid to non-controlling interest 32 181 16 902
Accumulated non-controlling interest 96 110 97 842
Summarised cash flow
Net cash inflow from operating activities 26 409 43 526
Net cash outflow from investing activities (82 554) (27 975)
Net cash outflow from financing activities (5 968) (10 107)

125METaIR 2014 INTEGRATED ANNUAL REPORT
NOTES TO THE ANNUAL FINANCIAL STATEMENTS
METAIR 2014 INTEGRATED ANNUAL REPORT 125
GROUP COMPANY
2014 2013 2014 2013
R'000 R'000 R'000 R'000
10. INVESTMENT IN ASSOCIATES
Unlisted
Shares at cost less impairment 9 044 9 044 2 793 2 794
Share of post-acquisition reserves included in equity accounted earnings 242 640 190 742
Income from associates in current year less dividends 51 898 18 847
In respect of prior years 190 742 171 895
Total carrying value 251 684 199 786 2 793 2 794
Reconciliation of movements:
Balance at the beginning of the year 199 786 175 939 2 794 2 794
Acquisition/(disposal) of associate 5 000 (1)
Share of equity accounted earnings 70 006 61 924
Dividends received (18 108) (43 077)
Investment in associates 251 684 199 786 2 793 2 794
Set out below are the associates of the group as at 31 December 2014, which, are accounted for on the equity basis.
The associates as listed below have share capital consisting solely of ordinary shares, which are held directly by the group.
Their principal place of business is South Africa. Group Group
Percentage Number carrying cost less
holding of shares amount impairment
Nature of investment in associates % held R'000 R'000
2014
Unlisted
Hesto Harnesses (Pty) Ltd 74.9 749 160 417 1
Tenneco Automotive Holdings SA (Pty) Ltd 25.1 154 712 22 545
Toyoda Gosei (Pty) Ltd 20.1 200 14 569 1 250
Valeo Systems SA (Pty) Ltd 49.0 490 49 153 2 793
Vizirama 12 (Pty) Ltd 33.0 40
Eye2square Innovations (Pty) Ltd 20.0 125 5 000 5 000
251 684 9 044
2013
Unlisted
Hesto Harnesses (Pty) Ltd 74.9 749 138 579 1
Tenneco Automotive Holdings SA (Pty) Ltd 25.1 154 712 14 445
Toyoda Gosei (Pty) Ltd 20.1 200 11 065 1 250
Valeo Systems SA (Pty) Ltd 49.0 490 30 697 2 793
Vizirama 12 (Pty) Ltd 33.0 40
Eye2square Innovations (Pty) Ltd 20.0 125 5 000 5 000
199 786 9 044

126 METaIR 2014 INTEGRATED ANNUAL REPORT
NOTES TO THE ANNUAL FINANCIAL STATEMENTS CONTINUED
126 METAIR 2014 INTEGRATED ANNUAL REPORT
10. INVESTMENT IN ASSOCIATES (continued)
The companies are all incorporated in South Africa. Details of the associates are disclosed on page 165. There are no significant restrictions on the ability of associates to transfer funds to the group. The group does not provide or has received guarantees or similar undertakings for financing facilities, except a limited letter of support of R3.6 million granted to Valeo for overdraft facilities. The risk of default is considered remote.
The associate companies operate in the automotive industry and manufacture automotive parts for original equipment and aftermarket segments, similar to the group strategy, with the exception of Vizirama. Vizirama is an investment company that holds the patents and owns the tooling utilised in the manufacture of streetlights.
The group has one material associate - Hesto. The group has the practical ability to direct the relevant activities of Hesto ('managed associate') and the group owns 74.9%, the majority of the voting rights. However, the Shareholder’s Agreement stipulates that unanimous consent is required for all decisions relating to the relevant activities of Hesto. The other shareholder also has a currently exercisable and substantive option (‘call option’) over the shareholding held by the group. This gives rise to 'de facto' power over Hesto. This results in Metair accounting for the investment as an associate and equity accounting is applied.
Hesto manufactures and sells automotive wiring harnesses and related components in South Africa. Hesto is a strategic and specialist automotive component manufacturer giving the group OE product and market focus as well being a product differentiator.
The group's associates are private companies and there is no quoted market price available for shares.
Summarised financial information for associates (material and other) Set out below are the summarised financial information for the associates, which are accounted for using the equity method.
Managed associate Other associates Total
2014 2013 2014 2013 2014 2013
R'000 R'000 R'000 R'000 R'000 R'000
Summarised income statements
Revenue 819 787 765 071 1 218 801 954 682 2 038 588 1 719 753
Profit after taxation 51 822 46 314 91 824 87 295 143 646 133 609
Total comprehensive income 51 822 46 314
Attributable to NCI 38 815 34 689
Attributable to investee's shareholders 13 007 11 625
Dividends received from associate 16 975 24 698 1 133 18 379 18 108 43 077
Summarised balance sheets
Current
Assets 207 480 218 434 521 855 438 698 729 335 657 132
Liabilities (93 158) (111 662) (219 868) (209 612) (313 026) (321 274)
Non-current
Assets 109 105 89 288 78 421 67 065 187 526 156 353
Liabilities (9 251) (11 041) (1 500) (3 409) (10 751) (14 450)
Net assets 214 176 185 019 378 908 292 742 593 084 477 761
Attributable to NCI 160 418 138 579
Attributable to investee's shareholders 53 758 46 440
The information above reflects the amounts presented in the financial statements of the associates adjusted for differences
in accounting policies between the group and the associates. Reconciliation of summarised financial information
Reconciliation of the summarised financial information presented to the carrying amount of its interest in associates:
Managed associate Other associates Total
2014 2013 2014 2013 2014 2013
R'000 R'000 R'000 R'000 R'000 R'000
Opening net assets 1 January 185 019 171 679 292 742 260 697 477 761 432 376
Profit for the year 51 822 46 314 91 824 87 295 143 646 133 609
Dividends paid (22 665) (32 974) (5 658) (55 250) (28 323) (88 224)
Closing net assets 214 176 185 019 378 908 292 742 593 084 477 761
Interest in associates 160 418 138 579 91 266 61 207 251 684 199 786
Carrying value 160 418 138 579 91 266 61 207 251 684 199 786

127METaIR 2014 INTEGRATED ANNUAL REPORT
NOTES TO THE ANNUAL FINANCIAL STATEMENTS
METAIR 2014 INTEGRATED ANNUAL REPORT 127
GROUP COMPANY
2014 2013 2014 2013
R'000 R'000 R'000 R'000
11. INVENTORY
Raw material 639 055 595 311
Work in progress 308 196 271 084
Finished goods 560 761 397 846
1 508 012 1 264 241
Included in the above are inventories stated at net realisable value of 23 476 28 289
The cost of inventories recognised as expense and included in cost of
sales amounted to 2 035 487 2 695 765
Inventory amounting to R14 248 148 (2013: R14 584 244) has been
pledged as security for bank overdrafts and borrowings.
12. TRADE AND OTHER RECEIVABLES
Trade receivables 1 140 710 1 161 594
Less: Provision for impairment of trade receivables (26 858) (22 056)
1 113 852 1 139 538
Prepayments 38 640 38 867
Insurance proceeds and claims receivable 26 349
Grant claim receivable 46 000
Tooling prepayments 135 786
Other receivables 87 301 49 982 211 154
1 401 928 1 274 387 211 154
Trade receivables can be categorised in the following categories:
Impaired.
Fully. Past due. and.
perfor-. and not. provided.
ming. impaired. for. Total.
R'000 R'000 R'000 R'000
2014
Original equipment 251 223 32 635 245 284 103
Exports 188 504 62 409 19 010 269 923
Aftermarket 459 414 51 530 5 195 516 139
Non-automotive 39 421 28 976 2 148 70 545
938 562 175 550 26 598 1 140 710
2013
Original equipment 235 711 31 970 574 268 255
Exports 159 536 60 542 15 540 235 618
Aftermarket 511 062 52 224 4 632 567 918
Non-automotive 67 437 21 056 1 310 89 803
973 746 165 792 22 056 1 161 594

128 METaIR 2014 INTEGRATED ANNUAL REPORT
NOTES TO THE ANNUAL FINANCIAL STATEMENTS CONTINUED
128 METAIR 2014 INTEGRATED ANNUAL REPORT
12. TRADE AND OTHER RECEIVABLES (continued)
The carrying amounts of the group's trade and other receivables are denominated in the following currencies:
GROUP
2014 2013
R'000 R'000
Rand 672 825 476 056
British Pound 5 118 4 512
Euro 185 100 176 380
US Dollar 74 061 50 059
Australian Dollar 487 1 054
Romanian Lei 116 635 148 827
Turkish Lira 347 702 417 356
Japanese Yen 143
1 401 928 1 274 387
No interest is applicable to accounts receivable balances. The provision for impairment can be analysed as follows:
Original. Non-.
equip-. After-. auto-.
Total. ment. Export. market. motive.
R'000 R'000 R'000 R'000 R'000
2014
At 1 January 22 056 574 15 540 4 632 1 310
Provisions for receivables impairment 6 854 150 4 472 1 376 856
Amounts written off (10) (10)
Unused amounts reversed (1 671) (479) (670) (506) (16)
Currency adjustments (371) (333) (38)
As at 31 December 26 858 245 19 009 5 454 2 150
2013
At 1 January 25 857 8 047 11 563 3 540 2 707
Provisions for/(recovery of) receivables impairment 1 832 450 741 809 (168)
Amounts written off (1 028) (1 028)
Unused amounts reversed (8 200) (7 923) (76) (201)
Currency adjustments 3 595 3 236 359
As at 31 December 22 056 574 15 540 4 632 1 310
The ageing profile of trade receivables are presented below:
Original. Non-.
equip-. After-. auto-.
Total. ment. Export. market. motive.
R'000 R'000 R'000 R'000 R'000
2014
Up to 3 months 1 033 008 280 146 243 629 444 402 64 831
3 - 6 months 73 674 2 731 9 102 57 583 4 258
Over 6 months 34 028 1 321 17 239 13 079 2 389
1 140 710 284 198 269 970 515 064 71 478
2013
Up to 3 months 1 048 348 267 402 201 164 493 890 85 892
3 - 6 months 81 613 751 17 179 60 667 3 016
Over 6 months 31 633 102 17 275 13 361 895
1 161 594 268 255 235 618 567 918 89 803

129METaIR 2014 INTEGRATED ANNUAL REPORT
NOTES TO THE ANNUAL FINANCIAL STATEMENTS
METAIR 2014 INTEGRATED ANNUAL REPORT 129
12. TRADE AND OTHER RECEIVABLES (continued)
The creation and release of provision for impaired receivables have been included in other operating expenses in the income statement. Unwinding of discount is included in interest expense in the income statement. Amounts charged to the allowance account are generally written off when there is no expectation of recovering additional cash.
The other classes within trade and other receivables do not contain impaired assets. The maximum exposure to credit risk at the reporting date is the fair value of each class of receivable mentioned above. Mutlu has received letters of guarantee for R516 440 180 (2013: R378 567 817) for amounts due as collateral. Trade receivables of R267 270 096 (2013: R59 193 057) and Rnil (2013: R182 495 000) have been pledged as security for bank overdrafts and borrowings.
GROUP COMPANY
2014 2013 2014 2013
R'000 R'000 R'000 R'000
13. CASH AND CASH EQUIVALENTS
For the purposes of the cash flow statement, cash and cash
equivalents consist of the following:
Cash at bank and on hand 602 666 574 742 1 486 4 181
Bank overdrafts (130 193) (167 241) (2)
472 473 407 501 1 484 4 181
Average interest rate on short-term bank deposits 3.4% 3.5%
Average interest rate on bank overdrafts 9.0% 9.4%
Average interest rate on European bank overdrafts 3.9% 2.5%
Property, plant and equipment of R127 862 078 (2013: R106 477 254), inventory of R14 248 148 (2013: R14 584 244)
and trade receivables of R267 270 096 (2013: R59 193 057) have been pledged as security for bank overdrafts.

130 METaIR 2014 INTEGRATED ANNUAL REPORT
NOTES TO THE ANNUAL FINANCIAL STATEMENTS CONTINUED
130 METAIR 2014 INTEGRATED ANNUAL REPORT
GROUP COMPANY
2014 2013 2014 2013
R'000 R'000 R'000 R'000
14. STATED CAPITAL AND TREASURY SHARES
Authorised
400 000 000 ordinary shares at par value of no par value
Reconciliation of number of shares at no par
value issued
Balance at the beginning of the year 198 985 886 152 531 875 198 985 886 152 531 875
Issue of ordinary shares 46 454 011 46 454 011
198 985 886 198 985 886 198 985 886 198 985 886
Issued
198 985 886 ordinary shares of no par value 1 497 932 1 497 931 1 497 931 1 497 931
1 497 932 1 497 931 1 497 931 1 497 931
Reconciliation of stated capital
Balance at the beginning of the year 1 497 931 42 876 1 497 931 42 876
Proceeds from shares issued 1 500 000 1 500 000
Share issue costs (44 945) (44 945)
Balance at the end of the year 1 497 931 1 497 931 1 497 931 1 497 931
The following share issue costs were recognised in stated
capital:
2% Equity commitment fee 32 120 32 120
Equity raising fee 12 825 12 825
44 945 44 945
Treasury shares
Balance at the beginning of the year (45 241) (72 232)
Shares disposed by the Metair Share Trust 2 952 1 095
Shares acquired by Business Venture Investments
No 1217 (Pty) Ltd (370)
Shares disposed by Business Venture Investments
No 1217 (Pty) Ltd (vesting utilisation) 21 184 25 896
Balance at the end of the year (21 475) (45 241)
Number of treasury shares are held as follows
Metair Share Trust 215 812
Business Venture Investments No 1217 (Pty) Ltd 2 108 312 4 203 609
2 108 312 4 419 421

131METaIR 2014 INTEGRATED ANNUAL REPORT
NOTES TO THE ANNUAL FINANCIAL STATEMENTS
METAIR 2014 INTEGRATED ANNUAL REPORT 131
14.1 STATED CAPITAL AND PREMIUM AND TREASURY SHARES (continued) 14.1 Metair Share Trust (old equity-settled share-based payment scheme)
Share options
The Metair Share Trust was terminated during the year and all remaining shares were allocated.
As at 31 December 2013, 207 500 ordinary shares were reserved for the purpose of the scheme, and under the control of
the directors.
Movements in the number of share options outstanding and their related weighted average offer prices are as follows:
2014 2013
Average. Average.
offer price. offer price'
per share. Options. per share. Options.
R 000's R 000's
At 1 January 6.36 208 6.30 296
Forfeited (4.34) (8)
Delivered (6.36) (208) 6.36 (80)
At 31 December 6.36 208
A total of 207 500 (2013: 80 000) options were exercised (delivered) during the year. The average share price (market value) per share on date of exercise was R42.92 (2013: R37.68). 8 312 shares that were forfeited in 2013 were transferred to Business Venture No 1217 (Pty) Ltd in the current year.
The share options were exercisable immediately after the option had been granted (provided this did not fall in a closed period as determined by the JSE Ltd) but no later than 10 years after such date. Delivery of the shares to the participant could only take place on the expiry of five years from the date the option was granted provided this did not fall in a closed period as determined by the JSE Ltd.
Options under the scheme were granted at the closing price ruling on the JSE Ltd on the previous day.
2014 2013
Number of shares held by the Metair Share Trust in respect of share option scheme 207 500
Number of shares held by the Metair Share Trust in respect of share option scheme forfeited
to be transferred 8 312
215 812
Market value of shares held by the Metair Share Trust in respect of share option scheme
(2013: R39.59) R8 543 997
There are no IFRS 2 share-based payment charges as the scheme was discontinued in 2004 and no further options
have been granted.

132 METaIR 2014 INTEGRATED ANNUAL REPORT
NOTES TO THE ANNUAL FINANCIAL STATEMENTS CONTINUED
132 METAIR 2014 INTEGRATED ANNUAL REPORT
14. STATED CAPITAL AND PREMIUM AND TREASURY SHARES (continued)
14.2 The Metair Investments Ltd 2009 Share Plan (equity-settled share-based payment scheme)
The Metair Investments Ltd 2009 Share Plan is an equity-settled share-based payment scheme.
The Metair Investments Ltd 2009 Share Plan was approved by shareholders on 4 December 2009. Under the plan executives,
senior managers and/or key employees of the group will annually be offered a combination of share appreciation rights,
performance shares or bonus shares.
Annual allocations of share appreciation rights, awards of performance shares and grants of bonus shares are governed by
Metair's remuneration policies.
If an employee ceases to be employed by the group by reason of no fault termination prior to the vesting and/or exercise of the
share appreciation rights, performance shares or bonus shares, the share appreciation rights, performance shares or bonus
shares available to vest and/or be exercised shall be deemed to have vested and been exercised and shall be settled to the
employee in terms of the share plan with effect from the date of termination of employment.
All shares vested are exercised.
a) Share appreciation rights
Annual allocations of share appreciation rights will be made to executives and selected managers. They will be available to be
settled, subject to any performance criteria that may have been stipulated at allocation in equal thirds on the third, fourth and
fifth anniversaries but need not be exercised until the sixth anniversary, at which time they will be automatically settled.
Special allocations of shares awarded in 2013 and 2014 vest on the third, fourth, fifth, sixth and seventh anniversaries of their
award in five equal portions annually.
On settlement, the value accruing to participants will be the appreciation of Metair's share price. The appreciation may be
calculated as the full appreciation in the share price, or that appreciation over and above a prescribed hurdle rate which may
have been stipulated at allocation.
Movements in the number of rights granted are as follows:
2014 2013
Weighted. Weighted.
average. average.
Number. grant price. Number. grant price.
of grants. R of grants. R
Balance at the beginning of the year 3 593 891 19.80 4 933 669 10.97
Granted 960 003 39.16 800 000 37.33
Lapsed (311 922) (9.08)
Vested (1 606 509) (7.28) (2 139 778) (5.98)
Balance at the end of the year 2 635 463 32.11 3 593 891 19.80
IFRS 2 share-based payment charge R6 386 254 R2 636 252
Rights outstanding at the end of the year vest in the following years (performance period), subject to the fulfilment
of performance conditions.
2014 2013
Number. Number.
of rights. of rights.
Year ending 31 December:
2014 1 897 146
2015 507 479 490 224
2016 427 560 453 095
2017 518 206 273 426
2018 413 109 160 000
2019 413 109 160 000
2020 178 000 160 000
2021 178 000
2 635 463 3 593 891
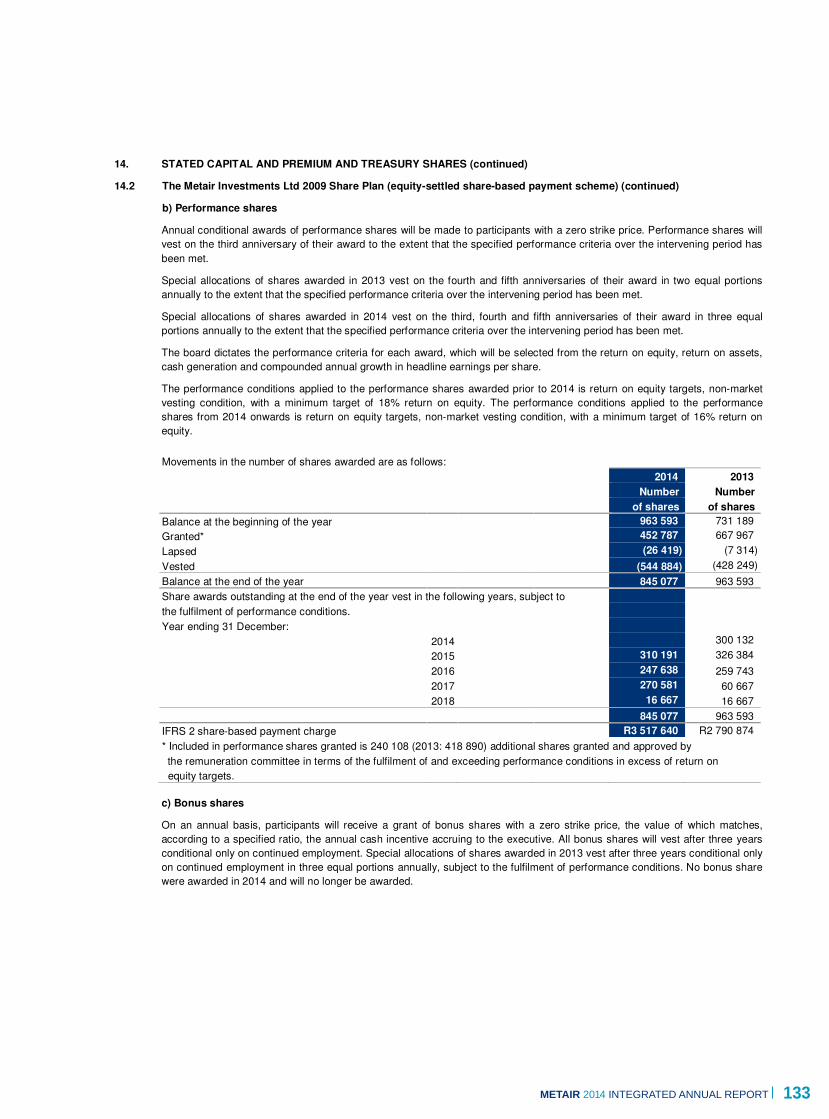
133METaIR 2014 INTEGRATED ANNUAL REPORT
NOTES TO THE ANNUAL FINANCIAL STATEMENTS
METAIR 2014 INTEGRATED ANNUAL REPORT 133
14. STATED CAPITAL AND PREMIUM AND TREASURY SHARES (continued)
14.2 The Metair Investments Ltd 2009 Share Plan (equity-settled share-based payment scheme) (continued)
b) Performance shares
Annual conditional awards of performance shares will be made to participants with a zero strike price. Performance shares will
vest on the third anniversary of their award to the extent that the specified performance criteria over the intervening period has
been met.
Special allocations of shares awarded in 2013 vest on the fourth and fifth anniversaries of their award in two equal portions
annually to the extent that the specified performance criteria over the intervening period has been met.
Special allocations of shares awarded in 2014 vest on the third, fourth and fifth anniversaries of their award in three equal
portions annually to the extent that the specified performance criteria over the intervening period has been met.
The board dictates the performance criteria for each award, which will be selected from the return on equity, return on assets,
cash generation and compounded annual growth in headline earnings per share.
The performance conditions applied to the performance shares awarded prior to 2014 is return on equity targets, non-market
vesting condition, with a minimum target of 18% return on equity. The performance conditions applied to the performance
shares from 2014 onwards is return on equity targets, non-market vesting condition, with a minimum target of 16% return on
equity.
Movements in the number of shares awarded are as follows:
2014 2013
Number. Number.
of shares. of shares.
Balance at the beginning of the year 963 593 731 189
Granted* 452 787 667 967
Lapsed (26 419) (7 314)
Vested (544 884) (428 249)
Balance at the end of the year 845 077 963 593
Share awards outstanding at the end of the year vest in the following years, subject to
the fulfilment of performance conditions.
Year ending 31 December:
2014 300 132
2015 310 191 326 384
2016 247 638 259 743
2017 270 581 60 667
2018 16 667 16 667
845 077 963 593
IFRS 2 share-based payment charge R3 517 640 R2 790 874
* Included in performance shares granted is 240 108 (2013: 418 890) additional shares granted and approved by
the remuneration committee in terms of the fulfilment of and exceeding performance conditions in excess of return on
equity targets.
c) Bonus shares
On an annual basis, participants will receive a grant of bonus shares with a zero strike price, the value of which matches,
according to a specified ratio, the annual cash incentive accruing to the executive. All bonus shares will vest after three years
conditional only on continued employment. Special allocations of shares awarded in 2013 vest after three years conditional only
on continued employment in three equal portions annually, subject to the fulfilment of performance conditions. No bonus share
were awarded in 2014 and will no longer be awarded.

134 METaIR 2014 INTEGRATED ANNUAL REPORT
NOTES TO THE ANNUAL FINANCIAL STATEMENTS CONTINUED
134 METAIR 2014 INTEGRATED ANNUAL REPORT
14. STATED CAPITAL AND PREMIUM AND TREASURY SHARES (continued) 14.2 The Metair Investments Limited 2009 Share Plan (equity settled share-based payment scheme) (continued)
Movements in the number of bonus shares awarded are as follows:
2014 2013
Number of. Number of.
shares. shares.
Balance at the beginning of the year 1 025 006 909 677
Granted 392 440
Lapsed (30 224)
Vested (282 730) (277 111)
Balance at the end of the year 712 052 1 025 006
IFRS 2 share-based payment charge R5 443 911 R4 320 196
Share awards outstanding at the end of the year vest in the following years,
subject to the fulfilment of performance conditions.
Year ending 31 December:
2014 272 591
2015 343 259 409 975
2016 268 793 242 440
2017 50 000 50 000
2018 50 000 50 000
712 052 1 025 006
d) Valuation of share incentive grants
The fair value of the share appreciation rights was determined using a modified binomial tree model. The performance and
bonus shares granted in terms of the share plan are the economic equivalent of awarding a Metair share (without dividend
rights for the period from grant date to vesting date) at zero strike. Therefore the value of each performance share and bonus
share is equal to the share price on the grant date less the present value of future dividends expected over the vesting period.
The table below sets out the assumptions used to value the grants
Share
appreciation Performance Bonus
rights shares shares
2014
Spot price R42.80/R35.20/R35.20 R42.80
Strike price R42.77/R37.35/R37.35 Nil
Volatility** 21.8%/27.85/27.85% N/A
Dividend yield 1.85%/2.48%/2.48% 2.0%
Valuation (IFRS 2) R4 305 852/R3 684 480/R2 792 132 R4 309 571
Fair value per share at grant R13.04/R9.50/R11.17 R40.53
2013
Spot price R37.88 R37.40/R37.88 R37.40/R37.88
Strike price R37.33 Nil Nil
Volatility** 44.33% N/A N/A
Dividend yield 2.08% 2.42%/2.12% 2.42%/2.12%
Valuation (IFRS 2) R7 621 616 R3 392 989 R11 372 273
Fair value per share at grant R22.03 R34.88/R34.77 R34.88/R34.77
The total IFRS 2 employee share-based payment expense for the year was R15 347 805 (2013: R9 747 321), including
allocation to non-controlling interests. The cost of share-based expenses for the company is capitalised to the investment in
subsidiaries. Metair's share price at 31 December 2014 was R31.95 (2013: R39.59).
** The volatility input to the pricing model is a measure of the expected price fluctuations of the Metair share price over the life
of the option structure. Volatility is measured as the annualised standard deviation of the daily price changes in underlying
shares.

135METaIR 2014 INTEGRATED ANNUAL REPORT
NOTES TO THE ANNUAL FINANCIAL STATEMENTS
METAIR 2014 INTEGRATED ANNUAL REPORT 135
14. STATED CAPITAL AND PREMIUM AND TREASURY SHARES (continued)
14.2 The Metair Investments Limited 2009 Share Plan (equity settled share-based payment scheme) (continued)
e) Share awards, options and other grants allocated to and exercised by Metair executive directors
Share.
appreciation. Performance. Bonus.
rights. shares shares. Total.
Yearly award (number of shares):
2014
CT Loock 84 476 20 629 105 105
S Douwenga 294 746 12 358 307 104
2013
CT Loock 800 000 69 962 180 222 1 050 184
BM Jacobs 8 920 17 544 26 464
Exercise (number of shares):
2014
CT Loock ** (495 646) (43 451) (124 996) (664 093)
BM Jacobs ** (19 838) (17 251) (37 089)
2013
CT Loock (469 015) (54 061) (523 076)
BM Jacobs (231 808) (15 113) (246 921)
Lapse (number of shares):
2014
BM Jacobs (304 103) (20 962) (30 224) (355 289)
Cumulative (number of shares):
2014
CT Loock 1 015 741 204 851 198 189 1 418 781
S Douwenga 294 746 12 358 307 104
2013
CT Loock 1 426 911 227 673 323 185 1 977 769
BM Jacobs 304 103 40 800 47 475 392 378 ** Set off against performance shares exercised is 50 631 (2013: 79 853) additional shares granted and approved by the
** Remuneration Committee in terms of the fulfilment of certain performance conditions.
The executive directors held no share options granted in terms of the Metair Share Trust incentive scheme (refer 14.1).
14.3 Interest of directors
At 31 December 2014 members of the board of directors had a direct and indirect beneficial and non-beneficial interest in
the company's ordinary stated capital as set out below (there has been no change since that date):
Beneficial. Beneficial.
Direct. Indirect. Direct. Indirect.
Number. % Number. % Number. % Number. %
31 December 2014 31 December 2013
Director
Executive directors
BM Jacobs 72 295 0.04
Non-executive
directors
A Joffe 2 047 506 1.03 2 665 934 1.34
Independent non-executive
directors
L Soanes 120 000 0.06 240 000 0.12
Total 120 000 0.06 2 047 506 1.03 312 295 0.16 2 665 934 1.34
There is no non-beneficial interest by members of board of directors.

136 METaIR 2014 INTEGRATED ANNUAL REPORT
NOTES TO THE ANNUAL FINANCIAL STATEMENTS CONTINUED
136 METAIR 2014 INTEGRATED ANNUAL REPORT
GROUP COMPANY
2014 2013 2014 2013
R'000 R'000 R'000 R'000
15. RESERVES
Other reserves comprises the following:
15.1 Share-based payment reserve
Balance at the beginning of the year 58 215 33 287 17 561 11 666
Value of service provided 15 348 9 747 15 348 9 747
Deferred taxation 1 685 15 767
Utilisation of treasury shares to settle obligation* (21 184) (25 896) (6 749) (3 852)
Estimated taxation effect of utilisation of treasury shares (12 441) (15 123)
Transfer of net vesting impact to retained earnings 33 625 41 019
Loss on settlement (Metair Share Trust) (1 264) (586)
Balance at the end of the year 73 984 58 215 26 160 17 561
* The market value of shares utilised to settle the obligation
amounted to R79 million (2013: R94 million).
15.2 Hedging reserve
Effects of cash flow hedges 110 377
Transfer to acquisition of subsidiary (110 377)
Balance at the end of the year
15.3 Foreign currency translation reserve
Balance at beginning of the year 87 809 36 660
Exchange gains arising from translation of foreign operations:
- Group 12 502 51 881
- Non-controlling interests (82) (732)
Balance at end of the year 100 229 87 809
15.4 Equity accounted reserves
Balance at the beginning of the year 190 742 171 895
Transfers from retained earnings 51 898 18 847
Balance at the end of the year 242 640 190 742
Transfer from retained earnings consists of:
- Share of associated companies' after taxation income 70 006 61 924
- Dividends received (18 108) (43 077)
51 898 18 847
15.5 Change in ownership reserve - Non-controlling interests (NCI)
The reserve relates to the premiums paid on purchases of and profit/loss on disposals to NCI without a change in degree of control. The reserve arose as a result of transactions with Mutlu NCI (refer note 28.2):
Deemed dilution in shareholding (MTO closure) 2 890
Acquisition of additional interest (1 670)
Deemed acquisition of remaining interest ('minority squeeze-out') (22 077)
Balance at the end of the year (20 857)
Total other reserves 395 996 336 766 26 160 17 561
15.6 Retained earnings
Balance at the beginning of the year 1 897 909 1 755 168 720 783 613 866
Net profit for the year 601 460 341 376 256 151 342 088
Other comprehensive income (10 378) 280
Dividends paid (136 822) (139 049) (139 290) (144 905)
Transfers to equity accounted reserves (51 898) (18 847)
Transfer of net vesting impact to retained earnings (33 625) (41 019)
Settlement of share option (72 273) (90 266)
Balance at the end of the year 2 266 646 1 897 909 765 371 720 783

137METaIR 2014 INTEGRATED ANNUAL REPORT
NOTES TO THE ANNUAL FINANCIAL STATEMENTS
METAIR 2014 INTEGRATED ANNUAL REPORT 137
GROUP COMPANY
2014 2013 2014 2013
R'000 R'000 R'000 R'000
15. RESERVES (continued)
15.7 Non-controlling interests
Balance at the beginning of the year 101 387 85 076
Net profit for the year - attributable to non-controlling interests 30 845 32 523
Other comprehensive income - attributable to non-controlling interests (198) 690
Mutlu NCI reinstated (MTO closure) 68 629
Acquisition of an additional interest in Mutlu (5 612)
Derecognition of Mutlu NCI (minority squeeze-out) (63 017)
Dividend (32 501) (16 902)
Balance at the end of the year 99 533 101 387
16. BORROWINGS
Redeemable preference shares 1 400 000
Bank borrowings 315 920 1 185 319
Instalment sale liabilities 12 732 16 835
Finance lease liabilities 11 193 618
Total borrowings 1 739 845 1 202 772
Current portion included in current liabilities (69 268) (180 796)
Non-current portion 1 670 577 1 021 976
Refinancing
On 13 August 2014, the group refinanced available facilities in the amount of R1.8 billion, previously extended by Absa Bank
Ltd, for the acquisition of Mutlu Akü by way of the issue of preference shares in an aggregate amount of R1.4 billion. In addition,
a revolving credit facility (RCF) in the amount of R750 million was also raised. The revolving credit facility will be used to fund
working capital and capital expenditure.
Absa Bank Limited, Investec Bank and Standard Bank have committed to the revolving credit facility (lenders) and Standard
Bank subscribed for the entire preference share issue.
A total of R923 237 000 relating to unsecured Absa term loans owing in the prior year was settled as part of the refinancing.
Preference shares
An aggregate of 1 400 cumulative redeemable no par value preference shares were issued on 2 September 2014 and are
mandatorily redeemable on a pro rata basis over a period of five years commencing no earlier than three years and one month
from the date of issue, on the following dates:
2014
R'000
Upon the date 3 years and 1 month after the Issue Date (30 September 2017) 840 000
Upon the date 4 years after the Issue Date (2 September 2018) 280 000
Upon the date 5 years after the Issue Date (final redemption date of 2 September 2019) 280 000
1 400 000
Preference dividends are to be paid on a semi-annual basis on 15 April and 15 October of each year during the term and
carry a dividend rate of 69% of the ruling South African prime rate calculated on a nominal annual monthly compounded
basis (NACM).
The preference shares are subject to covenant requirements (refer note 21.3). The obligations under the preference share
facility are guaranteed on a joint and several basis by certain wholly-owned subsidiaries within the group.

138 METaIR 2014 INTEGRATED ANNUAL REPORT
NOTES TO THE ANNUAL FINANCIAL STATEMENTS CONTINUED
138 METAIR 2014 INTEGRATED ANNUAL REPORT
16. BORROWINGS (continued)
Bank borrowings
Bank borrowings mature until March 2019 and include short and long-term debt consisting of term loan, working capital and
revolving credit facilities (RCF). Drawdowns on the RCF amounted to R177 894 000 at balance sheet date. The RCF has a tenure of five years with a final
maturity date of 13 August 2019. Interest is charged at 2.05% over the ruling JIBAR rate, determined either on a one, three
or six month basis, as selected by the group (interest period). Interest accrues on a daily basis and is payable in arrears
at the end of each interest period. Drawdowns are payable on a rolling basis at each interest period, but not later than the
final maturity date. Drawdowns are classified as non-current liabilities at balance sheet date as a result of the rolling
mechanism. The RCF is guaranteed on a joint and several basis by certain subsidiaries within the group. Group bank borrowings also consist of secured term loan facilities of R138 025 308 (2013: R262 082 000 of secured term
loans and R923 237 000 of unsecured term loans). These consist predominantly of US$12 425 000 and TL862 000
borrowings arising in Mutlu Akü (2013: US$18 659 000 and TL11 226 000) with maturities ranging up to 25 May 2017. The
interest rates range from 2.3% to 3.8% per annum (2013: 3.96% to 5.17%). Annual repayments approximate US$4 800 000
per annum (2013: US$5 500 000). The carrying value of security provided for borrowings (excluding financed assets), can be summarised as follows:
Group Company
2014 2013 2014 2013
R'000 R'000 R'000 R'000
Property, plant and equipment (note 7) 372 000 399 537
Inventory (note 11) 57 963
Trade receivables (note 12) 182 495
Total 372 000 639 995
Maturity of non-current borrowings (excluding financed assets)
Later than 1 year and not later than 2 years 61 071 881 993
Later than 2 year and not later than 5 years 1 595 751 139 542
1 656 822 1 021 535
The carrying amount of the above borrowings are denominated in the
following currencies:
Rand 1 601 820 941 836
US Dollar 133 751 183 470
Euro 22 274
Turkish Lira 4 274 55 192
1 739 845 1 202 772
The group had unutilised borrowing facilities of R1 601 000 000 and US$163 502 000 (Mutlu) of which R572 106 000 relates to
the RCF (2013: R744 016 000, US$172 152 000 (Mutlu) and Absa term facility of R580 000 000) at 31 December 2014.
Except for the RCF funding, all undrawn borrowing facilities are renewable annually. The borrowing powers of the company are
unlimited in terms of its memorandum of incorporation.
In the prior year, security provided over current assets related to the Rombat ‘RBS’ loan. The loan has been repaid in full. Mutlu
has provided general security in the amount of R78 839 200 for the ‘USD’ facilities available.
Instalment sale liabilities
Assets acquired by instalment sale agreements are paid over an agreed time period. The title of the asset passes automatically,
once the full amount has been paid. Payment obligations are effectively secured as the rights to the asset revert to the financer
in the event of default.
Instalment sale agreements are secured over vehicles and machinery with a book value of R20 537 518 (2013: R23 409 218).

139METaIR 2014 INTEGRATED ANNUAL REPORT
NOTES TO THE ANNUAL FINANCIAL STATEMENTS
METAIR 2014 INTEGRATED ANNUAL REPORT 139
16. BORROWINGS (continued)
GROUP COMPANY
2014 2013 2014 2013
R'000 R'000 R'000 R'000
Instalment sale liabilities - Minimum payments:
No later than 1 year 7 412
Later than 1 year and no later than 5 years 6 446
Minimum instalments 13 858
Future finance charges (1 126)
Present value of liabilities 12 732
The present value of all instalment sale liabilities may be
analysed as follows:
No later than 1 year 6 649
Later than 1 years and no later than 2 years 4 249
Later than 2 years and no later than 5 years 1 834 Finance lease liabilities
Lease rental obligations under financial lease arrangements are
capitalised and lease liabilities are effectively secured as the rights to
the leased asset revert to the lessor in the event of default. Capitalised finance leases are secured over vehicles and equipment
with a book value of R11 948 848 (2013: R588 816).
Gross finance lease liabilities - minimum lease payments:
Not later than 1 year 3 722 217
Later than 1 year and not later than 5 years 9 137 490
Minimum lease payments 12 859 707
Future finance charges on finance leases (1 666) (89)
Present value of finance lease liabilities 11 193 618
The present value of all finance lease liabilities may be
analysed as follows:
Not later than 1 year 2 915 177
Later than 1 years and no later than 2 years 3 435 441
Later than 2 years and no later than 5 years 4 843
11 193 618
All borrowings are interest-bearing and the approximate effective
annual interest rates at year-end are as follows: % %
Preference shares 6.4
Bank borrowings
- Revolving credit facility Jibar + 2.05
- Term facilities Jibar + 1.5
- Call loans (foreign borrowings) 1.9 - 4.1 2.5 - 5.2
Instalment sale liabilities 7.8 7.5
Finance lease liabilities 8.5 8.5

140 METaIR 2014 INTEGRATED ANNUAL REPORT
NOTES TO THE ANNUAL FINANCIAL STATEMENTS CONTINUED
140 METAIR 2014 INTEGRATED ANNUAL REPORT
GROUP COMPANY
2014 2013 2014 2013
Restated.
R'000 R'000 R'000 R'000
17. DEFERRED TAXATION
Deferred income taxation is calculated on all temporary differences under
the liability method using a principal taxation rate of 28% (2013: 28%) for
South Africa, 16% (2013: 16%) for Romania and 20% for Turkey.
The following amounts are shown in the consolidated balance sheet:
Deferred taxation assets (16 804) (10 838)
Deferred taxation liabilities 374 551 372 959
357 747 362 121
The movement on the deferred income taxation account is as follows:
At the beginning of the year 362 121 50 087
Effect of change in taxation rate
Acquisition of subsidiary 312 397
Income statement charge/(credit):
- Current year 1 116 28 565
- Prior year (3 501) (3 502)
Taxation (credited)/charged to other comprehensive income:
- Actuarial (losses)/gains (2 703) 157
Taxation credited to equity:
- Share-based payments (1 685) (15 767)
Currency adjustments 2 399 (9 816)
At the end of the year 357 747 362 121
Deferred taxation assets:
Deferred taxation asset to be recovered after more than 12 months (68 101) (87 430)
Deferred taxation asset to be recovered within 12 months (52 079) (13 889)
(120 180) (101 319)
Deferred taxation liabilities:
Deferred taxation liability to be recovered after more than 12 months 451 748 445 691
Deferred taxation liability to be recovered within 12 months 26 179 17 749
477 927 463 440
Amounts aggregated based on subsidiary companies:
Deferred taxation assets (120 180) (101 319)
Deferred taxation liabilities 477 927 463 440
Net deferred taxation liability 357 747 362 121
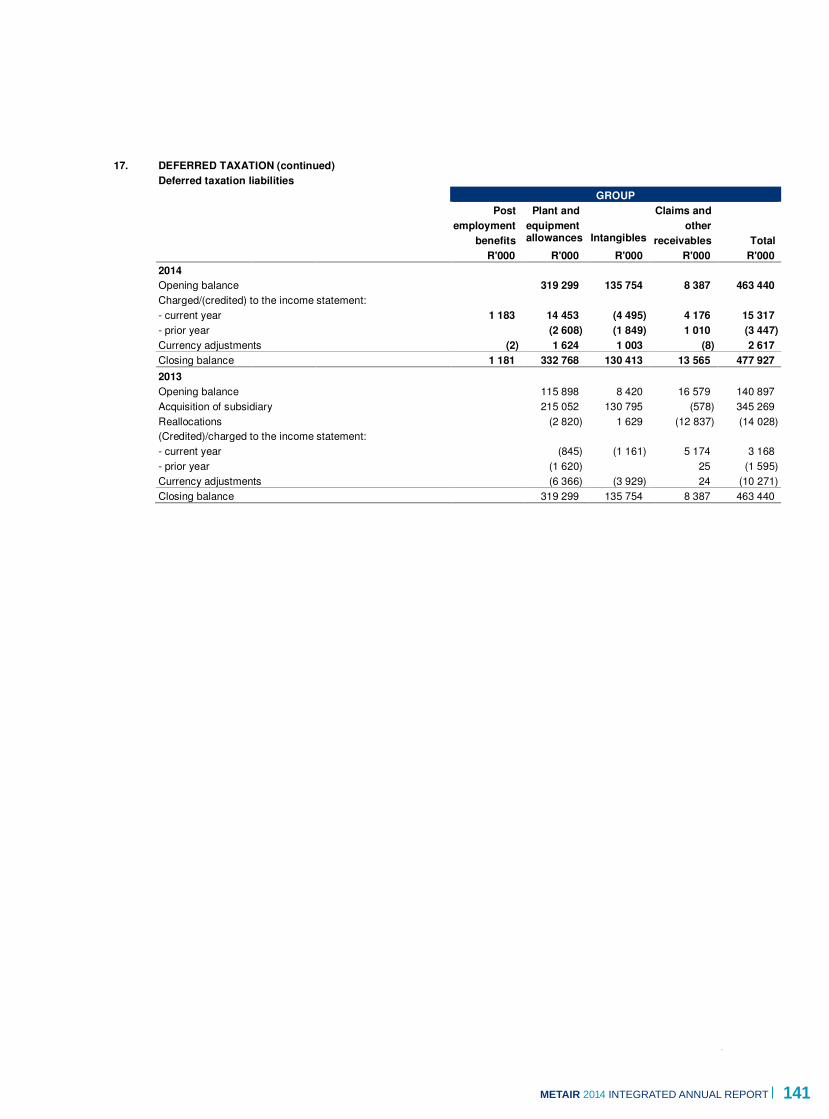
141METaIR 2014 INTEGRATED ANNUAL REPORT
NOTES TO THE ANNUAL FINANCIAL STATEMENTS
METAIR 2014 INTEGRATED ANNUAL REPORT 141
17. DEFERRED TAXATION (continued)
Deferred taxation liabilities
GROUP
Post. Plant and. Claims and.
employment. equipment. other.
benefits. allowances.
Intangibles.
receivables. Total.
R'000 R'000 R'000 R'000 R'000
2014
Opening balance 319 299 135 754 8 387 463 440
Charged/(credited) to the income statement:
- current year 1 183 14 453 (4 495) 4 176 15 317
- prior year (2 608) (1 849) 1 010 (3 447)
Currency adjustments (2) 1 624 1 003 (8) 2 617
Closing balance 1 181 332 768 130 413 13 565 477 927
2013
Opening balance 115 898 8 420 16 579 140 897
Acquisition of subsidiary 215 052 130 795 (578) 345 269
Reallocations (2 820) 1 629 (12 837) (14 028)
(Credited)/charged to the income statement:
- current year (845) (1 161) 5 174 3 168
- prior year (1 620) 25 (1 595)
Currency adjustments (6 366) (3 929) 24 (10 271)
Closing balance 319 299 135 754 8 387 463 440

142 METaIR 2014 INTEGRATED ANNUAL REPORT
NOTES TO THE ANNUAL FINANCIAL STATEMENTS CONTINUED
142 METAIR 2014 INTEGRATED ANNUAL REPORT
17. DEFERRED TAXATION (continued)
Deferred taxation assets
GROUP
Post-. Provision.
Share-. employ-. Assessed. for.
based. ment. losses. doubtful. Warranty. Derivatives.
payments. benefits. set off. debts. claims. and other. Total.
R'000 R'000 R'000 R'000 R'000 R'000 R'000
2014
Opening balance (14 463) (23 899) (3 536) (1 264) (20 564) (37 593) (101 319)
Charged/(credited)
to the income statement:
- Current year 7 244 1 056 (16 443) (519) 3 006 (8 545) (14 201)
- Prior year 44 (615) 517 (54)
Charged/(credited) to other
comprehensive income (2 703) (2 703)
Deferred taxation on share-
based payment reserve* (1 685) (1 685)
Currency adjustments 3 (137) 14 (57) (41) (218)
Closing balance (8 901) (25 639) (20 594) (1 769) (17 615) (45 662) (120 180)
2013 (Restated)
Opening balance (28 017) (11 073) (5 749) (901) (12 652) (32 418) (90 810)
Acquisition of subsidiary** (16 282) (5 917) (10 673) (32 872)
Reallocations 17 591 (4 546) (22) 620 (2 789) 3 174 14 028
(Credited)/charged
to the income statement:
- Current year 11 741 7 188 4 677 (976) 555 2 212 25 397
- Prior year (2 442) 535 (1 907)
Charged/(credited) to other
comprehensive income 157 157
Deferred taxation on share-
based payment reserve* (15 767) (15 767)
Currency adjustments** (11) 657 (7) 239 (423) 455
Closing balance (14 463) (23 899) (3 536) (1 264) (20 564) (37 593) (101 319)
* The measurement of the deductible expense for deferred taxation purposes is based on the entity’s share price at the
* balance sheet date.
** Adjusted for finalisation of provisionally determined values in respect of prior year business combination (refer note 28.1).

143METaIR 2014 INTEGRATED ANNUAL REPORT
NOTES TO THE ANNUAL FINANCIAL STATEMENTS
METAIR 2014 INTEGRATED ANNUAL REPORT 143
17. DEFERRED TAXATION (continued)
Deferred tax assets have been recognised for the carry forward amount of unused tax losses relating to the group’s operations
where, among other things, taxation losses can be carried forward indefinitely and there is evidence that it is probable that
sufficient taxable profits will be available in the future to utilise all tax losses carried forward.
Deferred tax assets have been recognised to the extent that it is probable that the entities will generate future taxable income
against which these tax losses can be utilised. Currently there are no statutory limitations as to its usage.
Deferred tax liabilities are not recognised for the income tax effect that may arise on the remittance of unremitted earnings by
subsidiaries. It is management’s intention that, where there is no double taxation relief, these earnings will be permanently re-
invested in the group.
Dividend withholding tax is payable at a rate of 15% on dividends distributed to shareholders. Dividends paid to companies and
certain other institutions and certain individuals are not subject to this withholding tax. This tax is not attributable to the company
paying the dividend but is collected by the company and paid to the tax authorities on behalf of the shareholder. On receipt of a
dividend, the company includes the dividend withholding tax on this dividend in its computation of the income tax expense in the
period of such receipt.
GROUP COMPANY
2014 2013 2014 2013
R'000 R'000 R'000 R'000
18. TRADE AND OTHER PAYABLES
Trade creditors 399 720 413 899
Accrual for leave pay 21 539 22 303
Sundry creditors, advances received and accruals 537 187 404 550 444 13 992
Deferred income on government grants 137 717 144 929
Mutlu Akü minority obligation 38 232 612 581
1 134 395 1 598 262 444 13 992
Non-current portion of deferred income on government grants
included in non-current liabilities (107 581) (125 313)
Current portion included in current liabilities 1 026 814 1 472 949 444 13 992
The minority obligation represents the squeeze out liability for the
remaining shares not acquired as part of the MTO process. The MTO
process was concluded in the first quarter of 2014. The carrying amounts of the group's trade and other payables are
denominated in the following currencies:
Rand 612 001 459 163 444 13 992
Yen 39 917 30 912
US Dollar 32 550 86 627
Euro 124 382 81 263
British Pound 443 370
Thai Baht 4 050 7 427
Romanian Lei 169 542 183 394
Turkish Lira 149 495 749 100
Singapore Dollar 2 015 6
1 134 395 1 598 262 444 13 992
No interest is payable on these amounts.

144 METaIR 2014 INTEGRATED ANNUAL REPORT
NOTES TO THE ANNUAL FINANCIAL STATEMENTS CONTINUED
144 METAIR 2014 INTEGRATED ANNUAL REPORT
19. PROVISIONS FOR LIABILITIES AND CHARGES
Warranty
Provision is made for the estimated liability on all products still under warranty including claims initiated, not yet settled.
Executive bonuses
The provision for executive bonuses is payable within a month after approval of the annual financial statements at the board
meeting.
Environmental and other
A provision is recognised for the present value of costs that may be incurred for statutory environmental and other related
matters. These provisions arise in Mutlu and Rombat and the impact of the unwinding of discount is insignificant.
Other provisions and liabilities comprise predominantly of “buy back” obligations for used battery returns (“scrap deposits”) and
long service awards. The awards arise mainly in Mutlu and are calculated in accordance with IAS19.
Total expected costs provided for environmental and related matters amounted to R15 858 855 (2013: R37 146 144). The
provision for scrap deposits amounted to R37 582 789 and long service awards amounted to R34 718 814
(2013: R30 241 560).
GROUP
Executive. Warranty.
bonus. claims. Environmental. Other. Total.
R'000 R'000 R'000 R'000 R'000
2014
Balance at the beginning of the
year 17 983 99 719 37 146 37 612 192 460
Charged to the income
statement:
- Additional provision 16 773 10 024 3 862 30 659
- Unused amounts reversed (806) (20 759) (5 204) (26 769)
Reclassifications 37 583 37 583
Utilised during the year (19 073) (16 396) (15 891) (5 800) (57 160)
Currency adjustments (5) 137 (192) 268 208
Balance at the end of the year 14 872 72 725 15 859 73 525 176 981
2013 (Restated)
Balance at the beginning of the
year 16 311 46 472 16 374 8 581 87 738
Acquisition of subsidiary 29 141 16 742 45 883
Finalisation of fair value* 31 235 31 235
Charged to the income
statement:
- Additional provision 17 744 29 736 214 47 694
- Unused amounts reversed (558) (1 145) (1 703)
Utilised during the year (16 446) (5 826) (13) (22 285)
Currency adjustments* 374 754 4 030 (1 260) 3 898
Balance at the end of the year 17 983 99 719 37 146 37 612 192 459
2014 2013
Restated.
Analysis of total provisions: R'000 R'000
Non-current 60 290 21 080
Current 116 691 171 379
176 981 192 459
* The other provisions reported in the previous year for the acquisition of Mutlu was determined on a provisional basis.
Subsequent to 31 December 2013 these values have been finalised (refer to note 28.1).
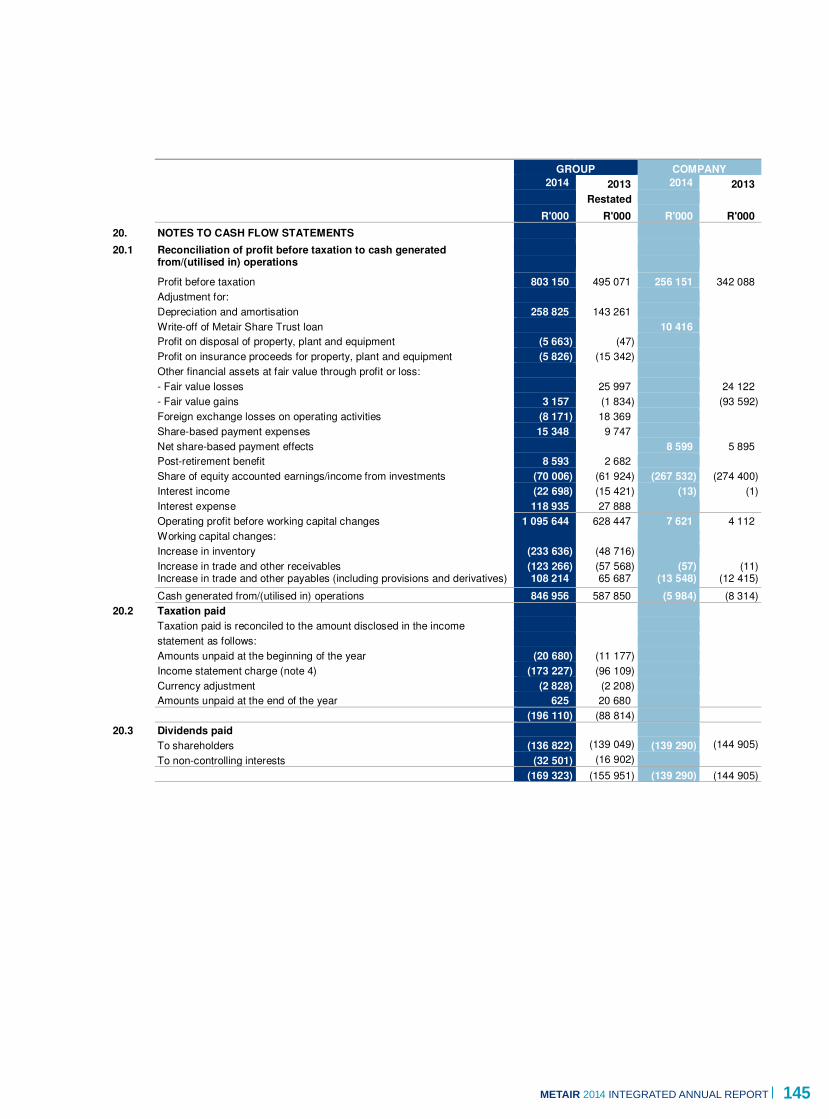
145METaIR 2014 INTEGRATED ANNUAL REPORT
NOTES TO THE ANNUAL FINANCIAL STATEMENTS
METAIR 2014 INTEGRATED ANNUAL REPORT 145
GROUP COMPANY
2014 2013 2014 2013
Restated.
R'000 R'000 R'000 R'000
20. NOTES TO CASH FLOW STATEMENTS
20.1 Reconciliation of profit before taxation to cash generated from/(utilised in) operations
Profit before taxation 803 150 495 071 256 151 342 088
Adjustment for:
Depreciation and amortisation 258 825 143 261
Write-off of Metair Share Trust loan 10 416
Profit on disposal of property, plant and equipment (5 663) (47)
Profit on insurance proceeds for property, plant and equipment (5 826) (15 342)
Other financial assets at fair value through profit or loss:
- Fair value losses 25 997 24 122
- Fair value gains 3 157 (1 834) (93 592)
Foreign exchange losses on operating activities (8 171) 18 369
Share-based payment expenses 15 348 9 747
Net share-based payment effects 8 599 5 895
Post-retirement benefit 8 593 2 682
Share of equity accounted earnings/income from investments (70 006) (61 924) (267 532) (274 400)
Interest income (22 698) (15 421) (13) (1)
Interest expense 118 935 27 888
Operating profit before working capital changes 1 095 644 628 447 7 621 4 112
Working capital changes:
Increase in inventory (233 636) (48 716)
Increase in trade and other receivables (123 266) (57 568) (57) (11) Increase in trade and other payables (including provisions and derivatives) 108 214 65 687 (13 548) (12 415)
Cash generated from/(utilised in) operations 846 956 587 850 (5 984) (8 314)
20.2 Taxation paid
Taxation paid is reconciled to the amount disclosed in the income
statement as follows:
Amounts unpaid at the beginning of the year (20 680) (11 177)
Income statement charge (note 4) (173 227) (96 109)
Currency adjustment (2 828) (2 208)
Amounts unpaid at the end of the year 625 20 680
(196 110) (88 814)
20.3 Dividends paid
To shareholders (136 822) (139 049) (139 290) (144 905)
To non-controlling interests (32 501) (16 902)
(169 323) (155 951) (139 290) (144 905)

146 METaIR 2014 INTEGRATED ANNUAL REPORT
NOTES TO THE ANNUAL FINANCIAL STATEMENTS CONTINUED
146 METAIR 2014 INTEGRATED ANNUAL REPORT
21. FINANCIAL INSTRUMENTS
21.1 Financial Instruments by category
The accounting policies for financial instruments have been applied to the line items below:
Assets as per balance sheet
GROUP
Assets at fair.
Loans and. value through.
receivables. profit or loss. Total.
R'000 R'000 R'000
2014
Derivative financial instruments 4 365 4 365
Trade and other receivables* 1 227 502 1 227 502
Cash and cash equivalents 602 666 602 666
Total 1 830 168 4 365 1 834 533
2013
Derivative financial instruments 15 870 15 870
Trade and other receivables* 1 235 520 1 235 520
Cash and cash equivalents 574 742 574 742
Total 1 810 262 15 870 1 826 131
Liabilities as per balance sheet
Other.
financial.
liabilities.
at fair value.
through. Other.
profit or loss. financial.
and OCI ***. liabilities. Total.
R'000 R'000 R'000
2014
Borrowings 1 739 845 1 739 845
Derivative financial instruments 5 388 5 388
Bank overdraft 130 193 130 193
Trade and other payables** 38 232 797 821 836 053
Total 43 620 2 667 859 2 711 479
2013
Borrowings 1 202 772 1 202 772
Derivative financial instruments 1 492 1 492
Bank overdraft 167 241 167 241
Trade and other payables** 1 431 030 1 431 030
Total 1 492 2 801 043 2 802 535
*** Prepayments are excluded from the trade and other receivables balance.
*** Leave pay, advances received and deferred income are excluded from trade and other payables balance.
*** OCI - other comprehensive income.

147METaIR 2014 INTEGRATED ANNUAL REPORT
NOTES TO THE ANNUAL FINANCIAL STATEMENTS
METAIR 2014 INTEGRATED ANNUAL REPORT 147
21. FINANCIAL INSTRUMENTS (continued)
21.1 Financial Instruments by category (continued)
The accounting policies for financial instruments have been applied to the line items below:
Assets and liabilities as per balance sheet
COMPANY
Other.
Loans and. financial.
receivables. liabilities. Total.
R'000 R'000 R'000
2014
Short-term loans to subsidiaries 485 475 485 475
Trade and other receivables* 211 211
Cash and cash equivalents 1 486 1 486
Short-term loans from subsidiaries (206 924) (206 924)
Trade and other payables** (444) (444)
Total 487 172 (207 368) 279 804
2013
Short-term loans to subsidiaries 306 104 306 104
Trade and other receivables* 154 154
Cash and cash equivalents 4 181 4 181
Short-term loans from subsidiaries (138 278) (138 278)
Trade and other payables** (13 992) (13 992)
Total 310 439 (152 270) 158 169
* Prepayments are excluded from the trade and other receivables balance.
** Leave pay, advances received and deferred income are excluded from trade and other payables balance.
*** OCI - other comprehensive income.
21.2 Financial risk management
The group’s activities expose it to a variety of financial risks: market risk (including foreign currency exchange risk and variable interest rate risk), credit risk and liquidity risk. The group’s overall risk management programme focuses on the unpredictability of financial markets and seeks to minimise potential adverse effects on the group’s financial performance. The executive board provides principles for overall risk management, as well as guidance containing specific areas such as foreign exchange risk.
A. Market risk
i. Foreign currency exchange risk (also refer 21.4.1)
The group operates internationally and is therefore exposed to exchange risk arising from various foreign currency exchange
exposures. These consist primarily of exposures with respect to the Euro, US Dollar, Japanese Yen, Romanian Lei and the
Turkish Lira.
Management has set up policies to require group companies to manage their foreign currency exchange risk against their
functional currency. When the business wins long term customer tenders or orders that are in a foreign currency the group
minimises the potential volatility of the cash flows from these transactions (supplier and customer sides) by ‘hedging’ through
forward exchange contracts. At period end the group is required to mark to market these ‘FECs’ even though it has no intention
of closing them out in advance of their maturity dates. Hedge accounting is not applied unless specifically designated as a cash
flow hedge. Hedge accounting is usually applied in the case of foreign business acquisitions such as the 2013 Mutlu business
combination.
The group makes use of professional foreign currency management specialists to administer its foreign exchange
xposures/contracts.
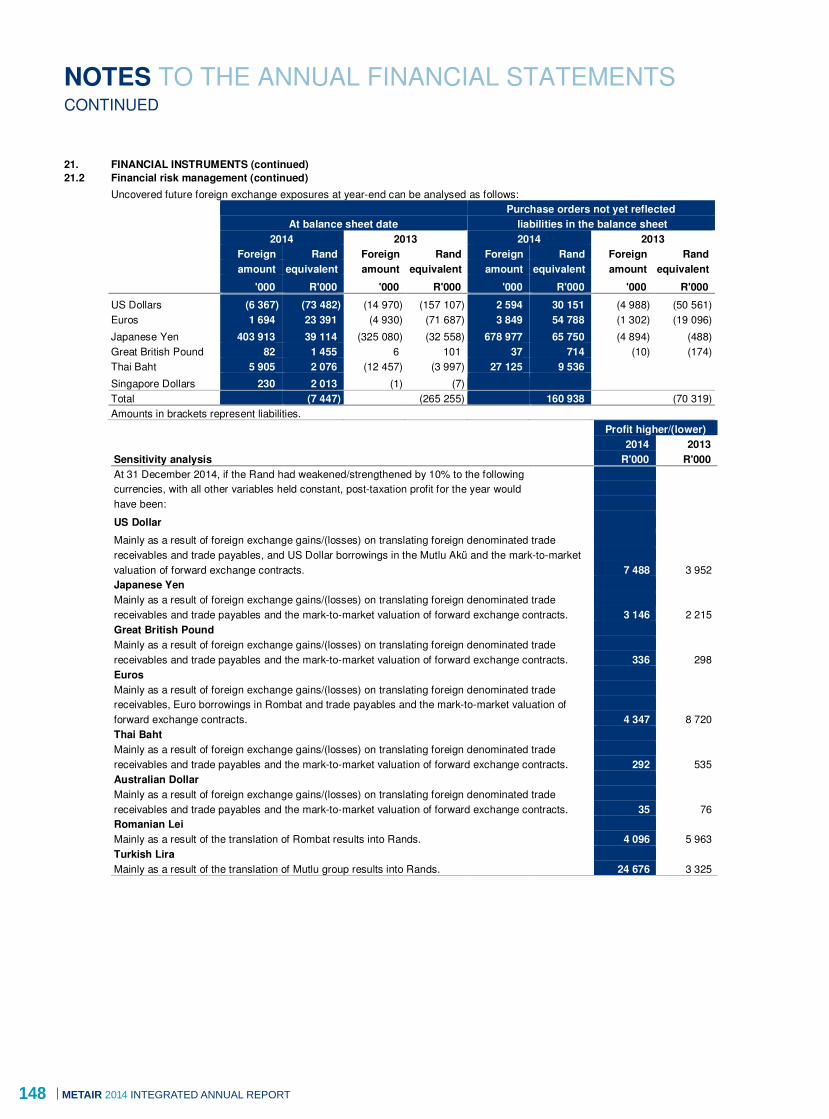
148 METaIR 2014 INTEGRATED ANNUAL REPORT
NOTES TO THE ANNUAL FINANCIAL STATEMENTS CONTINUED
148 METAIR 2014 INTEGRATED ANNUAL REPORT
21. FINANCIAL INSTRUMENTS (continued)
21.2 Financial risk management (continued)
Uncovered future foreign exchange exposures at year-end can be analysed as follows: Purchase orders not yet reflected
At balance sheet date liabilities in the balance sheet
2014 2013 2014 2013
Foreign. Rand. Foreign. Rand. Foreign. Rand. Foreign. Rand.
amount. equivalent. amount. equivalent. amount. equivalent. amount. equivalent.
'000 R'000 '000 R'000 '000 R'000 '000 R'000
US Dollars (6 367) (73 482) (14 970) (157 107) 2 594 30 151 (4 988) (50 561)
Euros 1 694 23 391 (4 930) (71 687) 3 849 54 788 (1 302) (19 096)
Japanese Yen 403 913 39 114 (325 080) (32 558) 678 977 65 750 (4 894) (488)
Great British Pound 82 1 455 6 101 37 714 (10) (174)
Thai Baht 5 905 2 076 (12 457) (3 997) 27 125 9 536
Singapore Dollars 230 2 013 (1) (7)
Total (7 447) (265 255) 160 938 (70 319)
Amounts in brackets represent liabilities.
Profit higher/(lower)
2014 2013
Sensitivity analysis R'000 R'000
At 31 December 2014, if the Rand had weakened/strengthened by 10% to the following
currencies, with all other variables held constant, post-taxation profit for the year would
have been:
US Dollar
Mainly as a result of foreign exchange gains/(losses) on translating foreign denominated trade
receivables and trade payables, and US Dollar borrowings in the Mutlu Akü and the mark-to-market
valuation of forward exchange contracts. 7 488 3 952
Japanese Yen
Mainly as a result of foreign exchange gains/(losses) on translating foreign denominated trade
receivables and trade payables and the mark-to-market valuation of forward exchange contracts. 3 146 2 215
Great British Pound
Mainly as a result of foreign exchange gains/(losses) on translating foreign denominated trade
receivables and trade payables and the mark-to-market valuation of forward exchange contracts. 336 298
Euros
Mainly as a result of foreign exchange gains/(losses) on translating foreign denominated trade
receivables, Euro borrowings in Rombat and trade payables and the mark-to-market valuation of
forward exchange contracts. 4 347 8 720
Thai Baht
Mainly as a result of foreign exchange gains/(losses) on translating foreign denominated trade
receivables and trade payables and the mark-to-market valuation of forward exchange contracts. 292 535
Australian Dollar
Mainly as a result of foreign exchange gains/(losses) on translating foreign denominated trade
receivables and trade payables and the mark-to-market valuation of forward exchange contracts. 35 76
Romanian Lei
Mainly as a result of the translation of Rombat results into Rands. 4 096 5 963
Turkish Lira
Mainly as a result of the translation of Mutlu group results into Rands. 24 676 3 325
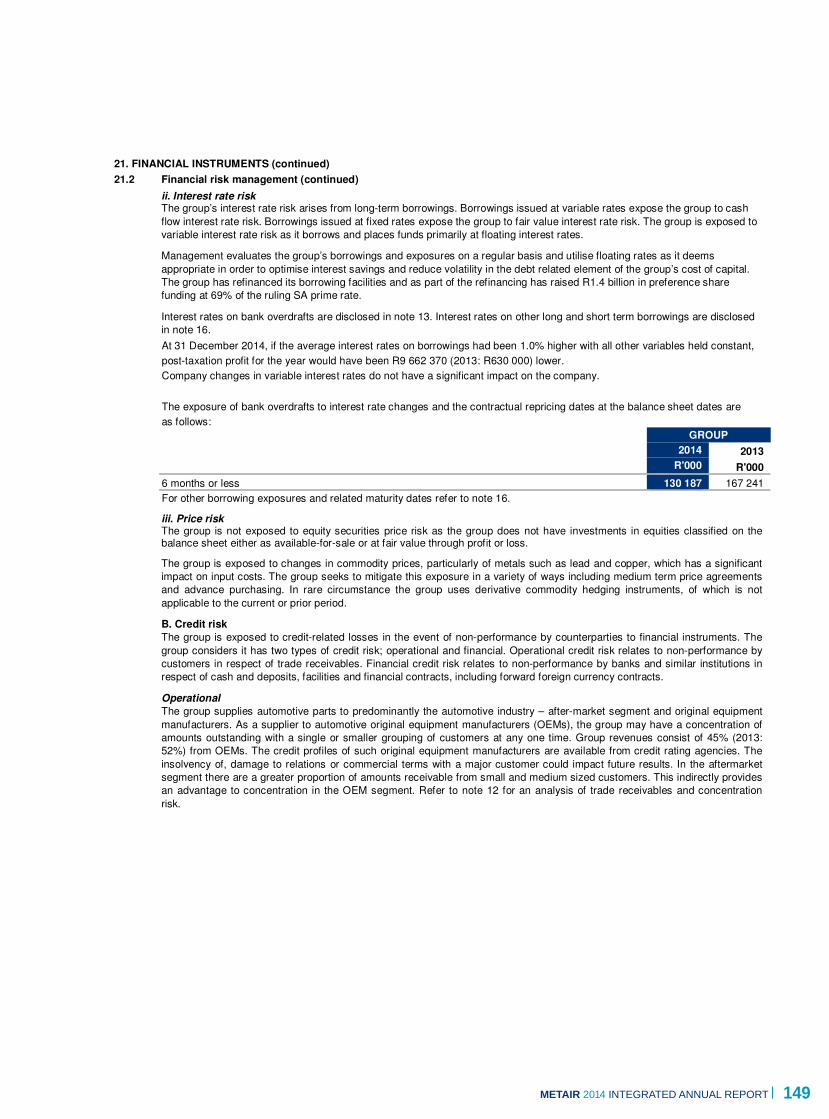
149METaIR 2014 INTEGRATED ANNUAL REPORT
NOTES TO THE ANNUAL FINANCIAL STATEMENTS
METAIR 2014 INTEGRATED ANNUAL REPORT 149
21. FINANCIAL INSTRUMENTS (continued)
21.2 Financial risk management (continued)
ii. Interest rate risk The group’s interest rate risk arises from long-term borrowings. Borrowings issued at variable rates expose the group to cash
flow interest rate risk. Borrowings issued at fixed rates expose the group to fair value interest rate risk. The group is exposed to
variable interest rate risk as it borrows and places funds primarily at floating interest rates.
Management evaluates the group’s borrowings and exposures on a regular basis and utilise floating rates as it deems
appropriate in order to optimise interest savings and reduce volatility in the debt related element of the group’s cost of capital.
The group has refinanced its borrowing facilities and as part of the refinancing has raised R1.4 billion in preference share
funding at 69% of the ruling SA prime rate.
Interest rates on bank overdrafts are disclosed in note 13. Interest rates on other long and short term borrowings are disclosed
in note 16. At 31 December 2014, if the average interest rates on borrowings had been 1.0% higher with all other variables held constant,
post-taxation profit for the year would have been R9 662 370 (2013: R630 000) lower.
Company changes in variable interest rates do not have a significant impact on the company. The exposure of bank overdrafts to interest rate changes and the contractual repricing dates at the balance sheet dates are
as follows:
GROUP
2014 2013
R'000 R'000
6 months or less 130 187 167 241
For other borrowing exposures and related maturity dates refer to note 16.
iii. Price risk The group is not exposed to equity securities price risk as the group does not have investments in equities classified on the balance sheet either as available-for-sale or at fair value through profit or loss.
The group is exposed to changes in commodity prices, particularly of metals such as lead and copper, which has a significant
impact on input costs. The group seeks to mitigate this exposure in a variety of ways including medium term price agreements
and advance purchasing. In rare circumstance the group uses derivative commodity hedging instruments, of which is not
applicable to the current or prior period.
B. Credit risk
The group is exposed to credit-related losses in the event of non-performance by counterparties to financial instruments. The
group considers it has two types of credit risk; operational and financial. Operational credit risk relates to non-performance by
customers in respect of trade receivables. Financial credit risk relates to non-performance by banks and similar institutions in
respect of cash and deposits, facilities and financial contracts, including forward foreign currency contracts.
Operational
The group supplies automotive parts to predominantly the automotive industry – after-market segment and original equipment
manufacturers. As a supplier to automotive original equipment manufacturers (OEMs), the group may have a concentration of
amounts outstanding with a single or smaller grouping of customers at any one time. Group revenues consist of 45% (2013:
52%) from OEMs. The credit profiles of such original equipment manufacturers are available from credit rating agencies. The
insolvency of, damage to relations or commercial terms with a major customer could impact future results. In the aftermarket
segment there are a greater proportion of amounts receivable from small and medium sized customers. This indirectly provides
an advantage to concentration in the OEM segment. Refer to note 12 for an analysis of trade receivables and concentration
risk.

150 METaIR 2014 INTEGRATED ANNUAL REPORT
NOTES TO THE ANNUAL FINANCIAL STATEMENTS CONTINUED
150 METAIR 2014 INTEGRATED ANNUAL REPORT
21. FINANCIAL INSTRUMENTS (continued)
21.2 Financial risk management (continued)
Credit risk and customer relationships are managed in a number of ways within the Group. The granting of credit is controlled
by a formal application process and rigid account limits. Ongoing credit evaluations are performed on the financial position of
these debtors. This evaluation takes into account its financial position, past experience and other factors such as amounts
overdue and credit limits. The group has extensive and regular dialogue with key customers and strong commercial
relationships. Provisions for doubtful debts are determined based upon the customer’s ability to pay and other factors in the
group’s relationship with the customer. Trade receivables are presented net of the provision for impairment.
Financial
Credit risk is mitigated by the group’s policy of selecting counterparties with a strong investment graded long term credit rating.
In South Africa, this is usually limited to the ‘big 4’ retail banks and major investment institutions. In Turkey and Romania, this is
usually limited to financial institutions of strong international investment ratings. The maximum exposure to a single bank for
deposits in South Africa is R217 million, whilst foreign deposits (held by foreign subsidiaries) and mark to market exposure for
forward foreign currency contracts at 31 December 2014 is evenly spread.
The credit quality of financial assets is based on historical counterparty default rules:
GROUP
2014 2013
Analysis of credit quality R'000 R'000
Trade receivables
Counterparties are:
Group 1 - new customers (less than 6 months). 35 538 33 685
Group 2 - existing customers (more than 6 months) with no defaults in the past. 1 076 952 1 103 567
Group 3 - existing customers (more than 6 months) with some defaults in the past. All defaults were
fully recovered. 1 362 2 286
1 113 852 1 139 538
Cash and cash equivalents
Bank balances were held as follows:
South African banks* 398 460 374 360
European banks** 6 154 77 753
Turkish banks** 198 052 122 629
602 666 574 743
Derivative financial assets
Forward exchange contracts were held as follows:
South African banks* 4 365 15 870
COMPANY
2014 2013
R'000 R'000
Loans to related parties - with no defaults in the past and not impaired 485 475 306 258
Bank balances with South African banks* 1 486 4 181 * Rating range from A negative to BBB negative.
** Ratings range from BBB to BBB negative.
NB: Ratings based on the long term issuer default rating from latest available Fitch Ratings at 17 July 2014.
Credit limits were within terms and management does not expect any losses from non-performance by these counterparties.
The maximum exposure to credit risk is estimated to be the carrying amounts of the financial assets of which trade
receivables may be minimised by collection of collateral held (refer note 12).

151METaIR 2014 INTEGRATED ANNUAL REPORT
NOTES TO THE ANNUAL FINANCIAL STATEMENTS
METAIR 2014 INTEGRATED ANNUAL REPORT 151
21. FINANCIAL INSTRUMENTS (continued)
21.2 Financial risk management (continued)
C. Liquidity risk
The group is exposed to liquidity risk as part of its normal financing and operational cash cycles. Prudent liquidity risk management implies maintaining sufficient cash and the availability of funding through an adequate amount of committed credit facilities to ensure that sufficient liquidity is available to meet obligations as they fall due and to maintain sufficient flexibility in order to fund investment and acquisition objectives. The group manages liquidity risk by monitoring forecast cash flows and ensuring that adequate unutilised borrowing facilities are maintained.
The group undertook a refinancing of borrowings and facilities in the form of R1 400 million in preference share funding and a revolving credit facility (RCF) for R750 million. The redemption of the preference share funding is based on a pro rata basis over five years with the first repayment of R840 million falling due on 30 September 2017.
The group utilises the credit facilities of various banking institutions and has been able to operate within these facilities. This trend is expected to continue into the foreseeable future to fund growth in the group. Approximately R572 million of the new committed RCF was unutilised at balance sheet date.
Details of borrowing including available facilities are disclosed in note 16. Projected operational cash flows are expected to provide adequate liquidity levels.
Analysis of financial liabilities - maturities (group)
The table below analyses the group’s financial liabilities and derivative financial liabilities into relevant maturity groupings based
on the contractual maturity date. The amounts disclosed in the table are the contractual undiscounted cash flows. Balances
due within 12 months equal their carrying balances as the impact of discounting is not significant.
Balance.
sheet.
carrying. Contractual. Less than. Between 1. Between 2. Over.
value. cash flows. 1 year. and 2 years. and 5 years. 5 years.
R'000 R'000 R'000 R'000 R'000 R'000
As at 31 December 2014
Borrowings 1 739 845 2 138 910 189 145 178 411 1 771 276 78
Derivative financial liabilities 5 388 5 388 5 388
Overdraft 130 193 134 000 134 000
Trade and other payables 836 053 836 053 836 053
As at 31 December 2013
Borrowings 1 202 772 1 293 019 248 686 895 933 148 099 301
Derivative financial liabilities 1 492 1 492 1 492
Overdraft 167 241 167 241 167 241
Trade and other payables 1 431 030 1 431 030 1 431 030
Analysis of financial liabilities - maturities (company) Financial liabilities noted in 21.1 for R207 368 000 (2013: R152 270 000) are all due in less than one year. The contractual cash flows approximate the carrying values. The company has provided guarantees for certain funding provided to the group and no liabilities are likely to arise.
Analysis of derivative financial instruments Details of the outstanding foreign exchange contracts which will be settled on a gross basis follows in note 21.4.1.

152 METaIR 2014 INTEGRATED ANNUAL REPORT
NOTES TO THE ANNUAL FINANCIAL STATEMENTS CONTINUED
152 METAIR 2014 INTEGRATED ANNUAL REPORT
21 FINANCIAL INSTRUMENTS (continued)
21.3 Capital risk management
The group’s objectives when managing capital are to safeguard the group’s ability to continue as a going concern in order to provide returns for shareholders and benefits for other stakeholders and to maintain an optimal capital structure to reduce the cost of capital.
In order to maintain or adjust the capital structure, the group may adjust the amount of dividends paid to shareholders, return capital to shareholders, issue new shares or sell assets to reduce debt.
The group monitors capital on the basis of the gearing ratio. This ratio is calculated as debt divided by total capital. Net debt is calculated as total borrowings (including ‘current and non-current borrowings’ as shown in the balance sheet) less cash and cash equivalents. Total capital is calculated as ‘equity’ as shown in the consolidated balance sheet plus net debt.
The gearing ratios at 31 December 2014 and 2013 were as follows:
GROUP
2014 2013
R'000 R'000
Total borrowings (notes 13 and 16) 1 870 038 1 370 013
Less: Cash and cash equivalents (note 13) (602 666) (574 742)
Net debt 1 267 372 795 271
Ordinary shareholders' equity 4 139 100 3 687 365
Total capital 5 406 472 4 482 636
Gearing ratio % 23.4 17.7
Debt covenants The borrowings provided by financiers to the group are subject to covenant measures (refer note 16).
The three covenant measures at balance sheet date are:
- Priority debt covenant not more than 1 times (achieved -0.1 times)
- Interest cover ratio not less than 3.0 times (achieved 11 times)
- Net borrowings to ‘adjusted EBITDA’ ratio (as defined) shall not exceed 2.5 times (achieved 1.2 times)
Covenant measures at balance sheet date have been met. Covenant measures (on the previous financing to the group) in
the prior year was also met.
21.4 Fair value estimation (IFRS 13)
The financial instruments that are measured subsequent to initial recognition at fair value are forward currency contracts. All of
these financial instruments are classified as Level 2 fair value measurements, as defined by IFRS 7, being those derived from
inputs other than quoted prices that are observable. Derivative financial instruments are discussed further below in note 21.4.1.
The fair value of financial instruments traded in active markets is based on quoted market prices at the balance sheet date are
classified as level 1, as defined by IFRS 7. Other than the irrevocable offer (squeeze out obligation) for the remaining Mutlu
minority shares (of which a 1.5% statutory shareholding is outstanding at balance sheet date), there are no such items
applicable to the group. The squeeze out obligation for the minorities was determined on an arm’s length regulated basis (MTO
process), using the fixed ‘MTO’ price of TL 9.07 per share, as stipulated by the CMB (Capital Markets Regulatory Board) of
Turkey. Mutlu Akü is listed on the Turkish Stock Exchange. The obligation outstanding at year-end amounted to R38.2 million
(refer to notes 18 and 28).
Inputs for the asset or liability that are not based on observable market data (that is, unobservable inputs) are classified as level
3, as defined by IFRS 7. There are no such items applicable to the group for the year.
Bank overdrafts, other short term bank borrowings, bank balances and cash and short term bank deposits approximate to book
value due to their short maturities.
For borrowings, the repayments which the group is committed to make have been discounted at the relevant interest rates
applicable at 31 December 2014. The current contractual pricing of borrowings approximates the rates that would be available
to the group in any event at year-end, taking into account the recent refinancing and re-pricing undertaken by the group (refer
note 16).

153METaIR 2014 INTEGRATED ANNUAL REPORT
NOTES TO THE ANNUAL FINANCIAL STATEMENTS
METAIR 2014 INTEGRATED ANNUAL REPORT 153
21. FINANCIAL INSTRUMENTS (continued)
21.4.1 Derivative financial instruments - Net fair value
The table below analyses financial instruments carried at fair value, by valuation method. The different levels have been
defined above.
GROUP
2014 2013
R'000 R'000
At 31 December Level Assets. Liabilities. Assets. Liabilities.
Forward exchange contracts and similar instruments -
held for trading valued at fair value through profit/(loss) 2 4 365 5 388 15 870 1 492
The fair value of forward foreign exchange contracts is determined using quoted forward exchange rates (market observable /
published rates) to terminate the contracts at the balance sheet date. The maximum exposure to credit risk at the balance sheet
is the fair value of the derivative assets.
Derivatives are classified as current assets or liabilities as the maturity of the hedged item is less than 12 months. The change
in value of derivative instruments during the year resulted in a loss of R3.2 million (2013: loss R24.2 million). In the prior year
the company made a net gain of R69.5million.
Group:
Cash flow hedge
During the prior year, the group concluded the acquisition of the Mutlu group (refer note 28.1) and the cash flow hedge was
recognised as part of the cost of acquisition.
The ineffective portion recognised in the profit or loss that arose from the cash flow hedge amounted to a loss of R3.9 million
and is included within administrative expenses in the income statement.
The effective portion of the fair value of the cash flow hedge recognised in equity and recognised as part of the acquisition
cost in the balance sheet is as follows:
GROUP
2014 2013
R'000 R'000
Fair value gain in year 110 377

154 METaIR 2014 INTEGRATED ANNUAL REPORT
NOTES TO THE ANNUAL FINANCIAL STATEMENTS CONTINUED
154 METAIR 2014 INTEGRATED ANNUAL REPORT
21. FINANCIAL INSTRUMENTS (continued)
Forward exchange contracts
Year-end forward exchange contracts and similar derivatives can be analysed as follows:
Average. Derivative.
Rand. Foreign. forward. Asset/.
amount. amount. exchange. Liability.
'000 '000 rate. used. Period to maturity.
Derivative financial assets
Imports
US Dollar 98 567 8 678 11.33 3 138 6 January 2015 - 29 May 2015
Euro 33 854 2 378 14.06 527 5 January 2015 - 1 July 2015
Japanese Yen 36 977 382 391 10.43 527 5 January 2015 - 30 April 2015
169 398 4 192
Exports
US Dollar 12 549 1 078 11.66 40 30 January 2015 - 16 March 2015
Euro 9 710 679 14.22 125 15 January 2015 - 30 January 2015
Great British Pound 1 455 80 18.13 7 15 January 2015 - 30 January 2015
23 714 172
Total derivative financial assets 4 364
Derivative financial liabilities
Imports
US Dollar 4 224 357 11.75 (52) 30 January 2015 - 31 March 2015
Euro 37 593 2 591 14.38 (995) 16 January 2015 - 15 April 2015
Great British Pound 227 13 18.16 (1) 30 January 2015
Japanese Yen 77 583 749 162 9.65 (4 300) 5 January 2015 - 30 April 2015
119 627 (5 348)
Exports
US Dollar 518 47 17.47 (25) 15 January 2015
Great British Pound 453 26 11.04 (15) 15 January 2015
971 (40)
Total derivative financial liabilities (5 388)
Company:
In 2013 the company obtained foreign exchange contracts in respect of the acquisition of the investment in the Mutlu group
(refer note 28.1).
Fair value movements are recognised in the income statement as hedge accounting has not been applied at company level.

155METaIR 2014 INTEGRATED ANNUAL REPORT
NOTES TO THE ANNUAL FINANCIAL STATEMENTS
METAIR 2014 INTEGRATED ANNUAL REPORT 155
GROUP COMPANY
2014 2013 2014 2013
R'000 R'000 R'000 R'000
22. CONTINGENT LIABILITIES
Letters of support in respect of overdrafts of associates
Valeo 3 675 3 675 3 675 3 675
Overdraft facilities in Alfred Teves Brake Systems (Pty) Ltd (ATE) has
been secured by a letter of suretyship for R28.5 million
(2013: R28.5 million). The group has contingent liabilities in respect of performance guarantees
and other related matters such as claims and disputes arising out of
ordinary cause of business. Performance and related guarantees
amounted to R27.8 million at 31 December 2014. Refer to note 25 for details on subordination agreements with
subsidiaries. Certain group subsidiaries provided guarantees for funding,
provided to the group, by Standard Bank (Preference shares) and the
RCF “lenders” (refer to note 16).
23. COMMITMENTS
Capital commitments 461 729 356 528
Contracted:
- Plant, machinery, tools, jigs and dies 54 687 68 605
Authorised by the directors, but not yet contracted:
- Plant, machinery, tools, jigs and dies 407 042 287 923
Unexpired portion of operating lease contracts 59 775 82 944
- Payable within 1 year 23 036 22 533
- Payable later than 1 year and not later than 5 years 36 739 60 411
521 504 439 472
The above commitments will be financed mainly from internal resources as well as from facilities available. The group leases various offices and warehouses under non-cancellable operating lease agreements. The lease terms are between 5 and 10 years, and the majority of lease agreements are renewable at the end of the lease period at market rate. The group also leases various plant and machinery under cancellable and non-cancellable operating lease agreements. The group is required to give notice for the termination of these agreements based on the specific terms of agreement. The lease expenditure charged to the income statement during the year is disclosed in note 3.

156 METaIR 2014 INTEGRATED ANNUAL REPORT
NOTES TO THE ANNUAL FINANCIAL STATEMENTS CONTINUED
156 METAIR 2014 INTEGRATED ANNUAL REPORT
24. POST-EMPLOYMENT BENEFITS
The group provides post-employment benefits for its employees.
Amounts included in the financial statements comprise of :
GROUP
2014 2013
R'000 R'000
Balance sheet obligation for:
Post-employment medical benefit (note 24.1) 31 305 29 565
Other post-employment benefits (note 24.2) 78 726 78 120
Liability in the balance sheet 110 031 107 685
Income statement charge included in operating profit for:
Post-employment medical benefits (note 24.1) 2 960 2 682
Other post-employment benefits (note 24.2) 5 633
8 593 2 682
Remeasurements included in other comprehensive income for:
Post-employment medical benefits (note 24.1) - loss/(gain) 183 (395)
Other post-employment benefits (note 24.2) - loss 13 014
13 197 (395)
24.1 Post-employment medical benefits
Certain of the companies in the group operated post-employment medical benefit schemes until 31 December 1996. Employees who joined the group after 1 January 1997 will not receive any co-payment subsidy from the group upon reaching retirement.
The scheme is unfunded. The present value of the obligation is based on the 'projected unit credit basis' using a number of assumptions.
The amounts recognised in the income statement are as follows:
GROUP
2014 2013
R'000 R'000
Current service costs 547 622
Interest costs 2 413 2 060
2 960 2 682
Movement in the liability recognised in the balance sheet
At the beginning of the year 29 564 28 499
Total expense per income statement 2 960 2 682
Contributions paid (1 402) (1 221)
Actuarial loss/(gain) recognised in other comprehensive income 183 (395)
At the end of the year 31 305 29 565
The amounts recognised in equity are as follows:
Recognised actuarial loss/(gain) 183 (395)
The effect of a 1% movement in the assumed medical healthcare cost rate is as follows:
Increase. Decrease.
R'000 R'000
Effect on the aggregate of the current service cost and interest cost 2 294 (1 474)
Revised defined benefit obligation 34 533 28 675
Assumptions 2014 2013
The principal actuarial assumptions used were:
- Discount rate for obligation 8.4% 8.4%
- Healthcare cost inflation 6.4% 6.6%
- Continuation of membership on retirement 100% 100%
- CPI inflation 6.0% 6.1%
- Post-retirement mortality PA (90)-1 PA (90)-1
- Pre-retirement mortality SA 85-90 SA 85-90
Assumptions regarding future mortality are set based on actuarial advice in accordance with published statistics and experience.

157METaIR 2014 INTEGRATED ANNUAL REPORT
NOTES TO THE ANNUAL FINANCIAL STATEMENTS
METAIR 2014 INTEGRATED ANNUAL REPORT 157
24. POST-EMPLOYMENT BENEFITS (continued)
24.2 Other post-employment benefits
In accordance with Turkish social legislation, Mutlu is required to make lump-sum payments to current employees whose employment is terminated due to retirement or for reasons other than resignation or misconduct.
Such payments are calculated on the basis of 30 day pay limited to a maximum of Turkish Lira 3 438 (2013: 3 254) per year at 31 December, per year of employment at the rate of pay applicable at the date of retirement/termination.
In the annual financial statements, the group reflects a liability calculated using the projected unit credit method and based upon factors derived using their experience of personnel terminating their services and being eligible to receive retirement pay and discounted by using the current market yield at the balance sheet date on government bonds (or rates approved by the Turkish capital markets board). Severance payment liability is not subject to any legal funding.
The scheme is unfunded.
GROUP
2014 2013
R'000 R'000
Current service costs 2 758 622
Interest costs 2 875 2 060
5 633 2 682
Movement in the liability recognised in the balance sheet
At the beginning of the year 78 122
Acquisition of subsidiary 81 406
Total expense per income statement 5 633
Contributions paid (18 740)
Actuarial loss recognised in other comprehensive income 13 014
Currency adjustment 698 (3 286)
At the end of the year 78 727 78 120
The amounts recognised in equity are as follows:
Recognised actuarial loss 13 014
The effect of a 1% movement in the discount rate is as follows: Increase. Decrease.
R'000 R'000
Effect on the aggregate of the current service cost and interest cost (331) 423
Effect on actuarial (gain)/loss (6 036) 7 056
Revised defined benefit obligation 72 358 86 204
The principal actuarial assumptions used at balance sheet date are as follows (based on Turkish
statistics):
Annual discount rate 10.00% 9.18%
Inflation rate 6.00% 5.00%
Turnover rate to estimate the probability of retirement 97.24% 99.17%
\ The principle assumption is that the maximum liability for each year of service will increase in line with inflation.
Maximum pay-out per employee per legislation is subject on a monthly cap of Turkish Lira 3 541 (2013: 3 438) per year of service.
24.3 Pension schemes
The group operates defined contribution pension schemes and contributions are charged against the income statement. The group contributed R58 million (2014: R57 million) to the defined contribution schemes.
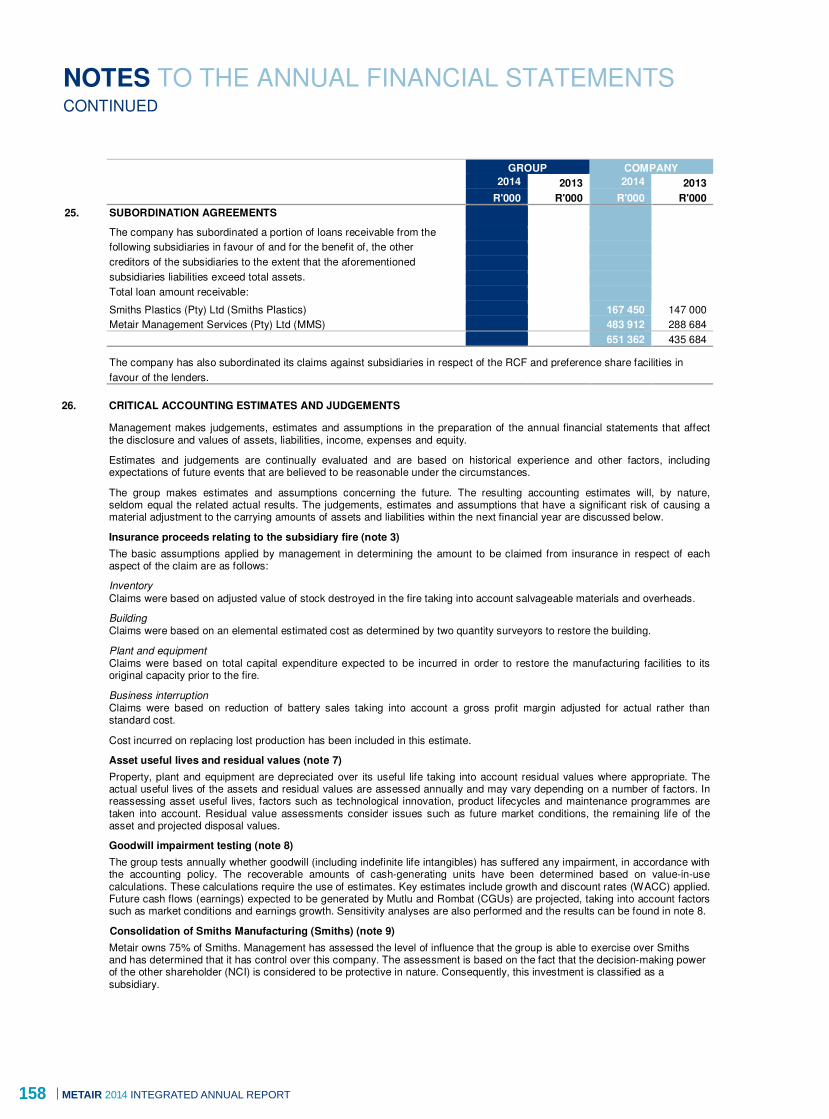
158 METaIR 2014 INTEGRATED ANNUAL REPORT
NOTES TO THE ANNUAL FINANCIAL STATEMENTS CONTINUED
158 METAIR 2014 INTEGRATED ANNUAL REPORT
GROUP COMPANY
2014 2013 2014 2013
R'000 R'000 R'000 R'000
25. SUBORDINATION AGREEMENTS The company has subordinated a portion of loans receivable from the
following subsidiaries in favour of and for the benefit of, the other
creditors of the subsidiaries to the extent that the aforementioned
subsidiaries liabilities exceed total assets.
Total loan amount receivable:
Smiths Plastics (Pty) Ltd (Smiths Plastics) 167 450 147 000
Metair Management Services (Pty) Ltd (MMS) 483 912 288 684
651 362 435 684
The company has also subordinated its claims against subsidiaries in respect of the RCF and preference share facilities in
favour of the lenders.
26. CRITICAL ACCOUNTING ESTIMATES AND JUDGEMENTS
Management makes judgements, estimates and assumptions in the preparation of the annual financial statements that affect the disclosure and values of assets, liabilities, income, expenses and equity.
Estimates and judgements are continually evaluated and are based on historical experience and other factors, including expectations of future events that are believed to be reasonable under the circumstances.
The group makes estimates and assumptions concerning the future. The resulting accounting estimates will, by nature, seldom equal the related actual results. The judgements, estimates and assumptions that have a significant risk of causing a material adjustment to the carrying amounts of assets and liabilities within the next financial year are discussed below.
Insurance proceeds relating to the subsidiary fire (note 3)
The basic assumptions applied by management in determining the amount to be claimed from insurance in respect of each aspect of the claim are as follows:
Inventory
Claims were based on adjusted value of stock destroyed in the fire taking into account salvageable materials and overheads.
Building Claims were based on an elemental estimated cost as determined by two quantity surveyors to restore the building.
Plant and equipment Claims were based on total capital expenditure expected to be incurred in order to restore the manufacturing facilities to its original capacity prior to the fire.
Business interruption Claims were based on reduction of battery sales taking into account a gross profit margin adjusted for actual rather than standard cost.
Cost incurred on replacing lost production has been included in this estimate.
Asset useful lives and residual values (note 7)
Property, plant and equipment are depreciated over its useful life taking into account residual values where appropriate. The actual useful lives of the assets and residual values are assessed annually and may vary depending on a number of factors. In reassessing asset useful lives, factors such as technological innovation, product lifecycles and maintenance programmes are taken into account. Residual value assessments consider issues such as future market conditions, the remaining life of the asset and projected disposal values.
Goodwill impairment testing (note 8)
The group tests annually whether goodwill (including indefinite life intangibles) has suffered any impairment, in accordance with the accounting policy. The recoverable amounts of cash-generating units have been determined based on value-in-use calculations. These calculations require the use of estimates. Key estimates include growth and discount rates (WACC) applied. Future cash flows (earnings) expected to be generated by Mutlu and Rombat (CGUs) are projected, taking into account factors such as market conditions and earnings growth. Sensitivity analyses are also performed and the results can be found in note 8.
Consolidation of Smiths Manufacturing (Smiths) (note 9)
Metair owns 75% of Smiths. Management has assessed the level of influence that the group is able to exercise over Smiths and has determined that it has control over this company. The assessment is based on the fact that the decision-making power of the other shareholder (NCI) is considered to be protective in nature. Consequently, this investment is classified as a subsidiary.

159METaIR 2014 INTEGRATED ANNUAL REPORT
NOTES TO THE ANNUAL FINANCIAL STATEMENTS
METAIR 2014 INTEGRATED ANNUAL REPORT 159
26. CRITICAL ACCOUNTING ESTIMATES AND JUDGEMENTS (Continued)
Hesto accounted for as an associate (note 10)
Metair owns 74.9% of Hesto. However, the shareholder’s agreement stipulates that unanimous consent is required for all decisions relating to the relevant activities of Hesto (de facto majority vote). The other shareholder also has a currently exercisable and substantive option (call option) that results in Metair accounting for the investment as an associate.
The call option held would benefit the other shareholder through additional voting rights acquired from its exercise. The other shareholder currently holds 25.1% shareholding in Hesto and the option will allow an increase to either 50.1% or 100% shareholding.
The unanimous consent required for decision-making is a clear indication that Metair does not control Hesto. Although unanimous consent usually indicates joint control, the impact of the call option results in the relationship being one of an associate. Metair therefore applies equity accounting to Hesto and has applied the disclosure requirements of IFRS 12 in respect of summarised information on associates.
IFRS 2 - Equity-settled schemes (note 14)
IFRS 2 charges, determined by reference to the fair value of options granted, are calculated in terms of the group’s accounting policy and is based on option pricing models for the share option scheme in operation. The charge is based on assumptions applied at grant date to the valuation models. These include (amongst others) the risk-free interest rate, Metair share price volatility and dividend yields.
Fair value determination at grant date includes market performance conditions (such as share price), excludes the impact of any service and non-market performance vesting conditions (such as employment period conditions and profitability) and includes the impact of any non-vesting conditions.
At the end of each reporting period, the group revises its estimates of the number of options that are expected to vest based on the non-market vesting conditions and service conditions. It recognises the impact of the revision to original estimates, if any, in the income statement, with a corresponding adjustment to equity.
Deferred tax assets recognised on assessed losses (note 17)
The group recognises the net future taxation benefit related to deferred income tax assets to the extent that it is probable that the deductible temporary differences will reverse in the foreseeable future.
Assessing the recoverability of deferred income tax assets requires the group to make estimates relating to expectations of future taxable income. Estimates of future taxable income are based on forecast cash flows from operations and the application of existing taxation laws.
To the extent that future cash flows and taxable income differ significantly from estimates, the ability of the group to realise the net deferred taxation assets recorded at the end of the reporting period could be impacted.
Warranties (note 19)
Warranty estimates and assumptions are based on the extrapolation of past claims experience over the warranty period. This is applied to warrantable sales. Specific occurrences are used as guides for these assumptions.
Factors that could impact the estimated claim information include the success of the group’s productivity and quality initiatives, as well as parts and labour costs.
Post-employment benefits (unfunded) (note 24)
Through its defined benefit termination plans and post-employment medical plans, the group is exposed to a number of risks, the most significant of which are detailed below:
Changes in discount rates
A decrease in discount rates will increase plan liabilities. The group determines the appropriate discount rate at the end of each year. This is the interest rate that should be used to determine the present value of estimated future cash outflows expected to be required to settle the post-retirement benefit obligations. In determining the appropriate discount rate, the group considers the interest rates of government bonds that are denominated in the currency in which the benefits will be paid and that have terms to maturity approximating the terms of the related post-retirement benefits.
Inflation risk
Some of the group’s pension and medical aid obligations are linked to general and medical aid inflation, and higher inflation and medical costs will lead to higher liabilities.
Life expectancy
The majority of the plans’ obligations are to provide benefits for the life of the member, so increases in life expectancy will result in an increase in the plans’ liabilities.

160 METaIR 2014 INTEGRATED ANNUAL REPORT
NOTES TO THE ANNUAL FINANCIAL STATEMENTS CONTINUED
160 METAIR 2014 INTEGRATED ANNUAL REPORT
27. RELATED PARTIES
The group and company entered into transactions with related parties. Transactions that are eliminated intra-group for consolidation purposes are not included. Transactions are carried out at a commercial basis.
Information on emoluments paid to executive and non-executive directors have been presented in note 3. Employees fulfilling the role of key management are all appointed to the board of directors.
Information on investments in subsidiaries and associates is presented in notes 9, 10 and on pages 166. Information on loans granted to subsidiaries has been presented in note 9. Dividend income from subsidiaries has been presented in note 3. Directors’ shareholding and share incentives granted have been presented in note 14.
Information on the Metair Share Trust and Metair Investments Limited 2009 Share Plan can be found in note 14.
Information on the Metair group Pension Scheme can be found in note 24.
Information on shareholding of the company can be found on pages 74 to 75.
The Royal Bafokeng Metair Trust, holds 24 903 569 (2013:37 911 325) ordinary shares at a shareholding of 12.52% (2013: 19.05%). Dividends paid by the company to the Royal Bafokeng Metair Trust amounted to R26 537 928 (2013: R36 015 758). The outstanding balance receivable from the Royal Bafokeng Metair Trust amounted to R211 748 (2013: R154 101).
GROUP
2014 2013
R'000 R'000
The group entered into the following transactions with its equity partner in Smiths:
Purchases of goods and services 42 450 47 896
Dividend paid 32 181 16 902
Outstanding balance at year-end 1 176 349
The group entered into the following transactions with its associates:
Hesto
Purchases from group companies 103 703 98 822
Sales to group companies 1 993 113
Management fees paid to group companies 558 532
Management fees received from group companies 276 132
Outstanding balance to group companies 4 066 3 607
Outstanding balance from group companies 156 71 Valeo
Purchases from group companies 42 851 28 057
Rental paid to group companies 1 065 1 053
Management fees paid to group companies 1 402 1 288
Outstanding balance to group companies 2 019 1 621 Vizirama
Outstanding balance to group companies 1 523 Tenneco
Sales to group companies 3 721
The company has provided limited letters of support and guarantees to certain subsidiaries within the group (refer note 25).

161METaIR 2014 INTEGRATED ANNUAL REPORT
NOTES TO THE ANNUAL FINANCIAL STATEMENTS
METAIR 2014 INTEGRATED ANNUAL REPORT 161
28. BUSINESS COMBINATIONS
28.1 Mutlu group (2013 Acquisition finalised)
On 5 December 2013, the group acquired 100% of the issued shares of Mutlu Holding Anonim irketi (Mutlu group), which is a group of companies incorporated under Turkish law. Mutlu Akü a 75% held listed company in Turkey, is the group's main operating subsidiary and a manufacturer of 'lead-acid batteries' for the original equipment manufacturers (OEM), aftermarket, non-automotive and export segments. Mutlu group was acquired to complement the group's existing battery operations and to deliver strategic and financial benefits.
Total consideration transferred amounted to a total of R2 890.7 million. Final goodwill of R568.7 million (provisional: R543.7 million) arising from the acquisition is attributable to the anticipated profitability arising from the group’s access to new geographic markets, increased supply and the anticipated future operating synergies from the combination. The fair values of net assets acquired were provisional at 31 December 2013.
These values have been finalised and are summarised below.
The following table summarises the consideration paid for Mutlu group and the amounts of the assets acquired and liabilities
assumed at the acquisition date:
Consideration at 5 December 2013 R'000
Cash and cash equivalents 2 321 349
Acquisition vendor payable 67 890
Minority tender offer acquisition payable 611 788
Hedging gains capitalised (110 377)
Total consideration 2 890 650
Final.
fair value.
Recognised amounts of identifiable assets acquired and liabilities assumed R'000
Assets
Intangible assets - brands and customer relationships (refer note 8) 657 533
Property, plant and equipment (refer note 9) 1 595 895
Inventory 430 200
Trade and other receivables 503 754
Cash and cash equivalents 84 784
3 272 166
Liabilities
Borrowings (297 005)
Provisions (refer note 19 and 24.2) (158 524)
Trade and other payables (182 275)
Net deferred taxation (refer note 17) (312 397)
(950 201)
Total identifiable net assets 2 321 965
Goodwill 568 685
Purchase consideration (including currency hedging) 2 890 650
Acquisition of subsidiary - cash flow on acquisition
Purchase consideration (including currency hedging) - cash portion 2 210 972
Cash and cash equivalents acquired (84 784)
Net cash flow on acquisition 2 126 188
Cash settlements - 2014
Settlement of acquisition vendor payable 67 890
MTO settlement 525 802
Cash outflow 593 692
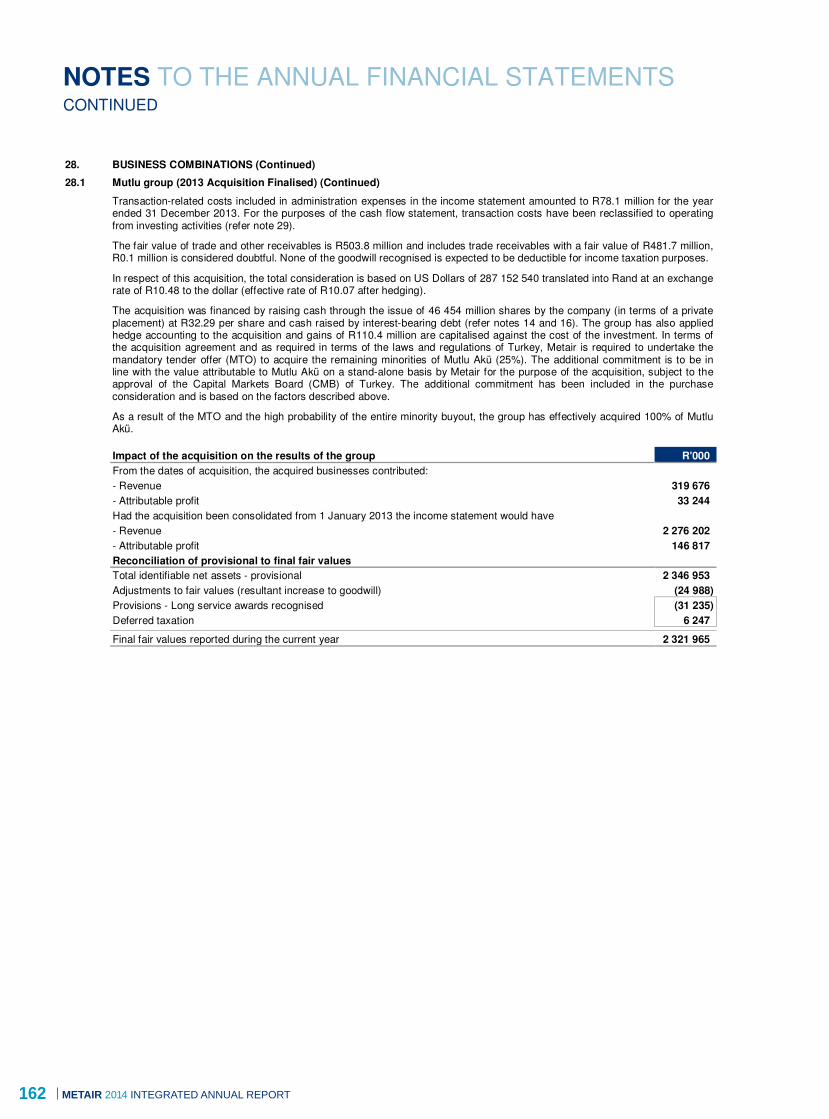
162 METaIR 2014 INTEGRATED ANNUAL REPORT
NOTES TO THE ANNUAL FINANCIAL STATEMENTS CONTINUED
162 METAIR 2014 INTEGRATED ANNUAL REPORT
28. BUSINESS COMBINATIONS (Continued)
28.1 Mutlu group (2013 Acquisition Finalised) (Continued)
Transaction-related costs included in administration expenses in the income statement amounted to R78.1 million for the year ended 31 December 2013. For the purposes of the cash flow statement, transaction costs have been reclassified to operating from investing activities (refer note 29).
The fair value of trade and other receivables is R503.8 million and includes trade receivables with a fair value of R481.7 million, R0.1 million is considered doubtful. None of the goodwill recognised is expected to be deductible for income taxation purposes.
In respect of this acquisition, the total consideration is based on US Dollars of 287 152 540 translated into Rand at an exchange rate of R10.48 to the dollar (effective rate of R10.07 after hedging).
The acquisition was financed by raising cash through the issue of 46 454 million shares by the company (in terms of a private placement) at R32.29 per share and cash raised by interest-bearing debt (refer notes 14 and 16). The group has also applied hedge accounting to the acquisition and gains of R110.4 million are capitalised against the cost of the investment. In terms of the acquisition agreement and as required in terms of the laws and regulations of Turkey, Metair is required to undertake the mandatory tender offer (MTO) to acquire the remaining minorities of Mutlu Akü (25%). The additional commitment is to be in line with the value attributable to Mutlu Akü on a stand-alone basis by Metair for the purpose of the acquisition, subject to the approval of the Capital Markets Board (CMB) of Turkey. The additional commitment has been included in the purchase consideration and is based on the factors described above.
As a result of the MTO and the high probability of the entire minority buyout, the group has effectively acquired 100% of Mutlu Akü.
Impact of the acquisition on the results of the group R'000
From the dates of acquisition, the acquired businesses contributed:
- Revenue 319 676
- Attributable profit 33 244
Had the acquisition been consolidated from 1 January 2013 the income statement would have
- Revenue 2 276 202
- Attributable profit 146 817
Reconciliation of provisional to final fair values
Total identifiable net assets - provisional 2 346 953
Adjustments to fair values (resultant increase to goodwill) (24 988)
Provisions - Long service awards recognised (31 235)
Deferred taxation 6 247
Final fair values reported during the current year 2 321 965

163METaIR 2014 INTEGRATED ANNUAL REPORT
NOTES TO THE ANNUAL FINANCIAL STATEMENTS
METAIR 2014 INTEGRATED ANNUAL REPORT 163
28. BUSINESS COMBINATIONS (Continued) 28.2 Transactions with non-controlling interests (NCI) The group carried out transactions with the NCI of Mutlu Akü. Following closure of the MTO process on 11 March 2014, the
group formally acquired 21.43% out of the remaining 25% from NCI.
Effectively the group sold 3.57% of its shareholding back to NCI since not all shares were taken up. During the period
18 March 2014 to 1 July 2014 the group acquired a 0.29% shareholding for R7 million.
On 18 July 2014, the group applied its 'squeeze-out' right to re-acquire all the remaining shares from NCI and, on this date,
an obligation for R85 million was raised for the remaining 3.28% in Mutlu Akü. The summarised effects on group equity are as
follows:
GROUP
2014 2013
R'000 R'000
a) Deemed disposal to non-controlling interest (dilution in shareholding) following MTO closure
11 March 2014
Carrying amount of NCI re-instated (68 629)
Consideration received from NCI (write-back of remaining MTO liability carried over) 71 519
Movement in NCI 2 890
b) Acquisition of additional interest
18 March 2014 to 1 July 2014
Carrying amount of NCI acquired 5 612
Consideration paid to NCI (7 282)
Movement in NCI (1 670)
c) Squeeze out of remaining interest (deemed acquisition of remaining interest)
18 July 2014
Carrying amount of NCI acquired 63 017
Liability raised for consideration payable to NCI (written put obligation) (85 094)
Movement in NCI (22 077)
The net movement in the changes in ownership reserve and equity of the group is
summarised as follows:
a) Deemed dilution in shareholding (MTO closure) 2 890
b) Acquisition of additional interest (1 670)
c) Deemed acquisition of remaining interest (minority squeeze-out) (22 077)
(20 857)
Cash settlements - 2014
Acquisition of additional interest 7 282
Portion of NCI acquired - squeeze out 46 862
Cash outflow 54 144

164 METaIR 2014 INTEGRATED ANNUAL REPORT
NOTES TO THE ANNUAL FINANCIAL STATEMENTS CONTINUED
164 METAIR 2014 INTEGRATED ANNUAL REPORT
29. Prior period adjustment restatements
29.1 Reclassification of cash flows on the treatment of transaction costs on acquisition of Mutlu
Metair acquired Mutlu in the prior financial year. Transaction costs amounting to R78 million associated with the transaction were classified as part of investing activities in the statement of cash flows. These transaction costs have been reclassified to operating activities.
The previously reported and restated line items and total cash flows are shown in the table below:
As
Previously As
Reported Adjustment Restated
2013 2013 2013
R'000 R'000 R'000
Net cash inflow from operating activities 436 332 (78 058) 358 274
Cash generated from operations 665 908 (78 058) 587 850
Net cash outflow from investing activities (2 302 625) 78 058 (2 224 567)
Acquisition of subsidiary (2 204 246) 78 058 (2 126 188)
The restatement had no impact on the net movement in cash resources, nor the balance thereof.
29.2 Finalisation of fair values on acquisition of Mutlu
The acquisition of Mutlu in the prior financial year was determined on a provisional basis as per IFRS 3 paragraph 45 and has been finalised in the current financial year. The comparative balance sheet has been restated to reflect the finalised numbers processed. Further information including a reconciliation of the provisionally determined fair values of assets and liabilities, arising on acquisition, to the final fair values can be found in note 28 – Business combinations. The finalisation had no impact on previously reported profit.

165METaIR 2014 INTEGRATED ANNUAL REPORT
INVESTMENTS IN SUBSIDIARIES AND ASSOCIATES AS AT 31 DECEMBER 2014
METAIR 2014 INTEGRATED ANNUAL REPORT 165
Issued % Direct/ Direct/
share (indirect) (indirect) cost of shares
Type capital interest less impairment
2014 2013 2014 2013 2014 2013
R'000 R'000 % % R'000 R'000
SUBSIDIARIES
Motor component
manufacturing
Smiths Manufacturing (Pty) Ltd ordinary (75.0) 75.0 (4 500) 4 500
Metindustrial (Pty) Ltd ordinary 500 500 (100.0) 100.0
Lumotech (Pty) Ltd ordinary 1 200 1 200 (100.0) 100.0 (20 000) 20 000
Smiths Plastics (Pty) Ltd ordinary (100.0) 100.0 (28 194) 28 194
Unitrade 745 (Pty) Ltd ordinary (100.0) 100.0
Smiths Electric Motors (Pty) Ltd ordinary (75.0) (75.0)
First National Battery Industrial
(Pty) Ltd ordinary (100.0) (100.0)
Tlangi Investments (Pty) Ltd ordinary (100.0) (100.0)
Automould (Pty) Ltd ordinary 2 2 (100.0) (100.0) (25 477)
Alfred Teves Brake Systems
(Pty) Ltd ordinary 15 15 (100.0) (100.0) (15)
Rombat SA** ordinary 76 010 76 010 (99.4) (99.4) (437 393) (437 393)
Management services
Metair Management Services
(Pty) Ltd ordinary 100.0 100.0
Business Venture Investments ordinary 100.0 100.0
No 1217 (Pty) Ltd
Inalex (Pty) Ltd ordinary 493 695 93 592 100.0 100.0 493 695 493 695
Metair International Cooperatief
U.A.* ordinary 3 431 376 2 835 818 (100.0) (100.0) (3 431 376) (2 835 818)
Nikisize (Pty) Ltd 52 695 (100.0) (52 695)
Metair Akü Holding Anonim
irketi*** ordinary 2 981 780 2 316 259 (100.0) (100.0) (2 987 107) (2 391 549)
Properties
SMSA Property (Pty) Ltd ordinary 3 000 3 000 (75.0) (75.0)
ILM Investments (Pty) Ltd ordinary 1 1 (100.0) (100.0)
Honeypenny (Pty) Ltd ordinary (100.0) (100.0) (6 850)
Climate Control Properties
(Pty) Ltd ordinary 2 2 (100.0) (100.0) (2)
Direct interest 493 695 546 389
Indirect interest (6 993 609) (5 664 760)
ASSOCIATES
Hesto Harnesses (Pty) Ltd ordinary 1 1 (74.9) 74.9 (1) 1
Tenneco Automotive Holdings
SA (Pty) Ltd ordinary 1 233 1 233 25.1 25.1
Valeo Systems South Africa
(Pty) Ltd ordinary 1 1 49.0 49.0 2 793 2 793
Toyoda Gosei (Pty) Ltd ordinary 1 1 (20.0) (20.0) (1 250) (1 250)
Vizirama 112 (Pty) Ltd ordinary 33.0 33.0
Eye2square Innovations (Pty) Ltd ordinary (20.0) (20.0) (5 000) (5 000)
Direct interest 2 793 2 794
Indirect interest (6 251) (6 250)

166 METaIR 2014 INTEGRATED ANNUAL REPORT
INVESTMENTS IN SUBSIDIARIES AND ASSOCIATES CONTINUED
166 METAIR 2014 INTEGRATED ANNUAL REPORT
All subsidiaries and associates are incorporated in South Africa except for:
* Metair International Cooperatief U.A. - Netherlands
** Rombat SA - Romania
*** Mutlu group is incorporated in Turkey and consists of the following:
- Mutlu Holding Anonim irketi
- Mutlu Akü ve Malzemeleri Sanayii Anonim irketi (Mutlu Akü)
- Mutlu Plastik ve Ambalaji Sanayi Anonim irketi (Plastik)
- Metropol Motorlu Tasitlar Kiralama Anonim irketi (Metropol) Are subsidiary undertakings are included in the consolidation. The proportion of the voting rights in the subsidiary undertakings
held directly by the parent company do not differ from the proportion of ordinary shares held.
2014 2013
Amounts owing by/(to) subsidiaries before impairment: R'000 R'000
Metair Management Services (Pty) Ltd 483 912 288 684
Inalex (Pty) Ltd 1 486 307 1 483 612
Lumotech (Pty) Ltd 57 983 70 529
Unitrade 745 (Pty) Ltd 5 312
Alfred Teves Brake Systems (Pty) Ltd 1 563
Smiths Plastics (Pty) Ltd 167 451 181 950
Business Venture Investments 1217 (Pty) Ltd (206 924) (138 278)
Metair Share Trust 12 108
1 990 292 1 903 917

167METaIR 2014 INTEGRATED ANNUAL REPORT
METaIR INVESTMENTS LIMITED(Incorporated in the Republic of South Africa)(Registration number: 1948/031013/06)JSE share code: MTA ISIN: ZAE000090692(Metair or company)
NOTICE TO SHaREHOLDERS Notice is hereby given that the annual general meeting of shareholders of Metair will be held in the conference room, AstroTech Conference Centre, Cnr Anerley Road, Parktown, Johannesburg, on Wednesday, 6 May 2015, at 14:00 for the following purposes:
Ordinary businessTo present the audited annual financial statements, which include the directors’ report and the audit committee report, for the year ended 31 December 2014, as approved by the board of directors of the company (directors) (board) in terms of section 30(3) of the Companies Act, No. 71 of 2008 (as amended) (Companies Act), incorporating the auditor’s and director’s reports.
Ordinary resolution number 1Resolved that Mr OME Pooe, who retires in terms of the provisions of the company’s memorandum of incorporation (MOI), but, being eligible and has offered himself for re-election (refer to page 30 of the integrated annual report for a brief curriculum vitae of Mr OME Pooe), be and is hereby re-appointed as a director of the company.
Ordinary resolution number 2Resolved that Mr RS Broadley, who retires in terms of the provisions of the MOI, but, being eligible and has offered himself for re-election (refer to page 31 of the integrated annual report for a brief curriculum vitae of Mr RS Broadley), be and is hereby re-appointed as a director of the company.
Ordinary resolution number 3Resolved that Mr L Soanes, who retires in terms of the provisions of the MOI, but, being eligible and has offered himself for re-election (refer to page 30 of the integrated annual report for a brief curriculum vitae of Mr L Soanes), be and is hereby re-appointed as a director of the company.
Ordinary resolution number 4Resolved that Mr S Douwenga, who retires in terms of the provisions of the MOI, but, being eligible and has offered himself for re-election (refer to page 30 of the integrated annual report for a brief curriculum vitae of Mr S Douwenga), be and is hereby re-appointed as a director of the company.
Ordinary resolution number 5Resolved that PricewaterhouseCoopers Inc., with the designated audit partner being Mr G Hauptfleisch, be and is hereby appointed as the independent auditors of the company for the ensuing year as recommended by the audit and risk committee (committee) of the board.
Ordinary resolution number 6Resolved that, subject to their applicable reappointments as directors in terms of the resolutions proposed above, the members of the committee as set out below be, and are hereby appointed in accordance with the provisions of section 94 of the Companies Act for the period commencing on the date of their re-appointment and enduring until the next annual general meeting of the company.
Resolved that the nominees to the committee, as proposed by the board, be and are hereby re-elected:(i) Mr JG Best, as chairman of the committee;(ii) Mr L Soanes, as a member of the committee; and(iii) Mr DR Wilson, as a member of the committee,each of whom are independent non-executive directors of the company.
Special businessTo consider, and, if deemed fit, to pass, with or without modification, the resolutions set out below.
Ordinary resolution number 7Resolved as an ordinary resolution that the unissued ordinary share capital of the company be and is hereby placed under the control of the directors who are hereby authorised, subject to Article 4.2 of the MOI and the Listings Requirements of the JSE Limited (JSE) (JSE Listings Requirements), to allot and issue 9 843 878 ordinary shares, representing 5% of the company’s listed equity securities (excluding treasury shares) as at the date of the notice of annual general meeting, on such terms and conditions and at such times as the directors may in their discretion deem fit, until the next annual general meeting.
In particular the approval of this ordinary resolution which, if passed, is in terms of the JSE Listings Requirements subject to not less than 75% of the votes of all shareholders entitled to vote and in attendance or represented at the meeting, being cast in favour of the resolution, and is further subject to paragraphs 5.52, 5.75 and 11.22 of the JSE Listings Requirements, which in summary provide as follows:l such shares may only be issued or sold, as the case may be, to
public shareholders as defined in paragraph 4.25 to 4.27 of the JSE Listings Requirements, and not to related parties;
l the maximum discount (if any) at which such shares may be issued or sold, as the case may be, is 10% of the weighted average traded price of the company’s shares on the JSE over the 30 business days preceding the date of determination or agreement of the issue or selling price, as the case may be; and
l after the company has issued shares in terms of this general authority representing, on an accumulative basis within a financial year, 5% or more of the number of shares in issue prior to that issue, the company is required to publish an announcement containing full details of the issue.
Ordinary resolution number 8Resolved as an ordinary resolution that the company’s remuneration policy and its implementation, as set out in the Remuneration Report contained in the integrated annual report (refer to page 70 of the integrated annual report) be and is hereby approved through a non-binding advisory vote.
NOTICE TO SHAREHOLDERS

168 METaIR 2014 INTEGRATED ANNUAL REPORT
The reason for this resolution being approved through a non-binding advisory vote is because of it being a recommended practice in terms of the King Report on Governance for South Africa 2009 and the King Code of Governance for South Africa 2009 and in line with sound corporate governance.
Special resolution number 1Resolved as a special resolution in terms of section 66(9) of the Companies Act, that the remuneration of the non-executive directors with effect from 1 January 2015 to 31 December 2015 (refer to page 73 of the integrated annual report) be and is hereby approved.
The reason for and effect of special resolution number 1 is to approve, to the extent required, the remuneration for non-executive directors for the period commencing 1 January 2015 and ending 31 December 2015.
Special resolution number 2Resolved as a special resolution in accordance with section 45 of the Companies Act, that the board be and is hereby authorised, by way of a general authority to, at any time and from time to time during the period of two years commencing on the date of passing of this special resolution to provide, any direct or indirect financial assistance (but subject to the provisions of section 45(1) of the Companies Act and the JSE Listings Requirements) in such amount and in any form (including, but not limited to, by way of loan (on an interest-free or a market-related interest basis), guarantee, the provision of security or otherwise) to any of its present or future subsidiaries and/or any juristic person that the company directly or indirectly controls from time to time (collectively hereinafter the Metair group) and for the time being on such terms and conditions as the board in its discretion deems fit, for any purpose whether in the normal course of business of the Metair group or of a transactional nature, subject thereto that the board will, before making such financial assistance available, satisfy itself that:(i) immediately after providing the financial assistance, the
company will satisfy the solvency and liquidity test as prescribed in section 46(2) of the Companies Act; and
(ii) the terms under which the financial assistance is proposed to be given are fair and reasonable to the company.
The effect of the special resolution and the reason therefore is that same is required in terms of section 45 of the Companies Act to grant the directors the authority to cause the company to provide financial assistance by way of loan, guarantee, the provision of security or otherwise, to any company which is related or inter-related to the company or any other juristic person that the company directly or indirectly controls.
The special resolution does not authorise Metair to provide financial assistance to a director or prescribed officer of the company.
In accordance with section 45(5) of the Companies Act, the board hereby gives notice to its shareholders of the fact that it has passed a resolution at a meeting of the directors held on 7 August 2014, authorising the company to provide financial assistance to certain related and/or inter-related companies which board resolution will take effect subject to the passing of special resolution number 2 as set out above.
Special resolution number 3Resolved as a special resolution in terms of the Companies Act and the JSE Listings Requirements, that the authorisation granted to the company in terms of Article 13 of its MOI to acquire the company’s own securities by way of a general approval, upon such terms and conditions and in such amounts as the directors may from time to time decide, subject only to the provisions of the Companies Act and the JSE Listings Requirements, be and is hereby extended, subject to the following terms and conditions: (i) Any repurchase of securities must be effected through the
order book operated by the JSE trading system and done without any prior understanding or arrangement between the company and any counterparty;
(ii) This general authority shall be valid until the company’s next annual general meeting, provided that it shall not extend beyond 15 months from the date of passing of this special resolution;
(iii) Repurchases may not be made at a price greater than 10% above the weighted average of the market value of the securities for the five business days immediately preceding the date on which the repurchase will be effected;
(iv) At any point in time, the company may only appoint one agent to give effect to any repurchase;
(v) An announcement shall be published as soon as the company has cumulatively repurchased 3% of the initial number (being the number of that class of shares in issue at the time that the general authority was granted) of the relevant class of securities and for each 3% in aggregate of the initial number of that class acquired thereafter, containing the details as required by paragraph 11.27 of the JSE Listings Requirements;
(vi) Repurchases shall not, in the aggregate, in any one financial year exceed 20% of the company’s issued share capital of that class in any one financial year;
(vii) Repurchases may not be made by the company and/or its subsidiaries during a prohibited period as defined by the JSE Listings Requirements unless a repurchase programme is in place where the dates and quantities of securities to be traded during the relevant period are fixed and full details of the programme have been disclosed and approved by the JSE prior to the prohibited period;
(viii) The intention of the board is that the repurchase of the company’s securities will be effected within the parameters laid down by this resolution as well as by the Companies Act, the JSE Listings Requirements and the board, as and when the directors of the company deem such repurchases to be appropriate, having regard for prevailing market and business conditions; and
(ix) The directors will ensure that the requisite prior resolution of the board has been taken authorising such repurchases, confirming that the company and its subsidiaries engaged in such repurchases have passed the solvency and liquidity test envisaged in the Companies Act and confirming that, since such tests were performed, there have been no material changes to the financial position of the Metair group.
The directors shall not make any repurchases under this general authority unless they are of the opinion that, after considering the effect of the maximum number of shares to be repurchased and for a period of 12 months after the date of the notice of the annual general meeting:
NOTICE TO SHAREHOLDERS CONTINUED

169METaIR 2014 INTEGRATED ANNUAL REPORT
a. the company and the Metair group will be able, in the ordinary course of business, to pay their debts;
b. the assets of the company and the Metair group will be in excess of the liabilities of the company and the Metair group, the assets and liabilities being recognised and measured in accordance with the accounting policies used in the latest audited annual financial statements;
c. the share capital and reserves of the company and the Metair group are adequate for the ordinary business purposes of the company and the Metair group; and
d. the working capital of the company and the Metair group will be adequate for ordinary business purposes.
The effect of the special resolution and the reason therefore is to extend the general authority given to the directors in terms of the Companies Act and the JSE Listings Requirements for the acquisition by the company and/or its subsidiaries of the company’s securities, which authority may be used at the directors’ discretion during the course of the period authorised.
additional disclosureIn terms of the JSE Listings Requirements, the following disclosures are required with reference to the general authority to repurchase its own securities by the company and/or its subsidiaries set out in special resolution number 3, some of which are set out in the integrated annual report of which this notice forms part.
Major shareholders of the company – refer to page 74 of the integrated annual report.
Stated capital – refer to page 130 of the integrated annual report.
Directors’ responsibility statement The directors, whose names are given on page 30 of the integrated annual report, collectively and individually, accept full responsibility for the accuracy of the information pertaining to the above special resolution number 3 and certify that to the best of their knowledge and belief there are no facts that have been omitted which would make any statement false or misleading, and that all reasonable enquiries to ascertain such facts have been made and that the aforementioned special resolutions contain all the information required by law and the JSE Listings Requirements.
Material change Other than the facts and developments reported on in the integrated annual report, there have been no material changes in the financial or trading position of the Metair group since the date of signature of the integrated annual report and the posting date hereof.
PERCENTaGE OF VOTING RIGHTS REQUIRED FOR RESOLUTIONSSpecial resolutionsThe percentage of voting rights that will be required for the adoption of each special resolution is at least 75% of the voting rights exercised on the resolution by shareholders present or represented by proxy at the meeting in order to be adopted.
Ordinary resolutionsThe percentage of voting rights that will be required for the adoption of each ordinary resolution is 50% plus one of the voting rights exercised on the resolution by shareholders present or represented by proxy at the meeting in order to be adopted, except for ordinary resolution number 6, which, in terms of paragraph 5.52 (e) of the JSE Listings Requirements requires a 75% majority of the votes cast.
NOTICE RECORD DaTE, VOTING RECORD DaTE aND FORMS OF PROXYThis notice of the company’s annual general meeting has been sent to its shareholders who were recorded as such in the company’s securities register on Friday, 20 March 2015, being the notice record date used to determine which shareholders are entitled to receive notice of the annual general meeting.
The record date on which shareholders of the company must be registered as such in the company’s securities register in order to attend and vote at the annual general meeting is Thursday, 30 April 2015, being the voting record date used to determine which shareholders are entitled to attend and vote at the annual general meeting. The last day to trade in order to be entitled to vote at the annual general meeting will therefore be Wednesday, 22 April 2015.
In terms of section 63(1) of the Companies Act, any person attending or participating in the annual general meeting must present reasonably satisfactory identification and the person presiding at the meeting must be reasonably satisfied that the right of any person to participate in and vote (whether as shareholder or as proxy for a shareholder) has been reasonably verified.
Duly completed proxy forms must be received by the company at its registered office or by the Transfer Secretaries (Computershare Investor Services (Pty) Ltd, Ground Floor, 70 Marshall Street, Johannesburg, 2001 or at PO Box 61051, Marshalltown, 2107) by no later than Monday, 4 May 2015 at 14:00.
Any forms of proxy not lodged at this time must be handed to the chairman of the annual general meeting immediately prior to the annual general meeting.
The attention of shareholders is directed to the additional notes contained in the form of proxy.
By order of the board
Registered office
SM Vermaak Metair Investments Ltd Wesco HouseCompany secretary 10 Anerley RoadJohannesburg Parktown25 March 2015 Johannesburg

170 METaIR 2014 INTEGRATED ANNUAL REPORT
SHaREHOLDERS’ DIARY
Financial year-end December
Annual general meeting May
REPORTS aND PROFIT STaTEMENTSInterim report August
Annual report and financial statements March
ORDINaRY DIVIDENDSDeclared March
Payment April
Shareholders are reminded to notify the transfer secretaries of any change in address.

171METAIR 2014 INTEGRATED ANNUAL REPORT
METAIR INVESTMENTS LIMITED(Incorporated in the Republic of South Africa)(Registration number 1948/031013/06)JSE share code: MTA ISIN: ZAE000090692(Metair or company)
Important note concerning this form of proxy
This form of proxy is only for the use by those shareholders of Metair who have not yet dematerialised their shares in Metair or who have dematerialised their shares in Metair and such dematerialised shares are recorded in the electronic sub-register of Metair Investments Ltd in the shareholder’s own name (entitled shareholders).
If either of the above situations is not applicable to you, you must not use this form. In such event, you must notify your duly appointed Central Securities Depository Participant (CSDP) or broker, as the case may be, in the manner stipulated in the agreement governing your relationship with your CSDP or broker, of your instructions as regards voting your shares at the annual general meeting.
A shareholder entitled to attend and vote at the meeting may appoint one or more proxies of his/her own choice to attend, speak, and, on a poll, vote in his/her stead at the annual general meeting of the company to be held at 14:00 on Wednesday, 6 May 2015 at AstroTech Conference Centre, Cnr Anerley Road, Parktown, Johannesburg. A proxy need not be a shareholder of the company.
I, ___________________________________________________________________________________________________________(name in block letters)
of (address) __________________________________________________________________________________________________
_____________________________________________________________________________________________________________
being holder/s of __________________ ordinary shares in the company, do hereby appoint:
1. ___________________________________________________________ or failing him/her
2. ___________________________________________________________ or failing him/her,
3. the chairman of the annual general meeting as my/our proxy to attend, speak and, on a poll, vote on my/our behalf at the annual general meeting which will be held for the purpose of considering and, if deemed fit, passing, with or without modification, the ordinary and special resolutions to be proposed thereat and at any adjournment thereof, and to vote for or against the resolutions or abstain from voting, in accordance with the following instructions:
Voting instruction:Please indicate with an ‘X’ in the appropriate spaces how votes are to be cast In favour Against AbstainAdoption of financial statements 1. Re-election of Mr OME Pooe as a director 2. Re-election of Mr RS Broadley as a director 3. Re-election of Mr L Soanes as a director 4. Re-election of Mr S Douwenga as a director 5. Re-appointment of auditors 6. Appointment of group audit committee members a. Re-election of Mr JG Best as chairman of the audit and risk committee b. Re-election of Mr L Soanes as member of the audit and risk committee c. Re-election of Mr DR Wilson as member of the audit and risk committee
Special business:Ordinary resolution number 7: Placing of unissued shares under the control of the directors Ordinary resolution number 8: Approval of remuneration policy Special resolution number 1: Approval of non-executive directors’ remuneration Special resolution number 2: Provision of financial assistance Special resolution number 3: General authority to repurchase the company’s securities
Signed at _____________________________ on _______________________________________________________________ 2015
Signature: ____________________________________________________________________________________________________
Assisted by me (where applicable) _________________________________________________________________________________
This form of proxy should be lodged at the registered office of the company (Wesco House, 10 Anerley Road, Parktown, Johannesburg) or at the Transfer Secretaries (Computershare Investor Services (Pty) Ltd, Ground Floor, 70 Marshall Street, Johannesburg, 2001 or at PO Box 61051, Marshalltown, 2107) by no later than Monday, 4 May 2015 at 14:00.
Please read the notes on the reverse side hereof.
FORM OF PROXY
172 METaIR 2014 INTEGRATED ANNUAL REPORT
A shareholder may insert the name of a proxy or the names of two alternative proxies of the shareholder’s choice in the space(s) provided, with or without deleting ‘the chairman of the general meeting’ but any such deletion must be initialled by the member. The person whose name stands first on the form of proxy and who is present at the general meeting will be entitled to act as proxy to the exclusion of those whose names follow.
Please insert an ‘X’ in the relevant spaces according to how you wish your votes to be cast. However, if you wish to cast your votes in respect of a lesser number of shares than you own in the company, insert the number of ordinary shares held in respect of which you desire to vote. Failure to comply with the above will be deemed to authorise the proxy to vote or to abstain from voting at the annual general meeting as he/she deems fit in respect of all the shareholder’s votes exercisable thereat. A shareholder or his/her proxy is not obliged to use all the votes exercisable by the shareholder or by his/her proxy, but the total of the votes cast and in respect whereof abstention is recorded may not exceed the total of the votes exercisable by the shareholder or by his/her proxy.
Forms of proxy must be lodged with or posted to the transfer secretaries, Computershare Investor Services (Pty) Ltd, Ground Floor, 70 Marshall Street, Johannesburg, 2001 or (PO Box 61051, Marshalltown, 2107) so as to be received by not later than 14:00 on Wednesday, 29 April 2015.
The completion and lodging of this form of proxy will not preclude the relevant shareholder from attending the annual general meeting and speaking and voting in person thereat to the exclusion of any proxy appointed in terms hereof.
Documentary evidence establishing the authority of a person signing this form of proxy in a representative capacity must be attached to this form of proxy unless previously recorded by the company’s transfer secretaries or waived by the chairman of the annual general meeting.
Any alternation or correction made to this form of proxy must be initialled by the signatory(ies).
A minor must be assisted by his/her parent or guardian unless the relevant documents establishing his/her legal capacity are produced or have been registered by the transfer secretaries of the company.
The chairman of the annual general meeting may reject or accept a form of proxy which is completed and/or received, other than in accordance with these instructions and notes, provided that he/she is satisfied as to the manner in which the shareholder concerned wishes to vote.
NOTES TO THE FORM OF PROXY
Company secretarySanet Vermaak
Registration number: 1948/031013/06
ISIN: ZAE 000090692
JSE share code: MTA
Head office and physical addressWesco House
10 Anerley RoadParktown
2132
Postal addressPO Box 2077Saxonwold
2193
Further information on this report and its contents can be obtained from the company secretary:
Telephone: +27 11 646 3011
Fax: +27 11 646 3102
Email: [email protected]