2014 annual report -...
TRANSCRIPT

2014 Annual Report
Containerboard & Corrugated ProductsBoise White Paper
© 2015 Packaging Corporation of America. All rights reserved.
When you choose Packaging Corporation of America, you work with people who do the right things for each other and for our customers. We believe in utilizing the power of strong collaborative relationships, bound by the trust we have earned, to deliver innovative packaging solutions and an outstanding service experience.
Packaging Corporation of America1955 West Field CourtLake Forest, Illinois 60045(800) 456-4725www.packagingcorp.com

Packaging Corporation of America is an ideas and solutions company — a company with a long history of excellence in the designing, engineering and manufacturing of corrugated products. The 2013 acquisition of Boise Inc. is providing new opportunities for PCA to apply its expertise and business philosophy to a broader market, and the integration continues to generate significant synergies.
The cornerstone of our business is the relationship between our customers and our people. Our success is made possible by a highly engaged, results-oriented workforce operating in an entrepreneurial culture and is driven by adding value to our customers’ businesses.
PCA’s common stock is listed on the New York Stock Exchange under the ticker symbol PKG.
PCA is the fourth largest producer of containerboard and
corrugated products in the United States. We manufacture many grades of kraft linerboard and corrugating medium at our
six containerboard mills and produce a wide variety of corrugated containers and displays at our 99 converting facilities.
Boise Paper is the third largest producer of uncoated freesheet in North America. Our team is dedicated to providing high-quality products, outstanding customer service and supply chain performance. Our product portfolio includes office, printing and converting, and pressure sensitive papers.
Packaging Corporation of America is a large company with a small-company feel. PCA’s strategic positioning affords our customers wide-ranging resources and
economies of scale, while our multiple locations put us in the right place at the right time to effectively meet customers’ local needs.
CHINA
SPAIN
NETHERLANDS
Ireland
FRANCE
CROATIA
Full-Line Plants
Sheet/Specialty Plants
Hexacomb Plants
White Paper Mills
Resource and Support Centers
Administrative Offices
Corporate Headquarters
Tharco Distribution Centers
Packaging and Supply Centers
Foam Fabricator
Sheet Feeder
Creative Design Centers
Technical Center
Containerboard Mills

UNITED STATES SECURITIES AND EXCHANGE COMMISSIONWashington, D.C. 20549
Form 10-KANNUAL REPORT PURSUANT TO SECTION 13 OR 15(d)
OF THE SECURITIES EXCHANGE ACT OF 1934For the fiscal year ended December 31, 2014
Commission file number 1-15399
(Exact Name of Registrant as Specified in its Charter)
Delaware 36-4277050(State or Other Jurisdiction of
Incorporation or Organization)(I.R.S. Employer
Identification No.)
1955 West Field Court, Lake Forest, Illinois 60045(Address of Prinicpal Executive Offices) (Zip Code)
Registrant’s telephone number, including area code:(847) 482-3000
Securities registered pursuant to Section 12(b) of the Act:
Title of Each ClassName of Each Exchange
On Which Registered
Common Stock, $0.01 par value New York Stock ExchangeSecurities registered pursuant to Section 12(g) of the Act:
None
Indicate by check mark if the registrant is a well-known seasoned issuer, as defined in Rule 405 of the SecuritiesAct. Yes È No ‘
Indicate by check mark if the registrant is not required to file reports pursuant to Section 13 or Section 15(d) of theAct. Yes ‘ No È
Indicate by check mark whether the registrant (1) has filed all reports required to be filed by Section 13 or 15(d) of the SecuritiesExchange Act of 1934 during the preceding 12 months (or for such shorter period that the registrant was required to file such reports), and(2) has been subject to such filing requirements for the past 90 days. Yes È No ‘
Indicate by check mark whether the registrant has submitted electronically and posted on its corporate Web site, if any, everyInteractive Data File required to be submitted and posted pursuant to Rule 405 of Regulation S-T (§232.405 of this chapter) during thepreceding 12 months (or for such shorter period that the registrant was required to submit and post such files). Yes È No ‘
Indicate by check mark if disclosure of delinquent filers pursuant to Item 405 of Regulation S-K (§229.405 of this chapter) is notcontained herein, and will not be contained, to the best of registrant’s knowledge, in definitive proxy or information statementsincorporated by reference in Part III of this Form 10-K or any amendment to this Form 10-K. È
Indicate by check mark whether the registrant is a large accelerated filer, an accelerated filer, a non-accelerated filer, or a smallerreporting company. See the definitions of “large accelerated filer,” “accelerated filer,” and “smaller reporting company” in Rule 12b-2 ofthe Exchange Act. (Check one):Large accelerated filer È Accelerated filer ‘ Non-accelerated filer ‘ Smaller reporting company ‘
(Do not check if a smaller reporting company)Indicate by check mark whether the registrant is a shell company (as defined in Rule 12b-2 of the Exchange
Act). Yes ‘ No È
At June 30, 2014, the last day of the Registrant’s most recently completed second fiscal quarter, the aggregate market value ofRegistrant’s common equity held by non-affiliates was approximately $6,937,544,233 based upon the closing sale price as reported on theNew York Stock Exchange. This calculation of market value has been made for the purposes of this report only and should not beconsidered as an admission or conclusion by the Registrant that any person is in fact an affiliate of the Registrant.
On January 30, 2015, there were 98,368,249 shares of Common Stock outstanding.DOCUMENTS INCORPORATED BY REFERENCE
Specified portions of the Proxy Statement for the Registrant’s 2015 Annual Meeting of Stockholders are incorporated by reference tothe extent indicated in Part III of this Form 10-K.

Table of Contents
PART IItem 1. Business . . . . . . . . . . . . . . . . . . . . . . . . . . . . . . . . . . . . . . . . . . . . . . . . . . . . . . . . . . . . . . . . . . . . . . 1
Packaging . . . . . . . . . . . . . . . . . . . . . . . . . . . . . . . . . . . . . . . . . . . . . . . . . . . . . . . . . . . . . . . . . . 2Paper . . . . . . . . . . . . . . . . . . . . . . . . . . . . . . . . . . . . . . . . . . . . . . . . . . . . . . . . . . . . . . . . . . . . . . 5Corporate and Other . . . . . . . . . . . . . . . . . . . . . . . . . . . . . . . . . . . . . . . . . . . . . . . . . . . . . . . . . . 7Employees . . . . . . . . . . . . . . . . . . . . . . . . . . . . . . . . . . . . . . . . . . . . . . . . . . . . . . . . . . . . . . . . . . 8Environmental Matters . . . . . . . . . . . . . . . . . . . . . . . . . . . . . . . . . . . . . . . . . . . . . . . . . . . . . . . . 8Executive Officers of the Registrant . . . . . . . . . . . . . . . . . . . . . . . . . . . . . . . . . . . . . . . . . . . . . . 8
Item 1A. Risk Factors . . . . . . . . . . . . . . . . . . . . . . . . . . . . . . . . . . . . . . . . . . . . . . . . . . . . . . . . . . . . . . . . . . . 9Item 1B. Unresolved Staff Comments . . . . . . . . . . . . . . . . . . . . . . . . . . . . . . . . . . . . . . . . . . . . . . . . . . . . . . 13Item 2. Properties . . . . . . . . . . . . . . . . . . . . . . . . . . . . . . . . . . . . . . . . . . . . . . . . . . . . . . . . . . . . . . . . . . . . . 13Item 3. Legal Proceedings . . . . . . . . . . . . . . . . . . . . . . . . . . . . . . . . . . . . . . . . . . . . . . . . . . . . . . . . . . . . . . 14Item 4. Mine Safety Disclosure . . . . . . . . . . . . . . . . . . . . . . . . . . . . . . . . . . . . . . . . . . . . . . . . . . . . . . . . . . 14
PART IIItem 5. Market for Registrant’s Common Equity, Related Stockholder Matters, and Issuer Purchases of
Equity Securities . . . . . . . . . . . . . . . . . . . . . . . . . . . . . . . . . . . . . . . . . . . . . . . . . . . . . . . . . . . . . . . 14Item 6. Selected Financial Data . . . . . . . . . . . . . . . . . . . . . . . . . . . . . . . . . . . . . . . . . . . . . . . . . . . . . . . . . . 17Item 7. Management’s Discussion and Analysis of Financial Condition and Results of Operations . . . . . 18
Overview . . . . . . . . . . . . . . . . . . . . . . . . . . . . . . . . . . . . . . . . . . . . . . . . . . . . . . . . . . . . . . . . . . . 18Executive Summary . . . . . . . . . . . . . . . . . . . . . . . . . . . . . . . . . . . . . . . . . . . . . . . . . . . . . . . . . . 18Industry and Business Conditions . . . . . . . . . . . . . . . . . . . . . . . . . . . . . . . . . . . . . . . . . . . . . . . . 20Outlook . . . . . . . . . . . . . . . . . . . . . . . . . . . . . . . . . . . . . . . . . . . . . . . . . . . . . . . . . . . . . . . . . . . . 20Results of Operations . . . . . . . . . . . . . . . . . . . . . . . . . . . . . . . . . . . . . . . . . . . . . . . . . . . . . . . . . 21Liquidity and Capital Resources . . . . . . . . . . . . . . . . . . . . . . . . . . . . . . . . . . . . . . . . . . . . . . . . . 26Commitments . . . . . . . . . . . . . . . . . . . . . . . . . . . . . . . . . . . . . . . . . . . . . . . . . . . . . . . . . . . . . . . 29Off-Balance-Sheet Arrangements . . . . . . . . . . . . . . . . . . . . . . . . . . . . . . . . . . . . . . . . . . . . . . . . 30Inflation and Other General Cost Increases . . . . . . . . . . . . . . . . . . . . . . . . . . . . . . . . . . . . . . . . 30Environmental Matters . . . . . . . . . . . . . . . . . . . . . . . . . . . . . . . . . . . . . . . . . . . . . . . . . . . . . . . . 31Critical Accounting Policies and Estimates . . . . . . . . . . . . . . . . . . . . . . . . . . . . . . . . . . . . . . . . 33New and Recently Adopted Accounting Standards . . . . . . . . . . . . . . . . . . . . . . . . . . . . . . . . . . 37Reconciliations of Non-GAAP Financial Measures to Reported Amounts . . . . . . . . . . . . . . . . 37
Item 7A. Quantitative and Qualitative Disclosures About Market Risk . . . . . . . . . . . . . . . . . . . . . . . . . . . . 39Item 8. Financial Statements and Supplementary Data . . . . . . . . . . . . . . . . . . . . . . . . . . . . . . . . . . . . . . . . 40Item 9. Changes In and Disagreements With Accountants on Accounting and Financial Disclosure . . . . 85Item 9A. Controls and Procedures . . . . . . . . . . . . . . . . . . . . . . . . . . . . . . . . . . . . . . . . . . . . . . . . . . . . . . . . . 85Item 9B. Other Information . . . . . . . . . . . . . . . . . . . . . . . . . . . . . . . . . . . . . . . . . . . . . . . . . . . . . . . . . . . . . . 86
PART IIIItem 10. Directors, Executive Officers, and Corporate Governance . . . . . . . . . . . . . . . . . . . . . . . . . . . . . . . 86Item 11. Executive Compensation . . . . . . . . . . . . . . . . . . . . . . . . . . . . . . . . . . . . . . . . . . . . . . . . . . . . . . . . . 86Item 12. Security Ownership of Certain Beneficial Owners and Management and Related Stockholder
Matters . . . . . . . . . . . . . . . . . . . . . . . . . . . . . . . . . . . . . . . . . . . . . . . . . . . . . . . . . . . . . . . . . . . . . . . 87Item 13. Certain Relationships and Related Transactions, and Director Independence . . . . . . . . . . . . . . . . 87Item 14. Principal Accounting Fees and Services . . . . . . . . . . . . . . . . . . . . . . . . . . . . . . . . . . . . . . . . . . . . . 87
PART IVItem 15. Exhibits, Financial Statement Schedules . . . . . . . . . . . . . . . . . . . . . . . . . . . . . . . . . . . . . . . . . . . . 88
Signatures . . . . . . . . . . . . . . . . . . . . . . . . . . . . . . . . . . . . . . . . . . . . . . . . . . . . . . . . . . . . . . . . . . . . 93
i
PART I
Item 1. BUSINESS
Packaging Corporation of America (“we,” “us,” “our,” “PCA,” or the “Company”) is the fourth largestproducer of containerboard and the third largest producer of white papers in North America, based on productioncapacity. We operate eight mills and 99 corrugated products manufacturing plants. We are headquartered in LakeForest, Illinois, and have approximately 14,000 employees. Our operations are primarily in the United States andwe have some converting operations in Europe, Mexico, and Canada.
On October 25, 2013, PCA acquired Boise Inc. (Boise) for $2.1 billion, including the fair value of assumeddebt. After the acquisition, we began reporting in three reportable segments: Packaging, Paper, and Corporateand Other. We present information pertaining to each of our segments and the geographic areas in which theyoperate in Note 18, Segment Information, of the Notes to Consolidated Financial Statements in “Part II, Item 8.Financial Statements and Supplementary Data” of this Form 10-K. For more information about our acquisition ofBoise, see Note 3, Acquisitions, of the Notes to Consolidated Financial Statements.
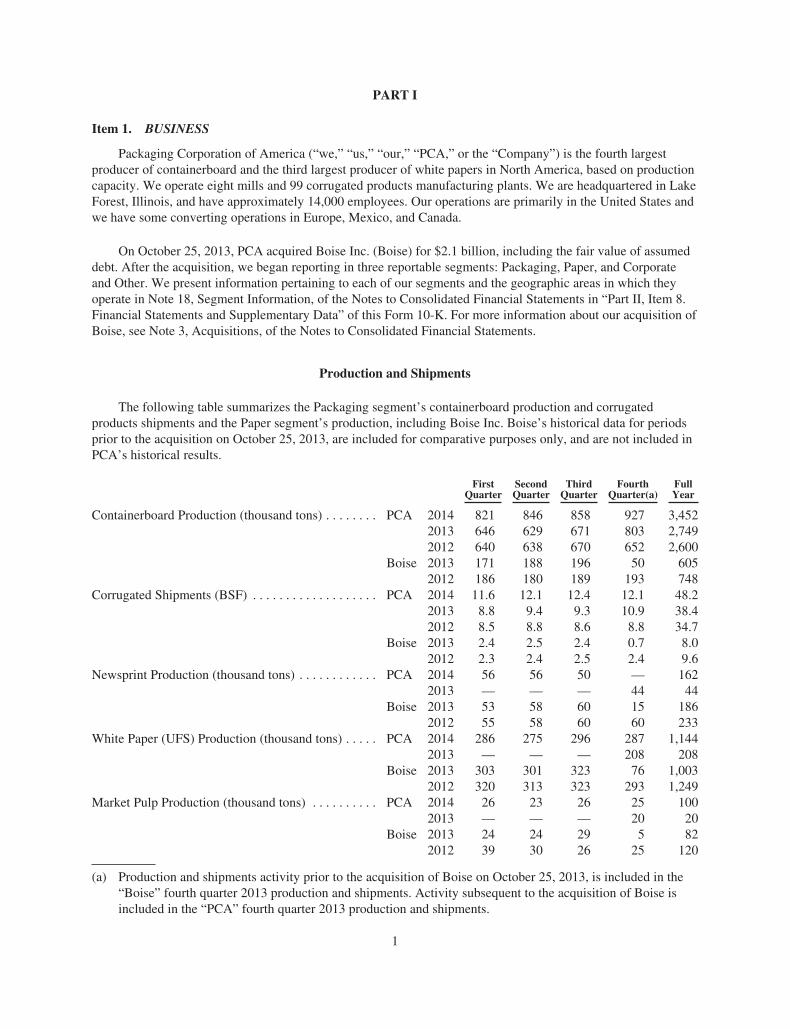
Production and Shipments
The following table summarizes the Packaging segment’s containerboard production and corrugatedproducts shipments and the Paper segment’s production, including Boise Inc. Boise’s historical data for periodsprior to the acquisition on October 25, 2013, are included for comparative purposes only, and are not included inPCA’s historical results.
FirstQuarter
SecondQuarter
ThirdQuarter
FourthQuarter(a)
FullYear
Containerboard Production (thousand tons) . . . . . . . . PCA 2014 821 846 858 927 3,4522013 646 629 671 803 2,7492012 640 638 670 652 2,600
Boise 2013 171 188 196 50 6052012 186 180 189 193 748
Corrugated Shipments (BSF) . . . . . . . . . . . . . . . . . . . PCA 2014 11.6 12.1 12.4 12.1 48.22013 8.8 9.4 9.3 10.9 38.42012 8.5 8.8 8.6 8.8 34.7
Boise 2013 2.4 2.5 2.4 0.7 8.02012 2.3 2.4 2.5 2.4 9.6
Newsprint Production (thousand tons) . . . . . . . . . . . . PCA 2014 56 56 50 — 1622013 — — — 44 44
Boise 2013 53 58 60 15 1862012 55 58 60 60 233
White Paper (UFS) Production (thousand tons) . . . . . PCA 2014 286 275 296 287 1,1442013 — — — 208 208
Boise 2013 303 301 323 76 1,0032012 320 313 323 293 1,249
Market Pulp Production (thousand tons) . . . . . . . . . . PCA 2014 26 23 26 25 1002013 — — — 20 20
Boise 2013 24 24 29 5 822012 39 30 26 25 120
(a) Production and shipments activity prior to the acquisition of Boise on October 25, 2013, is included in the“Boise” fourth quarter 2013 production and shipments. Activity subsequent to the acquisition of Boise isincluded in the “PCA” fourth quarter 2013 production and shipments.
1

Below is a map of our locations:
EUROPE
Corporate HeadquartersPackagingPaperAdministrative Office
MEXICO
CANADA
Packaging
Packaging Products
Our corrugated products manufacturing plants produce a wide variety of corrugated packaging products,including conventional shipping containers used to protect and transport manufactured goods, multi-color boxes,and displays with strong visual appeal that help to merchandise the packaged product in retail locations. Inaddition, we are a large producer of packaging for meat, fresh fruit and vegetables, processed food, beverages,and other industrial and consumer products.
During the year ended December 31, 2014, our Packaging segment produced 3.5 million tons ofcontainerboard at our mills. Our corrugated products manufacturing plants sold about 48.2 billion square feet(BSF) of corrugated products. Our net sales to third parties totaled $4.5 billion in 2014.
On October 17, 2014, we completed the No. 3 newsprint machine conversion at the DeRidder, Louisiana,mill to produce containerboard. After startup, the converted machine produced 58,000 tons of containerboardduring the fourth quarter. We stopped producing newsprint in September 2014.
2
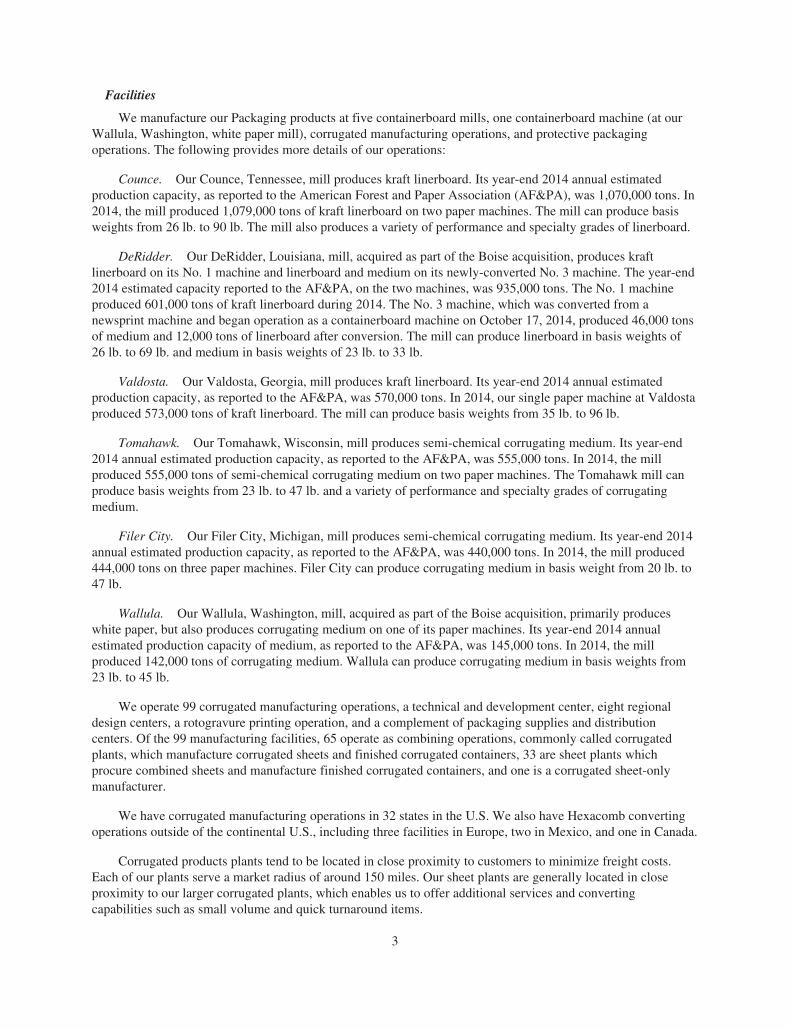
Facilities
We manufacture our Packaging products at five containerboard mills, one containerboard machine (at ourWallula, Washington, white paper mill), corrugated manufacturing operations, and protective packagingoperations. The following provides more details of our operations:
Counce. Our Counce, Tennessee, mill produces kraft linerboard. Its year-end 2014 annual estimatedproduction capacity, as reported to the American Forest and Paper Association (AF&PA), was 1,070,000 tons. In2014, the mill produced 1,079,000 tons of kraft linerboard on two paper machines. The mill can produce basisweights from 26 lb. to 90 lb. The mill also produces a variety of performance and specialty grades of linerboard.
DeRidder. Our DeRidder, Louisiana, mill, acquired as part of the Boise acquisition, produces kraftlinerboard on its No. 1 machine and linerboard and medium on its newly-converted No. 3 machine. The year-end2014 estimated capacity reported to the AF&PA, on the two machines, was 935,000 tons. The No. 1 machineproduced 601,000 tons of kraft linerboard during 2014. The No. 3 machine, which was converted from anewsprint machine and began operation as a containerboard machine on October 17, 2014, produced 46,000 tonsof medium and 12,000 tons of linerboard after conversion. The mill can produce linerboard in basis weights of26 lb. to 69 lb. and medium in basis weights of 23 lb. to 33 lb.
Valdosta. Our Valdosta, Georgia, mill produces kraft linerboard. Its year-end 2014 annual estimatedproduction capacity, as reported to the AF&PA, was 570,000 tons. In 2014, our single paper machine at Valdostaproduced 573,000 tons of kraft linerboard. The mill can produce basis weights from 35 lb. to 96 lb.
Tomahawk. Our Tomahawk, Wisconsin, mill produces semi-chemical corrugating medium. Its year-end2014 annual estimated production capacity, as reported to the AF&PA, was 555,000 tons. In 2014, the millproduced 555,000 tons of semi-chemical corrugating medium on two paper machines. The Tomahawk mill canproduce basis weights from 23 lb. to 47 lb. and a variety of performance and specialty grades of corrugatingmedium.
Filer City. Our Filer City, Michigan, mill produces semi-chemical corrugating medium. Its year-end 2014annual estimated production capacity, as reported to the AF&PA, was 440,000 tons. In 2014, the mill produced444,000 tons on three paper machines. Filer City can produce corrugating medium in basis weight from 20 lb. to47 lb.
Wallula. Our Wallula, Washington, mill, acquired as part of the Boise acquisition, primarily produceswhite paper, but also produces corrugating medium on one of its paper machines. Its year-end 2014 annualestimated production capacity of medium, as reported to the AF&PA, was 145,000 tons. In 2014, the millproduced 142,000 tons of corrugating medium. Wallula can produce corrugating medium in basis weights from23 lb. to 45 lb.
We operate 99 corrugated manufacturing operations, a technical and development center, eight regionaldesign centers, a rotogravure printing operation, and a complement of packaging supplies and distributioncenters. Of the 99 manufacturing facilities, 65 operate as combining operations, commonly called corrugatedplants, which manufacture corrugated sheets and finished corrugated containers, 33 are sheet plants whichprocure combined sheets and manufacture finished corrugated containers, and one is a corrugated sheet-onlymanufacturer.
We have corrugated manufacturing operations in 32 states in the U.S. We also have Hexacomb convertingoperations outside of the continental U.S., including three facilities in Europe, two in Mexico, and one in Canada.
Corrugated products plants tend to be located in close proximity to customers to minimize freight costs.Each of our plants serve a market radius of around 150 miles. Our sheet plants are generally located in closeproximity to our larger corrugated plants, which enables us to offer additional services and convertingcapabilities such as small volume and quick turnaround items.
3
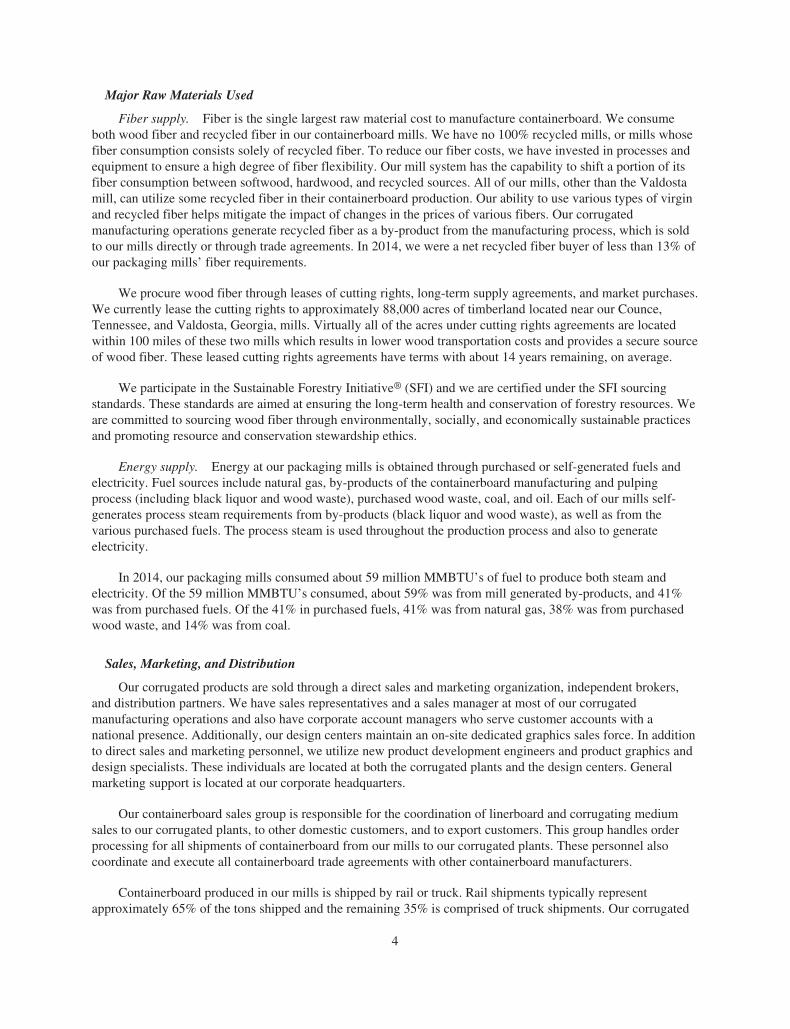
Major Raw Materials Used
Fiber supply. Fiber is the single largest raw material cost to manufacture containerboard. We consumeboth wood fiber and recycled fiber in our containerboard mills. We have no 100% recycled mills, or mills whosefiber consumption consists solely of recycled fiber. To reduce our fiber costs, we have invested in processes andequipment to ensure a high degree of fiber flexibility. Our mill system has the capability to shift a portion of itsfiber consumption between softwood, hardwood, and recycled sources. All of our mills, other than the Valdostamill, can utilize some recycled fiber in their containerboard production. Our ability to use various types of virginand recycled fiber helps mitigate the impact of changes in the prices of various fibers. Our corrugatedmanufacturing operations generate recycled fiber as a by-product from the manufacturing process, which is soldto our mills directly or through trade agreements. In 2014, we were a net recycled fiber buyer of less than 13% ofour packaging mills’ fiber requirements.
We procure wood fiber through leases of cutting rights, long-term supply agreements, and market purchases.We currently lease the cutting rights to approximately 88,000 acres of timberland located near our Counce,Tennessee, and Valdosta, Georgia, mills. Virtually all of the acres under cutting rights agreements are locatedwithin 100 miles of these two mills which results in lower wood transportation costs and provides a secure sourceof wood fiber. These leased cutting rights agreements have terms with about 14 years remaining, on average.
We participate in the Sustainable Forestry Initiative® (SFI) and we are certified under the SFI sourcingstandards. These standards are aimed at ensuring the long-term health and conservation of forestry resources. Weare committed to sourcing wood fiber through environmentally, socially, and economically sustainable practicesand promoting resource and conservation stewardship ethics.
Energy supply. Energy at our packaging mills is obtained through purchased or self-generated fuels andelectricity. Fuel sources include natural gas, by-products of the containerboard manufacturing and pulpingprocess (including black liquor and wood waste), purchased wood waste, coal, and oil. Each of our mills self-generates process steam requirements from by-products (black liquor and wood waste), as well as from thevarious purchased fuels. The process steam is used throughout the production process and also to generateelectricity.
In 2014, our packaging mills consumed about 59 million MMBTU’s of fuel to produce both steam andelectricity. Of the 59 million MMBTU’s consumed, about 59% was from mill generated by-products, and 41%was from purchased fuels. Of the 41% in purchased fuels, 41% was from natural gas, 38% was from purchasedwood waste, and 14% was from coal.
Sales, Marketing, and Distribution
Our corrugated products are sold through a direct sales and marketing organization, independent brokers,and distribution partners. We have sales representatives and a sales manager at most of our corrugatedmanufacturing operations and also have corporate account managers who serve customer accounts with anational presence. Additionally, our design centers maintain an on-site dedicated graphics sales force. In additionto direct sales and marketing personnel, we utilize new product development engineers and product graphics anddesign specialists. These individuals are located at both the corrugated plants and the design centers. Generalmarketing support is located at our corporate headquarters.
Our containerboard sales group is responsible for the coordination of linerboard and corrugating mediumsales to our corrugated plants, to other domestic customers, and to export customers. This group handles orderprocessing for all shipments of containerboard from our mills to our corrugated plants. These personnel alsocoordinate and execute all containerboard trade agreements with other containerboard manufacturers.
Containerboard produced in our mills is shipped by rail or truck. Rail shipments typically representapproximately 65% of the tons shipped and the remaining 35% is comprised of truck shipments. Our corrugated
4
products are delivered by truck due to our large number of customers and their demand for timely service. Ourcorrugated manufacturing operations typically serve customers within a 150 mile radius. We use third-partywarehouses for short-term storage of corrugated products.
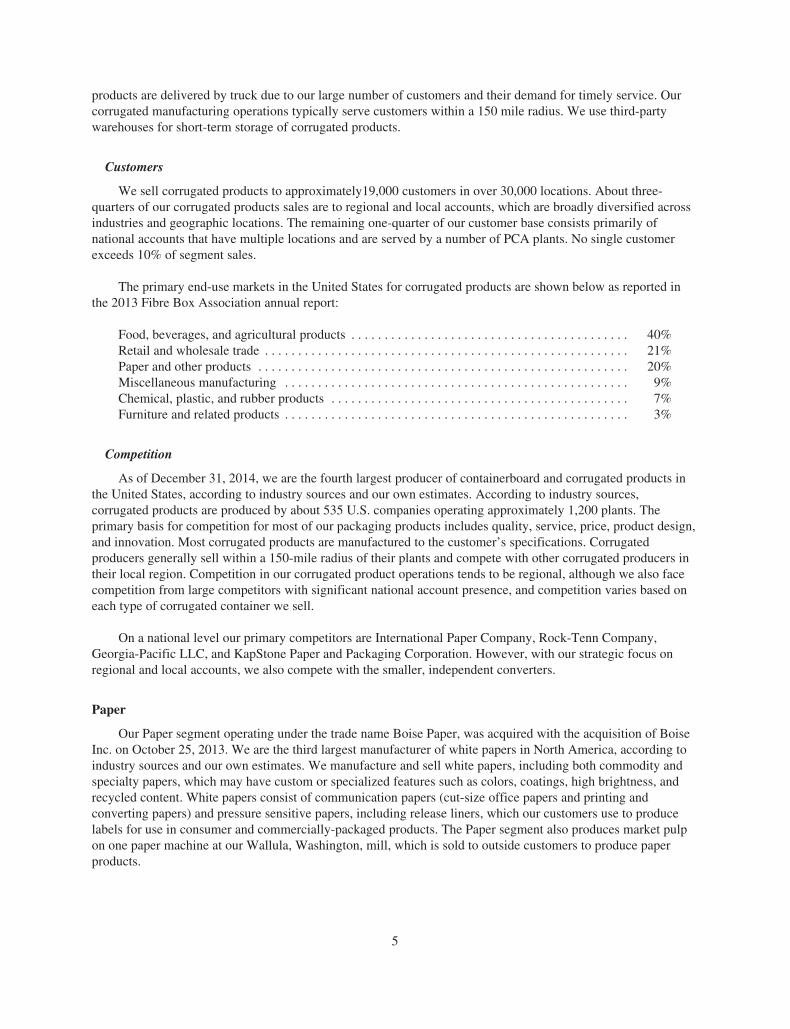
Customers
We sell corrugated products to approximately19,000 customers in over 30,000 locations. About three-quarters of our corrugated products sales are to regional and local accounts, which are broadly diversified acrossindustries and geographic locations. The remaining one-quarter of our customer base consists primarily ofnational accounts that have multiple locations and are served by a number of PCA plants. No single customerexceeds 10% of segment sales.
The primary end-use markets in the United States for corrugated products are shown below as reported inthe 2013 Fibre Box Association annual report:
Food, beverages, and agricultural products . . . . . . . . . . . . . . . . . . . . . . . . . . . . . . . . . . . . . . . . . . 40%Retail and wholesale trade . . . . . . . . . . . . . . . . . . . . . . . . . . . . . . . . . . . . . . . . . . . . . . . . . . . . . . . 21%Paper and other products . . . . . . . . . . . . . . . . . . . . . . . . . . . . . . . . . . . . . . . . . . . . . . . . . . . . . . . . 20%Miscellaneous manufacturing . . . . . . . . . . . . . . . . . . . . . . . . . . . . . . . . . . . . . . . . . . . . . . . . . . . . 9%Chemical, plastic, and rubber products . . . . . . . . . . . . . . . . . . . . . . . . . . . . . . . . . . . . . . . . . . . . . 7%Furniture and related products . . . . . . . . . . . . . . . . . . . . . . . . . . . . . . . . . . . . . . . . . . . . . . . . . . . . 3%
Competition
As of December 31, 2014, we are the fourth largest producer of containerboard and corrugated products inthe United States, according to industry sources and our own estimates. According to industry sources,corrugated products are produced by about 535 U.S. companies operating approximately 1,200 plants. Theprimary basis for competition for most of our packaging products includes quality, service, price, product design,and innovation. Most corrugated products are manufactured to the customer’s specifications. Corrugatedproducers generally sell within a 150-mile radius of their plants and compete with other corrugated producers intheir local region. Competition in our corrugated product operations tends to be regional, although we also facecompetition from large competitors with significant national account presence, and competition varies based oneach type of corrugated container we sell.
On a national level our primary competitors are International Paper Company, Rock-Tenn Company,Georgia-Pacific LLC, and KapStone Paper and Packaging Corporation. However, with our strategic focus onregional and local accounts, we also compete with the smaller, independent converters.
Paper
Our Paper segment operating under the trade name Boise Paper, was acquired with the acquisition of BoiseInc. on October 25, 2013. We are the third largest manufacturer of white papers in North America, according toindustry sources and our own estimates. We manufacture and sell white papers, including both commodity andspecialty papers, which may have custom or specialized features such as colors, coatings, high brightness, andrecycled content. White papers consist of communication papers (cut-size office papers and printing andconverting papers) and pressure sensitive papers, including release liners, which our customers use to producelabels for use in consumer and commercially-packaged products. The Paper segment also produces market pulpon one paper machine at our Wallula, Washington, mill, which is sold to outside customers to produce paperproducts.
5

Facilities
We have three white paper mills located in the United States. The following paragraphs describe our whitepaper mills:
Jackson. Our Jackson, Alabama, mill produces both commodity and specialty papers. Its year-end 2014annual estimated production capacity of white papers on two paper machines, as reported to the AF&PA, was490,000 tons. In 2014, the mill produced 494,000 tons of white papers. On a converted basis, from rollstock tocut-size white papers, the mill produced 416,000 tons in 2014.
International Falls. Our International Falls, Minnesota, mill produces both commodity and specialtypapers. Its year-end 2014 annual estimated production capacity of white papers on two paper machines, asreported to the AF&PA, was 455,000 tons. In 2014, the mill produced 457,000 tons of white papers. On aconverted basis, from rollstock to cut-size white papers, the mill produced 335,000 tons in 2014.
Wallula. Our Wallula, Washington, mill has the ability, on one machine, to switch production betweenpressure sensitive papers and a variety of white paper grades. The mill also produces corrugating medium andmarket pulp. Its year-end 2014 annual estimated production capacity of white paper grades and market pulp, asreported to the AF&PA, was 190,000 tons and 100,000 tons, respectively. The corrugating medium produced atWallula is included in our Packaging segment as discussed above. In 2014, the mill produced 193,000 tons ofwhite papers and 100,000 tons of market pulp.
Major Raw Materials Used
Fiber supply. Fiber is our principal raw material in this segment, including wood fiber, recycled fiber, andpurchased pulp. We purchase both whole logs and wood chips, which are a byproduct of lumber and plywoodproduction. At our mill in Jackson, Alabama, we also purchase recycled fiber to produce our line of recycledoffice papers. Our Jackson and International Falls paper mills also purchase pulp from third parties pursuant tocontractual arrangements. We negotiate these arrangements periodically, and terms can fluctuate based onprevailing pulp market conditions, including pricing and supply dynamics.
We purchase wood fiber through contracts and open-market purchases. Our contracts are generally withsuppliers located in close proximity to the specific facility they supply, and they commonly contain priceadjustment mechanisms to account for market price and expense volatility.
We participate in the Sustainable Forestry Initiative® (SFI) and the Forest Stewardship Council® (FSC) andare certified under the SFI sourcing standards. We procure all wood fiber for our white paper mills through ourcertified systems that are managed in accordance with the SFI and FSC standards. These standards are aimed atensuring the long-term health and conservation of forestry resources.
Energy supply. We obtain energy through purchased or self-generated fuels and electricity. Fuel sourcesinclude natural gas, electricity, by-products of the manufacturing and pulping process (including black liquor andwood waste), and purchased wood waste. Each of the paper mills self-generates process steam requirements fromby-products (black liquor and wood waste), as well as from the various purchased fuels. The process steam isused throughout the production process and also to generate electricity.
In 2014, our white paper mills consumed about 29 million MMBTU’s of fuel to produce both steam andelectricity. Of the 29 million MMBTU’s consumed, about 64% was from mill generated by-products, and36% was from purchased fuels. Of the 36% in purchased fuels, 71% was from natural gas, and 29% frompurchased wood waste.
Chemical supply. We consume a significant amount of chemicals in the production of white papers andpulp, including starch, precipitated calcium carbonate, caustic soda, sodium chlorate, dyestuffs, and optical
6

brighteners. Most of our chemicals are purchased under contracts, which may contain price adjustmentmechanisms or fixed prices designed to provide greater pricing stability than open-market purchases. Thesecontracts are bid or negotiated periodically.
Sales, Marketing, and Distribution
Our white papers are sold primarily by our own sales personnel. We ship to customers both directly fromour mills and through distribution centers and a network of outside warehouses by rail or truck. This allows us torespond quickly to customer requirements. Rail shipments typically represent approximately 70% of the tonsshipped and the remaining 30% is comprised of truck shipments.
Customers
We have over 200 customers in approximately 500 locations. These customers include paper merchants,commercial and financial printers, envelope converters, and customers who use our pressure sensitive paper forspecialty applications such as consumer and commercial product labels. We have established long-termrelationships with many of our customers. OfficeMax Incorporated (OfficeMax), a wholly-owned subsidiary ofOffice Depot, Inc., is our largest customer in the Paper segment. We have an agreement with OfficeMax in whichwe will supply at least 80% of OfficeMax’s requirements for commodity office papers through December 2017;however, there are circumstances that could cause the agreement to terminate before 2017. If this were to occur,OfficeMax’s purchase obligations under the agreement would phase out over two years. OfficeMax was acquiredby Office Depot, Inc. late in 2013. In 2014, our sales revenue to Office Depot (including OfficeMax) represented44% of our Paper segment sales revenue.
Competition
The markets in which our Paper segment competes are large and highly competitive. Commodity grades ofwhite paper are globally traded, with numerous worldwide manufacturers, and as a result, these products competeprimarily on the basis of price. All of our paper manufacturing facilities are located in the United States, andalthough we compete primarily in the domestic market, we do face competition from foreign producers, and haveexperienced increased foreign competition in recent years. The level of this competition varies depending ondomestic and foreign demand and foreign currency exchange rates. In general, paper production does not rely onproprietary processes or formulas, except in highly specialized or custom grades.
In January 2015, we, along with the United Steel Workers (USW) and other domestic paper producers, fileda petition before the United States International Trade Commission and the United States Department ofCommerce, alleging that paper producers in China, Indonesia, Australia, Brazil, and Portugal are selling productsin the United States and/or receiving government subsidies in violation of international trade rules. The agencieswill investigate the claims over the next 12 to 15 months. If the investigations determine that trade rules wereviolated, then antidumping and/or countervailing duties will be imposed on imports from the countries found inviolation. We cannot provide any assurance as to the ultimate outcome of these investigations.
Our largest competitors include Domtar Corporation, International Paper Company, and Georgia-PacificLLC. Although price is the primary basis for competition in most of our paper grades, quality, and service areimportant competitive determinants. Our white papers compete with electronic data transmission, e-readers,electronic document storage alternatives, and paper grades we do not produce. Increasing shifts to thesealternatives have had, and are likely to continue to have, an adverse effect on traditional print media and paperusage.
Corporate and Other
Our Corporate and Other segment includes corporate support staff services and related assets and liabilities,and foreign exchange gains and losses. This segment also includes transportation assets, such as rail cars and
7
trucks, which we use to transport our products from our manufacturing sites and assets related to a 50% ownedvariable interest entity, Louisiana Timber Procurement Company, L.L.C. (LTP). For segment financialinformation see Note 18, Segment Information, of the Notes to Consolidated Financial Statements in “Part II,Item 8. Financial Statements and Supplementary Data” of this Form 10-K.
Employees
As of December 31, 2014, we had approximately 14,000 employees, including 4,300 salaried employeesand 9,700 hourly employees. Approximately 75% of our hourly employees are represented by unions. Themajority of our unionized employees are represented by the USW, the International Brotherhood of Teamsters(IBT), the International Association of Machinists (IAM), and the Association of Western Pulp and PaperWorkers (AWPPW). We are currently in negotiations to renew or extend any union contracts that have recentlyexpired or are expiring in the near future, including the agreements at our Jackson, Alabama, paper mill, whichexpired August 31, 2014, and DeRidder, Tomahawk, and a portion of International Falls mill, which all expire in2015. During 2014, we experienced no work stoppages and we believe we have satisfactory labor relations withour employees.
Environmental Matters
Our discussion of the financial impact of our compliance with environmental laws is presented under thecaption “Environmental Matters” in “Part II, Item 7. Management’s Discussion and Analysis of FinancialCondition and Results of Operations” of this Form 10-K.
Executive Officers of the Registrant
Brief statements setting forth the age at February 27, 2015, the principal occupation, employment during thepast five years, the year in which such person first became an officer of PCA, and other information concerningeach of our executive officers appears below.
Mark W. Kowlzan, 59, Chief Executive Officer and Director — Mr. Kowlzan has served as ChiefExecutive Officer and a director of PCA since July 2010. From 1998 through June 2010, Mr. Kowlzan led thecompany’s containerboard mill system, first as Vice President and General Manager and then as Senior VicePresident — Containerboard. From 1996 through 1998, Mr. Kowlzan served in various senior mill-relatedoperating positions with PCA and Tenneco Packaging, including as manager of the Counce linerboard mill. Priorto joining Tenneco Packaging, Mr. Kowlzan spent 15 years at International Paper Company, where he held aseries of operational and managerial positions within its mill organization. Mr. Kowlzan is a member of theboard of American Forest and Paper Association.
Thomas A. Hassfurther, 59, Executive Vice President — Corrugated Products — Mr. Hassfurther hasserved as Executive Vice President — Corrugated Products of PCA since September 2009. From February 2005to September 2009, Mr. Hassfurther served as Senior Vice President — Sales and Marketing, CorrugatedProducts. Prior to this he held various senior-level management and sales positions at PCA and TennecoPackaging. Mr. Hassfurther joined the company in 1977.
Richard B. West, 62, Senior Vice President and Chief Financial Officer — Mr. West has served as ChiefFinancial Officer of PCA since March 1999 and as Senior Vice President since March 2002. From April 1999 toJune 2007, Mr. West also served as Corporate Secretary. From 1995 through April 1999, Mr. West served invarious senior financial positions with PCA and Tenneco Packaging. Prior to joining Tenneco Packaging,Mr. West spent 20 years with International Paper Company in various financial positions.
Judith M. Lassa, 56, Senior Vice President — Paper — Ms. Lassa has served as Senior Vice President —Paper since October 2013. Prior to PCA’s acquisition of Boise Inc., she served as Executive Vice President and
8
Chief Operating Officer of Boise from January 2013 to October 2013. Ms. Lassa served as Senior Vice President ofBoise’s paper and specialty products operations from November 2010 to December 2012. Prior to November 2010,she served in a number of capacities with Boise Cascade Corporation, Boise Cascade, L.L.C. and Boise Inc.
Thomas W.H. Walton, 55, Senior Vice President — Sales and Marketing, Corrugated Products —Mr. Walton has served as Senior Vice President — Sales and Marketing, Corrugated Products sinceOctober 2009. Prior to this, he served as a Vice President and Area General Manager within the CorrugatedProducts Group since 1998. Mr. Walton joined the company in 1981 and has also held positions in production,sales, and general management.
Kent A. Pflederer, 44, Senior Vice President, General Counsel and Secretary — Mr. Pflederer hasserved as General Counsel and Corporate Secretary since June 2007 and Senior Vice President sinceJanuary 2013. Prior to joining PCA, Mr. Pflederer served as Senior Counsel, Corporate and Securities, atHospira, Inc. from 2004 to 2007 and served in the corporate and securities practice at Mayer Brown, LLP from1996 to 2004.
Charles J. Carter, 55, Senior Vice President — Containerboard Mill Operations — Mr. Carter hasserved as Senior Vice President — Containerboard Mill Operations since July 2013. Prior to this, he served asVice President — Containerboard Mill Operations since January 2011. From March 2010 to January 2011,Mr. Carter served as PCA’s Director of Papermaking Technology. Prior to joining PCA in 2010, Mr. Carter spent28 years with various pulp and paper companies in managerial and technical positions of increasingresponsibility, most recently as Vice President and General Manager of the Calhoun, Tennessee, mill of AbitibiBowater from 2007 to 2010 and as manager of SP Newsprint’s Dublin, Georgia, mill from 1999 to 2007.
Available Information
PCA’s internet website address is www.packagingcorp.com. Our annual reports on Form 10-K, quarterlyreports on Form 10-Q, current reports on Form 8-K, and amendments to those reports filed or furnished pursuantto Section 13 or 15(d) of the Securities Exchange Act of 1934 are available free of charge through our website assoon as reasonably practicable after they are electronically filed with, or furnished to, the Securities andExchange Commission. In addition, our Code of Ethics may be accessed in the Investor Relations section ofPCA’s website. PCA’s website and the information contained or incorporated therein are not intended to beincorporated into this report.
Item 1A. RISK FACTORS
Some of the statements in this report and, in particular, statements found in Management’s Discussion andAnalysis of Financial Condition and Results of Operations, that are not historical in nature are forward-lookingstatements within the meaning of the Private Securities Litigation Reform Act of 1995. Forward-lookingstatements include statements about our expectations regarding our future liquidity, earnings, expenditures, andfinancial condition. These statements are often identified by the words “will,” “should,” “anticipate,” “believe,”“expect,” “intend,” “estimate,” “hope,” or similar expressions. These statements reflect management’s currentviews with respect to future events and are subject to risks and uncertainties. There are important factors thatcould cause actual results to differ materially from those in forward-looking statements, many of which arebeyond our control. These factors, risks and uncertainties include, but are not limited to, the factors describedbelow.
Our actual results, performance, or achievement could differ materially from those expressed in, or impliedby, these forward-looking statements, and accordingly, we can give no assurances that any of the eventsanticipated by the forward-looking statements will transpire or occur, or if any of them do so, what impact theywill have on our results of operations or financial condition. In view of these uncertainties, investors arecautioned not to place undue reliance on these forward-looking statements. We expressly disclaim any obligationto publicly revise any forward-looking statements that have been made to reflect the occurrence of events afterthe date hereof.
9

In addition to the risks and uncertainties we discuss elsewhere in this Form 10-K (particularly in “Part II,Item 7. Management’s Discussion and Analysis of Financial Condition and Results of Operations”) or in ourother filings with the Securities and Exchange Commission (SEC), the following are important factors that couldcause our actual results to differ materially from those we project in any forward-looking statement.
Industry Risks
Industry Cyclicality — Changes in the prices of our products could materially affect our financialcondition, results of operations, and liquidity. Macroeconomic conditions and fluctuations in industry capacitycan create changes in prices, sales volumes, and margins for most of our products, particularly commodity gradesof packaging and paper products. Prices for all of our products are driven by many factors, including generaleconomic conditions, demand for our products, and competitive conditions in our industry, and we have littleinfluence over the timing and extent of price changes, which are often volatile. If supply exceeds demand, pricesfor our products could decline, resulting in decreased earnings and cash generated from operations. Additionally,market conditions beyond our control can affect the prices for our commodity products. If the prices for ourproducts decline or if we are unable to control our costs, it could have a material adverse effect on our operatingcash flows, profitability, and liquidity.
Competition — The intensity of competition in the industries in which we operate could result indownward pressure on pricing and volume, which could lower earnings and cash generated fromoperations. Our industries are highly competitive, with no single containerboard, corrugated packaging, orwhite paper producer having a dominant position. Containerboard and commodity white paper products cannotgenerally be differentiated by producer, which tends to intensify price competition. The corrugated packagingindustry is also sensitive to changes in economic conditions, as well as other factors including innovation, design,quality, and service. To the extent that one or more competitors are more successful than we are with respect toany key competitive factor, our business could be adversely affected. Our packaging products also compete, tosome extent, with various other packaging materials, including products made of paper, plastics, wood, andvarious types of metal. Our white paper products compete with electronic data transmission and documentstorage alternatives. Increasing shifts to electronic alternatives have had and will continue to have an adverseeffect on usage of these products. The intensity of competition could lead to a reduction in our market share aswell as lower sales prices for our products, both of which could reduce our earnings and cash flow.
Several of our competitors are larger than we are and may have greater financial and other resources, greatermanufacturing economies of scale, greater energy self sufficiency, or lower operating costs, compared with ourcompany. We may be unable to compete with these companies particularly during economic downturns. Some ofthe factors that may adversely affect our ability to compete in the markets in which we participate include theentry of new competitors (including overseas producers, who have increased imports of white paper to the UnitedStates in recent years and some of whom we believe may be violating international trade rules) into the marketswe serve, our competitors’ pricing strategies, our inability to anticipate and respond to changing customerpreferences, and our inability to maintain the cost-efficiency of our facilities.
Company Risks
Inflation and Other General Cost Increases — We are subject to both contractual, inflation, and othergeneral cost increases. If we are unable to offset these cost increases by price increases, growth, and/or costreductions in our operations, these inflation and other general cost increases could have a material adverse effectof our operating cash flows, profitability, and liquidity.
In 2014, our total company costs including cost of sales (COS) and selling, general, and administrativeexpenses (SG&A) was $5.1 billion, and excluding non-cash costs (depreciation, pension, and share-basedcompensation expense) was $4.7 billion. A 1% increase in COS and SG&A costs would increase costs by$51 million and cash costs by $47 million.
10

Certain items of product input costs have historically been subject to more cost volatility including fiber,purchased energy, and chemicals.
Cost of Fiber — An increase in the cost of fiber could increase our manufacturing costs and lower ourearnings. The market price of wood fiber varies based upon availability, source, and the costs of fuels used inthe harvesting and transportation of wood fiber. The cost and availability of wood fiber can also be impacted byweather, general logging conditions, and geography.
The availability and cost of recycled fiber depends heavily on recycling rates and the domestic and globaldemand for recycled products. We purchase recycled fiber for use at seven of our eight mills. In 2014, wepurchased approximately 493,000 tons of recycled fiber, net of the recycled fiber generated by our corrugatedbox plants. The amount of recycled fiber purchased each year varies based upon production and the prices ofboth recycled fiber and wood fiber.
Periods of supply and demand imbalance have tended to create significant price volatility. Periods of higherrecycled fiber costs and unusual price volatility have occurred in the past and may occur again in the future,which could result in lower or volatile earnings.
Cost of Purchased Energy and Chemicals — An increase in the cost of purchased energy and chemicalscould lead to higher manufacturing costs, resulting in reduced earnings. We have the ability to use varioustypes of purchased fuels in our manufacturing operations, including coal, bark, natural gas, and oil. Energyprices, in particular prices for oil and natural gas, have fluctuated dramatically in the past. New and morestringent environmental regulations may discourage, or make more expensive, the use of certain fuels. Inaddition, costs for key chemicals used in our manufacturing also fluctuate. These fluctuations impact ourmanufacturing costs and result in earnings volatility. If energy and chemical prices rise, our production costs andtransportation costs will increase and cause higher manufacturing costs and reduced earnings.
Material Disruption of Manufacturing — A material disruption at one of our manufacturing facilitiescould prevent us from meeting customer demand, reduce our sales, and/or negatively affect our results ofoperations and financial condition. Our business depends on continuous operation of our facilities,particularly at our mills. Any of our manufacturing facilities, or any of our machines within such facilities, couldcease operations unexpectedly for a significant period of time due to a number of events, including:
• Unscheduled maintenance outages.
• Prolonged power failures.
• Equipment failure.
• Explosion of a boiler.
• Disruption in the supply of raw materials, such as wood fiber, energy, or chemicals.
• A chemical spill or release.
• Closure related to environmental concerns.
• Labor difficulties.
• Disruptions in the transportation infrastructure, including roads, bridges, railroad tracks, and tunnels.
• Fires, floods, earthquakes, hurricanes, or other catastrophes.
• Terrorism or threats of terrorism.
• Other operational problems.
These events could harm our ability to serve our customers and lead to higher costs and reduced earnings.
11

Environmental Matters — PCA may incur significant environmental liabilities with respect to both pastand future operations. We are subject to, and must comply with, a variety of federal, state and localenvironmental laws, particularly those relating to air and water quality, waste disposal and the cleanup ofcontaminated soil and groundwater. Because environmental regulations are constantly evolving, we haveincurred, and will continue to incur, costs to maintain compliance with those laws. See Item 7. “Management’sDiscussion and Analysis of Financial Condition and Results of Operations — Environmental Matters” forestimates of expenditures we expect to make for environmental compliance in the next few years. New and morestringent environmental regulations, including new U.S. Environmental Protection Agency rules relating toindustrial boiler emissions known as the Boiler MACT rules, are expected to require us to incur significantadditional capital expenditures to modify or replace certain of our boilers. In addition, environmental regulationsmay increase the cost of our raw materials and purchased energy. Although we have established reserves toprovide for known environmental liabilities, these reserves may change over time due to the enactment of newenvironmental laws or regulations or changes in existing laws or regulations, which might require additionalsignificant environmental expenditures.
Customer Concentration — OfficeMax represents a significant portion of PCA’s paper business. Wehave a supply agreement with OfficeMax, our largest customer in the paper segment. The agreement requiresOfficeMax to buy, and us to supply, at least 80% of OfficeMax’s requirements for office papers throughDecember 2017; however, there are circumstances that could cause the agreement to terminate before 2017. Ifthis were to occur, OfficeMax’s purchase obligations under the agreement would phase out over two years.OfficeMax was acquired by Office Depot, Inc. late in 2013. Office Depot has since agreed to be acquired byStaples, Inc. on February 4, 2015. The pending acquisition by Staples is subject to the satisfaction of certainconditions. If the acquisition of Office Depot by Staples is consummated, the risks described below may beintensified.
Our agreement with OfficeMax will continue to remain in effect after a merger or acquisition as to the officepaper requirements of the legacy OfficeMax business. However, we cannot predict how any merger oracquisition will affect the financial condition of the ultimate entity, the paper requirements of the legacy OfficeMax business, the purchasing decisions of the ultimate entity or the effects on pricing or competition for officepapers. In 2014, sales to Office Depot (including Office Max) represented 44% of our Paper segment sales. Ifthese sales are reduced, whether as a result of the pending integration of Office Max into Office Depot, the futureacquisition of Office Depot by Staples or otherwise, we would need to find new customers, which could harmour profitability if our prices are lower or costs are higher. Any significant deterioration in the financial conditionof the ultimate entity affecting its ability to pay or any other change that results in its willingness to purchase ourproducts will harm our business and results of operations.
Acquisition Integration — The acquired businesses may underperform relative to our expectations, andwe may not be able to successfully integrate the businesses. The acquired businesses may underperformrelative to our expectations, which may cause our financial results to differ from our own or the investmentcommunity’s expectations. If the acquired businesses underperform relative to our expectations, or if we fail tosuccessfully integrate the businesses, our business, financial condition, and results of operations may bematerially and adversely affected.
Cyber Security — Risks related to security breaches of company, customer, employee, and vendorinformation, as well as the technology that manages our operations and other business processes, couldadversely affect our business. We rely on various information technology systems to capture, process, store,and report data and interact with customers, vendors, and employees. Despite careful security and controlsdesign, implementation, updating, and internal and independent third-party assessments, our informationtechnology systems, and those of our third party providers, could become subject to cyber attacks or securitybreaches. Network, system, and data breaches could result in misappropriation of sensitive data or operationaldisruptions including interruption to systems availability and denial of access to and misuse of applicationsrequired by our customers to conduct business with us. Misuse of internal applications; theft of intellectual
12

property, trade secrets, or other corporate assets; and inappropriate disclosure of confidential information couldstem from such incidents. Delayed sales, slowed production, or other repercussions resulting from thesedisruptions could result in lost sales, business delays, and negative publicity and could have a material adverseeffect on our operations, financial condition, or cash flows.
Risks Related to Economic, Financial, and Investment Risk
Increased leverage may reduce our operating flexibility. At December 31, 2014, we had $2.3 billion oflong-term debt outstanding and a $350.0 million undrawn revolving credit facility. We and our subsidiaries mayincur additional indebtedness in the future. Our current borrowings, plus any future borrowings, may affect ourfuture operations, including, without limitation:
• Result in additional cash requirements to make interest and maturity payments on our outstandingindebtedness;
• Increase our vulnerability to adverse changes in our business or industry conditions;
• Limit our ability to obtain additional financing for working capital, capital expenditures, generalcorporate, and other purposes;
• Limit our flexibility in planning for, or reacting to, changes in our business and our industry; and
• Limit our flexibility to make acquisitions.
Further, if we cannot service our indebtedness, we may have to take actions to secure additional cash byselling assets, seeking additional equity or reducing investments.
Market Price of our Common Stock — The market price of our common stock may be volatile, whichcould cause the value of the stock to decline. Securities markets worldwide periodically experience significantprice declines and volume fluctuations. This market volatility, as well as general economic, market, or politicalconditions, could reduce the market price of our common stock in spite of our operating performance. Inaddition, our operating results could be below the expectations of public market analysts and investors, and inresponse, the market price of our common stock could decrease significantly.
General Economic Conditions — Adverse business and global economic conditions may have a materialadverse effect on our business, results of operations, liquidity, and financial position. General globaleconomic conditions adversely affect the demand and production of consumer goods, employment levels, theavailability and cost of credit, and ultimately, the profitability of our business. High unemployment rates, lowerfamily income, lower corporate earnings, lower business investment, and lower consumer spending typicallyresult in decreased demand for our products. These conditions are beyond our control and may have a significantimpact on our business, results of operations, liquidity, and financial position.
Item 1B. UNRESOLVED STAFF COMMENTS
None.
Item 2. PROPERTIES
We own and lease properties in our business. All of our leases are noncancelable and are primarilyaccounted for as operating leases. These leases are not subject to early termination except for standardnonperformance clauses.
Information concerning capacity and utilization of our principal operating facilities, the segments that usethose facilities, and a map of geographical locations is presented in “Part I, Item 1. Business” of this Form 10-K.We assess the condition and capacity of our manufacturing, distribution, and other facilities needed to meet our
13

operating requirements. Our properties have been generally well maintained and are in good operating condition.In general, our facilities have sufficient capacity and are adequate for our production and distributionrequirements.
We currently own buildings and land for five containerboard mills and three white paper mills.Additionally, we have 99 corrugated manufacturing operations, of which the buildings and land for 53 areowned, including 45 combining operations, or corrugated plants, one corrugated sheet-only manufacturer, andseven sheet plants. For 20 corrugated plants and 26 sheet plants the buildings and land are leased. We own onewarehouse and miscellaneous other properties, including sales offices and woodlands management offices. Welease space for regional design centers and numerous other distribution centers, warehouses, and facilities. Theequipment in these leased facilities is, in virtually all cases, owned by us, except for forklifts and other rollingstock which are generally leased.
We lease the cutting rights to approximately 88,000 acres of timberland located near our Valdosta mill(77,000 acres) and our Counce mill (11,000 acres). On average, these cutting rights agreements have terms withapproximately 14 years remaining. Additionally, we lease approximately 9,000 acres of land for a fiber farm,located near our Wallula mill, where we plant, grow, and harvest fiber.
Our corporate headquarters is located in Lake Forest, Illinois. The headquarter facilities are leased for thenext seven years with provisions for two additional five year lease extensions. We also lease an administrativeoffice in Boise, Idaho, which is leased through March 2018.
Item 3. LEGAL PROCEEDINGS
Information concerning legal proceedings can be found in Note 20, Commitments, Guarantees,Indemnifications, and Legal Proceedings, of the Notes to Consolidated Financial Statements in “Part II, Item 8.Financial Statements and Supplementary Data” of this Form 10-K.
Item 4. MINE SAFETY DISCLOSURE
Not applicable.
PART II
Item 5. MARKET FOR REGISTRANT’S COMMON EQUITY, RELATED STOCKHOLDER MATTERS,AND ISSUER PURCHASES OF EQUITY SECURITIES
Market Information
PCA’s common stock is listed on the New York Stock Exchange (NYSE) under the symbol “PKG”. Thefollowing table sets forth the high and low sales prices as reported by the NYSE and the cash dividends declaredper common share during the last two years.
2014 2013
Sales Price DividendsDeclared
Sales Price DividendsDeclaredQuarter Ended High Low High Low
March 31 . . . . . . . . . . . . . . . . . . . . . $75.10 $61.35 $0.40 $44.93 $37.86 $0.31June 30 . . . . . . . . . . . . . . . . . . . . . . . 72.74 65.00 0.40 50.78 42.36 0.40September 30 . . . . . . . . . . . . . . . . . . 72.82 63.11 0.40 61.32 48.45 0.40December 31 . . . . . . . . . . . . . . . . . . 80.14 57.06 0.40 64.39 55.66 0.40
14

Stockholders
On January 30, 2015, there were 73 holders of record of our common stock.
Dividend Policy
PCA expects to continue to pay regular cash dividends, although there is no assurance as to the timing orlevel of future dividend payments because these depend on future earnings, capital requirements, and financialcondition. The timing and amount of future dividends are subject to the determination of PCA’s Board ofDirectors.
On February 26, 2015, PCA announced an increase of its quarterly cash dividend on its common stock froman annual payout of $1.60 per share to an annual payout of $2.20 per share. The first quarterly dividend of$0.55 per share will be paid on April 15, 2015 to shareholders of record as of March 13, 2015.
Purchases of Equity Securities
Stock Repurchase Program
On December 14, 2011, PCA announced that its Board of Directors had authorized the repurchase of anadditional $150.0 million of its common stock. In 2014, the Company did not repurchase any shares of commonstock. In 2013, the Company repurchased 171,263 shares of common stock for $7.8 million, or an average priceof $45.54 per share. All shares repurchased under this authorization were retired prior to the end of 2013. As ofDecember 31, 2014, $98.1 million of the $150.0 million authorization remained available for repurchase of theCompany’s common stock. All shares repurchased under this authorization have been retired.
The Company withholds shares from vesting employee equity awards to cover employee tax liabilities.Total shares withheld in 2014 were 183,170 at an average price of $71.94, or $13.2 million. Total shares withheldin 2013 were 223,995 at an average price of $48.91, or $11.0 million.
The following table presents information related to our repurchases of common stock made under our planannounced on December 14, 2011, and shares withheld to cover taxes on vesting of equity awards, during thethree months ended December 31, 2014:
Issuer Purchases of Equity Securities
Period
Total Numberof Shares
Purchased(a)
AveragePrice PaidPer Share
Total Numberof Shares
Purchased asPart of Publicly
AnnouncedPlans or Programs
ApproximateDollar Value
of Shares ThatMay Yet Be
Purchased Underthe Plans orPrograms
October 1-31, 2014 . . . . . . . . . . . . . — $ — — $98,086November 1-30, 2014 . . . . . . . . . . . — — — 98,086December 1-31, 2014 . . . . . . . . . . . 14,706 76.55 — 98,086
Total . . . . . . . . . . . . . . . . . . . . . . . . 14,706(a) $76.55 — $98,086
(a) 14,706 shares were withheld from employees to cover income and payroll taxes on equity awards thatvested during the period.
15

Performance Graph
The graph below compares PCA’s cumulative 5-year total shareholder return on common stock with thecumulative total returns of the S&P 500 index; the S&P Midcap 400 index; and a Peer Group that includes threepublicly-traded companies, which are International Paper Company, Kapstone Paper and Packaging Corporation,and Rock-Tenn Company. The graph tracks the performance of a $100 investment (including the reinvestment ofall dividends) in our common stock, in each index, and in the peer groups’ common stock from December 31,2009, through December 31, 2014. The stock price performance included in this graph is not necessarilyindicative of future stock price performance.
COMPARISON OF 5 YEAR CUMULATIVE TOTAL RETURN*Among Packaging Corporation of America, the S&P 500 Index, the S&P Midcap 400 Index,
and a Peer Group
12/1312/1212/1112/1012/09 12/14$0
$100
$50
$200
$150
$250
$400
$300
$350
$450
Packaging Corporation of America S&P 500
S&P Midcap 400 Peer Group
*$100 invested on 12/31/09 in stock or index, including reinvestment of dividends.Fiscal year ending December 31.
Copyright© 2014 S&P, a division of The McGraw-Hill Companies Inc. All rights reserved.
Cumulative Total Return
December 31
2009 2010 2011 2012 2013 2014
Packaging Corporation of America . . . . . . . . . . . . $100.00 $115.11 $115.88 $182.34 $308.86 $389.45S&P 500 . . . . . . . . . . . . . . . . . . . . . . . . . . . . . . . . 100.00 115.06 117.49 136.30 180.44 205.14S&P Midcap 400 . . . . . . . . . . . . . . . . . . . . . . . . . . 100.00 126.64 124.45 146.69 195.84 214.97Peer Group . . . . . . . . . . . . . . . . . . . . . . . . . . . . . . . 100.00 105.80 117.87 160.44 220.35 251.79
The information in the graph and table above is not deemed “filed” with the Securities and ExchangeCommission and is not to be incorporated by reference in any of PCA’s filings under the Securities Act of 1933or the Securities Exchange Act of 1934, whether made before or after the date of this Annual Report onForm 10-K, except to the extent that PCA specifically incorporates such information by reference.
16

Item 6. SELECTED FINANCIAL DATA
The following table sets forth selected historical financial data of PCA (dollars and shares in millions,except per share data). The information contained in the table should be read in conjunction with the disclosuresin “Part II, Item 7. Management’s Discussion and Analysis of Financial Condition and Results of Operations”and “Part II, Item 8. Financial Statements and Supplementary Data” of this Form 10-K.
Year Ended December 31
2014(a) 2013(a) 2012 2011 2010
Statement of Income Data(b):Net Sales . . . . . . . . . . . . . . . . . . . . . . . . . . . . . . . . . . . . . . $5,852.6 $3,665.3 $2,843.9 $2,620.1 $2,435.6Net Income . . . . . . . . . . . . . . . . . . . . . . . . . . . . . . . . . . . . 392.6 441.3 160.2 158.8 210.0Net income per common share:
— basic . . . . . . . . . . . . . . . . . . . . . . . . . . . . . . . . . . . . . 3.99 4.57 1.66 1.60 2.07— diluted . . . . . . . . . . . . . . . . . . . . . . . . . . . . . . . . . . . . 3.99 4.52 1.64 1.58 2.05
Weighted average common shares outstanding:— basic . . . . . . . . . . . . . . . . . . . . . . . . . . . . . . . . . . . . . 97.0 96.6 96.4 99.3 101.7— diluted . . . . . . . . . . . . . . . . . . . . . . . . . . . . . . . . . . . . 97.1 97.5 97.5 100.4 102.6
Earnings, before interest, taxes, depreciation, andamortization (EBITDA)(c) . . . . . . . . . . . . . . . . . . . . . . $1,083.7 $ 683.7 $ 608.4 $ 437.6 $ 349.2
Cash dividends declared per common share . . . . . . . . . . . 1.60 1.51 1.00 0.80 0.60Balance Sheet Data(b):Total assets . . . . . . . . . . . . . . . . . . . . . . . . . . . . . . . . . . . . $5,348.5 $5,243.8 $2,494.9 $2,454.8 $2,267.5Total debt obligations . . . . . . . . . . . . . . . . . . . . . . . . . . . . 2,379.3 2,572.7 819.5 830.3 680.6Stockholders’ equity . . . . . . . . . . . . . . . . . . . . . . . . . . . . . 1,521.4 1,356.8 1,008.2 971.2 1,050.6
(a) On October 25, 2013, we acquired Boise Inc. (Boise). Our financial results include Boise subsequent toacquisition.
(b) Effective January 1, 2014, the Company changed its method of accounting for inventories from lower ofcost, as determined by the LIFO method, or market, to lower of cost, as determined by the average costmethod, or market. The Company applied the change retrospectively to all prior periods presented herein inaccordance with US generally accepted accounting principles (GAAP) relating to accounting changes. Formore information, see Note 2, Summary of Significant Accounting Policies, of the Notes to ConsolidatedFinancial Statements in “Part II, Item 8. Financial Statements and Supplementary Data” of this Form 10-K.
(c) EBITDA represents income before interest (interest expense and interest income), income tax provision(benefit), and depreciation, amortization, and depletion. We present EBITDA because it provides a means toevaluate our performance on an ongoing basis using the same measure that is used by our management andbecause it is frequently used by investors and other interested parties in the evaluation of companies.EBITDA, however, is not a measure of our liquidity or financial performance under generally acceptedaccounting principles (GAAP) and should not be considered as an alternative to net income, income fromoperations, or any other performance measure derived in accordance with GAAP or as an alternative to cashflow from operating activities as a measure of our liquidity. Any analysis of non-GAAP financial measuresshould be done in conjunction with results presented in accordance with GAAP. The non-GAAP measuresare not intended to be substitutes for GAAP financial measures and should not be used as such. See“Reconciliations of Non-GAAP Financial Measures to Reported Amounts” included in “Part II, Item 7.Management’s Discussion and Analysis of Financial Condition and Results of Operations” of this Form10-K for a reconciliation of non-GAAP measures to the most comparable GAAP measure.
17

Item 7. MANAGEMENT’S DISCUSSION AND ANALYSIS OF FINANCIAL CONDITION ANDRESULTS OF OPERATIONS
The following discussion and analysis of historical results of operations and financial condition should beread in conjunction with the audited financial statements and the notes thereto which appear elsewhere in thisForm 10-K. This discussion includes statements regarding our expectations with respect to our futureperformance, liquidity, and capital resources. Such statements, along with any other nonhistorical statements inthe discussion, are forward-looking. These forward-looking statements are subject to numerous risks anduncertainties, including, but not limited to, the risks and uncertainties described in “Part I, Item 1A. Risk Factors”of this Form 10-K, as well as those factors listed in other documents we file with the Securities and ExchangeCommission (SEC). We do not assume any obligation to update any forward-looking statements. Our actualresults may differ materially from those contained in or implied by any of the forward-looking statements in thisForm 10-K.
OverviewPCA is the fourth largest producer of containerboard and the third largest producer of white papers in North
America, based on production capacity. We operate five containerboard mills, three paper mills, and 99corrugated products manufacturing plants. Our corrugated products manufacturing plants produce a wide varietyof corrugated packaging products, including conventional shipping containers used to protect and transportmanufactured goods, multi-color boxes and displays with strong visual appeal that help to merchandise thepackaged product in retail locations, and honeycomb protective packaging. In addition, we are a large producerof packaging for meat, fresh fruit and vegetables, processed food, beverages, and other industrial and consumerproducts. We also manufacture and sell white papers, including both commodity and specialty papers, which mayhave custom or specialized features such as colors, coatings, high brightness, and recycled content. We operateprimarily in the United States and have some converting operations in Europe, Mexico, and Canada.
Executive SummaryIn 2014, sales grew 59.7% to a record $5,852.6 million. We reported $392.6 million of net income, or
$3.99 per diluted share in 2014, compared with $441.3 million, or $4.52 per share in 2013. Excluding the specialitems discussed below, we recorded $458.6 million of net income, or a record $4.66 per diluted share in 2014,compared with $325.2 million and $3.33 per diluted share in 2013. Packaging segment income was$663.2 million, compared with $554.2 million in 2013, and earnings before interest, taxes, depreciation,amortization, and depletion (EBITDA) excluding special items was $1,015.0 million, compared with$774.7 million in 2013. Paper segment income was $135.4 million, compared with $13.5 million in 2013, andEBITDA excluding special items was $186.0 million, compared with $24.2 million for the two months and fivedays after the Boise acquisition in 2013.
Compared with 2013, the improvement in our 2014 financial results excluding special items, was primarilydue to the Boise acquisition in October 2013. The acquisition was significantly accretive to our earnings beforespecial items due to earnings generated by Boise as well as the synergies generated from the integration of itspackaging business and operational improvements in the white papers business.
On October 17, 2014, we completed the No. 3 newsprint machine conversion at the DeRidder, Louisiana,mill to produce containerboard, which will provide our containerboard mill system with needed capacity andreduce our outside purchases of containerboard. After startup, the machine produced 58,000 tons during thefourth quarter.
In 2014, our results included $103.3 million ($47.7 million non-cash and $55.6 million cash) of pre-taxexpense from special items, compared with $87.3 million of income from special items in 2013. The 2014 specialitems included $65.8 million ($46.1 million non-cash and $19.7 million cash) of expenses related to theDeRidder mill restructuring, $19.9 million ($1.7 million non-cash and $18.2 million cash) of Boise acquisitionintegration-related, debt-refinancing, and other costs, and $17.6 million of cash expense related to the settlementof a class action lawsuit. Special items in 2013 included $166.0 million of income from the reversal of previouslyestablished tax reserves, partially offset by $67.8 million of pretax costs primarily related to the acquisition ofBoise and $10.9 million of pension plan curtailment charges.
18

Earnings per diluted share, excluding special items, in 2014 and 2013 were as follows:
Year EndedDecember 31
2014 2013
Earnings per diluted share . . . . . . . . . . . . . . . . . . . . . . . . . . . . . . . . . . . . . . . . . . . . . . $3.99 $ 4.52Special items:
DeRidder restructuring(a) . . . . . . . . . . . . . . . . . . . . . . . . . . . . . . . . . . . . . . . . . . 0.43 —Integration-related and other costs(b) . . . . . . . . . . . . . . . . . . . . . . . . . . . . . . . . . 0.13 0.11Class action lawsuit settlement(c) . . . . . . . . . . . . . . . . . . . . . . . . . . . . . . . . . . . . 0.11 —Alternative energy tax credits(d) . . . . . . . . . . . . . . . . . . . . . . . . . . . . . . . . . . . . . — (1.70)Acquisition inventory step-up(e) . . . . . . . . . . . . . . . . . . . . . . . . . . . . . . . . . . . . . — 0.14Acquisition-related costs(f) . . . . . . . . . . . . . . . . . . . . . . . . . . . . . . . . . . . . . . . . . — 0.11Acquisition-related financing costs(f) . . . . . . . . . . . . . . . . . . . . . . . . . . . . . . . . . — 0.08Pension curtailment charges(g) . . . . . . . . . . . . . . . . . . . . . . . . . . . . . . . . . . . . . . — 0.07
Total special items . . . . . . . . . . . . . . . . . . . . . . . . . . . . . . . . . . . . . . . . . . . . . . . . . . . . 0.67 (1.19)
Earnings per diluted share, excluding special items . . . . . . . . . . . . . . . . . . . . . . . . . . $4.66 $ 3.33
(a) Includes $65.8 million of costs related primarily to the conversion of the No. 3 newsprint machine at ourDeRidder, Louisiana, mill and related start-up costs, and our exit from the newsprint business inSeptember 2014 ($42.1 million after-tax or $0.43 per diluted share).
(b) 2014 includes $19.9 million ($12.7 million after-tax or $0.13 per diluted share) and 2013 includes$17.4 million ($11.0 million after-tax or $0.11 per diluted share) of Boise acquisition integration-related andother costs, primarily for severance, retention, travel, and professional fees.
(c) Includes $17.6 million of costs accrued for the settlement of the Kleen Products LLC v Packaging Corp. ofAmerica et al class action lawsuit ($11.2 million after-tax or $0.11 per diluted share).
(d) 2013 includes $1.70 of income per diluted share for the reversal of $166.0 million of tax reserves related toalternative energy tax credits. Approximately $103.9 million of the reversal is due to the completion of anIRS audit of PCA’s Filer City mill’s cellulosic biofuel tax credits and $62.1 million is from the reversal ofreserves for the taxability of the alternative energy tax credits acquired in the acquisition of Boise.
(e) Generally accepted accounting principles (GAAP) required us to value the inventory from the acquisition ofBoise at fair value, which increased the value of the inventory by $21.5 million. This reduced the profit onthe sale of the acquired inventory to that portion attributable to the selling effort. This step-up in valueincreased expenses by $21.5 million as the acquired inventory was sold and charged to cost of sales($13.6 million after-tax or $0.14 per diluted share).
(f) Includes $28.9 million of acquisition-related costs, primarily for professional fees related to transaction-advisory services and expenses related to financing the acquisition of Boise ($18.3 million after-tax or$0.19 per diluted share).
(g) Includes $10.9 million of non-cash pension curtailment charges related to pension plan changes in whichcertain hourly corrugated and containerboard mill employees will transition from a defined benefit pensionplan to a defined contribution 401k plan ($7.0 million after-tax or $0.07 per diluted share).
Management excludes special items and uses non-GAAP measures to focus on PCA’s on-going operationsand assess its operating performance and believes that it is useful to investors because it enables them to performmeaningful comparisons of past and present operating results. Reconciliation of diluted EPS to diluted EPSexcluding special items is included above and the reconciliations of other non-GAAP measures used in thisManagement’s Discussion and Analysis of Financial Condition and Results of Operations, to the mostcomparable measure reported in accordance with GAAP, are included later in Item 7 under “Reconciliations ofNon-GAAP Financial Measures to Reported Amounts.” Any analysis of non-GAAP financial measures should bedone in conjunction with results presented in accordance with GAAP. The non-GAAP measures are not intendedto be substitutes for GAAP financial measures and should not be used as such.
19

Industry and Business Conditions
Trade publications reported that industry-wide corrugated products shipments increased 1.2% during 2014,compared with 2013. In 2014, our corrugated products shipments, including Boise, increased 25.5% over lastyear and 25.0% per workday with one more workday in 2014. Excluding Boise shipments, corrugated productsshipments increased 4.7% in total, or 4.3% per workday. The acquisition of Crockett Packaging in April 2014contributed about 1.0% to the increase in shipments. Reported industry containerboard production was 1.8%higher than 2013, with export shipments up 6.3%. PCA containerboard mill production in 2014 was 3,452,000total tons, including 801,000 tons from Boise, compared with 2,749,000 total tons in 2013, which included141,000 tons from Boise. With strong internal containerboard demand needed to supply our box plants, wereduced our outside sales of containerboard, both domestic and export, by 46,000 tons compared with last yearand we purchased 182,000 tons of containerboard from the outside market in 2014. Our domestic containerboardpricing remained steady throughout 2014, while our export pricing decreased slightly, due, in part, to a strongerU.S. dollar.
The market for communication papers competes heavily with electronic data transmission and documentstorage alternatives. Increasing shifts to these alternatives have reduced usage of traditional print media andcommunication papers. In 2014, we elected to exit some business which lowered our office paper shipments. Ouroffice paper shipments decreased 2.1% or 16,000 tons in 2014, compared with Boise’s shipments last year. Ourprinting and converting papers and pressure sensitive papers shipments were down about 18.5% or 81,000 tonscompared with 2013, as a result of closing two paper machines at the International Falls, Minnesota, mill infourth quarter 2013. In 2014, our white paper mills produced 1,144,000 tons. In 2014, our average price for allproducts produced in our paper segment was $996 per ton compared with the 2013 average price of $984 per ton.
Outlook
In the first quarter of 2015, we expect lost containerboard production of about 60,000 tons and higheroperating costs from annual maintenance outages at Counce and DeRidder, our two largest containerboard mills,and two less production days compared with the fourth quarter of 2014. Corrugated products shipments areexpected to be seasonally lower, and white paper prices are expected to be lower from the impact of publishedprice decreases in November and December 2014 and changes in mix. Seasonally colder weather will increasewood, energy, and chemical costs. In addition, labor and benefit costs will be higher with annual wage increasesand timing-related fringe benefit increases. These items will be partially offset by higher production on theDeRidder No. 3 paper machine. As a result, we expect first quarter earnings, excluding special items, to be lowerthan fourth quarter 2014.
20

Results of Operations
Year Ended December 31, 2014, Compared with Year Ended December 31, 2013
The historical results of operations of PCA for the years ended December 31, 2014 and 2013 are set forthbelow (dollars in millions):
Year EndedDecember 31
2014(a) 2013(a) Change
Packaging . . . . . . . . . . . . . . . . . . . . . . . . . . . . . . . . . . . . . . . . . . . . . . $4,540.3 $3,431.7 $1,108.6Paper . . . . . . . . . . . . . . . . . . . . . . . . . . . . . . . . . . . . . . . . . . . . . . . . . 1,201.4 216.9 984.5Corporate and other and eliminations . . . . . . . . . . . . . . . . . . . . . . . . 110.9 16.7 94.2
Net sales . . . . . . . . . . . . . . . . . . . . . . . . . . . . . . . . . . . . . . . . . . . . . $5,852.6 $3,665.3 $2,187.3
Packaging . . . . . . . . . . . . . . . . . . . . . . . . . . . . . . . . . . . . . . . . . . . . . . $ 663.2 $ 554.2 $ 109.0Paper . . . . . . . . . . . . . . . . . . . . . . . . . . . . . . . . . . . . . . . . . . . . . . . . . 135.4 13.5 121.9Corporate and other and eliminations . . . . . . . . . . . . . . . . . . . . . . . . (95.9) (85.8) (10.1)
Income from operations . . . . . . . . . . . . . . . . . . . . . . . . . . . . . . . . . $ 702.7 $ 481.9 $ 220.8Interest expense, net . . . . . . . . . . . . . . . . . . . . . . . . . . . . . . . . . . . . . (88.4) (58.3) (30.1)
Income before taxes . . . . . . . . . . . . . . . . . . . . . . . . . . . . . . . . . . . . . . 614.3 423.6 190.7Income tax (expense) benefit . . . . . . . . . . . . . . . . . . . . . . . . . . . . . . . (221.7) 17.7 (239.4)
Net income . . . . . . . . . . . . . . . . . . . . . . . . . . . . . . . . . . . . . . . . . . . . . $ 392.6 $ 441.3 $ (48.7)
Net income excluding special items(b) . . . . . . . . . . . . . . . . . . . . . . . $ 458.6 $ 325.2 $ 133.4
EBITDA(b) . . . . . . . . . . . . . . . . . . . . . . . . . . . . . . . . . . . . . . . . . . . . $1,083.7 $ 683.7 $ 400.0
EBITDA excluding special items(b) . . . . . . . . . . . . . . . . . . . . . . . . . $1,143.6 $ 750.7 $ 392.9
(a) On October 25, 2013, we acquired Boise Inc. (Boise). Our financial results include Boise subsequent toacquisition.
(b) See “Reconciliations of Non-GAAP Financial Measures to Reported Amounts” included in this Item 7 for areconciliation of non-GAAP measures to the most comparable GAAP measure.
Net Sales
Net sales increased $2,187.3 million, or 59.7%, to a record $5,852.6 million in 2014, compared with$3,665.3 million in 2013. The increase in 2014 related to a full year of Boise operations, compared with onlytwo months and five days in 2013 ($1,962.8 million) and increased sales in PCA’s historical operations ($224.5),which resulted from higher sales volumes and higher sales prices and mix.
Packaging. Sales increased $1,108.6 million, or 32.3%, to $4,540.3 million, compared with$3,431.7 million in 2013. A full year of Boise operations contributed $878.7 million of the increase and theremaining increase related to higher sales volumes ($160.5 million) and higher sales prices and mix($69.4 million) in PCA’s historical operations. Total corrugated products volume sold in 2014, including Boise,increased 25.5% over 2013 and shipments per workday increased 25.0%. The year ended December 31, 2014,included 251 workdays, those days not falling on a weekend or holiday, compared with 250 workdays in 2013.Excluding Boise shipments, corrugated products shipments increased 4.7% in total, or 4.3% per workday in2014, compared with 2013. The acquisition of Crockett Packaging in April 2014, contributed about 1.0% to theincrease in shipments, with the rest of the increase coming from organic growth. We reduced our outside sales ofcontainerboard, both domestic and export, by 46,000 tons compared with last year and we purchased182,000 tons of containerboard from the outside market in 2014. Containerboard mill production in 2014 was3,452,000 total tons, including 801,000 tons from Boise, compared with 2,749,000 total tons in 2013, whichincluded 141,000 tons from Boise.
21

Paper. Our paper segment sales include the sales for the white paper mills we acquired from Boise. Salesfor 2014 were $1,201.4 million. In 2013, sales during the two months and five days we owned Boise were$216.9 million. In 2014, sales volumes of white paper were 1,114,000 tons, compared with 210,000 tons in 2013,for the period we owned Boise.
Gross Profit
Gross profit increased $362.0 million, or 41.7%, in 2014, compared with 2013. In 2014, gross profitincluded $58.1 million of expense from special items, most of which related to restructuring charges at ourDeRidder, Louisiana mill, including incremental depreciation related to changing the estimated useful lives ofnewsprint-related assets in connection with our exit from the newsprint business in September 2014. In 2013,gross profit included $21.5 million of expense from special items related to the step-up in value of inventoryacquired in the Boise acquisition. Excluding special items, gross profit increased $398.6 million. Approximately90% of the increase was due to a full year of Boise operations, including realized synergies, and the remainingincrease was from higher gross profit in PCA’s historical packaging operations due to higher sales prices,volume, and mix, partially offset by increases in costs for labor, depreciation, freight, wood fiber, and chemicalexpenses. Gross profit as a percentage of net sales decreased to 21.0% of net sales in 2014 compared with 23.7%in 2013 due primarily to a full year impact of the white papers business whose products generally have lowermargins than the products sold in the packaging business and the DeRidder restructuring charges describedabove.
Selling, General, and Administrative Expenses
Selling, general, and administrative expenses increased $142.9 million, or 43.8%, in 2014 compared with2013. Approximately 90% of the increase relates to the acquired Boise businesses. The remaining increase in ourhistorical PCA business is due primarily to a $12.0 million increase in salary and fringe benefit expenses andother increases, which were individually insignificant.
Other Expense, Net
Other expense, net, in 2014 was $57.3 million, which included Boise acquisition integration-related andother costs, which primarily relate to severance, retention, travel, and professional fees ($20.0 million), costs forthe settlement of the Kleen Products LLC v Packaging Corp. of America et al class action lawsuit($17.6 million), DeRidder mill restructuring costs primarily related to the conversion of the No. 3 newsprintmachine to produce lightweight linerboard and corrugating medium and related start-up costs, and our exit fromthe newsprint business in September 2014 ($7.3 million), and asset disposals and write-offs charges($10.1 million). In 2013, “Other expense, net” was $59.0 million, which primarily included acquisition-relatedcosts ($17.2 million), Boise acquisition integration-related and other costs ($17.4 million), pension plancurtailment charges ($10.9 million), and asset disposals and write-offs charges ($13.2 million).
Income from Operations
Income from operations increased $220.8 million, or 45.8%, for the year ended December 31, 2014,compared with 2013. Our 2014 income from operations included $101.8 million of expense from special items,compared with $67.0 million of expense from special items in 2013. See “Reconciliations of Non-GAAP Financial Measures to Reported Amounts” in this Item 7 for more information on special items.Excluding special items, income from operations increased $255.6 million in 2014, compared with 2013.Approximately 90% of the increase was due to a full year of Boise operations, including realized synergies, andthe remaining 10% was due to improvement in PCA’s historical earnings.
22

Packaging. Segment income from operations increased $109.0 million, or 19.7%, to $663.2 million,compared with $554.2 million in 2013. Excluding $70.7 million of special items in 2014 and $30.3 million in2013, segment income increased $149.4 million to $733.9 million, compared with $584.5 million. The increaseprimarily related to a full year of Boise operations in 2014 (approximately 90% of the change, including realizedsynergies, and excluding special items) and increased income in PCA’s historical packaging business, whichrelated to higher sales price and improved mix ($69.4 million), higher sales volume ($12.8 million), partiallyoffset by increased costs for labor and benefits ($28.4 million), depreciation ($16.6 million), transportation($10.9 million), energy ($10.2 million), wood fiber ($5.0 million), chemicals ($2.8 million), and repairs($2.8 million).
Paper. Segment income from operations was $135.4 million in 2014, compared with $13.5 million for thetwo months and five days after the Boise acquisition in 2013. Segment income in 2013 included $3.5 million ofacquisition inventory step-up costs included in cost of sales, partially offset by $1.9 million of income for aninsurance settlement related to Boise’s former St. Helens, Oregon, mill, net of other expenses. Excluding thesespecial items, segment income in 2013 for the white papers business was $15.1 million.
Interest Expense, Net, and Income Taxes
Interest expense, net, was $88.4 million in 2014, compared with $58.3 million in 2013. The increase ininterest expense primarily related to higher average outstanding borrowings following the acquisition of Boise inOctober of 2013. Interest expense in 2014 and 2013 included $1.5 million and $1.1 million of expense,respectively, related to the write-off of deferred financing costs in connection with the repayment of debt. Also,2013 included $10.5 million of expenses related to financing the acquisition of Boise.
In 2013, we recorded a $17.7 million income tax benefit, which included $166.0 million of income taxbenefits from the reversal of the reserve for unrecognized tax benefits from alternative energy tax credits. TheIRS completed its audit of PCA’s 2008 and 2009 Federal income tax returns and all claimed alternative energytax credits were allowed. In November 2013, PCA received a confirmation letter from the Joint Committee onTaxation that their review was complete. As a result, a $103.9 million ($102.0 million of tax plus $1.9 million ofaccrued interest) reserve for unrecognized tax benefits for the Filer City mill’s cellulosic biofuel tax credit wasfully reversed as a benefit to income taxes in 2013. Excluding the alternative energy tax credits, the 2013effective tax rate was 35.0%, compared with 36.1% in 2014. The credits are described in Note 7, AlternativeEnergy Tax Credits, of the Notes to Consolidated Financial Statements in “Part II, Item 8. Financial Statementsand Supplementary Data” of this Form 10-K. The effective tax rate in 2014 varies from the U.S. federal statutorytax rate of 35.0% principally due to the impact of state and local income taxes and the domestic manufacturers’deduction.
23

Year Ended December 31, 2013, Compared with Year Ended December 31, 2012
The historical results of operations of PCA for the years ended December 31, 2013 and 2012 are set forthbelow (dollars in millions):
Year EndedDecember 31
2013(a) 2012 Change
Packaging . . . . . . . . . . . . . . . . . . . . . . . . . . . . . . . . . . . . . . . . . . . . . $3,431.7 $2,843.9 $ 587.8Paper . . . . . . . . . . . . . . . . . . . . . . . . . . . . . . . . . . . . . . . . . . . . . . . . . 216.9 — 216.9Corporate and other and eliminations . . . . . . . . . . . . . . . . . . . . . . . . 16.7 — 16.7
Net sales . . . . . . . . . . . . . . . . . . . . . . . . . . . . . . . . . . . . . . . . . . $3,665.3 $2,843.9 $ 821.4
Packaging . . . . . . . . . . . . . . . . . . . . . . . . . . . . . . . . . . . . . . . . . . . . . $ 554.2 $ 383.9 $ 170.3Paper . . . . . . . . . . . . . . . . . . . . . . . . . . . . . . . . . . . . . . . . . . . . . . . . . 13.5 — 13.5Corporate and other and eliminations . . . . . . . . . . . . . . . . . . . . . . . . (85.8) 53.7 (139.5)
Income from operations . . . . . . . . . . . . . . . . . . . . . . . . . . . . . . $ 481.9 $ 437.6 $ 44.3Interest expense, net . . . . . . . . . . . . . . . . . . . . . . . . . . . . . . . . . . . . . (58.3) (62.9) 4.6
Income before taxes . . . . . . . . . . . . . . . . . . . . . . . . . . . . . . . . . . . . . 423.6 374.7 48.9Provision for income taxes . . . . . . . . . . . . . . . . . . . . . . . . . . . . . . . . 17.7 (214.5) 232.2
Net income . . . . . . . . . . . . . . . . . . . . . . . . . . . . . . . . . . . . . . . . . . . . $ 441.3 $ 160.2 $ 281.1
Net income excluding special items(b) . . . . . . . . . . . . . . . . . . . . . . . $ 325.2 $ 197.2 $ 128.0
EBITDA(b) . . . . . . . . . . . . . . . . . . . . . . . . . . . . . . . . . . . . . . . . . . . . $ 683.7 $ 608.4 $ 75.3
EBITDA excluding special items(b) . . . . . . . . . . . . . . . . . . . . . . . . . $ 750.7 $ 514.9 $ 235.8
(a) On October 25, 2013, we acquired Boise. Our financial results include Boise subsequent to acquisition.(b) See “Reconciliations of Non-GAAP Financial Measures to Reported Amounts” included in this Item 7 for a
reconciliation of non-GAAP measures to the most comparable GAAP measure.
Net Sales
Net sales increased $821.4 million, or 28.9%, to a record $3,665.3 million in 2013, compared with$2,843.9 million in 2012. The increase in 2013 related to higher sales price and mix ($205.5 million), highersales volumes ($176.8 million), and two months and five days of Boise operations ($439.1 million).
Packaging. Sales increased $587.8 million, or 20.7%, to $3,431.7 million, compared with $2,843.9 millionin 2012. As discussed above, higher sales price and mix, higher sales volumes, and two months and five days ofBoise operations increased sales in our Packaging segment. Corrugated products shipments per workdayincreased 11.1% in 2013, compared with the same period in 2012, on a shipments-per-workday basis. ExcludingBoise’s shipments, 2013 shipments increased 5.7% in total, and were up 6.1% per workday compared with 2012,all of which came from organic growth. Total corrugated products volume sold in 2013, including Boise,increased 10.7% over the same period last year. The year ended December 31, 2013, included 250 workdays,those days not falling on a weekend or holiday, compared with 251 workdays in 2012. Containerboard volumesold to outside domestic and export customers was essentially unchanged in 2013, compared with 2012, as theadditional Boise outside containerboard sales in the partial fourth quarter were offset by decreased export sales.Containerboard mill production in 2013 was 2,749,000 tons, which included 141,000 tons from the acquiredBoise mills, compared with 2,600,000 tons in 2012.
Paper. Our paper segment sales include the sales for the white paper mills we acquired from Boise. Salesfor the two months and five days we owned Boise were $216.9 million. During this period, sales volumes ofwhite paper were 210,000 tons.
24

Gross Profit
Gross profit increased $232.8 million, or 36.7%, in 2013, compared with 2012 due primarily to the salesprice and volume increases described above. Gross profit as a percentage of net sales increased to 23.7% of netsales in 2013 compared with 22.3% in the same period in 2012. Reported 2013 gross profit was negativelyaffected by $21.5 million of expense for the acquisition inventory step-up related to the acquisition of Boise, ofwhich $18.0 million was recorded in the Packaging segment and $3.5 million was recorded in the Paper segment.Excluding the step-up expense, gross profit was 24.3% of 2013 net sales.
Selling, General, and Administrative Expenses
Selling, general, and administrative expenses increased $45.8 million, or 16.3%, in 2013 compared with2012. Excluding selling, general, and administrative expenses associated with the acquired Boise businesses ofapproximately $25.2 million, selling, general, and administrative expenses increased $20.6 million, primarily dueto higher costs for salaries ($6.9 million), incentive compensation ($4.8 million), fringe benefits ($1.8 million),legal expenses ($3.0 million), travel and meeting costs ($1.7 million), and broker commissions ($1.5 million).
Other Expense, Net
Other expense, net, in 2013 was $59.0 million, which primarily included acquisition-related costs($17.2 million), Boise acquisition integration-related and other costs ($17.4 million), pension plan curtailmentcharges ($10.9 million), and asset disposals and write-offs charges ($13.2 million). In 2012, “Other expense, net”was $11.8 million, which related primarily to asset disposal and write-offs charges ($10.8 million).
Income from Operations
Income from operations increased $44.3 million, or 10.1%, for the year ended December 31, 2013,compared with 2012. Our 2013 income from operations included $67.1 million of expense from special items,consisting of $56.1 million of costs primarily related to the acquisition of Boise on October 25, 2013, and$10.9 million of pension plan curtailment charges. Income from operations in 2012 included $95.5 million ofincome related to alternative energy tax credits, offset partially by $2.0 million of plant closure charges.Excluding special items, income from operations increased $204.9 million in 2013, compared with 2012. Theincrease was primarily due to increased sales price, improved mix, higher sales volume, and a partial quarter ofBoise operations, partially offset by increased costs.
Packaging. Segment income from operations increased $170.3 million, or 44.4%, to $554.2 million,compared with $383.9 million in 2012. Excluding $30.3 million of special items in 2013 related to acquisitioninventory step-up, integration-related and other costs, and pension curtailment charges, segment incomeincreased $198.6 million to $584.5 million, compared with $385.9 million, excluding $2.0 million of specialitems in 2012. The increase primarily related to increased sales price and improved mix ($219.6 million), highersales volume ($25.2 million), and income from Boise’s operations for two months and five days in the fourthquarter of 2013. These improvements were partially offset by increased costs for labor ($16.8 million), energy($10.4 million), transportation ($6.9 million), incentive compensation ($5.5 million), wood fiber ($5.8 million),and repairs ($4.1 million).
Paper. Segment income from operations was $13.5 million in 2013, which included $3.5 million ofacquisition inventory step-up included in cost of sales, partially offset by $1.9 million of income for an insurancesettlement related to Boise’s St. Helens, Oregon, mill, net of other expenses. Excluding these special items,segment income for the white papers business was $15.1 million.
Interest Expense, Net, and Income Taxes
Interest expense, net, was $58.3 million in 2013, compared with $62.9 million in 2012. Excluding$10.5 million of expenses related to financing the acquisition of Boise in the fourth quarter of 2013, and
25

$1.1 million of expense for the write-off of deferred financing costs in connection with repaying the term loandue 2016 and the receivables credit facility due 2014, interest expense was $46.7 million, compared with$38.1 million in 2012, excluding $24.8 million of debt refinancing charges. The 2013 increase in interestexpense, excluding special items, primarily related to two months of increased interest expense on the higheraverage outstanding borrowings used to fund the acquisition of Boise.
In 2013, we recorded a $17.7 million income tax benefit, which included $166.0 million of income taxbenefits from the reversal of the reserve for unrecognized tax benefits from alternative energy tax credits. TheIRS completed its audit of PCA’s 2008 and 2009 Federal income tax returns and all claimed alternative energytax credits were allowed. In November 2013, PCA received a confirmation letter from the Joint Committee onTaxation that their review was complete. As a result, a $103.9 million ($102.0 million of tax plus $1.9 million ofaccrued interest) reserve for unrecognized tax benefits for the Filer City mill’s cellulosic biofuel tax credit wasfully reversed as a benefit to income taxes in the fourth quarter of 2013. Excluding the alternative energy taxcredits, the 2013 effective tax rate was 35.0%, compared with 57.2% in 2012, as reported, or 34.4%, excludingthe impact from amending our 2009 tax return in 2012 related to alternative energy tax credits. The credits aredescribed in Note 7, Alternative Energy Tax Credits, of the Notes to Consolidated Financial Statements in “PartII, Item 8. Financial Statements and Supplementary Data” of this Form 10-K. The effective tax rate varies fromthe U.S. federal statutory tax rate of 35.0% principally due to the impact of the alternative energy tax credits,state and local income taxes and the domestic manufacturers’ deduction.
Liquidity and Capital Resources
Sources and Uses of Cash
Our primary sources of liquidity are net cash provided by operating activities and available borrowingcapacity under our revolving credit facility. We ended the year with $124.9 million of cash and $325.1 million ofunused borrowing capacity under the revolving credit facility, net of letters of credit. Currently, our primary usesof cash are for operations, capital expenditures, debt service (including voluntary payments of debt), and declaredcommon stock dividends. We believe that net cash generated from operating activities, cash on hand, availableborrowings under our revolving credit facility and available capital through access to capital markets will beadequate to meet our liquidity and capital requirements, including payments of any declared common stockdividends for the foreseeable future. As our debt or credit facilities become due, we will need to repay, extend orreplace such facilities. Our ability to do so will be subject to future economic conditions and financial, business,and other factors, many of which are beyond our control.
Below is a summary table of our cash flows, followed by a discussion of our sources and uses of cashthrough operating activities, investing activities, and financing activities (dollars in millions):
Year Ended December 31
2014 2013 2012
Net cash provided by (used for):Operating activities . . . . . . . . . . . . . . . . . . . . . . . . . . . . . . . . . . $ 736.1 $ 608.2 $ 404.2Investing activities . . . . . . . . . . . . . . . . . . . . . . . . . . . . . . . . . . (451.1) (1,411.4) (107.5)Financing activities . . . . . . . . . . . . . . . . . . . . . . . . . . . . . . . . . . (351.1) 786.8 (245.6)
Net (decrease) increase in cash and cash equivalents . . . . . . . . . . . . $ (66.1) $ (16.4) $ 51.1
Our foreign operations are not material to our financial position or results of operations. At December 31,2014, we had $10.4 million of cash and short-term investments held in operations outside of the UnitedStates. We indefinitely reinvest our earnings in operations outside the United States; however, if foreign earningswere repatriated at a future date, we would need to accrue and pay taxes. It is not practicable to determine theamount of unrecognized deferred tax liability on these undistributed earnings because the actual tax liability, ifany, is dependent on circumstances existing when the repatriation occurs.
26

Operating Activities
2014
The major components of cash provided by operations are earnings from continuing operations adjusted fornon-cash income and expense items and changes in working capital. Earnings from continuing operations,adjusted for non-cash income and expense items, increased $216.0 million due to record earnings in 2014, whichwas driven by the acquisition of Boise in fourth quarter 2013. Cash used for operating assets and liabilities,excluding acquisitions, totaled $97.0 million in 2014, compared with $8.7 million in 2013. The higherrequirements for operating assets and liabilities, excluding acquisitions, in 2014 were driven primarily by highercontainerboard and office papers inventory levels built in advance of four of our five containerboard mills andtwo of our three white papers mills taking maintenance outages in the first half of 2015 and lower accountspayable levels due to the timing of payments, partially offset by a decrease in federal and state income taxesreceivable at December 31, 2014, compared with December 31, 2013. Cash requirements for operating activitiesare subject to PCA’s operating needs and the timing of collection of receivables and payments of payables andexpenses.
2013
In 2013, net cash provided by operating activities was $608.2 million, compared with $404.2 million in2012, an increase of $204.0 million. Approximately 67.5%, or $137.7 million of the increase in cash provided byoperating activities before changes in operating assets and liabilities, relate to the increase in income from ouroperations in 2013, which we discuss above under “Operating Results,” and two months and five days of incomeincluded in 2013 from the newly acquired Boise operations. In addition, we used an additional $7.2 million ofalternative energy tax credits to reduce federal income tax payments during 2013, compared with 2012. Cashused for operating assets and liabilities, excluding acquisitions, totaled $8.7 million in 2013, compared with$74.9 million in 2012. The lower requirements for operating assets and liabilities, excluding acquisitions, in2013, were driven primarily by higher accounts payable and lower inventory levels, partially offset by loweraccrued liabilities at December 31, 2013, compared with December 31, 2012.
Investing Activities
2014
We used $451.1 million for investing activities in 2014, compared with $1,411.4 million in 2013. In 2014,we spent $420.2 million for capital investments, compared with $234.4 million in 2013. The increase in capitalspending was due primarily to having a full year of Boise capital investments, including $104.2 million for theconversion of the No. 3 newsprint machine at our DeRidder, Louisiana, mill to produce containerboard. In 2014,we spent $20.5 million for the acquisition of Crockett Packaging, a corrugated products manufacturer. In 2013we spent $1,174.5 million on the acquisition of Boise, net of $121.7 million of cash acquired.
The details of capital expenditures for property and equipment, excluding acquisitions, by segment for theyears ended December 31, 2014, 2013, and 2012, are included in the table below (dollars in millions).
Year Ended December 31
2014 2013 2012
Packaging . . . . . . . . . . . . . . . . . . . . . . . . . . . . . . . . . . . . . . . . . . . . . . . . . $362.1 $222.2 $127.8Paper . . . . . . . . . . . . . . . . . . . . . . . . . . . . . . . . . . . . . . . . . . . . . . . . . . . . . 51.7 10.0 —Corporate and Other . . . . . . . . . . . . . . . . . . . . . . . . . . . . . . . . . . . . . . . . . 6.4 2.2 0.7
$420.2 $234.4 $128.5
We expect capital investments in 2015 to be between $275.0 million and $300.0 million, including capitalrequired for synergies and Boiler MACT spending, but excluding any acquisitions. These expenditures could
27

increase or decrease as a result of a number of factors, including our financial results, future economicconditions, and our regulatory compliance requirements. We currently estimate capital expenditures to complywith Boiler MACT regulations (as discussed below under “Environmental Matters”) in 2015 of up to$16.0 million and we expect other environmental capital expenditures of about $5.0 million in 2015. Ourestimated environmental expenditures could vary significantly depending upon the enactment of newenvironmental laws and regulations, including those related to greenhouse gas emissions and industrial boilers.For additional information, see “Environmental Matters” in this Management’s Discussion and Analysis ofFinancial Condition and Results of Operations.
At December 31, 2014, PCA had commitments for capital expenditures of $94.7 million. PCA believes thatcash-on-hand combined with cash flow from operations will be sufficient to fund these commitments.
2013
Net cash used for investing activities in 2013 increased $1,303.9 million, to $1,411.4 million, comparedwith $107.5 million in 2012. In 2013, we paid $1,174.5 million for the acquisition of Boise, net of $121.7 millionof cash acquired, while in 2012 we spent $35.4 million on the acquisition of our Cheswick, Pennsylvania,corrugated products plant. We spent $234.4 million for capital investments in 2013, compared with$128.5 million in 2012. In 2012, we received $57.4 million in grant proceeds from the U.S. Treasury.
Financing Activities
2014
In 2014, we used $351.1 million for financing activities, while financing activities provided $786.8 millionin 2013. In 2014, we made $592.5 million of principal payments on long-term debt and capital leases andreceived $398.9 million of proceeds (net of debt discount) from long-term debt issuances, for a net reduction indebt of $193.6 million. To reduce exposure to variable interest rates, in September 2014, we issued $400 millionof ten-year notes with a fixed interest rate of 3.65% and used the proceeds to pay down a portion of our five-year,variable-rate term loan. In October 2013, we entered into $2.35 billion of new credit facilities, including a$350.0 million revolver which remains undrawn. We used the proceeds from borrowings under these facilitiesand cash on hand to finance the acquisition of Boise, repay $953.6 million of indebtedness, which included$829.8 million of acquired Boise debt, and for general corporate purposes. In addition, in 2013, we repaid$12.2 million of outstanding debt prior to the acquisition of Boise and repaid $109.0 million under ourreceivables credit facility that we terminated in December 2013. In 2014, we also paid $3.4 million of financingcosts, compared with $19.4 million in 2013. We paid $157.4 million of dividends in 2014, compared with$109.1 million of dividends and $7.8 million of common stock repurchases in 2013. The lower dividends paid in2013 resulted from accelerating the dividends that would have been paid in January 2013 to December 2012.During 2014, we withheld 183,170 shares from vesting equity awards to cover employee tax liabilities of$13.2 million, compared with $11.0 million in 2013. Proceeds from the exercise of stock options and tax benefitsfrom share-based awards contributed $15.9 million in 2014, compared with $10.7 million in 2013.
For more information about our debt, commitments, and treasury lock derivative instruments, see Note 10,Debt, Note 20, Commitments, Guarantees, Indemnifications, and Legal Proceedings, and Note 13, DerivativeInstruments and Hedging Activities, respectively, of the Notes to Consolidated Financial Statements in “Part II,Item 8. Financial Statements and Supplementary Data” of this Form 10-K.
On February 26, 2015, PCA announced an increase of its quarterly cash dividend on its common stock froman annual payout of $1.60 per share to an annual payout of $2.20 per share. The first quarterly dividend of$0.55 per share will be paid on April 15, 2015 to shareholders of record as of March 13, 2015.
28

2013
In 2013, financing activities provided $786.8 million, while we used $245.6 million for financing activitiesin 2012. The change was due primarily to activities related to financing the acquisition of Boise, as describedabove. We paid $109.1 million of dividends and we repurchased $7.8 million of common stock in 2013,compared with $117.8 million of dividends paid and $45.2 million of common stock repurchases in 2012. Thehigher dividends paid in 2012 resulted from accelerating the dividends that would have been paid in January2013 to December 2012, offset partially by increases in dividends during 2013. Beginning in 2013, we beganwithholding shares from vesting equity awards to cover employee tax liabilities, which amounted to$11.0 million. In 2012, we also paid $65.5 million to settle treasury locks.
Commitments
Contractual Obligations
The table below sets forth our enforceable and legally binding obligations as of December 31, 2014, for thecategories described below. Some of the amounts included in the table are based on management’s estimates andassumptions about these obligations, including their duration, the possibility of renewal, anticipated actions bythird parties, and other factors. Because these estimates and assumptions are necessarily subjective, our actualpayments may vary from those reflected in the table. Purchase orders made in the ordinary course of business areexcluded from the table below. Any amounts for which we are liable under purchase orders are reflected on theConsolidated Balance Sheets as accounts payable and accrued liabilities (dollars in millions):
Payments Due by Period
TotalLess Than
1 Year1-3
Years3-5
YearsMore Than
5 Years
Term loan, due October 2018 . . . . . . . . . . . . . . . . . . . . . . . . $ 65.0 $ — $ — $ 65.0 $ —Term loan, due October 2020 . . . . . . . . . . . . . . . . . . . . . . . . 643.5 6.5 13.0 13.0 611.06.50% Senior Notes, due March 2018 . . . . . . . . . . . . . . . . . . 150.0 — — 150.0 —3.90% Senior Notes, due June 2022 . . . . . . . . . . . . . . . . . . . 400.0 — — — 400.04.50% Senior notes, due November 2023 . . . . . . . . . . . . . . . 700.0 — — — 700.03.65% Senior notes, due September 2024 . . . . . . . . . . . . . . . 400.0 — — — 400.0
Total short-term and long-term debt(a) . . . . . . . . . . . . . 2,358.5 6.5 13.0 228.0 2,111.0Interest on long-term debt(b) . . . . . . . . . . . . . . . . . . . . . . . . . 638.8 84.6 168.8 148.9 236.5Capital lease obligations, including interest . . . . . . . . . . . . . 36.5 2.7 5.4 5.4 23.0Operating leases(c) . . . . . . . . . . . . . . . . . . . . . . . . . . . . . . . . 274.3 58.9 86.7 49.8 78.9Capital commitments . . . . . . . . . . . . . . . . . . . . . . . . . . . . . . . 94.7 94.7 — — —Purchase commitments:
Raw materials(d) . . . . . . . . . . . . . . . . . . . . . . . . . . . . . . . . 94.9 47.3 22.2 16.0 9.4Energy related(e) . . . . . . . . . . . . . . . . . . . . . . . . . . . . . . . . 47.3 39.5 7.8 — —
Other long-term liabilities reflected on our ConsolidatedBalance Sheet(f):Compensation and benefits(g) . . . . . . . . . . . . . . . . . . . . . . 368.0 6.3 48.0 58.2 255.5Other(h)(i) . . . . . . . . . . . . . . . . . . . . . . . . . . . . . . . . . . . . . 70.8 3.2 10.0 7.6 50.0
$3,983.8 $343.7 $361.9 $513.9 $2,764.3
(a) The table assumes our long-term debt is held to maturity and includes the current portion of long-term debt.See Note 10, Debt, of the Notes to Consolidated Financial Statements in “Part II, Item 8. FinancialStatements and Supplementary Data” of this Form 10-K. Amounts are reported gross and do not includeunamortized debt discounts of $3.1 million at December 31, 2014.
(b) Amounts represent estimated future interest payments as of December 31, 2014, assuming our long-termdebt is held to maturity and using interest rates in effect at December 31, 2014. See “Item 7A. Quantitativeand Qualitative Disclosures About Market Risk” for the impact of changes in interest rates on PCA’s futurecash flows.
29

(c) We enter into operating leases in the normal course of business. We lease some of our operating facilities, aswell as other property and equipment, under operating leases. Some lease agreements provide us with theoption to renew the lease or purchase the leased property. Our operating lease obligations would change ifwe exercised these renewal options and/or if we entered into additional operating lease agreements.
(d) Included among our raw materials purchase obligations are contracts to purchase approximately$84.4 million of wood fiber. Purchase prices under most of these agreements are set quarterly orsemiannually based on regional market prices, and the estimate is based on contract terms or first quarter2015 pricing. Except for deposits required pursuant to wood supply contracts, these obligations are notrecorded in our consolidated financial statements until contract payment terms take effect. Under most ofthese log, fiber, and wood chip supply agreements, we have the right to cancel or reduce our commitmentsin the event of a mill curtailment or shutdown. Our log, fiber, and wood chip obligations are subject tochange based on, among other things, the effect of governmental laws and regulations, our manufacturingoperations not operating in the normal course of business, log and fiber availability, and the status ofenvironmental appeals.
(e) We enter into utility contracts for the purchase of electricity and natural gas. We also purchase theseservices under utility tariffs. The contractual and tariff arrangements include multiple-year commitmentsand minimum annual purchase requirements. Our payment obligations were based upon prices in effect onDecember 31, 2014, or contract language, if available.
(f) Long-term deferred income taxes of $409.9 million and unrecognized tax benefits of $4.8 million, includinginterest and penalties, are excluded from this table, because the timing of their future cash outflows areuncertain.
(g) Amounts primarily consist of pension and postretirement obligations, including current portion of$6.3 million. We have no required minimum qualified pension contributions in 2015. Actuariallydetermined liabilities related to pension benefits are recorded based on estimates and assumptions. Keyfactors used in developing estimates of these liabilities include assumptions related to discount rates,retirement and mortality rates, expected contributions, and other factors. Changes in estimates andassumptions related to the measurement of funded status could have a material impact on the amountreported. In the table above, we allocated our pension obligations by year based on the future requiredminimum pension contributions, as determined by our actuaries. See Note 11, Employee Benefit Plans andOther Postretirement Benefits, of the Notes to Consolidated Financial Statements in “Part II, Item 8.Financial Statements and Supplementary Data” of this Form 10-K, for additional information.
(h) Includes current liabilities of $2.9 million related primarily to the current portion of workers’ compensationliability.
(i) We have excluded $0.4 million of noncurrent deferred lease costs and unfavorable lease liabilities from theother long-term liabilities in the table above. These amounts have been excluded because deferred leasecosts relate to operating leases which are already reflected in the operating lease category in the table, andunfavorable lease liabilities do not represent a contractual obligation which will be settled in cash.
Off-Balance-Sheet Arrangements
The Company does not have any off-balance sheet arrangements as of December 31, 2014.
Inflation and Other General Cost Increases
We are subject to both contractual, inflation, and other general cost increases. If we are unable to offsetthese cost increases by price increases, growth, and/or cost reductions in our operations, these inflation and othergeneral cost increases could have a material adverse effect of our operating cash flows, profitability, andliquidity.
30

In 2014, our total company costs including cost of sales (COS) and selling, general, and administrativeexpenses (SG&A) was $5.1 billion, and excluding non-cash costs (depreciation, pension, and share-basedcompensation expense) was $4.7 billion. A 1% increase in COS and SG&A costs would increase costs by$51 million and cash costs by $47 million.
Certain items of product input costs have historically been subject to more cost volatility including fiber,purchased energy, and chemicals.
Energy
In 2014, our mills, including both packaging and paper mills, consumed about 88 million MMBTU’s offuel, including internally generated and externally purchased, to produce both steam and electricity. Thefollowing table for 2014 provides the total MMBTU’s purchased externally by fuel type each quarter and theaverage cost per MMBTU by fuel type for the year. Our mills represent about 90% of our total purchased fuelcosts. The cost per MMBTU includes the cost of the fuel plus our transportation and delivery costs.
2014 Fuel Purchased (millions of MMBTU’s)2014Avg.
Fuel TypeFirst
QuarterSecondQuarter
ThirdQuarter
FourthQuarter
FullYear
Cost /MMBTU
Natural gas . . . . . . . . . . . . . . . . . . . . . . . . . . . . . . . . . . . . 4.86 3.85 4.08 4.44 17.23 $5.17Purchased bark . . . . . . . . . . . . . . . . . . . . . . . . . . . . . . . . . 2.93 3.06 2.78 3.34 12.11 $2.75Coal . . . . . . . . . . . . . . . . . . . . . . . . . . . . . . . . . . . . . . . . . . 1.01 0.85 0.65 0.83 3.34 $4.01Other fuels . . . . . . . . . . . . . . . . . . . . . . . . . . . . . . . . . . . . . 0.46 0.48 0.44 0.56 1.94 $3.17
Total mills . . . . . . . . . . . . . . . . . . . . . . . . . . . . . . . . . . . . . 9.26 8.24 7.95 9.17 34.62 $4.10
In addition, the mills purchased 24.83 million CkWh (hundred kilowatt hours) of purchased electricity in2014. The purchases by quarter and the average cost per CkWh were as follows:
2014 Purchased Electricity (millions of CkWh)2014Avg.
FirstQuarter
SecondQuarter
ThirdQuarter
FourthQuarter
FullYear
Cost /CkWh
Purchased electricity . . . . . . . . . . . . . . . . . . . . . . . . . . . . . . . 6.33 6.34 6.69 5.47 24.83 $5.58
Environmental Matters
Environmental compliance requirements are a significant factor affecting our business. We employprocesses in the manufacture of containerboard, paper, and pulp which result in various discharges, emissionsand waste disposal. These processes are subject to numerous federal, state, local and foreign environmental lawsand regulations. We operate and expect to continue to operate, under environmental permits and similarauthorizations from various governmental authorities that regulate such discharges, emissions, and wastedisposal. The most significant of these laws affecting the Company are:
• Resource Conservation and Recovery Act (RCRA);
• Clean Water Act (CWA);
• Clean Air Act (CAA);
• The Emergency Planning and Community Right-to-Know-Act (EPCRA);
• Toxic Substance Control Act (TSCA); and
• Safe Drinking Water Act (SDWA).
31
We believe that we are currently in material compliance with these and all applicable environmental rulesand regulations. Because environmental regulations are constantly evolving, the Company has incurred, and willcontinue to incur, costs to maintain compliance with these and other environmental laws. The Company worksdiligently to anticipate and budget for the impact of applicable environmental regulations, and does not currentlyexpect that future environmental compliance obligations will materially affect its business or financial condition.For the years ended December 31, 2014, 2013, and 2012, we spent $43.9 million, $41.1 million, and $25.8million, respectively, to comply with the requirements of these and other environmental laws.
As is the case with any industrial operation, PCA has, in the past, incurred costs associated with theremediation of soil or groundwater contamination, as required by the federal Comprehensive EnvironmentalResponse, Compensation and Liability Act, commonly known as the federal “Superfund” law, and analogousstate laws. Cleanup requirements arise with respect to properties the Company currently owns or operates, formerfacilities and off-site facilities where the Company has disposed of hazardous substances. As part of the sale toPCA of the containerboard and corrugated products business of Pactiv Corporation in April 1999, Pactiv agreedto retain all liability for all former facilities and all sites associated with pre-closing off-site waste disposal.Pactiv also retained environmentally impaired real property in Filer City, Michigan unrelated to current milloperations. In addition, OfficeMax (now an indirect, wholly owned subsidiary of Office Depot) retainsresponsibility for certain environmental liabilities related to some of the businesses, facilities, and assets weacquired from Boise. Generally, this responsibility relates to hazardous substance releases and otherenvironmental incidents that arose before 2004. Some of these liabilities could be significant; however,OfficeMax may not have sufficient funds to satisfy its indemnification obligations, and in some cases, we maynot be entitled to such indemnification.
In January 2013, the U.S. Environmental Protection Agency (the “EPA”) established a three year deadlinefor compliance with the Boiler MACT regulations, establishing air emissions standards and certain otherrequirements for industrial boilers. States are authorized to extend the deadline an additional year if they so elect.PCA is currently assessing the impact of these regulations, which are expected to require modifications to orreplacement of certain of PCA’s boilers. PCA currently estimates that compliance with the final rule will requirecapital expenditures of up to $16 million in 2015. Due to the complexity of these regulations, and the potentialfor additional future regulatory or judicial modification to these regulations, this estimate is subject to furtherrevisions. We currently expect other environmental capital expenditures of about $5.0 million in 2015. Totalcapital expenditures for environmental matters were $29.0 million in 2014, $6.2 million in 2013, and$1.8 million for 2012.
Because liability for remediation costs under environmental laws is strict, meaning that liability is imposedwithout fault, joint and several, meaning that liability is imposed on each party without regard to contribution,and retroactive, PCA could receive notifications of cleanup liability in the future and this liability could bematerial. From 1994 through 2014, remediation costs at PCA’s mills and corrugated plants totaled approximately$3.2 million and the acquired Boise locations have not incurred any significant remediation costs since BoiseInc.’s inception in 2008. As of December 31, 2014, we maintained an environmental reserve of $35.4 millionrelating to on-site landfills and surface impoundments as well as ongoing and anticipated remedial projects. TheCompany believes that it is not reasonably possible that future environmental expenses above the $35.4 millionaccrued at December 31, 2014, will have a material impact on its financial condition, results of operations, andcash flows.
While legislation regarding the regulation of greenhouse gas emissions has been proposed at the federallevel, it is uncertain whether such legislation will be passed and, if so, what the breadth and scope of suchlegislation will be. The result of the regulation of greenhouse gas emissions could be an increase in our futureenvironmental compliance costs, through caps, taxes or additional capital expenditures to modify facilities, whichmay be material. However, climate change legislation and the resulting future energy policy could also provideus with opportunities if the use of renewable energy is encouraged. We currently self-generate a significantportion of our power requirements at our mills using bark, black liquor and biomass as fuel, which are derived
32

from renewable resources. While we believe we are well-positioned to take advantage of any renewable energyincentives, it is uncertain what the ultimate costs and opportunities of any climate change legislation will be andhow our business and industry will be affected.
Critical Accounting Policies and Estimates
Management’s discussion and analysis of financial condition and results of operations are based upon theCompany’s consolidated financial statements, which have been prepared in accordance with accountingprinciples generally accepted in the United States of America. The preparation of these financial statementsrequires us to make estimates and judgments that affect the reported amounts of assets, liabilities, revenues andexpenses, and related disclosures of contingent assets and liabilities. On an ongoing basis, PCA evaluates itsestimates, including those related to business combinations, goodwill and intangible assets, pensions and otherpostretirement benefits, environmental liabilities, income taxes, and long-lived asset impairment, among others.PCA bases its estimates on historical experience and on various other assumptions that are believed to bereasonable under the circumstances, the results of which form the basis for making judgments about the carryingvalues of assets and liabilities that are not readily apparent from other sources. Actual results may differ fromthese estimates under different assumptions or conditions.
Critical accounting estimates are those that are most important to the portrayal of our financial condition andresults. These estimates require management’s most difficult, subjective, or complex judgments. We review thedevelopment, selection, and disclosure of our critical accounting estimates with the Audit Committee of ourboard of directors. The Company believes that of its significant accounting policies, the following involve ahigher degree of judgment and/or complexity:
Pensions
The Company accounts for defined benefit pension plans in accordance with Accounting StandardsCodification (ASC) 715, “Compensation — Retirement Benefits.” The calculation of pension expense andpension liabilities requires decisions about a number of key assumptions that can significantly affect expense andliability amounts, including discount rates, expected return on plan assets, expected rate of compensationincreases, longevity and service lives of participants, expected contributions, and other factors. The pensionassumptions used to measure pension expense and liabilities are discussed in Note 11, Employee Benefit Plansand Other Postretirement Benefits.
We recognize the funded status of our pension plans on our Consolidated Balance Sheet and recognize theactuarial and experience gains and losses and the prior service costs and credits as a component of “AccumulatedOther Comprehensive Loss” in our Consolidated Statement of Changes in Stockholders’ Equity. Actual resultsthat differ from assumptions are accumulated and amortized over future periods and, therefore, generally affectrecognized expense in future periods. At December 31, 2014, we had approximately $126.1 million of actuariallosses recorded in “Accumulated other comprehensive loss, net of tax” on our Consolidated Balance Sheet.Accumulated losses in excess of 10% of the greater of the projected benefit obligation or the market-relatedvalue of assets will be recognized on a straight-line basis over the average remaining service period of activeemployees, which is between seven to ten years, to the extent that losses are not offset by gains in subsequentyears. While we believe that the assumptions used to measure our pension obligations are reasonable, differencesin actual experience or changes in assumptions may materially affect our pension obligations and future expense.
33

We believe that the accounting estimate related to pensions is a critical accounting estimate because it ishighly susceptible to change from period to period. As discussed above, the future effects of pension plans on ourfinancial position and results of operations will depend on economic conditions, employee demographics,mortality rates, retirement rates, investment performance, and funding decisions, among other factors. Thefollowing table presents selected assumptions used and expected to be used in the measurement of pensionexpense in the following periods (dollars in millions):
Year EndingDecember 31,
2015
Year Ended December 31
2014 2013
Pension expense . . . . . . . . . . . . . . . . . . . . . . . . . . . . . . . . . . . . . $30.5 $25.3 $46.4
AssumptionsDiscount rate . . . . . . . . . . . . . . . . . . . . . . . . . . . . . . . . . . . . . . . 4.14% 5.00% 4.57%Expected rate of return on plan assets . . . . . . . . . . . . . . . . . . . . 6.73% 6.69% 6.53%
A change of 0.25% in either direction to the discount rate or the expected rate of return on plan assets wouldhave had the following effect on 2014 and 2015 pension expense (dollars in millions):
Base Expense
Increase (Decrease) in PensionExpense(a)
0.25% Increase 0.25% Decrease
2014 ExpenseDiscount rate . . . . . . . . . . . . . . . . . . . . . . . . . . . . . . . . $25.3 $(0.8) $1.9Expected rate of return on plan assets . . . . . . . . . . . . . 25.3 (1.9) 1.9
2015 ExpenseDiscount rate . . . . . . . . . . . . . . . . . . . . . . . . . . . . . . . . $30.5 $(2.9) $3.7Expected rate of return on plan assets . . . . . . . . . . . . . 30.5 (2.0) 2.0
(a) The sensitivities shown above are specific to 2014 and 2015. The sensitivities may not be additive, so theimpact of changing multiple factors simultaneously cannot be calculated by combining the individualsensitivities shown.
For more information related to our pensions benefit plans, see Note 11, Employee Benefit Plans and OtherPostretirement Benefits, of the Notes to Consolidated Financial Statements in “Part II, Item 8. FinancialStatements and Supplementary Data” of this Form 10-K.
Goodwill and Intangible Asset Impairment
Goodwill represents the excess of the cost of an acquired business over the fair value of the identifiabletangible and intangible assets acquired and liabilities assumed in a business combination. At December 31, 2014,we had $546.8 million of goodwill, of which we recorded $458.6 million in connection with the acquisition ofBoise in fourth quarter 2013. At December 31, 2014, we had $491.6 million and $55.2 million of goodwillrecorded in our Packaging and Paper segments, respectively. All of our intangible assets are amortized over theirestimated useful lives.
We maintain two reporting units for purposes of our goodwill and intangible asset impairment testing,Packaging and Paper, which are the same as our operating segments discussed in Note 18, Segment Information,of the Notes to Consolidated Financial Statements in “Part II, Item 8. Financial Statements and SupplementaryData” of this Form 10-K. We test goodwill for impairment annually in the fourth quarter or sooner if events orchanges in circumstances indicate that the carrying value of the asset may exceed fair value.
In conducting our goodwill impairment analysis, we utilize the income approach, based on a discountedcash flow model (Level 3 measurement). The fair value was also calculated using the market approach basedprimarily on comparable company EBITDA multiples (Level 2 measurement) and was compared to and
34

supported the fair value based upon the discounted cash flow approach. We believe that the discounted cash flowmodel captures our estimates regarding the results of our future prospects; however, we also considered themarket’s expectations based on observable market information. The discounted cash flow model estimates theprojected future cash flows to be generated by our reporting units, discounted to present value using a discountrate for a potential market participant. The market approach estimates fair value based on multiples of EBITDA.The following assumptions are key to our estimates of fair value:
Business Projections. The discounted cash flow model utilizes business projections that are developedinternally by management for use in managing the business. These projections include significant assumptionssuch as estimates of future revenues, profits, income taxes, and capital expenditures. Our forecasts take intoconsideration recent sales data for existing products, planned timing of capital projects, and key economicindicators to estimate future production volumes, selling prices, and key input costs for our manufacturedproducts. Our pricing assumptions are estimated based upon an assessment of industry supply and demanddynamics for our major products.
Growth Rates. A growth rate is used to calculate the terminal value in the discounted cash flow model.The growth rate is the expected rate at which earnings or revenue is projected to grow beyond the forecast period.
Discount Rates. Future cash flows are discounted at a rate that is consistent with a weighted average costof capital for a potential market participant. The weighted average cost of capital is an estimate of the overallafter-tax rate of return required by equity and debt holders of a business enterprise. The discount rates selectedare based on existing conditions within our industry and reflect adjustments for potential risk premiums in thosemarkets as well as weighting of the market cost of equity versus debt.
EBITDA Multiples. The market approach requires the use of a valuation multiple to calculate the estimatedfair value of a reporting unit. We use an EBITDA multiple based on a selection of comparable companies andrecent acquisition transactions within our industries.
Based on the results of the first step of the goodwill impairment test, we determined that the fair value ofour Packaging and Paper reporting units were substantially in excess of the carrying amount, and therefore, nogoodwill impairment existed. As a result, the second step of the goodwill impairment test was not required to becompleted.
If management’s estimates of future operating results materially change or if there are changes to otherassumptions, the estimated fair value of our identifiable intangible assets and goodwill could changesignificantly. Such change could result in impairment charges in future periods, which could have a significantnoncash impact on our operating results and financial condition. We cannot predict the occurrence of futureevents that might adversely affect the reported value of our goodwill and intangible assets. As additionalinformation becomes known, we may change our estimates.
Long-Lived Asset Impairment
An impairment of a long-lived asset exists when the carrying value of an asset is not recoverable throughfuture undiscounted cash flows from operations and when the carrying value of the asset exceeds its fair value.Long-lived asset impairment is a critical accounting estimate, as it is susceptible to change from period to period.
We review the carrying value of long-lived assets for impairment when events or changes in circumstancesindicate that the carrying amount of assets may not be recoverable. For purposes of testing for impairment, wegroup our long-lived assets at the lowest level for which identifiable cash flows are largely independent of thecash flows from other assets and liabilities. Our asset groupings vary based on the related business in which thelong-lived asset is employed and the interrelationship between those long-lived assets in producing net cashflows. Asset groupings could change in the future if changes in the operations of the business or businessenvironment affect the way particular long-lived assets are employed or the interrelationships between assets. To
35
estimate whether the carrying value of an asset or asset group is impaired, we estimate the undiscounted cashflows that could be generated under a range of possible outcomes. To measure future cash flows, we are requiredto make assumptions about future production volumes, future product pricing, and future expenses to be incurred.In addition, estimates of future cash flows may change based on the availability of fiber, environmentalrequirements, capital spending, and other strategic management decisions. We estimate the fair value of an assetor asset group based on quoted market prices for similar assets and liabilities or inputs that are observable eitherdirectly (Level 1 measurement) or indirectly (the amount for which the asset(s) could be bought or sold in acurrent transaction with a third party) when available (Level 2 measurement). When quoted market prices are notavailable, we use a discounted cash flow model to estimate fair value (Level 3 measurement).
We periodically assess the estimated useful lives of our assets. Changes in circumstances, such as changesto our operational or capital strategy, changes in regulation, or technological advances, may result in the actualuseful lives differing from our estimates. Revisions to the estimated useful lives of assets requires judgment andconstitutes a change in accounting estimate, which is accounted for prospectively by adjusting or acceleratingdepreciation and amortization rates. During the year ended December 31, 2014, we recognized $42.0 million ofaccelerated depreciation expense related to shortening the useful lives of assets at the DeRidder, Louisiana, mill,which primarily related to the newsprint business we exited in 2014.
Income Taxes
We account for income taxes and separately recognize deferred tax assets and deferred tax liabilities. Weare subject to income taxes in both the U.S. and foreign jurisdictions. Significant judgments and estimates arerequired in determining the consolidated income tax expense and our tax basis in assets and liabilities.
PCA’s annual tax rate is determined based on income, statutory tax rates and the tax impacts of itemstreated differently for tax purposes than for financial reporting purposes. Tax law requires some items to beincluded in the tax return at different times than the items reflected in the financial statements. As a result, theannual tax rate in the financial statements is different than the rate reported on PCA’s tax return. Some of thesedifferences are permanent, such as expenses that are not deductible in the tax return, and some differences aretemporary, reversing over time, such as depreciation expense. These temporary differences create deferred taxassets and liabilities. We also recognize only the impact of tax positions that, based on their technical merits, aremore likely than not to be sustained upon an audit by the taxing authority.
Inherent in determining the annual tax rate are judgments regarding business plans, planning opportunities,and expectations about future outcomes. Significant management judgments are required for the following items:
• Management reviews PCA’s deferred tax assets for realizability. Valuation allowances are establishedwhen management believes that it is more likely than not that some portion of the deferred tax assetswill not be realized. Changes in valuation allowances from period to period are included in the taxprovision.
• PCA establishes accruals for unrecognized tax benefits when, despite the belief that PCA’s tax returnpositions are fully supported, PCA believes that an uncertain tax position does not meet the recognitionthreshold of ASC 740, “Income Taxes.” The tax contingency accruals are adjusted in light of changingfacts and circumstances, such as the progress of tax audits, the expiration of the statute of limitationsfor the relevant taxing authority to examine a tax return, case law and emerging legislation. While it isdifficult to predict the final outcome or timing of resolution for any particular tax matter, PCA believesthat the accruals for unrecognized tax benefits at December 31, 2014, reflect the likely outcome ofknown tax contingencies as of such date in accordance with accounting for uncertainty in income taxesunder ASC 740.
The calculation of our tax liabilities involves dealing with uncertainties in the application of complex U.S.and foreign tax regulations, exposures from not filing in some jurisdictions, and transfer pricing exposures fromallocation of income between jurisdictions. It is inherently difficult and subjective to estimate uncertain tax
36

positions, because we have to determine the probability of various possible outcomes. We evaluate theseuncertain tax positions on a quarterly basis. This evaluation is based on factors including, but not limited to,changes in facts or circumstances, changes in tax law, effectively settled issues under audit, and new auditactivity. Such a change in recognition or measurement would result in the recognition of a tax benefit or anadditional charge to the tax provision.
New and Recently Adopted Accounting Standards
For a listing of our new and recently adopted accounting standards, see Note 2, Summary of SignificantAccounting Policies, of the Notes to Consolidated Financial Statements in “Part II, Item 8. Financial Statementsand Supplementary Data” of this Form 10-K.
Reconciliations of Non-GAAP Financial Measures to Reported Amounts
Income from operations and net income excluding special items are non-GAAP financial measures.Management excludes special items and uses non-GAAP measures to focus on PCA’s on-going operations andassess its operating performance and believes that it is useful to investors because it enables them to performmeaningful comparisons of past and present operating results. Any analysis of non-GAAP financial measuresshould be done in conjunction with results presented in accordance with GAAP. The non-GAAP measures arenot intended to be substitutes for GAAP financial measures and should not be used as such. Reconciliations ofthe non-GAAP measures to the most comparable measure reported in accordance with GAAP for the years endedDecember 31, 2014, 2013, and 2012, follow (in millions, except per share amounts):
Year Ended December 31
2014(a) 2013(a) 2012
Incomefrom
OperationsNet
Income
Incomefrom
OperationsNet
Income
Incomefrom
OperationsNet
Income
As reported in accordance with GAAP . . . . . . . . $702.7 $392.6 $481.9 $ 441.3 $437.6 $160.2Special items:
DeRidder restructuring(b) . . . . . . . . . . . . . . 65.8 42.1 — — — —Integration-related and other costs(c) . . . . . 18.4 12.7 17.4 11.0 — —Class action lawsuit settlement(d) . . . . . . . . 17.6 11.2 — — — —Alternative energy tax credits(e) . . . . . . . . . — — — (166.0) (95.5) 23.0Acquisition inventory step-up(f) . . . . . . . . . — — 21.5 13.6 — —Acquisition-related costs(g) . . . . . . . . . . . . — — 17.2 10.9 — —Acquisition-related financing costs(g) . . . . — — — 7.4 — —Pension curtailment charges(h) . . . . . . . . . . — — 10.9 7.0 — —Debt financing charges(i) . . . . . . . . . . . . . . — — — — — 16.0State income tax adjustments . . . . . . . . . . . — — — — — (3.4)Plant closure charges . . . . . . . . . . . . . . . . . . — — — — 2.0 1.4
Total special items . . . . . . . . . . . . . . . . . . . . . . . 101.8 66.0 67.0 (116.1) (93.5) 37.0
Excluding special items . . . . . . . . . . . . . . . . . . . $804.5 $458.6 $548.9 $ 325.2 $344.1 $197.2
(a) On October 25, 2013, we acquired Boise Inc. (Boise). Our financial results include Boise subsequent toacquisition.
(b) Includes $65.8 million of costs related primarily to the conversion of the No. 3 newsprint machine at ourDeRidder, Louisiana, mill to produce lightweight linerboard and corrugating medium, and our exit from thenewsprint business in September 2014.
(c) 2014 and 2013 include $18.4 million and $17.4 million, respectively, of Boise acquisition integration-related and other costs, primarily for severance, retention, travel, and professional fees. 2014 includes$1.5 million of expense related to the write-off of deferred financing costs in connection with the debtrefinancing recorded in “Interest expense, net”.
37

(d) Includes $17.6 million of costs for the settlement of the Kleen Products LLC v Packaging Corp. of Americaet al class action lawsuit recorded in “Other expense, net”. See Note 20, Commitments, Guarantees,Indemnifications, and Legal Proceedings, for more information.
(e) 2013 includes the reversal of $166.0 million of tax reserves related to alternative energy tax credits.Approximately $103.9 million of the reversal is due to the completion of the IRS audit of PCA’s Filer Citymill’s cellulosic biofuel tax credits and $62.1 million is from the reversal of a reserve for the taxability ofthe alternative energy tax credits acquired in the acquisition of Boise.
In first quarter 2012, PCA amended its 2009 tax return to reduce the gallons claimed as cellulosic biofuelproducer credits previously recorded as a tax benefit, and increase the gallons claimed for alternative energytax credits previously recorded as income. The increase in gallons claimed as alternative energy tax creditsresulted in income of $95.5 million, and the decrease in gallons claimed as cellulosic biofuel producercredits resulted in a decrease in tax benefits of $118.5 million, or a net charge of $23.0 million.
(f) Generally accepted accounting principles required us to value the inventory from the acquisition of Boise atfair value, which increased the value of the inventory by $21.5 million. This reduced the profit on the sale ofthe acquired inventory to that portion attributable to the selling effort. This step-up in value increasedexpenses by $21.5 million as the acquired inventory was sold and charged to cost of sales.
(g) Includes acquisition-related costs, primarily for professional fees related to transaction-advisory servicesand expenses related to financing the acquisition of Boise.
(h) Includes $10.9 million of non-cash pension curtailment charges related to pension plan changes in whichcertain hourly corrugated and containerboard mill employees will transition from a defined benefit pensionplan to a defined contribution 401k plan.
(i) Consists of charges related to the Company’s refinancing of debt completed in 2012, including theredemption premium, the charge to settle the treasury lock prior to its maturity, and other items.
The following table reconciles net income to EBITDA for the periods indicated (dollars in millions):
Year Ended December 31
2014 2013 2012 2011 2010
Net income . . . . . . . . . . . . . . . . . . . . . . . . . . . . . . . . . . . . . . . . . . $ 392.6 $441.3 $160.2 $158.8 $210.0Interest expense, net . . . . . . . . . . . . . . . . . . . . . . . . . . . . . . . . . . . 88.4 58.3 62.9 29.2 32.3Provision (benefit) for income taxes . . . . . . . . . . . . . . . . . . . . . . . 221.7 (17.7) 214.5 86.0 (49.4)Depreciation, amortization, and depletion . . . . . . . . . . . . . . . . . . 381.0 201.8 170.8 163.6 156.3
EBITDA(a) . . . . . . . . . . . . . . . . . . . . . . . . . . . . . . . . . . . . . . . . . . $1,083.7 $683.7 $608.4 $437.6 $349.2
Special items:DeRidder restructuring . . . . . . . . . . . . . . . . . . . . . . . . . . . . . $ 23.9 $ — $ — $ — $ —Integration-related and other costs . . . . . . . . . . . . . . . . . . . . 18.4 17.4 — — —Class action lawsuit settlement . . . . . . . . . . . . . . . . . . . . . . . 17.6 — — — —Acquisition inventory step-up . . . . . . . . . . . . . . . . . . . . . . . . — 21.5 — — —Acquisition-related costs . . . . . . . . . . . . . . . . . . . . . . . . . . . . — 17.2 — — —Pension curtailment charges . . . . . . . . . . . . . . . . . . . . . . . . . — 10.9 — — —Plant closure charges . . . . . . . . . . . . . . . . . . . . . . . . . . . . . . . — — 2.0 7.4 13.2Alternative energy tax credits . . . . . . . . . . . . . . . . . . . . . . . . — — (95.5) — 86.8Medical benefits reserve adjustment . . . . . . . . . . . . . . . . . . . — — — (1.6) —
EBITDA excluding special items(a) . . . . . . . . . . . . . . . . . . . . . . . $1,143.6 $750.7 $514.9 $443.4 $449.2
(a) EBITDA and EBITDA, excluding special items, are non-GAAP financial measures. We present thesemeasures because they provide a means to evaluate the performance of our segments and our company onan ongoing basis using the same measures that are used by our management and because these measures arefrequently used by investors and other interested parties in the evaluation of companies and the performanceof their segments. For each non-GAAP financial measure, we provide a reconciliation to the most directlycomparable financial measure presented in accordance with GAAP. These measures may differ from
38
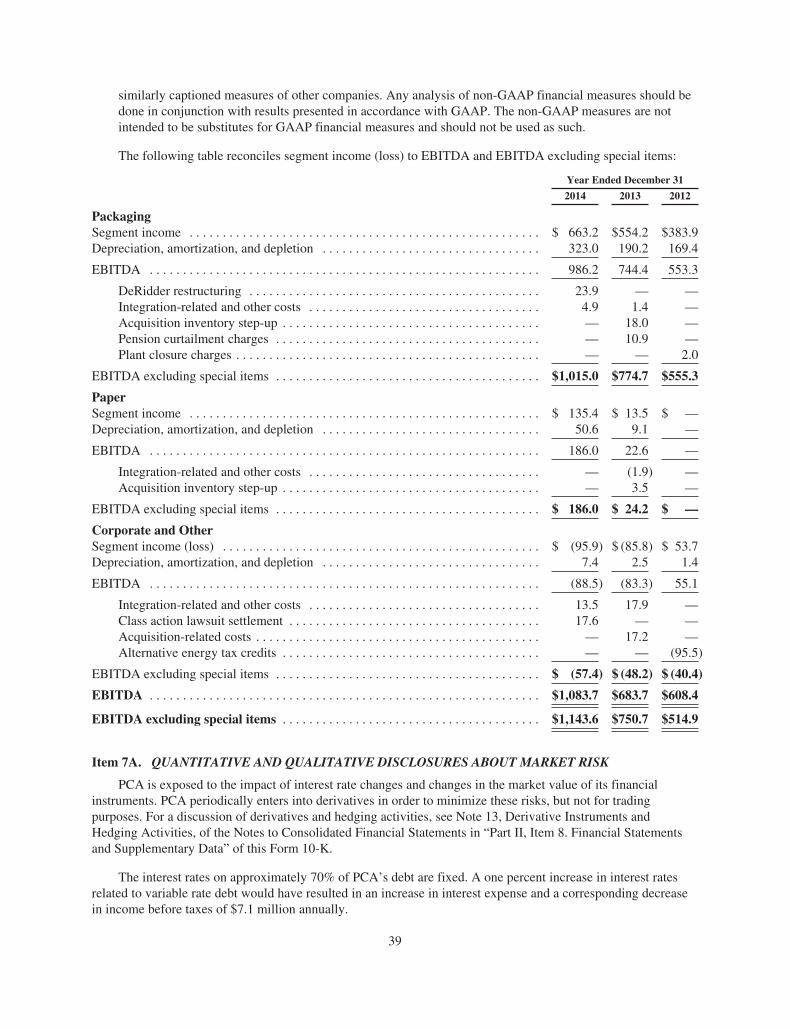
similarly captioned measures of other companies. Any analysis of non-GAAP financial measures should bedone in conjunction with results presented in accordance with GAAP. The non-GAAP measures are notintended to be substitutes for GAAP financial measures and should not be used as such.
The following table reconciles segment income (loss) to EBITDA and EBITDA excluding special items:
Year Ended December 31
2014 2013 2012
PackagingSegment income . . . . . . . . . . . . . . . . . . . . . . . . . . . . . . . . . . . . . . . . . . . . . . . . . . . . . $ 663.2 $554.2 $383.9Depreciation, amortization, and depletion . . . . . . . . . . . . . . . . . . . . . . . . . . . . . . . . . 323.0 190.2 169.4
EBITDA . . . . . . . . . . . . . . . . . . . . . . . . . . . . . . . . . . . . . . . . . . . . . . . . . . . . . . . . . . . 986.2 744.4 553.3
DeRidder restructuring . . . . . . . . . . . . . . . . . . . . . . . . . . . . . . . . . . . . . . . . . . . . 23.9 — —Integration-related and other costs . . . . . . . . . . . . . . . . . . . . . . . . . . . . . . . . . . . 4.9 1.4 —Acquisition inventory step-up . . . . . . . . . . . . . . . . . . . . . . . . . . . . . . . . . . . . . . . — 18.0 —Pension curtailment charges . . . . . . . . . . . . . . . . . . . . . . . . . . . . . . . . . . . . . . . . — 10.9 —Plant closure charges . . . . . . . . . . . . . . . . . . . . . . . . . . . . . . . . . . . . . . . . . . . . . . — — 2.0
EBITDA excluding special items . . . . . . . . . . . . . . . . . . . . . . . . . . . . . . . . . . . . . . . . $1,015.0 $774.7 $555.3
PaperSegment income . . . . . . . . . . . . . . . . . . . . . . . . . . . . . . . . . . . . . . . . . . . . . . . . . . . . . $ 135.4 $ 13.5 $ —Depreciation, amortization, and depletion . . . . . . . . . . . . . . . . . . . . . . . . . . . . . . . . . 50.6 9.1 —
EBITDA . . . . . . . . . . . . . . . . . . . . . . . . . . . . . . . . . . . . . . . . . . . . . . . . . . . . . . . . . . . 186.0 22.6 —
Integration-related and other costs . . . . . . . . . . . . . . . . . . . . . . . . . . . . . . . . . . . — (1.9) —Acquisition inventory step-up . . . . . . . . . . . . . . . . . . . . . . . . . . . . . . . . . . . . . . . — 3.5 —
EBITDA excluding special items . . . . . . . . . . . . . . . . . . . . . . . . . . . . . . . . . . . . . . . . $ 186.0 $ 24.2 $ —
Corporate and OtherSegment income (loss) . . . . . . . . . . . . . . . . . . . . . . . . . . . . . . . . . . . . . . . . . . . . . . . . $ (95.9) $ (85.8) $ 53.7Depreciation, amortization, and depletion . . . . . . . . . . . . . . . . . . . . . . . . . . . . . . . . . 7.4 2.5 1.4
EBITDA . . . . . . . . . . . . . . . . . . . . . . . . . . . . . . . . . . . . . . . . . . . . . . . . . . . . . . . . . . . (88.5) (83.3) 55.1
Integration-related and other costs . . . . . . . . . . . . . . . . . . . . . . . . . . . . . . . . . . . 13.5 17.9 —Class action lawsuit settlement . . . . . . . . . . . . . . . . . . . . . . . . . . . . . . . . . . . . . . 17.6 — —Acquisition-related costs . . . . . . . . . . . . . . . . . . . . . . . . . . . . . . . . . . . . . . . . . . . — 17.2 —Alternative energy tax credits . . . . . . . . . . . . . . . . . . . . . . . . . . . . . . . . . . . . . . . — — (95.5)
EBITDA excluding special items . . . . . . . . . . . . . . . . . . . . . . . . . . . . . . . . . . . . . . . . $ (57.4) $ (48.2) $ (40.4)
EBITDA . . . . . . . . . . . . . . . . . . . . . . . . . . . . . . . . . . . . . . . . . . . . . . . . . . . . . . . . . . . $1,083.7 $683.7 $608.4
EBITDA excluding special items . . . . . . . . . . . . . . . . . . . . . . . . . . . . . . . . . . . . . . . $1,143.6 $750.7 $514.9
Item 7A. QUANTITATIVE AND QUALITATIVE DISCLOSURES ABOUT MARKET RISK
PCA is exposed to the impact of interest rate changes and changes in the market value of its financialinstruments. PCA periodically enters into derivatives in order to minimize these risks, but not for tradingpurposes. For a discussion of derivatives and hedging activities, see Note 13, Derivative Instruments andHedging Activities, of the Notes to Consolidated Financial Statements in “Part II, Item 8. Financial Statementsand Supplementary Data” of this Form 10-K.
The interest rates on approximately 70% of PCA’s debt are fixed. A one percent increase in interest ratesrelated to variable rate debt would have resulted in an increase in interest expense and a corresponding decreasein income before taxes of $7.1 million annually.
39

Item 8. FINANCIAL STATEMENTS AND SUPPLEMENTARY DATA
INDEX TO FINANCIAL STATEMENTS
Packaging Corporation of America Consolidated Financial StatementsReports of Independent Registered Public Accounting Firms . . . . . . . . . . . . . . . . . . . . . . . . . . . . . . . . . . . . . . 41Consolidated Statements of Income and Comprehensive Income for the years ended December 31, 2014,
2013, and 2012 . . . . . . . . . . . . . . . . . . . . . . . . . . . . . . . . . . . . . . . . . . . . . . . . . . . . . . . . . . . . . . . . . . . . . . . . 44Consolidated Balance Sheets as of December 31, 2014 and 2013 . . . . . . . . . . . . . . . . . . . . . . . . . . . . . . . . . . . 45Consolidated Statements of Cash Flows for the years ended December 31, 2014, 2013, and 2012 . . . . . . . . . 46Consolidated Statement of Changes in Stockholders’ Equity for the years ended December 31, 2014, 2013,
and 2012 . . . . . . . . . . . . . . . . . . . . . . . . . . . . . . . . . . . . . . . . . . . . . . . . . . . . . . . . . . . . . . . . . . . . . . . . . . . . . 47Notes to Consolidated Financial Statements . . . . . . . . . . . . . . . . . . . . . . . . . . . . . . . . . . . . . . . . . . . . . . . . . . . . 48
40

REPORT OF INDEPENDENT REGISTERED PUBLIC ACCOUNTING FIRM
The Board of Directors and StockholdersPackaging Corporation of America:
We have audited the accompanying consolidated balance sheet of Packaging Corporation of Americaand subsidiaries as of December 31, 2014, and the related consolidated statements of income and comprehensiveincome, changes in stockholders’ equity, and cash flows for the year ended December 31, 2014. In connectionwith our audit of the consolidated financial statements, we also have audited financial statement ScheduleII — Valuation and Qualifying accounts. These consolidated financial statements and financial statementschedule are the responsibility of the Company’s management. Our responsibility is to express an opinion onthese consolidated financial statements and financial statement schedule based on our audit.
We conducted our audit in accordance with the standards of the Public Company Accounting Oversight Board(United States). Those standards require that we plan and perform the audit to obtain reasonable assurance aboutwhether the financial statements are free of material misstatement. An audit includes examining, on a test basis,evidence supporting the amounts and disclosures in the financial statements. An audit also includes assessing theaccounting principles used and significant estimates made by management, as well as evaluating the overallfinancial statement presentation. We believe that our audit provides a reasonable basis for our opinion.
In our opinion, the consolidated financial statements referred to above present fairly, in all material respects, thefinancial position of Packaging Corporation of America and subsidiaries as of December 31, 2014, and theresults of their operations and their cash flows for the year ended December 31, 2014, in conformity withU.S. generally accepted accounting principles. Also in our opinion, the related financial statement schedule,when considered in relation to the basic consolidated financial statements taken as a whole, presents fairly, in allmaterial respects, the information set forth therein.
We also have audited, in accordance with the standards of the Public Company Accounting Oversight Board(United States), Packaging Corporation of America’s internal control over financial reporting as of December 31,2014, based on the criteria established in Internal Control — Integrated Framework (2013) issued by theCommittee of Sponsoring Organizations of the Treadway Commission (COSO), and our report datedFebruary 27, 2015 expressed an unqualified opinion on the effectiveness of the Company’s internal control overfinancial reporting.
As discussed in Note 2 to the consolidated financial statements, the Company has elected to change its method ofaccounting for certain inventories in 2014.
/s/ KPMG LLP
Boise, IdahoFebruary 27, 2015
41

REPORT OF INDEPENDENT REGISTERED PUBLIC ACCOUNTING FIRM ON INTERNALCONTROL OVER FINANCIAL REPORTING
The Board of Directors and StockholdersPackaging Corporation of America:
We have audited Packaging Corporation of America’s internal control over financial reporting as ofDecember 31, 2014, based on criteria established in Internal Control — Integrated Framework (2013) issued bythe Committee of Sponsoring Organizations of the Treadway Commission (COSO). Packaging Corporation ofAmerica’s management is responsible for maintaining effective internal control over financial reporting and forits assessment of the effectiveness of internal control over financial reporting, included in the accompanyingmanagement’s report on internal control over financial reporting included in Item 9A. Our responsibility is toexpress an opinion on the Company’s internal control over financial reporting based on our audit.
We conducted our audit in accordance with the standards of the Public Company Accounting Oversight Board(United States). Those standards require that we plan and perform the audit to obtain reasonable assurance aboutwhether effective internal control over financial reporting was maintained in all material respects. Our auditincluded obtaining an understanding of internal control over financial reporting, assessing the risk that a materialweakness exists, and testing and evaluating the design and operating effectiveness of internal control based onthe assessed risk. Our audit also included performing such other procedures as we considered necessary in thecircumstances. We believe that our audit provides a reasonable basis for our opinion.
A company’s internal control over financial reporting is a process designed to provide reasonable assuranceregarding the reliability of financial reporting and the preparation of financial statements for external purposes inaccordance with generally accepted accounting principles. A company’s internal control over financial reportingincludes those policies and procedures that (1) pertain to the maintenance of records that, in reasonable detail,accurately and fairly reflect the transactions and dispositions of the assets of the company; (2) provide reasonableassurance that transactions are recorded as necessary to permit preparation of financial statements in accordancewith generally accepted accounting principles, and that receipts and expenditures of the company are being madeonly in accordance with authorizations of management and directors of the company; and (3) provide reasonableassurance regarding prevention or timely detection of unauthorized acquisition, use, or disposition of thecompany’s assets that could have a material effect on the financial statements.
Because of its inherent limitations, internal control over financial reporting may not prevent or detectmisstatements. Also, projections of any evaluation of effectiveness to future periods are subject to the risk thatcontrols may become inadequate because of changes in conditions, or that the degree of compliance with thepolicies or procedures may deteriorate.
In our opinion, Packaging Corporation of America maintained, in all material respects, effective internal controlover financial reporting as of December 31, 2014, based on criteria established in Internal Control — IntegratedFramework (2013) issued by the Committee of Sponsoring Organizations of the Treadway Commission (COSO).
We also have audited, in accordance with the standards of the Public Company Accounting Oversight Board(United States), the consolidated balance sheet of Packaging Corporation of America and subsidiaries as ofDecember 31, 2014, and the related consolidated statements of income and comprehensive income, changes instockholders’ equity, and cash flows for the year ended December 31, 2014, and our report dated February 27,2015 expressed an unqualified opinion on those consolidated financial statements.
/s/ KPMG LLP
Boise, IdahoFebruary 27, 2015
42
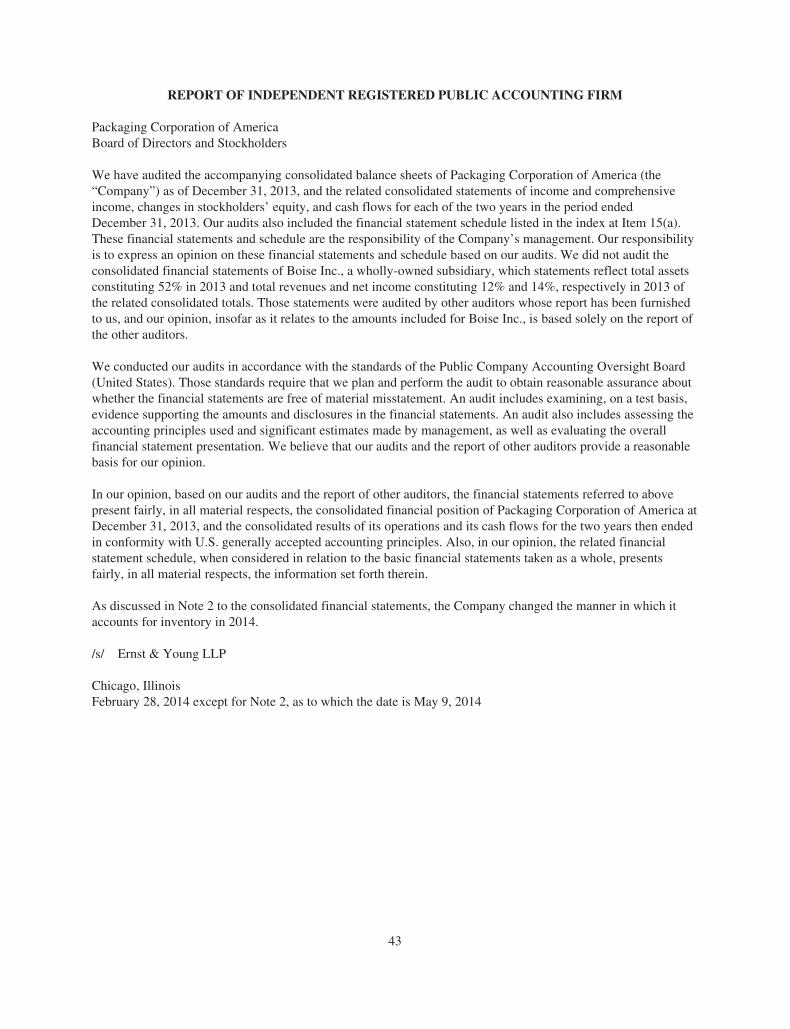
REPORT OF INDEPENDENT REGISTERED PUBLIC ACCOUNTING FIRM
Packaging Corporation of AmericaBoard of Directors and Stockholders
We have audited the accompanying consolidated balance sheets of Packaging Corporation of America (the“Company”) as of December 31, 2013, and the related consolidated statements of income and comprehensiveincome, changes in stockholders’ equity, and cash flows for each of the two years in the period endedDecember 31, 2013. Our audits also included the financial statement schedule listed in the index at Item 15(a).These financial statements and schedule are the responsibility of the Company’s management. Our responsibilityis to express an opinion on these financial statements and schedule based on our audits. We did not audit theconsolidated financial statements of Boise Inc., a wholly-owned subsidiary, which statements reflect total assetsconstituting 52% in 2013 and total revenues and net income constituting 12% and 14%, respectively in 2013 ofthe related consolidated totals. Those statements were audited by other auditors whose report has been furnishedto us, and our opinion, insofar as it relates to the amounts included for Boise Inc., is based solely on the report ofthe other auditors.
We conducted our audits in accordance with the standards of the Public Company Accounting Oversight Board(United States). Those standards require that we plan and perform the audit to obtain reasonable assurance aboutwhether the financial statements are free of material misstatement. An audit includes examining, on a test basis,evidence supporting the amounts and disclosures in the financial statements. An audit also includes assessing theaccounting principles used and significant estimates made by management, as well as evaluating the overallfinancial statement presentation. We believe that our audits and the report of other auditors provide a reasonablebasis for our opinion.
In our opinion, based on our audits and the report of other auditors, the financial statements referred to abovepresent fairly, in all material respects, the consolidated financial position of Packaging Corporation of America atDecember 31, 2013, and the consolidated results of its operations and its cash flows for the two years then endedin conformity with U.S. generally accepted accounting principles. Also, in our opinion, the related financialstatement schedule, when considered in relation to the basic financial statements taken as a whole, presentsfairly, in all material respects, the information set forth therein.
As discussed in Note 2 to the consolidated financial statements, the Company changed the manner in which itaccounts for inventory in 2014.
/s/ Ernst & Young LLP
Chicago, IllinoisFebruary 28, 2014 except for Note 2, as to which the date is May 9, 2014
43
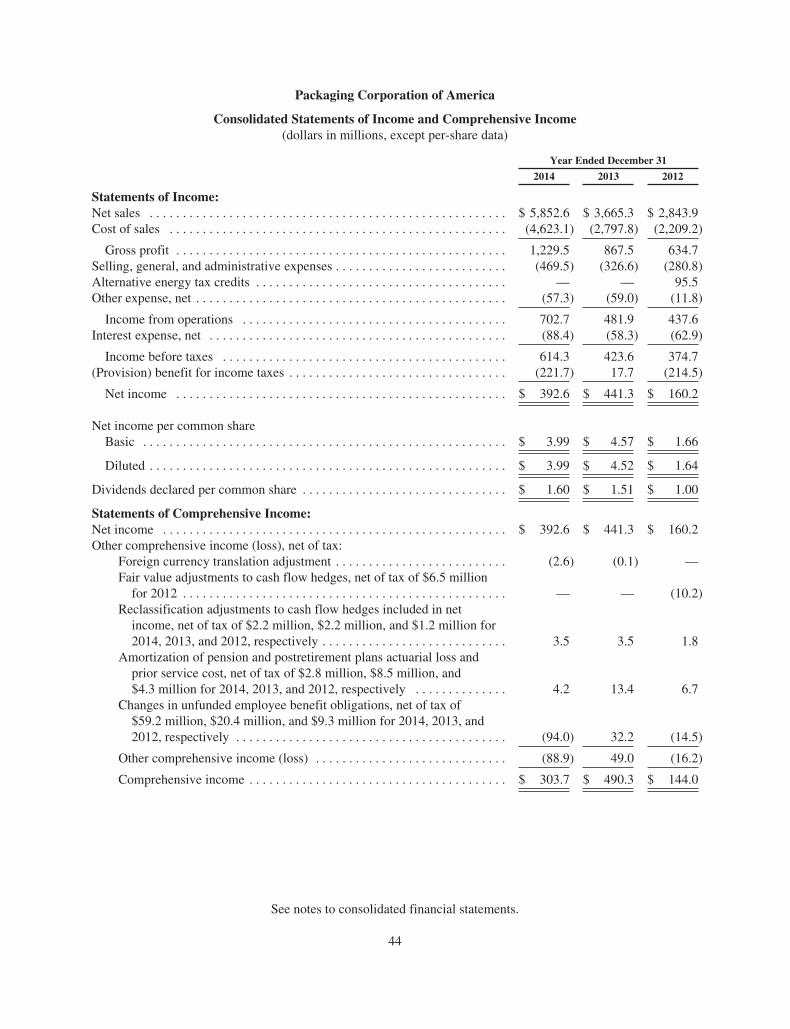
Packaging Corporation of America
Consolidated Statements of Income and Comprehensive Income(dollars in millions, except per-share data)
Year Ended December 31
2014 2013 2012
Statements of Income:Net sales . . . . . . . . . . . . . . . . . . . . . . . . . . . . . . . . . . . . . . . . . . . . . . . . . . . . . . $ 5,852.6 $ 3,665.3 $ 2,843.9Cost of sales . . . . . . . . . . . . . . . . . . . . . . . . . . . . . . . . . . . . . . . . . . . . . . . . . . . (4,623.1) (2,797.8) (2,209.2)
Gross profit . . . . . . . . . . . . . . . . . . . . . . . . . . . . . . . . . . . . . . . . . . . . . . . . . . 1,229.5 867.5 634.7Selling, general, and administrative expenses . . . . . . . . . . . . . . . . . . . . . . . . . . (469.5) (326.6) (280.8)Alternative energy tax credits . . . . . . . . . . . . . . . . . . . . . . . . . . . . . . . . . . . . . . — — 95.5Other expense, net . . . . . . . . . . . . . . . . . . . . . . . . . . . . . . . . . . . . . . . . . . . . . . . (57.3) (59.0) (11.8)
Income from operations . . . . . . . . . . . . . . . . . . . . . . . . . . . . . . . . . . . . . . . . 702.7 481.9 437.6Interest expense, net . . . . . . . . . . . . . . . . . . . . . . . . . . . . . . . . . . . . . . . . . . . . . (88.4) (58.3) (62.9)
Income before taxes . . . . . . . . . . . . . . . . . . . . . . . . . . . . . . . . . . . . . . . . . . . 614.3 423.6 374.7(Provision) benefit for income taxes . . . . . . . . . . . . . . . . . . . . . . . . . . . . . . . . . (221.7) 17.7 (214.5)
Net income . . . . . . . . . . . . . . . . . . . . . . . . . . . . . . . . . . . . . . . . . . . . . . . . . . $ 392.6 $ 441.3 $ 160.2
Net income per common shareBasic . . . . . . . . . . . . . . . . . . . . . . . . . . . . . . . . . . . . . . . . . . . . . . . . . . . . . . . $ 3.99 $ 4.57 $ 1.66
Diluted . . . . . . . . . . . . . . . . . . . . . . . . . . . . . . . . . . . . . . . . . . . . . . . . . . . . . . $ 3.99 $ 4.52 $ 1.64
Dividends declared per common share . . . . . . . . . . . . . . . . . . . . . . . . . . . . . . . $ 1.60 $ 1.51 $ 1.00
Statements of Comprehensive Income:Net income . . . . . . . . . . . . . . . . . . . . . . . . . . . . . . . . . . . . . . . . . . . . . . . . . . . . $ 392.6 $ 441.3 $ 160.2Other comprehensive income (loss), net of tax:
Foreign currency translation adjustment . . . . . . . . . . . . . . . . . . . . . . . . . . (2.6) (0.1) —Fair value adjustments to cash flow hedges, net of tax of $6.5 million
for 2012 . . . . . . . . . . . . . . . . . . . . . . . . . . . . . . . . . . . . . . . . . . . . . . . . . — — (10.2)Reclassification adjustments to cash flow hedges included in net
income, net of tax of $2.2 million, $2.2 million, and $1.2 million for2014, 2013, and 2012, respectively . . . . . . . . . . . . . . . . . . . . . . . . . . . . 3.5 3.5 1.8
Amortization of pension and postretirement plans actuarial loss andprior service cost, net of tax of $2.8 million, $8.5 million, and$4.3 million for 2014, 2013, and 2012, respectively . . . . . . . . . . . . . . 4.2 13.4 6.7
Changes in unfunded employee benefit obligations, net of tax of$59.2 million, $20.4 million, and $9.3 million for 2014, 2013, and2012, respectively . . . . . . . . . . . . . . . . . . . . . . . . . . . . . . . . . . . . . . . . . (94.0) 32.2 (14.5)
Other comprehensive income (loss) . . . . . . . . . . . . . . . . . . . . . . . . . . . . . (88.9) 49.0 (16.2)
Comprehensive income . . . . . . . . . . . . . . . . . . . . . . . . . . . . . . . . . . . . . . . $ 303.7 $ 490.3 $ 144.0
See notes to consolidated financial statements.
44
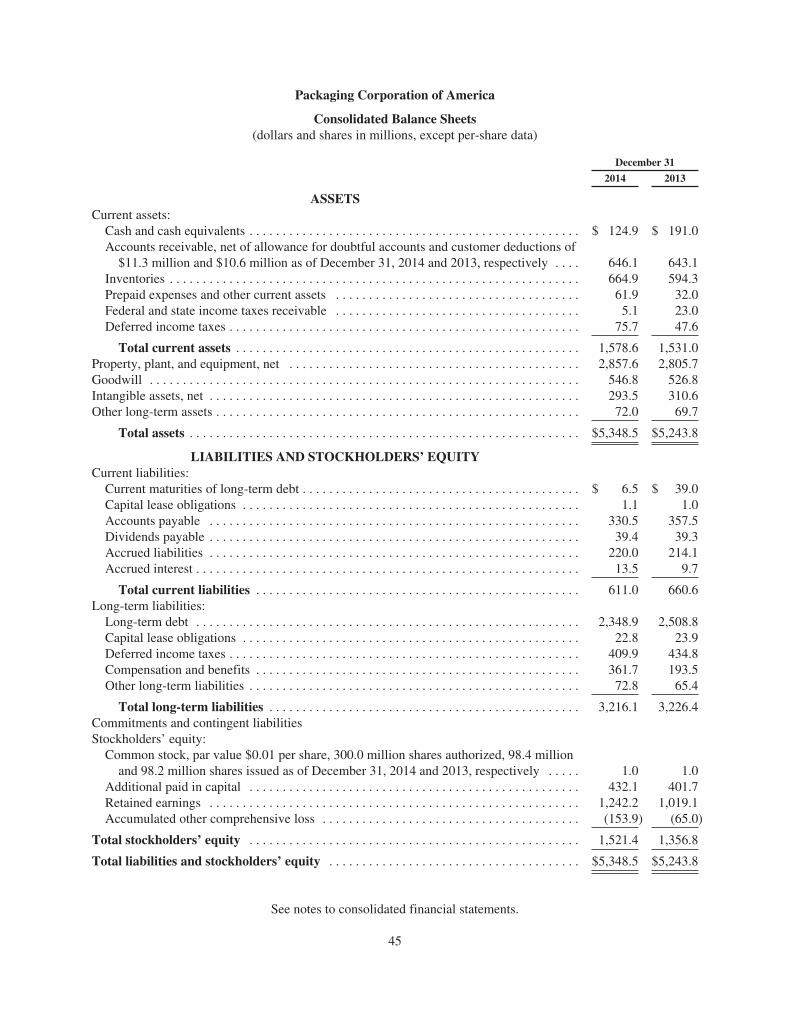
Packaging Corporation of America
Consolidated Balance Sheets(dollars and shares in millions, except per-share data)
December 31
2014 2013
ASSETSCurrent assets:
Cash and cash equivalents . . . . . . . . . . . . . . . . . . . . . . . . . . . . . . . . . . . . . . . . . . . . . . . . . . $ 124.9 $ 191.0Accounts receivable, net of allowance for doubtful accounts and customer deductions of
$11.3 million and $10.6 million as of December 31, 2014 and 2013, respectively . . . . 646.1 643.1Inventories . . . . . . . . . . . . . . . . . . . . . . . . . . . . . . . . . . . . . . . . . . . . . . . . . . . . . . . . . . . . . . 664.9 594.3Prepaid expenses and other current assets . . . . . . . . . . . . . . . . . . . . . . . . . . . . . . . . . . . . . 61.9 32.0Federal and state income taxes receivable . . . . . . . . . . . . . . . . . . . . . . . . . . . . . . . . . . . . . 5.1 23.0Deferred income taxes . . . . . . . . . . . . . . . . . . . . . . . . . . . . . . . . . . . . . . . . . . . . . . . . . . . . . 75.7 47.6
Total current assets . . . . . . . . . . . . . . . . . . . . . . . . . . . . . . . . . . . . . . . . . . . . . . . . . . . . 1,578.6 1,531.0Property, plant, and equipment, net . . . . . . . . . . . . . . . . . . . . . . . . . . . . . . . . . . . . . . . . . . . . 2,857.6 2,805.7Goodwill . . . . . . . . . . . . . . . . . . . . . . . . . . . . . . . . . . . . . . . . . . . . . . . . . . . . . . . . . . . . . . . . . 546.8 526.8Intangible assets, net . . . . . . . . . . . . . . . . . . . . . . . . . . . . . . . . . . . . . . . . . . . . . . . . . . . . . . . . 293.5 310.6Other long-term assets . . . . . . . . . . . . . . . . . . . . . . . . . . . . . . . . . . . . . . . . . . . . . . . . . . . . . . . 72.0 69.7
Total assets . . . . . . . . . . . . . . . . . . . . . . . . . . . . . . . . . . . . . . . . . . . . . . . . . . . . . . . . . . . $5,348.5 $5,243.8
LIABILITIES AND STOCKHOLDERS’ EQUITYCurrent liabilities:
Current maturities of long-term debt . . . . . . . . . . . . . . . . . . . . . . . . . . . . . . . . . . . . . . . . . . $ 6.5 $ 39.0Capital lease obligations . . . . . . . . . . . . . . . . . . . . . . . . . . . . . . . . . . . . . . . . . . . . . . . . . . . 1.1 1.0Accounts payable . . . . . . . . . . . . . . . . . . . . . . . . . . . . . . . . . . . . . . . . . . . . . . . . . . . . . . . . 330.5 357.5Dividends payable . . . . . . . . . . . . . . . . . . . . . . . . . . . . . . . . . . . . . . . . . . . . . . . . . . . . . . . . 39.4 39.3Accrued liabilities . . . . . . . . . . . . . . . . . . . . . . . . . . . . . . . . . . . . . . . . . . . . . . . . . . . . . . . . 220.0 214.1Accrued interest . . . . . . . . . . . . . . . . . . . . . . . . . . . . . . . . . . . . . . . . . . . . . . . . . . . . . . . . . . 13.5 9.7
Total current liabilities . . . . . . . . . . . . . . . . . . . . . . . . . . . . . . . . . . . . . . . . . . . . . . . . . 611.0 660.6Long-term liabilities:
Long-term debt . . . . . . . . . . . . . . . . . . . . . . . . . . . . . . . . . . . . . . . . . . . . . . . . . . . . . . . . . . 2,348.9 2,508.8Capital lease obligations . . . . . . . . . . . . . . . . . . . . . . . . . . . . . . . . . . . . . . . . . . . . . . . . . . . 22.8 23.9Deferred income taxes . . . . . . . . . . . . . . . . . . . . . . . . . . . . . . . . . . . . . . . . . . . . . . . . . . . . . 409.9 434.8Compensation and benefits . . . . . . . . . . . . . . . . . . . . . . . . . . . . . . . . . . . . . . . . . . . . . . . . . 361.7 193.5Other long-term liabilities . . . . . . . . . . . . . . . . . . . . . . . . . . . . . . . . . . . . . . . . . . . . . . . . . . 72.8 65.4
Total long-term liabilities . . . . . . . . . . . . . . . . . . . . . . . . . . . . . . . . . . . . . . . . . . . . . . . 3,216.1 3,226.4Commitments and contingent liabilitiesStockholders’ equity:
Common stock, par value $0.01 per share, 300.0 million shares authorized, 98.4 millionand 98.2 million shares issued as of December 31, 2014 and 2013, respectively . . . . . 1.0 1.0
Additional paid in capital . . . . . . . . . . . . . . . . . . . . . . . . . . . . . . . . . . . . . . . . . . . . . . . . . . 432.1 401.7Retained earnings . . . . . . . . . . . . . . . . . . . . . . . . . . . . . . . . . . . . . . . . . . . . . . . . . . . . . . . . 1,242.2 1,019.1Accumulated other comprehensive loss . . . . . . . . . . . . . . . . . . . . . . . . . . . . . . . . . . . . . . . (153.9) (65.0)
Total stockholders’ equity . . . . . . . . . . . . . . . . . . . . . . . . . . . . . . . . . . . . . . . . . . . . . . . . . . 1,521.4 1,356.8
Total liabilities and stockholders’ equity . . . . . . . . . . . . . . . . . . . . . . . . . . . . . . . . . . . . . . $5,348.5 $5,243.8
See notes to consolidated financial statements.
45
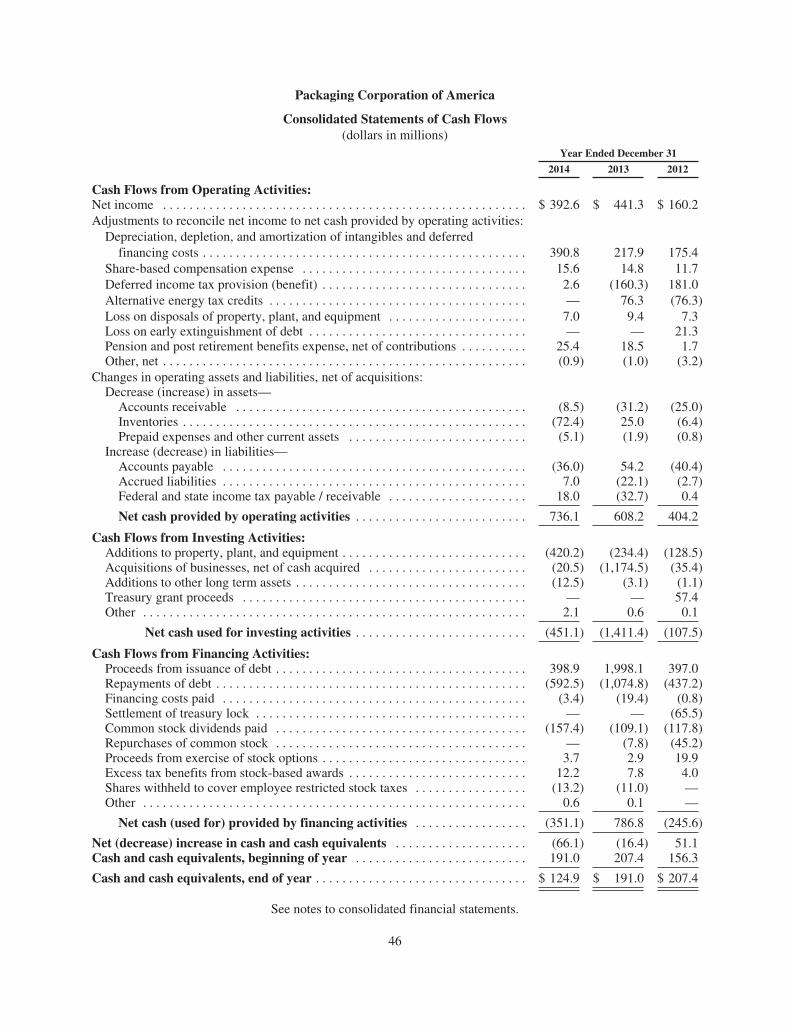
Packaging Corporation of America
Consolidated Statements of Cash Flows(dollars in millions)
Year Ended December 31
2014 2013 2012
Cash Flows from Operating Activities:Net income . . . . . . . . . . . . . . . . . . . . . . . . . . . . . . . . . . . . . . . . . . . . . . . . . . . . . . . $ 392.6 $ 441.3 $ 160.2Adjustments to reconcile net income to net cash provided by operating activities:
Depreciation, depletion, and amortization of intangibles and deferredfinancing costs . . . . . . . . . . . . . . . . . . . . . . . . . . . . . . . . . . . . . . . . . . . . . . . . . 390.8 217.9 175.4
Share-based compensation expense . . . . . . . . . . . . . . . . . . . . . . . . . . . . . . . . . . 15.6 14.8 11.7Deferred income tax provision (benefit) . . . . . . . . . . . . . . . . . . . . . . . . . . . . . . . 2.6 (160.3) 181.0Alternative energy tax credits . . . . . . . . . . . . . . . . . . . . . . . . . . . . . . . . . . . . . . . — 76.3 (76.3)Loss on disposals of property, plant, and equipment . . . . . . . . . . . . . . . . . . . . . 7.0 9.4 7.3Loss on early extinguishment of debt . . . . . . . . . . . . . . . . . . . . . . . . . . . . . . . . . — — 21.3Pension and post retirement benefits expense, net of contributions . . . . . . . . . . 25.4 18.5 1.7Other, net . . . . . . . . . . . . . . . . . . . . . . . . . . . . . . . . . . . . . . . . . . . . . . . . . . . . . . . (0.9) (1.0) (3.2)
Changes in operating assets and liabilities, net of acquisitions:Decrease (increase) in assets—
Accounts receivable . . . . . . . . . . . . . . . . . . . . . . . . . . . . . . . . . . . . . . . . . . . . (8.5) (31.2) (25.0)Inventories . . . . . . . . . . . . . . . . . . . . . . . . . . . . . . . . . . . . . . . . . . . . . . . . . . . . (72.4) 25.0 (6.4)Prepaid expenses and other current assets . . . . . . . . . . . . . . . . . . . . . . . . . . . (5.1) (1.9) (0.8)
Increase (decrease) in liabilities—Accounts payable . . . . . . . . . . . . . . . . . . . . . . . . . . . . . . . . . . . . . . . . . . . . . . (36.0) 54.2 (40.4)Accrued liabilities . . . . . . . . . . . . . . . . . . . . . . . . . . . . . . . . . . . . . . . . . . . . . . 7.0 (22.1) (2.7)Federal and state income tax payable / receivable . . . . . . . . . . . . . . . . . . . . . 18.0 (32.7) 0.4
Net cash provided by operating activities . . . . . . . . . . . . . . . . . . . . . . . . . . 736.1 608.2 404.2
Cash Flows from Investing Activities:Additions to property, plant, and equipment . . . . . . . . . . . . . . . . . . . . . . . . . . . . (420.2) (234.4) (128.5)Acquisitions of businesses, net of cash acquired . . . . . . . . . . . . . . . . . . . . . . . . (20.5) (1,174.5) (35.4)Additions to other long term assets . . . . . . . . . . . . . . . . . . . . . . . . . . . . . . . . . . . (12.5) (3.1) (1.1)Treasury grant proceeds . . . . . . . . . . . . . . . . . . . . . . . . . . . . . . . . . . . . . . . . . . . — — 57.4Other . . . . . . . . . . . . . . . . . . . . . . . . . . . . . . . . . . . . . . . . . . . . . . . . . . . . . . . . . . 2.1 0.6 0.1
Net cash used for investing activities . . . . . . . . . . . . . . . . . . . . . . . . . . (451.1) (1,411.4) (107.5)
Cash Flows from Financing Activities:Proceeds from issuance of debt . . . . . . . . . . . . . . . . . . . . . . . . . . . . . . . . . . . . . . 398.9 1,998.1 397.0Repayments of debt . . . . . . . . . . . . . . . . . . . . . . . . . . . . . . . . . . . . . . . . . . . . . . . (592.5) (1,074.8) (437.2)Financing costs paid . . . . . . . . . . . . . . . . . . . . . . . . . . . . . . . . . . . . . . . . . . . . . . (3.4) (19.4) (0.8)Settlement of treasury lock . . . . . . . . . . . . . . . . . . . . . . . . . . . . . . . . . . . . . . . . . — — (65.5)Common stock dividends paid . . . . . . . . . . . . . . . . . . . . . . . . . . . . . . . . . . . . . . (157.4) (109.1) (117.8)Repurchases of common stock . . . . . . . . . . . . . . . . . . . . . . . . . . . . . . . . . . . . . . — (7.8) (45.2)Proceeds from exercise of stock options . . . . . . . . . . . . . . . . . . . . . . . . . . . . . . . 3.7 2.9 19.9Excess tax benefits from stock-based awards . . . . . . . . . . . . . . . . . . . . . . . . . . . 12.2 7.8 4.0Shares withheld to cover employee restricted stock taxes . . . . . . . . . . . . . . . . . (13.2) (11.0) —Other . . . . . . . . . . . . . . . . . . . . . . . . . . . . . . . . . . . . . . . . . . . . . . . . . . . . . . . . . . 0.6 0.1 —
Net cash (used for) provided by financing activities . . . . . . . . . . . . . . . . . (351.1) 786.8 (245.6)
Net (decrease) increase in cash and cash equivalents . . . . . . . . . . . . . . . . . . . . (66.1) (16.4) 51.1Cash and cash equivalents, beginning of year . . . . . . . . . . . . . . . . . . . . . . . . . . 191.0 207.4 156.3
Cash and cash equivalents, end of year . . . . . . . . . . . . . . . . . . . . . . . . . . . . . . . . $ 124.9 $ 191.0 $ 207.4
See notes to consolidated financial statements.
46

Packaging Corporation of America
Consolidated Statements of Changes in Stockholders’ Equity(dollars in million and shares in thousands)
AdditionalPaid inCapital
RetainedEarnings
AccumulatedOther
ComprehensiveLoss
TotalStockholders’
Equity
Common Stock Treasury Stock
Shares Amount Shares Amount
Balance at January 1, 2012 . . . . . . . . . . . . . . . . . . 98,325 $ 1.0 (2) $ — $351.8 $ 716.3 $ (97.8) $ 971.3Common stock repurchases and retirements . . . (1,510) — 2 — (9.3) (35.9) — (45.2)Common stock dividends declared . . . . . . . . . . — — — — — (98.1) — (98.1)Restricted stock grants and cancellations . . . . . 383 — — — 1.6 — — 1.6Exercise of stock options . . . . . . . . . . . . . . . . . 945 — — — 22.3 — — 22.3Share-based compensation expense . . . . . . . . . — — — — 11.7 — — 11.7Other . . . . . . . . . . . . . . . . . . . . . . . . . . . . . . . . . — — — — 0.7 — — 0.7Comprehensive income . . . . . . . . . . . . . . . . . . . — — — — — 160.2 (16.2) 144.0
Balance at December 31, 2012 . . . . . . . . . . . . . . . 98,143 $ 1.0 — $ — $378.8 $ 742.5 $(114.0) $1,008.3Common stock repurchases and retirements . . . (171) — — — (1.1) (6.7) — (7.8)Common stock withheld and retired to cover
taxes on vested stock awards . . . . . . . . . . . . (224) — — — (1.4) (9.6) — (11.0)Common stock dividends declared . . . . . . . . . . — — — — — (148.4) — (148.4)Restricted stock grants and cancellations . . . . . 297 — — — 6.9 — — 6.9Exercise of stock options . . . . . . . . . . . . . . . . . 127 — — — 3.7 — — 3.7Share-based compensation expense . . . . . . . . . — — — — 14.8 — — 14.8Other . . . . . . . . . . . . . . . . . . . . . . . . . . . . . . . . . — — — — — — — —Comprehensive income . . . . . . . . . . . . . . . . . . . — — — — — 441.3 49.0 490.3
Balance at December 31, 2013 . . . . . . . . . . . . . . . 98,172 $ 1.0 — $ — $401.7 $1,019.1 $ (65.0) $1,356.8Common stock withheld and retired to cover
taxes on vested stock awards . . . . . . . . . . . . (183) — — — (1.2) (12.0) — (13.2)Common stock dividends declared . . . . . . . . . . — — — — — (157.5) — (157.5)Restricted stock grants and cancellations . . . . . 228 — — — 9.7 — — 9.7Exercise of stock options . . . . . . . . . . . . . . . . . 151 — — — 6.3 — — 6.3Share-based compensation expense . . . . . . . . . — — — — 15.6 — — 15.6Comprehensive income . . . . . . . . . . . . . . . . . . . — — — — — 392.6 (88.9) 303.7
Balance at December 31, 2014 . . . . . . . . . . . . . . . 98,368 $ 1.0 — $ — $432.1 $1,242.2 $(153.9) $1,521.4
See notes to consolidated financial statements.
47

Notes to Consolidated Financial Statements
1. Nature of Operations and Basis of Presentation
Packaging Corporation of America (“we,” “us,” “our,” “PCA,” or the “Company”) was incorporated onJanuary 25, 1999. In April 1999, PCA acquired the containerboard and corrugated packaging products businessof Pactiv Corporation (Pactiv), formerly known as Tenneco Packaging, Inc., a wholly owned subsidiary ofTenneco Inc. On October 25, 2013, PCA acquired Boise Inc. (Boise). For more information, see Note 3,Acquisitions. After the acquisition of Boise, we became a large diverse manufacturer of both packaging andpaper products. We are headquartered in Lake Forest, Illinois, and we operate largely in the United States butalso have operations in Europe, Mexico, and Canada. We have approximately 14,000 employees.
We report our businesses in three reportable segments: Packaging, Paper, and Corporate and Other. OurPackaging segment produces a wide variety of corrugated packaging products. The Paper segment manufacturesand sells a range of papers, including communication-based papers, and pressure sensitive papers (collectively,white papers), and market pulp. Corporate and other includes support staff services and related assets andliabilities, transportation assets, and activity related to other ancillary support operations. For more informationabout our segments, see Note 18, Segment Information.
In these consolidated financial statements, certain amounts in prior periods’ consolidated financialstatements have been reclassified to conform with the current period presentation.
Effective January 1, 2014, the Company elected to change its method of accounting for certain inventoriesfrom lower of cost, as determined by the LIFO method, or market, to lower of cost, as determined by the averagecost method, or market. We applied this change in method of inventory costing retrospectively to all priorperiods presented in accordance with U.S. generally accepted accounting principles relating to accountingchanges. For more information about our inventory valuation, see Note 2, Summary of Significant AccountingPolicies.
The consolidated financial statements include the accounts of PCA and its majority-owned subsidiaries afterelimination of intercompany balances and transactions. Boise’s results are included in our results subsequent toOctober 25, 2013, the date of acquisition.
2. Summary of Significant Accounting Policies
Use of Estimates
The preparation of financial statements in conformity with accounting principles generally accepted in theUnited States of America requires management to make estimates and assumptions about future events. Theseestimates and the underlying assumptions affect the amounts of assets and liabilities reported, disclosures aboutcontingent assets and liabilities, and reported amounts of revenues and expenses. These estimates andassumptions are based on management’s best estimates and judgment. Management evaluates its estimates andassumptions on an ongoing basis using historical experience and other factors, including the current economicenvironment. We adjust such estimates and assumptions when facts and circumstances dictate. As future eventsand their effects cannot be determined with precision, actual results could differ significantly from theseestimates. Changes in these estimates will be reflected in the consolidated financial statements in future periods.
Revenue Recognition
We recognize revenue when the following criteria are met: persuasive evidence of an agreement exists,delivery has occurred or services have been rendered, our price to the buyer is fixed or determinable, andcollectability is reasonably assured. Shipping and handling billings to a customer are included in net sales.Shipping and handling costs, such as freight to our customers’ destinations, are included in cost of sales. Wepresent taxes collected from customers and remitted to governmental authorities on a net basis in ourConsolidated Statements of Income.
48

Planned Major Maintenance Costs
The Company accounts for its planned major maintenance activities in accordance with ASC 360,“Property, Plant, and Equipment,” using the deferral method. All maintenance costs incurred during the year areexpensed in the year in which the maintenance activity occurs.
Share-Based Compensation
We recognize compensation expense for awards granted under the PCA long-term equity incentive plansbased on the fair value on the grant date. We recognize the cost of the equity awards expected to vest over theperiod the awards vest. See Note 12, Share-Based Compensation, for more information.
Research and Development
Research and development costs are expensed as incurred. The amount charged to expense was$12.3 million, $11.5 million, and $11.3 million for the years ended December 31, 2014, 2013, and 2012,respectively.
Foreign Currency
Local currencies are the functional currencies for our operations outside the United States. Assets andliabilities are remeasured into U.S. dollars using the exchange rates as of the Consolidated Balance Sheet date.Revenue and expense items are remeasured into U.S. dollars using an average exchange rate prevailing duringthe period. Any resulting translation adjustments are recorded in the Consolidated Statements of ComprehensiveIncome. The foreign exchange gain (loss) resulting from remeasuring transactions into the functional currenciesis reported in the Consolidated Statements of Income.
Cash and Cash Equivalents
Cash and cash equivalents include all cash balances and highly liquid investments with a maturity, whenacquired, of three months or less. Cash equivalents are stated at cost, which approximates market. Cash and cashequivalents totaled $124.9 million and $191.0 million at December 31, 2014 and 2013, respectively, whichincluded cash equivalents of $79.9 million and $156.6 million, respectively. At December 31, 2014 and 2013, wehad $10.4 million and $7.1 million, respectively, of cash at our operations outside the United States.
Trade Accounts Receivable, Allowance for Doubtful Accounts, and Customer Deductions
Trade accounts receivable are stated at the amount we expect to collect. The collectability of our accountsreceivable is based upon a combination of factors. In circumstances where a specific customer is unable to meetits financial obligations to PCA (e.g., bankruptcy filings, substantial downgrading of credit sources), a specificreserve for bad debts is recorded against amounts due to the Company to reduce the net recorded receivable tothe amount the Company reasonably believes will be collected. For all other customers, reserves for bad debtsare recognized based on historical collection experience. If collection experience deteriorates (i.e., higher thanexpected defaults or an unexpected material adverse change in a major customer’s ability to meet its financialobligations to the Company), the estimate of the recoverability of amounts due could be reduced by a materialamount. We periodically review our allowance for doubtful accounts and adjustments to the valuation allowanceare recorded as income or expense. Trade accounts receivable balances that remain outstanding after we haveused reasonable collection efforts are written off through a charge to the valuation allowance and a credit toaccounts receivable. At December 31, 2014 and 2013, the allowance for doubtful accounts was $4.9 million and$3.9 million, respectively.
The customer deductions reserve represents the estimated amount required for customer returns, allowances,and earned discounts. Based on the Company’s experience, customer returns, allowances, and earned discountshave averaged approximately 1% of gross selling price. Accordingly, PCA reserves 1% of its open customer
49

accounts receivable balance for these items. The reserves for customer deductions of $6.4 million and$6.7 million at December 31, 2014 and 2013, respectively, are also included as a reduction of the accountsreceivable balance.
Derivative Instruments and Hedging Activities
The Company records its derivatives, if any, in accordance with ASC 815, “Derivatives and Hedging.” Theguidance requires the Company to recognize derivative instruments as either assets or liabilities on the balancesheet at fair value. The accounting for changes in the fair value of a derivative depends on the intended use anddesignation of the derivative instrument. For a derivative designated as a fair value hedge, the gain or loss on thederivative is recognized in earnings in the period of change at fair value together with the offsetting gain or losson the hedged item. For a derivative instrument designated as a cash flow hedge, the effective portion of thederivative’s gain or loss is initially reported as a component of accumulated other comprehensive income (loss)(AOCI) and is subsequently recognized in earnings when the hedged exposure affects earnings. The ineffectiveportion of the gain or loss is recognized in earnings. We were not party to any derivative-based arrangements atDecember 31, 2014 and 2013.
Fair Value Measurements
PCA measures the fair value of its financial instruments in accordance with ASC 820, “Fair ValueMeasurements and Disclosures.” The guidance defines fair value as the price that would be received to sell anasset or paid to transfer a liability in an orderly transaction between market participants. It is determined based onassumptions that market participants would use in pricing an asset or liability. As a basis for considering suchassumptions, ASC 820 establishes the following hierarchy that prioritizes the inputs to valuation methodologiesused to measure fair value:
Level 1 — Valuations based on quoted prices for identical assets and liabilities in active markets.
Level 2 — Valuations based on observable inputs other than quoted prices included in Level 1, such asquoted prices for similar assets and liabilities in active markets, quoted prices for identical or similarassets and liabilities in markets that are not active, or other inputs that are observable or can becorroborated by observable market data.
Level 3 — Valuations based on unobservable inputs in which there is little or no market data, whichrequire the reporting entity to develop its own assumptions.
Financial instruments measured at fair value on a recurring basis include the fair value of our pension andpostretirement benefit assets and liabilities. See Note 11, Employee Benefit Plans and Other PostretirementBenefits for more information. Other assets and liabilities measured and recognized at fair value on anonrecurring basis include assets acquired and liabilities assumed in acquisitions and our asset retirementobligations. Given the nature of these assets and liabilities, evaluating their fair value from the perspective of amarket participant is inherently complex. Assumptions and estimates about future values can be affected by avariety of internal and external factors. Changes in these factors may require us to revise our estimates and couldrequire us to retroactively adjust provisional amounts that we recorded for the fair values of assets acquired andliabilities assumed in connection with business combinations. These adjustments could have a material effect onour financial condition and results of operations. See Note 3, Acquisitions, and Note 19, Asset RetirementObligations, for more information.
Inventory Valuation
Prior to 2014, with the exception of inventories acquired since 2004, our raw materials, work in process, andfinished goods inventories were valued using the last-in, first-out (LIFO) cost method. Supplies and materials arevalued at the first-in, first-out (FIFO) or average cost methods. Effective January 1, 2014, the Company electedto change its method of accounting for certain inventories from lower of cost, as determined by the LIFO
50

method, or market, to lower of cost, as determined by the average cost method, or market. Had the Company notmade this change in accounting method, “Net income” for the year ended December 31, 2014, would have been$1.6 million higher than reported in the Consolidated Statements of Income and “Inventories” at December 31,2014, would have been $69.2 million lower than reported in the Consolidated Balance Sheets. We believe thechange is preferable as the average cost method better reflects the current value of inventory on the consolidatedbalance sheets, more closely aligns with how we manage inventory, and conforms the inventory costing methodsto be more consistent within the Company.
We applied this change in method of inventory costing retrospectively to all prior periods presented inaccordance with U.S. generally accepted accounting principles relating to accounting changes. As a result of theretrospective change in accounting principle, opening retained earnings as of January 1, 2012, increased$42.3 million. For additional information and detail of certain components of our financial statements affected bythe change in valuation methodology as originally reported under the LIFO method and as adjusted for thechange to the average cost method, see Note 2, Summary of Significant Accounting Policies, of the Notes toConsolidated Financial Statements in “Part II, Item 8. Financial Statements and Supplementary Data” of ourCurrent Report on Form 8-K filed on May 9, 2014.
The components of inventories were as follows (dollars in millions):
December 31
2014 2013
Raw materials . . . . . . . . . . . . . . . . . . . . . . . . . . . . . . . . . . . . . . . . . . . . . . . . . . . . . . $261.9 $212.0Work in process . . . . . . . . . . . . . . . . . . . . . . . . . . . . . . . . . . . . . . . . . . . . . . . . . . . . . 11.3 13.9Finished goods . . . . . . . . . . . . . . . . . . . . . . . . . . . . . . . . . . . . . . . . . . . . . . . . . . . . . . 216.3 210.0Supplies and materials . . . . . . . . . . . . . . . . . . . . . . . . . . . . . . . . . . . . . . . . . . . . . . . . 175.4 158.4
Inventories . . . . . . . . . . . . . . . . . . . . . . . . . . . . . . . . . . . . . . . . . . . . . . . . . . . . . . . . . $664.9 $594.3
Property, Plant, and Equipment
Property, plant, and equipment are recorded at cost. Cost includes expenditures for major improvements andreplacements and the amount of interest cost associated with significant capital additions. Repairs andmaintenance costs are expensed as incurred. When property and equipment are retired, sold, or otherwisedisposed of, the asset’s carrying amount and related accumulated depreciation are removed from the accountsand any gain or loss is included in “Net income” in our Consolidated Statements of Income.
Property, plant, and equipment consisted of the following (dollars in millions):
December 31
2014 2013
Land and land improvements . . . . . . . . . . . . . . . . . . . . . . . . . . . . . . . . . . . . . . $ 138.2 $ 140.6Buildings . . . . . . . . . . . . . . . . . . . . . . . . . . . . . . . . . . . . . . . . . . . . . . . . . . . . . . 659.9 628.9Machinery and equipment . . . . . . . . . . . . . . . . . . . . . . . . . . . . . . . . . . . . . . . . 4,508.0 4,246.3Construction in progress . . . . . . . . . . . . . . . . . . . . . . . . . . . . . . . . . . . . . . . . . . 154.8 168.8Other . . . . . . . . . . . . . . . . . . . . . . . . . . . . . . . . . . . . . . . . . . . . . . . . . . . . . . . . . 54.5 48.1
Property, plant, and equipment, at cost . . . . . . . . . . . . . . . . . . . . . . . . . . . . . . 5,515.4 5,232.7Less accumulated depreciation . . . . . . . . . . . . . . . . . . . . . . . . . . . . . . . . . . . . . (2,657.8) (2,427.0)
Property, plant, and equipment, net . . . . . . . . . . . . . . . . . . . . . . . . . . . . . . . . . $ 2,857.6 $ 2,805.7
51
The amount of interest capitalized from construction in progress was $2.8 million, $1.7 million, and$0.8 million for the years ended December 31, 2014, 2013, and 2012, respectively.
Depreciation is computed on the straight-line basis over the estimated useful lives of the related assets.Assets under capital leases are depreciated on the straight-line method over the term of the lease or the usefullife, if shorter. The following lives are used for the various categories of assets:
Buildings and land improvements . . . . . . . . . . . . . . . . . . . . . . . . . . . . . . . . . . . . 5 to 40 yearsMachinery and equipment . . . . . . . . . . . . . . . . . . . . . . . . . . . . . . . . . . . . . . . . . . 3 to 25 yearsTrucks and automobiles . . . . . . . . . . . . . . . . . . . . . . . . . . . . . . . . . . . . . . . . . . . 3 to 10 yearsFurniture and fixtures . . . . . . . . . . . . . . . . . . . . . . . . . . . . . . . . . . . . . . . . . . . . . 3 to 20 yearsComputers and hardware . . . . . . . . . . . . . . . . . . . . . . . . . . . . . . . . . . . . . . . . . . . 3 to 10 yearsLeasehold improvements . . . . . . . . . . . . . . . . . . . . . . . . . . . . . . . . . . . . . . . . . . Period of the lease or
useful life, if shorter
The amount of depreciation expense was $348.2 million, $191.2 million, and $166.0 million for the yearsended December 31, 2014, 2013, and 2012, respectively. The increase in depreciation expense relates primarilyto the acquisition of Boise in fourth quarter 2013, as well as accelerated depreciation. During the year endedDecember 31, 2014, we recognized $42.0 million of incremental depreciation expense primarily related toshortening the useful lives of assets at the DeRidder, Louisiana, mill, related primarily to the newsprint businesswhich we exited in 2014.
Pursuant to the terms of an industrial revenue bond, title to certain property, plant, and equipment wastransferred to a municipal development authority in 2009 in order to receive a property tax abatement. The titleof these assets will revert back to PCA upon retirement or cancellation of the bond. The assets are included in theconsolidated balance sheet under the caption “Property, plant, and equipment, net” as all risks and rewardsremain with the Company.
Leases
We assess lease classification as either capital or operating at lease inception or upon modification. Welease some of our locations, as well as other property and equipment, under operating leases. For purposes ofdetermining straight-line rent expense, the lease term is calculated from the date of possession of the facility,including any periods of free rent and any renewal option periods that are reasonably assured of being exercised.
Long-Lived Asset Impairment
Long-lived assets other than goodwill and other intangibles are reviewed for impairment in accordance withprovisions of ASC 360, “Property, Plant and Equipment.” In the event that facts and circumstances indicate thatthe carrying amount of any long-lived assets may be impaired, an evaluation of recoverability is performed. If anevaluation is required, the estimated future undiscounted cash flows associated with the asset (or group of assets)is compared to the assets (or group of assets) carrying amount to determine if a write-down to fair value isrequired.
Goodwill and Intangible Assets
The Company has capitalized certain intangible assets, primarily goodwill, customer relationships, andtrademarks and trade names, based on their estimated fair value at the date of acquisition. Amortization isprovided for customer relationships on a straight-line basis over periods ranging from ten to 40 years, andtrademarks and trade names over periods ranging from three to 20 years.
52

Goodwill, which amounted to $546.8 million and $526.8 million for the years ended December 31, 2014and 2013, respectively, is not amortized but is subject to an annual impairment test in accordance with ASC 350,“Intangibles — Goodwill and Other.” We test goodwill for impairment annually in the fourth quarter or sooner ifevents or changes in circumstances indicate that the carrying value of the asset may exceed fair value.Additionally, we evaluate the remaining useful lives of our finite-lived purchased intangible assets to determinewhether any adjustments to the useful lives are necessary. The Company concluded that none of the goodwill orintangible assets were impaired in the 2014, 2013, and 2012 annual impairment tests. See Note 8, Goodwill andIntangible Assets for additional information.
Pension and Postretirement Benefits
Several estimates and assumptions are required to record pension costs and liabilities, including discountrate, return on assets, and longevity and service lives of employees. We review and update these assumptionsannually unless a plan curtailment or other event occurs, requiring we update the estimates on an interim basis.While we believe the assumptions used to measure our pension and postretirement benefit obligations arereasonable, differences in actual experience or changes in assumptions may materially affect our pension andpostretirement benefit obligations and future expense. See Note 11, Employee Benefit Plans and OtherPostretirement Benefits, for additional information.
For postretirement health care plan accounting, the Company reviews external data and its own historicaltrends for health care costs to determine the health care cost trend rate assumption.
Environmental Matters
Environmental expenditures that extend the life of the related property or mitigate or prevent futureenvironmental contamination are capitalized. Liabilities are recorded for environmental contingencies when suchcosts are probable and reasonably estimable. These liabilities are adjusted as further information develops orcircumstances change. Environmental expenditures related to existing conditions resulting from past or currentoperations from which no current or future benefit is discernible are expensed as incurred.
Asset Retirement Obligations
The Company accounts for its retirement obligations related predominantly to landfill closure, wastewatertreatment pond dredging, closed-site monitoring costs, and certain leasehold improvements under ASC 410,“Asset Retirement and Environmental Obligations,” which requires recognition of legal obligations associatedwith the retirement of long-lived assets whether these assets are owned or leased. These legal obligations arerecognized at fair value at the time that the obligations are incurred. When we record the liability, we capitalizethe cost by increasing the carrying amount of the related long-lived asset which is amortized to expense over theuseful life of the asset. See Note 19, Asset Retirement Obligations, for additional information.
Deferred Financing Costs
PCA has capitalized certain costs related to obtaining its financing. These costs are amortized to interestexpense using the effective interest rate method over the terms of the related financing, which range from five toten years. Unamortized deferred financing costs of $14.1 million as of both December 31, 2014 and 2013,respectively, were recorded in “Other long-term assets” on our Consolidated Balance Sheets.
Cutting Rights and Fiber Farms
We lease the cutting rights to approximately 88,000 acres of timberland and we lease 9,000 acres of landwhere we operate fiber farms as a source of future fiber supply. For our cutting rights and fiber farms, wecapitalized the annual lease payments and reforestation costs associated with these leases. Costs are recorded as
53

depletion when the timber or fiber is harvested and used in operations or sold to customers. Capitalized long-termlease costs for our cutting rights and fiber farms, primarily recorded in “Other long-term assets” on ourConsolidated Balance Sheet, were $38.0 million and $37.0 million as of December 31, 2014 and 2013,respectively. The amount of depletion expense was $7.3 million, $2.5 million, and $0.7 million for the yearsended December 31, 2014, 2013, and 2012, respectively.
Deferred Software Costs
PCA capitalizes costs related to the purchase and development of software which is used in its businessoperations. The costs attributable to these software systems are amortized over their estimated useful lives basedon various factors such as the effects of obsolescence, technology, and other economic factors. Net capitalizedsoftware costs recorded in “Other long-term assets” on our Consolidated Balance Sheets were $6.8 million and$5.7 million for the years ended December 31, 2014 and 2013, respectively. Software amortization expense was$2.9 million, $1.1 million, and $0.9 million for the years ended December 31, 2014, 2013, and 2012,respectively.
Income Taxes
PCA utilizes the liability method of accounting for income taxes whereby it recognizes deferred tax assetsand liabilities for the future tax consequences of temporary differences between the tax basis of assets andliabilities and their reported amounts in the financial statements. Deferred tax assets will be reduced by avaluation allowance if, based upon management’s estimates, it is more likely than not that a portion of thedeferred tax assets will not be realized in a future period. The estimates utilized in the recognition of deferred taxassets are subject to revision in future periods based on new facts or circumstances. PCA’s practice is torecognize interest and penalties related to unrecognized tax benefits in income tax expense.
Trade Agreements
PCA regularly trades containerboard with other manufacturers primarily to reduce shipping costs. Theseagreements are entered into with other producers on an annual basis, pursuant to which both parties agree to shipan identical number of tons of containerboard to each other within the agreement period. These agreements lowertransportation costs by allowing each party’s containerboard mills to ship containerboard to the other party’scloser corrugated products plant. PCA tracks each shipment to ensure that the other party’s shipments to PCAmatch PCA’s shipments to the other party during the agreement period. Such transfers are possible becausecontainerboard is a commodity product with no distinguishing product characteristics. These transactions areaccounted for at carrying value, and revenue is not recorded as the transactions do not represent the culminationof an earnings process. The transactions are recorded into inventory accounts, and no sale or income is recordeduntil such inventory is converted to a finished product and sold to an end-use customer.
New and Recently Adopted Accounting Standards
In August 2014, the Financial Accounting Standards Board (FASB) issued Accounting Standards Update(ASU) 2014-15, Presentation of Financial Statements (Topic 205): Disclosure of Uncertainties about an Entity’sAbility to Continue as a Going Concern. This ASU provides guidance that will explicitly require management toassess an entity’s ability to continue as a going concern, and to provide related footnote disclosures in certaincircumstances. The guidance will become effective for us in December 2016, and for annual and interim periodsthereafter. Early adoption is permitted. The adoption of this update will not affect our financial position or resultsof operations.
In May 2014, the FASB issued ASU 2014-09: Revenue from Contracts with Customers (Topic 606). ASU2014-09 amends the guidance for revenue recognition to replace numerous, industry-specific requirements andconverges areas under this topic with those of the International Financial Reporting Standards. The ASU
54

implements a five-step process for customer contract revenue recognition that focuses on transfer of control, asopposed to transfer of risk and rewards. The amendment also requires enhanced disclosures regarding the nature,amount, timing, and uncertainty of revenues and cash flows from contracts with customers. The amendments inthis ASU will become effective for us in 2017, and early adoption is prohibited. Entities can transition to thestandard either retrospectively or as a cumulative-effect adjustment as of the date of adoption. We are currentlyassessing the impact the adoption of ASU 2014-09 may have on our financial position and results of operations.
In April 2014, the FASB issued ASU 2014-08, Presentation of Financial Statements (Topic 205) andProperty, Plant, and Equipment (Topic 360): Reporting Discontinued Operations and Disclosures of Disposals ofComponents of an Entity. This ASU defines a discontinued operation as a disposal of a component or group ofcomponents that is disposed of or is classified as held for sale and represents a strategic shift that has (or willhave) a major effect on an entity’s operations and financial results. The standard also requires additionaldisclosures about discontinued operations. We adopted the provisions of this guidance in third quarter 2014, andit did not have a material effect on our financial position and results of operations.
In February 2013, the FASB issued ASU 2013-04, Liabilities (Topic 405): Obligations Resulting from Jointand Several Liability Arrangements for Which the Total Amount of the Obligation is Fixed at the Reporting Date.This ASU requires an entity to measure obligations resulting from joint and several liability arrangements forwhich the total amount of the obligation within the scope of this guidance is fixed at the reporting date, as thesum of (a) the amount the reporting entity agreed to pay on the basis of its arrangement among its co-obligorsand (b) any additional amount the reporting entity expects to pay on behalf of its co-obligors. This ASU alsorequires an entity to disclose the nature and amount of the obligation as well as other information about thoseobligations. We adopted the provisions of this guidance January 1, 2014, and it did not have a material effect onour financial position and results of operations.
There were no other accounting standards recently issued that had or are expected to have a material impacton our financial position or results of operations.
3. Acquisitions
Crockett Packaging Acquisition
On April 28, 2014, we acquired the assets of Crockett Packaging, a corrugated products manufacturer, for$21.2 million, before $0.7 million of working capital adjustments. The assets included a corrugated plant and asheet plant in Southern California. Sales and total assets of the acquired company are not material to our overallsales and total assets. Operating results of the acquired assets subsequent to April 28, 2014, are included in ourPackaging segment’s 2014 operating results. We have estimated the allocation of the purchase price to the assetsacquired and liabilities assumed based on estimates of the fair value at the date of the acquisition, of which$12.2 million was allocated to goodwill (which is deductible for tax purposes) and $5.5 million to intangibleassets (to be amortized over a weighted average life of approximately ten years), primarily customerrelationships, in the Packaging segment. The purchase price allocation continues to be preliminary, as estimatesand assumptions are subject to change as more information becomes available.
Boise Acquisition
On October 25, 2013, we acquired 100% of the outstanding stock and voting equity interests of Boise for$2.1 billion including the assumption of debt. We paid $12.55 per share to shareholders, or $1.2 billion, net of$121.7 million of cash acquired, and assumed the fair value of Boise’s debt, of $829.8 million. The acquisitionexpands our corrugated products geographic reach and offerings, provides low-cost, lightweight containerboardcapacity for continued growth in the packaging business, and provides meaningful opportunities in the whitepaper business. During the year ended December 31, 2014, we recorded approximately $6.4 million of purchaseprice adjustments that increased goodwill. These adjustments related primarily to a true-up to the valuation of
55

fixed assets, the associated impact to income tax liabilities, and residual goodwill. Boise’s financial results areincluded in our Packaging, Paper, and Corporate and Other segments from the date of acquisition. For moreinformation, see Note 18, Segment Information.
4. Earnings Per Share
The following table sets forth the computation of basic and diluted income per common share for theperiods presented (dollars and shares in millions, except per share data).
Year Ended December 31
2014 2013 2012
Numerator:Net income . . . . . . . . . . . . . . . . . . . . . . . . . . . . . . . . . . . . . . . . . . . . . . $392.6 $441.3 $160.2Less: distributed and undistributed earnings allocated to participating
securities . . . . . . . . . . . . . . . . . . . . . . . . . . . . . . . . . . . . . . . . . . . . . . (5.7) — —
Net income attributable to common shareholders . . . . . . . . . . . . . . . . . . $386.9 $441.3 $160.2
Denominator:Weighted average basic common shares outstanding . . . . . . . . . . . . . 97.0 96.6 96.4Effect of dilutive securities . . . . . . . . . . . . . . . . . . . . . . . . . . . . . . . . . 0.1 0.9 1.1
Diluted common shares outstanding . . . . . . . . . . . . . . . . . . . . . . . . . . . . 97.1 97.5 97.5
Basic income per common share . . . . . . . . . . . . . . . . . . . . . . . . . . . . . . . $ 3.99 $ 4.57 $ 1.66Diluted income per common share . . . . . . . . . . . . . . . . . . . . . . . . . . . . . $ 3.99 $ 4.52 $ 1.64
For the years ended December 31, 2014, 2013, and 2012, all outstanding options to purchase shares wereincluded in the computation of diluted common shares outstanding. On June 29, 2014, all remaining options topurchase shares expired.
5. Other Expense, Net
The components of other expense, net, were as follows (in millions):
Year Ended December 31
2014 2013 2012
Integration-related and other costs(a) . . . . . . . . . . . . . . . . . . . . . . . . . . . . $20.0 $17.4 $ —Class action lawsuit settlement(b) . . . . . . . . . . . . . . . . . . . . . . . . . . . . . . 17.6 — —DeRidder restructuring(c) . . . . . . . . . . . . . . . . . . . . . . . . . . . . . . . . . . . . 7.3 — —Pension curtailment charges(d) . . . . . . . . . . . . . . . . . . . . . . . . . . . . . . . . — 10.9 —Acquisition-related costs(e) . . . . . . . . . . . . . . . . . . . . . . . . . . . . . . . . . . . — 17.2 —Asset disposals and write-offs . . . . . . . . . . . . . . . . . . . . . . . . . . . . . . . . . 10.1 13.2 10.8Other . . . . . . . . . . . . . . . . . . . . . . . . . . . . . . . . . . . . . . . . . . . . . . . . . . . . . 2.3 0.3 1.0
Total . . . . . . . . . . . . . . . . . . . . . . . . . . . . . . . . . . . . . . . . . . . . . . . . . . . $57.3 $59.0 $11.8
(a) Includes Boise acquisition integration-related and other costs, which primarily relate to severance, retention,travel, and professional fees.
(b) Includes $17.6 million of costs for the settlement of the Kleen Products LLC v Packaging Corp. of Americaet al class action lawsuit. See Note 20, Commitments, Guarantees, Indemnifications, and Legal Proceedings,for more information.
(c) Costs relate primarily to the conversion of the No. 3 newsprint machine at our DeRidder, Louisiana, mill toproduce lightweight linerboard and corrugating medium, and our exit from the newsprint business inSeptember 2014.
56

(d) Includes $10.9 million of non-cash pension curtailment charges related to pension plan changes in whichcertain hourly corrugated plant and containerboard mill employees will transition from a defined benefitpension plan to a defined contribution (401k) plan.
(e) Includes $17.2 million of acquisition-related costs, primarily for professional fees related to transaction-advisory services and expenses related to financing the acquisition of Boise.
6. Income Taxes
The following is an analysis of the components of the consolidated income tax provision (dollars inmillions):
2014 2013 2012
Current income tax provision (benefit) —U.S. Federal . . . . . . . . . . . . . . . . . . . . . . . . . . . . . . . . . . . . . . . . . . . . . $185.1 $ 129.6 $ 27.1State and local . . . . . . . . . . . . . . . . . . . . . . . . . . . . . . . . . . . . . . . . . . . 33.1 12.7 6.4Foreign . . . . . . . . . . . . . . . . . . . . . . . . . . . . . . . . . . . . . . . . . . . . . . . . . 0.9 0.3 —
Total current provision for taxes . . . . . . . . . . . . . . . . . . . . . . . . . . . 219.1 142.6 33.5
Deferred —U.S. Federal . . . . . . . . . . . . . . . . . . . . . . . . . . . . . . . . . . . . . . . . . . . . . (5.0) (160.5) 179.1State and local . . . . . . . . . . . . . . . . . . . . . . . . . . . . . . . . . . . . . . . . . . . 7.6 0.3 1.9Foreign . . . . . . . . . . . . . . . . . . . . . . . . . . . . . . . . . . . . . . . . . . . . . . . . . — (0.1) —
Total deferred provision (benefit) for taxes . . . . . . . . . . . . . . . . . . . 2.6 (160.3) 181.0
Total provision (benefit) for taxes . . . . . . . . . . . . . . . . . . . . . . . . . . $221.7 $ (17.7) $214.5
The effective tax rate varies from the U.S. Federal statutory tax rate principally due to the following (dollarsin millions):
2014 2013 2012
Provision computed at U.S. Federal statutory rate of 35% . . . . . . . . . . . $215.0 $ 148.3 $131.1Alternative fuel mixture and cellulosic biofuel producer credits . . . . . . — (166.0) 81.7State and local taxes, net of federal benefit . . . . . . . . . . . . . . . . . . . . . . 20.5 13.6 8.9Domestic manufacturers deduction . . . . . . . . . . . . . . . . . . . . . . . . . . . . (16.5) (11.7) (7.2)Other . . . . . . . . . . . . . . . . . . . . . . . . . . . . . . . . . . . . . . . . . . . . . . . . . . . . 2.7 (1.9) —
Total . . . . . . . . . . . . . . . . . . . . . . . . . . . . . . . . . . . . . . . . . . . . . . . . . . $221.7 $ (17.7) $214.5
Tax benefits in 2013 included $166.0 million for the release of ASC 740 uncertain tax positions related tothe taxability of the alternative energy tax credits acquired in the acquisition of Boise and the completion of theIRS audit of PCA’s 2008 and 2009 Federal income tax returns including the Filer City mill’s cellulosic biofueltax credits. Tax expense in 2012 included $81.7 million for the reallocation of gallons from the cellulosic biofuelproducer credit to the alternative energy tax credit claimed in the 2009 amended federal and state income taxreturns filed in 2012. For further discussion regarding these credits, see Note 7, Alternative Energy Tax Credits.
57
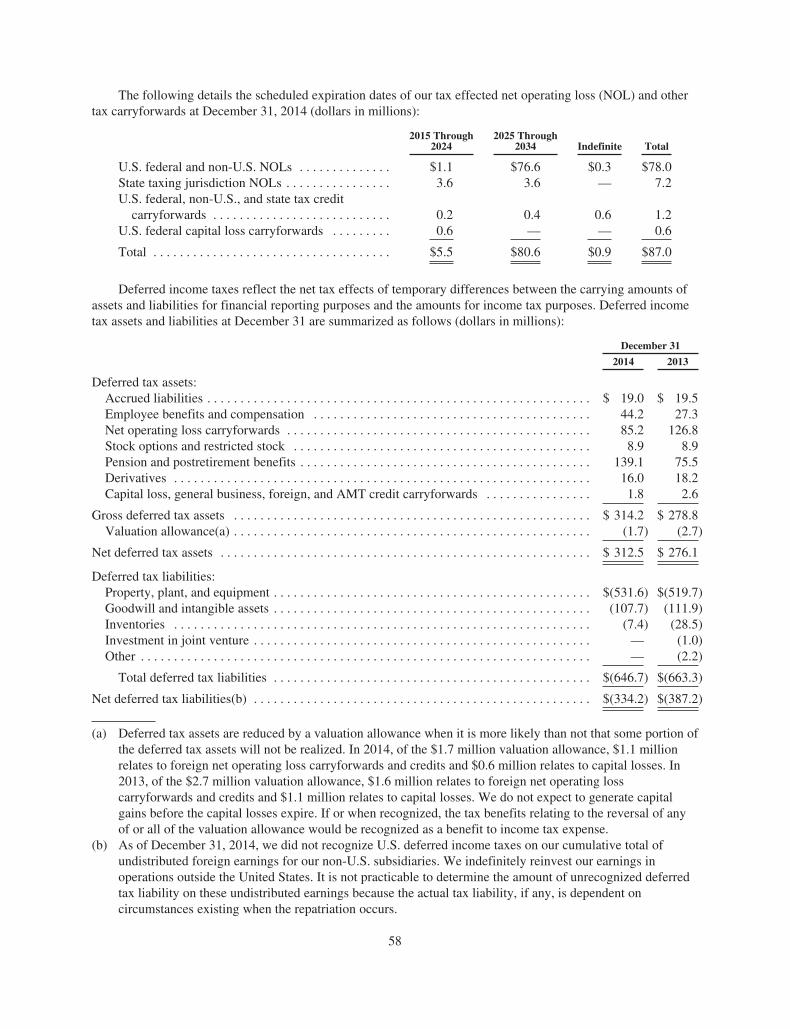
The following details the scheduled expiration dates of our tax effected net operating loss (NOL) and othertax carryforwards at December 31, 2014 (dollars in millions):
2015 Through2024
2025 Through2034 Indefinite Total
U.S. federal and non-U.S. NOLs . . . . . . . . . . . . . . $1.1 $76.6 $0.3 $78.0State taxing jurisdiction NOLs . . . . . . . . . . . . . . . . 3.6 3.6 — 7.2U.S. federal, non-U.S., and state tax credit
carryforwards . . . . . . . . . . . . . . . . . . . . . . . . . . . 0.2 0.4 0.6 1.2U.S. federal capital loss carryforwards . . . . . . . . . 0.6 — — 0.6
Total . . . . . . . . . . . . . . . . . . . . . . . . . . . . . . . . . . . . $5.5 $80.6 $0.9 $87.0
Deferred income taxes reflect the net tax effects of temporary differences between the carrying amounts ofassets and liabilities for financial reporting purposes and the amounts for income tax purposes. Deferred incometax assets and liabilities at December 31 are summarized as follows (dollars in millions):
December 31
2014 2013
Deferred tax assets:Accrued liabilities . . . . . . . . . . . . . . . . . . . . . . . . . . . . . . . . . . . . . . . . . . . . . . . . . . . . . . . . . . $ 19.0 $ 19.5Employee benefits and compensation . . . . . . . . . . . . . . . . . . . . . . . . . . . . . . . . . . . . . . . . . . 44.2 27.3Net operating loss carryforwards . . . . . . . . . . . . . . . . . . . . . . . . . . . . . . . . . . . . . . . . . . . . . . 85.2 126.8Stock options and restricted stock . . . . . . . . . . . . . . . . . . . . . . . . . . . . . . . . . . . . . . . . . . . . . 8.9 8.9Pension and postretirement benefits . . . . . . . . . . . . . . . . . . . . . . . . . . . . . . . . . . . . . . . . . . . . 139.1 75.5Derivatives . . . . . . . . . . . . . . . . . . . . . . . . . . . . . . . . . . . . . . . . . . . . . . . . . . . . . . . . . . . . . . . 16.0 18.2Capital loss, general business, foreign, and AMT credit carryforwards . . . . . . . . . . . . . . . . 1.8 2.6
Gross deferred tax assets . . . . . . . . . . . . . . . . . . . . . . . . . . . . . . . . . . . . . . . . . . . . . . . . . . . . . . $ 314.2 $ 278.8Valuation allowance(a) . . . . . . . . . . . . . . . . . . . . . . . . . . . . . . . . . . . . . . . . . . . . . . . . . . . . . . (1.7) (2.7)
Net deferred tax assets . . . . . . . . . . . . . . . . . . . . . . . . . . . . . . . . . . . . . . . . . . . . . . . . . . . . . . . . $ 312.5 $ 276.1
Deferred tax liabilities:Property, plant, and equipment . . . . . . . . . . . . . . . . . . . . . . . . . . . . . . . . . . . . . . . . . . . . . . . . $(531.6) $(519.7)Goodwill and intangible assets . . . . . . . . . . . . . . . . . . . . . . . . . . . . . . . . . . . . . . . . . . . . . . . . (107.7) (111.9)Inventories . . . . . . . . . . . . . . . . . . . . . . . . . . . . . . . . . . . . . . . . . . . . . . . . . . . . . . . . . . . . . . . (7.4) (28.5)Investment in joint venture . . . . . . . . . . . . . . . . . . . . . . . . . . . . . . . . . . . . . . . . . . . . . . . . . . . — (1.0)Other . . . . . . . . . . . . . . . . . . . . . . . . . . . . . . . . . . . . . . . . . . . . . . . . . . . . . . . . . . . . . . . . . . . . — (2.2)
Total deferred tax liabilities . . . . . . . . . . . . . . . . . . . . . . . . . . . . . . . . . . . . . . . . . . . . . . . . $(646.7) $(663.3)
Net deferred tax liabilities(b) . . . . . . . . . . . . . . . . . . . . . . . . . . . . . . . . . . . . . . . . . . . . . . . . . . . $(334.2) $(387.2)
(a) Deferred tax assets are reduced by a valuation allowance when it is more likely than not that some portion ofthe deferred tax assets will not be realized. In 2014, of the $1.7 million valuation allowance, $1.1 millionrelates to foreign net operating loss carryforwards and credits and $0.6 million relates to capital losses. In2013, of the $2.7 million valuation allowance, $1.6 million relates to foreign net operating losscarryforwards and credits and $1.1 million relates to capital losses. We do not expect to generate capitalgains before the capital losses expire. If or when recognized, the tax benefits relating to the reversal of anyof or all of the valuation allowance would be recognized as a benefit to income tax expense.
(b) As of December 31, 2014, we did not recognize U.S. deferred income taxes on our cumulative total ofundistributed foreign earnings for our non-U.S. subsidiaries. We indefinitely reinvest our earnings inoperations outside the United States. It is not practicable to determine the amount of unrecognized deferredtax liability on these undistributed earnings because the actual tax liability, if any, is dependent oncircumstances existing when the repatriation occurs.
58
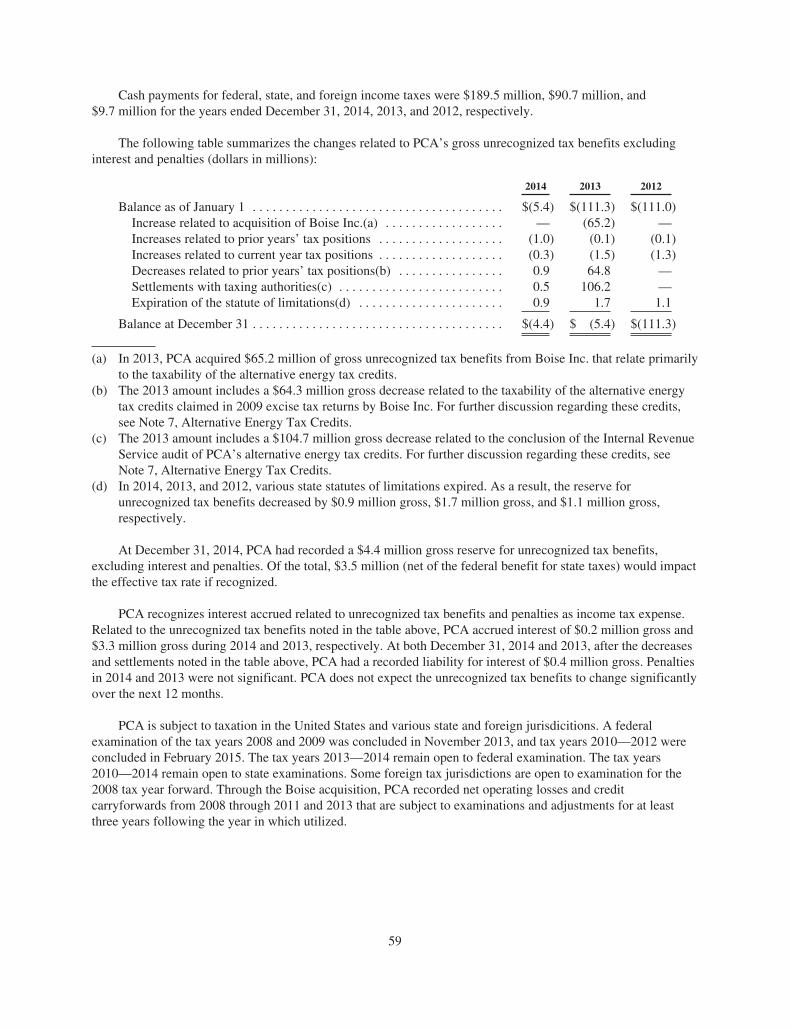
Cash payments for federal, state, and foreign income taxes were $189.5 million, $90.7 million, and$9.7 million for the years ended December 31, 2014, 2013, and 2012, respectively.
The following table summarizes the changes related to PCA’s gross unrecognized tax benefits excludinginterest and penalties (dollars in millions):
2014 2013 2012
Balance as of January 1 . . . . . . . . . . . . . . . . . . . . . . . . . . . . . . . . . . . . . . $(5.4) $(111.3) $(111.0)Increase related to acquisition of Boise Inc.(a) . . . . . . . . . . . . . . . . . . — (65.2) —Increases related to prior years’ tax positions . . . . . . . . . . . . . . . . . . . (1.0) (0.1) (0.1)Increases related to current year tax positions . . . . . . . . . . . . . . . . . . . (0.3) (1.5) (1.3)Decreases related to prior years’ tax positions(b) . . . . . . . . . . . . . . . . 0.9 64.8 —Settlements with taxing authorities(c) . . . . . . . . . . . . . . . . . . . . . . . . . 0.5 106.2 —Expiration of the statute of limitations(d) . . . . . . . . . . . . . . . . . . . . . . 0.9 1.7 1.1
Balance at December 31 . . . . . . . . . . . . . . . . . . . . . . . . . . . . . . . . . . . . . . $(4.4) $ (5.4) $(111.3)
(a) In 2013, PCA acquired $65.2 million of gross unrecognized tax benefits from Boise Inc. that relate primarilyto the taxability of the alternative energy tax credits.
(b) The 2013 amount includes a $64.3 million gross decrease related to the taxability of the alternative energytax credits claimed in 2009 excise tax returns by Boise Inc. For further discussion regarding these credits,see Note 7, Alternative Energy Tax Credits.
(c) The 2013 amount includes a $104.7 million gross decrease related to the conclusion of the Internal RevenueService audit of PCA’s alternative energy tax credits. For further discussion regarding these credits, seeNote 7, Alternative Energy Tax Credits.
(d) In 2014, 2013, and 2012, various state statutes of limitations expired. As a result, the reserve forunrecognized tax benefits decreased by $0.9 million gross, $1.7 million gross, and $1.1 million gross,respectively.
At December 31, 2014, PCA had recorded a $4.4 million gross reserve for unrecognized tax benefits,excluding interest and penalties. Of the total, $3.5 million (net of the federal benefit for state taxes) would impactthe effective tax rate if recognized.
PCA recognizes interest accrued related to unrecognized tax benefits and penalties as income tax expense.Related to the unrecognized tax benefits noted in the table above, PCA accrued interest of $0.2 million gross and$3.3 million gross during 2014 and 2013, respectively. At both December 31, 2014 and 2013, after the decreasesand settlements noted in the table above, PCA had a recorded liability for interest of $0.4 million gross. Penaltiesin 2014 and 2013 were not significant. PCA does not expect the unrecognized tax benefits to change significantlyover the next 12 months.
PCA is subject to taxation in the United States and various state and foreign jurisdicitions. A federalexamination of the tax years 2008 and 2009 was concluded in November 2013, and tax years 2010—2012 wereconcluded in February 2015. The tax years 2013—2014 remain open to federal examination. The tax years2010—2014 remain open to state examinations. Some foreign tax jurisdictions are open to examination for the2008 tax year forward. Through the Boise acquisition, PCA recorded net operating losses and creditcarryforwards from 2008 through 2011 and 2013 that are subject to examinations and adjustments for at leastthree years following the year in which utilized.
59

7. Alternative Energy Tax Credits
The Company generates black liquor as a by-product of its pulp manufacturing process, which entitled it tocertain federal income tax credits. When black liquor is mixed with diesel, it is considered an alternative fuel thatwas eligible for a $0.50 per gallon refundable alternative energy tax credit for gallons produced beforeDecember 31, 2009. Black liquor is also eligible for a $1.01 per gallon taxable cellulosic biofuel producer creditfor gallons of black liquor produced and used in 2009. The Company first recorded income relating to thesecredits in its Consolidated Statement of Income for the year ended December 31, 2009.
During 2010, the Internal Revenue Service (IRS) released guidance related to the alternative energy creditswhich resulted in: (1) the Company releasing a reserve that was established in 2009 for ambiguity in thecalculation of the alternative energy tax credit; (2) reallocation of gallons of black liquor from the alternativeenergy tax credit to the cellulosic biofuel credit; and (3) the determination that the Company’s proprietary biofuelprocess at its Filer City, Michigan mill would likely qualify for the cellulosic biofuel producer credit. TheCompany amended its 2009 federal income tax return in December 2010 to claim the additional Filer Citygallons. As a result of these changes, the Company recorded a charge of $86.3 million in “Alternative energy taxcredits” and a $135.5 million benefit in the “(Provision) benefit for income taxes”. Additional expenses of$1.6 million related to the alternative energy tax credits were also recorded, resulting in total income of $47.7million recorded in 2010. In addition, the Company recorded in 2010 a reserve for unrecognized tax benefitsunder ASC 740, “Income Taxes,” of $102.0 million (net of the federal benefit for state taxes) because the IRSguidelines do not specifically address the unique and proprietary nature of the Filer City mill process anduncertainty existed.
On February 3, 2012, PCA again amended its 2009 federal tax return to reallocate claimed gallons fromcellulosic biofuel producer credits to alternative energy tax credits. As a result of this change, the Companyrecorded a charge of $118.5 million in “(Provision) benefit for income taxes” and income of $95.5 million in“Alternative energy tax credits”, together resulting in a first quarter 2012 non-cash, after-tax charge of$23.0 million. In the fourth quarter of 2012, PCA recorded after-tax income of $3.4 million for the amendment ofthe 2009 state income tax returns related to the federal amendment filed in February 2012. The net impact ofthese changes resulted in a non-cash, after-tax charge of $19.6 million for the year ended December 31, 2012.
The IRS completed its audit of PCA’s 2008 and 2009 Federal income tax returns and all claimed alternativeenergy tax credits were allowed. In November 2013, PCA received a confirmation letter from the JointCommittee on Taxation that their review was also complete. As a result, a $103.9 million ($102.0 million of taxplus $1.9 million of accrued interest) reserve for unrecognized tax benefits for the Filer City mill’s cellulosicbiofuel tax credit was fully reversed as a benefit to income taxes in the fourth quarter of 2013.
In November 2013, an IRS Chief Counsel Memorandum was published that provided guidance concerningthe taxability of the alternative energy tax credits. Based on this new fact, PCA reversed a $62.1 million (net ofthe federal benefit for state taxes) reserve for unrecognized tax benefits acquired from Boise for the taxability ofthe 2009 alternative energy tax credits that Boise had claimed through excise tax refunds as a benefit to incometaxes in the fourth quarter of 2013. This resulted in a reduction in “Other long-term liabilities” of $13.1 millionand the recording of a deferred tax asset to increase the net operating loss carryforwards recorded in deferredtaxes by $49.0 million.
8. Goodwill and Intangible Assets
Goodwill
Goodwill represents the excess of the cost of an acquired business over the fair value of the identifiabletangible and intangible assets acquired and liabilities assumed in a business combination. At December 31, 2014and 2013, we had $491.6 million and $472.9 million, respectively, of goodwill recorded in our Packagingsegment and $55.2 million and $53.9 million, respectively, in our Paper segment on our Consolidated BalanceSheets.
60

Changes in the carrying amount of our goodwill were as follows (dollars in millions):
Packaging Paper Goodwill
Balance at January 1, 2013 . . . . . . . . . . . . . . . . . . . . . . . . . . . . . . . . . . $ 67.2 $ — $ 67.2Acquisitions . . . . . . . . . . . . . . . . . . . . . . . . . . . . . . . . . . . . . . . . . . . . . . 405.7 53.9 459.6
Balance at December 31, 2013 . . . . . . . . . . . . . . . . . . . . . . . . . . . . . . . 472.9 53.9 526.8Acquisitions (a) . . . . . . . . . . . . . . . . . . . . . . . . . . . . . . . . . . . . . . . . . . . 12.2 — 12.2Adjustments related to purchase accounting (b) . . . . . . . . . . . . . . . . . . 6.5 1.3 7.8
Balance at December 31, 2014 . . . . . . . . . . . . . . . . . . . . . . . . . . . . . . . $491.6 $55.2 $546.8
(a) In April 2014, we acquired the assets of Crockett Packaging, a corrugated products manufacturer, for $21.2million, before $0.7 million of working capital adjustments, and recorded $12.2 million of goodwill in ourPackaging segment.
(b) Adjustments relate primarily to the Boise acquisition, see Note 3, Acquisitions, for more information.
Intangible Assets
Intangible assets are comprised of customer relationships and trademarks and trade names.
The weighted average useful life, gross carrying amount, and accumulated amortization of our intangibleassets were as follows (dollars in millions):
As of December 31, 2014 As of December 31, 2013
WeightedAverage
RemainingUseful Life(in Years)
GrossCarryingAmount
AccumulatedAmortization
WeightedAverage
RemainingUseful Life(in Years)
GrossCarryingAmount
AccumulatedAmortization
Customer relationships . . . . . . . . . . . . . . 14.3 $311.5 $36.9 15.4 $306.4 $16.5Trademarks and trade names . . . . . . . . . 13.4 21.8 3.0 14.7 21.4 0.8Other . . . . . . . . . . . . . . . . . . . . . . . . . . . . 2.2 0.2 0.1 3.0 0.2 0.1
Total intangible assets (excludinggoodwill) . . . . . . . . . . . . . . . . . . . . . . . 14.2 $333.5 $40.0 15.4 $328.0 $17.4
Amortization expense was $22.6 million, $6.4 million, and $3.1 million for the years ended December 31,2014, 2013, and 2012, respectively. Estimated amortization expense of intangible assets over the next five yearsis expected to approximate $22.6 million (2015), $22.5 million (2016), $22.4 million (2017), $22.2 million(2018), and $21.3 million (2019).
Impairment Testing
We test goodwill for impairment annually in the fourth quarter as of October 1 or sooner if events orchanges in circumstances indicate that the carrying value of the asset may exceed fair value. Additionally, whenwe experience changes to our business or operating environment, we evaluate the remaining useful lives of ourfinite-lived purchased intangible assets to determine whether any adjustments to the useful lives are necessary.We completed our test in the fourth quarter as of October 1, 2014, and there is no indication of goodwill orintangible asset impairment.
61
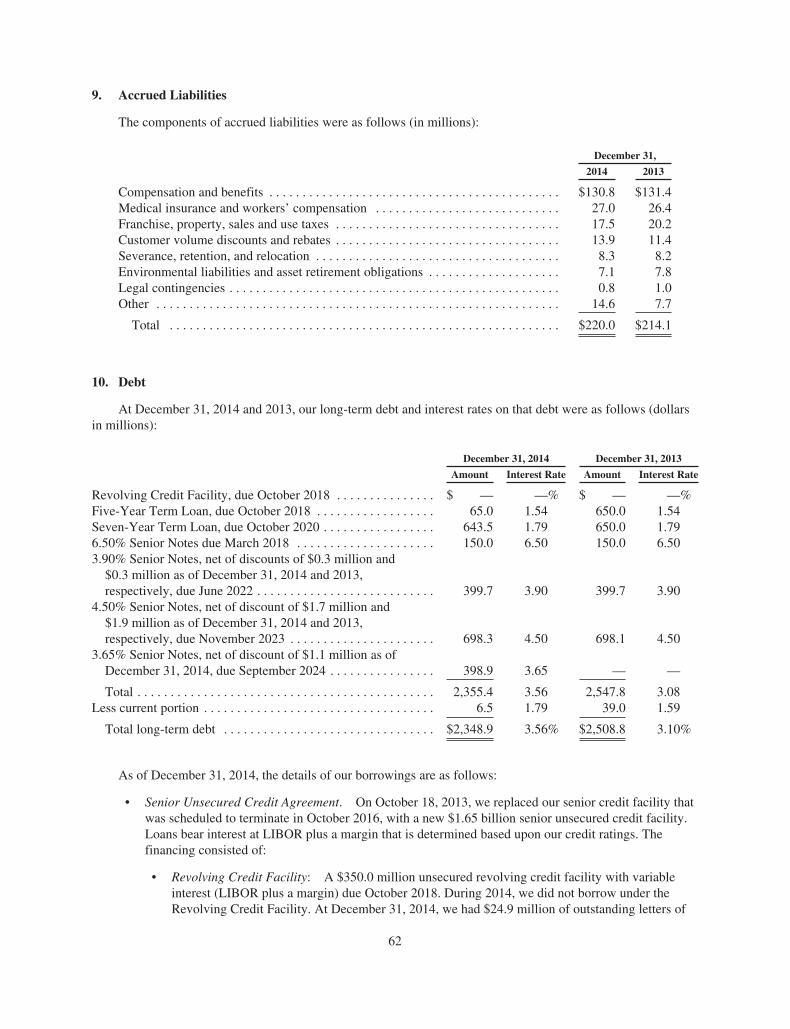
9. Accrued Liabilities
The components of accrued liabilities were as follows (in millions):
December 31,
2014 2013
Compensation and benefits . . . . . . . . . . . . . . . . . . . . . . . . . . . . . . . . . . . . . . . . . . . . $130.8 $131.4Medical insurance and workers’ compensation . . . . . . . . . . . . . . . . . . . . . . . . . . . . 27.0 26.4Franchise, property, sales and use taxes . . . . . . . . . . . . . . . . . . . . . . . . . . . . . . . . . . 17.5 20.2Customer volume discounts and rebates . . . . . . . . . . . . . . . . . . . . . . . . . . . . . . . . . . 13.9 11.4Severance, retention, and relocation . . . . . . . . . . . . . . . . . . . . . . . . . . . . . . . . . . . . . 8.3 8.2Environmental liabilities and asset retirement obligations . . . . . . . . . . . . . . . . . . . . 7.1 7.8Legal contingencies . . . . . . . . . . . . . . . . . . . . . . . . . . . . . . . . . . . . . . . . . . . . . . . . . . 0.8 1.0Other . . . . . . . . . . . . . . . . . . . . . . . . . . . . . . . . . . . . . . . . . . . . . . . . . . . . . . . . . . . . . 14.6 7.7
Total . . . . . . . . . . . . . . . . . . . . . . . . . . . . . . . . . . . . . . . . . . . . . . . . . . . . . . . . . . . $220.0 $214.1
10. Debt
At December 31, 2014 and 2013, our long-term debt and interest rates on that debt were as follows (dollarsin millions):
December 31, 2014 December 31, 2013
Amount Interest Rate Amount Interest Rate
Revolving Credit Facility, due October 2018 . . . . . . . . . . . . . . . $ — —% $ — —%Five-Year Term Loan, due October 2018 . . . . . . . . . . . . . . . . . . 65.0 1.54 650.0 1.54Seven-Year Term Loan, due October 2020 . . . . . . . . . . . . . . . . . 643.5 1.79 650.0 1.796.50% Senior Notes due March 2018 . . . . . . . . . . . . . . . . . . . . . 150.0 6.50 150.0 6.503.90% Senior Notes, net of discounts of $0.3 million and
$0.3 million as of December 31, 2014 and 2013,respectively, due June 2022 . . . . . . . . . . . . . . . . . . . . . . . . . . . 399.7 3.90 399.7 3.90
4.50% Senior Notes, net of discount of $1.7 million and$1.9 million as of December 31, 2014 and 2013,respectively, due November 2023 . . . . . . . . . . . . . . . . . . . . . . 698.3 4.50 698.1 4.50
3.65% Senior Notes, net of discount of $1.1 million as ofDecember 31, 2014, due September 2024 . . . . . . . . . . . . . . . . 398.9 3.65 — —
Total . . . . . . . . . . . . . . . . . . . . . . . . . . . . . . . . . . . . . . . . . . . . . 2,355.4 3.56 2,547.8 3.08Less current portion . . . . . . . . . . . . . . . . . . . . . . . . . . . . . . . . . . . 6.5 1.79 39.0 1.59
Total long-term debt . . . . . . . . . . . . . . . . . . . . . . . . . . . . . . . . $2,348.9 3.56% $2,508.8 3.10%
As of December 31, 2014, the details of our borrowings are as follows:
• Senior Unsecured Credit Agreement. On October 18, 2013, we replaced our senior credit facility thatwas scheduled to terminate in October 2016, with a new $1.65 billion senior unsecured credit facility.Loans bear interest at LIBOR plus a margin that is determined based upon our credit ratings. Thefinancing consisted of:
• Revolving Credit Facility: A $350.0 million unsecured revolving credit facility with variableinterest (LIBOR plus a margin) due October 2018. During 2014, we did not borrow under theRevolving Credit Facility. At December 31, 2014, we had $24.9 million of outstanding letters of
62

credit that were considered outstanding on the revolving credit facility, resulting in $325.1 millionof unused borrowing capacity. The outstanding letters of credit were primarily for workerscompensation. We are required to pay commitment fees on the unused portions of the creditfacility.
• Five-Year Term Loan: A $650.0 million unsecured term loan with variable interest (LIBOR plus1.375%), payable quarterly, due October 2018. The balance outstanding at December 31, 2014was $65.0 million.
• Seven-Year Term Loan: A $650.0 million unsecured term loan with variable interest (LIBORplus 1.625%), payable quarterly, due October 2020. The balance outstanding at December 31,2014 was $643.5 million.
• 6.50% Senior Notes. On March 25, 2008, we issued $150.0 million of 6.50% senior notes dueMarch 15, 2018, through a registered public offering.
• 3.90% Senior Notes. On June 26, 2012, we issued $400.0 million of 3.90% senior notes due June 15,2022, through a registered public offering.
• 4.50% Senior Notes. On October 22, 2013, we issued $700.0 million of 4.50% senior notes dueNovember 1, 2023, through a registered public offering.
• 3.65% Senior Notes. On September 5, 2014, we issued $400.0 million of 3.65% fixed-rate seniornotes due September 15, 2024, through a registered public offering. In connection with the $400.0million debt issuance, we paid $3.4 million of deferred financing costs, which we are amortizing tointerest expense using the effective interest method over the term of the debt.
The instruments governing our indebtedness contain financial and other covenants that limit the ability ofPCA and its subsidiaries to enter into sale and leaseback transactions, incur liens, incur indebtedness at thesubsidiary level, enter into certain transactions with affiliates, merge or consolidate with any other person or sellor otherwise dispose of all or substantially all of our assets. Our credit facility also requires us to comply withcertain financial covenants, including maintaining a minimum interest coverage ratio and a maximum leverageratio. A failure to comply with these restrictions could lead to an event of default, which could result in anacceleration of any outstanding indebtedness and/or prohibit us from drawing on the revolving credit facility.Such an acceleration may also constitute an event of default under the senior notes indenture. At December 31,2014, we were in compliance with these covenants.
At December 31, 2014, we have $1,646.9 million of fixed-rate senior notes and $708.5 million of variable-rate term loans outstanding. At December 31, 2014, the fair value of our fixed-rate debt was estimated to be$1,707.5 million. The difference between the book value and fair value is due to the difference between theperiod-end market interest rate and the stated rate of our fixed-rate debt. We estimated the fair value of our fixed-rate debt using quoted market prices (Level 2 inputs), discussed further in Note 2, Summary of SignificantAccounting Policies. The fair value of our variable-rate term debt approximates the carrying amount as our costof borrowing is variable and approximates current market rates.
Repayments, Interest, and Other
In 2014, we used the proceeds of our $400.0 million of 3.65% fixed-rate senior notes offering and other cashfrom operations to repay $591.5 million of debt outstanding under the Five-Year and Seven-Year Term Loans.
On December 23, 2013, we repaid in full the $109.0 million that was outstanding under, and terminated, thereceivables credit facility that was scheduled to terminate on October 11, 2014.
In October 2013, we used debt and cash on hand to finance the acquisition of Boise, repay $953.6 million ofindebtedness, which included $829.8 million of acquired Boise debt, and for general corporate purposes.
63

On July 26, 2012, we used the proceeds of our $400.0 million of 3.90% senior notes offering issued June 26,2012, and cash on hand to redeem our 5.75% notes for $432.5 million, which included a redemption premium of$21.3 million and $11.2 million of accrued and unpaid interest.
As of December 31, 2014, annual principal maturities for debt, excluding unamortized debt discount, are:$6.5 million each year for 2015, 2016, and 2017; $221.5 million for 2018; $6.5 million for 2019; and $2.1 billionfor 2020 and thereafter.
At both December 31, 2014 and 2013, the reference interest rate (LIBOR) of our variable rate debt for bothour Five-Year Term Loan, due October 2018, and Seven-Year Term Loan, due October 2020, was 0.17%. Theapplicable margin of our variable rate debt at both December 31, 2014 and 2013, for our Five-Year Term Loan,due October 2018, and Seven-Year Term Loan, due October 2020, was 1.375% and 1.625%, respectively.
Interest payments and redemption premium payments paid in connection with the Company’s debtobligations for the years ended December 31, 2014, 2013, and 2012, were $77.0 million, $105.7 million(including a $54.8 million redemption premium related to the acquired Boise Inc. debt), and $66.3 million(including a $21.3 million redemption premium), respectively.
Included in interest expense, net, are amortization of financing costs and amortization of treasury locksettlements. Amortization of treasury lock settlements was a $5.7 million net loss for both the years endedDecember 31, 2014 and 2013, and a $3.0 million net loss for the year ended December 31, 2012. Amortization offinancing costs for the years ended December 31, 2014, 2013, and 2012, was $3.3 million (including $1.5 millionof deferred financing costs), $10.3 million (including $8.2 million for acquisition-related financing fees), and$1.1 million, respectively.
11. Employee Benefit Plans and Other Postretirement Benefits
PCA has defined pension benefit plans for both salaried and hourly employees. The plans covering salariedemployees are closed to new entrants with only certain current active participants still accruing benefits. Theplans covering certain hourly employees are closed to new participants. We also have a Supplemental ExecutiveRetirement Plan (SERP) and other nonqualified defined benefit pension plans that provide unfundedsupplemental retirement benefits to certain of our executives and former executives. The SERP provides forincremental pension benefits in excess of those offered in our principal pension plans.
Other Postretirement Benefits
PCA provides postretirement medical benefits for certain salaried employees and postretirement medicaland life insurance benefits for certain hourly employees. For salaried employees, the plan covers employeesretiring from PCA on or after attaining age 58 who have had at least 10 years of full-time service with PCA afterattaining age 48. For hourly employees, the postretirement medical and life insurance coverage, whereapplicable, is available according to the eligibility provisions contained in the applicable collective bargainingagreement in effect at the employee’s work location.
64

Obligations and Funded Status of Defined Benefit Pension and Other Postretirement Benefits Plans
The funded status of PCA’s plans change from year to year based on the plan asset investment return,contributions, benefit payments, the discount rate used to measure the liability, and expected participantlongevity. The following table, which includes only company-sponsored defined benefit and other postretirementbenefit plans, reconciles the beginning and ending balances of the projected benefit obligation and the fair valueof plan assets. We recognize the unfunded status of these plans on the Consolidated Balance Sheets, and werecognize changes in funded status in the year changes occur through the Consolidated Statements ofComprehensive Income (dollars in millions):
Pension Plans Postretirement Plans
Year Ended December 31 Year Ended December 31
2014 2013 2014 2013
Change in Benefit ObligationBenefit obligation at beginning of period . . . . . . . . . . . . . . . . $ 929.8 $ 378.7 $ 26.3 $ 31.8Service cost . . . . . . . . . . . . . . . . . . . . . . . . . . . . . . . . . . . . . . . 22.7 24.5 1.6 2.1Interest cost . . . . . . . . . . . . . . . . . . . . . . . . . . . . . . . . . . . . . . . 45.9 21.5 1.2 1.3Plan amendments (a) . . . . . . . . . . . . . . . . . . . . . . . . . . . . . . . . 2.6 13.8 — —Actuarial (gain) loss (b) . . . . . . . . . . . . . . . . . . . . . . . . . . . . . 159.2 (53.5) 4.1 (7.8)Acquisitions . . . . . . . . . . . . . . . . . . . . . . . . . . . . . . . . . . . . . . . — 554.0 — 0.2Special termination benefits . . . . . . . . . . . . . . . . . . . . . . . . . . 0.3 — — —Participant contributions . . . . . . . . . . . . . . . . . . . . . . . . . . . . . — — 1.2 1.2Benefits paid . . . . . . . . . . . . . . . . . . . . . . . . . . . . . . . . . . . . . . (30.9) (9.2) (2.5) (2.5)
Benefit obligation at plan year end . . . . . . . . . . . . . . . . . . . . . $1,129.6 $ 929.8 $ 31.9 $ 26.3
Accumulated benefit obligation portion of above . . . . . . . . . . . . $1,078.6 $ 884.0
Change in Fair Value of Plan AssetsPlan assets at fair value at beginning of period . . . . . . . . . . . . $ 772.1 $ 238.4 $ — $ —Acquisitions . . . . . . . . . . . . . . . . . . . . . . . . . . . . . . . . . . . . . . . — 486.2 — —Actual return on plan assets . . . . . . . . . . . . . . . . . . . . . . . . . . 63.4 26.6 — —Company contributions . . . . . . . . . . . . . . . . . . . . . . . . . . . . . . 1.3 30.1 1.3 1.3Participant contributions . . . . . . . . . . . . . . . . . . . . . . . . . . . . . — — 1.2 1.2Benefits paid . . . . . . . . . . . . . . . . . . . . . . . . . . . . . . . . . . . . . . (30.9) (9.2) (2.5) (2.5)
Fair value of plan assets at plan year end . . . . . . . . . . . . . . . . $ 805.9 $ 772.1 $ — $ —
Underfunded status . . . . . . . . . . . . . . . . . . . . . . . . . . . . . . . . . $ (323.7) $(157.7) $(31.9) $(26.3)
Amounts Recognized on Consolidated Balance SheetsCurrent liabilities . . . . . . . . . . . . . . . . . . . . . . . . . . . . . . . . . . . $ (1.1) $ (0.8) $ (1.4) $ (1.2)Noncurrent liabilities . . . . . . . . . . . . . . . . . . . . . . . . . . . . . . . . (322.6) (156.9) (30.5) (25.1)
Accrued obligation recognized at December 31 . . . . . . . . . . . $ (323.7) $(157.7) $(31.9) $(26.3)
Amounts Recognized in Accumulated Other Comprehensive(Income) Loss (Pre-Tax)Prior service cost . . . . . . . . . . . . . . . . . . . . . . . . . . . . . . . . . . . $ 27.6 $ 31.6 $ 0.3 $ 0.1Actuarial loss . . . . . . . . . . . . . . . . . . . . . . . . . . . . . . . . . . . . . . 172.6 26.7 5.5 1.4
Total . . . . . . . . . . . . . . . . . . . . . . . . . . . . . . . . . . . . . . . . . . . . $ 200.2 $ 58.3 $ 5.8 $ 1.5
(a) In 2013, the United Steel Workers (USW) ratified a master labor agreement with PCA under which certainUSW-represented employees will have their pension accruals frozen under PCA’s hourly pension plan,resulting in most of the $13.8 million increase in benefit obligations.
(b) The actuarial loss in 2014 is due primarily to a decrease in the weighted average discount rate and also ouruse of recently updated mortality assumptions from the Society of Actuaries which reflect longer expectedparticipant longevity. In 2013, the discount rate increased resulting in an actuarial gain.
65
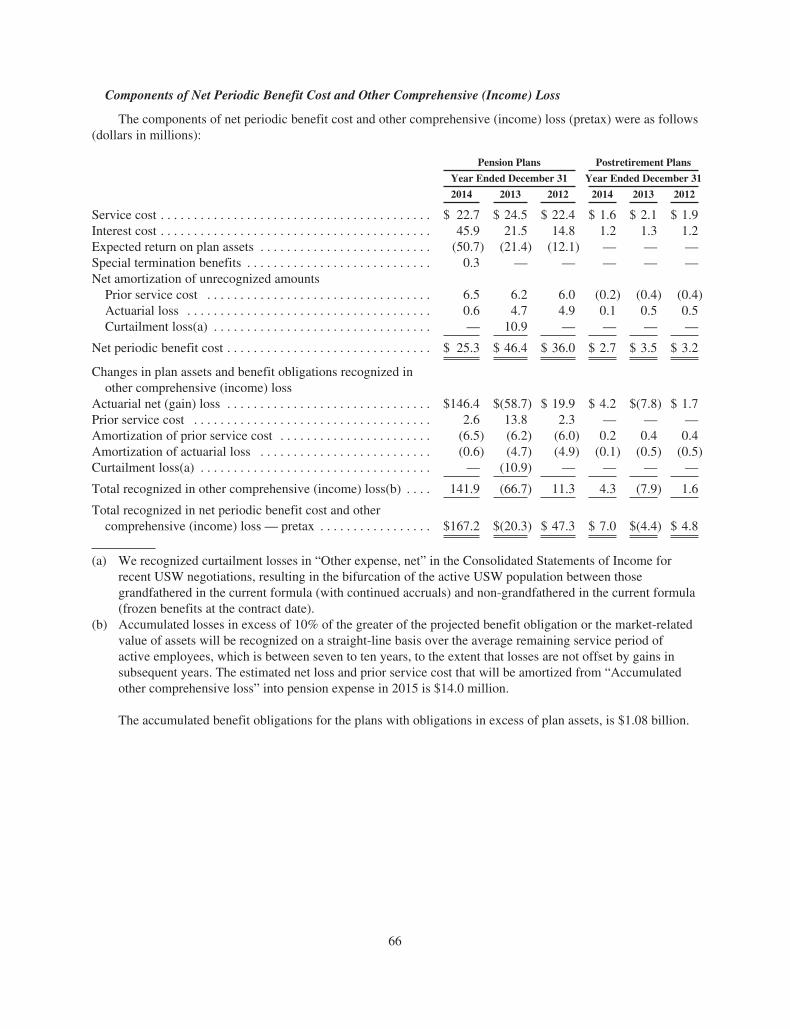
Components of Net Periodic Benefit Cost and Other Comprehensive (Income) Loss
The components of net periodic benefit cost and other comprehensive (income) loss (pretax) were as follows(dollars in millions):
Pension Plans Postretirement Plans
Year Ended December 31 Year Ended December 31
2014 2013 2012 2014 2013 2012
Service cost . . . . . . . . . . . . . . . . . . . . . . . . . . . . . . . . . . . . . . . . . $ 22.7 $ 24.5 $ 22.4 $ 1.6 $ 2.1 $ 1.9Interest cost . . . . . . . . . . . . . . . . . . . . . . . . . . . . . . . . . . . . . . . . . 45.9 21.5 14.8 1.2 1.3 1.2Expected return on plan assets . . . . . . . . . . . . . . . . . . . . . . . . . . (50.7) (21.4) (12.1) — — —Special termination benefits . . . . . . . . . . . . . . . . . . . . . . . . . . . . 0.3 — — — — —Net amortization of unrecognized amounts
Prior service cost . . . . . . . . . . . . . . . . . . . . . . . . . . . . . . . . . . 6.5 6.2 6.0 (0.2) (0.4) (0.4)Actuarial loss . . . . . . . . . . . . . . . . . . . . . . . . . . . . . . . . . . . . . 0.6 4.7 4.9 0.1 0.5 0.5Curtailment loss(a) . . . . . . . . . . . . . . . . . . . . . . . . . . . . . . . . . — 10.9 — — — —
Net periodic benefit cost . . . . . . . . . . . . . . . . . . . . . . . . . . . . . . . $ 25.3 $ 46.4 $ 36.0 $ 2.7 $ 3.5 $ 3.2
Changes in plan assets and benefit obligations recognized inother comprehensive (income) loss
Actuarial net (gain) loss . . . . . . . . . . . . . . . . . . . . . . . . . . . . . . . $146.4 $(58.7) $ 19.9 $ 4.2 $(7.8) $ 1.7Prior service cost . . . . . . . . . . . . . . . . . . . . . . . . . . . . . . . . . . . . 2.6 13.8 2.3 — — —Amortization of prior service cost . . . . . . . . . . . . . . . . . . . . . . . (6.5) (6.2) (6.0) 0.2 0.4 0.4Amortization of actuarial loss . . . . . . . . . . . . . . . . . . . . . . . . . . (0.6) (4.7) (4.9) (0.1) (0.5) (0.5)Curtailment loss(a) . . . . . . . . . . . . . . . . . . . . . . . . . . . . . . . . . . . — (10.9) — — — —
Total recognized in other comprehensive (income) loss(b) . . . . 141.9 (66.7) 11.3 4.3 (7.9) 1.6
Total recognized in net periodic benefit cost and othercomprehensive (income) loss — pretax . . . . . . . . . . . . . . . . . $167.2 $(20.3) $ 47.3 $ 7.0 $(4.4) $ 4.8
(a) We recognized curtailment losses in “Other expense, net” in the Consolidated Statements of Income forrecent USW negotiations, resulting in the bifurcation of the active USW population between thosegrandfathered in the current formula (with continued accruals) and non-grandfathered in the current formula(frozen benefits at the contract date).
(b) Accumulated losses in excess of 10% of the greater of the projected benefit obligation or the market-relatedvalue of assets will be recognized on a straight-line basis over the average remaining service period ofactive employees, which is between seven to ten years, to the extent that losses are not offset by gains insubsequent years. The estimated net loss and prior service cost that will be amortized from “Accumulatedother comprehensive loss” into pension expense in 2015 is $14.0 million.
The accumulated benefit obligations for the plans with obligations in excess of plan assets, is $1.08 billion.
66

Assumptions
The following table presents the assumptions used in the measurement of our benefits obligations:
Pension Plans Postretirement Plans
December 31 December 31
2014 2013 2012 2014 2013 2012
Weighted-Average Assumptions Used to Determine BenefitObligations at December 31Discount rate . . . . . . . . . . . . . . . . . . . . . . . . . . . . . . . . . . . . . . . . 4.14% 5.00% 4.25% 3.95% 4.85% 4.00%Rate of compensation increase . . . . . . . . . . . . . . . . . . . . . . . . . . 4.00% 4.00% 4.00% N/A N/A N/A
Weighted-Average Assumptions Used to Determine Net PeriodicBenefit Cost for the Years Ended December 31Discount rate . . . . . . . . . . . . . . . . . . . . . . . . . . . . . . . . . . . . . . . . 5.00% 4.57% 4.75% 4.85% 4.00% 4.50%Expected return on plan assets . . . . . . . . . . . . . . . . . . . . . . . . . . 6.69% 6.53% 6.15% N/A N/A N/ARate of compensation increase . . . . . . . . . . . . . . . . . . . . . . . . . . 4.00% 4.00% 4.00% N/A N/A N/A
Discount Rate Assumption. The discount rate reflects the current rate at which the pension obligationscould be settled on the measurement date: December 31. The discount rate assumption used to calculate thepresent value of pension and postretirement benefit obligations reflects the rates available on high-quality, fixed-income debt instruments on December 31. In all periods, the bonds included in the models reflect anticipatedinvestments that would be made to match the expected monthly benefit payments over time. The plans’ projectedcash flows were duration-matched to these models to develop an appropriate discount rate. The discount ratePCA will use in 2015 to calculate the net periodic pension benefit and postretirement benefit cost is 4.14% and3.95%, respectively.
Asset Return Assumption. The expected return on plan assets reflects the expected long-term rates ofreturn for the categories of investments currently held in the plans as well as anticipated returns for additionalcontributions made in the future. The expected long-term rate of return is adjusted when there are fundamentalchanges in expected returns on the plan investments. The weighted-average expected return on plan assets wewill use in our calculation of 2015 net periodic pension benefit cost is 6.73%.
Rate of Compensation Increase. The rate of compensation increase is determined by PCA based uponannual reviews. The compensation increase assumption is not applicable for all plans as many of our pensionplans are frozen and not accruing benefits.
Health Care Cost Trend Rate Assumptions. PCA assumed health care cost trend rates for its postretirementbenefits plans were as follows:
2014 2013 2012
Health care cost trend rate assumed for next year . . . . . . . . . . . . . . . . . . . . . . . . . . 7.75% 7.75% 8.00%Rate to which the cost trend rate is assumed to decline (the ultimate trend rate) . . . 5.00% 5.00% 5.00%Year that the rate reaches the ultimate trend rate . . . . . . . . . . . . . . . . . . . . . . . . . . 2023 2020 2020
Postretirement Health Care Plan Assumptions. For postretirement health care plan accounting, PCAreviews external data and its own historical trends for health care costs to determine the health care cost trendrate assumption.
67
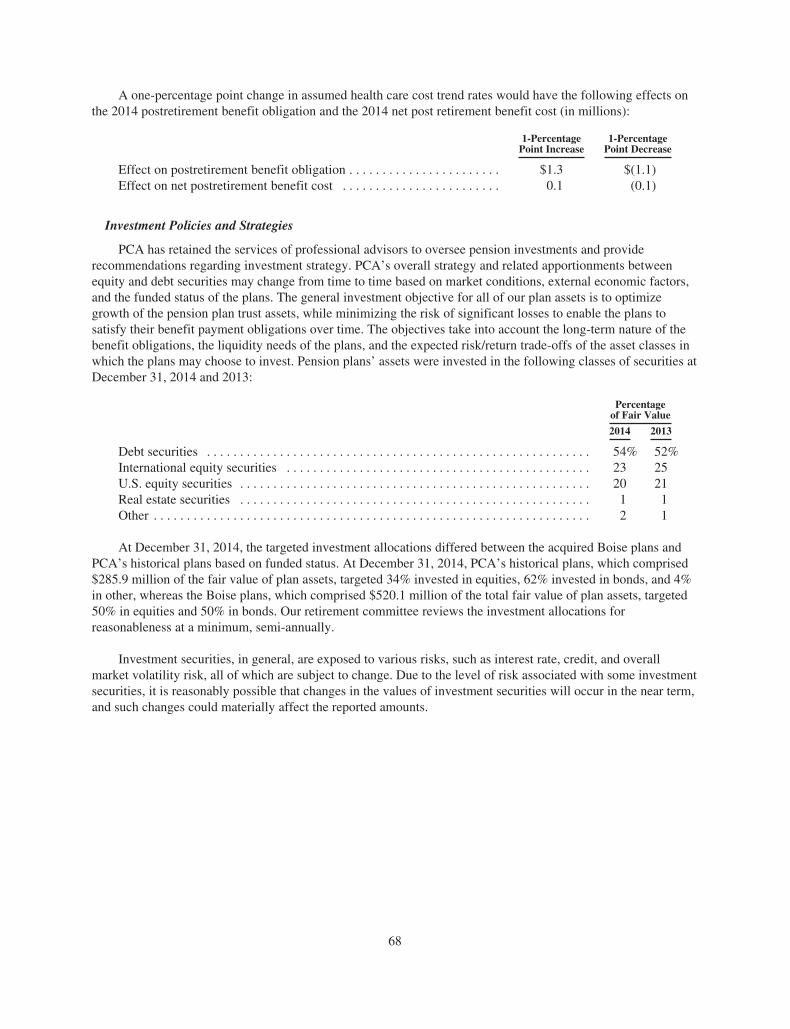
A one-percentage point change in assumed health care cost trend rates would have the following effects onthe 2014 postretirement benefit obligation and the 2014 net post retirement benefit cost (in millions):
1-PercentagePoint Increase
1-PercentagePoint Decrease
Effect on postretirement benefit obligation . . . . . . . . . . . . . . . . . . . . . . . $1.3 $(1.1)Effect on net postretirement benefit cost . . . . . . . . . . . . . . . . . . . . . . . . 0.1 (0.1)
Investment Policies and Strategies
PCA has retained the services of professional advisors to oversee pension investments and providerecommendations regarding investment strategy. PCA’s overall strategy and related apportionments betweenequity and debt securities may change from time to time based on market conditions, external economic factors,and the funded status of the plans. The general investment objective for all of our plan assets is to optimizegrowth of the pension plan trust assets, while minimizing the risk of significant losses to enable the plans tosatisfy their benefit payment obligations over time. The objectives take into account the long-term nature of thebenefit obligations, the liquidity needs of the plans, and the expected risk/return trade-offs of the asset classes inwhich the plans may choose to invest. Pension plans’ assets were invested in the following classes of securities atDecember 31, 2014 and 2013:
Percentageof Fair Value
2014 2013
Debt securities . . . . . . . . . . . . . . . . . . . . . . . . . . . . . . . . . . . . . . . . . . . . . . . . . . . . . . . . . . 54% 52%International equity securities . . . . . . . . . . . . . . . . . . . . . . . . . . . . . . . . . . . . . . . . . . . . . . 23 25U.S. equity securities . . . . . . . . . . . . . . . . . . . . . . . . . . . . . . . . . . . . . . . . . . . . . . . . . . . . . 20 21Real estate securities . . . . . . . . . . . . . . . . . . . . . . . . . . . . . . . . . . . . . . . . . . . . . . . . . . . . . 1 1Other . . . . . . . . . . . . . . . . . . . . . . . . . . . . . . . . . . . . . . . . . . . . . . . . . . . . . . . . . . . . . . . . . . 2 1
At December 31, 2014, the targeted investment allocations differed between the acquired Boise plans andPCA’s historical plans based on funded status. At December 31, 2014, PCA’s historical plans, which comprised$285.9 million of the fair value of plan assets, targeted 34% invested in equities, 62% invested in bonds, and 4%in other, whereas the Boise plans, which comprised $520.1 million of the total fair value of plan assets, targeted50% in equities and 50% in bonds. Our retirement committee reviews the investment allocations forreasonableness at a minimum, semi-annually.
Investment securities, in general, are exposed to various risks, such as interest rate, credit, and overallmarket volatility risk, all of which are subject to change. Due to the level of risk associated with some investmentsecurities, it is reasonably possible that changes in the values of investment securities will occur in the near term,and such changes could materially affect the reported amounts.
68

Fair Value Measurements of Plan Assets
The following tables set forth, by level within the fair value hierarchy, discussed in Note 2, Summary ofSignificant Accounting Policies, the pension plan assets, by major asset category, at fair value at December 31,2014 and 2013 (dollars in millions):
Fair Value Measurements at December 31, 2014
Asset Category
Quoted Prices in ActiveMarkets for Identical
Assets (Level 1)
Significant OtherObservable
Inputs (Level 2)
SignificantUnobservable
Inputs (Level 3) Total
Short-term investments(a) . . . . . . . . . . . . . . . . . $ — $ 1.8 $ — $ 1.8Mutual funds(b):
U.S. large value . . . . . . . . . . . . . . . . . . . . . . . . 14.8 — — 14.8U.S. large growth . . . . . . . . . . . . . . . . . . . . . . 11.6 — — 11.6U.S. mid-cap value . . . . . . . . . . . . . . . . . . . . . 3.0 — — 3.0U.S. mid-cap growth . . . . . . . . . . . . . . . . . . . . 8.8 — — 8.8Foreign large blend . . . . . . . . . . . . . . . . . . . . . 41.9 — — 41.9Diversified emerging markets . . . . . . . . . . . . 8.0 — — 8.0Real estate . . . . . . . . . . . . . . . . . . . . . . . . . . . . 8.9 — — 8.9Fixed income . . . . . . . . . . . . . . . . . . . . . . . . . 178.2 — — 178.2
Common/collective trust funds(a):U.S. large-cap equity blend . . . . . . . . . . . . . . — 92.9 — 92.9U.S. small and mid-cap equity blend . . . . . . . — 20.5 — 20.5Foreign large blend . . . . . . . . . . . . . . . . . . . . . — 128.4 — 128.4Diversified emerging markets . . . . . . . . . . . . — 9.4 — 9.4U.S. small blend . . . . . . . . . . . . . . . . . . . . . . . — 8.9 — 8.9Fixed income . . . . . . . . . . . . . . . . . . . . . . . . . — 259.3 — 259.3
Private equity securities(c) . . . . . . . . . . . . . . . . . — — 8.1 8.1
Total securities at fair value . . . . . . . . . . . . . . . . $275.2 $521.2 $8.1 $804.5
Receivables and accrued expenses . . . . . . . . . . . 1.4
Total fair value of plan assets . . . . . . . . . . . . . . . $805.9
69

Fair Value Measurements at December 31, 2013
Asset Category
Quoted Prices in ActiveMarkets for Identical
Assets (Level 1)
Significant OtherObservable
Inputs (Level 2)
SignificantUnobservable
Inputs (Level 3) Total
Short-term investments(a) . . . . . . . . . . . . . . . . . $ — $ 1.9 $ — $ 1.9Mutual funds(b):
U.S. large value . . . . . . . . . . . . . . . . . . . . . . . . 19.4 — — 19.4U.S. large growth . . . . . . . . . . . . . . . . . . . . . . 17.2 — — 17.2U.S. mid-cap value . . . . . . . . . . . . . . . . . . . . . 3.1 — — 3.1U.S. mid-cap growth . . . . . . . . . . . . . . . . . . . . 6.8 — — 6.8Foreign large blend . . . . . . . . . . . . . . . . . . . . . 45.2 — — 45.2Diversified emerging markets . . . . . . . . . . . . 8.0 — — 8.0Real estate . . . . . . . . . . . . . . . . . . . . . . . . . . . . 7.5 — — 7.5Fixed income . . . . . . . . . . . . . . . . . . . . . . . . . 54.4 — — 54.4
Common/collective trust funds(a):U.S. large-cap equity blend . . . . . . . . . . . . . . — 87.9 — 87.9U.S. small and mid-cap equity blend . . . . . . . — 19.6 — 19.6Foreign large blend . . . . . . . . . . . . . . . . . . . . . — 126.6 — 126.6Diversified emerging markets . . . . . . . . . . . . — 9.2 — 9.2Government bonds . . . . . . . . . . . . . . . . . . . . . — 35.6 — 35.6Corporate bonds . . . . . . . . . . . . . . . . . . . . . . . — 77.2 — 77.2U.S. small blend . . . . . . . . . . . . . . . . . . . . . . . — 6.8 — 6.8Fixed income . . . . . . . . . . . . . . . . . . . . . . . . . — 234.4 — 234.4
Private equity securities(c) . . . . . . . . . . . . . . . . . — — 9.9 9.9
Total securities at fair value . . . . . . . . . . . . . . . . $161.6 $599.2 $9.9 $770.7
Receivables and accrued expenses . . . . . . . . . . . 1.4
Total fair value of plan assets . . . . . . . . . . . . . . . $772.1
(a) Investments in common/collective trust funds valued using net asset values (NAV) provided by theadministrator of the funds. We use NAV as a practical expedient to fair value. The NAV is based on thevalue of the underlying assets owned by the fund, minus its liabilities, and then divided by the number ofunits outstanding. While the underlying assets are actively traded on an exchange, the funds are not. Thereare currently no redemption restrictions on these investments. There are certain funds with one-dayredeemable notice.
(b) Investments in mutual funds valued at quoted market values on the last business day of the fiscal year.(c) Investments in this category are invested in the Pantheon Global Secondary Fund IV, LP. The fund
specializes in investments in the private equity secondary market and occasionally directly in privatecompanies to maximize capital growth. Fund investments are carried at fair value as determined quarterlyusing the market approach to estimate the fair value of private investments. The market approach utilizesprices and other relevant information generated by market transactions, type of security, size of the position,degree of liquidity, restrictions on the disposition, latest round of financing data, current financial position,and operating results, among other factors. In circumstances where fair values are not provided with respectto any of the company’s fund investments, the investment advisor will seek to determine the fair value ofsuch investments based on information provided by the general partners or managers of such funds or fromother sources. Audited financial statements are provided by fund management annually. Notwithstandingthe above, the variety of valuation bases adopted and quality of management data of the ultimate underlyinginvestee companies means that there are inherent difficulties in determining the value of the investments.Amounts realized on the sale of these investments may differ from the calculated values. Boise hadoriginally committed to a $15.0 million investment, with $5.0 million of the commitment unfunded atDecember 31, 2014.
70

The following table sets forth a summary of changes in the fair value of the pension plans’ Level 3 assets forthe year ended December 31, 2014 (dollars in millions):
2014
Balance, beginning of year . . . . . . . . . . . . . . . . . . . . . . . . . . . . . . . . . . . . . . . . . . . . . . . . . . . . . . $ 9.9Acquisitions . . . . . . . . . . . . . . . . . . . . . . . . . . . . . . . . . . . . . . . . . . . . . . . . . . . . . . . . . . . . . . . . . —Purchases . . . . . . . . . . . . . . . . . . . . . . . . . . . . . . . . . . . . . . . . . . . . . . . . . . . . . . . . . . . . . . . . . . . . —Sales . . . . . . . . . . . . . . . . . . . . . . . . . . . . . . . . . . . . . . . . . . . . . . . . . . . . . . . . . . . . . . . . . . . . . . . (3.4)Unrealized gain . . . . . . . . . . . . . . . . . . . . . . . . . . . . . . . . . . . . . . . . . . . . . . . . . . . . . . . . . . . . . . . 1.6
Balance, end of year . . . . . . . . . . . . . . . . . . . . . . . . . . . . . . . . . . . . . . . . . . . . . . . . . . . . . . . . . . . $ 8.1
Funding and Cash Flows
PCA makes pension plan contributions that are sufficient to fund its actuarially determined costs, generallyequal to the minimum amounts required by the Employee Retirement Income Security Act (ERISA). From timeto time, PCA may make discretionary contributions based on the funded status of the plans, tax deductibility,income from operations, and other factors. In 2014, we contributed $1.3 million to our plans, which exceeded our2014 minimum required contributions, calculated under the pension provisions of the Highway andTransportation Funding Act passed in August 2014. We have no required minimum qualified pensionscontributions in 2015.
The following are estimated benefit payments to be paid to current plan participants by year (dollars inmillions). Qualified pension benefit payments are paid from plan assets, while nonqualified pension benefitpayments are paid by the Company.
Pension PlansPostretirement
Plans
2015 . . . . . . . . . . . . . . . . . . . . . . . . . . . . . . . . . . . . . . . . . . . . . . . . . . . . . $ 34.2 $ 1.42016 . . . . . . . . . . . . . . . . . . . . . . . . . . . . . . . . . . . . . . . . . . . . . . . . . . . . . 37.6 1.62017 . . . . . . . . . . . . . . . . . . . . . . . . . . . . . . . . . . . . . . . . . . . . . . . . . . . . . 41.5 1.72018 . . . . . . . . . . . . . . . . . . . . . . . . . . . . . . . . . . . . . . . . . . . . . . . . . . . . . 45.2 1.92019 . . . . . . . . . . . . . . . . . . . . . . . . . . . . . . . . . . . . . . . . . . . . . . . . . . . . . 49.0 2.12020 – 2024 . . . . . . . . . . . . . . . . . . . . . . . . . . . . . . . . . . . . . . . . . . . . . . . 298.3 12.1
Defined Contribution Plans
Some of our employees participate in contributory defined contribution savings plans, available to most ofour salaried and hourly employees. The defined contribution plans permit participants to make contributions bysalary reduction pursuant to Section 401(k) of the Code. PCA made employer-matching contributions of$28.3 million, $15.0 million, and $10.8 million in 2014, 2013, and 2012, respectively. The increase incontributions in 2014, compared with 2013 and 2012, relates primarily to the additional participants added in theBoise acquisition. Company matching contributions to certain full-time salaried employees are made in companystock, through our Employee Stock Ownership Plan (ESOP). All other matching contributions are in cash. Weexpense employer matching contributions and charge dividends on shares held by the ESOP to retained earnings.Shares of company stock held by the ESOP are included in basic shares for earnings-per-share computations. AtDecember 31, 2014 and 2013, the ESOP held 2.2 million and 2.1 million shares of company stock, respectively.
Certain salaried and hourly employees that are not participating in a PCA sponsored defined benefit pensionplan receive a service-related company retirement contribution to their defined contribution plan account inaddition to any employer matching contribution. This contribution increases with years of service and rangesfrom 3% to 5% of base pay. We expensed $7.4 million, $5.3 million, and $4.3 million for this retirementcontribution during the years ended December 31, 2014, 2013, and 2012, respectively.
71

Deferred Compensation Plans
Key managers can elect to participate in a deferred compensation plan. The deferred compensation plan isunfunded; therefore, benefits are paid from our general assets. At December 31, 2014 and 2013, we had$12.4 million and $12.0 million, respectively, of liabilities attributable to participation in our deferredcompensation plan on our Consolidated Balance Sheets.
12. Share-Based Compensation
The Company has a long-term equity incentive plan, which allows for grants of stock options, stockappreciation rights, restricted stock, and performance awards to directors, officers, and employees, as well asothers who engage in services for PCA. The plan, as amended, terminates May 1, 2023, and authorizes10.6 million shares of common stock for grant over the life of the plan. As of December 31, 2014, 1.9 millionshares remained available for future issuance under the plan. Forfeitures are added back to the pool of shares ofcommon stock available to be granted at a future date.
Restricted Stock
Restricted stock awards granted to officers and employees generally vest at the end of a four-year period,and restricted stock awards granted to directors vest immediately. The fair value of restricted stock is determinedbased on the closing price of the Company’s stock on the grant date. A summary of the Company’s restrictedstock activity follows:
2014 2013 2012
Shares
WeightedAverage Grant-Date Fair Value Shares
WeightedAverage Grant-Date Fair Value Shares
WeightedAverage Grant-Date Fair Value
Restricted stock at January 1 . . . . . . 1,463,694 $31.48 1,771,664 $23.44 1,817,745 $22.37Granted . . . . . . . . . . . . . . . . . . . . . 229,489 70.24 331,053 51.99 394,928 27.46Vested(a) . . . . . . . . . . . . . . . . . . . . (507,222) 26.29 (605,458) 19.54 (429,034) 22.66Forfeitures . . . . . . . . . . . . . . . . . . . (1,662) 61.05 (33,565) 24.76 (11,975) 21.46
Restricted stock at December 31 . . . 1,184,299 $41.71 1,463,694 $31.48 1,771,664 $23.44
(a) The total fair value of awards upon vesting for the years ended December 31, 2014, 2013, and 2012, was$36.4 million, $29.5 million, and $12.4 million, respectively.
72

Performance Units
In 2014 and 2013, we granted performance award units to certain key employees. The awards vest fouryears after the grant date based on the achievement of defined performance rankings compared to a peer group.The performance units are paid out entirely in shares of the Company’s common stock. The awards are valued atthe closing price of the Company’s stock on the grant date and expensed over the requisite service period basedon the most probable number of awards expected to vest.
2014 2013
Shares
WeightedAverage Grant-Date Fair Value Shares
WeightedAverage Grant-Date Fair Value
Performance units at January 1 . . . . . . . . . . . . 70,600 $47.83 — $ —Granted . . . . . . . . . . . . . . . . . . . . . . . . . . . . 56,889 71.19 70,600 47.83Vested . . . . . . . . . . . . . . . . . . . . . . . . . . . . . — — — —Forfeitures . . . . . . . . . . . . . . . . . . . . . . . . . . — — — —
Performance units at December 31 . . . . . . . . . 127,489 $58.25 70,600 $47.83
Compensation Expense
Our share-based compensation expense is recorded in “Selling, general, and administrative expenses.”Compensation expense for share-based awards recognized in the Consolidated Statements of Income, net offorfeitures was as follows (dollars in millions):
Year Ended December 31
2014 2013 2012
Restricted stock . . . . . . . . . . . . . . . . . . . . . . . . . . . . . . . . . . . . . . . . . . . . . . . $13.8 $14.3 $11.7Performance units . . . . . . . . . . . . . . . . . . . . . . . . . . . . . . . . . . . . . . . . . . . . . . 1.8 0.5 —
Impact on income before income taxes . . . . . . . . . . . . . . . . . . . . . . . . . . . . . 15.6 14.8 11.7Income tax benefit . . . . . . . . . . . . . . . . . . . . . . . . . . . . . . . . . . . . . . . . . . . . . (6.1) (5.8) (4.6)
Impact on net income . . . . . . . . . . . . . . . . . . . . . . . . . . . . . . . . . . . . . . . . . . . $ 9.5 $ 9.0 $ 7.1
The fair value of restricted stock and performance units is determined based on the closing price of theCompany’s common stock on the grant date. As PCA’s Board of Directors has the ability to accelerate vesting ofshare-based awards upon an employee’s retirement, the Company accelerates the recognition of compensationexpense for certain employees approaching normal retirement age.
The unrecognized compensation expense for all share-based awards was as follows (dollars in millions):
December 31, 2014
UnrecognizedCompensation
Expense
RemainingWeighted Average
RecognitionPeriod (in years)
Restricted stock . . . . . . . . . . . . . . . . . . . . . . . . . . . . . . . . . . . . . . . . . $27.3 2.5Performance units . . . . . . . . . . . . . . . . . . . . . . . . . . . . . . . . . . . . . . . . 5.5 3.1
Total unrecognized share-based compensation expense . . . . . . . . . . $32.8 2.6
We evaluate share-based compensation expense on a quarterly basis based on our estimate of expectedforfeitures, review of recent forfeiture activity, and expected future turnover. We recognize the effect of adjustingthe forfeiture rate for all expense amortization in the period that we change the forfeiture estimate. The effect offorfeiture adjustments was insignificant in all periods presented.
73

13. Derivative Instruments and Hedging Activities
Hedging Strategy
When appropriate, we use derivatives as a risk management tool to mitigate the potential impact of certainmarket risks. The primary risks managed by using derivative financial instruments are interest rate and foreigncurrency exchange rate risks. We do not enter into derivative financial instruments for trading or speculativepurposes.
Interest Rate Risk
The Company has used treasury lock derivative instruments to manage interest costs and the risk associatedwith changing interest rates. In connection with contemplated issuances of ten-year debt securities, PCA enteredinto interest rate protection agreements with counterparties in 2003, 2008, 2010, and 2011 to protect againstincreases in the ten-year U.S. Treasury Note rate. These treasury rates served as references in determining theinterest rates applicable to the debt securities the Company issued in July 2003, March 2008, February 2011, andJune 2012. As a result of changes in the interest rates on those treasury securities between the time PCA enteredinto the derivative agreements and the time PCA priced and issued the debt securities, the Company: (1) receiveda payment of $22.8 million from the counterparty upon settlement of the 2003 interest rate protection agreementon July 21, 2003; (2) made a payment of $4.4 million to the counterparty upon settlement of the 2008 interestrate protection agreement on March 25, 2008; (3) received a payment of $9.9 million from the counterpartiesupon settlement of the 2010 interest rate protection agreements on February 4, 2011; and (4) made a payment of$65.5 million to the counterparty upon settlement of the 2011 interest rate protection agreement on June 26,2012. The Company recorded the effective portion of the settlements in AOCI, and these amounts are beingamortized over the terms of the respective notes.
During the second quarter of 2012, the Company recorded a charge of $3.4 million in interest expense ashedge ineffectiveness due to settling the 2011 interest rate protection agreement prior to its maturity ofDecember 31, 2012. The Company calculated the ineffective portion of the hedge utilizing the hypotheticalderivative method. Additionally, during the third quarter of 2012, the Company recorded a $2.2 millionsettlement gain in interest expense from the 2003 interest rate protection agreement that was written off due tothe redemption of the 5.75% notes on July 26, 2012.
Foreign Currency Exchange Rate Risk
In connection with the energy optimization projects at its Valdosta, Georgia mill and Counce, Tennesseemill, the Company entered into foreign currency forward contracts in 2009 and 2010 to hedge its exposure toforecasted purchases of machinery and equipment denominated in foreign currencies. The foreign currencyforward contracts were properly documented and designated as cash flow hedges at inception. By the end of2011, all contracts had been settled for a loss of $0.7 million. The loss was recorded in accumulated OCI and isbeing amortized into cost of sales over the lives of the respective machinery and equipment.
74

Derivative Instruments
The impact of derivative instruments on the consolidated statements of income and accumulated OCI was asfollows (dollars in millions):
NetLoss Recognized inAccumulated OCI(Effective Portion)
December 31
2014 2013
Treasury locks, net of tax . . . . . . . . . . . . . . . . . . . . . . . . . . . . . . . . . . . . . . . . . . . . . . $(24.7) $(28.2)Foreign currency exchange contracts, net of tax . . . . . . . . . . . . . . . . . . . . . . . . . . . . (0.4) (0.4)
Total . . . . . . . . . . . . . . . . . . . . . . . . . . . . . . . . . . . . . . . . . . . . . . . . . . . . . . . . . . . . . . $(25.1) $(28.6)
Gain (Loss) Reclassifiedfrom Accumulated OCI into
Income(Effective Portion)
Year Ended December 31
Location 2014 2013 2012
Amortization of treasury locks (included in interest expense, net) . . . . . . $(5.7) $(5.7) $0.4
The net amount of settlement gains or losses on derivative instruments included in accumulated OCI to beamortized over the next 12 months is a net loss of $5.7 million ($3.4 million after-tax).
14. Stockholders’ Equity
Dividends
During the year ended December 31, 2014, we paid $157.4 million of dividends to shareholders. OnDecember 9, 2014, PCA’s Board of Directors approved a regular quarterly cash dividend $0.40 per share, whichwas paid on January 15, 2015, to shareholders of record as of December 19, 2014. The dividend payment was$39.4 million.
On February 26, 2015, PCA announced an increase of its quarterly cash dividend on its common stock froman annual payout of $1.60 per share to an annual payout of $2.20 per share. The first quarterly dividend of$0.55 per share will be paid on April 15, 2015 to shareholders of record as of March 13, 2015.
Share Repurchase Program
In 2013 and 2012, we repurchased the following shares of common stock. In both years, all of the sharespurchased were retired. No shares were repurchased in 2014. Share repurchase activity follows (in millions,except share and per share amounts).
Shares
WeightedAverage Price
Per Share Total
2012 . . . . . . . . . . . . . . . . . . . . . . . . . . . . . . . . . . . . . . . . . . . . . . . . 1,507,659 $29.96 $45.22013 . . . . . . . . . . . . . . . . . . . . . . . . . . . . . . . . . . . . . . . . . . . . . . . . 171,263 45.54 7.8
At December 31, 2014, $98.1 million of the $150.0 million authorization by the Board of Directorsremained available for repurchase of the Company’s common stock.
75
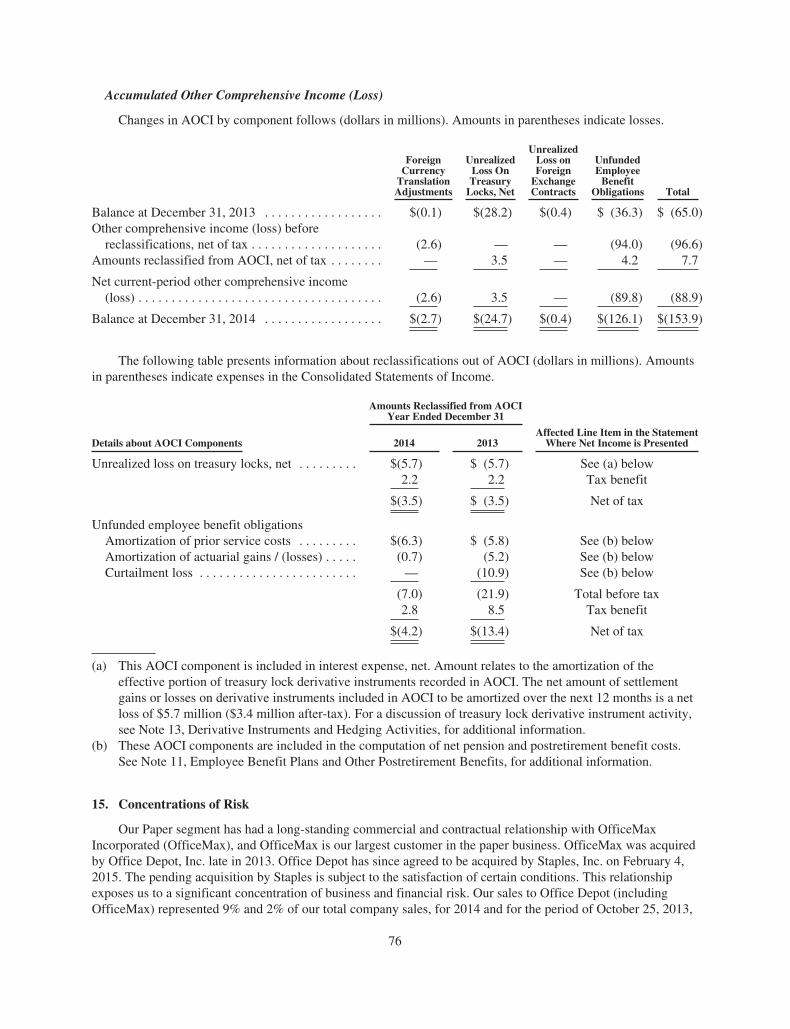
Accumulated Other Comprehensive Income (Loss)
Changes in AOCI by component follows (dollars in millions). Amounts in parentheses indicate losses.
ForeignCurrency
TranslationAdjustments
UnrealizedLoss OnTreasury
Locks, Net
UnrealizedLoss onForeign
ExchangeContracts
UnfundedEmployee
BenefitObligations Total
Balance at December 31, 2013 . . . . . . . . . . . . . . . . . . $(0.1) $(28.2) $(0.4) $ (36.3) $ (65.0)Other comprehensive income (loss) before
reclassifications, net of tax . . . . . . . . . . . . . . . . . . . . (2.6) — — (94.0) (96.6)Amounts reclassified from AOCI, net of tax . . . . . . . . — 3.5 — 4.2 7.7
Net current-period other comprehensive income(loss) . . . . . . . . . . . . . . . . . . . . . . . . . . . . . . . . . . . . . (2.6) 3.5 — (89.8) (88.9)
Balance at December 31, 2014 . . . . . . . . . . . . . . . . . . $(2.7) $(24.7) $(0.4) $(126.1) $(153.9)
The following table presents information about reclassifications out of AOCI (dollars in millions). Amountsin parentheses indicate expenses in the Consolidated Statements of Income.
Amounts Reclassified from AOCIYear Ended December 31
Details about AOCI Components 2014 2013Affected Line Item in the Statement
Where Net Income is Presented
Unrealized loss on treasury locks, net . . . . . . . . . $(5.7) $ (5.7) See (a) below2.2 2.2 Tax benefit
$(3.5) $ (3.5) Net of tax
Unfunded employee benefit obligationsAmortization of prior service costs . . . . . . . . . $(6.3) $ (5.8) See (b) belowAmortization of actuarial gains / (losses) . . . . . (0.7) (5.2) See (b) belowCurtailment loss . . . . . . . . . . . . . . . . . . . . . . . . — (10.9) See (b) below
(7.0) (21.9) Total before tax2.8 8.5 Tax benefit
$(4.2) $(13.4) Net of tax
(a) This AOCI component is included in interest expense, net. Amount relates to the amortization of theeffective portion of treasury lock derivative instruments recorded in AOCI. The net amount of settlementgains or losses on derivative instruments included in AOCI to be amortized over the next 12 months is a netloss of $5.7 million ($3.4 million after-tax). For a discussion of treasury lock derivative instrument activity,see Note 13, Derivative Instruments and Hedging Activities, for additional information.
(b) These AOCI components are included in the computation of net pension and postretirement benefit costs.See Note 11, Employee Benefit Plans and Other Postretirement Benefits, for additional information.
15. Concentrations of Risk
Our Paper segment has had a long-standing commercial and contractual relationship with OfficeMaxIncorporated (OfficeMax), and OfficeMax is our largest customer in the paper business. OfficeMax was acquiredby Office Depot, Inc. late in 2013. Office Depot has since agreed to be acquired by Staples, Inc. on February 4,2015. The pending acquisition by Staples is subject to the satisfaction of certain conditions. This relationshipexposes us to a significant concentration of business and financial risk. Our sales to Office Depot (includingOfficeMax) represented 9% and 2% of our total company sales, for 2014 and for the period of October 25, 2013,
76
through December 31, 2014, respectively, and 44% and 38% of our Paper segment sales revenue for thoseperiods, respectively. At December 31, 2014 and 2013, we had $52.6 million and $39.2 million of accountsreceivable due from Office Depot (including OfficeMax), which represents 8% and 6% of our total companyreceivables, respectively.
Our agreement with OfficeMax will continue to remain in effect after a merger or acquisition as to the officepaper requirements of the legacy OfficeMax business. However, we cannot predict how any merger oracquisition will affect the financial condition of the ultimate entity, the paper requirements of the legacy OfficeMax business, the purchasing decisions of the ultimate entity or the effects on pricing or competition for officepapers. In 2014, sales to Office Depot (including Office Max) represented 44% of our Paper segment sales. Ifthese sales are reduced, whether as a result of the pending integration of Office Max into Office Depot, the futureacquisition of Office Depot by Staples or otherwise, we would need to find new customers, which could harmour profitability if our prices are lower or costs are higher. Any significant deterioration in the financial conditionof the ultimate entity affecting its ability to pay or any other change that results in its willingness to purchase ourproducts will harm our business and results of operations.
Labor
At December 31, 2014, we had approximately 14,000 employees and approximately 50% of theseemployees worked pursuant to collective bargaining agreements. Approximately 75% of our hourly employeesare represented by unions. The majority of our unionized employees are represented by the United Steel Workers(USW), the International Brotherhood of Teamsters (IBT), the International Association of Machinists (IAM),and the Association of Western Pulp and Paper Workers (AWPPW). Approximately 16% of our employees workpursuant to collective bargaining agreements that will expire within the next twelve months.
16. Transactions With Related Parties
Louisiana Timber Procurement Company, L.L.C. (LTP) is a variable-interest entity that is 50% owned byPCA and 50% owned by Boise Cascade Company (Boise Cascade). LTP procures sawtimber, pulpwood, residualchips, and other residual wood fiber to meet the wood and fiber requirements of PCA and Boise Cascade inLouisiana. PCA is the primary beneficiary of LTP, and has the power to direct the activities that mostsignificantly affect the economic performance of LTP. Therefore, we consolidate 100% of LTP in our financialstatements in our Corporate and Other segment. The carrying amounts of LTP’s assets and liabilities (whichrelate primarily to noninventory working capital items) on our Consolidated Balance Sheets were both$5.2 million at December 31, 2014, and $5.0 million at December 31, 2013. For 2014 and for the period ofOctober 25 to December 31, 2013, we recorded $75.8 million and $10.3 million, respectively, of LTP sales toBoise Cascade in “Net Sales” in the Consolidated Statements of Income and approximately the same amount ofexpenses in “Cost of Sales”. The sales were at prices designed to approximate market prices.
For 2014 and for the period of October 25 to December 31, 2013, fiber purchases from related parties were$28.7 million and $3.7 million, respectively. Most of these purchases related to chip and log purchases by LTPfrom Boise Cascade’s wood products business. These purchases are recorded in “Cost of Sales” in theConsolidated Statements of Income.
17. U.S. Treasury Grant
On April 5, 2012, PCA’s application for a U.S. Treasury Section 1603 Grant for Specified Energy propertywas approved for the Valdosta energy project. The Company received the grant proceeds of $57.4 million onApril 11, 2012 and recorded the proceeds as a reduction to the cost of the related property, plant, and equipment.These proceeds will be amortized ratably over the estimated useful lives of the related equipment, which amountsto $3.2 million each year.
77

18. Segment Information
On October 25, 2013, PCA acquired Boise Inc. (Boise) for $2.1 billion, including the fair value of assumeddebt. After the acquisition, we began reporting in three reportable segments: Packaging, Paper, and Corporateand Other. These segments represent distinct businesses that are managed separately because of differingproducts and services. Each of these businesses requires distinct operating and marketing strategies.
Packaging. We manufacture and sell a wide variety of corrugated packaging products, includingconventional shipping containers used to protect and transport manufactured goods, multi-color boxes anddisplays with strong visual appeal that help to merchandise the packaged product in retail locations. In addition,we are a large producer of packaging for meat, fresh fruit and vegetables, processed food, beverages, and otherindustrial and consumer products.
Paper. We manufacture and sell a range of white papers, including communication papers, and pressuresensitive papers, and market pulp. Our white papers can be manufactured as either commodity papers or specialtypapers with specialized or custom features, such as colors, coatings, high brightness, or recycled content. Weship to customers both directly from our mills and through distribution centers. In 2014, our sales to Office Depot(including OfficeMax), our largest paper segment customer, represented 44% of our Paper segment salesrevenue.
Corporate and Other. Our Corporate and Other segment includes corporate support staff services andrelated assets and liabilities, and foreign exchange gains and losses. This segment also includes transportationassets, such as rail cars and trucks, which we use to transport our products from some of our manufacturing sitesand assets related to a 50% owned variable interest entity, Louisiana Timber Procurement Company, L.L.C.(LTP), that we acquired in the acquisition of Boise. See Note 16, Transactions With Related Parties, for moreinformation related to LTP. Sales in this segment relate primarily to LTP and our rail and truck business. Weprovide transportation services not only to our own facilities but also, on a limited basis, to third parties whengeographic proximity and logistics are favorable. Rail cars and trucks are generally leased.
Each segments’ profits and losses are measured on operating profits before interest expense and interestincome. For many of these allocated expenses, the related assets and liabilities remain in the Corporate and Othersegment.
Segment sales to external customers by product line were as follows (dollars in millions):
Year Ended December 31
2014 2013 2012
Packaging sales . . . . . . . . . . . . . . . . . . . . . . . . . . . . . . . . . . . . . . . . $4,540.3 $3,431.7 $2,843.9
Paper salesWhite papers . . . . . . . . . . . . . . . . . . . . . . . . . . . . . . . . . . . . . . . . 1,138.5 207.0 —Market pulp . . . . . . . . . . . . . . . . . . . . . . . . . . . . . . . . . . . . . . . . . 62.9 9.9 —
1,201.4 216.9 —
Corporate and Other . . . . . . . . . . . . . . . . . . . . . . . . . . . . . . . . . . . . 110.9 16.7 —
$5,852.6 $3,665.3 $2,843.9
Sales to foreign unaffiliated customers during the years ended December 31, 2014, 2013, and 2012 were$378.8 million, $162.4 million, and $115.8 million, respectively. At December 31, 2014 and 2013, the netcarrying value of long-lived assets held by foreign operations, all of which were in our Packaging segment, were$12.4 million and $14.0 million, respectively.
78

An analysis of operations by reportable segment were as follows (dollars in millions):
Sales, net OperatingIncome(Loss)
Depreciation,Amortization,and Depletion
CapitalExpenditures(l) AssetsYear Ended December 31, 2014 Trade
Inter-segment Total
Packaging . . . . . . . . . . . . . . . . . . . . $4,534.5 $ 5.8 $4,540.3 $663.2(b) $323.0 $362.1 $4,105.3Paper . . . . . . . . . . . . . . . . . . . . . . . . 1,201.4 — 1,201.4 135.4 50.6 51.7 968.6Corporate and Other . . . . . . . . . . . . 116.7 144.9 261.6 (95.9)(c) 7.4 6.4 274.6Intersegment eliminations . . . . . . . — (150.7) (150.7) — — — —
$5,852.6 $ — $5,852.6 702.7 $381.0 $420.2 $5,348.5
Interest expense, net . . . . . . . . . . . . (88.4)(d)
Income before taxes . . . . . . . . . . . . $614.3
Sales, net OperatingIncome(Loss)
Depreciation,Amortization,and Depletion
CapitalExpenditures(l) AssetsYear Ended December 31, 2013(a) Trade
Inter-segment Total
Packaging . . . . . . . . . . . . . . . . . . . . . $3,431.3 $ 0.4 $3,431.7 $554.2(e) $190.2 $222.2 $3,988.5Paper . . . . . . . . . . . . . . . . . . . . . . . . 216.9 — 216.9 13.5(f) 9.1 10.0 938.4Corporate and Other . . . . . . . . . . . . 17.1 28.0 45.1 (85.8)(g) 2.5 2.2 316.9Intersegment eliminations . . . . . . . . — (28.4) (28.4) — — — —
$3,665.3 $ — $3,665.3 481.9 $201.8 $234.4 $5,243.8
Interest expense, net . . . . . . . . . . . . (58.3)(h)
Income before taxes . . . . . . . . . . . . . $423.6
Sales, net OperatingIncome(Loss)
Depreciation,Amortization,and Depletion
CapitalExpenditures(l) AssetsYear Ended December 31, 2012 Trade
Inter-segment Total
Packaging . . . . . . . . . . . . . . . . . . . . . $2,843.9 $— $2,843.9 $383.9(i) $169.4 $127.8 $2,194.5Corporate and Other . . . . . . . . . . . . — — — 53.7(j) 1.4 0.7 300.4
$2,843.9 $— $2,843.9 437.6 $170.8 $128.5 $2,494.9
Interest expense, net . . . . . . . . . . . . (62.9)(k)
Income before taxes . . . . . . . . . . . . . $374.7
(a) On October 25, 2013, we acquired Boise Inc. (Boise). Our financial results include Boise subsequent toacquisition.
(b) Includes $65.8 million of costs related primarily to the conversion of the No. 3 newsprint machine at ourDeRidder, Louisiana, mill to produce lightweight linerboard and corrugating medium, and our exit from thenewsprint business in September 2014. Includes $4.9 million of Boise acquisition integration-related andother costs, most of which are recorded in “Other expense, net”.
(c) Includes $13.5 million of Boise acquisition integration-related and other costs, most of which are recordedin “Other expense, net”. Includes $17.6 million of costs for the settlement of the Kleen ProductsLLC v Packaging Corp. of America et al class action lawsuit recorded in “Other expense, net”. See Note 20,Commitments, Guarantees, Indemnifications, and Legal Proceedings, for more information.
(d) Includes $1.5 million of expense related to the write-off of deferred financing costs in connection with thedebt refinancing discussed in Note 10, Debt.
(e) Includes $18.0 million of expense for the acquisition inventory step-up and $1.4 million of integration-related and other costs incurred in connection with the acquisition of Boise in fourth quarter 2013.
79

(f) Includes $3.5 million of expense for acquisition inventory step-up and $1.9 million of income forintegration-related and other costs.
(g) Includes $17.2 million of acquisition-related costs and $17.9 million of integration-related and other costs.(h) Includes $10.5 million of expenses for financing the acquisition and $1.1 million of expense for the write-
off of deferred financing costs.(i) Includes $2.0 million of plant closure charges.(j) Includes $95.5 million of income related to the increase in gallons claimed as alternative energy tax credits
on the Company’s amended 2009 tax return. See Note 7, Alternative Energy Tax Credits, for moreinformation.
(k) Includes $24.8 million of debt refinancing charges, including a $21.3 million redemption premium, a$3.4 million charge to settle the treasury lock prior to its maturity, and $0.1 million of other items.
(l) Includes “Additions to property, plant, and equipment” and excludes cash used for “Acquisitions ofbusinesses, net of cash acquired” as reported on our Consolidated Statements of Cash Flows.
19. Asset Retirement Obligations
Our asset retirement obligations relate predominantly to landfill closure, wastewater treatment ponddredging, closed-site monitoring costs, and certain leasehold improvements. In accordance with ASC 410, “AssetRetirement and Environmental Obligations,” we recognize the fair value of these liabilities as an asset retirementobligation and capitalize that cost as part of the cost basis of the related asset in the period in which the costs areincurred if sufficient information is available to reasonably estimate the fair value of the obligation. Fair valueestimates are determined using Level 3 inputs in the fair value hierarchy. The fair value of our asset retirementobligations is measured using expected future cash outflows discounted using the company’s credit-adjusted risk-free interest rate. Over time, the liability is accreted to its settlement value, and the capitalized cost is depreciatedover the useful life of the related asset. These liabilities are based on the best estimate of costs and are updatedperiodically to reflect current technology, laws and regulations, inflation, and other economic factors.Occasionally, we become aware of events or circumstances that require us to revise our future estimated cashflows. When revisions become necessary, we recalculate our obligation and adjust our asset and liabilityaccounts utilizing appropriate discount rates. No assets are legally restricted for purposes of settling assetretirement obligations. Upon settlement of the liability, we will recognize a gain or loss for any differencebetween the settlement amount and the liability recorded.
The following table describes changes to the asset retirement obligation liability (dollars in millions):
Year Ended December 31
2014 2013
Asset retirement obligation at beginning of period . . . . . . . . . . . . . . . . . . . . . . $32.0 $ 5.1Acquisition . . . . . . . . . . . . . . . . . . . . . . . . . . . . . . . . . . . . . . . . . . . . . . . . . . . . . 4.1 23.8Liabilities incurred . . . . . . . . . . . . . . . . . . . . . . . . . . . . . . . . . . . . . . . . . . . . . . . — 3.2Accretion expense . . . . . . . . . . . . . . . . . . . . . . . . . . . . . . . . . . . . . . . . . . . . . . . 1.0 0.3Payments . . . . . . . . . . . . . . . . . . . . . . . . . . . . . . . . . . . . . . . . . . . . . . . . . . . . . . (0.1) —Revisions in estimated cash flows . . . . . . . . . . . . . . . . . . . . . . . . . . . . . . . . . . . — (0.4)
Asset retirement obligation at end of period . . . . . . . . . . . . . . . . . . . . . . . . . . . $37.0 $32.0
We have additional asset retirement obligations with indeterminate settlement dates. The fair value of theseasset retirement obligations cannot be estimated due to the lack of sufficient information to estimate thesettlement dates of the obligations. These asset retirement obligations include, for example, (i) removal anddisposal of potentially hazardous materials related to equipment and/or an operating facility if the equipmentand/or facilities were to undergo major maintenance, renovation, or demolition and (ii) storage sites or ownedfacilities for which removal and/or disposal of chemicals and other related materials are required if the operatingfacility is closed. We will recognize a liability in the period in which sufficient information becomes available toreasonably estimate the fair value of these obligations.
80

20. Commitments, Guarantees, Indemnifications, and Legal Proceedings
We have financial commitments and obligations that arise in the ordinary course of our business. Theseinclude long-term debt (discussed in Note 10, Debt), capital commitments, lease obligations, purchasecommitments for goods and services, and legal proceedings (discussed below).
Capital Commitments
The Company had capital commitments of approximately $94.7 million and $151.4 million as ofDecember 31, 2014 and 2013, respectively, in connection with the expansion and replacement of existingfacilities and equipment.
Lease Obligations
PCA leases space for certain of its facilities, cutting rights to approximately 88,000 acres of timberland, landfor a fiber farm, and equipment, primarily vehicles and rolling stock. Remaining lease terms range from one to15 years and may contain renewal options or escalation clauses. Substantially all lease agreements have fixedpayment terms based on the passage of time. Some lease agreements provide us with the option to purchase theleased property. Additionally, some agreements contain renewal options averaging approximately six years.Some leases may require the Company to pay executory costs, which may include property taxes, maintenanceand insurance. The minimum lease payments under non-cancelable operating leases with lease terms in excess ofone year were as follows (dollars in millions):
2015 . . . . . . . . . . . . . . . . . . . . . . . . . . . . . . . . . . . . . . . . . . . . . . . . . . . . . . . . . . . . . . . . . . . . . . $ 58.92016 . . . . . . . . . . . . . . . . . . . . . . . . . . . . . . . . . . . . . . . . . . . . . . . . . . . . . . . . . . . . . . . . . . . . . . 48.92017 . . . . . . . . . . . . . . . . . . . . . . . . . . . . . . . . . . . . . . . . . . . . . . . . . . . . . . . . . . . . . . . . . . . . . . 37.82018 . . . . . . . . . . . . . . . . . . . . . . . . . . . . . . . . . . . . . . . . . . . . . . . . . . . . . . . . . . . . . . . . . . . . . . 28.22019 . . . . . . . . . . . . . . . . . . . . . . . . . . . . . . . . . . . . . . . . . . . . . . . . . . . . . . . . . . . . . . . . . . . . . . 21.6Thereafter . . . . . . . . . . . . . . . . . . . . . . . . . . . . . . . . . . . . . . . . . . . . . . . . . . . . . . . . . . . . . . . . . . 78.9
Total . . . . . . . . . . . . . . . . . . . . . . . . . . . . . . . . . . . . . . . . . . . . . . . . . . . . . . . . . . . . . . . . . . . . $274.3
Total lease expense, including base rent on all leases and executory costs, such as insurance, taxes, andmaintenance, for the years ended December 31, 2014, 2013, and 2012, was $85.6 million, $56.0 million and$49.4 million, respectively. These costs are included in “Cost of sales” and “Selling, general, and administrativeexpenses” in our Consolidated Statements of Income. We had an insignificant amount of sublease rental incomein the periods presented.
PCA was obligated under capital leases covering buildings and machinery and equipment in the amount of$23.9 million and $24.9 million at December 31, 2014 and 2013, respectively. Assets held under capital leaseobligations were included in property, plant, and equipment as follows (dollars in millions):
Year Ended December 31
2014 2013
Buildings . . . . . . . . . . . . . . . . . . . . . . . . . . . . . . . . . . . . . . . . . . . . . . . . . . . . . . $ 0.3 $ 0.3Machinery and equipment . . . . . . . . . . . . . . . . . . . . . . . . . . . . . . . . . . . . . . . . . 28.5 28.5
Total . . . . . . . . . . . . . . . . . . . . . . . . . . . . . . . . . . . . . . . . . . . . . . . . . . . . . . . . 28.8 28.8Less accumulated amortization . . . . . . . . . . . . . . . . . . . . . . . . . . . . . . . . . . . . . (10.5) (8.7)
Total . . . . . . . . . . . . . . . . . . . . . . . . . . . . . . . . . . . . . . . . . . . . . . . . . . . . . . . . $ 18.3 $20.1
Amortization of assets under capital lease obligations is included in depreciation expense.
81
The future minimum payments under capitalized leases at December 31, 2014 were as follows (dollars inmillions):
2015 . . . . . . . . . . . . . . . . . . . . . . . . . . . . . . . . . . . . . . . . . . . . . . . . . . . . . . . . . . . . . . . . . . . . . . . $ 2.72016 . . . . . . . . . . . . . . . . . . . . . . . . . . . . . . . . . . . . . . . . . . . . . . . . . . . . . . . . . . . . . . . . . . . . . . . 2.72017 . . . . . . . . . . . . . . . . . . . . . . . . . . . . . . . . . . . . . . . . . . . . . . . . . . . . . . . . . . . . . . . . . . . . . . . 2.72018 . . . . . . . . . . . . . . . . . . . . . . . . . . . . . . . . . . . . . . . . . . . . . . . . . . . . . . . . . . . . . . . . . . . . . . . 2.72019 . . . . . . . . . . . . . . . . . . . . . . . . . . . . . . . . . . . . . . . . . . . . . . . . . . . . . . . . . . . . . . . . . . . . . . . 2.7Thereafter . . . . . . . . . . . . . . . . . . . . . . . . . . . . . . . . . . . . . . . . . . . . . . . . . . . . . . . . . . . . . . . . . . 23.0
Total minimum capital lease payments . . . . . . . . . . . . . . . . . . . . . . . . . . . . . . . . . . . . . . . . . 36.5Less amounts representing interest . . . . . . . . . . . . . . . . . . . . . . . . . . . . . . . . . . . . . . . . . . . . . . . (12.6)
Present value of net minimum capital lease payments . . . . . . . . . . . . . . . . . . . . . . . . . . . . . . 23.9Less current maturities of capital lease obligations . . . . . . . . . . . . . . . . . . . . . . . . . . . . . . . . . . (1.1)
Total long-term capital lease obligations . . . . . . . . . . . . . . . . . . . . . . . . . . . . . . . . . . . . . . . . $ 22.8
Interest expense related to capital lease obligations was $1.6 million during the year ended December 31,2014, and $1.7 million during both the years ended December 31, 2013 and 2012.
Purchase Commitments
In the table below, we set forth our enforceable and legally binding purchase obligations as of December 31,2014. Some of the amounts included in the table are based on management’s estimates and assumptions aboutthese obligations, including their duration, the possibility of renewal, anticipated actions by third parties, andother factors. Because these estimates and assumptions are necessarily subjective, our actual payments may varyfrom those reflected in the table. Purchase orders made in the ordinary course of business are excluded from thetable below. Any amounts for which we are liable under purchase orders are reflected on the ConsolidatedBalance Sheets as accounts payable and accrued liabilities. These obligations relate to various purchaseagreements for items such as minimum amounts of fiber and energy purchases over periods ranging fromone year to 20 years. Total purchase commitments were as follows (dollars in millions):
2015 . . . . . . . . . . . . . . . . . . . . . . . . . . . . . . . . . . . . . . . . . . . . . . . . . . . . . . . . . . . . . . . . . . . . . . $ 86.82016 . . . . . . . . . . . . . . . . . . . . . . . . . . . . . . . . . . . . . . . . . . . . . . . . . . . . . . . . . . . . . . . . . . . . . . 21.42017 . . . . . . . . . . . . . . . . . . . . . . . . . . . . . . . . . . . . . . . . . . . . . . . . . . . . . . . . . . . . . . . . . . . . . . 8.62018 . . . . . . . . . . . . . . . . . . . . . . . . . . . . . . . . . . . . . . . . . . . . . . . . . . . . . . . . . . . . . . . . . . . . . . 8.02019 . . . . . . . . . . . . . . . . . . . . . . . . . . . . . . . . . . . . . . . . . . . . . . . . . . . . . . . . . . . . . . . . . . . . . . 8.0Thereafter . . . . . . . . . . . . . . . . . . . . . . . . . . . . . . . . . . . . . . . . . . . . . . . . . . . . . . . . . . . . . . . . . . 9.4
Total . . . . . . . . . . . . . . . . . . . . . . . . . . . . . . . . . . . . . . . . . . . . . . . . . . . . . . . . . . . . . . . . . . . . . . $142.2
The Company purchased a total of $265.9 million, $61.7 million, and $27.7 million during the years endedDecember 31, 2014, 2013, and 2012, respectively, under these purchase agreements. The increase in purchasesunder these agreements in 2014, compared with 2013, relates to the acquisition of Boise in fourth quarter 2013.
Environmental Liabilities
The potential costs for various environmental matters are uncertain due to such factors as the unknownmagnitude of possible cleanup costs, the complexity and evolving nature of governmental laws and regulationsand their interpretations, and the timing, varying costs and effectiveness of alternative cleanup technologies.From 1994 through 2014, remediation costs at the Company’s mills and corrugated plants totaled approximately$3.2 million. At December 31, 2014, the Company had $35.4 million of environmental-related reserves recordedon its Consolidated Balance Sheet. Of the $35.4 million, approximately $26.9 million related to environmental-
82

related asset retirement obligations discussed in Note 19, Asset Retirement Obligations, and $8.5 million relatedto our estimate of other environmental contingencies. The Company recorded $7.1 million in “Accruedliabilities” and $28.3 million in “Other long-term liabilities” on the Consolidated Balance Sheet. Liabilitiesrecorded for environmental contingencies are estimates of the probable costs based upon available informationand assumptions. Because of these uncertainties, PCA’s estimates may change. The Company believes that it isnot reasonably possible that future environmental expenditures for remediation costs and asset retirementobligations above the $35.4 million accrued as of December 31, 2014, will have a material impact on its financialcondition, results of operations, or cash flows.
Guarantees and Indemnifications
We provide guarantees, indemnifications, and other assurances to third parties in the normal course of ourbusiness. These include tort indemnifications, environmental assurances, and representations and warranties incommercial agreements. At December 31, 2014, we are not aware of any material liabilities arising from anyguarantee, indemnification, or financial assurance we have provided. If we determined such a liability wasprobable and subject to reasonable determination, we would accrue for it at that time.
Legal proceedings
During 2010, PCA and eight other U.S. and Canadian containerboard producers were named as defendantsin five purported class action lawsuits filed in the United States District Court for the Northern District ofIllinois, alleging violations of the Sherman Act. The lawsuits were consolidated in a single complaint under thecaption Kleen Products LLC v Packaging Corp. of America et al. The consolidated complaint alleges that thedefendants conspired to limit the supply of containerboard, and that the purpose and effect of the allegedconspiracy was to artificially increase prices of containerboard products during the period of August 2005 toOctober 2010 (the time of filing of the complaint). The complaint was filed as a class action suit on behalf of allpurchasers of containerboard products during such period. On April 4, 2014, we reached an agreement with therepresentatives of the class to settle this lawsuit for $17.6 million. These costs were recorded in “Other expense,net” in our Consolidated Statements of Income for the year ended December 31, 2014. On May 6, 2014, the courtpreliminarily approved the settlement. Notice of the proposed settlement was mailed to potential class membersand $17.6 million was paid to the settlement fund escrow account in June 2014. The court granted final approvalof the settlement on September 4, 2014.
We are also a party to other legal actions arising in the ordinary course of our business. These legal actionsinclude commercial liability claims, premises liability claims, and employment-related claims, among others. Asof the date of this filing, we believe it is not reasonably possible that any of the legal actions against us will,either individually or in the aggregate, have a material adverse effect on our financial condition, results ofoperations, or cash flows.
83

21. Quarterly Results of Operations (unaudited, dollars in millions, except per-share and stock priceinformation)
Quarter
First(a) Second(b) Third(c) Fourth(d) Total
2014:Net sales . . . . . . . . . . . . . . . . . . . . . . . $1,431.3 $1,468.4 $1,518.9 $1,434.0 $5,852.6Gross profit . . . . . . . . . . . . . . . . . . . . . 301.4 310.8 320.3 297.0 1,229.5Income from operations . . . . . . . . . . . 160.9 180.2 188.4 173.2 702.7Net income . . . . . . . . . . . . . . . . . . . . . 90.1 99.6 104.4 98.5 392.6Basic earnings per share . . . . . . . . . . . 0.92 1.01 1.06 1.00 3.99Diluted earnings per share . . . . . . . . . . 0.92 1.01 1.06 1.00 3.99Stock price — high . . . . . . . . . . . . . . . 75.10 72.74 72.82 80.14 80.14Stock price — low . . . . . . . . . . . . . . . . 61.35 65.00 63.11 57.06 57.06
Quarter
First Second(e) Third(f) Fourth(g) Total
2013:Net sales . . . . . . . . . . . . . . . . . . . . . . . $ 755.2 $ 800.2 $ 845.5 $1,264.4 $3,665.3Gross profit . . . . . . . . . . . . . . . . . . . . . 185.2 195.3 227.6 259.4 867.5Income from operations . . . . . . . . . . . 106.0 110.2 142.8 122.9 481.9Net income . . . . . . . . . . . . . . . . . . . . . 62.3 66.2 84.7 228.1 441.3Basic earnings per share . . . . . . . . . . . 0.65 0.69 0.88 2.36 4.57Diluted earnings per share . . . . . . . . . . 0.64 0.68 0.87 2.34 4.52Stock price — high . . . . . . . . . . . . . . . 44.93 50.78 61.32 64.39 64.39Stock price — low . . . . . . . . . . . . . . . . 37.86 42.36 48.45 55.66 37.86
Note: The sum of the quarters may not equal the total of the respective year’s earnings per share on either abasic or diluted basis due to changes in the weighted average shares outstanding throughout the year.
(a) Includes $17.6 million of costs accrued for the settlement of the Kleen Products LLC v Packaging Corp. ofAmerica et al class action lawsuit ($11.2 million after-tax or $0.11 per diluted share), $4.1 million ofintegration-related costs ($2.6 million after-tax or $0.03 per diluted share), and $4.0 million of DeRidderrestructuring charges ($2.6 million after-tax or $0.02 per diluted share).
(b) Includes $17.8 million of DeRidder restructuring charges ($11.2 million after-tax or $0.12 per diluted share)and $4.9 million of integration-related and other costs ($3.0 million after-tax or $0.03 per diluted share).
(c) Includes $26.0 million of DeRidder restructuring charges ($16.6 million after-tax or $0.17 per diluted share)and $4.5 million of integration-related and other costs ($2.9 million after-tax or $0.03 per diluted share).
(d) Includes $18.0 million of DeRidder restructuring charges ($11.7 million after-tax or $0.12 per diluted share)and $6.4 million of integration-related and other costs ($4.2 million after-tax or $0.04 per diluted share).
(e) Includes a $7.8 million non-cash pension curtailment charge ($5.0 million after-tax or $0.05 per dilutedshare).
(f) Includes a $3.1 million non-cash pension curtailment charge ($2.0 million after-tax or $0.02 per dilutedshare), $1.5 million of acquisition-related costs ($1.0 million after-tax or $0.01 per diluted share), and$2.7 million of acquisition-related financing costs ($1.8 million after-tax or $0.02 per diluted share).
(g) Includes Boise’s results for the period of October 25, 2013, through December 31, 2013. The quarter alsoincludes $166.0 million of income tax benefits from the reversal of the reserves for unrecognized taxbenefits from alternative energy tax credits ($1.70 per diluted share), partially offset by $21.5 million ofexpense for the acquisition inventory step-up ($13.6 million after-tax or $0.14 per diluted share),$15.8 million of acquisition-related costs ($10.0 million after-tax or $0.10 per diluted share), $8.9 million ofacquisition-related financing costs ($5.6 million after-tax or $0.06 per diluted share), and $17.4 million ofintegration-related and other costs ($11.0 million after-tax or $0.11 per diluted share).
84

Item 9. CHANGES IN AND DISAGREEMENTS WITH ACCOUNTANTS ON ACCOUNTING ANDFINANCIAL DISCLOSURE
Not applicable.
Item 9A. CONTROLS AND PROCEDURES
Controls and Procedures
PCA maintains disclosure controls and procedures (as defined in Rule 13a-15(e) of the Securities ExchangeAct of 1934) that are designed to provide reasonable assurance that information required to be disclosed inPCA’s filings under the Securities Exchange Act is recorded, processed, summarized and reported within theperiods specified in the rules and forms of the SEC and that such information is accumulated and communicatedto PCA’s management, including its Chief Executive Officer and Chief Financial Officer, as appropriate, toallow timely decisions regarding required disclosure.
Prior to filing this report, PCA completed an evaluation under the supervision and with the participation ofPCA’s management, including PCA’s Chief Executive Officer and Chief Financial Officer, of the effectivenessof the design and operation of PCA’s disclosure controls and procedures as of December 31, 2014. Theevaluation of PCA’s disclosure controls and procedures included a review of the controls’ objectives and design,PCA’s implementation of the controls and the effect of the controls on the information generated for use in thisreport. Based on this evaluation, PCA’s Chief Executive Officer and Chief Financial Officer concluded thatPCA’s disclosure controls and procedures were effective at the reasonable assurance level as of December 31,2014.
During the quarter ended December 31, 2014, there were no changes in internal controls over financialreporting that have materially affected, or are reasonably likely to materially affect, PCA’s internal control overfinancial reporting.
Management’s Report on Internal Control Over Financial Reporting
PCA’s management is responsible for establishing and maintaining adequate internal control over financialreporting, as such term is defined in Exchange Act Rule 13a-15(f). Internal control over financial reporting is aprocess designed to provide reasonable assurance regarding the reliability of financial reporting and thepreparation of financial statements for external purposes in accordance with generally accepted accountingprinciples. Internal control over financial reporting includes those policies and procedures that (1) pertain to themaintenance of records that, in reasonable detail, accurately and fairly reflect the transactions and dispositions ofthe Company’s assets; (2) provide reasonable assurance that transactions are recorded as necessary to permitpreparation of financial statements in accordance with generally accepted accounting principles, and that receiptsand expenditures are being made only with proper authorizations; and (3) provide reasonable assurance regardingprevention or timely detection of unauthorized acquisition, use, or disposition of the Company’s assets that couldhave a material effect on the financial statements.
Because of its inherent limitations, PCA’s internal control over financial reporting may not prevent or detectmisstatements. A control system, no matter how well conceived and operated, can provide only reasonable, notabsolute, assurance that objectives of the control system are met. Because of the inherent limitations in all controlsystems, no evaluation of controls can provide absolute assurance that all control issues and instances of fraud, ifany, have been detected. Also, projections of any evaluation of effectiveness to future periods are subject to therisk that controls become inadequate because of changes in conditions, or that the degree of compliance with thepolicies and procedures may deteriorate.
PCA’s management, under the supervision of and with the participation of the Chief Executive Officer andChief Financial Officer, assessed the Company’s internal control over financial reporting as of December 31,
85

2014, based on criteria established in Internal Control — Integrated Framework (2013) issued by the Committeeof Sponsoring Organizations of the Treadway Commission (COSO). Based on this assessment, PCA’smanagement concluded that its internal control over financial reporting was effective as of December 31, 2014,based on the specified criteria.
KPMG LLP, the independent registered public accounting firm that audited PCA’s financial statementsincluded in this Form 10-K, has also audited the effectiveness of the Company’s internal control over financialreporting. Their attestation report precedes PCA’s audited financial statements included elsewhere in this report.
Item 9B. OTHER INFORMATION
Because this Annual Report on Form 10-K is being filed within four business days after the applicabletriggering event, the following disclosure is being made under “Part II, Item 9B. Other Information” of thisAnnual Report on Form 10-K instead of under Item 5.02 (Departure of Directors or Certain Officers; Election ofDirectors; Appointment of Certain Officers; Compensatory Arrangements of Certain Officers) of Form 8-K.
On February 26, 2015, PCA amended and restated its June 24, 2013, agreement with Paul T. Stecko,chairman of its board of directors. Under the amended and restated agreement, PCA’s board may determine topay additional fees to Mr. Stecko for services provided under the agreement that were not contemplated at thetime the original agreement was executed. On February 26, 2015, the board determined to pay Mr. Stecko anadditional $1.6 million of fees for 2014, primarily for services related to PCA’s integration of its acquisition ofBoise Inc. The amended and restated agreement is filed herewith as Exhibit 10.12 and incorporated by referenceherein.
PART III
Item 10. DIRECTORS, EXECUTIVE OFFICERS, AND CORPORATE GOVERNANCE
Information regarding PCA’s executive officers required by this Item 10 is set forth in Item 1 of Part I ofthis report under the caption “Executive Officers of the Registrant.”
The following information required by this Item 10 will be included in PCA’s Proxy Statement for the 2014Annual Meeting of Stockholders and is incorporated by reference herein:
• Information regarding PCA’s directors included under the caption “Election of Directors”
• Information regarding PCA’s Audit Committee and financial experts included under the caption“Election of Directors — Audit Committee”
• Information regarding PCA’s code of ethics included under the caption “Election of Directors — Codeof Ethics”
• Information regarding PCA’s stockholder nominating procedures included under the captions “Electionof Directors — Nominating and Governance Committee,” “Other Information — Recommendationsfor Board — Nominated Director Nominees,” and “Other Information — Procedures for NominatingDirectors or Bringing Business Before the 2015 Annual Meeting”
• Information regarding compliance with Section 16(a) of the Securities Exchange Act of 1934 includedunder the caption “Section 16(a) Beneficial Ownership Reporting Compliance”
Item 11. EXECUTIVE COMPENSATION
Information with respect to executive compensation required by this Item 11 will be included in PCA’sProxy Statement under the captions “Compensation Discussion and Analysis,” “Executive Officer and DirectorCompensation” (including all subcaptions and tables thereunder) and “Board Committees — CompensationCommittee” and is incorporated herein by reference.
86

Item 12. SECURITY OWNERSHIP OF CERTAIN BENEFICIAL OWNERS AND MANAGEMENT ANDRELATED STOCKHOLDER MATTERS
Information with respect to security ownership of certain beneficial owners and management required bythis Item 12 will be included in PCA’s Proxy Statement under the caption “Ownership of Our Stock” and isincorporated herein by reference.
Authorization of Securities under Equity Compensation Plans — Securities authorized for issuance underour equity compensation plans at December 31, 2014 are as follows:
Column
A B C
Plan Category
Number of Securities toBe Issued Upon Exerciseof Outstanding Options,Warrants, and Rights
(a)
Weighted AverageExercise Price of
Outstanding Options,Warrants, and
Rights
Number of SecuritiesRemaining Available forFuture Issuance Under
Equity Compensation Plans(Excluding Securities
Reflected in Column A)
Equity compensation plans approved bysecurityholders . . . . . . . . . . . . . . . . . . — $ — 1,856,238
Equity compensation plans notapproved by securityholders . . . . . . . N/A N/A N/A
Total . . . . . . . . . . . . . . . . . . . . . . . . . . . . . . — $ — 1,856,238
(a) Does not include 1,311,788 shares of unvested restricted stock and performance units granted pursuant toour Amended and Restated 1999 Long-Term Equity Incentive Plan.
Item 13. CERTAIN RELATIONSHIPS AND RELATED TRANSACTIONS, AND DIRECTORINDEPENDENCE
Information with respect to certain relationships and related transactions and director independence requiredby this Item 13 will be included in PCA’s Proxy Statement under the captions “Transactions with RelatedPersons” and “Election of Directors — Determination of Director Independence,” respectively, and isincorporated herein by reference.
Item 14. PRINCIPAL ACCOUNTING FEES AND SERVICES
Information with respect to fees and services of the principal accountant required by this Item 14 will beincluded in PCA’s Proxy Statement under the caption “Ratification of Appointment of the IndependentRegistered Public Accounting Firm” under the subcaptions “— Fees to the Independent Registered PublicAccounting Firm” and “— Audit Committee Preapproval Policy for Audit and Non-Audit Fees” and areincorporated herein by reference.
87
PART IV
Item 15. EXHIBITS, FINANCIAL STATEMENT SCHEDULES
(a) The following documents are filed as a part of this report:(1) The financial statements listed in the “Index to Financial Statements.”(2) Financial Statement Schedule.
The following consolidated financial statement schedule of PCA for the years ended December 31, 2014,2013, and 2012 is included in this report.
Schedule II — Packaging Corporation of America — Valuation and Qualifying Accounts (dollars inmillions).
Description
BalanceBeginning of
YearAcquiredReserves
Chargedto
Expenses Deductions
BalanceEnd ofYear
Year ended December 31, 2014:Deducted from assets accounts:
Allowance for doubtful accounts . . . . . . . . $ 3.9 $ — $ 2.2 $ (1.2)(a) $ 4.9Reserve for customer deductions . . . . . . . . 6.7 — 44.5 (44.8)(b) 6.4Deferred tax asset valuation allowance . . . . 2.7 — 0.1 (1.1) 1.7
Total . . . . . . . . . . . . . . . . . . . . . . . . . . $13.3 $ — $46.8 $(47.1) $13.0
Year ended December 31, 2013:Deducted from assets accounts:
Allowance for doubtful accounts . . . . . . . . $ 1.9 $ — $ 2.8 $ (0.8)(a) $ 3.9Reserve for customer deductions . . . . . . . . 3.4 3.4 39.5 (39.6)(b) 6.7Deferred tax asset valuation allowance . . . . — 2.7 — — 2.7
Total . . . . . . . . . . . . . . . . . . . . . . . . . . $ 5.3 $6.1 $42.3 $(40.4) $13.3
Year ended December 31, 2012:Deducted from assets accounts:
Allowance for doubtful accounts . . . . . . . . $ 1.9 $ — $ 1.0 $ (1.0)(a) $ 1.9Reserve for customer deductions . . . . . . . . 3.1 — 31.0 (30.7)(b) 3.4
Total . . . . . . . . . . . . . . . . . . . . . . . . . . $ 5.0 $ — $32.0 $(31.7) $ 5.3
(a) Consists primarily of uncollectable accounts written off, net of recoveries, during the year.(b) Consists primarily of discounts taken by customers during the year.
All other schedules for which provision is made in the applicable accounting regulations of the Securitiesand Exchange Commission are not required under the related instructions, are inapplicable or not material, or theinformation called for thereby is otherwise included in the financial statements or the accompanying notes to thefinancial statements and therefore, have been omitted.
88

(2) Exhibits
ExhibitNumber Description
2.1 Contribution Agreement, dated as of January 25, 1999, among Pactiv Corporation (formerly knownas Tenneco Packaging Inc.) (“Pactiv”), PCA Holdings LLC (“PCA Holdings”) and PackagingCorporation of America (“PCA”). (Incorporated herein by reference to Exhibit 2.1 to PCA’sregistration Statement on Form S-4, Registration No. 333-79511).
2.2 Letter Agreement Amending the Contribution Agreement, dated as of April 12, 1999, among Pactiv,PCA Holdings and PCA. (Incorporated herein by reference to Exhibit 2.2 to PCA’s RegistrationStatement on Form S-4, Registration No. 333-79511).
2.3 Agreement and Plan of Merger, dated September 16, 2013, between PCA, Bee Acquisition Corp. andBoise, Inc. (Incorporated herein by reference to Exhibit 2.1 to PCA’s Current Report on Form 8-Kfiled September 17, 2013, File No. 1-15399). PCA will furnish supplementally a copy of any omittedschedule or exhibit to the SEC upon request; provided, however, that PCA may request confidentialtreatment pursuant to Rule 24b-2 of the Securities Exchange Act of 1934, as amended, for anyschedule or exhibit so furnished.
3.1 Restated Certificate of Incorporation of PCA. (Incorporated herein by reference to Exhibit 3.1 toPCA’s Registration Statement on Form S-4, Registration No. 333-79511).
3.2 Certificate of Amendment to Restated Certificate of Incorporation of PCA. (Incorporated herein byreference to Exhibit 3.2 to PCA’s Registration Statement on Form S-4, Registration No. 333-109437.)
3.3 Amended and Restated By-laws of PCA. (Incorporated herein by reference to Exhibit 3.1 to PCA’sCurrent Report on Form 8-K filed December 7, 2012, File No. 1-15399.)
4.1 Form of certificate representing shares of common stock. (Incorporated herein by reference toExhibit 4.9 to PCA’s Registration Statement on Form S-1, Registration No. 333-86963.)
4.2 Indenture, dated as of July 21, 2003, between PCA and U.S. Bank National Association.(Incorporated herein by reference to Exhibit 4.2 to PCA’s Quarterly Report on Form 10-Q for theperiod ended June 30, 2003, File No. 1-15399.)
4.3 First Supplemental Indenture, dated as of July 21, 2003, between PCA and U.S. Bank NationalAssociation. (Incorporated herein by reference to Exhibit 4.3 to PCA’s Quarterly Report on Form 10-Q for the period ended June 30, 2003, File No. 1-15399.)
4.4 Form of Rule 144A Global Note. (Incorporated herein by reference to Exhibit 4.5 to PCA’s QuarterlyReport on Form 10-Q for the period ended June 30, 2003, File No. 1-15399.)
4.5 Officers’ Certificate, dated March 25, 2008, pursuant to Section 301 of the Indenture filed herewithas Exhibit 4.2 (Incorporated herein by reference to Exhibit 4.1 to PCA’s Current Report on Form 8-Kfiled March 25, 2008, File No. 1-15399.)
4.6 6.50% Senior Notes due 2018. (Incorporated herein by reference to Exhibit 4.2 to PCA’s CurrentReport on Form 8-K filed March 25, 2008, File No. 1-15399.)
4.7 Officers’ Certificate and 3.90% Senior Notes due 2022. (Incorporated herein by reference toExhibit 4.2 to PCA’s Current Report on Form 8-K filed June 26, 2012, File No. 1-15399.)
4.8 Officers’ Certificate, dated as of October 22, 2013, pursuant to Section 301 of the Indenture filedherewith as Exhibit 4.2. (Incorporated herein by reference to Exhibit 4.1 to PCA’s Current Report onForm 8-K filed October 22, 2013, File No 1-15399.)
4.9 4.500% Senior Notes due 2023. (Incorporated herein by reference to Exhibit 4.2 to PCA’s CurrentReport on Form 8-K filed October 22, 2013, File No 1-15399.)
89
ExhibitNumber Description
4.10 Officers’ Certificate, dated September 5, 2014, pursuant to Section 301 of the Indenture, dated July21, 2003, by and between Packaging Corporation of America and U.S. Bank National Association(Incorporated herein by reference to Exhibit 4.1 to PCA’s Current Report on Form 8-K filedSeptember 5, 2014, File No. 1-15399).
4.11 3.650% Senior Notes due 2024 (Incorporated herein by reference to Exhibit 4.2 to PCA’s CurrentReport on Form 8-K filed September 5, 2014, File No. 1-15399).
10.1 Credit Agreement, dated as of October 18, 2013, by and among PCA and the lenders and agentsnamed therein. (Incorporated herein by reference to Exhibit 10.1 to PCA’s Current Report onForm 8-K filed October 22, 2013, File No. 1-15399, which incorporates by reference Exhibit (b)(2)to Amendment No. 6 to PCA’s Schedule filed October 21, 2013).
10.2 Packaging Corporation of America Thrift Plan for Hourly Employees and First Amendment ofPackaging Corporation of America Thrift Plan for Hourly Employees, effective February 1, 2000.(Incorporated herein by reference to Exhibit 4.5 to PCA’s Registration Statement on Form S-8,Registration No. 333-33176.)*
10.3 Packaging Corporation of America Retirement Savings Plan, effective February 1, 2000.(Incorporated herein by reference to Exhibit 4.6 to PCA’s Registration Statement on Form S-8,Registration No. 333-33176.)*
10.4 Form of Stock Option Agreement for employees under the Amended and Restated 1999 Long-termEquity Incentive Plan. (Incorporated herein by reference to Exhibit 10.1 to PCA’s Current Report onForm 8-K, dated March 14, 2006, File No. 1-15399.)*
10.5 Form of Restricted Stock Award Agreement for employees and non-employee directors under theAmended and Restated 1999 Long-term Equity Incentive Plan. (Incorporated herein by reference toExhibit 10.3 to PCA’s Current Report on Form 8-K, filed March 14, 2006, File No. 1-15399.)*
10.6 Packaging Corporation of America Supplemental Executive Retirement Plan, as Amended andRestated Effective as of January 1, 2005. (Incorporated herein by reference to Exhibit 10.31 toPCA’s Annual Report on Form 10-K for the year ended December 31, 2006, File No. 1-15399.)*
10.7 Packaging Corporation of America Deferred Compensation Plan, effective as of January 1, 2009.(Incorporated herein by reference to Exhibit 10.15 to PCA’s Annual Report on Form 10-K for theyear ended December 31, 2008, File No. 1-15399.)*
10.8 Packaging Corporation of America Amended and Restated Executive Incentive Compensation Plan,effective as of February 28, 2007. (Incorporated herein by reference to Exhibit 10.32 to PCA’sAnnual Report on Form 10-K for the year ended December 31, 2006, File No. 1-15399.)*
10.9 First Amendment of Packaging Corporation of America Supplemental Executive Retirement Plan,effective as of January 1, 2008. (Incorporated herein by reference to Exhibit 10.17 to PCA’s AnnualReport on Form 10-K for the year ended December 31, 2008, file No. 1-15399.)*
10.10 Amended and Restated 1999 Long-Term Equity Incentive Plan, effective as of May 1, 2013.(Incorporated herein by reference to Appendix A to PCA’s Definitive Proxy Statement onSchedule 14A, filed with the SEC on March 22, 2013, File No 1-15399.)*
10.11 PCA Performance Incentive Plan, effective as of May 11, 2010. (Incorporated herein by reference toAppendix A to PCA’s Definitive Proxy Statement on Schedule 14A, filed with the SEC on March 30,2010, File No. 1-15399.)*
10.12 Amended and Restated Agreement, dated February 26, 2015, between Packaging Corporation ofAmerica and Paul T. Stecko.†
10.13 Second Amendment of Packaging Corporation of America Supplemental Executive Retirement Plan,effective as of February 28, 2013. (Incorporated herein by reference to Exhibit 10.22 to PCA’sAnnual Report on Form 10-K for the year ended December 31, 2012, File No. 1-15399.)*
90

ExhibitNumber Description
10.14 Third Amendment of Packaging Corporation of America Supplemental Executive Retirement Plan,effective as of February 28, 2013. (Incorporated herein by reference to Exhibit 10.23 to PCA’sAnnual Report on Form 10-K for the year ended December 31, 2012, File No. 1-15399.) *
10.15 Form of Restricted Stock Agreement for executive officer awards made in June 2013. (Incorporatedby reference to Exhibit 10.1 to PCA’s Quarterly Report on Form 10-Q for the period ended June 30,2013, File No. 1-15399).*
10.16 Form of Performance Unit Agreement for executive officer awards made in June 2013. (Incorporatedby reference to Exhibit 10.2 to PCA’s Quarterly Report on Form 10-Q for the period ended June 30,2013, File No. 1-15399).*
10.17 Performance Based Equity Award Pool for Executive Officers relating to awards made in June 2013.(Incorporated by reference to Exhibit 10.3 to PCA’s Quarterly Report on Form 10-Q for the periodended June 30, 2013, File No. 1-15399).*
10.18 Paper Purchase Agreement, dated June 25, 2011 (the “Paper Purchase Agreement”), between BoiseWhite Paper, L.L. C. and OfficeMax Incorporated (Incorporated by reference to Exhibit 10.1 toBoise, Inc.’s Quarterly Report on Form 10-Q for the period ended June 30, 2013, File No. 1-33541)
10.19 First Amendment to Paper Purchase Agreement, dated June 20, 2013, between Boise White Paper,L.L.C. and OfficeMax Incorporated (Incorporated by reference to Exhibit 10.2 to Boise, Inc.’sQuarterly Report on Form 10-Q for the period ended June 30, 2013, File No. 1-33541)
10.20 Form of Restricted Stock Award Agreement for December 16, 2013 awards to Mark W. Kowlzan,Thomas A. Hassfurther and Richard B. West. (Incorporated herein by reference to Exhibit 10.1 toPCA’s Current Report on Form 8-K, filed December 17, 2013, File No. 1-15399).*
10.21 Form of Performance Unit Agreement for executive officer awards made in June 2014. (Incorporatedby reference to Exhibit 10.1 to PCA’s Quarterly Report on Form 10-Q for the period ended June 30,2014, File No. 1-15399).*
10.22 Form of Restricted Stock Agreement for executive officer awards made in June 2014. (Incorporatedby reference to Exhibit 10.2 to PCA’s Quarterly Report on Form 10-Q for the period ended June 30,2014, File No. 1-15399).*
12.1 Statement Regarding Computation of Ratio of Earnings to Fixed Charges†
16.1 Letter from Ernst & Young LLP dated November 15, 2013. (Incorporated herein by reference toExhibit 16 to PCA’s Current Report on Form 8-K, filed November 15, 2013, File No. 1-15399).
16.2 Letter from Ernst & Young LLP dated March 3, 2014. (Incorporated herein by reference to Exhibit16.1 to PCA’s Current Report on Form 8-K, filed March 3, 2014, File No. 1-15399).
21.1 Subsidiaries of the Registrant.†
23.1 Consent of KPMG LLP (2014).†
23.2 Consent of KPMG LLP (2013).†
23.3 Consent of Ernst & Young LLP.†
24.1 Powers of Attorney.†
31.1 Certification of Chief Executive Officer, As Adopted Pursuant to Section 302 of the Sarbanes-OxleyAct of 2002.†
31.2 Certification of Chief Financial Officer, As Adopted Pursuant to Section 302 of the Sarbanes-OxleyAct of 2002.†
32 Certification of Chief Executive Officer and Chief Financial Officer Pursuant to 18 U.S.C. §1350, AsAdopted Pursuant to Section 906 of the Sarbanes-Oxley Act of 2002.†
99.1 Independent Auditors’ Report (KPMG).†
91

ExhibitNumber Description
101 The following financial information from Packaging Corporation of America’s Annual Report onForm 10-K for the year ended December 31, 2014, formatted in XBRL (eXtensible BusinessReporting Language): (i) Consolidated Statements of Income for the years ended December 31,2014, 2013, and 2012, (ii) Consolidated Balance Sheets at December 31, 2014 and 2013,(iii) Consolidated Statements of Cash Flows for the years ended December 31, 2014, 2013, and 2012,(iv) Consolidated Statements of Changes in Stockholders’ Equity for the years ended December 31,2014, 2013, and 2012, (v) the Notes to Consolidated Financial Statements, and (vi) FinancialStatement Schedule-Valuation and Qualifying Accounts.
* Management contract or compensatory plan or arrangement.† Filed herewith.
92
SIGNATURES
Pursuant to the requirements of Section 13 or 15(d) of the Securities Exchange Act of 1934, the registrantshave duly caused this report to be signed on their behalf by the undersigned, thereunto duly authorized onFebruary 27, 2015.
Packaging Corporation of America
/s/ MARK W. KOWLZAN
Mark K. KowlzanChief Executive Officer
/s/ RICHARD B. WEST
Richard B. WestSenior Vice President and Chief Financial Officer
93

Pursuant to the requirements of the Securities Exchange Act of 1934, this report has been signed below onFebruary 27, 2015, by the following persons on behalf of the registrants and in the capacities indicated.
Signature Capacity
/s/ MARK W. KOWLZAN
Mark W. Kowlzan
Chief Executive Officer and Director(Principal Executive Officer)
/s/ RICHARD B. WEST
Richard B. West
Senior Vice President and Chief Financial Officer(Prinicpal Financial and Accounting Officer)
*
Paul T. Stecko
Chairman of the Board
*
Cheryl K. Beebe
Director
*
Hasan Jameel
Director
*
Robert C. Lyons
Director
*
Thomas P. Maurer
Director
*
Samuel M. Mencoff
Director
*
Roger B. Porter
Director
*
Thomas S. Souleles
Director
*
James D. Woodrum
Director
/s/ RICHARD B. WEST
Richard B. West(Attorney-In-Fact)
94

Exhibit 31.1
CEO CERTIFICATION PURSUANT TO SECTION 302OF THE SARBANES-OXLEY ACT OF 2002
I, Mark W. Kowlzan, certify that:
(1) I have reviewed this annual report on Form 10-K of Packaging Corporation of America (PCA);
(2) Based on my knowledge, this annual report does not contain any untrue statement of a material fact oromit to state a material fact necessary to make the statements made, in light of the circumstances under whichsuch statements were made, not misleading with respect to the period covered by this annual report;
(3) Based on my knowledge, the financial statements, and other financial information included in thisannual report, fairly present in all material respects the financial condition, results of operations and cash flowsof PCA as of, and for, the periods presented in this annual report;
(4) PCA’s other certifying officer and I are responsible for establishing and maintaining disclosure controlsand procedures (as defined in Exchange Act Rules 13a-15(e) and 15d-15(e)) and internal control over financialreporting (as defined in Exchange Act Rules 13a-15(f) and 15d-15(f)) for PCA and have:
a) designed such disclosure controls and procedures, or caused such disclosure controls and proceduresto be designed under our supervision, to ensure that material information relating to PCA, including itsconsolidated subsidiaries, is made known to us by others within those entities, particularly during the periodin which this report is being prepared;
b) designed such internal control over financial reporting, or caused such internal control over financialreporting to be designed under our supervision, to provide reasonable assurance regarding the reliability offinancial reporting and the preparation of financial statements for external purposes in accordance withgenerally accepted accounting principles;
c) evaluated the effectiveness of PCA’s disclosure controls and procedures and presented in this reportour conclusions about the effectiveness of the disclosure controls and procedures, as of the end of the periodcovered by this report based on such evaluation; and
d) disclosed in this report any change in PCA’s internal control over financial reporting that occurredduring PCA’s most recent fiscal quarter (PCA’s fourth fiscal quarter in the case of an annual report) that hasmaterially affected, or is reasonably likely to materially affect, PCA’s internal control over financialreporting; and
(5) PCA’s other certifying officer and I have disclosed, based on our most recent evaluation of internalcontrol over financial reporting, to PCA’s auditors and the Audit Committee of PCA’s Board of Directors (orpersons performing the equivalent functions):
a) all significant deficiencies and material weaknesses in the design or operation of internal controlover financial reporting which are reasonably likely to adversely affect PCA’s ability to record, process,summarize and report financial information; and
b) any fraud, whether or not material, that involves management or other employees who have asignificant role in PCA’s internal control over financial reporting.
/s/ MARK W. KOWLZAN
Mark W. KowlzanChief Executive Officer
Date: February 27, 2015

Exhibit 31.2
CFO CERTIFICATION PURSUANT TO SECTION 302OF THE SARBANES-OXLEY ACT OF 2002
I, Richard B. West, certify that:
(1) I have reviewed this annual report on Form 10-K of Packaging Corporation of America (PCA);
(2) Based on my knowledge, this annual report does not contain any untrue statement of a material fact oromit to state a material fact necessary to make the statements made, in light of the circumstances under whichsuch statements were made, not misleading with respect to the period covered by this annual report;
(3) Based on my knowledge, the financial statements, and other financial information included in thisannual report, fairly present in all material respects the financial condition, results of operations and cash flowsof PCA as of, and for, the periods presented in this annual report;
(4) PCA’s other certifying officer and I are responsible for establishing and maintaining disclosure controlsand procedures (as defined in Exchange Act Rules 13a-15(e) and 15d-15(e)) and internal control over financialreporting (as defined in Exchange Act Rules 13a-15(f) and 15d-15(f)) for PCA and have:
a) designed such disclosure controls and procedures, or caused such disclosure controls and proceduresto be designed under our supervision, to ensure that material information relating to PCA, including itsconsolidated subsidiaries, is made known to us by others within those entities, particularly during the periodin which this report is being prepared;
b) designed such internal control over financial reporting, or caused such internal control over financialreporting to be designed under our supervision, to provide reasonable assurance regarding the reliability offinancial reporting and the preparation of financial statements for external purposes in accordance withgenerally accepted accounting principles;
c) evaluated the effectiveness of PCA’s disclosure controls and procedures and presented in this reportour conclusions about the effectiveness of the disclosure controls and procedures, as of the end of the periodcovered by this report based on such evaluation; and
d) disclosed in this report any change in PCA’s internal control over financial reporting that occurredduring PCA’s most recent fiscal quarter (PCA’s fourth fiscal quarter in the case of an annual report) that hasmaterially affected, or is reasonably likely to materially affect, PCA’s internal control over financialreporting; and
(5) PCA’s other certifying officer and I have disclosed, based on our most recent evaluation of internalcontrol over financial reporting, to PCA’s auditors and the Audit Committee of PCA’s Board of Directors (orpersons performing the equivalent functions):
a) all significant deficiencies and material weaknesses in the design or operation of internal controlover financial reporting which are reasonably likely to adversely affect PCA’s ability to record, process,summarize and report financial information; and
b) any fraud, whether or not material, that involves management or other employees who have asignificant role in PCA’s internal control over financial reporting.
/s/ RICHARD B. WEST
Richard B. WestSenior Vice President and Chief Financial Officer
Date: February 27, 2015

Exhibit 32
CERTIFICATIONS OF CHIEF EXECUTIVE OFFICER ANDCHIEF FINANCIAL OFFICER
PURSUANT TO 18 U.S.C. §1350,AS ADOPTED PURSUANT TO
SECTION 906 OF THE SARBANES-OXLEY ACT OF 2002
We are providing this Certificate pursuant to Section 906 of the Sarbanes-Oxley Act of 2002, 18 U.S.C.,Section 1350. It accompanies the Annual Report on Form 10-K of Packaging Corporation of America for theyear ended December 31, 2014.
I, Mark W. Kowlzan, Chief Executive Officer of Packaging Corporation of America (the “Company”),certify, pursuant to 18 U.S.C. § 1350, as adopted pursuant to Section 906 of the Sarbanes-Oxley Act of 2002, thatto my knowledge:
(1) The Annual Report of the Company on Form 10-K for the period ended December 31, 2014 fullycomplies with the requirements of Section 13(a) or 15(d) of the Securities Exchange Act of 1934; and
(2) The information contained in such Report fairly presents, in all material respects, the financial conditionand results of operations of the Company.
/s/ MARK W. KOWLZAN
Mark W. KowlzanChief Executive Officer
Date: February 27, 2015
I, Richard B. West, Chief Financial Officer of Packaging Corporation of America (the “Company”), certify,pursuant to 18 U.S.C. § 1350, as adopted pursuant to Section 906 of the Sarbanes-Oxley Act of 2002, that to myknowledge:
(1) The Annual Report of the Company on Form 10-K for the period ended December 31, 2014 fullycomplies with the requirements of Section 13(a) or 15(d) of the Securities Exchange Act of 1934; and
(2) The information contained in such Report fairly presents, in all material respects, the financial conditionand results of operations of the Company.
/s/ RICHARD B. WEST
Richard B. WestSenior Vice President and Chief Financial Officer
Date: February 27, 2015

Exhibit 99.1
Independent Auditors’ Report
The Board of Directors and StockholdersPackaging Corporation of America:
We have audited the consolidated balance sheet of Boise Inc. and subsidiaries as of December 31, 2013, andthe related consolidated statements of income and comprehensive income, changes in stockholder’s equity, andcash flows for the period from October 25, 2013 through December 31, 2013 (not presented separately herein).These consolidated financial statements are the responsibility of the Company’s management. Our responsibilityis to express an opinion on these consolidated financial statements based on our audit.
We conducted our audit in accordance with the auditing standards of the Public Company AccountingOversight Board (United States). Those standards require that we plan and perform the audit to obtain reasonableassurance about whether the financial statements are free of material misstatement. The Company is not requiredto have, nor were we engaged to perform, an audit of its internal control over financial reporting. Our auditincluded consideration of internal control over financial reporting as a basis for designing audit procedures thatare appropriate in the circumstances, but not for the purpose of expressing an opinion on the effectiveness of theCompany’s internal control over financial reporting. Accordingly, we express no such opinion. An audit alsoincludes examining, on a test basis, evidence supporting the amounts and disclosures in the financial statements,assessing the accounting principles used and significant estimates made by management, as well as evaluatingthe overall financial statement presentation. We believe that our audit provides a reasonable basis for ouropinion.
In our opinion, the consolidated financial statements referred to above present fairly, in all material respects,the financial position of Boise Inc. and subsidiaries as of December 31, 2013, and the results of their operationsand their cash flows for the period from October 25, 2013 through December 31, 2013 in conformity withU.S. generally accepted accounting principles.
/s/ KPMG LLP
Boise, IdahoFebruary 26, 2014

Board of Directors
Paul T. SteckoChairman of the Board,Packaging Corporation of America
Cheryl K. BeebeRetired Executive Vice Presidentand Chief Financial Officer,Ingredion Incorporated
Hasan JameelEllis Signe Olsen Professor,North Carolina State University
Mark W. KowlzanChief Executive Officer,Packaging Corporation of America
Robert C. LyonsExecutive Vice President andChief Financial Officer,GATX Corporation
Thomas P. MaurerRetired Partner,Ernst & Young LLP
Samuel M. MencoffCo-Chief Executive Officer,Madison Dearborn Partners, LLC
Roger B. PorterIBM Professor of Business andGovernment,Harvard University
Thomas S. SoulelesManaging Director,Madison Dearborn Partners, LLC
James D. WoodrumClinical Assistant Professor,Kellogg School of BusinessNorthwestern University
Executive Officers
Mark W. KowlzanChief Executive Officer
Thomas A. HassfurtherExecutive Vice President,Corrugated Products
Richard B. WestSenior Vice President andChief Financial Officer
Charles J. CarterSenior Vice President,Containerboard Mill Operations
Judith M. LassaSenior Vice President, Paper
Kent A. PfledererSenior Vice President,General Counsel and Secretary
Thomas W. H. WaltonSenior Vice President, Salesand Marketing, Corrugated Products
Officers
Pamela A. BarnesVice President and Treasurer
Mark D. BeymaVice President,Area General Manager
Charles G. ColbyVice President,Area General Manager
Bruce K. EllsberryVice President,Area General Manager
Donald R. HaagVice President,Manufacturing Services
Jeffrey S. KaserVice President,Area General Manager
Paul LeBlancVice President,Paper Sales and Marketing
Edward T. LeesVice President,Area General Manager
Bernadette M. MadarietaVice President and Controller
Peter A. MartensVice President, Finance
James A. McKeeVice President,Area General Manager
Darla J. OlivierVice President, Tax
Heidi L. PattonVice President,Containerboard Sales
Bruce A. RidleyVice President, EH&Sand Operations Services
Robert A. SchneiderVice President,Chief Information Officer
Donald R. ShirleyVice President,Corporate Process Technology
Jay C. ThiessenVice President,Containerboard

Shareholder Information
Annual MeetingThe annual meeting of shareholders will be held at 8:30 a.m., central time, on May 12, 2015, at the Company’soffice located at 1955 West Field Court, Lake Forest, IL 60045.
Shareholder ServicesTo transfer securities, change address or replace lost certificates, please contact:
Packaging Corporation of America Shareholder Servicesc/o Computershare Trust Company N.A., P.O. Box 30170, College Station, TX 77842-3170Toll Free: (877) 282-1168 Outside North America: (781) 575-2723Shareholder Website: www.computershare.com/investor
Stock Exchange InformationPackaging Corporation of America’s common stock is listed on the New York Stock Exchange under thesymbol PKG.
CertificationsOn May 21, 2014, the Company filed with the New York Stock Exchange (the “NYSE”) the Annual CEOCertification regarding the Company’s compliance with the NYSE’s Corporate Governance listing standards asrequired by Section 303A. 12(a) of the New York Stock Exchange Listed Company Manual. In addition, theCompany has filed as exhibits to this Annual Report on Form 10-K for the year ended December 31, 2014, theapplicable certifications of its Chief Executive Officer and its Chief Financial Officer required under Section 302of the Sarbanes-Oxley Act of 2002, regarding the quality of the Company’s public disclosures.
Website: www.packagingcorp.comCorporate news releases, Forms 10-K and 10-Q, annual reports and a variety of additional information ofpotential interest to investors are available through the Company’s website.
Requests for InformationAdditional information is available without charge. For additional copies of annual reports, Forms 10-K and10-Q or other financial information, please contact:
Investor Relations, Packaging Corporation of America, 1955 West Field Court, Lake Forest, IL 60045Toll Free: (877) 454-2509
[THIS PAGE INTENTIONALLY LEFT BLANK]

[THIS PAGE INTENTIONALLY LEFT BLANK]

Packaging Corporation of America is an ideas and solutions company — a company with a long history of excellence in the designing, engineering and manufacturing of corrugated products. The 2013 acquisition of Boise Inc. is providing new opportunities for PCA to apply its expertise and business philosophy to a broader market, and the integration continues to generate significant synergies.
The cornerstone of our business is the relationship between our customers and our people. Our success is made possible by a highly engaged, results-oriented workforce operating in an entrepreneurial culture and is driven by adding value to our customers’ businesses.
PCA’s common stock is listed on the New York Stock Exchange under the ticker symbol PKG.
PCA is the fourth largest producer of containerboard and
corrugated products in the United States. We manufacture many grades of kraft linerboard and corrugating medium at our
six containerboard mills and produce a wide variety of corrugated containers and displays at our 99 converting facilities.
Boise Paper is the third largest producer of uncoated freesheet in North America. Our team is dedicated to providing high-quality products, outstanding customer service and supply chain performance. Our product portfolio includes office, printing and converting, and pressure sensitive papers.
Packaging Corporation of America is a large company with a small-company feel. PCA’s strategic positioning affords our customers wide-ranging resources and
economies of scale, while our multiple locations put us in the right place at the right time to effectively meet customers’ local needs.
CHINA
SPAIN
NETHERLANDS
Ireland
FRANCE
CROATIA
Full-Line Plants
Sheet/Specialty Plants
Hexacomb Plants
White Paper Mills
Resource and Support Centers
Administrative Offices
Corporate Headquarters
Tharco Distribution Centers
Packaging and Supply Centers
Foam Fabricator
Sheet Feeder
Creative Design Centers
Technical Center
Containerboard Mills

2014 Annual Report
Containerboard & Corrugated ProductsBoise White Paper
© 2015 Packaging Corporation of America. All rights reserved.
When you choose Packaging Corporation of America, you work with people who do the right things for each other and for our customers. We believe in utilizing the power of strong collaborative relationships, bound by the trust we have earned, to deliver innovative packaging solutions and an outstanding service experience.
Packaging Corporation of America1955 West Field CourtLake Forest, Illinois 60045(800) 456-4725www.packagingcorp.com