2014 annual progress report table of contents state university, western research and demonstration...
TRANSCRIPT

Iowa State University, Western Research and Demonstration Farm ISRF14-10
2014 Annual Progress Report Table of Contents
Western Research Farm Summary RFR-A1439 ...........................................................................1
Update: ISU FARM Network RFR-A1438 ..................................................................................6
Weather and Growing Season Summary, 2014 RFR-A1437 .......................................................8
Diesel Fuel Consumption during Tractor Operations RFR-A1475 ............................................10
ISU On-Farm Cooperator Trials: Relationships and Partnerships RFR-A1472 .........................13
On-Farm Corn Population Trials RFR-A1435 ...........................................................................16
On-Farm Corn Rootworm Trials RFR-A1411 ............................................................................20
On-Farm Sulfur Fertilization of Corn and Soybean Trials RFR-A1446 ....................................23
On-Farm Corn Fertilizer Trials RFR-A1447 ..............................................................................25
On-Farm Corn and Soybean Management Trials RFR-A1450 ..................................................28
On-Farm Soybean Seed Treatment Trials RFR-A1436 ..............................................................31
On-Farm Soybean Fungicide Trials RFR-A1409 .......................................................................33
On-Farm Cover Crop Trials RFR-A1449 ...................................................................................35
Western Research Farm
36515 Hwy E-34 Castana, IA 51010
Phone: 712-885-2802 Fax: 712-885-2600
Directions: Go 4 miles east of Castana on County Road E-34
Preparation of this report was coordinated by Wayne Roush of the Western Research Farm. Questions or requests for additional information should be directed to the contributing authors. NOTE: This is a progress report and, therefore, is not necessarily conclusive. Further data may result in conclusions somewhat different from those reported here.
The mention of firm names or trade products does not imply that they are endorsed over other firms or similar products not mentioned.
Annual report, farm and weather information is available at: www.ag.iastate.edu/farms/
Progress reports also can be found on the ISU Extension website fpr.extension.iastate.edu/. This site allows sorting by field, area, department, and farm.

Iowa State University, Western Research and Demonstration Farm ISRF14-10
1
Western Research Farm Summary
RFR-A1439
Western Iowa Experimental Farm Association Founded 1946
Officers
Chairperson ........................................................................................ Kyle Bohnker, Charter Oak Vice Chairperson ........................................................................................ Linda Herman, Pisgah Secretary-Treasurer ........................................................................................ Richard Pope, Sloan
Directors
Aaron Gress ....................................................................................................... Crawford County Kyle Bohnker ..................................................................................................... Crawford County Linda Herman ...................................................................................................... Harrison County Gary Guge ............................................................................................................ Harrison County Keith Zediker ....................................................................................................... Monona County James Else ............................................................................................................ Monona County Jason Yockey .................................................................................................... Woodbury County Rich Pope .......................................................................................................... Woodbury County Larry Ketelsen .................................................................................................................... At large
Western Research Farm
Wayne Roush ......................................................................................................... Superintendent Chris Beedle .............................................................................................. Ag Research Specialist Mark Honeyman ............................................................................. Coordinator, Research Farms Tim Goode ............................................................................................ Manager, Research Farms 103 Curtiss Hall, ISU Ames, IA 50011

Iowa State University, Western Research and Demonstration Farm ISRF14-10
2
Farm Summary
Wayne Roush, farm superintendent
Farm Comments Developments. Equipment changes during 2014 included purchases of a new Demco 550 grain cart with scale and tarp, a used Hagie hi-boy sprayer, and a new gooseneck flatbed trailer. The sprayer and gooseneck trailer to haul it will be shared with another ISU farm. A new Gandy drop fertilizer spreader also was purchased. These purchases will help support many of the trials conducted by the farm. A swine weighing scale was replaced and a used gravity wagon was transferred to another farm. Numerous general farm maintenance activities occurred over the year. The new automated weather station for the Iowa Mesonet system (installed in late 2013) came on-line in late summer 2014. Various problems plagued it during initial startup and most of the summer was spent chasing problems, installing a new enclosure, and re-calibrating its instrumentation. It now will supply real-time weather data accessible to the public. Construction of a new machinery storage hoop was completed. Dirt work in fields, terrace repairs, and removal of volunteer trees and old fences helped to consolidate various fields. General clean-up, scrap iron sales, and some new pasture border fence installation also occurred. A new staff member, Chris Beedle, was added in December. He is a 2009 ISU graduate and a western Iowa native. Field days and tours. Because the county paved road that bisects the farm was scheduled for total reconstruction, a minimum of field days and activities were held at the farm in 2014. The construction commenced May 27 and was not totally completed by December 31. Numerous rain events delayed
progress and created extremely muddy conditions. The mud, activity of construction equipment, and truck traffic greatly hindered movement both to and around the farm. During the actual pouring of new concrete, a cement truck passed by the farm every 4-5 minutes! Only four events were held during the year, with a total of 232 people either visiting the farm or attending a meeting. The Annual Meeting, Crop Update Informational meeting, and Manure Applicator Certification Training were held in late February. Thirteen producers attended the ISU Farmer Cooperator Trials participant meeting, also in February. The participant meeting covers all trials statewide, with an emphasis on the local ones. Participants can see how their trials/ideas mesh with others and get a chance to interact with ISU crops personnel. New projects. Three new projects were started on-site in 2014. Plasticity in native and exotic bunch grasses within low and high diversity prairie communities, diesel fuel consumption during field operations, and documenting efficiencies of heavy weight market pigs in bedded hoop barns were conducted. Other new project developments were under the ISU On-Farm Cooperator Trials banner, which completed 14 of the 24 trials started in the spring of 2014. The 10 abandoned ones were due to wet weather induced poor field conditions. Livestock. With the addition of ISU On-Farm Cooperator Trials to Western’s research mix, livestock production has been rearranged to more closely match available labor. Livestock production at the farm will focus on research-based trials. Livestock production in 2014 included a group of 20 steers pastured during the summer and then shipped to another farm for finishing. These steers were part of the McNay Research farm’s cattle breeding trial. Any extra pastures were either mowed for hay

Iowa State University, Western Research and Demonstration Farm ISRF14-10
3
or sold as standing forage. Portions of the cattle finishing facilities were rented out. Swine production consisted of finishing 36 head as part of a trial. The pigs were weighed every 28 days and ultra-sounded for muscle and fat deposition three times as they neared the designated terminal weight.
Crop Season Comments At the farm, corn planting started on May 3 and was completed on May 5. Corn harvest started on November 24 and was completed November 30, with an average yield of 195.8 bushels/acre. Soybeans were planted between May 6 and May 9. Soybean harvest started October 15 and was completed on October 16, with an average yield of 62.0 bushels/acre. These corn and soybean yields were 10.8 percent and 10.0 percent above five-year farm averages. Alfalfa yields averaged 6.5 tons/acre with three cuttings harvested and were 1.36 ton/acre above the five-year farm average. The year began with the coldest winter in 35 years. Persistent below average cold, little snow cover, and relatively dry soils allowed the ground to freeze much deeper than normal. Recorded soil temperatures at the farm indicate soils finally thawed across western Iowa early in the forth week of April. Frequent rains and cold soils of mid- to late-April got planting off to a slow start, however much drier weather in May allowed rapid planting progress. A hard freeze occurred over most of western Iowa on May 16. Although some area crops experienced enough damage to require replanting, none at the research farm were damaged to that degree.
During planting, there was once again long-term drought concerns due to the unusually dry weather during the second half of 2013. At planting, there was enough soil moisture to get the crop up, but not enough to sustain it during the summer. These concerns were short-lived however, as June precipitation totals were well above normal at every Iowa reporting point. Parts of western Iowa eventually recorded their wettest calendar year of record. The rains subsided across most of the state and growing conditions were nearly ideal during July. No damaging heat occurred during the critical reproductive phase of crop development with only three days reaching 90°F or above. Statewide there are normally 23 days above 90°F. Crop maturity and dry-down was slowed by the cool and abnormally wet growing season, and the 2014 harvest got off to a very slow start. Frequent rains in September and early October also hampered the start of harvest, however much drier weather from mid-October through early November allowed harvest to be completed. Although yields were above normal for the farm, corn test weights were below normal and grain moistures ran above normal. One good effect of a cooler and wetter summer was soil moisture levels at the end of the growing season were the greatest since 2010.
Acknowledgements
We would like to thank all members, sustaining members, and donors who support the Western Research and Demonstration Farm through donations of time, money, and products. Their support has made many of this year’s trials possible.

Iowa State University, Western Research and Demonstration Farm ISRF14-10
4
Sustaining Members Community Bank, Dunlap First State Bank, Mapleton
Sloan State Bank, Sloan and Whiting Iowa-Nebraska State Bank, S. Sioux City
Valley Bank, Mapleton and Danbury Western Iowa Power Cooperative
Soil and Water Conservation Districts of: Crawford County Harrison County Monona County
Woodbury County
Donors Bomgaars, Mapleton
LG Seeds, Brad Hanson Mapleton Press, Mapleton
Marc Clemon, Soldier Renze Seeds, Dennis Boyle Wyffels Seeds, Brian Stueve
Research Farm Projects Project Project Leader Documenting efficiencies of heavy weight market pigs in bedded hoop barns
M. Honeyman/D. Stender
Dominant grass effects on diversity and functioning of restored Grasslands
B. Wilsey
Effects of biochar and manure applications to prairie establishment Plasticity in native and exotic bunch grasses within low and high diversity prairie communities
L. Biederman K. Barber
National Phenology network study M. Schwartz
Native cover crops: effects on prairie establishment and weed invasion
B. Wilsey
Plant species effects on diversity and weed invasion resistance in restored grasslands
B. Wilsey

Iowa State University, Western Research and Demonstration Farm ISRF14-10
5
Project (continued) Project Leader Diesel fuel consumption during field operation(s) Planting corn Drilling cover crops Mowing hay Hauling bales Hauling grain Rotary mowing
M. Hanna
U.S. Weather Service weather station Air temps; hi, lo, current Soil temps; 1, 2, 8, 20, 40 in. Evaporation dish Daily precipitation Severe weather spotter Iowa MesoNet weather station (real time data online) Air temperature Relative humidity Precipitation Wind: speed & direction Solar radiation Soil temperature Soil moisture Demonstrations: Manure settlement basin Composting livestock mortalities Composting hoop buildings manure pack Swine finishing in hoop buildings Farmer Cooperator Trials (see article elsewhere in this report for details) Corn foliar fertilizer Drought tolerance Population (5) Cover crops Corn rootworm traits (2) Sulfur fertility Mechanical injury at VT applications Soybean treated seed Fungicide

Iowa State University, Western Research and Demonstration Farm ISRF14-10
6
Update: ISU FARM Network
RFR-A1438
Wayne Roush, farm superintendent
Introduction Since its inception in 1946, Iowa State University’s (ISU) Western Research Farm (WRF) has fulfilled its original stated objective of “careful research giving definite answers to specific problems.” In continuing with that tradition, the WRF joined the On-farm Research Network of the ISU Corn and Soybean Initiative (CSI) and started conducting on-farm trials with participating local producers during the 2010 growing season. The CSI network was initiated in 2006 and underwent a metamorphosis in 2011 and 2014 and is now known as: Farmer Cooperator Trials. The original farmer trials network was started at the ISU Northwest Research Farm, and as Farmer Cooperator Trials, it has expanded to the western, north central, central, southwest, and southeast regions of the state. Future expansion across the remainder of Iowa is possible. The Farmer Cooperator Trials structure allows for expanded networking. The university research farms serve as logistical hubs and ISU ag specialists, Extension field agronomists, and campus researchers serve as technical hubs. Most project ideas are farmer-driven and some may be researcher-driven, with both working to achieve the stated goal of “a research network to improve soybean and corn production with replicated trials in farmer fields.”
Materials and Methods In 2014, the WRF coordinated with ag business partners, ISU Extension field agronomists, and local producers to help identify specific local, crop-based research needs, and to identify local producers willing to participate in on-farm trials. Research trials then were set up in farmer’s fields with producers providing the equipment and land base, and WRF and Extension staff providing trial planning and plot layout, data collection and analysis, and assistance in planting and harvesting. There were 12 corn trials and two soybean trials completed in 2014. Another 10 trials were abandoned during the growing season due to wet weather induced poor field conditions. The following is a final list of the participant trials conducted by WRF during the 2014 growing season. Corn Rootworm Control Comparison (2) CRW traited hybrid vs. isoline Corn drought resistant hybrid comparison Corn sulfur fertilizer hill ground Corn cover crop Corn foliar fertilizer Corn population trials (5) Corn mechanical injury at VT applications Soybean seed treatment CruiserMaxx Soybean foliar fungicide treated vs. non-treated

Iowa State University, Western Research and Demonstration Farm ISRF14-10
7
Results and Discussion Results of the various trials undergo statistical analysis and are published in the research farm’s progress reports. If you have a crop-related production question, or are interested in participating in an ISU trial, please stop in or call the WRF at 712-885-2802. We will assist you with the plot and display (optional) an official ISU participant sign at your location.
Acknowledgements
Thank you to all the companies, producers, and other individuals who helped make this year’s trials possible through their participation or donations of time, money, product, equipment, and land.
ISU FARM trials sponsors Companies Berne Coop, Ute Calcium Products Incorporated, Ft. Dodge Goshorn Seed & Ag Supply, Harlan Renze Seeds, Templeton Wyfells Seeds, Ute Individuals Dennis Boyle Joel Bubke Joel De Jong Brad Hanson Harvey Hanson Harry Riesberg Rich Rosner Brian Stueve Jerry Thies Chris Theilan Marc Clemon

Iowa State University, Western Research and Demonstration Farm ISRF14-10
8
Weather and Growing Season Summary, 2014
RFR-A1437
Chris Beedle, ag specialist ISU Western Research Farm
Weather Summary
Cool and wet seemed to be the rule for most of 2014, with several weather records broken over the course of the year. Average temperatures were 45.4oF, which is 2.7oF below normal. This ranks as the sixth
coolest year in 142 years of records. The year began with the coldest winter season in 35 years. The prolonged duration of cold, along with relatively dry soils, allowed the ground to freeze to unusual depths. Soils under roadways froze up to 5 1/2 ft and led to hundreds of water main breaks across the state. A hard freeze was recorded over much of northwestern Iowa on May 16 with the temperature falling to 24oF at Spencer. This was the lowest temperature recorded so late in the spring since 1963. There was only an average of three days of temperatures exceeding 90oF or above with 97oF being the high for the summer. Heavy rain was widespread across northern and eastern Iowa for the month of June with widespread flooding. June precipitation totals were above normal at every Iowa reporting point with Moville in Woodbury County reporting the most rain of 18.70 in. The statewide average precipitation for June was 9.92 in. and was the fourth highest calendar month total in 142 years of state records. Annual precipitation totals varied from about 25 in. at Hawarden and Spirit Lake in the northwest to a little over 55 in. at Greenfield.
Growing Season Iowa entered the year with drought concerns, due to the unusually dry weather occurring during the second half of 2013. January through March precipitation was below normal. However, April brought normal to above normal precipitation for most of the state, except for the far northwest corner of the state, which recorded one of the driest springs on record. Frequent rains and cold soil temperatures during April delayed the planting season. However, drier weather in May allowed for a quick catch up. Heavy rains and flooding in June drowned/washed out some crops and required some replanting. Fortunately, rain subsided across most of the state in July and brought a relatively quick end to flooding issues across Iowa. However, wet weather redeveloped across much of the southwest one-third of Iowa during August and persisted in the same areas through mid-October. Soil moisture levels at the end of the growing season were the greatest since 2010. The driest soils were in northwest Iowa, but even their moisture levels were better than at the end of the three previous seasons. Very wet soils prevailed over a broad swath of central and southwest Iowa.
Crop Yield and Quality Cold soils and frequent rains in mid and late April got planting off to a slow start. However, much drier weather in May allowed rapid planting progress. The heavy rains and flooding washed out some crops in June and necessitated some replanting, particularly in northern areas. However, growing conditions were nearly ideal during July with no damaging heat during the critical reproductive phase of crop development. The 2014 harvest got off to a slow start due to frequent rain in September and early October. Additionally, crop maturity and grain dry-down was slowed by the cool growing season, thus giving even
Iowa State University, Western Research and Demonstration Farm ISRF14-10
9
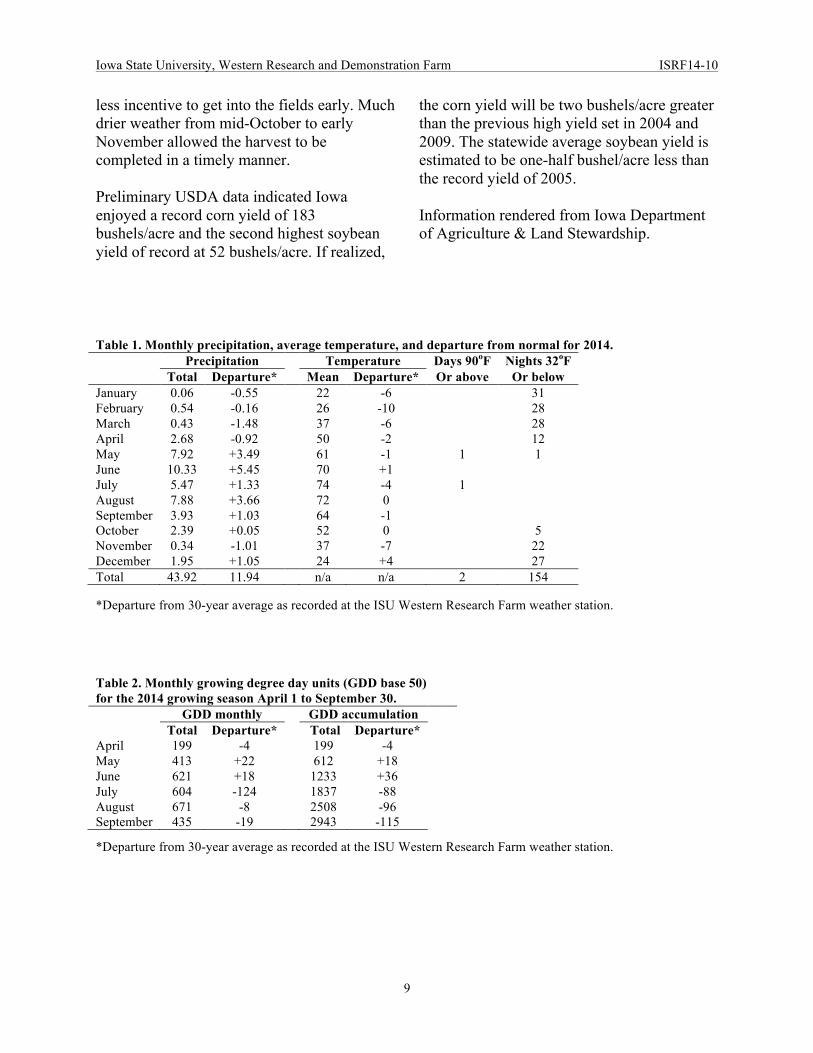
less incentive to get into the fields early. Much drier weather from mid-October to early November allowed the harvest to be completed in a timely manner. Preliminary USDA data indicated Iowa enjoyed a record corn yield of 183 bushels/acre and the second highest soybean yield of record at 52 bushels/acre. If realized,
the corn yield will be two bushels/acre greater than the previous high yield set in 2004 and 2009. The statewide average soybean yield is estimated to be one-half bushel/acre less than the record yield of 2005. Information rendered from Iowa Department of Agriculture & Land Stewardship.
Table 1. Monthly precipitation, average temperature, and departure from normal for 2014.
*Departure from 30-year average as recorded at the ISU Western Research Farm weather station. Table 2. Monthly growing degree day units (GDD base 50) for the 2014 growing season April 1 to September 30.
*Departure from 30-year average as recorded at the ISU Western Research Farm weather station.
Precipitation Temperature Days 90oF Nights 32oF Total Departure* Mean Departure* Or above Or below January 0.06 -0.55 22 -6 31 February 0.54 -0.16 26 -10 28 March 0.43 -1.48 37 -6 28 April 2.68 -0.92 50 -2 12 May 7.92 +3.49 61 -1 1 1 June 10.33 +5.45 70 +1 July 5.47 +1.33 74 -4 1 August 7.88 +3.66 72 0 September 3.93 +1.03 64 -1 October 2.39 +0.05 52 0 5 November 0.34 -1.01 37 -7 22 December 1.95 +1.05 24 +4 27 Total 43.92 11.94 n/a n/a 2 154
GDD monthly GDD accumulation Total Departure* Total Departure* April 199 -4 199 -4 May 413 +22 612 +18 June 621 +18 1233 +36 July 604 -124 1837 -88 August 671 -8 2508 -96 September 435 -19 2943 -115

Iowa State University, Western Research and Demonstration Farm ISRF14-10
10
Diesel Fuel Consumption during Tractor Operations
RFR-1475
H. Mark Hanna, extension ag engineer Dana Schweitzer, program coordinator
Department of Agricultural and Biosystems Engineering
Introduction
Direct energy expenses (diesel, gasoline, propane, electricity) total more than $1 billion annually for Iowa’s farmers. Day-to-day farm management techniques such as adjusting tractor gear and throttle settings, making use of front-wheel-drive, and other strategies can reduce diesel fuel consumption for row crop production and general tractor operations. This study is being conducted over multiple years to measure the effects of energy management techniques on tractor fuel consumption during field operations.
Materials and Methods A small auxiliary 12-gallon fuel tank was mounted on a John Deere 6420 tractor. Plumbing was added for diesel fuel to be supplied and returned from the engine via either the main or auxiliary fuel tank, depending on the setting of a single flow control valve. A load cell under the auxiliary fuel tank measured the net (supply–return) weight of fuel consumed. Most of the field work at the farm was conducted using small plot areas for row crops and forage production. One objective was to measure fuel use in areas of 0.7 to 1 acre when possible; the auxiliary tank measures fuel consumption within 0.1 lb increments. Another objective was to obtain multiple replications of land area and timing of trials allowed. Small plots and weather frequently conflicted with these objectives, limiting the ability to measure statistical significance beyond overall trends in some trials.
Fuel consumption was measured as gallons/acre or gallons/mile for hauling. Although larger equipment consumes fuel at higher rates, field work also was completed at a faster rate (acres/hr). Gallons/acre generally remains consistent and is a common, useful measure for farmers.
Results and Discussion Effects of shifting up one transmission gear and throttling back the engine’s speed were compared during planting of both row and cover crops (Tables 1 and 2). In both cases, shifting to a higher gear and reducing engine speed reduced fuel use while maintaining the same travel speed for planting operations (fuel savings of 16 and 43%, respectively). By not using the available front-wheel drive on the tractor, fuel use increased by 7 percent during row-crop planting, by 5 percent when seeding a cover crop with a grain drill, and by 32 percent during summer mowing of grassy areas (Tables 1–3). Disengaging the front-wheel drive while hauling bales increased fuel consumption by 12 percent (Table 4), although discretion should be used if the hauling route is on a highway or paved surface that would limit wheel slip. Fuel consumption increased 20 percent towing a grain wagon at 20 miles/hr rather than 17 miles/hr (Table 5). Reducing engine speed is not generally recommended for PTO operations as lower speed increases torque requirements and stress on equipment. During summer 2014, however, hay mowing was conducted at a 15 percent reduction in engine speed. In this trial, the cutting and crimping quality and the width of the windrow produced were similar to the quality and width obtained at rated PTO speed. Fuel savings of 16 percent (Table 6) resulted in terms of fuel consumption/acre, although field speed also

Iowa State University, Western Research and Demonstration Farm ISRF14-10
11
was reduced with the tractor kept in the same transmission gear.
Conclusions Results indicate reduced diesel fuel consumption when using a ‘shift-up/throttle-back’ strategy with drawbar loads that are less than the available maximum tractor horsepower. Similarly, fuel savings were consistent when using available front-wheel-assist drive on the tractor. Loads operated by the power-take-off usually require operating the engine at rated PTO speed, however, effective rotary cutting speed was able to be maintained during the field conditions that
were present. When conditions allow, lower transport speeds reduced fuel consumption/mile. Results are only from the first year of study. Farm staff plan to continue additional fuel consumption comparisons next year.
Acknowledgements Research was supported by a grant from the Iowa Energy Center. The authors would like to thank Wayne Roush for mounting instrumentation on the tractor, recording fuel consumption during field trials, and identifying comparative treatments.
Table 1. Fuel consumption during row-crop planting. Treatment Replications Gal/acre Gear/engine rpm B4/2150 8 0.574 C2/1900 8 0.495 LSD α=0.05
a 0.027 MFDb disengaged 8 0.553 engaged 8 0.515 LSD α=0.05
a 0.027 aLeast significant difference between treatments at a 95 percent confidence level. bMechanical front-wheel drive engaged (yes) or disengaged (no). Table 2. Fuel consumption with a grain drill planting rye cover crop. Treatment Replications Gal/acre Gear/engine rpm B4/2150 6 0.556 C2/1900 6 0.390 LSD α=0.05
a 0.044 MFDb disengaged 6 0.485 engaged 6 0.461 LSD α=0.05
a NSc
aLeast significant difference between treatments at a 95 percent confidence level. bMechanical front-wheel drive engaged (yes) or disengaged (no). cNo significant difference at the 95 percent confidence level.

Iowa State University, Western Research and Demonstration Farm ISRF14-10
12
Table 6. Fuel consumption while mowing hay. Operation Replications Treatment Gal/acre Engine rpm Travel speed, mi/h Mowing hay 4 2160 5.3 0.726 4 1840 4.5 0.626 LSD α=0.05
a 0.016 aLeast significant difference between treatments at a 95 percent confidence level.
Table 3. Fuel consumption during rotary mowing. Operation No. of replications Treatment Gal/acre MFDa Rotary mowing, 4.3 mi/h 4 no 0.777 4 yes 0.591 LSD α=0.05
b 0.148 aMechanical front-wheel drive engaged (yes) or disengaged (no). bLeast significant difference between treatments at a 95 percent confidence level.
Table 4. Fuel consumption hauling two large round bales. Operation No. of replications Treatment Gal/mile MFDa Hauling bales, 5 mi/h 4 no 0.330 4 yes 0.293 LSD α=0.05
b 0.021 aMechanical front-wheel drive engaged (yes) or disengaged (no). bLeast significant difference between treatments at a 95 percent confidence level.
Table 5. Fuel consumption hauling 265-bushel wagon full of corn (and empty return). Operation No. of replications Treatment Gal/mile Travel speed, mi/h Hauling corn 4 17 0.171 4 20 0.205 LSD α=0.05
b 0.002 aLeast significant difference between treatments at a 95 percent confidence level.

Iowa State University, Western Research and Demonstration Farm ISRF14-10
13
ISU On-Farm Cooperator Trials: Relationships and Partnerships
RFR-A1472
Josh Sievers, Northwest Farm, superintendent
Lyle Rossiter, Allee Farm, superintendent Wayne Roush, Western Farm, superintendent Micah Smidt, Northern Farm, superintendent Matt Schnabel, Northern Farm, ag specialist Lance Miller, Southeast Farm, ag specialist Jim Rogers, Armstrong Farm, ag specialist
Zack Koopman, Ag Engineering/Agronomy Farm, ag specialist
Iowa State University (ISU) has a long-standing relationship with Iowa corn and soybean farmers. As a part of this relationship, ISU works to provide quality, unbiased information to assist the decision-making process on farm operations. In 2006, ISU began to expand this commitment with the
assistance of northwest Iowa farmers by conducting more trials in their fields. The ISU on-farm cooperator trial program has grown to cover other areas across Iowa. The program links the resources of the ISU research farms, the technical expertise of the ISU field agronomists, the support of the local research farm associations, and volunteer farmer-cooperators to create a system of on-farm trials for Iowa. In 2014, 55 farmer-cooperators in 24 counties assisted in conducting 115 on-farm trials. In addition, ISU has long-term partnerships that support agricultural research locations (research farms) across Iowa. The following groups have endorsed and supported the ISU on-farm trial program.
Committee for Agricultural Development, Ames, IA
North Central Iowa Research Association, Kanawha, IA Northeast Iowa Agricultural Experimental Association, Nashua, IA
Northwest Iowa Experimental Association, Sutherland, IA Southeast Iowa Agricultural Research Association, Crawfordsville, IA Wallace Foundation for Rural Research and Development, Lewis, IA
Western Iowa Experimental Farm Association, Castana, IA

Iowa State University, Western Research and Demonstration Farm ISRF14-10
14
Sponsors for 2014 On-Farm Cooperator Trials The ISU On-Farm Cooperator Trials program was made possible in part by support and donations of products or funding from these sponsors/donors. We recognize the following entities for their support of the ISU On-Farm Cooperator Trials program. Sponsor Location AGRILAND FS, Inc. Wyman, IA American State Bank (Troy Broers) Sioux Center, IA BASF (Karl Leikvold) Wakonda, SD BASF (Marcus Juhl) Emmetsburg, IA BASF (Mark Storr) Nevada, IA BASF (Max McCoy) Norwalk, IA Bayer (Terry Holm) Brandon, SD Berne Cooperative (Jerry Theis) Ute, IA Calcium Products, Inc. (Andrew Hoiberg) Ames, IA ChemGro, Inc. Mt. Pleasant, IA DuPont (Ron Geis) Newcastle, NE Farm Bureau (Mark Bohner) Sioux County, IA Farm Credit Services (Dave Popkes) Sheldon, IA Goshorn Seed & Ag Supply (Chris Theilan) Harlan, IA Hull Coop (Evan Wielenga) Hull, IA Iowa Soybean Association Ankeny, IA Lindeman Tractor Atlantic, IA Marc Clemon Soldier, IA Mycogen Seeds (Michael Huston) Wellman, IA Nutra-Flo Company (Kelli Barnett) Sioux City, SD Pioneer Hi Bred (Darren Hora) Sioux City, IA Pioneer Hi Bred (Ralph Sandeen) Mt. Pleasant, IA Renze Seeds (Dennis Boyle) Templeton, IA Steve Jorgensen Atlantic, IA Wieringa Seeds (Harry Wieringa) Sioux Center, IA Winfield Agri Solutions (Steve Barnhart) Sioux City, IA Wyffels Seeds (Bill Backhaus) Griswold, IA Wyffels Seeds (Brian Stueve) Ute, IA

Iowa State University, Western Research and Demonstration Farm ISRF14-10
15
2014 On-Farm Trial Cooperators
The following farmer cooperators conducted on-farm trials in their fields during 2014.
Steve Agar Sibley, IA Wade Amos Griswold, IA Galen Becker Cumberland, IA Dennis Boyle Castana, IA Thad Bridges Elliottt, IA Joel Bubke Ute, IA
Wes DeGroot Doon, IA Dordt College Sioux Center, IA Darrell Egli Crawfordsville, IA David Erwin Crawfordsville, IA Randy Euken Lewis, IA
Craig Fleshman Dallas Center, IA Eric Graber Crawfordsville, IA Joel Greene Crawfordsville, IA
Jerry Hammen Fonda, IA Brad Hanson Castana, IA
Craig Heineman Ogden, IA Andy Hill Manly, IA
Richard Hoffman Cumberland, IA Jim Hultgren Aurelia, IA Mike Hustoft Sibley, IA Mark Huston Wellman, IA J & P Farms Griswold, IA Dave Kalsem Huxley, IA
Marty Knobloch Lester, IA Brian Kuntz Wapello, IA Keith Kuntz Wapello, IA Bob Ladd Rock Rapids, IA
Mapleton FFA Mapleton, IA Morris Metzger Lester, IA
Dean Meyer Rock Rapids, IA Rodney Mogler Lester, IA
Russ Mogler Lester, IA Mike Muhlbauer Lewis, IA James Namanny Anita, IA
NIACC Mason City, IA Ryan Odens Rock Rapids, IA Rod Pierce Ogden, IA Jim Rains Pisgah, IA
Riceville Vo-Ag Saratoga, IA Harry Riesberg Castana, IA Rich Rosener Vail, IA
Dave Rossman Hartley, IA Lester Schnabel Sheffield, IA Brian Sievers Newell, IA Ray Sigwalt Wall Lake, IA Brian Stueve Castana, IA
Gary Trei Sibley, IA Layne Twinam Crawfordsville, IA Wally Unkrich Winfield, IA
Pete Van Regenmorter
Inwood, IA
Larry Warner Larchwood, IA Mark Warner Larchwood, IA Gene Wassom Sac City, IA Duane Winston Atlantic, IA

Iowa State University, Western Research and Demonstration Farm ISRF14-10
16
On-Farm Corn Population Trials
RFR-A1435
Jim Fawcett, extension field agronomist (retired)
Lyle Rossiter, Allee Farm, superintendent Wayne Roush, Western Farm, superintendent Micah Smidt, Northern Farm, superintendent Matt Schnabel, Northern Farm, ag specialist
Introduction
Farmers continue to increase corn planting populations in hopes of increasing yields. Planting too high of a population can result in increased barrenness and thus lower yields, but too low of a population also can result in lower yields. As seed prices continue to rise, it is important for farmers to find a population that maximizes both yield and profit.
Materials and Methods In 2014, 12 trials (Table 1) examined the effect of various planting populations on corn grain yield. All trials were conducted on-farm by farmer cooperators using the farmers’ equipment. Strips were arranged in a randomized complete block design with at least three replications per treatment. Strip size varied from field to field depending on equipment size and the size of the field. Plant stand counts and ear counts were made in the fall. All strips were machine harvested for grain yield. In Trial 1, two corn varieties were planted in 22-in. rows at 45,000 and 50,000 seeds/acre (Table 2). In Trials 2 and 3, corn was planted at approximately 30,000 and 35,000 seeds/acre. In Trial 4, two corn varieties were planted at three populations from 30,000 to 40,000 seeds/acre. In Trials 5 through 7, corn was planted at five populations from 25,000 to 45,000 seeds/acre. In Trials 8 through 12, corn
was planted at five populations from 30,000 to 40,000 seeds/acre.
Results and Discussion
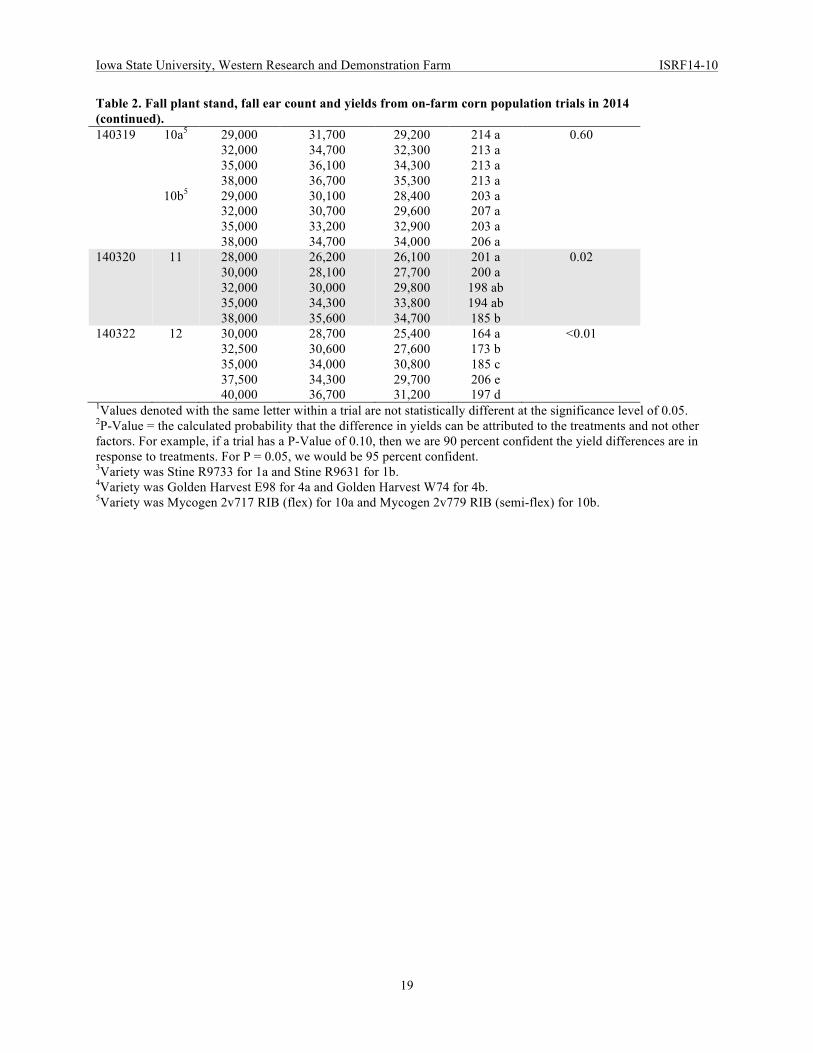
In Trials 1 and 4, there was no difference in yield between the two planting populations within each hybrid, but some yield differences occurred between hybrids (Table 2). In Trials 2 and 10, there were no differences in yield due to plant population. In Trial 3, there was a nearly significant yield increase of 5 bushels/acre with the planting population of 37,000 vs. 31,600 seeds/acre (P = 0.09). In Trial 12, the lowest planting population of 30,000 seeds/acre had the lowest yield, and the highest yield occurred with the second highest planting population of 37,500 seeds/acre. In Trials 5, 6, 7, 8, 9, and 11, the lowest planting population had the highest yield or a yield that was not significantly different from higher populations. This occurred with planting rates as low as 25,000 seeds/acre. Ear counts in the fall indicated there was not much difference in barrenness among the different populations in most trials, although there were slightly more barren plants with the higher populations in Trials 9 and 12 (Table 2). Most past research has shown the optimal planting rate for corn yield falls in a range from about 35,000 to 37,000 seeds/acre. It is not clear why half of the trials conducted in 2014 showed that planting rates lower than this range did not result in any yield loss, although the unusually wet spring and cool summer may have caused results not typical of past years. However, in all but one trial (Trial 5), planting populations of 35,000 seeds/acre or more resulted in a yield that was among the highest.

Iowa State University, Western Research and Demonstration Farm ISRF14-10
17
Table 1. Hybrid, row spacing, planting date, previous crop, and tillage practices from on-farm corn population trials in 2014.
Exp. no. Trial County Variety
Row spacing
(in.) Planting
date Previous
crop Tillage
140201 1 Sac Stine R9733 &
Stine R9631 22 4/25/12 Soybean
Fall chisel, spring disc & field cultivate
140202 2 Buena Vista Dekalb 50-67 36 5/17/14 Soybean Spring field
cultivate
140206 3 Buena Vista Pioneer
PO193RIB 30 5/8/14 Soybean Field cultivate
140212 4 Pocahontas Golden Harvest E98 and W74 30 5/1/14 Soybean
Spring field cultivate
140501 5 Story Pioneer 115IR 30 5/9/14 Corn Conventional 140502 6 Boone Pioneer 636AM 30 5/7/14 Corn Conventional
140503 7 Dallas Pioneer
P1360HR 30 5/7/14 Corn Conventional
140312 8 Monona LG 2602VT3
PRIB 30 5/15/14 Corn
Fall disc, Spring field
cultivate
140316 9 Monona Wyffels
W6878RIB LP 30 5/5/14 Soybean No-till
140319 10 Harrison
Mycogen 2v717 RIB and
2v779 RIB 30 5/4/14 Soybean No-till
140320 11 Crawford Renze 6334 30 5/6/14 Corn
Fall disc, Spring field
cultivate 140322 12 Monona Renze 3385RA 30 5/4/14 Soybean No-till

Iowa State University, Western Research and Demonstration Farm ISRF14-10
18
Table 2. Fall plant stand, fall ear count and yields from on-farm corn population trials in 2014.
Exp. no. Trial Treatments
(seeds/A)
Fall plant stand
(plants/A)
Fall ear count
(ears/A) Yield
(bu/A)1 P-value (yield)2
140201
1a3
1b3
45,000 50,000 40,000 45,000
39,000 44,200 32,100 40,000
38,300 43,800 31,700 39,800
174 ab 173 b 188 a
183 ab
0.03
140202
2
30,000 35,000
29,300 34,100
28,700 33,300
148 a 148 a
0.93
140206
3
31,600 37,000
29,700 34,000
29,500 33,700
221 a 226 a
0.09
140212
4a4
4b4
30,000 35,000 40,000 30,000 35,000 40,000
29,800 32,900 37,800 28,100 32,900 35,800
29,300 32,300 36,900 27,800 32,600 35,400
220 a 221 a
211 ab 195 b 196 b 195 b
<0.01
140501
5
25,000 30,000 35,000 40,000 45,000
23,400 28,400 33,600 38,200 43,200
23,200 27,900 32,600 36,900 41,100
163 ab 172 a
158 bc 163 ab 151 c
<0.01
140502
6
25,000 30,000 35,000 40,000 45,000
27,800 31,500 34,500 38,800 42,300
27,300 31,000 33,800 37,800 41,000
185 a 182 a
178 ab 169 b 154 c
<0.01
140503
7
25,000 30,000 35,000 40,000 45,000
24,500 28,400 33,500 38,600 43,100
24,300 28,200 33,600 37,900 43,600
196 ab 198 a 199 a
196 ab 193 b
0.01
140312
8
30,000 32,500 35,000 37,500 40,000
28,200 29,800 33,500 35,500 37,500
27,800 29,200 32,500 33,900 35,100
200 a 195 ab 182 ab 175 b 174 b
0.01
140316
9
30,000 32,500 35,000 37,500 40,000
30,600 31,300 34,600 38,400 40,000
29,700 30,300 31,800 34,600 36,200
194 a 191 ab 189 ab 189 ab 185 b
0.01
1Values denoted with the same letter within a trial are not statistically different at the significance level of 0.05. 2P-Value = the calculated probability that the difference in yields can be attributed to the treatments and not other factors. For example, if a trial has a P-Value of 0.10, then we are 90 percent confident the yield differences are in response to treatments. For P = 0.05, we would be 95 percent confident. 3Variety was Stine R9733 for 1a and Stine R9631 for 1b. 4Variety was Golden Harvest E98 for 4a and Golden Harvest W74 for 4b. 5Variety was Mycogen 2v717 RIB (flex) for 10a and Mycogen 2v779 RIB (semi-flex) for 10b.
Iowa State University, Western Research and Demonstration Farm ISRF14-10
19
Table 2. Fall plant stand, fall ear count and yields from on-farm corn population trials in 2014 (continued). 140319
10a5
10b5
29,000 32,000 35,000 38,000 29,000 32,000 35,000 38,000
31,700 34,700 36,100 36,700 30,100 30,700 33,200 34,700
29,200 32,300 34,300 35,300 28,400 29,600 32,900 34,000
214 a 213 a 213 a 213 a 203 a 207 a 203 a 206 a
0.60
140320
11
28,000 30,000 32,000 35,000 38,000
26,200 28,100 30,000 34,300 35,600
26,100 27,700 29,800 33,800 34,700
201 a 200 a
198 ab 194 ab 185 b
0.02
140322
12
30,000 32,500 35,000 37,500 40,000
28,700 30,600 34,000 34,300 36,700
25,400 27,600 30,800 29,700 31,200
164 a 173 b 185 c 206 e 197 d
<0.01
1Values denoted with the same letter within a trial are not statistically different at the significance level of 0.05. 2P-Value = the calculated probability that the difference in yields can be attributed to the treatments and not other factors. For example, if a trial has a P-Value of 0.10, then we are 90 percent confident the yield differences are in response to treatments. For P = 0.05, we would be 95 percent confident. 3Variety was Stine R9733 for 1a and Stine R9631 for 1b. 4Variety was Golden Harvest E98 for 4a and Golden Harvest W74 for 4b. 5Variety was Mycogen 2v717 RIB (flex) for 10a and Mycogen 2v779 RIB (semi-flex) for 10b.

Iowa State University, Western Research and Demonstration Farm ISRF14-10
20
On-Farm Corn Rootworm Trials
RFR-A1411
Jim Fawcett, extension field agronomist (retired)
Zack Koopman, Ag Engineering/Agronomy Farm, ag specialist
Wayne Roush, Western Farm, superintendent Josh Sievers, Northwest Farm, superintendent
Introduction
There are several methods to manage corn rootworms, including crop rotation, rootworm insecticides, and corn rootworm (CRW) transgenic traits. The use of CRW transgenic traits in corn hybrids has allowed farmers to manage CRW without using soil-applied insecticides. However, rootworm populations resistant to the transgenic traits have been confirmed in Iowa, leading some farmers to see if there is an economic return by adding an insecticide when planting CRW-Bt corn. There also are several transgenic traits now available for corn rootworm control on the market. On-farm trials allow farmers to see how these traits perform on their farms in side-by-side evaluations.
Materials and Methods Five CRW trials were conducted in Sioux, Monona, and Story counties in 2014 (Table 1). In Trial 1, several SmartStax® and Duracade®
hybrids were compared with a conventional hybrid (Table 2). In Trial 2, two SmartStax® and two Agrisure® hybrids were compared with a conventional hybrid with and without Force® 3G insecticide. In Trials 3 and 4, conventional hybrids were planted with and without Force® 3G insecticide. In Trial 5, a SmartStax® hybrid was compared with a Duracade® hybrid. All trials were conducted on corn ground in strips arranged in a randomized complete block design with at least three replications per treatment. Strip
size varied from field to field depending on equipment size and the size of the field. In Trials 1, 2, and 5, three to five plants/strip were dug in August and the roots assessed for CRW larval injury on the 0–3 node injury scale, where 0 is no damage and 3 is three nodes of roots eaten. Strips were evaluated for plant lodging in September in Trials 1 and 5 and strips were machine harvested for grain yield in Trials 2–5.
Results and Discussion Root injury ratings in Trials 1, 2, and 5 indicated the corn rootworm pressure was relatively low, probably because the wet late spring and early summer resulted in the drowning of rootworm larva. In Trial 1, there was significantly more root feeding on the conventional hybrid than on several of the SmartStax® hybrids (Table 2), although the injury rating on the conventional hybrid (0.13) probably was not economical. A root injury rating of 0.25 is usually considered the economic threshold. There was significantly more plant lodging in one of the Duracade® hybrids than several of the SmartStax® hybrids or the conventional hybrid. Because of the low root injury ratings, differences in plant lodging may have been due to factors other than rootworm feeding. Although yields were not taken in this trial, it is likely any yield differences would have been due primarily to genetics and not differences in rootworm damage. In Trial 2, there was no difference in root feeding with or without the insecticide with either the Agrisure® or SmartStax® hybrids, indicating that both transgenic traits are still providing adequate protection against rootworms in this field. The root injury rating for the conventional hybrid without the insecticide (0.41) was significantly greater

Iowa State University, Western Research and Demonstration Farm ISRF14-10
21
than with the two transgenic hybrids, although the two transgenic hybrids did not yield significantly more than the conventional hybrid without the insecticide. Although the root feeding was significantly less on the conventional hybrid with the insecticide than without, this did not result in a significant yield increase. There was a significant yield increase with the use of a rootworm insecticide on a conventional hybrid in Trial 3 (P < 0.01) but not in Trial 4, indicating there likely was more corn rootworm pressure in Trial 3 than Trial 4.
In Trial 5, there was very little root feeding on either corn hybrid, but there was significantly more plant lodging with the Duracade® hybrid and this hybrid also yielded significantly less than the SmartStax® hybrid. Because there was little evidence of rootworm feeding in this trial, the yield difference was likely due to factors other than corn rootworms, although it may have been partly due to the difference in lodging. These trials show that in years with low corn rootworm pressure, such as 2014, the extra expense of corn hybrids with transgenic traits and/or the use of corn rootworm insecticides are less likely to be economical.
Table 1. Hybrid, row spacing, planting date, population, previous crop, and tillage in on-farm corn rootworm trials in 2014.
Exp. no. Trial County
Hybrid
Row spacing
(in.) Planting
date
Planting popu-lation
(seed/A) Previous
crop Tillage 140318
1
Monona
5 smartstax, 2 duracade, and 1
conventional 38 (twin
row)
4/22/14
31,000
Corn
Fall heavy disk, spring
field cultivate 140122
2
Sioux
NK 53W3, NK 53W3122, and DeKalb 5438
30
5/6/14
34,300
Corn
Conventional
140506
3
Story
Golden Harvest G11U58
36
5/19/14
29,900
Corn
Conventional
140512
4
Story
Golden Harvest G11U58
36
5/19/14
29,900
Corn
Conventional
140317
5
Monona
Wyffels W7888 RIB & Golden Harvest G14H66-5122A
38 (twin row)
4/23/14
31,000
Corn
Fall disc, spring disc
harrow

Iowa State University, Western Research and Demonstration Farm ISRF14-10
22
Table 2. Treatments, root injury ratings, percent lodging, and yields of on-farm corn rootworm trials in 2014.
Exp. no. Trial Treatments
Rootworm insecticide
(Y/N)1
Root injury rating2
Percent lodging2
Yield (bu/A)2
P-Value (yield)3
140318
1
SmartStax (Renze 3232) SmartStax (Renze 3244) SmartStax (Renze 3264) SmartStax (Renze 3222) SmartStax (Renze 3332)
Duracade (Golden Harvest G09M49)
Duracade (Golden Harvest G14H66-
5122A) Conventional (Renze 2224)
N N N N N
N
N N
0.01 a 0.01 a 0.01 a 0.01 a
0.04 ab
0.07 ab
0.04 ab 0.13 b
0.3 a 0.7 a 0.3 a
6.3 ab 2.3 ab
4.0 ab
11.0 b 0.7 a
140122
2
SmartStax (DeKalb 5438 ) SmartStax (DeKalb 5438 ) Agrisure (NK 53W3122) Agrisure (NK 53W3122) Conventional (NK 53W3) Conventional (NK 53W3)
Y N Y N Y N
0.03 a 0.03 a 0.04 a 0.06 a 0.08 a 0.41 b
203 a 201 a
186 bc 183 c
197 ab 193 abc
<0.01
140506
3
Conventional (Golden Harvest G11U58)
Conventional (Golden Harvest G11U58)
Y
N
155 a
149 b
<0.01
140512
4
Conventional (Golden Harvest G11U58)
Conventional (Golden Harvest G11U58)
Y
N
199 a
195 a
0.49
140317
5
SmartStax (Wyffles W7888 RIB)
Duracade (Golden Harvest G14H66-
5122A)
N
N
0.01 a
0.03 b
0.5 a
12.3 b 236 a
202 b
<0.01
1Insecticide was Force 3G at 5 oz/1,000 ft of row in-furrow in Trials 2, 3, and 4. 2Values denoted with the same letter are not statistically different at the significance level 0.05. 3P-Value = the calculated probability that the difference in yields can be attributed to the treatments and not other factors. For example, if a trial has a P-Value of 0.10, then we are 90 percent confident the yield differences are in response to treatments. For P = 0.05, we would be 95 percent confident.

Iowa State University, Western Research and Demonstration Farm ISRF14-10
23
On-Farm Sulfur Fertilization of Corn and Soybean Trials
RFR-A1446
Jim Fawcett, extension field agronomist (retired)
John Sawyer, professor Department of Agronomy
Lance Miller, Southeast Farm, ag specialist Jim Rogers, Armstrong Farm, ag specialist
Wayne Roush, Western Farm, superintendent
Introduction In the past several years, sulfur (S) deficiency has been showing up more frequently in Iowa fields. This has been especially true in corn and alfalfa fields of northeast Iowa. This is thought to be partially due to Iowa receiving less S in the rainfall due to more stringent air pollution regulations, less S fertilizer applications, and less widespread use of manure. Sulfur fertilizer applications can offer yield increases when S deficiencies are present. The objective of these trials was to evaluate potential for S deficiency and grain yield response in corn and soybean to S applications.
Materials and Methods The response of soybean and corn to S application was investigated in five soybean fields and three cornfields in 2014 (Tables 1 and 2). Sulfur was applied to one cornfield with no manure history to test the response of corn to S in 2012, and the residual effect in the same field with soybean in 2013 and corn in 2014. Sulfur was applied to two cornfields and five soybean fields in 2014 to test the response of corn and soybean to S in the year of application. There was no recent manure history in Trial 1 in soybean and no manure history in the other trials in 2014. Corn was at the V6 growth stage at the time of application in 2014. In four trials, soybeans were at the
V6-V7 growth stage at the time of application in 2014, and in the other soybean trial (Trial 1) the S was applied prior to planting. Calcium sulfate (gypsum) was the source of S in all trials. The rate of applied S ranged from 16 to 34 lb S/acre and was dribble applied to the soil surface in all trials. Strips receiving the S application were compared with untreated strips. All trials were in southwest Iowa except Trial 1 in soybean, which was in southeast Iowa and Trial 3 in corn, which was in west central Iowa. All trials were conducted on-farm by farmer cooperators using the farmers’ equipment. Strips were arranged in a randomized complete block design with at least three replications per treatment. Strip size varied from field to field depending on equipment size and size of field. All strips were machine harvested for grain yield.
Results and Discussion
There was no effect of S application on soybean yield in any of the trials (Table 3). There was a significant yield increase of 23 bushels/acre of corn in Trial 2 with the application of 17 lb S/acre when corn was at the V6 stage (P = 0.07), but no effect of S application on corn yield in Trial 1 (Table 4). Trial 3 investigated the effect of residual S on corn yields, however, no yield increase was measured in 2014 (three years after the S application). There was a significant yield increase of 32 bushels/acre of corn in that field in the year of application (P < 0.01), and also a yield increase in soybeans of 4 bushels/acre in the year after application (P = 0.01). These results indicate there are corn and soybean fields in Iowa that could benefit from S application.

Iowa State University, Western Research and Demonstration Farm ISRF14-10
24
Table 1. Variety, row spacing, planting date, planting population, previous crop, and tillage practices in the on–farm sulfur fertilization trials on soybeans in 2014.
Exp. no. Trial County Variety
Row spacing
(in.) Planting
date
Planting population (seeds/A)
Previous crop Tillage
140707 1 Washington Asgrow
2931 7.5 5/17/14 180,000 Corn No-till
140632 2 Cass
Epply ESB254
NRR 30 6/7/14 160,000 Corn Disked
140638 3 Cass Pioneer P2Y83 30 5/17/14 155,000 Corn No-till
140639 4 Pottawattamie Stine 27L32 30 5/20/14 155,000 Corn
Field cultivate
140640 5 Cass
Epply ESB281
NRR 30 5/31/14 170,000 Corn No-till Table 2. Hybrid, row spacing, planting date, planting population, previous crop, and tillage practices in the on-farm sulfur fertilization trials on corn in 2014.
Exp. no. Trial County Hybrid
Row spacing
(in.) Planting
date
Planting population (seeds/A)
Previous crop Tillage
140618 1 Pottawattamie Wyffels
5786 30 6/15/14 34,000 Soybean Field
cultivate
140621 2 Cass Pioneer
P1215AM1 30 5/4/12 34,325 Soybean No-till
140321 3 Crawford Pioneer PO987 30 5/7/14 29,900 Soybean No-till
Table 3. Yield response from the on-farm sulfur fertilization trials on soybeans in 2014.
Yield (bushels/A)
Exp. no. Trial
Sulfur rate
(lb/A) Application
timing Sulfur Control Response P-valuex
140707 1 17 Pre-plant (4/11/14) 61 57 4 0.19 140632 2 17 V6-V7 (7/17/14) 63 61 2 0.18 140638 3 17 V6-V7 (6/20/14) 65 66 -1 0.38 140639 4 34 V6-V7 (6/15/14) 71 71 0 0.87 140640 5 17 V6-V7 (7/7/14) 67 71 -4 0.31 xP-Value = the calculated probability that the difference in yields can be attributed to the treatments and not other factors. For example, if a trial has a P-Value of 0.10, then we are 90 percent confident the yield differences are in response to treatments. For P = 0.05, we would be 95 percent confident. Table 4. Yield response from the on-farm sulfur fertilization trials on corn in 2014.
Yield (bushels/A)
Exp. no. Trial
Sulfur Rate
(lb/acre) Application
timing Sulfur Control Response P-valuex
140618 1 17 V6 (7/10/14) 178 176 2 0.63 140621 2 17 V6 (5/28/14) 212 189 23 0.07 140321 3 16 2012 185 186 -1 0.88 xP-Value = the calculated probability that the difference in yields can be attributed to the treatments and not other factors. For example, if a trial has a P-Value of 0.10, then we are 90 percent confident the yield differences are in response to treatments. For P = 0.05, we would be 95 percent confident.

Iowa State University, Western Research and Demonstration Farm ISRF14-10
25
On-Farm Corn Fertilizer Trials
RFR-A1447
Jim Fawcett, extension field agronomist (retired)
Jim Rogers, Armstrong Farm, ag specialist Lyle Rossiter, Allee Farm, superintendent
Wayne Roush, Western Farm, superintendent Josh Sievers, Northwest Farm, superintendent
Introduction
All cropping systems require fertilizer inputs in order to maintain crop yields. However, excess fertilizer, especially nitrogen and phosphorus, can increase problems with water quality. Starter fertilizer applied with the corn planter has been shown to sometimes increase corn yields. It is important for farmers to use the appropriate rates and methods of fertilizer application to optimize corn yields and minimize the impact on the environment.
Materials and Methods In 2014, seven trials utilizing various methods of fertilizing corn were investigated (Table 1). All trials were conducted on-farm by farmer cooperators using the farmers’ equipment. Strips were arranged in a randomized complete block design with at least three replications per treatment. Strip length and width varied from field to field depending on equipment size and size of field. All strips were machine harvested for grain yield. Trials 1 and 7 investigated the use of 9-18-9 pop-up starter fertilizer on corn yield. In Trial 1, the fertilizer was applied with and without zinc. In Trial 7, the fertilizer was applied with and without Generate. Generate is marketed by AgNition and promoted as a product that generates beneficial microbial activity in the soil and liberates micro and macro nutrients. In both trials, the fertilizer-treated strips were compared with corn planted without starter
fertilizer. The soil in Trial 1 tested optimum to high in phosphorus and potassium. In Trial 2, corn planted with a micronutrient seed treatment was compared with corn planted without the treatment. The treatment was 8 oz/100 lb of seed of Nutriplant SD® marketed by Amway. It contained magnesium, sulfur, copper, iron, manganese, molybdenum, zinc, and calcium. In Trials 3–6, various rates and application times of nitrogen (N) fertilizer were investigated. Trial 3 investigated a fall application of 220 lb/acre N (as anhydrous ammonia) with and without an additional 50 lb/acre side-dressed (as 32% UAN) on corn at the V10 stage on July 7. Trial 4 compared a split application of N (100 lb/acre at planting followed by 50 lb/acre side-dressed on corn at the V10 stage on July 8) with 150 lb/acre N all at planting. In Trial 5, 4,000 gallons of liquid swine manure fall-applied (containing 192 lb/acre N) was compared with and without an additional 40 lb/acre N (side-dressed as urea on corn at the V8 stage). In Trial 6, a foliar application by air of liquid fertilizer containing 21 lb/acre N and 3 lb/acre P2O5 (2 gallons/acre of product) was applied on corn at the V14 stage and compared with strips without the foliar application (which had a total of 180 lb/acre N applied).
Results and Discussion None of the starter fertilizer treatments in Trials 1 and 7 had any effect on corn yield (Table 2). There was a significant corn yield decrease of 7 bushels/acre with the application of the micronutrient seed treatment in Trial 2. It is not known why the seed treatment would have resulted in a loss of yield. There was not an increase in corn yield with the additional application of 50 lb/acre N side-dressed following the 220 lb/acre of fall applied N in

Iowa State University, Western Research and Demonstration Farm ISRF14-10
26
Trial 3, indicating the 220 lb/acre was adequate or more than adequate for optimum yields in this field in 2014 (Table 2). There was a significant yield decrease of 5 bushels/acre (P = 0.02) with the side-dress application of an additional 40 lb/acre N following a fall application of liquid swine manure in Trial 5 (Table 2). The yield decrease is unusual, but it does indicate the 4,000 gallons of swine manure supplied all of the nitrogen needs of the corn crop. In Trial 4, there was no advantage to splitting the nitrogen between pre-plant and side-dress,
because the two treatments had the same yield. There was a yield increase of 12 bushels/acre with the foliar application of 21 lb/acre N in Trial 6. This field was on corn following corn, so it would not be unusual to get a yield benefit to rates of N greater than the 180 lb/acre applied prior to the foliar application. Weather conditions are important in determining how corn responds to nitrogen rates and application timings, so different results might be seen in other years.

Iowa State University, Western Research and Demonstration Farm ISRF14-10
27
Table 1. Hybrid, row spacing, planting date, planting population, previous crop, and tillage practices from on-farm corn fertilizer trials in 2014.
Exp. no. Trial County Hybrid
Row spacing
(in.) Planting
date
Planting population (seeds/A)
Previous crop
Tillage practices
140119 1 Lyon DeKalb 5378 30 4/21/14 31,500 Soybean Conventional
140616 2 Cass Pioneer P993HR 30 5/7/14 34,000 Soybean No till
140154 3 Plymouth Pioneer 987 30 4/23/14 35,000 Corn
Conventional
140125 4 Sioux Pioneer
448AMX 30 5/5/14 34,300 Soybean
Conventional
140103 5 Lyon Pioneer 297 20 4/25/14 34,600 Corn
Conventional
140304 6 Crawford Renze 6224 30 5/5/14 29,900 Corn Spring field
cultivate
140208 7 Sac
Golden Harvest 9E98-
3000GT 30 5/7/14 30,000 Soybean
No till Table 2. Yields from on-farm corn fertilizer trials in 2014.
Exp. no. Trial Treatment
Yield (bu/A)x P-valuey
140119
1
Control 1 Gal/A of 9-18-9 starter
1 Gal/A of 9-18-9 + 1 qt/A zinc (9%) starter
203 a 206 a 206 a
0.72
140616
2
Control 8 oz/100 # of micros with the seed
204 a 197 b
0.02
140154
3
220 lb/A N fall applied 220 lb/A N in Fall + 50 lb/A N side-dressed on V10 corn
185 a 190 a
0.25
140125
4
150 lb/A N spring preplant 100 lb/A N Spring preplant + 50 lb/A N side-dressed on V10 corn
198 a 197 a
0.75
140103
5
4000 Gal/A fall applied swine manure (192 lb/A N) 4000 Gal/A fall applied swine manure followed by
40 lb/A N sidedressed on V8 corn
193 a
188 b
0.02
140304
6
Control (180 lb/A N starter+at planting+side-dress) 21+3+0 foliar applied by air on V14 corn on 7/13/14
158 a 170 b
0.01
140208
7
Control 5 Gal/A 9-18-9 starter
5 Gal/A 9-18-9 starter + 1 qt/A Generate
219 a 227 a 216 a
0.85
xValues denoted with the same letter within a trial are not statistically different at the significance level of 0.05. yP-Value = the calculated probability that the difference in yields can be attributed to the treatments and not other factors. For example, if a trial has a P-Value of 0.10, then we are 90 percent confident the yield differences are in response to treatments. For P = 0.05, we would be 95 percent confident.

Iowa State University, Western Research and Demonstration Farm ISRF14-10
28
On-Farm Corn and Soybean Management Trials
RFR-A1450
Jim Fawcett, extension field agronomist (retired)
Josh Sievers, Northwest Farm, superintendent Wayne Roush, Western Farm, superintendent
Introduction
Farmers are faced with many decisions in managing corn and soybeans as new technologies are introduced, such as drought-tolerant corn hybrids, air reels for combines, and land-rolling equipment. Land rolling is the practice of pulling a large, heavy roller across soybean fields in order to push down rocks, smooth the surface of the field, and help break up residue. The purpose is to protect harvest equipment that could be vulnerable to rocks and corn roots. Yields are expected to improve by creating a more uniform harvest. Fungicide application to corn at the VT stage or after has become a popular practice. One concern with this practice is applications with ground equipment may cause mechanical injury to the corn. Planting and harvesting at the proper times also are important management decisions farmers must make in obtaining optimum corn and soybean yields.
Materials and Methods In 2014, six trials investigating various management practices in corn and soybeans were conducted (Table 1). All trials were conducted on-farm by farmer cooperators using the farmers’ equipment. Strips were arranged in a randomized complete block design with at least three replications per treatment. Strip width and length varied from field to field depending on equipment size and size of field. All strips were machine harvested for grain yield.
In Trial 1, a drought tolerant corn hybrid was compared with a conventional hybrid. In Trial 2, potential yield loss from mechanical damage to the corn by a sprayer was studied. A sprayer was driven through the field at 5.5 mph (without applying a pesticide) when the corn was at the VT stage. Corn yield from strips that did not have the sprayer pass over them were compared with strips under the spray boom and strips under both the machine axle and the spray boom. The corn was 119 in. tall to the top of the tassel at the time of the sprayer pass. The corn was 17 in. taller than the boom height and 47 in. taller than the axle. In Trial 3, yield of soybeans harvested using a Crary air reel were compared with soybeans harvested with the air reel turned off. In Trial 4, yields of corn harvested at three different harvest moistures (approximately 15, 20, and 25%) were compared. In Trial 5, soybean yields from strips that were land-rolled immediately after planting were compared with soybean yields from strips not land-rolled. In Trial 6, yields were compared with soybeans planted on April 21 to soybeans planted on May 15.
Results and Discussion
There was no yield difference between the drought-tolerant hybrid and the non-drought tolerant hybrid in Trial 1 (Table 2). There were no drought conditions in this field in 2014. In Trial 2, there was no yield difference between the control and the corn that had the spray boom pass over it, but there was a yield loss of 34 bushels/acre in the strips that had both the machine axle and boom pass over them. A typical sprayer with a boom width of 90-120 ft would have about 10 percent of the rows passing under the machine axle. A 34-bushel/acre yield loss in these rows could mean a yield loss of about 3-4 bushels/acre in the field. This may be something for farmers

Iowa State University, Western Research and Demonstration Farm ISRF14-10
29
to consider in making fungicide application decisions. Also, it should be noted the corn was almost 10 ft tall. There was no difference in soybean yield between the soybeans harvested with or without the air reel in Trial 3. Even though there was no yield difference, there may be other advantages to using the air reel, such as faster harvest and harvesting under adverse conditions. There was no corn yield difference among the three harvest timings in Trial 4. There was no difference in
soybean yield between soybeans on ground that was land-rolled vs. soybeans on non-rolled ground in Trial 5. In Trial 6, the soybeans planted on April 21 yielded eight bushels/acre more than the soybeans planted on May 15. This agrees with most other research on soybean planting dates that have shown soybeans planted in late April or early May usually yield better than soybeans planted in mid-May or later.
Table 1. Variety, planting date, planting population, previous crop, and tillage practices in on-farm trials investigating various management practices in corn and soybean in 2014.
Exp. no. Trial
Mgmt
practice County Variety
Row
spacing Planting
date
Planting population (seeds/A)
Pre-vious crop Tillage
140307 1
GMO
drought tolerance in corn Monona
Pioneer P1151A
M and
Pioneer P1023A
M
30 5/4/14 32,300 Soybean No-till
140324 2
Corn injury from
sprayer at VT Monona
LG5541STX RIB
30 5/5/14 32,300 Soybean No-till
140144 3
Harvest with Crary air reel in soybean Lyon
Pioneer 22T69
15 5/20/14 140,000 Corn No-till
140129 4
Harvest timing in
corn Sioux Pioneer PO193
30 4/26/14
34,300 Soybean Conven-tional
140131 5
Land rolling in soybean Sioux
Pioneer 22T41
30 5/15/14
150,000 Corn No-till
140132 6
Planting date in
soybean Sioux Pioneer 22T41
30
4/21/14 and
5/15/14
150,000 Corn No-till

Iowa State University, Western Research and Demonstration Farm ISRF14-10
30
Table 2. Yields for on-farm trials investigating various management practices in corn and soybean in 2014.
Exp. no. Trial Treatment
Yield (bu/A)x P-valuey
140307
1
Pioneer P1023AM (not drought tolerant) Pioneer P1151AM (drought tolerant)
210 a 208 a
0.36
140324
2
Control (no injury) Under boom (boom passed over rows - corn 17 in.
taller than boom) Under machine (boom and axle passed over rows
– corn 47 in. taller than axle)
197 a
205 a
163 b
<0.01
140144
3
Crary air reel Control (air reel turned off)
39 a 39 a
0.63
140129
4
15% harvest moisture (actual moisture 12%) 20% harvest moisture (actual moisture 16%) 25% harvest moisture (actual moisture 21%)
226 a 222 a 226 a
0.54
140131
5
Land rolled Control
70 a 71 a
0.46
140132
6
Soybeans planted 4/21/14 Soybeans planted 5/15/14
73 a 65 b
<0.01
xValues denoted with the same letter within a trial are not statistically different at the significance level of 0.05. yP-Value = the calculated probability that the difference in yields can be attributed to the treatments and not other factors. For example, if a trial has a P-Value of 0.10, then we are 90 percent confident the yield differences are in response to treatments. For P = 0.05, we would be 95 percent confident.
Iowa State University, Western Research and Demonstration Farm ISRF14-10
31
On-Farm Soybean Seed Treatment Trials
RFR-A1436
Jim Fawcett, extension field agronomist (retired)
Zack Koopman, Ag Engr/Agronomy Farm, ag specialist
Lance Miller, Southeast Farm, ag specialist Wayne Roush, Western Farm, superintendent Josh Sievers, Northwest Farm, superintendent
Introduction
Seed treatments offer protection from fungi, insects, and nematodes to germinating seeds and developing seedlings. All legumes require the appropriate rhizobium bacteria in the soil in order for nitrogen fixation to occur. Inoculating the seed with an inoculum can insure the crop can take advantage of this nitrogen fixation.
Materials and Methods In 2014, seven trials (Table 1) examined the use of soybean seed treatments to increase soybean yield. All trials were conducted on-farm by farmer cooperators using the farmers’ equipment. Soybean seed treatments were applied with the planter and were arranged in a randomized complete block design with at least three replications per treatment. Strip size varied from field to field depending on equipment size and the size of the field. All strips were machine harvested for grain yield. In Trials 1–4, soybeans planted with soybean seed treated with an inoculant was compared with soybeans planted with untreated seed (Table 2). The inoculant was Optimize® from Novozymes in Trial 1, PPST730 from Pioneer Hybrid for Trials 2-3, and First up ST from Helena Chemical Company for Trial 4. In Trial 5, soybeans with seed treated with Clariva® nematicide were compared with soybeans planted with untreated seed. In Trial
6, soybeans with seed treated with Cruiser Maxx® were compared with soybeans planted with untreated seed. In Trial 7, the seed treatments Clariva Complete® and Cruiser Maxx Advanced® were compared with soybeans planted with untreated seed. Cruiser Maxx® and Cruiser Maxx Advanced® contain an insecticide and two fungicides. Clariva Complete® contains a nematicide, an insecticide, and two fungicides.
Results and Discussion None of the soybean inoculants resulted in an increase in soybean yield (Table 2). Most research has indicated that grain yield increases are seldom seen when soybean seed is treated with an inoculant unless the field has not been planted to soybeans for at least five years. Fields in Trials 1–3 had a corn-soybean rotation history for several years, so would be less likely to show a benefit to the soybean inoculant. However, Trial 4 was in a field that had been in sod for 20 years, so a yield increase would have been more likely. It has been speculated there is often enough soil blowing from nearby soybean fields into fields without a recent soybean history resulting in the field being “inoculated” with the soybean rhizobium bacteria. This may have been the case in this field. In Trial 5, there was not a soybean yield increase with the use of Clariva® nematicide, which may indicate there are low levels of nematodes that feed on soybeans in the field. In Trial 6, there was a yield increase of three bushels/acre with the use of the Cruiser Maxx® seed treatment. This yield increase may have been due either to the insecticide or fungicides in the treatment. The soybeans were planted in early May and the cool, wet weather in May would have increased the likelihood of problems with soil-borne fungal diseases, so most or all of the yield benefit

Iowa State University, Western Research and Demonstration Farm ISRF14-10
32
may have been due to protecting the soybeans from seedling diseases. No yield increase was seen with either of the seed treatments in Trial 7 (Table 3). These soybeans were not planted until June, which would have decreased the likelihood of problems with soybean seedling
diseases. Although soybean seed treatments can result in yield increases, significant yield increases were only seen in one of the seven trials in 2014 (P = 0.05).
Table 1. Variety, row spacing, planting date, planting population, and previous crop in on-farm seed treatment trials in soybeans in 2014.
Exp. no. Trial County Variety
Row spacing
(in.) Planting
date
Planting population (seeds/A)
Previous crop
140706 1 Henry Mycogen 5N342R2 30 5/23/14 155,000 Corn
140710 2 Washington Pioneer
P34T07R2 30 5/22/14 140,000 Corn
140716 3 Washington Pioneer
P34T07R2 30 5/23/14 VR 110-130,000 Corn
140637 4 Cass 4-star 2Y283 15 6/15/14 150,000 Sod
140130 5 Sioux NKS2251 30 5/15/14 150,000 Corn
140323 6 Monona Renze
2889RR 30 5/6/14 139,000 Corn
140507 7 Story Asgrow
2433 30 6/6/14 150,000 Corn Table 2. Yields from on-farm soybean seed treatment with multiple comparison trials in 2014. Yield (bu/A) Exp. no. Trial Treatment Treatment Control Response P-valuex
140706 1 Inoculant 71 72 -1 0.29 140710 2 Inoculant 71 69 3 0.29 140716 3 Inoculant 65 65 0 0.82 140637 4 Inoculant 59 57 2 0.21 140130 5 Clariva 60 59 1 0.29 140323 6 Cruiser Maxx 60 57 3 0.03 xP-Value = the calculated probability that the difference in yields can be attributed to the treatments and not other factors. For example, if a trial has a P-Value of 0.10, then we are 90 percent confident the yield differences are in response to treatments. For P = 0.05, we would be 95 percent confident. Table 3. Yields from on-farm soybean seed treatment trials in 2014. Exp. no. Trial Treatment
Yield (bu/A)x P-valuey
140507 7 Clariva Complete 52 a 0.62 Cruiser Maxx Advanced 52 a Control 53 a xValues denoted with the same letter are not significantly different at the significance level 0.05. yP-Value = the calculated probability that the difference in yields can be attributed to the treatments and not other factors. For example, if a trial has a P-Value of 0.10, then we are 90 percent confident the yield differences are in response to treatments. For P = 0.05, we would be 95 percent confident.

Iowa State University, Western Research and Demonstration Farm ISRF14-10
33
On-Farm Soybean Fungicide Trials
RFR-A1409
Jim Fawcett, extension field agronomist (retired)
Lance Miller, Southeast Farm, ag specialist Lyle Rossiter, Allee Farm, superintendent
Wayne Roush, Western Farm, superintendent Josh Sievers, Northwest Farm, superintendent Micah Smidt, Northern Farm, superintendent Matt Schnabel, Northern Farm, ag specialist
Introduction
Fungicide applications have become more popular among soybean farmers in recent years. The primary use of fungicides has been to control diseases such as Septoria brown spot, Cercospora leaf blight, and frogeye leaf spot. With lower grain prices, the chances of getting an economic benefit from fungicide applications have decreased.
Materials and Methods
In 2014, nine trials (Table 1) examined the use of fungicides to control foliar disease and to increase soybean yield. All trials were conducted on-farm by farmer cooperators using the farmer’s equipment. Fungicide treatments were applied by ground equipment and were arranged in a randomized complete block design with at least three replications per treatment. Strips varied from field to field depending on equipment size and the size of the field. All strips were machine harvested for grain yield. In Trials 1, 2, 3, and 5, PriaxorTM Xemium® was applied at R2-R4 at 4 oz/acre (Table 2). In Trial 4, Stratego® was applied at R3 at 4 oz/acre. Aproach® at 6 oz/acre was applied in Trials 6 and 9 at V8-R2. In Trial 7, Fortix® was applied at V3 at 5 oz/acre, and in Trial 8 Tetraconozole + αβ PRO was applied at 4 + 1 oz/acre at R1. These treated strips were compared with an untreated control in each
trial. Soybeans were evaluated for foliar diseases during September in Trial 4 and at the time of the fungicide application in Trial 2.
Results and Discussion A statistically significant yield increase of 2 to 6 bushels/acre was seen in Trials 1, 3, 4, and 5 (P = 0.05), and a nearly significant yield increase of 4 bushels/acre was seen in Trial 2 (P = 0.10). There was no difference between the treated and untreated strips in the other four trials (Table 2). There were very low levels of Septoria brown spot on all plots at the time of the fungicide application in Trial 2. Plant disease assessments made in Trial 4 indicated more disease lesions in the untreated control than the plots treated with Stratego® (primarily Septoria brown spot on the lower leaves). There was a higher yield of the soybeans with the fungicide application in this trial, but not likely enough of a yield increase to pay for the fungicide application. The average yield difference between the treated and untreated plots in all trials was 2 bushels/acre. It would likely require a yield response of about 3 bushels/acre to cover the cost of the fungicide, thus in only three of the nine trials would the fungicide application have been profitable. The fungicide in these three trials (2, 3, and 5) was PriaxorTM Xemium®. Although plant disease evaluations were not made in most of the trials, it is likely there was disease present in the three trials where there was an economic response to the fungicide and little disease incidence in trials with little to no yield response to the fungicide. This indicates the importance of evaluating plant disease incidence and the likelihood of disease problems with current weather conditions in making decisions on the use of foliar fungicides in protecting soybean yield.

Iowa State University, Western Research and Demonstration Farm ISRF14-10
34
Table 1. Variety, row spacing, planting date, planting population, previous crop, and tillage practices in on-farm soybean fungicide trials in 2014.
Exp. No. Trial County Variety
Row spacing
(in.) Planting
date
Planting population
(seed/A) Previous
crop Tillage 140156 1 Sioux NKS2251 30 5/15/14 150,000 Corn No-till 140709 2 Washington LG 3650 30 5/6/14 150,000 Corn Conventional
140411 3 Franklin NK S27-
H6 30 5/22/14 140,000 Corn Conventional
140313 4 Monona LG Seeds
LG2898LL 30 5/20/14 138,000 Corn
Fall disk, spring field
cultivate
140111 5 Osceola Kruger 1901 30 5/10/14 150,000 Corn Conventional
140143 6 Lyon Asgrow
2232 30 5/7/14 140,000 Corn Strip till
140216 7 Buena Vista
Syngenta NK 25E5 30 5/19/14 138,500 Corn
Fall chisel, spring disk
& field cultivate
140713 8 Henry Pioneer
32T25R2 30 5/20/14 150,000 Corn
Fall chisel, spring field
cultivate
140179 9 Lyon Asgrow
2534 30 5/7/14 140,000 Corn Strip till Table 2. Yields from on-farm soybean fungicide trials in 2014.
Yield (bushels/A)
Exp. No. Trial Treatment Rate
(oz/A) Application
timing Fungicide Control Response P-value1
140156 1 Priaxor Xemium 4 R4 58 56 2 0.04 140709 2 Priaxor Xemium 4 R3 65 62 4 0.10 140411 3 Priaxor Xemium 4 R2 51 45 6 <0.01 140313 4 Stratego 4 R3 65 63 2 <0.01 140111 5 Priaxor Xemium 4 R3 59 55 4 0.02 140143 6 Aproach 6 V8 67 68 -1 0.29 140216 7 Fortix 5 V3 67 65 2 0.27 140713
8
Tetraconozole + αβ PRO
4 + 1 R1 59 59 0 0.87
140179 9 Aproach 6 R3 71 70 1 0.46 1P-Value = the calculated probability that the difference in yields can be attributed to the treatments and not other factors. For example, if a trial has a P-Value of 0.10, then we are 90 percent confident that the yield differences are in response to treatments. For P = 0.05, we would be 95 percent confident.
Iowa State University, Western Research and Demonstration Farm ISRF14-10
35
On-Farm Cover Crop Trials
RFR-A1449
Jim Fawcett, extension field agronomist (retired)
Josh Sievers, Northwest Farm, superintendent Wayne Roush, Western Farm, superintendent
Brian Lang, extension field specialist
Introduction Cover crops can benefit farmers by aiding in erosion control, increasing organic matter in the soil, and reducing nitrate losses into the surface waters. Cover crops also have been promoted to alleviate soil compaction and improve soil drainage. Legume cover crops can supply nitrogen to the following crop. Cover crops are an important practice in meeting Iowa’s nutrient reduction strategy goals. However, some research has indicated that planting corn following a rye cover crop can result in corn grain yield losses, especially if the cover crop is not killed at least two weeks prior to planting the corn.
Materials and Methods In 2014, cover crop use was examined in two trials of corn in western Iowa (Table 1) and one trial in soybean in northeast Iowa (Table 2). All trials were conducted on-farm by farmer cooperators using the farmers’ equipment. Strips were arranged in a randomized complete block design with at least three replications per treatment. Strip width and length varied from field to field depending on equipment size and size of field. All strips were machine harvested for grain yield. In Trial 1, 44 lb/acre of a seed mixture containing 70 percent crimson clover and 30 percent tillage radish was no-till drilled in mid-September 2013 following a corn silage harvest. The cover crop that survived the winter (primarily crimson clover) was sprayed
with glyphosate when it was about 6 in. tall, immediately prior to planting the corn no-till on May 7, 2014. In Trial 2, winter rye was no-till drilled at 1.5 bushels/acre into soybean stubble on October 10, 2013. The rye was sprayed with glyphosate on April 10, 2014 about four weeks prior to the no-till planting of the corn. Corn without a cover crop was compared with the corn planted after a cover crop in both trials. In Trial 3, four different cover crop seeding mixtures were no-till drilled on August 8, 2013 into a “prevented planting” field where wet spring and summer conditions prevented the field from being planted to corn or soybean. The four treatments were winter rye at 1.25 bushels/acre, oats at 2.5 bushels/acre, tillage radish at 10 lb/acre, and oats plus radish at 1.25 lb/acre plus 5 lb/acre. The entire area was grazed after November 1. Because of regulations regarding cover crops on prevented planting acres, it was not possible to include an untreated control. All strips were sprayed with glyphosate on April 28, 2014 when the winter rye was about 7 in. tall (about 3 weeks prior to soybean planting). Evaluations of soybean plant stands were made in the spring.
Results and Discussion
In Trial 1, there was a yield increase of 17 bushels/acre with the corn planted after the crimson clover plus tillage radish cover crop compared with the corn without a cover crop (Table 3). This may have been due to improving the soil drainage with the tillage radish, or some nitrogen benefit to the crimson clover. The rate of nitrogen fertilizer on the field was 192 lb/acre. With the excess spring rains, it is possible the corn might have responded to additional nitrogen, because the field had been in corn for several years.

Iowa State University, Western Research and Demonstration Farm ISRF14-10
36
In Trial 2, there was no difference in yield between the corn planted following a rye cover crop and the corn without the cover crop. In Trial 3, the soybean yield was 2-3 bushels/acre lower following the winter rye cover crop compared with the oats, oats plus tillage radish, or tillage radish (Table 4). The
soybean plant stands also were lower following the winter rye, although the stand of 123,000 plants/acre should have been sufficient for optimum yields. Without an untreated control, it is not possible to know how the soybean yield following any of these cover crops would have compared with soybeans without a cover crop.
Table 1. Hybrid, row spacing, planting date, planting population, previous crop, and tillage practices from on-farm cover crop trials in corn in 2014.
Exp. no. Trial County Hybrid
Row spacing
(in.) Planting
date
Planting population (seeds/A)
Previous crop
Tillage practices
140314 1 Monona
LG 2602VT3
PRIB 30 5/7/14 31,000 Corn
No-till
140128 2 Sioux Pioneer 636AM 30 5/6/14 34,300 Soybean
No-till
Table 2. Variety, row spacing, planting date, planting population, previous crop, and tillage practices from an on-farm cover crop trial in soybean in 2014.
Exp. no. Trial County Variety
Row spacing
(in.) Planting
date
Planting population (seeds/A)
Previous crop
Tillage practices
140802 3 Howard Stine
20DR20 30 5/21/14 165,700 Corn
Spring field
cultivate Table 3. Yield from on-farm cover crop trials in corn in 2014.
Exp. no. Trial Treatment
Yield (bu/A) P-valuex
140314
1
Fall seeded crimson clover & tillage radish
Control 206 189
0.01
140128
2
Fall seeded rye Control
196 193
0.70
xP-Value = the calculated probability that the difference in yields can be attributed to the treatments and not other factors. For example, if a trial has a P-Value of 0.10, then we are 90 percent confident the yield differences are in response to treatments. For P = 0.05, we would be 95 percent confident. Table 4. Yield from an on-farm cover crop trial in soybean in 2014.
Exp. no. Trial Treatment
Yield (bu/A)x
P-value (yield)y
Spring standx
P-value (stand)y
140802
3
Oats Oat + radish Radish Winter rye
55 b 56 b 55 b 53 a
0.01 136,000 a 136,000 a 136,000 a 123,000 b
<0.01
xValues denoted with the same letter within a trial are not statistically different at the significance level of 0.05. yP-Value = the calculated probability that the difference in yields can be attributed to the treatments and not other factors. For example, if a trial has a P-Value of 0.10, then we are 90 percent confident the yield differences are in response to treatments. For P = 0.05, we would be 95 percent confident.