20130920 streaming codec study report - npr labs · triton digital ad‐insertion software ......
TRANSCRIPT

Streaming Codec Study Report
For NPR Digital Media
John Kean
Ellyn G. Sheffield, PhD
NPR Labs
September 20, 2013
©2013 National Public Radio, Inc.

2
CONTENTS
Introduction and Executive Summary ............................................................................................................ 4
Codec Choice and Optimal Bit Rates ......................................................................................................................... 4
Loudness Management Within and Between Streams ............................................................................................. 6
Encoding Computer ................................................................................................................................................... 8
Audio Quality Tests ......................................................................................................................................... 9
Selection of Codecs by Well‐Informed Listeners ....................................................................................................... 9
Audio Codecs for Test ............................................................................................................................................ 9
Participants and methodology ............................................................................................................................. 11
Sound Sample Material and Preparation............................................................................................................. 12
Playback Conditions ............................................................................................................................................. 12
Results ................................................................................................................................................................. 12
Audio Quality of Codecs ‐ Consumer Test 1 ............................................................................................................ 15
Audio Codecs Under Test .................................................................................................................................... 15
Participants and Methodology ............................................................................................................................ 16
Results ................................................................................................................................................................. 16
Loudness ‐ Consumer Test 2 .................................................................................................................................... 21
Methodology ....................................................................................................................................................... 21
Sample Preparation ............................................................................................................................................. 21
Within‐Stream Results ......................................................................................................................................... 22
Between‐Stream Results ..................................................................................................................................... 24
Technical Recommendations ........................................................................................................................ 29
Codec Selection and Bit Rate ................................................................................................................................... 29
Codec Compatibility and Licensing .......................................................................................................................... 30
Streaming Requirements ......................................................................................................................................... 32
Wireless Networks ............................................................................................................................................... 32
Codec and bit rates .................................................................................................................................................. 35

3
Loudness Consistency ................................................................................................................................... 36
Current Experience .................................................................................................................................................. 36
Loudness Control and Management ....................................................................................................................... 38
Program Level Measurement .............................................................................................................................. 38
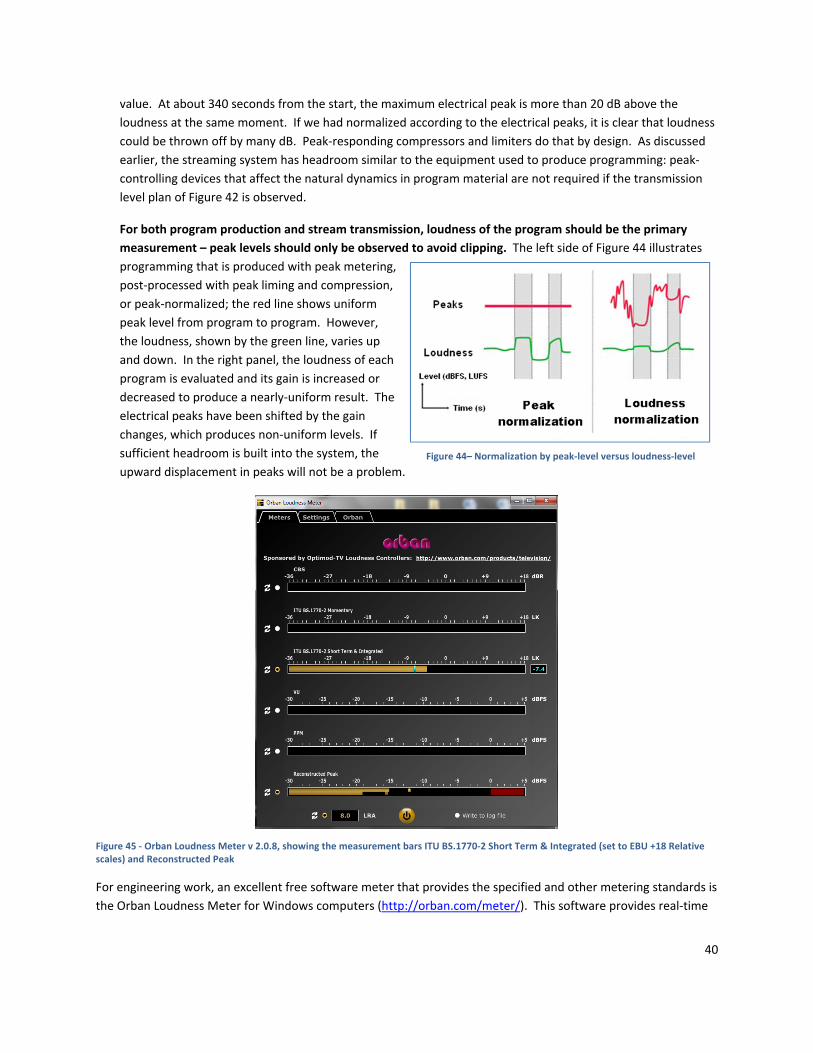
Loudness Values Should be the Target, Not Peak Levels ..................................................................................... 39
Loudness Monitoring and Normalization of Streams .......................................................................................... 41
Batch Normalization of Audio Loudness for Files and Podcasts .......................................................................... 45
Loudness Levels Relative To Other Internet Streams .......................................................................................... 45
Stream Server ............................................................................................................................................... 47
Present Audio Card .................................................................................................................................................. 47
Patchmix DSP Configuration .................................................................................................................................... 49
Triton Digital Ad‐Insertion Software ........................................................................................................................ 50
Audio Card Replacements ....................................................................................................................................... 51
Cautions for the Software Encoder ......................................................................................................................... 51
Acknowledgements ...................................................................................................................................... 52

4
STREAMING CODEC STUDY REPORT FOR NPR DIGITAL MEDIA
INTRODUCTION AND EXECUTIVE SUMMARY
This report presents the results of research and testing in support of a new Internet audio streaming system to be
launched by NPR Digital Media, with a focus on delivery over mobile wireless networks to smartphone and tablet
devices using a custom player application. The objective of this study was to identify the best digital audio codec
and streaming rate. Additionally, we explored the effects of audio level shifts on consumers’ preferences and
behavior and developed a solution to loudness management for playback in a variety of listening conditions.
This section provides an executive summary of the key findings and technical recommendations. The appendices
discuss implementation, as well as explanations of the research and methodology.
CODEC CHOICE AND OPTIMAL BIT RATES
Digital audio codecs are the heart of a practical streaming system. They make Internet streaming commercially
feasible by vastly reducing the bit rate required of the audio data without noticeably reducing the audio quality.
Without them, streaming would require too much data bandwidth to be affordable.
Codecs vary in their ability to maintain sound quality at lower bit rates. The older ones, such as the familiar MP3
format, are the poorest at hiding audible artifacts that result as the bit rates are reduced. Through continual
research and development, digital compression techniques have continued to evolve, leading to new codecs that
provide high sound fidelity at ever‐lower bit rates.
Besides saving on transmission expenses related to the data bandwidth, minimizing the bit rate has direct benefits
for the listeners, because lower stream bit rates:
Start faster when a stream is selected, much like a radio plays as soon as tuned in to a station;
Experience markedly higher reliability (fewer dropouts) in mobile wireless networks, and
Restart audio faster after a dropout occurs
Save potential data charges for the listener.
This study included real‐time field measurements of wireless mobile networks (see Streaming
Requirements/Wireless Networks in the Appendix), which explains that as the bit rate rises, a rise in the frequency
and duration of data interruptions (“dropouts”) occur. In fact, data show the amount of interruption rises steadily
at rates above approximately 32 kbps, whereas, at lesser rates, outages tend to be caused by weak cellular signals.
Not surprisingly, testing in the Washington, DC area also showed that stream reliability was worst during morning
and evening drive‐time – the peak listening times for most public radio programming.
There are numerous codecs available for use by portable devices and computers. We tested six of the leading
codecs with expert listeners over a wide range of bit rates (see the appendix for Selection of Codecs by Well‐
Informed Listeners for details).

5
After identifying the High Efficiency AAC (HE‐AAC)
codec as the top performing codec, consumers were
tested to substantiate the expert listeners’
recommendations (see the appendix Audio Quality
of Codecs ‐ Consumer Test for details). Figure 1
shows how consumers rated the HE‐AAC codec,
shown in red, on a vertical scale of Mean Opinion
Score ranging from 1 (worst) to 5 (best) for the
music genre. Notice that there is relatively little
difference between the overall (encoded/decoded)
quality and the original reference audio, shown to
the far right in light blue. Over a range of bit rates
suitable for mobile streaming, our test data and
industry research show good agreement between
the listener scores with music and speech programs.
Recommendation 1: Of the codecs currently available, the standout, overall, is High Efficiency‐Advanced Audio
Coding (“HE‐AAC”), also known as “aacPlus” and “AAC+”, for streaming. This codec, herein referred to as
HE‐AAC, is preferred for the following reasons:
Provides the sound quality of MP3 coding at less than half the bit rate;
Commonly available in Apple iOS (all versions) and recent Android operating systems;
Licensing fees paid by end‐product manufacturers, and no fee to program originators;
Support for metadata transport for loudness normalization and ancillary data functions.
As discussed fully in the appendix, the optimal bit rate must consider various aspects of the listener’s experience,
which must balance sound quality at higher bit rates and streaming reliability at lower bit rates. In our view, this
balance is best met with the following considerations:
For both music and speech streamed with the HE‐AAC codec, the optimal codec and bit rate is 48 kbps;
For non‐real time playback, such as podcasts, the optimal bit rate for music and speech with the
HE‐AAC codec is 64 kbps;1
Higher bit rates are unnecessary as listeners heard minimal, if any, improvement.
Update the encoder as new versions are released (updates usually on the encoding side, where the
heavier data processing occurs). Streaming software should also be designed to support the future
replacement with a superior codec.
1 The reason that a higher bit rate may be used for podcasts is that these are file transfers to the player, which
bridge interruptions in the flow of data over the Internet. File transfers may be bursty and interrupted, but these
effects are unnoticeable during file play back. Live streams use relatively small data buffers to permit faster
startup and recovery from dropouts, but they require a more constant flow of data.
Figure 1 ‐ Consumers’ Mean Opinion Scores for HE‐AAC and xHE‐AACcodecs with music at bit rates from 16 to 128 kbps
1
2
3
4
5
16 24 32 48 64 96 128
Mean
Opinion Score
Tested Rates (kbps)
MP3
HEACC
xHE‐AAC
AACLC
Reference

6
The HE‐AAC codec is universally available in portable devices operating iOS and most devices running the Android
OS (since version 3.1). There are earlier Android devices that may not have HE‐AAC on board, however, as these
devices are typically more than two years old and this market share continues to decline as consumers replace
their devices with newer models that support HE‐AAC audio.
LOUDNESS MANAGEMENT WITHIN AND BETWEEN STREAMS
Uniformity of perceptual loudness is an important consideration for the listening experience. As discussed in detail
in Loudness Consistency/Current Experience, the uniformity of public radio streams is quite poor in terms of
loudness, audio bandwidth and levels of digital compression artifacts. The chart below shows a series of audio
samples from 49 public radio stations, all carrying the same news program from NPR. The vertical position of the
dot measures the subjective loudness on a decibel (dB) scale –a desirable range is ±3 dB. In this test, however,
streams are varying over more than a 15 dB range in audio transmission level.
Figure 2 – Audio loudness (relative dB scale) of 49 public radio station streams carrying Weekend Edition Saturday
This project included a systematic study with consumers to determine their reaction to changes in loudness, as
reported in Loudness ‐ Consumer Test 2. For cases such as stream to stream switching, or hearing one
announcement at one level followed by another announcement at a different level, we measured the amount of
change in audio level that is annoying to listeners. Findings indicate that the irregularity of audio levels between
individual public radio streams today often exceed the tolerance of listeners. To ensure a pleasant listener
experience, the transmission level of each stream should be normalized, based on its long‐term loudness, as
measured by the ITU standard loudness meter.
Aside from stream‐to‐stream variation, the effect of loudness variation within a stream is important for listener
satisfaction, depending on external environmental factors. For example, listeners on a noisy subway need tighter
control of speech or music dynamic range to hear programming clearly, but in better listening conditions, the
natural dynamics of human speech or a musical performance can add to the experience and enjoyment of
listeners.2
2 As an experiment, we streamed a news/information and a classical music station for several weeks each with a
direct connection to the console output, that is, no audio processing. Listener reports were universally favorable.
0
5
10
15
20
25
0 5 10 15 20 25 30 35 40 45
Loudness (dBr)

7
Figure 3 ‐ Eleven public radio streams as received (left) and after processing in an iPhone loudness control app (right)
However, loudness variation should not be solved by more compression of dynamic range. We evaluated the
dynamic range of many public radio streams and found that many use aggressive compression and limiting, even
with fine‐arts programming. This may be suitable for broadcast transmissions which are subject to signal noise
and interference, and which must conform to tight modulation limits. However, audio processing is not required
to protect Internet audio streams: it is a digital audio transmission system capable of more than 90 dB of dynamic
range, which does not require dynamic range compression per se. Reduction in the dynamic range is useful for
noisier listening environments, or simply to comply with the listener’s taste. However, it is preferable to put this
choice under the control of the listener, rather than a restriction that is universally applied to all listeners.
We recommend a break from the tradition of dynamic
compression at the transmission end, which forces a
“one size fits all” treatment to audio. Figure 3 illustrates
how active loudness management can be applied at the
player. The thumbnail picture on the left shows samples
from 11 public radio streams (20 to 30 seconds each) as
they were received on an iPhone 4S. Considerable
variation in level is evident in the heights of the streams ‐
as much as 15 dB between adjacent streams. The picture
to the right shows the same streams after activating
active loudness management software that was added to
the iPhone. The software was effective at raising the low
level streams and bringing down the level of the loud streams. The audible effect was a more pleasant evenness in
sound across the group, while each sample remained fairly true to its original form.3
Taking a cue from industry work on loudness management for high‐definition television, we recommend the
following:
Adopt loudness metering for production, setup and stream monitoring. Measure the real‐time
loudness and dynamic range of programs with ITU‐R BS.1770‐2 metering (see Appendix for details) to
ensure levels sound more consistent across streams and from program to program.
Peak metering should be relied upon only to ensure that overload is not occurring, not for evaluating
loudness consistency of production and audio streams. As demonstrated in the Appendix, peak
measurement does not correlate well with subjective loudness.
Discontinue peak normalization of audio files in production. This effort should be replaced by loudness
normalization, either manually or automatically, plus active loudness management in the player.
Discontinue aggressive compression of audio dynamics before stream transmission. With loudness
measurement of levels in production, loudness management can be accomplished with less dynamic
compression (or, eventually, at the player, which also helps ensure that streams will sound better and
more uniform to the listeners).
3 This was a rather extreme example, as we would not expect to use this much control for streams that are
transmitted near the proper level.

8
Shift active loudness management to the stream player, using custom software. This can resolve the
problem of audio control, both within the program and from stream to stream. Smartphones and PCs are
capable of controlling the audio loudness range, and some music‐player “apps” for smartphones already
do this. Stream player loudness management would put the control in the hands of the listener,
according their needs and tastes. (This would require transmission of audio without addition
compression at the stream encoding, only loudness‐normalization program material to ensure
consistency. The issue with this is use of random, unassociated players lacking the loudness
management: they would play the streams, just without the loudness management feature available in
planned players. This would not affect many mobile devices, however, which use a player supplied by
public radio sources.)
Measurement and control of audio transmission levels for public radio streaming is arguably a bigger challenge
than selecting the codec and bit rate. Fortunately, we now have the technology to manage loudness effectively,
and comfortably, for every listener.
ENCODING COMPUTER
As discussed in the Appendix, NPR Digital Media is supplying a server computer to stations for stream encoding,
along with an audio interface and software. A Creative® model E‐MU‐0404 audio card was selected for the
computer, a consumer product with high quality, but inputs that are not compatible with most stations’ analog or
digital audio plants. To minimize installation and operational issues, NPR Labs developed a custom audio interface
box that ensures full compatibility and simple setup. The interface supports both analog and digital audio and has
been tested in a live stream for several weeks at two member stations.
The E‐MU 0404 audio card is discontinued and there is no direct replacement from Creative. We recommend a
study to identify a suitable replacement. This should consider USB‐connected audio interfaces, which are
becoming common in audio systems.

9
Appendices
AUDIO QUALITY TESTS
This appendix details three tests conducted over the spring and summer of 2012. The first, Selection of Codecs by
Well‐Informed Listeners was conducted at NPR and at the Public Radio Engineering Conference in Las Vegas. The
second and third: Audio Quality of Codecs ‐ Consumer Test 1, and Loudness ‐ Consumer Test 2, were conducted at
Towson University, near Baltimore, with individuals from Towson and the nearby community.
SELECTION OF CODECS BY WELL‐INFORMED LISTENERS
The purpose of this pre‐test was to (a) critically evaluate several codecs that are currently being used or potential
contenders for transmission over the Internet, and (b) identify two codecs that would be presented to consumers
in a final round of audio quality testing.
AUDIO CODECS FOR TEST
The codecs for this test were chosen to represent some of the most popular available, as well as the newest (and
arguably, best). The choices are listed in the table below, along with information on the relevant standards, if
applicable, their history and licensing requirements.
Codec Source Information Description
LAME lame.sourceforge.net A free software codec compatible with MP3 playback.
Although a widely available, it includes technology covered by
other patent‐holders. LAME’s developers consider it
educational software that, as such, does not infringe patents.
Commercial use may require license fees.
MPEG‐2 Layer
III (“MP3”)
ISO/IEC 11172‐3 (1993)
ISO/IEC 13818‐3 (1995)
http://www.iis.fraunhofer.de/en/b
f/amm/produkte/audiocodec/audi
ocodecs/mp3.html
A widely‐used codec used for consumer audio storage and
transmission encoding and playback. It is included in the
firmware of most digital audio players.
With some exceptions, the software is subject to royalty
payments for use in broadcast, streaming and physical
storage (see mp3licensing.com).
AAC‐Low
Complexity
(“AAC‐LC”)
ISO/IEC 13818‐7 (1997)
ISO/IEC 14496‐3 (2001)
http://www.iis.fraunhofer.de/en/b
f/amm/produkte/audiocodec/audi
ocodecs/aaclc.html
Advanced Audio Coding was designed as the successor to the
MP3 format, achieving better sound quality at similar bit
rates. It was originally developed in the mid‐1990s and
became an MPEG‐2 standard in 1994. The Low Complexity
(“LC”) profile is intended for consumer applications: because
of Apple’s use in iTunes, it is in all Apple operating systems for
iPhone, iPod and iPad device. It became a regular part of the
Android operating system beginning with v3.1
(http://developer.android.com/guide/appendix/media‐

10
formats.html). Based on EBU testing (EBU Tech 3324, Sept.
2007), this codec provides “good” to “excellent” quality at
128 kbps. Through its standardization in MPEG‐4 the AAC
family of codec often appears with that identification.
The licensing model for the AAC family of codecs puts a fee on
manufacturers or developers of end‐user products, rather
than use to broadcast or stream (www.vialicensing.com).
High‐
Efficiency AAC
(“HE‐AAC”)
ISO/IEC 14496‐3:2009
http://www.iis.fraunhofer.de/en/b
f/amm/produkte/audiocodec/audi
ocodecs/heaac.html
The addition of Spectral Band Replication (SBR) to AAC‐LC
results in the High Efficiency AAC profile (“HE‐AAC” or
“aacPlus”). With HE‐AAC, the lower part of the audio
spectrum in coded with AAC‐LC, while SBR encodes a “guided
recreation” the upper frequency spectrum. HE‐AAC offers an
efficiency improvement of up to 30% compared to AAC‐LC.
At bit rates of 24 to 32kbps, HE‐AAC automatically adds
Parametric Stereo processing, which extracts positional
information from the stereo signal along with a mono down
mix, to achieve a reconstruction of the decoded signal with
the stereo image. This achieves a more efficient transmission
than two‐channel HE‐AAC with similar overall scores for
quality. When SBR alone is employed, it is referred to as
“HE‐AAC v1”; when Parametric Stereo is added, it is referred
to as “HE‐AAC v2” or “aacPlus v2”. The version of HE‐AAC in
our testing can be determined by the bit rate employed for
each test.
G.722.2
(“AMR‐WB+”)
ITU‐T G.722.2
http://www.itu.int/rec/T‐REC‐
G.722.2/recommendation.asp?lan
g=en&parent=T‐REC‐G.722.2‐
200307‐I
Adaptive Multi‐Rate Wideband (AMR‐WB) is codified in
G.722.2 as an ITU‐T standard speech codec, or “vocoder”. A
standard for mobile phones, AMR‐WB is intended to provide
acceptable speech quality at very low bit rates and
multimedia support at moderate bit rates. Voice Age
Corporation, a developer and licensor of digital speech and
audio compression technology for communications
applications, developed a “hi‐fi speech and audio codec”
version of the codec for both speech and music, AMR‐WB+,
making it a candidate for testing.
Extended
HE‐AAC
(“xHE‐AAC”)
ISO/IEC DIS 23003‐3
MPEG‐D Part 3
ISO/IEC 23003‐3:2012
http://www.iis.fraunhofer.de/cont
ent/dam/iis/en/dokumente/pr/20
08/voiceage_iis_engl.pdf
Unified Speech and Audio Coding began as collaboration
between Fraunhofer IIS and Voice Age and combines the
technology of both companies to further performance and
efficiency of the lossy compression, using time‐domain
vocoding tools for speech segments as well as transform
coding methods for general audio. It is able to blend between
the techniques dynamically in response to the program signal.
A parametric stereo option may further increase coding
efficiency. The final standard was developed by the MPEG
audio subgroup as an MPEG‐4 audio object type. xHE‐AAC is
the MPEG "profile" which encompasses HE‐AACv2 as well as
additional technology with the name "Unified Speech and
Audio Coding"

11
Other codecs were considered for the expert listener testing. However, the requirement that they be available in
the Android and iOS operating systems, and a variety consumer products, limited the field of candidates. This
requirement was overlooked for AMR‐WB+ and xHE‐AAC codecs because of their standardization, which can help
future adoption in consumer devices.4 xHE‐AAC combines the advantages of speech and audio codecs, which
makes it possible to outperform either coding approach alone. This would be another codec to consider for future
implementation. Indeed, the performance of xHE‐AAC, described elsewhere in this section, suggests it to be a
future upgrade for NPR, once it becomes commonly available in products – or if no licensing fee is involved to
bundle it in a player.
PARTICIPANTS AND METHODOLOGY
Eleven listeners (4 females and 7 males), all NPR staff or associated with NPR‐affiliates, listened to audio samples
trial‐by‐trial to rank order the audio output of the codecs. Listeners were not taken from the general public for
this effort. They were all well acquainted with codecs and the artifacts that codecs create. Within one trial (e.g., a
female speech sample) participants listened to the same sample produced by six codecs at the same bit rate, side‐
by‐side, allowing them to compare small differences and rank order the codecs on a 0‐100 scale. Figure 4 depicts
the screen to enter data for one trial. Participants were directed to slide the “note” on the bar up and down until
they were satisfied that they had rank ordered the six codecs. Participants were encouraged to give each codec a
unique number, even though they may have felt two codecs were equivalent. This, for example, resulted in
participants occasionally giving one codec a “23” and another codec a “24”.
Figure 4 ‐ Snapshot of Rank Order Screen
For each new trial, listeners heard randomly ordered samples, such that different codecs were placed on different
slider bars. Selections included female and male speech, orchestra, single instrument, multiple voices and
voiceover (i.e., commercials). The codecs described above were tested at the MPEG standard bit rates of 16, 32,
4 USAC and xHE‐AAC codec technologies were developed jointly by a large number of companies and institutes,
including VoiceAge, Sony, Panasonic, Samsung, Philips, Dolby, NTT Docomo. Although Fraunhofer and VoiceAge
may claim to have contributed the largest part of the technology, others have contributed significantly.

12
48, 64 and 96 kbps. While tests could be conducted at other bit rates (to provide a more uniform distribution of
rates) some codecs are optimized for the MPEG rates. The selected rates avoided the possibility of uneven test
results.
SOUND SAMPLE MATERIAL AND PREPARATION
Audio material was selected from a variety of sources representing male and female speech, speech over a music
bed (voiceover), singing, individual instruments and orchestral music. All material was produced from
uncompressed PCM files with a sample rate of 44.1 kHz in 16‐bit integer format. (Some audio was collected as
48 kHz recordings, which were converted to 44.1 kHz using Audacity 2.0 rate converter in the high‐quality mode.)
All of the test material heard was played back as a WAV file. This required each audio sample to be encoded and
decoded (transcoded) back to a WAV file for each codec type. The LAME samples were encoded and decoded in
Reaper v4.26 using the version 3.98 codec. The AMR‐WB+ transcoding was accomplished with the VoiceAge
Evaluation Executable (http://www.voiceage.com/amrwbplus_eval.php), a Windows software tool that produces
the output WAV file in one step. The MP3, AAC (including HE‐AAC), and xHE‐AAC files were furnished to the
Fraunhofer Institute for transcoding.
To ensure that the listeners’ scores were not biased by differences in loudness, the audio level of the samples were
measured using the Orban Loudness Meter software, v 2.0.3 (downloaded from http://orban.com/meter/). Before
transcoding, the audio gain of each WAV file was trimmed in Audacity 2.0 to approximately ‐23 dB LUFS, according
to the “Integrated” indicator of the software tool’s ITU‐R BS.1770‐2 loudness meter. (The EBU R128 term LUFS, for
Loudness Units, relative to digital Full Scale, is used herein, and is equivalent to the ITU term LKFS.)
PLAYBACK CONDITIONS
The expert listener test was conducted with Sennheiser HD‐
600 headphones, connected to a Tascam US‐144MKII audio
interface, providing the audio connection from the test
computer. Approximately half the test subjects listened in
NPR Studio 5A, which provided a very quiet environment.
The remainder of the listeners volunteered during the 2012
Public Radio Engineering Conference in Las Vegas, and tests
were conducted in a quiet hotel room using the same
headphones and headphone driver. A photo of the hotel
listening room setup is shown in Figure 5. Listeners
operated their codec test through E‐Prime®, a PC program
to automate the playback of codec audio test samples and
collect the listener’s responses.
RESULTS
As can be seen from Figure 6, when all genres were combined, listeners felt that three codecs codecs performed
better than others at 32, 48 and 64 kbps: HEAAC‐V2, xHE‐AAC, and AMR‐WB+. Although LAME, Fraunhofer MP3
Figure 5 ‐ Participant being set up for expert listener test

13
and AAC‐LC were satisfactory at 96 kbps, they were significantly lower at all other bit rates, rendering them
unacceptable as candidate choices for the consumer test.
Figure 6 through Figure 11 show results by genre. Notice that in speech, AMR‐WB+ falls off precipitously at
64 kbps, highlighting its intended use for lower bit rates. With regard to music (i.e., orchestral, choral and single
instruments) xHE‐AAC and HE‐AAC are consistently higher, with listeners ranking them as satisfactory starting at
32 kbps. (The data for HE‐AAC excludes 64 and 96 kbps as some of that audio material was later found to have
been inadvertently impaired in preparation for testing. However, tests conducted by others suggest that the
results for HE‐AAC would have been similar to AAC‐LC at 96 kbps.)
Interestingly, results were quite flat starting at 32 kbps, suggesting that listeners did not hear marked
improvements at higher bit rates. Given these results, the audio quality consumer test included xHE‐AAC and
HE‐AAC as the codecs of interest.
Figure 6 ‐ Expert listener scores for ALL GENRES combined
Figure 7 ‐ Expert listener scores for SPEECH genre
0
10
20
30
40
50
60
70
80
90
100
16kbps 24kbps 32kbps 48kbps 64kbps 96kbps
AAC‐LC
AMR‐WB+
HE‐AAC
LAME MP3
MP3
xHE‐AAC
0
10
20
30
40
50
60
70
80
90
100
16kbps 24kbps 32kbps 48kbps 64kbps 96kbps
AAC‐LC
AMR‐WB+
HE‐AAC
LAME MP3
MP3
xHE‐AAC

14
Figure 8 ‐ Expert listener scores for ORCHESTRAL genre
Figure 9 ‐ Expert listener scores for SINGLE INSTRUMENT genre
Figure 10 ‐ Expert listener scores for VOICE OVER genre
0
10
20
30
40
50
60
70
80
90
100
16kbps 24kbps 32kbps 48kbps 64kbps 96kbps
AAC‐LC
AMR‐WB+
HE‐AAC
LAME MP3
MP3
xHE‐AAC
0
10
20
30
40
50
60
70
80
90
100
16kbps 24kbps 32kbps 48kbps 64kbps 96kbps
AAC‐LC
AMR‐WB+
HE‐AAC
LAME MP3
MP3
xHE‐AAC
0
10
20
30
40
50
60
70
80
90
100
16kbps 24kbps 32kbps 48kbps 64kbps 96kbps
AAC‐LC
AMR‐WB+
HE‐AAC
LAME MP3
MP3
xHE‐AAC

15
Figure 11 ‐ Expert listener scores for CHORAL‐MULTIPLE VOICES genre
AUDIO QUALITY OF CODECS ‐ CONSUMER TEST 1
The purpose of this test was to determine how consumers would respond to audio transmitted at different bit‐
rates using our selected codecs ‐ HE‐AAC and xHE‐AAC ‐ and whether they would continue to listen to the
transmission as the bit rate decreased. Consumers heard HE‐AAC and xHE‐AAC samples coded at 16, 24, 32, 48,
64 and 96 kbps, and heard samples coded with MP3 at 16, 24 kbps (low anchors) and 128 kbps (frequently used in
streaming), plus AAC‐LC at 128 kbps and an unprocessed sample, known as the “reference”. The consumer test
also presented the material under conditions closer to that of average listeners: the listeners used Apple® earbuds,
rather than high‐end headphones, and a Polk® iSonic© table radio. Also, the listening room was a small interior
office with a moderate level of air handling noise. These tests were designed to determine the bit rate parameters
for an Internet audio system, less one that is indistinguishable from the source under the most discerning of
conditions than one that is capable of delivering a quality experience for all listeners. We believe the two tests
inform that determination.
AUDIO CODECS UNDER TEST
The high scores of the HE‐AAC and xHE‐AAC codecs were primary considerations for the test. The AMR‐WB+ codec
performed well, too, but it is not common to the operating systems in current smartphones and personal
computers. The same could be said for the xHE‐AAC, but we feel this codec is on the best track for future adoption
by smartphone manufacturers. (It also happens to be based on a joint development of Fraunhofer Institute and
VoiceAge Corporation, the companies that were active in the development of the HE‐AAC and AMR‐WB+ codecs,
respectively.) The MP3 codec was included to (1) provide a comparison to a codec and bit rate frequently used in
Internet streaming (MP3 at 128 kbps), and (2) by operating at a low bit provide a low reference for the tests. The
audio material for all three codecs was prepared in the same manner described for the expert listener tests and
was transcoded at Fraunhofer Institute.
0
10
20
30
40
50
60
70
80
90
100
16kbps 24kbps 32kbps 48kbps 64kbps 96kbps
AAC‐LC
AMR‐WB+
HE‐AAC
LAME MP3
MP3
xHE‐AAC

16
PARTICIPANTS AND METHODOLOGY
Forty participants were recruited from Towson University staff and administration via the university’s “Daily
Digest” announcement forum. See below for demographic details.
Age Group Female Male
18‐30 5 5
30‐40 5 5
40‐50 5 5
50‐65 5 5
Participants listened to a total of 250 speech and music audio samples, one‐by‐one. After each sample, participants
were asked to answer 3 questions: (a) on a scale of 1‐5 (bad, poor, fair, good, excellent), rate the audio quality for
the sample; (b) on a yes/no basis, were you satisfied with the audio quality; and (c) would you keep listening to the
radio or turn it off, given the audio quality of the sample. In two sessions, participants listened over loudspeakers
and earbuds. Sessions were counterbalanced such that 20 people were assigned to listening with speakers first
and 20 people were assigned to listening with earbuds first. Participants were encouraged to adjust the volume to
a comfortable setting before beginning the session, after which the volume remained constant.
RESULTS
DATA NORMALIZATION:
Within each genre, unique audio selections were presented for listening at different bit‐rates. This methodology
was specifically constructed in order to minimize the effect of listeners becoming overly fatigued by hearing the
same selection too many times. However, for each audio sample, a non‐processed reference was also included for
listeners to rate. In order to ensure that the audio content for each selection was not unduly influencing people’s
ratings (Mean Opinion Score and On/Off decision), scores were normalized to their corresponding references. For
example, if the MOS for a particular reference sample was 4.5, scores for codecs were calculated in relation to the
4.5; if the next reference sample was 4.2, those scores were calculated in relation to 4.2.
ANALYSIS OF GENDER AND AGE
A 2 (Gender: male, female) x 4 (Age group: 18‐29; 30‐39; 40‐49; 50‐65) Analysis of Variance (ANOVA) was
conducted to explore whether men and women differently answered whether they would leave the radio on,
given the quality of the audio. There was a main effect of age, F(3,10920) = 8.14, p<.01, showing that 18‐29 year
old listeners in general were more motivated to leave the radio on, particularly at higher bit rates. There was no
substantial difference between male and female listeners.
ANALYSIS OF EARBUD AND LOUDSPEAKER LISTENING
In order to determine whether consumers rated audio differently when listening over earbuds and loudspeakers, a
multivariate analysis of variance (MANOVA) was conducted with type of listening, bit rate and genre as
independent variables, and MOS, turn‐off score, and satisfaction score as dependent variables. This analysis
revealed significant differences for genre and bit rate on all measures but did not reveal differences for loud
speaker or earbud listening. Thus for the main analysis, all responses, whether collected on earbuds or
loudspeakers, were collapsed into one measure.

17
ANALYSES OF MOS, COMBINED AND SEPARATED BY GENRE
Figure 12 shows listeners mean opinion scores when all audio selections were combined. Asterisk (*) indicate that
the codec audio quality is statistically significant different from the Reference. Note that MP3 was significantly
worse than HE‐AAC and xHE‐AAC at the lowest bit rates, and that at 32 kbps and above, HE‐AAC and xHE‐AAC
performed extremely well, with listeners rating them as “good”. Listeners did not distinguish between the audio
quality of HE‐AAC and xHE‐AAC at 64 kbps and the uncoded reference sample.
Figure 12 ‐ MOS ‐ all audio combined
Figure 13 ‐ MOS ‐ music
16 24 32 48 64 96 128 WAV
MP3 1.8 2.0 4.2
HE‐ACCv1 3.2 3.7 3.9 4.1 4.0 4.1
xHE‐AAC 3.8 4.0 3.9 3.9 4.1
AAC 4.2
Reference 4.1
1.0
1.5
2.0
2.5
3.0
3.5
4.0
4.5
5.0
* *
**
*
1.0
1.5
2.0
2.5
3.0
3.5
4.0
4.5
5.0
16 24 32 48 64 96 128
MP3
HEACC
xHE‐AAC
AACLC
Reference

18
Figure 14 ‐ MOS ‐ speech
Figure 15 MOS ‐ voiceover
Figure 16 shows the On‐Off scores with combined audio selections. When answering this question, 99% of
listeners felt that they would leave the radio on at 32kbps and above. Even at 24 kbps, approximately 94% of
listeners claimed they would leave HE‐AAC on. Figures 17‐19 show on‐off scores by genre.
1.0
1.5
2.0
2.5
3.0
3.5
4.0
4.5
5.0
16 24 32 48 64 96 128
MP3
HEACC
xHE‐AAC
AACLC
Reference
1.0
1.5
2.0
2.5
3.0
3.5
4.0
4.5
5.0
16 24 32 48 64 96 128
MP3
HEACC
xHE‐AAC
AACLC
Reference

19
Figure 16 ‐ Leave on ‐ all audio combined
Figure 17 ‐ Leave on ‐ music
16 24 32 48 64 96 128
MP3 0.21 0.38 1.00
HEACC 0.72 0.94 0.99 1.00 0.99 1.01
xHE‐AAC 0.98 0.99 0.99 0.99 0.99
AACLC 1.01
Reference 1.00
0.0
0.1
0.2
0.3
0.4
0.5
0.6
0.7
0.8
0.9
1.0
0
0.1
0.2
0.3
0.4
0.5
0.6
0.7
0.8
0.9
1
16 24 32 48 64 96 128
MP3
HEACC
xHE‐AAC
AACLC
Reference

20
Figure 18 ‐ Leave on ‐ speech
Figure 19 – Leave on ‐ voiceover
0
0.1
0.2
0.3
0.4
0.5
0.6
0.7
0.8
0.9
1
16 24 32 48 64 96 128
MP3
HEACC
xHE‐AAC
AACLC
Reference
0
0.1
0.2
0.3
0.4
0.5
0.6
0.7
0.8
0.9
1
16 24 32 48 64 96 128
MP3
HEACC
xHE‐AAC
AACLC
Reference

21
LOUDNESS ‐ CONSUMER TEST 2
METHODOLOGY
Forty participants were recruited for the loudness test from Towson University staff and administration via the
university’s “Daily Digest” announcement forum. See below for demographic details.
Age Group Female Male
18‐30 5 5
30‐40 5 5
40‐50 5 5
50‐65 5 5
Participants listened to 128 speech and music audio samples, divided into a total of four sessions. In the first two
sessions, participants listened to samples via speakers, and then repeated the two sessions listening via earbuds.
Speakers and earbuds were counterbalanced across participants so that 20 people used speakers first and 20
people used earbuds first. Participants were encouraged to adjust the volume to a comfortable setting before
beginning, after which the volume remained constant.
In the first segment of session 1, participants listened to a single audio sample approximately 15 – 25 seconds in
length. Participants were told that some samples would contain a loudness change and some samples would not.
They were instructed to press the space bar as soon as they detected a change in loudness, if at all.
In the second segment of session 1, participants listened to two samples, back‐to‐back, and were instructed to
listen for a loudness change between samples. Listeners were presented with different combinations of audio,
including speech to speech, speech to music, music to speech and music to music. Samples were approximately
15‐18 seconds in length, so that listening to a sample pair took approximately 30‐35 seconds. The participants did
not have to identify when the change was detected in segment two, as the change occurred when the second
sample was played. After each sample or sample‐pair participants answered 4 questions:
1) Could you detect a loudness change on a scale of 1‐10 (1 – did not detect, 10 – easily detectable);
2) On a scale of 1‐10 how annoying was the loudness change (1 – not annoying, 10 – very annoying);
3) If this change occurred while listening to the radio, would you do nothing, adjust the volume or turn off
the radio.
4) If this change occurred on a regular basis, would you do nothing, adjust the volume or turn off the radio.
Session three was a replication of session one, and session four was a replication of session two, with the
participant listening via speakers or earbuds, whichever they did not use in the first two sessions.
SAMPLE PREPARATION
Audio selections included music and speech. The selections were chosen based on the evenness of their
amplitude, using the Orban Loudness Meter with its current ITU‐R BS.1770‐2 algorithm. Each candidate selection
was measured at a 1 sample per second interval and samples were selected that each had a maximum to minimum
loudness variation of less than 4 dB. This ensured that listener’s scores would not be significantly biased by one
part of the selection, such as the last sounds they hear during the sample. Using the audio gain editor in Cool Edit

22
Pro, the selected samples were adjusted in gain so that the average loudness level of the samples was within 2 dB
of each other.
ANALYSIS OF AGE AND GENDER
For the loudness test, A 2 (Gender: male, female) x 4 (Age group: 18‐29; 30‐39; 40‐49; 50‐65) Analysis of Variance
(ANOVA) was again conducted to explore whether men and women were differentially annoyed by change in
amplitude. There was no statistical difference among age groups, and no statistical difference between male and
female listeners.
WITHIN‐STREAM RESULTS
By pressing a button, people were asked to identify where a change in amplitude occurred within a single audio
stream. Correct responses were counted only if listeners pressed their buttons within 6 seconds of the amplitude
change. Figure 20 shows the percentage of correct and incorrect responses as the dB change increased from 1dB
to 9dB. Notice that at 6dB a majority of listeners were able to correctly identify a change in amplitude, but
beneath that level, 80% of listeners could not correctly identify a change. People also demonstrated the “false‐
positive” response, saying that there were changes in samples that were held “constant”.
Figure 20 ‐ Percentage of people identifying change in amplitude
Figure 21 displays participants’ ratings of how annoying the change was, on a 1 (not annoying) to 10 (extremely
annoying) scale. Notice that participants did not think any of the amplitude changes were very annoying or
extremely annoying, but that at 9dB participants claimed that the change was becoming annoying.
0
0.1
0.2
0.3
0.4
0.5
0.6
0.7
0.8
0.9
1
1dB 2dB 3dB 4dB 6dB 9dB Constant
Incorrect Response
Incorrect No Response
Incorrect ‐ before or too late
Correct

23
Figure 21 ‐ How annoying the change was
Figure 22 and Figure 23 show how listeners would respond to the radio after a change occurred within a stream.
Figure 22 shows that if listeners believed the change were atypical, few would turn the volume off, and instead opt
to adjust the volume knob. However, as is seen in Figure 23, if they believed the change would occur frequently,
more reported they would turn the radio off.
Figure 22 ‐ Listeners' behavior after a change occurred IF the change was rare
0
1
2
3
4
5
6
7
8
9
10
1dB 2dB 3dB 4dB 6dB 9dB No Change

24
Figure 23 ‐ Listeners' behavior after a change occurred IF the change was frequent
BETWEEN‐STREAM RESULTS
Listeners were asked several questions after listening to two audio streams. First, they were asked how prominent
the change was. Figure 24 shows listeners ratings when listening on earbuds or loudspeakers. Notice that when
the changes were small, participants claimed that they were easier to hear on earbuds. However, when the
change was large, both earbud listening and loudspeaker listening was equivalent. Similarly, as seen in Figure 25,
listeners were slightly more annoyed at lower loudness changes when they listened over earbuds, but this
annoyance evened out as the change became larger.
Figure 24 ‐ How prominent change was when listening on earbuds or loudspeakers

25
Figure 25 ‐ How annoying change was when listening on earbuds or loudspeakers
With regard to the direction of the change – loud to soft or soft to loud Figure 26 and Figure 27 show that as the
change increased more listeners reported hearing the change and being annoyed by the change if the audio went
from softer to louder.
Figure 26 ‐ How prominent change was

26
Figure 27 ‐ How annoying change was
With regard to participants behavior, as with the first segment where change occurred within the audio selection,
when change occurred between two audio selections participants were more likely to turn off the radio when they
felt this change would occur frequently. As is evident in Figure 29, at 6dB change people were beginning to take
action, by adjusting the volume or turning the radio off.
Figure 28 ‐ Behavior if radio loudness change occurred once

27
Figure 29 ‐ Behavior if radio loudness change occurred regularly
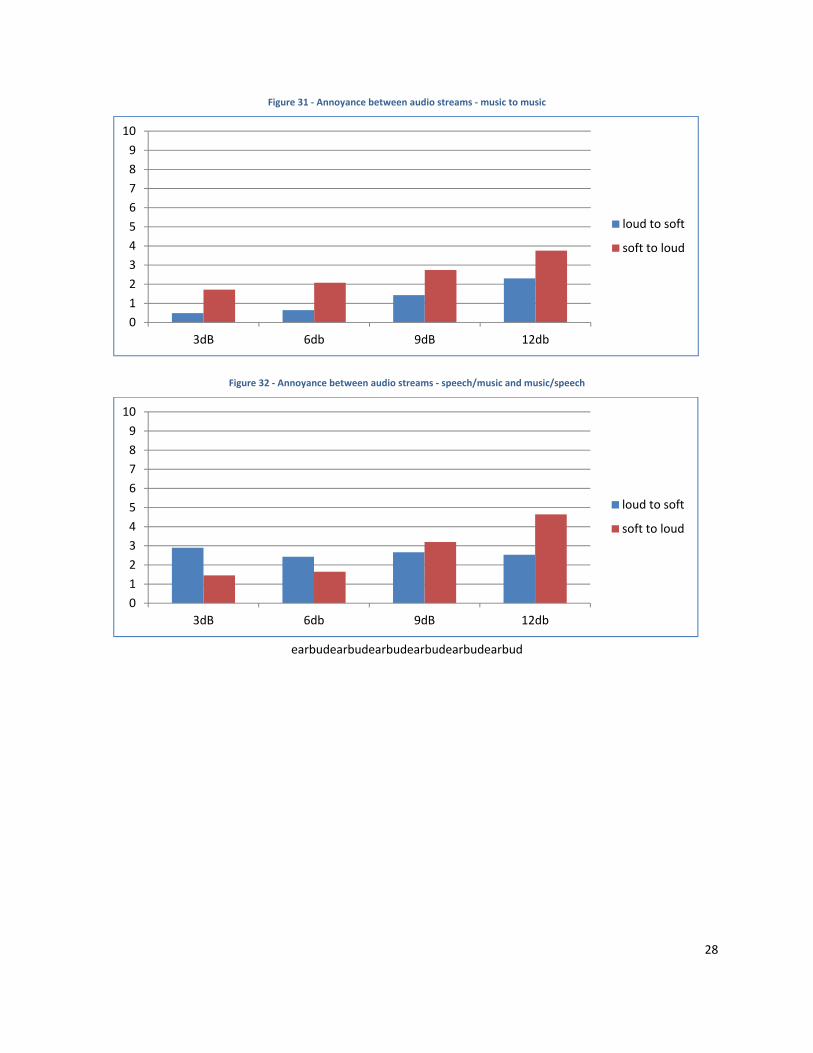
Finally, when we parsed the data into specific kinds of audio, participants were significantly more annoyed when
change occurred between speech samples, as can be seen in Figure 30. It is likely that people are significantly
more sensitive to changes in amplitude between speech samples because they expect speech to be more even,
and are more familiar with change in amplitude with music, as demonstrated in Figure 31 and Figure 32.
Figure 30 ‐ Annoyance between audio streams ‐ speech to speech
0
0.1
0.2
0.3
0.4
0.5
0.6
0.7
0.8
0.9
1
3dB 6db 9dB 12db
I'd adjust the volume withthe volume knob.
I'd do nothing.
I'd turn off the radio.
0
1
2
3
4
5
6
7
8
9
10
3dB 6db 9dB 12db
loud to soft
soft to loud
28
Figure 31 ‐ Annoyance between audio streams ‐ music to music
Figure 32 ‐ Annoyance between audio streams ‐ speech/music and music/speech
earbudearbudearbudearbudearbudearbud
0
1
2
3
4
5
6
7
8
9
10
3dB 6db 9dB 12db
loud to soft
soft to loud
0
1
2
3
4
5
6
7
8
9
10
3dB 6db 9dB 12db
loud to soft
soft to loud

29
TECHNICAL RECOMMENDATIONS
The section addresses key factors that affect the quality experienced by listeners, summarized below:5
Absence of digital compression artifacts in the audio (by choosing the right bit rate in association with a
given codec);
Optimum dynamic range to hear the program material, as determined by the listener’s needs (controlled,
for clarity in a noisy environment, or “open” when the listener desires it and the ambient noise level is
lower); and
Reliability of the stream audio (of less importance for personal computers connected to broadband
networks, but a significant concern for streaming over mobile networks).
CODEC SELECTION AND BIT RATE
The two test results discussed earlier in this report provides direct guidance on the selection of a codec and the bit
rate. The first study, by experienced listeners, examined a variety of commonly used codecs. In terms of efficiency
(the lowest bit rates required to render high mean opinion scores) for a range of audio material, this study
identified the xHE‐AAC and HE‐AAC codecs for first and second place, respectively. xHE‐AAC and HE‐AAC provided
similar results for music, but xHE‐AAC excelled at voice quality at the lowest bit rates. As discussed in the section
Audio Codecs Under Test, however, xHE‐AAC is not currently available across all smartphone and PC platforms.
The HE‐AAC codec is sufficiently available in consumer devices, in our opinion, to receive the nomination.
Figure 33 ‐ The Advanced Audio Codec "family"
5 The quality of the audio itself, that is, to be audibly free from distortion, noise, etc., is under the control of
program originators and is beyond the scope of this study

30
Figure 33 illustrates the codecs under the unified AAC patent license. The codecs are arranged in order of
decreasing age, as well as their increasing bit rate efficiency, from left to right.6 The AAC codecs recommended for
NPR’s streaming services are contained in the “MPEG‐4”box. The AAC‐Low Complexity (AAC‐LC) codec is
appropriate for rates of at least 96 kbps. It spawned the “High Efficiency” (HE‐AAC) version by adding Spectral
Band Replication. At bit rates below approximately 96 kbps, AAC switches to the HE‐AAC mode. This transition is
automatic, but the specific bit rate may be modified by sending configuration parameters to the encoder. At rates
of 32 kbps and below, Parametric Stereo processing is added, to further improve coding efficiency and extend
usable stereo operation to as low as 20 kbps. All three codecs are supported within one software encoder and
decoder, and their licensing terms are shared with other forms of AAC, such as AAC‐Low Delay (AAC‐LD).
CODEC COMPATIBILITY AND LICENSING
The HE‐AAC codec is almost universally available in portable devices operated by iOS and Android (at least since
version 3.1 “Honeycomb”, according to the developer).7 Android devices before v3.1 may not have HE‐AAC on
board, however, as these devices are now more than two years old, this percentage is declining as consumers
replace their devices with newer models and later versions of Android OS.
Other systems that support HE‐AAC include Blackberry, Windows phone®, Symbian® OS and the 3rd Generation
Partnership Project (3GPP), which is a collaboration of telecommunications entities. Services such as Pandora®,
Netflix®, hulu® and the BBC iPlayer use HE‐AAC, as well as global broadcast systems such as Digital Video
Broadcasting (DVB), World Digital Multimedia Broadcasting (DMB), Digital Radio Modiale (DRM).8
In addition to the technical performance and availability, NPR should consider any costs associated with the codec
choice. HE‐AAC has no fee, either for NPR to stream or for listeners to use, provided that the codec was supplied
by the phone’s manufacturer. For those mobile devices that do not include the HE‐AAC codec, the AAC codec
could be included in a player‐software download, but the developer (NPR) would be subject to mandatory license
fees: a license fee of $15,000 for five years plus $0.98 per download for the first 500,000 units.9
6 These designations are supplied in a figure by the licensing agent, Via Licensing Corporation, which represents a
number of patent holders involved in the development of AAC. The designations may vary.
7 The page at http://developer.android.com/about/versions/android‐2.3‐highlights.html states (on 10/2012) that
“the [Android 2.3] platform also adds support for AAC encoding and AMR wideband encoding (in software)”.
Decoding would also be needed to playback one’s own files, although this is not stated. The supported files and
container formats at the page http://developer.android.com/guide/appendix/media‐formats.html list “ADTS raw
AAC (.aac, decode in Android 3.1+, encode in Android 4.0+…)”. This statement seems inconsistent with the first
reference.
8 HE‐AAC – The Universal Solution, Fraunhofer IIS presentation to the Audio Engineering Society, October 2010.
9 Licensing on behalf of the patent holders is administered by Via Licensing Corporation; see
http://www.vialicensing.com/licensing/aac‐faq.aspx and http://www.vialicensing.com/licensing/aac‐fees.aspx.

31
The MP3 format, while universally available, appears to be an alternative. However, the drawbacks to that codec
include:
MP3 streaming requires at least 2½ times the bit rate of HE‐AAC for similar quality, which increases
streaming costs and may accumulate higher data fees for listeners;10
The higher streaming rate needed by MP3 will lower stream reliability, compared to HE‐AAC.
A cost‐benefit analysis is indicated for the case of HE‐AAC codec download versus the cost of an alternative MP3
stream. The following example shows that, depending on the number of listeners who download the NPR app
with HE‐AAC (as we understand that the current version has been downloaded at least 100,000 times), the cost to
NPR of the codec license could be made up in a matter of time through streaming cost savings by using HE‐AAC
instead of MP3. The example below illustrates the number of months to break‐even for the AAC license if the
added streaming cost were 5¢ per user per month.
overall license fee $15,000
per download $ 0.98
number of downloads: 10,000 50,000 100,000 500,000
cost per download $ 2.48 $ 1.28 $ 1.13 $ 1.01
difference per user per month, 128 kbps $ 0.05
time it would take to get to the download cost for the AAC decoder
(number of months) 49.6 25.6 22.6 20.2
Another consideration for implementing any advanced codec is computers running older operating systems, such
as Windows XP, which lacked AAC. Codec upgrades that include a compatible AAC decoder are widely available for
download on the Internet, and it may be possible to use separate public radio stream software to avoid the
licensing fee for consumer PC software, which is $0.48 per unit plus $32,000 per year.9 Compatibility of HE‐AAC
with older Apple computer products is not likely to be an issue as Apple’s iTunes uses the AAC codec exclusively.
10 The StreamGuys hosting service (www.streamguys.com) levies a $0.05 extra cost per user per month (at 1000
user capacity) for customers who stream at 128 kbps, compared to those who stream at 48 kbps.

32
STREAMING REQUIREMENTS
While it is undeniable that that higher bit rates permit potentially greater audio quality, there are other conditions
besides audio quality to consider, such as the reliability of the stream, which runs counter to the bit rate. The
following section explains how wireless mobile networks affect stream reliability and how this impacts the choice
of streaming bit rate.
WIRELESS NETWORKS
Wireless mobile networks, such as Verizon and AT&T, are essential to a mobile audio service. These carriers are
licensed by the FCC to provide two‐way broadband data service to large geographic areas of the U.S. According to
Consumer Watchdog (www.consumerwatchdog.com), however, they promise “faster 4G” speeds “without actually
making improvements to existing products and services or without disclosing the meaning of ‘faster’”. Prompted
by complaints from consumers about irregular broadband speeds and uneven geographic service, the FCC
announced that it will test mobile operators’ systems in the near future (see Figure 33). Some industry analysts
doubt that much can be done to improve performance, as customer growth and user demand for greater amounts
of data will continue to soak up the networks’ 4G and LTE speed improvements.
Figure 34 ‐ Examples of news reports about the misleading speed claims of mobile wireless operators; FCC intention to investigate
The bandwidth of wireless networks is not an absolute: it can be described by averages, with statistical variations
around a mean. The measurements in Figure 34 and Figure 35 further illustrate that bit rates, when grouped into

33
ranges, vary in their occurrence (frequency).11 The measured rates compare UDP, an Internet transport protocol
with no data retransmission, to TCP, a transport protocol that can request retransmission of data packets. UDP is
commonly used for streams while TCP is a core protocol used on the Internet for reliable file transfer.
Figure 35 ‐ ‐ Statistical availability of bit rate for TCP and UDP protocols
Reliable protocols, such as TCP, guarantee correct delivery of each bit in the media stream. However, they
accomplish this with a system of timeouts and retries, which makes them more complex to implement than UDP.
UDP is it preferred for streaming because it has less latency and processing overhead than TCP, but it is less
reliable because packet checking and retransmission requests are not possible. With either protocol, when there is
data loss on the network, a media stream stalls while the protocol handlers detect the loss and retransmit the
missing data. Clients can minimize this effect by buffering data, but at the expense of longer startup times and
latency.
It is apparent that UDP offers higher more occasions for higher downstream bit rates than TCP. The Figure 35
charts show that bit rates in the city have a
wider variability than the highway
measurements. It is important to note that
these measurements are averages over time,
and that the data, especially with UDP, could
include shorter intervals when no data is
received.
Figure 36 shows a simplificationof how audio
data packets can flow over an Internet network
(wireless or wired) to a UDP device, as the small
blocks along the base line. The accumulated
data over time is shown with the blue line. If
the audio playout rate, shown by the red line,
11 The Effects of Mobility on Streaming Media in CDMA2000 1xEV‐DO Network, Phillipa Sessini, et. al., Dept. of
Computer Science, University of Calgary, Proc. SPIE, Jan. 2007.
Figure 36 ‐ Data flow for streaming and file transfer

34
exceeds the received data, dropouts in the audio will occur. If a lower audio playout rate, shown in green, is less
than the rate at which data accumulates in the buffer, uninterrupted audio results. These scenarios do not apply
to file‐download systems, such as Pandora, which are effectively file transfer systems with a large data buffer: the
data transfer can even stop, briefly, as long as the data bursts keep ahead of the file playout rate. (It is believed
that Pandora and similar file‐playout systems may also shift to a lower playback bit rate in anticipation of a data
shortfall, which helps avoid audio dropouts. Because podcasts are file transfers, their playback after download is
complete; hence, high bursty bit rates are possible without effect to the playback.
Prior to this project we constructed an in‐vehicle system to measure the reliability of different streams. To do this
we connected the audio output from a smartphone to an audio sensor and computer that could record time and
location along with audio availability. The phone was placed in the clear, in a holder at the top of the dash, and a
GPS antenna was placed on the roof. Our primary interest was to determine if stream rate would affect reliability.
Figure 37 ‐ Typical route, between NPR and home for one of the authors.
The map in Figure 37 shows a trip to NPR headquarters, in the upper right, from the Virginia suburbs as a series of
dots. The green dots indicate stream audio and the white dots show dropouts, using an Apple iPhone 3GS on the
AT&T network.12 The inset chart shows the audio availability over time for the same trip. It is apparent that this
stream (at 128 kbps from NRK Klassik, in Norway) had several dropouts, with two lasting about two minutes each.
Our testing found that lower bit rate streams were consistently more reliable than higher streams.
12 The iPhone 3GS introduced support for 7.2 Mbps HSDPA (High‐Speed Downlink Packet Access) in the Universal
Mobile Telecommunications System (UMTS), a third generation mobile cellular system for networks based on the
GSM standard. This capability would appear to far exceed the 0.128 Mbps (128 kbps) stream rate in the example.

35
The stream logging system was expanded later to support two smartphones. In that way we could by
simultaneously measure two different streams in one vehicle during the same trip, cancelling out the variations
that may occur from trip to trip. Figure 38 shows two member stations with stream rates in this test of 32 kbps
(upper, in red) and 128 kbps (lower, in blue), both received on iPhone 4’s on the AT&T network. The higher bit
rate stream experienced more dropouts, including one 17‐second drop at approximately 573 seconds from the
start.
Dropout behavior with higher bit rate streams was frequently less reliable, but not always consistent. As Figure 38
shows, the dropouts are not correlated in time, suggesting that in populous areas where the signal is consistently
high, the dropouts are caused by network capacity limitations.
Figure 38 ‐ Comparison of dropouts on simultaneous streams at 128 and 32 kbps
Our tests found significantly higher dropout during peak morning and evening travel time than during off‐peak
times, which reinforces our theory that network loading, not signal, was reducing stream reliability. This may be
due to travel from one wireless cell into another cell that is at temporarily at capacity, where no other cell is
available for handoff. We also found cases where handoff appeared to be delayed, such as the section of I‐66
leaving Washington and entering Arlington, where we theorize that handoff between Washington and Virginia
networks is occurring that causes regular and predictable dropout. The dropouts are usually more prolonged with
high bit rate streams in this section of roadway.
CODEC AND BIT RATES
From the testing discussed above, we conclude that lower bit rates offer noticeably higher resilience against
momentary network capacity issues and poor cell handoff. The effect of dropouts on listener satisfaction was not
measured in this study, but we presume that listeners’ annoyance with dropouts rises quickly with frequency or
duration, and could lead to “tune outs”. Based on our research, we recommend keeping the bit rate of streams
as low as possible, consistent with high audio quality. For the HE‐AAC codec, we believe this balance is achieved
at a constant stream rate of 48 kbps. (bit rate is not suited to wireless streaming as the instantaneous bit rate
may exceed the data channel capacity, resulting in increased dropouts.)

36
LOUDNESS CONSISTENCY
Next to digital audio quality, the uniformity of perceptual loudness, both from stream‐to‐stream and from
program‐to‐program within streams, is one of the most important factors to listener enjoyment. In television, for
example, the matching of commercial announcements to programming and control of dynamic range have
required large investments in technology research and development to tackle this problem to consumer’s
satisfaction. Streaming services for public radio deserves special consideration because of the wide variety of
environments in which listeners may hear streams and because they can easily switch between streams of varying
program types.
As explained below, the current consistency of loudness between public radio streams is poor. This appears to be
due to multiple factors, including a lack of standards for digital audio transmission level, inattention to audio levels
that inadvertently get out of adjustment, and great variety in audio processing devices and the way they are
operated. At the same time, audio streams on the Internet unrelated to public radio operate across an enormous
range of audio levels, which presents issues for listeners who may switch to and from public radio streams.
Listeners may hear public radio streams in a variety of environments, from a noisy subway car to a quiet living
room. Those in noisier locations need tight control of dynamic range to hear every word of a talk show or
newscast, and every note of a symphony. However, the degree of loudness management necessary for noisy
listening conditions is entirely different than in a quiet room. Consequently, we present a solution that puts the
active loudness management in the player, where the listener can choose the dynamic range that’s suitable for
their environment and taste.
CURRENT EXPERIENCE
Figure 39 ‐ Audio samples of 49 public radio stations carrying NPR's Weekend Edition, Saturday; variation in level exceeds 21dB
Figure 39 is a screen shot of the program levels from 49 public radio station streams, all carrying the same
program: Weekend Edition, Saturday, on February 21, 2012. Each sample is more than 20 seconds, which affords
time to determine each stream’s level, which ranges by more than 21 dB. Listeners who switch between some of
these streams would hear changes in loudness large enough, according to our research, to be annoying or even
cause listener turn‐off. This is clearly a challenge for public radio’s success with Internet audio streams.

37
Figure 40 – Audio spectrogram of 49 public radio streams
Figure 40 shows a frequency spectrogram of the same 49 public radio streams carrying Weekend Edition Saturday.
The heights of the vertical bars show the highest frequency transmitted, from 43 Hz at the bottom, to 20 kHz near
the top, with 9991 Hz near the center. Colors indicate the amplitude, from red (highest amplitude) to dark green
(no energy). Several streams contain substantial energy up to 15 kHz, while several others roll off just above 5 kHz.
These variations are due to different bit rates for the streams, as well as different codecs. Listeners switching from
stream to stream will hear large variations in the quality and naturalness of speech and music.
Figure 41 ‐ Loudness of same audio samples as above (CBS Loudness Meter) in blue; orange bars show level variations after each sample was normalized according to its electrical peak values.
Figure 41 is a chart of loudness (measured by the CBS Loudness Meter) of the 49 public radio streams before and
after “peak normalization”. This technique adjusts the audio gain of each stream sample to produce the same
electrical peak level – a common practice, especially in the editing of digital audio, as the entire file can be
examined. However, this technique is also similar to most audio processors (compressor‐limiters), which adjust
their gain dynamically to produce a constant electrical peak level.
‐30
‐25
‐20
‐15
‐10
‐5
0
1 3 5 7 9 11 13 15 17 19 21 23 25 27 29 31 33 35 37 39 41 43 45 47 49
Original Audio Peak Normalized

38
The difference in height of the peak normalized (orange) bars to the original (blue) bars shows that despite peak
normalization, the loudness varies by up to 8 dB across the streaming samples. This demonstrates that even when
audio is “leveled” according to peaks, there can still be variations in loudness that could be unnatural, or even
annoying to listeners. We recommend that audio production implement an EBU 128/ITU‐R BS.1770‐2 loudness
measure, which imitates the way humans perceive loudness, rather than relying on electrical peak level alone.13
This is discussed further in the next section.
Even if the all the audio processors were the same and adjusted alike, they only provide uniform peaks – not
necessarily uniform impression of loudness. The television industry has developed automatic loudness controllers
for program audio, based around the International Telecommunications Union standard ITU‐R BS.1770‐2,
“Algorithms to measure audio programme loudness and true‐‐peak audio level”. This standard defines a loudness
measurement procedure that generally follows human hearing. It also has been used to build a system to regulate
loudness for broadcast and streaming applications. Following our report on tests of the tolerance of listeners to
loudness changes, we present recommendations that build on our results and current loudness measurement.
LOUDNESS CONTROL AND MANAGEMENT
PROGRAM LEVEL MEASUREMENT
To ensure live‐production streams are encoded with uniform program levels, the following procedures are
recommended, based on the scales in Figure 42:14
0 1 2 3‐15 ‐2
‐4
‐5‐7‐10‐20 ‐3 ‐1
‐8‐12‐16‐20 0 4
AlignmentLevel (+4 dBm)
MeasurementLevel (‐30 dBfs)
PermittedMaximum Level
IEC Type 1 PPM
IEC S VI (VU meter)
‐18 dBFS
‐9 dBFS
(‐12)
DigitalFull Scale(0 dBFS)
Figure 42 ‐ Alignment and maximum program levels for common meters based on ITU and EBU recommendations
13 Loudness normalization and permitted maximum level of audio signals, EBU Recommendation R128, Geneva
2011, and Practical guidelines for distribution systems in accordance with EBU R 128, EBU Tech 3344, Geneva,
October 2011.
14 This generally follows ITU‐R BS.1726, Signal level of digital audio accompanying television in international
programme exchange, and ITU‐R BS.645‐2, Test signals and metering to be used on international sound
programme connections.

39
For systems using an IEC Type 1 peak program meter for production, the PPM’s Permitted Maximum Level
(typically 0 dB on its scale) with a test tone is set 9 dB below the encoder’s Digital Full Scale (0 dBFS,
shown as the red vertical line to the right);
o Maximum program peaks will occasionally reach the 0 dB scale level, with 9 dB for unexpected
increases in program level;
o Lineup tone at 18 dB below Digital Full Scale would typically indicate at ‐9 dB on the meter scale;
o Measurement tones at ‐30 dBFS, for example for frequency response testing, would indicate
21 dB below Maximum Permitted Level;
For systems utilizing a ANSI VU Meter (IEC Volume Indicator), a tone a 0 VU indication is set 18 dB below
Digital Full Scale;
o Maximum program peaks will occasionally reach the 0 VU scale level, with‐18 dB of headroom
for peak overshoot and unexpected increases in program level;
o Measurement tones at ‐30 dBFS, for example for frequency response testing, would indicate
21 dB below Maximum Permitted Level.
To monitor the level of stream audio we recommend measurement with BOTH an IEC 60268 10 Type 1
meter for quasi‐peak electrical level, and an ITU R BS.1770 2 loudness meter. The first meter ensures that
the transmission waveform is not clipped and the second meter determines the instantaneous loudness.
LOUDNESS VALUES SHOULD BE THE TARGET, NOT PEAK LEVELS
Figure 43 shows a comparison between loudness‐normalized audio (normalized within a series of 20 to 30
second subsections) and the simultaneous electrical peak level. The loudness ranges around the
nominal ‐23 LUFS value, with a variance of a two or three dB. At one point of maximum loudness (around 400
seconds from the start), the electrical level (shown by the double arrow‐heads) is 9 dB above the loudness
Figure 43 ‐ ‐ Graph of loudness‐normalized audio and peak level
40
value. At about 340 seconds from the start, the maximum electrical peak is more than 20 dB above the
loudness at the same moment. If we had normalized according to the electrical peaks, it is clear that loudness
could be thrown off by many dB. Peak‐responding compressors and limiters do that by design. As discussed
earlier, the streaming system has headroom similar to the equipment used to produce programming: peak‐
controlling devices that affect the natural dynamics in program material are not required if the transmission
level plan of Figure 42 is observed.
For both program production and stream transmission, loudness of the program should be the primary
measurement – peak levels should only be observed to avoid clipping. The left side of Figure 44 illustrates
programming that is produced with peak metering,
post‐processed with peak liming and compression,
or peak‐normalized; the red line shows uniform
peak level from program to program. However,
the loudness, shown by the green line, varies up
and down. In the right panel, the loudness of each
program is evaluated and its gain is increased or
decreased to produce a nearly‐uniform result. The
electrical peaks have been shifted by the gain
changes, which produces non‐uniform levels. If
sufficient headroom is built into the system, the
upward displacement in peaks will not be a problem.
Figure 45 ‐ Orban Loudness Meter v 2.0.8, showing the measurement bars ITU BS.1770‐2 Short Term & Integrated (set to EBU +18 Relative scales) and Reconstructed Peak
For engineering work, an excellent free software meter that provides the specified and other metering standards is
the Orban Loudness Meter for Windows computers (http://orban.com/meter/). This software provides real‐time
Figure 44– Normalization by peak‐level versus loudness‐level

41
display as well as the ability to record the measurements to a CSV file for later analysis. It includes a
“Reconstructed Peak” meter that indicates the peak value following D/A conversion, which can cause clipping as
they may be higher than the digital samples before conversion. Caution is advised in using this meter with the
Windows XP operating system, as its calibration is affected by a combination of controls in Windows’ audio
mixer.15 The Orban meter is excellent for technical monitoring, but its window is large and cannot be resized or
simplified. We recommend the use of meters designed for audio workstations production editors that provide a
simpler loudness indicator, such as the examples in Figure 46 and Figure 47.
Figure 46 ‐ LevelViewS provides simple EBU/ITU loudness metering in live and integrated (long‐term) forms.
Figure 47 ‐ The NUGEN Audio VisLM‐H provides both real‐time and historical charting of audio levels.
LOUDNESS MONITORING AND NORMALIZATION OF STREAMS
15 For computers running the Windows XP operating system, it is very important to calibrate your meter device
through the Windows Wave I/O or Stereo Mix, to ensure accuracy and to prevent the sound device driver from
clipping. For Windows Vista and 7/8, the meter uses Windows Audio Session API (WASAPI) Loopback, which allows
the meter to monitor play out from any Windows Audio player application and eliminates the Wave I/O or Stereo
Mix requirements. Level calibration is unnecessary because the WASAPI Loopback is internally unity‐gain.

42
Stream validation, the process of monitoring audio streams for quality, can easily incorporate audio level
monitoring to ensure that audio is transmitted with acceptable ranges. There are several firms that do that
commercially, especially for audio that accompanies video. Fortunately, the need to manage loud commercials
while offering pleasing amounts of dynamic range had led to considerable development in video production and
transmission.16 There are tools available for real time monitoring and reporting of audio stream levels, such as the
product illustrated in Figure 51. This type of software could be used to spot audio level problems, while the
stream validations checks digital quality, metadata, and other aspects of each stream. We recommend that
automated loudness monitoring be included in the stream validation system. As discussed below, the
monitored levels provides information to adjust and normalize the audio transmission level of any streams that
To ensure a pleasant experience for listeners, the audio level of all streams should achieve a long‐term loudness
target of ‐23 LUFS.
Figure 48 ‐ Several minutes of jazz music; BS.1770‐2 loudness, peak and long‐term loudness are relative to 0 dBFS
Figure 48 shows several minutes of jazz music (running left to right) from an actual Internet stream, where 0 dBFS
is digital full scale. The chart provides ITU‐R BS.1770‐2 measurements collected by the Orban meter application:
16 In the U.S., in response to the CALM (Commercial Advertisement Loudness Mitigation) Act, the Advanced
Television Systems Committee established a study group to develop a “recommended practice”A/85 that includes
measurement, metadata insertion into audio streams and loudness management at the consumer’s television.
The Europeans formed the EBU Group “P/LOUD” and also developed extensive systems to monitor and control
audio program loudness. Their system is even more applicable to audio‐only transmission systems, and it is
already in use in Norway’s digital audio broadcasting system.
‐40
‐30
‐20
‐10
0
10
20
dB
BS.1770‐2Loudness
Max. LR Peak LRA(Dynamic Range)
Long‐term Avg.Loudness
‐23 LKFS
Jazz music sample with little dynamic compression, moderatedynamic range and close to nominal long‐term loudness

43
Peak level is shown in red;
Short‐term BS.1770‐2 loudness is dark blue;
Loudness target ‐23 LUFS is shown in yellow;
Average loudness is light blue;
Loudness range (LRA) is green; like average loudness, this measurement develops over time, but skips
silent intervals; this sample starts at 0 dB, rises and settles around 17 dB on the right.
This jazz sample shows loudness briefly exceeding ‐23 LUFS, but the long‐term average at far right is
about ‐25 LUFS, which is 2 dB below the target. However, peaks exceed the Permitted Maximum Level of ‐9 dBFS
on several occasions, which leaves too little margin to increase program level. The transmission level for this
program segment is considered satisfactory as‐is.
Figure 49 ‐ A 2‐minute section of relatively dynamic classical music
A passage of classical music is shown in Figure 49 according to the BS.1770‐2 measurements available with the
Orban meter. It displays larger variation than the jazz sample, but the long‐term average loudness also settles
about 2 dB less than the target loudness. Peak level frequently exceeds the Permitted Maximum Level, which
argues against an increase in program level. Classical programming may have very wide dynamic range, thus, a
long‐term average loudness objective of ‐23 LUFS should be adjusted downward if electrical peaks frequently
exceed the Permitted Maximum Level of ‐9 dBFS.
‐40
‐30
‐20
‐10
0
10
20
dB
BS.1770‐2Loudness
Reconstructedpeak
LRA(Dynamic Range)
Long‐term Avg.Loudness
‐23 LKFS
Approx. 2 minutes of highly‐dynamic classical music with minimal processing; long‐term average loudness is slightly below target and is a compromise with peaks that occasionally

44
Figure 50 ‐ Recommended ways to handle streams that are too loud or too soft
Figure 50 illustrates two actual audio streams and how their transmission levels should be adjusted to provide the
best experience for listeners. The stream on the left half is talk with heavy dynamic compression, as shown by its
peak level in red. The compression and limiting prevent the peaks from reaching maximum level (0 dBFS), but it
also has an average loudness of approximately ‐14 LUFS, which is 9 dB above the target loudness of ‐23 LUFS.
(Note that the dynamic range, indicated by LRA, in green, is about 8 dB.)
The audio stream on the right is talk with less dynamic compression, with peaks reaching ‐10 dBFS, and an average
loudness of approximately ‐27 LUFS. This stream could be increased in transmission level by 3 dB without driving
peak levels too close to the maximum. For the short interval used for this demonstration, this stream has a
dynamic range of approximately 12 dB. While this stream would momentarily vary in loudness because of its more
“open” dynamic sound, its long term loudness would be comparable to the denser audio sample on the left, when
both are adjusted toward the ‐23 LUFS target, as shown by the yellow arrows. While the loudness of the first,
highly compressed stream is reduced, this approach is the only way to ensure that listeners are not annoyed by
jumps in loudness from stream to stream.17
17 There are many of articles discussing the growing concern of the so‐called “loudness war” in publicly‐distributed
audio. Examples of thoughtful papers are: The Loudness War: Background, Speculation and Recommendations,
Earl Vickers, AES 129th Convention, 4 November 2010; Loudness normalisation and permitted maximum level of
audio signals, EBU Technical Recommendation R128, European Broadcasting Union, http://tech.ebu.ch/loudness,
2010; .The Loudness Wars: Why Music Sounds Worse, NPR Music, 31 December 2009; Norway’s DAB network
embraces loudness normalization, Bjørn Aarseth, EBU Technical Review, 13 February 2012.
‐40
‐30
‐20
‐10
0
10
20
dB
BS.1770‐2Loudness
Reconstructedpeak
LRA(Dynamic Range)
Long‐term Avg.Loudness
‐23 LKFS
‐9
+3
Stream with heavy dynamic compression and high loudness
Stream with less dynamic compression and lower loudness

45
BATCH NORMALIZATION OF AUDIO LOUDNESS FOR FILES AND PODCASTS
The job of loudness management, file by file, can be automated with existing software. One example is
LevelOne™, developed by Grimm Audio (http://www.grimmaudio.com/pro_software_levelone.htm). This
program can serve as part of an ingest system, which, according to Grimm, analyzes files up to 100 times faster
than real time, normalizing programs or program segments before transmission or assembly into larger programs.
Figure 51 shows the LevelOne window in use by number of NRK program files carried by Norway’s Digital Audio
Broadcasting system.
Figure 51 ‐ Example of a commercial batch file processor, made by LevelOne, for file loudness normalization
Another loudness management system is the AudioTools™ Server for file‐based workflows
(http://minnetonkaaudio.com/). The developer states that this product includes a “dialog anchoring” technique
that produces more consistent speech levels, even surrounded by music or sound effects. (These are techniques
developed for video production, although they may have application in public radio programs with mixed speech
and other sound content.)
An open source solution is FreeLCS (Loudness Correction Server) http://freelcs.sourceforge.net. This free software
is set up on a network server where users can drop audio files to be loudness corrected. The software creates
graphic files that display the internal loudness variations in a file. Loudness‐corrected versions of each file are
moved to a “HotFolder” for later transmission. The program supports encoded file formats and uses a protective
limiter to prevent peak levels from clipping where the volume must be increased. The software is written in
Python 3 which allows modifications and integration with other programs and runs on Ubuntu Linux.
LOUDNESS LEVELS RELATIVE TO OTHER INTERNET STREAMS
The Internet is open territory as far as stream loudness is concerned. An increasing number of stream operators
are compressing their program content and operating peaks close to maximum level. Even in two of three streams
of the BBC, dynamic compression is evident: Figure 52 shows sample clips from Radio 3 (classical), Radio 2 (adult
contemporary) and Radio 1 (Top 40). The vertical scale is dB relative to digital full scale (for the red and blue
traces) and the ITU BS.1770‐2 loudness scale, dBLK, for the green trace.

46
Figure 52 ‐ Samples from BBC Internet audio streams: Radio 3, Radio 2 and Radio 1 (1 minute total)
In this case study, Radio 2 and 3 were engaged in talk during the 15 to 20‐second samples. The classical music at
the time was a light orchestra rendition, with peaks just below ‐15 dBFS and loudness of about ‐35 to ‐25 dBLK.
This approximates the loudness of a public radio stream, transmitted at the level standards described earlier
(Permitted Maximum Level of ‐9 dBFS and target loudness of ‐23 dBLK).
By comparison, the Radio 2 and 3 segments are compressed, raising electrical peaks within 2 dB of full scale, and
loudness in a tight range between ‐15 and ‐11 dBLK. Of course, they sound substantially louder than the Radio 3
program, which raises an issue as to whether public radio should compete with loud streams.
Active loudness management in the stream players is recommended, by putting a limit on program audio that
exceeds a nominal level (the recommended loudness in EBU R128 is ‐23 dBLK). In this case study, classical music
would be unaffected by a threshold at ‐23 dBLK, but the Radio 2 and Radio 3 programs would be “turned down” by
the loudness management software in the player. The software may also be programmed to reduce the range of
program material with wide variations while also preventing “blasting” of loud program material (streams that are
not compliant with EBU R128).
If transmission level must be raised, and lacking loudness management on the consumer side, a process that has
the least impact on program dynamics is to: (1) produce to target level (‐23 dBLK) as usual; (2) limit peaks
at ‐9 dBFS; and (3) apply a gain increase of ”n” dB (n << 9 dB).

47
STREAM SERVER
The computer supplied to stations for stream encoding is a SuperChassis 512L‐260B, made by Super Micro
Computer, Inc. (http://www.supermicro.com/products/chassis/1u/512/sc512l‐260.cfm). It is a 1RU rack mount
unit running an Intel® processor and C602 chipset with 4GB of memory and two 1TB hard drives. The
motherboard expansion slot supports one PCI‐E 3.0 x 16 full‐height half‐length card, which lays horizontally
because of the low form‐factor of the cabinet.
PRESENT AUDIO CARD
For audio input, NPR Digital Media selected an E‐MU®‐0404
PCI audio card made by Creative Technology Ltd.
(http://us.store.creative.com/EMU‐0404‐
PCI/M/B00064YZVK.htm). The card is one of the highest
performance products developed for the consumer audio
market, using 24‐bit 192 kHz A/D converters and DSP
hardware acceleration effects to minimize CPU load. As a
consumer product, the card, shown in Figure 53, is supplied
with dongle adapters that interconnect the card frame to
standard consumer connectors. The analog (DB‐9) and
digital (DB‐15) audio connectors are detailed in Figure 54.
The audio lines extend to unbalanced input and output
connectors operating at ‐10 dBu. Digital input and output is extended to optical and unbalanced coaxial operating
at S/PDIF signal level (0.5 V p‐p). The product is furnished with PatchMix DSP™ software for Windows computers
that provides a comprehensive array of audio mixing and processing effects.
The consumer analog and digital levels can present a problem for stations, which
typically operate balanced analog audio lines at substantially higher levels.
Professional users must also convert from balanced to unbalanced audio at the card
to avoid hum and noise. These conversions also increase difficulty with standardizing
transmission levels and providing proper headroom at the card’s A/D converter.
Also, stations use professional connectors, such as XLR to interface analog or digital
audio equipment. Stations also may use AES‐EBU digital lines to interconnect audio
equipment. While the protocol for S/PDIF and AES digital audio are compatible, AES
operates at a higher voltage and is usually a balanced connection. These differences
could lead to reliability issues with the audio interface.
NPR Labs investigated a variety of professional audio interface cards to replace the
EMU‐0404, but the cost would be far beyond what was budgeted, and NPR had
already purchased a large number of the consumer cards. As a solution for stations
and NPR, NPR Labs recommended an interface box be supplied to stations. No off‐
the‐shelf box was available, so we designed a custom box built locally by Excalibur
Figure 53 ‐ E‐MU 0404 card with dongles attached
Figure 54 ‐ Audio connectors on card bracket
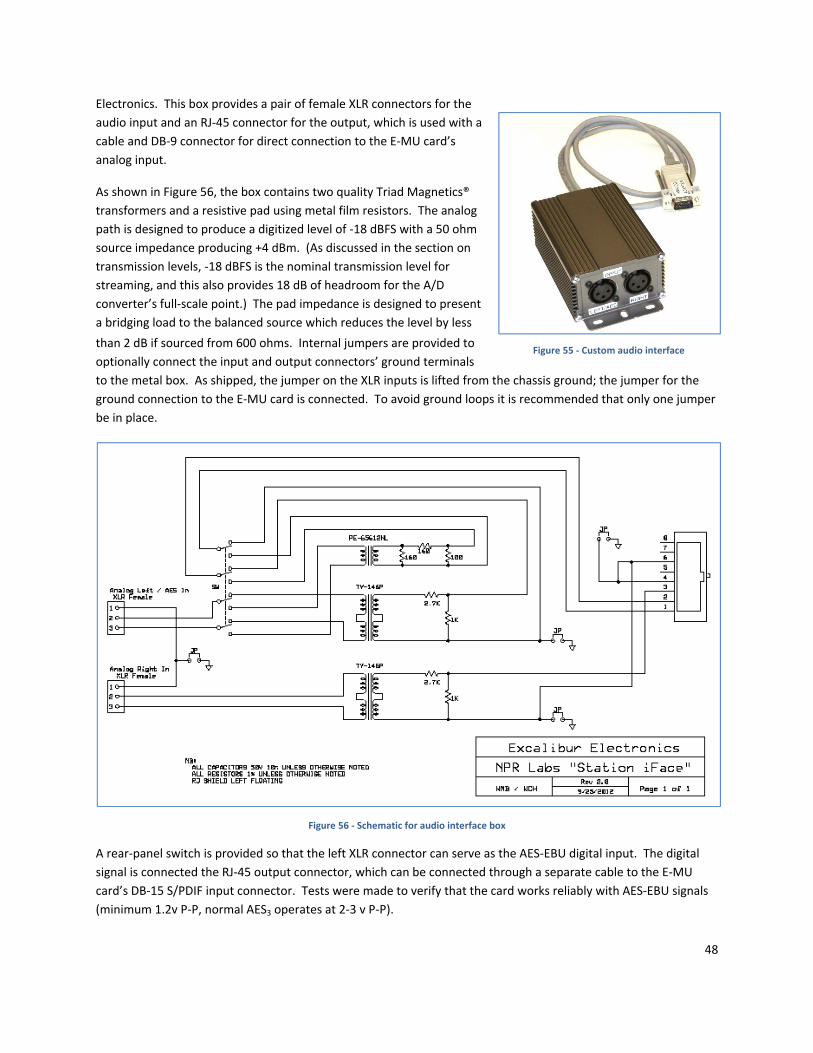
48
Electronics. This box provides a pair of female XLR connectors for the
audio input and an RJ‐45 connector for the output, which is used with a
cable and DB‐9 connector for direct connection to the E‐MU card’s
analog input.
As shown in Figure 56, the box contains two quality Triad Magnetics®
transformers and a resistive pad using metal film resistors. The analog
path is designed to produce a digitized level of ‐18 dBFS with a 50 ohm
source impedance producing +4 dBm. (As discussed in the section on
transmission levels, ‐18 dBFS is the nominal transmission level for
streaming, and this also provides 18 dB of headroom for the A/D
converter’s full‐scale point.) The pad impedance is designed to present
a bridging load to the balanced source which reduces the level by less
than 2 dB if sourced from 600 ohms. Internal jumpers are provided to
optionally connect the input and output connectors’ ground terminals
to the metal box. As shipped, the jumper on the XLR inputs is lifted from the chassis ground; the jumper for the
ground connection to the E‐MU card is connected. To avoid ground loops it is recommended that only one jumper
be in place.
Figure 56 ‐ Schematic for audio interface box
A rear‐panel switch is provided so that the left XLR connector can serve as the AES‐EBU digital input. The digital
signal is connected the RJ‐45 output connector, which can be connected through a separate cable to the E‐MU
card’s DB‐15 S/PDIF input connector. Tests were made to verify that the card works reliably with AES‐EBU signals
(minimum 1.2v P‐P, normal AES3 operates at 2‐3 v P‐P).
Figure 55 ‐ Custom audio interface

49
The lowest sample rate for the preselected audio interface card (Creative E‐MU 0404) is 44.1 kHz, which is the
recommended rate for music. If it were available in the present configuration, we would recommend a rate of
32 kHz for streams with primarily news and information programming. This would avoid quantization of the audio
spectrum that is unnecessary for this genre, thereby providing a small improvement in codec efficiency. However,
if a future codec with a vocoder is employed, this sample rate change may be unneeded.
PATCHMIX DSP CONFIGURATION
The Creative E‐MU cards require proprietary software, called “PatchMix DSP” to operate. When installed, the
software bypasses the standard Windows audio mixer and provides a digital PCM audio connection directl stream
encoding software as “Line In (Legacy Mode)”. The operation of the Windows audio mixer, the Realtek ALC662
audio chip on the motherboard, and its interface software are unaffected; they may be used simultaneously as a
second audio input or as an audio bridging monitor of the E‐MU PCM output, supplied to the 3.5mm jack on the
rear panel.
Figure 57 ‐ PatchMix DSP window (left) and Winamp SHOUTcast window (right)
The PatchMix DSP software loads automatically at startup, along with the Winamp player and its associated
SHOUTcast DSP plugin, which provides the stream encoding. (This applies only to streams not using the Triton
Digital “Ad Insertion” streaming software.)

50
Figure 57 shows the recommended configuration for PatchMix DSP, with two input “modules”: one for S/PDIF
digital input and one for analog L/R input on the E‐MU 0404 card. The modules provide six inserts each for special
features. The S/PDIF module’s top insert is a small bar graph peak level indicator, followed by a DSP‐based
COMPRESSor/limiter. The analog is also configured with a bar graph indicator, followed by a TIRM_POT gain
control, and then a SEND insert, which routes the module’s output to the computer’s PCM audio feeding the
encoding card. Only one SEND can be inserted, which serves as a ‘toggle switch’ for either digital audio input or
analog input. The TRIM_POT insert was clicked, which put a yellow box around it and displays information about
the insert: in this case a larger bar graph indicator in the “video” screen.
The TRIM_POT screen includes a gain control, which is set to 0.0 dB. In this case, a +4 dBu input on analog left
channel produces ‐18 dBFS on the video screen’s bar graph indicator. The SHOUTcast encoding software is set to
receive the PCM audio from PatchMix (“Line In”), which produces a ‐18 dB indication on the encoder’s bar graph
indicator. Note that maximum peaks would occasionally reach ‐9 dB on the encoder, which provides 9 dB of
headroom. This is the nominal level setup for transmission.
TRITON DIGITAL AD‐INSERTION SOFTWARE
To support an audience measurement and ad‐management solution for public radio streams, NPR plans to work
with Triton Digital (formerly Ando Media) on a digital sponsorship system. The system would use the stream
server hardware, described above, along with Triton media automation software to insert sponsorship
announcements.
The Triton documentation specifies that two sound cards are required: one for the external audio input and a
second to provide the internal announcement files.18 However, the SuperServer computer selected by NPR
physically supports only a single PC card, such as the E‐MU 0404 audio soundcard.19 The Realtek ALC662 audio
chip on the computer motherboard can provide the announcement file playback.20 As the announcement files are
played digitally, the audio is passed digitally through the Realtek chip and no degradation in quality occurs.
However, there is no provision in the Triton software to automatically adjust the loudness of recorded
announcements. This is a potential problem for uniform transmission loudness, as the announcements are
produced elsewhere under differing level standards, possibly including dynamic compression. Ideally, Triton
should upgrade its software to adjust announcement playback levels to match the external (station) audio, in
accordance with EBU R128. Lacking that, implementation of active loudness management in the playback
18 Ando Media Installation Client Requirements and Preparation, Ando Media Group, March 2, 2011.
19 We understand from Triton engineers that their ad‐insertion software was written with the intention of using
the Orban Optimod PC 1101 audio card (now the Optimod‐PC 1211e), which supports external and ad‐insertion
audio. This is a relatively large increase in cost for the stream server and, if on‐card audio processing is used to
control announcement levels, would also dynamically compress the station program audio, which we discourage.
20 We have tested the on‐board chip for operation with the E‐MU card, however, we did not have access to the
announcement files to verify operation the Triton ad‐insertion software. We are advised by Trition’s technical
support that the motherboard audio chip should be compatible with their software.

51
software, as discussed earlier, can effectively moderate undesired changes in loudness as announcements are
inserted. Currently, the Triton software also can support only one stream per server, which prevents dual‐
streaming at different bit rates or with different codecs.
AUDIO CARD REPLACEMENTS
The E‐MU 0404 product is discontinued, and Creative has no direct replacement for the model. NPR Digital Media
followed our advice and purchased some remaining cards at dealers. However, there is a need to identify a long‐
term replacement for this card as additional computers are implements or old cards fail. The Optimod‐PC 1211e
card is a candidate, which offers the capability to mix the external audio input and the internal audio for Triton “ad
insertion” software. (Triton officials noted that their software was written with the intention of using the
Optimod‐PC card, which also includes a professional audio compressor/limiter.) However, the Optimod‐PC card
costs several times more than the E‐MU card, even with the audio interface.
The search for a solution to the present card’s consumer input gave us a perspective on the direction of PC audio
interfaces. In our view, audio engineers are moving away from PC card implementations, and it was apparent that
the choices of these cards has quickly diminished over the past couple of years, in favor of external audio
interfaces with USB interconnection to the PC. USB audio interfaces are quite plentiful, have very high audio
quality and could permit more than one audio input to the computer.
There is some concern about whether USB devices are reliable enough, especially when the computer is rebooted:
does it automatically restart the audio interface every time? Also, questions have been raised about the possibility
of interruptions to the audio data through the USB port as other devices use the port or computer’s hardware data
bus. These are questions on which we recommend further study for future growth, and before the supply of E‐MU
PC cards runs out.
CAUTIONS FOR THE SOFTWARE ENCODER
The stream encoding software selected by NPR Digital Services is the Nullsoft’s Winamp Standard media player
with the SHOUTcast DSP plugin for stream encoding. This software, currently in version 5.63 for the player, is
available as a free download at www.winamp.com. There are some uncertainties with using freeware for a large‐
scale streaming project such as NPR’s:
Correcting errors in the software, or answering difficult questions may be difficult without technical
support that is under contractual obligation to NPR;
The software is designed for use by individual users who undertake their own local downloads, which may
make updates to the software across hundreds of remote computers more cumbersome;
Modern audio codecs are under continual improvement, and new versions are issued from time to time
that should be used; the updates may not be apparent to NPR and more difficult to push out to large
numbers of remote computers.
Fortunately, Winamp has a large user base and online community. (There is a “Pro” version of the software that
promises technical support for customers, but a question emailed to them has remained unanswered after 10
days.) It is possible that others will identify software issues quickly, which technical support may correct on behalf
of the community, and some technical questions may be answered by experts in the community.

52
ACKNOWLEDGEMENTS
The authors appreciate the assistance and contributions of the following individuals and companies:
Jan Nordmann, Max Neuendorf, and Nikolaus Rettelbach, Fraunhofer Institute
Claude Gravel, VoiceAge Corporation
Towson University, Towson MD
Bob Orban and Greg Ogonowski, Orban
Michael Byrnes and William Harrison, Excalibur Electronics
Staff of the NPR Audio Engineering Department
The members of the Codec Evaluation Project Advisory Group