2013 annual project report -...
TRANSCRIPT
2013 Annual Project Report
Published as an JndustJy Swice by th~ Mm1~~ of the California Tomato RFStarch Institute, Jnc.
California Tomato Research Institute ~ 2013 Annual Report
2013 ANNUAL RESEARCH REPORT
INTRODUCTION
Welcome, this report marks the 45th year of continuous crop research sponsored by California processing tomato growers. This report presents research funded by the contributing growers of the California Tomato Research Institute, Inc. For 2013 this full report will be only available in electronic form, however summary reports will be available at industry meetings, events and www.tomatonet.org.
It is our goal to provide useful timely information, geared to assisting growers in both daily production decisions and long term crop improvement. The Institute Board of Directors continues to support a broad range of projects, addressing both current problems and long range concerns.
INDEX OF RESEARCH PROJECT REPORTS BY CATEGORY
Agronomic Projects Page
Influence of deficit irrigation on soil quality and processing tomato performance Tom Turini 1
Design and investigation of water use efficient and ‘climate smart’ risk management cropping systems for tomato in the Central Valley Jeff Mitchell 15
Evaluation of irrigation practices on water use, soil salinity, and tomato productivity in the Delta
Brenna Aegerter 21
Effect of mycorrhizal inoculants and plant flavonoid inducers on processing tomatoes Kate Scow 27
California Tomato Research Institute ~ 2013 Annual Report
Breeding, Genetics & Variety Development Projects
Statewide Variety Trials Brenna Aegerter 35
Tomato Genetics Resource Center Roger Chetelat 46
Fruit yields with less water: beneficial genes from wild tomato Dina St.Clair 62
Disease Management Projects
Tomato Spotted Wilt Virus (TSWV) Analysis and Management Robert Gilbertson
64
Harvester / Equipment Movement of Fusarium Oxysporum Gene Miyao 75
Influence of Drip Irrigation on Tomato Root Health Mike Davis 77
Screening Germplasm for Resistance to Bacterial Speck and Monitoring P. s Strains Gitta Coaker 86
Management of RK Nematodes With Novel Nematicides Ole Becker 92
Genome sequencing of the bacterial canker pathogen, to develop robust detection and disease control strategies. Gitta Coaker 99
Genomics Study of Tomato Powdery Mildews Ioannis Stergiopoulos
103
Weed Management Projects
Field Bindweed Management in Processing Tomatoes Lynn Sosnoskie 107 Evaluating Herbicide Carryover in Sub-surface Drip-irrigated Tomatoes Kurt Hembree 124
Field Bindweed Management in Drip Irrigated Processing Tomatoes
Scott Stoddard 130
2013 Officers, Directors and CTRI Members
California Tomato Research Institute ~ 2013 Annual Report
Officers Rick Blankenship Huron Chairman
Mark Cooley Dixon Vice Chairman Dino Del Carlo Stockton Secretary/Treasurer District Directors Bryan Barrios Yolo
Darryl Bettencourt Corcoran
Daniel Burns Dos Palos
Frank Coelho Five Points
Mark Cooley Dixon
Dino Del Carlo Stockton
Scott Houlding Cantua Creek
Cannon Michael Los Banos
Scott Park Meridian
Ray Perez Crows Landing
Kent Stenderup Arvin
Directors at Large Rick Blankenship Huron
Brett Ferguson Huron
Tony Turkovich Winters
CTRI Members Sacramento Valley
Amistad Ranches Walnut Grove
George Aoki Farms. Inc. Woodland
K & D Aoki Woodland
Barrios Farms Inc. Yolo
Steve Barsoom Walnut Grove
Dan Best Ranch, Inc. Woodland
Jim Borchard Woodland
Bullero Farms Woodland
Bullseye Farms Woodland
Button and Turkovich, LLC Winters
Casa Lupe Farms, Inc. Colusa
Chan Farms Courtland
Dettling Farms Woodland
Dougherty Bros. Robbins
E and H Farms Dixon
E and J Farms, Inc. Woodland
Emerald Farms Maxwell
F & F Company Walnut Grove
Fong Farms, Inc Woodland
R.C. Gill and Son Dixon
Harlan Family Ranch Woodland
T.A. Hatanaka Farms Woodland
Hunn, Merwin and Merwin, Inc. Clarksburg
J & P Farms Esparto
Kidwell Farms Davis
K.L.M. Ranches, Inc. Elk Grove
La Grande Farms Inc. Williams
Matt La Grande Farms Williams
Los Rios Farms Davis
William Maupin Farms Williams
Mayflower Farms, Inc. Arbuckle
J.H. Meek and Sons Woodland
Joe Muller & Sons Woodland
Mumma Brothers Arbuckle
Myers Seed Colusa
Nakahara Farms Clarksburg
C&M Ochoa Woodland
Ornbaun Farms Arbuckle
P & C Farming Williams
2013 Officers, Directors and CTRI Members
California Tomato Research Institute ~ 2013 Annual Report
Scott Park Farming Meridian
Payne Brothers Ranches Knights Landing
Quad H Ranch, Inc. Robbins
Sam Reynolds Farm Williams
Richter Bros. Inc. Knights Landing
River Vista Farms Colusa
Gene Robben Farms Dixon
Roma Farms Robbins
Rominger Brothers Farms Winters
D.A. Rominger & Sons Winters
Schreiner Farms Inc. Woodland
Silverdale Farms Clarksburg
T & P Farms Arbuckle
Tanaka Farms Inc. Woodland
Dustin Timothy Farms Dixon
Ronald Timothy Farming Dixon
TOMCO Woodland
Triad Farms Davis
Two M Enterprises Dixon
Van Ruiten Bros. Robbins
Vann Bros. Farms Williams
Viguie Farming Winters
Wallace Brothers Meridian
Joe Yeung Farms West Sacramento
CTRI Members San Joaquin & Stanislaus
Alvarez Farms Inc. Tracy
Arnaudo Bros Inc. Tracy
Steve Arnaudo & Sons Tracy
Allen Baroni Farms Thornton
Bayes Ranch Patterson
Matthew R Boulware Salida
Cerri and Son Stockton
Cerutti Bros. Newman
Cox and Perez Westley
Cox Farms Patterson
Del Carlo Farms Stockton
Del Mar Farms Patterson
Del Terra Farms, LLC Tracy
Delucchi Farms Stockton
John Dondero Farm Linden
Fantozzi Farms Patterson
G.G. Orchards Linden
Jerry Goubert Farms Westley
Holdener Ranches Stockton
K and H Farms Tracy
Lagorio Brothers Linden
Michael Lara Farms Patterson
Lassen Farms Stockton
J. Lombardi Farms Stockton
F A Maggiore & Sons Brentwood
Rich Marchini Farms Stockton
Jon Maring Farming Westley
Mizuno Farms Inc. Tracy
L & R Mussi Farms Stockton
Ronald Nunn Farms Brentwood
Pat Crow Farms Tracy
Patterson Westside Farms Patterson
Perez Farms - Crows Landing Crows Landing
Perez Farms - Westley Westley
George Perry & Sons, Inc. Manteca
2013 Officers, Directors and CTRI Members
California Tomato Research Institute ~ 2013 Annual Report
Greg Pombo Farms Tracy
Hal Robertson Farms Tracy
S4 Farms, Inc. Ripon
J & R Sanguinetti Ranch Linden
Sarale Farms, Inc. Stockton
Simoni & Massoni Farms Byron
T & M Farms Westley
Toso Brothers Stockton
Trinta Brothers Patterson
Victoria Island Farms Holt
Yamamoto Farms Westley
D & B Yrigoyen Lathrop
Merced, Fresno & Coastal Valleys
A-Bar Ag Enterprises Los Banos
Abbate Farms Merced
Anderson Farms, LLC Huron
B & T Farms Gilroy
Beene Farms Helm
J. F. Bennett Ranch Firebaugh
Borba Farms, Inc. Riverdale
Bowles Farming Company Los Banos
Britz Inc. Fresno
Burford Company Fresno
Burford Family Farming Co. Fresno
Cantua Farms Fresno
Casaca Vineyards Five Points
Clark Bros. Farming Clovis
Coelho East Five Points
Coelho South Five Points
Coelho West Five Points
Daddy’s Pride Farming El Centro
N.F. Davis Drier & Elevator Firebaugh
W. C. Davis Farms Firebaugh
William Deidrich Farms Firebaugh
Del Bosque Farms Los Banos
J. Diedrich Farms Firebaugh
Dresick Farms, Inc. Huron
Dust Bowl Farms LLC Coalinga
Errotabere Ranches Riverdale
Ferguson Farming Company Lemoore
Filice Farms LP Hollister
Five Points Ranch, Inc. Five Points
Fortune Farming Company Fresno
Fundus Farms Mendota
G & H Farms Five Points
Graham Farming Kerman
Greenfields Turf, Inc. Greenfield
Hammonds Ranch Firebaugh
Harris Farms Inc. Coalinga
Houlding Farms Inc. Fresno
Gary Hughes Farms Kerman
J & J Farms Firebaugh
Lucero Farms Los Banos
D. & V. McCurdy Farms Firebaugh
Robert McDonald Farms Los Banos
McKeen Farms, Inc. Riverdale
Motte Ranches, Inc. San Joaquin
Nickel Family LLC Dos Palos
Obata Farms Gilroy
Mick Oliveira Farms Hanford
OPC Farms, Inc. San Joaquin
2013 Officers, Directors and CTRI Members
California Tomato Research Institute ~ 2013 Annual Report
P.L. Ferry Cooperative, Inc. Five Points
Ralph Palazzo & Co., Inc. Los Banos
Perez Ranches Firebaugh
Polder Bros. Farms Lemoore
Pucheu Bros. Ranch Tranquility
Red Rock Ranch, Inc Five Points
Refco Farms Spreckles
San Andreas Farms Brentwood
Sano Farms, Inc. Firebaugh
R.A. Sano Farms, Inc. Firebaugh
Scoto Brothers Farming, Inc. Merced
J.O. Seasholtz Farms Fresno
SJR Farming Los Banos
Steve Smith Farms Madera
Solo Mio Farms Lemoore
Teicheira Farms Los Banos
Terra Linda Farms Riverdale
Terrranova Ranch, Inc. Helm
Allen Thomsen Farming Firebaugh
Teixeira & Sons Dos Palos
Valley Pride Huron
Vaquero Farms Stockton
Ventura Farms, Inc. Gustine
Westside Harvesting Cantua Creek
Will-Shar Farms Merced
Woolf Enterprises Huron
Worth Farms Coalinga
Regents of Univ. CA WREC Five Points
CTRI Members King, Kern & South
Badger Creek JV Buttonwillow
J.G. Boswell Company Bakersfield
Cauzza Ag Partners Buttonwillow
Dalena Farms, Inc. Madera
Esajian Farming Co. Lemoore
F & F West Lemoore
Fabbri Farms Bakersfield
Freitas Ranch Hanford
Opal Fry and Son Bakersfield
Grimmway Farms Bakersfield
Gary Icardo Farms Bakersfield
Island Farms LLC Visalia
Jerry Slough Farming Co. Buttonwillow
Jones Farms Stratford
Materra Farming Company, LLC Bakersfield
Newton Farms Stratford
Sheely Farms Lemoore
Stenderup Ag Partners Bakersfield
John Stewart Farms Lemoore
Stone Land Co. Stratford
SVI Farming Hanford
Donald Valpredo Farms Bakersfield
WAY Farms Bakersfield
Westlake Farms Stratford
Wilson Farms lemoore
California Tomato Research Institute ~ 2013 Annual Report 1
Project Title: Irrigation and Salinity Management for High Yielding Processing Tomato Systems Project Leaders: Tom Turini, Dan Munk, Jon Wroble and Devon Rodriguez University of California Cooperative Extension Steve Grattan
University of California, Davis, Department of Land Air and Water Resources
Abstract: Influence of irrigation reductions on drip-irrigated processing tomato yield and quality were assessed in Fresno County from 2010 to 2012. The irrigation regimes compared in the study were the following: a) the grower treatment, which is ET + 10%; b) same as a until 60 days before projected harvest, then, 80% ET to 30 days before the projected harvest and 60% for the remainder of the season; c) same as b, but 60% ET imposed from 60 to 30 days before projected harvest and 40% ET for the remainder of the season. The irrigation water used throughout the study was high quality surface water. Drip tape was not changed during the study and the beds were only tilled to a depth of 4 to 6 inches. Each bed within the study received the same irrigation treatment during this study. Yields as determined by mechanical harvest of the trial areas were high over all three years and unaffected by the irrigation treatments, with the exception of a 5.26 ton/acre reduction in yield in the plots with the most severe irrigation reduction in 2012. Hand sorts and laboratory analysis of sub-samples showed that treatments had no significant influence on fruit quality. Substantial quantities of sub-surface moisture were mined during all seasons, which contributed to the overall good condition of these crops. When applied water + rainfall were considered, there was a significant negative correlation between water quantities and salinity accumulation. Because the field was irrigated with high quality district water, the additional drip-applied water may have aided in salinity management. However, while there was a numerical decrease in soil salinity, variability was very high so no significant reduction in electrical conductivity or chloride was observed. Furthermore, the position of increased salinity levels within the soil profile was often associated with the center of the bed at depths of 13 to 24 inches, which could present challenges for the crop. While a drip-applied leaching fraction with high quality water may aid in salinity management, based on this work, it is not advisable to use as the only tactic for addressing this issue. Introduction: Water, particularly high quality water, is a limited resource in some very productive processing tomato production areas. In the Westlands Water District, the largest of several districts in which a large amount of processing tomatoes are produced, availability of high quality water has historically been punctuated by shortages and the need for the use of lower quality ground water. In many Central California water districts, high quality water was available to growers in much greater quantities in 2010 and 2011 than in the 2008 or 2009 tomato seasons, which was then followed by extreme reductions in availability in 2012 and 2013. Water shortages drove the processing tomato grower to increase capacity by using well water to meet crop water needs.
California Tomato Research Institute ~ 2013 Annual Report 2
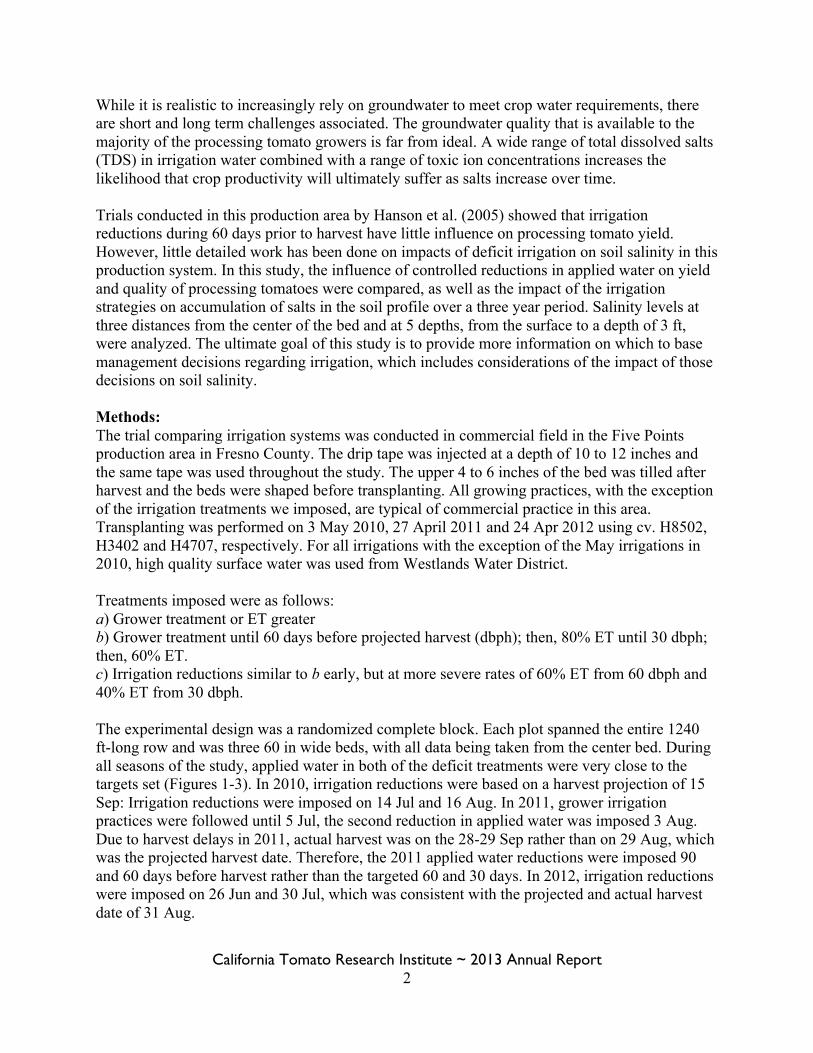
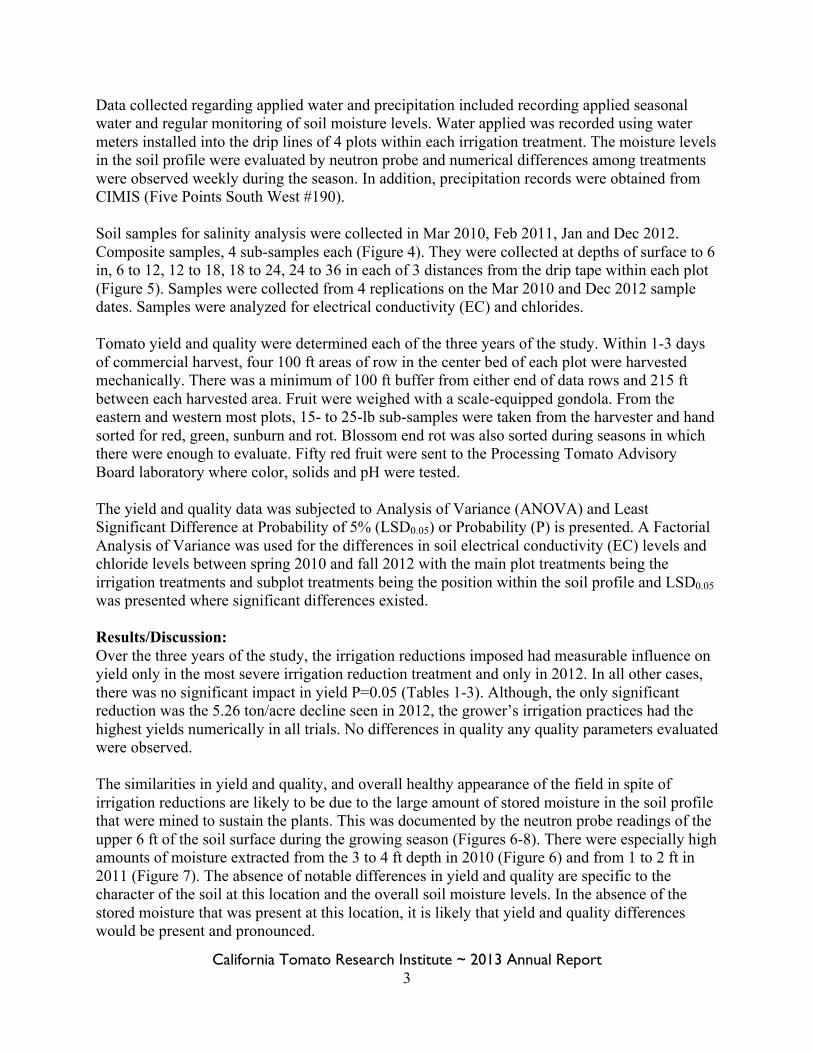
While it is realistic to increasingly rely on groundwater to meet crop water requirements, there are short and long term challenges associated. The groundwater quality that is available to the majority of the processing tomato growers is far from ideal. A wide range of total dissolved salts (TDS) in irrigation water combined with a range of toxic ion concentrations increases the likelihood that crop productivity will ultimately suffer as salts increase over time. Trials conducted in this production area by Hanson et al. (2005) showed that irrigation reductions during 60 days prior to harvest have little influence on processing tomato yield. However, little detailed work has been done on impacts of deficit irrigation on soil salinity in this production system. In this study, the influence of controlled reductions in applied water on yield and quality of processing tomatoes were compared, as well as the impact of the irrigation strategies on accumulation of salts in the soil profile over a three year period. Salinity levels at three distances from the center of the bed and at 5 depths, from the surface to a depth of 3 ft, were analyzed. The ultimate goal of this study is to provide more information on which to base management decisions regarding irrigation, which includes considerations of the impact of those decisions on soil salinity. Methods: The trial comparing irrigation systems was conducted in commercial field in the Five Points production area in Fresno County. The drip tape was injected at a depth of 10 to 12 inches and the same tape was used throughout the study. The upper 4 to 6 inches of the bed was tilled after harvest and the beds were shaped before transplanting. All growing practices, with the exception of the irrigation treatments we imposed, are typical of commercial practice in this area. Transplanting was performed on 3 May 2010, 27 April 2011 and 24 Apr 2012 using cv. H8502, H3402 and H4707, respectively. For all irrigations with the exception of the May irrigations in 2010, high quality surface water was used from Westlands Water District. Treatments imposed were as follows: a) Grower treatment or ET greater b) Grower treatment until 60 days before projected harvest (dbph); then, 80% ET until 30 dbph; then, 60% ET. c) Irrigation reductions similar to b early, but at more severe rates of 60% ET from 60 dbph and 40% ET from 30 dbph. The experimental design was a randomized complete block. Each plot spanned the entire 1240 ft-long row and was three 60 in wide beds, with all data being taken from the center bed. During all seasons of the study, applied water in both of the deficit treatments were very close to the targets set (Figures 1-3). In 2010, irrigation reductions were based on a harvest projection of 15 Sep: Irrigation reductions were imposed on 14 Jul and 16 Aug. In 2011, grower irrigation practices were followed until 5 Jul, the second reduction in applied water was imposed 3 Aug. Due to harvest delays in 2011, actual harvest was on the 28-29 Sep rather than on 29 Aug, which was the projected harvest date. Therefore, the 2011 applied water reductions were imposed 90 and 60 days before harvest rather than the targeted 60 and 30 days. In 2012, irrigation reductions were imposed on 26 Jun and 30 Jul, which was consistent with the projected and actual harvest date of 31 Aug.
California Tomato Research Institute ~ 2013 Annual Report 3
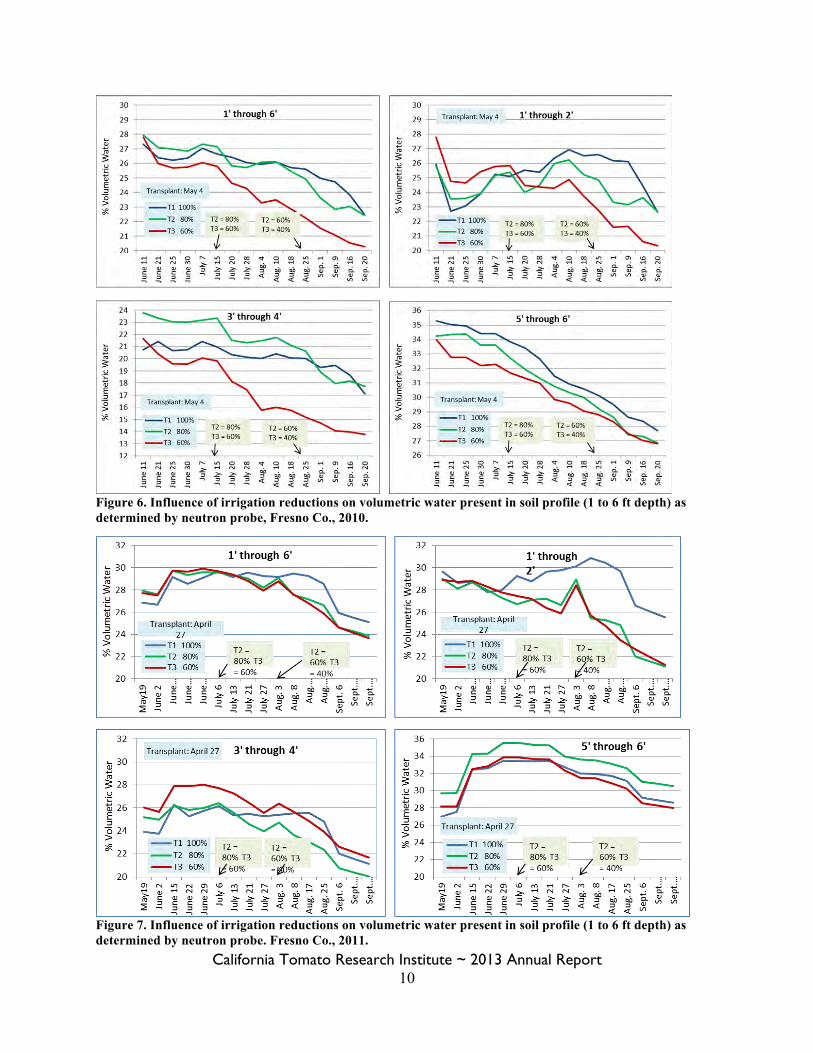
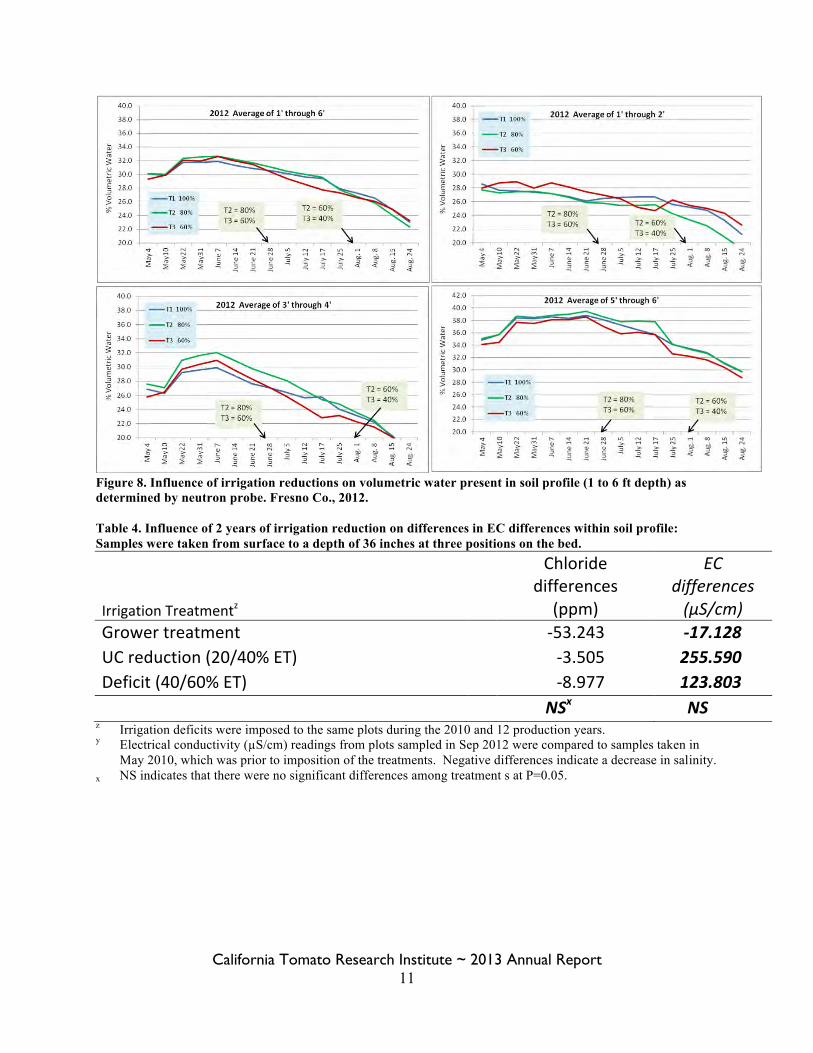
Data collected regarding applied water and precipitation included recording applied seasonal water and regular monitoring of soil moisture levels. Water applied was recorded using water meters installed into the drip lines of 4 plots within each irrigation treatment. The moisture levels in the soil profile were evaluated by neutron probe and numerical differences among treatments were observed weekly during the season. In addition, precipitation records were obtained from CIMIS (Five Points South West #190). Soil samples for salinity analysis were collected in Mar 2010, Feb 2011, Jan and Dec 2012. Composite samples, 4 sub-samples each (Figure 4). They were collected at depths of surface to 6 in, 6 to 12, 12 to 18, 18 to 24, 24 to 36 in each of 3 distances from the drip tape within each plot (Figure 5). Samples were collected from 4 replications on the Mar 2010 and Dec 2012 sample dates. Samples were analyzed for electrical conductivity (EC) and chlorides. Tomato yield and quality were determined each of the three years of the study. Within 1-3 days of commercial harvest, four 100 ft areas of row in the center bed of each plot were harvested mechanically. There was a minimum of 100 ft buffer from either end of data rows and 215 ft between each harvested area. Fruit were weighed with a scale-equipped gondola. From the eastern and western most plots, 15- to 25-lb sub-samples were taken from the harvester and hand sorted for red, green, sunburn and rot. Blossom end rot was also sorted during seasons in which there were enough to evaluate. Fifty red fruit were sent to the Processing Tomato Advisory Board laboratory where color, solids and pH were tested. The yield and quality data was subjected to Analysis of Variance (ANOVA) and Least Significant Difference at Probability of 5% (LSD0.05) or Probability (P) is presented. A Factorial Analysis of Variance was used for the differences in soil electrical conductivity (EC) levels and chloride levels between spring 2010 and fall 2012 with the main plot treatments being the irrigation treatments and subplot treatments being the position within the soil profile and LSD0.05 was presented where significant differences existed. Results/Discussion: Over the three years of the study, the irrigation reductions imposed had measurable influence on yield only in the most severe irrigation reduction treatment and only in 2012. In all other cases, there was no significant impact in yield P=0.05 (Tables 1-3). Although, the only significant reduction was the 5.26 ton/acre decline seen in 2012, the grower’s irrigation practices had the highest yields numerically in all trials. No differences in quality any quality parameters evaluated were observed. The similarities in yield and quality, and overall healthy appearance of the field in spite of irrigation reductions are likely to be due to the large amount of stored moisture in the soil profile that were mined to sustain the plants. This was documented by the neutron probe readings of the upper 6 ft of the soil surface during the growing season (Figures 6-8). There were especially high amounts of moisture extracted from the 3 to 4 ft depth in 2010 (Figure 6) and from 1 to 2 ft in 2011 (Figure 7). The absence of notable differences in yield and quality are specific to the character of the soil at this location and the overall soil moisture levels. In the absence of the stored moisture that was present at this location, it is likely that yield and quality differences would be present and pronounced.
California Tomato Research Institute ~ 2013 Annual Report 4
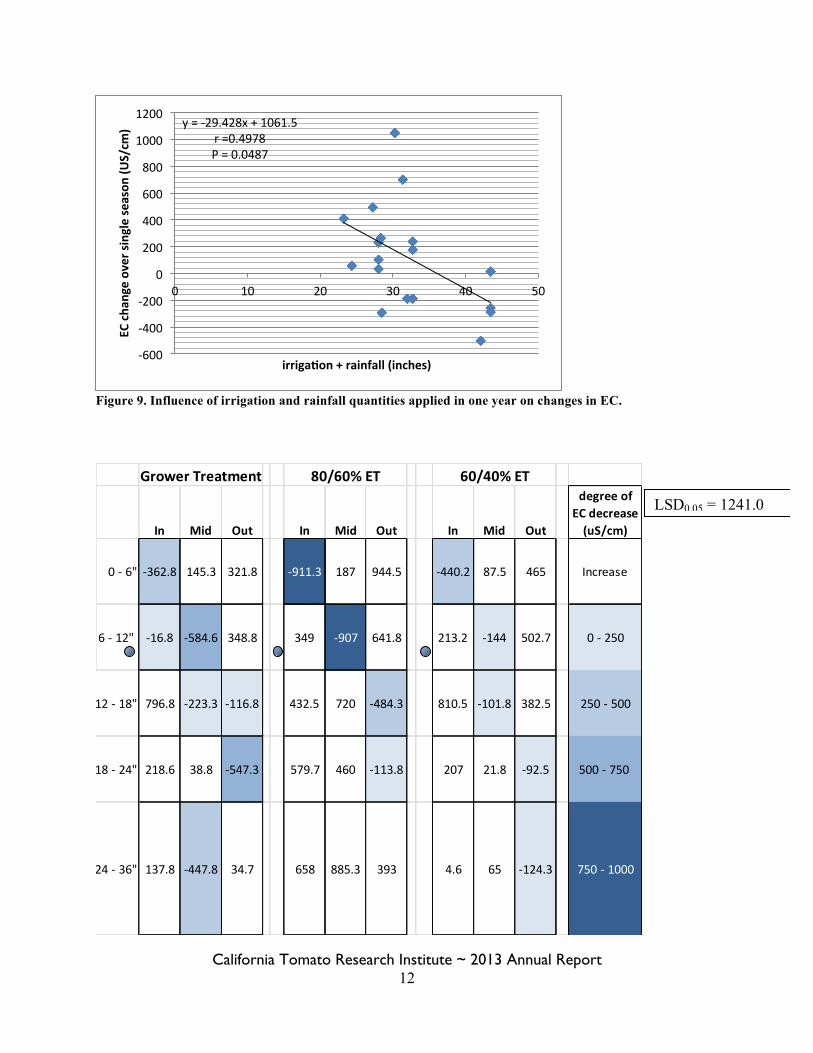
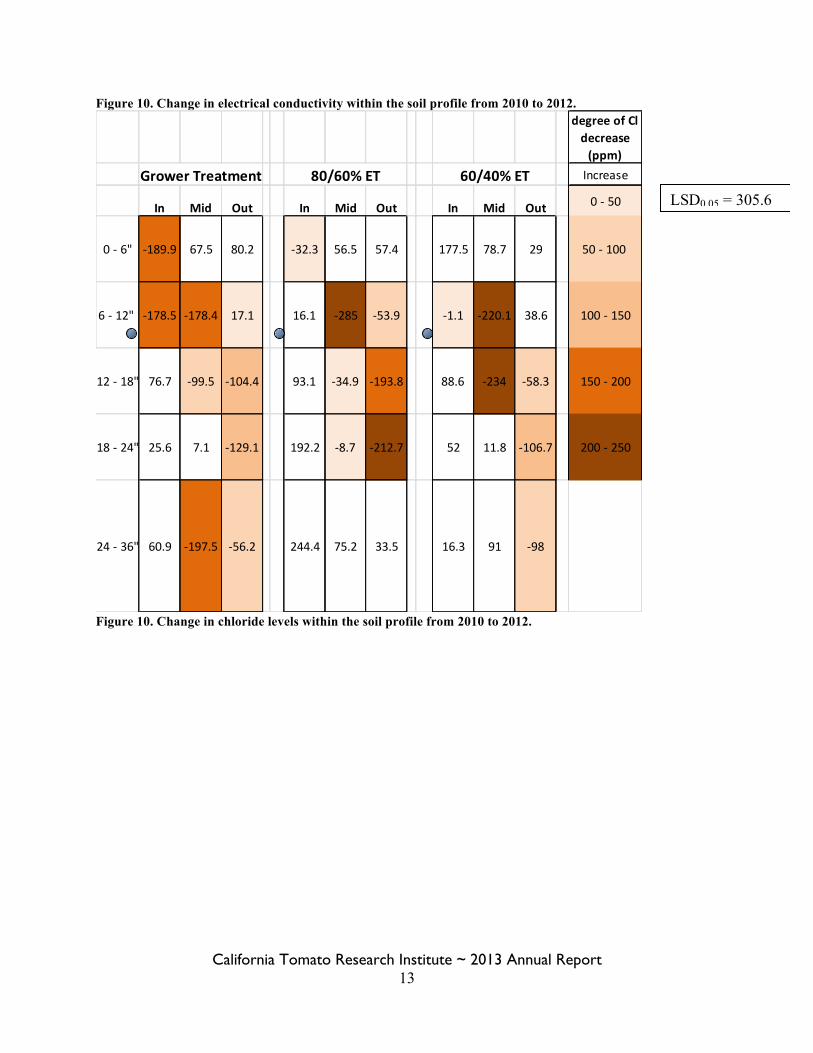
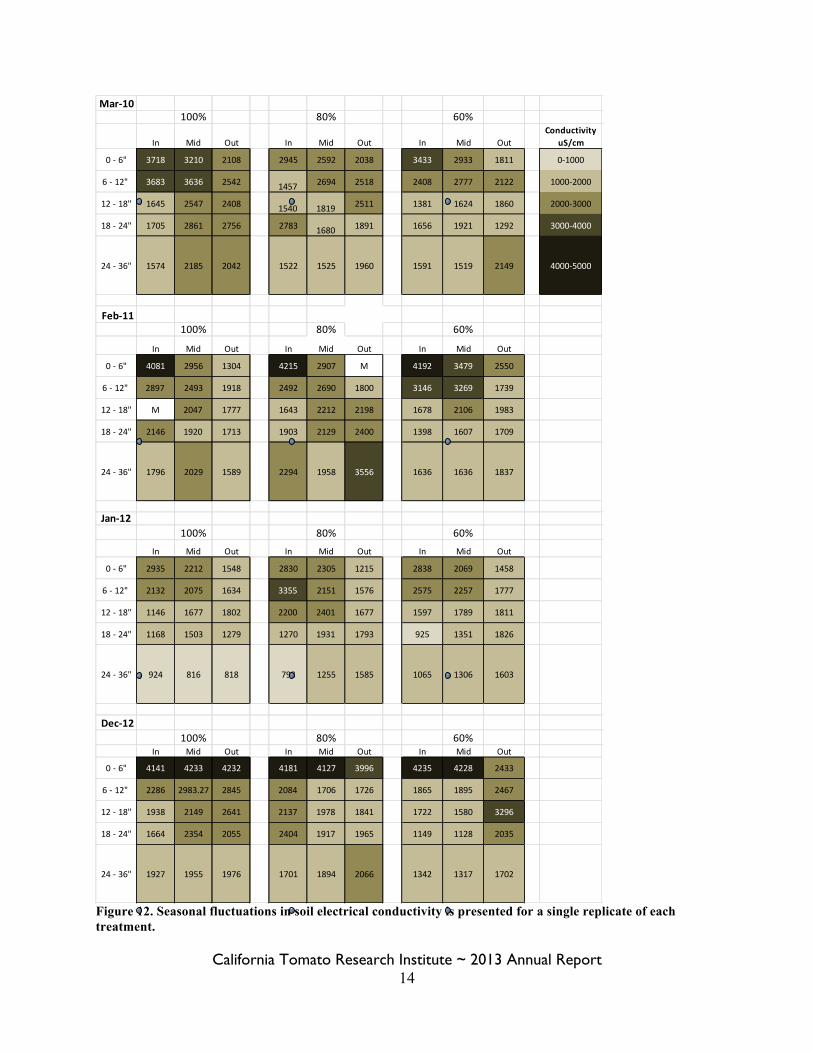
The influence of irrigation treatments on soil salinity showed numerical declines where higher irrigation rates were used, but there were no significant differences among treatments due to very high variability. Based on changes of EC and chloride levels from pre-season 2010 and post-season 2012, there were no statistically significant differences among the irrigation treatments P=0.05 (Table 4). However, numerically, there is a suggestion of greater declines in chloride and EC, particularly between the grower treatment and both deficit treatments. The grower treatment was compared to both of the deficit treatments by Orthogonal Contrasts and differences were not statistically significant P = 0.190 (data not shown). A decline in EC is associated with higher irrigation/rainfall levels. When rainfall was added to applied water levels, there is evidence of a relationship between the quantity of water and the change in salinity. A significant negative correlation between applied water plus precipitation and the change in EC was observed (Figure 9). The regression was exclusive to plots where the soil samples were taken over consecutive years, but all treatments were represented equally in this figure. Although there were points that were outliers and served to decrease the coefficient of correlation (r value), the relationship is significant. Differences in change of EC and chloride were significantly associated with position within the bed (Figures 10 and 11). Generally, the greatest EC decreases were observed nearest the tape at surface to 6-in depth and mid-shoulder of the bed at 6-12” depth. In addition, consistent increases were documented at the outside of the bed from surface to 12-in depth and nearest the tape at 12- to 24-in depth. Consistent chloride decreases were observed mid-shoulder of the bed at 6- to 18-in and at the outside of the bed at depths of 12- to 24-in. The annual salinity evaluations were not replicated, but there is an indication of seasonal patterns. Figure 11 shows electrical conductivity of replication 1 from pre-season 2010 and post-season 2012. The 2010 to 2011 samples would suggest no substantial change in EC, and a numerical decrease from 2011 to 2012 over all treatments. The fall 2012 EC levels were numerically elevated as compared to the previous samples. This is consistent with rainfall and irrigation practices at the site. With near record rainfall between 2010 and 11 production seasons and access to high quality district water, there appeared to be general declines in salinity within the profile. The grower treatment, 36 inches of water was applied, substantially higher than ET along with winter rainfall, probably created a leaching environment which was seen in the Jan 2012 EC levels. Drought and more conservative irrigation scheduling throughout the season in 2012 would likely lead to accumulation, which numerically appears to be the case in the fall 2012 sample results. In this trial, it was not shown that leaching could be accomplished with drip irrigation. Some of the differences in leaching due to location within the soil profile may make use of drip irrigation for purposes of leaching particularly challenging. However, we were able to demonstrate that with greater amounts of water in terms of both high quality irrigation water and rainfall, there are decreases in salinity levels. Furthermore, the seasonal differences in rainfall have impact on overall salinity levels and need to be considered in management decisions. It would be expected that results will differ where soils are not similar to where this study was conducted.
California Tomato Research Institute ~ 2013 Annual Report 5
Figure 1. Applied water by treatment in a Fresno Co. processing tomato field, 2010. (Values prior to 10 Jun are estimated based on standard practices)
Figure 2. Applied water by treatment in a Fresno Co. processing tomato field, 2011.
California Tomato Research Institute ~ 2013 Annual Report 6
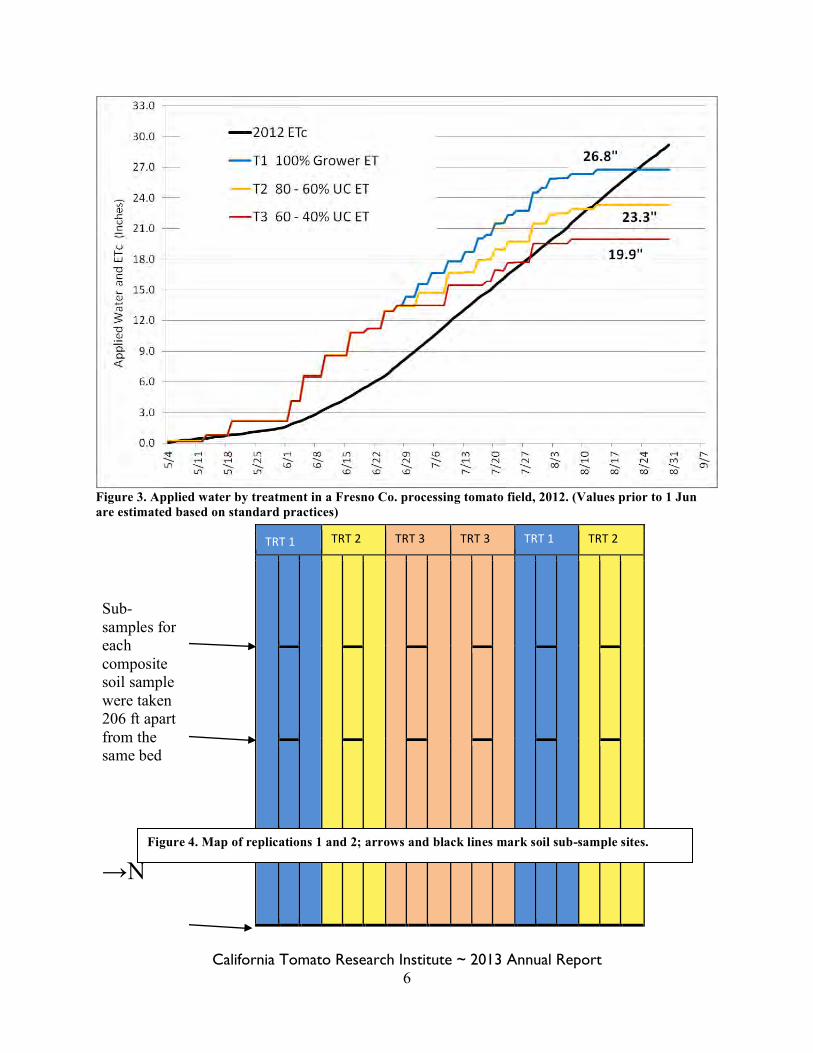
Figure 3. Applied water by treatment in a Fresno Co. processing tomato field, 2012. (Values prior to 1 Jun are estimated based on standard practices)
sample
TRT 1 TRT 2 TRT 3 TRT 3 TRT 1 TRT 2
Sub-samples for each composite soil sample were taken 206 ft apart from the same bed
→N Figure 4. Map of replications 1 and 2; arrows and black lines mark soil sub-sample sites.
California Tomato Research Institute ~ 2013 Annual Report 7
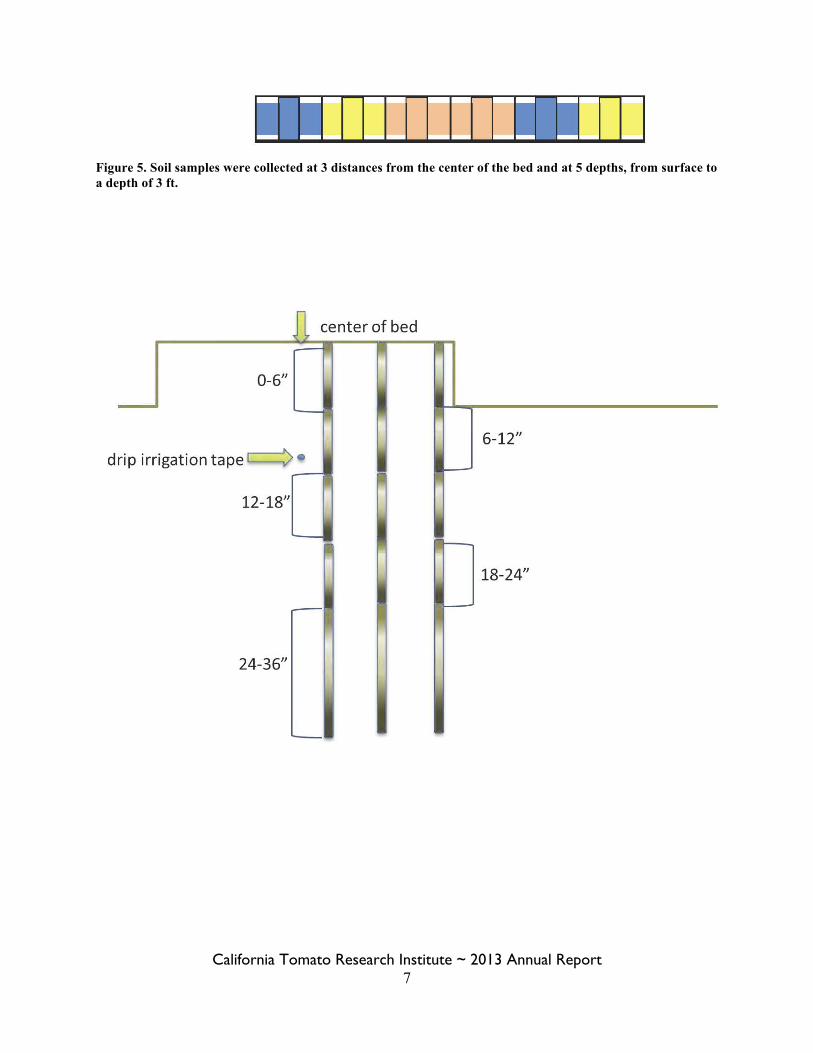
Figure 5. Soil samples were collected at 3 distances from the center of the bed and at 5 depths, from surface to a depth of 3 ft.
Jl center of bed .. ll
0-6"
- -6-12"
drip irrigation tape c::::::::> •
12-18"
18-24"
24-36"
-'=
California Tomato Research Institute ~ 2013 Annual Report 8
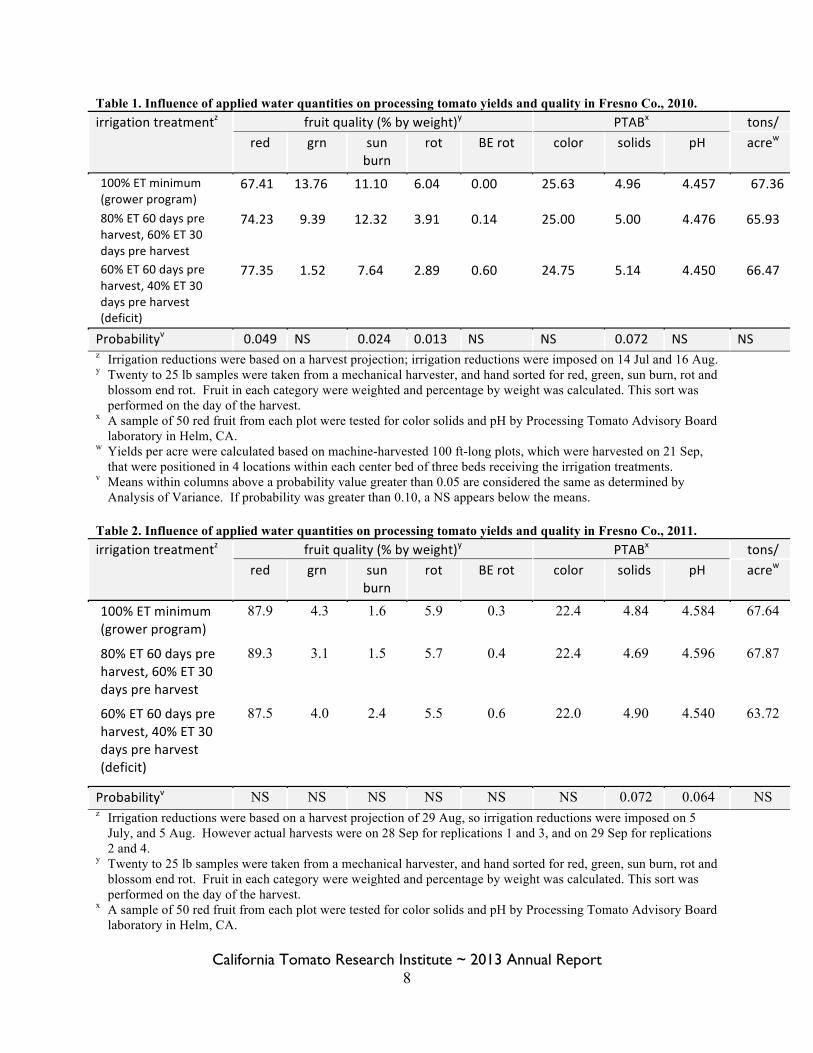
Table 1. Influence of applied water quantities on processing tomato yields and quality in Fresno Co., 2010. irrigation treatmentz fruit quality (% by weight)y PTABx tons/
red grn sun burn
rot BE rot color solids pH acrew
100% ET minimum (grower program)
67.41 13.76 11.10 6.04 0.00 25.63 4.96 4.457 67.36
80% ET 60 days pre harvest, 60% ET 30 days pre harvest
74.23 9.39 12.32 3.91 0.14 25.00 5.00 4.476 65.93
60% ET 60 days pre harvest, 40% ET 30 days pre harvest (deficit)
77.35 1.52 7.64 2.89 0.60 24.75 5.14 4.450 66.47
Probabilityv 0.049 NS 0.024 0.013 NS NS 0.072 NS NS z Irrigation reductions were based on a harvest projection; irrigation reductions were imposed on 14 Jul and 16 Aug. y Twenty to 25 lb samples were taken from a mechanical harvester, and hand sorted for red, green, sun burn, rot and
blossom end rot. Fruit in each category were weighted and percentage by weight was calculated. This sort was performed on the day of the harvest.
x A sample of 50 red fruit from each plot were tested for color solids and pH by Processing Tomato Advisory Board laboratory in Helm, CA.
w Yields per acre were calculated based on machine-harvested 100 ft-long plots, which were harvested on 21 Sep, that were positioned in 4 locations within each center bed of three beds receiving the irrigation treatments.
v Means within columns above a probability value greater than 0.05 are considered the same as determined by Analysis of Variance. If probability was greater than 0.10, a NS appears below the means.
Table 2. Influence of applied water quantities on processing tomato yields and quality in Fresno Co., 2011. irrigation treatmentz fruit quality (% by weight)y PTABx tons/
red grn sun burn
rot BE rot color solids pH acrew
100% ET minimum (grower program)
87.9 4.3 1.6 5.9 0.3 22.4 4.84 4.584 67.64
80% ET 60 days pre harvest, 60% ET 30 days pre harvest
89.3 3.1 1.5 5.7 0.4 22.4 4.69 4.596 67.87
60% ET 60 days pre harvest, 40% ET 30 days pre harvest (deficit)
87.5 4.0 2.4 5.5 0.6 22.0 4.90 4.540 63.72
Probabilityv NS NS NS NS NS NS 0.072 0.064 NS z Irrigation reductions were based on a harvest projection of 29 Aug, so irrigation reductions were imposed on 5
July, and 5 Aug. However actual harvests were on 28 Sep for replications 1 and 3, and on 29 Sep for replications 2 and 4.
y Twenty to 25 lb samples were taken from a mechanical harvester, and hand sorted for red, green, sun burn, rot and blossom end rot. Fruit in each category were weighted and percentage by weight was calculated. This sort was performed on the day of the harvest.
x A sample of 50 red fruit from each plot were tested for color solids and pH by Processing Tomato Advisory Board laboratory in Helm, CA.
California Tomato Research Institute ~ 2013 Annual Report 9
w Yields per acre were calculated based on machine-harvested 100 ft-long plots, which were harvested on 28-29 Sep, that were positioned in 4 locations within each center bed of three beds receiving the irrigation treatments.
v Means within columns above a probability value greater than 0.05 are considered the same as determined by Analysis of Variance. If probability was greater than 0.10, a NS appears below the means.
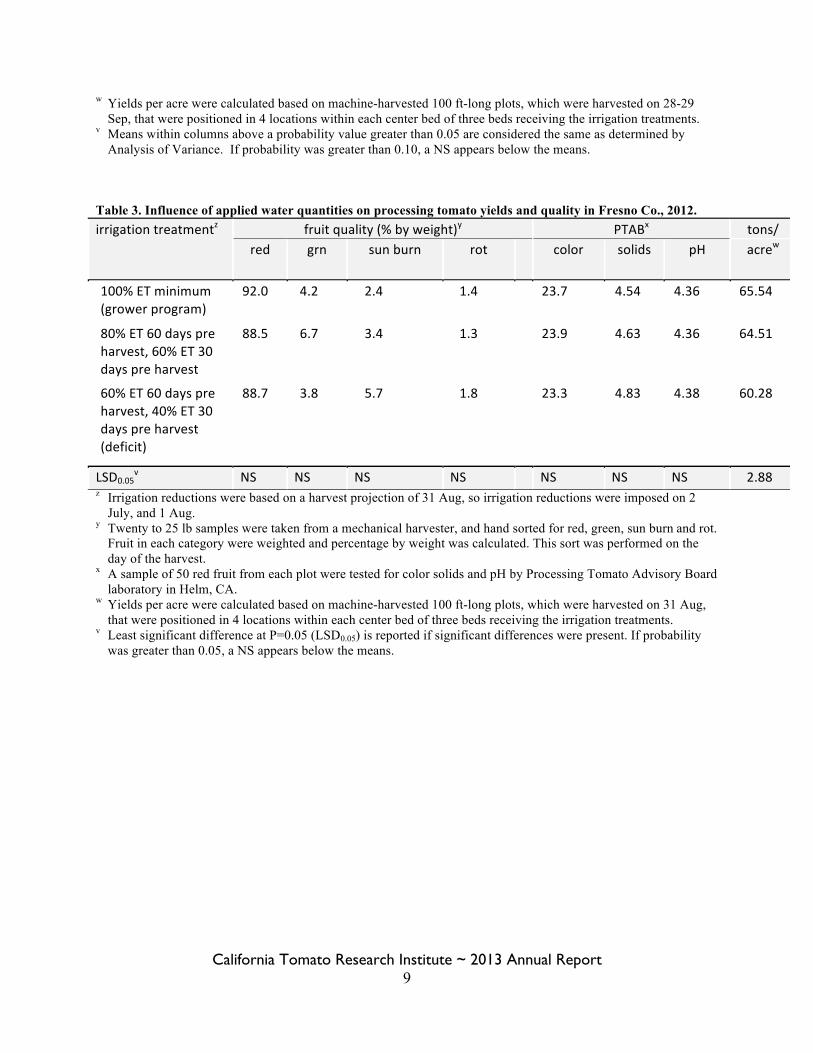
Table 3. Influence of applied water quantities on processing tomato yields and quality in Fresno Co., 2012. irrigation treatmentz fruit quality (% by weight)y PTABx tons/
red grn sun burn rot color solids pH acrew
100% ET minimum (grower program)
92.0 4.2 2.4 1.4 23.7 4.54 4.36 65.54
80% ET 60 days pre harvest, 60% ET 30 days pre harvest
88.5 6.7 3.4 1.3 23.9 4.63 4.36 64.51
60% ET 60 days pre harvest, 40% ET 30 days pre harvest (deficit)
88.7 3.8 5.7 1.8 23.3 4.83 4.38 60.28
LSD0.05v NS NS NS NS NS NS NS 2.88
z Irrigation reductions were based on a harvest projection of 31 Aug, so irrigation reductions were imposed on 2 July, and 1 Aug.
y Twenty to 25 lb samples were taken from a mechanical harvester, and hand sorted for red, green, sun burn and rot. Fruit in each category were weighted and percentage by weight was calculated. This sort was performed on the day of the harvest.
x A sample of 50 red fruit from each plot were tested for color solids and pH by Processing Tomato Advisory Board laboratory in Helm, CA.
w Yields per acre were calculated based on machine-harvested 100 ft-long plots, which were harvested on 31 Aug, that were positioned in 4 locations within each center bed of three beds receiving the irrigation treatments.
v Least significant difference at P=0.05 (LSD0.05) is reported if significant differences were present. If probability was greater than 0.05, a NS appears below the means.
California Tomato Research Institute ~ 2013 Annual Report 10
Figure 6. Influence of irrigation reductions on volumetric water present in soil profile (1 to 6 ft depth) as determined by neutron probe, Fresno Co., 2010.
Figure 7. Influence of irrigation reductions on volumetric water present in soil profile (1 to 6 ft depth) as determined by neutron probe. Fresno Co., 2011.
California Tomato Research Institute ~ 2013 Annual Report 11
Figure 8. Influence of irrigation reductions on volumetric water present in soil profile (1 to 6 ft depth) as determined by neutron probe. Fresno Co., 2012. Table 4. Influence of 2 years of irrigation reduction on differences in EC differences within soil profile: Samples were taken from surface to a depth of 36 inches at three positions on the bed.
Irrigation Treatmentz
Chloride differences
(ppm)
EC differences (µS/cm)
Grower treatment -‐53.243 -‐17.128 UC reduction (20/40% ET) -‐3.505 255.590 Deficit (40/60% ET) -‐8.977 123.803 NSx NS
z Irrigation deficits were imposed to the same plots during the 2010 and 12 production years. y Electrical conductivity (µS/cm) readings from plots sampled in Sep 2012 were compared to samples taken in
May 2010, which was prior to imposition of the treatments. Negative differences indicate a decrease in salinity. x NS indicates that there were no significant differences among treatment s at P=0.05.
California Tomato Research Institute ~ 2013 Annual Report 12
Figure 9. Influence of irrigation and rainfall quantities applied in one year on changes in EC.
y = -‐29.428x + 1061.5 r =0.4978 P = 0.0487
-‐600
-‐400
-‐200
0
200
400
600
800
1000
1200
0 10 20 30 40 50
EC cha
nge over single se
ason
(US/cm
)
irriga6on + rainfall (inches)
Grower Treatment 80/60% ET 60/40% ET
In Mid Out In Mid Out In Mid Out
degree of EC decrease (uS/cm)
0 -‐ 6" -‐362.8 145.3 321.8 -‐911.3 187 944.5 -‐440.2 87.5 465 Increase
6 -‐ 12" -‐16.8 -‐584.6 348.8 349 -‐907 641.8 213.2 -‐144 502.7 0 -‐ 250
12 -‐ 18" 796.8 -‐223.3 -‐116.8 432.5 720 -‐484.3 810.5 -‐101.8 382.5 250 -‐ 500
18 -‐ 24" 218.6 38.8 -‐547.3 579.7 460 -‐113.8 207 21.8 -‐92.5 500 -‐ 750
24 -‐ 36" 137.8 -‐447.8 34.7 658 885.3 393 4.6 65 -‐124.3 750 -‐ 1000
LSD0.05 = 1241.0
California Tomato Research Institute ~ 2013 Annual Report 13
Figure 10. Change in electrical conductivity within the soil profile from 2010 to 2012.
Figure 10. Change in chloride levels within the soil profile from 2010 to 2012.
degree of Cl decrease (ppm)
Grower Treatment 80/60% ET 60/40% ET Increase
In Mid Out In Mid Out In Mid Out 0 -‐ 50
0 -‐ 6" -‐189.9 67.5 80.2 -‐32.3 56.5 57.4 177.5 78.7 29 50 -‐ 100
6 -‐ 12" -‐178.5 -‐178.4 17.1 16.1 -‐285 -‐53.9 -‐1.1 -‐220.1 38.6 100 -‐ 150
12 -‐ 18" 76.7 -‐99.5 -‐104.4 93.1 -‐34.9 -‐193.8 88.6 -‐234 -‐58.3 150 -‐ 200
18 -‐ 24" 25.6 7.1 -‐129.1 192.2 -‐8.7 -‐212.7 52 11.8 -‐106.7 200 -‐ 250
24 -‐ 36" 60.9 -‐197.5 -‐56.2 244.4 75.2 33.5 16.3 91 -‐98
LSD0.05 = 305.6
California Tomato Research Institute ~ 2013 Annual Report 14
Figure 12. Seasonal fluctuations in soil electrical conductivity is presented for a single replicate of each treatment.
Mar-‐10100% 80% 60%
In Mid Out In Mid Out In Mid OutConductivity
uS/cm
0 -‐ 6" 3718 3210 2108 2945 2592 2038 3433 2933 1811 0-‐1000
6 -‐ 12" 3683 3636 2542 1457 2694 2518 2408 2777 2122 1000-‐2000
12 -‐ 18" 1645 2547 2408 1540 1819 2511 1381 1624 1860 2000-‐3000
18 -‐ 24" 1705 2861 2756 2783 1680 1891 1656 1921 1292 3000-‐4000
24 -‐ 36" 1574 2185 2042 1522 1525 1960 1591 1519 2149 4000-‐5000
Feb-‐11100% 80% 60%
In Mid Out In Mid Out In Mid Out
0 -‐ 6" 4081 2956 1304 4215 2907 M 4192 3479 2550
6 -‐ 12" 2897 2493 1918 2492 2690 1800 3146 3269 1739
12 -‐ 18" M 2047 1777 1643 2212 2198 1678 2106 1983
18 -‐ 24" 2146 1920 1713 1903 2129 2400 1398 1607 1709
24 -‐ 36" 1796 2029 1589 2294 1958 3556 1636 1636 1837
Jan-‐12100% 80% 60%
In Mid Out In Mid Out In Mid Out
0 -‐ 6" 2935 2212 1548 2830 2305 1215 2838 2069 1458
6 -‐ 12" 2132 2075 1634 3355 2151 1576 2575 2257 1777
12 -‐ 18" 1146 1677 1802 2200 2401 1677 1597 1789 1811
18 -‐ 24" 1168 1503 1279 1270 1931 1793 925 1351 1826
24 -‐ 36" 924 816 818 793 1255 1585 1065 1306 1603
Dec-‐12100% 80% 60%
In Mid Out In Mid Out In Mid Out
0 -‐ 6" 4141 4233 4232 4181 4127 3996 4235 4228 2433
6 -‐ 12" 2286 2983.27 2845 2084 1706 1726 1865 1895 2467
12 -‐ 18" 1938 2149 2641 2137 1978 1841 1722 1580 3296
18 -‐ 24" 1664 2354 2055 2404 1917 1965 1149 1128 2035
24 -‐ 36" 1927 1955 1976 1701 1894 2066 1342 1317 1702
California Tomato Research Institute ~ 2013 Annual Report 15
Project Title: Design and Investigation of Water Use Efficient and ‘Climate Smart’ Risk Management Cropping Systems for Tomato in the Central Valley Project Leader: Jeff Mitchell
Department of Plant Sciences, University of California, Davis Telephone (559) 303-9689 Fax (559) 646-6593 [email protected]
Project Collaborators: Wes Wallender
Department of Land, Air and Water Resources University of California, Davis One Shields Avenue, Davis, CA 95616 Telephone (530) 752-0688 Fax (530) 752-5262 [email protected] Karen Klonsky Department of Agricultural and Natural Resource Economics University of California, Davis Telephone (530) 752-3563 Fax (530) 752-5614 [email protected] Dan Munk Fresno County Cooperative Extension 1720 S. Maple Avenue, Fresno, CA 93720 Telephone (559) 456-7561 Fax (559) 456-7575 [email protected] Anil Shrestha Department of Plant Science and Mechanized Agriculture California State University, Fresno 2415 E. San Ramon Avenue M/S AS 72, Fresno, CA 93740-8033 Telephone (559) 278-5784 [email protected] William Horwath Department of Land, Air and Water Resources University of California, Davis One Shields Avenue, Davis, CA 95616 Telephone (530) 754-6029 [email protected]
California Tomato Research Institute ~ 2013 Annual Report 16
Kurt Hembree Fresno County Cooperative Extension 1720 S. Maple Avenue, Fresno, CA 93720 Telephone (559) 456-7285 Fax (559) 456-7575 [email protected]; Tom Turini Fresno County Cooperative Extension 1720 S. Maple Avenue, Fresno, CA 93720 Telephone (559) 456-7285 Fax (559) 456-7575
Collaborators: John Diener
Red Rock Ranch, P.O. Box 97, Five Points, CA 93624 (559) 288-8540 [email protected]
Scott Schmidt Farming ‘D’, P.O. Box 248, Five Points, CA 93624 (559) 285-9201 [email protected] Ron Harben California Association of Resource Conservation Districts 4974 E. Clinton Way, Suite 214, Fresno, CA 93727 Telephone (559) 252-2192 Fax (559) 252-5483 [email protected]
Brook Gale USDA Natural Resources Conservation Service, Fresno Service Center 4625 W. Jennifer Avenue, Suite 125, Fresno, CA 93722 Telephone (559) 276-7494, Ext. 121 Fax (559) 276-1791 [email protected]
Monte Bottens Bottens Ag Solutions, Inc. 4746 W. Jennifer Avenue, Suite 104, Fresno, CA 93722 Telephone (559) 694-1582 [email protected]
Other Project Collaborators: This CTRI project is also part of a broader USDA NRCS Conservation Innovation Grant Program initiative on soil quality that we are conducting with CTRI members and a broader group of NRCS collaborators in California and also in Lincoln, NE. Partial CTRI cost-share match on this broader initiative has been pivotal in our accessing higher level support for this effort.
California Tomato Research Institute ~ 2013 Annual Report 17
Introduction: Because of the interest that many CTRI members have in gaining understanding and experience with research related to the range of ‘ecosystem services’ that may be provided by tomato production systems in California, we initiated work to evaluate a number of these services within San Joaquin Valley (SJV) tomato fields. We report progress that has been made in 2013 in fulfillment of our contract with CTRI, Inc. ‘Ecosystem services’ as outlined by the Millenium Ecosystem Assessment, 2005, are ‘services that people obtain from ecosystems’ and these include the following types.
o Provisionary ecosystem services (food, fiber, fuel, feed crop production – assets that are ‘consumed directly’)
o Regulatory ecosystem services that help ‘maintain balance’ within a given area o Cultural ecosystem services that enlighten and enrich human life, and o Supporting ecosystem services that are the ‘backstage’ processes such as soil
formation and nutrient cycling A range of benefits may derive from these varied services for tomato producers including improved resource use efficiencies, improved air, water and soil quality, reductions in GHG emissions with potentially positive benefits on climate change, as well as marketing advantages associated with the overall benefits of these services to society in general. Past work has documented benefits of conservation tillage tomato systems in the SJV for reducing particulate matter emissions by upwards of 75% (Baker et al., 2005). Our recent work for CTRI focuses on how soil properties in SJV tomato fields may change under conservation tillage and cover crop management. Summary of 2013 Findings: Since 1999, we have evaluated the amount of cover crop biomass that may be produced ahead of tomatoes in a study field in Five Points, CA. During this period, with supplemental irrigations applied in 2000 and 2013 amounting to about 8 inches, over 19 tons of organic matter (OM) (dry weight basis) and 7 tons of carbon (C) have been added to the soil in the cover crop systems (Table 1.
2000 2001 2002 2003 2004 2005 2006 2007 2008 2009 2010 2011
(lbs/ac) (lbs/ac) (lbs/ac) (lbs/ac) (lbs/ac) (lbs/ac) (lbs/ac) (lbs/ac) (lbs/ac) (lbs/ac) (lbs/ac) (lbs/ac)
STCC 8036 3604 1226 2281 1732 6661 1461 28 2895 950 1173 6832
CTCC 8344 2798 1895 5063 1744 8327 1282 66 2638 1199 1216 6543 Table 1. Cover crop biomass (dry weight) produced with 8 inches supplemental irrigation water in
Five Points, CA study (STCC – standard tillage with cover crop, CTCC – conservation tillage with cover crop)
California Tomato Research Institute ~ 2013 Annual Report 18
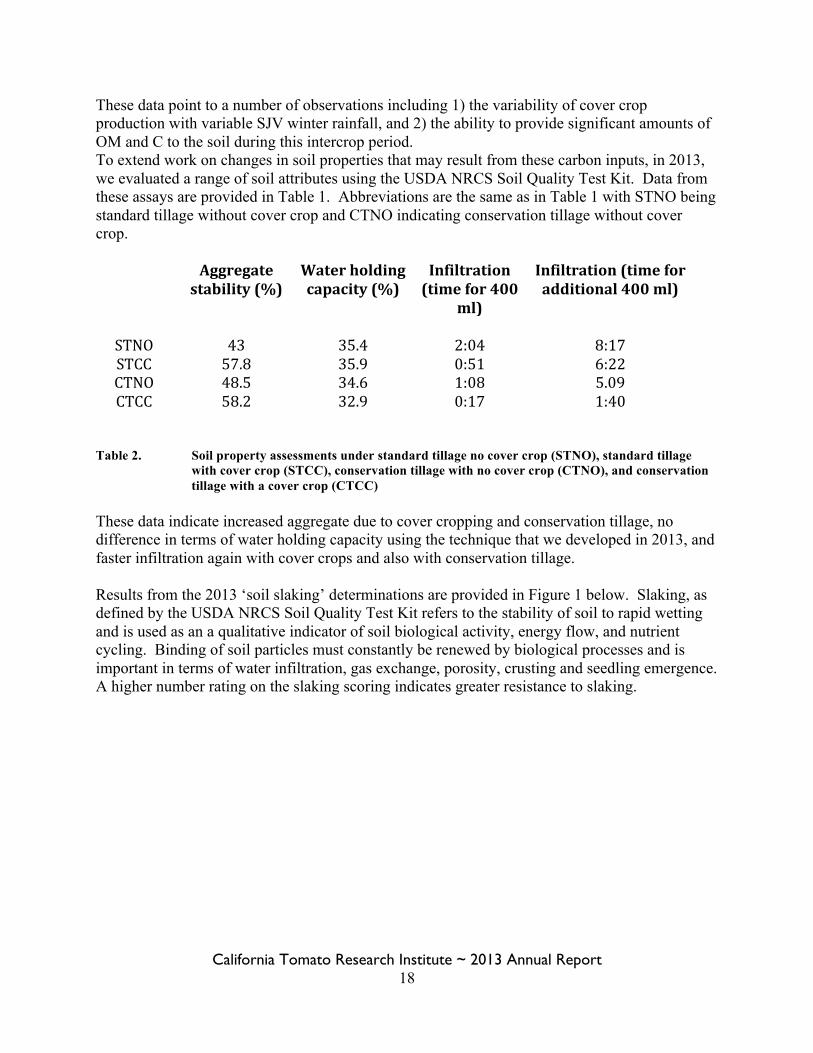
These data point to a number of observations including 1) the variability of cover crop production with variable SJV winter rainfall, and 2) the ability to provide significant amounts of OM and C to the soil during this intercrop period. To extend work on changes in soil properties that may result from these carbon inputs, in 2013, we evaluated a range of soil attributes using the USDA NRCS Soil Quality Test Kit. Data from these assays are provided in Table 1. Abbreviations are the same as in Table 1 with STNO being standard tillage without cover crop and CTNO indicating conservation tillage without cover crop.
Aggregate stability (%)
Water holding capacity (%)
Infiltration (time for 400
ml)
Infiltration (time for additional 400 ml)
STNO 43 35.4 2:04 8:17 STCC 57.8 35.9 0:51 6:22 CTNO 48.5 34.6 1:08 5.09 CTCC 58.2 32.9 0:17 1:40
Table 2. Soil property assessments under standard tillage no cover crop (STNO), standard tillage
with cover crop (STCC), conservation tillage with no cover crop (CTNO), and conservation tillage with a cover crop (CTCC)
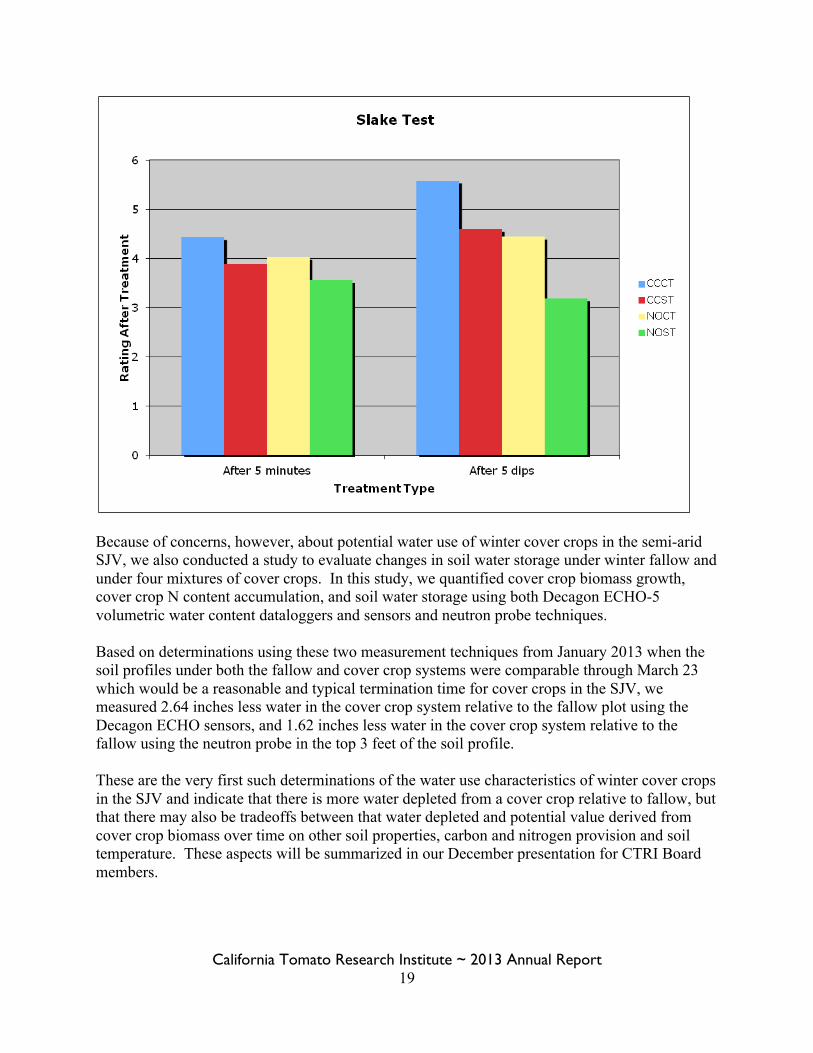
These data indicate increased aggregate due to cover cropping and conservation tillage, no difference in terms of water holding capacity using the technique that we developed in 2013, and faster infiltration again with cover crops and also with conservation tillage. Results from the 2013 ‘soil slaking’ determinations are provided in Figure 1 below. Slaking, as defined by the USDA NRCS Soil Quality Test Kit refers to the stability of soil to rapid wetting and is used as an a qualitative indicator of soil biological activity, energy flow, and nutrient cycling. Binding of soil particles must constantly be renewed by biological processes and is important in terms of water infiltration, gas exchange, porosity, crusting and seedling emergence. A higher number rating on the slaking scoring indicates greater resistance to slaking.
California Tomato Research Institute ~ 2013 Annual Report 19
Because of concerns, however, about potential water use of winter cover crops in the semi-arid SJV, we also conducted a study to evaluate changes in soil water storage under winter fallow and under four mixtures of cover crops. In this study, we quantified cover crop biomass growth, cover crop N content accumulation, and soil water storage using both Decagon ECHO-5 volumetric water content dataloggers and sensors and neutron probe techniques. Based on determinations using these two measurement techniques from January 2013 when the soil profiles under both the fallow and cover crop systems were comparable through March 23 which would be a reasonable and typical termination time for cover crops in the SJV, we measured 2.64 inches less water in the cover crop system relative to the fallow plot using the Decagon ECHO sensors, and 1.62 inches less water in the cover crop system relative to the fallow using the neutron probe in the top 3 feet of the soil profile. These are the very first such determinations of the water use characteristics of winter cover crops in the SJV and indicate that there is more water depleted from a cover crop relative to fallow, but that there may also be tradeoffs between that water depleted and potential value derived from cover crop biomass over time on other soil properties, carbon and nitrogen provision and soil temperature. These aspects will be summarized in our December presentation for CTRI Board members.
California Tomato Research Institute ~ 2013 Annual Report 20
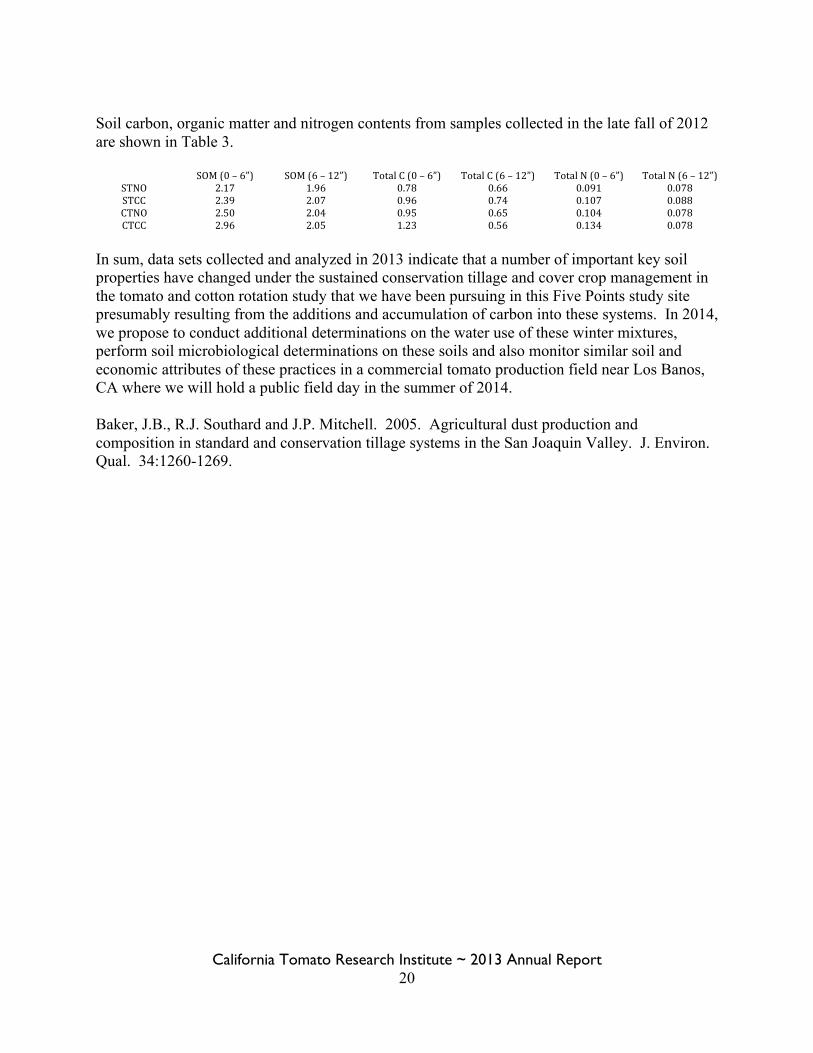
Soil carbon, organic matter and nitrogen contents from samples collected in the late fall of 2012 are shown in Table 3.
SOM (0 – 6”) SOM (6 – 12”) Total C (0 – 6”) Total C (6 – 12”) Total N (0 – 6”) Total N (6 – 12”) STNO 2.17 1.96 0.78 0.66 0.091 0.078 STCC 2.39 2.07 0.96 0.74 0.107 0.088 CTNO 2.50 2.04 0.95 0.65 0.104 0.078 CTCC 2.96 2.05 1.23 0.56 0.134 0.078
In sum, data sets collected and analyzed in 2013 indicate that a number of important key soil properties have changed under the sustained conservation tillage and cover crop management in the tomato and cotton rotation study that we have been pursuing in this Five Points study site presumably resulting from the additions and accumulation of carbon into these systems. In 2014, we propose to conduct additional determinations on the water use of these winter mixtures, perform soil microbiological determinations on these soils and also monitor similar soil and economic attributes of these practices in a commercial tomato production field near Los Banos, CA where we will hold a public field day in the summer of 2014. Baker, J.B., R.J. Southard and J.P. Mitchell. 2005. Agricultural dust production and composition in standard and conservation tillage systems in the San Joaquin Valley. J. Environ. Qual. 34:1260-1269.

California Tomato Research Institute ~ 2013 Annual Report 21
Project Title: Evaluation of Irrigation Practices on Water Use, Soil Salinity, and Tomato Productivity in the Delta Project Leaders: Brenna Aegerter and Michelle Leinfelder-Miles
Farm Advisors University of California Cooperative Extension, San Joaquin County 2101 E. Earhart Ave. Ste. 200, Stockton, CA 95206 Phone 209-953-6100 FAX 209-953-6128 Email: [email protected] and [email protected]
Objective and Justification: With this study, we are evaluating the impact of conversion to drip irrigation on water use, soil salinity, tomato yields, and fruit quality in the Delta. Results from this study will give growers knowledge on whether drip irrigation improves tomato yield and/or quality in the unique Delta growing environment, which is challenged by salinity. Procedures: Our study was conducted in a first-year drip irrigated field and a furrow irrigated field on Roberts Island in the Sacramento-San Joaquin River Delta region. The fields were selected based on proximity, similar soil characteristics, and similar water sourcing. The soil type at both fields was an Egbert silty clay loam. The Egbert series occupies approximately 21,882 acres in the San Joaquin County Delta. Water was sourced from Middle River. The furrow field was transplanted April 24th with the varieties AB 2 and AB 0311; the drip field was transplanted May 18th with the variety UG 19406. This was a demonstration study with the purpose of gaining a better understanding of the plant-soil-water relations of using drip irrigation in the Delta. Pit sampling. Our project commenced in the spring, prior to tomato transplanting. In April, we collected 40 soil samples each from two soil pits in what would become the furrow-irrigated tomato field. The samples were collected at 8-inch wide by 4-inch deep spacing, which began at the soil surface and went to a depth of 40 inches and ran from the middle of the row to the middle of the furrow (approximately 32 inches of the 60 inch beds). From the bottom of the pits, we augured a hole to the depth of the water table and collected a water sample. In May, we collected samples from a first-year drip field just prior to transplanting, following similar procedures. In the drip field, we dug the soil pits in locations that would correspond to treatments for the grower’s irrigation program and our own irrigation schedule of full irrigation followed by a mid-season deficit irrigation strategy. In October, following harvest, we followed similar procedures to collect samples from the drip field, but we collected samples at 4-inch wide by 4-inch deep spacing. The pit sites were offset from the spring pits so as not to sample from previously-disturbed soil. Survey. We measured soil salinity indirectly by means of a non-invasive electromagnetic probe (EM38) to determine the utility of this survey tool in furrow and drip irrigation settings. The EM38 measures conductivity in the soil, as from the dissolved salts in the moisture-filled pore spaces.
California Tomato Research Institute ~ 2013 Annual Report 22
Thus, the EM38 is sensitive to moisture and textural differences, but it allows the exploration of a larger area and volume of soil. Our surveying coincided with the pit sampling. In the furrow field, we surveyed 374 locations at 30-ft increments over an area of 6.9 acres. To ground-truth the surveying, we augured soil samples in six locations to three feet deep at 1-ft increments. We followed similar procedures over the 3.2 acre drip irrigation site, modifying for the smaller area by surveying 186 locations and ground-truthing the device by auguring four holes for soil salinity samples. The drip site had a smaller area than the furrow site because there was a change in the soil series that prevented us from surveying a larger area. We followed the same procedures in October as in May at the drip site. Soil and water testing. Soil salinity was determined by measuring the electrical conductivity (EC) and chloride (Cl) ion concentration of the saturated paste extract, where higher measures of conductivity and Cl indicate higher levels of dissolved salts in the soil. To conduct these procedures, a saturated paste was made by saturating a soil sample with deionized water until all pores were filled but before water pooled on the surface. When saturation was achieved, the liquid and dissolved salts were extracted from the sample under partial vacuum. We measured the EC of the saturated paste extracts, and of the irrigation and groundwater, in the laboratory of UC Cooperative Extension in San Joaquin County using a conductivity meter (YSI 3200 Conductivity Instrument). Chloride in the saturated paste extracts and water was measured at the UC Davis Analytical Laboratory by flow injection analysis colorimetry (http://anlab.ucdavis.edu/analyses/soil/227). Salinity of groundwater was tested pre-plant and post-harvest, and irrigation water quality was tested from a few irrigations. Evapotranspiration and deficit irrigation. Within the drip field, we installed in-line valves on three rows in order to institute more severe irrigation cutbacks than the grower’s strategy, allowing us to compare soil salinity under differing degrees of deficit irrigation. The number of hours that the system was on was determined from the grower’s log book and was monitored toward the end of the season with a timer attached to a pressure switch, which logged the number of hours that the system exceeded a pressure of 4 psi. The pressure switches with timers were installed on both sides of our in-line valves so that we could monitor run time of the grower’s system as well as our three isolated rows. The grower’s flow meter was monitored during two irrigations to determine the amount of water the drip system put out per hour. The acreage being irrigated was measured with GPS, and thus, we were able to determine how many inches of water were being applied via the drip system. At each spot where we augered soil samples, we also augered a second hole to take volumetric soil samples to determine bulk density and soil moisture. From those, we were able to determine the stored soil moisture pre-plant and post-harvest. Crop evapotranspiration was estimated assuming full ET for the late-season, once canopy cover was full. We used 2013 values for reference ET from the CIMIS weather station in Manteca, which is located about 10 miles SE of the field. Crop coefficients were calculated based on the method of Hanson and May (2006). Yield and fruit quality. Yield and fruit quality data were collected for the two irrigation strategies in the drip-irrigated field. Machine-harvested fruit weight was collected on September 30th from three 160-foot sections from both the grower-irrigated and experimental-irrigated rows. Soluble solids, pH and color of raw fruit were determined from 5-lb samples analyzed by PTAB. Because this was not a replicated experiment, statistical analyses were not performed.
California Tomato Research Institute ~ 2013 Annual Report 23
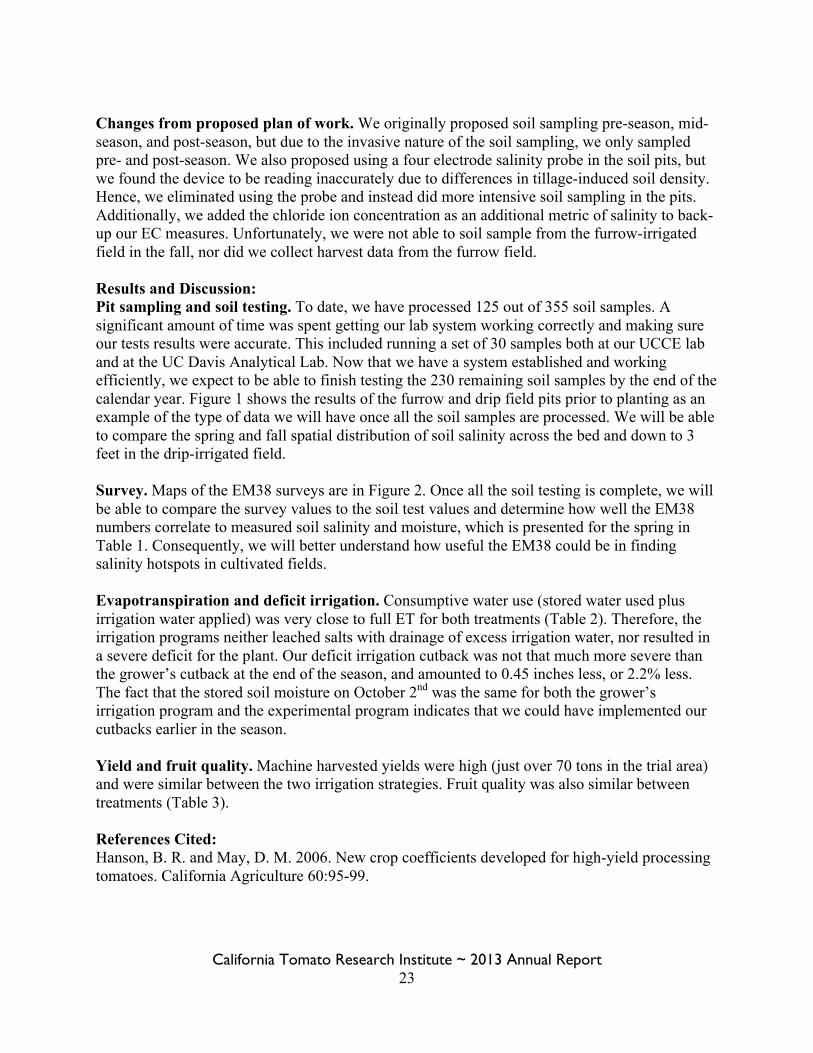
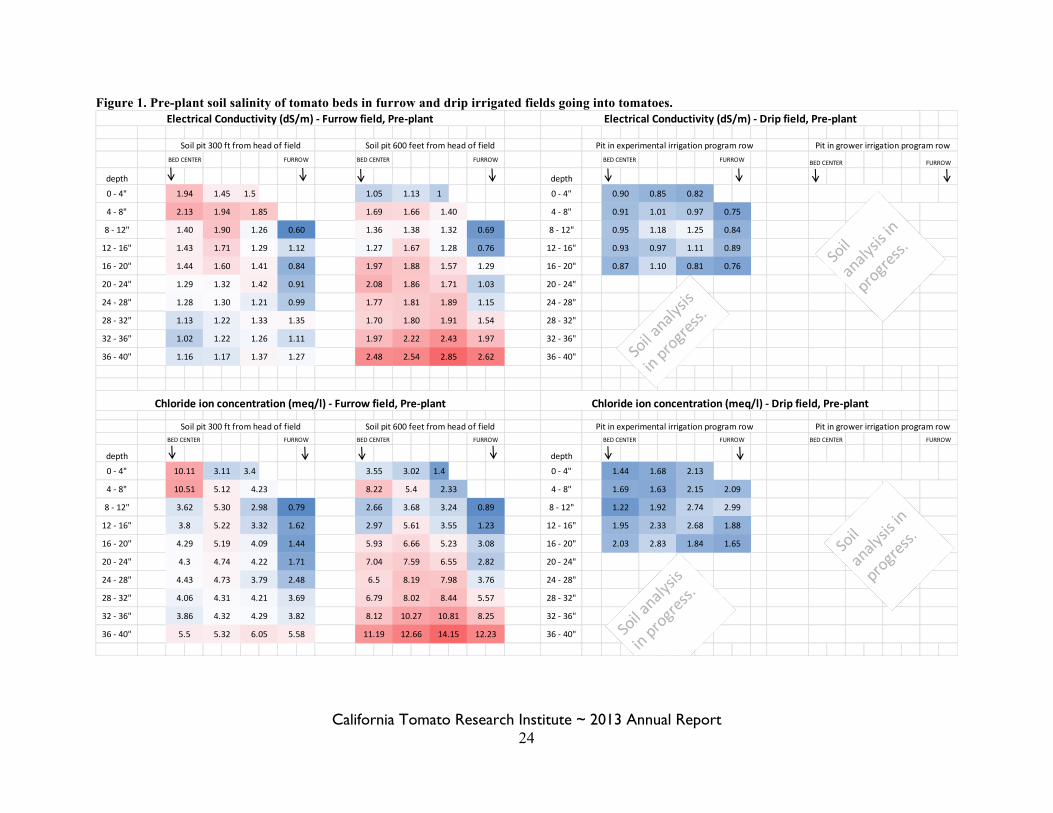
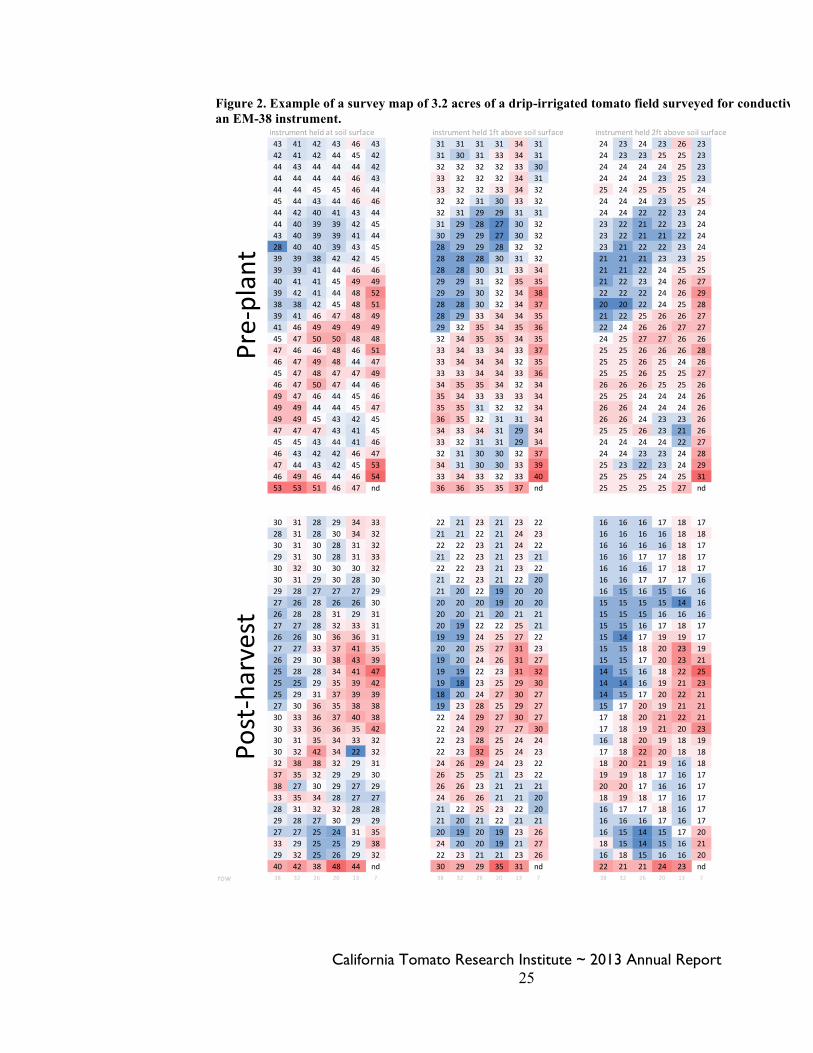
Changes from proposed plan of work. We originally proposed soil sampling pre-season, mid-season, and post-season, but due to the invasive nature of the soil sampling, we only sampled pre- and post-season. We also proposed using a four electrode salinity probe in the soil pits, but we found the device to be reading inaccurately due to differences in tillage-induced soil density. Hence, we eliminated using the probe and instead did more intensive soil sampling in the pits. Additionally, we added the chloride ion concentration as an additional metric of salinity to back-up our EC measures. Unfortunately, we were not able to soil sample from the furrow-irrigated field in the fall, nor did we collect harvest data from the furrow field. Results and Discussion: Pit sampling and soil testing. To date, we have processed 125 out of 355 soil samples. A significant amount of time was spent getting our lab system working correctly and making sure our tests results were accurate. This included running a set of 30 samples both at our UCCE lab and at the UC Davis Analytical Lab. Now that we have a system established and working efficiently, we expect to be able to finish testing the 230 remaining soil samples by the end of the calendar year. Figure 1 shows the results of the furrow and drip field pits prior to planting as an example of the type of data we will have once all the soil samples are processed. We will be able to compare the spring and fall spatial distribution of soil salinity across the bed and down to 3 feet in the drip-irrigated field. Survey. Maps of the EM38 surveys are in Figure 2. Once all the soil testing is complete, we will be able to compare the survey values to the soil test values and determine how well the EM38 numbers correlate to measured soil salinity and moisture, which is presented for the spring in Table 1. Consequently, we will better understand how useful the EM38 could be in finding salinity hotspots in cultivated fields. Evapotranspiration and deficit irrigation. Consumptive water use (stored water used plus irrigation water applied) was very close to full ET for both treatments (Table 2). Therefore, the irrigation programs neither leached salts with drainage of excess irrigation water, nor resulted in a severe deficit for the plant. Our deficit irrigation cutback was not that much more severe than the grower’s cutback at the end of the season, and amounted to 0.45 inches less, or 2.2% less. The fact that the stored soil moisture on October 2nd was the same for both the grower’s irrigation program and the experimental program indicates that we could have implemented our cutbacks earlier in the season. Yield and fruit quality. Machine harvested yields were high (just over 70 tons in the trial area) and were similar between the two irrigation strategies. Fruit quality was also similar between treatments (Table 3). References Cited: Hanson, B. R. and May, D. M. 2006. New crop coefficients developed for high-yield processing tomatoes. California Agriculture 60:95-99.
California Tomato Research Institute ~ 2013 Annual Report 24
Figure 1. Pre-plant soil salinity of tomato beds in furrow and drip irrigated fields going into tomatoes.
BED CENTER BED CENTER BED CENTER
depth depth
0 -‐ 4" 1.5 1 0 -‐ 4"
4 -‐ 8" 4 -‐ 8"
8 -‐ 12" 8 -‐ 12"
12 -‐ 16" 12 -‐ 16"
16 -‐ 20" 16 -‐ 20"
20 -‐ 24" 20 -‐ 24"
24 -‐ 28" 24 -‐ 28"
28 -‐ 32" 28 -‐ 32"
32 -‐ 36" 32 -‐ 36"
36 -‐ 40" 36 -‐ 40"
BED CENTER BED CENTER BED CENTER BED CENTER
depth depth
0 -‐ 4" 3.4 1.4 0 -‐ 4"
4 -‐ 8" 4 -‐ 8"
8 -‐ 12" 8 -‐ 12"
12 -‐ 16" 12 -‐ 16"
16 -‐ 20" 16 -‐ 20"
20 -‐ 24" 20 -‐ 24"
24 -‐ 28" 24 -‐ 28"
28 -‐ 32" 28 -‐ 32"
32 -‐ 36" 32 -‐ 36"
36 -‐ 40" 36 -‐ 40"
Electrical Conductivity (dS/m) -‐ Drip field, Pre-‐plant
Chloride ion concentration (meq/l) -‐ Drip field, Pre-‐plant
2.48
11.19
Pit in grower irrigation program rowPit in experimental irrigation program row
Pit in experimental irrigation program row Pit in grower irrigation program row
BED CENTER
Electrical Conductivity (dS/m) -‐ Furrow field, Pre-‐plant
Chloride ion concentration (meq/l) -‐ Furrow field, Pre-‐plant
FURROW
Soil pit 300 ft from head of field Soil pit 600 feet from head of field
Soil pit 300 ft from head of field Soil pit 600 feet from head of field
FURROW
0.87 1.10 0.81 0.76
0.95 1.18 1.25 0.84
0.93 0.97 1.11 0.89
FURROW
0.90 0.85
0.91 1.01 0.97
0.82
0.75
1.02 1.22 1.26 1.11
1.17 1.37 1.271.16
1.28 1.30 1.21 0.99
1.13 1.22 1.33 1.35
1.44 1.60 1.41 0.84
1.29 1.32 1.42 0.91
1.40 1.90 1.26 0.60
1.43 1.71 1.29 1.12
FURROW
1.94 1.45
2.13 1.94 1.85
1.97 2.22 2.43 1.97
FURROW
1.97 1.88 1.57 1.29
2.08 1.86 1.71 1.03
1.40
1.38 1.32 0.69
1.67 1.28 0.76
1.05
1.69
1.36
1.27
1.13
1.66
2.54 2.85 2.62
1.77 1.81 1.89 1.15
1.70 1.80 1.91 1.54
3.55 3.02
8.22 5.4 2.33
2.66 3.68 3.24 0.89
2.97 5.61 3.55 1.23
5.93 6.66 5.23 3.08
7.04 7.59 6.55 2.82
6.5 8.19 7.98 3.76
6.79 8.02 8.44 5.57
8.12 10.27 10.81 8.25
12.66 14.15 12.23
FURROW
10.11 3.11
10.51 5.12 4.23
3.62 5.30 2.98 0.79
3.8 5.22 3.32 1.62
4.29 5.19 4.09 1.44
4.3 4.74 4.22 1.71
4.43 4.73 3.79 2.48
4.06 4.31 4.21 3.69
3.86 4.32 4.29 3.82
5.5 5.32 6.05 5.58
FURROW
1.22 1.92 2.74 2.99
2.03 2.83 1.84 1.65
FURROW
1.44 1.68 2.13
1.69 1.63 2.15 2.09
1.95 2.33 2.68 1.88
California Tomato Research Institute ~ 2013 Annual Report 25
Figure 2. Example of a survey map of 3.2 acres of a drip-irrigated tomato field surveyed for conductivity with an EM-38 instrument.
instrument held at soil surface instrument held 1ft above soil surface instrument held 2ft above soil surface43 41 42 43 46 43 31 31 31 31 34 31 24 23 24 23 26 2342 41 42 44 45 42 31 30 31 33 34 31 24 23 23 25 25 2344 43 44 44 44 42 32 32 32 32 33 30 24 24 24 24 25 2344 44 44 44 46 43 33 32 32 32 34 31 24 24 24 23 25 2344 44 45 45 46 44 33 32 32 33 34 32 25 24 25 25 25 2445 44 43 44 46 46 32 32 31 30 33 32 24 24 24 23 25 2544 42 40 41 43 44 32 31 29 29 31 31 24 24 22 22 23 2444 40 39 39 42 45 31 29 28 27 30 32 23 22 21 22 23 2443 40 39 39 41 44 30 29 29 27 30 32 23 22 21 21 22 2428 40 40 39 43 45 28 29 29 28 32 32 23 21 22 22 23 2439 39 38 42 42 45 28 28 28 30 31 32 21 21 21 23 23 2539 39 41 44 46 46 28 28 30 31 33 34 21 21 22 24 25 2540 41 41 45 49 49 29 29 31 32 35 35 21 22 23 24 26 2739 42 41 44 48 52 29 29 30 32 34 38 22 22 22 24 26 2938 38 42 45 48 51 28 28 30 32 34 37 20 20 22 24 25 2839 41 46 47 48 49 28 29 33 34 34 35 21 22 25 26 26 2741 46 49 49 49 49 29 32 35 34 35 36 22 24 26 26 27 2745 47 50 50 48 48 32 34 35 35 34 35 24 25 27 27 26 2647 46 46 48 46 51 33 34 33 34 33 37 25 25 26 26 26 2846 47 49 48 44 47 33 34 34 34 32 35 25 25 26 25 24 2645 47 48 47 47 49 33 33 34 34 33 36 25 25 26 25 25 2746 47 50 47 44 46 34 35 35 34 32 34 26 26 26 25 25 2649 47 46 44 45 46 35 34 33 33 33 34 25 25 24 24 24 2649 49 44 44 45 47 35 35 31 32 32 34 26 26 24 24 24 2649 49 45 43 42 45 36 35 32 31 31 34 26 26 24 23 23 2647 47 47 43 41 45 34 33 34 31 29 34 25 25 26 23 21 2645 45 43 44 41 46 33 32 31 31 29 34 24 24 24 24 22 2746 43 42 42 46 47 32 31 30 30 32 37 24 24 23 23 24 2847 44 43 42 45 53 34 31 30 30 33 39 25 23 22 23 24 2946 49 46 44 46 54 33 34 33 32 33 40 25 25 25 24 25 3153 53 51 46 47 nd 36 36 35 35 37 nd 25 25 25 25 27 nd
30 31 28 29 34 33 22 21 23 21 23 22 16 16 16 17 18 1728 31 28 30 34 32 21 21 22 21 24 23 16 16 16 16 18 1830 31 30 28 31 32 22 22 23 21 24 22 16 16 16 16 18 1729 31 30 28 31 33 21 22 23 21 23 21 16 16 17 17 18 1730 32 30 30 30 32 22 22 23 21 23 22 16 16 16 17 18 1730 31 29 30 28 30 21 22 23 21 22 20 16 16 17 17 17 1629 28 27 27 27 29 21 20 22 19 20 20 16 15 16 15 16 1627 26 28 26 26 30 20 20 20 19 20 20 15 15 15 15 14 1626 28 28 31 29 31 20 20 21 20 21 21 15 15 15 16 16 1627 27 28 32 33 31 20 19 22 22 25 21 15 15 16 17 18 1726 26 30 36 36 31 19 19 24 25 27 22 15 14 17 19 19 1727 27 33 37 41 35 20 20 25 27 31 23 15 15 18 20 23 1926 29 30 38 43 39 19 20 24 26 31 27 15 15 17 20 23 2125 28 28 34 41 47 19 19 22 23 31 32 14 15 16 18 22 2525 25 29 35 39 42 19 18 23 25 29 30 14 14 16 19 21 2325 29 31 37 39 39 18 20 24 27 30 27 14 15 17 20 22 2127 30 36 35 38 38 19 23 28 25 29 27 15 17 20 19 21 2130 33 36 37 40 38 22 24 29 27 30 27 17 18 20 21 22 2130 33 36 36 35 42 22 24 29 27 27 30 17 18 19 21 20 2330 31 35 34 33 32 22 23 28 25 24 24 16 18 20 19 18 1930 32 42 34 22 32 22 23 32 25 24 23 17 18 22 20 18 1832 38 38 32 29 31 24 26 29 24 23 22 18 20 21 19 16 1837 35 32 29 29 30 26 25 25 21 23 22 19 19 18 17 16 1738 27 30 29 27 29 26 26 23 21 21 21 20 20 17 16 16 1733 35 34 28 27 27 24 26 26 21 21 20 18 19 18 17 16 1728 31 32 32 28 28 21 22 25 23 22 20 16 17 17 18 16 1729 28 27 30 29 29 21 20 21 22 21 21 16 16 16 17 16 1727 27 25 24 31 35 20 19 20 19 23 26 16 15 14 15 17 2033 29 25 25 29 38 24 20 20 19 21 27 18 15 14 15 16 2129 32 25 26 29 32 22 23 21 21 23 26 16 18 15 16 16 2040 42 38 48 44 nd 30 29 29 35 31 nd 22 21 21 24 23 nd
row 38 32 26 20 13 7 38 32 26 20 13 7 38 32 26 20 13 7
Pre-‐plan
tPo
st-‐harvest
California Tomato Research Institute ~ 2013 Annual Report 26
Table 1. Electrical conductivity (EC), chloride ion concentration (Cl), and moisture content of augered soil samples from spring sampling.
Furrow Drip
Depth EC
(dS/m) Cl
(meq/l)
Moisture (% by
volume) EC
(dS/m) Cl
(meq/l)
Moisture (% by
volume) 0-‐12" 1.60 5.73 35 0.90 2.00 49 13-‐24" 2.23 10.85 45 0.79 2.06 53 25-‐36" 2.63 14.37 44 0.79 2.59 62 Values represent the average of six (furrow) or four (drip) samples.
Table 2. Amounts of water stored, applied water and water used by the tomato crop in the drip-irrigated field. Grower
irrigation program
Experimental irrigation program
Stored soil moisture (inches in top 3 ft) Soil moisture May 14th 19.58 19.58
Soil moisture Oct. 2nd 14.15 14.15 Stored soil moisture used (inches) 5.43 5.43
Irrigation water applied (inches)* 19.14 18.71
Consumptive water use (inches) 24.57 24.14
Estimated full crop ET (inches)** 24.06 24.06
* water applied via drip system, does not include pre-‐irrigation via furrows.
** Estimate based on 2013 CIMIS data and crop coefficients of Hanson & May (2006).
Table 3. Yield and fruit quality from machine-harvest of the drip-irrigated field.
Yield
Soluble solids PTAB
(tons/acre) (°Brix) color pH
Grower irrigation program 69.32 4.80 22.0
4.25
Experimental irrigation program 70.73 4.87
22.3
4.27
California Tomato Research Institute ~ 2013 Annual Report 27
Project Title: Effect of Mycorrhizal Inoculants and Plant Flavonoid Inducers on Processing Tomatoes Principle Investigator: Kate Scow
Department of Land Air and Water Resources, UC Davis 3236 Plant and Environmental Sciences Building One Shields Avenue Davis, CA 95616
Cooperators: Gene Miyao, Farm Advisor Vegetable Crops, UC Cooperative Yolo County Emma Torbert, Assistant Specialist, Agricultural Sustainability Institute Megan McCaghey, Graduate Student, Agricultural Sustainability Institute Abstract or Summary Results: Soil amendments have the potential to increase soil quality, increase beneficial soil organisms and reduce pathogenic soil organisms. However, the soil amendments in this experiment (compost, Regalia and MycoApply) did not significantly affect processing tomato yields, mycorrhizal colonization, or soil properties such as organic matter, pH, CEC or salt concentrations. The chicken manure compost treatment did increase soil concentrations of phosphorus, potassium and sulfur and decreased the overall severity of disease, as compared to treatments without compost. The total cost of the amendments (including material, labor and equipment to apply) was $489/acre. Of that total cost, $411/acre is due to the compost application alone. Long-term increases of yields and sustained lower disease incidence levels would be needed to justify the cost of applying the amendments. Objectives: Overall: To study the effect of plant flavonoid inducers (Regalia), soil amendments (compost) and mycorrhizal inoculants (MycoApply) on commercial-scale processing tomatoes Specific: 1) Conduct field trials testing the effectiveness of microbial soil amendments in a grower’s processing tomato field 2) Measure effect of soil amendments, alone and in combination, on ● processing tomato yields ● plant health ● soil nutrient content ● mycorrhizal populations 3) Communicate results in field days, workshops and conferences on the effectiveness of microbial soil amendments
California Tomato Research Institute ~ 2013 Annual Report 28
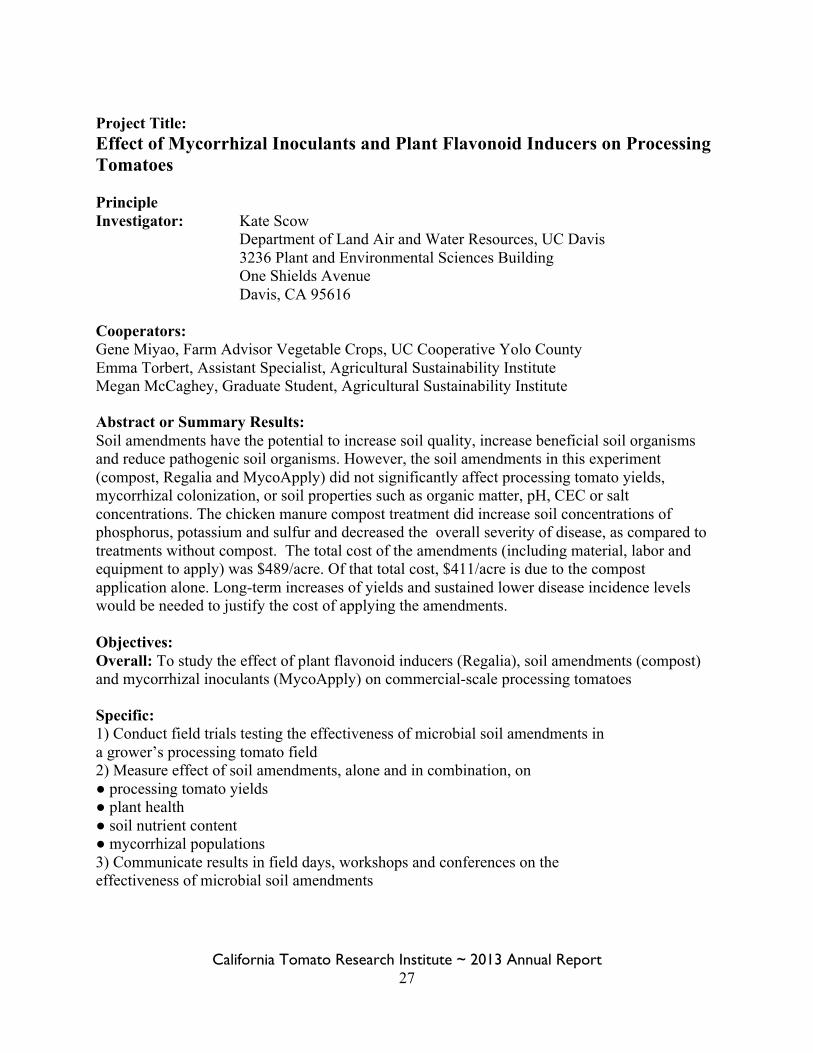
Procedures: Field work was initiated in the Spring of 2013. Soil samples were taken in March prior to the addition of amendments and planting. Eight treatments were applied to the 32 rows, with 4 replicates for each treatment. Rows were randomly selected for the application of treatments and treatments were applied to 830 feet long strips (one half of the field length). Treatments included Regalia with the addition of compost and Mycoapply, Regalia with no compost and Mycoapply, Regalia with compost or Mycoapply, and Regalia alone. The same additions of compost and or Mycoapply were used in the rows without Regalia including control rows with no additions. The experimental field is owned and operated by Mr. Steve Meeks and is adjacent to the Russell Ranch Sustainable Agriculture Research Facility. This is the first year the field has been grown in processing tomatoes after a previous history of cucumbers and sunflowers. Drip irrigation was installed at 10-12” spacing at the beginning of season in 5 foot beds. Additional inputs used in field management by Mr. Meeks, outside of the experimental treatments, included 28-0-05 fertilizer applied at 170 units N/acre, Can 17 applied at 40 units N per acre and Thiocal applied at 10 gallons/acre. In the fall, 8-25-26 was also applied at a rate of 100 lbs dry/acre. Prior to the addition of amendments and planting, soil was analyzed for organic matter, estimated N release, P, K, Mg, CA, Na, H, S, pH, CEC, percent cation saturated, nitrate, soluble salts, excess lime, Zn, Mn, Fe, Cu and B and ammonium. Ten samples were taken from each from each row at a depth of 30 cm and cores were combined for each of the 8 samples per block prior to refrigeration. Directly after sampling, the soil was mailed for analysis by A & L Western Laboratories. Compost generated from Foster Farms chicken manure was applied with a spreader on May 18th at a rate of 4 tons per acre. Tomato transplants were inoculated with Mycoapply (Mycorrhizal Applications) using a transplant drench in early May. To determine the appropriate solution of water and MycoApply, trays were weighed prior and after drenching in order to determine how much water was absorbed. The weight of the water prior to drenching and post drenching was also measured. This allowed us to determine how much water was lost from the container after each drench. The average absorbed by each tray was 2.13 pounds of water, with 2.77 pounds being lost from the container, the difference being lost from drainage after removal from the drench. Transplants were drenched in the water for 1.5 minutes to mimic field procedures (Figure 1). Mycoapply was applied to the transplants with 2.31 lbs for 1.54 acres, accounting for water that was estimated to be absorbed by the transplants. Trays were marked with colored tape in order to make sure that the correct plants were planted by workers on the tomato transplanter. The Heinz 5508 transplants were planted with a density of 8750 plants/acre. Transplanting took place on the same afternoon of May 6th using a mechanical transplanter. An error occurred with the tomato transplants, likely at the tomato breeding level, and there was a mix of some unknown variety with the Heinz 5508.
Figure 1: Applying a transplant drench of MycoApply (a mycorrhizal inoculant).
California Tomato Research Institute ~ 2013 Annual Report 29
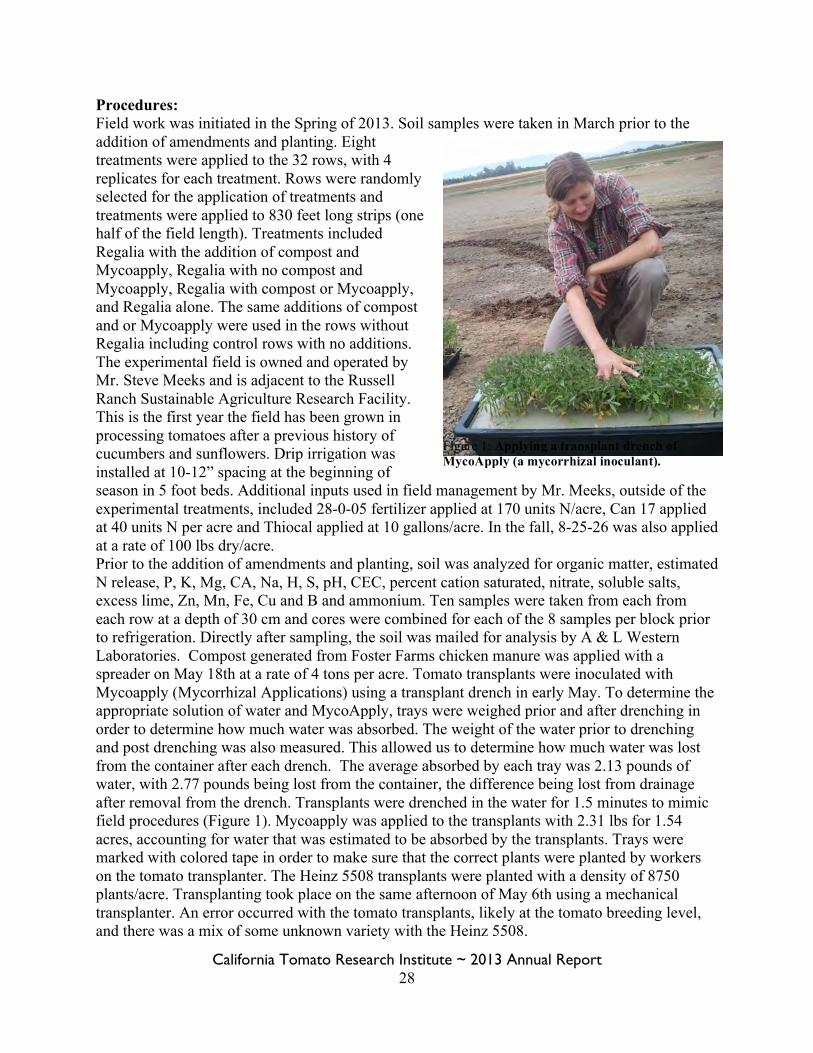
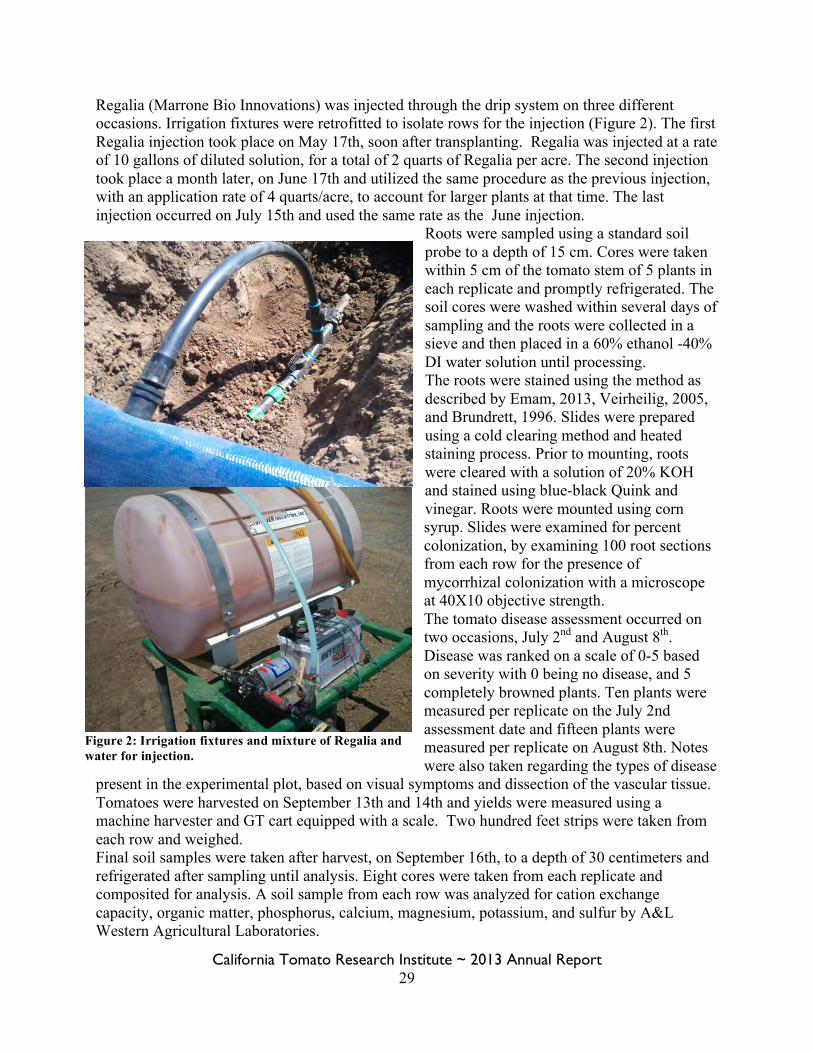
Regalia (Marrone Bio Innovations) was injected through the drip system on three different occasions. Irrigation fixtures were retrofitted to isolate rows for the injection (Figure 2). The first Regalia injection took place on May 17th, soon after transplanting. Regalia was injected at a rate of 10 gallons of diluted solution, for a total of 2 quarts of Regalia per acre. The second injection took place a month later, on June 17th and utilized the same procedure as the previous injection, with an application rate of 4 quarts/acre, to account for larger plants at that time. The last injection occurred on July 15th and used the same rate as the June injection.
Roots were sampled using a standard soil probe to a depth of 15 cm. Cores were taken within 5 cm of the tomato stem of 5 plants in each replicate and promptly refrigerated. The soil cores were washed within several days of sampling and the roots were collected in a sieve and then placed in a 60% ethanol -40% DI water solution until processing. The roots were stained using the method as described by Emam, 2013, Veirheilig, 2005, and Brundrett, 1996. Slides were prepared using a cold clearing method and heated staining process. Prior to mounting, roots were cleared with a solution of 20% KOH and stained using blue-black Quink and vinegar. Roots were mounted using corn syrup. Slides were examined for percent colonization, by examining 100 root sections from each row for the presence of mycorrhizal colonization with a microscope at 40X10 objective strength. The tomato disease assessment occurred on two occasions, July 2nd and August 8th. Disease was ranked on a scale of 0-5 based on severity with 0 being no disease, and 5 completely browned plants. Ten plants were measured per replicate on the July 2nd assessment date and fifteen plants were measured per replicate on August 8th. Notes were also taken regarding the types of disease
present in the experimental plot, based on visual symptoms and dissection of the vascular tissue. Tomatoes were harvested on September 13th and 14th and yields were measured using a machine harvester and GT cart equipped with a scale. Two hundred feet strips were taken from each row and weighed. Final soil samples were taken after harvest, on September 16th, to a depth of 30 centimeters and refrigerated after sampling until analysis. Eight cores were taken from each replicate and composited for analysis. A soil sample from each row was analyzed for cation exchange capacity, organic matter, phosphorus, calcium, magnesium, potassium, and sulfur by A&L Western Agricultural Laboratories.
Figure 2: Irrigation fixtures and mixture of Regalia and water for injection.
California Tomato Research Institute ~ 2013 Annual Report 30
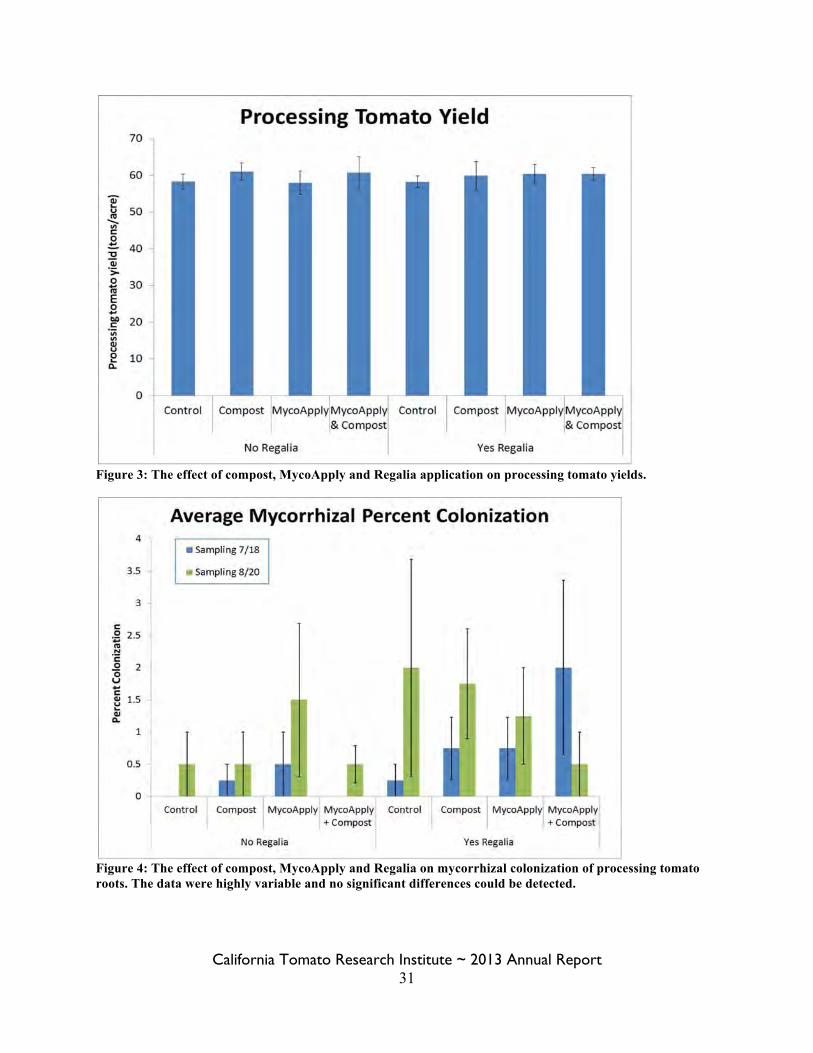
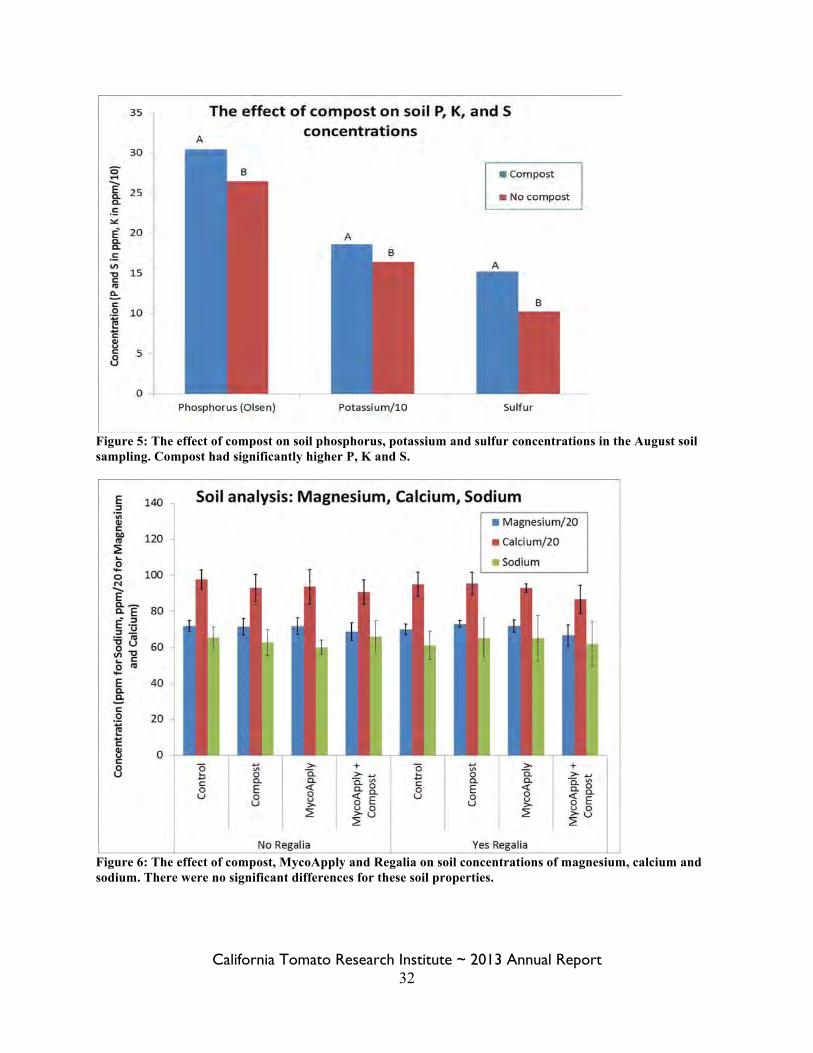
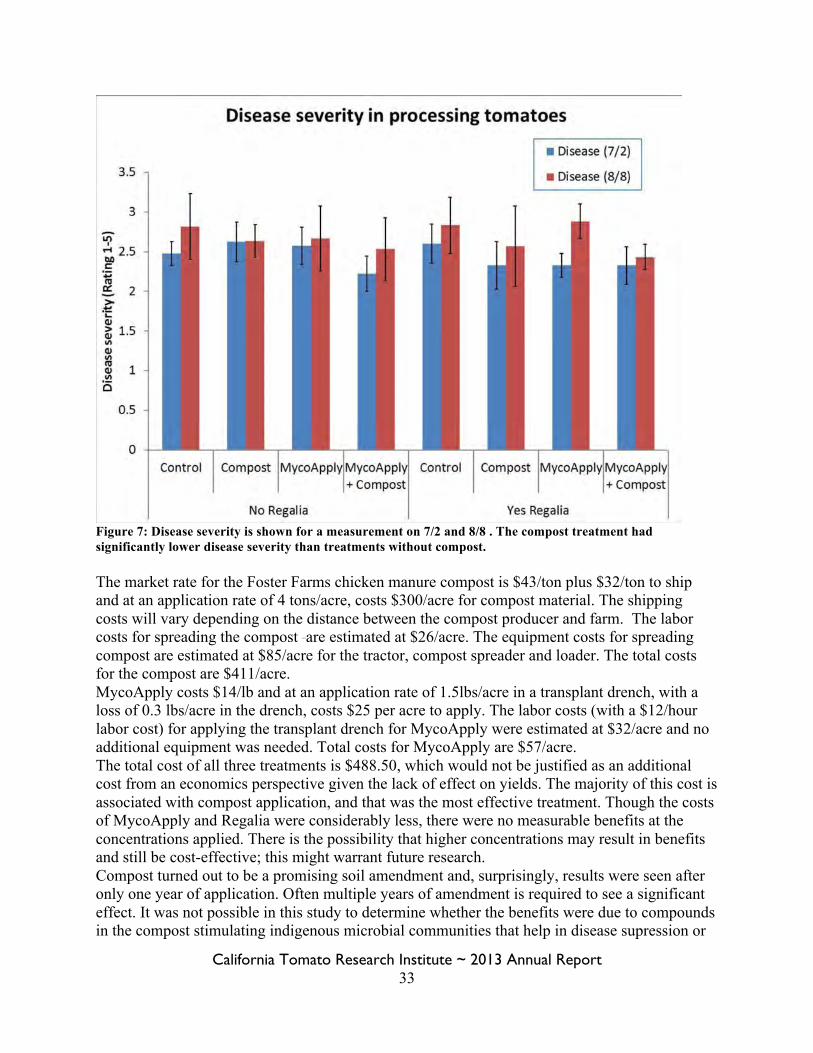
Results: The applied treatments did not significantly affect processing tomato yields, as measured by machine harvested strips (Figure 3). Mycorrhizal colonization was also not significantly affected by treatment (Figure 4). Very few samples showed any colonization; the highest percent colonization for any one replicate was 7%. The low percentage of colonization led to high a standard error. The treatment with the highest rate of success at affecting colonization appeared to be Regalia (p = 0.06), which was close to significantly affecting colonization. One hypothesis is that the low rate of colonization could potentially be due to high soil phosphorus concentrations in the soil (30 ppm, Olsen method). The treatments did have a significant effect on soil nutrient content. Compost significantly increased phosphorus (p=0.002), potassium (p= 0.005) and sulfur (p=0.002) concentrations (Figure 5). There was no significant difference between treatments for other soil properties measured, including organic matter, pH, cation exchange capacity, magnesium, calcium, or sodium (Figure 6). The first disease measurement on July 2nd did not show any significant differences between treatments (Figure 7). The disease severity measured was significantly lower for treatments with applied compost for the second disease measurement on August 8th (p = 0.03) and the two disease measurements analyzed together (p = 0.009). Diseases identified in the disease surveys included: verticillium wilt (100% incidence), fusarium crown rot, fusarium wilt, fusarium foot rot, and root knot nematodes. Aphid damage was also present on 100% of the plants at the second disease measurement. The cost of the Regalia for the project was $60/gallon and with three applications for a total of ten quarts per acre, costs $150 per acre to apply. More typical application rates in commercial agricultural operations are on the order of 2-4 quarts per acre; the higher rate was chosen for this experiment to test the efficacy of Regalia. A more typical cost would be for 4 quarts/acre at $60/acre. The labor costs for injecting Regalia are dependent on field size, for commercial application; for this 65 acre field costs would be $0.50/acre and initial equipment costs would be $14/acre. Total costs for injecting Regalia at commercial rates would be $20.50/acre.
California Tomato Research Institute ~ 2013 Annual Report 31
Figure 3: The effect of compost, MycoApply and Regalia application on processing tomato yields.
Figure 4: The effect of compost, MycoApply and Regalia on mycorrhizal colonization of processing tomato roots. The data were highly variable and no significant differences could be detected.
California Tomato Research Institute ~ 2013 Annual Report 32
Figure 5: The effect of compost on soil phosphorus, potassium and sulfur concentrations in the August soil sampling. Compost had significantly higher P, K and S.
Figure 6: The effect of compost, MycoApply and Regalia on soil concentrations of magnesium, calcium and sodium. There were no significant differences for these soil properties.
California Tomato Research Institute ~ 2013 Annual Report 33
Figure 7: Disease severity is shown for a measurement on 7/2 and 8/8 . The compost treatment had significantly lower disease severity than treatments without compost. The market rate for the Foster Farms chicken manure compost is $43/ton plus $32/ton to ship and at an application rate of 4 tons/acre, costs $300/acre for compost material. The shipping costs will vary depending on the distance between the compost producer and farm. The labor costs for spreading the compost are estimated at $26/acre. The equipment costs for spreading compost are estimated at $85/acre for the tractor, compost spreader and loader. The total costs for the compost are $411/acre. MycoApply costs $14/lb and at an application rate of 1.5lbs/acre in a transplant drench, with a loss of 0.3 lbs/acre in the drench, costs $25 per acre to apply. The labor costs (with a $12/hour labor cost) for applying the transplant drench for MycoApply were estimated at $32/acre and no additional equipment was needed. Total costs for MycoApply are $57/acre. The total cost of all three treatments is $488.50, which would not be justified as an additional cost from an economics perspective given the lack of effect on yields. The majority of this cost is associated with compost application, and that was the most effective treatment. Though the costs of MycoApply and Regalia were considerably less, there were no measurable benefits at the concentrations applied. There is the possibility that higher concentrations may result in benefits and still be cost-effective; this might warrant future research. Compost turned out to be a promising soil amendment and, surprisingly, results were seen after only one year of application. Often multiple years of amendment is required to see a significant effect. It was not possible in this study to determine whether the benefits were due to compounds in the compost stimulating indigenous microbial communities that help in disease supression or
California Tomato Research Institute ~ 2013 Annual Report 34
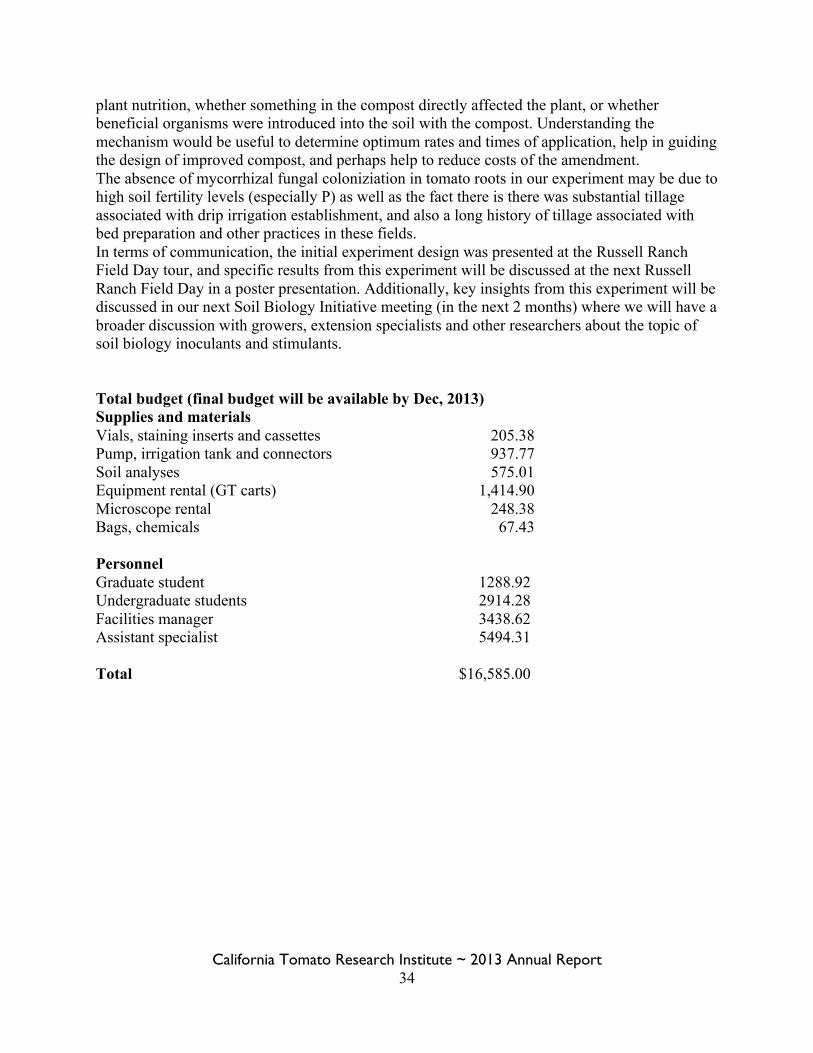
plant nutrition, whether something in the compost directly affected the plant, or whether beneficial organisms were introduced into the soil with the compost. Understanding the mechanism would be useful to determine optimum rates and times of application, help in guiding the design of improved compost, and perhaps help to reduce costs of the amendment. The absence of mycorrhizal fungal coloniziation in tomato roots in our experiment may be due to high soil fertility levels (especially P) as well as the fact there is there was substantial tillage associated with drip irrigation establishment, and also a long history of tillage associated with bed preparation and other practices in these fields. In terms of communication, the initial experiment design was presented at the Russell Ranch Field Day tour, and specific results from this experiment will be discussed at the next Russell Ranch Field Day in a poster presentation. Additionally, key insights from this experiment will be discussed in our next Soil Biology Initiative meeting (in the next 2 months) where we will have a broader discussion with growers, extension specialists and other researchers about the topic of soil biology inoculants and stimulants. Total budget (final budget will be available by Dec, 2013) Supplies and materials Vials, staining inserts and cassettes 205.38 Pump, irrigation tank and connectors 937.77 Soil analyses 575.01 Equipment rental (GT carts) 1,414.90 Microscope rental 248.38 Bags, chemicals 67.43 Personnel Graduate student 1288.92 Undergraduate students 2914.28 Facilities manager 3438.62 Assistant specialist 5494.31 Total $16,585.00
California Tomato Research Institute ~ 2013 Annual Report 35
Project Title: UCCE Statewide Processing Tomato Variety Evaluation Trials, 2013 Project Leader: Brenna Aegerter, Farm Advisor UCCE San Joaquin County 2101 E. Earhart Ave., Ste 200 Stockton, CA 95206 209-953-6114 [email protected] Cooperating UC Personnel: Diane Barrett, Food Science & Technology CE Specialist, UC Davis Tim Hartz, Vegetable Crops CE Specialist, UC Davis Michelle Le Strange, Farm Advisor, Tulare & Kings Counties Scott Stoddard, Farm Advisor, Merced & Madera Counties Tom Turini, Farm Advisor, Fresno County Mark Lundy, Farm Advisor, Colusa, Sutter & Yuba Counties Summary: University of California Cooperative Extension farm advisors, in cooperation with commercial growers and CTRI, conducted five mid-maturity variety evaluation trials in 2013. Seed companies submitted 13 replicated lines and 18 observational entries for the mid-maturity/full-season trial. Among varieties in the replicated trials, HM 1892, H 1175, H 5608 and N 6407 were highest yielding, while H 1161, AB 0311, N 6402, N 6407 and SUN 6366 were highest in soluble solids. There were few yield differences in the observational variety trials, while soluble solids were highest from HMX 2898, BQ 311, H1285, BQ 296 and UG 16609. Variety yield varied by trial, highlighting the importance of looking at results from the individual trials to gauge variety performance under different conditions. Objectives: The major objective of our project is to evaluate pre-commercial and early commercial release processing tomato varieties for fruit yield, soluble solids, color, and pH in replicated field trials conducted at multiple locations statewide. The data are combined from multiple trials to evaluate variety adaptability under a wide range of growing conditions. These tests are designed and conducted with input from seed companies, processors, and other allied industry members and are intended to generate third-party information on varieties to assist in decision-making. Procedures: Five mid-maturity/full-season variety evaluation trials were conducted in 2013. Details of the trials are presented in Table 1. Variety selections were made in November of 2012 with input from California tomato processors. Changes and/or additions were made by the seed companies based on seed availability. Table 2 lists the variety entries, their disease resistances and other characteristics as provided by the seed companies.
California Tomato Research Institute ~ 2013 Annual Report 36
New varieties are generally evaluated for one of more years in non-replicated observational trials before moving forward for evaluation in the replicated trials. Test locations were transplanted over an 11-day period from April 30th to May 10th. This year all the trials were conducted in commercial production fields with grower cooperators. Each variety was planted in a single-bed plot measuring 30 to 100 feet in length, depending on the trial location. Both double and single row plots were utilized, again depending on location (see Table 1). Experimental design of each trial was a randomized complete block with four replications. The observational trial consisted of single plots of each variety planted adjacent to the replicated trial. The farm advisor organized transplanting at the same time that the rest of the field was planted. All cultural operations, with the exception of planting and harvest, were done by the grower cooperator using the same equipment and techniques as the rest of the field. All locations used transplants and all but one used drip irrigation. Shortly before or during harvest (dates in table 1), fruit samples were collected from each plot and submitted to a grading station run by the Processing Tomato Advisory Board (PTAB) for measurement of raw fruit quality including soluble solids (°Brix, an estimate of the soluble solids percentage using a refractometer), color (LED color), and fruit pH. These samples consisted of ripe fruit picked from the vines or pulled off the harvester. Additionally, fruit samples were analyzed for cooked fruit quality by the lab of Diane Barrett at UC Davis with funding from the California League of Food Processors; results of those analyses are not reported here but are available from Dr. Barrett. For yield data, the plots were harvested with commercial harvest equipment, conveyed to a GT wagon equipped with weigh cells, and weighed before going to the bulk trailers for processing. The exception to this was the Stanislaus trial which had shorter plots of which a 20-sq ft section was harvested by hand. Yield and fruit quality data were subjected to analysis of variance using the SAS software package. When data were combined from multiple locations, the block effect was nested within each county. Mean separation tests were performed using Fisher’s protected LSD at the 5% level. The Merced trial was missing yield data from one or more plots, therefore least-squares means are reported rather than arithmetic means. At the Fresno location, variety N 6407 was not planted. Results: Replicated trials of mid-maturity/full-season varieties were conducted at five locations; results of analyses combining all locations are shown in Table 3, and results of individual trials in Tables 4 – 7.
Combining all trials together for analysis, the varieties varied significantly for yield and all fruit quality measurements. However, there was also a significant variety by location interaction for yield, meaning that varieties yielded somewhat differently depending on the trial location. Therefore, the reader should use some caution when viewing the combined results (Table 3), and may find it more informative to look at the results of individual trials (Tables 4 to 7).
California Tomato Research Institute ~ 2013 Annual Report 37
Mean yield of the combined trials was 56 tons per acre, with a range of trial averages from 48.9 (San Joaquin) to 59.5 tons per acre (Stanislaus). Variety HM 1892 ranked first overall with a mean of 62.5 tons per acre; but its rank was first only at the Stanislaus location. At other locations, first-ranked varieties were H 1175 (Colusa and Fresno) and H 5608 (San Joaquin and Merced). See Table 4. Overall, the soluble solids averaged 5.5 °Brix when data were combined from all trials, with trial averages varying from 5.1 to 5.7 °Brix (see Table 5). Top performers overall were H 1161, AB 0311, N 6402, N 6407 and SUN 6366. However, at particular locations, other varieties made it into that top group (for example, H 1170 at Colusa and San Joaquin, N 6404 at Colusa and Fresno). The leaders for Brix-yield (tons per acre x °Brix) were HM 1892, H 1161 and N 6407. The Fresno County trial had the best fruit color overall (average of 21.1). Best fruit color was observed in varieties SUN 6366, H 5608, H 1175, H 1170, AB 031, and N 6402, with LED color measurements averaging 21.3 to 22 (Table 6). Fruit pH of varieties ranged from 4.29 to 4.48 (mean = 4.39, Table 7), with lowest means for H 8504, HM 1893, and H 1161. Mid observational. Mid-maturity/full-season varieties which are new to our trial program were evaluated in single plots at five locations. Results of analyses combining five of these locations are shown in Table 8. While the average yields of varieties ranged from 36.9 to 57.7 tons per acre, varieties in the top ten ranks were are considered to have statistically similar yield. Because these varieties are not replicated within a trial location, we do not know if the variation in performance by location is due to the particular conditions of that location or due to experimental error (random factors not of interest). When all trials were combined for analysis, significant differences were found among varieties for °Brix, color, and pH. Varieties with the highest soluble solids were HMX 2898, BQ 311, BQ 296 and H 1285 (5.8 to 6 °Brix). Those with the best color included H 1292, H 1293, HMX 3907, HMX 2897 and N 6412 (measurements of 20 to 21.2). Fruit pH was lowest in UG 16609, BQ 296 and N 6410 (pH of 4.34 to 4.35). Acknowledgements: Many thanks to the California Tomato Research Institute and to participating seed companies for their support of this project. A special thanks to Chuck Rivara of CTRI for coordinating the Colusa trial in cooperation with Morning Star. The cooperation of the Processing Tomato Advisory Board and of the California tomato processors is also greatly appreciated. Thanks to Sam Matoba of the Diane Barrett lab for managing the analysis of cooked fruit quality and dealing with our compressed planting and harvest schedule this season. And lastly, we are indebted to our excellent grower cooperators for their very generous in-kind support. It is their interest in and support of research that makes this project possible.
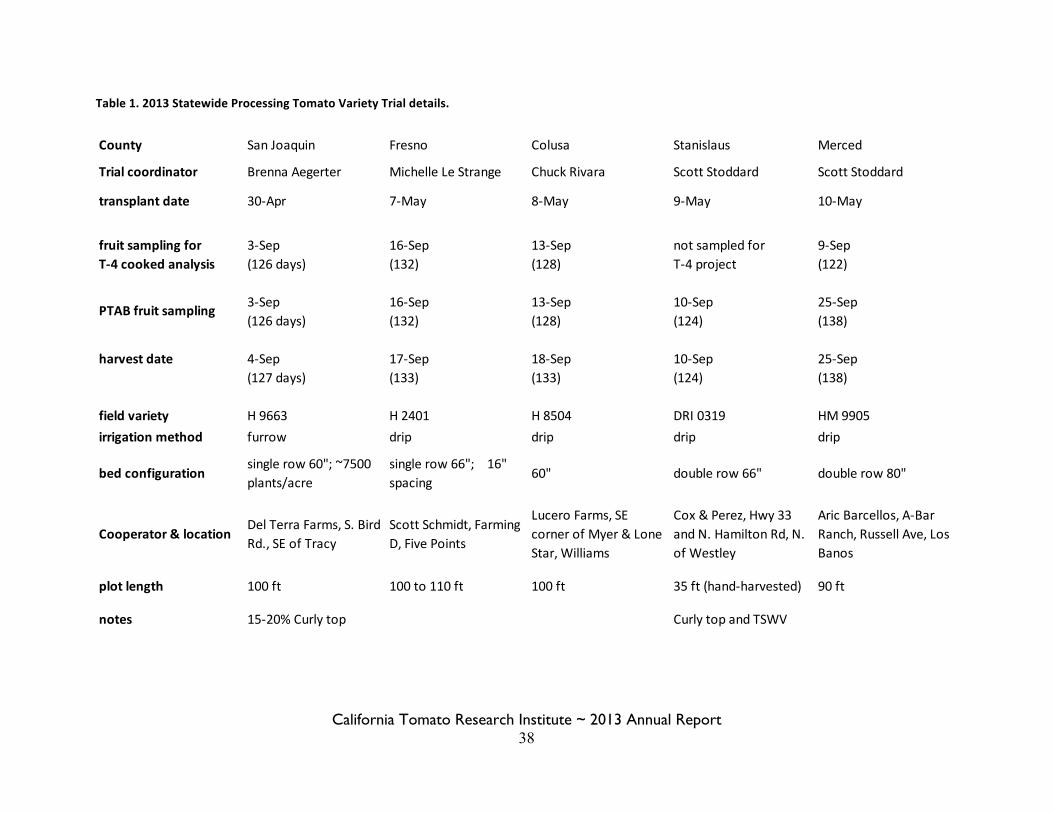
California Tomato Research Institute ~ 2013 Annual Report 38
Table 1. 2013 Statewide Processing Tomato Variety Trial details.
County San Joaquin Fresno Colusa Stanislaus Merced
Trial coordinator Brenna Aegerter Michelle Le Strange Chuck Rivara Scott Stoddard Scott Stoddard
transplant date 30-‐Apr 7-‐May 8-‐May 9-‐May 10-‐May
fruit sampling for 3-‐Sep 16-‐Sep 13-‐Sep not sampled for 9-‐SepT-‐4 cooked analysis (126 days) (132) (128) T-‐4 project (122)
3-‐Sep 16-‐Sep 13-‐Sep 10-‐Sep 25-‐Sep(126 days) (132) (128) (124) (138)
harvest date 4-‐Sep 17-‐Sep 18-‐Sep 10-‐Sep 25-‐Sep(127 days) (133) (133) (124) (138)
field variety H 9663 H 2401 H 8504 DRI 0319 HM 9905irrigation method furrow drip drip drip drip
bed configurationsingle row 60"; ~7500 plants/acre
single row 66"; 16" spacing
60" double row 66" double row 80"
Cooperator & locationDel Terra Farms, S. Bird Rd., SE of Tracy
Scott Schmidt, Farming D, Five Points
Lucero Farms, SE corner of Myer & Lone Star, Williams
Cox & Perez, Hwy 33 and N. Hamilton Rd, N. of Westley
Aric Barcellos, A-‐Bar Ranch, Russell Ave, Los Banos
plot length 100 ft 100 to 110 ft 100 ft 35 ft (hand-‐harvested) 90 ft
notes 15-‐20% Curly top Curly top and TSWV
PTAB fruit sampling
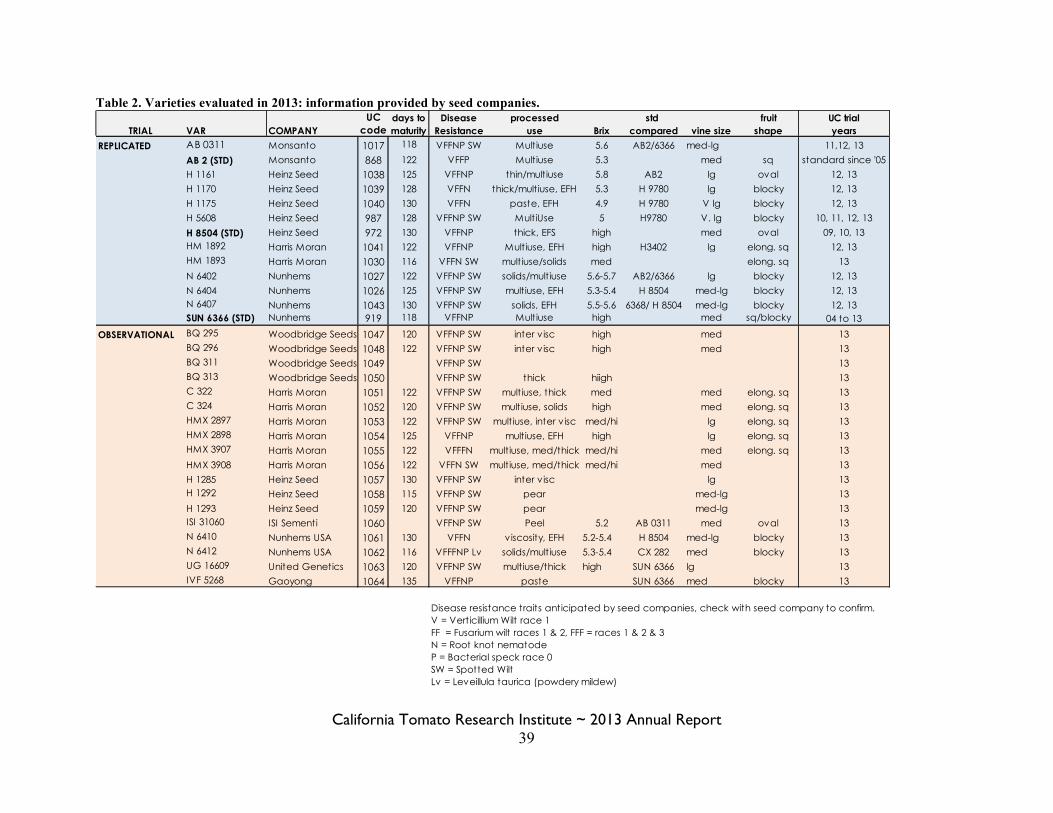
California Tomato Research Institute ~ 2013 Annual Report 39
Table 2. Varieties evaluated in 2013: information provided by seed companies.
UC days to Disease processed std fruit UC trialTRIAL VAR COMPANY code maturity Resistance use Brix compared vine size shape years
REPLICATED AB 0311 Monsanto 1017 118 VFFNP SW Multiuse 5.6 AB2/6366 med-lg 11,12, 13
AB 2 (STD) Monsanto 868 122 VFFP Multiuse 5.3 med sq standard since '05
H 1161 Heinz Seed 1038 125 VFFNP thin/multiuse 5.8 AB2 lg oval 12, 13
H 1170 Heinz Seed 1039 128 VFFN thick/multiuse, EFH 5.3 H 9780 lg blocky 12, 13
H 1175 Heinz Seed 1040 130 VFFN paste, EFH 4.9 H 9780 V lg blocky 12, 13
H 5608 Heinz Seed 987 128 VFFNP SW MultiUse 5 H9780 V. lg blocky 10, 11, 12, 13
H 8504 (STD) Heinz Seed 972 130 VFFNP thick, EFS high med oval 09, 10, 13HM 1892 Harris Moran 1041 122 VFFNP Multiuse, EFH high H3402 lg elong. sq 12, 13HM 1893 Harris Moran 1030 116 VFFN SW multiuse/solids med elong. sq 13
N 6402 Nunhems 1027 122 VFFNP SW solids/multiuse 5.6-5.7 AB2/6366 lg blocky 12, 13
N 6404 Nunhems 1026 125 VFFNP SW multiuse, EFH 5.3-5.4 H 8504 med-lg blocky 12, 13N 6407 Nunhems 1043 130 VFFNP SW solids, EFH 5.5-5.6 6368/ H 8504 med-lg blocky 12, 13SUN 6366 (STD) Nunhems 919 118 VFFNP Multiuse high med sq/blocky 04 to 13
OBSERVATIONAL BQ 295 Woodbridge Seeds 1047 120 VFFNP SW inter visc high med 13BQ 296 Woodbridge Seeds 1048 122 VFFNP SW inter visc high med 13BQ 311 Woodbridge Seeds 1049 VFFNP SW 13BQ 313 Woodbridge Seeds 1050 VFFNP SW thick hiigh 13C 322 Harris Moran 1051 122 VFFNP SW multiuse, thick med med elong. sq 13C 324 Harris Moran 1052 120 VFFNP SW multiuse, solids high med elong. sq 13HMX 2897 Harris Moran 1053 122 VFFNP SW multiuse, inter visc med/hi lg elong. sq 13HMX 2898 Harris Moran 1054 125 VFFNP multiuse, EFH high lg elong. sq 13HMX 3907 Harris Moran 1055 122 VFFFN multiuse, med/thick med/hi med elong. sq 13
HMX 3908 Harris Moran 1056 122 VFFN SW multiuse, med/thick med/hi med 13
H 1285 Heinz Seed 1057 130 VFFNP SW inter visc lg 13H 1292 Heinz Seed 1058 115 VFFNP SW pear med-lg 13
H 1293 Heinz Seed 1059 120 VFFNP SW pear med-lg 13ISI 31060 ISI Sementi 1060 VFFNP SW Peel 5.2 AB 0311 med oval 13N 6410 Nunhems USA 1061 130 VFFN viscosity, EFH 5.2-5.4 H 8504 med-lg blocky 13N 6412 Nunhems USA 1062 116 VFFFNP Lv solids/multiuse 5.3-5.4 CX 282 med blocky 13UG 16609 United Genetics 1063 120 VFFNP SW multiuse/thick high SUN 6366 lg 13IVF 5268 Gaoyong 1064 135 VFFNP paste SUN 6366 med blocky 13
Disease resistance traits anticipated by seed companies, check with seed company to confirm.V = Verticillium Wilt race 1FF = Fusarium wilt races 1 & 2, FFF = races 1 & 2 & 3N = Root knot nematodeP = Bacterial speck race 0SW = Spotted WiltLv = Leveillula taurica (powdery mildew)
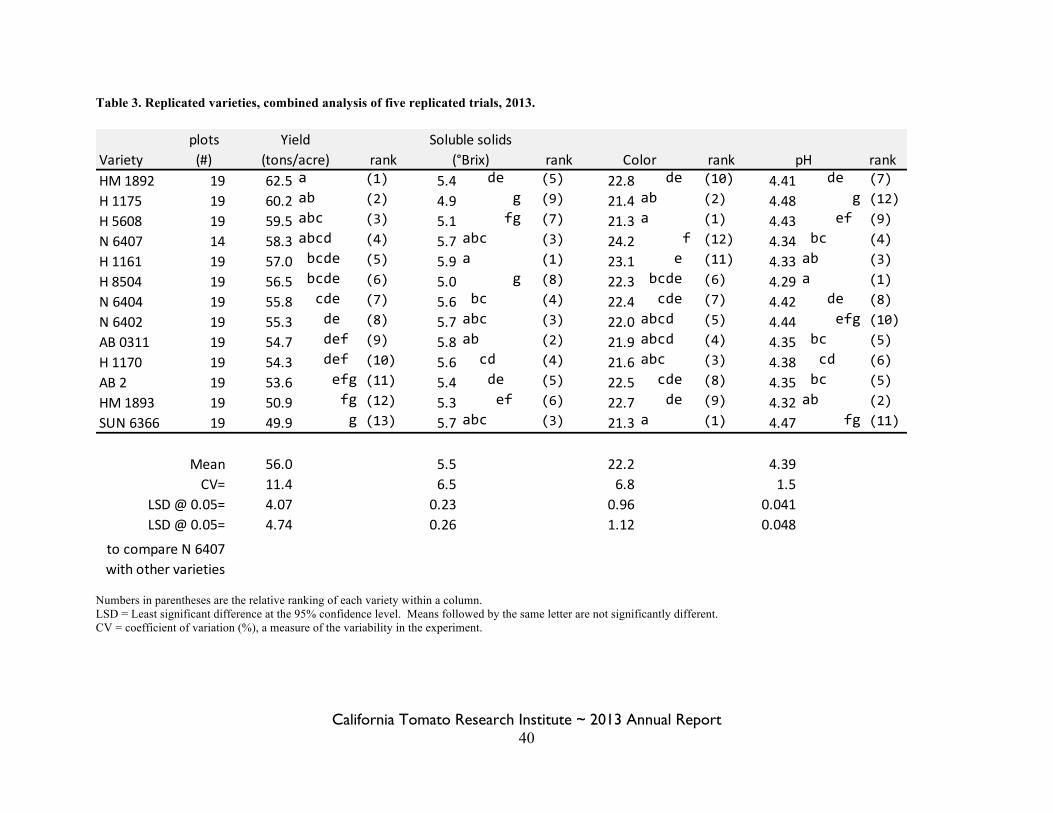
California Tomato Research Institute ~ 2013 Annual Report 40
Table 3. Replicated varieties, combined analysis of five replicated trials, 2013.
Numbers in parentheses are the relative ranking of each variety within a column. LSD = Least significant difference at the 95% confidence level. Means followed by the same letter are not significantly different. CV = coefficient of variation (%), a measure of the variability in the experiment.
plotsVariety (#) rank rank rank rankHM 1892 19 62.5 a (1) 5.4 de (5) 22.8 de (10) 4.41 de (7)H 1175 19 60.2 ab (2) 4.9 g (9) 21.4 ab (2) 4.48 g (12)H 5608 19 59.5 abc (3) 5.1 fg (7) 21.3 a (1) 4.43 ef (9)N 6407 14 58.3 abcd (4) 5.7 abc (3) 24.2 f (12) 4.34 bc (4)H 1161 19 57.0 bcde (5) 5.9 a (1) 23.1 e (11) 4.33 ab (3)H 8504 19 56.5 bcde (6) 5.0 g (8) 22.3 bcde (6) 4.29 a (1)N 6404 19 55.8 cde (7) 5.6 bc (4) 22.4 cde (7) 4.42 de (8)N 6402 19 55.3 de (8) 5.7 abc (3) 22.0 abcd (5) 4.44 efg (10)AB 0311 19 54.7 def (9) 5.8 ab (2) 21.9 abcd (4) 4.35 bc (5)H 1170 19 54.3 def (10) 5.6 cd (4) 21.6 abc (3) 4.38 cd (6)AB 2 19 53.6 efg (11) 5.4 de (5) 22.5 cde (8) 4.35 bc (5)HM 1893 19 50.9 fg (12) 5.3 ef (6) 22.7 de (9) 4.32 ab (2)SUN 6366 19 49.9 g (13) 5.7 abc (3) 21.3 a (1) 4.47 fg (11)
56.0 5.5 22.2 4.3911.4 6.5 6.8 1.54.07 0.23 0.96 0.0414.74 0.26 1.12 0.048
MeanCV=
LSD @ 0.05=LSD @ 0.05=
to compare N 6407 with other varieties
pHYield
(tons/acre)Soluble solids
(°Brix) Color
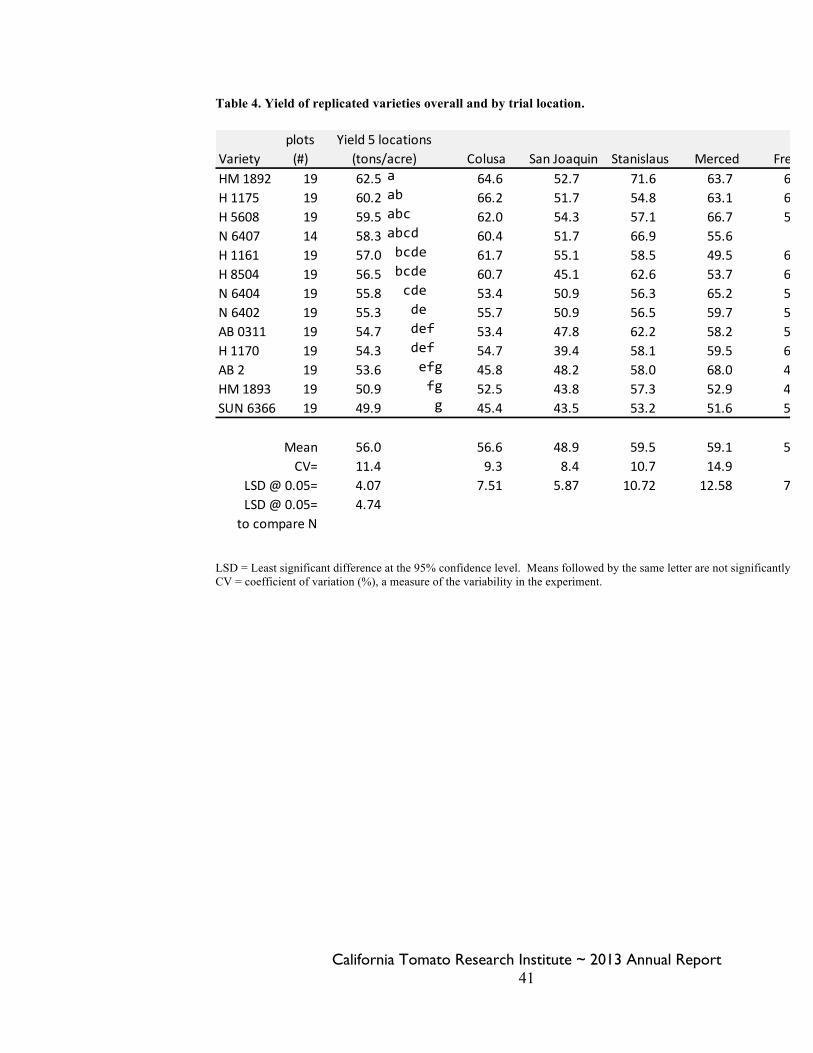
California Tomato Research Institute ~ 2013 Annual Report 41
Table 4. Yield of replicated varieties overall and by trial location.
LSD = Least significant difference at the 95% confidence level. Means followed by the same letter are not significantly different. CV = coefficient of variation (%), a measure of the variability in the experiment.
plotsVariety (#) Colusa San Joaquin Stanislaus Merced FresnoHM 1892 19 62.5 a 64.6 52.7 71.6 63.7 62.1H 1175 19 60.2 ab 66.2 51.7 54.8 63.1 63.8H 5608 19 59.5 abc 62.0 54.3 57.1 66.7 56.6N 6407 14 58.3 abcd 60.4 51.7 66.9 55.6 -‐-‐-‐H 1161 19 57.0 bcde 61.7 55.1 58.5 49.5 60.4H 8504 19 56.5 bcde 60.7 45.1 62.6 53.7 62.0N 6404 19 55.8 cde 53.4 50.9 56.3 65.2 53.5N 6402 19 55.3 de 55.7 50.9 56.5 59.7 54.1AB 0311 19 54.7 def 53.4 47.8 62.2 58.2 53.5H 1170 19 54.3 def 54.7 39.4 58.1 59.5 60.8AB 2 19 53.6 efg 45.8 48.2 58.0 68.0 49.2HM 1893 19 50.9 fg 52.5 43.8 57.3 52.9 49.4SUN 6366 19 49.9 g 45.4 43.5 53.2 51.6 56.5
56.0 56.6 48.9 59.5 59.1 56.811.4 9.3 8.4 10.7 14.9 9.14.07 7.51 5.87 10.72 12.58 7.444.74
Yield 5 locations(tons/acre)
MeanCV=
LSD @ 0.05=LSD @ 0.05=to compare N
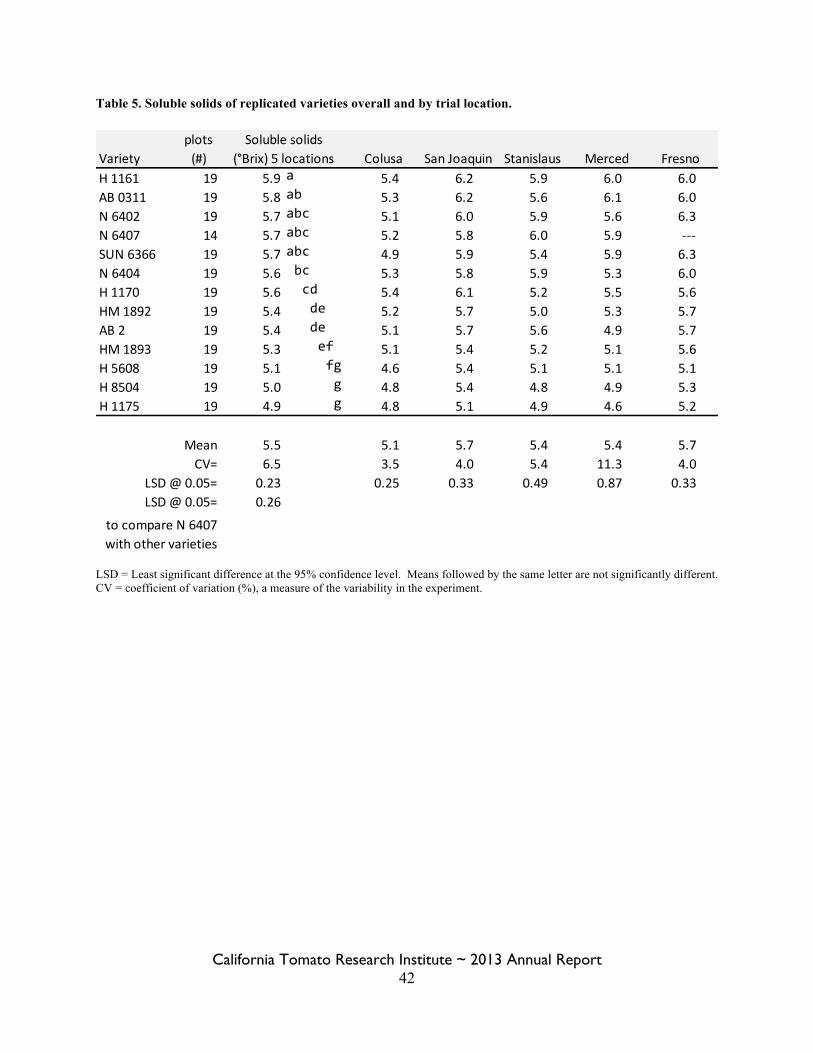
California Tomato Research Institute ~ 2013 Annual Report 42
Table 5. Soluble solids of replicated varieties overall and by trial location.
LSD = Least significant difference at the 95% confidence level. Means followed by the same letter are not significantly different. CV = coefficient of variation (%), a measure of the variability in the experiment.
plotsVariety (#) Colusa San Joaquin Stanislaus Merced FresnoH 1161 19 5.9 a 5.4 6.2 5.9 6.0 6.0AB 0311 19 5.8 ab 5.3 6.2 5.6 6.1 6.0N 6402 19 5.7 abc 5.1 6.0 5.9 5.6 6.3N 6407 14 5.7 abc 5.2 5.8 6.0 5.9 -‐-‐-‐SUN 6366 19 5.7 abc 4.9 5.9 5.4 5.9 6.3N 6404 19 5.6 bc 5.3 5.8 5.9 5.3 6.0H 1170 19 5.6 cd 5.4 6.1 5.2 5.5 5.6HM 1892 19 5.4 de 5.2 5.7 5.0 5.3 5.7AB 2 19 5.4 de 5.1 5.7 5.6 4.9 5.7HM 1893 19 5.3 ef 5.1 5.4 5.2 5.1 5.6H 5608 19 5.1 fg 4.6 5.4 5.1 5.1 5.1H 8504 19 5.0 g 4.8 5.4 4.8 4.9 5.3H 1175 19 4.9 g 4.8 5.1 4.9 4.6 5.2
5.5 5.1 5.7 5.4 5.4 5.76.5 3.5 4.0 5.4 11.3 4.00.23 0.25 0.33 0.49 0.87 0.330.26LSD @ 0.05=
to compare N 6407 with other varieties
Soluble solids(°Brix) 5 locations
MeanCV=
LSD @ 0.05=
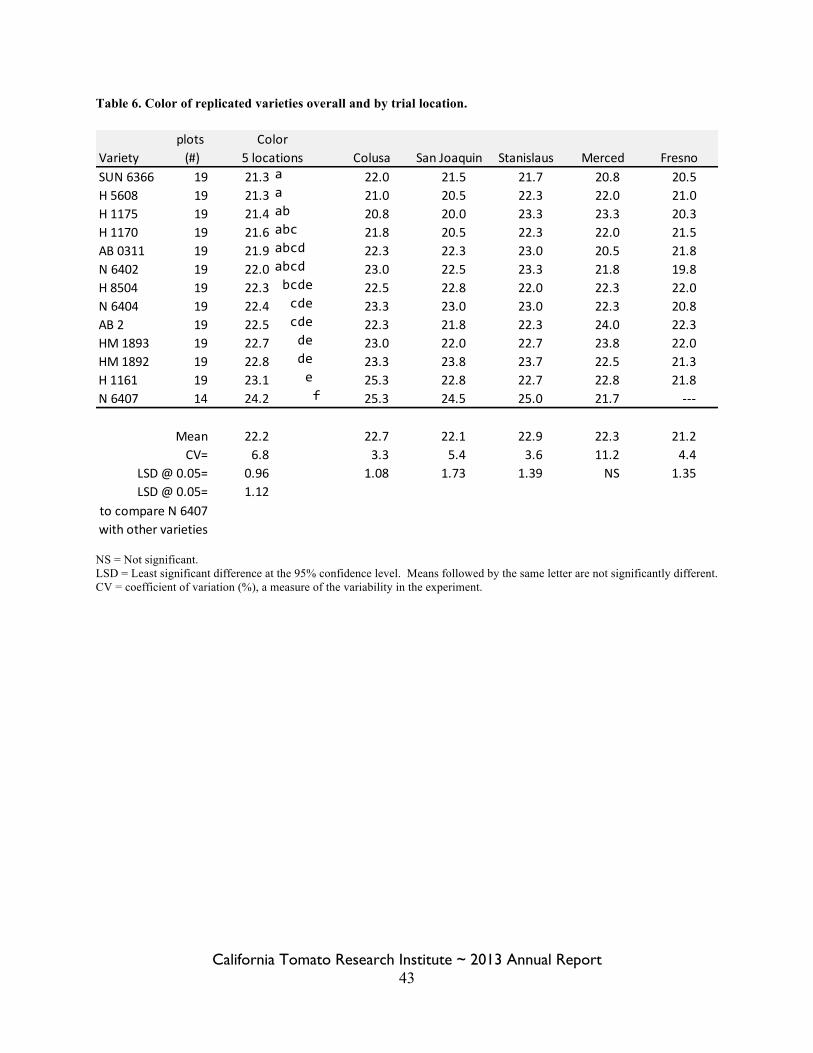
California Tomato Research Institute ~ 2013 Annual Report 43
Table 6. Color of replicated varieties overall and by trial location.
NS = Not significant. LSD = Least significant difference at the 95% confidence level. Means followed by the same letter are not significantly different. CV = coefficient of variation (%), a measure of the variability in the experiment.
plotsVariety (#) Colusa San Joaquin Stanislaus Merced FresnoSUN 6366 19 21.3 a 22.0 21.5 21.7 20.8 20.5H 5608 19 21.3 a 21.0 20.5 22.3 22.0 21.0H 1175 19 21.4 ab 20.8 20.0 23.3 23.3 20.3H 1170 19 21.6 abc 21.8 20.5 22.3 22.0 21.5AB 0311 19 21.9 abcd 22.3 22.3 23.0 20.5 21.8N 6402 19 22.0 abcd 23.0 22.5 23.3 21.8 19.8H 8504 19 22.3 bcde 22.5 22.8 22.0 22.3 22.0N 6404 19 22.4 cde 23.3 23.0 23.0 22.3 20.8AB 2 19 22.5 cde 22.3 21.8 22.3 24.0 22.3HM 1893 19 22.7 de 23.0 22.0 22.7 23.8 22.0HM 1892 19 22.8 de 23.3 23.8 23.7 22.5 21.3H 1161 19 23.1 e 25.3 22.8 22.7 22.8 21.8N 6407 14 24.2 f 25.3 24.5 25.0 21.7 -‐-‐-‐
22.2 22.7 22.1 22.9 22.3 21.26.8 3.3 5.4 3.6 11.2 4.40.96 1.08 1.73 1.39 NS 1.351.12
Color5 locations
MeanCV=
LSD @ 0.05=LSD @ 0.05=
to compare N 6407 with other varieties
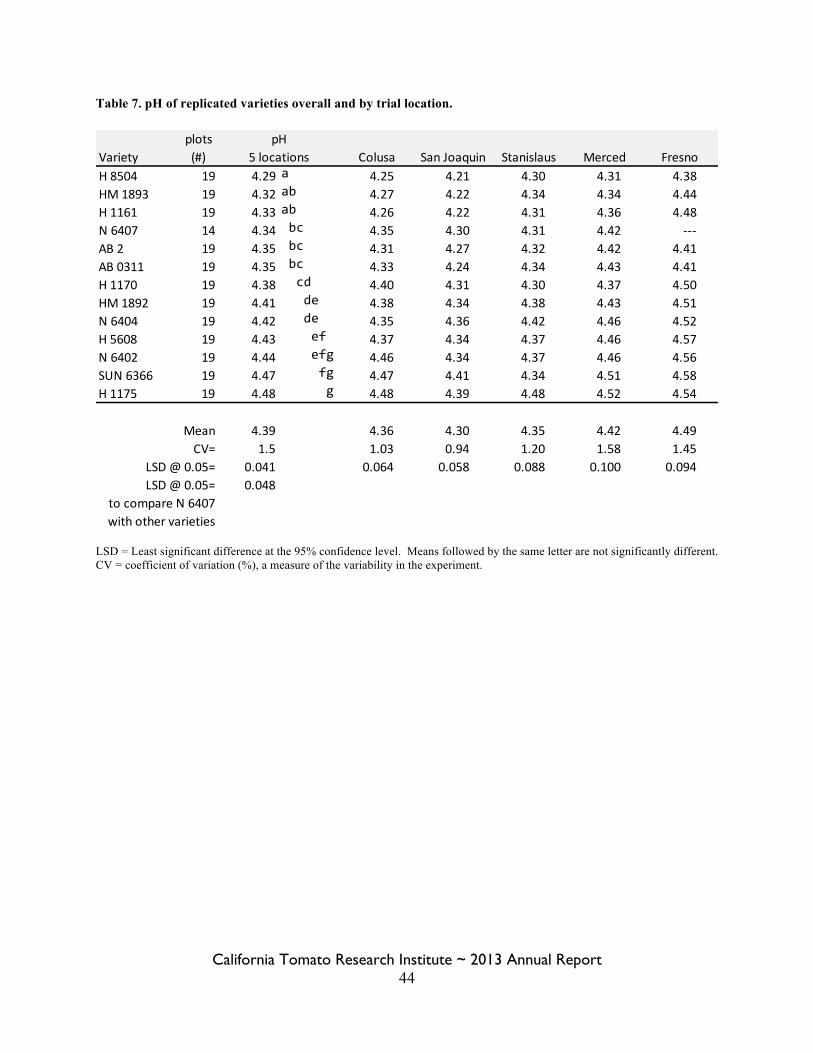
California Tomato Research Institute ~ 2013 Annual Report 44
Table 7. pH of replicated varieties overall and by trial location.
LSD = Least significant difference at the 95% confidence level. Means followed by the same letter are not significantly different. CV = coefficient of variation (%), a measure of the variability in the experiment.
plotsVariety (#) Colusa San Joaquin Stanislaus Merced FresnoH 8504 19 4.29 a 4.25 4.21 4.30 4.31 4.38HM 1893 19 4.32 ab 4.27 4.22 4.34 4.34 4.44H 1161 19 4.33 ab 4.26 4.22 4.31 4.36 4.48N 6407 14 4.34 bc 4.35 4.30 4.31 4.42 -‐-‐-‐AB 2 19 4.35 bc 4.31 4.27 4.32 4.42 4.41AB 0311 19 4.35 bc 4.33 4.24 4.34 4.43 4.41H 1170 19 4.38 cd 4.40 4.31 4.30 4.37 4.50HM 1892 19 4.41 de 4.38 4.34 4.38 4.43 4.51N 6404 19 4.42 de 4.35 4.36 4.42 4.46 4.52H 5608 19 4.43 ef 4.37 4.34 4.37 4.46 4.57N 6402 19 4.44 efg 4.46 4.34 4.37 4.46 4.56SUN 6366 19 4.47 fg 4.47 4.41 4.34 4.51 4.58H 1175 19 4.48 g 4.48 4.39 4.48 4.52 4.54
4.39 4.36 4.30 4.35 4.42 4.491.5 1.03 0.94 1.20 1.58 1.45
0.041 0.064 0.058 0.088 0.100 0.0940.048LSD @ 0.05=
to compare N 6407 with other varieties
pH5 locations
MeanCV=
LSD @ 0.05=
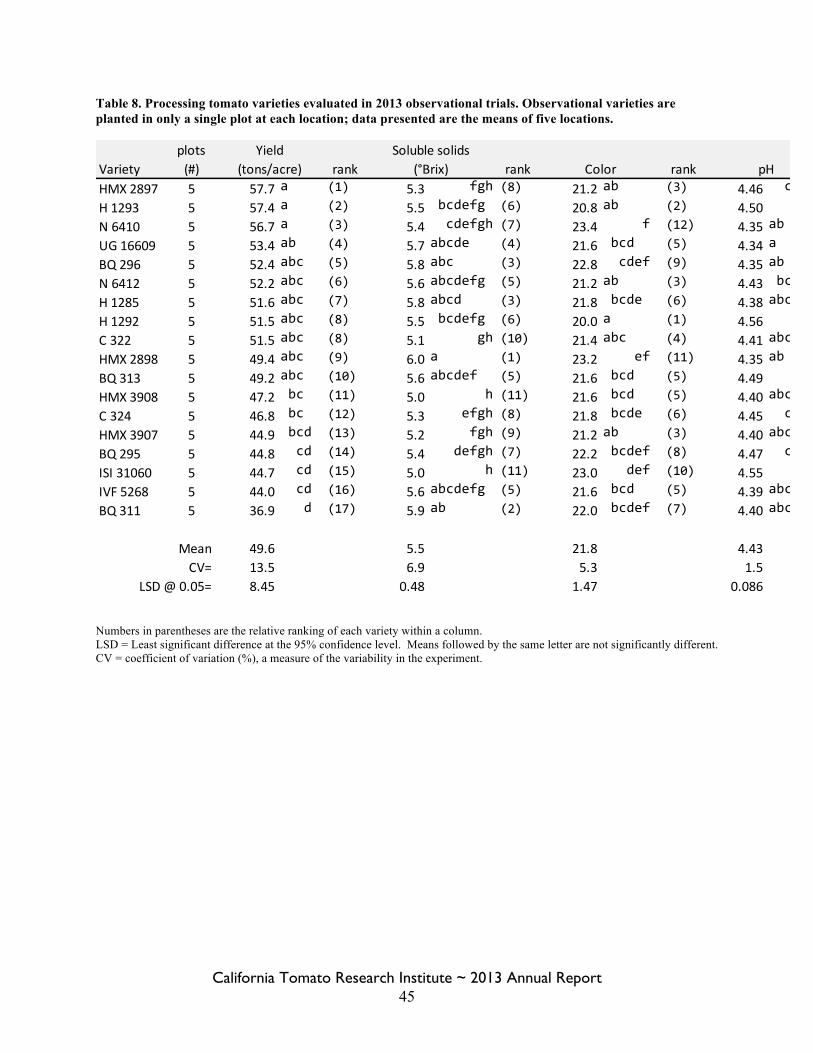
California Tomato Research Institute ~ 2013 Annual Report 45
Table 8. Processing tomato varieties evaluated in 2013 observational trials. Observational varieties are planted in only a single plot at each location; data presented are the means of five locations.
Numbers in parentheses are the relative ranking of each variety within a column. LSD = Least significant difference at the 95% confidence level. Means followed by the same letter are not significantly different. CV = coefficient of variation (%), a measure of the variability in the experiment.
plotsVariety (#) rank rank rank rankHMX 2897 5 57.7 a (1) 5.3 fgh (8) 21.2 ab (3) 4.46 cd (9)H 1293 5 57.4 a (2) 5.5 bcdefg (6) 20.8 ab (2) 4.50 def (12)N 6410 5 56.7 a (3) 5.4 cdefgh (7) 23.4 f (12) 4.35 ab (2)UG 16609 5 53.4 ab (4) 5.7 abcde (4) 21.6 bcd (5) 4.34 a (1)BQ 296 5 52.4 abc (5) 5.8 abc (3) 22.8 cdef (9) 4.35 ab (2)N 6412 5 52.2 abc (6) 5.6 abcdefg (5) 21.2 ab (3) 4.43 bcd (7)H 1285 5 51.6 abc (7) 5.8 abcd (3) 21.8 bcde (6) 4.38 abc (3)H 1292 5 51.5 abc (8) 5.5 bcdefg (6) 20.0 a (1) 4.56 f (14)C 322 5 51.5 abc (8) 5.1 gh (10) 21.4 abc (4) 4.41 abc (6)HMX 2898 5 49.4 abc (9) 6.0 a (1) 23.2 ef (11) 4.35 ab (2)BQ 313 5 49.2 abc (10) 5.6 abcdef (5) 21.6 bcd (5) 4.49 def (11)HMX 3908 5 47.2 bc (11) 5.0 h (11) 21.6 bcd (5) 4.40 abc (5)C 324 5 46.8 bc (12) 5.3 efgh (8) 21.8 bcde (6) 4.45 cd (8)HMX 3907 5 44.9 bcd (13) 5.2 fgh (9) 21.2 ab (3) 4.40 abc (5)BQ 295 5 44.8 cd (14) 5.4 defgh (7) 22.2 bcdef (8) 4.47 cde (10)ISI 31060 5 44.7 cd (15) 5.0 h (11) 23.0 def (10) 4.55 ef (13)IVF 5268 5 44.0 cd (16) 5.6 abcdefg (5) 21.6 bcd (5) 4.39 abc (4)BQ 311 5 36.9 d (17) 5.9 ab (2) 22.0 bcdef (7) 4.40 abc (5)
49.6 5.5 21.8 4.4313.5 6.9 5.3 1.58.45 0.48 1.47 0.086
MeanCV=
LSD @ 0.05=
pHYield Soluble solids
(tons/acre) (°Brix) Color
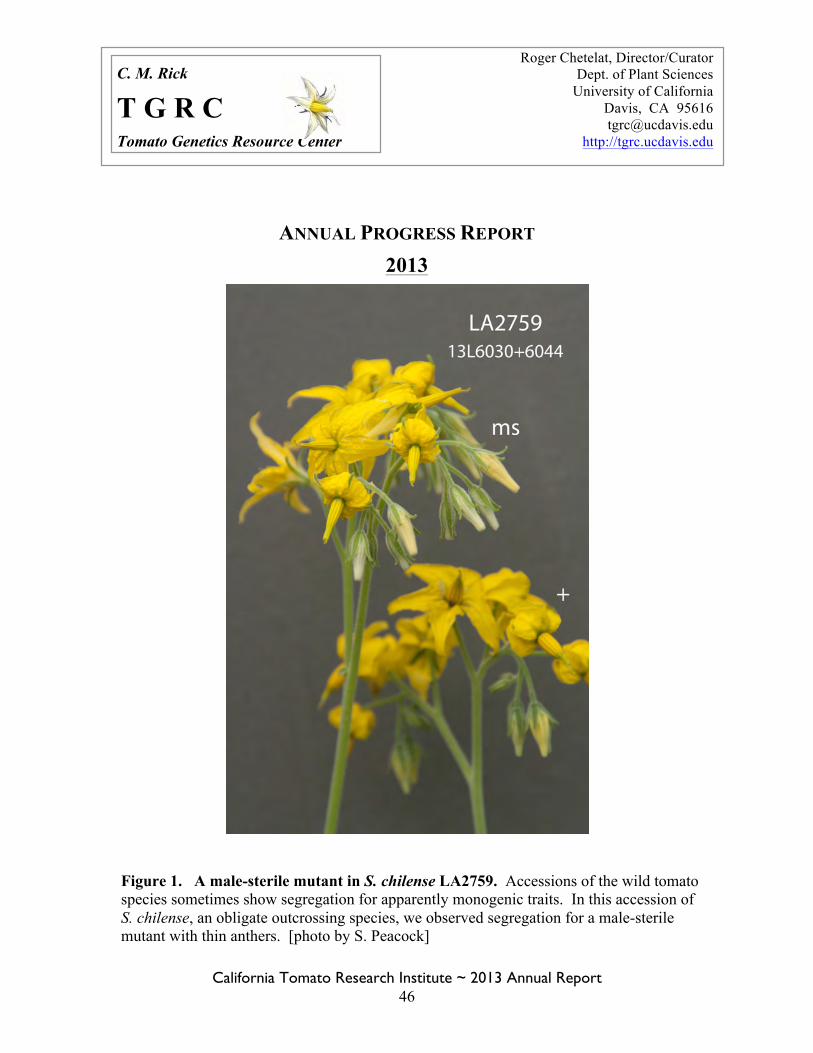
California Tomato Research Institute ~ 2013 Annual Report 46
ANNUAL PROGRESS REPORT 2013
Roger Chetelat, Director/Curator Dept. of Plant Sciences
University of California Davis, CA 95616 [email protected]
http://tgrc.ucdavis.edu
C. M. Rick
T G R C
Tomato Genetics Resource Center
Figure 1. A male-sterile mutant in S. chilense LA2759. Accessions of the wild tomato species sometimes show segregation for apparently monogenic traits. In this accession of S. chilense, an obligate outcrossing species, we observed segregation for a male-sterile mutant with thin anthers. [photo by S. Peacock]
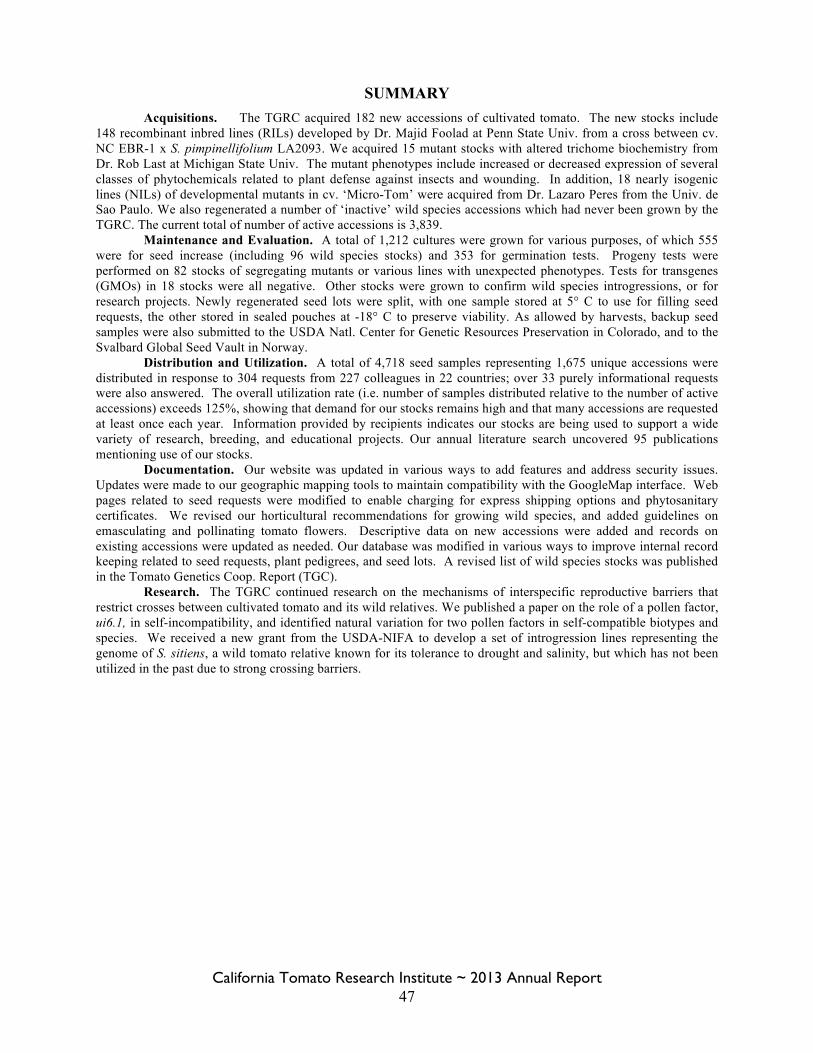
California Tomato Research Institute ~ 2013 Annual Report 47
SUMMARY Acquisitions. The TGRC acquired 182 new accessions of cultivated tomato. The new stocks include 148 recombinant inbred lines (RILs) developed by Dr. Majid Foolad at Penn State Univ. from a cross between cv. NC EBR-1 x S. pimpinellifolium LA2093. We acquired 15 mutant stocks with altered trichome biochemistry from Dr. Rob Last at Michigan State Univ. The mutant phenotypes include increased or decreased expression of several classes of phytochemicals related to plant defense against insects and wounding. In addition, 18 nearly isogenic lines (NILs) of developmental mutants in cv. ‘Micro-Tom’ were acquired from Dr. Lazaro Peres from the Univ. de Sao Paulo. We also regenerated a number of ‘inactive’ wild species accessions which had never been grown by the TGRC. The current total of number of active accessions is 3,839. Maintenance and Evaluation. A total of 1,212 cultures were grown for various purposes, of which 555 were for seed increase (including 96 wild species stocks) and 353 for germination tests. Progeny tests were performed on 82 stocks of segregating mutants or various lines with unexpected phenotypes. Tests for transgenes (GMOs) in 18 stocks were all negative. Other stocks were grown to confirm wild species introgressions, or for research projects. Newly regenerated seed lots were split, with one sample stored at 5° C to use for filling seed requests, the other stored in sealed pouches at -18° C to preserve viability. As allowed by harvests, backup seed samples were also submitted to the USDA Natl. Center for Genetic Resources Preservation in Colorado, and to the Svalbard Global Seed Vault in Norway. Distribution and Utilization. A total of 4,718 seed samples representing 1,675 unique accessions were distributed in response to 304 requests from 227 colleagues in 22 countries; over 33 purely informational requests were also answered. The overall utilization rate (i.e. number of samples distributed relative to the number of active accessions) exceeds 125%, showing that demand for our stocks remains high and that many accessions are requested at least once each year. Information provided by recipients indicates our stocks are being used to support a wide variety of research, breeding, and educational projects. Our annual literature search uncovered 95 publications mentioning use of our stocks. Documentation. Our website was updated in various ways to add features and address security issues. Updates were made to our geographic mapping tools to maintain compatibility with the GoogleMap interface. Web pages related to seed requests were modified to enable charging for express shipping options and phytosanitary certificates. We revised our horticultural recommendations for growing wild species, and added guidelines on emasculating and pollinating tomato flowers. Descriptive data on new accessions were added and records on existing accessions were updated as needed. Our database was modified in various ways to improve internal record keeping related to seed requests, plant pedigrees, and seed lots. A revised list of wild species stocks was published in the Tomato Genetics Coop. Report (TGC). Research. The TGRC continued research on the mechanisms of interspecific reproductive barriers that restrict crosses between cultivated tomato and its wild relatives. We published a paper on the role of a pollen factor, ui6.1, in self-incompatibility, and identified natural variation for two pollen factors in self-compatible biotypes and species. We received a new grant from the USDA-NIFA to develop a set of introgression lines representing the genome of S. sitiens, a wild tomato relative known for its tolerance to drought and salinity, but which has not been utilized in the past due to strong crossing barriers.
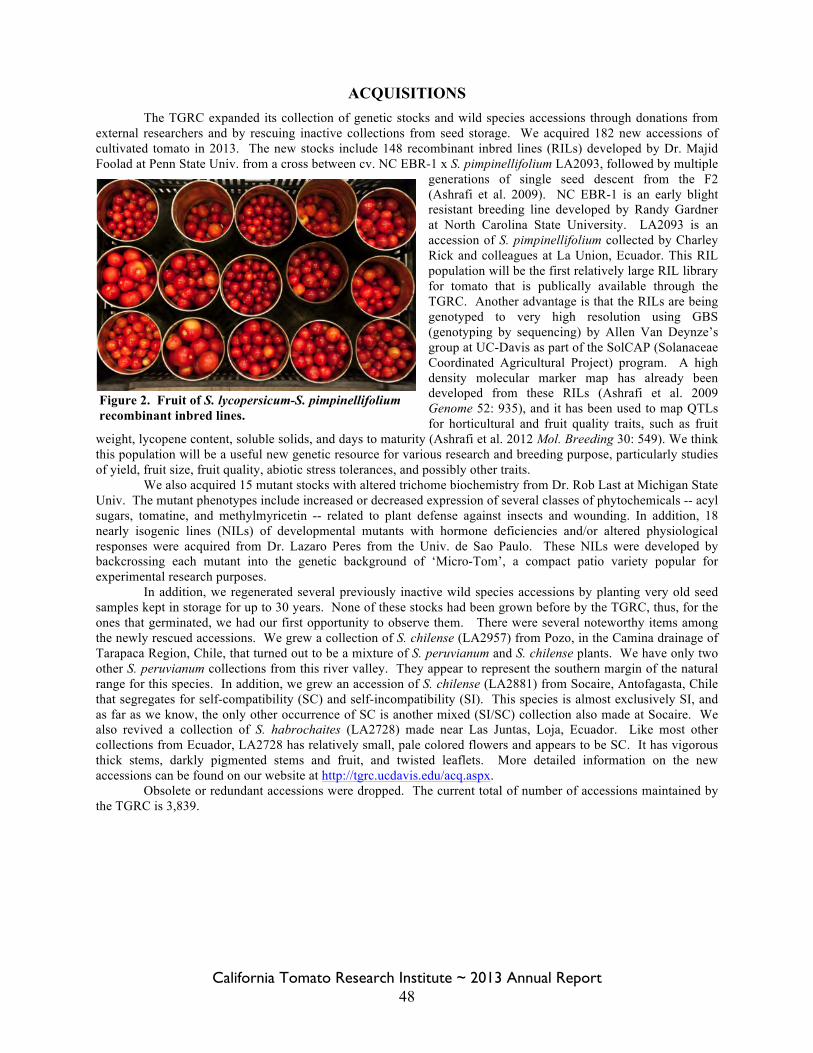
California Tomato Research Institute ~ 2013 Annual Report 48
ACQUISITIONS The TGRC expanded its collection of genetic stocks and wild species accessions through donations from external researchers and by rescuing inactive collections from seed storage. We acquired 182 new accessions of cultivated tomato in 2013. The new stocks include 148 recombinant inbred lines (RILs) developed by Dr. Majid Foolad at Penn State Univ. from a cross between cv. NC EBR-1 x S. pimpinellifolium LA2093, followed by multiple
generations of single seed descent from the F2 (Ashrafi et al. 2009). NC EBR-1 is an early blight resistant breeding line developed by Randy Gardner at North Carolina State University. LA2093 is an accession of S. pimpinellifolium collected by Charley Rick and colleagues at La Union, Ecuador. This RIL population will be the first relatively large RIL library for tomato that is publically available through the TGRC. Another advantage is that the RILs are being genotyped to very high resolution using GBS (genotyping by sequencing) by Allen Van Deynze’s group at UC-Davis as part of the SolCAP (Solanaceae Coordinated Agricultural Project) program. A high density molecular marker map has already been developed from these RILs (Ashrafi et al. 2009 Genome 52: 935), and it has been used to map QTLs for horticultural and fruit quality traits, such as fruit
weight, lycopene content, soluble solids, and days to maturity (Ashrafi et al. 2012 Mol. Breeding 30: 549). We think this population will be a useful new genetic resource for various research and breeding purpose, particularly studies of yield, fruit size, fruit quality, abiotic stress tolerances, and possibly other traits. We also acquired 15 mutant stocks with altered trichome biochemistry from Dr. Rob Last at Michigan State Univ. The mutant phenotypes include increased or decreased expression of several classes of phytochemicals -- acyl sugars, tomatine, and methylmyricetin -- related to plant defense against insects and wounding. In addition, 18 nearly isogenic lines (NILs) of developmental mutants with hormone deficiencies and/or altered physiological responses were acquired from Dr. Lazaro Peres from the Univ. de Sao Paulo. These NILs were developed by backcrossing each mutant into the genetic background of ‘Micro-Tom’, a compact patio variety popular for experimental research purposes. In addition, we regenerated several previously inactive wild species accessions by planting very old seed samples kept in storage for up to 30 years. None of these stocks had been grown before by the TGRC, thus, for the ones that germinated, we had our first opportunity to observe them. There were several noteworthy items among the newly rescued accessions. We grew a collection of S. chilense (LA2957) from Pozo, in the Camina drainage of Tarapaca Region, Chile, that turned out to be a mixture of S. peruvianum and S. chilense plants. We have only two other S. peruvianum collections from this river valley. They appear to represent the southern margin of the natural range for this species. In addition, we grew an accession of S. chilense (LA2881) from Socaire, Antofagasta, Chile that segregates for self-compatibility (SC) and self-incompatibility (SI). This species is almost exclusively SI, and as far as we know, the only other occurrence of SC is another mixed (SI/SC) collection also made at Socaire. We also revived a collection of S. habrochaites (LA2728) made near Las Juntas, Loja, Ecuador. Like most other collections from Ecuador, LA2728 has relatively small, pale colored flowers and appears to be SC. It has vigorous thick stems, darkly pigmented stems and fruit, and twisted leaflets. More detailed information on the new accessions can be found on our website at http://tgrc.ucdavis.edu/acq.aspx. Obsolete or redundant accessions were dropped. The current total of number of accessions maintained by the TGRC is 3,839.
Figure 2. Fruit of S. lycopersicum-S. pimpinellifolium recombinant inbred lines.
California Tomato Research Institute ~ 2013 Annual Report 49
Table 1. Number of accessions of each species maintained by the TGRC. The totals include some accessions that are currently unavailable for distribution.
Solanum name Lycopersicon equivalent No. of Accessions S. lycopersicum L. esculentum, including var.
cerasiforme 2,685
S. pimpinellifolium L. pimpinellifolium 311 S. cheesmaniae L. cheesmanii 41 S. galapagense L. cheesmanii f. minor 29 S. chmielewskii L. chmielewskii 29 S. neorickii L. parviflorum 52 S. arcanum L. peruvianum, including f. humifusum 46 S. peruvianum L. peruvianum 75 S. huaylasense L. peruvianum 19 S. corneliomulleri L. peruvianum, including f.
glandulosum 57
S. chilense L. chilense 118 S. habrochaites L. hirsutum, including f. glabratum 124 S. pennellii L. pennellii, including var. puberulum 51 S. lycopersicoides n/a 24 S. sitiens n/a 13 S. juglandifolium n/a 6 S. ochranthum n/a 9 Interspecific hybrids, RILs n/a 150 Total 3,839
MAINTENANCE Led by Scott Peacock and his crew of undergraduate student assistants, the TGRC again managed large field and greenhouse plantings this year. A total of 1,212 families were grown for various purposes; 555 of these were for seed increase, including 96 of wild species accessions, most of which required greenhouse culture. The rest were grown for germination tests, evaluation, introgression of the S. sitiens genome, research on reproductive barriers, or other purposes. Identifying accessions in need of regeneration begins with seed germination testing. Seed lots with a germination rate that fails to meet our threshold of 80% are normally regenerated in the same year. Other factors, such as available space, age of seed and supply on hand, are also taken into account. Newly acquired accessions are typically regenerated in the first year or so after acquisition because seed supplies are limited and of uncertain viability. This year, 353 seed lots were tested for germination responses. Average germination rates continued to be relatively high for most species (Table 2), indicating conditions in our seed vault are satisfactory. We observed unusually poor germination responses in seed lots of cultivated tomato and cherry tomato, possibly due to technical problems with those tests. We sometimes encounter lack of uniformity in seed bleaching or seed wetting. Use of cheesecloth ‘tea bags’ for bleaching multiple seed lots, and thicker germination paper (the blue blotter paper) for sprouting seeds give more consistent results than other methods we’ve tried.
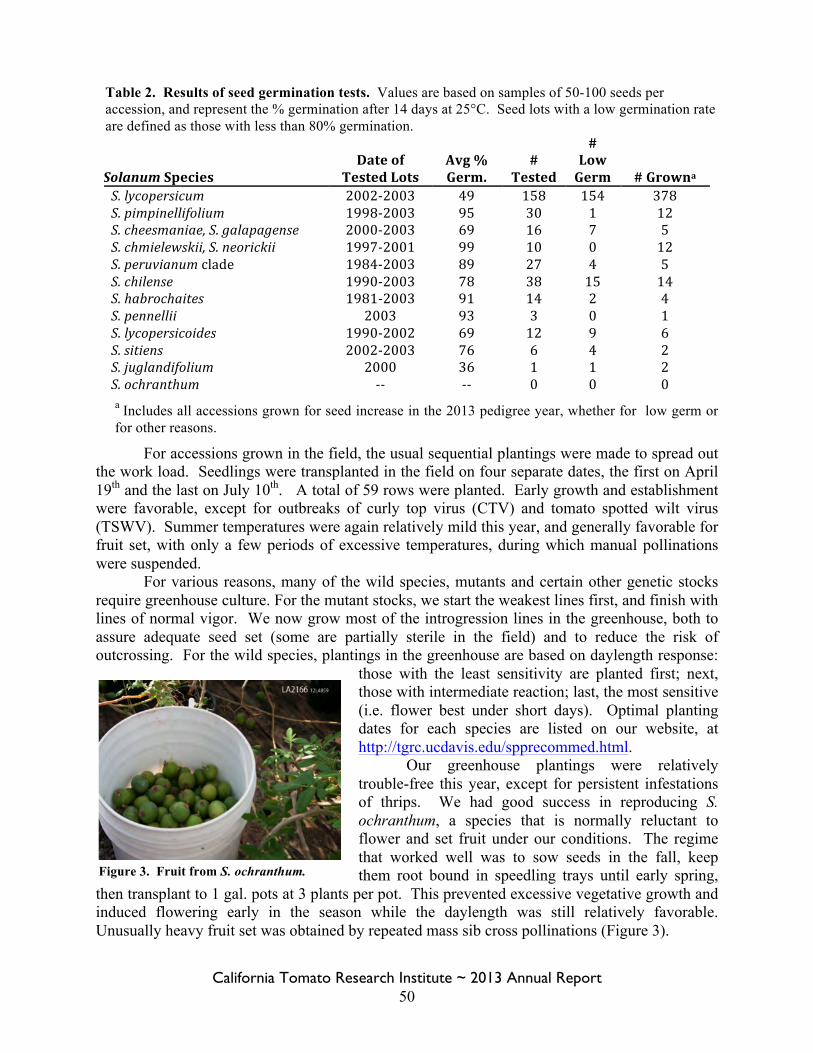
California Tomato Research Institute ~ 2013 Annual Report 50
Table 2. Results of seed germination tests. Values are based on samples of 50-100 seeds per accession, and represent the % germination after 14 days at 25°C. Seed lots with a low germination rate are defined as those with less than 80% germination.
SoSolanum Species Date of
Tested Lots Avg % Germ.
# Tested
# Low Germ # Growna
S. lycopersicum 2002-‐2003 49 158 154 378 S. pimpinellifolium 1998-‐2003 95 30 1 12 S. cheesmaniae, S. galapagense 2000-‐2003 69 16 7 5 S. chmielewskii, S. neorickii 1997-‐2001 99 10 0 12 S. peruvianum clade 1984-‐2003 89 27 4 5 S. chilense 1990-‐2003 78 38 15 14 S. habrochaites 1981-‐2003 91 14 2 4 S. pennellii 2003 93 3 0 1 S. lycopersicoides 1990-‐2002 69 12 9 6 S. sitiens 2002-‐2003 76 6 4 2 S. juglandifolium 2000 36 1 1 2 S. ochranthum -‐-‐ -‐-‐ 0 0 0 a Includes all accessions grown for seed increase in the 2013 pedigree year, whether for low germ or for other reasons.
For accessions grown in the field, the usual sequential plantings were made to spread out the work load. Seedlings were transplanted in the field on four separate dates, the first on April 19th and the last on July 10th. A total of 59 rows were planted. Early growth and establishment were favorable, except for outbreaks of curly top virus (CTV) and tomato spotted wilt virus (TSWV). Summer temperatures were again relatively mild this year, and generally favorable for fruit set, with only a few periods of excessive temperatures, during which manual pollinations were suspended.
For various reasons, many of the wild species, mutants and certain other genetic stocks require greenhouse culture. For the mutant stocks, we start the weakest lines first, and finish with lines of normal vigor. We now grow most of the introgression lines in the greenhouse, both to assure adequate seed set (some are partially sterile in the field) and to reduce the risk of outcrossing. For the wild species, plantings in the greenhouse are based on daylength response:
those with the least sensitivity are planted first; next, those with intermediate reaction; last, the most sensitive (i.e. flower best under short days). Optimal planting dates for each species are listed on our website, at http://tgrc.ucdavis.edu/spprecommed.html.
Our greenhouse plantings were relatively trouble-free this year, except for persistent infestations of thrips. We had good success in reproducing S. ochranthum, a species that is normally reluctant to flower and set fruit under our conditions. The regime that worked well was to sow seeds in the fall, keep them root bound in speedling trays until early spring,
then transplant to 1 gal. pots at 3 plants per pot. This prevented excessive vegetative growth and induced flowering early in the season while the daylength was still relatively favorable. Unusually heavy fruit set was obtained by repeated mass sib cross pollinations (Figure 3).
Figure 3. Fruit from S. ochranthum.
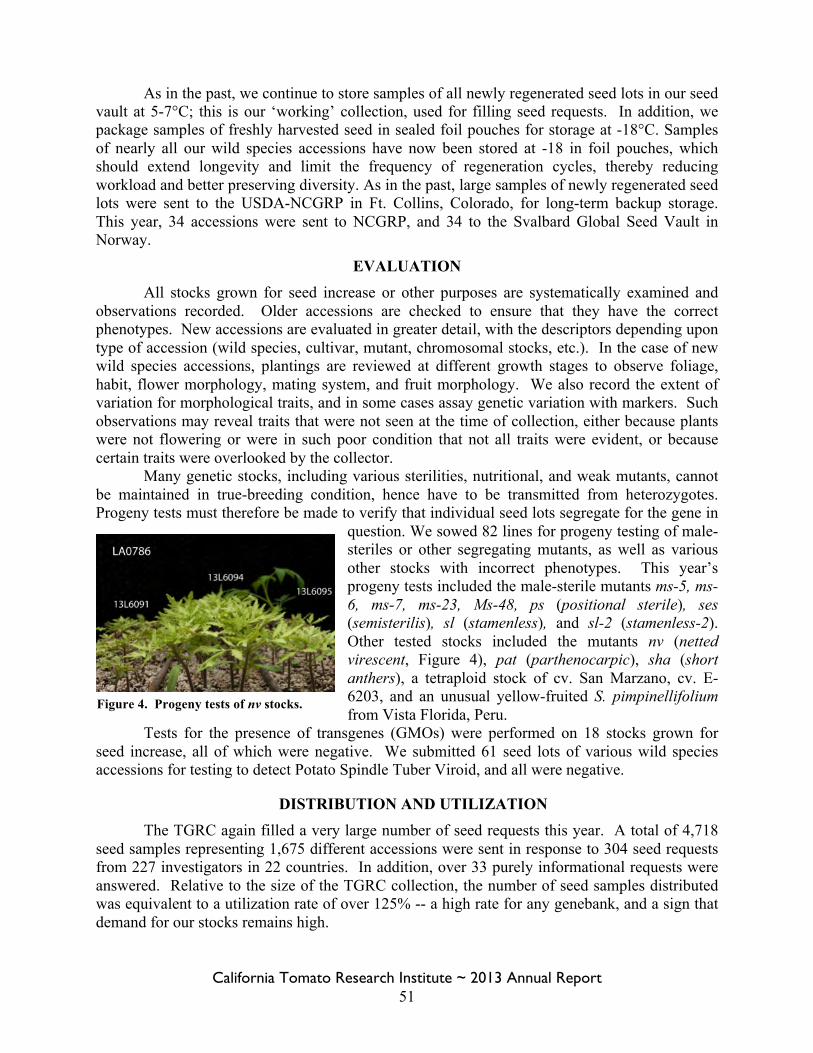
California Tomato Research Institute ~ 2013 Annual Report 51
As in the past, we continue to store samples of all newly regenerated seed lots in our seed vault at 5-7°C; this is our ‘working’ collection, used for filling seed requests. In addition, we package samples of freshly harvested seed in sealed foil pouches for storage at -18°C. Samples of nearly all our wild species accessions have now been stored at -18 in foil pouches, which should extend longevity and limit the frequency of regeneration cycles, thereby reducing workload and better preserving diversity. As in the past, large samples of newly regenerated seed lots were sent to the USDA-NCGRP in Ft. Collins, Colorado, for long-term backup storage. This year, 34 accessions were sent to NCGRP, and 34 to the Svalbard Global Seed Vault in Norway.
EVALUATION All stocks grown for seed increase or other purposes are systematically examined and observations recorded. Older accessions are checked to ensure that they have the correct phenotypes. New accessions are evaluated in greater detail, with the descriptors depending upon type of accession (wild species, cultivar, mutant, chromosomal stocks, etc.). In the case of new wild species accessions, plantings are reviewed at different growth stages to observe foliage, habit, flower morphology, mating system, and fruit morphology. We also record the extent of variation for morphological traits, and in some cases assay genetic variation with markers. Such observations may reveal traits that were not seen at the time of collection, either because plants were not flowering or were in such poor condition that not all traits were evident, or because certain traits were overlooked by the collector.
Many genetic stocks, including various sterilities, nutritional, and weak mutants, cannot be maintained in true-breeding condition, hence have to be transmitted from heterozygotes. Progeny tests must therefore be made to verify that individual seed lots segregate for the gene in
question. We sowed 82 lines for progeny testing of male-steriles or other segregating mutants, as well as various other stocks with incorrect phenotypes. This year’s progeny tests included the male-sterile mutants ms-5, ms-6, ms-7, ms-23, Ms-48, ps (positional sterile), ses (semisterilis), sl (stamenless), and sl-2 (stamenless-2). Other tested stocks included the mutants nv (netted virescent, Figure 4), pat (parthenocarpic), sha (short anthers), a tetraploid stock of cv. San Marzano, cv. E-6203, and an unusual yellow-fruited S. pimpinellifolium from Vista Florida, Peru.
Tests for the presence of transgenes (GMOs) were performed on 18 stocks grown for seed increase, all of which were negative. We submitted 61 seed lots of various wild species accessions for testing to detect Potato Spindle Tuber Viroid, and all were negative.
DISTRIBUTION AND UTILIZATION The TGRC again filled a very large number of seed requests this year. A total of 4,718 seed samples representing 1,675 different accessions were sent in response to 304 seed requests from 227 investigators in 22 countries. In addition, over 33 purely informational requests were answered. Relative to the size of the TGRC collection, the number of seed samples distributed was equivalent to a utilization rate of over 125% -- a high rate for any genebank, and a sign that demand for our stocks remains high.
Figure 4. Progeny tests of nv stocks.
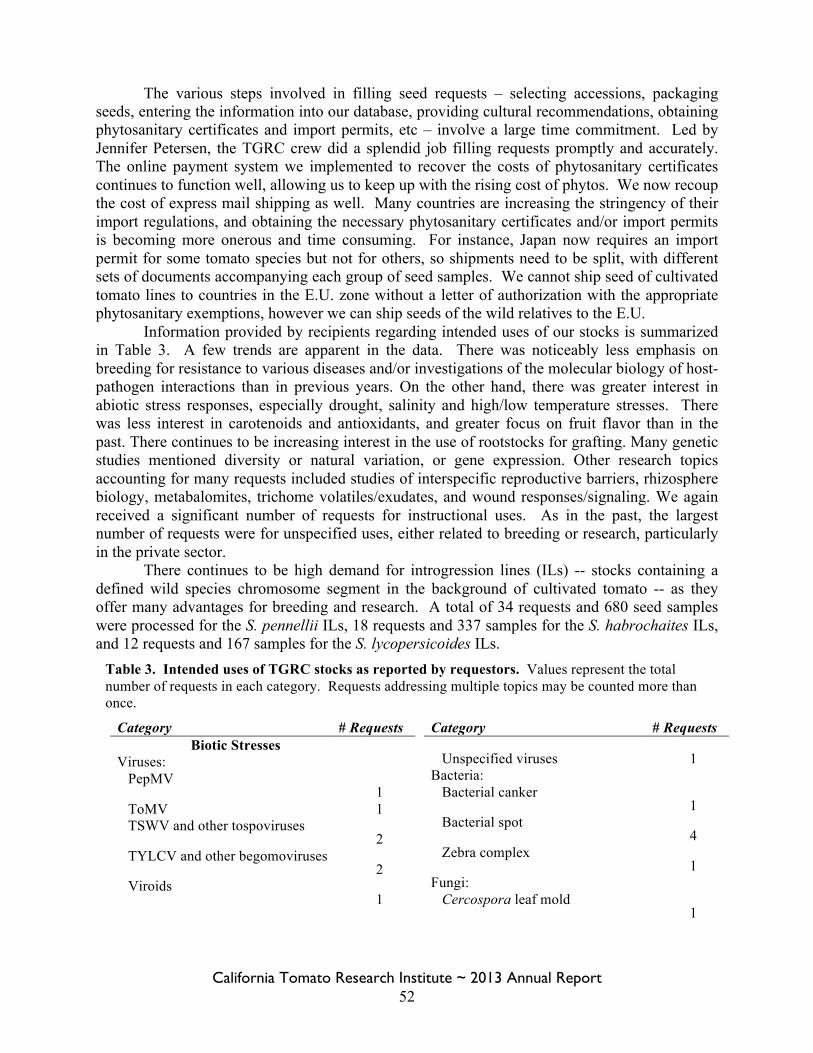
California Tomato Research Institute ~ 2013 Annual Report 52
The various steps involved in filling seed requests – selecting accessions, packaging seeds, entering the information into our database, providing cultural recommendations, obtaining phytosanitary certificates and import permits, etc – involve a large time commitment. Led by Jennifer Petersen, the TGRC crew did a splendid job filling requests promptly and accurately. The online payment system we implemented to recover the costs of phytosanitary certificates continues to function well, allowing us to keep up with the rising cost of phytos. We now recoup the cost of express mail shipping as well. Many countries are increasing the stringency of their import regulations, and obtaining the necessary phytosanitary certificates and/or import permits is becoming more onerous and time consuming. For instance, Japan now requires an import permit for some tomato species but not for others, so shipments need to be split, with different sets of documents accompanying each group of seed samples. We cannot ship seed of cultivated tomato lines to countries in the E.U. zone without a letter of authorization with the appropriate phytosanitary exemptions, however we can ship seeds of the wild relatives to the E.U.
Information provided by recipients regarding intended uses of our stocks is summarized in Table 3. A few trends are apparent in the data. There was noticeably less emphasis on breeding for resistance to various diseases and/or investigations of the molecular biology of host-pathogen interactions than in previous years. On the other hand, there was greater interest in abiotic stress responses, especially drought, salinity and high/low temperature stresses. There was less interest in carotenoids and antioxidants, and greater focus on fruit flavor than in the past. There continues to be increasing interest in the use of rootstocks for grafting. Many genetic studies mentioned diversity or natural variation, or gene expression. Other research topics accounting for many requests included studies of interspecific reproductive barriers, rhizosphere biology, metabalomites, trichome volatiles/exudates, and wound responses/signaling. We again received a significant number of requests for instructional uses. As in the past, the largest number of requests were for unspecified uses, either related to breeding or research, particularly in the private sector.
There continues to be high demand for introgression lines (ILs) -- stocks containing a defined wild species chromosome segment in the background of cultivated tomato -- as they offer many advantages for breeding and research. A total of 34 requests and 680 seed samples were processed for the S. pennellii ILs, 18 requests and 337 samples for the S. habrochaites ILs, and 12 requests and 167 samples for the S. lycopersicoides ILs.
Table 3. Intended uses of TGRC stocks as reported by requestors. Values represent the total number of requests in each category. Requests addressing multiple topics may be counted more than once.
Category # Requests Biotic Stresses
Viruses: PepMV
1 ToMV 1 TSWV and other tospoviruses
2 TYLCV and other begomoviruses
2 Viroids
1
Category # Requests
Unspecified viruses 1 Bacteria: Bacterial canker
1 Bacterial spot
4 Zebra complex
1 Fungi: Cercospora leaf mold
1
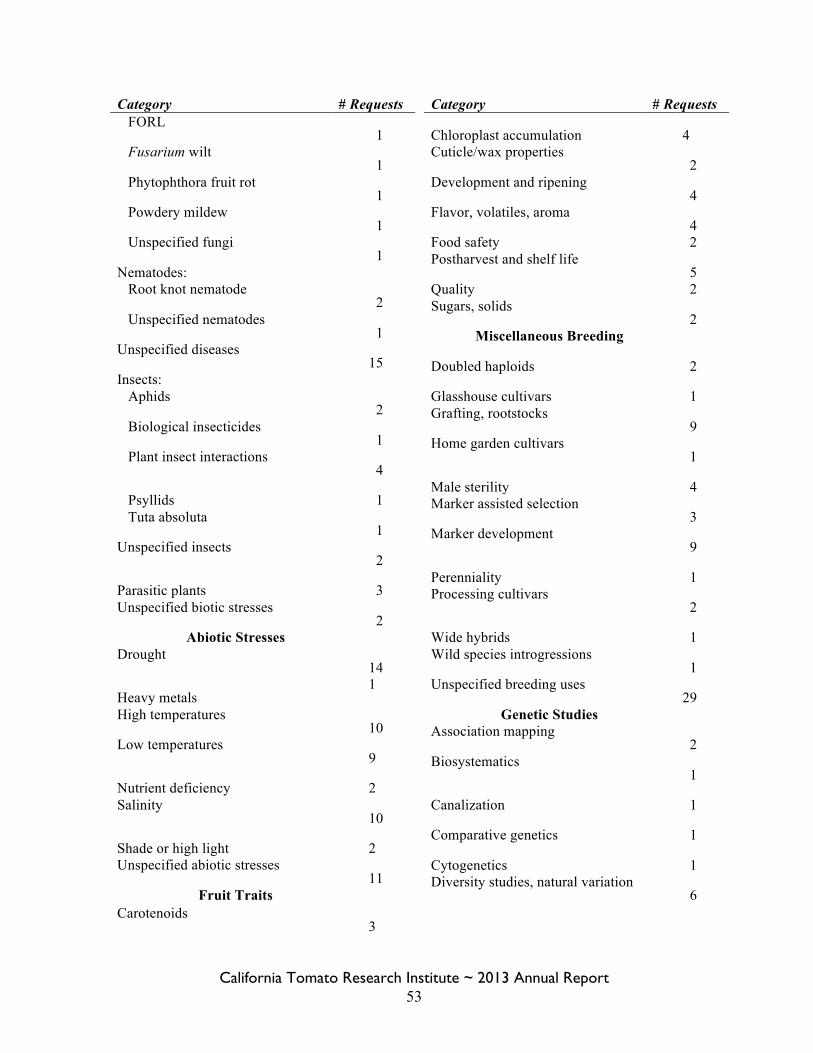
California Tomato Research Institute ~ 2013 Annual Report 53
Category # Requests FORL
1 Fusarium wilt
1 Phytophthora fruit rot
1 Powdery mildew
1 Unspecified fungi
1 Nematodes: Root knot nematode
2 Unspecified nematodes
1 Unspecified diseases
15 Insects: Aphids
2 Biological insecticides
1 Plant insect interactions
4
Psyllids 1 Tuta absoluta
1 Unspecified insects
2
Parasitic plants 3 Unspecified biotic stresses
2 Abiotic Stresses
Drought 14
Heavy metals 1
High temperatures 10
Low temperatures 9
Nutrient deficiency 2 Salinity
10
Shade or high light 2 Unspecified abiotic stresses
11 Fruit Traits
Carotenoids 3
Category # Requests
Chloroplast accumulation 4 Cuticle/wax properties
2 Development and ripening
4 Flavor, volatiles, aroma
4 Food safety 2 Postharvest and shelf life
5 Quality 2 Sugars, solids
2 Miscellaneous Breeding
Doubled haploids 2
Glasshouse cultivars 1 Grafting, rootstocks
9 Home garden cultivars
1
Male sterility 4 Marker assisted selection
3 Marker development
9
Perenniality 1 Processing cultivars
2
Wide hybrids 1 Wild species introgressions
1 Unspecified breeding uses
29 Genetic Studies
Association mapping 2
Biosystematics 1
Canalization 1
Comparative genetics 1
Cytogenetics 1 Diversity studies, natural variation
6
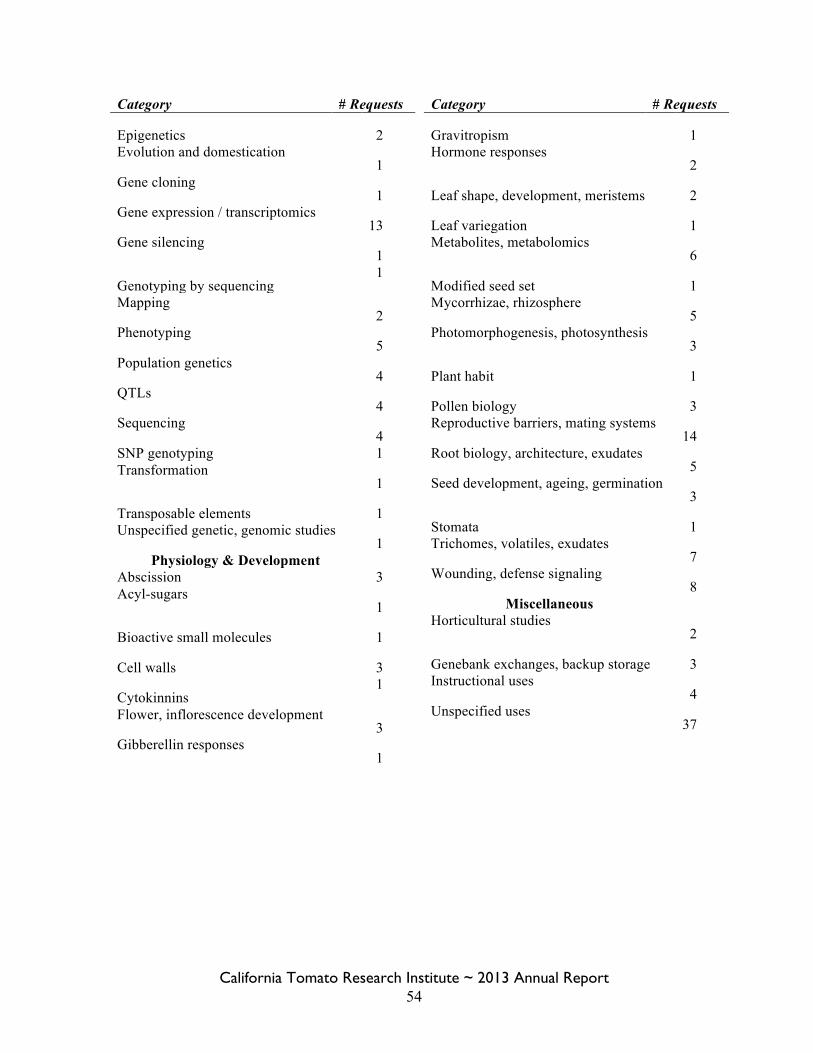
California Tomato Research Institute ~ 2013 Annual Report 54
Category # Requests
Epigenetics 2 Evolution and domestication
1 Gene cloning
1 Gene expression / transcriptomics
13 Gene silencing
1
Genotyping by sequencing 1
Mapping 2
Phenotyping 5
Population genetics 4
QTLs 4
Sequencing 4
SNP genotyping 1 Transformation
1
Transposable elements 1 Unspecified genetic, genomic studies
1 Physiology & Development
Abscission 3 Acyl-sugars
1
Bioactive small molecules 1
Cell walls 3
Cytokinnins 1
Flower, inflorescence development 3
Gibberellin responses 1
Category # Requests
Gravitropism 1 Hormone responses
2
Leaf shape, development, meristems 2
Leaf variegation 1 Metabolites, metabolomics
6
Modified seed set 1 Mycorrhizae, rhizosphere
5 Photomorphogenesis, photosynthesis
3
Plant habit 1
Pollen biology 3 Reproductive barriers, mating systems
14 Root biology, architecture, exudates
5 Seed development, ageing, germination
3
Stomata 1 Trichomes, volatiles, exudates
7 Wounding, defense signaling
8 Miscellaneous
Horticultural studies 2
Genebank exchanges, backup storage 3 Instructional uses
4 Unspecified uses
37
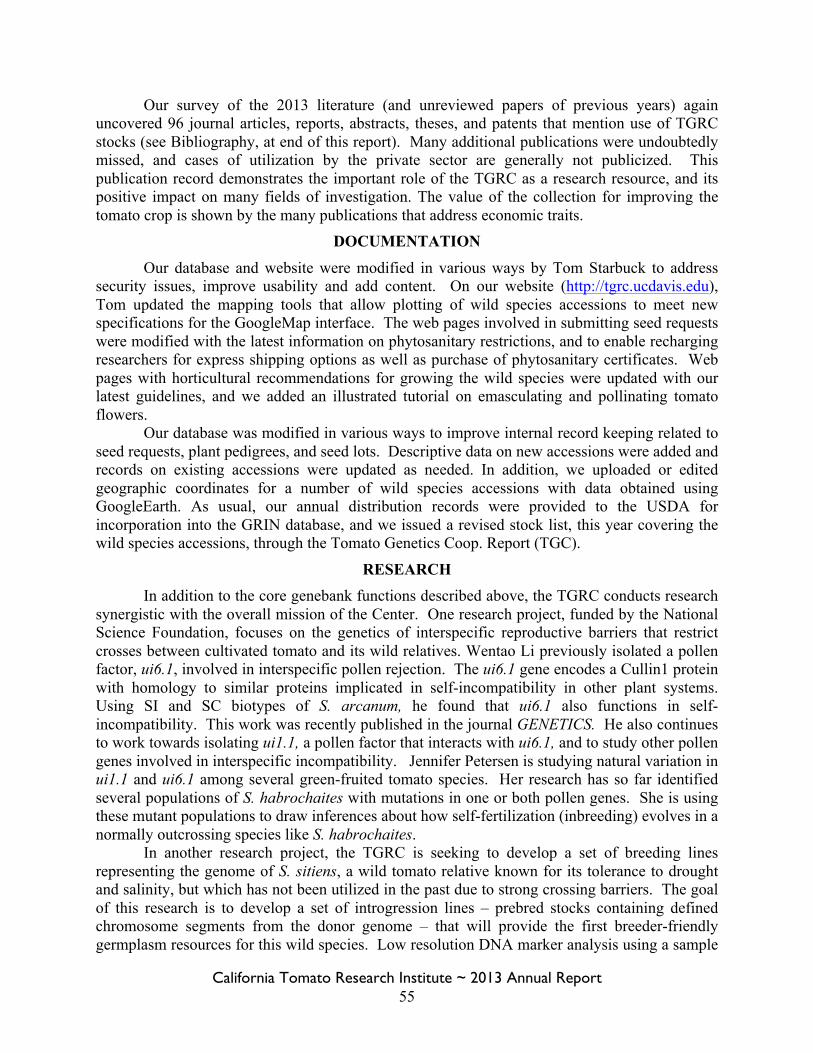
California Tomato Research Institute ~ 2013 Annual Report 55
Our survey of the 2013 literature (and unreviewed papers of previous years) again uncovered 96 journal articles, reports, abstracts, theses, and patents that mention use of TGRC stocks (see Bibliography, at end of this report). Many additional publications were undoubtedly missed, and cases of utilization by the private sector are generally not publicized. This publication record demonstrates the important role of the TGRC as a research resource, and its positive impact on many fields of investigation. The value of the collection for improving the tomato crop is shown by the many publications that address economic traits.
DOCUMENTATION Our database and website were modified in various ways by Tom Starbuck to address
security issues, improve usability and add content. On our website (http://tgrc.ucdavis.edu), Tom updated the mapping tools that allow plotting of wild species accessions to meet new specifications for the GoogleMap interface. The web pages involved in submitting seed requests were modified with the latest information on phytosanitary restrictions, and to enable recharging researchers for express shipping options as well as purchase of phytosanitary certificates. Web pages with horticultural recommendations for growing the wild species were updated with our latest guidelines, and we added an illustrated tutorial on emasculating and pollinating tomato flowers.
Our database was modified in various ways to improve internal record keeping related to seed requests, plant pedigrees, and seed lots. Descriptive data on new accessions were added and records on existing accessions were updated as needed. In addition, we uploaded or edited geographic coordinates for a number of wild species accessions with data obtained using GoogleEarth. As usual, our annual distribution records were provided to the USDA for incorporation into the GRIN database, and we issued a revised stock list, this year covering the wild species accessions, through the Tomato Genetics Coop. Report (TGC).
RESEARCH In addition to the core genebank functions described above, the TGRC conducts research synergistic with the overall mission of the Center. One research project, funded by the National Science Foundation, focuses on the genetics of interspecific reproductive barriers that restrict crosses between cultivated tomato and its wild relatives. Wentao Li previously isolated a pollen factor, ui6.1, involved in interspecific pollen rejection. The ui6.1 gene encodes a Cullin1 protein with homology to similar proteins implicated in self-incompatibility in other plant systems. Using SI and SC biotypes of S. arcanum, he found that ui6.1 also functions in self-incompatibility. This work was recently published in the journal GENETICS. He also continues to work towards isolating ui1.1, a pollen factor that interacts with ui6.1, and to study other pollen genes involved in interspecific incompatibility. Jennifer Petersen is studying natural variation in ui1.1 and ui6.1 among several green-fruited tomato species. Her research has so far identified several populations of S. habrochaites with mutations in one or both pollen genes. She is using these mutant populations to draw inferences about how self-fertilization (inbreeding) evolves in a normally outcrossing species like S. habrochaites. In another research project, the TGRC is seeking to develop a set of breeding lines representing the genome of S. sitiens, a wild tomato relative known for its tolerance to drought and salinity, but which has not been utilized in the past due to strong crossing barriers. The goal of this research is to develop a set of introgression lines – prebred stocks containing defined chromosome segments from the donor genome – that will provide the first breeder-friendly germplasm resources for this wild species. Low resolution DNA marker analysis using a sample
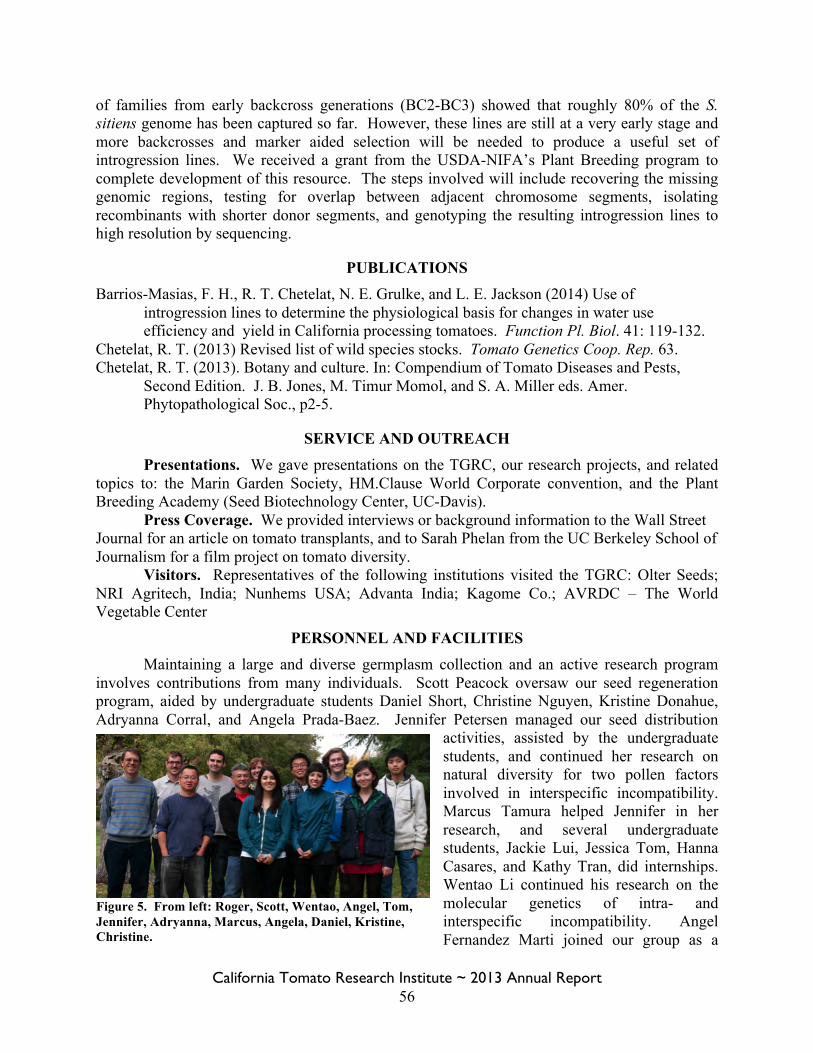
California Tomato Research Institute ~ 2013 Annual Report 56
of families from early backcross generations (BC2-BC3) showed that roughly 80% of the S. sitiens genome has been captured so far. However, these lines are still at a very early stage and more backcrosses and marker aided selection will be needed to produce a useful set of introgression lines. We received a grant from the USDA-NIFA’s Plant Breeding program to complete development of this resource. The steps involved will include recovering the missing genomic regions, testing for overlap between adjacent chromosome segments, isolating recombinants with shorter donor segments, and genotyping the resulting introgression lines to high resolution by sequencing.
PUBLICATIONS Barrios-Masias, F. H., R. T. Chetelat, N. E. Grulke, and L. E. Jackson (2014) Use of
introgression lines to determine the physiological basis for changes in water use efficiency and yield in California processing tomatoes. Function Pl. Biol. 41: 119-132.
Chetelat, R. T. (2013) Revised list of wild species stocks. Tomato Genetics Coop. Rep. 63. Chetelat, R. T. (2013). Botany and culture. In: Compendium of Tomato Diseases and Pests,
Second Edition. J. B. Jones, M. Timur Momol, and S. A. Miller eds. Amer. Phytopathological Soc., p2-5.
SERVICE AND OUTREACH Presentations. We gave presentations on the TGRC, our research projects, and related topics to: the Marin Garden Society, HM.Clause World Corporate convention, and the Plant Breeding Academy (Seed Biotechnology Center, UC-Davis). Press Coverage. We provided interviews or background information to the Wall Street Journal for an article on tomato transplants, and to Sarah Phelan from the UC Berkeley School of Journalism for a film project on tomato diversity. Visitors. Representatives of the following institutions visited the TGRC: Olter Seeds; NRI Agritech, India; Nunhems USA; Advanta India; Kagome Co.; AVRDC – The World Vegetable Center
PERSONNEL AND FACILITIES Maintaining a large and diverse germplasm collection and an active research program involves contributions from many individuals. Scott Peacock oversaw our seed regeneration program, aided by undergraduate students Daniel Short, Christine Nguyen, Kristine Donahue, Adryanna Corral, and Angela Prada-Baez. Jennifer Petersen managed our seed distribution
activities, assisted by the undergraduate students, and continued her research on natural diversity for two pollen factors involved in interspecific incompatibility. Marcus Tamura helped Jennifer in her research, and several undergraduate students, Jackie Lui, Jessica Tom, Hanna Casares, and Kathy Tran, did internships. Wentao Li continued his research on the molecular genetics of intra- and interspecific incompatibility. Angel Fernandez Marti joined our group as a
Figure 5. From left: Roger, Scott, Wentao, Angel, Tom, Jennifer, Adryanna, Marcus, Angela, Daniel, Kristine, Christine.
California Tomato Research Institute ~ 2013 Annual Report 57
post-doctoral scholar to work on developing an introgression line resource for S. sitiens. Tom Starbuck continues to maintain our database and website. There were no significant changes in facilities.
FINANCIAL SUPPORT
We thank the following institutions for their financial support.
California Tomato Research Institute National Science Foundation
Nunhems USA, Inc. SolCAP (Solanaceae Coordinated Agricultural Project)
UC-Davis, College of Agricultural and Environmental Sciences UC-Davis, Department of Plant Sciences
USDA – ARS, National Plant Germplasm System USDA – NIFA (National Institute of Food and Agriculture)
TESTIMONIALS “You have been doing great job with distributing the tomato seeds to all over the world.” -- Ozer Calis, Gaziosmanpasa University, Turkey “We really appreciate the service. I really appreciate the TGRC site that let me focus on the genes we were interested in her working on, so I could get those lines.” -- Barbara Liedl, West Virginia State University “I greatly appreciate the existence of the TGRC!” -- Gregg Howe, Michigan State University “We very much appreciate the work of the TGRC, it is a great contribution to the activities of many globally, and we will be very pleased to be acknowledging your contribution in future publications.” -- Mark Tester, King Abdullah University “Thanks so much for the wonderful resource of the TGRC!” -- Dan Chitwood, Danforth Plant Science Center “…there are entire populations of people who will benefit from the work at TGRC for years to come.” -- Jennifer Ibarra, John Winthrop School
California Tomato Research Institute ~ 2013 Annual Report 58
BIBLIOGRAPHY (publications that mention use of TGRC accessions)
Alseekh, S., I. Ofner, et al. (2013). "Resolution by recombination: breaking up Solanum pennellii introgressions." Trends in Plant Science 18(10): 536-538.
Alvarez Viveros, M. F., C. Inostroza-Blancheteau, et al. (2013). "Overexpression of GlyI and GlyII genes in transgenic tomato (Solanum lycopersicum Mill.) plants confers salt tolerance by decreasing oxidative stress." Molecular Biology Reports 40(4): 3281-3290.
Arellano Rodriguez, L. J., E. Rodriguez Guzman, et al. (2013). "Evaluation of the resistance against Phytophthora infestans of wild populations of Solanum lycopersicum var. cerasiforme." Rev. Mexicana de Ciencias Agric. 4(5): 753-766.
Arikita, F. N., M. S. Azevedo, et al. (2013). "Novel natural genetic variation controlling the competence to form adventitious roots and shoots from the tomato wild relative Solanum pennellii." Plant Science (Oxford) 199: 121-130.
Barrios-Masias, F. H., R. T. Chetelat, et al. (2014). "Use of introgression lines to determine the physiological basis for changes in water use efficiency and yield in California processing tomatoes." Functional Plant Biology 41: 119-132.
Bassolino, L., Y. Zhang, et al. (2013). "Accumulation of anthocyanins in tomato skin extends shelf life." New Phytologist 200(3): 650-655.
Blanco-Ulate, B., et al. (2013). "Tomato transcriptome and mutant analyses suggest a role for plant stress hormones in the interaction between fruit and Botrytis cinerea." Frontiers in Plant Science 4: 1-.
Casas-Leal, N. E., F. A. Vallejo-Cabrera, et al. (2013). "Mechanisms of resistance to Neoleucinodes elegantalis (Guenee) in wild germplasm of the genus Solanum." Agronomia Colombiana 31(2): 153-160.
Causse, M., N. Desplat, et al. (2013). "Whole genome resequencing in tomato reveals variation associated with introgression and breeding events." BMC Genomics 14(791).
Ceballos-Aguirre, N., F. A. Vallejo-Cabrera, et al. (2012). "Assessment antioxidant content in introductions of cherry tomato (Solanum spp.)." Acta Agronomica, Universidad Nacional de Colombia 61(3): 230-238.
Chakrabarti, M., N. Zhang, et al. (2013). "A cytochrome P450 regulates a domestication trait in cultivated tomato." Proceedings of the National Academy of Sciences of the United States of America 110(42): 17125-17130.
Chalivendra, S. C., G. Lopez-Casado, et al. (2013). "Developmental onset of reproductive barriers and associated proteome changes in stigma/styles of Solanum pennellii." Journal of Experimental Botany 64(1): 265-279.
Chitwood, D. H., L. R. Headland, et al. (2012). "Leaf assymetry as a developmental constraint imposed by auxin-dependent phyllotactic patterning." Plant Cell 24: 2318-2327.
Chitwood, D. H., R. Kumar, et al. (2013). "A quantitative genetic basis for leaf morphology in a set of precisely defined tomato introgression lines." Plant Cell 25: 2465-2481.
Chitwood, D. H., J. N. Maloof, et al. (2013). "Dynamic Transcriptomic Profiles between Tomato and a Wild Relative Reflect Distinct Developmental Architectures." Plant Physiology (Rockville) 162(2): 537-552.
Chunwongse, J. (2013). "Molecular marker application for tomato improvement in Thailand." Procs. Tomato Breeders' Roundtable, Chiang-Mai, Thailand: 13.
Di Matteo, A., V. Ruggieri, et al. (2013). "Identification of candidate genes for phenolics accumulation in tomato fruit." Plant Science (Oxford) 205: 87-96.
Di Matteo, A., A. Sacco, et al. (2012). "Comparative Transcriptomic Profiling of Two Tomato Lines with Different Ascorbate Content in the Fruit." Biochemical Genetics 50(11-12): 908-921.
Dias, D. M., J. T. V. Resende, et al. (2013). "Selection of processing tomato genotypes with high acyl sugar content that are resistant to the tomato pinworm." Genetics and Molecular Research 12(1): 381-389.
Easlon, H. M., J. S. Rubio Asensio, et al. (2013). "CHILLING-INDUCED WATER STRESS: VARIATION IN SHOOT TURGOR MAINTENANCE AMONG WILD TOMATO SPECIES FROM DIVERSE HABITATS." American Journal of Botany 100(10): 1991-1999.
El-Airaj, H., N. Gest, et al. (2013). "Decreased monodehydroascorbate reductase activity reduces tolerance to cold storage in tomato and affects fruit antioxidant levels." Postharvest Biology and Technology 86: 502-510.
Elsen, F. van den. (21030 Resistance mechanisms against Bemisia tabaci in wild relatives of tomato. Ph.D. thesis, Wageningen University.
Fantini, E., G. Falcone, et al. (2013). "Dissection of tomato lycopene biosynthesis through virus-induced gene silencing." Plant Physiology 163(2): 986-998.
Filippis, I., R. Lopez-Cobollo, et al. (2013). "Using a periclinal chimera to unravel layer-specific gene expression in plants." Plant Journal 75(6): 1039-1049.
Finkers, R. (2013). "The 150+ tomato genome (re-) sequencing project; lessons learned and potential applications." Procs. Tomato Breeders' Roundtable, Chiang-Mai, Thailand: 6.
Firon, N., E. Pressman, et al. (2012). "Ethylene is involved in maintaining tomato (Solanum lycopersicum) pollen quality
California Tomato Research Institute ~ 2013 Annual Report 59
under heat-stress conditions." AoB Plants 37. Foolad, M. R. (2013). High lycopene content tomato plants and markers for use in breeding for same. Fracetto, G. G. M., L. E. P. Peres, et al. (2013). "Tomato ethylene mutants exhibit differences in arbuscular mycorrhiza
development and levels of plant defense-related transcripts." Symbiosis 60(3): 155-167. Francis, D., et al. (2013). "Population level analysis to move from massive sequence data sets to application." Procs. Tomato
Breeders' Roundtable, Chiang-Mai, Thailand: 4. Gallardo, G. S., R. Masuelli, et al. (2013). "Advances in genetic breeding for processing tomatoes." Horticultura Argentina
32(78): 5-14. Gorovits, R., A. Moshe, et al. (2013). "Progressive aggregation of Tomato yellow leaf curl virus coat protein in systemically
infected tomato plants, susceptible and resistant to the virus." Virus Research 171(1): 33-43. Guo, G., J. Gao, et al. (2013). "Establishment of an in vitro method for evaluating whitefly resistance in tomato." Breeding
Science 63(3): 239-245. Hai Thi Hong, T., T. Hung Ngoc, et al. (2013). "Development of a co-dominant SCAR marker linked to the Ph-3 gene for
Phytophthora infestans resistance in tomato (Solanum lycopersicum)." European Journal of Plant Pathology 136(2): 237-245.
Hanson, P., et al. (2013). "Recent progress in mapping begomovirus resistance and marker-assisted selection for bacterial wilt resistance in tomato at AVRDC -- the World Vegetable Center." Procs. Tomato Breeders' Roundtable, Chiang-Mai, Thailand: 25.
Hirakawa, H., K. Shirasawa, et al. (2013). "Genome-Wide SNP Genotyping to Infer the Effects on Gene Functions in Tomato." DNA Research 20(3): 221-233.
Huang, Z. J., J. v. Houten, et al. (2013). "Genome-wide identification, phylogeny and expression analysis of SUN, OFP and YABBY gene family in tomato." Molecular Genetics and Genomics 288(3/4): 111-129.
Hutton, S. F. and J. W. Scott (2013). "Fine-mappng and cloning of Ty-1 and Ty-3: and mapping of a new TYLCV resistance locus, "Ty-6"." Procs. Tomato Breeders' Roundtable, Chiang-Mai, Thailand: 28.
Iijima, Y., B. Watanabe, et al. (2013). "Steroidal glycoalkaloid profiling and structures of glycoalkaloids in wild tomato fruit." Phytochemistry 95: 145-157.
Kaveh, H., H. Nemati, et al. (2011). "How salinity affect germination and emergence of tomato lines." Journal of Biological & Environmental Sciences 5(15): 159-163.
Khan, A. L., M. Waqas, et al. (2013). "Fungal endophyte Penicillium janthinellum LK5 improves growth of ABA-deficient tomato under salinity." World Journal of Microbiology & Biotechnology 29(11): 2133-2144.
Khialparast, F., S. Abdemishani, et al. (2013). "Identification and characterization of quantitative trait loci related to chemical traits in tomato (Lycopersicon esculentum Mill.)." Crop Breeding Journal 3(1): 13-18.
Kilambi, H. V., K. Rakesh, et al. (2013). "Chromoplast-specific carotenoid-associated protein appears to be important for enhanced accumulation of carotenoids in hp1 tomato fruits." Plant Physiology 161(4): 2085-2101.
Kim, W., K. Kim, et al. (2013). "Selection and characterization of horticultural traits of Tomato leaf curl virus (TYLCV)-resistant tomato cultivars." Korean Journal of Horticultural Science & Technology 31(3): 328-336.
Kinkade, M. P. and M. R. Foolad (2013). "Validation and fine mapping of lyc12.1, a QTL for increased tomato fruit lycopene content." Theoretical and Applied Genetics 126(8): 2163-2175.
Koenig, D., J. M. Jimenez-Gomez, et al. (2013). "Comparative transcriptomics reveals patterns of selection in domesticated and wild tomatoes." Proceedings of the National Academy of Sciences of the United States of America.
Kumar, R., et al. (2012). "A high-throughput method for Illumina RNA-Seq library preparation." Frontiers in Pl. Sci. 3: 1-10. Leckie, B. M., D. M. De Jong, et al. (2013). "Quantitative trait loci regulating sugar moiety of acylsugars in tomato."
Molecular Breeding 31(4): 957-970. Levin, I., et al. (2013). "Cloning and analysis of the Tomato yellow leaf curl virus resistance gene Ty-5." Procs. Tomato
Breeders' Roundtable, Chiang-Mai, Thailand: 14. Li, J., S. Wei, et al. (2013). "Identification and Expression Pattern of a ZPR1 Gene in Wild Tomato (Solanum Pennellii)."
Plant Molecular Biology Reporter 31(2): 409-417. Lucatti, A. F., A. W. van Heusden, et al. (2013). "Differences in insect resistance between tomato species endemic to the
Galapagos Islands." BMC Evolutionary Biology 13: 175. Luengwilai, K. and M. D. Beckles (2010). "Climacteric ethylene is not essential for initiating chilling injury in tomato
(Solanum lycopersicum) cv. Ailsa Craig." Journal of Stored Products and Postharvest Research 1(1): 1-8. Mahuad, S. L., G. R. Pratta, et al. (2013). "Preservation of Solanum pimpinellifolium genomic fragments in recombinant
genotypes improved the fruit quality of tomato." Journal of Genetics 92(2): 195-203. Malathi, V. G. (2013). "Biology and pathogenesis of whitefly transmitted begomoviruses causing tomato leaf curl disease --
Indian and global scenario." Procs. Tomato Breeders' Roundtable, Chiang-Mai, Thailand: 19. Mantelin, S., K. K. Bhattarai, et al. (2013). "Mi-1-mediated resistance to Meloidogyne incognita in tomato may not rely on
California Tomato Research Institute ~ 2013 Annual Report 60
ethylene but hormone perception through ETR3 participates in limiting nematode infection in a susceptible host." PLoS One 8(5).
Mathew, L. A., P. R. Staab, et al. (2013). "Why to account for finite sites in population genetic studies and how to do this with Jaatha 2.0." Ecology and Evolution 3(11): 3647-3662.
Matsuba, Y., T. T. H. Nguyen, et al. (2013). "Evolution of a complex locus for terpene biosynthesis in Solanum." Plant Cell 25(6): 2022-2036.
Mazzucato, A., D. Willems, et al. (2013). "Novel phenotypes related to the breeding of purple-fruited tomatoes and effect of peel extracts on human cancer cell proliferation. (Special Issue: Plant phenolics: biosynthesis, genetics, and ecophysiology.)." Plant Physiology and Biochemistry 72: 125-133.
Menda, N., et al. (2013). "Application of next generation sequencing of a begomovirus-resistant inbred to design a KASPar assay for SNP detection of the Ty1-Ty-3 region." Procs. Tomato Breeders' Roundtable, Chiang-Mai, Thailand: 15.
Minutolo, M., C. Amalfitano, et al. (2013). "Polyphenol distribution in plant organs of tomato introgression lines." Natural Product Research 27(9): 787-795.
Morgan, M. J., S. Osorio, et al. (2013). "Metabolic Engineering of Tomato Fruit Organic Acid Content Guided by Biochemical Analysis of an Introgression Line." Plant Physiology (Rockville) 161(1): 397-407.
Mousa, M. A. A., et al. (2013). "Response of tomato genotypes at early growing stages to irrigation water salinity." J. Food Agric. Environ. 11: 501-507.
Naz, A. A., S. Raman, et al. (2013). "Trifoliate encodes an MYB transcription factor that modulates leaf and shoot architecture in tomato." Proceedings of the National Academy of Sciences of the United States of America 110(6): 2401-2406.
Nveawiah-Yoho, P., J. Zhou, et al. (2013). "Identification of proteins for salt tolerance using a comparative proteomics analysis of Tomato accessions with contrasting salt tolerance." Journal of the American Society for Horticultural Science 138(5): 382-394.
O'Brochta, W. J. (2011). "Phytoremediation comparisons between Solanum lycopersicum wild-type and brt mutant using kelthane miticide." TGC Report 61: 5-6.
Orchard, C., S. C. sim, et al. (2013). "Breeding for nutritional traits in tomato using naturally occurring variation in the fruit specific beta-cyclase promoter." Procs. Tomato Breeders' Roundtable, Chiang-Mai, Thailand: 27.
Panthee, D. R., J. A. Labate, et al. (2012). "Evaluation of tomato accessions for flavour and flavour-contributing components." Plant Genetic Resources Characterization and Utilization 11: 106-113.
Panthee, D. R., P. Perkins-Veazie, et al. (2013). "Lycopene estimation in tomato lines using infrared absorbance and tomato analyzer." International Journal of Vegetable Science 19(3): 240-255.
Pereira da Costa, J. H., G. R. Rodriguez, et al. (2013). "QTL detection for fruit shelf life and quality traits across segregating populations of tomato." Scientia Horticulturae 156: 47-53.
Perez de Castro, A., O. Julian, et al. (2013). "Genetic control and mapping of Solanum chilense LA1932, LA1960 and LA1971-derived resistance to Tomato yellow leaf curl disease." Euphytica 190(2): 203-214.
Piotto, F. A., K. D. Batagin-Piotto, et al. (2013). "Interspecific xenia and metaxenia in seeds and fruits of tomato." Scientia Agricola 70(2): 102-107.
Piterkova, J., L. Luhova, et al. (2013). "Nitric oxide and reactive oxygen species regulate the accumulation of heat shock proteins in tomato leaves in response to heat shock and pathogen infection." Plant Science (Oxford) 207: 57-65.
Pye, M. F., F. Hakuno, et al. (2013). "Induced resistance in tomato by SAR activators during predisposing salinity stress." Frontiers in Plant Science 4(May).
Queiroz, M. A. d., L. d. M. Barros, et al. (2012). "Plant breeding in the semiarid region of Brazil: examples of success. (Special edition.)." Crop Breeding and Applied Biotechnology 12(S2): 57-66.
Ranc, N. (2010). "Analyse du polymorphisme moleculaire de genes de composantes de lat qualite de fruits dans les ressources genetique sauvages et cultivees de tomates: recherche d'associations genes/QTL." Thesis, Ecolo Nat. Sup. Agronomique de Montpellier.
Rao, E. S., P. Kadirvel, et al. (2013). "Relationship between survival and yield related traits in Solanum pimpinellifolium under salt stress." Euphytica 190(2): 215-228.
Ron, M., et al. (2013). "Identification of novel loci regulating interspecific variation in root morphology and cellular development in tomato." Plant Physiology 162: 755-768.
Sacco, A., A. Di Matteo, et al. (2013). "Quantitative trait loci pyramiding for fruit quality traits in tomato." Molecular Breeding 31(1): 217-222.
Saeidi, Z. (2012). "Inheritance of type IV glandular trichomes and two-spotted spider mite resistance in an interspecific cross of Lycopersicon esculentum x L. pennellii 'LA 2580'." Journal of Research in Agricultural Science 8(2): 157-163.
Saeidi, Z. and B. Mallik (2012). "Entrapment of two-spotted spider mite, Tetranychus urticae (Acari: Prostigmata: Tetranychidae), by type IV glandular trichomes of Lycopersicon species." Journal of Entomological Society of Iran
California Tomato Research Institute ~ 2013 Annual Report 61
31(2): 15-27. Saeidi, Z., B. Mallik, et al. (2012). "Resistance of 14 accessions/cultivars of Lycopersicon spp. to two-spotted spider mite,
Tetranychus urticae (Acari: Tetranychidae), in laboratory and greenhouse." Journal of Entomological Society of Iran 32(1): 93-108.
Sen, Y., Z. Feng, et al. (2013). "Screening for new sources of resistance to Clavibacter michiganensis subsp michiganensis (Cmm) in tomato." Euphytica 190(2): 309-317.
Sharlach, M., et al. (2012). "Fine genetic mapping of RxopJr, a bacterial spot disease resistance locus from Solanum pennellii LA716." Theoretical and Applied Genetics.
Strickler, S. (2013). "Mining alleles in wild tomato species." Plant and Animal Genome XXI conference: W009. Szinay, D., et al. (2008). "High‐resolution chromosome mapping of BACs using multi‐colour FISH and pooled‐BAC FISH as
a backbone for sequencing tomato chromosome 6." Plant J. 56: 627-637. Tang, X., Z. Tang, et al. (2013). "Whole transcriptome sequencing reveals genes involved in plastid/chloroplast division and
development are regulated by the HP1/DDB1 at an early stage of tomato fruit development." Planta 238(5): 923-936.
Tezuka, T., H. Okinaka, et al. (2013). "Tumor formation in hybrids between Solanum lycopersicum and S. habrochaites." African Journal of Biotechnology 12(15): 1745-1753.
Townsley, B. T., N. R. Sinha, et al. (2013). "KNOX1 genes regulate lignin deposition and composition in monocots and dicots." Frontiers in Plant Science 4(May).
Verlaan, M. G., S. F. Hutton, et al. (2013). "The Tomato Yellow Leaf Curl Virus Resistance Genes Ty-1 and Ty-3 Are Allelic and Code for DFDGD-Class RNA-Dependent RNA Polymerases." PLoS Genetics 9(3): e1003399.
Viquez-Zamora, M., B. Vosman, et al. (2013). "Tomato breeding in the genomics era: insights from a SNP array." BMC Genomics 14: 354.
Xu, J., N. Ranc, et al. (2013). "Phenotypic diversity and association mapping for fruit quality traits in cultivated tomato and related species." Theoretical and Applied Genetics 126(3): 567-581.
Yan, R., N. Yokotani, et al. (2013). "Characterization of ripening-associated genes using a tomato DNA macroarray, 1-methylcyclopropene, and ripening-impaired mutants." Postharvest Biology and Technology 86: 159-170.
Zhang, C., L. Liu, et al. (2013). "Fine mapping of the Ph-3 gene conferring resistance to late blight (Phytophthora infestans) in tomato." Theoretical and Applied Genetics 126(10): 2643-2653.
Zhang, L., et al. (2013). "Ectopic overexpression of SsCBF1, A CRT/DRE-binding factor from the nightshade plant Solanum lycopersicoides, confers freezing and salt tolerance in transgenic Arabidopsis." PLoS One 8: e61810.
Zhang, Y. L., A. H. Zhang, et al. (2013). "Gene expression patterns of invertase gene families and modulation of the inhibitor gene in tomato sucrose metabolism." Genetics and Molecular Research 12(3): 3412-3420.
Zheng, Z., T. Nonomura, et al. (2013). "Loss of Function in Mlo Orthologs Reduces Susceptibility of Pepper and Tomato to Powdery Mildew Disease Caused by Leveillula taurica." PLoS One 8(7): e70723.
Zhou, S. P., M. Palmer, et al. (2013). "Differential root proteome expression in tomato genotypes with contrasting drought tolerance exposed to dehydration." Journal of the American Society for Horticultural Science 138(2): 131-141.
California Tomato Research Institute ~ 2013 Annual Report 62
Project Title: Fruit Yields with Less Water: Beneficial Genes from Wild Tomato Project Leader: Dr. Dina St. Clair
University of California-Davis, Department of Plant Sciences One Shields Ave., Davis, CA 95616 Tel. (530) 752-1740; [email protected]
Co-investigator: Erin Arms Graduate Student Researcher, Ph.D. candidate in Genetics University of California-Davis, Department of Plant Sciences
Summary: We are using “mRNA sequencing analysis” (mRNA-seq analysis) to identify genes from S. habrochaites involved in resistance to water stress. We conducted a water stress experiment with two of our breeding lines to induce expression of genes involved in water stress responses. Root samples from multiple plants of both lines were harvested and RNA extracted from the roots. Currently, our root RNA samples are in queue for mRNA-seq library preparation by technical staff at the UC-Davis Genome Center, followed by subsequent DNA sequencing at the Center. The project timeline was delayed due to unanticipated problems with obtaining quality RNA from roots and wait times for services provided by technical staff and specialized equipment at the UC-Davis Genome Center DNA Technology Core. Objective: Our project goal is to identify genes from chromosome 9 of wild tomato (S. habrochaites) that confer resistance to water stress and contribute to the maintenance of fruit yields under restricted irrigation. Introduction: Wild tomato (S. habrochaites) is highly resistant to water stress. Previously, we genetically mapped this resistance to chromosome 9, and determined that resistance is controlled by a root-to-shoot signal that causes leaf stomata to close, allowing plants to avoid wilting under water stress. We used marker-assisted selection to create a set of breeding lines containing different portions of this chromosome 9 region from S. habrochaites. During summer 2012 and 2013, we conducted replicated field trials at UC-Davis with 18 of these tomato breeding lines under two drip irrigation treatments: full water, equivalent to the evapotranspiration rate (ETo) for tomato; and severely restricted water, 1/3 of ETo for tomato. We measured numerous plant traits, including fruit yields, fruit size and plant weight (biomass). We determined that breeding lines containing specific portions of the S. habrochaites chromosome 9 region had the ability to resist water stress and maintain fruit yields under limited water. Identification of the beneficial genes from chromosome 9 of S. habrochaites would provide useful and very specific targets for marker-assisted breeding of water-stress tolerance in processing tomato cultivars.
California Tomato Research Institute ~ 2013 Annual Report 63
Procedures: To identify genes from S. habrochaites involved in resistance to water stress, we are using a method called “mRNA sequencing analysis” (mRNA-seq analysis). Briefly, this method involves extracting RNA from plant tissue samples, making DNA from the RNA, and sequencing of the DNA products to detect all expressed gene products (i.e., transcripts). The resulting DNA sequence data is analyzed using statistics and bioinformatics for gene product identification and quantification. These analyses will permit identification of specific genes and stress response gene pathways involved in S. habrochaites resistance to water stress. For this project, we are using two of our closely-related tomato breeding lines, one with (Line 175) and one without (Line 163) the chromosome 9 region from S. habrochaites. Line 175 has tolerance to water stress while Line 163 does not. In an experiment we conducted earlier this year, plants of both breeding lines were exposed to water stress conditions to induce the expression of genes involved in the stress response. At several time points during exposure to water stress in our experiment, we harvested root tissue samples from multiple plants of the two breeding lines, froze the samples in liquid nitrogen and transferred the samples to our -80C freezer for subsequent RNA extraction and mRNA-seq analysis. Results and Discussion: We extracted RNA from the frozen root samples of both breeding lines. Extraction involves grinding each root sample with a mortar and pestle under liquid nitrogen, followed by high-speed mechanical grinding in a liquid buffer solution. Root tissue is very fibrous, which complicates the extraction and isolation of sufficiently high-quality RNA for use in mRNA-seq analysis. If the RNA is not high quality, it adversely affects the accuracy of identification and quantification of gene products. Our RNA samples were evaluated for quality on a Bioanalyzer at the UC-Davis Genome Center, which determined that the root RNA samples were not of sufficiently high quality to use for mRNA-seq analysis. To address this issue, we modified the extraction procedure, and then re-extracted RNA from root samples of Lines 175 and 163 that we had obtained previously from our experiment. The modified extraction procedure improved the RNA quality sufficiently to move forward with mRNA-seq analysis by technical staff at the UC-Davis Genome Center. In early October we submitted our re-extracted root RNA samples of the two breeding lines (Lines 175 and 163) to the UC-Davis Genome Center DNA Technology Core. The technical staff will prepare mRNA-seq libraries from our RNA samples. The facilities at the UC-Davis Genome Center are in high demand, which leads to queues and wait times for technical staff services and specialized equipment that can be weeks in length. Our samples are currently in queue, and the technical staff anticipates completion of libraries by mid-December. Once the root RNA-seq libraries are completed, they will be sequenced at the DNA Technology Core by technical staff using an Illumina Hi-Seq DNA sequencer, which will generate “sequence read data” for each root RNA-seq library. Once sequencing is completed, the “sequence read” data obtained from the Illumina Hi-Seq DNA sequencer will be transferred to us. We’ll use statistical and bioinformatics methods on this data to identify genes from S. habrochaites involved in conferring resistance to water stress.
California Tomato Research Institute ~ 2013 Annual Report 64
Project Title: Development and Application of a Degree-Day Model and Risk Index to Predict Development of Thrips and Tomato Spotted Wilt Virus (TSWV) and Implement an IPM Strategy in California Processing Tomato Fields Principal Investigator: Robert L. Gilbertson Plant Pathologist, Department of Plant Pathology, UC Davis Cooperating Personnel: Ozgur Batuman, Project Scientist, UC Davis
Li-Fang Chen, Postdoctoral Researcher, UC Davis Michelle LeStrange, Farm Adviser, Kings County Tom Turini, Farm Adviser, Fresno County Scott Stoddard, Farm Adviser, Merced County Gene Miyao, Farm Adviser, Yolo County Brenna Aegerter, Farm Advisor, San Joaquin County Neil McRoberts, Epidemiologist, UC Davis Diane E. Ullman, Entomologist, UC Davis
Summary: The goal of this project is the development and implementation of a predictive thrips phenology (degree-day) model and Tomato spotted wilt virus (TSWV) risk index (TRI) and to focus our ongoing monitoring efforts in northern counties (Solano, Yolo, Colusa, Sacramento and Sutter) and San Joaquin County (SJC). The long-term goal is to provide accurate and real-time information to growers about the population dynamics of thrips and development of TSWV infection to facilitate effective disease management with the integrated pest management (IPM) strategy that has been developed as part of this project. In 2013, monitoring of tomato fields in northern counties (fifth year), and in San Joaquin County (first year) revealed similar thrips population dynamics, with a build-up of thrips populations beginning in early-April, a rapid population increase in early-May and moderately high populations through the summer. TSWV was first detected in a monitored tomato field on 11 April in the Brentwood area in SJC and not until 1 May in a field on the Yolo/Colusa county line area. TSWV was eventually detected in all monitored fields, but overall incidences were low (<1-20%). However, high incidences (up to 80%) were found in parts of two fields (one in Colusa and another in Sacramento/SJC) by early June. Winter and spring weed surveys revealed very low levels of TSWV infection (~2% of all weeds tested). A notable exception was rough-seeded buttercup (Ranunculus muricatus) in SJC and northern counties where this weed was identified as a potentially important reservoir of TSWV. Large numbers of buttercup weeds showed virus disease symptoms and high rates (85%) of TSWV infection were detected. TSWV-infected buttercups were detected in 9/17 walnut orchards surveyed, and this may explain grower observations of high TSWV incidences in tomato fields near walnuts. Results of our laboratory experiments on the role of the soil-emerging adult thrips as an inoculum source for early season tomatoes revealed that thrips can stay dormant in soil for at least 7 weeks and that some emerging adults retained the virus and were able to infect plants. These results strongly suggest that adult thrips emerging from soil can be an inoculum source of TSWV. During the 2013 growing season, the web site for the thrips phenology (degree-day) model was made available for growers, and was regularly updated to
California Tomato Research Institute ~ 2013 Annual Report 65
provide thrips population projections for each area. This model accurately predicted the timing of adult thrips generations (>80% accuracy) in monitored areas. Thus, we believe that this model can be used as a reliable predictor of when thrips populations begin to increase in the spring and when it is best to apply thrips management strategies (e.g., early-mid-April in the northern counties and SJC in 2013). The prototype TSWV risk index (TRI) calculator was also made available on the web as well as on Smartphone, tablet and computer friendly interfaces. Growers submitted required field information interactively to the TRI calculator and received a prompt response from us with the TRI value for their field (low, moderate and high risk) and brief recommendations on how to prevent TSWV outbreaks. The TRI was moderate for most monitored fields in 2013. However, a number of low and high risk fields were identified, and the TSWV incidences in these fields were accurately predicted by the TRI. Thus, we believe that the IPM strategy for thrips and TSWV can be highly effective at reducing disease incidence, particularly if followed regionally. Key aspects include proper timing of thrips management strategies and identifying high risk fields where intensive IPM practices should be implemented. We now hope to put more efforts into encouraging the use and uptake of the grower-friendly thrips degree-day model and risk index, and to further publicize the IPM strategy for regional thrips and TSWV management. Objectives: The objectives of this project in 2013 were to 1) conduct surveys of selected processing tomato fields to gain insight into when and from where thrips and TSWV enter into commercial processing tomato fields and to use this data to assess the reliability of our degree-day model to predict the appearance of thrips populations in 2013, 2) gain insight into potential sources of thrips and TSWV for tomatoes in the Central Valley, 3) assess the capacity of mixed infections of TSWV and Tomato mosaic virus (ToMV) to overcome the Sw-5 resistance gene in tomato, 4) assess the role of soil-emerging thrips in TSWV epidemiology, 5) continue to refine and validate a thrips phenology model and a TSWV risk assessment system, and 6) continue to develop and assess an IPM strategy for TSWV in the Central Valley. Information on Materials and Methods can be found in our CTRI proposal for 2013 and are available upon request. Results: Field Monitoring: Our monitoring efforts for thrips and TSWV were initiated in selected fields beginning 1 March in the northern production area (Solano, Yolo, Colusa, Sacramento and Sutter Counties) and processing tomato production areas of San Joaquin County (SJC). In 2013, we monitored six processing tomato fields in northern counties and five in SJC. All were established with transplants except one that was direct-seeded in the Brentwood area of SJC. Table 1 lists the 11 monitored fields and indicates the final TSWV incidence and TSWV Risk Index (TRI) calculated for each field. Additionally, we also monitored a transplant house for thrips and TSWV in SJC. Thrips populations on yellow sticky cards: In 2013, the build-up of thrips populations started in early-April in SJC and northern counties (150-250 thrips/card/two weeks), and populations rapidly increased in most monitored fields in early-May (>1000 thrips/card/ two weeks). Interestingly, this increase in early-May in northern counties had been observed the last 4 years. A similar pattern for thrips population dynamics with a build-up of thrips populations in early-
California Tomato Research Institute ~ 2013 Annual Report 66
April followed by rapid population increase in early-May was observed in SJC (Fig. 1). Thus, thrips population dynamics in SJC may be similar to those in northern counties. However, as the season progressed the thrips populations in the northern counties were much higher than in SJC (Fig. 1). Higher thrips populations in northern counties later in the growing season have also been observed in previous years. After populations reached high levels by early-May (>1000 thrips/card), populations fluctuated at relatively high levels (800-2000 thrips/card/two week) until the end of September (Fig. 1). In 2012, a drop in thrips populations occurred during June-July in all monitored fields in the Central Valley. In 2013, a similar population drop occurred in June-July in all monitored fields. This was not predicted based on our degree-day model; i.e., there was no evidence of a noticeable delay in thrips generations. Thus, it is possible that these decreases in thrips population during June-July reflected the widespread implementation of thrips management (spraying) in monitored fields in early-June. In 2013, we also monitored a transplant house (an open-type greenhouse) with yellow sticky cards in SJC. The build-up of thrips populations also started in early-April (100-150 thrips/card/two weeks), followed by a rapid population increase in early-May (>2000 thrips/card/ two weeks). This was similar to population dynamics observed in fields in SJC (Fig. 2), with populations in the transplant house sometimes exceeding those in the field. Overall, when compared with our previous surveys conducted in different transplant houses in the Central Valley, especially with those that were open-type houses, this transplant house had relatively high level (~500 thrips/card/ two weeks) thrips populations. Key finding: Thrips population dynamics were similar in northern and SJC and timing of initial thrips sprays was predicted for early-mid-April.
TSWV incidence: In 2013, the first detection of TSWV in a processing tomato field was on 21 March in a non-monitored field at I-5 and Lassen Ave. in Kings County. TSWV was first detected in our monitored direct-seeded field in SJC on 11 April, and was not detected until 1 May in monitored fields in northern counties. As in previous years, TSWV was eventually detected in all monitored fields. The overall incidence of TSWV in processing tomato fields in SJC and northern counties was very low (<1-20%, Table 1). In two fields, one in Sacramento/SJ county line and another in Yolo/Colusa county line, TSWV was present at higher incidences (20%), with up to 80% incidences in a single corner of each field (<2 acres). As in previous years, the incidence of TSWV was lower in early-planted compared with late-planted fields. Overall, we do not believe that TSWV caused economic losses in any of the monitored fields in 2013. However, a high incidence of TSWV in parts of some fields shows the potential for damage still exists. We also detected TSWV infection in a small number of tomato transplants (10-15 plants) in our surveyed transplant house in SJC. However, TSWV infected transplants were detected only at the end of the season (July) and in the last shipment of transplants. Thus, we do not think that the infected transplants from this transplant house were significant sources of TSWV inoculum. In 2013, curly top virus (CTV, 8%) and Alfalfa mosaic virus (AMV, 5%) were detected at higher incidences than TSWV in some fields, especially in SJC. AMV was detected in some weed
California Tomato Research Institute ~ 2013 Annual Report 67
samples collected in and around monitored fields before tomatoes were established. Together with high populations of aphids observed in tomatoes early in the season, it is likely that AMV was moved into tomato fields from surrounding alfalfa and AMV-infected weeds. Additionally, very low (sporadic and <1%) levels of other tomato-infecting viruses including Tomato necrotic spot virus (ToNSV) and Pelargonium zonate spot virus (PZSV) were detected in monitored fields. Key finding: TSWV caused little or no economic damage in monitored processing tomato fields in 2013. Curly top virus outbreak of 2013: Of course, in 2013, the predominant disease problem in tomatoes in the Central Valley was CTV. In late-March, we received leafhopper samples from CDFA and 12 of 14 had very high levels of CTV. We warned CDFA that the combination of high leafhopper populations that they detected with sweep net surveys and the high amounts of CTV in the leafhoppers could lead to curly top outbreaks in processing tomato based upon our previous research. Indeed, within two weeks after testing of the leafhoppers, we began to receive samples for curly top testing from various fields in the Central Valley. Samples continued to be received throughout the growing season, mainly from the southern Central Valley and SJC. To date, we have tested 465 crop, leafhopper and weed samples for curly top and >92% of these were positive. Since late-April in 2013, a total of 192 tomato samples were received with typical curly top-like symptoms, including stunting and upward leaf curling distortion and vein purpling. These were tested for the presence of Beet mild curly top virus (BMCTV) and Beet severe curly top virus (BSCTV) by PCR with species-specific primer pairs. A total of 96% of these samples were confirmed to be positive for curly top virus, and 65% and 48% of samples were infected with BMCTV and BSCTV, respectively. Interestingly, the incidence of mixed infection of these viruses was 17%, which is unusually high. BMCTV was more prevalent in Merced and San Joaquin Counties, whereas, both BMCTV and BSCTV were detected in Fresno, Kern and Monterey Counties (Table 2). We also tested other plant samples with curly top-like symptoms for CTV infection including beet, cucurbit, eggplant, melon, watermelon and pepper (Table 3). Most samples were collected from Fresno County, but beet, cucurbit and pepper samples were also collected from Kern, San Benito, San Joaquin and Ventura Counties. Based on our PCR test results, 90 % of these samples were positive for curly top virus, and 79% and 16% of samples were infected with BMCTV and BSCTV, respectively (Table 3). Interestingly, the BMCTV involved in 2013 outbreak was determined to be a different strain compared to previously described BMCTV strains. Similarly, most of the BSCTV associated with the 2013 outbreak was a new strain (LH71) composed of parts of BMCTV and BSCTV. It is not clear the role these new curly top virus strains played in the 2013 outbreak. Survey of potential hosts for TSWV: We continued our efforts to identify reservoir hosts of TSWV before, during and after the processing tomato season in 2013. We focused our efforts around processing tomato fields that were monitored in SJC and northern counties, and we
California Tomato Research Institute ~ 2013 Annual Report 68
collected numerous weeds from these areas in the winter and spring before tomatoes were established. Bridge crops: Fall crops (i.e., lettuce and radicchio) were not grown in our surveyed areas during fall/winter seasons in 2013. However, in 2013, spring-planted lettuce and radicchio, potential TSWV bridge crops, were grown in non-surveyed areas (i.e., Fresno and Kings Counties). Surveys of these crops revealed low TSWV incidences. Fava bean: Early in 2013, we monitored two fava bean fields in Yolo County. Low thrips populations and no TSWV infections were detected in these fields. Weeds: In 2013, weeds were collected from surveyed areas and tested for TSWV (Table 4). Both in SJC and northern counties, weeds were abundant on roadsides, levees, fallow fields and some orchards. With the exception of buttercups (a new TSWV weed host, see below), most weeds collected before and during 2013 tomato growing season were symptomless and tested negative for TSWV (with immunostrips or PCR). A small number of weeds with symptoms (necrosis and thrips-feeding damage) were infected with TSWV. However, the overall incidence of TSWV infection in weeds was very low (a total of 12 TSWV-infected weeds detected/435 tested; overall incidence 2%). This was similar to results from previous years. A new potentially important TSWV weed host identified in San Joaquin and northern counties: In our 2013 weed surveys, we identified a new weed host of TSWV: rough-seeded buttercup (Ranunculus muricatus). Buttercup is a low-growing biennial plant that produces round leaves and yellow flowers. When infected with TSWV, the leaves develop mosaic and mottling symptoms. TSWV-infected buttercup plants were found in large numbers in and around walnut orchards in SJC (3 of 8 orchards) and northern counties (6 of 9 orchards). TSWV infection rates in patches of buttercups in these orchards ranged from 10-100% (a total of 128 TSWV-infected buttercups detected/149 samples tested, overall incidence 85%; Table 4). Since the beginning of our ongoing project in 2007, buttercup is the only weed species with such a high rate of TSWV infection. Interestingly, buttercup has become more common in California recent years, although it is not yet a widespread problem. It grows well in wet soils, such as low spots in orchards or at the end of rows where water might accumulate. It does not appear to become established in tomato fields. However, it has also been found in wheat fields and in other orchards (e.g., cherry and almond). Buttercup is a biennial weed, so it would germinate with fall/winter rains and survive through the summer and into the following spring when it would flower and set seed. Because it is biennial, infected plants can carry the virus over multiple years and serve as an inoculum source for processing tomatoes. Thus, in 2014, we hope to continue to survey for the presences of TSWV-infected buttercups to further determine the importance of this TSWV inoculum source. Key finding: Rough-seeded buttercup may be an important TSWV weed host in California. Assessment of the potential role of the soil-emerging adult thrips as inoculum sources of TSWV for early planted tomatoes: In 2013, we directed some of our efforts into curly top detection and characterization.
California Tomato Research Institute ~ 2013 Annual Report 69
This resulted in reduced efforts on the laboratory experiments on the potential for adult thrips emerging from soil to serve as sources of inoculum for early season TSWV infection. Our previous laboratory experiments confirmed that thrips can overwinter in soil as pupae for as long as 7 weeks at 4ºC. Thus, soils can be a potential reservoir for thrips, but TSWV was not detected in these soil-emerging thrips. In 2012 and 2013, we assessed the capacity of adult thrips emerging from soil to be able to transmit TSWV under controlled conditions. In 2013, we established that emerging adult thrips, after a dormant period up to 4 weeks at 4ºC, could still transmit TSWV. The number of emerging adult thrips that transmitted the virus depended on the period of time thrips were in soil as well as the temperature. This strongly suggests that adult thrips emerging from soil can be an inoculum source, and is a possible explanation for how single TSWV-infected plants may be observed within fields early in the season. We hope to complete these experiments in 2014. Key finding: Adult thrips emerging from soil can be sources of TSWV inoculum. Assessment the role of TSWV resistant (Sw-5) tomato varieties for selection of ‘resistance breaking’ TSWV-isolates in California In the Central Valley, more fields are being planted with tomato varieties carrying the TSWV resistance gene (Sw-5), especially in fields with a history of TSWV or late-planted fields. In 2013, our survey results continued to indicate that Sw-5 plants in the Central Valley did not show typical symptoms of TSWV infection. However, in a couple of processing tomato fields, symptoms were observed in fruits of some Sw-5 plants and these plants were found to have mixed infections with TSWV and Tomato mosaic virus (ToMV). A molecular analysis of the N gene of the TSWV isolates from these infected Sw-5 plants failed to show evidence that these were resistance-breaking strains. In 2013, we conducted laboratory experiments to assess whether mixed infections (TSWV with ToMV) would allow TSWV to infect Sw-5 varieties. In repeated experiments, we were not able to infect Sw-5 tomato varieties (two commercial varieties) with TSWV followed inoculation with TSWV alone or with TSWV + ToMV (via sap inoculation). In these experiments, no TSWV symptoms were observed in Sw-5 varieties, although very severe ToMV symptoms developed within 10-14 days after inoculation (the Sw-5 varieties used are not resistant to ToMV). In parallel experiments performed with susceptible control tomato plants (Early Pak 7; a non Sw-5 variety), typical symptoms developed in plants inoculated with TSWV (bronzing and necrosis) and ToMV (stunting and leaf mottling, mosaic and shoestring) by 10-14 days post-inoculation. In Early Pak 7 plants co-inoculated with TSWV + ToMV, the predominant symptoms were similar to those caused by ToMV, although both viruses were detected in these plants. In mixed infection experiments (ToMV + TSWV, ToMV then TSWV a week later or TSWV and then ToMV a week later), the most severe symptoms in Early Pak 7 plants (the non Sw-5 variety) were in plants inoculated with ToMV followed by TSWV. However, this was not the case in Sw-5 varieties where all plants developed similar ToMV symptoms. In no cases did TSWV symptoms develop in Sw-5 plants with any of the TSWV/ToMV combinations tested. A month after inoculations, the presence of the viruses in all inoculated plants (symptomatic and asymptomatic) was determined by ELISA. The ELISA test results with TSWV specific antibody
California Tomato Research Institute ~ 2013 Annual Report 70
were consistent with the symptoms observed. TSWV was detected only in those plants with typical TSWV symptoms, i.e., Early Pak 7 plants inoculated with TSWV or TSWV + ToMV. Also, consistent with symptom observations, ToMV was detected in all plants inoculated with ToMV, and not in plants inoculated with only TSWV (Sw-5 and non-Sw-5). Thus, these results suggested that mixed infection of ToMV and TSWV is not breaking down Sw-5 resistance. Previously published reports indicated that the Sw-5 gene is not expressed in fruits; thus, the symptoms observed only in fruits were probably due to direct feeding of viruliferous (virus-carrying) thrips on these fruits. Key finding: Mixed infection of ToMV and TSWV does not break Sw-5 resistance.
Refinement and validation of the degree-day model and the risk index for thrips and tomato spotted wilt disease In 2013, we started running thrips population projections for 6 locations instead of 4; the additional locations were the Delta-Tracy (Western SJC) and Linden (Eastern SJC). The web site for the phenology (degree-day) model was up and running through September in 2013 for Fresno, Kings, Merced, Western and Eastern San Joaquin and northern counties. We also regularly updated the web page to provide thrips population projections for each area. In 2013, real-time thrips population dynamics (from yellow sticky card counts) and phenology model projections were compared side by side for SJC and northern counties. In general, the phenology model was accurate (over 80%) and reliable. In 2013, the model predicted 7 adult thrips generations for monitored counties and 8 generations for southern counties. For example, in the northern and Western SJC counties, the generations were predicted for April 5, May 6, June 5, June 30, July 23, August 17 and September 9. Furthermore, the projected adult thrips generation times for northern counties and Western San Joaquin were on the same dates (1-2 day earlier or later), but corresponding projections were at least week later for Eastern San Joaquin County. These results indicated the importance of selecting much closer weather stations to production areas for more accurate phenology model predictions (i.e., choosing two or more weather stations per county instead of choosing a single station representing an entire county). In 2013, a prototype TSWV risk index (TRI) calculator was made available on the web for growers. It was also made available on Smartphone, tablet and computer friendly interfaces. Thus, growers submitted required field information interactively to the TRI calculator and received a prompt response from us with a TRI value for their field (low, moderate and high risk) and brief recommendations for TSWV management. After harvest of our monitored fields, we obtained all data needed to calculate the TRI for each field, and correlated this with actual TSWV incidences in these fields. Most of the fields were placed in the moderate TRI category (Table 1); however, two of the fields that were placed in the high risk category had the highest TSWV incidences (20%). In contrast, fields with low or moderate TRIs had much lower TSWV incidences (Table 1). We are now confident that the TRI is reliable and can be used to accurately predict the potential for TSWV in grower fields. We will continue to fine-tune the current TRI and make it available for growers to use in the 2014 growing season. Key finding: The thrips phenology (degree-day) model and TSWV TRI are useful tools that growers can use to help implement the IPM strategy for thrips and TSWV management in the Central Valley of California.
California Tomato Research Institute ~ 2013 Annual Report 71
Refinement of the IPM strategy for thrips and TSWV in processing tomatoes By using the information generated in this project, we have developed the following comprehensive IPM program for TSWV and thrips in processing tomatoes in the Central Valley of California. We believe that implementation of this package (all or in part) has helped reduced TSWV to levels where economic losses have been substantially reduced. Before planting i) determine the risk index for the field and plan your needs for TSWV management accordingly ii) evaluate planting location/time of planting-this will involve determining proximity to potential inoculum sources during the time of planting (if possible avoid hot spots, planting near fields with bridge crops or late planting dates). iii) use TSWV- and thrips-free transplants iv) plant TSWV resistant varieties (possessing the Sw-5 gene)-these are available, but may not be necessary if other practices are followed. Varieties without the Sw-5 gene can also vary in susceptibility. At least, resistant cultivars should be used in hot-spot areas or in late-planted fields that will be established near early-planted fields in which TSWV infections have already been identified. v) implement weed management-maintain weed control in and around tomato fields and especially in fallow fields and orchards, as some weeds are TSWV hosts, such as rough-seeded buttercup. If weeds are allowed to grow in fallow fields, they can amplify thrips and TSWV and serve as inoculum sources for processing tomatoes. During the season i) monitor fields for thrips with yellow sticky cards or use the predictive phenology (degree-day) model to estimate when thrips populations begin to increase. ii) manage thrips with insecticides at early stages of crop development and when thrips populations begin to increase (typically late March-early-mid-April). iii) rotate insecticides to minimize development of insecticide resistance in thrips. iv) monitor fields for TSWV and remove infected plants early in development (<30 days old) and when percent infection is low (<5%) v) implement weed management-maintain effective weed control in and around tomato fields. After harvest i) promptly remove and destroy plants after harvest (typically done during harvest) ii) avoid planting bridge crops that are thrips/TSWV reservoirs or monitor for and control thrips and TSWV in these crops iii) control weeds/volunteers in fallow fields, non-cropped or idle land near next years tomato fields
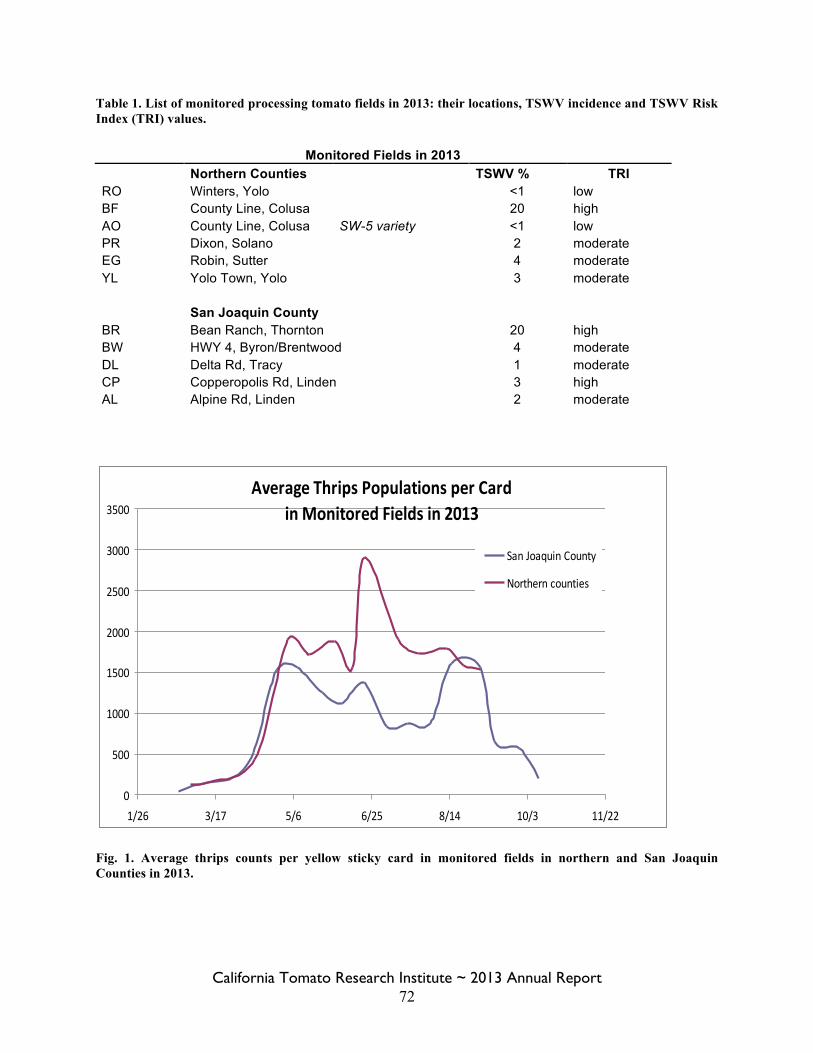
California Tomato Research Institute ~ 2013 Annual Report 72
Table 1. List of monitored processing tomato fields in 2013: their locations, TSWV incidence and TSWV Risk Index (TRI) values.
Monitored Fields in 2013 Northern Counties TSWV % TRI RO Winters, Yolo <1 low BF County Line, Colusa 20 high AO County Line, Colusa SW-5 variety <1 low PR Dixon, Solano 2 moderate EG Robin, Sutter 4 moderate YL Yolo Town, Yolo 3 moderate San Joaquin County BR Bean Ranch, Thornton 20 high BW HWY 4, Byron/Brentwood 4 moderate DL Delta Rd, Tracy 1 moderate CP Copperopolis Rd, Linden 3 high AL Alpine Rd, Linden 2 moderate
Average Thrips Populations per Cardin Monitored Fields in 2013
0
500
1000
1500
2000
2500
3000
3500
1/26 3/17 5/6 6/25 8/14 10/3 11/22
San Joaquin County
Northern counties
Fig. 1. Average thrips counts per yellow sticky card in monitored fields in northern and San Joaquin Counties in 2013.
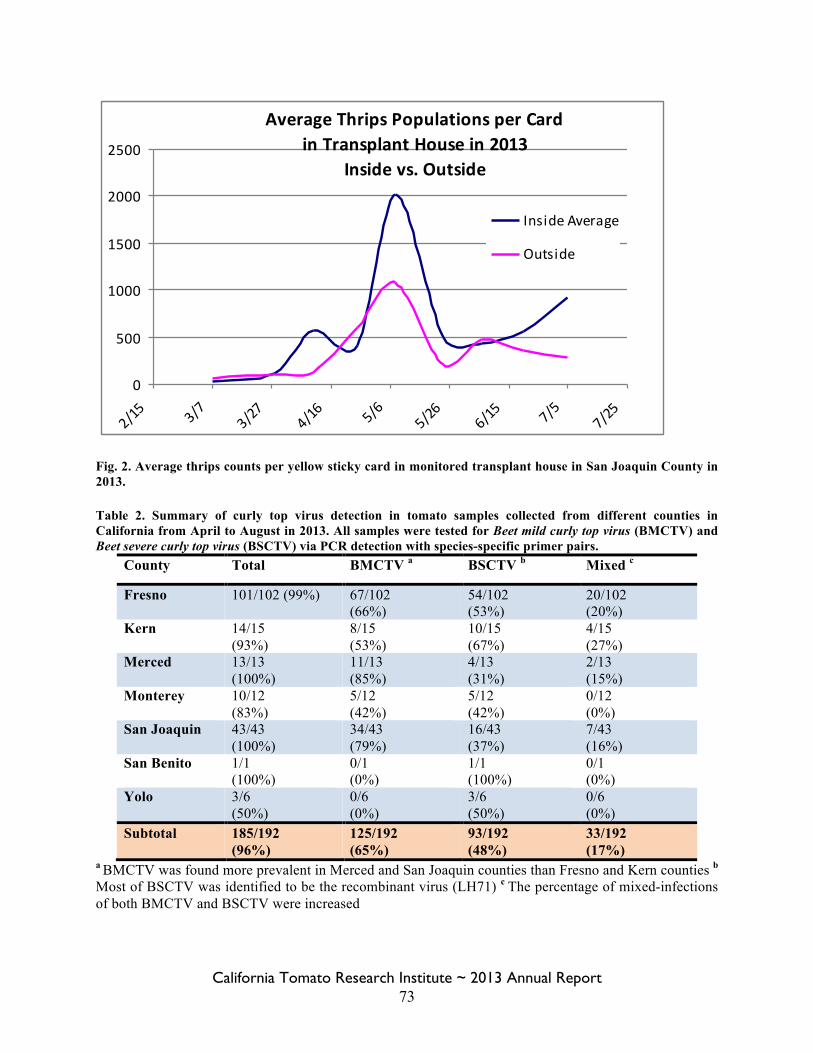
California Tomato Research Institute ~ 2013 Annual Report 73
Average Thrips Populations per Cardin Transplant House in 2013
Inside vs. Outside
0
500
1000
1500
2000
2500
2/15 3/
73/27
4/16 5/
65/26
6/15 7/
57/25
Inside Average
OutsideAverage
Fig. 2. Average thrips counts per yellow sticky card in monitored transplant house in San Joaquin County in 2013. Table 2. Summary of curly top virus detection in tomato samples collected from different counties in California from April to August in 2013. All samples were tested for Beet mild curly top virus (BMCTV) and Beet severe curly top virus (BSCTV) via PCR detection with species-specific primer pairs.
County Total BMCTV a BSCTV b Mixed c
Fresno 101/102 (99%) 67/102 (66%)
54/102 (53%)
20/102 (20%)
Kern 14/15 (93%)
8/15 (53%)
10/15 (67%)
4/15 (27%)
Merced 13/13 (100%)
11/13 (85%)
4/13 (31%)
2/13 (15%)
Monterey 10/12 (83%)
5/12 (42%)
5/12 (42%)
0/12 (0%)
San Joaquin 43/43 (100%)
34/43 (79%)
16/43 (37%)
7/43 (16%)
San Benito 1/1 (100%)
0/1 (0%)
1/1 (100%)
0/1 (0%)
Yolo 3/6 (50%)
0/6 (0%)
3/6 (50%)
0/6 (0%)
Subtotal 185/192 (96%)
125/192 (65%)
93/192 (48%)
33/192 (17%)
a BMCTV was found more prevalent in Merced and San Joaquin counties than Fresno and Kern counties b
Most of BSCTV was identified to be the recombinant virus (LH71) c The percentage of mixed-infections of both BMCTV and BSCTV were increased
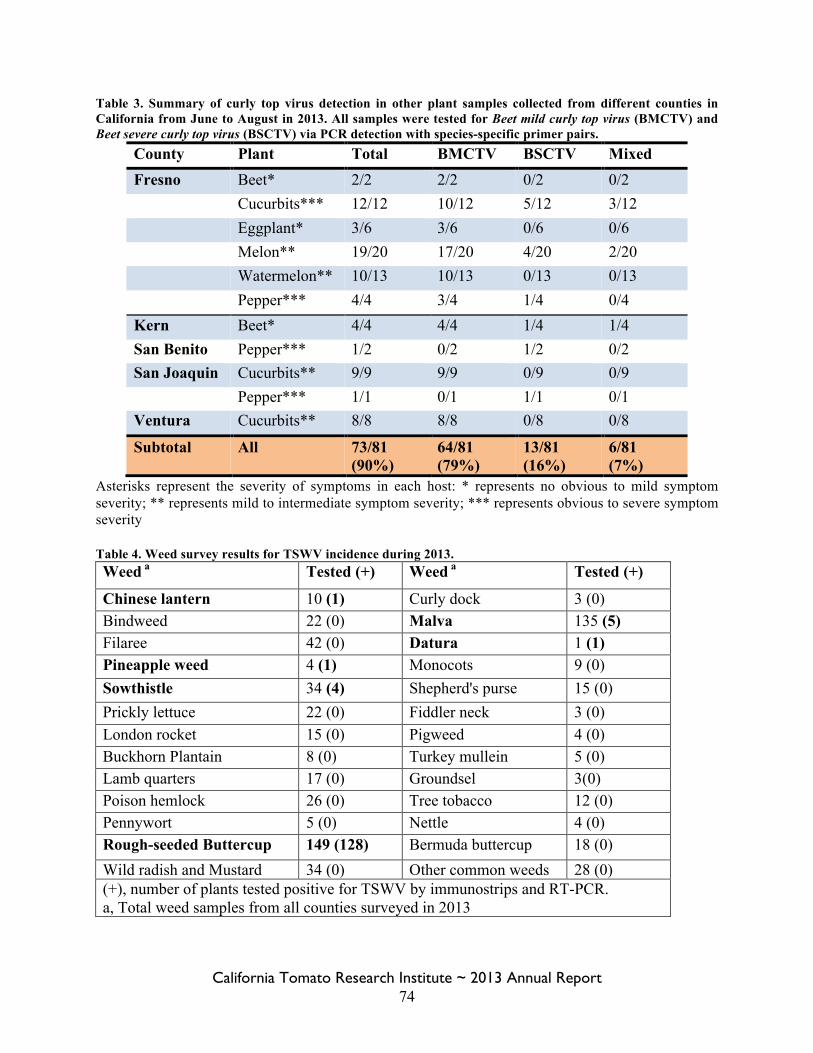
California Tomato Research Institute ~ 2013 Annual Report 74
Table 3. Summary of curly top virus detection in other plant samples collected from different counties in California from June to August in 2013. All samples were tested for Beet mild curly top virus (BMCTV) and Beet severe curly top virus (BSCTV) via PCR detection with species-specific primer pairs.
County Plant Total BMCTV BSCTV Mixed Fresno Beet* 2/2 2/2 0/2 0/2 Cucurbits*** 12/12 10/12 5/12 3/12 Eggplant* 3/6 3/6 0/6 0/6 Melon** 19/20 17/20 4/20 2/20 Watermelon** 10/13 10/13 0/13 0/13 Pepper*** 4/4 3/4 1/4 0/4 Kern Beet* 4/4 4/4 1/4 1/4 San Benito Pepper*** 1/2 0/2 1/2 0/2 San Joaquin Cucurbits** 9/9 9/9 0/9 0/9 Pepper*** 1/1 0/1 1/1 0/1 Ventura Cucurbits** 8/8 8/8 0/8 0/8
Subtotal All 73/81 (90%)
64/81 (79%)
13/81 (16%)
6/81 (7%)
Asterisks represent the severity of symptoms in each host: * represents no obvious to mild symptom severity; ** represents mild to intermediate symptom severity; *** represents obvious to severe symptom severity Table 4. Weed survey results for TSWV incidence during 2013. Weed a Tested (+) Weed a Tested (+)
Chinese lantern 10 (1) Curly dock 3 (0) Bindweed 22 (0) Malva 135 (5) Filaree 42 (0) Datura 1 (1) Pineapple weed 4 (1) Monocots 9 (0) Sowthistle 34 (4) Shepherd's purse 15 (0) Prickly lettuce 22 (0) Fiddler neck 3 (0) London rocket 15 (0) Pigweed 4 (0) Buckhorn Plantain 8 (0) Turkey mullein 5 (0) Lamb quarters 17 (0) Groundsel 3(0) Poison hemlock 26 (0) Tree tobacco 12 (0) Pennywort 5 (0) Nettle 4 (0) Rough-seeded Buttercup 149 (128) Bermuda buttercup 18 (0) Wild radish and Mustard 34 (0) Other common weeds 28 (0) (+), number of plants tested positive for TSWV by immunostrips and RT-PCR. a, Total weed samples from all counties surveyed in 2013
California Tomato Research Institute ~ 2013 Annual Report 75
Project Title: Movement of Fusarium Oxysporum Via Equipment
Project Leaders: Gene Miyao, UC Cooperative Extension 70 Cottonwood Street, Woodland, CA 95695 (530) 666-8732 [email protected]
Mike Davis, CE Specialist Dept. Plant Pathology, UC Davis 1 Shields Ave, Davis, CA 95616
Results: Nearly 20% of the tomato plants were infected with Fusarium wilt by the 3rd year of cropping after the introduction of the pathogen to the soil. The fungus established readily and thereafter infection level progressively increased. Objectives: Evaluate establishment and movement of Fusarium oxysporum in causing Fusarium wilt from diseased tomato tissue introduced into non-infested soil. Movement of infected tomato plant debris is most probable with harvest equipment moving the pathogen within a field as well as between fields. Procedures: Race 3 of Fusarium wilt diseased tomato plant tissue was collected from 2 commercial fields in Yolo County in late 2010. Dry stem pieces were buried about 6 inches deep in the center of established beds in late 2010 in a non-infested soil at a UC Davis Plant Pathology field research facility; and no further outside sources of inoculum were introduced. The plot design was a randomized complete block with 4 replications. The plot was a single, 5-foot centered bed by 90 feet long with the experimental area comprised to 16 beds. The Fusarium infected plant tissue was placed 30-foot away from the headland of each row.
A tomato planting in the infested soil was initiated in 2011. Twelve plants were diseased with Fusarium wilt by season’s end. Tomatoes were grown again in 2012 in minimally tilled soil. Plants were tagged when symptoms developed and all flagged plants were sampled to send suspect diseased tissue to the lab for confirmation. The 2013 season was the third consecutive tomato planting and final year of the test.
Results: A total of 264 plants were lab confirmed to be diseased with Fusarium wilt from the 2013 test plot. Discussion: Our field study indicated that Fusarium wilt can readily establish in a new soil environment, infect the following season and multiple quickly (Table 1). The results suggest equipment, especially tomato harvesters and vine diverters that routinely trap and carry plant debris, should be cleaned before transporting between fields to reduce the spread of this and other pathogens.
California Tomato Research Institute ~ 2013 Annual Report 76
Table 1. Evaluation of spread of Fusarium wilt
from Nov 2010 field introduction, UC Davis
Visually
infected
plants* infected
year (#) (%)
2010 - -
2011 12 1%
2012 34 2%
2013 287 19%
* with lab confirmation
California Tomato Research Institute ~ 2013 Annual Report 77
Project Title: Influence of Drip Irrigation on Tomato Root Health Project Leaders: Mike Davis
Cooperative Extension Specialist, Department of Plant Pathology One Shields Ave, University of California, Davis, CA 95616 Phone 530-752-0303, email [email protected] Johan Leveau Assistant Professor, Department of Plant Pathology One Shields Ave, University of California, Davis, CA 95616 Phone 530-752-5046, email [email protected]
Gene Miyao Cooperative Extension Farm Advisor Yolo-Solano-Sacramento counties 70 Cottonwood Ave., Woodland, CA 95695 Phone 530-666-8732, email [email protected]
Objectives:
1. Evaluate the interaction of drip irrigation, composted chicken manure, fungicides, and fertilizers on root health, root and soil microbiota, and tomato fruit yield and quality in field experiments.
2. Study the effect of chicken manure on soil microbial activity, plant nutrition, and management of soilborne pathogens of tomato in controlled greenhouse trials.
3. Determine the efficacy of Collimonas, a parasite of fungi, on suppression of soilborne diseases.
4. Develop diagnostics tools for Fusarium oxysporum f. sp. radicis-lycopersici, the cause of Fusarium crown and root rot of tomato.
Abstract: Experiments were conducted in four commercial tomato fields in Yolo and Solano counties. All fields used buried drip irrigation. In one location, the effects of preplant-incorporation of composted poultry manure, different fertilizer regimes, and several biologically-based materials delivered through the drip tape were examined. Single manure applications at 5 and 10 tons per acre significantly increased yields (64 and 71 tons per acre, respectively) relative to the nontreated control (57 tons). The control was the grower’s standard practice with normal fertilizer rates and practices. Supplemental fertilizers also significantly increased yields. No treatment reduced the incidence of Verticillium wilt, the predominate disease in the field. In two other locations, no treatment, including poultry manure, supplemental fertilizers, biologicals, and a fungicide, influenced fruit yields or disease incidence. The placement of poultry manure (either buried or incorporated after a surface application) with and without gypsum was evaluated in the forth location. No treatment influenced fruit yield or quality. DNA was extracted for determination of soil microbial community structure. In previous experiments, no significant differences in soil bacterial or fungal community composition were detected between soil
California Tomato Research Institute ~ 2013 Annual Report 78
samples collected from poultry manure treatments and other treatments. Overall, our data suggest that soil microbiota in the tomato fields under study are unaffected by disease management tools such as fungicides, biocontrol agents, and composted manures. Greenhouse trials that evaluated the effects of the bacterium Collimonas and Serenade Soil on Fusarium wilt of tomato were completed. Neither Serenade Soil nor Collimonas by itself reduced the effects of Fusarium wilt; together, however, there was a beneficial synergistic response. This experiment was repeated three times in various iterations with the same results. At least three genotypes of Fusarium oxysporum f. sp. radicis-lycopersici, the cause of Fusarium crown and root rot of tomato, were identified in California from submitted samples. All have been reported elsewhere in the world. We are continuing to refine our methodology for a quick and accurate DNA-based assay to distinguish Forl from Fol and other fungi. Procedures: Field trials were conducted in four commercial processing tomato fields in Yolo and Solano counties. All fields were buried drip-irrigated and had a history of disease. We used a randomized complete block design for our trials, with one treatment per block and four replicated blocks. Each replicated manure treatment included one 100-ft section of a planted row; otherwise, the entire row was treated when materials were applied through the buried drip. At site #1 in Yolo County, composted poultry manure was piled in a foot-wide mound in the center of and on the surface of preformed beds on March 9, 2013; fertilizer was applied as a surface band along the center of the bed top prior to planting or as a common knifed injection under the plant line on April 19; and tomato variety CXD 282 VFFF3NP was transplanted March 28. The first chemigation, which included JH Biotech Promot, LH Organics Soil System 1, and Regalia, was made April 22 for. LH Organics Soil System 1 was reapplied at 7 to 14-day intervals until July 27 for a total of 10 applications. Promot was reapplied at about 3-week intervals for a total of five applications. Regalia was reapplied at 2 to 3-week intervals for a total of six applications. Potassium chloride applications were made June 6, June 14, June 21, July 1, and July 16. Foliar nutrients in the nutrient luxury treatment were sprayed on the foliage during early fruit sizing stage. The composted poultry manure contained 49 lbs N, 47 lbs P205, and 35 lbs K20 per ton. The grower fertilizer treatment was 200 lbs N, 27 lbs P205, 75 lbs K20, and 31 lbs S. Fruit were harvested and evaluated for quality on August 15. Verticillium wilt was present in 100% of the plants in all plots. Corky root symptoms were present on most root systems. The incidence of Fusarium crown and root rot was low and there were no symptoms of Fusarium wilt. There was a low incidence (<1%) of tomato spotted wilt virus. At site #2 in Yolo County, composted poultry manure was spread March 12, 2013; preplant fertilizer was applied April 12; and tomato variety CXD 282 VFFF3NP was transplanted April 14. Prior to transplanting, some seedlings received a root dip with LH Organics System 1 (24 g/5 gal) or Promot (200 ml/5 gal). The first chemigation, which included LH Organics, Promot, and Converted Organics LC111, was made April 17. LH Organics Soil System 1 was reapplied at 7 to 14-day intervals until July 19 for a total of 11 applications. Promot was reapplied at about 3-week intervals for a total of six applications. LC111 was reapplied at about 3-week intervals for a total of five applications. Fontelis was applied May 29, June 19, and July 10. KCl was first applied on June 7 at 8 lbs/10 gal and weekly thereafter for a total of six applications. Fruit were
California Tomato Research Institute ~ 2013 Annual Report 79
harvested and evaluated for quality on August 22. Verticillium was present in most plants in the field. The incidence of foot rot, caused by Fusarium solani, ranged from 8-12% among plots. There was a low incidence (<1%) of tomato spotted wilt virus in the field. At site #3 in Yolo County, composted poultry manure was spread Feb. 21, 2013. Vermicompost was applied April 15. Fertilizer was applied to the foliage May 14, June 5, June 18, July 12, and Aug. 7. The field was planted with HyPeel 849 seedlings on April 23. Fruit were harvested and evaluated for quality on Oct. 3. The incidence of premature vine decline at the end of the season was high. Over 30% of the plants across all plots had died by harvest. At site #4 in Solano County, gypsum and composted poultry manure were applied in the center of the bed furrows Oct. 30, 2012 and on the surface of the beds Nov. 6. The field was planted with HyPeel 849 seedlings on April 23. Fruit were harvested and evaluated for quality on Sept. 24. There were no obvious symptoms of disease in this field. Results: Obj. 1. Evaluate the interaction of drip irrigation, composted chicken manure, fungicides, and fertilizers on root health, root and soil microbiota, and tomato fruit yield and quality in field experiments.
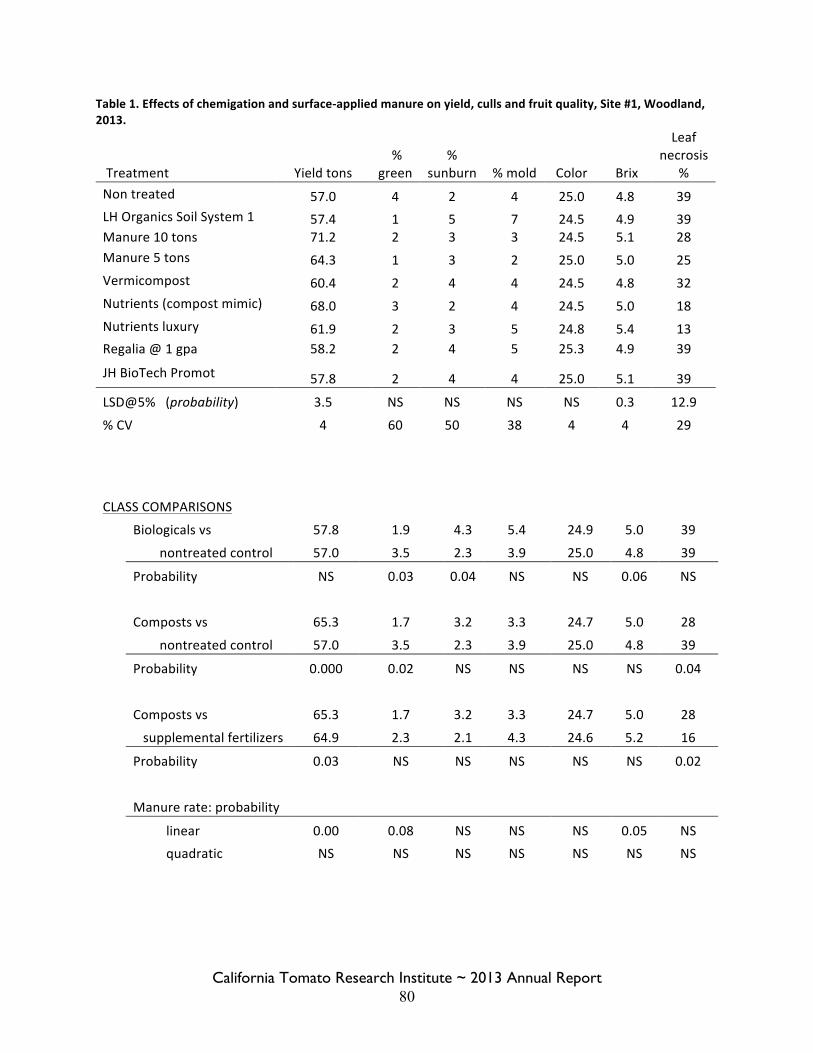
California Tomato Research Institute ~ 2013 Annual Report 80
Table 1. Effects of chemigation and surface-‐applied manure on yield, culls and fruit quality, Site #1, Woodland, 2013.
Treatment Yield tons %
green %
sunburn % mold Color Brix
Leaf necrosis
% Non treated 57.0 4 2 4 25.0 4.8 39 LH Organics Soil System 1 57.4 1 5 7 24.5 4.9 39 Manure 10 tons 71.2 2 3 3 24.5 5.1 28 Manure 5 tons 64.3 1 3 2 25.0 5.0 25 Vermicompost 60.4 2 4 4 24.5 4.8 32 Nutrients (compost mimic) 68.0 3 2 4 24.5 5.0 18 Nutrients luxury 61.9 2 3 5 24.8 5.4 13 Regalia @ 1 gpa 58.2 2 4 5 25.3 4.9 39
JH BioTech Promot 57.8 2 4 4 25.0 5.1 39
LSD@5% (probability) 3.5 NS NS NS NS 0.3 12.9
% CV 4 60 50 38 4 4 29
CLASS COMPARISONS
Biologicals vs 57.8 1.9 4.3 5.4 24.9 5.0 39
nontreated control 57.0 3.5 2.3 3.9 25.0 4.8 39
Probability NS 0.03 0.04 NS NS 0.06 NS
Composts vs 65.3 1.7 3.2 3.3 24.7 5.0 28
nontreated control 57.0 3.5 2.3 3.9 25.0 4.8 39
Probability 0.000 0.02 NS NS NS NS 0.04
Composts vs 65.3 1.7 3.2 3.3 24.7 5.0 28
supplemental fertilizers 64.9 2.3 2.1 4.3 24.6 5.2 16
Probability 0.03 NS NS NS NS NS 0.02
Manure rate: probability
linear 0.00 0.08 NS NS NS 0.05 NS
quadratic NS NS NS NS NS NS NS
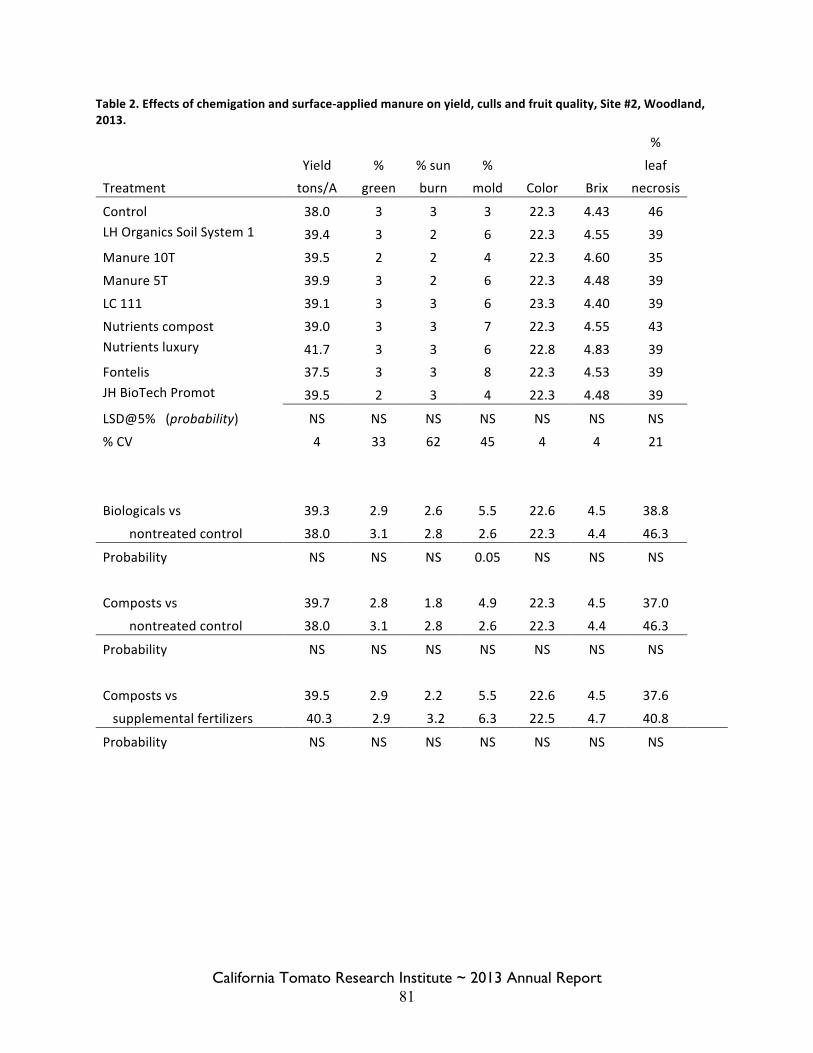
California Tomato Research Institute ~ 2013 Annual Report 81
Table 2. Effects of chemigation and surface-‐applied manure on yield, culls and fruit quality, Site #2, Woodland, 2013.
%
Yield % % sun %
leaf
Treatment tons/A green burn mold Color Brix necrosis
Control 38.0 3 3 3 22.3 4.43 46 LH Organics Soil System 1 39.4 3 2 6 22.3 4.55 39
Manure 10T 39.5 2 2 4 22.3 4.60 35
Manure 5T 39.9 3 2 6 22.3 4.48 39
LC 111 39.1 3 3 6 23.3 4.40 39
Nutrients compost 39.0 3 3 7 22.3 4.55 43 Nutrients luxury 41.7 3 3 6 22.8 4.83 39 Fontelis 37.5 3 3 8 22.3 4.53 39 JH BioTech Promot 39.5 2 3 4 22.3 4.48 39
LSD@5% (probability) NS NS NS NS NS NS NS
% CV 4 33 62 45 4 4 21
Biologicals vs 39.3 2.9 2.6 5.5 22.6 4.5 38.8
nontreated control 38.0 3.1 2.8 2.6 22.3 4.4 46.3
Probability NS NS NS 0.05 NS NS NS
Composts vs 39.7 2.8 1.8 4.9 22.3 4.5 37.0
nontreated control 38.0 3.1 2.8 2.6 22.3 4.4 46.3
Probability NS NS NS NS NS NS NS
Composts vs 39.5 2.9 2.2 5.5 22.6 4.5 37.6
supplemental fertilizers 40.3 2.9 3.2 6.3 22.5 4.7 40.8 Probability NS NS NS NS NS NS NS
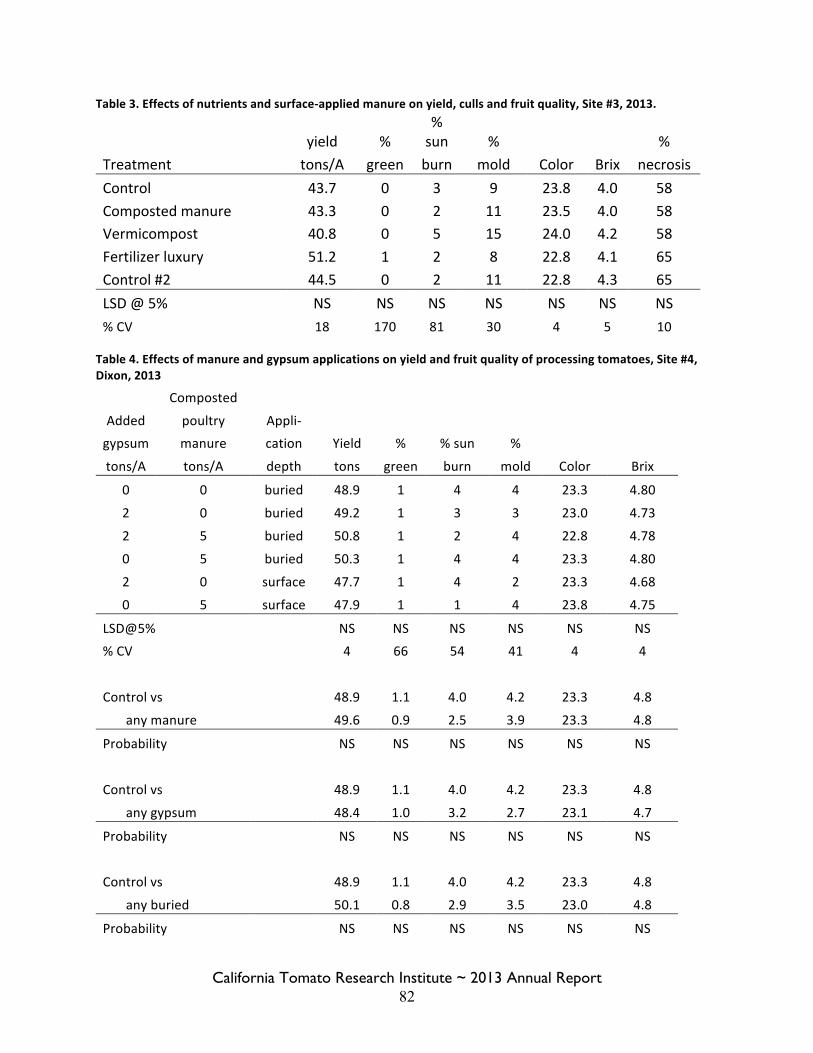
California Tomato Research Institute ~ 2013 Annual Report 82
Table 3. Effects of nutrients and surface-‐applied manure on yield, culls and fruit quality, Site #3, 2013.
yield %
% sun %
%
Treatment tons/A green burn mold Color Brix necrosis Control 43.7 0 3 9 23.8 4.0 58 Composted manure 43.3 0 2 11 23.5 4.0 58 Vermicompost 40.8 0 5 15 24.0 4.2 58 Fertilizer luxury 51.2 1 2 8 22.8 4.1 65 Control #2 44.5 0 2 11 22.8 4.3 65 LSD @ 5% NS NS NS NS NS NS NS % CV 18 170 81 30 4 5 10
Table 4. Effects of manure and gypsum applications on yield and fruit quality of processing tomatoes, Site #4, Dixon, 2013
Composted
Added poultry Appli-‐ gypsum manure cation Yield % % sun %
tons/A tons/A depth tons green burn mold Color Brix
0 0 buried 48.9 1 4 4 23.3 4.80
2 0 buried 49.2 1 3 3 23.0 4.73
2 5 buried 50.8 1 2 4 22.8 4.78
0 5 buried 50.3 1 4 4 23.3 4.80
2 0 surface 47.7 1 4 2 23.3 4.68
0 5 surface 47.9 1 1 4 23.8 4.75
LSD@5%
NS NS NS NS NS NS % CV
4 66 54 41 4 4
Control vs
48.9 1.1 4.0 4.2 23.3 4.8
any manure 49.6 0.9 2.5 3.9 23.3 4.8
Probability
NS NS NS NS NS NS
Control vs
48.9 1.1 4.0 4.2 23.3 4.8
any gypsum 48.4 1.0 3.2 2.7 23.1 4.7
Probability
NS NS NS NS NS NS
Control vs
48.9 1.1 4.0 4.2 23.3 4.8
any buried 50.1 0.8 2.9 3.5 23.0 4.8
Probability
NS NS NS NS NS NS
California Tomato Research Institute ~ 2013 Annual Report 83
At Site #1, there were significant yield increases with both rates of composted poultry manure (Table 1). The yield increase was rate dependent. Brix was slightly improved with the biological treatments (P=0.06). Leaf necrosis, an indicator of overall plant health and reflective of late season vine decline, was reduced by the manure treatments and the supplemental fertilizers relative to the nontreated control. The supplemental fertilizers were more effective in reducing leaf necrosis than the manures. There was also a positive yield response to synthetic NPK nutrients when applied on the bed surface and shallowly incorporated (as a mimic to the application of manure). There were minor differences in percentage of green fruit and sunburn damaged fruit with some treatments. The severity and incidence of Verticillium wilt and corky root, which were common at this site, were not affected by any treatment. There were no significant gains in yield with any treatment at site #2 (Table 2). No treatment affected the incidence of Verticillium, which was present in most plants. The incidence of foot rot, which was relatively high in that field, was not affected by any treatment. Neither the manure, vermicompost, nor additional fertilizer affected fruit yield or quality at site #3 (Table 3). Despite a very high incidence of premature vine decline, no treatment influenced leaf necrosis or incidence of plant death. Composted poultry manure and/or gypsum or their placement had no significant effect on tomato yields or fruit quality at site #4 (Table 4). Obj. 2. Study the effect of chicken manure on soil microbial activity, plant nutrition, and management of soilborne pathogens of tomato in controlled greenhouse trials Culturable populations of bacteria and fungi did not significantly vary between treatments at multiple time points. Because organisms cultured in the laboratory may represent just a fraction of the organisms found in soil, we used Illumina DNA sequencing to measure microbial community diversity. There were some significant trends (although these data should be considered preliminary since we are still collecting data). First, no treatment, including metam sodium and fungicides used in previous years, influenced microbial diversity. Apparently, soil microbial communities in tomato fields in Yolo and Solano counties are remarkably durable since we failed to make a change in them despite repetitive applications of biologicals and chemical treatments. Second, microbial communities between fields significantly differed in these studies; i.e., fields that were 10 miles from each other harbored a different set of bacteria and fungi. Third, soil microbial communities significantly changed in the course of a season. And no significant differences in bacterial or fungal community composition were detected in soil samples from poultry manure treatments and other treatments. Overall, our data suggest that soil microbiota are quite resilient to disease management tools such as fungicides, introduced organisms, biocontrol agents, and composted manures. Obj. 3. Determine the efficacy of Collimonas, a parasite of fungi, on suppression of soilborne diseases. The bacterial genus Collimonas includes the following three described species: C. fungivorans, C. pratensis, and C. arenae, best known for their antifungal properties. In this study, we developed preliminary greenhouse data on the potential of C. arenae strain Cal35, isolated from California soils, to reduce severity of Fusarium wilt of tomato. Roots of tomato seedlings (two true leaf-stage) were dipped for four minutes in water, a cell suspension of 1X10⁶ colony-forming units of C. arenae per ml, or Serenade Soil and transferred into 750 ml pots with UC potting soil mix. After one week, the roots of the seedlings were dipped into water or a Fusarium
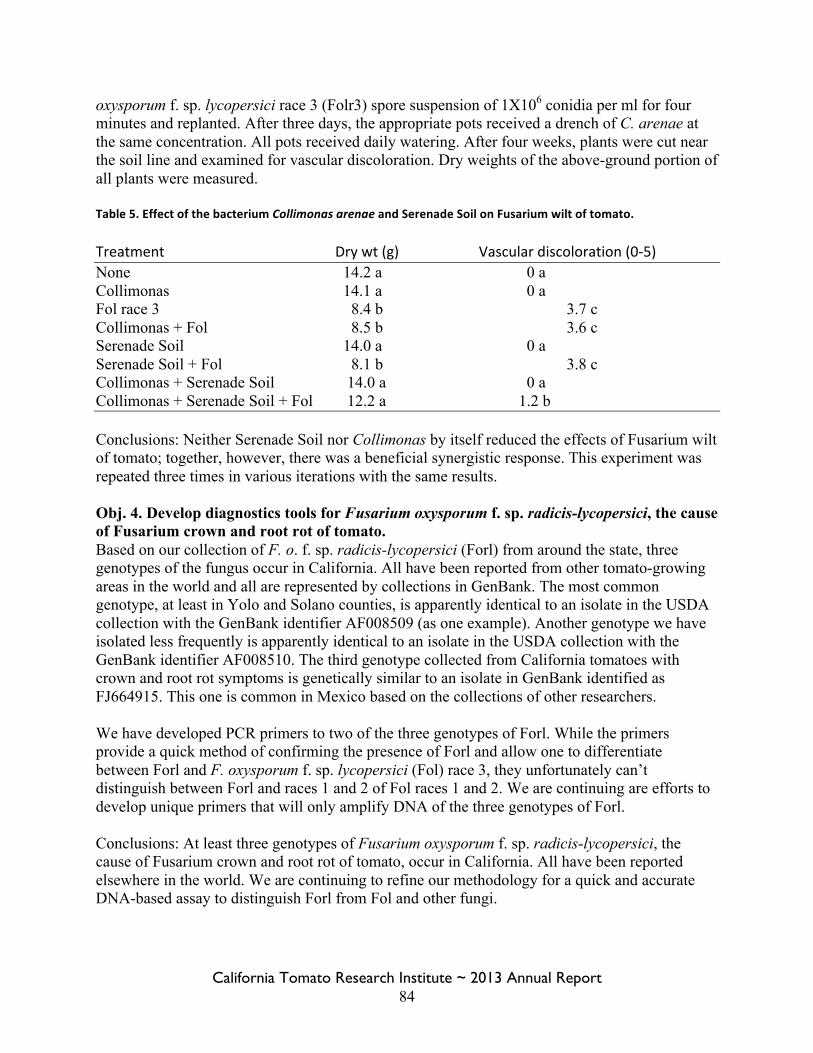
California Tomato Research Institute ~ 2013 Annual Report 84
oxysporum f. sp. lycopersici race 3 (Folr3) spore suspension of 1X10⁶ conidia per ml for four minutes and replanted. After three days, the appropriate pots received a drench of C. arenae at the same concentration. All pots received daily watering. After four weeks, plants were cut near the soil line and examined for vascular discoloration. Dry weights of the above-ground portion of all plants were measured. Table 5. Effect of the bacterium Collimonas arenae and Serenade Soil on Fusarium wilt of tomato. Treatment Dry wt (g) Vascular discoloration (0-‐5) None 14.2 a 0 a Collimonas 14.1 a 0 a Fol race 3 8.4 b 3.7 c Collimonas + Fol 8.5 b 3.6 c Serenade Soil 14.0 a 0 a Serenade Soil + Fol 8.1 b 3.8 c Collimonas + Serenade Soil 14.0 a 0 a Collimonas + Serenade Soil + Fol 12.2 a 1.2 b Conclusions: Neither Serenade Soil nor Collimonas by itself reduced the effects of Fusarium wilt of tomato; together, however, there was a beneficial synergistic response. This experiment was repeated three times in various iterations with the same results. Obj. 4. Develop diagnostics tools for Fusarium oxysporum f. sp. radicis-lycopersici, the cause of Fusarium crown and root rot of tomato. Based on our collection of F. o. f. sp. radicis-lycopersici (Forl) from around the state, three genotypes of the fungus occur in California. All have been reported from other tomato-growing areas in the world and all are represented by collections in GenBank. The most common genotype, at least in Yolo and Solano counties, is apparently identical to an isolate in the USDA collection with the GenBank identifier AF008509 (as one example). Another genotype we have isolated less frequently is apparently identical to an isolate in the USDA collection with the GenBank identifier AF008510. The third genotype collected from California tomatoes with crown and root rot symptoms is genetically similar to an isolate in GenBank identified as FJ664915. This one is common in Mexico based on the collections of other researchers. We have developed PCR primers to two of the three genotypes of Forl. While the primers provide a quick method of confirming the presence of Forl and allow one to differentiate between Forl and F. oxysporum f. sp. lycopersici (Fol) race 3, they unfortunately can’t distinguish between Forl and races 1 and 2 of Fol races 1 and 2. We are continuing are efforts to develop unique primers that will only amplify DNA of the three genotypes of Forl. Conclusions: At least three genotypes of Fusarium oxysporum f. sp. radicis-lycopersici, the cause of Fusarium crown and root rot of tomato, occur in California. All have been reported elsewhere in the world. We are continuing to refine our methodology for a quick and accurate DNA-based assay to distinguish Forl from Fol and other fungi.
California Tomato Research Institute ~ 2013 Annual Report 85
Discussion: At site #1, we observed a yield increase of about 20% with incorporated poultry manure at 10 tons/acre and a 12% increase in yield at 5 tons/acre. Similar trends were observed the last two years. Although tissue nutrient analysis for 2013 has not yet been completed, plant nutrition seems to have played a role in the increased yields and better plant health since luxury fertilizer levels and additional macronutrients that equaled nutrients in the manure also increased yields. However, last season tissue analysis did not explain the increase in yield with manure because NPK levels in the nontreated plots were not deficient. Apparently, NPK contributed by the manure didn’t fully account for the dramatic yield increase last year. However, it is doubtful the yield increase was due to pathogen suppression since there were no reductions in incidence of Verticillium or Fusarium in this year’s trials. The soil microbial communities in the tomato fields in our trials were not apparently influenced by any treatment. Neither bacterial nor fungal communities correlated with plant health and yield responses. We hope to learn more about the direct or indirect benefits of additional nutrients in the coming year. We thank J. H. Meek and Sons, Don Beeman Farms, Harlan Ranch, and Timothy and Viguie Farming for their cooperation.
California Tomato Research Institute ~ 2013 Annual Report 86
Project Title: Screening for Resistance to Bacterial Speck and Monitoring California Pseudomonas syringae Strains Project Leader: Gitta Coaker
Associate Professor Department of Plant Pathology University of California Davis Phone: 530-752-6541 E-mail: [email protected]
Collaborator: Gene Miyao
Farm Advisor, Vegetable Crops Cooperative Extension Yolo County Phone: (530) 666-8732 E-mail: [email protected]
Introduction: Bacterial speck of tomato, caused by Pseudomonas syringae pv. tomato, can significantly impact plant health and lead to decreased yields, fruit symptoms that can pose problems for whole-peel processors, as well as plant death in seedlings. Traditionally P. syringae pv. tomato has been controlled by a combination of copper sprays and genetic resistance conferred by the tomato genes Pto and Prf (Pedley and Martin 2003). Pto and Prf are effective in mediating resistance against Race 0 strains. However, Race 1 strains were first detected in California in 2000 (Arredondo and Davis 2000). In 2005, 2010 and 2011, outbreaks of bacterial speck occurred (Kunkeaw, Tan et al. 2010). The PI (G. Coaker) has been monitoring field strains of P. syringae over the last five years and has found that almost all field strains are exclusively Race 1 and possess moderate to high levels of copper resistance (Kunkeaw, Tan et al. 2010). Bacterial speck of tomato can become a problem in California due to a combination of favorable weather promoting disease development, the emergence of race shifting strains, and moderate to high levels of copper resistance. Thus, the most viable form of disease control will be genetic resistance. Objectives: This is the last year of a three year project. In the first two years of funding, we found that Pseudomonas syringae pv. tomato strains in California are closely related to one another, exhibit high levels of virulence, and possess moderate to high levels of copper resistance. Because cultivated tomato breeding lines and hybrids do not possess resistance to P. syringae race 1, we have screened through a variety of wild germplasm to identify novel sources of resistance that can be used by the tomato industry for effective disease control. We verified that Solanum peruvianum hybrids are resistant to current strains of P. syringae pv. tomato in both greenhouse and field trials. We also found that another wild species of tomato, Solanum habrochaites, exhibits resistance to race 1 strains of P. syringae. Importantly, there is an existing population derived from S. habrochaites that can be used to rapidly screen for resistance and identify lines
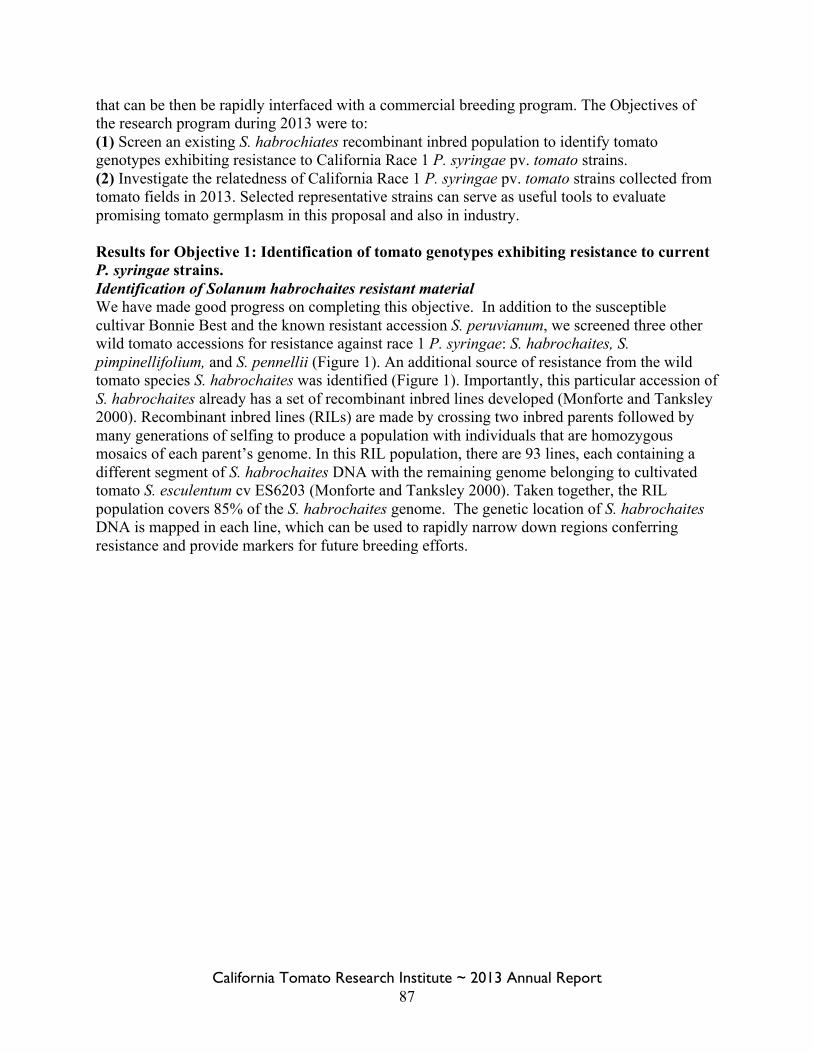
California Tomato Research Institute ~ 2013 Annual Report 87
that can be then be rapidly interfaced with a commercial breeding program. The Objectives of the research program during 2013 were to: (1) Screen an existing S. habrochiates recombinant inbred population to identify tomato genotypes exhibiting resistance to California Race 1 P. syringae pv. tomato strains. (2) Investigate the relatedness of California Race 1 P. syringae pv. tomato strains collected from tomato fields in 2013. Selected representative strains can serve as useful tools to evaluate promising tomato germplasm in this proposal and also in industry. Results for Objective 1: Identification of tomato genotypes exhibiting resistance to current P. syringae strains. Identification of Solanum habrochaites resistant material We have made good progress on completing this objective. In addition to the susceptible cultivar Bonnie Best and the known resistant accession S. peruvianum, we screened three other wild tomato accessions for resistance against race 1 P. syringae: S. habrochaites, S. pimpinellifolium, and S. pennellii (Figure 1). An additional source of resistance from the wild tomato species S. habrochaites was identified (Figure 1). Importantly, this particular accession of S. habrochaites already has a set of recombinant inbred lines developed (Monforte and Tanksley 2000). Recombinant inbred lines (RILs) are made by crossing two inbred parents followed by many generations of selfing to produce a population with individuals that are homozygous mosaics of each parent’s genome. In this RIL population, there are 93 lines, each containing a different segment of S. habrochaites DNA with the remaining genome belonging to cultivated tomato S. esculentum cv ES6203 (Monforte and Tanksley 2000). Taken together, the RIL population covers 85% of the S. habrochaites genome. The genetic location of S. habrochaites DNA is mapped in each line, which can be used to rapidly narrow down regions conferring resistance and provide markers for future breeding efforts.
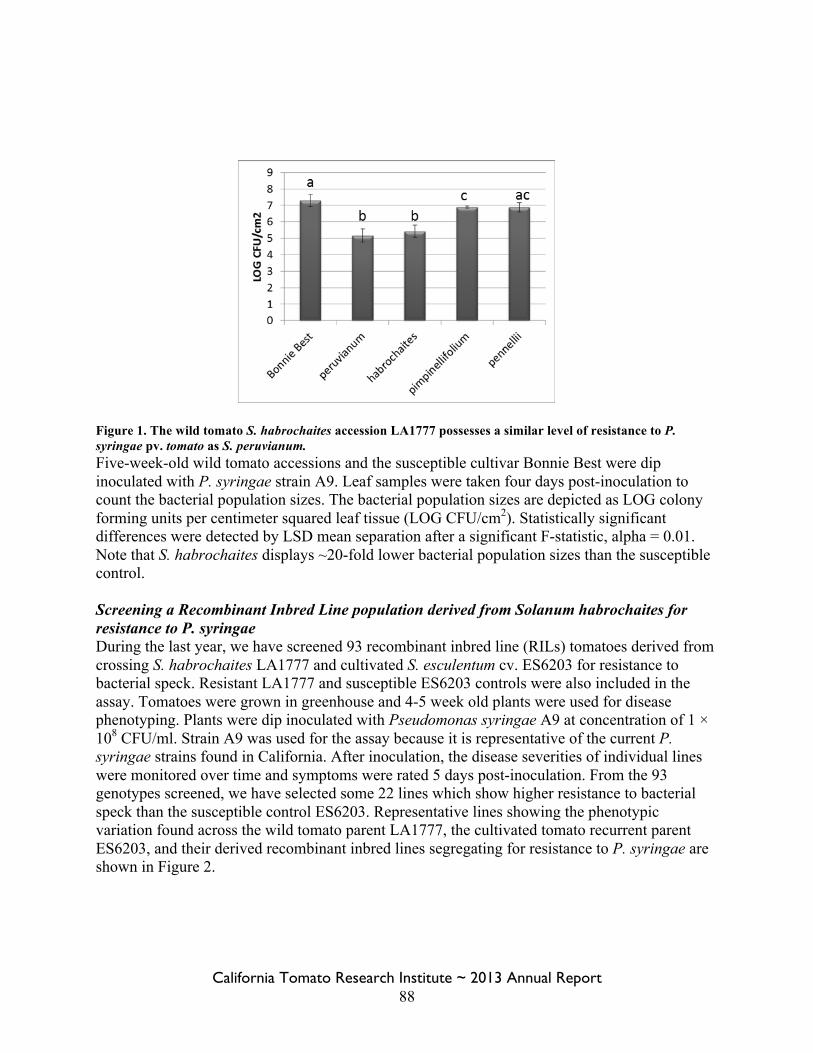
California Tomato Research Institute ~ 2013 Annual Report 88
Figure 1. The wild tomato S. habrochaites accession LA1777 possesses a similar level of resistance to P. syringae pv. tomato as S. peruvianum. Five-week-old wild tomato accessions and the susceptible cultivar Bonnie Best were dip inoculated with P. syringae strain A9. Leaf samples were taken four days post-inoculation to count the bacterial population sizes. The bacterial population sizes are depicted as LOG colony forming units per centimeter squared leaf tissue (LOG CFU/cm2). Statistically significant differences were detected by LSD mean separation after a significant F-statistic, alpha = 0.01. Note that S. habrochaites displays ~20-fold lower bacterial population sizes than the susceptible control. Screening a Recombinant Inbred Line population derived from Solanum habrochaites for resistance to P. syringae During the last year, we have screened 93 recombinant inbred line (RILs) tomatoes derived from crossing S. habrochaites LA1777 and cultivated S. esculentum cv. ES6203 for resistance to bacterial speck. Resistant LA1777 and susceptible ES6203 controls were also included in the assay. Tomatoes were grown in greenhouse and 4-5 week old plants were used for disease phenotyping. Plants were dip inoculated with Pseudomonas syringae A9 at concentration of 1 × 10⁸ CFU/ml. Strain A9 was used for the assay because it is representative of the current P. syringae strains found in California. After inoculation, the disease severities of individual lines were monitored over time and symptoms were rated 5 days post-inoculation. From the 93 genotypes screened, we have selected some 22 lines which show higher resistance to bacterial speck than the susceptible control ES6203. Representative lines showing the phenotypic variation found across the wild tomato parent LA1777, the cultivated tomato recurrent parent ES6203, and their derived recombinant inbred lines segregating for resistance to P. syringae are shown in Figure 2.
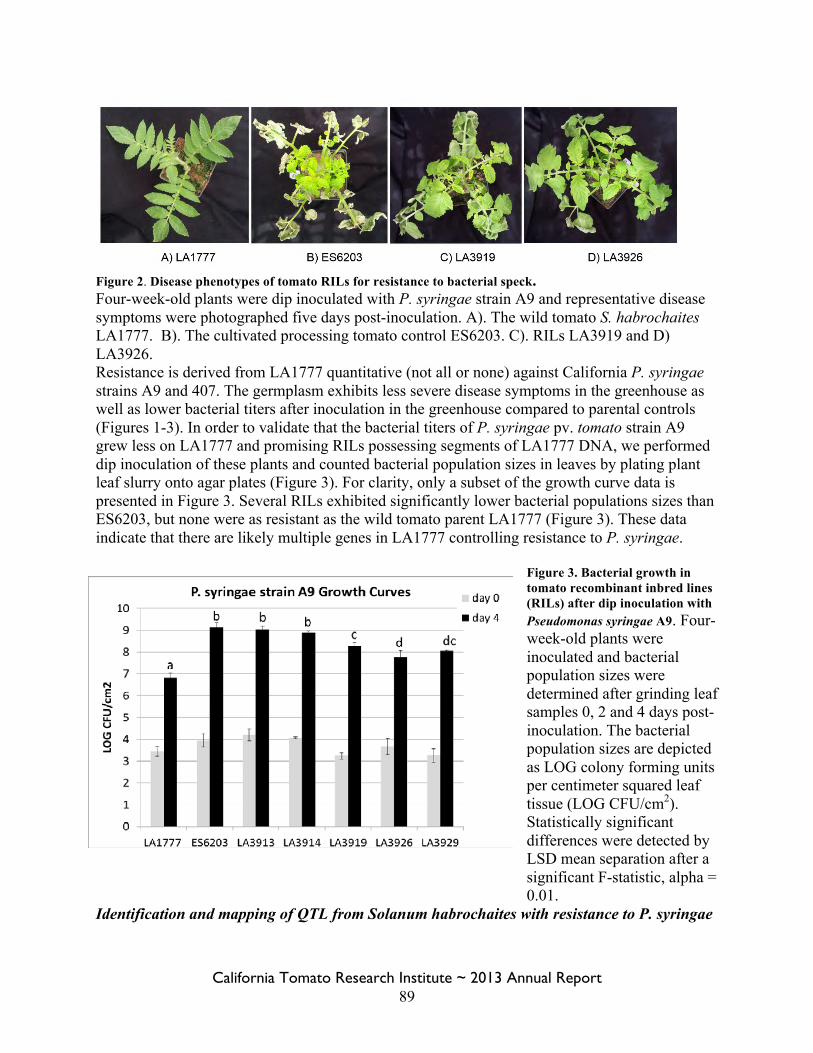
California Tomato Research Institute ~ 2013 Annual Report 89
Figure 2. Disease phenotypes of tomato RILs for resistance to bacterial speck. Four-week-old plants were dip inoculated with P. syringae strain A9 and representative disease symptoms were photographed five days post-inoculation. A). The wild tomato S. habrochaites LA1777. B). The cultivated processing tomato control ES6203. C). RILs LA3919 and D) LA3926. Resistance is derived from LA1777 quantitative (not all or none) against California P. syringae strains A9 and 407. The germplasm exhibits less severe disease symptoms in the greenhouse as well as lower bacterial titers after inoculation in the greenhouse compared to parental controls (Figures 1-3). In order to validate that the bacterial titers of P. syringae pv. tomato strain A9 grew less on LA1777 and promising RILs possessing segments of LA1777 DNA, we performed dip inoculation of these plants and counted bacterial population sizes in leaves by plating plant leaf slurry onto agar plates (Figure 3). For clarity, only a subset of the growth curve data is presented in Figure 3. Several RILs exhibited significantly lower bacterial populations sizes than ES6203, but none were as resistant as the wild tomato parent LA1777 (Figure 3). These data indicate that there are likely multiple genes in LA1777 controlling resistance to P. syringae.
Figure 3. Bacterial growth in tomato recombinant inbred lines (RILs) after dip inoculation with Pseudomonas syringae A9. Four-week-old plants were inoculated and bacterial population sizes were determined after grinding leaf samples 0, 2 and 4 days post-inoculation. The bacterial population sizes are depicted as LOG colony forming units per centimeter squared leaf tissue (LOG CFU/cm2). Statistically significant differences were detected by LSD mean separation after a significant F-statistic, alpha = 0.01.
Identification and mapping of QTL from Solanum habrochaites with resistance to P. syringae
California Tomato Research Institute ~ 2013 Annual Report 90
Quantitative Trait Loci (QTL) mapping approaches are used for studying quantitative inheritance, for detecting genomic regions associated with disease resistance, and for identifying molecular markers tightly linked to the genes of interest (Collard, Jahufer et al. 2005). We have used QTL mapping to identify genetic regions controlling disease resistance against P. syringae from S. habrochaites. We have identified 3 QTLs (Pr1, Pr2, Pr3) on chromosomes 2, 11 and 12 (Table 1) controlling resistance against P. syringae. The LOD values for Pr1, Pr2, and Pr3 are 5.54, 7.5 and 8.17, respectively. Pr3 is a major QTL and explains the most phenotypic variation (70%) for resistance to P. syringae (Table 1). Therefore, Pr3 will be an important QTL to integrate into breeding programs. Table 1. QTL mapping results for RILS derived from S. habrochaites accession LA1777 crossed with ES6203.
QTL Chromosomal location LOD RILs Effect (%)
Pr1 2 5.54 LA3921, LA3922 18.8
Pr2 11 7.5 LA3993, LA3992, LA3998 -
Pr3 12 8.17 LA3969, LA4001 70 LOD-Logarithm of odds. An LOD score of more than 3 is considered significant. RILs that exhibit resistance to P. syringae with small introgressions of S. habrochaites DNA will be analyzed for horticultural attributes over the next two months. Seven promising lines have been selected and will be screened in the greenhouse for growth habit (determinant or indeterminant), fruit set, fruit size, and seed set compared with controls. Completing the last set of proposed experiments will enable us to identify promising lines that can be more rapidly used by industry to breed for resistance. We have been in contact with multiple members of industry, including Harris-Moran and Claus, and have freely shared all information and seed to facilitate more rapid deployment of germplasm with resistance. Results from Objective 2: Investigate the relatedness of California Race 1 P. syringae pv. tomato strains collected from tomato fields in 2013. 2013 was a very dry year in California. Because P. syringae requires cool, wet conditions, bacterial speck was not a problem in 2013. We were able to obtain four infected tomato samples this year which were positive for infection with P. syringae. These strains were phenotyped and verified as Race 1 and closely related to P. syringae A9. Therefore, the bacterial population has not changed significantly and we are using representative strains for screening new sources of resistance.
California Tomato Research Institute ~ 2013 Annual Report 91
References: Arredondo, C. and R. Davis (2000). "First Report of Pseudomonas syringae pv. tomato Race 1
on Tomato in California." Plant Disease 84(3): 371. Collard, B. C. Y., M. Z. Z. Jahufer, et al. (2005). "An introduction to markers, quantitative trait
loci (QTL) mapping and marker-assisted selection for crop improvement: The basic concepts." Euphytica 142(1-2): 169-196.
Kunkeaw, S., S. Tan, et al. (2010). "Molecular and evolutionary analyses of Pseudomonas syringae pv. tomato race 1." Mol Plant Microbe Interact 23(4): 415-424.
Monforte, A. J. and S. D. Tanksley (2000). "Development of a set of near isogenic and backcross recombinant inbred lines containing most of the Lycopersicon hirsutum genome in a L. esculentum genetic background: A tool for gene mapping and gene discovery." Genome 43(5): 803-813.
Pedley, K. F. and G. B. Martin (2003). "Molecular basis of Pto-mediated resistance to bacterial speck disease in tomato." Annu Rev Phytopathol 41: 215-243.
California Tomato Research Institute ~ 2013 Annual Report 92
Project Title: Management of Root-Knot Nematodes with Novel Nematicides Project Leaders: J. Ole Becker
Department of Nematology 1463 Boyce Hall, UC Riverside, CA 92521 (951) 827 2185, [email protected] Antoon Ploeg Department of Nematology, UC Riverside, CA
Joe Nunez UCCE Bakersfield, CA
Summary: Field trials were conducted at the UC South Coast Research and Extension Center (SCREC) and at Shafter to evaluate the efficacy of several novel soil nematicides and two biological control products on root-knot nematode population development, tomato root health and yield. The products were applied at different rates and/or times according to the manufacturer's recommendation. Vydate and an untreated control served as standard checks. Of the products tested, the two nematicides showed excellent efficacy against root-knot nematodes. At SCREC MCW-2 significantly reduced early and late-season root galling and increased tomato yields by 26% over the non-treated check. This confirms our result from last year's trials. Another development product (DP) that was noted for its promising activity at the Shafter location in 2012, showed again excelent efficacy. It significantly reduced early and late-season root galling and at SCREC increased tomato yields over the non-treated control by up to 36%. The Shafter trial suffered from major curly top incidence but still confirmed the nematicidal efficacy of MCW-2 and DP based on disease ratings at harvest. Introduction and Objectives: Plant-parasitic nematodes are responsible for at least $11 billion in US crop losses; more than half of those are caused by various species of root-knot nematodes (Meloidogyne spp.). Root-knot nematodes in CA processing tomato production have been responsible for 10-20% yield reductions, despite the wide-spread use of resistant tomato cultivars or nematicides (Koenning et al, 1999). The increasing occurrence of Mi-1 gene resistance-breaking root-knot nematode strains in CA processing tomato production fields (Roberts, 1995, Kaloshian et al., 1996, Williamson and Kumar, 2006) is considered an increasing problem not only because of the potential yield loss to the individual farmer but the danger of wider dissemination of these strains. Also, there is the realistic concern about the potential introduction of new invasive species. Meloidogyne enterolobii (syn. M. mayaguensis) is a subtropical root-knot nematode species that was first detected in the US about a decade ago. It is now considered one of the most important nematode species in Florida vegetable production (Brito et al., 2004a,b). It has been also reported also from Europe (Castagnone-Sereno, 2012). The nematode is morphologically indistinguishable from our common root-knot species and reproduces on Mi-resistant tomato cultivars (Kiewnick et al., 2009).
California Tomato Research Institute ~ 2013 Annual Report 93
In the past few decades, management of soilborne pathogens in high cash crops has primarily relied on the use of soil fumigants (Noling and Becker, 1994). Although often superior in efficacy compared to contact pesticides, many fumigants have negative attributes, such as potential health hazards, and groundwater or air pollutants. Consequently, several soil fumigants were banned while others have been restricted in use. The few remaining fumigants are generally limited by regulatory restrictions related to their high emission rates (volatile organic compounds), and toxicity. Furthermore, organophosphate and carbamate nematicides have been severely restricted or taken off the market as a consequence of the Food Quality Protection Act. With development cost of >$200 million for a new pesticide, the agrochemical industry has neglected R & D of nematicides for a number of years in favor of the more profitable markets of other pesticides. More recently, a number of new products for nematode management have been under development, including some for organic production systems. However, little data are available concerning efficacy against root knot nematodes under Southern California conditions. Materials and Methods: For the past few years, several field trials were conducted at the UC South Coast Research and Extension Center (SCREC) and at Shafter to evaluate the efficacy of novel soil nematicides and bionematicides on root-knot nematode population development, tomato root health and yield. After screening out those products that did not perform well under our conditions and nematode populations, this year we concentrated primarily on two soil nematicides (MCW-2, DP) and the nematophagous fungus Paecilomyces lilacinus (MeloCon, NemaRoot). A tomato field trial was conducted from 29 May to 21 Aug 2013 at the University of California South Coast Research and Extension Center (SCREC). The SCREC soil at the trial site was a San Emigdio sandy loam with 13% sand, 75% silt, 11.6% clay, 0.4% organic matter, pH 7.3 (ANR Analytical Laboratory, University of California, Davis). The test site at SCREC is infested with the Southern root-knot nematode (rkn), M. incognita. For the past five years at least one host crop has been grown to keep the rkn population at a yield-reducing level. During the winter months the field was cropped to root knot nematode-susceptible wheat (cv. Yecoro Rojo). On May 23, Matrix SG was applied at 2 oz/acre, Prowl H2O at 2 pt/acre, and Treflan HFP at 1.25 pt/acre for weed control. For the tomato trial, each individual plot was 6.1 m long and 0.6 m wide with plant spacing of 0.3 m. The trial was designed as a randomized complete block with 5 replications. At the beginning (pi) and end (pf) of the trial, six soil cores were taken to a depth of 0.25 m from each plot, pooled and a subsample was extracted for second-stage juveniles (J2) of rkn. Mean rkn population density at planting was 43 J2/100 cm3 (5 days incubation on Baermann funnels with approx. 35% extraction efficacy). All pre-plant nematicide treatments (Tab.1) were suspended in 7.5 L water, applied with a sprinkler can in a 0.5 m band and rototilled into the top 10-12 cm. Additional 22.8 L water was then sprinkled on top of each plot. Before planting, low volume irrigation tubing (2 L/hr emitter output, 0.3 m spacing) was buried at approximately 10 cm depth. The trial was planted with 6-week transplants of the root-knot nematode susceptible cultivar Halley 3155. Post-plant soil treatments were suspended in 4 gal water, thoroughly stirred and applied through low volume irrigation tubing (2 L/hr emitter output, 0.3 m spacing) placed on top of the beds during a 45 min run, followed by a 15 min flush with water. Soil temperatures at SCREC at 15 cm depth were 23.1˚C (7 dbp), 23.3˚C (@p), and 21.8˚C (14 dap). To prevent potential virus transmission, Platinum was applied via irrigation system on June 7th, 2013 at 10oz/acre rate.
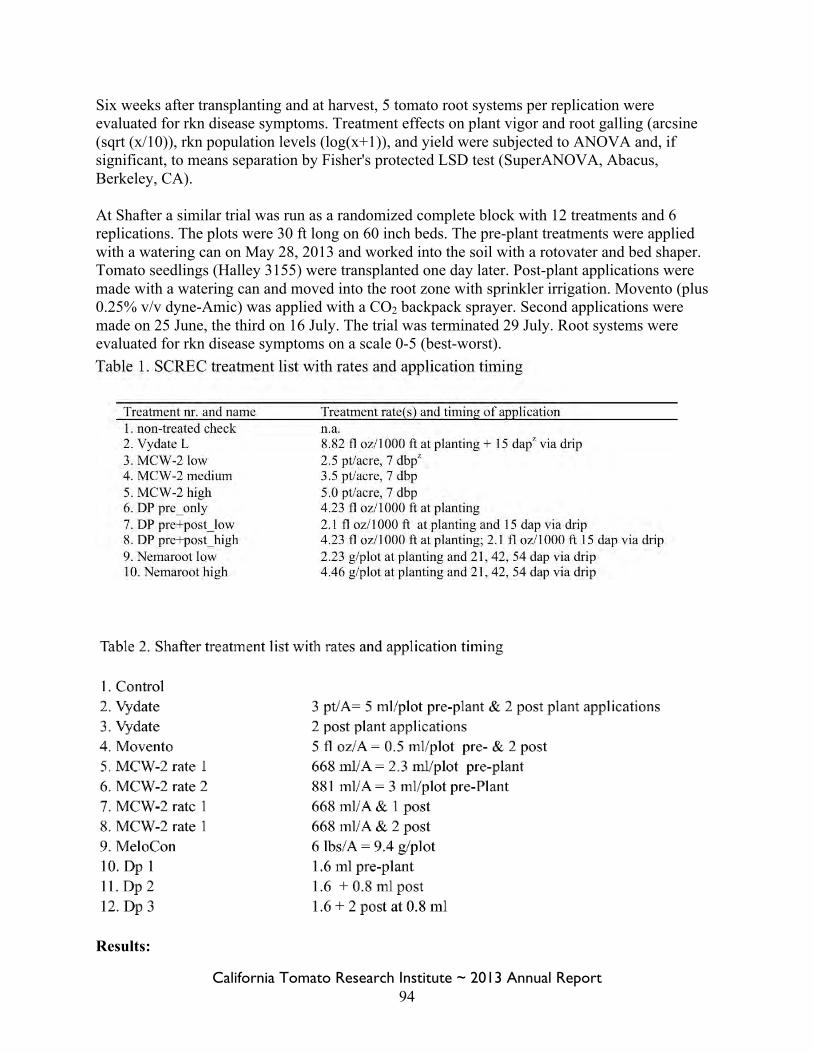
California Tomato Research Institute ~ 2013 Annual Report 94
Six weeks after transplanting and at harvest, 5 tomato root systems per replication were evaluated for rkn disease symptoms. Treatment effects on plant vigor and root galling (arcsine (sqrt (x/10)), rkn population levels (log(x+1)), and yield were subjected to ANOVA and, if significant, to means separation by Fisher's protected LSD test (SuperANOVA, Abacus, Berkeley, CA). At Shafter a similar trial was run as a randomized complete block with 12 treatments and 6 replications. The plots were 30 ft long on 60 inch beds. The pre-plant treatments were applied with a watering can on May 28, 2013 and worked into the soil with a rotovater and bed shaper. Tomato seedlings (Halley 3155) were transplanted one day later. Post-plant applications were made with a watering can and moved into the root zone with sprinkler irrigation. Movento (plus 0.25% v/v dyne-Amic) was applied with a CO2 backpack sprayer. Second applications were made on 25 June, the third on 16 July. The trial was terminated 29 July. Root systems were evaluated for rkn disease symptoms on a scale 0-5 (best-worst).
Results:
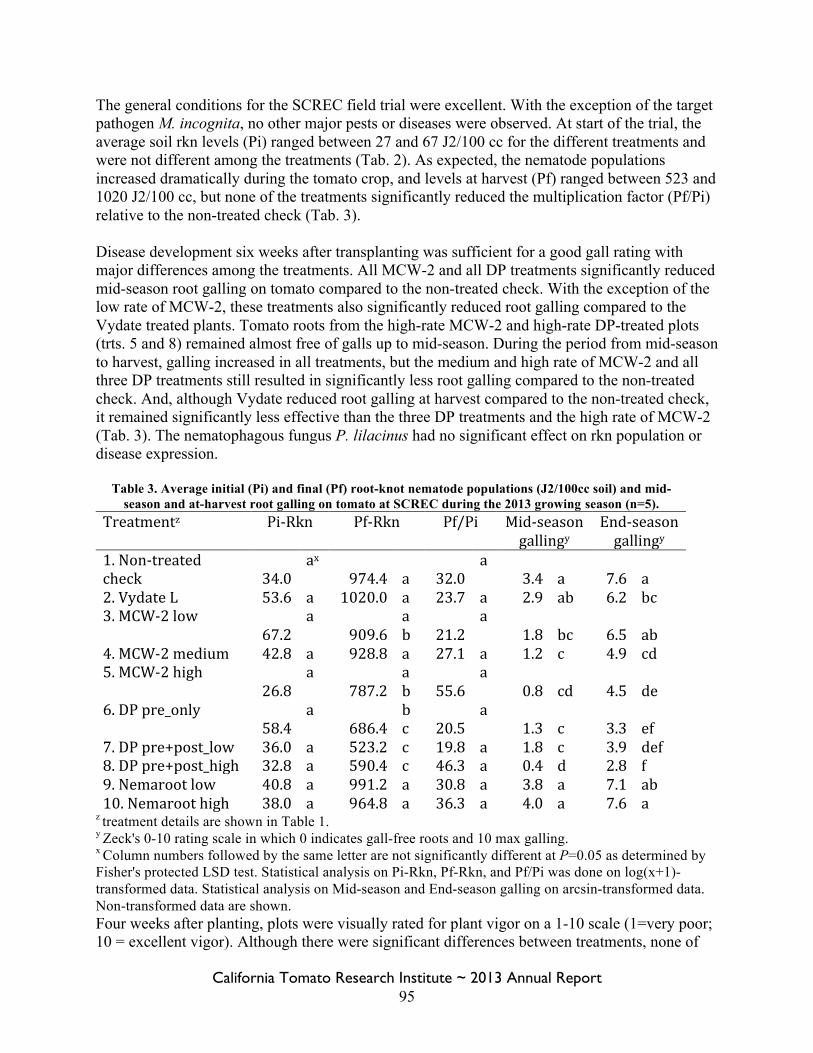
California Tomato Research Institute ~ 2013 Annual Report 95
The general conditions for the SCREC field trial were excellent. With the exception of the target pathogen M. incognita, no other major pests or diseases were observed. At start of the trial, the average soil rkn levels (Pi) ranged between 27 and 67 J2/100 cc for the different treatments and were not different among the treatments (Tab. 2). As expected, the nematode populations increased dramatically during the tomato crop, and levels at harvest (Pf) ranged between 523 and 1020 J2/100 cc, but none of the treatments significantly reduced the multiplication factor (Pf/Pi) relative to the non-treated check (Tab. 3). Disease development six weeks after transplanting was sufficient for a good gall rating with major differences among the treatments. All MCW-2 and all DP treatments significantly reduced mid-season root galling on tomato compared to the non-treated check. With the exception of the low rate of MCW-2, these treatments also significantly reduced root galling compared to the Vydate treated plants. Tomato roots from the high-rate MCW-2 and high-rate DP-treated plots (trts. 5 and 8) remained almost free of galls up to mid-season. During the period from mid-season to harvest, galling increased in all treatments, but the medium and high rate of MCW-2 and all three DP treatments still resulted in significantly less root galling compared to the non-treated check. And, although Vydate reduced root galling at harvest compared to the non-treated check, it remained significantly less effective than the three DP treatments and the high rate of MCW-2 (Tab. 3). The nematophagous fungus P. lilacinus had no significant effect on rkn population or disease expression.
Table 3. Average initial (Pi) and final (Pf) root-knot nematode populations (J2/100cc soil) and mid-season and at-harvest root galling on tomato at SCREC during the 2013 growing season (n=5).
Treatmentz Pi-‐Rkn Pf-‐Rkn Pf/Pi Mid-‐season gallingy
End-‐season gallingy
1. Non-‐treated check 34.0
ax 974.4 a 32.0
a 3.4 a 7.6 a
2. Vydate L 53.6 a 1020.0 a 23.7 a 2.9 ab 6.2 bc 3. MCW-‐2 low
67.2 a
909.6 ab 21.2
a 1.8 bc 6.5 ab
4. MCW-‐2 medium 42.8 a 928.8 a 27.1 a 1.2 c 4.9 cd 5. MCW-‐2 high
26.8 a
787.2 ab 55.6
a 0.8 cd 4.5 de
6. DP pre_only 58.4
a 686.4
bc 20.5
a 1.3 c 3.3 ef
7. DP pre+post_low 36.0 a 523.2 c 19.8 a 1.8 c 3.9 def 8. DP pre+post_high 32.8 a 590.4 c 46.3 a 0.4 d 2.8 f 9. Nemaroot low 40.8 a 991.2 a 30.8 a 3.8 a 7.1 ab 10. Nemaroot high 38.0 a 964.8 a 36.3 a 4.0 a 7.6 a
z treatment details are shown in Table 1. y Zeck's 0-10 rating scale in which 0 indicates gall-free roots and 10 max galling. x Column numbers followed by the same letter are not significantly different at P=0.05 as determined by Fisher's protected LSD test. Statistical analysis on Pi-Rkn, Pf-Rkn, and Pf/Pi was done on log(x+1)-transformed data. Statistical analysis on Mid-season and End-season galling on arcsin-transformed data. Non-transformed data are shown. Four weeks after planting, plots were visually rated for plant vigor on a 1-10 scale (1=very poor; 10 = excellent vigor). Although there were significant differences between treatments, none of
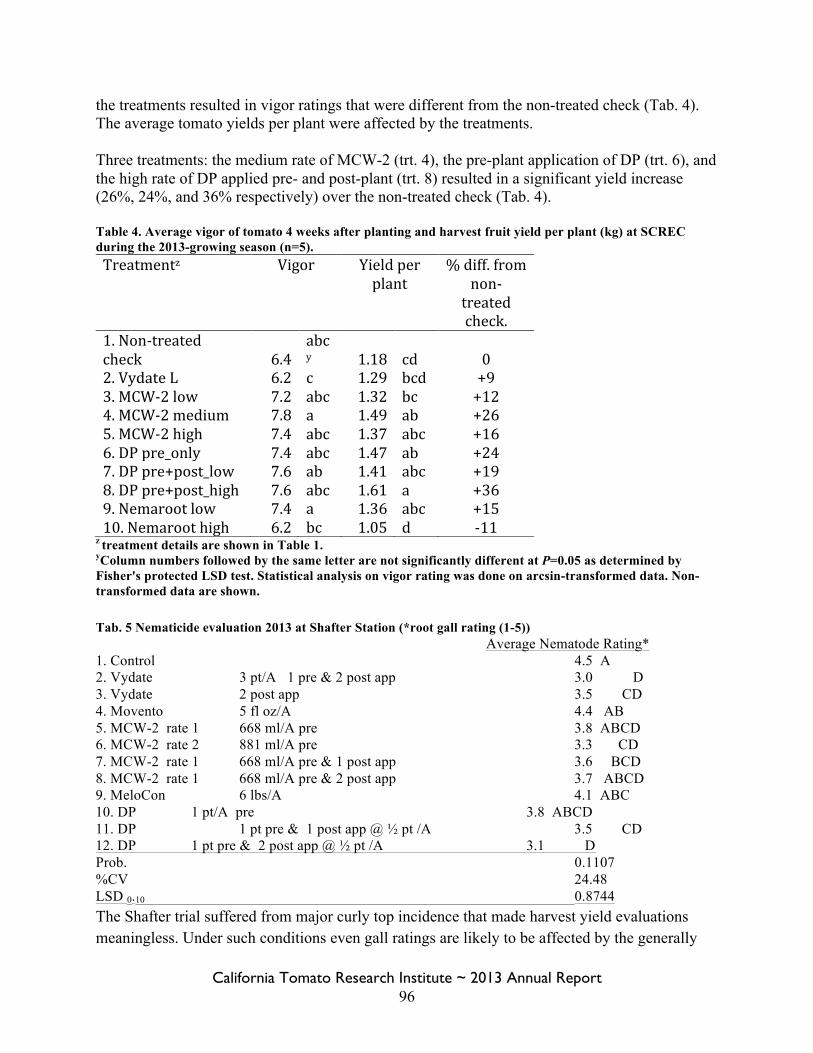
California Tomato Research Institute ~ 2013 Annual Report 96
the treatments resulted in vigor ratings that were different from the non-treated check (Tab. 4). The average tomato yields per plant were affected by the treatments. Three treatments: the medium rate of MCW-2 (trt. 4), the pre-plant application of DP (trt. 6), and the high rate of DP applied pre- and post-plant (trt. 8) resulted in a significant yield increase (26%, 24%, and 36% respectively) over the non-treated check (Tab. 4). Table 4. Average vigor of tomato 4 weeks after planting and harvest fruit yield per plant (kg) at SCREC during the 2013-growing season (n=5). Treatmentz Vigor Yield per
plant % diff. from
non-‐treated check.
1. Non-‐treated check 6.4
abcy 1.18 cd 0
2. Vydate L 6.2 c 1.29 bcd +9 3. MCW-‐2 low 7.2 abc 1.32 bc +12 4. MCW-‐2 medium 7.8 a 1.49 ab +26 5. MCW-‐2 high 7.4 abc 1.37 abc +16 6. DP pre_only 7.4 abc 1.47 ab +24 7. DP pre+post_low 7.6 ab 1.41 abc +19 8. DP pre+post_high 7.6 abc 1.61 a +36 9. Nemaroot low 7.4 a 1.36 abc +15 10. Nemaroot high 6.2 bc 1.05 d -‐11
z treatment details are shown in Table 1. yColumn numbers followed by the same letter are not significantly different at P=0.05 as determined by Fisher's protected LSD test. Statistical analysis on vigor rating was done on arcsin-transformed data. Non-transformed data are shown. Tab. 5 Nematicide evaluation 2013 at Shafter Station (*root gall rating (1-5)) Average Nematode Rating* 1. Control 4.5 A 2. Vydate 3 pt/A 1 pre & 2 post app 3.0 D 3. Vydate 2 post app 3.5 CD 4. Movento 5 fl oz/A 4.4 AB 5. MCW-2 rate 1 668 ml/A pre 3.8 ABCD 6. MCW-2 rate 2 881 ml/A pre 3.3 CD 7. MCW-2 rate 1 668 ml/A pre & 1 post app 3.6 BCD 8. MCW-2 rate 1 668 ml/A pre & 2 post app 3.7 ABCD 9. MeloCon 6 lbs/A 4.1 ABC 10. DP 1 pt/A pre 3.8 ABCD 11. DP 1 pt pre & 1 post app @ ½ pt /A 3.5 CD 12. DP 1 pt pre & 2 post app @ ½ pt /A 3.1 D Prob. 0.1107 %CV 24.48 LSD 0.10 0.8744 The Shafter trial suffered from major curly top incidence that made harvest yield evaluations meaningless. Under such conditions even gall ratings are likely to be affected by the generally
California Tomato Research Institute ~ 2013 Annual Report 97
poor growth of the tomatoes. Still, the nematicidal efficacies of MCW-2 and DP treatments at the high rate or repeated applications were documented (Tab. 5). Recently it was announced that MCW-2 will be trademarked in the US Nimitz and, according to the manufacturer, is expected to receive federal EPA registration in fruiting vegetables within the next few months. The development of two potent new nematicides is quite encouraging but we need to be smart with these novel chemistries. Although root knot nematode resistance to carbamate and organophosphate nematicides has never been observed under field conditions, lessons from other pesticides should not be ignored. Also, there is still quite some work left to optimize application technology for these new products.
Literature Cited: Becker, J.O., A. Ploeg, and J. Nunez 2012. Evaluation of novel products for root knot nematode
management in tomato, 2011. Plant Disease Management Report No. 6:N016. Becker, J.O., A. Ploeg, and J. Nunez 2013. Efficacy of nematicides for root-knot nematode
management in tomato, 2012. Plant Disease Management Report No. 7. Brito, J., J. Stanley, R. Cetintas, T. Powers, R. Inserra, G. McAvoy, M. Mendes, B. Crow, and
D. Dickson 2004a. Meloidogyne mayaguensis a new plant nematode species, poses threat for vegetable production in Florida. 2004 Annual International Research Conference on Methyl Bromide Alternatives and Emissions Reductions. Orlando, FL.
Brito, J., T. O. Powers, P. G. Mullin, R. N. Inserra and D. W. Dickson 2004b. Morphological
and molecular characterization of Meloidogyne mayaguensis isolates from Florida. Journal of Nematology 36 (3): 232–240.
Castagnone-Sereno, P. 2012. Meloidogyne enterolobii (= M. mayaguensis): profile of an
emerging, highly pathogenic, root-knot nematode species. Nematology 14:133-138(6). Kaloshian, I., V. Williamson, G. Miyao, D.A. Lawn, and B.B. Westerdahl 1996. “Resistance-
breaking” nematodes identified in California tomatoes. California Agriculture 50(6):18-19.
Kiewnick, S., M. Dessimoz, L. Franck 2009. Effects of the Mi-1 and the N root-knot nematode-
resistance gene on infection and reproduction of Meloidogyne enterolobii on tomato and pepper cultivars. Journal of Nematology 41(2): 134–139.
Koenning, S.R., C. Overstreet, J.W. Noling, P.A. Donald, J.O. Becker, and B.A. Fortnum. 1999.
Survey of crop losses in response to phytoparasitic nematodes in the United States for 1994. J. Nematology 31:587-618.
California Tomato Research Institute ~ 2013 Annual Report 98
Noling, J.W., and J.O. Becker 1994. The challenge of research and extension to define and implement alternatives to methyl bromide. J. Nematology 26:573-586.
Roberts, P. A. 1995. Conceptual and practical aspects of variability in root knot nematode related
host plant resistance. Annual Review Phytopathology 33:199-221. Williamson, V. M., and A. Kumar 2006. Nematode resistance in plants: the battle underground.
Trends Genet. 22:396-403. Zeck, W. M. 1971. A rating scheme for field evaluation of root-knot nematode infestations.
Pflanzenschutz-Nachrichten, Bayer AG 24:141–144.
California Tomato Research Institute ~ 2013 Annual Report 99
Project Title: Genome Sequencing of the Bacterial Canker Pathogen, Clavibacter Michiganensis Subsp. Michiganensis, to Develop Robust Detection and Disease Control Strategies Project Leader: Gitta Coaker
Associate Professor Department of Plant Pathology University of California Davis Phone: 530-752-6541 E-mail: [email protected]
Co-PI: Robert Gilbertson
Professor Department of Plant Pathology University of California, Davis Phone: 530-752-3163 E-mail: [email protected]
Introduction: Bacterial canker of tomato, caused by Clavibacter michiganensis subsp. michiganensis (Cmm), can cause significant losses in greenhouse and field tomato production under favorable environmental conditions (Eichenlaub and Gartemann 2011). Although seed disinfestation with HCl is a highly effective disease control strategy, bacterial canker can still develop if seed treatment is not complete or if other sources of inoculum are present. Detection of the disease in the field is now commonly performed with immunostrips, but these are not very sensitive and are prone to false positives due to the presence of non-pathogenic bacteria that are closely related to Cmm. PCR with Cmm primers is a more sensitive method, but it is technically challenging and the currently available primers may only detect a subset of Cmm strains present in the field (Eichenlaub and Gartemann 2011). Development of robust PCR detection method for Cmm would enable rapid detection of contaminated seed or seedlings before planting or transplanting, respectively. Furthermore, there are no existing chemical or genetic disease control methods for this pathogen. The goals of the funded research are to sequence the genomes of 5 Clavibacter strains in order to develop a robust PCR detection strategy and test the efficacy of novel chemical control strategies based off genome sequencing information. This is the first year of a proposed three year grant. There are three objectives in the proposal: Objective 1: Sequence and assemble four strains of Clavibacter michiganensis subsp. michiganensis as well as one saprophytic Clavibacter isolate. Objective 2: Mine the genome sequence data to develop robust PCR detection strategies for Clavibacter michiganensis subsp. michiganensis. Objective 3: Test the efficiency of novel chemical control strategies based on information from genome sequencing. Progress for Objective 1:Genome sequencing and assembly of Clavibacter strains
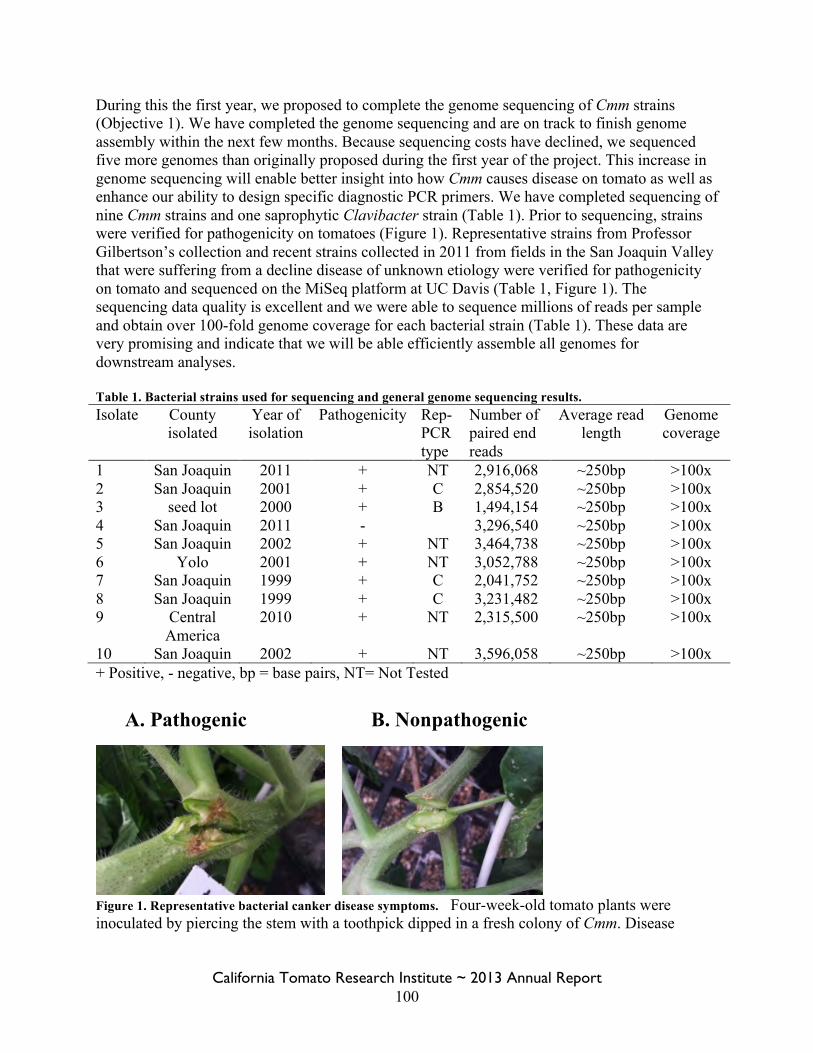
California Tomato Research Institute ~ 2013 Annual Report 100
During this the first year, we proposed to complete the genome sequencing of Cmm strains (Objective 1). We have completed the genome sequencing and are on track to finish genome assembly within the next few months. Because sequencing costs have declined, we sequenced five more genomes than originally proposed during the first year of the project. This increase in genome sequencing will enable better insight into how Cmm causes disease on tomato as well as enhance our ability to design specific diagnostic PCR primers. We have completed sequencing of nine Cmm strains and one saprophytic Clavibacter strain (Table 1). Prior to sequencing, strains were verified for pathogenicity on tomatoes (Figure 1). Representative strains from Professor Gilbertson’s collection and recent strains collected in 2011 from fields in the San Joaquin Valley that were suffering from a decline disease of unknown etiology were verified for pathogenicity on tomato and sequenced on the MiSeq platform at UC Davis (Table 1, Figure 1). The sequencing data quality is excellent and we were able to sequence millions of reads per sample and obtain over 100-fold genome coverage for each bacterial strain (Table 1). These data are very promising and indicate that we will be able efficiently assemble all genomes for downstream analyses. Table 1. Bacterial strains used for sequencing and general genome sequencing results. Isolate County
isolated Year of isolation
Pathogenicity Rep-PCR type
Number of paired end reads
Average read length
Genome coverage
1 San Joaquin 2011 + NT 2,916,068 ~250bp >100x 2 San Joaquin 2001 + C 2,854,520 ~250bp >100x 3 seed lot 2000 + B 1,494,154 ~250bp >100x 4 San Joaquin 2011 - 3,296,540 ~250bp >100x 5 San Joaquin 2002 + NT 3,464,738 ~250bp >100x 6 Yolo 2001 + NT 3,052,788 ~250bp >100x 7 San Joaquin 1999 + C 2,041,752 ~250bp >100x 8 San Joaquin 1999 + C 3,231,482 ~250bp >100x 9 Central
America 2010 + NT 2,315,500 ~250bp >100x
10 San Joaquin 2002 + NT 3,596,058 ~250bp >100x + Positive, - negative, bp = base pairs, NT= Not Tested
Figure 1. Representative bacterial canker disease symptoms. Four-week-old tomato plants were inoculated by piercing the stem with a toothpick dipped in a fresh colony of Cmm. Disease
A. Pathogenic B. Nonpathogenic
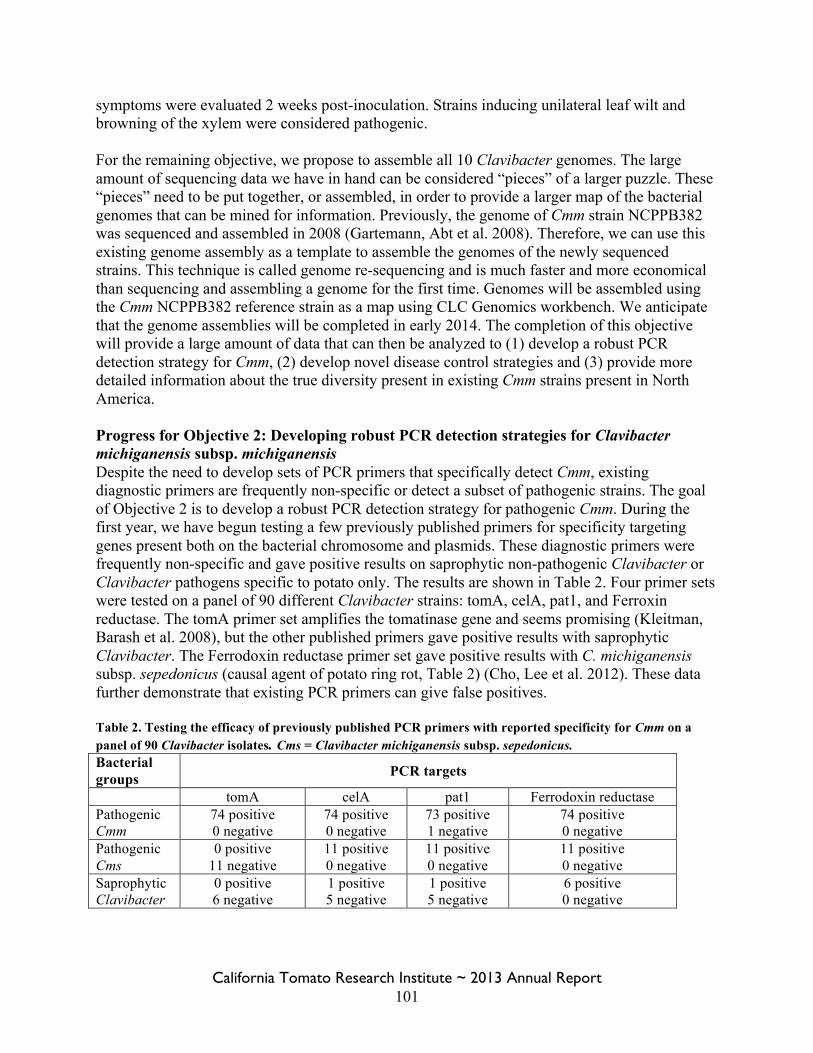
California Tomato Research Institute ~ 2013 Annual Report 101
symptoms were evaluated 2 weeks post-inoculation. Strains inducing unilateral leaf wilt and browning of the xylem were considered pathogenic. For the remaining objective, we propose to assemble all 10 Clavibacter genomes. The large amount of sequencing data we have in hand can be considered “pieces” of a larger puzzle. These “pieces” need to be put together, or assembled, in order to provide a larger map of the bacterial genomes that can be mined for information. Previously, the genome of Cmm strain NCPPB382 was sequenced and assembled in 2008 (Gartemann, Abt et al. 2008). Therefore, we can use this existing genome assembly as a template to assemble the genomes of the newly sequenced strains. This technique is called genome re-sequencing and is much faster and more economical than sequencing and assembling a genome for the first time. Genomes will be assembled using the Cmm NCPPB382 reference strain as a map using CLC Genomics workbench. We anticipate that the genome assemblies will be completed in early 2014. The completion of this objective will provide a large amount of data that can then be analyzed to (1) develop a robust PCR detection strategy for Cmm, (2) develop novel disease control strategies and (3) provide more detailed information about the true diversity present in existing Cmm strains present in North America. Progress for Objective 2: Developing robust PCR detection strategies for Clavibacter michiganensis subsp. michiganensis Despite the need to develop sets of PCR primers that specifically detect Cmm, existing diagnostic primers are frequently non-specific or detect a subset of pathogenic strains. The goal of Objective 2 is to develop a robust PCR detection strategy for pathogenic Cmm. During the first year, we have begun testing a few previously published primers for specificity targeting genes present both on the bacterial chromosome and plasmids. These diagnostic primers were frequently non-specific and gave positive results on saprophytic non-pathogenic Clavibacter or Clavibacter pathogens specific to potato only. The results are shown in Table 2. Four primer sets were tested on a panel of 90 different Clavibacter strains: tomA, celA, pat1, and Ferroxin reductase. The tomA primer set amplifies the tomatinase gene and seems promising (Kleitman, Barash et al. 2008), but the other published primers gave positive results with saprophytic Clavibacter. The Ferrodoxin reductase primer set gave positive results with C. michiganensis subsp. sepedonicus (causal agent of potato ring rot, Table 2) (Cho, Lee et al. 2012). These data further demonstrate that existing PCR primers can give false positives. Table 2. Testing the efficacy of previously published PCR primers with reported specificity for Cmm on a panel of 90 Clavibacter isolates. Cms = Clavibacter michiganensis subsp. sepedonicus. Bacterial groups PCR targets
tomA celA pat1 Ferrodoxin reductase Pathogenic Cmm
74 positive 0 negative
74 positive 0 negative
73 positive 1 negative
74 positive 0 negative
Pathogenic Cms
0 positive 11 negative
11 positive 0 negative
11 positive 0 negative
11 positive 0 negative
Saprophytic Clavibacter
0 positive 6 negative
1 positive 5 negative
1 positive 5 negative
6 positive 0 negative
California Tomato Research Institute ~ 2013 Annual Report 102
In order to complete Objective 2, we will analyze the genome sequence data obtained in Objective 1 to develop robust PCR detection strategies. All genomes will be compared and results of these comparisons used to develop primers that will specifically amplify conserved genes from pathogenic Cmm. We will compare these primers to DNA sequence data currently available for other microorganisms to help ensure specificity. We will also attempt to develop primers to specifically differentiate the REP-PCR types of Cmm, including those that are most prevalent in California. These more specific PCR primers can be useful for determining which type of Cmm is involved in an outbreak after an initial positive result is obtained. Primers will be tested for their specificity against a panel of Cmm strains, related non-pathogenic Clavibacter and other bacterial pathogens of tomato. We will also include the tomA primer set in these analyses as well as the Cmm 3/4 and 4/5 primer pairs (Santos, Cruze et al. 1997; Kleitman, Barash et al. 2008). In the last year, we have assembled a large collection of Cmm isolates and saprophytic Clavibacter representative of the diversity present worldwide. These Cmm strains, in addition to California strains, will be included in the panel for testing primer specificity. References: Cho, M. S., J. H. Lee, et al. (2012). "A quantitative and direct PCR assay for the subspecies-
specific detection of Clavibacter michiganensis subsp. michiganensis based on a ferredoxin reductase gene." J Microbiol 50(3): 496-501.
Eichenlaub, R. and K. H. Gartemann (2011). "The Clavibacter michiganensis subspecies: molecular investigation of gram-positive bacterial plant pathogens." Annu Rev Phytopathol 49: 445-464.
Gartemann, K. H., B. Abt, et al. (2008). "The genome sequence of the tomato-pathogenic actinomycete Clavibacter michiganensis subsp. michiganensis NCPPB382 reveals a large island involved in pathogenicity." J Bacteriol 190(6): 2138-2149.
Kleitman, F., I. Barash, et al. (2008). "Characterization of a Clavibacter michiganensis subsp. michiganensis population in Israel." European Journal of Plant Pathology 121(4): 463-475.
Santos, S. M., L. Cruze, et al. (1997). "A rapid and sensitive detection of Clavibacter michiganensis subsp. michiganensis in tomato seeds by polymerase chain reaction." Seed Science and Technology 25: 581-584.
California Tomato Research Institute ~ 2013 Annual Report 103
Project Title: A Genomics Approach to Unravel the Molecular Pathogenesis of Powdery Mildew on Tomato Project leader: Ioannis Stergiopoulos
Assistant Professor Department of Plant Pathology, University of California Davis 578 Hutchison Hall, One Shields Avenue, Davis, CA 95616-8751 Office: 530-400-9802, fax: 530-752-1199 email: [email protected]
Cooperating Personnel: Mike Davis Plant Pathology Specialist, Department of Plant Pathology
University of California, Davis, CA 95616 Office: 530-752-0303, fax: 530-752-5674 email: [email protected]
Summary: In tomato, powdery mildew is caused by the species Leveillula taurica and Oidium neolycopersici, which are primarily associated with the disease in field and greenhouse grown tomatoes, respectively. The aim of this study is to obtain the genome sequence and transcriptome of L. taurica, in order to gain a deeper understanding of the molecular mechanisms that govern development and pathogenicity of this fungus on its host. Most efforts during the first year of this study have so far have focused on overcoming a number of technical challenges regarding generating monospore cultures of L. taurica in the lab and propagating these cultures on a living plant host in order to obtain enough fungal material (i.e. conidiospores) that can be used to isolate high quality DNA and RNA. In contrast to primary believes, we also report on the presence of mixed infections by L. taurica and O. neolycopersici in open tomato fields around Davis and elsewhere in California. This is quite an important observation that can have serious consequences for the control of the disease in the fields, and thus one that we currently try to confirm on a molecular level as well. Introduction: Powdery mildews are obligate biotrophs that cause extensive diseases in crops. In tomato, powdery mildew is caused by two different fungi, namely Leveillula taurica and Oidium neolycopersici. Both species cause similar symptoms on the infected plants, which include the appearance of light-green to bright yellow lesions on the upper leaf surface followed by desiccation and necrosis. However, while O. neolycopesici grows epiphytically and sporulates on the upper side of the leaf surface, in contrast L. taurica grows endophytically into the leaf mesophyll and is mostly visible on the lower side of the leaf surface, where it also sporulates. Unlike most other powdery mildew fungi that are known to be host-specific, both L. taurica and O. neolycopersici are reported to have a wide host-range within the Solanaceae, Alliaceae, and Cucurbitaceae families.
California Tomato Research Institute ~ 2013 Annual Report 104
Powdery mildew epidemics occur almost yearly in vegetable and tomato-growing areas of California and can impact fruit production and quality. Chemical control with azole, strobilurin (QoI), and sulfur-based fungicides is currently the main way for fighting the disease but their continuous use increases the danger for fungicide resistance development. Sources of natural resistance have been identified in wild Solanaceous species and it is shown that resistance to powdery mildews is mainly pathogen race-specific. Effective long-term disease management and deployment of host resistance genes in the field requires information on the molecular mechanisms used by the two pathogens to infect their host. We currently have no knowledge on virulence factors from the tomato powdery mildew fungi, including effectors that modulate host immunity. New advances in genome sequencing technologies have revolutionized the face of plant pathology and provided a unique insight into molecular aspects of host-microbe interactions. The availability of both the tomato and the parasites genome sequence will offer unparalleled opportunities to study gene families involved in plant defense and pathogen virulence within an integrated pathosystem. However, despite the recent explosion of fungal genome sequencing projects, to date the genomes of only three powdery mildews have been released. This is mainly due to the serious challenges that the study of these pathogens poses. As to date, the genome sequences of the barley powdery mildew, Blumeria graminis f.sp. hordei, the pea powdery mildew pathogen Erysiphe pisi, and a powdery mildew species that colonizes the dicotyledonous reference species Arabidopsis thaliana have been released. Comparative analysis of the three genomes provided the first insight into the obligate biotrophic lifestyle of powdery mildews and identified a significant number of species-specific candidate secreted effector proteins, which presumably represent the weapons of mildews for pathogenesis. Powdery mildew genomes are in general very large (>120-150 Mb) and full of retrotransposons, potentially allowing for high genomic flexibility. Notably they lack a considerable number of genes otherwise present in ascomycetes, which may explain why powdery mildews rely on living host plants for propagation. However, despite this recent breakthrough, several questions regarding the biology and genomics of powdery mildews still remain open. Objectives: The main objective in this project is to use de novo genome and transcriptome (RNA-seq) sequencing to determine the molecular mechanisms that govern development and pathogenicity of L. taurica on tomato and to sketch the pathogenic processes that lead to disease. In more specific, obtaining the first draft genome assembly of L. taurica will provide a valuable resource for:
• elucidating the molecular mechanisms of powdery mildew pathogenicity on tomato • identifying secreted effector proteins required for host manipulation. Such effector
proteins will subsequently be used in effector-assisted breeding programs • having a reference genome for follow-up studies on the population structure and spread
of pathogen genotypes, races and fungicide resistant strains. • understanding the evolutionary and functional relationships between powdery mildew
species that will generate unique insight into the process of host-adaptation and specialization in these important pathogens.
California Tomato Research Institute ~ 2013 Annual Report 105
Results: A common bottleneck to the molecular genetic analysis of powdery mildew fungi is the availability of genomic DNA and RNA of suitable quality and in sufficient quantity. This is mainly due to the obligate biotrophic nature of these fungi and consequently the inability to grow them on artificial growth media. The problem is more pronounced with L. taurica that predominantly grows endophytically and only sporulates on the leaf surface. Another major technical challenge is contamination of the mildew DNA samples with plant DNA or DNA of other microbial origin. Although care can be taken to limit the presence of plant cells, such as leaf trichomes, in the sample when collecting fungal spores from the infected host tissue, in practice the presence of plant DNA in the mildew DNA samples can hardly be excluded, which consequently may confound analysis as it does not faithfully represent the genetic information from the biological source of interest. Finally, as in any given microbial genomics project, it is essential that the DNA is isolated from a monospore isolate of the fungus in order to ensure the genomic uniformity of the sample and to avoid problems related to intraspecific nucleotide and structural variation, such as SNPs, copy number variation, and aneuploidy. Most of efforts so far have been concentrated to overcome the technical difficulties described above. In more specific terms, we have concentrated our attention towards i) establishing an inoculation protocol for tomato powdery mildew in the lab, ii) obtaining a monospore culture of L. taurica, and iii) propagating this culture in order to obtain enough fungal material that will allow us to isolate sufficient amount of high quality DNA and RNA. First attempts early in the summer of 2013 to recover the pathogen from dried tomato leaves that were stored in the lab from last year’s infections were unsuccessful. This is perhaps no surprising as the survival rate of the fungus under in vitro conditions is known to be extremely low. We thus focused our attention on obtaining fresh inoculum from infected tomatoes in the field. Infections by L. taurica on tomato plants were first noticed in the fields around Davis in early August 2013. Leaves with abundant sporulation of the fungus were collected and were used immediately to infect eight-week-old tomato plants of cv. Money Maker and cv. Purdue 135 by dusting or brushing spores onto their leaves. After multiple testing, conditions that finally proved to be conductive for the disease in the lab were 95% of relative humidity (RH) for the first two days following inoculations with the fungus and 60-70% RH for the remaining period of the infection, temperatures of 21-23°C, and a photoperiod of 16h. These conditions allowed the formation of lesions to take place on the leaves of inoculated plants but sporulation of the fungus remained fairly limited, thus seriously hampering our efforts to obtain enough fungal material from which sufficient quantities of DNA could be isolated. Also after two consecutive inoculations with the same fungal “culture”, the last batch of plants inoculated in mid-October 2013 failed to develop any symptoms, which meant that our “culture” was lost before enough fungal material for DNA extractions could be collected. During the same time period, several attempts were also made to create monospore cultures of L. taurica by transferring using the eyelash method a number of single spores onto leaves of cv. Money Maker tomato plants. Despite considerable efforts, all these attempts met with limited success. With the knowledge obtained regarding plant inoculations under lab conditions with L. taurica this year, we plant to repeat these experiments again next year in order to obtain enough fungal material that will allow us to isolate sufficient quantities of DNA.
California Tomato Research Institute ~ 2013 Annual Report 106
Although L. taurica has been reported as the only powdery mildew species to infect tomato plants in outdoor commercial fields of California, notably we have observed severe infections by O. neolycopersici in the fields around Davis as well. More specifically, most infections by powdery mildew that were observed in the tomato fields during August 2013 were indeed caused by L. taurica. By mid-September however, we observed a change in the population dynamics of the two pathogens and it soon became apparent that O. neolycopersici was present in mixed infections with L. taurica in some fields as well. By mid-October, most of the infections caused on new vegetation appearing on the surviving plants were caused by O. neolycoperici instead of L. taurica. Interestingly enough, cooperative extension farm advisor Brenna Aegeter reported the presence of O. neolycopersici infections in at least one field in the San Joaquin valley during October 2013 as well. The infection by the fungus in this field was so severe that symptoms of the disease and sporulation of the fungus was observed even in stems of the infected plants, which is rather unusual and rarely only observed. To confirm the infections by O. neolycopersici in these tomato fields we have isolated spores of the fungus and used them to infect cotyledons of Lagenaria leucantha cv. Minibottle that were maintained on agar (8 g/lit) media supplemented with mannitol (0.1 M) and sucrose (0.002 M). This plant species is known to be particularly sensitive to infections by O. neolycopersici and indeed, following inoculations typical spores and spore-bearing structures of the fungus were observed on the infected cotyledons. The presence of mixed infections by the two pathogens in tomato fields could have considerable consequences for the control of the disease in the fields and thus should be more thoroughly examined. We currently try to confirm these findings molecularly as well by sequencing the ITS region of the two fungal species, using DNA isolated from conidiospores that were collected from infected leaves during the past growing season. We also intent to monitor more closely next year the population dynamics of the two pathogens in the fields and the extent to which mixed infections by the two pathogens occur.
California Tomato Research Institute ~ 2013 Annual Report 107
Project Title: Field Bindweed Management in Early and Late Planted Processing Tomatoes Project Leader
Lynn M. Sosnoskie, Assistant Project Scientist 259 D Robbins Hall, University of California -‐ Davis Department of Plant Sciences, MS-‐4 One Shields Avenue Davis, CA 95616 (229) 326-‐2676 [email protected]
CO-‐PIs:
Bradley D. Hanson, Extension Weed Specialist 276 Robbins Hall, University of California -‐ Davis Department of Plant Sciences, MS-‐4 One Shields Avenue Davis, CA 95616 (530) 752-‐8115 [email protected] W. Thomas Lanini, Extension Weed Ecologist Department of Plant Sciences 278 Robbins Hall, University of California -‐ Davis Department of Plant Sciences, MS-‐4 One Shields Avenue Davis, CA 95616 (530) 752-‐4476 [email protected]
Summary Field bindweed (Convovulous arvensis) is a deep-‐rooted perennial that is difficult to control once it has become established. Bindweed should be managed for up to eight weeks following tomato transplanting in order to reduce interspecific competition and maximize crop yields. Bindweed control is highly dependent on weed development and the timing of herbicide applications; it is assumed that herbicide performance could vary throughout the production season. Field studies were conducted during the summer of 2013 to evaluate the efficacy of currently registered herbicides for field bindweed management in early and late planted processing tomato. Results show that bindweed cover and density were significantly reduced, relative to the controls, when using an herbicide program that included trifluralin (incorporated to a depth of 2-‐3 inches prior to planting) and either rimusulfron or carfentrazone (applied post-‐emergence or shielded, respectively). The use of metolachlor and sulfentrazone (pre-‐plant incorporated) or rimsulfuron (pre-‐emergence), in combination with trifluralin, also helped to reduce field bindweed density in late planted tomatoes. Pre-‐plant applications of glyphosate to emerged bindweed (late planted tomatoes) reduced weed cover by more than half in herbicide-‐treated plots, supporting a common IPM recommendation that all growers should strive to plant into clean fields. Although crop injury was observed in response to herbicide treatments, phytotoxicity was minimal and transient. Crop yields were statistically higher in all herbicide treatments, relative to the checks.
California Tomato Research Institute ~ 2013 Annual Report 108
JUSTIFICATION The agricultural sector has been a significant contributor to California’s economy since the 1850’s when former miners were forced to seek alternate sources of income following the gold rush (Baker et al. 2013). The subsequent development of a complicated and extensive canal system helped transform California’s Central Valley, which was originally dominated by ranching and dry-‐land crops, into the United States’ most diverse and economically productive farmland (Baker et al. 2013). In 2012, more than 400 different agricultural commodities, worth more than $40 billion, were produced in the state; processing tomatoes, which were ranked as the tenth most important commodity, were valued at $1.2 billion (CDFA 2013). Processing tomato production has changed, dramatically, over time. Breeding efforts, the switch from seeds to transplants, the commercialization of the mechanical harvester and the steady adoption of drip irrigation have helped to expand the total area planted to tomatoes (>250,000 acres in 2012) and increase yields (currently, > 45 tons/A) (CDFA 2013; Mitchell et al. 2012; USDA 2013). In order to maintain outputs and meet pre-‐contracted processing needs, growers are in need to effective pest management strategies. Historically, processing tomato production has been heavily dependent on intense, multi-‐pass cultivation programs for weed suppression (Mitchell et al. 2012). The growing adoption of minimum tillage production systems (Mitchell et al. 2012), coupled with the constantly changing costs and availability of hand labor, suggests that herbicides will continue to be an important tool for the control of weedy pests. Field bindweed (Convolvulus arvensis) is a deep-‐rooted (to depths of 10 feet, or more), drought-‐tolerant perennial that propagates and spreads via asexual (i.e. root and shoot buds developing directly from rhizomes and roots) and sexual (i.e. seed) means. Although bindweed seedlings can be readily managed via chemical and cultural means, perennial plants with extensive root systems are less susceptible to control measures (Dall’Armellina and Zimdahl 1989; Sharma and Singh 2007; Wiese and Lavake 1986; Yerkes and Weller 1996). Cultivation and tillage, if not conducted regularly, may only serve to disperse seeds and root fragments. Herbicides, if applied infrequently and/or at the incorrect time, may do little more than burn off aboveground tissue. Tomato growers in California have some flexibility with respect to the timing of crop planting so as to fulfill pre-‐contracted processing needs throughout the production season. Producers engaged in IPM practices may also wish to manipulate planting dates to take advantage of differential weed species germination and emergence in response to changes in soil temperature and moisture (http://www.ipm.ucdavis). For example, growers may choose to plant early to avoid barnyardgrass or late to avoid dodder. It is unknown if a similar strategy could be employed to help with the management of field bindweed; there is limited data available regarding the potential for varying herbicide efficacy in response to bindweed development and environmental conditions in processing tomato production systems (Gaynor et a. 1993; Grass et al. 1994; Grey and McCullough 2012). OBJECTIVE Evaluate the combined effects of a pre-‐plant (PP) burn-‐down, pre-‐plant incorporated (PPI), preemergence (PRE), postemergence (POST) and shielded-‐spray (SHIELD) herbicide applications for field bindweed (Convolvulus arvensis) management in early and late planted processing tomatoes.
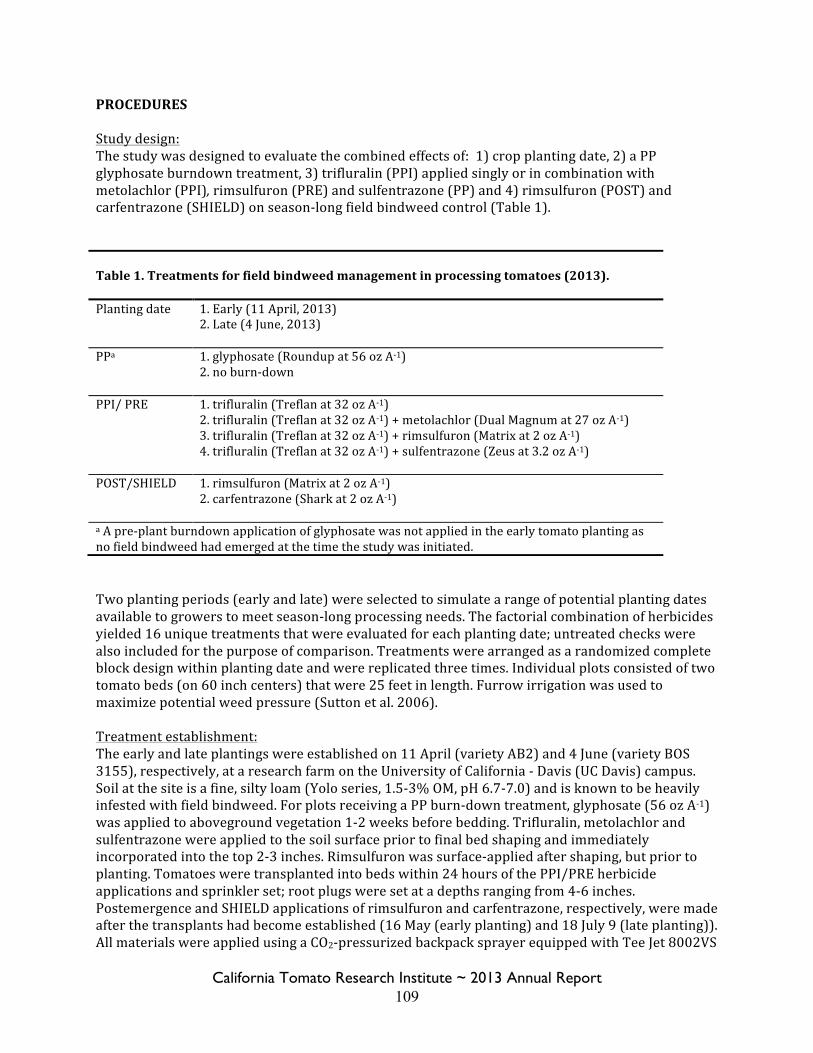
California Tomato Research Institute ~ 2013 Annual Report 109
PROCEDURES Study design: The study was designed to evaluate the combined effects of: 1) crop planting date, 2) a PP glyphosate burndown treatment, 3) trifluralin (PPI) applied singly or in combination with metolachlor (PPI), rimsulfuron (PRE) and sulfentrazone (PP) and 4) rimsulfuron (POST) and carfentrazone (SHIELD) on season-‐long field bindweed control (Table 1). Table 1. Treatments for field bindweed management in processing tomatoes (2013). Planting date 1. Early (11 April, 2013)
2. Late (4 June, 2013)
PPa 1. glyphosate (Roundup at 56 oz A-‐1) 2. no burn-‐down
PPI/ PRE 1. trifluralin (Treflan at 32 oz A-‐1) 2. trifluralin (Treflan at 32 oz A-‐1) + metolachlor (Dual Magnum at 27 oz A-‐1) 3. trifluralin (Treflan at 32 oz A-‐1) + rimsulfuron (Matrix at 2 oz A-‐1) 4. trifluralin (Treflan at 32 oz A-‐1) + sulfentrazone (Zeus at 3.2 oz A-‐1)
POST/SHIELD 1. rimsulfuron (Matrix at 2 oz A-‐1) 2. carfentrazone (Shark at 2 oz A-‐1)
a A pre-‐plant burndown application of glyphosate was not applied in the early tomato planting as no field bindweed had emerged at the time the study was initiated. Two planting periods (early and late) were selected to simulate a range of potential planting dates available to growers to meet season-‐long processing needs. The factorial combination of herbicides yielded 16 unique treatments that were evaluated for each planting date; untreated checks were also included for the purpose of comparison. Treatments were arranged as a randomized complete block design within planting date and were replicated three times. Individual plots consisted of two tomato beds (on 60 inch centers) that were 25 feet in length. Furrow irrigation was used to maximize potential weed pressure (Sutton et al. 2006). Treatment establishment: The early and late plantings were established on 11 April (variety AB2) and 4 June (variety BOS 3155), respectively, at a research farm on the University of California -‐ Davis (UC Davis) campus. Soil at the site is a fine, silty loam (Yolo series, 1.5-‐3% OM, pH 6.7-‐7.0) and is known to be heavily infested with field bindweed. For plots receiving a PP burn-‐down treatment, glyphosate (56 oz A-‐1) was applied to aboveground vegetation 1-‐2 weeks before bedding. Trifluralin, metolachlor and sulfentrazone were applied to the soil surface prior to final bed shaping and immediately incorporated into the top 2-‐3 inches. Rimsulfuron was surface-‐applied after shaping, but prior to planting. Tomatoes were transplanted into beds within 24 hours of the PPI/PRE herbicide applications and sprinkler set; root plugs were set at a depths ranging from 4-‐6 inches. Postemergence and SHIELD applications of rimsulfuron and carfentrazone, respectively, were made after the transplants had become established (16 May (early planting) and 18 July 9 (late planting)). All materials were applied using a CO2-‐pressurized backpack sprayer equipped with Tee Jet 8002VS
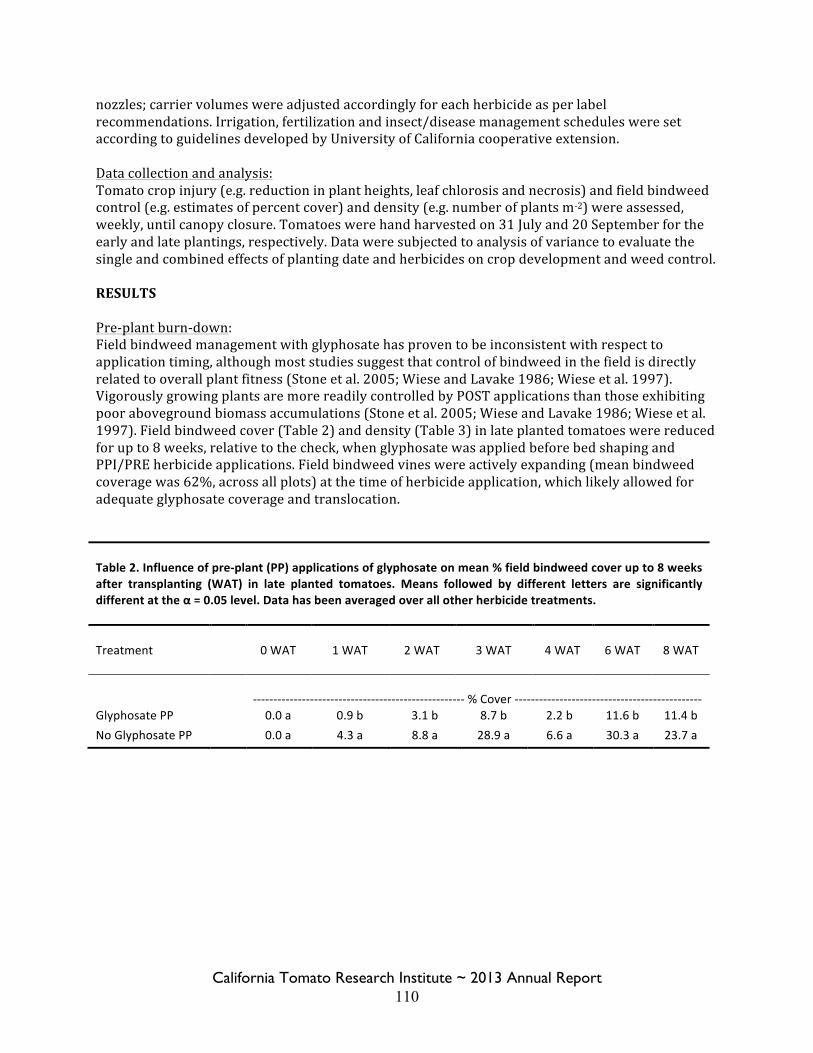
California Tomato Research Institute ~ 2013 Annual Report 110
nozzles; carrier volumes were adjusted accordingly for each herbicide as per label recommendations. Irrigation, fertilization and insect/disease management schedules were set according to guidelines developed by University of California cooperative extension. Data collection and analysis: Tomato crop injury (e.g. reduction in plant heights, leaf chlorosis and necrosis) and field bindweed control (e.g. estimates of percent cover) and density (e.g. number of plants m-‐2) were assessed, weekly, until canopy closure. Tomatoes were hand harvested on 31 July and 20 September for the early and late plantings, respectively. Data were subjected to analysis of variance to evaluate the single and combined effects of planting date and herbicides on crop development and weed control. RESULTS Pre-‐plant burn-‐down: Field bindweed management with glyphosate has proven to be inconsistent with respect to application timing, although most studies suggest that control of bindweed in the field is directly related to overall plant fitness (Stone et al. 2005; Wiese and Lavake 1986; Wiese et al. 1997). Vigorously growing plants are more readily controlled by POST applications than those exhibiting poor aboveground biomass accumulations (Stone et al. 2005; Wiese and Lavake 1986; Wiese et al. 1997). Field bindweed cover (Table 2) and density (Table 3) in late planted tomatoes were reduced for up to 8 weeks, relative to the check, when glyphosate was applied before bed shaping and PPI/PRE herbicide applications. Field bindweed vines were actively expanding (mean bindweed coverage was 62%, across all plots) at the time of herbicide application, which likely allowed for adequate glyphosate coverage and translocation.
Table 2. Influence of pre-‐plant (PP) applications of glyphosate on mean % field bindweed cover up to 8 weeks after transplanting (WAT) in late planted tomatoes. Means followed by different letters are significantly different at the α = 0.05 level. Data has been averaged over all other herbicide treatments.
Treatment 0 WAT 1 WAT 2 WAT 3 WAT 4 WAT 6 WAT 8 WAT
-‐-‐-‐-‐-‐-‐-‐-‐-‐-‐-‐-‐-‐-‐-‐-‐-‐-‐-‐-‐-‐-‐-‐-‐-‐-‐-‐-‐-‐-‐-‐-‐-‐-‐-‐-‐-‐-‐-‐-‐-‐-‐-‐-‐-‐-‐-‐-‐-‐-‐-‐-‐ % Cover -‐-‐-‐-‐-‐-‐-‐-‐-‐-‐-‐-‐-‐-‐-‐-‐-‐-‐-‐-‐-‐-‐-‐-‐-‐-‐-‐-‐-‐-‐-‐-‐-‐-‐-‐-‐-‐-‐-‐-‐-‐-‐-‐-‐-‐-‐ Glyphosate PP 0.0 a 0.9 b 3.1 b 8.7 b 2.2 b 11.6 b 11.4 b No Glyphosate PP 0.0 a 4.3 a 8.8 a 28.9 a 6.6 a 30.3 a 23.7 a
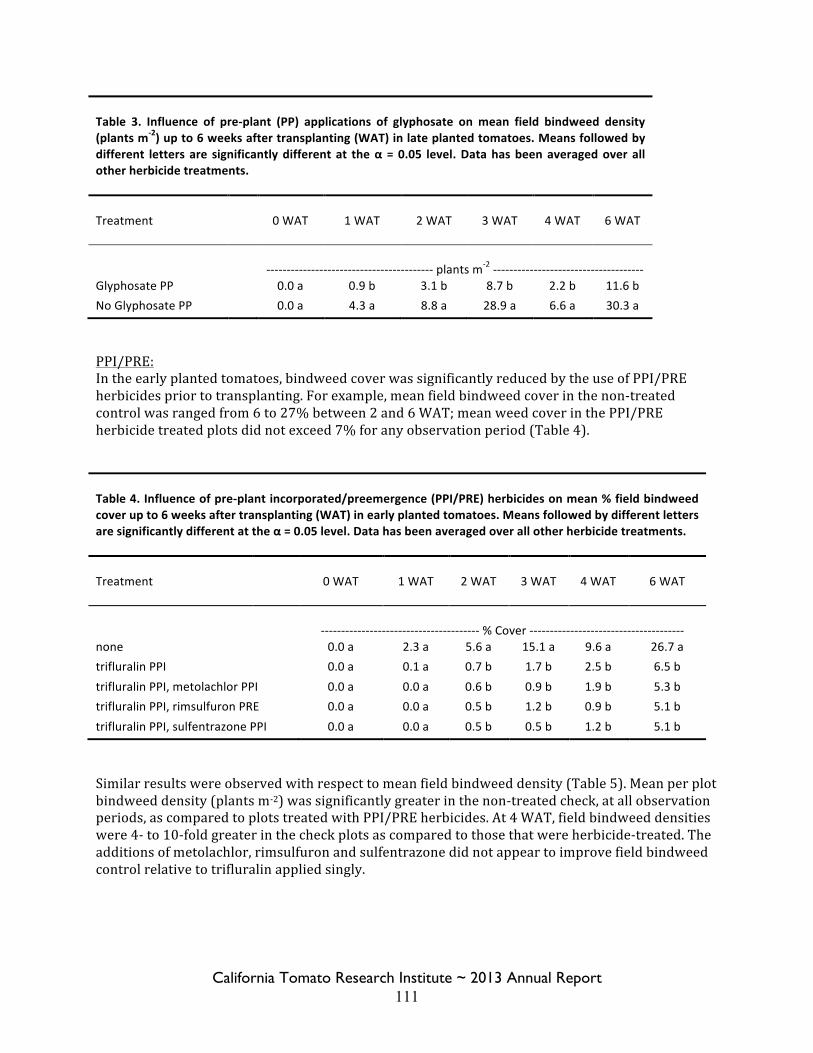
California Tomato Research Institute ~ 2013 Annual Report 111
Table 3. Influence of pre-‐plant (PP) applications of glyphosate on mean field bindweed density (plants m-‐2) up to 6 weeks after transplanting (WAT) in late planted tomatoes. Means followed by different letters are significantly different at the α = 0.05 level. Data has been averaged over all other herbicide treatments.
Treatment 0 WAT 1 WAT 2 WAT 3 WAT 4 WAT 6 WAT
-‐-‐-‐-‐-‐-‐-‐-‐-‐-‐-‐-‐-‐-‐-‐-‐-‐-‐-‐-‐-‐-‐-‐-‐-‐-‐-‐-‐-‐-‐-‐-‐-‐-‐-‐-‐-‐-‐-‐-‐-‐ plants m-‐2 -‐-‐-‐-‐-‐-‐-‐-‐-‐-‐-‐-‐-‐-‐-‐-‐-‐-‐-‐-‐-‐-‐-‐-‐-‐-‐-‐-‐-‐-‐-‐-‐-‐-‐-‐-‐-‐ Glyphosate PP 0.0 a 0.9 b 3.1 b 8.7 b 2.2 b 11.6 b No Glyphosate PP 0.0 a 4.3 a 8.8 a 28.9 a 6.6 a 30.3 a
PPI/PRE: In the early planted tomatoes, bindweed cover was significantly reduced by the use of PPI/PRE herbicides prior to transplanting. For example, mean field bindweed cover in the non-‐treated control was ranged from 6 to 27% between 2 and 6 WAT; mean weed cover in the PPI/PRE herbicide treated plots did not exceed 7% for any observation period (Table 4).
Table 4. Influence of pre-‐plant incorporated/preemergence (PPI/PRE) herbicides on mean % field bindweed cover up to 6 weeks after transplanting (WAT) in early planted tomatoes. Means followed by different letters are significantly different at the α = 0.05 level. Data has been averaged over all other herbicide treatments.
Treatment 0 WAT 1 WAT 2 WAT 3 WAT 4 WAT 6 WAT
-‐-‐-‐-‐-‐-‐-‐-‐-‐-‐-‐-‐-‐-‐-‐-‐-‐-‐-‐-‐-‐-‐-‐-‐-‐-‐-‐-‐-‐-‐-‐-‐-‐-‐-‐-‐-‐-‐-‐ % Cover -‐-‐-‐-‐-‐-‐-‐-‐-‐-‐-‐-‐-‐-‐-‐-‐-‐-‐-‐-‐-‐-‐-‐-‐-‐-‐-‐-‐-‐-‐-‐-‐-‐-‐-‐-‐-‐-‐ none 0.0 a 2.3 a 5.6 a 15.1 a 9.6 a 26.7 a trifluralin PPI 0.0 a 0.1 a 0.7 b 1.7 b 2.5 b 6.5 b trifluralin PPI, metolachlor PPI 0.0 a 0.0 a 0.6 b 0.9 b 1.9 b 5.3 b trifluralin PPI, rimsulfuron PRE 0.0 a 0.0 a 0.5 b 1.2 b 0.9 b 5.1 b trifluralin PPI, sulfentrazone PPI 0.0 a 0.0 a 0.5 b 0.5 b 1.2 b 5.1 b
Similar results were observed with respect to mean field bindweed density (Table 5). Mean per plot bindweed density (plants m-‐2) was significantly greater in the non-‐treated check, at all observation periods, as compared to plots treated with PPI/PRE herbicides. At 4 WAT, field bindweed densities were 4-‐ to 10-‐fold greater in the check plots as compared to those that were herbicide-‐treated. The additions of metolachlor, rimsulfuron and sulfentrazone did not appear to improve field bindweed control relative to trifluralin applied singly.
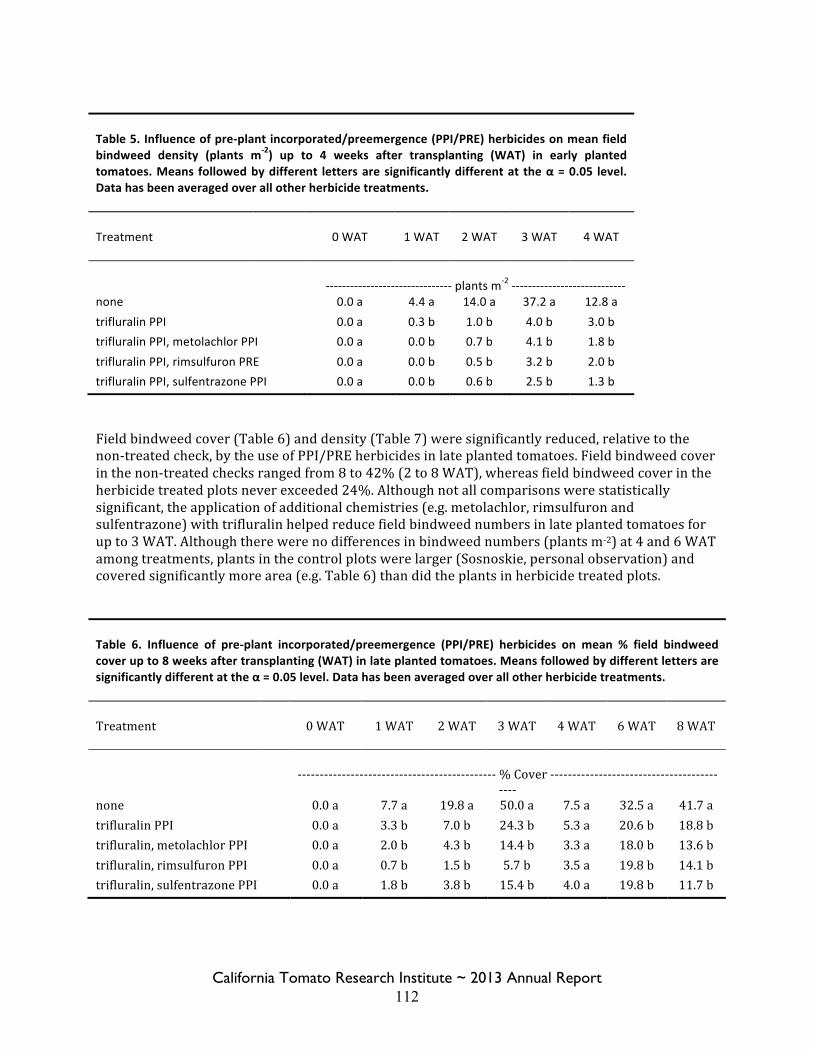
California Tomato Research Institute ~ 2013 Annual Report 112
Table 5. Influence of pre-‐plant incorporated/preemergence (PPI/PRE) herbicides on mean field bindweed density (plants m-‐2) up to 4 weeks after transplanting (WAT) in early planted tomatoes. Means followed by different letters are significantly different at the α = 0.05 level. Data has been averaged over all other herbicide treatments.
Treatment 0 WAT 1 WAT 2 WAT 3 WAT 4 WAT
-‐-‐-‐-‐-‐-‐-‐-‐-‐-‐-‐-‐-‐-‐-‐-‐-‐-‐-‐-‐-‐-‐-‐-‐-‐-‐-‐-‐-‐-‐-‐ plants m-‐2 -‐-‐-‐-‐-‐-‐-‐-‐-‐-‐-‐-‐-‐-‐-‐-‐-‐-‐-‐-‐-‐-‐-‐-‐-‐-‐-‐-‐ none 0.0 a 4.4 a 14.0 a 37.2 a 12.8 a trifluralin PPI 0.0 a 0.3 b 1.0 b 4.0 b 3.0 b trifluralin PPI, metolachlor PPI 0.0 a 0.0 b 0.7 b 4.1 b 1.8 b trifluralin PPI, rimsulfuron PRE 0.0 a 0.0 b 0.5 b 3.2 b 2.0 b trifluralin PPI, sulfentrazone PPI 0.0 a 0.0 b 0.6 b 2.5 b 1.3 b
Field bindweed cover (Table 6) and density (Table 7) were significantly reduced, relative to the non-‐treated check, by the use of PPI/PRE herbicides in late planted tomatoes. Field bindweed cover in the non-‐treated checks ranged from 8 to 42% (2 to 8 WAT), whereas field bindweed cover in the herbicide treated plots never exceeded 24%. Although not all comparisons were statistically significant, the application of additional chemistries (e.g. metolachlor, rimsulfuron and sulfentrazone) with trifluralin helped reduce field bindweed numbers in late planted tomatoes for up to 3 WAT. Although there were no differences in bindweed numbers (plants m-‐2) at 4 and 6 WAT among treatments, plants in the control plots were larger (Sosnoskie, personal observation) and covered significantly more area (e.g. Table 6) than did the plants in herbicide treated plots.
Table 6. Influence of pre-‐plant incorporated/preemergence (PPI/PRE) herbicides on mean % field bindweed cover up to 8 weeks after transplanting (WAT) in late planted tomatoes. Means followed by different letters are significantly different at the α = 0.05 level. Data has been averaged over all other herbicide treatments.
Treatment 0 WAT 1 WAT 2 WAT 3 WAT 4 WAT 6 WAT 8 WAT
-‐-‐-‐-‐-‐-‐-‐-‐-‐-‐-‐-‐-‐-‐-‐-‐-‐-‐-‐-‐-‐-‐-‐-‐-‐-‐-‐-‐-‐-‐-‐-‐-‐-‐-‐-‐-‐-‐-‐-‐-‐-‐-‐-‐-‐ % Cover -‐-‐-‐-‐-‐-‐-‐-‐-‐-‐-‐-‐-‐-‐-‐-‐-‐-‐-‐-‐-‐-‐-‐-‐-‐-‐-‐-‐-‐-‐-‐-‐-‐-‐-‐-‐-‐-‐-‐-‐-‐-‐
none 0.0 a 7.7 a 19.8 a 50.0 a 7.5 a 32.5 a 41.7 a trifluralin PPI 0.0 a 3.3 b 7.0 b 24.3 b 5.3 a 20.6 b 18.8 b trifluralin, metolachlor PPI 0.0 a 2.0 b 4.3 b 14.4 b 3.3 a 18.0 b 13.6 b trifluralin, rimsulfuron PPI 0.0 a 0.7 b 1.5 b 5.7 b 3.5 a 19.8 b 14.1 b trifluralin, sulfentrazone PPI 0.0 a 1.8 b 3.8 b 15.4 b 4.0 a 19.8 b 11.7 b
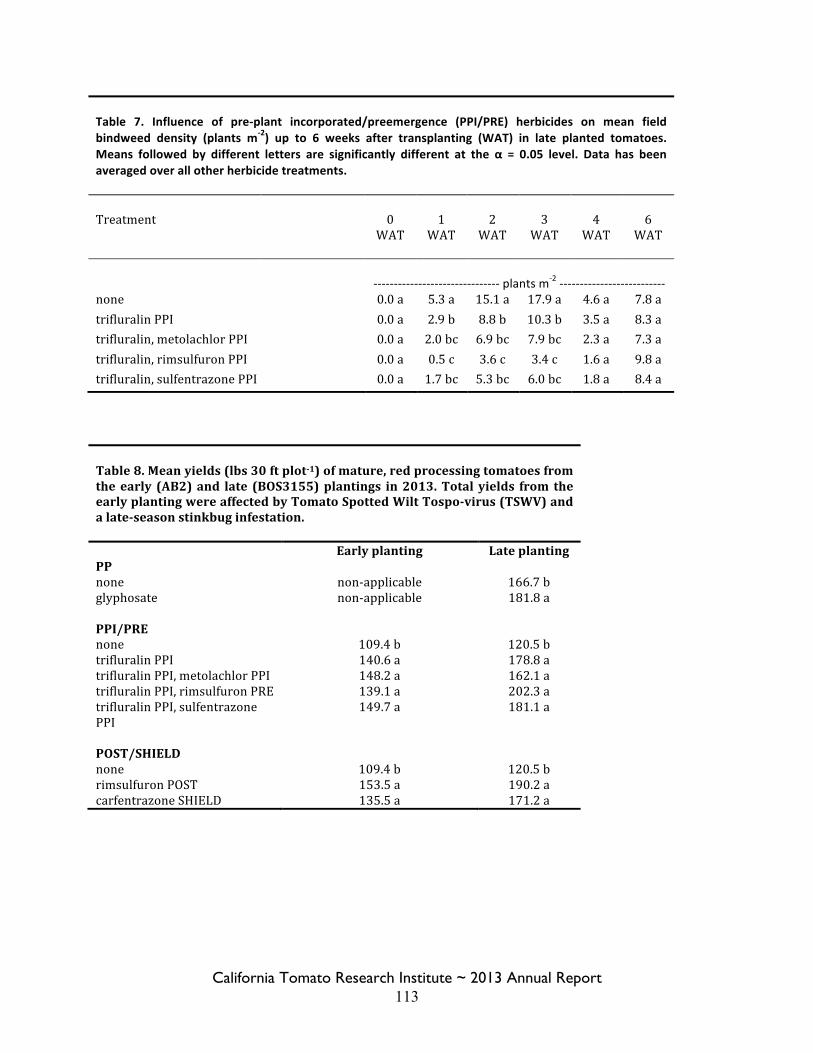
California Tomato Research Institute ~ 2013 Annual Report 113
Table 7. Influence of pre-‐plant incorporated/preemergence (PPI/PRE) herbicides on mean field bindweed density (plants m-‐2) up to 6 weeks after transplanting (WAT) in late planted tomatoes. Means followed by different letters are significantly different at the α = 0.05 level. Data has been averaged over all other herbicide treatments.
Treatment 0 WAT
1 WAT
2 WAT
3 WAT
4 WAT
6 WAT
-‐-‐-‐-‐-‐-‐-‐-‐-‐-‐-‐-‐-‐-‐-‐-‐-‐-‐-‐-‐-‐-‐-‐-‐-‐-‐-‐-‐-‐-‐-‐ plants m-‐2 -‐-‐-‐-‐-‐-‐-‐-‐-‐-‐-‐-‐-‐-‐-‐-‐-‐-‐-‐-‐-‐-‐-‐-‐-‐-‐ none 0.0 a 5.3 a 15.1 a 17.9 a 4.6 a 7.8 a trifluralin PPI 0.0 a 2.9 b 8.8 b 10.3 b 3.5 a 8.3 a trifluralin, metolachlor PPI 0.0 a 2.0 bc 6.9 bc 7.9 bc 2.3 a 7.3 a trifluralin, rimsulfuron PPI 0.0 a 0.5 c 3.6 c 3.4 c 1.6 a 9.8 a trifluralin, sulfentrazone PPI 0.0 a 1.7 bc 5.3 bc 6.0 bc 1.8 a 8.4 a
Table 8. Mean yields (lbs 30 ft plot-‐1) of mature, red processing tomatoes from the early (AB2) and late (BOS3155) plantings in 2013. Total yields from the early planting were affected by Tomato Spotted Wilt Tospo-‐virus (TSWV) and a late-‐season stinkbug infestation.
Early planting Late planting PP none non-‐applicable 166.7 b glyphosate non-‐applicable 181.8 a PPI/PRE none 109.4 b 120.5 b trifluralin PPI 140.6 a 178.8 a trifluralin PPI, metolachlor PPI 148.2 a 162.1 a trifluralin PPI, rimsulfuron PRE 139.1 a 202.3 a trifluralin PPI, sulfentrazone PPI
149.7 a 181.1 a
POST/SHIELD none 109.4 b 120.5 b rimsulfuron POST 153.5 a 190.2 a carfentrazone SHIELD 135.5 a 171.2 a
California Tomato Research Institute ~ 2013 Annual Report 114
Crop injury and yield: Crop injury was observed in all herbicide treated plots for both planting dates. Symptoms ranged from stunting (trifluralin, sulfentrazone) to chlorosis (rimsulfuron) to necrosis (carfentrazone), although ratings did not exceed 20% for any treatment. Injury was also ephemeral; most plants had grown out of injury symptoms within a few weeks of the herbicide applications. Processing tomato yields were also affected by herbicide use (Table 8). In the late planting, use of glyphosate as a PP burndown increased crop yields by 15 lbs as compared to the check (167 lbs per 30 ft row). The use of trifluralin, alone, or in combination with metolachlor, rimsulfuron and sulfentrazone, improved crop yields by 30 to 80 lbs per 30 ft row relative to the non-‐treated control. Although not statistically different, crop yields were greater when rimsulfuron was applied POST as compared to carfentrazone SHIELD, for both planting dates. CONCLUSIONS Results from this trial are in agreement with previously conducted studies that field bindweed can be suppressed, but not controlled by herbicides, primarily trifluralin. However, the outcomes observed in this study also suggest that herbicide combinations (PP, PPI/PRE and POST/SHIELD) could be more beneficial to growers than the use of a single product. The use of glyphosate as a PP burndown reduced field bindweed cover and density across all treatments (Figures 1 to 5, Appendices A to D), including the non-‐treated control. For example, mean bindweed cover in plots treated with glyphosate, but not PPI/PREs was 38% at 8 WAT; mean bindweed cover in plots that were not treated with glyphosate and not treated with PPI/PREs was 45% (Appendix C). Similar trends were observed in the trifluralin (5 to 15% vs 25-‐30), trifluralin + metolachlor (7 to 9% vs 17-‐21%), trifluralin + rimsulfuron (6 to 9% vs 15-‐27%) and trifluralin + sulfentrazone (7% vs 15-‐18%) treatments across all observation periods (Appendix C). Although not as dramatic, similar observations were made for field bindweed density (Appendix D). These results reinforce a critical tenet of IPM: overall weed control can be greatly improved if growers can begin with clean fields. Therefore, emerged bindweed should be treated prior to transplanting to improve overall suppression. However, growers must be aware that the timing of applications is crucial; newly emerging perennial bindweed may be less susceptible to glyphosate at this time as carbon flow is like to be moving away from the roots and into the shoots. Contact herbicides will remove aboveground biomass, but it may be quickly replenished. As has been observed, previously, field bindweed can be managed for several weeks following transplanting by trifluralin applied PPI (Appendices A to D). Although metolachlor, rimsulfuron and sulfentrazone may not be effective as trifluralin for managing perennialized plants, all are known to control other troublesome species (i.e. common lambsquarters, nightshades, pigweeds, and yellow and purple nutsedges (Adcock et al. 2008; Clewis et al. 2007; Felix and Newberry 2012). Results from this study suggest that the addition of these products (to a trfluralin-‐based system) could help to improve bindweed control, especially if in-‐field populations are high (Appendices C and D). With respect to POST/SHIELD herbicide treatments, carfentrazone and rimsulfuron have consistently improved bindweed control in UC Davis research trials. Rimsulfuron appeared to be slightly more effective than carfentrazone at suppressing bindweed, especially in the absence of a PP burndown application (Appendices C and D). In order to maximize yield, tomatoes must remain relatively weed-‐free for up to two months after planting. Information regarding the performance of registered herbicides against field bindweed and other competitive weeds -‐ as they are affected by the timing of crop planting and weed
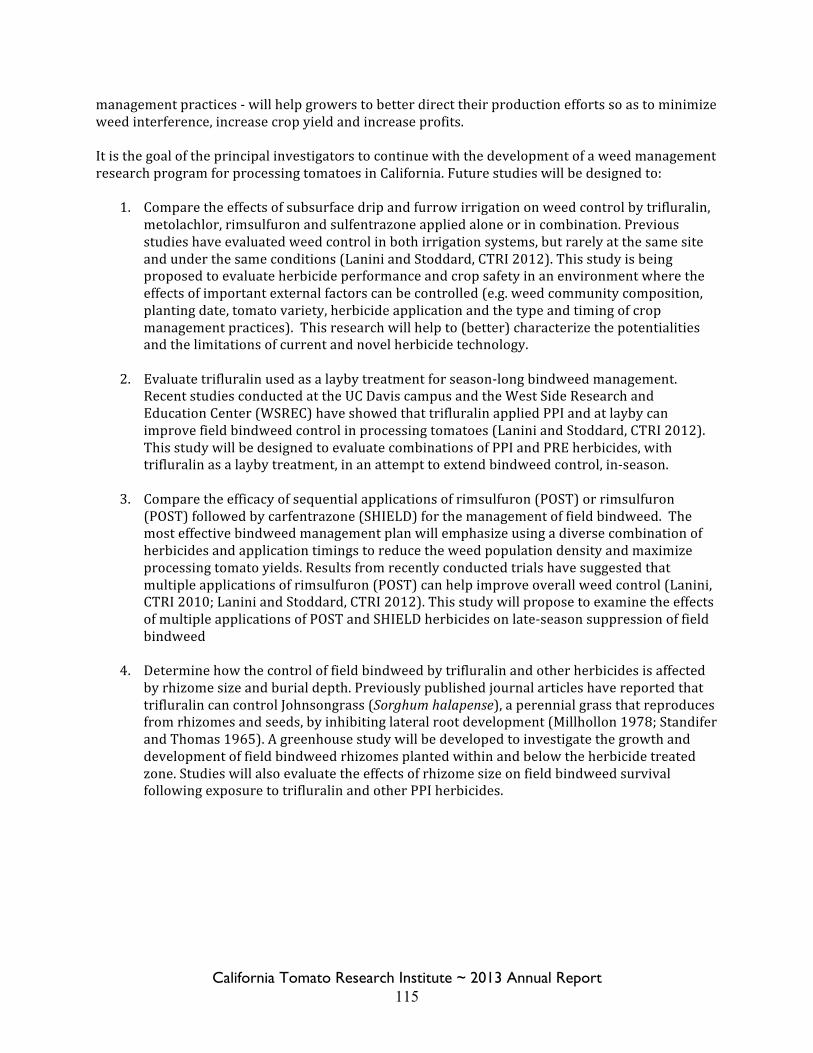
California Tomato Research Institute ~ 2013 Annual Report 115
management practices -‐ will help growers to better direct their production efforts so as to minimize weed interference, increase crop yield and increase profits. It is the goal of the principal investigators to continue with the development of a weed management research program for processing tomatoes in California. Future studies will be designed to:
1. Compare the effects of subsurface drip and furrow irrigation on weed control by trifluralin, metolachlor, rimsulfuron and sulfentrazone applied alone or in combination. Previous studies have evaluated weed control in both irrigation systems, but rarely at the same site and under the same conditions (Lanini and Stoddard, CTRI 2012). This study is being proposed to evaluate herbicide performance and crop safety in an environment where the effects of important external factors can be controlled (e.g. weed community composition, planting date, tomato variety, herbicide application and the type and timing of crop management practices). This research will help to (better) characterize the potentialities and the limitations of current and novel herbicide technology.
2. Evaluate trifluralin used as a layby treatment for season-‐long bindweed management. Recent studies conducted at the UC Davis campus and the West Side Research and Education Center (WSREC) have showed that trifluralin applied PPI and at layby can improve field bindweed control in processing tomatoes (Lanini and Stoddard, CTRI 2012). This study will be designed to evaluate combinations of PPI and PRE herbicides, with trifluralin as a layby treatment, in an attempt to extend bindweed control, in-‐season.
3. Compare the efficacy of sequential applications of rimsulfuron (POST) or rimsulfuron (POST) followed by carfentrazone (SHIELD) for the management of field bindweed. The most effective bindweed management plan will emphasize using a diverse combination of herbicides and application timings to reduce the weed population density and maximize processing tomato yields. Results from recently conducted trials have suggested that multiple applications of rimsulfuron (POST) can help improve overall weed control (Lanini, CTRI 2010; Lanini and Stoddard, CTRI 2012). This study will propose to examine the effects of multiple applications of POST and SHIELD herbicides on late-‐season suppression of field bindweed
4. Determine how the control of field bindweed by trifluralin and other herbicides is affected by rhizome size and burial depth. Previously published journal articles have reported that trifluralin can control Johnsongrass (Sorghum halapense), a perennial grass that reproduces from rhizomes and seeds, by inhibiting lateral root development (Millhollon 1978; Standifer and Thomas 1965). A greenhouse study will be developed to investigate the growth and development of field bindweed rhizomes planted within and below the herbicide treated zone. Studies will also evaluate the effects of rhizome size on field bindweed survival following exposure to trifluralin and other PPI herbicides.
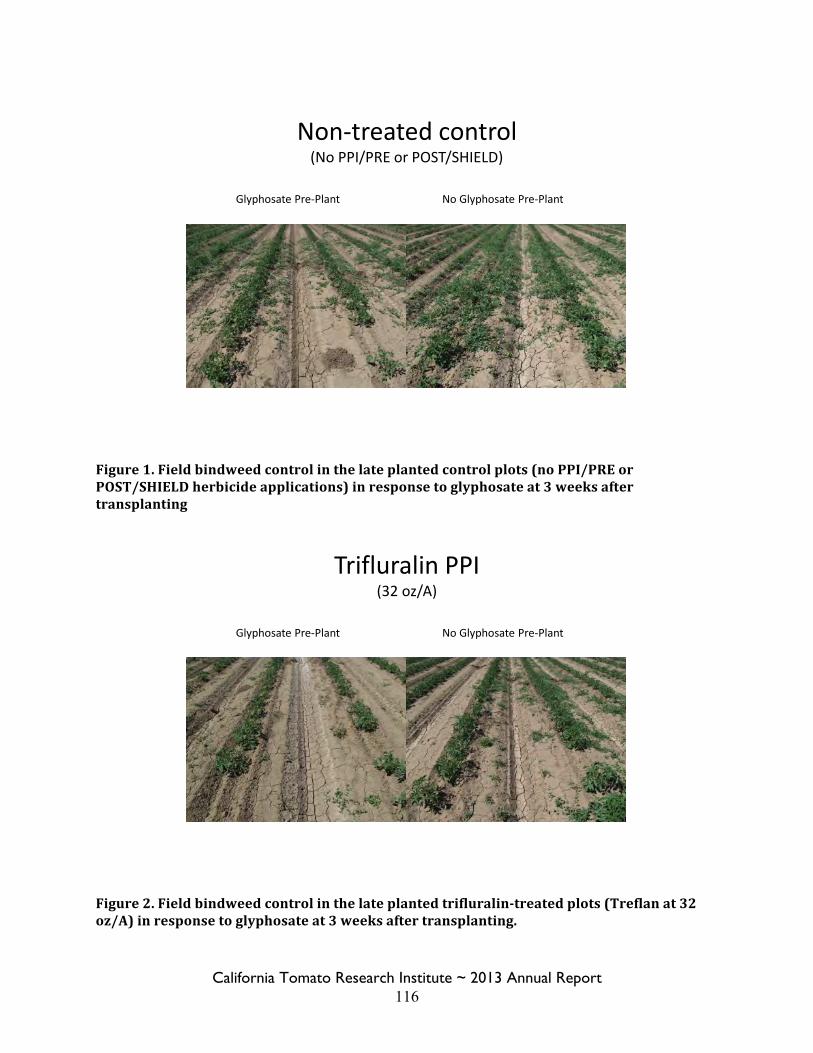
California Tomato Research Institute ~ 2013 Annual Report 116
Figure 1. Field bindweed control in the late planted control plots (no PPI/PRE or POST/SHIELD herbicide applications) in response to glyphosate at 3 weeks after transplanting
Figure 2. Field bindweed control in the late planted trifluralin-‐treated plots (Treflan at 32 oz/A) in response to glyphosate at 3 weeks after transplanting.
Non-‐treated control(No PPI/PRE or POST/SHIELD)
Glyphosate Pre-‐Plant No Glyphosate Pre-‐Plant
Trifluralin PPI(32 oz/A)
Glyphosate Pre-‐Plant No Glyphosate Pre-‐Plant
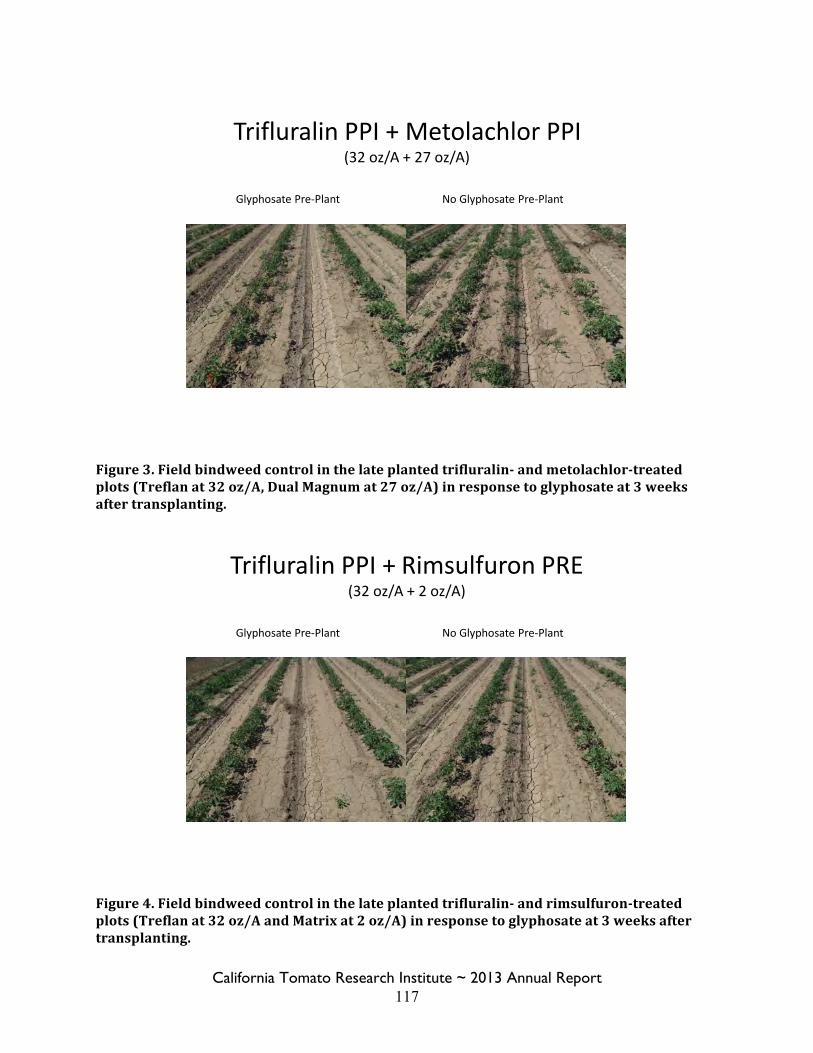
California Tomato Research Institute ~ 2013 Annual Report 117
Figure 3. Field bindweed control in the late planted trifluralin-‐ and metolachlor-‐treated plots (Treflan at 32 oz/A, Dual Magnum at 27 oz/A) in response to glyphosate at 3 weeks after transplanting.
Figure 4. Field bindweed control in the late planted trifluralin-‐ and rimsulfuron-‐treated plots (Treflan at 32 oz/A and Matrix at 2 oz/A) in response to glyphosate at 3 weeks after transplanting.
Trifluralin PPI + Metolachlor PPI(32 oz/A + 27 oz/A)
Glyphosate Pre-‐Plant No Glyphosate Pre-‐Plant
Trifluralin PPI + Rimsulfuron PRE(32 oz/A + 2 oz/A)
Glyphosate Pre-‐Plant No Glyphosate Pre-‐Plant
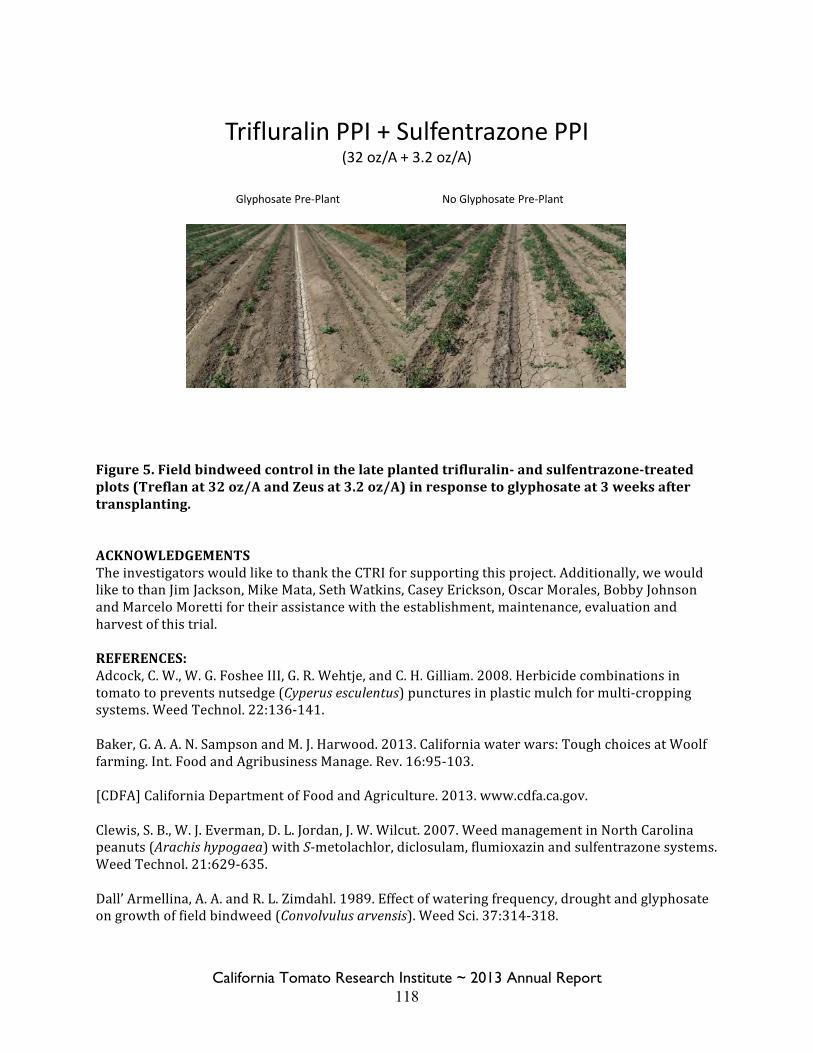
California Tomato Research Institute ~ 2013 Annual Report 118
Figure 5. Field bindweed control in the late planted trifluralin-‐ and sulfentrazone-‐treated plots (Treflan at 32 oz/A and Zeus at 3.2 oz/A) in response to glyphosate at 3 weeks after transplanting. ACKNOWLEDGEMENTS The investigators would like to thank the CTRI for supporting this project. Additionally, we would like to than Jim Jackson, Mike Mata, Seth Watkins, Casey Erickson, Oscar Morales, Bobby Johnson and Marcelo Moretti for their assistance with the establishment, maintenance, evaluation and harvest of this trial.
REFERENCES: Adcock, C. W., W. G. Foshee III, G. R. Wehtje, and C. H. Gilliam. 2008. Herbicide combinations in tomato to prevents nutsedge (Cyperus esculentus) punctures in plastic mulch for multi-‐cropping systems. Weed Technol. 22:136-‐141. Baker, G. A. A. N. Sampson and M. J. Harwood. 2013. California water wars: Tough choices at Woolf farming. Int. Food and Agribusiness Manage. Rev. 16:95-‐103. [CDFA] California Department of Food and Agriculture. 2013. www.cdfa.ca.gov. Clewis, S. B., W. J. Everman, D. L. Jordan, J. W. Wilcut. 2007. Weed management in North Carolina peanuts (Arachis hypogaea) with S-‐metolachlor, diclosulam, flumioxazin and sulfentrazone systems. Weed Technol. 21:629-‐635. Dall’ Armellina, A. A. and R. L. Zimdahl. 1989. Effect of watering frequency, drought and glyphosate on growth of field bindweed (Convolvulus arvensis). Weed Sci. 37:314-‐318.
Trifluralin PPI + Sulfentrazone PPI(32 oz/A + 3.2 oz/A)
Glyphosate Pre-‐Plant No Glyphosate Pre-‐Plant
California Tomato Research Institute ~ 2013 Annual Report 119
Felix, J. and G. Newberry. 2012. Yellow nutsedge control and reduced tuber production with S-‐metolachlor, halosulfuron plus dicamba, and glyphosate in furrow-‐irrigated corn. Weed Technol. 26:213-‐219. Gaynor, J. D., A. S. Hamill, and D. C. MacTavish. 1993. Efficacy, fruit residues, and soil dissipation of the herbicide metolachlor in processing tomato. J. Amer. Soc. Hort. Sci. 118:68-‐72. Grass, B., B. W. Wenclawiak, and H. Rudel. 1994. Influence of air velocity, air temperature, and air humidity on the volitilisation of trifluralin from soil. Chemosphere. 28:491-‐499. Grey, T. L. and P. E. McCullough. 2012. Sulfonylurea herbicides’ fate in soil: dissipation, mobility, and other processes. Weed Technol. 26:579-‐581. Millhollon, R. W. 1978. Toxicity of soil incorporated trifluralin to Johnsongrass (Sorghum halapense) rhizomes. Weed Sci. 26:171-‐174. Mitchell, J. P., K. A. Klonsky, E. M. Miyao, B. J. Aegerter, A. Shrestha, D. S. Munk, K. Hembree, N. M. Madden and T. A. Turini. 2012. Evolution of conservation tillage systems for processing tomato in California’s Central Valley. Hort Tecnol. 22: 617-‐626. Sharma, S. D. and M. Singh. 2007. Effect of timing and rates of application of glyphosate and carfentrazone herbicides and their mixtures on the control of some broadleaf weeds. Hort. Sci. 42:1221-‐1226 Standifer, L. C. and C. H. Thomas. 1965. Response of Johnsongrass to soil incorporated trifluralin. Weeds. 13:302-‐306. Stone, A. E., T. F. Peeper, and J. P. Kelley. Efficacy and acceptance of herbicides applied for field bindweed (Convolvulus arvensis) control. Weed Technol. 19:148-‐153. Sutton, K. F., W. T. Lanini, J. P. Mitchell, E. M. Miyao and A. Shrestha. 2006. Weed control, yield and quality of processing tomato production under different ittigation, tillage and herbicide systems. Weed Technol. 20:831-‐838. [USDA-‐NASS] United States Department of Agriculture – National Agricultural Statistics Service. 2013. www.nass.gov. Wiese, A. F. and D. E. Lavake. 1986. Control of field bindweed (Convolvulus arvensis) with postemergence herbicides. Weed Sci. 34:77-‐80. Wiese, A. F., M. G. Schoenhals, B. W. Bean, and C. D. Salisbury. 1997. Effect of tillage timing on herbicide toxicity to field bindweed. J. Prod. Agric. 10:459-‐461. Yerkes, C.N.D and C. Weller. 1996. Diluent volume influences susceptibility of field bindweed (Convolvulous arvensis) biotypes to glyphosate. Weed Technol. 10:565-‐569.
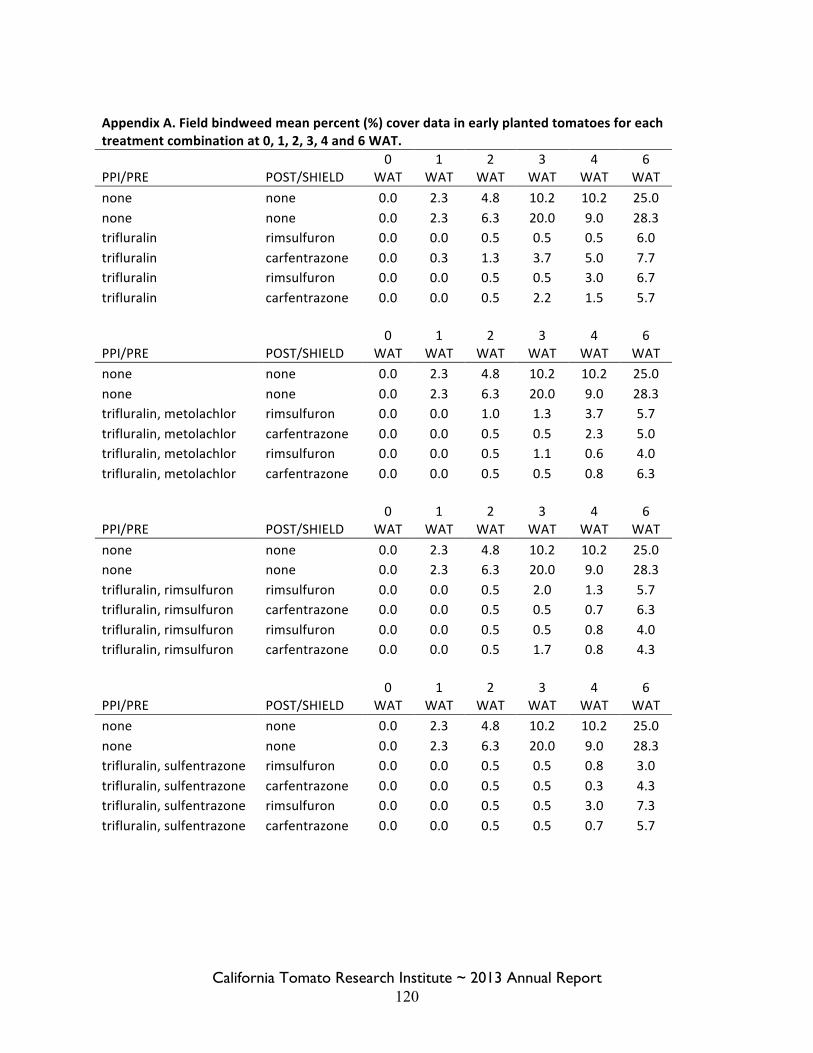
California Tomato Research Institute ~ 2013 Annual Report 120
Appendix A. Field bindweed mean percent (%) cover data in early planted tomatoes for each treatment combination at 0, 1, 2, 3, 4 and 6 WAT.
PPI/PRE POST/SHIELD 0
WAT 1
WAT 2
WAT 3
WAT 4
WAT 6
WAT none none 0.0 2.3 4.8 10.2 10.2 25.0 none none 0.0 2.3 6.3 20.0 9.0 28.3 trifluralin rimsulfuron 0.0 0.0 0.5 0.5 0.5 6.0 trifluralin carfentrazone 0.0 0.3 1.3 3.7 5.0 7.7 trifluralin rimsulfuron 0.0 0.0 0.5 0.5 3.0 6.7 trifluralin carfentrazone 0.0 0.0 0.5 2.2 1.5 5.7
PPI/PRE POST/SHIELD
0 WAT
1 WAT
2 WAT
3 WAT
4 WAT
6 WAT
none none 0.0 2.3 4.8 10.2 10.2 25.0 none none 0.0 2.3 6.3 20.0 9.0 28.3 trifluralin, metolachlor rimsulfuron 0.0 0.0 1.0 1.3 3.7 5.7 trifluralin, metolachlor carfentrazone 0.0 0.0 0.5 0.5 2.3 5.0 trifluralin, metolachlor rimsulfuron 0.0 0.0 0.5 1.1 0.6 4.0 trifluralin, metolachlor carfentrazone 0.0 0.0 0.5 0.5 0.8 6.3
PPI/PRE POST/SHIELD
0 WAT
1 WAT
2 WAT
3 WAT
4 WAT
6 WAT
none none 0.0 2.3 4.8 10.2 10.2 25.0 none none 0.0 2.3 6.3 20.0 9.0 28.3 trifluralin, rimsulfuron rimsulfuron 0.0 0.0 0.5 2.0 1.3 5.7 trifluralin, rimsulfuron carfentrazone 0.0 0.0 0.5 0.5 0.7 6.3 trifluralin, rimsulfuron rimsulfuron 0.0 0.0 0.5 0.5 0.8 4.0 trifluralin, rimsulfuron carfentrazone 0.0 0.0 0.5 1.7 0.8 4.3
PPI/PRE POST/SHIELD
0 WAT
1 WAT
2 WAT
3 WAT
4 WAT
6 WAT
none none 0.0 2.3 4.8 10.2 10.2 25.0 none none 0.0 2.3 6.3 20.0 9.0 28.3 trifluralin, sulfentrazone rimsulfuron 0.0 0.0 0.5 0.5 0.8 3.0 trifluralin, sulfentrazone carfentrazone 0.0 0.0 0.5 0.5 0.3 4.3 trifluralin, sulfentrazone rimsulfuron 0.0 0.0 0.5 0.5 3.0 7.3 trifluralin, sulfentrazone carfentrazone 0.0 0.0 0.5 0.5 0.7 5.7
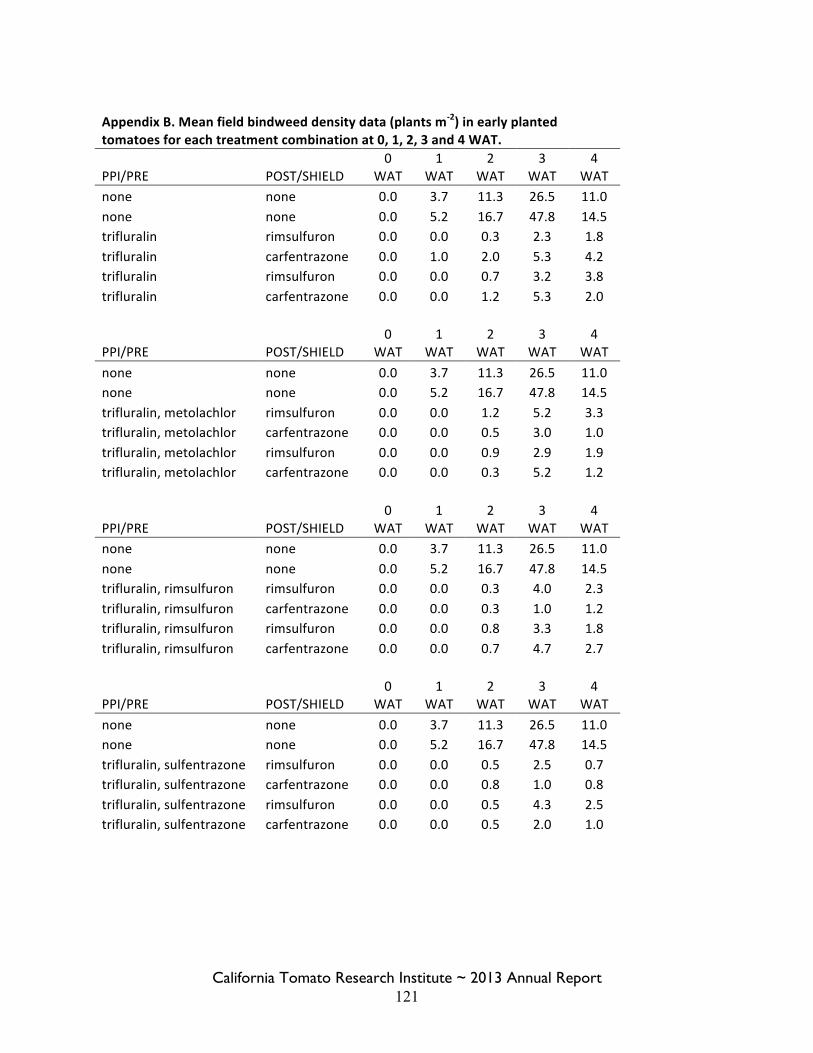
California Tomato Research Institute ~ 2013 Annual Report 121
Appendix B. Mean field bindweed density data (plants m-‐2) in early planted tomatoes for each treatment combination at 0, 1, 2, 3 and 4 WAT.
PPI/PRE POST/SHIELD 0
WAT 1
WAT 2
WAT 3
WAT 4
WAT none none 0.0 3.7 11.3 26.5 11.0 none none 0.0 5.2 16.7 47.8 14.5 trifluralin rimsulfuron 0.0 0.0 0.3 2.3 1.8 trifluralin carfentrazone 0.0 1.0 2.0 5.3 4.2 trifluralin rimsulfuron 0.0 0.0 0.7 3.2 3.8 trifluralin carfentrazone 0.0 0.0 1.2 5.3 2.0
PPI/PRE POST/SHIELD
0 WAT
1 WAT
2 WAT
3 WAT
4 WAT
none none 0.0 3.7 11.3 26.5 11.0 none none 0.0 5.2 16.7 47.8 14.5 trifluralin, metolachlor rimsulfuron 0.0 0.0 1.2 5.2 3.3 trifluralin, metolachlor carfentrazone 0.0 0.0 0.5 3.0 1.0 trifluralin, metolachlor rimsulfuron 0.0 0.0 0.9 2.9 1.9 trifluralin, metolachlor carfentrazone 0.0 0.0 0.3 5.2 1.2
PPI/PRE POST/SHIELD
0 WAT
1 WAT
2 WAT
3 WAT
4 WAT
none none 0.0 3.7 11.3 26.5 11.0 none none 0.0 5.2 16.7 47.8 14.5 trifluralin, rimsulfuron rimsulfuron 0.0 0.0 0.3 4.0 2.3 trifluralin, rimsulfuron carfentrazone 0.0 0.0 0.3 1.0 1.2 trifluralin, rimsulfuron rimsulfuron 0.0 0.0 0.8 3.3 1.8 trifluralin, rimsulfuron carfentrazone 0.0 0.0 0.7 4.7 2.7
PPI/PRE POST/SHIELD
0 WAT
1 WAT
2 WAT
3 WAT
4 WAT
none none 0.0 3.7 11.3 26.5 11.0 none none 0.0 5.2 16.7 47.8 14.5 trifluralin, sulfentrazone rimsulfuron 0.0 0.0 0.5 2.5 0.7 trifluralin, sulfentrazone carfentrazone 0.0 0.0 0.8 1.0 0.8 trifluralin, sulfentrazone rimsulfuron 0.0 0.0 0.5 4.3 2.5 trifluralin, sulfentrazone carfentrazone 0.0 0.0 0.5 2.0 1.0
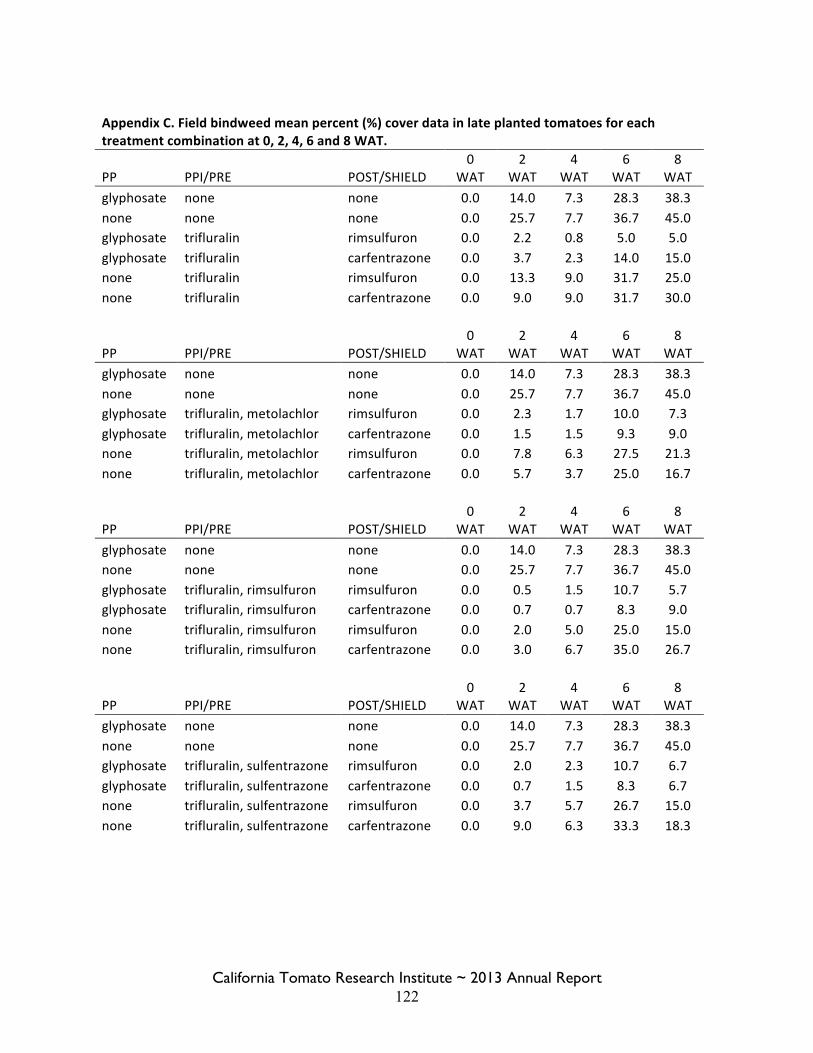
California Tomato Research Institute ~ 2013 Annual Report 122
Appendix C. Field bindweed mean percent (%) cover data in late planted tomatoes for each treatment combination at 0, 2, 4, 6 and 8 WAT.
PP PPI/PRE POST/SHIELD 0
WAT 2
WAT 4
WAT 6
WAT 8
WAT glyphosate none none 0.0 14.0 7.3 28.3 38.3 none none none 0.0 25.7 7.7 36.7 45.0 glyphosate trifluralin rimsulfuron 0.0 2.2 0.8 5.0 5.0 glyphosate trifluralin carfentrazone 0.0 3.7 2.3 14.0 15.0 none trifluralin rimsulfuron 0.0 13.3 9.0 31.7 25.0 none trifluralin carfentrazone 0.0 9.0 9.0 31.7 30.0
PP PPI/PRE POST/SHIELD
0 WAT
2 WAT
4 WAT
6 WAT
8 WAT
glyphosate none none 0.0 14.0 7.3 28.3 38.3 none none none 0.0 25.7 7.7 36.7 45.0 glyphosate trifluralin, metolachlor rimsulfuron 0.0 2.3 1.7 10.0 7.3 glyphosate trifluralin, metolachlor carfentrazone 0.0 1.5 1.5 9.3 9.0 none trifluralin, metolachlor rimsulfuron 0.0 7.8 6.3 27.5 21.3 none trifluralin, metolachlor carfentrazone 0.0 5.7 3.7 25.0 16.7
PP PPI/PRE POST/SHIELD
0 WAT
2 WAT
4 WAT
6 WAT
8 WAT
glyphosate none none 0.0 14.0 7.3 28.3 38.3 none none none 0.0 25.7 7.7 36.7 45.0 glyphosate trifluralin, rimsulfuron rimsulfuron 0.0 0.5 1.5 10.7 5.7 glyphosate trifluralin, rimsulfuron carfentrazone 0.0 0.7 0.7 8.3 9.0 none trifluralin, rimsulfuron rimsulfuron 0.0 2.0 5.0 25.0 15.0 none trifluralin, rimsulfuron carfentrazone 0.0 3.0 6.7 35.0 26.7
PP PPI/PRE POST/SHIELD
0 WAT
2 WAT
4 WAT
6 WAT
8 WAT
glyphosate none none 0.0 14.0 7.3 28.3 38.3 none none none 0.0 25.7 7.7 36.7 45.0 glyphosate trifluralin, sulfentrazone rimsulfuron 0.0 2.0 2.3 10.7 6.7 glyphosate trifluralin, sulfentrazone carfentrazone 0.0 0.7 1.5 8.3 6.7 none trifluralin, sulfentrazone rimsulfuron 0.0 3.7 5.7 26.7 15.0 none trifluralin, sulfentrazone carfentrazone 0.0 9.0 6.3 33.3 18.3
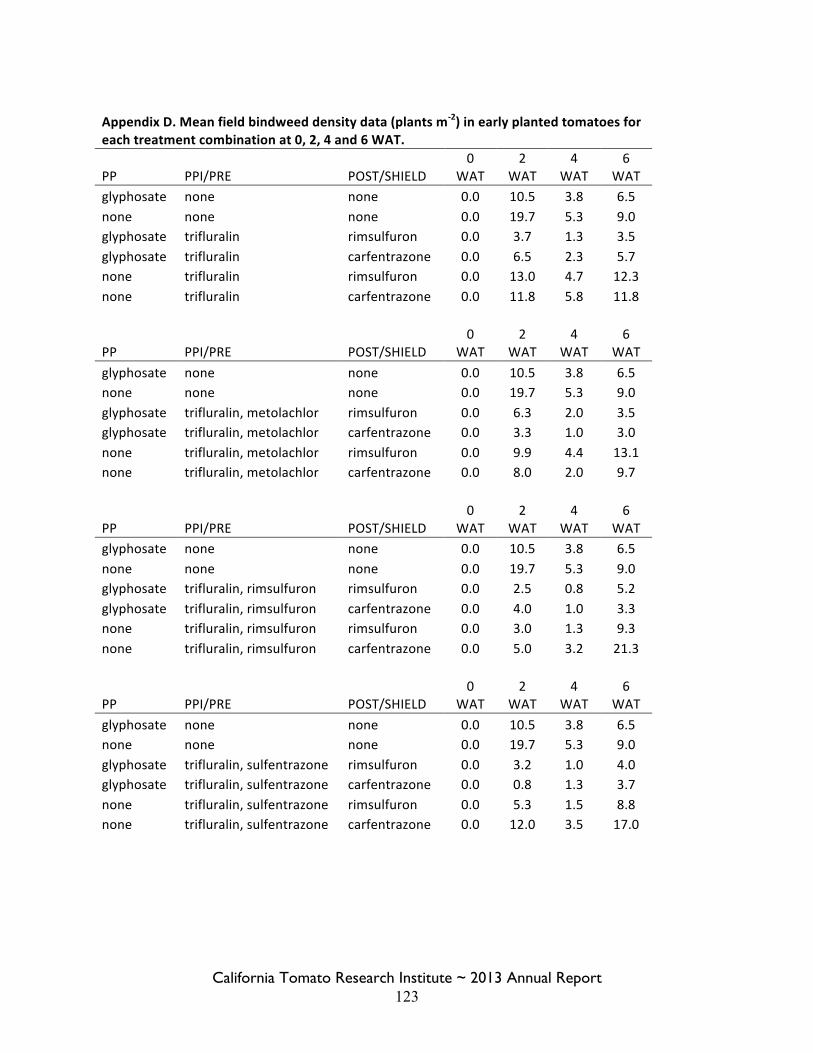
California Tomato Research Institute ~ 2013 Annual Report 123
Appendix D. Mean field bindweed density data (plants m-‐2) in early planted tomatoes for each treatment combination at 0, 2, 4 and 6 WAT.
PP PPI/PRE POST/SHIELD 0
WAT 2
WAT 4
WAT 6
WAT glyphosate none none 0.0 10.5 3.8 6.5 none none none 0.0 19.7 5.3 9.0 glyphosate trifluralin rimsulfuron 0.0 3.7 1.3 3.5 glyphosate trifluralin carfentrazone 0.0 6.5 2.3 5.7 none trifluralin rimsulfuron 0.0 13.0 4.7 12.3 none trifluralin carfentrazone 0.0 11.8 5.8 11.8
PP PPI/PRE POST/SHIELD
0 WAT
2 WAT
4 WAT
6 WAT
glyphosate none none 0.0 10.5 3.8 6.5 none none none 0.0 19.7 5.3 9.0 glyphosate trifluralin, metolachlor rimsulfuron 0.0 6.3 2.0 3.5 glyphosate trifluralin, metolachlor carfentrazone 0.0 3.3 1.0 3.0 none trifluralin, metolachlor rimsulfuron 0.0 9.9 4.4 13.1 none trifluralin, metolachlor carfentrazone 0.0 8.0 2.0 9.7
PP PPI/PRE POST/SHIELD
0 WAT
2 WAT
4 WAT
6 WAT
glyphosate none none 0.0 10.5 3.8 6.5 none none none 0.0 19.7 5.3 9.0 glyphosate trifluralin, rimsulfuron rimsulfuron 0.0 2.5 0.8 5.2 glyphosate trifluralin, rimsulfuron carfentrazone 0.0 4.0 1.0 3.3 none trifluralin, rimsulfuron rimsulfuron 0.0 3.0 1.3 9.3 none trifluralin, rimsulfuron carfentrazone 0.0 5.0 3.2 21.3
PP PPI/PRE POST/SHIELD
0 WAT
2 WAT
4 WAT
6 WAT
glyphosate none none 0.0 10.5 3.8 6.5 none none none 0.0 19.7 5.3 9.0 glyphosate trifluralin, sulfentrazone rimsulfuron 0.0 3.2 1.0 4.0 glyphosate trifluralin, sulfentrazone carfentrazone 0.0 0.8 1.3 3.7 none trifluralin, sulfentrazone rimsulfuron 0.0 5.3 1.5 8.8 none trifluralin, sulfentrazone carfentrazone 0.0 12.0 3.5 17.0
California Tomato Research Institute ~ 2013 Annual Report 124
Project Title: Evaluating Herbicide Carryover in Sub-surface Drip-irrigated Tomatoes Principle Investigator: Kurt Hembree
Weed Management Farm Advisor UC Cooperative Extension, Fresno County
550 E. Shaw Ave.,Suite 210-B, Fresno, CA 93710 Phone: (559) 241-7520 [email protected]
Co-Investigators: Thomas Turini Vegetable Crops Farm Advisor
UC Cooperative Extension, Fresno County 550 E. Shaw Ave.,Suite 210-B, Fresno, CA 93710 Phone: (559) 241-7529 [email protected]
Summary: Beginning in 2009, stunted tomato plants with substantial root reduction were observed where labeled rates of dinitroaniline herbicides were routinely used in commercial processing tomato fields in western Fresno County, where semi-permanent beds and sub-surface drip irrigation are now a common practice. The field patterns and plant symptoms observed were consistent with injury by dinitroaniline herbicides. To address this issue, we began a three-year field study at the UC West Side Research & Extension Center (WSREC) in Five Points, CA to evaluate dinitroanilin herbicide carryover and impact on tomato health and production in a three-year tomato rotation using permanent raised beds with sub-surface drip irrigation. Pre-plant use of Treflan (trifluralin) and Prowl H2O (pendimethalin) were evaluated under sub-surface drip and sub-surface drip plus overhead sprinkler irrigation. Initially, shoot and root dry weights were lower where sprinkler irrigation was used, but differences could not be detected later and plots yielded fruit similarly. Stand was also reduced slightly where sprinklers were used, compared to drip-only plots. Neither of the herbicide treatments used influenced plant dry weight, stand, or yield. Soil analyses for trifluralin and pendimethalin indicated that there was no downward movement of either herbicide through the soil profile, even where sprinkler irrigation was used during crop establishment. While trifluralin was not detectable in the soil by harvest, about 10% of the pendimethalin remained in the upper three-inches of the soil. This indicates possible carryover into next year’s planting cycle, with the potential of causing crop injury similar to what we had been observing in commercial fields. There was a 50% infection rate of Curly top virus across the trial area, resulting in yields of about 45 ton/acre. This resulted in reduced yields across the trial for the area. Objectives (year 1): The objectives in year one are three-fold; 1) determine tomato growth and yield following initial treatment of trifluralin and pendimethalin, 2) determine if using sprinkler irrigation at crop establishment aids or hinders herbicide movement or degradation, and 3) determine if herbicide residues are detected in the upper soil profile before next season’s planting cycle.
California Tomato Research Institute ~ 2013 Annual Report 125
Procedure: In 2013, a site was selected at WSREC in a Panoche clay loam soil that had not had any dinitroaniline herbicides applied for at least the prior two years. The site was prepared in February by leveling, disking, and building 60-inch raised beds, and then sub-surface irrigation tape (Netafim 15-mil) was installed 10-inces deep down the center of each bed. The experimental design was a split-plot with four replications. Main-plot treatments are sub-surface drip irrigation the entire season and sprinkler irrigation during crop establishment, followed by sub-surface drip irrigation. Sub-plot herbicide treatments include Treflan at 2 pt/acre, Prowl H2O at 3 pt/acre, and no herbicide, applied pre-plant incorporated 2.5 to 3” deep. Main plots are six beds-wide, 270-feet long and sub-plots are six beds-wide, 75-feet long. A 15-foot untreated buffer was used between sub-plots down each row to help prevent cross-contamination of plots. Only the center two beds of each plot were used for collecting data. On April 22, herbicides were applied with a pull-behind ground sprayer and incorporated to a depth of 2.5- to 3-inches with a three-row power bed mulcher. Soil samples were then collected at depths of 0 to 3-inches and 3- to 6-inches the following day. Tomato variety H5608 (SW5 – spotted wilt resistant) was planted on April 24 using a Chechi Magli cone planter. The transplants were placed below the herbicide-treated zone (3.5- to 4.5-inches deep from the bed surface to the top of transplant plugs), one every 10 inches in a single row per bed. Transplant water was applied at 300 gal/acre combined with First Choice Transplant Supreme (Loveland Products, Greeley, CO) at 3 gal/acre. In the drip-only plots, 2.25 acre-inches was applied as a pre-irrigation and in the sprinkler plots, 3 acre-inches of water was applied starting immediately after planting over a six-day period. A total of 28 acre-inches of water was applied to the entire field throughout the season as needed. The site was cultivated and hand weeded two times each during the season. Soil samples were again collected one week before harvest and analyzed for herbicide residues. Plots were harvested for yield and quality on September 5, by hand pulling consecutive plants in 20-foot sections of the center two rows, shaking the fruit into drums, and recording weights. A 5-gallon sub-sample was collected from each drum and the fruit was sorted by red, green, sunburn, and rot. Percent of each sorted grade was calculated and ton/acre of red fruit was determined. A 50-count sample of red fruit was also collected from each plot and weighed, then analyzed for color, pH, and solids. The plot area was then sprayed with paraquat to dry down remaining plants, and then the beds were re-shaped in their original position in November in preparation for planting next season. To determine herbicide residues, sub-samples were collected from 10 locations within each plot (center 2 rows) and combined into a single sample. Two sampling depths (0 to 3-inch and 3- to 6-inch) were collected in each plot. A 1 5/8-inch diameter soil probe was used for collecting the soil, yielding a total of about 1 pint of soil per plot sample for analysis. The samples were taken to Dellavalley Laboratory Inc. in Fresno, CA, where herbicide residues were measured using high performance liquid chromatography (HPLC). Testing for trifluralin was conducted at Dellavalley, but pendimethalin samples were sub-contracted out to another laboratory, which used the same HPLC technique.
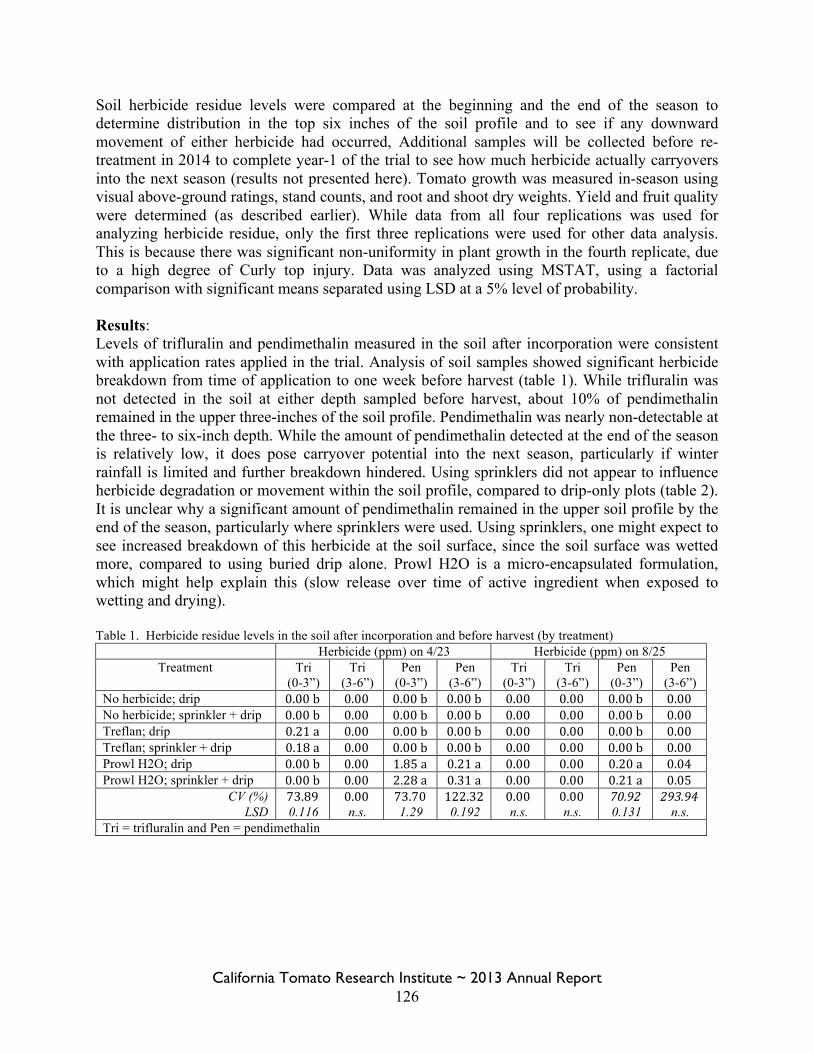
California Tomato Research Institute ~ 2013 Annual Report 126
Soil herbicide residue levels were compared at the beginning and the end of the season to determine distribution in the top six inches of the soil profile and to see if any downward movement of either herbicide had occurred, Additional samples will be collected before re-treatment in 2014 to complete year-1 of the trial to see how much herbicide actually carryovers into the next season (results not presented here). Tomato growth was measured in-season using visual above-ground ratings, stand counts, and root and shoot dry weights. Yield and fruit quality were determined (as described earlier). While data from all four replications was used for analyzing herbicide residue, only the first three replications were used for other data analysis. This is because there was significant non-uniformity in plant growth in the fourth replicate, due to a high degree of Curly top injury. Data was analyzed using MSTAT, using a factorial comparison with significant means separated using LSD at a 5% level of probability. Results: Levels of trifluralin and pendimethalin measured in the soil after incorporation were consistent with application rates applied in the trial. Analysis of soil samples showed significant herbicide breakdown from time of application to one week before harvest (table 1). While trifluralin was not detected in the soil at either depth sampled before harvest, about 10% of pendimethalin remained in the upper three-inches of the soil profile. Pendimethalin was nearly non-detectable at the three- to six-inch depth. While the amount of pendimethalin detected at the end of the season is relatively low, it does pose carryover potential into the next season, particularly if winter rainfall is limited and further breakdown hindered. Using sprinklers did not appear to influence herbicide degradation or movement within the soil profile, compared to drip-only plots (table 2). It is unclear why a significant amount of pendimethalin remained in the upper soil profile by the end of the season, particularly where sprinklers were used. Using sprinklers, one might expect to see increased breakdown of this herbicide at the soil surface, since the soil surface was wetted more, compared to using buried drip alone. Prowl H2O is a micro-encapsulated formulation, which might help explain this (slow release over time of active ingredient when exposed to wetting and drying). Table 1. Herbicide residue levels in the soil after incorporation and before harvest (by treatment)
Herbicide (ppm) on 4/23 Herbicide (ppm) on 8/25 Treatment Tri
(0-3”) Tri
(3-6”) Pen
(0-3”) Pen
(3-6”) Tri
(0-3”) Tri
(3-6”) Pen
(0-3”) Pen
(3-6”) No herbicide; drip 0.00 b 0.00 0.00 b 0.00 b 0.00 0.00 0.00 b 0.00 No herbicide; sprinkler + drip 0.00 b 0.00 0.00 b 0.00 b 0.00 0.00 0.00 b 0.00 Treflan; drip 0.21 a 0.00 0.00 b 0.00 b 0.00 0.00 0.00 b 0.00 Treflan; sprinkler + drip 0.18 a 0.00 0.00 b 0.00 b 0.00 0.00 0.00 b 0.00 Prowl H2O; drip 0.00 b 0.00 1.85 a 0.21 a 0.00 0.00 0.20 a 0.04 Prowl H2O; sprinkler + drip 0.00 b 0.00 2.28 a 0.31 a 0.00 0.00 0.21 a 0.05
CV (%) 73.89 0.00 73.70 122.32 0.00 0.00 70.92 293.94 LSD 0.116 n.s. 1.29 0.192 n.s. n.s. 0.131 n.s.
Tri = trifluralin and Pen = pendimethalin
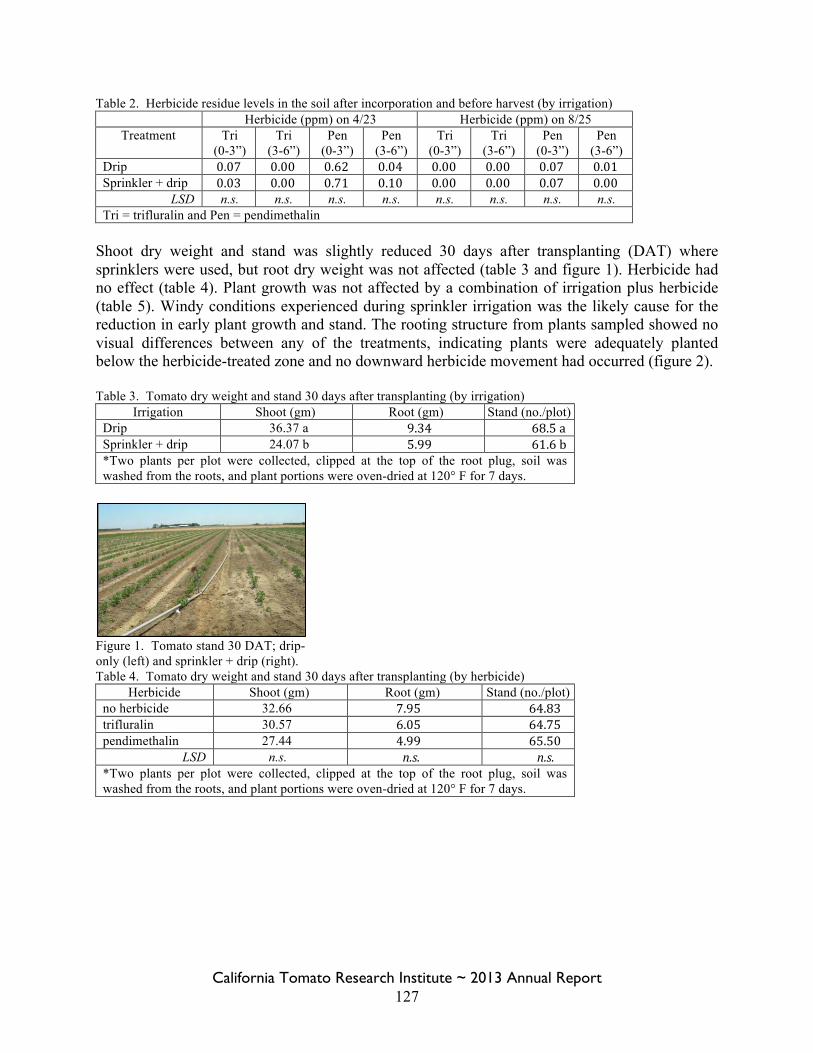
California Tomato Research Institute ~ 2013 Annual Report 127
Table 2. Herbicide residue levels in the soil after incorporation and before harvest (by irrigation) Herbicide (ppm) on 4/23 Herbicide (ppm) on 8/25
Treatment Tri (0-3”)
Tri (3-6”)
Pen (0-3”)
Pen (3-6”)
Tri (0-3”)
Tri (3-6”)
Pen (0-3”)
Pen (3-6”)
Drip 0.07 0.00 0.62 0.04 0.00 0.00 0.07 0.01 Sprinkler + drip 0.03 0.00 0.71 0.10 0.00 0.00 0.07 0.00
LSD n.s. n.s. n.s. n.s. n.s. n.s. n.s. n.s. Tri = trifluralin and Pen = pendimethalin
Shoot dry weight and stand was slightly reduced 30 days after transplanting (DAT) where sprinklers were used, but root dry weight was not affected (table 3 and figure 1). Herbicide had no effect (table 4). Plant growth was not affected by a combination of irrigation plus herbicide (table 5). Windy conditions experienced during sprinkler irrigation was the likely cause for the reduction in early plant growth and stand. The rooting structure from plants sampled showed no visual differences between any of the treatments, indicating plants were adequately planted below the herbicide-treated zone and no downward herbicide movement had occurred (figure 2). Table 3. Tomato dry weight and stand 30 days after transplanting (by irrigation)
Irrigation Shoot (gm) Root (gm) Stand (no./plot) Drip 36.37 a 9.34 68.5 a Sprinkler + drip 24.07 b 5.99 61.6 b *Two plants per plot were collected, clipped at the top of the root plug, soil was washed from the roots, and plant portions were oven-dried at 120° F for 7 days.
Figure 1. Tomato stand 30 DAT; drip-only (left) and sprinkler + drip (right). Table 4. Tomato dry weight and stand 30 days after transplanting (by herbicide)
Herbicide Shoot (gm) Root (gm) Stand (no./plot) no herbicide 32.66 7.95 64.83 trifluralin 30.57 6.05 64.75 pendimethalin 27.44 4.99 65.50
LSD n.s. n.s. n.s. *Two plants per plot were collected, clipped at the top of the root plug, soil was washed from the roots, and plant portions were oven-dried at 120° F for 7 days.
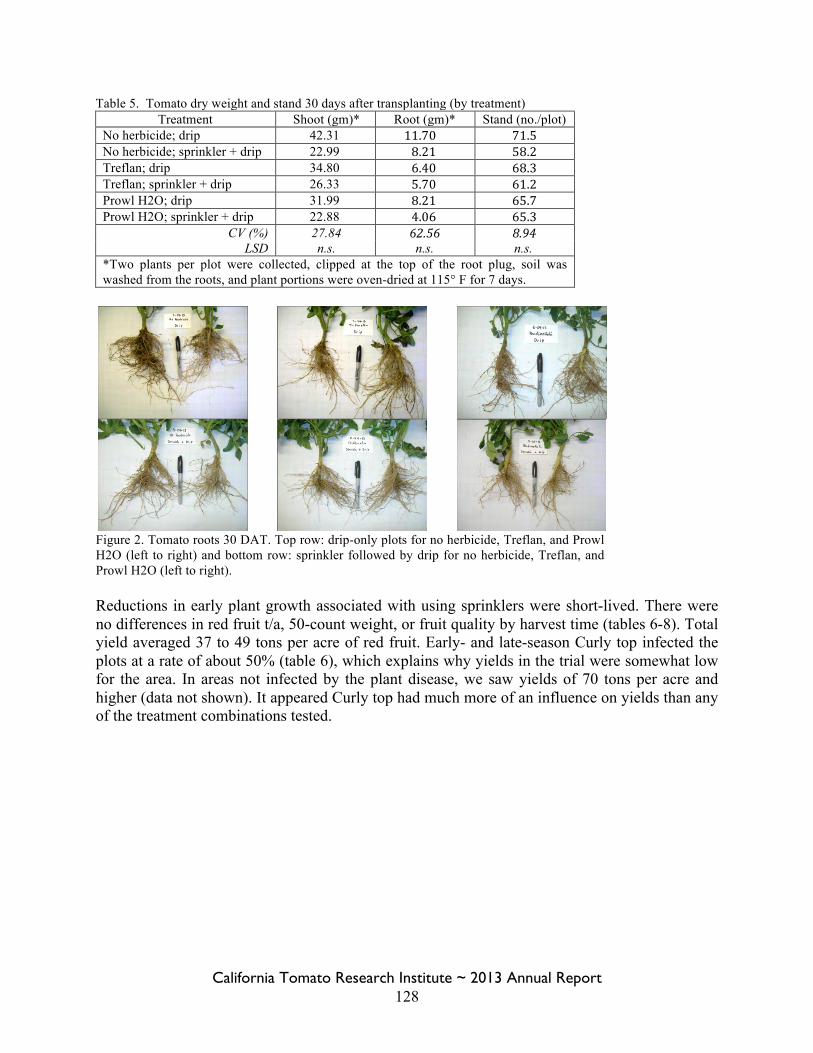
California Tomato Research Institute ~ 2013 Annual Report 128
Table 5. Tomato dry weight and stand 30 days after transplanting (by treatment) Treatment Shoot (gm)* Root (gm)* Stand (no./plot)
No herbicide; drip 42.31 11.70 71.5 No herbicide; sprinkler + drip 22.99 8.21 58.2 Treflan; drip 34.80 6.40 68.3 Treflan; sprinkler + drip 26.33 5.70 61.2 Prowl H2O; drip 31.99 8.21 65.7 Prowl H2O; sprinkler + drip 22.88 4.06 65.3
CV (%) 27.84 62.56 8.94 LSD n.s. n.s. n.s.
*Two plants per plot were collected, clipped at the top of the root plug, soil was washed from the roots, and plant portions were oven-dried at 115° F for 7 days.
Figure 2. Tomato roots 30 DAT. Top row: drip-only plots for no herbicide, Treflan, and Prowl H2O (left to right) and bottom row: sprinkler followed by drip for no herbicide, Treflan, and Prowl H2O (left to right). Reductions in early plant growth associated with using sprinklers were short-lived. There were no differences in red fruit t/a, 50-count weight, or fruit quality by harvest time (tables 6-8). Total yield averaged 37 to 49 tons per acre of red fruit. Early- and late-season Curly top infected the plots at a rate of about 50% (table 6), which explains why yields in the trial were somewhat low for the area. In areas not infected by the plant disease, we saw yields of 70 tons per acre and higher (data not shown). It appeared Curly top had much more of an influence on yields than any of the treatment combinations tested.
California Tomato Research Institute ~ 2013 Annual Report 129
Table 6. Tomato yield, 50-count, and fruit quality (by treatment)
Treatment
Red fruit (t/a)
50-count (lb)
Color
Solids
pH
Curly top (%)
No herbicide; drip 37.87 7.63 23.67 4.00 4.40 47.68 No herbicide; sprinkler + drip 39.23 7.90 24.67 4.30 4.44 46.65 Treflan; drip 49.28 8.03 23.00 4.17 4.41 49.38 Treflan; sprinkler + drip 46.82 7.90 24.33 4.07 4.39 47.53 Prowl H2O; drip 39.32 7.73 22.67 4.07 4.43 51.43 Prowl H2O; sprinkler + drip 44.13 7.98 23.67 4.03 4.42 50.23
CV (%) 29.01 9.18 6.12 5.29 1.21 27.78 LSD n.s. n.s. n.s. n.s. n.s. n.s.
Based on three replications Table 7. Tomato yield, 50-count, and fruit quality (by irrigation)
Irrigation
Red fruit (t/a)
50-count (lb)
Color
Solids
pH
Drip 42.87 7.80 23.11 4.08 4.41 Sprinkler + drip 45.43 7.93 24.22 4.13 4.41
LSD n.s. n.s. n.s. n.s. n.s. Based on three replications
Table 8. Tomato yield, 50-count, and fruit quality (by herbicide)
Herbicide
Red fruit (t/a)
50-count (lb)
Color
Solids
pH
no herbicide 38.60 7.77 24.17 4.15 4.42 trifluralin 48.05 7.97 23.67 4.11 4.40 pendimethalin 42.79 7.86 23.17 4.05 4.42
LSD n.s. n.s. n.s. n.s. n.s. Based on three replications
Results from the initial part of this project are about what we anticipated going into this three-year tomato rotation, where pre-plant herbicides are used each year. Herbicides used in the study were not detected deep in the soil profile, so root health and yield were not affected. By harvest, a significant amount of the pendimethalin remained in the upper soil profile, while trifluralin was not detected. While using sprinkler irrigation initially did not result in movement of herbicide downward in the soil profile, it appeared to have the largest influence on early plant health, most likely the result of windy conditions during application and non-uniformity in water distribution. Curly top virus impacted overall production, influencing main- and sub-plot effects equally. Once final soil analyses are run for herbicides before planting in 2014, we should have a better understanding of potential for herbicide carryover (particularly pendimethalin) and possible influence on tomato growth and productivity. We anticipate a cumulative effect of pendimethalin over time.
California Tomato Research Institute ~ 2013 Annual Report 130
Project Title: Field Bindweed Management in Drip Irrigated Processing Tomatoes Project Leader: Scott Stoddard Farm Advisor Merced & Madera Counties 2145 Wardrobe Ave. Merced, CA 95340 209-385-7403; cell: 209-777-SOIL [email protected] Summary: Field studies were conducted at WSREC near Five Points to evaluate the efficacy of registered herbicide combinations in controlling field bindweed (Convolvulsus arvensis) in drip irrigated processing tomatoes. The herbicides tested suppressed field bindweed growth, but none of the herbicides provided complete control. Treflan was the most effective preemergence treatment for suppressing established field bindweed, and post emergence treatments with Matrix or Shark improved control in most instances. Slight crop phytotoxicity was noted at WSREC for Prowl, Treflan, and Zeus preplant incorporated; however, symptoms of herbicide damage were not apparent by the end of the season. Other broadleaf and grassy weeds, especially lambsquarters, became very problematic by the end of the season, and when combined with irrigation difficulties, prevented yields from being estimated. Justification: The rapid adoption of drip irrigation and the economic necessity of maintaining the beds and replanting with only minimal tillage for multiple seasons in processing tomatoes has created a system where field bindweed has become more prevalent. Field bindweed is extremely difficult to control because it propagates from seed and vegetatively from buds formed in the roots. Seedlings can be controlled with tillage when very young, but they develop the capacity to regenerate new shoot growth (become perennial) very rapidly. Chemical control of seedlings is possible, but established plants are much more difficult to control. Established plants often have a large root system relative to the amount of top growth, and thus not enough leaf area for absorption of postemergence herbicides to kill the entire root system. Mullen et al. (1999) found that Matrix (1 or 2 oz/a), Devrinol (2 lb/a), Dual (2.5 lb/a), Treflan (0.5 lb/a) PRE or POST applications of Matrix at 1 or 2 oz/a and metribuzin at 0.25 lb/a failed to control field bindweed. Other researchers have noted partial control with Matrix applied PRE or POST, Shark applied POST, and Treflan applied PRE. CTRI funded research by Tom Lanini (2010 – 2012) evaluated combinations of PRE and POST treatments and showed that PPI Treflan plus Matrix POST gave overall better control of bindweed than either alone. Pre-emergent applications of Prowl H2O were not as effective as Treflan. The purpose of this study was to evaluate these materials alone or in combination for field bindweed “management”. The term management is used rather than control, as it is unlikely that any registered herbicide will completely control field bindweed in a single season. Hopefully the
California Tomato Research Institute ~ 2013 Annual Report 131
right combination of herbicide treatments can suppress field bindweed enough to achieve maximum yield potential with minimum hand weeding. In 2012 trials at WSREC and UC Davis, Treflan was the most effective preemergence treatment for suppressing established field bindweed, and that post emergence treatments with Shark or Matrix also improved control in most instances. Dual Magnum, Matrix, Prowl H2O, and Zeus applied PRE were not as effective in suppressing established field bindweed. Results suggested that a double application of Treflan (pre-emergence and again at lay-by), a Treflan + Dual + Matrix program, or a double POST Matrix application were providing the best herbicide control on field bindweed. These treatments were evaluated at WSREC using similar herbicide combinations as in previous years. Because Tom Lanini retired in 2013, the trial was not done at UC Davis. References: Mullen, R.J., Caprile, J., Viss, T.C., Whiteley, R.W. and Rivara, C.J. 1999. Recent research development in tomato weed management. Acta Hort. (ISHS) 487:165-170. Lanini, T. and C.S. Stoddard. 2012. Field Bindweed Management in Drip Irrigated and Furrow Irrigated Processing Tomatoes. CTRI Research Project Report.
Objective: Evaluate registered herbicides and herbicide combinations for field bindweed management in drip irrigated processing tomatoes. Procedure: Field studies were conducted at West Side Research and Education Center (WSREC) to assess registered herbicides and herbicide combinations on management of field bindweed in drip irrigated processing tomatoes. The field site was in the same location as 2012, utilizing the existing beds and irrigation system. The site was heavily infested with field bindweed. A large split-plot trial was used, with main plots pre-plant and pre-emergent applications of Prowl H2O (pendimethalin), Treflan (trifluralin), Zeus (sulfentrazone), and Matrix (rimsulfuron). Over the top of these, post applications of Matrix or Shark (carfentrazone) for the split plot treatments. Adjacent to this trial, other herbicide treatment combinations were tested with a randomized block design, and included sequential POST applications of Matrix, Shark + Roundup (glyphosate), Treflan applied PPI and again at lay-by, Zeus + Dual Magnum PPI, and a Treflan + Dual (metalochlor) + Matrix combination that is commonly used in tomatoes, as well as untreated controls. Treatment design was a randomized complete block design, with four replications. The trials included a hand-weeded check plot. Total number of unique treatment combinations = (5 x 3) + 6 = 21. A listing of these treatments with their application dates for WSREC is shown in Tables 1 and 2. Prior to bedding the experimental area, emerged bindweed was sprayed with Roundup at 2 pints/A. After burndown, Treflan, Prowl, and Zeus were applied to the top of finished beds and incorporated into the upper 3” of soil on April 18. Materials were applied with Tee Jet 8003
California Tomato Research Institute ~ 2013 Annual Report 132
nozzles at 30 psi in 40 gpa water. The plot area was planted using TSWV resistant variety H5608 on May 7, then sprayed with an over-the-top application of Matrix. The field was then sprinkler irrigated on May 9 with approximately 1” of water. All subsequent irrigation was done with the drip system (the drip system was installed on April 18, 2012, using Netafim “high flow” (0.36 gph) 5/8” drip line with 12” emitter spacing to a depth of about 9 inches). The system was attached to flow meters so that total water use could be monitored. Nitrogen fertilizer was applied through the drip system on 6 occasions for a total of 165 lbs N/A. Admire Pro (imidacloprid) was injected on two occasions at 10 oz/A to control leaf hopper; Coragen was applied once through the drip system for worm control. About 5 weeks before harvest the plots were sprayed with Quadris Top and Warrior for powdery mildew, black mold, and stink bugs. Post emergence applications of Matrix and Shark were made on May 14 using the same nozzle set up as for the pre herbicides. Shark was applied using a shielded sprayer as to minimize contact with the tomato crop (Fig 1); matrix was applied over the top with an NIS adjuvant at 0.25% v/v. The second post application for select plots was done on May 30. Weed-free plots were kept free of all weeds by manually removing them at bi-weekly intervals during the growing season. Weed and crop ratings were made at 14, 28, 54 days after treatment. The entire plot area was cultivated once after the 28-day evaluation.
Results: Main and split plot treatment affects are shown in Table 1, and show weed and crop phytotoxicity ratings based on a 0 – 10 scale, where 10 indicates all weeds/phyto. These ratings were transformed to percentages using the arc-sin transformation so that weed control could be graphed. Best control of field bindweed was observed with PPI Treflan at 2 pints/A. This treatment had less field bindweed on all evaluation dates, but this effect was not significantly less than the other treatments or the untreated control. The Treflan treatment by itself provided about 70% control of the bindweed by the end of the season (Figure 1) Application of Matrix or Shark as a post treatment provided significant suppression of bindweed as compared to the untreated plots on all evaluation dates (Table 1). Matrix performed better than Shark, but again by the end of the season average control was about 70%. Regardless of PPI herbicide, the addition of Matrix or Shark improved bindweed control to as high as 80% in June (Figures 1) and 75% in mid-July (Figure 2). All of the PPI treatments significantly reduced other broadleaf weeds (mainly puncture vine, pigweed, lambsquarters, purslane, and nightshades) as compared to the untreated control at all evaluation dates (Table 1). Treflan again provided the best suppression of these other weed species. As with bindweed, the addition of post emergence herbicide significantly improved weed control (Figs 1 and 2), however Matrix was far better than Shark for improving control of both broadleaf and grasses. The combination of Treflan and Matrix gave nearly 100% weed control of all weeds with the exception of bindweed. Very little crop injury was noted this year, and visible crop injury was gone by the end of the season. The main effects of the additional herbicide treatments are shown in Table 2 and in Figure 3. The application of Treflan both as a pre-plant and at lay-by gave good overall bindweed and other broadleaf control. The Shark + Roundup treatment appeared to work well at suppressing
California Tomato Research Institute ~ 2013 Annual Report 133
bindweed, but at the expense of having tremendous grassy and broadleaf weeds as a consequence of not being able to spray in the plant row. The “3-way” program (PPI Treflan + Dual followed by a post application of Matrix) also proved good weed control. Zeus weed control was improved with the addition of Dual Magnum. Yields were not measured for this trial due to heavy end of season weed pressure and irrigation problems. Conclusions: The results of this trial again show that Treflan provides better field bindweed control than Zeus, Prowl H20, or Matrix in processing tomatoes. Bindweed, grasses, and other broadleaf weed suppression were all improved with the application of Shark or Matrix after weed emergence, with Matrix being superior to Shark, most likely because the crop row could not be treated with the shielded application used with Shark. Unlike last year, doubling the rate of Matrix did not appear to improve field bindweed control. The combination of a preemergence herbicide and either Matrix or Shark applied postemergence, or applying Treflan both pre and at layby, have been the best treatments for controlling field bindweed in these trials over a 4-year span. Concerns about this herbicide program remain for its potential crop phytotoxicity and plant-back restrictions.
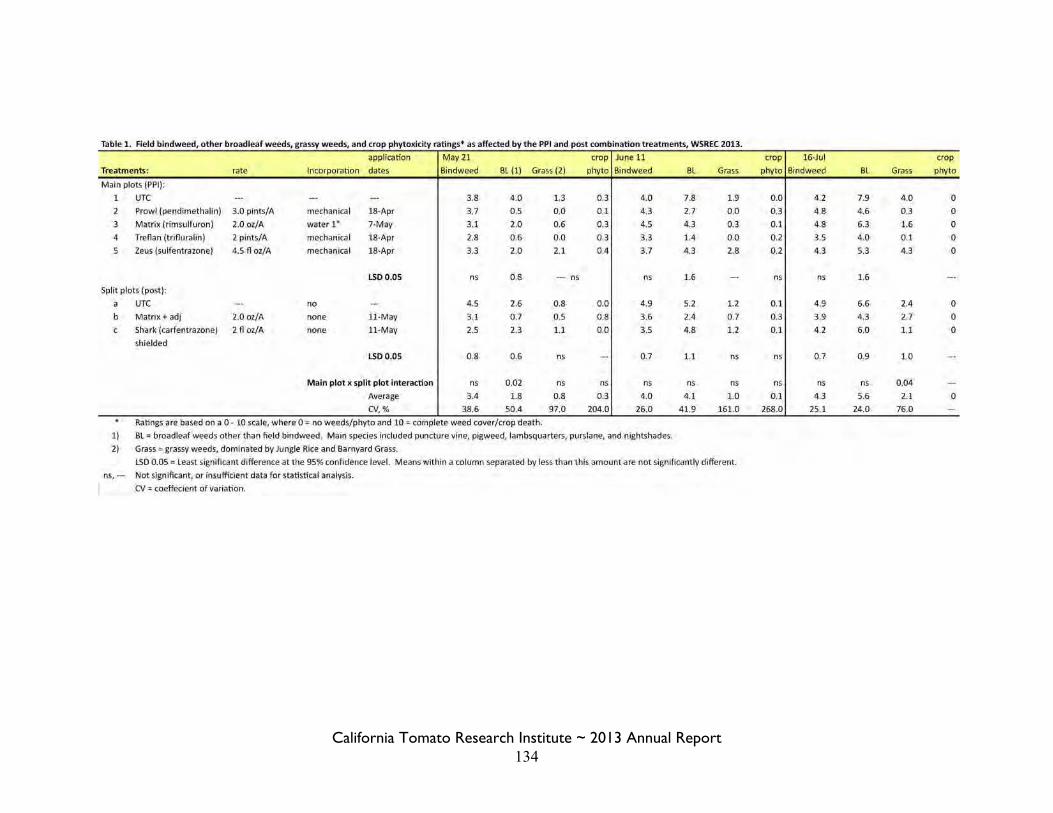
California Tomato Research Institute ~ 2013 Annual Report 134
Table 1. Field bindweed, other broad leaf weeds, grassy weeds, and crop phytoJCicity ratings• as affected by the PPI and post combination treatments, WSREC 2013.
<!pplication May2l CtOp June.U Treatments: rate ln~orporatfon date~ Bin~weed Bl (1) .Grass (2) Plwta' Bindweed Bl Grass
Mafn plots (PPI);
1 UTC ·- - -· 3.8 4.0 1,3 0.3 4.n 7.8 1.9
2 Prowl (pendimethalin) 3.0 pints/A mecl1anical 18·Apr 3.7 0,5 0.0 0.1 4.3 2.7 0.0
3 Matrix (rimsulfuron) 2.0 oz/A water 1" 7·May 3.1 2.0 0.6 0.3 4.5 4.3 0.3
4 j renan (trifluratin) 2 pitlts/A mechanical 18-Apr i.S 0,6 0.0 0.3 3.3 1.4 0.0
5 Zeus (sulfentrazone) 4.5 n oz/A mechanical 18•Apr 3.3 2.0 2.1 0.4 3.7 4.3 2.8
LSDO.OS ns 0,8 -- ns ns 1.6 -Split plots (post):
a UTC -· no ·- 4.5 2.6 0.8 0.0 4.9 5.2 1.2
b Matrix+ adj 2.0 oz/A none 11-May 3..1 0.7 0.5 0.8 3.6 2.4 0.7 ( Shark (carfentrazone) 2 fl oz/A none 11-May 2.5 2.3 1.1 0.0 3 .5 4.8 1.2
shielded
LSDO.OS 0.8 0,6 ns - 0.7 1,1 ns
Main plot x split plot interaction ns 0.02 ns ns ns ns ns
Average 3.4 1.8 0.8 0.3 4.0 4.1 .),.0
CV,% 38.6 50.4 97.0 204.0 26.0 41.9 161.0
Ratings are based on a 0 • 10 sca le, where 0: no weeds/phyto and 10 : complete weed cover/crop death.
1) BL: broadleaf weeds other than field bi!Jdweed, Main species included punct\Jre vine, pigweed, lambsquarters, purslane. and nigl)tshades.
2) Grass= gras-sy weeds, domina ted by Jungle Rice and Barnyard Grass.
LSD 0.05 = Least significant differen~e at the 95% confidence level. Means within a column separated by less than this amount a re not significantly different.
ns,- Not signlfkant, or insufficient data for statistical analysis.
CV = coeffeclent of variation.
crop 1!16:::Jul crop
phvfo Bfndweed Bl Grass Phvtg
0.0 4.2 7.9 4.0 0
0.3 4.8 4.6 0.3 0
0.1 4.8 6.3 1.6 0
0.2 3.5 4.0 0.1 0
0.2 4.3 5.3 4.3 0
ns ns 1.6 - ·
Q,1 4.9 6.6 2.4 0
0.3 3..9 4.3 2.7 0
0.1 4.2 6.0 1.1 0
ns OJ 0.9 1,0 - ·
ns ns ns 0.04 -0.1 4.3 5.6 2.1 0
268.0 25.1 24.0 76.0 -
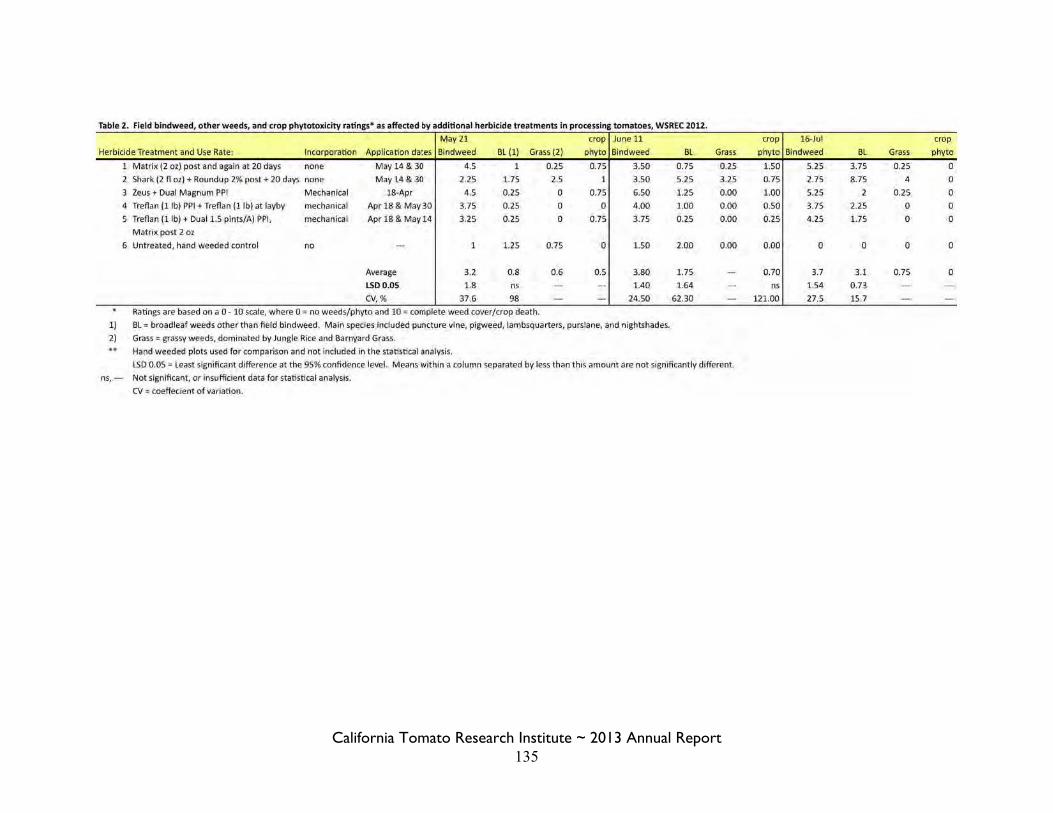
California Tomato Research Institute ~ 2013 Annual Report 135
Table 2 Field bindweed other weeds and crop phytotoxicity ratings• as affected by additional herbicide treatments in processing tomatoes WSREC 2012 . . May-.21 ClOP June ll
Herbfcjde Treatment and Use Rate! lnqlrporabon fl,ppllcation da:es Bin~weed BL (1) G@SS 12) Plwfo Bindweed
1)
2) ..
1 Matrix (2 oz) post and again at 20 days none May14 & 30 4.5 1 0 .25 0.75 3.50
2 Shark (2 f1 oz) + Roundup 2'1(. post+ 20 days none May 14 &30 2.25 1.75 2..5 1 3.50
3 Zeus + Dual Magnum PPI Mechanical 18-Apr 4.5 0.25 0 0.75 6.50
4 Tteflan (l ib) PPI + Treflan (lib) at layby mechanical Apr 18·& May30 3.75 0 .25 0 0 4.00
5 Treflan (l ib) + Dual 1.5 pints/A) PPI, mechanical Apr 18 & May 14 3."25 0 .25 0 0.75 3.75
Matrix post 2 oz
6 Untreated, hand weeded control no - 1 1.25 0 .75 0 1.50
Average 3.2 0.8 0.6 0.5 3.80
LSDO.OS 1.8 ns - -· 1.40
CV, % 37.6 98 - - 24.50
Ranngs are based on a o- 10 sca le, where o: no weedsfphyto and 10: complete weed cover/crop death.
BL = broadleaf weeds other than field bindweed. Main specfeslncluded puncture v ine, pigweetl, lambsquarters, purslane, and nightshades.
Grass " grassy weeds, dominated by Jungle Rice and Barnyard Grass.
Hand weeded plots used for comparison and not Included in the statistical analysis .
Bl
0.75
5.25
1.25
1.00
0 .25
2.00
1.75
1:64
62.30
Grass
0.25
3.25
0 .00
0.00
o.oo
0.00
---
ns ... -
LSD 0.05 = Least significant difference at 1he 95% confidence level. Means within a column sepafated by less ttlan this amourlt are not significantly different
Not significant, or fnsu fficlent data for statistica l analysls.
CV = toeffeclent of variation.
crop 16:::Jul crop
phyto Bindweed BL Grass PI'\Yto
1.50 5.25 3.75 0.25 0
0.75 2.75 8.75 4 0
1.00 5.25 2 0.25 0
0.50 3.75 2.25 0 0
0 .25 4.25 1.75 0 0
0.00 0 0 0 0
0.70 3.7 3.1 0.75 0
ns 1.54 0.73 - -121.00 27.5 15.7 - -
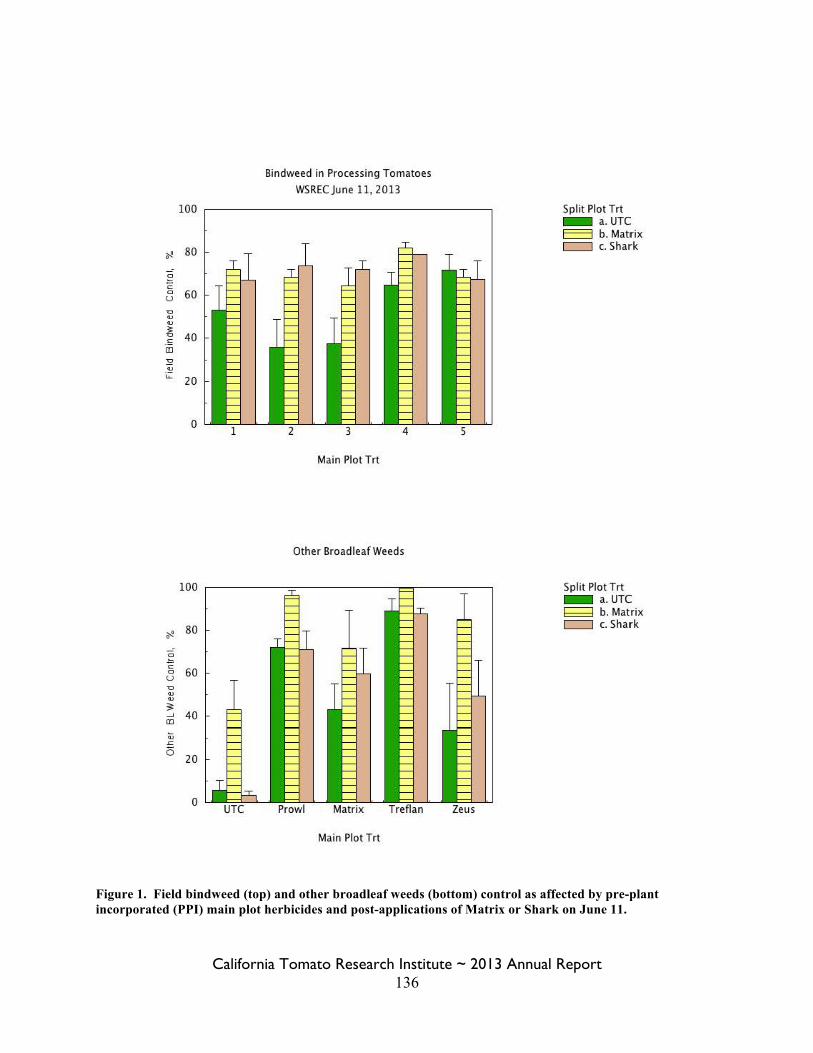
California Tomato Research Institute ~ 2013 Annual Report 136
Figure 1. Field bindweed (top) and other broadleaf weeds (bottom) control as affected by pre-plant incorporated (PPI) main plot herbicides and post-applications of Matrix or Shark on June 11.
~ 80
2 c 3 60
" <1.) <1.)
~
.~ 40 ID
<1.)
;;:: 20
0
100
~ 80
2 c 60 0
u
" <1.) <1.)
:;:: ...J 40 ID
<; s::::
i5 20
0
Bindweed in Processing Tomatoes
WSREC June 11, 2013
Main Plot Trt
Other Broad leaf Weeds
Main Plot Trt
Split Plot Trt - a. UTC E:::J b. Matrix c=:::J c. Shark
Split Plot Trt - a. UTC ~ b.Matrix c=:::J c. Shark
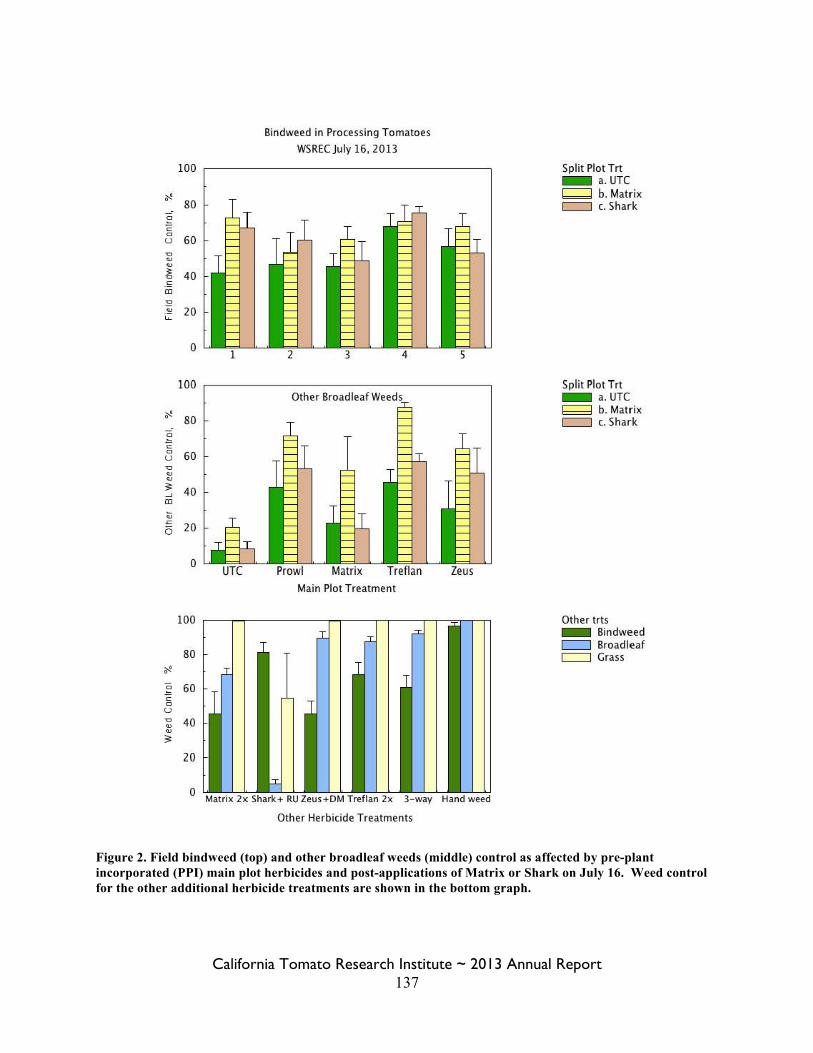
California Tomato Research Institute ~ 2013 Annual Report 137
Figure 2. Field bindweed (top) and other broadleaf weeds (middle) control as affected by pre-plant incorporated (PPI) main plot herbicides and post-applications of Matrix or Shark on July 16. Weed control for the other additional herbicide treatments are shown in the bottom graph.
~
2 c
100
80
0 u 60
"' ., ., ~ 40 .s CD
~ 20
0
100
~ 80
2 c 3 60
"' ., ., ~ 40 CD
v 6 20
0
100
80 ~
2 60 c 0 u
"' 40 ., ., 3:
20
0
,I
'---'--- '---
Bindweed in Processing Tomatoes
WSRECJuly 16, 2013
Other Broad leaf Weeds
Main Plot Treatment
,I ,.I ,.:r.
.:r: -'--- '--- '--- - .__ -'--- '--- - '---
Matrix 2x Shark+ RU Zeus+DM Treflan 2x 3-way Hand weed
Other Herbicide Treatments
Split Plot Trt
- a.UTC b:d b. Matrix c=:::J c. Shark
Split Plot Trt
- a.UTC ~ b.Matrix c=:::J c. Shark
Other trts - Bindweed c=:::J Broadleaf c=:::J Grass