2012 survey of america’s college students · these are among the highlights of this year’s...
TRANSCRIPT

22001122 SSuurrvveeyy OOff AAmmeerriiccaa’’ss
CCoolllleeggee SSttuuddeennttss
Conducted On Behalf Of:
The Panetta Institute For Public Policy
By Hart Research Associates
April 2012
Hart Research Associates
1724 Connecticut Avenue, NW
Washington, D.C. 20009
202-234-5570

Hart Research Associates
Page 1
Table Of Contents
I. Introduction ......................................................................... 2
� Methodology ....................................................................... 3
II. The State Of The Nation And Issue Agenda .......................... 4
� News Sources And Attentiveness ........................................... 6
� Focus On Domestic Issues ..................................................... 7
� International Issues ............................................................. 8
� Social Issues ....................................................................... 9
� Health Care ......................................................................... 11
� The Economy And Jobs ......................................................... 12
III. Attitudes Toward Political Leadership And Political Parties . 14
IV. 2012 Elections ..................................................................... 18
V. Employment Opportunities And Public Service ..................... 23
VI. Assessment Of Education ..................................................... 25
VII. Social Networking And Personal Information ...................... 26

Hart Research Associates
Page 2
I. Introduction
This report analyzes the findings of a survey among American college students
conducted by Hart Research Associates for the Panetta Institute for Public Policy.
Since 2001, the Panetta Institute has sponsored a yearly survey among U.S.
college students that yields invaluable insights into their opinions. Because of the
research’s continuity and depth, it truly is one of the best barometers for measuring
college students’ attitudes. Hart Research is honored to have conducted this
important research on behalf of the Panetta Institute, and we present the results in
this summary of key findings.
The 2012 Panetta Institute survey explores a wide range of issues, including
college students’ feelings about the current direction of the country as well as their
feelings about the future, ratings of President Obama, an assessment of the
country’s political leadership and the 2012 elections, how closely college students
follow the issues of the day, the state of the economy and students’ job prospects,
social networking usage and related privacy concerns, and interest in public service.
These are among the highlights of this year’s study:
� College students have become a little more optimistic about the direction of the country from last year. While more students still believe that the country
is off on the wrong track (46%) than headed in the right direction (43%), the margin is smaller than in 2011 when 50% said wrong track and 37% said
right direction.
� Students continue to view the economy largely in negative terms, with 79% stating that the nation’s economy is not so good (61%) or poor (18%) and
only 21% saying that the economy is excellent or good. This is an improvement from last year’s outlook (85% not so good/poor, 15%
excellent/good), but students still have a bleak outlook.
� The economy is the most important issue for students in terms of the presidential election, with 43% saying this is the case, followed by domestic
issues (35%), social issues (17%), and international issues (4%).
� Satisfaction with the quality of the country’s political leadership has declined
since 2011, with only 47% of students saying they are satisfied and 51% saying they are dissatisfied. In 2011 a majority were satisfied (56%) and 41% were dissatisfied.
� Related, students are paying less attention to the 2012 presidential campaign (66% a lot of some attention) than they did in either 2008 (82%) or 2004
(76%). And college students are less likely to be active currently in a presidential campaign than they were at this time in 2008 (7% compared with 16%).

Hart Research Associates
Page 3
� A majority (52%) of college students believe that the country needs a third political party. And 38% of college students identify with either the Occupy
Wall Street or Tea Party movement.
� Barack Obama continues to receive strong support from college students
both personally and professionally. Fully 57% of college students have positive personal feelings toward the president and 24% have negative feelings toward him. And 67% approve of the job that Barack Obama is
doing as president.
� On the other hand, the Republican primary has had a negative impact on the
Republican Party as 50% of college students say it has made them feel less favorable toward the Republican Party and 9% say it has made them feel more favorable toward it. And the four Republican challengers all are viewed
more negatively than positively by college students, including the presumptive nominee, Mitt Romney (21% positive, 42% negative).
� Obama leads Romney in a general election matchup by 58% to 25%, which is on par with Obama’s lead against John McCain in the 2008 Panetta Institute survey (59% to 27%).
� The proportion of students who rely on Internet news Web sites to receive most of their information about politics and civic affairs continues to
increase, as 59% now say this the case, up from 54% in 2011, and up from 29% in 2001, the first time this was measured. Conversely, in 2001 21% of
college students reported that they received most of their information from community or city newspapers and now this is down to 8%.
� Students also rely on the Internet, specifically social networking Web sites,
as a major source of keeping up with friends and family (69%). Many also rely on social networking sites to stay informed about events and activities
sponsored by organizations (24%) and receiving information about politics and civic affairs (12%).
� Despite their reliance on the Internet and social media Web sites, many
college students are concerned about how much information is available about themselves on the Internet (49% worry about this).
� And college students are divided about whether the information about them that is available online should be a consideration for employers and universities to use as part of an application review process (49% should be a
consideration, 49% should not be a consideration).
Methodology: In an effort to reach a fully representative sample of college
students, the survey’s methodology consists of interviews conducted by telephone
and online. Hart Research interviewed college students using traditional telephone
interviewing based on list samples of college students at four-year higher-learning
institutions nationwide. This list included a considerable number of cell phone
numbers; we reached more than half the telephone respondents on their cell
phone. In addition, Hart Research contracted with an online survey vendor to

Hart Research Associates
Page 4
administer an identical survey to a sample of people currently enrolled in some type
of post-secondary institution drawn from the vendor’s multi-million-member
respondent panel. In the online survey, screening questions limited participation to
students enrolled in a four-year higher-learning institution. A total of 806
interviews were completed. All interviews, whether by phone or online, were
conducted from March 27 to April 3, 2012. Some demographics were weighted in
each sample to achieve representative samples of four-year college students
nationwide. The margin of error is ±3.5 percentage points for the overall sample
and is higher for specific subgroups.
II. State Of The Nation And The Issue Agenda
Overall, college students have become more optimistic about the direction of the
country since last year, but attitudes are mixed. Taking a longer term view about
the future, students have become more pessimistic about the country and more
concerned about what the future will bring compared with last year. Students are
much more optimistic about their future than the country’s future.
Today, 43% of college students say that things in the country generally are
headed in the right direction whereas 46% feel that things are off on the wrong
track. The proportion who says things are headed in the right direction has
increased from last year’s survey (37% right direction, 50% wrong track). Not only
are college students more positive about the direction of the country than they
were last year, but they also are more sanguine about where the country is headed
compared with all adults, among whom just 33% say that the country is headed in
the right direction and 59% say wrong track.1 Attitudes toward President Obama
and the economy do color perceptions of the country’s direction. Among Democrats,
55% say that things are headed in the right direction, 36% wrong track, whereas
both independents (35% right direction, 49% wrong track) and Republicans (31%,
59%) offer a more negative than positive assessment. For those who say that the
economy is excellent or good, they believe that the country is headed in the right
direction by three to one (66% right direction, 21% wrong track). Results are more
mixed among college students who say that the economy is not so good (41% right
1 NBC News/Wall Street Journal poll conducted April 13-17, 2012

Hart Research Associates
Page 5
direction, 49% wrong track), and a negative outlook of the country’s direction is
provided by those who describe the economy as poor (27%, 63%).
Direction Of The Nation
43%
37%
53%
40%
43%
33%29%
32%
55%
46%50%
39%35%
47%50%
53%
38%
42%
2004 2005 2006 2007 2008 2009 2010 2011 2012
Right direction Wrong track
Although students’ outlook on the country’s direction has improved since last
year, their attitudes about the country’s future have declined from 32% who said
that they were confident and secure about the country’s future in 2011 to 24% in
this year’s survey who say the same, which also is the lowest proportion that we
have recorded on this measure. Among those with larger declines in confidence
from last year are men (from 38% to 24%) and Republicans (from 25% to 14%).
When asked to focus on their own future, college students are much more
optimistic (49% confident/secure, 47% uncertain/concerned). Underclassmen are
more confident than upperclassmen: freshman (53% confident/secure, 40%
uncertain/concerned), sophomores (54%, 44%), juniors (46%, 51%), and seniors
(44%, 53%). And students’ economic ratings do color perceptions of their future
outlook. For those who believe that the economy is excellent or good, 67% are
more confident and secure about their future, 29% more uncertain and concerned;
those who say the economy is not so good feel mixed (49%, 48%) and those who
rate the economy as poor are pessimistic about their future (34%, 62%).

Hart Research Associates
Page 6
News Sources And Attentiveness
The Internet, and specifically news Web sites, has become the predominant source
for college students to receive information about politics and civic affairs. When it
comes to specific news stories, college students are more closely following coverage
about rising gas prices, the 2012 presidential elections, and the economy.
Going back to the 2001 Panetta Institute survey, just 29% of college
students reported that they turned to Internet news Web sites for information
about politics and civic affairs and today that proportion is 59%. Although
television had been on par with the Internet for several years, it is now decidedly a
second source for students at 38%. Family and friends have held relatively steady
as the third most common news source (28%). And for the first year, Internet
blogs have surpassed community or city newspapers as a news source (10% to
8%). Whereas the Internet has increased dramatically as a news source over the
course of the survey’s history, newspapers have declined significantly.
Source Of Information On Politics And Civic Affairs
52%
55%
37%
25%
26%
29%
54%
59%
51%
46%
61%
40% 48%51%
42%
38%
8%
12%10%
13%
20%
26%
25%
21%
2001 2002 2004 2006 2009 2010 2011 2012
Internet Television Community or city newspaper
When it comes to news stories, college students are most likely to follow the rising
price of gas (68% following very/fairly closely), the candidates in the 2012
presidential elections (61%), and the condition of the U.S. economy (60%). As is
the case in general, students are more likely to follow domestic stories than
international ones—with Iran’s nuclear program (45%), Afghanistan (41%), and
Syria (35%) further down the list. In general, students are not as likely to follow

Hart Research Associates
Page 7
stories closely compared with adults, for example, whereas 60% of students are
following the economy closely 75% of adults are doing so. However, college
students are following the 2012 presidential elections more closely than are adults
(61% to 59%).2 Seniors are more likely to follow the condition of the U.S.
economy compared with just 51% for freshman. And women are more likely than
men to closely follow the debate over insurance for birth control (57% to 42%).
Following News Stories
12%
14%
20%
13%
20%
26% 68%
Very closely Somewhat closely
50%
45%
41%
Rising price of oil and gas
Candidates in 2012 presidential elections
Condition of the U.S. economy
Insurance coverage for birth control
Potential military action against Iran over its
nuclear program
Current situation and events in Afghanistan
61%
60%
Focus On Domestic Issues
The previous results reveal that college students are more closely following
domestic news stories than international ones; and college students also continue
to believe that the problems that their generation will face are more national rather
than international in scope. Students identify economic issues as the most
important issue to them in determining their vote in the presidential elections.
Three in five (60%) college students say that most of the problems faced by
their generation will be national compared with just 36% who say international.
And this is relatively unchanged from recent surveys. In 2007, 44% of college
students cited international problems while 47% believed their generation’s
problems would be national in nature. Since that survey, roughly three in five
students believe problems for their generation will be national.
2 Pew poll conducted March 15-18, 2012.

Hart Research Associates
Page 8
The economy and jobs is the issue that is most important to college students
in determining their vote in the presidential election (43% select this option).
Domestic issues such as health and education rank in second place (35%), with
social issues such as gay rights and abortion (17%) and foreign policy issues such
as Iran and Afghanistan (4%) much further down the list. Significant partisan
differences exist, with Republicans and independents much more interested in
economic issues whereas Democrats are more focused on domestic issues. And
business majors are much more focused on economic issues than are other college
students. To underscore the fact that college students are much more interested in
domestic than foreign policy issues, even among those who say their generation will
face more international than national problems, just 9% mention foreign policy as
the most important type of issue for them in choosing between presidential
candidates.
Most Important Issues in Choosing Candidate
All
College
Students
%
Demo-
crats
%
Indep-
endents
%
Repub
-licans
%
Social
Sciences
%
Human-
ities
%
Science/
Math/CS
%
Business
%
Economic issues,
such as jobs and
economic growth
43 33 45 58 32 38 44 59
Domestic issues,
such as health and
education
35 41 35 23 36 36 38 20
Social issues, such
as gay rights and
abortion
17 23 12 11 25 23 13 15
Foreign policy issues,
such as Iran and
Afghanistan
4 3 5 7 6 2 4 5
International Issues
Despite recent events in Afghanistan, students are more likely to believe that the
war has been successful. Students are more likely to say that the United States
should not initiate military action in Iran. And when considering American
involvement with the recent uprisings in Arab countries, college students prefer that
we maintain our current level of involvement, though are much more likely to
prefer that we become less involved rather than more involved.
Hart Research Associates
Page 9
By 50% to 44% college students believe that the United States should not
initiate military action if Iran continues its nuclear research and is close to
developing a nuclear weapon. In a recent poll among adults, Americans support
military action by 52% to 40%.3 Among college students, Democrats are much
more likely to oppose military action (32% initiate, 63% should not initiate),
whereas independents show a slight preference for military action (47%, 44%), and
Republicans strongly support military action (62%, 35%). While a majority of
women oppose military action (41%, 52%), men are more evenly divided (47%,
49%).
A majority (54%) of college students now say that the war in Afghanistan
against the Taliban and Al Qaeda has been successful, with 42% saying it has been
unsuccessful. The proportion who says the war has been successful has increased
by 10 points from the Panetta Institute’s 2011 survey (44% successful, 55%
unsuccessful). The proportion of women who feel that the war has been successful
has increased by 14 points (37% to 51%) and Democrats have recorded a 16-point
increase (31% to 47%) on this measure.
A slim majority (51%) of college students want the United States to maintain
its current level of involvement with uprisings in Syria, Libya, Egypt, and other Arab
countries. However, students are four times more likely to want the United States
to become less involved than more involved (37% to 9%).
Social Issues
Student attitudes remain largely unchanged from last year’s survey on both
abortion and same-sex marriage, with large majorities supporting both keeping
abortion legal and allowing same-sex marriage.
Two in three (67%) college students say that abortion should be legal in all
(29%) or most cases (38%), with 32% feeling that abortion should be illegal in
most (22%) or all cases (10%). Both men (68% legal, 31% illegal) and women
(66%, 34%) largely support legal abortion. Students who attend a public
institution (69%) are more likely than those that attend a private school (59%) to
believe that abortion should be legal. Partisan and ideological divisions exist on
abortion, with Democrats (82%, 18%) and liberals (86%, 14%) favoring legal
3 NBC News/WSJ poll conducted February 29-March 3, 2012.

Hart Research Associates
Page 10
abortion and independents (60%, 39%) and moderates (65%, 34%) also more
likely to favor legal abortion, but Republicans (48%, 51%) and conservatives (38%,
60%) are much less supportive.
Position On Abortion
58% 60%
67% 67%
32%
40%36%
32%
Legal in all/most cases Illegal in all/most cases
2005 2011 2010
+18 +24
+35 +35
2012
College students also continue to strongly support same-sex marriage (75%
favor, 22% oppose). These results are holding stable from last year (74% favor,
24% oppose). We again see partisan and ideological cleavages on this measure
with overwhelming support for same-sex marriage among Democrats and liberals
(90% favor, 9% oppose; 93%, 6% respectively) and independents and moderates
(71%, favor, 23% oppose; 75% favor, 20% oppose), with a more mixed rating
among Republicans and conservatives (52% favor, 43% oppose; 43% favor, 53%
oppose).

Hart Research Associates
Page 11
Views Of Same-Sex Marriage
52%
60%
75%74%
65%
25%
38%35%
22%24%
Favor same-sex marriage Oppose same-sex marriage
2004 2010 2005
+50
2011
+40
+25
+14
+53
2012
Health Care
While the Supreme Court’s ruling on President Obama’s health care legislation
looms, on campus there still is widespread support for health care reform and
opposition to repealing the law.
Three in five (61%) college students say it is a good thing that Congress
passed the health care bill, with 33% who say it is a bad thing. This margin is
relatively unchanged from the 2011 result (59% good thing, 35% bad thing). This
is another issue for which major partisan and ideological differences exist, with
strong majorities of Democrats (86% good thing, 9% bad thing) and liberals (85%,
11%) saying that it is a good thing that Congress passed the health care legislation
and with majorities of independents (57%, 35%) and moderates (57%, 36%) also
approving, whereas Republicans (23%, 71%) and conservatives (31%, 65%)
largely are of the opinion that the health care bill’s passage is a bad thing.
Majorities of college students also do not want to see the health care law
repealed—by 59% to 33% students want the law kept as it is—and this is a stable
result from last year’s survey (55%, 38%). There also are similar partisan and
ideological variations on this measure—Democrats (83% keep, 11% repeal) and
liberals (79%, 14%), and independents (55%, 35%) and moderates (59%, 34%)

Hart Research Associates
Page 12
prefer the legislation kept as is with Republicans (20%, 70%) and conservatives
(25%, 65%) firmly on the side of repealing the legislation.
The Economy And Jobs
While other issues may have their day during the presidential campaign, it is
extremely likely that for many college students and Americans, this election will
come down to the economy.
College students continue to have a negative outlook on the nation’s
economy, though impressions have improved somewhat since last year’s survey.
Currently 21% describe the economy as excellent or good, up from just 15% in
2011. Still, students’ evaluation of the economy remains quite low, as 79% say the
economy is not so good or poor. And the downturn is particularly striking when
looking back at the data prior to the great recession. In 2006 54% of college
students offered an excellent or good rating of the economy whereas 45% said the
nation’s economy was not so good or poor.
State Of The Economy
21%15%
6%14%
54%51%
40%
17%
79%
58%
47% 45%
85%
94%
83% 85%
2004 2005 2006 2007 2008 2009 2010 2011 2012
Excellent/good Not so good/poor
Economic fairness also is a concern for many college students, as 50% say
that the U.S. economic system is unfair and 45% believe that it is fair. This
assessment mirrors attitudes among adults nationally (45% fair, 49% unfair).4
4 Gallup poll conducted January 2012.

Hart Research Associates
Page 13
There are significant divisions on this question and this debate likely will be a
significant part of the 2012 presidential campaign, with majorities of Democrats,
independents, and Obama voters feeling that the economic system is unfair while
Republicans and Romney voters believe the system is fair. Male students and
college students who say they come from an upper or upper-middle-class
upbringing are more likely to say the economy is fair but women and middle- and
lower/lower-middle-class students are more likely to say the economy is unfair.
Is the U.S. Economic System Fair?
Fair
%
Unfair
%
All students 45 50
Democrats 41 56
Independents 40 52
Republicans 56 38
Upper/upper-middle 57 35
Middle 43 53
Lower/lower-middle 33 63
Obama voters 41 55
Romney voters 56 40
Men 51 45
Women 39 55
Despite concerns about the economy, college students continue to prefer
reducing the budget deficit to spending to help the economy recover by 62% to
35%. This is nearly unchanged from last year’s survey (36%, 62%). And while the
results are more mixed among Democrats, majorities across partisan lines prefer
reducing the deficit―Democrats (53%), independents (58%), and Republicans
(79%). While business majors are more likely to be Republican, they look more
like Democrats on this issue, with 45% feeling that a greater priority should be
placed on spending to help the economy recover and 51% say reducing the budget
deficit.
In addition to a review of major issues of the day, college students also were
presented with two questions to gauge their perspective on government
involvement in cultural and economic issues. In cultural terms, students believe
that government is too involved while in economic matters, students want to see
government more involved.
Nearly two in three (65%) college students worry that government is getting
too involved in the issue of morality while 33% say that government should do

Hart Research Associates
Page 14
more to promote morality in society. There is no partisan division on this cultural
assessment as Democrats (64% government too involved), independents (66%),
and Republicans (66%) all find common ground here.
However when it comes to economic matters, a slim majority of college
students (54%) believe that we need a strong government to handle today’s
complex economic problems while 40% take the other side that states the free
market can handle today’s complex economic problems without government being
involved. And the partisan unity dissipates on economic concerns as majorities of
Democrats (68%) and independents (52%) agree that we need a strong
government to handle economic problems while 63% of Republicans take the free
market position.
What emerges from these two questions is a significant strain of libertarian
attitudes among college students. In fact, three in 10 (30%) students take both
libertarian positions on the economic and cultural statements. These libertarians
are more likely to be Republican than the overall sample (45% compared with 28%
overall) as well as white (72% compared with 65%). They are more likely to
believe that the country is headed off on the wrong track (56% to 46%) and are
net negative to all political figures with the exception of Ron Paul, who receives a
34% positive, 25% negative among these libertarian students. Even though nearly
half are Republican, they only vote for Romney over Obama in the general election
by 42% to 36%. In the Republican primary they divided their vote between
Romney and Paul (31% to 30%). They believe that passage of the health care bill
is a bad idea by 54% to 43%, but 64% say that abortion should be legal and 72%
support same-sex marriage.
III. Attitudes Toward Political Leadership And Political
Parties
As we approach the beginning stages of the 2012 general election campaign, for
the first time since 2008 a majority of America’s college students are dissatisfied
with the country’s political leadership. Students continue to provide Barack Obama
with largely favorable personal and professional ratings, but offer negative
evaluations of the Republican primary field. College students are less likely to say

Hart Research Associates
Page 15
that politics is relevant in their lives and a majority supports the creation of a third
party.
While 47% of college students say that they are satisfied with the country’s
political leadership, 51% now say that they are dissatisfied. And this marks a
significant shift from 2011 when 56% said they were satisfied and 41% were
dissatisfied. The level of satisfaction among sophomores (from 60% satisfied to
43%) and those majoring in social sciences (60% to 46%) has declined further
than among all college students. What should be particularly concerning for both
parties is that the middle of the electorate and key subgroups have recorded larger
decreases in satisfaction than the rest of college students:
� Independents are down 16 points (from 54% to 40%);
� Moderates are down 12 points (from 58% to 46%);
� Midwestern college students are down 14 points (from 62% to 48%);
� And Hispanics are down 16 points (from 63% to 47%).
Satisfaction With The Country’’’’s Political Leadership
47%
56%56%
73%
38%38%
68%
48%54%
45%
51%
41%
61%
43%
25%
59%
54%
45%48%
30%
2001 2002 2003 2004 2005 2006 2007 2008 2009 2010 2011 2012
Satisfied Dissatisfied
In looking at specific political figures, college students continue to have strongly
positive personal feelings toward Barack Obama (57% positive, 24% negative).
And while college students are a Democratic-leaning group in general, it should

Hart Research Associates
Page 16
concern Republicans that at the time of the survey their four remaining presidential
candidates all had net-negative personal ratings among college students, including
Mitt Romney, who is two to one negative (21% positive, 42% negative), Rick
Santorum (11%, 51%), Newt Gingrich (6%, 52%), and Ron Paul (25%, 29%).
While Obama does fare much better than his potential Republican
challengers, his personal ratings among college students have declined from 2008,
prior to his election, from 64% positive, 16% negative to 57% positive, 24%
negative. Still, 67% of college students approve of the job that Barack Obama is
doing as president whereas 29% disapprove. This is a slight improvement from last
year’s survey (65% approve, 31% disapprove). And Obama’s standing among
college students is far better than it is among all Americans, among whom 49%
approve, 46% disapprove of the job that he is doing.5 Nine in 10 (90%) Democrats
approve of the job that Obama is doing as president along with 63% of
independents, while just 30% of Republicans approve.
Feelings Toward Political Figures
6%
26%
29%
35%
2%
9%
1%
20%
11%
13%
Very positive Somewhat positive
Very negative Somewhat negative
Barack Obama
Ron Paul
Mitt Romney
Rick Santorum
Newt Gingrich
57%
24%
25%
29%
21%
42%
11%
51%
6%
52%
Obama April 2008:
64% positive 16% negative
Today, only half (50%) of American college students say that politics is very
(18%) or fairly relevant (32%) in their life while 50% say politics is just somewhat
(38%) or not at all relevant (12%). This is a new low and a significant decline in
5 NBC News/Wall Street Journal poll conducted April 13-17, 2012.

Hart Research Associates
Page 17
relevance from the last time this question was asked in 2006 (59% relevant, 41%
just somewhat/not relevant at all).
Given the decline in satisfaction with the country’s political leadership and
relevance of politics in their life, as well as the low personal ratings for the
Republican field, it is not surprising that a majority of college students (52%) say
that the country needs a third political party in addition to the Democratic and
Republican parties. Independents (63%) and moderates (59%) are more likely to
say that the country needs a third political party. Students who identify themselves
as supporters of the Occupy Wall Street movement also are more likely to feel this
way (61%). And men (58%) are more likely than women (47%) to feel the need
for a third party.
Not only is there strong support for a third party among college students, but
38% consider themselves to be a supporter of the Occupy Wall Street movement or
Tea Party movement, which demonstrates that a significant proportion of college
students are trying to engage in issues outside of the two-party system. Overall,
28% of college students identify with the Occupy Wall Street movement. OWS
supporters are much more likely to be Democrats (44%) than independents (23%)
or Republicans (7%). On the other hand, 12% of college students identify as
supporters of the Tea Party movement, which is down somewhat from 16% in last
year’s survey. Republicans (23%) are more likely to be Tea Partiers than are
independents or Democrats (8% respectively).
Regardless of a downturn in satisfaction with the country’s political
leadership, college students remain a Democratic-leaning group, with 48%
identifying as Democrats, 24% as independents, and 28% as Republicans.
Students are asked to select which party would do a better job on seven issues and
Democrats hold significant advantages on four of the seven issues, including
women’s rights (+54), the environment (+48), college affordability (+38), and
health care (+30). On only one issue, defense and national security, does the
Republican Party hold a significant advantage (+22). However, there are two
issues where attitudes are divided and one of these is the most important issue
facing the country—jobs and the economy, where students favor the Democratic
Party by only 33% to 30%. There also is a mixed result on taxes—36% say the
Democratic Party would be better, 34% say the Republican Party.

Hart Research Associates
Page 18
Which Party Is Better On These Issues?
41%
30%
34%
12%
22%
10%
7%
19%
36%
50%
52%
58%
61%
33%
Women’s rights
The environment
Health care
College affordability
Taxes
Jobs and the economy
Defense and national security
Democratic Party Republican Party
IV. 2012 Elections
College students are paying less attention to the presidential campaign than they
were in either 2008 or 2004 and fewer students report that they are active or plan
to become involved in a campaign. The Republican primary has hurt the party far
more than it has helped the party’s image, and while Mitt Romney leads the race
against the other Republican candidates, as many eligible Republican primary
voters are undecided as support the former governor of Massachusetts. In the
general election, Barack Obama holds a large lead over Mitt Romney, which is on
par with his advantage over John McCain in 2008. Democrats have expanded their
lead in the congressional elections from a low point in the 2010 mid-terms and now
hold a 20-point advantage over Republicans.
Not only are college students less satisfied with the country’s political
leadership and relevance of politics in their life, but they also are paying less
attention to the presidential campaign than they did in either 2008 or 2004. Given
the historic nature of the 2008 campaign, it is not surprising that college students
are less engaged than they were four years ago, but it is concerning that students
are paying less attention to the campaign than they did in 2004. Today, 66% of
college students say they are paying a lot or some attention to the campaign

Hart Research Associates
Page 19
compared with 82% in 2008 and 76% in 2004. Despite the fact that there has
been a high-profile Republican primary, Democrats are slightly more likely to be
paying attention to the campaign than Republicans (71% to 68%) while
independents are paying less attention (54%). Asian students are much less likely
to be paying attention than are other students (47%). And women are more likely
to be following the campaign less closely than 2008 than other students, as their
attention has dropped from 82% in 2008 to 61% now.
Attention On Presidential Campaign
22%29%
19%
10%4% 3%
76%
24%
2004
How much attention have you been paying to the presidential campaign?
A lot of attention Some attention Not much attention No attention
2008 2012
82%
18%
66%
34%
Fewer college students say they have become active in a campaign or plan to
do so compared with 2008. The 2008 Panetta Institute survey was conducted at a
similar period of time in the campaign, and back then 16% of college students
already had become active in a campaign and 20% planned to do so. Now just 7%
have become active in a campaign and 21% plan to do so. And even though there
has been a contested Republican primary, Democratic college students are just as
likely to have become involved in a campaign as Republican students (8% and 7%
respectively).
The Republican primary has hurt the party among college students. By 50%
to 9% students say the Republican primary has made them less favorable rather
than more favorable to the party, with 40% saying it has had no impact either way.
Even Republicans are more likely to say that the primary has made them less
favorable rather than more favorable by 29% to 16%.

Hart Research Associates
Page 20
While Mitt Romney now looks to be the Republican nominee, the survey was
conducted during a time when the primary was contested. Among all Republican
and independent students, Romney led the race with 30%, followed by Ron Paul at
23%, Rick Santorum (9%), Newt Gingrich (4%), and 30% undecided, which
underscores the issues with the Republican field. Ron Paul clearly has a following
among some college students as also is demonstrated in his mixed personal
ratings, compared with negative evaluations for the rest of the Republican field.
However, his appeal in the primary is much more from independents than
Republicans. Paul actually leads Romney by 30% to 20% among independents but
loses to Romney by two to one among Republicans only (36% to 18%).
Turning to the general election, Barack Obama holds a 58% to 25% lead
over the presumptive Republican nominee Mitt Romney. This is on par with his lead
against John McCain in the April 2008 Panetta Institute survey (Obama 59%,
McCain 27%). And as the following table illustrates, the breakdown among key
subgroups today against Romney looks very similar to Obama’s margins in 2008
against McCain, though Obama is trailing his 2008 margin among Hispanics and
business majors. However, among the key group of independents, Obama is
overperforming his 2008 margin.
Presidential Trial Heats By Subgroup
Obama
%
McCain
%
Obama
%
Romney
%
All students 59 27 58 25
Men 58 29 58 26
Women 60 25 57 24
Northeast 64 21 65 21
South 62 24 56 25
Midwest 53 34 51 31
West 57 27 60 22
Whites 51 33 51 32
Hispanics 79 19 62 16
African Americans 87 4 82 5
Asians 68 17 69 8
Social sciences 65 27 57 26
Humanities 62 22 61 22
Science/math/CS 57 30 58 24
Business 60 26 49 30
Democrats 87 6 88 4
Independents 49 26 52 13
Republicans 15 68 10 70

Hart Research Associates
Page 21
Looking at the congressional elections, Democrats hold a 20-point advantage
over Republicans among college students. This marks a significant improvement in
Democrats’ margin from a low-point in 2010 when Democrats held just a 12-point
lead with students.
34%
46%49%
44%
32%
27%
20%
29%
Preference In Congressional Elections
2002 2012
Will vote for Democrat Will vote for Republican
2006 2010
Taking a closer look at the shift from 2010 reveals a number of subgroups
that have returned to the Democratic fold. Most notably, in 2010 men were evenly
split between both parties but are now voting for the Democratic candidate by 44%
to 31%.

Hart Research Associates
Page 22
Congressional Trial Heat By Subgroup
2010
Democrat
%
2010
Republican
%
2012
Democrat
%
2012
Republican
%
All students 44 32 49 29
Men 36 36 44 31
Women 51 29 53 27
Northeast 52 23 57 20
South 39 38 49 32
Midwest 43 38 42 36
West 45 26 49 26
Whites 38 39 41 37
Hispanics 47 25 56 23
African Americans 71 10 81 5
Asians 48 20 51 13
Social sciences 53 27 49 30
Humanities 48 29 56 23
Science/math/CS 38 31 49 29
Business 39 44 39 34
Democrats 78 5 85 2
Independents 24 18 31 18
Republicans 2 85 3 84
School size: Less than 5,000 41 40 51 30
School size: 5,001 to 20,000 46 29 49 33
School size: More than 20,000 45 31 49 28
College students also are asked their reactions on two issues related to the
2012 elections that have not yet become major issues of the campaign but have
the potential to do so.
Super PACs: Two in three (66%) college students believe that Super PACs should not be legal while 29% feel that they should. Strong majorities of
Democrats (74%) and independents (65%) say that Super PACs should NOT be legal while 54% of Republicans agree, but 42% of Republicans do believe that Super PACs should be legal.
Voter ID Laws: Two in three (67%) college students also say that new laws
that tighten voter registration rules and require voters to show valid photo identification are a good thing, with 30% taking the alternative point of view and indicating that these are a bad thing. Fully 89% of Republicans say the
laws are a good thing compared with 65% of independents and 55% of Democrats. Hispanic students are evenly divided about whether these new
laws are a good thing or a bad thing (49% to 49%).

Hart Research Associates
Page 23
V. Employment Opportunities And Public Service
Students remain confident about their ability to find an acceptable job after they
graduate. Upon graduation, students are most interested in working in the private
sector, but many also express high interest in working for government, a not-for-
profit, or teaching. The proportion of students interested in running for public office
remains relatively stable, with significant gender gaps continuing to exist as men
are more likely than are women to say they would want to run for office. And
nearly two in five students report that they would be interested in pursuing a
service-oriented experience upon graduation.
In looking ahead to life after they receive their diploma, despite the
challenging economy and concerns about the future of the country, college students
remain confident in their own ability to succeed. Fully 69% of students are
confident that after they graduate they will be able to find a job that is acceptable
to them.
College students are most interested in working in the private sector (60%
very/fairly interested), though significant proportions also mention high interest in
working in the government (40%), working for a not-for-profit (38%), or teaching
in a public school (27%). Roughly one in 10 (9%) students is very or fairly
interested in serving in the military. As the following table reveals men are more
likely to have interest in working in the private sector while women are more likely
to have interest in working for a not-for-profit. And business majors are more
likely to want to work in the private sector while those majoring in humanities are
much more interested in teaching.
Level Of Interest In Various Careers % Very/Fairly Interested
All
College
Students
%
Men
%
Women
%
Social
Sciences
%
Human-
ities
%
Science/
Math/CS
%
Business
%
Working in the private
sector
60 68 53 57 54 64 71
Working in the government 40 42 38 49 40 40 30
Working for a not-for-profit
community organization or
foundation
38 29 46 49 42 34 31
Teaching in a public school 27 26 29 32 50 22 13
Serving in the military 9 13 6 13 7 8 2

Hart Research Associates
Page 24
Interest in working in government reached a new high in the 2011 survey but
declined by seven points this year. Subgroups with larger declines include
Hispanics (-10 points), men (-11), students in the Northeast (-15), conservatives
(-15), business majors (-19), and Asians (-21).
Interest In Working For Government
40%
47%
34%
41%
29%30%26%
35%
39% 38%42%
2001 2002 2003 2004 2005 2006 2007 2008 2009 2010 2011 2012
Very/fairly interested
One in four (25%) students reports that they are interested in running for a
federal elected office such as a Member of Congress or senator, which is a slight
increase from 29% in last year’s survey. As we have found in previous surveys,
men (37%) are much more likely than women (16%) to be interested.
Three in 10 (30%) college students say they would be interested in running
for a local or state elected office such as city council member or state legislator and
this result is unchanged from last year. The gender gap at the local or state level is
not as large as is found at the federal level, but men (34%) still are more likely to
be interested in running than are women (26%).
Nearly two in five (38%) students have considered pursuing a service-
oriented experience after they complete their undergraduate degree, such as Teach
for America, VISTA, or AmeriCorps. Democrats (44%) are more likely than are
independents (31%) or Republicans (34%) to consider a service-oriented
experience, and those of an upper or upper-middle-class family background also
are more likely to consider this (44%) than middle (39%) or lower to lower-middle-

Hart Research Associates
Page 25
class students (31%). And upperclassmen are much more likely than are
underclassmen to have considered these experiences—freshman (29%),
sophomores (28%), juniors (45%), seniors (48%).
Nearly one in two (47%) college students say that someone has spoken to
them when they were either in high school or college about getting involved in
politics or public service. Democrats (51%) are more likely to say this is the case
than are independents (44%) or Republicans (41%). And men (51%) also are
more likely to say someone talked to them about getting involved in politics or
public service than are women (44%). Lastly, 49% of students who are registered
to vote say this is the case compared with 38% for non-registered students.
And fully 77% of college students say that during their time in college they
have been involved in activities that help the local community.
VI. Assessment Of Education
College students express high levels of satisfaction with the education that they
have received in preparing them for life after graduation. More students report
taking an online class for credit compared with last year’s survey, though the
perception that online courses do not offer the same quality of instruction continues
to be a widely held belief.
The vast majority of students are satisfied with the education that they have
received so far in college in helping them prepare for life after graduation as 86%
report that they are either very (45%) or fairly satisfied (41%). This marks a slight
improvement over last year’s survey when 84% said they were satisfied.
The proportion of students who have taken online classes for credit has
increased from last year and is up from 39% to 43% today. Just 19% of freshman
report taking online classes, but these courses are much more prevalent among
sophomores (42%), juniors (50%), and seniors (58%) and at public institutions
compared with private schools (50% to 21%).
Most students continue to believe that online courses do not offer the same
quality of teaching and learning opportunities as in-person classes (26% offer same
quality, 71% do not offer same quality). In 2011, 21% of college students said
online courses provided the same quality of instruction as in-person classes while
76% disagreed. However, those who have taken an online course are more likely
Hart Research Associates
Page 26
to say that it offers the same quality as an in-person class compared with students
who have not taken an online class (33% to 19%).
VII. Social Networking And Personal Information
Social networking Web sites are a major source of information for students,
particularly when it comes to interacting with friends and family. However, nearly
one in two students worry that there is too much information available about them
online. And college students are divided about whether the publicly available online
information about them should be part of an application review process for their
potential employers or graduate schools. Even so, most students believe that a
review of this information would not make a difference either way for their chances
of receiving a job or being accepted into graduate school, and more are likely to say
this will help their chances rather than hurt them.
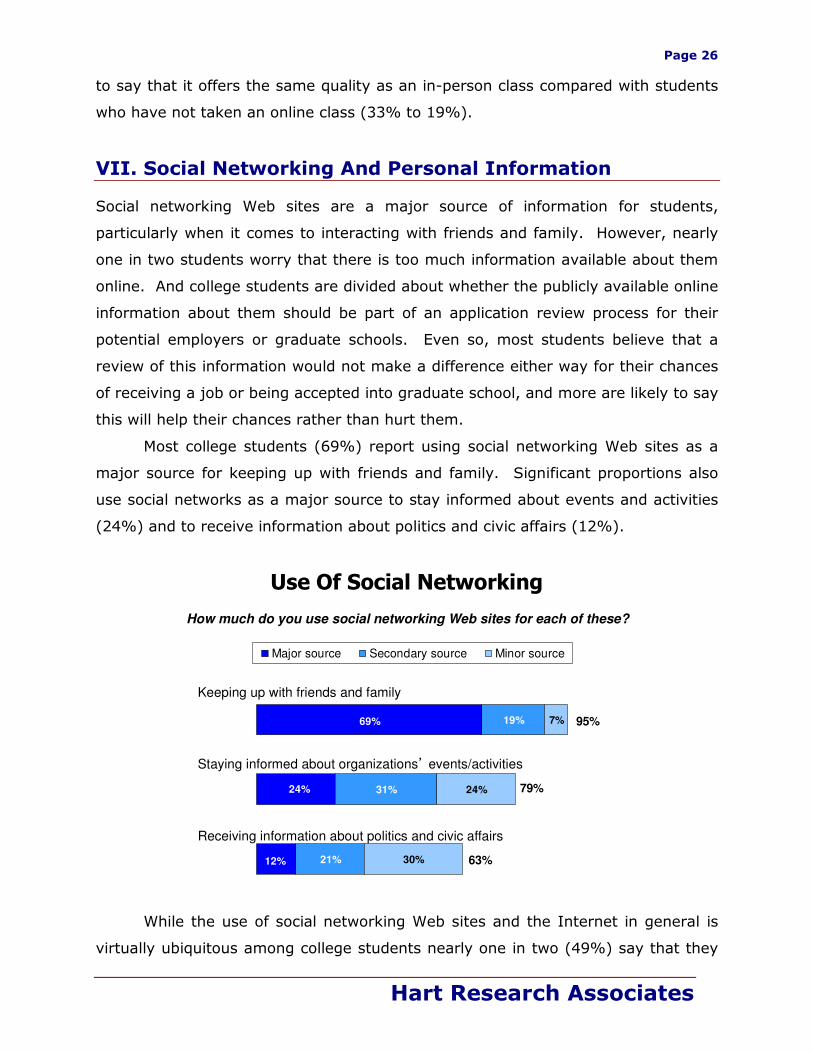
Most college students (69%) report using social networking Web sites as a
major source for keeping up with friends and family. Significant proportions also
use social networks as a major source to stay informed about events and activities
(24%) and to receive information about politics and civic affairs (12%).
Use Of Social Networking
21%
31%
19%
30%
24%
7%
12%
24%
69%
Major source Secondary source Minor source
Keeping up with friends and family
Staying informed about organizations’ events/activities
Receiving information about politics and civic affairs
95%
How much do you use social networking Web sites for each of these?
79%
63%
While the use of social networking Web sites and the Internet in general is
virtually ubiquitous among college students nearly one in two (49%) say that they

Hart Research Associates
Page 27
worry about how much information is available about them on the Internet.
Women particularly are worried about how much information is available about
them (55%) whereas men are less worried about this (41%).
College students are divided about whether employers or universities should
consider applicants’ online activities, such as their Facebook and Twitter accounts,
as well as conducting a Google search, as part of the application process. Students
are divided evenly at 49% who say this should be a consideration and 49% who say
it should not be a consideration. There are significant divisions on this question
across party lines, type of school, as well as between under- and upper-classmen,
with students closer to graduation (and hopefully employment or graduate school)
being less likely to say that a review of online activities should be a consideration.
Should Online Activities Be Considered For Application Process
Yes
%
No
%
All students 49 49
Democrats 43 55
Independents 49 50
Republicans 59 49
Public school 46 52
Private school 59 40
Freshman 57 41
Sophomores 50 49
Juniors 45 54
Seniors 45 53
Despite divisions on whether a review of online activities should be a
consideration, the vast majority of college students say that if a potential employer
or graduate school received their online activity it would not really make a
difference either way when it came to their chances of being hired or accepted. In
fact, 74% say a consideration of their online activities would make no difference
and students are more likely to say that a review would help their chances rather
than hurt them by 17% to 8%.