2012 natural gas market outlook
TRANSCRIPT
© 2005 San Diego Gas and Electric and Southern California Gas Company. All copyright and trademark rights reserved
This information is provided solely for informational purposes. Although Southern California Gas Co. (SoCalGas) has used reasonable
efforts to assure its accuracy, no representation is made that the contents are free from error or suitable for use for any particular purpose.
SoCalGas assumes no responsibility for use of, or reliance on, this information by any party, and specifically advise such parties to discuss
any decisions or actions related hereto with their own advisors and experts.
2012 NATURAL GAS MARKET OUTLOOK
Marjorie Schmidt-Pines, Principal Regulatory Economic Advisor
Southern California Gas Company and SDG&E
Regulatory Affairs
January, 2012

2
Natural Gas Outlook
•U.S. shale gas resources drive increases U.S. production, lower prices, economic growth and lower imports of natural gas
•Industrial and electric power use drives future demand growth
•Non-hydro renewables and natural gas are the fastest growing electricity generation sources
•Natural gas prices expected to continue to be low in 2012 due to mild winter and an expanded shale gas resource base

2001 to 2011 – A decade makes a difference
3 Source: LDC Forum, Exxon Mobil,, October, 2011

Factors impacting Natural Gas Growth
4 Source: LDC Forum, Exxon Mobil, October, 2011
5
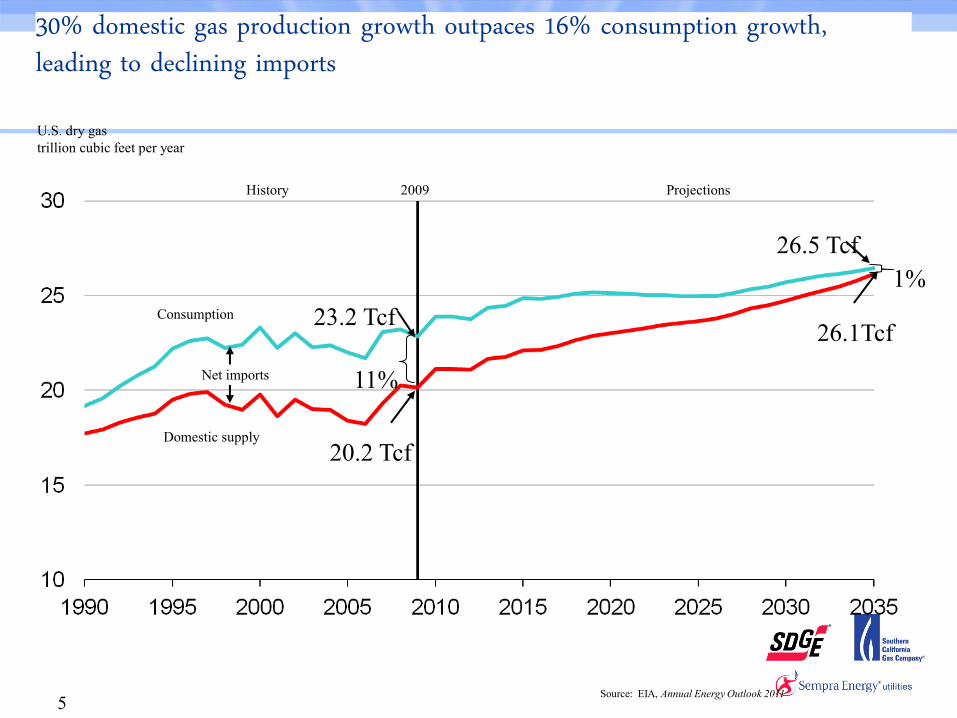
30% domestic gas production growth outpaces 16% consumption growth, leading to declining imports
Consumption
Domestic supply
Net imports
Projections History
1%
11%
Source: EIA, Annual Energy Outlook 2011
2009
U.S. dry gas
trillion cubic feet per year
23.2 Tcf 26.1Tcf
26.5 Tcf
20.2 Tcf

Horizontal drilling and hydraulic fracturing
6 Source: ProPublica,
http://www.propublica.org/special/hydraulic-fracturing-national

Success in the Barnett prompted companies to look at other shale formations in the United States
7
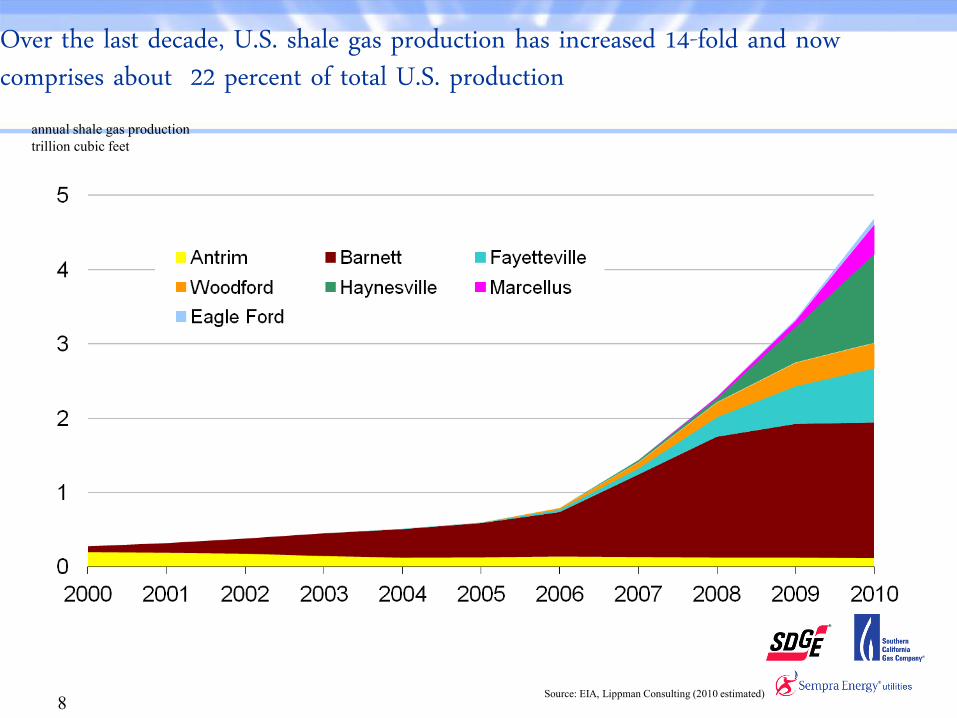
Over the last decade, U.S. shale gas production has increased 14-fold and now comprises about 22 percent of total U.S. production
Source: EIA, Lippman Consulting (2010 estimated)
annual shale gas production
trillion cubic feet
8
9
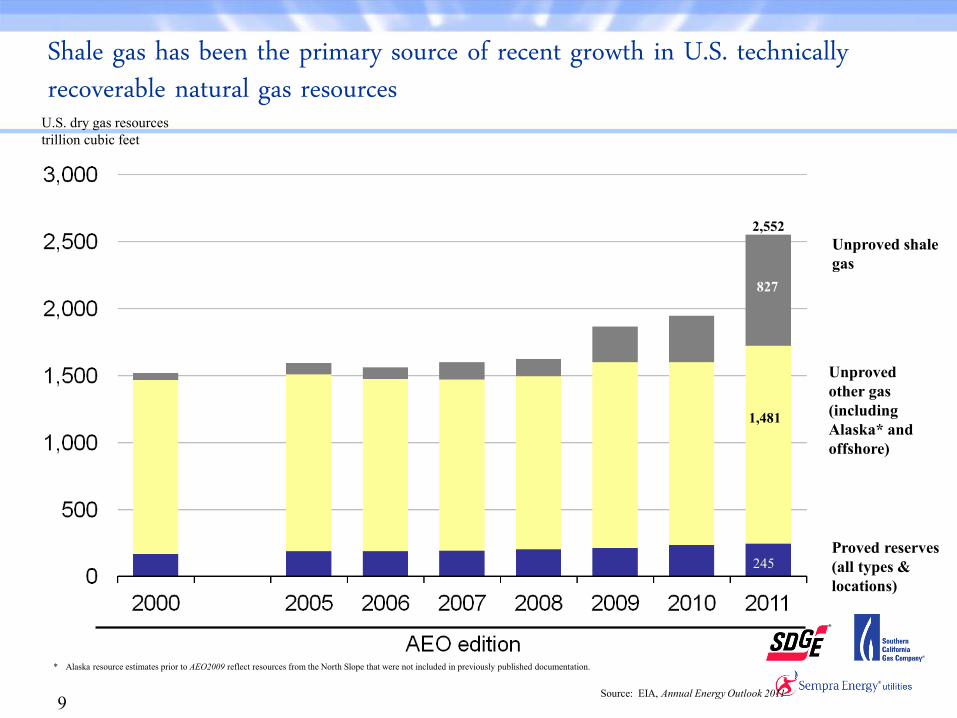
Shale gas has been the primary source of recent growth in U.S. technically recoverable natural gas resources
U.S. dry gas resources
trillion cubic feet
Unproved shale
gas
Unproved
other gas
(including
Alaska* and
offshore)
Proved reserves
(all types &
locations)
* Alaska resource estimates prior to AEO2009 reflect resources from the North Slope that were not included in previously published documentation.
Source: EIA, Annual Energy Outlook 2011
827
1,481
2,552
245

10
Four-fold increase in shale gas production offsets declines
in other U.S. supply, meeting consumption growth and
lowering import needs

11
Spurring Economic Growth
Source: LDC Forum, Exxon Mobil,, October, 2011, http://www.marcellus-
shale.us/
12
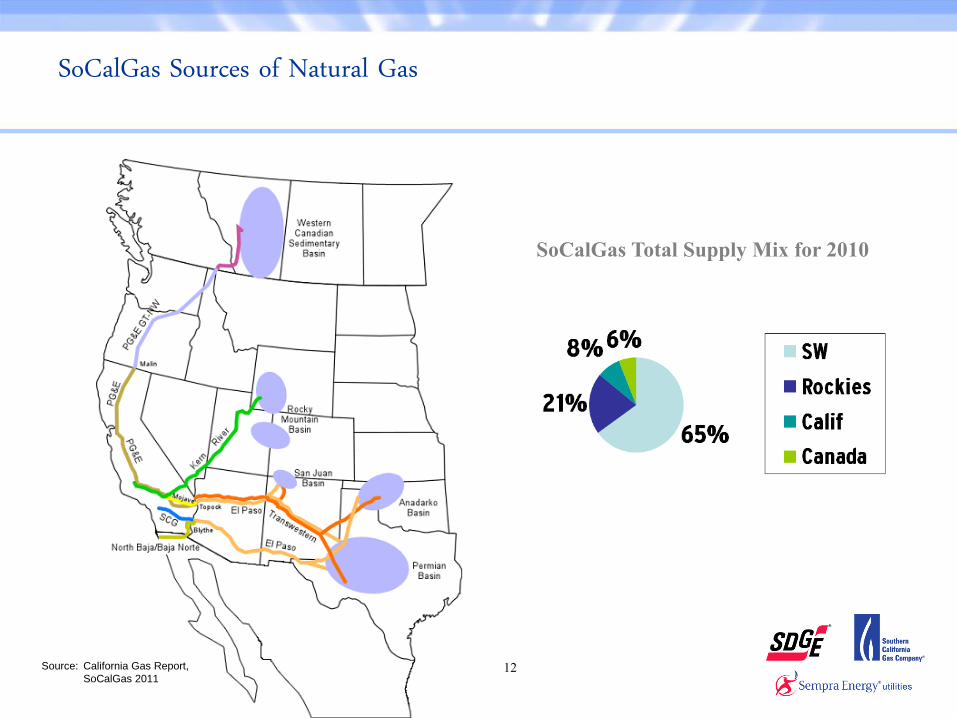
SoCalGas Sources of Natural Gas
Deliveries
(BCF)
2002 1012
2003 958
2004 995
2005 903
2006 959
SoCalGas Total Supply Mix for 2010
Source: California Gas Report,
SoCalGas 2011

13
U.S. dry gas consumption
trillion cubic feet per year
Commercial
Transportation** Residential
Central electric power
Industrial*
* Includes combined heat-and-power and lease and plant fuel. ** Includes pipeline fuel.
Source: EIA, Annual Energy Outlook 2011
2009
3%
14%
35%
18%
29%
3%
14%
32%
21%
30%
Projections History
Richard Newell, December 16, 2010
Natural gas consumption is quite dispersed; industrial and electric power use drives future demand growth
13

14
electricity net generation
trillion kilowatthours per year
Natural gas
Renewable
Projections History
Nuclear
Oil and other
Coal
20%
23%
25%
1% 1%
45%
43%
14% 10%
17%
The projected electricity mix gradually shifts to lower-carbon options, with generation from natural gas rising 37% and renewables rising 73%
Source: EIA, Annual Energy Outlook 2011
2009
Richard Newell, December 16, 2010 14

15
Southern California Gas Demand
0
200
400
600
800
1000
1200
2009 2010 2015 2020 2025 2030
Bc
f/Y
ea
r
Wholesale
EG
Noncore Non EG
Core Non Residential
Residential
Source: CGR 2010

16
U.S. Storage Expected to Remain High This Winter
Forecast
-20%
-10%
0%
10%
20%
30%
40%
50%
60%
70%
80%
90%
100%
110%
120%
130%
Jan 2007 Jan 2008 Jan 2009 Jan 2010 Jan 2011 Jan 2012
-3,000
-2,000
-1,000
0
1,000
2,000
3,000
4,000
U.S. Working Natural Gas in Storage
Deviation from 2006 - 2010 average
Storage level
Note: Colored band around storage levels represents the range between the minimum and maximum from Jan. 2006 - Dec. 2010.
billion cubic feet
Source: Short-Term Energy Outlook, December 2011

17
Weather has the most impact on spot natural gas prices.
Winter 2011/12
Source: NOAA

18
Natural Gas Price History
1
2
3
4
5
6
7
8
01
/01
06
/01
11
/01
04
/02
09
/02
02
/03
07
/03
12
/03
05
/04
10
/04
03
/05
08
/05
01
/06
06
/06
11
/06
04
/07
09
/07
02
/08
07
/08
12
/08
05
/09
10
/09
03
/10
08
/10
01
/11
06
/11
11
/11
$/m
mb
tu
CA AZ Border and SoCal Citygate - NGI Monthly Index Data Souce: NGI Bidweek Survey January 3, 2012
Southern Border, SoCalNGI Bidweek ($/Dth)
SoCal CitygateNGI Bidweek ($/Dth)

19
Oil vs Natural Gas Prices
0
5
10
15
20
25
Jan-0
4
Apr-
04
Jul-0
4
Oct-
04
Jan-0
5
Apr-
05
Jul-0
5
Oct-
05
Jan-0
6
Apr-
06
Jul-0
6
Oct-
06
Jan-0
7
Apr-
07
Jul-0
7
Oct-
07
Jan-0
8
Apr-
08
Jul-0
8
Oct-
08
Jan-0
9
Apr-
09
Jul-0
9
Oct-
09
Jan-1
0
Apr-
10
Jul-1
0
Oct-
10
Jan-1
1
Apr-
11
Jul-1
1
Oct-
11
Historical Oil Prices vs. Gas Prices Equivalent Unit Cost ($/MMBtu)
1 Barrel = 6.2 MMBtu Last Updated: 1/3/2012 Source: Source: Oil prices - EIA, CA/AZ Border Gas Price - ProphetX T:\oil vs gas.xls
CA/AZ Border NG Cash ($/MMBtu)
WTI Crude Equiv ($/MMBtu)

20
While Gas Prices Have Fluctuated: SoCalGas’ Transportation Costs Have Been Flat
$0.00 $1.00 $2.00 $3.00 $4.00 $5.00 $6.00 $7.00 $8.00 $9.00
$/m
mb
tu
Core Transport Noncore Transport
Core Gas Cost CA Border Index
`
Transport costs are the Volumetric & Customer Charge.
Core GN10 @ 100,000th/year and Noncore GTF/I3-D @ 1.5MMth/year.
Core Gas Cost is SCG’s core procurement rate and CA Border Index is Natural Gas Intelligence Index
21
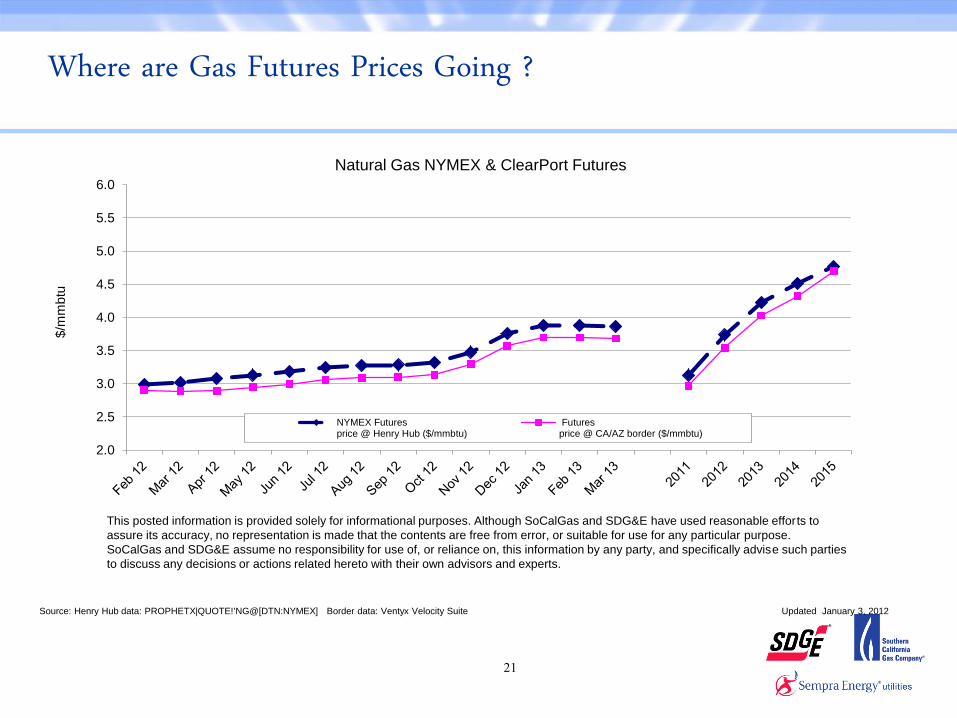
Where are Gas Futures Prices Going ?
2.0
2.5
3.0
3.5
4.0
4.5
5.0
5.5
6.0
$/m
mbtu
NYMEX Futuresprice @ Henry Hub ($/mmbtu)
Futuresprice @ CA/AZ border ($/mmbtu)
Natural Gas NYMEX & ClearPort Futures
Source: Henry Hub data: PROPHETX|QUOTE!'NG@[DTN:NYMEX] Border data: Ventyx Velocity Suite Updated January 3, 2012
This posted information is provided solely for informational purposes. Although SoCalGas and SDG&E have used reasonable efforts to
assure its accuracy, no representation is made that the contents are free from error, or suitable for use for any particular purpose.
SoCalGas and SDG&E assume no responsibility for use of, or reliance on, this information by any party, and specifically advise such parties
to discuss any decisions or actions related hereto with their own advisors and experts.
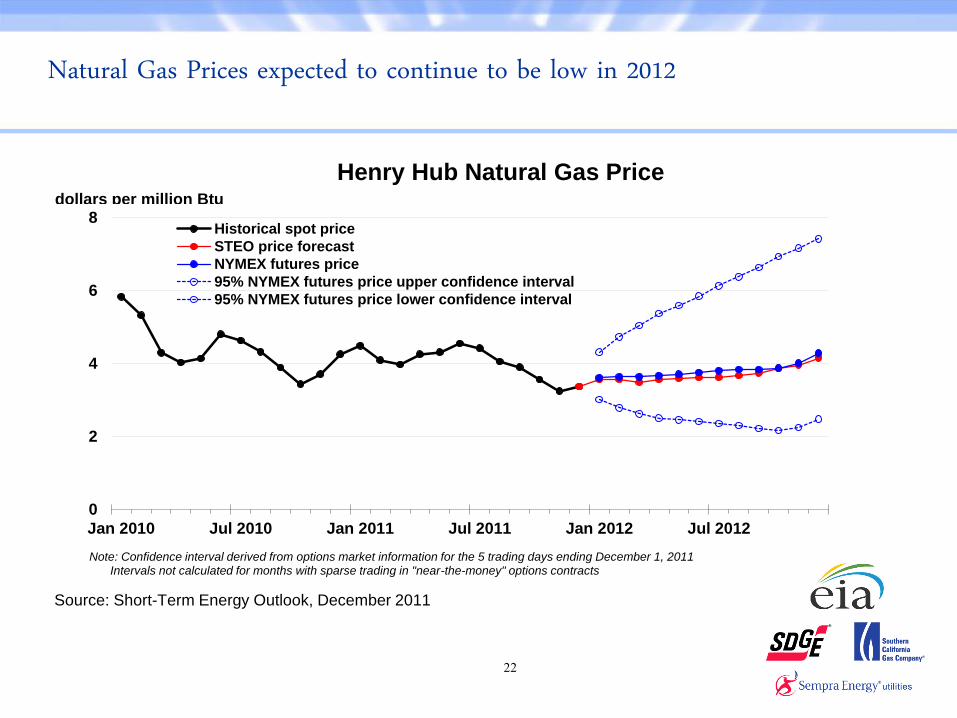
Natural Gas Prices expected to continue to be low in 2012
22
0
2
4
6
8
Jan 2010 Jul 2010 Jan 2011 Jul 2011 Jan 2012 Jul 2012
Henry Hub Natural Gas Price
Historical spot price
STEO price forecast
NYMEX futures price
95% NYMEX futures price upper confidence interval
95% NYMEX futures price lower confidence interval
Note: Confidence interval derived from options market information for the 5 trading days ending December 1, 2011 Intervals not calculated for months with sparse trading in "near-the-money" options contracts
dollars per million Btu
Source: Short-Term Energy Outlook, December 2011

23
• Shale gas drives growth in natural gas production, economy and reduces reliance on imported gas.
• Higher demand expected for U.S. gas fired electric generation and industrial demand.
• Natural gas prices much lower than oil prices.
• Natural Gas basis differences at various hubs diminished, driven by shale production increase in the east and new pipelines added.
• Natural gas price projections for 2012 are lower than past years due to warmer winter and an expanded shale gas resource base.
North American Natural Gas Market

24
What Can You Do to Manage Energy Costs?
• Take advantage of energy efficiency programs. Call your Account Executive for technical support.
• Go to socalgas.com/business for support tools.
• If you transport your own gas, talk to your gas supplier to discuss supply and pricing strategies.
• Look for ways to conserve and be more energy efficient.

25
Thank you