2012 interim results - · pdf file• gross profit uplifted to a ... another economic...
TRANSCRIPT
2012 Interim Results

Business Highlights
Business Summary
For 1H2012,
• Revenue of the Group was approximately RMB1,085.5 million, representing an increase of RMB191.1 million or 21.4% over RMB894.4 million as compared to the same period of 2011.
• Gross profit uplifted to a larger extent by approximately 21.6% reaching approximately RMB226.4 million as compared to the same period of 2011.
• Net profit attributable to equity holders of the parent increased 28.0% to approximately RMB202.5 million.
• Earnings per share was RMB20.19cents, up 30.4% as compared to last corresponding period.
• The Board does not recommend payment of any interim dividend for the six months ended 30 Jun 2012 in light of the time lag of approximately 7 months between the expected capital expenditure of approximately RMB221.4 million to be paid in 2H 2012 for the construction of the 4th phase EO production facilities and the expected operating cash inflow of approximately RMB250.0 million in three months’time from the first day of its commercial operation under the existing business model, primarily because EO customers are on cash on delivery term and required to pay in advance before delivery of goods while the feedstock suppliers are on 90-day letter of credit term.
3
4
Business Summary
• Finalising the construction of the 1st phase EO production facilities of Sanjiang Honam Chemical Co., Ltd.* (三江湖石化工有限公司) --> expected ramp-up in the end of September 2012.
• Finalisingng the construction of the 4th phase EO production.
• Plans to construct the 5th phase EO/EG production facilities, which is located at Haiyan Economic Development Zone, another economic development zone located right next to our existing production plant located at Zhapu Economic Development Zone of Zhejiang Province, PRC.
• Acquired 75% stake of Zhejiang Xingxing New Energy Technology Co., Ltd. with a consideration of RMB108,500,000. The Group will be able to obtain the Methanol-to-Olefin-based (“MTO”) Technology and related ancillary technologies.
Financial Highlights
Financial Summary
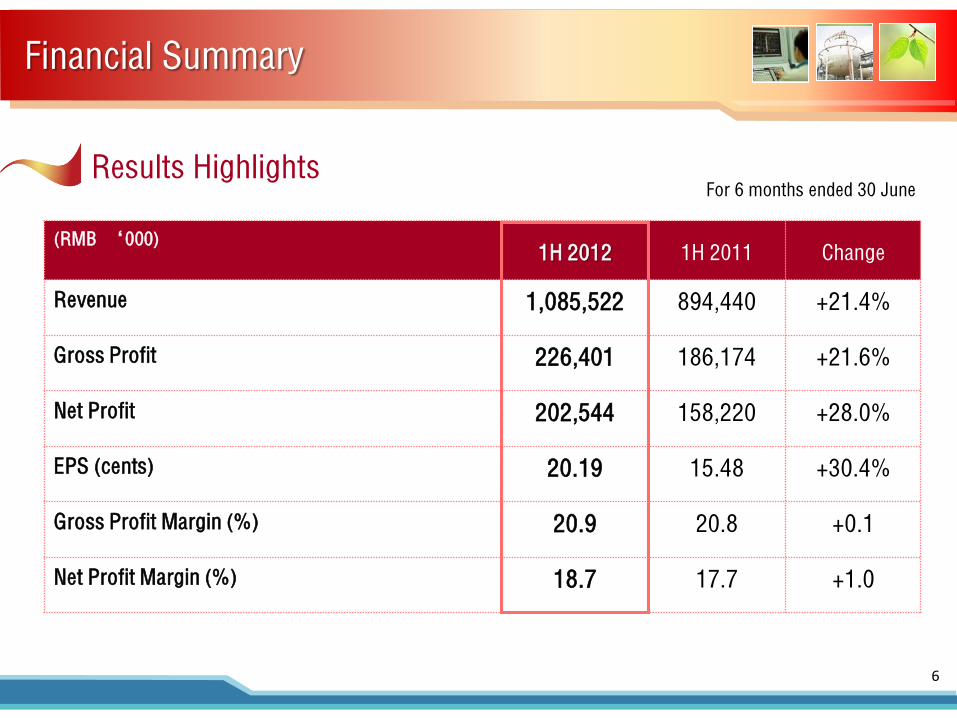
For 6 months ended 30 June
(RMB ‘000) 1H 2012 1H 2011 Change
Revenue 1,085,522 894,440 +21.4%
Gross Profit 226,401 186,174 +21.6%
Net Profit 202,544 158,220 +28.0%
EPS (cents) 20.19 15.48 +30.4%
Gross Profit Margin (%) 20.9 20.8 +0.1
Net Profit Margin (%) 18.7 17.7 +1.0
Results Highlights
6
Financial Overview
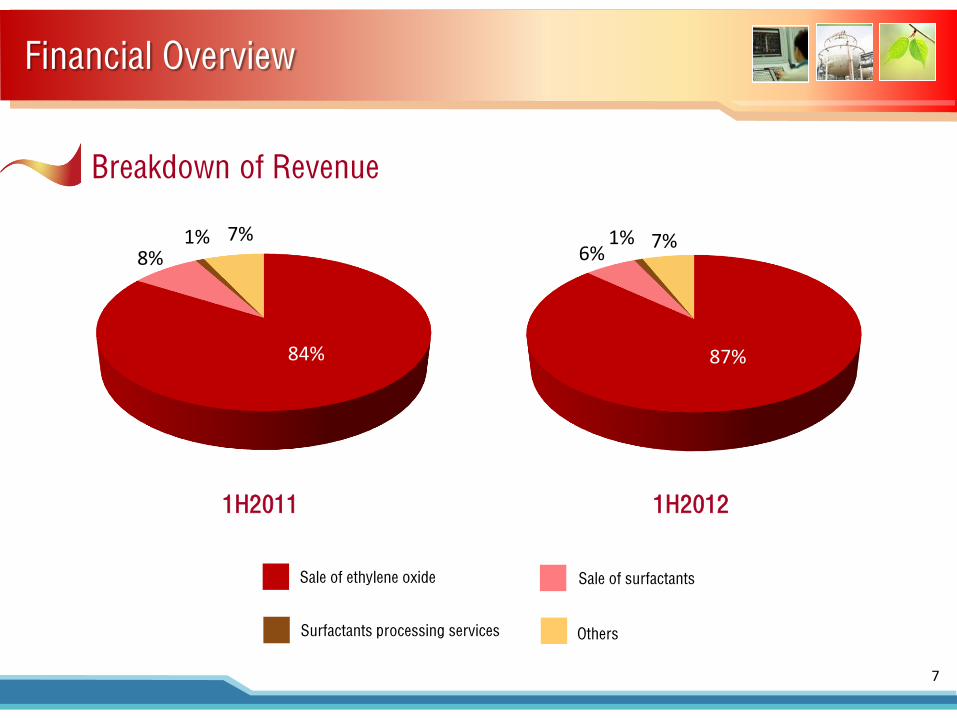
Sale of ethylene oxide Sale of surfactants
Surfactants processing services Others
Breakdown of Revenue
1H2011 1H2012
7%
87%
6% 1%
84%
8% 7% 1%
7
Revenue Gross Profit & GP%
Cash from Operating Activities Net Income
(RMB million) (RMB million)
(RMB million) (RMB million)
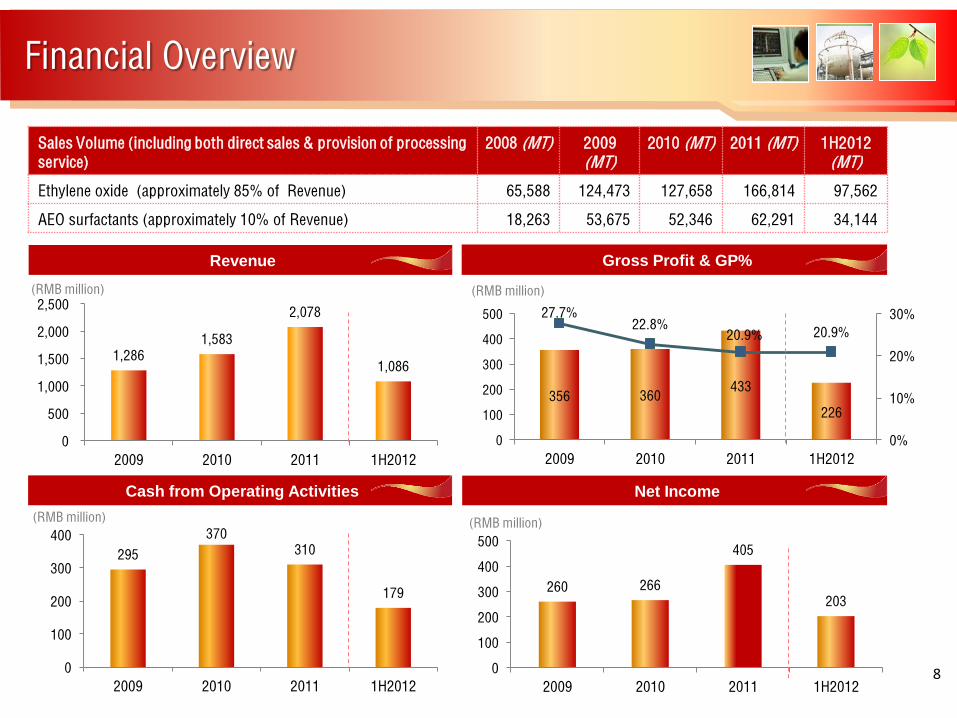
Sales Volume (including both direct sales & provision of processing service)
2008 (MT) 2009 (MT)
2010 (MT) 2011 (MT) 1H2012 (MT)
Ethylene oxide (approximately 85% of Revenue) 65,588 124,473 127,658 166,814 97,562
AEO surfactants (approximately 10% of Revenue) 18,263 53,675 52,346 62,291 34,144
356 360 433
226
27.7% 22.8%
20.9% 20.9%
0%
10%
20%
30%
0
100
200
300
400
500
2009 2010 2011 1H2012
1,286 1,583
2,078
1,086
0
500
1,000
1,500
2,000
2,500
2009 2010 2011 1H2012
295
370 310
179
0
100
200
300
400
2009 2010 2011 1H2012
Financial Overview
260 266
405
203
0
100
200
300
400
500
2009 2010 2011 1H20128
Days
Receivables Turnover Days Payables Turnover Days
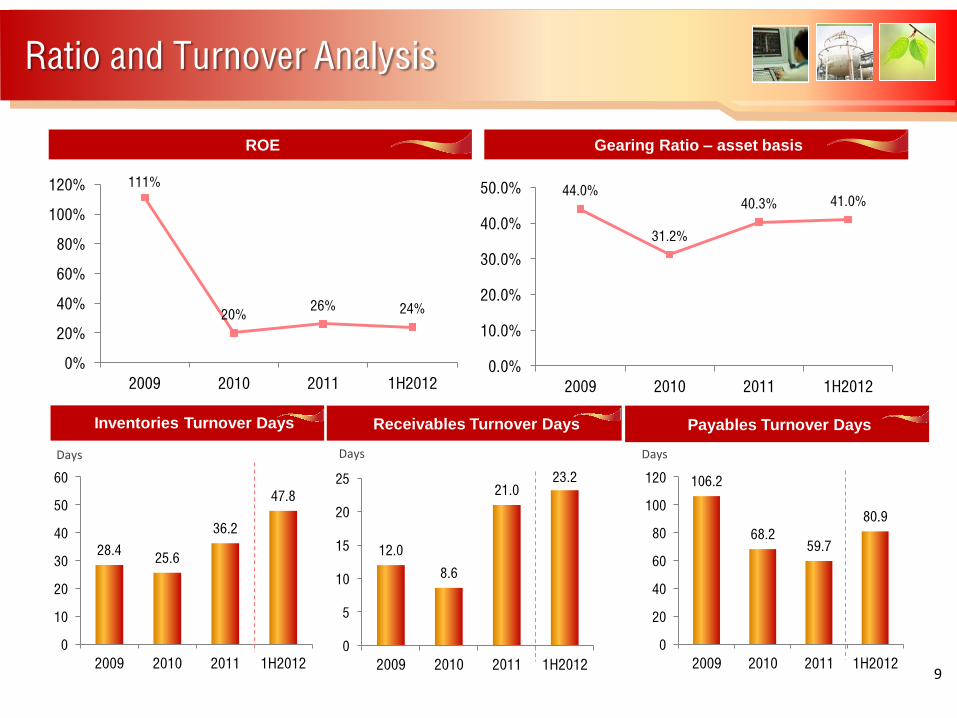
ROE Gearing Ratio – asset basis
Days Days
Ratio and Turnover Analysis
Inventories Turnover Days
111%
20% 26% 24%
0%
20%
40%
60%
80%
100%
120%
2009 2010 2011 1H2012
44.0%
31.2%
40.3% 41.0%
0.0%
10.0%
20.0%
30.0%
40.0%
50.0%
2009 2010 2011 1H2012
28.4 25.6
36.2
47.8
0
10
20
30
40
50
60
2009 2010 2011 1H2012
12.0
8.6
21.0 23.2
0
5
10
15
20
25
2009 2010 2011 1H2012
106.2
68.2 59.7
80.9
0
20
40
60
80
100
120
2009 2010 2011 1H20129
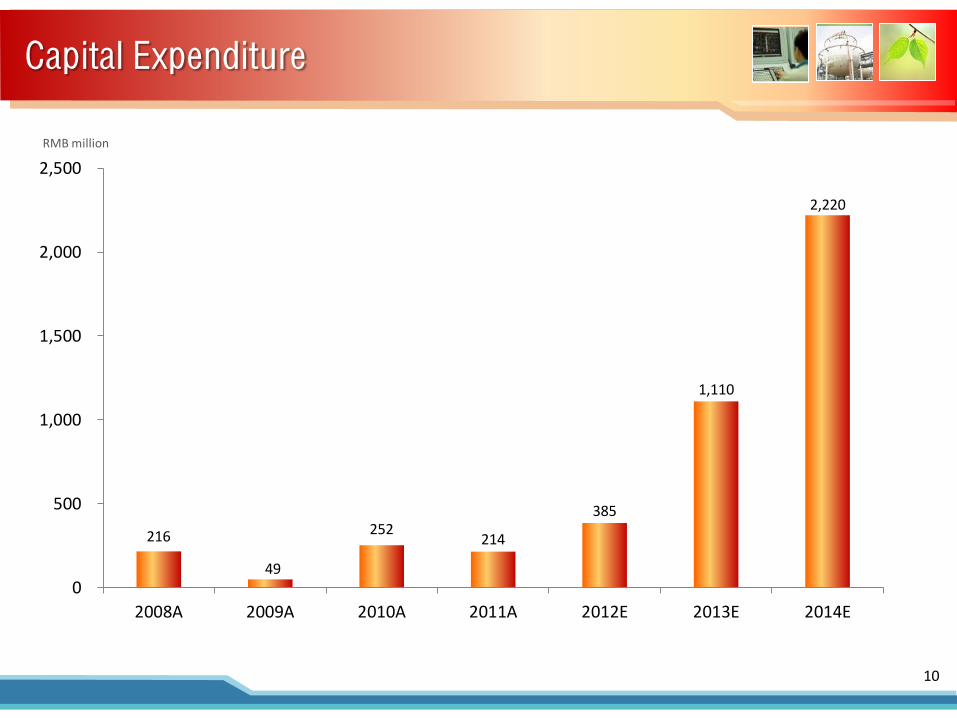
Capital Expenditure
RMB million
216
49
252 214
385
1,110
2,220
0
500
1,000
1,500
2,000
2,500
2008A 2009A 2010A 2011A 2012E 2013E 2014E
10

Operations & Outlook
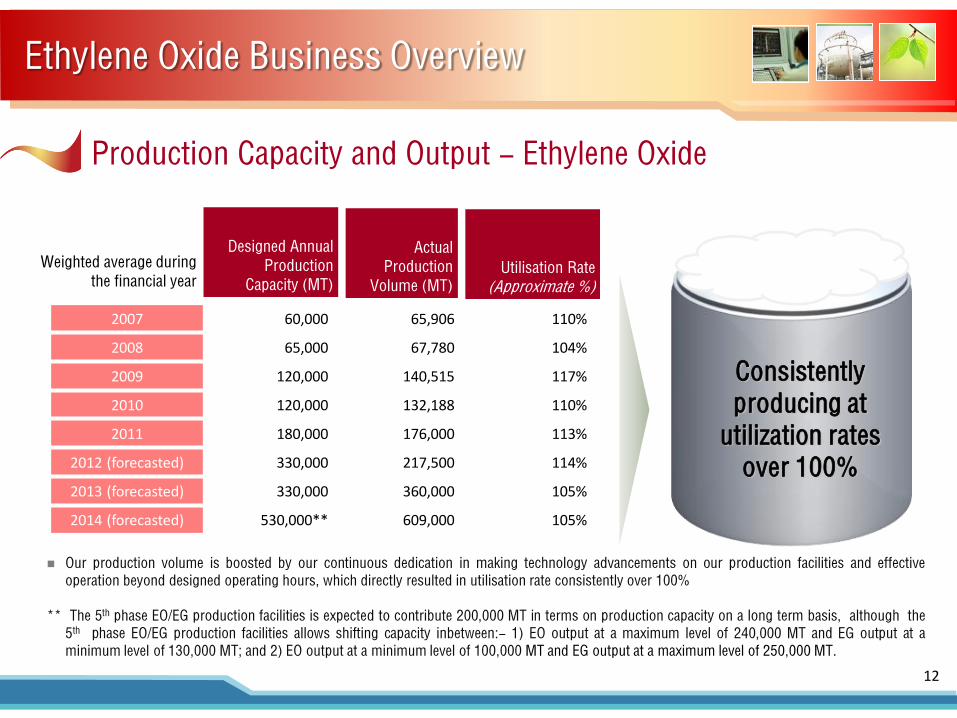
Ethylene Oxide Business Overview
Actual Production
Volume (MT) Utilisation Rate
(Approximate %)
Designed Annual Production
Capacity (MT)
2007 60,000 65,906 110%
2008 65,000 67,780 104%
2009 120,000 140,515 117%
2010 120,000 132,188 110%
2011 180,000 176,000 113%
2012 (forecasted) 330,000 217,500 114%
2013 (forecasted) 330,000 360,000 105%
2014 (forecasted) 530,000** 609,000 105%
Weighted average during the financial year
Consistently producing at
utilization rates over 100%
Our production volume is boosted by our continuous dedication in making technology advancements on our production facilities and effective operation beyond designed operating hours, which directly resulted in utilisation rate consistently over 100%
** The 5th phase EO/EG production facilities is expected to contribute 200,000 MT in terms on production capacity on a long term basis, although the
5th phase EO/EG production facilities allows shifting capacity inbetween:- 1) EO output at a maximum level of 240,000 MT and EG output at a minimum level of 130,000 MT; and 2) EO output at a minimum level of 100,000 MT and EG output at a maximum level of 250,000 MT.
Production Capacity and Output - Ethylene Oxide
12
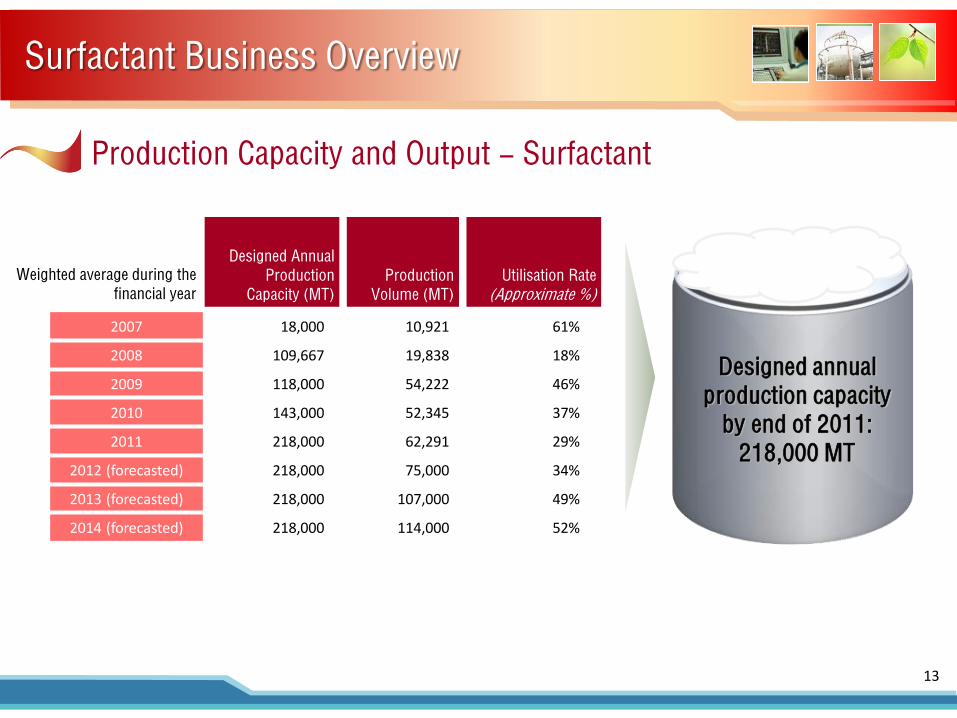
Surfactant Business Overview
Weighted average during the financial year
Designed annual production capacity
by end of 2011: 218,000 MT
Production Volume (MT)
Utilisation Rate (Approximate %)
Designed Annual Production
Capacity (MT)
2007 18,000 10,921 61%
2008 109,667 19,838 18%
2009 118,000 54,222 46%
2010 143,000 52,345 37%
2011 218,000 62,291 29%
2012 (forecasted) 218,000 75,000 34%
2013 (forecasted) 218,000 107,000 49%
2014 (forecasted) 218,000 114,000 52%
Production Capacity and Output - Surfactant
13
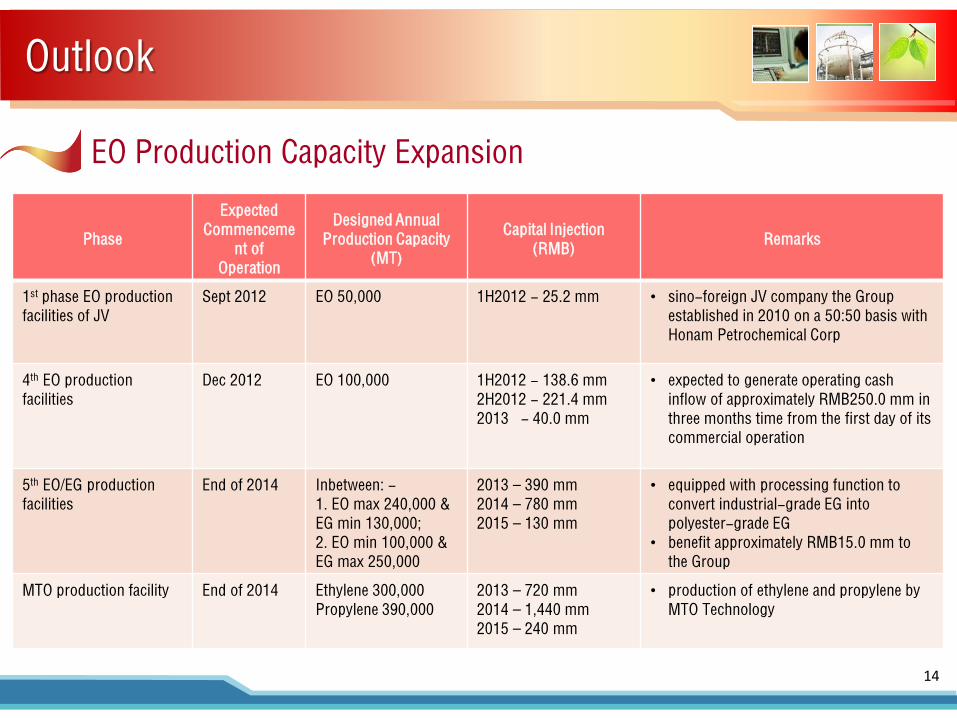
Outlook
EO Production Capacity Expansion
Phase
Expected Commenceme
nt of Operation
Designed Annual Production Capacity
(MT)
Capital Injection (RMB)
Remarks
1st phase EO production facilities of JV
Sept 2012 EO 50,000 1H2012 - 25.2 mm • sino-foreign JV company the Group established in 2010 on a 50:50 basis with Honam Petrochemical Corp
4th EO production facilities
Dec 2012 EO 100,000 1H2012 - 138.6 mm 2H2012 - 221.4 mm 2013 - 40.0 mm
• expected to generate operating cash inflow of approximately RMB250.0 mm in three months time from the first day of its commercial operation
5th EO/EG production facilities
End of 2014 Inbetween: - 1. EO max 240,000 & EG min 130,000; 2. EO min 100,000 & EG max 250,000
2013 – 390 mm 2014 – 780 mm 2015 – 130 mm
• equipped with processing function to convert industrial-grade EG into polyester-grade EG
• benefit approximately RMB15.0 mm to the Group
MTO production facility End of 2014 Ethylene 300,000 Propylene 390,000
2013 – 720 mm 2014 – 1,440 mm 2015 – 240 mm
• production of ethylene and propylene by MTO Technology
14

Thank You

Appendix
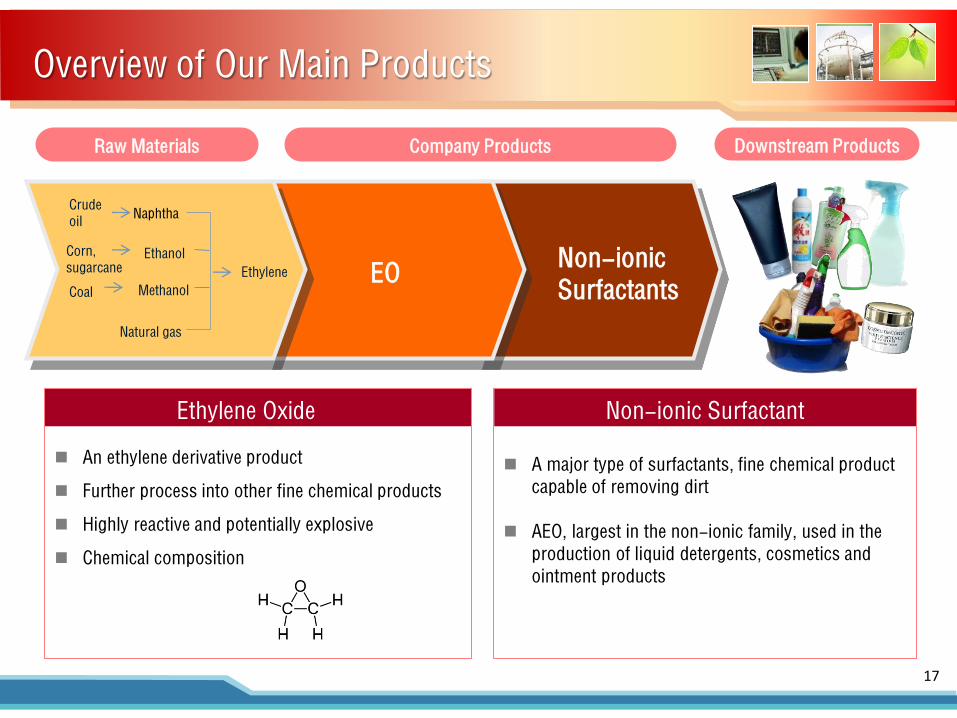
Overview of Our Main Products
Non-ionic Surfactant A major type of surfactants, fine chemical product
capable of removing dirt
AEO, largest in the non-ionic family, used in the production of liquid detergents, cosmetics and ointment products
An ethylene derivative product
Further process into other fine chemical products
Highly reactive and potentially explosive
Chemical composition
Ethylene Oxide
Raw Materials Company Products Downstream Products
Crude oil
Corn, sugarcane
Coal
Naphtha
Ethanol
Methanol
Natural gas
Ethylene EO Non-ionic Surfactants
17
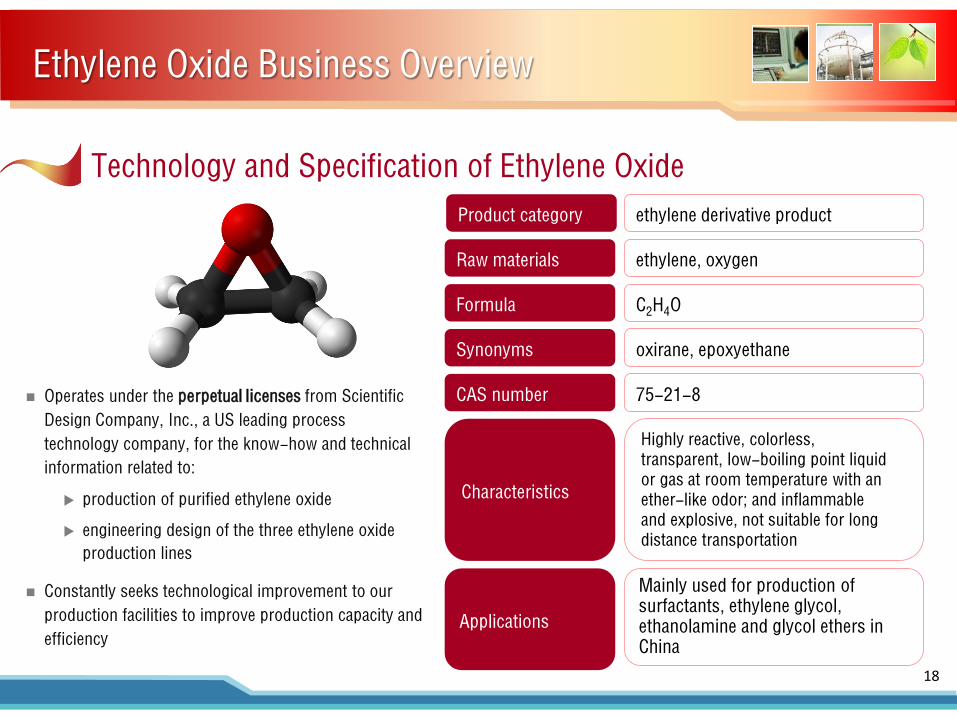
Ethylene Oxide Business Overview
Operates under the perpetual licenses from Scientific Design Company, Inc., a US leading process technology company, for the know-how and technical information related to:
production of purified ethylene oxide
engineering design of the three ethylene oxide production lines
Constantly seeks technological improvement to our production facilities to improve production capacity and efficiency
Product category ethylene derivative product
Raw materials ethylene, oxygen
Formula C2H4O
Synonyms oxirane, epoxyethane
CAS number 75-21-8
Characteristics
Highly reactive, colorless, transparent, low-boiling point liquid or gas at room temperature with an ether-like odor; and inflammable and explosive, not suitable for long distance transportation
Mainly used for production of surfactants, ethylene glycol, ethanolamine and glycol ethers in China
Applications
Technology and Specification of Ethylene Oxide
18
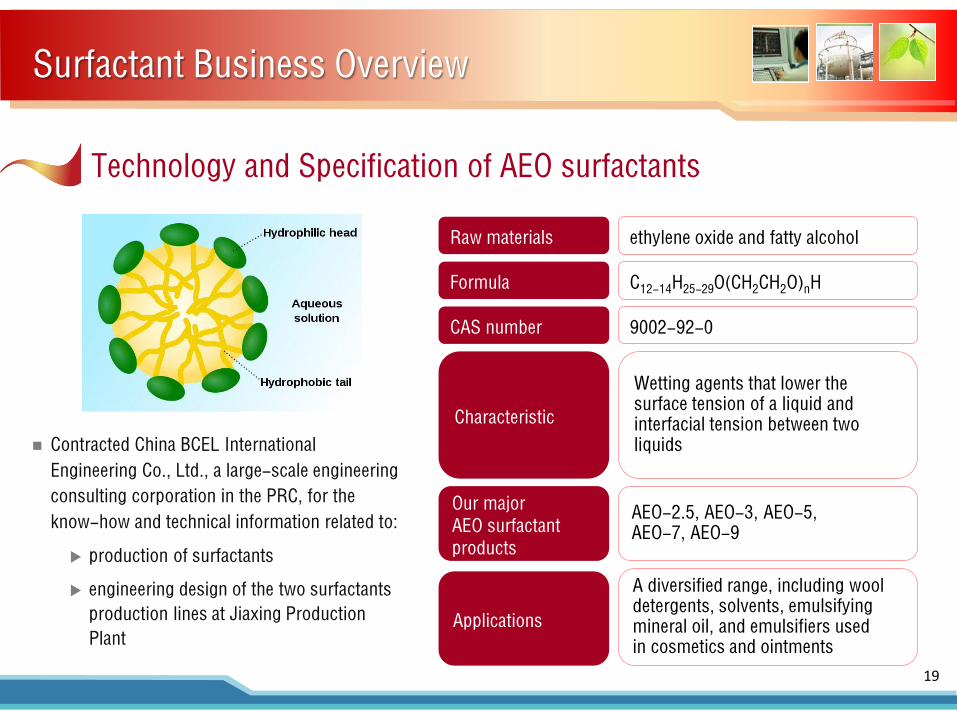
Contracted China BCEL International Engineering Co., Ltd., a large-scale engineering consulting corporation in the PRC, for the know-how and technical information related to:
production of surfactants
engineering design of the two surfactants production lines at Jiaxing Production Plant
Surfactant Business Overview
Raw materials ethylene oxide and fatty alcohol
Formula C12-14H25-29O(CH2CH2O)nH
CAS number 9002-92-0
Characteristic
Wetting agents that lower the surface tension of a liquid and interfacial tension between two liquids
A diversified range, including wool detergents, solvents, emulsifying mineral oil, and emulsifiers used in cosmetics and ointments
Applications
Our major AEO surfactant products
AEO-2.5, AEO-3, AEO-5, AEO-7, AEO-9
Technology and Specification of AEO surfactants
19

Competition Analysis
Ethylene Oxide Surfactants
Major Competitors in the Market
CNPC
Sinopec
Fragmented market with 20 major domestic producers
Our Competitive Advantages
More flexible in terms of product pricing
Around the clock customer service
Significant size advantage over other privately-owned competitors
In-house supply of ethylene oxide
Competes in terms of product quality, production efficiency and cost advantage
Overall
We face limited competition as majority of ethylene oxide produced by CNPC and Sinopec are for captive use in producing other chemical products
We are the largest privately-owned AEO producer in the market with 13% market share
We are well positioned to compete with our competitors in the EO and surfactants market
20