a tectonically uplifted marine shoreline deposit, knights ...2459ikxj617q9ser65rr/hierarchy...cooper...
TRANSCRIPT

Cooper & Kostro—Knights Point Terrace 203
A tectonically uplifted marine shoreline deposit, Knights Point, Westland, New Zealand
New Zealand Journal of Geology & Geophysics, 2006, Vol. 49: 203–2160028–8306/06/4902–0203 © The Royal Society of New Zealand 2006
ALAN F. COOPERFABIAN KOSTRO
Geology DepartmentUniversity of OtagoP.O. Box 56Dunedin, New [email protected]
Abstract An 11 m thick subhorizontal beach deposit rests on steeply dipping Cretaceous bedrock. Sediments, ranging from a basal boulder bed to upper sands, are poorly sorted and negatively skewed, indicating pronounced winnowing of fine material. Impact features on quartz grain surfaces at-test to high-energy turbulent environments, and are similar to those found on clasts from modern nearby beaches. The Haast River was source to some of the sand and gravel. Heavy minerals from the Dun Mountain Ophiolite Belt were trans-ported 85 km by fluvial/glacial and longshore drift processes, necessitating caution when using apparent lateral separation of source material for estimating strike-slip displacement rates on the Alpine Fault. An optical luminescence age estimate of 123 ± 7 ka for Knights Point beach sands dates to the last interglacial (MIS 5e). A shore-platform altitude of 113 m a.s.l. requires tectonic uplift of the Australian plate of 0.86 mm/yr, an order of magnitude less than the nearby Pacific plate.
Keywords Knights Point; beach sediments; marine terrace; last interglacial; OSL dating; heavy mineral compositions
INTRODUCTION
Prominent terraces are exposed along the precipitous and densely vegetated coastal strip west of the Alpine Fault plate boundary, between Moeraki and Haast River in South West-land, New Zealand (Fig. 1). The terraces were recognised (at least in part) by Wellman & Willett (1942), referred to briefly by Wellman (1955), mapped by Gair & Gregg (1962) and Young (1968), and dated and correlated with New Zea-land and international sequences by Nathan (1975). Nathan described the Sardine-2 Terrace (24–32 m a.s.l.), Sardine-1 Terrace (56–59 m a.s.l.), and the Knights Point Terrace (140–147 m a.s.l., an overestimate), ascribing the lowest sequence to be youngest (Oturian) and the highest to be old-est (pre-Terangian; terminology after Suggate 1965, table 1), although radiocarbon (14C) dates were conflicting due to contamination by modern carbon. Both Sardine-2 and Knights Point sequences were interpreted to be marine in origin, based on the “character” of the constituent sediments, although no analysis was conducted. This inferred marine origin was then
used by Bull & Cooper (1986) in their analysis of tectonic uplift of Westland terraces. As observed by Nathan, roadside outcrops of the terrace sequences were already overgrown by 1974 and have stead-ily deteriorated since that time. Recent road widening has taken place at Knights Point (169°13.930′E, 43°42.953′S), with the consequence that the main outcrop of the Knights Point Terrace has been recut and is now devegetated (Fig. 2). This paper documents the stratigraphic sequence exposed, investigates and interprets the sedimentary facies, comments on the provenance of the sediment based on detailed petro-logical and mineralogical analyses, and ascribes an origin to the deposits. An age for the sands of the Knights Point Terrace based on Optically Stimulated Luminescence (OSL) dating is presented and its significance assessed in terms of the Quaternary–Recent record of the West Coast region, the international correlation of the terrace, and implications for regional uplift rates.
REGIONAL GEOLOGY
The geology of South Westland follows work by Wellman (1955) and Nathan (1975, 1977), with modifications by Phillips et al. (2005). The basement rocks of South Westland comprise the Greenland Group, a sequence of greywackes and their low grade regional and contact metamorphosed equivalents of probable early Paleozoic age (R. Cooper 1975; Ireland 1992). The greywackes are intruded by mainly grani-toid intrusives, some of late Paleozoic age (Aronson 1968). The basement is overlain unconformably by a thick sequence of breccias—the Otumotu Formation of probable Cretaceous age (Nathan 1977)—and then by a terrestrial (Tauperikaka Coal Measures) to marine, transgressive sequence with the Whakapohai Sandstone extending upwards into the Tititira Formation. Extensive volcanism occurs throughout the se-quence, initially with the Arnott Basalt (the top of which was dated at 61 Ma by Phillips et al. 2005) and later with the Otitia Basalt. The volcano-sedimentary succession has been extensively deformed and now occurs in sequences compris-ing often steeply dipping or overturned strata bounded by the Arnott, Grave, and Mistake Fault zones (Young 1968). The coastal strip is interpreted to comprise the upper, eastern limb of the “Coastal Monocline” (McNaughton & Gibson 1970), with deformation related to the Miocene–Re-cent oblique slip displacement along the Alpine Fault plate boundary. At the present day, this displacement averages 25 ± 5 mm/yr of dextral strike slip and 10–0 mm/yr of dip slip, with uplift occurring dominantly on the eastern side of the plate boundary zone (Norris & Cooper 2000). Total dextral strike-slip displacement amounts to 440–470 km (Sutherland 1999) and vertical uplift of the eastern, hanging-wall Haast Schist block of 25 km in this area (Cooper 1980) has occurred since the mid-Cenozoic inception of the throughgoing plate boundary fault zone. Dramatic uplift of the Pacific plate, on
G05036; Online publication date 12 May 2006 Received 25 July 2005; accepted 12 December 2005

New Zealand Journal of Geology and Geophysics, 2006, Vol. 49204
Fig. 1 South Westland showing terrace localities, generalised geol-ogy, and other geographic features referred to in the text.
the eastern side of the Alpine Fault, producing the Southern Alps, is superimposed on a regional uplift affecting the Aus-tralian plate of 1–2 mm/yr (Wellman 1979), 2.2 ± 0.2 mm/yr (Hull & Berryman 1986), and 1.4 ± 0.5 mm/yr (Sutherland & Norris 1995). Based on terrace sequences in South West-land between the Jackson River and Moeraki River (Fig. 1), inferred to be of marine origin, and ages inferred for them by correlation with dated coral terrace sequences in New Guinea, Bull & Cooper (1986) calculated substantially lower uplift rates for the Australian plate of 0.87 mm/yr over the past 150 k.y.
TERRACE STRATIGRAPHY
Three representative sections have been measured through the Knights Point Terrace, two at Knights Point (Fig. 2) and one near Arnott Creek, 1 km to the southwest (Kostro 2003). The detailed stratigraphic columns, incorporating sequences up to 11 m thick, are shown in Fig. 3. Seven lithofacies are distinguished, based on lithology, sedimentary structures, and the textural classification of Folk (1980). Bulk samples
were analysed for grain size, pebble composition, and detrital heavy minerals. Grain size, sorting, and skewness (defined by Mason & Folk 1958) are summarised in Table 1, and grain-size distribution is represented in terms of frequency distribution in Fig. 4.
Facies 1This lithofacies, 1.25–2.75 m thick, occurs at the base of the Knights Point section and comprises well-rounded pebbles in a medium-grained quartz-rich sand, with a distinctive bouldery layer at the base, unconformably overlying a con-solidated unit of Cretaceous bedrock (Fig. 5). Well-rounded boulders within the lower part of the unit can exceed 1.00 m in diameter. Most of the boulders lie directly on an undulating unconformity cut in orange to dark brown decomposed tuff (Arnott Basalt) at Knights Point or, farther south (Fig. 3), the Whakapohai Sandstone. Pebbles represent the main component within this facies and occur in crudely defined centimetre–decimetre thick lay-ers, dipping at c. 15° to the north. A greyish to yellow matrix of moderately sorted, medium quartz sand becomes more dominant towards the upper part of the facies. The greyish

Cooper & Kostro—Knights Point Terrace 205
Fig. 2 Roadside outcrop at Knights Point of the Knights Point Terrace.
to yellow matrix is dominantly (up to 85%) composed of quartz and feldspar, but lithoclasts and biotite are also present. Overall, this matrix is significantly bimodal (Fig. 4).
Facies 2Facies 2 is composed of homogeneous clast-supported, pea-sized gravel (very well rounded clasts c.10 mm diam.) with a coarse-grained sand matrix. The clasts are mainly composed of quartz, but also of high-grade metamorphic rocks, sand-stones, granites, and decomposed basalts. Small amounts of mica (5% of rock volume) and limonitic particles (1% of rock volume) are also present. The entire unit has a variable thickness of c. 400 mm, shows no bedding, and has an irregular top and base.
Facies 3This lithofacies comprises centimetre-scale alternating layers of yellowish, coarse grained, very poorly sorted quartz sand and coarse gravel. Well-rounded and often platy lithoclasts (30%) are dominated by decomposed basalts, but include schists, quartz, and granitic rocks forming continuous lay-ers within the micaceous coarse sand. Although clasts are dominant at the base of the unit, sand increases towards the upper 50 cm where this submature lithofacies is truncated by the overlying unit.
Facies 4This unit consists of dark grey, very coarse sand with occa-sional pebbles concentrated in lenticular beds (Fig. 5). Peb-bles consist mainly of quartz, schistose metamorphic rocks, and granitic rocks, with up to 20% of decomposed basalt pebbles. In places the very coarse sand, in fining-upwards sequences, shows cross-bedding dipping mainly at low angles to the north. Clasts are moderately sorted and roundness varies from subangular to subrounded, to very well rounded for the lithoclasts. The sand is submature, unimodal, and negatively skewed (Fig. 4). The dish-shaped unit has a maximum thick-ness of 0.5 m.
Facies 5This pebble-dominated layer with minor amounts of coarse sand has a pronounced imbrication defined by platy pebbles dipping north at c. 20° (Fig. 6). The clasts consist mainly of greywacke, granitic rocks, sandstone, and decomposed basalt (Fig. 6). The unit gets less sandy towards the top and decreases laterally in its mean grain-size towards the south. This lithofacies is very poorly sorted, submature, and with a slightly bimodal distribution (Fig. 4). The relative amount of lithoclasts is higher than in other units of the Knights Point Terrace, producing a very large mean grain size. The thickness of the unit varies from 0.2 to 0.4 m.
Table 1 Grain-size distribution, sorting, skewness of Knights Point, Arnott Creek and Ship Creek beach samples.
Facies Mean Grain-Size (φ,mm) Sorting (φ) Skewness 7 Upper 1.6 (0.33) 0.71 0.027 Lower 0.28 (0.75) 0.95 –0.126 0.05 (0.9) 1.18 –0.055 –2.2 (9.2) 2.38 –0.514 –0.1 (1.1) 0.92 –0.261 –1.7 (3.3) 2.52 –0.64Arnott Creek (7) 1.1 (0.45) 0.83 0.02Present-Day Beach –1.5 (2.8) 1.41 –0.04

New Zealand Journal of Geology and Geophysics, 2006, Vol. 49206
Fig. 3 Stratigraphic sections through the Knights Point Terrace at Knights Point and Arnott Creek.

Cooper & Kostro—Knights Point Terrace 207
Facies 6This unit of coarse quartz sand contains two distinctive layers only one pebble thick of dispersed centimetre-sized clasts (Fig. 6). The general dip direction of individual, imbricated pebbles is to the north. The main component of this unit is a homogeneous coarse sand, which comprises c. 75% of quartz/feldspar and 25% of lithoclasts, with minor amounts of mica. The sand is poorly sorted and submature. The histo-gram and frequency curves of this unit show a clear unimodal distribution (Fig. 4), and again, a negative skewness. This unit has a maximum thickness of 0.6 m and grades into the overlying unit.
Facies 7This lithofacies is a massive unit (Fig. 2), which starts at the base with coarse quartz sand and grades towards the top into a fine to medium quartz sand. Horizontal centimetre-scale bedding and occasional cross-beds occur throughout the unit. Individual well rounded, often flattened clasts have a general horizontal orientation (Fig. 6). The amount of quartz relative to lithic fragments increases from c. 85% at the base to 95% at
the top of the unit. The sand is moderately sorted at the base and moderately well sorted within the upper unit. The sand is unimodal (Fig. 4), which changes from negatively skewed in the lower part to slightly positively skewed in the upper part. This facies has variable thickness, at least 2.0 m, but it can be significantly thicker. Samples for OSL dating were collected from this facies (Fig. 3).
InterpretationDegradation of an irregular basement of Arnott Basalt or Whakapohai Sandstone beneath the sedimentary sequence supplied boulders to the base of Facies 1. Although these clasts have not been transported over long distances, their rounded nature indicates deposition in a high-energy environ-ment. The occurrence of medium sand and gravel between the boulders indicates that energy conditions changed over time. The decreasing amount of boulders towards the top indicates the decreasing influence of energetic events and therefore the establishment of moderate to high-energy conditions during which medium sand and gravel were deposited. Cross-bed-ding indicates an approximate current direction from south
Fig. 4 Grain-size cumulative frequency distribution curves for sedimentary facies at Knights Point.

New Zealand Journal of Geology and Geophysics, 2006, Vol. 49208
deposition in a depression or channel-like structure, in which large pebbles reflect short duration, very high energy current activity. Facies 5 indicates a constant very high energy environ-ment, in which only pebbles were deposited; the imbrica-tion of clasts indicates a strong current from north to south. High abundance of Arnott Basalt pebbles is explained by an increased erosion of the bedrock, a consequence of the proposed very high energy environment. Bimodal grain-size distribution of the unit (Fig. 4) could be indicative of a multi-ple source area (Folk 1980) or fluctuating energy conditions in the depositional environment. Less sand towards the top of the unit is interpreted as an increase of energy in the depositional environment. Facies 6 is interpreted to have been deposited in a moder-ate to high energy environment with pebble layers deposited during high-energy events. Although shape in general is not a very useful criterion of depositional environment, the prominent flattened shape of larger pebbles (20–140 mm) that occur in this and almost every facies of the terrace is compatible with beach deposits (Folk 1980). However, some of the flattening is inherited from the foliated character of the schist protolith. Pebble imbrication indicates a prevail-ing current direction from north to south. Poorly sorted sand is interpreted as an indicator for multiple source areas and limited working.
Fig. 5 Boulder layer unconformably overlying Arnott Basalt tuffs at the base of Facies 1, Knights Point.
Fig. 6 Contact between Facies 5 gravels showing strong pebble imbrication and overlying sands of Facies 6 containing discontinuous pebble layers. View to east, scale in centimetres.
to north. The roundness of gravel clasts implies either long transportation distances or extensive back and forth move-ments on a beach due to different directions of wave action. Grain-sizes of Knights Point Terrace sands (Fig. 4) have “truncated" fine-grained distributions, indicating negative skewness. The absence of fine sand and mud is explained by their removal by winnowing, a characteristic process of beach environments (Friedman 1961). Friedman (1961) and Martins (1965) suggested that beach sands are generally negatively skewed, a feature also observed by Sevon (1965) in New Zealand beach sands. The accumulation of uniform grain size gravel in Facies 2 indicates a constant energy environment. Facies 3 is inter-preted to represent deposition in a low to moderate energy environment, influenced by episodic high-energy events, dur-ing which pebble layers were deposited. Increasing amount of sand towards the top of the unit indicates a decreasing influence of high-energy events on the depositional environ-ment, but the constant mean grain-size of the sand suggests energy levels fluctuated within narrow limits. Poorly sorted sand indicates relatively rapid deposition with no significant reworking. Facies 4 is interpreted to have been deposited in a high-energy environment. Cross-bedding reversals im-ply fluctuating current directions, although the dominance of northward-dipping layers indicates a predominantly north-flowing current. The dish-shape of the unit indicates

Cooper & Kostro—Knights Point Terrace 209
The fining upward of Facies 7 from a coarse sand into a fine to medium sand is interpreted as a gradual change from a high to a moderate energy environment. Occasional cross-beds indicate fluctuations in current direction. Isolated pebbles were deposited during episodic high-energy (storm?) events. Better sorting and increased amounts of quartz upwards implies that the sand has undergone prolonged exposure to physical and chemical processes, and current intensities were no longer capable of transporting pebble-sized clasts. The change from negative skewness to a positive skewness through the terrace sequence is taken as an additional indicator for the decrease in energy: a positive skewness implies the presence of fine mate-rial that is assumed to be deposited under calm conditions.
PRESENT-DAY BEACH FACIES
Sediment from the present-day beach at Ship Creek (8 km southwest of Knights Point) was examined for comparison with the Knights Point Terrace sequence. The lithofacies at Ship Creek is characterised by very coarse light grey sand, containing pebbles up to 60 mm in diameter. Pebbles are mainly composed of quartz, granitic rocks, and micaceous schist. Quartz makes up to 85% of the sand, which contains lithoclasts and mica. In contrast to the lithofacies of the Knights Point Terrace, where several different rock types occur in each unit, the present day beach is dominated by micaceous schist. The sand contains no clay and is submature and poorly sorted. The histogram and the frequency curve display a uni-modal distribution (Fig. 4) and a slightly negative skewness (Table 1).
PROVENANCE
Provenance of sedimentary detritus in the Knights Point Ter-race can be assessed on the basis of the compositions of (1) boulders in the basal lag deposit, (2) pebbles in the gravels, and (3) detrital heavy mineral clasts.
Boulders and pebblesBoulders (up to 1 m diam.) lying on or close to the uncon-formable contact with underlying tuffs of the Arnott Volcan-ics, and pebbles from the gravel horizons within the Knights Point Terrace, can be identified on the basis of their hand specimen and petrographic characteristics. They include:(1) Arnott Basalt, including olivine-augite basalt and volcanic
breccias and tuffs;(2) Whakapohai Sandstone, a micaceous, glauconitic sand-
stone;(3) Greenland Group greywacke, a feldspathic quartz-arenite
with clasts of metamorphic and siliceous lithic frag-ments;
(4) Tuhua Intrusives—although granitic material is rare, quartz diorites occur as flattened and very well rounded pebbles;
(5) garnet-biotite quartzofeldspathic schists, generally lack-ing chlorite, and with plagioclase of oligoclase composi-tion;
(6) oligoclase amphibolites characterised by blue green to green hornblende;
(7) piemontite schists, containing the assemblage quartz-albite-muscovite-tourmaline-hematite-piemontite.
Rock types (1) to (7) occur locally on the coastal strip of Western Province rocks, west of the Alpine Fault. In South Westland, Nathan (1977) described a basement of Greenland Group greywacke, intruded by mainly granitic rocks, and overlain by a Cretaceous–Tertiary sedimentary sequence. Diorites have not been described from the basement rocks of this area, although hypabyssal intermediate to mafic rocks of dioritic to gabbroic aspect do occur west of the Alpine Fault in the Jackson River area farther south (Ransley 1983). In contrast, rock types (5) to (7) indicate derivation from the Haast Schists, occurring east of the Alpine Fault. The presence of oligoclase-bearing quartzofeldspathic schists and amphibolites indicates derivation from the high-grade garnet or oligoclase zones that occur in the proximal hanging wall of the fault (Fig. 1). The piemontite schist, however, indicates a more distal source, in that it lacks a phlogopitic mica and pie-montite is finer grained than recorded at high grade (Cooper 1971a). On this basis, these low-grade piemontite schist clasts are likely to be derived from a chlorite zone source which is only drained by the major Haast, Okuru, Turnbull, and Arawata Rivers (Fig. 1).
Detrital sand grade clastsMost of the sand grade component of the Knights Point Ter-race is composed of quartz, feldspar, and mica, none of which is particularly definitive of source. Heavy minerals were hand picked from processed samples, made into a polished mount, and analysed using the Otago University JEOL JXA 8600 electron microprobe. Energy Dispersive Spectroscopic (EDS) analysis was carried out to determine the elemental make-up of mineral grains, and Wavelength Dispersive Spectroscopic Analysis (WDS) analysis, using standard techniques and spec pure metals and oxides as standards, was used to determine specific compositions of potentially useful mineral groups. Heavy minerals identified include magnetite, ilmenite, hematite, rutile, chromite, garnet, zircon, hornblende, kaer-sutite, biotite, chlorite, tourmaline, apatite, titanite, epidote, fuchsite, glauconite, allanite, orthopyroxene, clinopyroxene, gold, and possibly pumpellyite.
MINERAL COMPOSITIONS
Mineral compositions determined by WDS electron micro-probe analysis follow.
RutileMost grains of red-brown rutile are exclusively TiO2, but a few grains contain significant to substantial contents of Nb2O5 (up to 13.9 wt %; Table 2). Niobian rutile has not been described as a detrital phase on West Coast beaches (Hutton 1950; Bradley et al. 1979), but it is widely reported as an accessory phase in granitoid rocks worldwide (e.g., Cerny et al. 1999). Niobian rutile (with up to 18.80 wt% Nb2O5) has been described locally in carbonatitic veins and dikes and in proximal fenites associated with the lamprophyric Alpine Dyke Swarm (Cooper 1971b, fig 8, 9; 1986; unpubl. data), which crops out in the middle reaches of the Haast River.
KaersutiteKaersutite, a TiO2-rich calcic amphibole (with >0.5 Ti cations per formula unit; Leake et al. 1997) has been analysed as a detrital phase (Table 2). Kaersutite occurs as an essential phase of camptonite lamprophyres, which are the dominant

New Zealand Journal of Geology and Geophysics, 2006, Vol. 49210
component of the Alpine Dyke Swarm at Haast River (Cooper 1971b, 1979, 1986). Rare kaersutite-bearing lamprophyres also occur west of the Alpine Fault, intruding Greenland Group greywacke (Cooper & Norris unpubl. data; Randall & Cooper 2004). Based on the abundance of source materials, the most likely source would be the Haast River, but a more proximal Western Province derivation can not be excluded.
Cr-spinelA Cr-rich spinel is a minor but distinctive component of the Knights Point Terrace heavy mineral suite. Compositions are highly variable (Table 2), with Cr# (Cr/Cr + Al) rang-ing from 0.44 to 0.82 and Mg# (Mg/Mg + Fe) from 0.32 to 0.57. Despite the range, Knights Point Terrace compositions overlap with, or lie within, the ranges of Cr-spinels reported by Sinton (1977) from peridotites of the Red Mountain area in the Dun Mountain Ophiolite Belt (Cr# 0.27–0.82, Mg# 0.31–0.69).
OrthopyroxeneSeventeen grains of an enstatite-rich orthopyroxene have been analysed from Knights Point Terrace sediments (see representative analyses in Table 2). The compositions are
uniform, with an average Mg# 0.908 (range 0.901–0.925) and averages of 0.51% Cr2O3 and 2.62% Al2O3. There is excellent correspondence with orthopyroxene from the basal peridotite of the Dun Mountain Ophiolite Belt, with Sinton (1977) citing a range from Mg# 0.909 to 0.922, Cr2O3 cores 0.41–0.78%, rims 0.12–0.53%, Al2O3 cores 0.90–3.60%, rims 0.59–3.01%.
ClinopyroxeneEight grains of detrital clinopyroxene have been analysed from the Knights Point Terrace (representative analyses are reported in Table 2). The average Mg# is 0.855 (range 0.819–0.890), with Al2O3 3.19%, Cr2O3 0.39%, and TiO2 0.64% (range 0.07–1.68%). Sinton (1977) reported clinopy-roxene from the basal peridotite of the Dun Mountain Ophio-lite Belt as having Mg# 0.91–0.95 and with Al2O3 cores 1.06–3.52%, rims 0.33–1.34%, and Cr2O3 cores 0.54–1.18%, rims 0.15–0.43%. Some of the more magnesian of the Knights Point Terrace clinopyroxenes (e.g., analysis 21, Table 2) are similar to the Dun Mountain Ophiolite peridotite clinopy-roxenes, but some of the more ferroan clinopyroxenes (e.g., analysis 17, Table 2) have affinities with the Livingstone Subgroup (the “crustal” part of the Dun Mountain Ophiolite
Table 2 Representative analysis of detrital heavy minerals, Knights Point Terrace (– not analysed; † total Fe as FeO; Cr# = Cr/Cr+Al, Mg# = Mg/Mg+Fe2+, C = Core R = Rim).
Mineral Spinel Orthopyroxene Clinopyroxene Kaersutite Garnet RutileAnalysis no. 2 5 8 15 18 17 21 27 25C 26R 33SiO2 – – – 55.86 56.65 50.47 52.41 38.69 36.84 36.64 –Al2O3 5.43 22.25 13.79 3.49 2.25 4.85 3.15 13.36 21.10 21.30 –TiO2 0.16 0.37 0.43 0.01 0.04 1.14 0.15 6.01 0.08 0.04 80.43FeO† 27.62 24.97 31.47 6.23 5.91 5.17 3.49 10.75 11.24 15.63 6.14MnO 0.35 0.21 0.30 0.13 0.13 0.07 0.00 0.00 22.74 15.56 –MgO 6.06 10.79 7.51 32.95 33.94 15.06 15.84 12.83 0.11 0.15 –CaO – – – 0.77 0.69 22.07 23.96 11.86 8.43 10.47 –Na2O – – – 0.00 0.00 0.36 0.10 2.54 0.00 0.00 –K2O – – – 0.00 0.00 0.00 0.00 1.40 0.00 0.00 –Cr2O3 59.11 40.07 45.00 0.53 0.44 0.18 0.45 0.06 0.00 0.00 –NiO 0.11 0.08 0.09 – – – – – – – –Nb2O5 – – – – – – – – – – 13.87Sum 98.84 98.74 98.59 99.97 100.05 99.39 99.55 97.49 100.54 99.79 100.44RecalculatedFe2O3 5.06 6.82 9.99 – – – – – 1.27 1.36 –FeO 23.07 18.83 22.48 – – – – – 10.l0 14.41 –Total 99.35 99.42 99.59 99.97 100.05 99.39 99.55 97.49 100.67 99.93 100.44Oxygen/ cations 4/3 4/3 4/3 6/- 6/- 6/- 6/- 23/- 12/8 12/8 2/-Si – – – 1.929 1.951 1.866 1.924 5.768 2.958 2.947 –Al 0.224 0.825 0.542 0.142 0.091 0.211 0.136 2.348 1.997 2.019 –Ti 0.004 0.009 0.011 0.000 0.001 0.032 0.004 0.674 0.005 0.002 0.853Fe3+ 0.133 0.161 0.251 – – – – – 0.077 0.082 –Fe2+ 0.675 0.495 0.627 0.180 0.170 0.160 0.107 1.340 0.678 0.969 0.072Mn 0.010 0.006 0.008 0.004 0.004 0.002 0.000 0.000 1.547 1.060 –Mg 0.316 0.506 0.373 1.695 1.742 0.830 0.867 2.851 0.013 0.018 –Ca – – – 0.028 0.025 0.874 0.942 1.895 0.725 0.902 –Na – – – 0.000 0.000 0.026 0.007 0.734 0.000 0.000 –K – – – 0.000 0.000 0.000 0.000 0.264 0.000 0.000 –Cr 1.635 0.996 1.186 0.014 0.012 0.005 0.013 0.007 0.000 0.000 –Ni 0.003 0.002 0.002 – – – – – – – –Nb – – – – – – – – – – 0.088
Cr# 0.82 0.50 0.60 0.09 0.12 0.02 0.09 0.00 – – –Mg# 0.32 0.51 0.37 0.91 0.91 0.84 0.89 0.68 0.02 0.02 –

Cooper & Kostro—Knights Point Terrace 211
Belt), documented by Sinton (1980). However, Livingstone Subgroup rocks contain no orthopyroxene, so can not be the source of the Knights Point Terrace orthopyroxenes.
GarnetGarnet is a very common detrital heavy mineral in the Knights Point Terrace. Thirty grains were examined by EDS, and three analyses determined quantitatively by WDS. The three analyses comprise a core and rim of one grain and the core of another. Compositions of the zoned grain are variable, with Mn-rich cores and Fe-rich rims (analyses 25, 26, Table 2). In terms of end-member molecules, the garnets are domi-nated by grossular-almandine-spessartine. In the discriminant (Fe+Mg)-Mn-Ca diagram used by Mason (1981), the three garnets plot in the Haast Schist garnet field. The high gros-sular and spessartine components rule out possible Western Province sources identified by Mason and others character-ised more recently by Rattenbury (1991) (Fraser Complex) or by Bradshaw (1989) (Western Fiordland Orthogneiss). High spessartine contents and the pronounced zoning pro-file of the Knights Point Terrace garnet indicate derivation from comparatively “low” grade, garnet zone Haast Schists (Brown 1967; Cooper 1972; Mortimer 2000), rather than the more proximal oligoclase zone rocks in the Alpine Fault hanging wall.
AllaniteOne of the grains scanned by EDS contains substantial con-tents of La and Ce, together with Ca, Si, Al, and Fe. This element combination suggests allanite, a common granite or granite pegmatite mineral. Although granitic rocks are not common in the Western Province of South Westland (Randall & Cooper 2004), the allanite is likely to be derived from the Western Province.
SummaryThe pebbles, cobbles, and heavy minerals of the Knights Point Terrace indicate a mixed provenance. Some coarse clastic material (Arnott Basalt, Whakapohai Sandstone, Greenland Group) is locally derived with the strong rounding occurring during high-energy transportation that involved limited lateral displacement. The high-grade (oligoclase zone) amphibolites and quartzofeldspathic schists suggest intermediate distance transport from beyond the Alpine Fault zone, at least 11 km to the southeast. Garnet, Nb-rutile, and kaersutite attest to transport from greater distances, probably from Haast Schist and Alpine Dyke Swarm sources in the eastern or middle reaches of the Haast River catchment (see Fig. 1). “Low” grade garnet zone rocks do occur immediately east of the Alpine Fault in the Jackson River area (Ransley 1983); these areas could have contributed garnet to the Knights Point Terrace, but not the kaersutite and Nb-rutile. Detrital pumpellyite and the piemontite schist pebbles indicate sub-greenschist and greenschist facies derivation, respectively, and require pro-longed transport by either rivers or perhaps valley glaciers or Pleistocene ice sheets from a more distal eastern source. Low-grade rocks exposed near the Main Divide of the Southern Alps are eroded and drained by the Haast River, which flows into the Tasman Sea 22 km southwest of the Knights Point Terrace. A mechanism is also required to transport Haast River detritus to the Knights Point Terrace. Collectively, the Cr-spinels, orthopyroxene, and clinopy-roxene grains indicate unequivocal derivation from the
metamorphic textured basal peridotite and the structurally overlying igneous textured Livingstone Subgroup compo-nents of the Dun Mountain Ophiolite Belt. This belt of rocks is truncated by the Alpine Fault in the middle reaches of the Jackson River, where the unit is almost exclusively composed of serpentinite. Peridotite, capable of yielding detrital or-thopyroxene and clinopyroxene, occurs in significant volumes only in the Cascade River catchment, 75 km southwest of the Knights Point Terrace (Fig. 1). Direct northeast-directed fluvial and/or glacial transport of Dun Mountain Ophiolite Belt detritus to the Knights Point Terrace is impossible given that major intervening rivers drain westwards or northwards from the uplifted Southern Alps, across the plate boundary, to the Tasman Sea. The most likely mechanisms of supply-ing ophiolite detritus to the Knights Point Terrace would be fluvial or glacial transport to the Tasman Sea, with second-ary reworking by longshore drift in a marine environment. A similar northeastern-directed longshore redistribution of Haast River detritus (garnet, piemontite, kaersutite, Nb-ru-tile) is also required to explain their presence in the Knights Point Terrace. The inferred northeast-directed longshore drift hypothesis (which is identical to the present-day offshore current), requires that the Knights Point sequence is a marine terrace.
SURFACE TEXTURES OF QUARTZ CLASTS
Quartz grains and quartz pebbles collected from the Knights Point Terrace and Ship Creek ocean beach were examined at magnifications of up to 1000× by scanning electron mi-croscopy on the JEOL JXA 8600 microprobe. Between 4–6 pebbles and 8–12 grains from each sample were selected at random. The investigated pebbles were on average 5 mm in diameter and the sand grains were of the coarse sand fraction. The characteristic features observed are both mechanical and chemical, although mechanical features predominate.
Quartz pebblesSurface textures of pebbles from the Knights Point Terrace and the present-day beach near Ship Creek are similar and the following description applies therefore to both. Electron microscopy of the well-rounded pebbles reveals rough areas on their surface, defined by micro-relief markings such as pits, breakage patterns, and ridges. Low magnifications show that the surface of the grains is dominated by the occurrence of numerous triangular impact V’s, which are relatively regu-lar and densely distributed over the grains. Sporadic large grooves occur on the surface, which can be associated with pits and irregular blocky margins. Irregular breakage areas are a common feature and can be as extensive as 350 µm in diameter. Some parts of the grains display freshly broken surfaces, which show conchoidal fractures and etching pat-terns under high magnifications. In protected depression areas, some breakage features with rounded edges and corners show rough coatings of a probable silica precipitate.
Quartz grainsDue to the similarity between samples of the Knights Point Terrace and the present-day beach, descriptions of sand grains are treated collectively. Under the electron microscope the grain surfaces show a high density of impact V’s, which are regularly distributed but are on average smaller than the impact V’s observed on the pebbles. Grooves are rare, are up

New Zealand Journal of Geology and Geophysics, 2006, Vol. 49212
to 300 µm in diameter, and show again irregular and often rounded margins. Breakage areas are irregular and occur both as well-defined and as smoothed features. Some grains show large depressions on their surfaces, in which breakage features occur commonly.
Interpretation of surface texturesEven though no single feature is sufficiently diagnostic of environmental conditions, features taken in combination can be indicative of specific environments. Generally, the number of mechanical features and characteristics of the Knights Point Terrace grains show a striking similarity to recent beach grains of the Ship Creek area. This phenomenon is taken as evidence for the subaqueous, beach origin of the Knights Point Terrace. Due to the varying size of impact V’s (some are larger than 1 µm2) and in particular due to the limits of useful magnifica-tions with the electron microprobe (c. 1000×), the numerical energy diagram of Margolis & Kennett (1971) could not be applied. However, since the density of impact features is high and the impact V’s markedly large, a high-turbulence beach is suggested (Krinsley & Doornkamp 1973) as a depositional environment for the Knights Point Terrace. Large impact V’s on pebbles indicate a high-energy depositional environ-ment; these grain collisions and the rolling of grains along the surface of a beach by waves and currents are assumed to be responsible for the high density of impacts, grooves, and for the well-rounded texture. Conchoidal fractures with razor sharp edges are interpreted as fresh breakage features and are again an indicator of a high-energy environment, such as the swash zone of a beach face, where grains and pebbles hit against each other or are saltated along the bottom. Breakage features with rounded edges and corners, weath-ered surface features, and upturned plates can be taken as evidence that pebbles are not directly derived from a fresh source material (Krinsley & Doornkamp 1973). Breakage features within large depressions on sand grains can be ex-plained as due to older impacts, which survived mechanical abrasion due to their protection in hollows.
SYNTHESIS OF DEPOSITIONAL ENVIRONMENT
Aspects of the sedimentary facies, of the grain-size charac-teristics, of the surface textures of individual clasts, and of the inferred provenance of the Knights Point Terrace detritus are compatible with a high-energy marine origin for the sedimentary sequence. The dominance of coarse-grained pebble-rich detritus, deposited on an unconformable surface of considerable relief cut into the local bedrock, the presence of well-rounded clasts with a pronounced negative skewness, the presence of impact V’s of coarse size and high surface density on sand and pebble grains, and the presence of heavy minerals that can only have been deposited from longshore currents all attest to deposition in a beach environment. The inferred high-energy environment is compatible with deposi-tion within the breaker or swash zone of a coastal beach, where turbulence is at a maximum (Folk 1980). Episodic very high energy events are assumed to be storm waves, which have a stronger influence on shallower water than on deeper water. The coarse-grained, pebble rich, and poorly sorted nature of the terrace deposits is typical of unstable coasts that receive high sediment influxes from coastal cliffs (Folk 1980). Turbulence of breakers, in particular during storms, is as-sumed to have attacked these coastal cliffs, which, according
to most of the pebbles, and to the basement rocks of the ter-race sequence, consisted of Arnott Basalt and Whakapohai Sandstone. A marine terrace, according to Pillans (1990), is defined as a gently sloping, subplanar landform “bounded along one edge by a steeper descending slope and along the other by a steeper ascending slope”. The sediments overlying the wave-cut platform are referred to as coverbeds and indicate that the Knights Point Terrace is a constructional surface above the underlying erosional wave-cut platform. The strandline is defined as the inner edge of the wave-cut platform where the platform meets the fossil sea cliffs and represents the culmination of platform cutting (Pillans 1990). The strandline could not be located accurately within the Knights Point area, although the presence of a bouldery lag at the base of Facies 1 indicates, by analogy with modern environments, proximity of bounding sea cliffs. Predominantly northwards dipping cross-beds (Facies 1 and 4) within the terrace succession indicate a prevailing longshore current from south to north, compatible with results from the provenance analysis. In contrast, imbricated pebbles of Facies 5 and slightly inclined pebbles of Facies 6 are in-terpreted as indicators of a paleocurrent direction from north to south. These deposits could be explained as a consequence of tidal activity. The entire sedimentary succession from the basal bouldery layer of Facies 1 to the coarse to medium sand of Facies 7 indicates a transgressive system. It is characterised by deposition within an environment of incessant and vigorous changes in high-energy conditions. The deposition of these marine coverbeds shows that rising sea level proceeded after platform cutting was completed and exceeded the uplift of the terrace. Fining upward and better sorting towards the upper units of the terrace is taken as evidence for a stabilising coastline, suggesting sea-level rise had ceased. Overall, the marine coverbeds of the terrace are interpreted as a deposit within a dynamic and rapidly fluctuating coast, which evolved during the deposition of the coverbeds into a relatively stable coast. The uppermost surface of the marine coverbeds is interpreted as the “maximum flooding surface”. It represents the level at which relative sea level reached its maximum with respect to uplift. At this point, sea-level rise was either constant with uplift, or slower, thus completing the deposition of the terrace sediments before sea-level fall with respect to uplift. The present-day occurrence of the top of the Knights Point sedimentary succession at an altitude of 113 m clearly identi-fies the terrace as tectonically uplifted.
AGE AND CORRELATION
AgeOptically Stimulated Luminescence dating has been used to determine the timing of last light exposure (inferred to be the depositional age) of two sand samples from the Knights Point Terrace. Localities are indicated on Fig. 3. Details of the experimental technique are described in Formento-Trigilio et al. (2002), and results are summarised in Table 3. Sample KP-03-TL incurred slight radioactive disequilibrium and its age could therefore be slightly younger than that stated. The first date (123.0 ± 7.0 ka, 1 σ) is therefore taken as the more reliable estimate of the age of sedimentation. As discussed
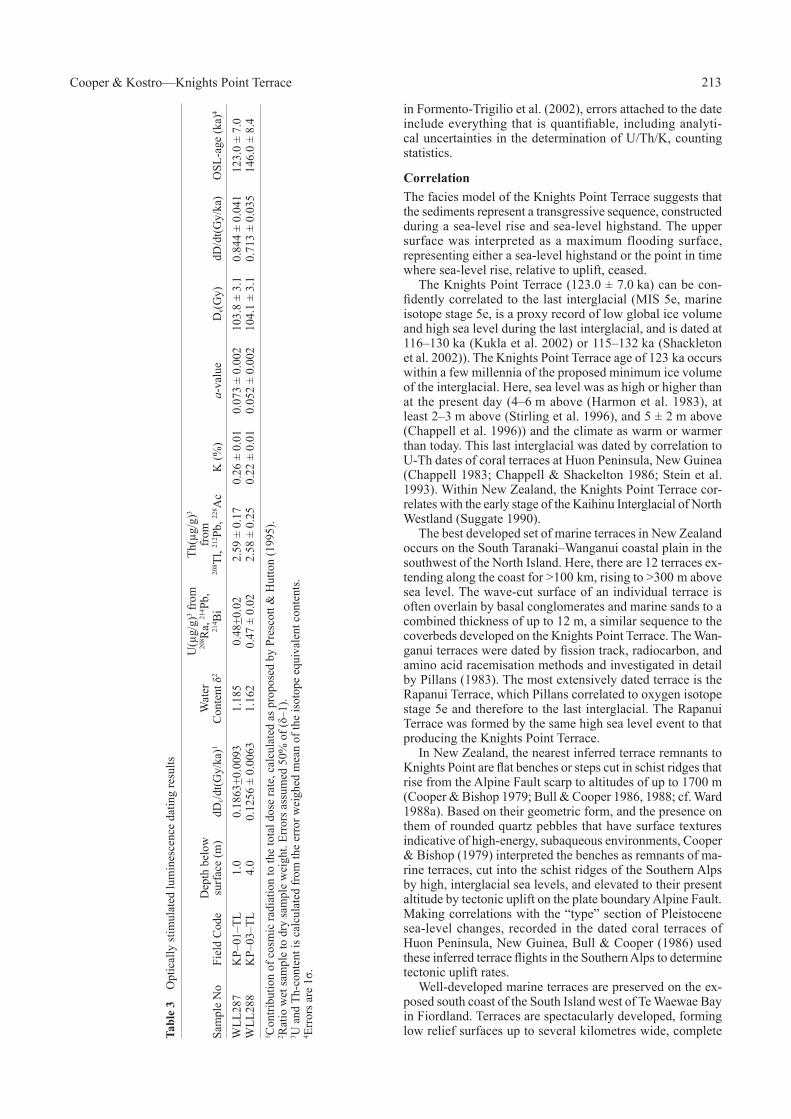
Cooper & Kostro—Knights Point Terrace 213
in Formento-Trigilio et al. (2002), errors attached to the date include everything that is quantifiable, including analyti-cal uncertainties in the determination of U/Th/K, counting statistics.
CorrelationThe facies model of the Knights Point Terrace suggests that the sediments represent a transgressive sequence, constructed during a sea-level rise and sea-level highstand. The upper surface was interpreted as a maximum flooding surface, representing either a sea-level highstand or the point in time where sea-level rise, relative to uplift, ceased. The Knights Point Terrace (123.0 ± 7.0 ka) can be con-fidently correlated to the last interglacial (MIS 5e, marine isotope stage 5e, is a proxy record of low global ice volume and high sea level during the last interglacial, and is dated at 116–130 ka (Kukla et al. 2002) or 115–132 ka (Shackleton et al. 2002)). The Knights Point Terrace age of 123 ka occurs within a few millennia of the proposed minimum ice volume of the interglacial. Here, sea level was as high or higher than at the present day (4–6 m above (Harmon et al. 1983), at least 2–3 m above (Stirling et al. 1996), and 5 ± 2 m above (Chappell et al. 1996)) and the climate as warm or warmer than today. This last interglacial was dated by correlation to U-Th dates of coral terraces at Huon Peninsula, New Guinea (Chappell 1983; Chappell & Shackelton 1986; Stein et al. 1993). Within New Zealand, the Knights Point Terrace cor-relates with the early stage of the Kaihinu Interglacial of North Westland (Suggate 1990). The best developed set of marine terraces in New Zealand occurs on the South Taranaki–Wanganui coastal plain in the southwest of the North Island. Here, there are 12 terraces ex-tending along the coast for >100 km, rising to >300 m above sea level. The wave-cut surface of an individual terrace is often overlain by basal conglomerates and marine sands to a combined thickness of up to 12 m, a similar sequence to the coverbeds developed on the Knights Point Terrace. The Wan-ganui terraces were dated by fission track, radiocarbon, and amino acid racemisation methods and investigated in detail by Pillans (1983). The most extensively dated terrace is the Rapanui Terrace, which Pillans correlated to oxygen isotope stage 5e and therefore to the last interglacial. The Rapanui Terrace was formed by the same high sea level event to that producing the Knights Point Terrace. In New Zealand, the nearest inferred terrace remnants to Knights Point are flat benches or steps cut in schist ridges that rise from the Alpine Fault scarp to altitudes of up to 1700 m (Cooper & Bishop 1979; Bull & Cooper 1986, 1988; cf. Ward 1988a). Based on their geometric form, and the presence on them of rounded quartz pebbles that have surface textures indicative of high-energy, subaqueous environments, Cooper & Bishop (1979) interpreted the benches as remnants of ma-rine terraces, cut into the schist ridges of the Southern Alps by high, interglacial sea levels, and elevated to their present altitude by tectonic uplift on the plate boundary Alpine Fault. Making correlations with the “type” section of Pleistocene sea-level changes, recorded in the dated coral terraces of Huon Peninsula, New Guinea, Bull & Cooper (1986) used these inferred terrace flights in the Southern Alps to determine tectonic uplift rates. Well-developed marine terraces are preserved on the ex-posed south coast of the South Island west of Te Waewae Bay in Fiordland. Terraces are spectacularly developed, forming low relief surfaces up to several kilometres wide, complete Ta
ble
3 O
ptic
ally
stim
ulat
ed lu
min
esce
nce
datin
g re
sults
Sam
ple
No
Fiel
d C
ode
Dep
th b
elow
su
rfac
e (m
)dD
c/dt(G
y/ka
)1W
ater
C
onte
nt δ
2
U(µ
g/g)
3 fro
m
208 R
a, 21
4 Pb,
214 B
i
Th(µ
g/g)
3
from
208 T
l, 21
2 Pb,
228 A
cK
(%)
a-va
lue
De(G
y)dD
/dt(G
y/ka
)O
SL-a
ge (k
a)4
WLL
287
KP–
01–T
L1.
00.
1863
+0.0
093
1.18
50.
48+0
.02
2.59
± 0
.17
0.26
± 0
.01
0.07
3 ±
0.00
210
3.8
± 3.
10.
844
± 0.
041
123.
0 ±
7.0
WLL
288
KP–
03–T
L4.
00.
1256
± 0
.006
31.
162
0.47
± 0
.02
2.58
± 0
.25
0.22
± 0
.01
0.05
2 ±
0.00
210
4.1
± 3.
10.
713
± 0.
035
146.
0 ±
8.4
1 Con
tribu
tion
of c
osm
ic ra
diat
ion
to th
e to
tal d
ose
rate
, cal
cula
ted
as p
ropo
sed
by P
resc
ott &
Hut
ton
(199
5).
2 Rat
io w
et sa
mpl
e to
dry
sam
ple
wei
ght.
Erro
rs a
ssum
ed 5
0% o
f (δ–
1).
3 U a
nd T
h-co
nten
t is c
alcu
late
d fr
om th
e er
ror w
eigh
ed m
ean
of th
e is
otop
e eq
uiva
lent
con
tent
s.4 E
rror
s are
1σ.

New Zealand Journal of Geology and Geophysics, 2006, Vol. 49214
with fossil seastacks and islands, and bounded on their inland side by prominent seacliffs. At least 13 terraces were investi-gated by Ward (1988b), occurring up to altitudes of 1040 m, with Terrace 4 at 140 m correlated with MIS 5e (Ward 1988b). The western end of this flight of southern Fiordland terraces has been documented by Bishop (1991). Using a morphos-tratigraphic comparison of Fiordland and Taranaki terraces, Bishop prefers a different correlation (his H6 terrace) with the 120 ka (=MIS 5e) Rapanui Terrace of Pillans (1983). In summary, the Knights Point Terrace was formed during the high sea-level period of the last interglacial somewhere between 120 and 130 ka (MIS 5e) and correlates to other independently dated marine terraces such as terrace VIIb of the Huon Peninsula (New Guinea), the Rapanui Terrace in Taranaki (New Zealand) (Pillans 1983), and inferred correla-tives of Terrace 4 (Ward 1988b) or Terrace H6 (Bishop 1991) in southern Fiordland.
UPLIFT RATES
Pleistocene marine terraces above 5 m are usually inferred to be tectonically or isostatically uplifted (Pillans 1990) since the paleosea level of the late Quaternary has never been higher than c. 5 m above the present in absolute terms (e.g., Veeh & Chappell 1970; Harmon et al. 1983; Chappell et al. 1996; Stirling et al. 1996). There are as yet only a few reliable numerical ages for marine terraces in New Zealand, even though flights of marine terraces or their remnants are widely distributed (Pillans 1990, fig. 1) and have been the subject of many studies. The numerical age of the Knights Point Terrace is of significance for determining uplift rates of the Australian plate in South Westland and is important for understanding tectonic history and movements along the Alpine Fault plate boundary. According to Pillans (1990), the following parameters are needed to determine tectonic uplift rates [U] of marine terraces: (1) the age [T] of the marine terrace; (2) the present height [H] of the marine terrace; (3) the height [E] at which some features such as the strandline was formed relative to the paleosea level; and (4) sea-level height [S] relative to the present, at the time the marine terrace was formed. Since the luminescence samples were taken from Facies 7 (at an altitude of 112 m for KP-01-TL) that is interpreted as beach sand, the height [E] relative to paleosea level is assumed to be 0. Paleosea-level curves from the late Quaternary show a peak at c. 125 ka, where sea level appears to have been 5 ± 2 m above the present level (Veeh & Chappell 1970; Har-mon et al. 1983; Chappell et al. 1996; Stirling et al. 1996). The height of the inner edge of the shore platform at Knights Point is unknown, so tectonic uplift is calculated using the maximum altitude of the shore platform itself, resulting in rates that are minimum estimates. With this estimate, and the assumptions discussed above, an uplift rate of 0.86 mm/yr for the Australian plate in the field area is calculated. Uplift rates using heights of marine terraces in New Zea-land have been estimated by several workers (e.g., Pillans 1983; Bull & Cooper 1986; Ward 1988b; Bishop 1991), even though they are only rarely based on numerical ages. Ward (1988b) inferred an uplift rate of 1.1 mm/yr for the southern Fiordland region, east of the Alpine Fault. Ward (1988b) based this calculation of the uplift rate on a correlated age of Terrace 4, which in this work is matched with the Knights Point Terrace. Since Bishop correlated his H6 terrace (at an
altitude of 370 m) with the 120–125 ka interglacial highstand, his inferred uplift rate of 3.0 mm/yr is almost three times that advocated by Ward (1988b). Pillans (1983) inferred varying uplift rates for South Taranaki of 0.29–0.54 mm/yr, based on the height of the Rapanui Terrace. Uplift rates east of the Alpine Fault (Pacific plate) on the South Island, estimated by Bull & Cooper (1986), show sig-nificantly higher values. Bull & Cooper (1986) investigated sequences of inferred marine terraces in the Southern Alps and used their altitudinal spacing for determining uplift rates. They suggested that an altitudinal spacing of marine terraces is uniquely determined by the uplift rate, and the highly vari-able altitudes of former sea-level highstands. Correlation of the terraces with the sea-level record of the Huon Peninsula allowed Bull & Cooper (1986) to infer uplift rates even where no other estimates or dates were available. Uplift rates of up to 7.8 mm/yr were calculated for the Southern Alps, east of the Alpine Fault, values that are broadly compatible with estimates using other evidence (e.g., Simpson et al. 1994; Norris & Cooper 2000). Bull & Cooper (1986) extended this method to inferred terrace remnants west of the Alpine Fault, determining an uplift rate of the Australian plate, west of the Alpine Fault, and in the general area of Knights Point of 0.87 mm/yr over the past 150 k.y. The calculated uplift of 0.86 mm/yr for the Knights Point Terrace from this work is in good agreement with that postu-lated by Bull & Cooper (1986).
STRIKE-SLIP DISPLACEMENT RATES
The displacement by >95 km of Pliocene sediments on the Australian plate from their source on the Pacific plate has been used to calculate rates of lateral motion on the Alpine Fault plate boundary (Sutherland 1994). The calculation as-sumed that no sedimentary transport had occurred parallel to the Alpine Fault, based on independent lines of evidence. In contrast, this study has demonstrated that 125 ka sedi-ments of the Knights Point terrace contain detritus that has been transported by at least 20 km (from Haast River) and in part 85 km (from Cascade Valley) parallel to the present-day coastline by longshore drift. The present day, nearshore, oceanic circulation on the West Coast of the South Island has effectively not changed since the last interglacial. If this pat-tern of longshore drift persists back into the Cenozoic, then strike-slip displacement estimates for the Alpine Fault, based on the offset of Australian plate sediments from their Pacific plate sources, must be made with caution.
CONCLUSIONS
The Knights Point Terrace comprises a subhorizontal sedi-mentary sequence, up to 11 m thick, resting unconformably on steeply dipping Cretaceous Arnott Basalt or Whakapohai Sandstone in South Westland, New Zealand. Sediments range from a boulder bed at the base to medium sands at the top in an overall upward-fining transgressive sequence. Sediments are poorly sorted and negatively skewed, indicating pronounced winnowing of fine material. High densities of impact features on grain surfaces attest to high-energy turbulent environ-ments, and are similar to features on quartz clasts from the modern open ocean beach. Sedimentary detritus is varied and multi-sourced; some material has been derived from the

Cooper & Kostro—Knights Point Terrace 215
local West Coast stratigraphic sequence, other material comes from the high-grade Haast Schists of the nearby Alpine Fault scarp, but other eastern sources are more distal, from as far afield as the low-grade schists close to the Main Divide. A significant heavy mineral component has been identified as derived from the Dun Mountain Ophiolite Belt, some 85 km to the southwest, with material transported by a combination of fluvial/glacial and longshore drift processes. Combined evidence strongly suggests a beach environment of deposi-tion, implying that the terrace sequence is marine. Based on an optical luminescence age of 123 ka deter-mined on beach sands from the upper part of the coverbed sequence, the Knights Point Terrace is confidently assigned to the last interglacial (MIS 5e), allowing correlations with other terrace sequences in New Zealand, New Guinea, and else-where around the world. The present altitude of the Knights Point Terrace is ascribed to tectonic uplift as a consequence of proximity to the Australian-Pacific plate boundary. Assuming constant uplift, a rate of 0.86 mm/yr is calculated.
ACKNOWLEDGMENTS
We are grateful to John Youngson who gave valuable help with heavy mineral identification, Lorraine Paterson who assisted with electron microprobe analysis, Brent Pooley who produced grain mounts and thin sections, and Steve Read who produced and modified some of the figures. We acknowledge with thanks Uwe Rieser, Luminescence Dating Laboratory, School of Earth Sciences, Victoria University of Wellington, who determined the OSL dates. The Foundation for Research Science and Technology is acknowledged for funding a research programme investigating the origin of the Southern Alps. Our thanks to Bill Bull, Peter Almond, and Andy Nicol for their critical reviews of the paper. Their comments, and the editorial assistance of Rob Lynch, have significantly improved the manuscript
REFERENCES
Aronson JL 1968. Regional geochronology of New Zealand. Geo-chimica et Cosmochimica Acta 32: 669–697.
Bishop DG 1991. High-level marine terraces in western and southern New Zealand: indicators of the tectonic tempo of an active continental margin. Special Publications of the International Association of Sedimentologists 12: 69–78.
Bradley JP, Wilkins CJ, Oldershaw W, Smale D 1979. A study of heavy minerals in the Taramakau catchment. Journal of the Royal Society of New Zealand 9: 233–251.
Bradshaw JY 1989. Origin and metamorphic history of an Early Cretaceous polybaric granulite terrain, Fiordland, southwest New Zealand. Contributions to Mineralogy and Petrology 103: 346–360.
Brown EH 1967. The greenschist facies in part of eastern Otago, New Zealand. Contributions to Mineralogy and Petrology 14: 259–292.
Bull WB, Cooper AF 1986. Uplifted marine terraces along the Alpine Fault, New Zealand. Science 234: 1225–1228.
Bull WB, Cooper AF 1988. New Zealand marine terraces: uplift rates (response). Science 240: 804–805.
Cerny P, Chapman R, Simmons WB, Chackowsky LE 1999. Niobian rutile from the McGuire granitic pegmatite, Park County, Colorado: solid solution, exsolution and oxidation. American Mineralogist 84: 754–763.
Chappell J 1983. A revised sea level record for the last 300 000 years from Papua New Guinea. Search 4: 99–101.
Chappell J, Shackleton NJ 1986. Oxygen isotopes and sea level. Nature 324: 137–140.
Chappell J, Omura A, Esat T, McCulloch M, Pandolfi J, Ota Y, Pil-lans B 1996. Reconciliation of late Quaternary sea levels derived from coral terraces at Huon Peninsula with deep sea isotope records. Earth and Planetary Science Letters 141: 227–236.
Cooper AF 1971a. Piemontite schists from Haast River, New Zea-land. Mineralogical Magazine 38: 64–71.
Cooper AF 1971b. Carbonatites and fenitization associated with a lamprophyre dyke-swarm intrusive into schists of the New Zealand Geosyncline. Geological Society of America Bul-letin 82: 1327–1340.
Cooper AF 1972. Progressive metamorphism of metabasic rocks from the Haast Schist Group of southern New Zealand. Journal of Petrology 13: 457–492.
Cooper AF 1979. Petrology of ocellar lamprophyres from western Otago, New Zealand. Journal of Petrology 20: 139–163.
Cooper AF 1980. Retrograde alteration of chromian kyanite in metachert and amphibolite whiteschist from the Southern Alps, New Zealand, with implications for uplift on the Alpine Fault. Contributions to Mineralogy and Petrology 75: 153–164.
Cooper AF 1986. A carbonatitic lamprophyre dyke swarm from the Southern Alps, Otago and Westland, New Zealand. Royal Society of New Zealand Bulletin 23: 313–336.
Cooper AF, Bishop DG 1979. Uplift rates and high level marine platforms associated with the Alpine Fault at Okuru River, South Westland. Royal Society of New Zealand Bulletin 18: 35–43.
Cooper RA 1975. Age of the Greenland and Waiuta Groups, South Island, New Zealand. New Zealand Journal of Geology and Geophysics 17: 955–962.
Folk RL 1980. Petrology of sedimentary rocks. 2nd ed. Austin, Texas, Hemphill Publ. Co. 184 p.
Formento-Trigilio ML, Burbank DW, Nicol A, Shulmeister J, Rieser U 2002. River response to an active fold-and-thrust belt in a convergent margin setting, North Island, New Zealand. Geomorphology 49: 125–152.
Friedman GM 1961. Distinction between dune, beach and river sands from their textural characteristics. Journal of Sedimentary Petrology 31: 514–529.
Gair HS, Gregg DR 1962. Geology of the Whakapohai River to Bull-ock Creek section of the Paringa-Haast road. Unpublished report, New Zealand Geological Survey.
Harmon RS, Mitterer RM, Kriausakul N, Land LS, Schwarcz HP, Garrett P, Larson GJ, Vacher HL, Rowe M 1983. U-series and amino-acid racemization geochronology of Bermuda: implications for eustatic sea-level fluctuation over the past 250 000 years. Palaeogeography, Palaeoclimatology, Pal-aeoecology 44: 41–70.
Hull AG, Berryman KR 1986. Holocene tectonism in the region of the Alpine Fault at Lake McKerrow, Fiordland, New Zealand. Royal Society of New Zealand Bulletin 24: 317–331.
Hutton CO 1950. Studies of heavy detrital minerals. Geological Society of America Bulletin 61: 635–716.
Ireland TR 1992. Crustal evolution of New Zealand: evidence from age distributions of detrital zircons in Western Province paragneisses and Torlesse greywacke. Geochimica et Cos-mochimica Acta 56: 911–920.

New Zealand Journal of Geology and Geophysics, 2006, Vol. 49216
Kostro F 2003. Sedimentary architecture and age of the Knights Point Terrace, South Westland, New Zealand. Unpublished Postgraduate Diploma of Science dissertation, University of Otago Library, Dunedin, New Zealand.
Krinsley DH, Doornkamp JC 1973. Atlas of quartz sand surface textures. Cambridge University Press. 91 p.
Kukla GJ, Bender ML, de Beaulieu JL and others 2002. Last Inter-glacial climates. Quaternary Research 58: 2–13.
Leake BE, Woolley AR, Arps CES and others 1997. Nomenclature of amphiboles; Report of the Subcommittee on Amphiboles of the International Mineralogical Association Commission on New Minerals and Mineral Names. American Mineralo-gist 82: 1019–1037.
McNaughton DA, Gibson FA 1970. Reef play developing in New Zealand. Oil and Gas Journal 68: 89–95.
Margolis SV, Kennett JP 1971. Antarctic glaciation during the Tertiary recorded in sub-Antarctic deep-sea cores. Science 170: 1085–1087.
Martins LR 1965. Significance of skewness and kurtosis in envi-ronmental interpretation. Journal of Sedimentary Petrology 35: 768–770.
Mason B 1981. Garnet compositions in metamorphic rocks and granites of Westland, New Zealand. Journal of the Royal Society of New Zealand 11: 35–43.
Mason CC, Folk RL 1958. Differentiating beach, dune, and aeolian flat environments by size analysis, Mustang Island, Texas. Journal of Sedimentary Petrology 28: 211–226.
Mortimer N 2000. Metamorphic discontinuities in orogenic belts: example of the garnet-biotite-albite zone in the Otago Schist, New Zealand. International Journal of Earth Science 89: 295–306.
Nathan S 1975. Late Quaternary terraces between Ship Creek and the Whakapohai River, South Westland, New Zealand. Journal of the Royal Society of New Zealand 5: 313–327.
Nathan S 1977. Cretaceous and lower Tertiary stratigraphy of the coastal strip between Buttress Point and Ship Creek, South Westland, New Zealand. New Zealand Journal of Geology and Geophysics 20: 615–654.
Norris RJ, Cooper AF 2000. Late Quaternary slip rates and slip partitioning on the Alpine Fault, New Zealand. Journal of Structural Geology 23: 507–520.
Phillips CJ, Cooper AF, Palin JM, Nathan S 2005. Geochronological constraints on Cretaceous–Paleocene volcanism in South Westland, New Zealand. New Zealand Journal of Geology and Geophysics 48: 1–14.
Pillans B 1983. Upper Quaternary marine terrace chronology and deformation, South Taranaki, New Zealand. Geology 11: 292–297.
Pillans B 1990. Pleistocene marine terraces in New Zealand: a review. New Zealand Journal of Geology and Geophysics 33: 219–231.
Prescott JR, Hutton JT 1995. Environmental dose rates and radio-active disequilibrium from some Australian luminescence dating sites. Quaternary Science Reviews 14: 439–448.
Randall SB, Cooper AF 2004. Geology of metasediments and intrusive rocks of the Haast region, South Westland. Geo-logical Society of New Zealand Miscellaneous Publication 117a: 84.
Ransley JF 1983. The geology of the Jackson River catchment, south-ern Westland. Unpublished BSc (Hons) thesis, University of Otago Library, Dunedin, New Zealand.
Rattenbury MS 1991. The Fraser Complex: high-grade metamorphic, igneous and mylonitic rocks in central Westland. New Zea-land Journal of Geology and Geophysics 34: 23–33.
Sevon WD 1965. Distinction of New Zealand beach, dune, and river sand by their grain size distribution characteristics. New Zealand Journal of Geology and Geophysics 9: 213–223.
Shackleton NJ, Chapman M, Sanchez-Goni MF, Pailler D, Lancelot Y 2002. The classic Marine Isotope Substage 5e. Quaternary Research 58: 14–16.
Simpson GDH, Cooper AF, Norris RJ 1994. Late Quaternary evolu-tion of the Alpine Fault Zone at Paringa, South Westland, New Zealand. New Zealand Journal of Geology and Geo-physics 37: 49–58.
Sinton JM 1977. Equilibration history of the basal Alpine-type pe-ridotite, Red Mountain, New Zealand. Journal of Petrology 18: 216–246.
Sinton JM 1980. Petrology and evolution of the Red Mountain Ophiolite Complex, New Zealand. American Journal of Science 280A: 296–328.
Stein M, Wasserburg GJ, Aharon P, Chen JH, Zhu ZR, Bloom A, Chappell J 1993. TIMS U-series dating and stable isotopes of the last interglacial event in Papua New Guinea. Geochimica et Cosmochimica Acta 57: 2541–2554.
Stirling CH, Esat TM, McCulloch MT, Lambeck K 1996. High-pre-cision U-series dating of corals from Western Australia and implications for the timing and duration of the last intergla-cial. Earth and Planetary Science Letters 135: 115–130.
Suggate RP 1965. Late Pleistocene geology of the northern part of the South Island, New Zealand. New Zealand Geological Survey Bulletin 77. 91 p.
Suggate RP 1990. Late Pliocene and Quaternary glaciations of New Zealand. Quaternary Science Reviews 9: 175–197.
Sutherland R 1994. Displacement since the Pliocene along the southern section of the Alpine Fault, New Zealand. Geol-ogy 22: 327–330.
Sutherland R 1999. Cenozoic bending of New Zealand basement terranes and Alpine Fault displacement: a brief review. New Zealand Journal of Geology and Geophysics 42: 295–301.
Sutherland R, Norris RJ 1995. Late Quaternary displacement rate, paleoseismicity, and geomorphic evolution of the Alpine Fault: evidence from Hokuri Creek, South Westland, New Zealand. New Zealand Journal of Geology and Geophysics 38: 419–430.
Veeh HH, Chappell J 1970. Astronomical theory of climatic change support from New Guinea. Science 167: 862–865.
Ward C 1988a. New Zealand marine terraces: uplift rates (comment). Science 240: 803–804.
Ward C 1988b. Marine terraces of the Waitutu district and their rela-tion to the late Cenozoic tectonics of the southern Fiordland region, New Zealand. Journal of the Royal Society of New Zealand 18: 1–28.
Wellman HW 1955. Geology of Bruce Bay-Haast River. New Zea-land Geological Survey Bulletin 48.
Wellman HW 1979. An uplift map for the South Island of New Zealand, and a model for uplift of the Southern Alps. Royal Society of New Zealand Bulletin 18: 13–20.
Wellman HW, Willett RW 1942. The geology of the West Coast from Abut Head to Milford Sound. Part 2 Glaciation. Transactions of the Royal Society of New Zealand 72: 199–219.
Young DJ 1968. Engineering geology of the Paringa-Haast section of State Highway six, South Westland. New Zealand Journal of Geology and Geophysics 11: 1134–1158.