2012 capital bikeshare member survey report
TRANSCRIPT

2012 Capital Bikeshare Member Survey Report
Prepared by: LDA Consulting
Washington, DC 20015 (202) 548-0205
May 22, 2013

Capital Bikeshare 2012 Member Survey Report May 22, 2013
i
EXECUTIVE SUMMARY
Overview
This report presents the results of the November 2012 Capital Bikeshare Customer Use and Satisfaction Survey conducted for the Capital Bikeshare program (Capital Bikeshare). Capital Bikeshare, a program jointly owned and sponsored by the District of Columbia, Arlington County, VA, and the City of Alexan-dria, VA, and operated by Alta Bicycle Share, Inc., offers short-term use of more than 1,650 bicycles to registered members and day-pass users at more than 175 stations in the District of Columbia, Arlington County, and the City of Alexandria. Users register for an annual or 30-day membership and receive a Capital Bikeshare key that allows them to unlock a bike at any station. Users can return the bike to the same station or to any other station in the network, facilitating both return and one-way trips. Capital Bikeshare’s management was interested in users’ experience with the program and exploring bikeshare’s impact on users’ travel patterns. The survey was conducted for the following primary pur-poses; to examine:
Demographic characteristics of Capital Bikeshare users Characteristics of Capital Bikeshare trips Travel changes made in response to Capital Bikeshare availability Users’ satisfaction with Capital Bikeshare features
Capital Bikeshare staff sent an email to approximately 11,100 members, half of the total 22,200 mem-bers, informing them of the online survey and providing the link to the survey website. The email indi-cated that Capital Bikeshare was offering entry into a drawing to win an iPad to members who com-pleted the survey. To increase the response rate further, Capital Bikeshare sent a reminder in the monthly e_newsletter that is distributed to all members. During the approximately four-week period that the survey website was active, 3,731 members completed the survey, for a total response rate of 34%. At about the same time period, Capital Bikeshare staff distributed a second online survey, in coopera-tion with researchers at George Washington University, to study CB’s health-related impacts. To enable the Travel Survey and Health Survey to be conducted simultaneously, members were randomly assigned to one of the two surveys. Thus, the health survey also was distributed to approximately 11,100 mem-bers, using the same email distribution and direct access survey link method as was used for the Travel Survey. A total of 3,111 Health Surveys were completed, for a response rate of 28%. Several of the Travel Survey questions also were included in the Health Survey. Comparison of results for the Travel Survey and Health Survey populations on key demographic questions indicated that the popu-lations were not statistically different, thus data for the 3,111 Capital Bikeshare members who partici-pated in the Health Survey were added to the Travel Survey data for these questions, bringing the total sample for some Travel Survey questions to 6,842.
Key Conclusions
Several overall conclusions, generally related to the personal travel benefits and travel impacts of bikesharing rise to the top of importance.

Capital Bikeshare 2012 Member Survey Report May 22, 2013
ii
Capital Bikeshare members benefit through easier, faster access to destinations and access to a wider range of destinations – Four in ten respondents had made a trip in the past month that they would not have made without bikeshare. Of these respondents, 61% said they would not have made the trip because it was too far to walk, so bikeshare broadened their travel destination options. Other respondents reported reasons related to the difficulty of travel or disadvantages of driving to a particular destination or at a particular time of day. For these members, bikeshare expands their easy and convenient travel options.
The “transit access” role that bikeshare offers expands travel range even further – Over half (54%) of respondents said at least one of the bikeshare trips they made last month either started or ended at a Metrorail station; 17% had used bikeshare six or more times for this purpose. About a quarter (23%) of respondents used Capital Bikeshare to access a bus in the past month.
Capital Bikeshare makes travel fun and more flexible – More than three-quarters of members said they were motivated to join Capital Bikeshare to have access to a new travel option or a one-way travel option, or simply because they enjoy biking. The opportunity to make one-way trips by bikeshare is particularly valuable to many members, who now have a wealth of travel options – bikeshare, transit, taxi, walking, carshare – that they can choose “in the moment,” increasing their travel flexibility.
Bikeshare serves both work-related and personal travel needs – Seven in ten respondents reported that they at least occasionally use bikeshare for social/entertainment and errands/personal appoint-ments trips, 66% use bikeshare to go out for a meal, and 55% use bikeshare for shopping trips, all non-work purposes. But 58% of respondents use bikeshare to go to or from work and 40% use bikeshare “often” for this purpose. Since commuting is a frequent and required trip, bikeshare is serving a valuable basic travel function for members who commute by bikeshare.
Capital Bikeshare allows members to give up the cost and hassle of car ownership and driving – More than half of the Capital Bikeshare members surveyed don’t have access to a car or other personal vehicle. Five percent of all members surveyed had sold a household vehicle since joining CB and 81% of these members said bikeshare was a factor in their decision to sell the vehicle. A quarter of respondents said they reduced their driving miles since joining Capital Bikeshare. Across all re-spondents, the average driving reduction was 198 miles per year, equating to about 4.4 million fewer driving miles by the 22,200 bikeshare members (in November 2012).
Bikeshare members appear to have shifted some trips to bicycle from taxi, transit, and walking – A quarter of respondents increased their use of bicycling since joining Capital Bikeshare. By comparison, respondents reduced use of all other transportation modes; 50% drove a car less often, 60% use a taxi less often,61% ride Metrorail less often, 52% ride a bus less often, and 52% decreased their use of walking, suggesting some shifts to biking from other modes.
Bikeshare members who used Capital Bikeshare frequently reported the greatest reduction in use of non-bicycle modes – For example, 72% of respondents who made 11 or more CB trips in the past month said they reduced their use of Metrorail, compared with 47% of respondents who made one or two CB trips in the past month, a net additional reduction of 25 percentage points. The results are similar for other non-bike mode groups; the share of respondents who reduced use of a non-biking mode since they joined Capital Bikeshare increases steadily as their bikeshare use increases.
On average, each Capital Bikeshare member saves $800 per year on personal travel cost – Re-spondents reported saving an average of $15.39 per week on personal transportation costs as a re-sult of their bikeshare use, about $800 over the course of the year. Across the estimated 22,200 Capital Bikeshare members in November 2012, the collective saving is nearly $18 million each year.

Capital Bikeshare 2012 Member Survey Report May 22, 2013
iii
Respondents give high marks to most bikeshare features – More than seven in tens give ratings of 4 or 5 (Excellent) to Capital Bikeshare website, safety of stations, mechanical repair of bikes, call center, and map at Capital Bikeshare stations. Respondents are less satisfied with the nighttime lighting at the stations; 55% of respondents rate this feature as 4 or 5.
CB members are eager for expansion of Capital Bikeshare – The most noted expansion need ap-pears to be for more docks at existing stations; 47% of respondents chose this option for greater ac-cess to bikes in popular bikeshare pick-up and drop-off locations. The second highest priority is for new stations in residential neighborhoods (43%), perhaps indicating a desire for greater access to bikeshare for short trips within or from a home neighborhood. About a third (36%) of respondents said they wanted expansion to areas that bikeshare doesn’t serve now (greater coverage) and a sim-ilar percentage (34%) indicated a need for expansion within the existing service area (greater infill or density of stations).
Bikeshare Users Demographic and Membership Characteristics
Bikeshare users do not mirror the adult population of the Washington metropolitan region – More than nine in ten survey respondents were employed, while the U.S. Census reportes only about seven in ten adults in the Washington region are employed. But bikeshare survey respondents also differ from the general employed population. Compared to all commuters in the region, they are, on average, considerably younger, more likely to be male, Caucasian, and highly educated, and slightly less affluent. Bikeshare visibility and referrals are important market-ing tools for Capital Bikeshare – Respondents were most likely to have learned about Capital Bikeshare by seeing a CB station (31%) or through a referral from a friend or family member (27%). These two sources have become more important as the program has matured; 39% of members who joined CB in 2012 men-tioned seeing a station, compared with only 20% who joined in the first seven months of the program (August 2010 – March 2011). Referrals also have doubled over that time, with 34% of 2012 members mentioning this source, compared with 17% of “first adopter” members. The primary motivations for joining Capital Bikeshare were for greater access and one-way travel flexibility – More than nine in ten (91%) respondents said they were motivated by the ability to get around more easily or more quickly. Eight in ten (80%) were motivated by having a new travel option or a one-way travel option. And 76% were motivated simply by the enjoyment of biking. About six in ten cited a desire for exercise (57%) or a desire to save money on transportation (52%).

Capital Bikeshare 2012 Member Survey Report May 22, 2013
iv
Bikeshare Use Characteristics
Capital Bikeshare use was distributed evenly across frequency categories, showing demand for the service at many use levels – About 15% of respondents had made one or two bikeshare trips in the month before the survey, 22% made between three and five trips, and 17% made between six and ten trips. About 35% were frequent users, making 11 or more trips in the past month. Respondents made an average of 8.6 trips in the past month, a slight increase over the 8.1 trips per month average reported in the CB survey conducted in November 2011.
The top bikeshare trip purposes overall are for personal / non-work trips but a large share of members use bikeshare for their trip to work – Seven in ten respondents reported that they at least occasionally use bikeshare for social / enter-tainment and errands/personal appointments trips; about four in ten use bikeshare “often” for these trips. Two-thirds said they use bikeshare for a trip to a restaurant or other location where they have a meal, 55% use bikeshare for shopping trips and 50% use bikeshare for an exercise or recrea-tion trip. Nearly six in ten respondents use bikeshare to commute to or from work and 40% often make a commute trip by bikeshare.
Capital Bikeshare also serves as a feeder service to reach transit stops – More than half (54%) of all re-spondents said that at least one of the Capital Bikeshare trips they made last month either started or ended at a Metrorail station and 17% had used bikeshare six or more times for this purpose. About a quarter (23%) of respondents used Capital Bikeshare to access bus in the past month. Respondents’ recent bikeshare trips were evenly divided between work and non-work trip purposes – The single most common recent trip purpose overall was to go to or from work; 42% of respondents noted this purpose. The most common recent non-work purpose trips were for a social / entertainment trip and errand / personal appointment trips, mentioned by 19% and 12% of respondents, respectively. As noted above, travel to work is a less common trip purpose overall than is non-work travel; more re-spondents report using CB for social / entertainment, errand / personal appointment, and restaurant / meal trips than work trips. This indicates that bikeshare work trips are concentrated among a smaller share of respondents, but that these respondents repeat the work trip frequently. Bikeshare was the choice for most recent trips because it was the fastest and easier way to travel – Nearly eight in ten (78%) respondents chose bikeshare for the recent trip because it was a faster or eas-ier way to reach their destination. Respondents also noted other issues related to characteristics of the destination or the time they were traveling. Four in ten said the destination was too far to walk, 22% said public transportation was either not available or inconvenient to reach that destination, and 16% said that parking was very limited at that destination. Respondents also mentioned reasons related to the time of day they were traveling; 15% said that transit service didn’t operate or that transit was in-convenient at that time of day. Two in ten used bikeshare because they didn’t have a car.

Capital Bikeshare 2012 Member Survey Report May 22, 2013
v
Bikeshare is attractive because it both offers a new travel option for members who don’t have a car and an alternative to the disadvantages of driving for those who do – Young respondents and respond-ents with lower incomes were more likely to say they chose bikeshare for a recent trip for reasons re-lated to their lack of transportation options: too far to walk, unavailable or inconvenient transit, or lack of a car. These respondents also noted reasons related to the time and cost advantage of Capital Bikeshare in comparison with other travel options. For these members, bikeshare expands the range of destinations to include locations that are otherwise difficult to reach. Older respondents, those with higher incomes, and respondents who have a personal vehicle were more likely to mention reasons re-lated to the disadvantages of driving to a particular destination. For these respondents, Capital Bikeshare makes the destination more attractive or less of a bother to reach than it otherwise would be. Forty-four percent of respondents would have ridden a bus or train if Capital Bikeshare had not been available for the most recent trip – About four in ten (38%) would have walked to their destination. Only 4% of respondents would have driven or rid-den in a personal vehicle, but since more than half of respond-ents do not have a personal vehicle regularly available, this would not be an easy option for many. Six percent would have used a taxi and 5% would have ridden a personal bike. Respondents’ options for making these trips differed by the type of trip they were making – More than half of respondents whose last trip was to go to/from work would have used transit for the trip. Respondents whose last trip was for errands, shop-ping, or meals (restaurant) were more likely to say they would have walked than were respondents generally, suggesting they would have substituted a trip to a local shop for a trip to a shop farther away. Taxi was noted as a more likely alternative by re-spondents whose last Capital Bikeshare trip was to go to a meet-ing, perhaps indicating a choice of convenience over cost.
Use of Capital Bikeshare to “Induce” Trips
In the past month, 40% of respondents used bikeshare to make at least one trip they would not have made (“induced” trips) if bikeshare had not been available – Two in ten respondents made an induced social/entertainment trip and 15% made an errand/personal appointment trip. About one in ten made induced trips to restaurants (12%), for exercise/recreation (9%), and shopping trip (9%). Induced trips for work purposes were less common, indicating they are typically not considered discretionary trips. The vast majority of induced trips were made to destinations in the District of Columbia – Dupont Cir-cle/Adams Morgan and Downtown DC were the most common induced destination; 15% of respondents made an induced trip to each of these areas. About one in ten made an induced trip to Capitol Hill (9%), Georgetown (8%), or Shaw / U Street (7%). More than six in ten (61%) respondents said they would not have made the induced trips without Cap-ital Bikeshare because it was too far to walk –This suggests respondents might have substituted some induced trips to distant destination for trips they might have made to locations closer to their origin lo-cation. In this way, Capital Bikeshare broadened the travel destination options. Other common

Capital Bikeshare 2012 Member Survey Report May 22, 2013
vi
reasons were related to characteristics of the destination or time of travel; 44% said bicycle is a faster or easier way to reach the destination and substantial percentages reported that public transportation is either not available or incon-venient to reach that destination (31%) or at that time of day (24%). Two in ten (21%) don’t have a car and 17% wanted to get exercise. Capital Bikeshare access makes establishments more attractive to Bikeshare members – More than eight in ten respondents said they are ei-ther much more likely (37%) or somewhat more likely (48%) to patronize an establishment that is accessible by Capital Bikeshare.
Respondents who give high ratings for the value of bikeshare access made induced trips at a much higher rate than did those who give lower ratings – Two-thirds (67%) of respondents who said they are much more likely to patronize a Capital Bikeshare-accessible establishment had made in induced trip, compared with 48% who said they are somewhat more likely, and 33% of those who said they are not more likely to patronize the establishment. This suggests that the decision to make some, and perhaps many, of the induced trips was motivated by the establishments’ accessibility.
Change in Mode Use Since Joining Capital Bikeshare
Bikeshare members substantially reduced their car and taxi use since they joined Capital Bikeshare – Half (50%) of all survey respondents drove a car less often. Six in ten (60%) said they use a taxi less often now than before they joined Capital Bikeshare. Bikeshare members also substantially reduced their use of Metrorail, and bus; 61% ride Metrorail less often and 52% ride a bus less often. Respondents also de-creased their walking trips, with 52% saying the reduced use of this type of transportation. Bikeshare members who use Capital Bikeshare frequently report the greatest reduction in use of non-bicycle modes – For example, 72% of respondents who made 11 or more CB trips in the past month said they reduced their use of Metrorail, compared with 47% of respondents who made one or two CB trips in the past month, a net additional reduction of 25 percentage points. The results are similar for other non-bike mode groups; the share of re-spondents who reduced use of a non-biking mode since they joined Capital Bikeshare increases steadily as their bikeshare use increases. The change is most pronounced for Metrorail and bus (net difference of 25 points and 26 points. The dif-ferences are less dramatic for use of walk (18 points), driving a car (14 points), and taxi (17 points), suggesting that bikeshare is substituted less often for these modes.

Capital Bikeshare 2012 Member Survey Report May 22, 2013
vii
A quarter of respondents reduced their annual driving miles – Respondent also were asked approxi-mately how many miles they drive per month in the Washington region now and how many miles they drove in the year before they joined Capital Bikeshare. A quarter (26%) reduced their driving miles; 11% reduced driving by more than 1,000 miles. Two-thirds (65%) of respondents who reported their mileage made no change in driving miles; only 9% increased their driving miles. Capital Bikeshare members reduce 4.4 million driving miles annually – On average, survey respondents who reported both a current and pre-Capital Bikeshare mileage drove about 1,805 miles per year before joining Capital Bikeshare and drive 1,607 miles per year now, for a reduction of about 198 miles annu-ally. When these survey results are applied to the estimated 22,205 bikeshare member population in November 2012, the month in which the survey was conducted, the results are as follows:
Number of Capital Bikeshare members (November 2012) 22,205 Estimated annual VMT reduced per member 198 Estimated total annual VMT reduced 4,396,60 annual miles
On average, each Capital Bikeshare member saves $800 per year on personal travel cost – Nearly all (87%) respondents said they save money on weekly travel costs by using Capital Bikeshare. About six in ten save between one dollar and $20 per week, 24% save more than $20. On average, respondents save $15.39 per week, or about $800 over the course of a year. Across the estimated 22,205 Capital Bikeshare members in November 2012, the aggregate savings are nearly $18 million per year:
Number of bikeshare members (November 2012) 22,205 Estimated annual cost saving per member $800 Estimated total annual cost saving $17,764,000 annually
Bikeshare Members’ Commute Travel Patterns
Capital Bikeshare members travel an average of 6.3 miles to work one-way, less than half of the aver-age 16.3 miles distance of commuters region-wide –Two in ten bikeshare respondents travel fewer than two miles to work and 63% travel fewer than five miles. By contrast, only 17% of all regional com-muters travel fewer than five miles.
Capital Bikeshare members drive alone to work much less than do commuters region-wide – The overwhelming majority of employed re-spondents use a non-drive-alone mode of travel to get to work: CB members make 41% of their work trips by public transit, 27% by biking, and 13% by walking. They make only 12% of com-mute trips by driving alone, well below the 65% drive alone mode share for all commuters in the Washington region. Bike commute use is particu-larly high for members who live close to work; among CB members who travel less than five miles to work, 33% primarily ride a bicycle.

Capital Bikeshare 2012 Member Survey Report May 22, 2013
viii
Nearly four in ten employed respondents started or increased use of a non-drive alone mode for their trip to work since joining bikeshare – A quarter (25%) started or increased use of bicycle, 6% made a change to public transit, 4% started or increased use of walking, and 3% made a change to carpool or vanpool. Capital Bikeshare members reduce about 2.1 million commute driving miles annually, reducing traffic during the peak commuting periods – The 38% of employed survey respondents who made a commute change each eliminate an average of 5.3 driving miles each week, for an annual total of 265 miles. When this per-person reduction is applied to the estimated 21,095 employed bikeshare member population in November 2012, the results are as follows:
Number of employed CB members (November 2012) 21,095 Members who made a commute change (x 38%) 8,016 Estimated annual commute VMT reduced per member 265 Estimated total annual commute VMT reduced 2,124,000 annual miles
Access to bicycle support services appeared to influence use of bicycle for work travel – Bikeshare sur-vey respondents are twice as likely to report that their employers offered bike racks, showers, personal lockers, and other bicycle-support services (55%) as are all commuters region-wide (26%) and are more likely to have bicycle services than are other commuters in the jurisdictions where they worked. Re-spondents who have access to bicycle-support services bike to work at a higher rate than do respondent who do not have access to these services; 34% of respondents who said bicycle services are available bicycle to work, compared with 27% of those who do not have bicycle services.
Satisfaction with Capital Bikeshare
Respondents give generally high marks to bikeshare features – More than seven in tens give ratings of 4 or 5 (Excellent) to Capital Bikeshare website, safety of stations, mechanical repair of bikes, call center, and the map at Capital Bikeshare stations. Respondents are less satisfied with the nighttime lighting at the stations; 55% of respondents rate this feature as 4 or 5.
About four in ten respondents reported some problem with using Capital Bikeshare services – A quarter (26%) said they had a mechanical issue with the bike, 18% encountered issues accessing a bike with the membership key, and 17% said they had an issue with the bike dock. CB members want both more bikes at existing locations and expansion of Capital Bikeshare to new destinations – The most often noted expansion need is for more docks at existing stations; 47% of respondents chose this option for greater access to bikes in popular bikeshare pick-up and drop-off locations. The second highest priority is for new stations in

Capital Bikeshare 2012 Member Survey Report May 22, 2013
ix
residential neighborhoods (43%), perhaps indicating a desire for greater access to bikeshare for short trips within or from a home neighborhood. About a third (36%) of respondents said they wanted expan-sion to areas that bikeshare doesn’t serve now (greater coverage) and a similar percentage (34%) indi-cated a need for expansion within the existing service area (greater infill or density of stations). Smaller percentages of respondents said they would like to see expansion in commercial and employment areas (23%) or near Metrorail (17%).

Capital Bikeshare 2012 Member Survey Report May 22, 2013
x
TABLE OF CONTENTS
SECTION 1 – INTRODUCTION 1
Overview and survey objectives
Survey methodology summary
Survey analysis
SECTION 2 – SURVEY RESULTS 3
Demographic characteristics 3
Participation and program membership characteristics 10
Typical bikeshare use 18
Most recent bikeshare use 30
Use of Capital Bikeshare to “induce” trips 38
Role of Capital Bikeshare in encouraging patronage of Bikeshare-accessible establishments 44
Changes in use of biking and non-biking modes since joining Capital Bikeshare 46
Changes in vehicle ownership and driving miles since joining Capital Bikeshare 53
Work travel of bikeshare users and changes since joining Capital Bikeshare 61
Satisfaction with bikeshare 76
APPENDIX A –SURVEY QUESTIONNAIRE 88

Capital Bikeshare 2012 Member Survey Report May 22, 2013
xi
This page left blank intentionally.

Capital Bikeshare 2012 Member Survey Report May 22, 2013
1
SECTION 1 INTRODUCTION
Overview and Survey Objectives
This report presents the results of the November 2012 Capital Bikeshare Customer Use and Satisfac-tion Survey conducted for the Capital Bikeshare program (Capital Bikeshare). Capital Bikeshare, a pro-gram jointly owned and sponsored by the District of Columbia, Arlington County, VA, and the City of Alexandria, VA, and operated by Alta Bicycle Share, Inc., offers short-term use of more than 1,650 bicy-cles to registered members and day-pass users at more than 175 stations in the District of Columbia, Arlington County, and the City of Alexandria. Users register for an annual or 30-day membership and receive a bikeshare key that allows them to unlock a bike at any station. Use of a bike is free for the first 30 minutes of any trip. Trips lasting longer than 30 minutes incur trip fees that increase as the length of the trip increases. This pricing system en-courages the use of bikes for short trips. Users can return the bike to the same station or to any other station in the network, facilitating both return and one-way trips. Several governmental and community organizations in the Washington Metropolitan region, including the District of Columbia Department of Transportation, Arlington County Commuter Services, goDCgo, BikeArlington, the City of Alexandria, Local Motion, the Virginia Department of Rail and Public Trans-portation, and the Federal Highways Administration, sponsor or support Capital Bikeshare. These enti-ties were interested in learning more of bikeshare users’ experience with the program and exploring Capital Bikeshare’s impact on users’ travel patterns. The survey was conducted for the following pri-mary purposes, to examine:
Demographic characteristics of Capital Bikeshare users Characteristics of Capital Bikeshare trips Travel changes made in response to Capital Bikeshare availability Users’ satisfaction with Capital Bikeshare features
Survey Methodology Summary
Sample Selection
Planning for the Capital Bikeshare Member Travel Survey occurred during the early fall of 2012. At the same time, researchers at George Washington University requested Capital Bikeshare assistance to conduct an online survey about health-related impacts of Capital Bikeshare. To enable the Travel Sur-vey and Health Survey to be conducted simultaneously, the two surveys were administered in parallel, with each Capital Bikeshare member randomly assigned to one of the two surveys. On November 15, 2012 Capital Bikeshare staff sent an email to the 11,100 annual and monthly mem-bers that were assigned to the Travel Survey. The email informed them of the online survey and pro-vided the link to the survey website. The email indicated that Capital Bikeshare was offering entry into a drawing to win a Kindle Fire to members who completed the survey. To increase the response rate further, Capital Bikeshare sent a reminder in the monthly e_newsletter to all members. During the ap-proximately one-month period that the survey website was active, 3,731 members completed the sur-vey, for a total response rate of 34%. Capital Bikeshare staff used a similar email distribution method

Capital Bikeshare 2012 Member Survey Report May 22, 2013
2
to distribute the link to the Health Survey and 3,111 surveys were completed, for a response rate of 28%. Questionnaire Development
The Travel Survey questionnaire was developed jointly by Capital Bikeshare staff and the consultant. A copy of the final questionnaire is presented in Appendix A. The questionnaire, which was designed for online self-administration, collected data on the following major topics:
Capital Bikeshare participation background and motivation for registering Capital Bikeshare use patterns Details of most recent Capital Bikeshare trip Trips made by Capital Bikeshare that would not have been made without the service Role of Capital Bikeshare in influencing use of bike and other types of transportation Changes in vehicle ownership and driving miles since joining Capital Bikeshare Work travel patterns and changes in work travel pattern changes since joining Capital Bikeshare Ratings for quality of Capital Bikeshare features Issues encountered while using Capital Bikeshare bikes and stations Barriers to bicycling in the Washington region Suggestions for Capital Bikeshare expansion and other improvements Demographics
Survey Analysis
Section 2 presents key results of the survey. The findings present the percentages of respondents who gave each response. Figures and tables also show the base for the percentages, the number of re-spondents who actually answered the question, presented as (n=___). The total number of completed Travel Survey interviews (3,731) was substantial enough that it was possible to examine results for various sub-groups of the total respondent population. Several re-spondent characteristics, including age, sex, home location, how long ago the respondent joined Capi-tal Bikeshare, frequency of Capital Bikeshare use, and other characteristics, were found to be im-portant in this analysis. Several of the Travel Survey questions also were included in the Capital Bikeshare Health Survey. Com-parison of results for the Travel Survey and Health Survey populations on key demographic and travel questions indicated that the populations were not statistically different in any characteristic, thus data for the 3,111 Capital Bikeshare members who participated in the Health Survey were added to the Travel Survey data for these questions, bringing the total sample for some Travel Survey questions to 6,842. When comparable data were available, results also are presented from the State of the Commute sur-vey conducted by the Commuter Connections program of the Metropolitan Washington Council of Governments in 2010 (2010 SOC). Although the SOC survey interviewed only employed residents of the Washington metropolitan region, it provides a reasonable dataset for demographic comparisons because 95% of the Capital Bikeshare survey respondents said they were employed.

Capital Bikeshare 2012 Member Survey Report May 22, 2013
3
SECTION 2 SURVEY RESULTS
This section presents an overview of the survey findings. The survey collected data in several primary topic areas. Results for these topics are presented below:
Demographic characteristics Capital Bikeshare participation and membership characteristics Typical Capital Bikeshare use Most recent Capital Bikeshare trip Trips made by Capital Bikeshare that would not have been made without the service Role of Capital Bikeshare in influencing use of bike and other types of transportation Vehicle ownership and driving miles Work travel patterns and travel changes User satisfaction ratings and service issues
Demographic Characteristics
The demographic characteristics of respondents are presented below. When data were available, re-sults also are presented from the State of the Commute survey conducted by the Metropolitan Wash-ington Council of Government’s Commuter Connection program in 2010 (2010 SOC). Although the SOC survey interviewed only employed residents of the 11-county Washington metropolitan region, it pro-vides a reasonable dataset for demographic comparisons because 95% of the Capital Bikeshare survey respondents are employed.
In general, bikeshare users does not mirror the adult population of the Washington metropolitan region. More than nine in ten bikeshare survey respondents are employed, while the U.S. Census reports that only about seven in ten Washington metropolitan region adults are employed. But bikeshare survey respondents also differ from the general employed population. Compared to all commuters in the region, they are, on average,
Considerably younger More likely to be male, More likely to be Caucausian, Very highly educated, Slightly less affluent than the regional employee population, Much more likely to live and work in the urban core of the region – Washington DC, Arlington
County, VA, or Alexandria, VA, The program is likely to continue to attract additional member with these general demographics, how-ever some of the extreme differences are being mitigated as the Capital Bikeshare membership grows. Survey respondents who joined the program more recently appeared to have different demographics than did early users, as described later in this section.

Capital Bikeshare 2012 Member Survey Report May 22, 2013
4
Home and Work Locations
Table 1 presents the distributions of Capital Bikeshare survey respondents by their home and work ju-risdictions. In the November 2012 survey, nearly eight in ten respondents said they live in the District of Columbia. Arlington County, VA is home to about 11% of respondents. Smaller percentages of re-spondents said they live in Montgomery County, MD, Fairfax County, VA, Prince George’s County, MD, or the City of Alexandria, VA. The distribution of respondents by work jurisdictions is essentially the same as for home location. The distribution also is shown for the November 2011 Capital Bikeshare Survey. The share of respond-ents who live or work in Arlington County increased slightly between 2011 and 2012, with a corre-sponding decrease in respondents who reported the District of Columbia as their home or work loca-tion. This reflects the growth in CB stations and bicycles in Arlington during the past year.
Table 1 Home and Work Locations
November 2012 Capital Bikeshare Survey and November 2011 Capital Bikeshare Survey
State/County 2012 Survey 2011 Survey
Home Location (n = 5,367) (n = 5,159)
District of Columbia 78% 83%
Arlington County (VA) 11% 7%
Montgomery County (MD) 4% 3%
Fairfax County (VA) 2% 2%
Prince Georges County (MD) 1% 1%
Alexandria City (VA) 2% 1%
Other * 2% 3%
Work Location (n = 4,821) (n = 4,931)
District of Columbia 77% 80%
Arlington County (VA) 10% 6%
Montgomery County (MD) 5% 7%
Fairfax County (VA) 3% 3%
Prince Georges County (MD) 2% <1%
Alexandria City (VA) 2% 2%
Other * 1% 1%
* Each response in the “Other” category was mentioned by less than one percent of respondents.

Capital Bikeshare 2012 Member Survey Report May 22, 2013
5
Sex
More than half (57%) of bikeshare survey respondents are male; 45% are female (Figure 1). This is the opposite of the 2010 SOC distribution, in which 56% of employed residents were female.
Figure 1 Respondent Sex Distribution – Bikeshare Members and All Regional Employees
(Bikeshare n = 5,467, 2010 SOC n = 6,506)
Age
Capital Bikeshare survey respondents are considerably younger than are all regional employees, as measured through the 2010 SOC survey (Figure 2). Nearly two-thirds (63%) of respondents are under 35 years old and one in ten (9%) is under 25 years of age. By comparison, only 17% of the regional em-ployee population is under 35 years of age. Age distributions also were examined for the two jurisdictions that represent the dominant share of bikeshare members, District of Columbia and Arlington, VA. The SOC survey found that 16% of all com-muters who live in Arlington and 19% of District commuters are younger than 35 years of age. These percentages are not statistically different from the 17% of commuters region-wide in this age group. But the percentage of bikeshare members who are young is dramatically higher in both of these juris-dictions when compared to the total SOC respondents who live in these two jurisdictions; 60% of Ar-lington bikeshare members and 67% of Washington bikeshare members are under 35 years old. Thus, with respect to age, bikeshare members are more like each other, regardless of their home area, than they are like other commuters in their home jurisdictions.
0% 20% 40% 60% 80% 100%
Bikeshare members
All regional workers (2010 SOC)
57%
44%
43%
56%
Male Female

Capital Bikeshare 2012 Member Survey Report May 22, 2013
6
Figure 2 Respondent Age Distribution – Bikeshare Members and All Regional Employees
(2012 Bikeshare n = 5,476, 2010 SOC n = 6,506)
Highest Educational Level
Bikeshare members have achieved quite high levels of formal education (Figure 3). Nearly all (95%) have completed a four-year college degree and 56% have an advanced degree. Thirteen percent of re-spondents said they are currently college students; 8% are full-time students and about 5% are part-time students. Given the already high percentage of respondents who have completed at least a four-year degree, it seems likely that many of the students are enrolled in graduate studies.
Figure 3 Highest Level of Education – Bikeshare Members
(n = 5,466)
0%
20%
40%
60%
80%
100%
Under 35 35-44 45-54 55-64
63%
20%11%
6%
17%24%
31% 28%
Bikeshare members All regional workers (2010 SOC)
High school1%
Some college4%
4 year college degree
39%
Master's degree41%
Doctoral degree15%
Capital Bikeshare 2012 Member Survey Report May 22, 2013
7
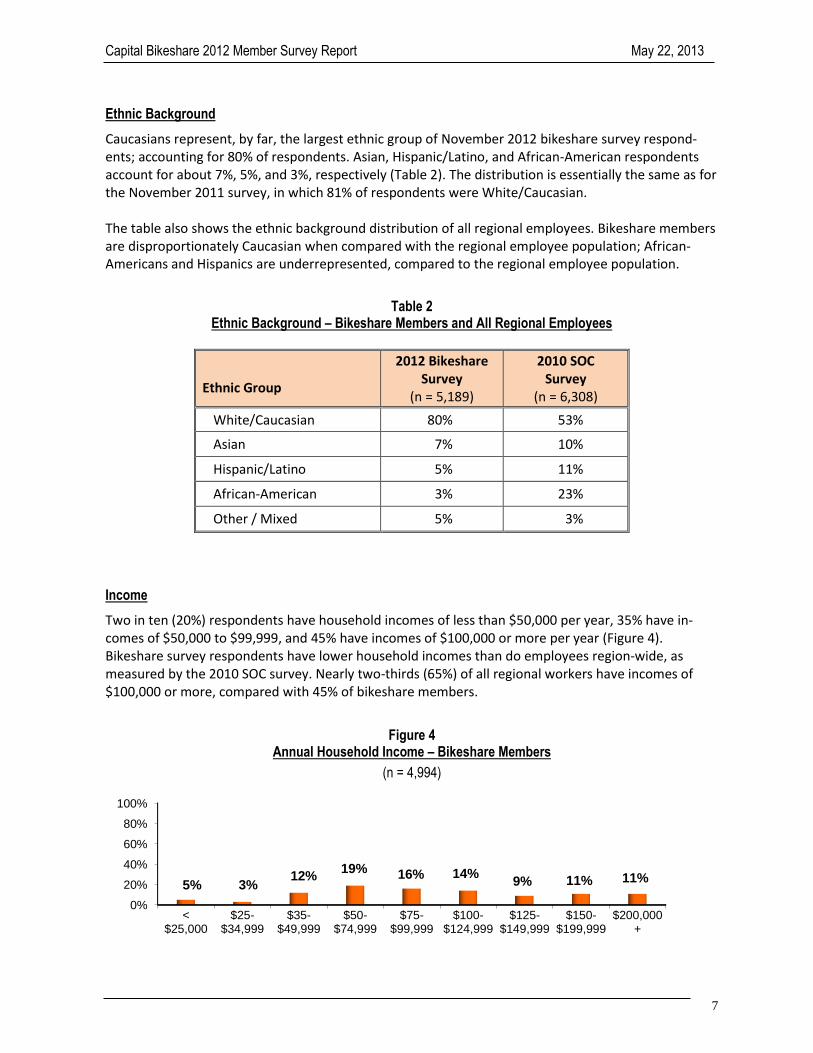
Ethnic Background
Caucasians represent, by far, the largest ethnic group of November 2012 bikeshare survey respond-ents; accounting for 80% of respondents. Asian, Hispanic/Latino, and African-American respondents account for about 7%, 5%, and 3%, respectively (Table 2). The distribution is essentially the same as for the November 2011 survey, in which 81% of respondents were White/Caucasian. The table also shows the ethnic background distribution of all regional employees. Bikeshare members are disproportionately Caucasian when compared with the regional employee population; African-Americans and Hispanics are underrepresented, compared to the regional employee population.
Table 2 Ethnic Background – Bikeshare Members and All Regional Employees
Ethnic Group
2012 Bikeshare Survey
(n = 5,189)
2010 SOC Survey
(n = 6,308)
White/Caucasian 80% 53%
Asian 7% 10%
Hispanic/Latino 5% 11%
African-American 3% 23%
Other / Mixed 5% 3%
Income
Two in ten (20%) respondents have household incomes of less than $50,000 per year, 35% have in-comes of $50,000 to $99,999, and 45% have incomes of $100,000 or more per year (Figure 4). Bikeshare survey respondents have lower household incomes than do employees region-wide, as measured by the 2010 SOC survey. Nearly two-thirds (65%) of all regional workers have incomes of $100,000 or more, compared with 45% of bikeshare members.
Figure 4 Annual Household Income – Bikeshare Members
(n = 4,994)
0%
20%
40%
60%
80%
100%
<$25,000
$25-$34,999
$35-$49,999
$50-$74,999
$75-$99,999
$100-$124,999
$125-$149,999
$150-$199,999
$200,000+
5% 3%12%
19% 16% 14%9% 11% 11%

Capital Bikeshare 2012 Member Survey Report May 22, 2013
8
Availability of Vehicles and Other Personal Transportation Options
The survey asked respondents if they have access to any of four types of personal transportation on a regular basis for their travel: car/van/SUV/truck; personal bike, carshare vehicle, or motorcycle/mo-tor-scooter/motorbike (Figure 5).
Figure 5 Vehicles and Other Personal Transportation Options Regularly Available for Travel
2012 and 2011 CB Survey
(2012 n = 3,731; 2011 n = 5,464)
In the November 2012 survey, 46% of respondents said they have regular access to a personal vehicle – car, van, SUV, or truck. This percentage is well below the rate of vehicle availability in the Washing-ton Metropolitan region. According to the 2008 Household Travel Survey conducted by Metropolitan Washington Council of governments, 94% of households in the region have at least one vehicle and 84% of household have a vehicle for each driver in the household. But bikeshare members’ vehicle availability rate is essentially the same as the rate for the District of Columbia, where a large majority of bikeshare users live. The MWCOG Household Travel Survey found that 52% of households in the Dis-trict of Columbia had a vehicle for each driver in the household. More than four in ten (42%) bikeshare survey respondents said they have access to a personal bike. A third (33%) of respondents said they have access to a carshare vehicle, that is, they are members of a carshare program, which offers short-term rental of vehicles to registered members. As is evident from Figure 5, the availability of transportation options is quite different than was re-ported in the November 2011 bikeshare survey. The percentage of respondents who have a personal auto/vehicle dropped from 53% to 46%, while the percentages of respondents reporting access to a personal bicycle increased from 29% to 42%. Carshare access showed a dramatic increase, 33% of re-spondents reported this option in 2012, compared with just 9% of respondents in 2011.
0% 20% 40% 60% 80% 100%
Motorcycle/Motorscooter
Carshare vehicle
Personal bike
Car, van, SUV, truck
3%
9%
29%
53%
2%
33%
42%
46%
2012 CB Survey
2011 CB Survey

Capital Bikeshare 2012 Member Survey Report May 22, 2013
9
Vehicle Availability by Demographic Characteristic – Because it is expected that Capital Bikeshare membership would be more attractive and influential to respondents who have fewer travel options than to those who have many, the analysis examined differences in availability of personal vehicles and personal bicycles by various demographic characteristics. These results are presented in Table 3.
Table 3 Personal Vehicle and Bicycle Availability by Respondents’ Demographic Characteristics
Respondent Characteristic Percentage with Personal Vehicle
Available
Percentage with Personal Bicycle
Available
Home location
- Arlington County (n = 302) 72% 55%
- District of Columbia (n = 2,166) 49% 49%
Sex
- Male (n = 1,619) 57% 51%
- Female (n = 1,309) 52% 50%
Race / Ethnicity
- White (n = 2,215) 56% 53%
- Non-white (n = 554) 50% 38%
Age
- Under 25 years (n = 256) 24% 26%
- 25 – 34 years (n = 1,546) 49% 46%
- 35 – 44 years (n = 596) 68% 60%
- 45 – 54 years (n = 353) 71% 65%
- 55 and older (n = 190) 75% 65%
Income
- Under $50,000 (n = 520) 32% 35%
- $50,000 - $74,999 (n = 509) 43% 43%
- $75,000 - $99,999 (n = 400) 53% 54%
- $100,000 - $149,999 (n = 587) 66% 56%
- $150,000 or more (n = 579) 74% 61%
(Statistical differences noted with orange highlighting)

Capital Bikeshare 2012 Member Survey Report May 22, 2013
10
Availability is not uniformly distributed across all respondents. For example, Arlington County residents are more likely to have both a personal vehicle and a personal bicycle available than are residents of the District of Columbia. Male and female respondents have approximately equal access to a personal bicycle, but males are slightly more likely than are females to have access to a personal vehicle. And a higher share of respondents who are White reported access to both a vehicle and a bicycle than did respondents who are Non-white. But the most striking differences are related to respondents’ age and income. Among respondents who are under 25 years of age, only a quarter (24%) said they have a personal vehicle available for reg-ular travel, compared with 49% of those who are 25 to 34 years of age and at least two-thirds of re-spondents who are 35 years of age or older. Availability of a personal bicycle is similarly tied to respondents' age; about a quarter (26%) of re-spondents who are under 25 years old said they have a personal bicycle, compared with 46% who are 25 to 44 years of age and about six in ten who are 35 years of age or older. A similar pattern is noted by respondents' annual household income, with availability increasing as in-come increases. Vehicle availability ranges from a low of 32% of respondents whose incomes are un-der $50,000 to a high of 74% among respondents with incomes of $150,000 or more. Availability of a bicycle shows a similar pattern; 35% of respondents with incomes of under $50,000 have a personal bicycle available, compared with six in ten (61%) with the highest income level.
Participation and Program Membership Characteristics
An early section of the survey asked respondents about their bikeshare membership, such as when and why they joined Capital Bikeshare and how they heard about the program. Responses to these questions also were compared for various subgroups of survey respondents, to see if any differences exist that might be useful to guide marketing efforts in the future.
When Joined Bikeshare
As shown in in Figure 6, 19% of current members joined Capital Bikeshare in the five-month period im-mediately after the program began in August 2010. Membership growth has been steady since then, but three 3-month periods since the start showed particularly strong growth: April – June 2011, April – June 2012, and July – September, 2012. Nearly half of all Capital Bikeshare members joined during these three quarters.

Capital Bikeshare 2012 Member Survey Report May 22, 2013
11
Figure 6 When Joined Capital Bikeshare
(n = 6,015) Changing Member Profile – It is common to expect that the people who are attracted to a program when it is new might be different in various respects from those who join at a later time. This idea was tested for the Capital Bikeshare survey respondents by comparing the demographics of respondents who joined early in the program (August 2010 – March 2011), to those who joined during subsequent periods. The conclusion from this analysis is that the profile of new bikeshare members appears to be changing in several demographic characteristics to become less dominantly male, less white, younger, and less “bicycle-centric:”
Sex - Of the members who joined between August 2010 and March 2011, 64% are men and 40% are women. Since April 2011, the membership has shifted to be less dominated by men; of mem-bers who joined during 2012, only 46% are men, suggesting either that women are now more aware of the program or that the program is more attractive to women now that it was at the start.
Age – Young people account for a larger share of new members. About 51% of respondents who joined between August 2010 and March 2011 are younger than 35 years old. Among responders who joined between April and December 2011, 63% are under 35 years old. And 70% of re-spondents who joined during 2012 are in this young age group.
Ethnicity – Non-white respondents comprise 23% of members who joined in 2012. This repre-sented a continued increase from the 18% of members who joined between August 2010 and December 2011 who are Non-white.
Regular Access to a Personal Bicycle – Among the members who joined before April 2011, per-sonal bike use is very high; 60% have access to a personal bicycle for regular travel. But personal bike ownership has been dropping since then. Less than half (48%) of respondents who joined between April and December of 2011 have a personal bike. Among respondents who joined dur-ing 2012, the percentage is just 38%, indicating the program is continuing to attract more mem-bers who were not regular bike users before joining bikeshare.
0%
20%
40%
60%
80%
100%
Aug-Dec2010
Jan-Mar2011
Apr-Jun2011
Jul-Sep2011
Oct-Dec2011
Jan-Mar2012
Apr-Jun2012
Jul-Sep2012
Oct-Nov2012
19%
8%15%
8% 5% 6%14%
20%
4%

Capital Bikeshare 2012 Member Survey Report May 22, 2013
12
Regular Access to a Car / Personal Vehicle – Members who joined Capital Bikeshare recently are less likely to have a car, van, SUV, or other personal vehicle available on a regular basis for their travel. Nearly six in ten (57%) respondents who joined between August 2010 and March 2011 have regular access to a vehicle, while only 48% who joined between April and December 2011 and47% who joined in 2012 have a personal vehicle.
How Heard About Bikeshare
Figure 7 presents the sources of information noted by Capital Bikeshare members for how they “first learned” of the program. The top source is related to seeing Capital Bikeshare in action; 31% of re-spondents said they learned of the program by seeing a bikeshare station. An additional 5% said they saw someone riding a Capital Bikeshare bike. About a quarter (27%) said a friend or family member re-ferred them. Other common sources, each named by at least one in twenty respondents, include blogs (8%), newspaper or magazine articles (7%), Living Social deal (5%), and employers (5%). The wide range of sources indicates success with a broad marketing pattern and perhaps the role of multiple program partners.
Figure 7 How First Learned of Capital Bikeshare
(n = 3,329)
0% 20% 40% 60% 80% 100%
Other
CB brochure
Newspaper/magazine ad
Community event
WABA
CB website
Living Social deal
Saw someone riding CB bike
Employer/info at work
Newspaper/magazine article
Blog
Referral from friend/family/coworker
Saw CB station
5%
1%
1%
1%
2%
2%
5%
5%
5%
7%
8%
27%
31%

Capital Bikeshare 2012 Member Survey Report May 22, 2013
13
Change in Sources – Table 4 shows the percentages of respondents who learned about Capital Bikeshare from four sources by the time period in which they joined the program: August 2010 through March 2011, April through June 2011, July through December 2011, January through June 2012, and July through November 2012. The four sources shown are the only sources for which there are significant differences by time period. Green highlighting show sources that increased in im-portance over time and yellow highlighting shows sources that decreased in importance.
Table 4 Bikeshare Information Sources – First Source
Bikeshare Information Source
When Joined Capital Bikeshare
Aug 2010-Mar 2011 (n = 872)
Apr-Jun 2011
(n = 518)
Jul-Dec 2011
(n = 454)
Jan-Jun 2012
(n = 666)
Jul-Nov 2012
(n = 809)
Increased Importance
- Saw bikeshare station 20% 26% 33% 38% 40%
- Referral from friend/family 17% 24% 31% 32% 35%
Decreased Importance
- Blog 15% 10% 7% 4% 2%
- Newspaper or magazine article 11% 7% 6% 4% 4%
Two sources, "saw bikeshare station” and "referral from friend or family member," demonstrate in-creased importance. Clearly, this shows how the visibility of the bikes and word-of-mouth referrals can be important marketing tools. Two sources seem to have declined in importance since the early months of the program. "Blogs," named by 15% of respondents who joined during the first eight months, was noted by a declining percentage of respondents. And newspaper or magazine articles, which was noted by 11% of respondents who joined in the initial months, was named by only 4% of recent members. This suggests that some of the marketing and promotion for the program, which was important during program rollout, has ended or is reaching fewer people. Sources Noted by Demographic Sub-groups – There also are some differences in how respondents learned of Capital Bikeshare by where they live and by their sex, age, and ethnicity. Some differences also are noted for different income groups, but these largely parallel the age patterns. Sex: Women and men reported differences in two sources.
Referrals – Women are more likely to mention referral (30%) than are men (25%).
Blog – Men are more likely to mention a blog (10%) as their source than are women (6%).
Capital Bikeshare 2012 Member Survey Report May 22, 2013
14
Home and Work Location:
Referrals – Respondents who live in the District of Columbia (District) note referrals (30%) at a higher rate than do respondents who live in Arlington (20%) or in other areas (17%).
Saw Capital Bikeshare station – Arlington members note this source more often (35%) than do District members (30%) or members who live in other areas (27%).
Employer – Respondents who live in Arlington and those who live outside Arlington/outside the District mention learning about Capital Bikeshare from an employer at a higher rate (Arlington – 9%, Outside Arlington/DC – 14%) than do District residents (2%). Respondents who work in Ar-lington are particularly likely to have learned of Capital Bikeshare from an employer (15%), while only 4% of respondents who work in the District and 1% of respondents who live in other areas mention this source.
Age: Two sources show distinct trends as respondents’ ages increased:
Referrals – Referrals decline substantially with increasing age. Four in ten (41%) respondents who are younger than 25 and 33% who are between 25 and 34 years old mention referrals, com-pared with 21% of respondents who are between 35 and 44, and only 13% of respondents who are 45 or older.
Newspaper or Magazine Article – By contrast, this source shows an increasing trend with increas-ing age. Only 4% of respondents who are younger than 35 years old mention a newspaper or magazine article as a source, compared with 9% of respondents between 35 and 54 years old and 19% of respondents 55 or older.
Race / Ethnicity: Four sources show differences by respondents’ race/ethnicity:
Referrals – A higher share of White respondents cite a referral from a friend, family member, or co-worker as the source (29%), compared with 23% of Non-white respondents.
Newspaper or Magazine Article or Blog – White respondents also note seeing a newspaper or magazine article (7%) or a blog (9%) as their source more often than do Non-white respondents (article – 4% and blog – 5%).
See Capital Bikeshare Station – Non-white respondents are more likely to say they learned of Capital Bikeshare by seeing a CB station (34%) than are White respondents (30%).
Reasons for Joining Bikeshare
To identify what motivated members to join Capital Bikeshare at the time that they did, respondents were asked to rate how important each of eight possible motivations was to their decision. The results for these questions are presented in Figure 8, showing the percentages of respondents who gave a rat-ing of 1 (not at all important) or 2, a rating of 3, a rating of 4, or a rating of 5 (very important). As illustrated in Figure 8, the primary reason was clearly access and speed; 91% of respondents rated their ability to get around more easily or more quickly as a 4 or 5 (very important). Another important motivation was having a new travel option or a one-way travel option; 80% of respondents rated this as important. The third top motivation was simply the enjoyment of biking; 76% said liking to bike or thinking that biking is fun way to travel was an important motivation to join bikeshare.

Capital Bikeshare 2012 Member Survey Report May 22, 2013
15
Nearly six in ten (57%) said getting exercise / fitness was an important motivator and about half cited a desire to save money on transportation (52%) or environmental concerns (48%) as motivating factors. Having access to another bicycle was important to 40% of respondents and 27% said they were motivated by health concerns to join.
Figure 8 Importance of Bikeshare Membership Motivations
(n = 5,588)
Importance of Motivations by Member Sub-group – Respondents give quite similar responses to why they joined Capital Bikeshare, regardless of their travel and demographic characteristics. But a few no-table, statistically significant, differences are described below. When Joined Capital Bikeshare:
Save Money – Saving money appears to have become a more important motivation. Fifty-six per-cent of respondents who joined CB in 2012 rated this motivation as important to their decision, compared with 49% who joined CB in 2010 or 2011.
Access to another bike / back-up bike – This seems to be a less important motivation for recent members; only 33% of respondents who joined CB in 2012 gave this an importance rating of 4 or 5, while 45% who joined before 2012 gave this rating.
0% 20% 40% 60% 80% 100%
Get around more easily, faster, shorter
New travel option, one-way travel option
Like to bike, fun way to travel
Exercise, fitness
Save money on transportation
Reduce carbon footprint / environmental concern
Access to another bike, backup
Health concerns
3%
8%
8%
18%
27%
26%
46%
46%
6%
12%
16%
25%
21%
26%
14%
27%
22%
29%
32%
30%
23%
26%
19%
17%
69%
51%
44%
27%
29%
22%
21%
10%
1 or 2 (not important) 3 4 5 (Very important)
Average Rating
4.6
4.2
4.1
3.6
3.4
3.3
2.8
2.7

Capital Bikeshare 2012 Member Survey Report May 22, 2013
16
Frequency of Capital Bikeshare Use – Respondents who use Capital Bikeshare frequently reported dis-tinctly different motivations for joining than do respondents who ride bikeshare infrequently:
Save Money – The motivation to save money was more important to frequent riders than to those who ride infrequent. Two-thirds (65%) of members who made 11 or more trips in the past month and 50% who made between three and ten trips said saving money was important, while only 38% of respondents who made fewer than 3 trips in the past month rated saving money as an important motivation.
Get Around More Easily – Although this was an important motivation overall, it was more im-portant to frequent riders; 94% of respondents who made three or more CB trips in the past month said this was important, compared with 84% who rode infrequently.
Like to Bike / Bike is Fun – More than three-quarters (77%) of frequent riders (3 or more trips last month) said this was an important motivation, compared with 72% of infrequent riders.
Get Exercise – Frequent riders also are more likely to report this as an important motivation, but the threshold was at a higher riding level; 62% of members who made 11 or more CB trips last month rated this motivation as important, compared with 54% who made between three and ten trips and the same percentage who made fewer than three trips.
Access to another bike / back-up bike – This seems to be more important to infrequent riders; 42% who made fewer than three trips and 45% who made between three and ten CB trips in the past month rated this motivation as important, compared with 33% who made 11 or more trip.
Home Location
Save Money – More than half (55%) of respondents who live in the District of Columbia and 47% who live in Arlington mentioned a desire to save money, while only 40% of respondents who lived in other areas gave this as a reason.
Get Around More Easily – District members also were more likely to join to be able to get around more easily or faster; 93% of District residents mentioned this reason, compared to 87% of Ar-lington residents and 84% of respondents who live in other areas. Since most CB trips are quite short, this likely reflects the greater level of traffic congestion in the District, compared with other residential locations.
Get Exercise / Health Concerns – Only 56% of District residents and 58% of Arlington residents mentioned this motivation as important, compared with 65% who live in other areas. District and Arlington residents also were less likely to mention health concerns as reasons for joining CB (District – 26%, Arlington – 28%, Other areas – 34%). This suggests CB plays less of a role as “basic transportation” for respondents who live outside the District and Arlington.
Age – Several motivations show pronounced trends as respondents’ ages increased, with two showing decreasing trends with age and three showing increasing trends:
Save Money – Six in ten (61%) respondents who are younger than 35 mentioned a desire to save money on transportation, compared with 42% of respondents who are between 35 and 44, and only 32% of respondents who are 45 or older. This is likely due in part to younger respondents’ lower level of income.
Get Around More Easily – More than nine in ten (93%) respondents under 35 mentioned this motivation, compared with 89% who are between 35 and 44, and 85% who are 45 or older. This

Capital Bikeshare 2012 Member Survey Report May 22, 2013
17
again may be due to other factors however, such as availability of a car and the areas in which they typically travel.
Get Exercise and Health Concerns – These two motivations were more important to older re-spondents than to younger respondents. Seven in ten (69%) respondents who are 45 years or older rated getting exercise as important, compared with 55% of younger respondents. And 40% of respondents 45 years and older rated health concerns as important, compared with 29% who are between 35 and 44 years old and 23% who are younger than 35 years.
Environmental Concerns – Older respondents also reported greater importance of environmental concerns; 57% of respondents who are 45 years or older rated environmental concerns as im-portant, compared with 52% of respondents who are between 35 and 44 and 23% of respond-ents who are younger than 35 years old.
Sex Get Exercise, Environmental Concerns, Access to New Transportation Option – Female respond-
ents are slightly more likely than male respondents to rate three motivations as important: get exercise (61% of women vs 54% of men), environmental concerns (53% of women vs 45% of men), and access to new transportation option (84% of women vs 79% of men). There were no statistical differences in other motivations.
Income – The results show a distinct downward pattern as respondents’ income increase for one moti-vation – a desire to save money on transportation. More than seven in ten (72%) respondents with in-comes of less than $50,000 said this was an important motivation for joining Capital Bikeshare. Among respondents whose incomes are between $50,000 and $99,999, 58% rated saving money as important. The share of respondents who noted this reason dropped still further for the next two income groups; 46% who have an income of between $100,000 and $149,999 and 34% of those with incomes of $150,000 or more said saving money was an important motivation. Ethnicity – Slight, but statistically significant, differences are noted in motivations for White and Non-white respondents on several motivations.
Save Money – Non-white respondents mention saving money at a higher rate than do White re-spondents; 57% of Non-white respondents said this was an important motivation, compared with 51% of White respondents.
Get Exercise and Health Concerns – Both of these motivations were more important to Non-white respondents than to White respondents. Six in ten (60%) Non-white respondents rated getting exercise as important, compared with 56% of White respondents. And 33% of Non-white respondents rated health concerns as important, compared with 26% of White respondents.
Get Around More Easily – This reason was noted by a higher share of White respondents (92%) than Non-white respondents (89%).
Like to Bike – A higher share of White respondents also noted liking to bike as a reason (77%); only 74% of Non-white respondents mentioned this reason.
Access to a Personal Vehicle – Respondents’ motivations for joining Capital Bikeshare also were exam-ined relative to their access to a personal vehicle. Interestingly, while respondents who do not have a vehicle were slightly more likely than were those with a vehicle to join Capital Bikeshare to be able to

Capital Bikeshare 2012 Member Survey Report May 22, 2013
18
get around more easily (94% of no vehicle vs 88% of with vehicle), they appeared to be even more con-cerned with saving money. More than six in ten (61%) respondents with no vehicle said they wanted to save money on transportation compared with 44% of those who have a vehicle available. This could be related, however, to the incomes of these two groups of respondents. Respondents who do not have vehicles available also have lower average incomes, thus their interest in saving money could be re-lated to their income rather than to their vehicle availability.
Typical Bikeshare Use
Another section of the questionnaire asked respondents about their frequency of bikeshare use and trip purposes for which they used bikeshare. The survey also asked several detailed questions about respondents’ most recent bikeshare trip.
Frequency of Bikeshare Use
About one in ten (11%) respondents said they did not make any bikeshare trips in the past month (Fig-ure 9). About 15% made one or two bikeshare trips, 22% made between three and five trips, and 17% made between six and ten trips. About a third of respondents were frequent users, with 11 or more trips in the past month. And 23% made at least 16 trips. This use distribution results in an average use of about 8.6 trips per user in the past month.
Figure 9
Bikeshare Trips Made in Past Month
(n = 5,979)
The percentage of high frequency users increased between 2011 and 2012. In the 2012 survey, 35% of respondents said they made 11 or more trips in the past month, compared with 26% in the 2011 sur-vey. The average frequency of use increased slightly, from 8.1 per month to 8.6 per month in 2012. Trip Frequency by Demographic Characteristics – Several demographic characteristics are associated with more frequent bikeshare use (Table 5). Use is more frequent among respondents who live in the District of Columbia and those who work in the District than for residents of other locations. This seems a reasonable outcome, considering that the majority of bikes and bike stations are located in the District. Other characteristics associated with higher use include being male, younger than 35 years old, not having access to a personal vehicle, and not having access to a personal bicycle. At least half of
0%
20%
40%
60%
80%
100%
No trips 1-2 trips 3-5 trips 6-10 trips 11-15 trips 16-25 trips 26 or moretrips
11% 15%22%
17% 12% 11% 12%

Capital Bikeshare 2012 Member Survey Report May 22, 2013
19
the respondents in each of these categories said they had used bikeshare at least six or more times in the past month.
Table 5 Bikeshare Trips in Past Month by Respondents’ Demographic Characteristics
Respondent Characteristic Percentage with 6 or more CB Trips
in Past Month
Home jurisdiction
- Arlington County, VA (n = 568) 44%
- District of Columbia (n = 4,164) 55%
- Montgomery / Prince George’s Co, MD (n = 281) 41%
Work jurisdiction
- Arlington County, VA (n = 465) 44%
- District of Columbia (n = 3,707) 55%
- Montgomery / Prince George’s Co, MD (n = 322) 45%
Sex
- Male (n = 3,133) 59%
- Female (n = 2,325) 43%
Age
- 16 to 24 years old (n = 504) 66%
- 25 to 34 years old (n = 2,942) 54%
- 35 to 44 years old (n = 1,091) 46%
- 45 years and older (n = 930) 45%
Access to a personal vehicle
- Yes (n = 1,706) 44%
- No (n = 1,579) 59%
Access to a personal bicycle
- Yes (n = 1,567) 47%
- No (n = 1,718) 55%
(Statistical differences highlighted)

Capital Bikeshare 2012 Member Survey Report May 22, 2013
20
Trip Frequency by When Respondent Joined CB and the Motivations for Joining – Frequency differ-ences also are noted by when the respondents joined Capital Bikeshare and what motivated them to join. Table 6 presents the results to the first question and Table 7 shows results to the questions on motivation. When Joined CB – Respondents who joined most recently made more trips in the past month than did respondents who joined earlier; six in ten (59%) respondents who registered between July and Novem-ber 2012 made at least six bikeshare trips in the past month compared to about half of respondents who joined earlier.
Table 6 Bikeshare Trips in Past Month by When Respondent Joined Capital Bikeshare
Respondent Characteristic Percentage with 6 or more CB Trips
in Past Month
When Joined Capital Bikeshare
- August 2010 to June 2011 (n = 2,568) 49%
- July 2011 to December 2011 (n = 826) 52%
- January 2012 to June 2012 (n = 1,159) 51%
- July 2012 to November 2012 (n = 1,404) 59%
(Statistical differences highlighted)
Motivations for Joining CB – In general, respondents who rated each motivation to join Capital Bikeshare as more important used CB more frequently, as shown in Table 7. For example, 62% of re-spondents who gave an importance rating of 4 or 5 to “saving money” made at least six CB trips in the past month, compared with 46% of respondents who rated saving money as a 3 on the importance scale and 40% who rated it as a 1 (not at all important) or a 2. The pattern was similar for other moti-vations. There were two exceptions to this rule. The motivation of “get access to another bicycle or a back-up bike” shows the opposite pattern; only 48% of respondents who gave this a high importance rating made six or more CB trips in the past month, compared with 53% who rated it as a 3 and 56% who rated it as a 1 or 2. Presumably, this is because they have a personal bicycle that they use for some trips, so don’t rely on bikeshare for all their bicycle trips. The other motivation exception, not shown on Table 7, is for the motivation of environmental con-cerns / reducing carbon footprint. The share of respondents who made six or more CB trips is essen-tially the same for all respondents, regardless of how important they rated this motivation.

Capital Bikeshare 2012 Member Survey Report May 22, 2013
21
Table 7 Bikeshare Trips in Past Month by Respondents’ Motivations to Join Capital Bikeshare
Motivation to Join Percentage with 6 or more CB Trips
in Past Month
Saving money
- Important (rating of 4 or 5) (n = 1,595) 62%
- Rating of 3 (n = 1,199) 46%
- Not important (rating of 1 or 2) (n = 1,589) 40%
Get around more easily
- Important (rating of 4 or 5) (n = 5,406) 54%
- Rating of 3 (n = 361) 31%
- Not important (rating of 1 or 2) (n = 162) 30%
Like to bike
- Important (rating of 4 or 5) (n = 4,478) 54%
- Rating of 3 (n = 965) 49%
- Not important (rating of 1 or 2) (n = 449) 47%
Health concern
- Important (rating of 4 or 5) (n = 1,595) 56%
- Rating of 3 (n = 1,541) 54%
- Not important (rating of 1 or 2) (n = 2,664) 50%
Get exercise
- Important (rating of 4 or 5) (n = 3,350) 55%
- Rating of 3 (n = 1,482) 51%
- Not important (rating of 1 or 2) (n = 1,045) 46%
Access to another bike
- Important (rating of 4 or 5) (n = 2,230) 48%
- Rating of 3 (n = 760) 53%
- Not important (rating of 1 or 2) (n = 2,589) 56%
(Statistical differences highlighted)

Capital Bikeshare 2012 Member Survey Report May 22, 2013
22
Use of a Helmet while Riding a Capital Bikeshare Bike
At the time of the survey, Capital Bikeshare bikes did not come equipped with helmet; riders need to provide their own helmet. The survey asked respondents how often they wear a helmet when using a Capital Bikeshare bike (Figure 10). Only about a third (32%) of respondents said they use a helmet al-ways or most of the time and 23% wear a helmet some of the time. But 45% never wear a helmet.
Figure 10 Use Helmet when Riding Capital Bikeshare Bike
(n = 2,716)
Differences in Hemet Use by Demographics – Regular helmet use (most of the time or always) is more common among women (38%) than men (28%) and among White respondents (34%) than Non-white (26%). Helmet use also is more common among older respondents; 40% of respondents who are 45 years of age or older reported regular use, compared with 31% of respondents 25 to 44 years old and only 25% of respondents who are younger than 24. Respondents who live in Arlington are statistically less likely than are respondents who live elsewhere to wear a helmet; 23% reported regular helmet use, compared with 33% of District of Columbia residents and 38% of respondents who live in Mont-gomery County or Prince George’s County, MD. When asked why they do not wear a helmet, respondents gave a range of reasons, as illustrated in Fig-ure 11. Two overwhelming reasons topped the list. About six in ten (58%) respondents said the trips they make by bikeshare are unplanned or spontaneous, so they do not have a helmet with them. In-deed, the opportunity to make a spontaneous trip is part of Capital Bikeshare's appeal. And 56% re-ported that it is “not convenient” to carry a helmet. This presumably means it is not convenient to carry it during the day, but 36% checked the related and more specific response “don’t want to carry to my destination, too obvious to carry, too bulky.” Three in ten respondents said it is too bulky. A similar percentage (28%) said they don't own a helmet and since Capital Bikeshare does not provide helmets, they don't have one to wear. About a quarter (26%) of respondents said they don’t think they need a helmet, because they feel safe enough without it. Some of these respondents commented that they ride slowly or on bike paths, so do not feel they are in any danger riding without a helmet. And 10% indicated it is simply their personal preference or that they feel “not cool” wearing a helmet.
0%
20%
40%
60%
80%
100%
Never Some of the time Most of the time Always
45%
23%19%
13%

Capital Bikeshare 2012 Member Survey Report May 22, 2013
23
Figure 11 Reasons for Not Wearing a Helmet when Riding Capital Bikeshare Bike
(n = 1,845)
Trip Purposes
Respondents were shown a list of eight trip purposes and asked to indicate how frequently they use Capital Bikeshare for each type of trip, using a scale from 1 to 5, in which 1 meant “never use Capital Bikeshare” and 5 meant “very often use Capital Bikeshare.” Figure 12 presents the results for these questions, with trip purposes divided into “non-work” and “work–related trips.” Non-work Travel – Respondents use bikeshare primarily for trips that are for personal, non-work pur-poses and 90% reported using bikeshare for at least one of these purposes. The top two bikeshare trip purposes are social / entertainment and errands / personal appointments. Seven in ten (70%) respond-ents said they ever use bikeshare for these purposes and 43% say they use bikeshare often for these purposes. Two-thirds said they use bikeshare for a trip to a restaurant or other location where they have a meal. About half use bikeshare for trips to shop (55%) or for an exercise or recreation trip (50%). Work/School-related Travel – Nearly six in ten respondents said they at least occasionally use bikeshare to get to or from work and four in ten said they often use bikeshare for this purpose. But many of the respondents who report frequent use of bikeshare for commuting reported transit as their primary commute mode in a later question of the survey. This suggests they might be using bikeshare to access a bus or train, which they use for the longest part of their trip. For these respond-ents, bikeshare might be making transit a more feasible option than it otherwise would be. For in ten (40%) respondents said they at least occasionally use bikeshare to go to a meeting. Although the survey did not specify what type of meeting, it is likely that most of these are work-related. And 10% of respondents said they use bikeshare to get to school. As noted earlier in the survey, only 13% of all survey respondents are students, thus it appears a large percentage of student members are us-ing Capital Bikeshare for this purpose.
0% 20% 40% 60% 80% 100%
Personal preference / not cool
Feel safe enough without it
Don't own one
Too bulky
Don't want to carry to destination
Not convenient
Don't have one with me / unplanned trips
10%
26%
28%
30%
36%
56%
58%

Capital Bikeshare 2012 Member Survey Report May 22, 2013
24
Figure 12 Bikeshare Trip Purposes
(n = 6,842) Trip Purposes by When Joined Capital Bikeshare – The analysis examined whether respondents who joined Capital Bikeshare during 2012 use bikeshare for different trip purposes than do respondents who joined earlier. Figure 13 presents the percentages of respondents from the two time periods, Au-gust 2010 - December 2011 and January – November 2012, who noted that they ever use Capital Bikeshare for the specified trip purpose. As is clear from the figure, use for nearly every trip purpose is higher for respondents who joined Capi-tal Bikeshare during 2010-2011 than for respondents who joined in 2012. This is likely due, at least in part, to the greater opportunity these early adopters have had to make trips of multiple purposes, compared with respondents who have been in the program for a shorter period of time. However, it also could indicate a greater interest in bicycling overall among these early adopters. The only excep-tions are for trips made for going to or from work and going to meetings. For these two trip purposes, higher percentages of recent respondents report using CB.
0% 20% 40% 60% 80% 100%
Social / entertainment / visit friends
Errands/ personal appointments
Restaurant / meal
Shopping
Exercise, fitness
Go to or from work
Go to a meeting
Go to or from school
27%
31%
33%
35%
33%
18%
26%
4%
43%
39%
33%
20%
17%
40%
14%
6%
2 or 3 (Occasionally use CB) 4 or 5 (Often use CB)
Non-work Trips
Work/School-related Trips
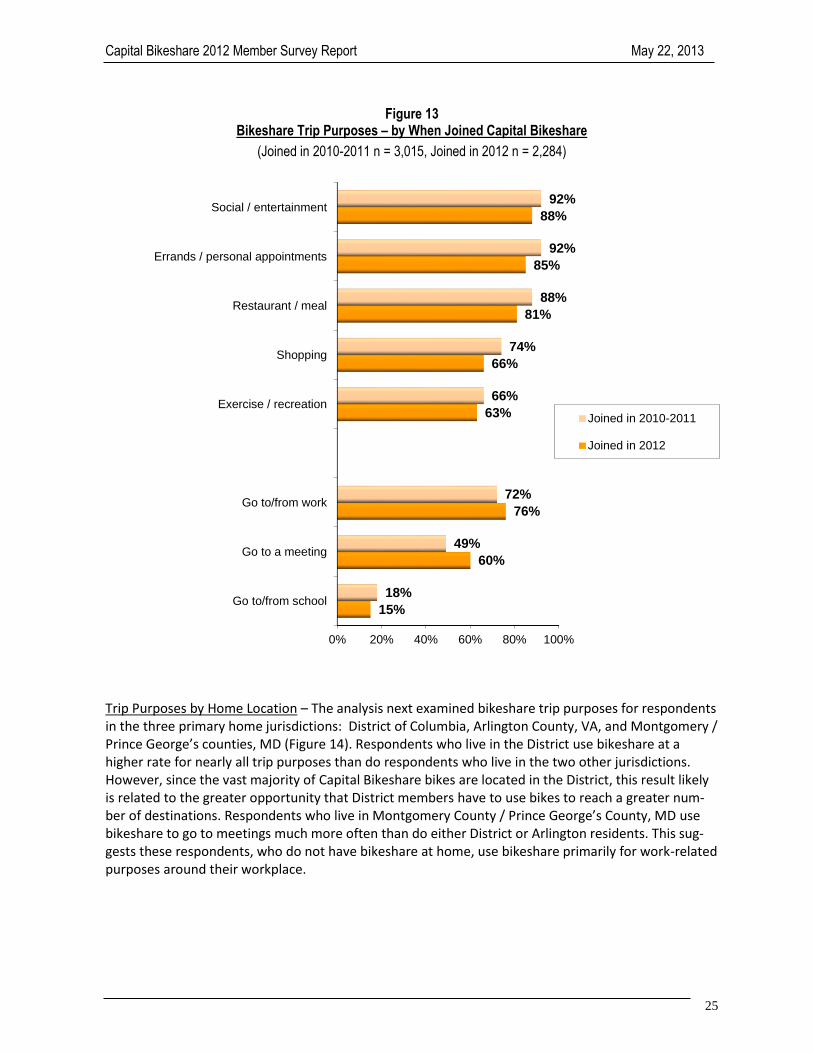
Capital Bikeshare 2012 Member Survey Report May 22, 2013
25
Figure 13 Bikeshare Trip Purposes – by When Joined Capital Bikeshare
(Joined in 2010-2011 n = 3,015, Joined in 2012 n = 2,284)
Trip Purposes by Home Location – The analysis next examined bikeshare trip purposes for respondents in the three primary home jurisdictions: District of Columbia, Arlington County, VA, and Montgomery / Prince George’s counties, MD (Figure 14). Respondents who live in the District use bikeshare at a higher rate for nearly all trip purposes than do respondents who live in the two other jurisdictions. However, since the vast majority of Capital Bikeshare bikes are located in the District, this result likely is related to the greater opportunity that District members have to use bikes to reach a greater num-ber of destinations. Respondents who live in Montgomery County / Prince George’s County, MD use bikeshare to go to meetings much more often than do either District or Arlington residents. This sug-gests these respondents, who do not have bikeshare at home, use bikeshare primarily for work-related purposes around their workplace.
0% 20% 40% 60% 80% 100%
Go to/from school
Go to a meeting
Go to/from work
Exercise / recreation
Shopping
Restaurant / meal
Errands / personal appointments
Social / entertainment
15%
60%
76%
63%
66%
81%
85%
88%
18%
49%
72%
66%
74%
88%
92%
92%
Joined in 2010-2011
Joined in 2012

Capital Bikeshare 2012 Member Survey Report May 22, 2013
26
Figure 14 Bikeshare Trip Purposes – by Home Jurisdiction
(District of Columbia n = 3,821, Arlington n = 504, Montgomery/Prince George’s n = 244)
Trip Purposes by Demographic Characteristics – Next, the analysis examined differences in bikeshare trip purpose for respondents in different demographic subgroups.
Sex – There was only one difference in bikeshare use between male and female respondents. Men are slightly more likely to have used bikeshare to go to a meeting (men – 58%, women – 53%). There are no statistical differences in any other trip purposes.
Age – In general, younger respondents use Capital Bikeshare for each trip purpose more than do older respondents (Figure 15). This is particularly the case for social / entertainment trips and trips to restaurants / meals. Nearly all (93%) respondents who are under 35 years old have used bikeshare for a social or entertainment trips, compared with 88% of respondents who are between 35 and 44 years old and 77% of those who are 45 years of age or older. And 87% of respondents
0% 20% 40% 60% 80% 100%
Go to/from school
Go to a meeting
Go to/from work
Exercise / recreation
Shopping
Restaurant / meal
Errands / personal appointments
Social / entertainment
8%
67%
68%
60%
54%
74%
75%
73%
14%
42%
66%
68%
68%
78%
82%
86%
18%
56%
76%
64%
74%
88%
92%
94%
District of Columbia
Arlington
Montgomery/Prince George's

Capital Bikeshare 2012 Member Survey Report May 22, 2013
27
who are under 35 have used bikeshare to reach a restaurant, compared with only 75% of those who are 45 or older. A similar, although less extreme, pattern is evident for use of bikeshare for errands and shopping trips. The only trip purpose that shows a different pattern by age is trips to go to a meeting. Older respondents use bikeshare for this trip purpose more than do younger re-spondents.
Figure 165 Bikeshare Trip Purposes – by Age
(Under 35 years old n = 3,198, 35 – 44 years old n = 974, 45 or older n = 779)
Race / Ethnicity – Overall, White and Non-white respondents use bikeshare at about the same rate for each trip purpose. White respondents are slightly more likely to use bikeshare for social trips (White 91%, Non-white 88%) and meal trips (White 86%, Non-white 81%), while Non-white re-spondents report greater use of bikeshare for exercise/recreation (White 63%, Non-white 69%). The relative similarity of trip use among respondents of different racial/ethnic groups is a change
0% 20% 40% 60% 80% 100%
Go to/from school
Go to a meeting
Go to/from work
Exercise / recreation
Shopping
Restaurant / meal
Errands / personal appointments
Social / entertainment
6%
64%
69%
66%
72%
75%
88%
77%
8%
61%
74%
62%
69%
83%
88%
88%
18%
54%
75%
64%
71%
87%
90%
93%
Under 35
35 to 44
45 or older

Capital Bikeshare 2012 Member Survey Report May 22, 2013
28
from the November 2011 bikeshare survey. In the 2011 survey, use of bikeshare among White re-spondents was about five or six percentage points higher than among Non-white respondents for nearly all trip purposes.
Income – Differences in trip purpose also are relatively minor for respondents of different income
groups. About 81% of respondents with incomes of under $50,000 use bikeshare for a trip to or from work, compared with 75% of respondents with higher incomes. There also is a declining pat-tern of use for social / entertainment purposes as income increase; about 95% of respondents whose incomes are below $100,000 a year use bikeshare for this type of trip compared with 86% of respondents with higher incomes.
Trip Purposes by Access to Alternative Transportation Option – Finally, the analysis explored bikeshare trip purposes of respondents who have access to a personal vehicle or a personal bicycle, compared with those who do not have these personal transportation options (Table 8).
Table 8 Bikeshare Trip Purposes – by Access to Personal Vehicle or Personal Bicycle
Respondent Characteristic
Personal Vehicle Available
Personal Bicycle Available
Yes (n = 1,391)
No (n = 1,411)
Yes (n =1,298)
No (n =1,457 )
Personal / Non-work Trips
- Social / entertainment 86% 92% 90% 89%
- Run errands, personal appointment 88% 92% 88% 93%
- Go to a restaurant, meal 81% 86% 84% 83%
- Shopping 63% 75% 70% 68%
- Exercise, recreation 60% 64% 55% 68%
Work-related trips
- Go to/from work 73% 79% 76% 76%
- Go to a meeting 53% 50% 58% 45%
- Go to/from school 11% 17% 11% 16%
(Statistical differences noted with orange highlighting)
Personal Vehicle – Respondents who do not have a personal vehicle available use Capital Bikeshare
for a wider range of trip purposes than do respondents who have a vehicle available. In general, bikeshare use for each trip purpose is 5% to 8% higher among respondents without a vehicle.
Personal Bicycle – A different use pattern is evident by respondents’ access to a personal bicycle. Higher shares of respondents without a personal bike use bikeshare to run errands, suggesting

Capital Bikeshare 2012 Member Survey Report May 22, 2013
29
bikeshare’s basic transportation role. But there are no differences in use for travel for social pur-poses, to go to restaurants, for shopping, or for travel to/from work. Bikeshare use for exercise or recreation trips also is higher among those who do not have a personal bicycle, but this is reasona-ble if we assume that many respondents who have a personal bicycle use it primarily for exercise and for trips that do not require them to leave the bicycle unattended.
Use of Bikeshare to Access Transit
The preceding section reported on “destination” trips for which respondents used Capital Bikeshare. But another use of bikeshare could be as an access mode to reach public transportation. The survey explored how many of the Capital Bikeshare trips that respondents made in the past month started or ended at a Metrorail station, a bus stop, or a commuter rail station (Figure 16).
Figure 16 Use of Capital Bikeshare to Access Train and Bus
(n = 3,731)
More than half (54%) of all respondents said that at least one of the Capital Bikeshare they made last month either started or ended at a Metrorail station. Fifteen percent had used bikeshare three to five times to get to Metrorail and 17% used bikeshare six or more times for this purpose.
0% 20% 40% 60% 80% 100%
Commuter rail
Bus
Metrorail
1%
3%
9%
2%
3%
8%
2%
6%
15%
5%
10%
22%
90%
78%
46%
0 trips
1-2 trips
3-5 trips
6-10 trips
11 or more trips
Capital Bikeshare 2012 Member Survey Report May 22, 2013
30
About a quarter (23%) of respondents used Capital Bikeshare to access bus in the past month, but only 6% used bikeshare at least six times to reach a bus stop. Use of bikeshare to reach commuter rail is rare; only 9% either started or ended a trip at a commuter rail station and only 3% reported six or more commuter rail access trips. Transit Access by Frequency of CB Use – Respondents who are more frequent bikeshare users overall also report more frequent use of bikeshare to access transit. For example, 77% of respondents who made six or more bikeshare trips in the past month used bikeshare to access Metrorail, compared with 68% of respondents who used bikeshare three to five times and 55% who had used bikeshare one or two times in the past month. Access to bus is similarly more common among frequent CB users; 40% of respondents who made six or more bikeshare trips used bikeshare to access bus, compared with 29% who made three to five CB trips and 23% who made one or two bikeshare trips. Transit Access by Demographic and Location Differences – Slight differences in use of Capital Bikeshare to reach transit also are noted for respondents of different sub-groups, but generally are evident only for bus access. Bikeshare use to access a bus declines with increasing age and increasing income. Higher percentages of Non-white respondents than White respondents use bikeshare to get to a bus (Non-white 41%, White 32%). Respondents who do not have regular access to a personal vehicle use bikeshare more to access bus (38%) than do respondents who have access to a vehicle (31%). And a higher share of District of Columbia residents (37%) use bikeshare to access bus than do residents of other jurisdictions (25%). Two cases in which a difference was found for access to/from Metrorail was in the sex and work juris-diction of respondents. About 73% of male respondents report using bikeshare to access Metrorail, compared with 68% of female respondents. And 82% of respondents who work in Arlington use bikeshare to access Metrorail, compared with 70% of respondents who work in other locations.
Most Recent Bikeshare Use
One purpose of the Capital Bikeshare survey was to examine the characteristics of bikeshare trips. For this purpose, the survey included questions exploring the details of respondents’ “most recent Capital Bikeshare trip.” It was expected that respondents would be able to recall this last trip in sufficient de-tail to provide accurate information. Highlights of these results are shown below.
Trip Purposes
Respondents were first asked the purpose of their most recent bikeshare trip. Figure 17 shows these results, compared with the results presented earlier for all bikeshare uses. Respondents’ most recent bikeshare trips are divided evenly between work and non-work purposes. The most common recent trip purpose overall was to go to or from work; 42% of respondents noted this purpose. Trips to go to or from school and to go to a meeting each comprised about 4% of total recent trips. But, as is clear from the figure, travel to work is a less common trip purpose overall; more respondents reported using CB for social / entertainment, errand / personal appointment, and restaurant / meal trips than work trips. This indicates that bikeshare work trips are made more frequently than are er-rand and restaurant trips, but are concentrated among a smaller numbers of users.

Capital Bikeshare 2012 Member Survey Report May 22, 2013
31
Figure 17 Bikeshare Trip Purposes – All Trips Made and Most Recent Trip
(All trips made n = 6,842, Most recent trip n = 2,817) The most common recent non-work purpose trips are for a social / entertainment trip and errand / personal appointment trips, mentioned by 19% and 12% of respondents, respectively. These also are the top two trip purpose overall; 70% of respondents at least occasionally use Capital Bikeshare for these purposes. The remaining recent bikeshare trips are evenly divided among restaurant/meal trips (5%), exercise/recreation trips (5%), shopping trips (4%), and trips to access transit (4%). Recent Trip Purposes by Respondent Subgroup Characteristics – The previous section of the report ex-plored differences in how subgroups of respondents use Capital Bikeshare, noting numerous differ-ences by when respondents joined the program, where they live, and certain demographic characteris-tics. Interestingly, these differences in bikeshare use are much less prominent for the most recent trips than for all trips ever made by bikeshare. For example, there are no statistical differences in the most recent trip purpose for respondents who are recent registrants compared to those who registered at the beginning of the program. This sup-ports the conclusion, drawn earlier, that the greater use of Capital Bikeshare for all trip purposes likely is related to early adopters’ longer exposure to trip-making opportunities.
0% 20% 40% 60% 80% 100%
Go to or from transit
Go to or from school
Shopping
Exercise/fitness
Go to a meeting
Restaurant / meal
Errands / personal appointments
Social / entertainment
Go to or from work
4%
4%
4%
5%
5%
5%
12%
19%
42%
59%
10%
55%
50%
40%
66%
70%
70%
58%
All trips
Most recent trip

Capital Bikeshare 2012 Member Survey Report May 22, 2013
32
The distribution of most recent trip purposes shows no statistical differences by respondents’ de-mographics. The distribution of recent trip purpose is similar for respondents who live in the District of Columbia and Arlington County, reinforcing the conclusion that the greater use of bikeshare by District residents when all trips were considered is primarily due to District residents’ greater opportunity to make trips to a wider range of destinations. Sex – Men were slightly more likely to have made a recent bikeshare trip to or from work (44% of
men vs 39% of women). By contrast, 15% of women’s last bikeshare trips were to run errands / go to a personal appointment, while only 9% of men noted this trip purpose.
Age – Differences in most recent trip purpose were noted among respondents of different age groups for only two purposes. The percentage of respondents whose last trip was to go to a meet-ing increased with increasing age, from 4% percent of respondents who are under 35 years old to 10% of respondents who are 45 years of age or older. Conversely while 24% of respondents who are under 35 years old used bikeshare most recently for social or entertainment purposes, only 11% of respondents 45 years of age or older mentioned this trip purpose.
Timing of Bikeshare Use – Weekend vs Weekday – More than eight in ten (82%) of the most recent bikeshare uses fell on weekdays (Monday through Friday). The remaining trips were on weekends; 11% of recent trips were made on Saturday and 7% were made on Sunday. Since the five weekdays com-prise only about 71% of the total days of the week, this indicates that bikeshare use is slightly higher on weekdays than weekends. But 96% of respondents took the survey between Tuesday and Friday, so frequent CB users would be very likely to have their most recent trip on a weekday. Weekdays, Saturdays, and Sundays all exhibit day of week priority patterns (Table 9). As expected, work trips feature prominently on weekdays, comprising 65% of recent weekday trips but only 7% of recent Saturday and 10% of recent Sunday trips. The top two trip purposes on Saturday are social/en-tertainment trips, which account for half of all Saturday trips, and errand trips (18%). Social trips (38%) and errand trips (16%) also are common on Sunday (38%), as are exercise (19%) and shopping trips (13%).

Capital Bikeshare 2012 Member Survey Report May 22, 2013
33
Table 9 Day of Most Recent Bikeshare Use, by Trip Purposes
Trip Purpose Weekday
(n = 2,166) Saturday (n =304)
Sunday (n = 181)
Non-work trips – all types 35% 93% 90%
Work-related trips – all types 65% 7% 10%
Non-work trips
- Social / entertainment 13% 50% 38%
- Run errands, personal appointment 10% 18% 16%
- Restaurant, meal 5% 8% 5%
- Shopping 2% 9% 13%
- Exercise, recreation 4% 8% 19%
Work-related trips
- Go to or from work 55% 4% 8%
- Go to a meeting 6% 1% 2%
- Go to or from school 5% 2% 0%
(Statistical differences highlighted)
Recent Trip Locations
Figure 18 shows the primary locations where respondents picked-up and dropped-off the Capital Bikeshare bikes for their most recent trips. As expected, the vast majority of trips originated and/or ended at destinations in the District of Colum-bia, with Dupont Circle/Adams Morgan/Logan Circle, Capitol Hill, Downtown, and Columbia Heights/Petworth being the most common pick-up locations; 54% of recent trips began in one of these areas and 52% of the trips ended in one of these areas. Other popular locations in the District of Co-lumbia included Shaw /U Street, H Street Corridor/NOMA, and West end/George Washington Univer-sity, each named by about one in twenty respondents as a pick-up or drop-off location. About one in ten (11%) trips began in Arlington and a similar share (10%) ended in Arlington. Court-house/Clarendon and Ballston/Virginia Square were the most popular pick-up and drop-off locations. About 2% of trips began in Alexandria and 2% ended in Alexandria.

Capital Bikeshare 2012 Member Survey Report May 22, 2013
34
Figure 18 Recent Trip Pick-up and Drop-off Locations
(n = 2,373)
Note: Scale extends only to 40% to highlight results
0% 10% 20% 30% 40%
Alexandria - Other
Arlington - Other
Arl - Ballston / Virginia Square
Arl - Courthouse/Clarendon
DC - Other
DC - Georgetown
DC - National Mall
DC - Penn Quarter
DC - Bloomingdale / Brookland /Eckington
DC - Navy Yard / SW Waterfront
DC - Cleveland Park / Woodley
DC - West end / GWU
DC - H Street corridor / NoMA
DC - Shaw / U Street
DC - Columbia Heights / Petworth
DC - Downtown
DC - Capitol Hill
DC - Dupont / Adams Morgan / Logan Cir
2%
5%
2%
3%
1%
4%
3%
3%
1%
4%
2%
7%
5%
6%
4%
19%
12%
17%
2%
4%
3%
4%
2%
2%
2%
3%
3%
3%
3%
5%
5%
5%
10%
12%
14%
18%
Pick-up
Drop-off
87% pick-up in DC 88% drop-off in DC
11% pick-up in Arlington 10% drop-off in Arlington

Capital Bikeshare 2012 Member Survey Report May 22, 2013
35
0% 20% 40% 60% 80% 100%
Other
Friends wanted to bicycle
Don't have a car
Wanted to get exercise
Don't like to drive to destination that time of day
No bus/train, inconvenient that time of day
Too much traffic at destination
Parking limited / expensive at destination
No bus/train, inconvenient to destination
Bicycle is faster, easier to destination
Too far to walk
5%
3%
21%
30%
11%
15%
11%
16%
22%
78%
42%
Ninety-six percent of respondents dropped-off the bike in the jurisdiction where they picked it up and 25% dropped off the bike in the same neighborhood where they picked it up, indicating substantial bikeshare use for short intra-neighborhood trips. Respondents who picked up the bike in Alexandria and Arlington were slightly more likely to return it to another jurisdiction. About a third of bikes picked up in Alexandria were dropped off in either Arlington (9%) or the District (23%). Two in ten bikes picked up in Arlington were dropped off in either Alexandria (2%) or the District (19%). Nearly all (98%) of the bikes that were picked up in the District were returned to a District station.
Reasons for Using Bikeshare for Most Recent Trip
The previous sections of the report explored the trip purposes and destinations of recent trips. Re-spondents also were asked why they chose Capital Bikeshare for the trip, instead of using another type of transportation. Figure 19 presents these results, divided into four categories: characteristics of the trip, issues related to the trip destination, issues related to the time of day the trip was made, and other personal reasons.
Figure 19 Why Respondent Chose Bikeshare for Most Recent Trip
(n = 2,813)
Personal Reasons
Trip Characteristics
Time of Day Issues
Destination Issues
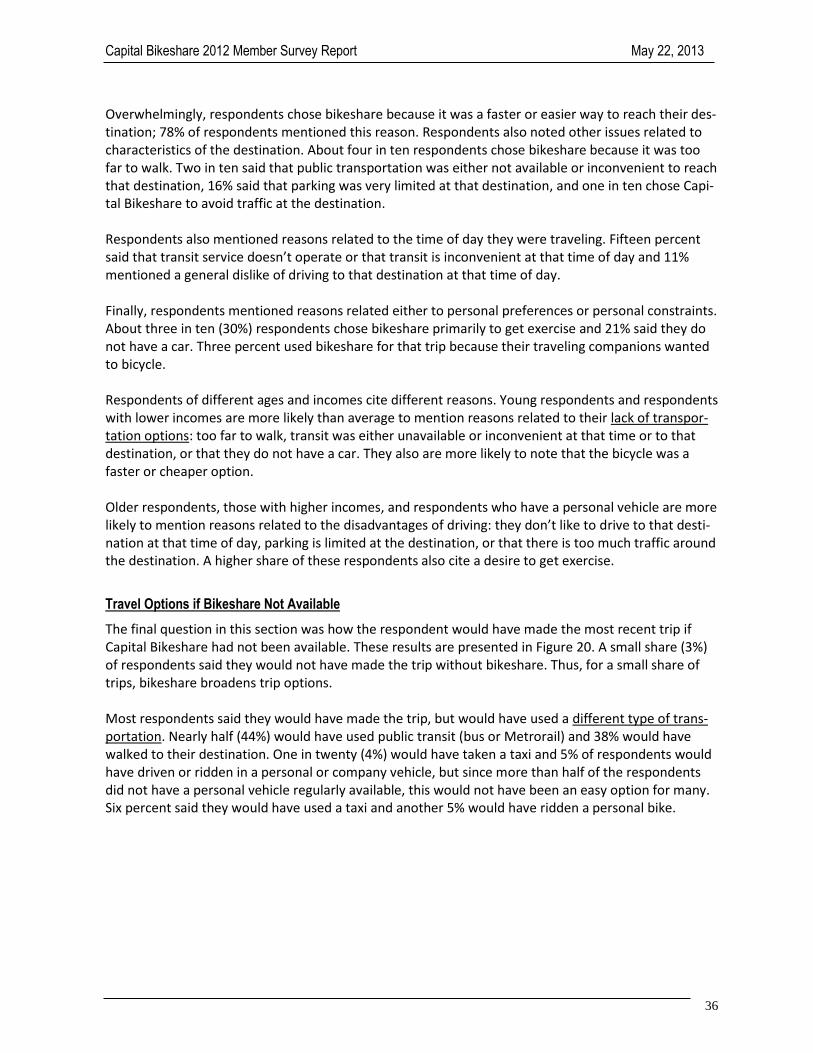
Capital Bikeshare 2012 Member Survey Report May 22, 2013
36
Overwhelmingly, respondents chose bikeshare because it was a faster or easier way to reach their des-tination; 78% of respondents mentioned this reason. Respondents also noted other issues related to characteristics of the destination. About four in ten respondents chose bikeshare because it was too far to walk. Two in ten said that public transportation was either not available or inconvenient to reach that destination, 16% said that parking was very limited at that destination, and one in ten chose Capi-tal Bikeshare to avoid traffic at the destination. Respondents also mentioned reasons related to the time of day they were traveling. Fifteen percent said that transit service doesn’t operate or that transit is inconvenient at that time of day and 11% mentioned a general dislike of driving to that destination at that time of day. Finally, respondents mentioned reasons related either to personal preferences or personal constraints. About three in ten (30%) respondents chose bikeshare primarily to get exercise and 21% said they do not have a car. Three percent used bikeshare for that trip because their traveling companions wanted to bicycle. Respondents of different ages and incomes cite different reasons. Young respondents and respondents with lower incomes are more likely than average to mention reasons related to their lack of transpor-tation options: too far to walk, transit was either unavailable or inconvenient at that time or to that destination, or that they do not have a car. They also are more likely to note that the bicycle was a faster or cheaper option. Older respondents, those with higher incomes, and respondents who have a personal vehicle are more likely to mention reasons related to the disadvantages of driving: they don’t like to drive to that desti-nation at that time of day, parking is limited at the destination, or that there is too much traffic around the destination. A higher share of these respondents also cite a desire to get exercise.
Travel Options if Bikeshare Not Available
The final question in this section was how the respondent would have made the most recent trip if Capital Bikeshare had not been available. These results are presented in Figure 20. A small share (3%) of respondents said they would not have made the trip without bikeshare. Thus, for a small share of trips, bikeshare broadens trip options. Most respondents said they would have made the trip, but would have used a different type of trans-portation. Nearly half (44%) would have used public transit (bus or Metrorail) and 38% would have walked to their destination. One in twenty (4%) would have taken a taxi and 5% of respondents would have driven or ridden in a personal or company vehicle, but since more than half of the respondents did not have a personal vehicle regularly available, this would not have been an easy option for many. Six percent said they would have used a taxi and another 5% would have ridden a personal bike.

Capital Bikeshare 2012 Member Survey Report May 22, 2013
37
Figure 20 Travel Options for Most Recent Trip if Bikeshare Not Available
(n = 2,814)
Alternative Type of Transportation by Trip Purpose – As shown in Table 10, the type of transportation respondents would have used if Capital Bikeshare had not been available varied by the trip purpose. Overall, 44% of respondents said they would have used a bus or Metrorail if Capital Bikeshare had not been available, but 56% of respondents whose last bikeshare trip was to go to or from work and 50% who made their most recent trip to go to school would have used transit for the trip. Walking was a predominant choice for errand, restaurant/meal, and shopping trips. This suggests they make, or would make, most of these trips in their immediate neighborhood. Taxi would have been a common choice for respondents whose last bikeshare trip was to go to a meeting, as well as for so-cial/entertainment and restaurant / meal trips.
Would not have made the trip, 3%
Other mode, 1%
Taxi, 6%
Ride a personal bike, 5%
Personal/company vehicle, 4%
Walk, 38%
Bus or Metrorail, 44%
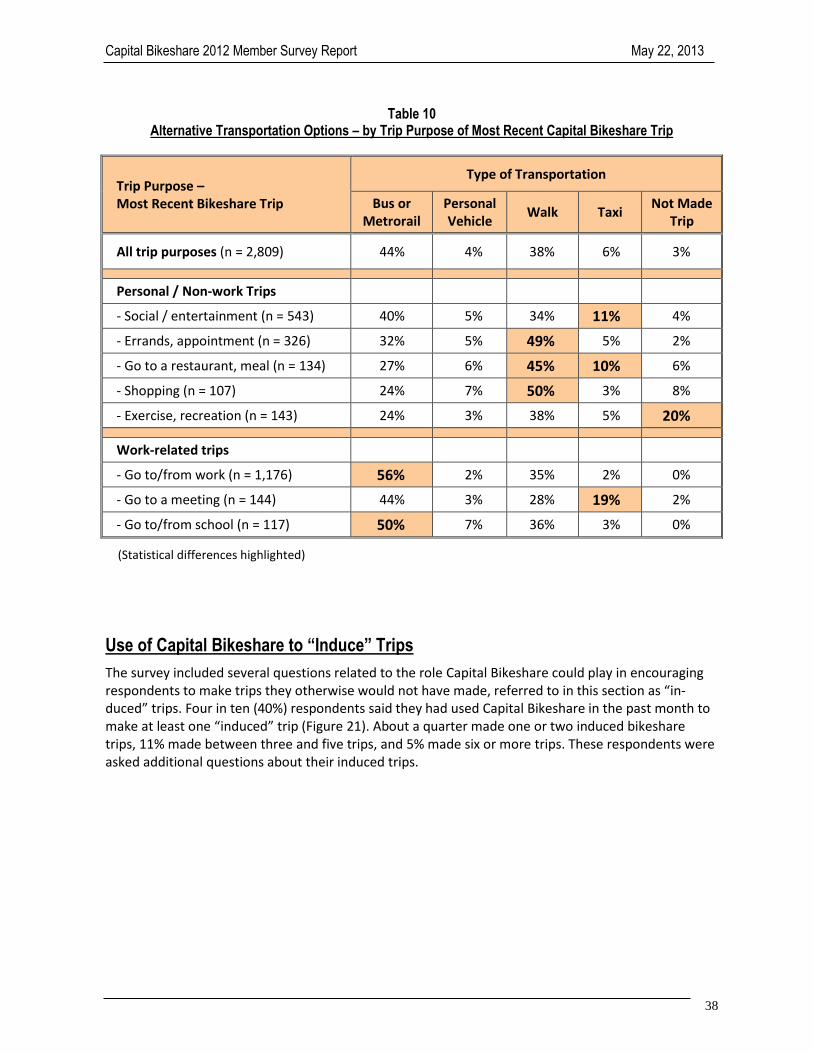
Capital Bikeshare 2012 Member Survey Report May 22, 2013
38
Table 10 Alternative Transportation Options – by Trip Purpose of Most Recent Capital Bikeshare Trip
Trip Purpose – Most Recent Bikeshare Trip
Type of Transportation
Bus or Metrorail
Personal Vehicle
Walk Taxi Not Made
Trip
All trip purposes (n = 2,809) 44% 4% 38% 6% 3%
Personal / Non-work Trips
- Social / entertainment (n = 543) 40% 5% 34% 11% 4%
- Errands, appointment (n = 326) 32% 5% 49% 5% 2%
- Go to a restaurant, meal (n = 134) 27% 6% 45% 10% 6%
- Shopping (n = 107) 24% 7% 50% 3% 8%
- Exercise, recreation (n = 143) 24% 3% 38% 5% 20%
Work-related trips
- Go to/from work (n = 1,176) 56% 2% 35% 2% 0%
- Go to a meeting (n = 144) 44% 3% 28% 19% 2%
- Go to/from school (n = 117) 50% 7% 36% 3% 0%
(Statistical differences highlighted)
Use of Capital Bikeshare to “Induce” Trips
The survey included several questions related to the role Capital Bikeshare could play in encouraging respondents to make trips they otherwise would not have made, referred to in this section as “in-duced” trips. Four in ten (40%) respondents said they had used Capital Bikeshare in the past month to make at least one “induced” trip (Figure 21). About a quarter made one or two induced bikeshare trips, 11% made between three and five trips, and 5% made six or more trips. These respondents were asked additional questions about their induced trips.

Capital Bikeshare 2012 Member Survey Report May 22, 2013
39
Figure 21 “Induced” Bikeshare Trips Made in Past Month
(n = 3,731)
Induced Trip Purposes
Figure 22 shows the trip purposes for which respondents made induced trips in the past month, com-pared with the results presented earlier for all bikeshare uses. In this chart, the trip purposes are or-dered from highest to lowest percentages of induced trips.
Figure 22 Bikeshare Trip Purposes – All Trips Made and “Induced” Trips
(All trips made n = 6,842, Induced trips n = 3,731)
0% 20% 40% 60% 80% 100%
Go to/from school
Go to a meeting
Go to/from work
Shopping
Exercise / recreation
Restaurant / meal
Errands / personal appointments
Social / entertainment
1%
4%
7%
9%
9%
12%
15%
20%
10%
4%
58%
55%
50%
66%
70%
70%
All trips
Induced trips
0%
20%
40%
60%
80%
100%
No trips 1-2 trips 3-5 trips 6 or more trips
60%
24%11%
5%

Capital Bikeshare 2012 Member Survey Report May 22, 2013
40
The distribution of non-work induced bikeshare trip purposes is similar to that for all bikeshare trips. The most common induced trips in the past month were for social / entertainment trips; 20% of all re-spondents made an induced trip for this trip purpose. This also was the most common overall trip pur-pose. Induced trips also were typically made for errands and personal appointments (15%) and for res-taurants/meals (12%). Exercise trips and shopping trips also were common induced trips, each men-tioned by 9% of respondents, although they were slightly less common overall. The distribution is quite different for work-related trips. Although a large share of respondents use Capital Bikeshare to go to or from work (58%), only 9% mentioned making an induced trip for this pur-pose. This is a reasonable result, however, as work-related trips would not generally be considered dis-cretionary trips. The trips that were noted might have been trips made to a workplace on a weekend or evening, when the respondent might otherwise have worked at home or not worked.
Induced Trip Destinations
The primary destinations to which respondents made induced bikeshare trips are illustrated in Figure 23. The vast majority of trips were made to destinations in the District of Columbia, with Dupont Cir-cle/Adams Morgan/Logan Circle and Downtown being the most common destinations overall; about 15% of respondents made an induced trip to these destinations. Other common destinations, named by at least 5% of all respondents included: Capitol Hill (9%), Georgetown (8%), Shaw/U Street (7%), Columbia Heights/Petworth/Mt. Pleasant (6%), and National Mall (5%).
Differences in Induced Trips by Member Subgroup
Several differences are noted in the rate at which various user subgroups made induced Capital Bikeshare trips and the particular induced trip purposes and destinations:
When Joined Capital Bikeshare – Respondents who joined Capital Bikeshare during 2012 made in-duced trips at about the same rate as did respondents who joined in 2010 or 2011 and made in-duced trips for the same distribution of trip purposes as early adopters.
Frequency of Capital Bikeshare Use – Frequent CB users report more induced trips than do infre-quent users; 64% of respondents who made at least 11 bikeshare trips in the past month had made an induced trip during that time, while only 41% of respondents who made fewer than six bikeshare trips made an induced trip. Frequent users also mentioned more induced trip than did infrequent users for five trip purposes:
Social / entertainment: 11 or more trips – 34% Fewer than 6 trips – 18%
Errand / appointment: 11 or more trips – 27% Fewer than 6 trips – 13%
Meal / restaurant: 11 or more trips – 20% Fewer than 6 trips – 10%
Shopping: 11 or more trips – 17% Fewer than 6 trips – 6%
Go to/from work: 11 or more trips – 13% Fewer than 6 trips – 5%
For example, a third (34%) of respondents who made 11 or more bikeshare trips in the past month made a social/entertainment induced trip, compared with only 18% of respondents who made fewer than six bikeshare trips.
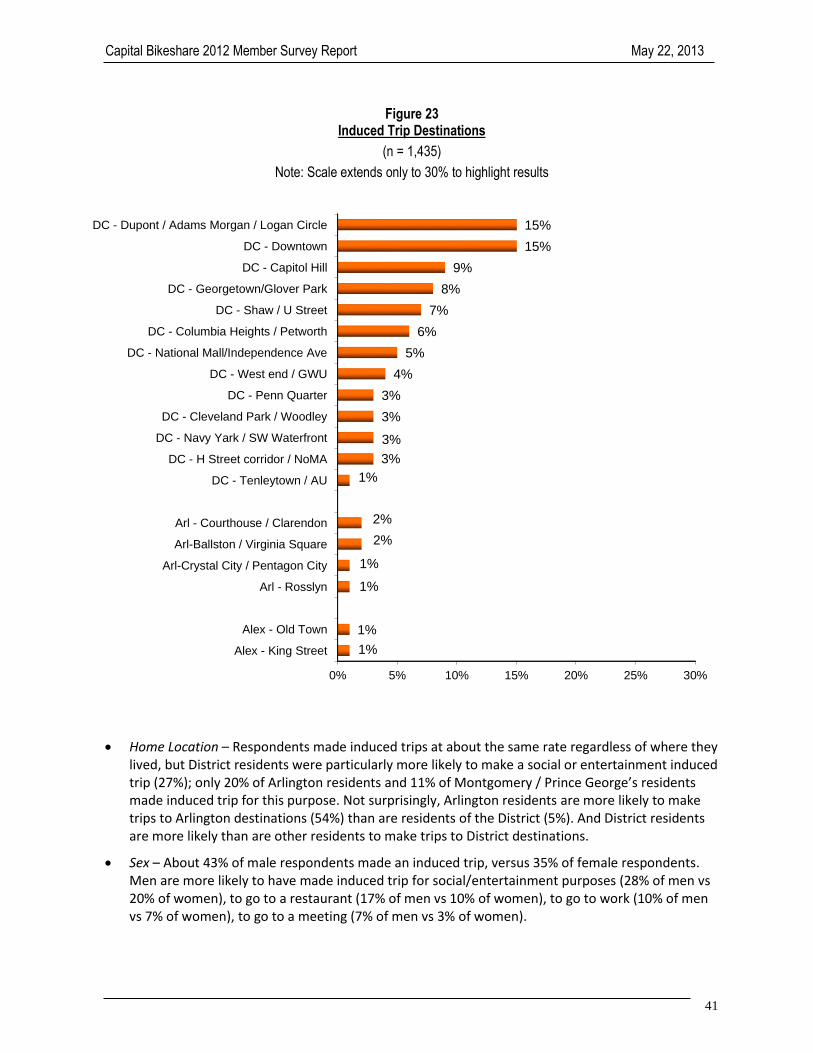
Capital Bikeshare 2012 Member Survey Report May 22, 2013
41
Figure 23 Induced Trip Destinations
(n = 1,435)
Note: Scale extends only to 30% to highlight results
Home Location – Respondents made induced trips at about the same rate regardless of where they lived, but District residents were particularly more likely to make a social or entertainment induced trip (27%); only 20% of Arlington residents and 11% of Montgomery / Prince George’s residents made induced trip for this purpose. Not surprisingly, Arlington residents are more likely to make trips to Arlington destinations (54%) than are residents of the District (5%). And District residents are more likely than are other residents to make trips to District destinations.
Sex – About 43% of male respondents made an induced trip, versus 35% of female respondents. Men are more likely to have made induced trip for social/entertainment purposes (28% of men vs 20% of women), to go to a restaurant (17% of men vs 10% of women), to go to work (10% of men vs 7% of women), to go to a meeting (7% of men vs 3% of women).
0% 5% 10% 15% 20% 25% 30%
Alex - King Street
Alex - Old Town
Arl - Rosslyn
Arl-Crystal City / Pentagon City
Arl-Ballston / Virginia Square
Arl - Courthouse / Clarendon
DC - Tenleytown / AU
DC - H Street corridor / NoMA
DC - Navy Yark / SW Waterfront
DC - Cleveland Park / Woodley
DC - Penn Quarter
DC - West end / GWU
DC - National Mall/Independence Ave
DC - Columbia Heights / Petworth
DC - Shaw / U Street
DC - Georgetown/Glover Park
DC - Capitol Hill
DC - Downtown
DC - Dupont / Adams Morgan / Logan Circle
1%
1%
1%
1%
2%
2%
1%
3%
3%
3%
3%
4%
5%
6%
7%
8%
9%
15%
15%

Capital Bikeshare 2012 Member Survey Report May 22, 2013
42
Age – About 45% of respondents who are younger than 35 years old made an induced trip, com-pared with 36% of respondents who are 35 or older. Young residents are in particular more likely to be making induced trips for social or entertainment purposes; 30% of respondents who are younger than 35 years made this type of induced trip, vs 18% who are between 35 and 44, and 10% of respondents who are 45 or older.
Income – Forty-three percent of respondents with incomes of less than $50,000 per year made an induced trip, versus 39% of respondents with incomes between $50,000 and $99,999, and 33% of respondents with incomes of $100,000 or more. Lower income respondents made more social / entertainment trips than did more affluent respondents, but this likely is related to younger re-spondents’ lower incomes.
Personal Vehicle Available – Access to a personal vehicle did not seem to influence respondents’ likelihood to make induced trips. About four in ten (40%) of respondents who have access to a per-sonal vehicle made an induced trip in the past month, compared with 41% of respondents who do not have a vehicle. Respondents who do not have a vehicle were slightly more likely to make a so-cial/entertainment induced trips (22%) than were respondents who do have a vehicle. There were no other statistical differences in the distribution of trip purposes for respondents who had vehi-cles and those without vehicles.
Personal Bike Available –A higher share of respondents who do not have a personal bike made more induced trip (43%) than was the case for respondents with a bike (37%). Those with bikes made slightly more induced trips for errands/appointments (18% with a bike vs 14% without a bike), social/entertainment (22% with a bike vs 19% without a bike), and for going to/from work (9% with a bike vs 6% without a bike), but they made fewer trips for exercise purposes (8% with a bike vs 11% without a bike).
Reasons for Using Bikeshare for Induced Trip
The previous sections of the report explored the reasons respondents used bikeshare for their most recent trips. Respondents who had made induced trips also were asked how bikeshare had influenced them to make trips they otherwise would not have made. Specifically, respondents were asked, “why would you not have made these trips without Capital Bikeshare?” Figure 24 presents these results, di-vided into the same four categories as were shown in Figure 19 for recent bikeshare trips: characteris-tics of the trip, issues related to the trip destination, issues related to the time of day the trip was made, and other personal reasons.

Capital Bikeshare 2012 Member Survey Report May 22, 2013
43
0% 20% 40% 60% 80% 100%
Other
Friends wanted to bicycle
Wanted to get exercise
Don't have a car
Don't like to drive to destination that time of day
No bus/train, inconvenient that time of day
Too much traffic at destination
Parking limited / expensive at destination
No bus/train, inconvenient to destination
Bicycle is faster, easier to destination
Too far to walk
5%
4%
17%
21%
12%
24%
12%
20%
31%
44%
61%
Figure 24 Why Respondent would not have Made Induced Trips without Bikeshare
(n = 1,430)
Overwhelmingly, respondents said they would not have made this trip without Capital Bikeshare be-cause it was too far to walk; 61% of respondents mention this reason. This response doesn't address whether other travel options were available to make the trips, but it suggests respondents might have substituted some induced trips to distant destination for trips they might have made to locations closer to their origin location. In this way, Capital Bikeshare broadens the travel destination options. Substantial percentages of respondents also note destination issues. Four in ten said bicycle is a faster or easier way to reach the destination and 31% reported that public transportation is either not availa-ble or inconvenient to reach that destination. Two in ten (20%) indicated parking is very limited at that destination and 12% said they would not have made that trip without bikeshare because there is too much traffic at the destination.
Personal Reasons
Trip Characteristics
Time of Day Issues
Destination Issues

Capital Bikeshare 2012 Member Survey Report May 22, 2013
44
Respondents also note reasons related to the time of day they were traveling. About a quarter (24%) said that transit service doesn’t operate or that transit is inconvenient at that time of day and 11% mentioned not liking to drive to that destination at that time of day. Finally, respondents mention reasons related either to personal preferences or personal constraints. About two in ten respondents said they would not have made the trip without Capital Bikeshare be-cause they don’t have a car and 17% made an induced trip primarily to get exercise. Respondents of different ages and incomes cite different reasons. Young respondents and respondents with lower incomes are more likely than average to mention reasons related to their lack of transpor-tation options: too far to walk, transit was either unavailable or inconvenient at that time or to that destination, or that they do not have a car. These respondents also noted reasons related to the time and cost advantage of Capital Bikeshare in comparison with other travel options. For these members, bikeshare expands the range of destinations to include locations that are otherwise difficult to reach. Older respondents and those with higher incomes more often mention reasons related to disad-vantages of driving: they don’t want to drive to that destination at that time of day, too much traffic around that destination, or that parking is limited at the destination. For these respondents, Capital Bikeshare makes the destination more attractive or less of a bother to reach than it otherwise would be.
Role of Capital Bikeshare in Encouraging Patronage of Bikeshare-accessible Estab-lishments
Several of the earlier results indicate that the availability of Capital Bikeshare bikes broadens the range of destinations to which members can travel. To examine this further, the survey included a question that asked, “if a commercial / retail business, restaurant, or shop is easily accessible by Capital Bikeshare, does that access make you more or less likely to patronize that establishment?" These re-sults are presented in Figure 25. The figure clearly shows that Capital Bikeshare access makes establishments more attractive to most bikeshare members. More than eight in ten respondents said they are either much more likely (37%) or somewhat more likely (48%) to patronize a bikeshare-accessible establishment. One in ten said ac-cess is not a factor in their choice of establishments. Bikeshare access certainly does not appear to be detrimental to an establishment; only 4% of the respondents who answered the question said they would be less likely to patronize a bikeshare-accessible establishment.

Capital Bikeshare 2012 Member Survey Report May 22, 2013
45
Figure 25 Likelihood to Patronize Establishment if Accessible by Capital Bikeshare
(n = 2,759)
Frequency of Bikeshare Trips by Interest in Capital Bikeshare Accessibility
Given the overwhelming support shown for Capital Bikeshare-accessibility across all survey respond-ents, it is not surprising that this result is consistent across nearly all respondent subgroups. One inter-esting result, however, is that respondents who report they are much more likely to patronize a bikeshare-accessible establishment made more bikeshare trips in the past month than do respondents who are only somewhat more likely or not more likely (Figure 26).
Figure 26 Trips Made in Past Month – by Likelihood to Patronize Establishment if Accessible by Capital Bikeshare
(Not more likely n = 416, Somewhat more likely n = 1,273, Much more likely n = 998)
0%
20%
40%
60%
80%
100%
Much less likely Somewhat lesslikely
Not more likely Somewhat morelikely
Much more likely
2% 2%11%
48%
37%
0%
20%
40%
60%
80%
100%
Not more likely Somewhat more likely Much more likely
23% 20%14%
42%46%
40%35% 35%
46%
0 trips last month 1-5 trips last month 6 or more trips last month

Capital Bikeshare 2012 Member Survey Report May 22, 2013
46
Among respondents who are much more likely to patronize an establishment, 86% made at least one bikeshare trip last month, compared with only 77% of those who are not more likely. And respondents who are much more likely are the most frequent users of the Capital Bikeshare service; 46% made six or more trips, compared with 35% of those who are somewhat more likely or not more likely to pat-ronize the bikeshare-accessible establishment.
Induced Trips by Interest in Capital Bikeshare Accessibility
Respondents who said bikeshare access was a motivating factor also made induced trips at a much higher rate (Figure 27). Two-thirds (67%) of respondents who are much more likely to patronize a Capi-tal Bikeshare-accessible establishment made an induced trip in the past month, compared with 48% who said they are somewhat more likely, and only 33% of those who said they are not more likely to patronize the establishment. This suggests that the decision to make some, and perhaps many, of the induced trips was motivated by the establishments’ accessibility.
Figure 27 Made Induced Trip in Past Month – by Likelihood to Patronize Establishment if Accessible by Capital
Bikeshare
(Not more likely n = 415, Somewhat more likely n = 1,273, Much more likely n = 999)
Changes in Use of Biking and Non-Biking Modes Since Joining Capital Bikeshare
One expected impact of bikeshare is to encourage members to shift travel from other modes to bicy-cling. To explore this possibility, the survey asked respondents if, as a result of their use of Capital Bikeshare, they had increased, decreased, or made not change in how often they ride a bicycle and how often they use other forms of transportation. These results are shown in this section.
0%
20%
40%
60%
80%
100%
Not more likely Somewhat more likely Much more likely
67%
52%
33%28%
44%
55%
5% 4%12%
0 induced trips 1 to 5 induced trips 6 or more induced trips

Capital Bikeshare 2012 Member Survey Report May 22, 2013
47
Change in Bicycle Use
Figure 28 presents the percentages of respondents who made changes in their use of bicycle after join-ing Capital Bikeshare. About a quarter (27%) said they bicycle more often since joining and 44% made no change in how often they bicycle.
Figure 28 Change in Bicycle Use Since Joining Capital Bikeshare
(n = 2.527)
Three in ten (29%) respondents said they reduced their bicycling since joining Capital Bikeshare. This result seems counter-intuitive, particularly when compared with the results from the 2011 Capital Bikeshare survey, in which only 1% of respondents said they reduced their bicycle use. The question referred to use of “any bike” and was worded in the same way in 2012 as in 2011. But it is possible that some 2012 respondents might have misinterpreted the question as asking about a change in use of personal, non-CB bikes. For example, 32% of respondents who said they have a per-sonal bike reported biking less often than before they joined CB, compared with only 25% of respond-ents who do not have a personal bike. To test this idea further, the analysis examined the number of Capital Bikeshare trips the respondents made in the past month by their reported change in bicycle use (Figure 29). As shown by the figure, respondents who reported a greater increase in bike use also reported more frequent Capital Bikeshare use. Respondents who said they bike “much more often” reported making an average of 11.0 bikeshare trips in the past month, compared with 6.8 trips for respondents who said they bike “more often,” and 8.6 trips for those who reported no change in bike use. And 71% of “much more often” respondents made at least six Capital Bikeshare trips in the past month, compared to 46% of the “more often” respondents, and only 53% of those who reported no change in bike use. But a significant portion of respondents who said they bike “less often” or “much less often” also use bikeshare frequently; 75% of those who bike “much less often” and 62% who bike “less often” re-ported making at least six bikeshare trips in the past month. In fact, the bikeshare use distributions are nearly the same for respondents who bike “much less often” and those who bike “much more often.” A similar result is clear for the “bike less often” and “bike more often” respondent sub-groups. This suggests they might have shifted some bike use from a personal bike to a bikeshare bike.
0%
20%
40%
60%
80%
100%
Much less often Less often About the same More often Much moreoften
15% 14%
44%
12% 15%

Capital Bikeshare 2012 Member Survey Report May 22, 2013
48
Figure 29 Capital Bikeshare Trips Made Last Month – by Change in Bicycle Use Since Joining Capital Bikeshare
(Bike change: Much less often n = 366, Less often n = 361, About the same n = 1,124, More often n = 310, Much more often n = 364)
Change in Use of Transit, Walking, and Auto Modes
The survey also asked respondents if they had changed their use of any five non-bicycle types of trans-portation: Metrorail, bus, walking, driving a car, and taxi. These results are illustrated in Figure 30. Change in Use of Transit Modes – Respondents substantially reduced their use of both bus and Metro-rail since they joined Capital Bikeshare. More than six in ten reduced their use of Metrorail; 40% ride Metrorail less often and 21% ride much less often. About half ride a bus less often (33%) or much less often (19%). Only 4% of respondents increased use of Metrorail and 3% increased bus use. Change in Use of Walking – Respondents also decreased their use of walking substantially; more than half walk less often (46%) or much less often (8%). Seven percent of respondents said they now walk more often. Change in Use of Auto Modes – Finally, the survey asked respondents about changes they made since joining Capital Bikeshare in how often they drive a car and how often they ride in a taxi. Respondents substantially reduced their use of car and taxi. Half reduced their car use; 30% said they drive a car less often and 20% drive much less often. The results are similar for taxi; three in ten ride in a taxi less of-ten (29%) and about the same percentage use a taxi much less often (31%). Only 1% of respondents increased use of car or taxi.
0%
20%
40%
60%
80%
100%
Bike much lessoften
Bike less often Bike about thesame
Bike more often Bike much moreoften
9%
19% 22% 23%
11%16% 19%
25%
34%
18%22%
26%18% 21% 20%
53%
36% 35%
25%
51%
1-2 trips 3-5 trips 6-10 trips 11 or more trips
Bikeshare trips last month
11.3 trips 8.6 trips 8.6 trips 6.8 trips 11.0 trips

Capital Bikeshare 2012 Member Survey Report May 22, 2013
49
Figure 30 Change in Use of Non-bicycle Modes Since Joining Capital Bikeshare
(Bus n = 2,626, Metrorail n = 2,671, Walk n = 2,653, Car n = 2,557, Taxi n = 2,607)
Change in Use of Non-bicycling Modes by Frequency of Capital Bikeshare Use
The preceding figures showed that, overall, survey respondents increased their use of biking and de-creased use of other modes. As also noted earlier, many respondents said they use Capital Bikeshare to make some trips they would not otherwise make. For these trips, bikeshare would not substitute for another mode. But presumably, some trips now made by bikeshare would have been made previously by a different type of transportation. To examine possible shifts in mode use, Table 11 compares changes in respondents’ use of each non-biking mode against their frequency of bikeshare use. Each mode column in the table presents the percentage of respondents who reduced use of that mode by the frequency with which they use Capital Bikeshare. For example, the Metrorail column shows that 47% of respondents who made one to two trips by bikeshare in the past month reduced their bus use after joining the program. Among respondents who made three to five bikeshare trips in the past month, 51% had reduced Metrorail use since joining bikeshare. The percentage of respondents who reduced Metrorail use is even greater among those who made six to ten CB trips (69%) and 11 or more trips (72%). The “Net reduction” row shows that the percentage of respondents in the most frequent bikeshare use group (11 or more trips = 72%) who reduced Metrorail use is 25 percentage points higher than for the most infrequent bikeshare use group (1 to 2 trips = 47%).
-80% -60% -40% -20% 0% 20% 40% 60% 80%
Taxi
Drive a car
Walk
Bus
Metrorail
-29%
-30%
-46%
-33%
-40%
-31%
-20%
-8%
-19%
-21%
39%
49%
39%
45%
35%
1%
1%
7%
3%
4%
Less often Much less often About the same More often/Much more often

Capital Bikeshare 2012 Member Survey Report May 22, 2013
50
Table 11 Respondents Who Reduced Use of Transportation Modes Other than Bicycle – by Frequency of Capital
Bikeshare Use
(1-2 trips n = 466, 3-5 trips n = 632, 6-10 trips n = 512, 11 or more trips n = 1,040)
Capital Bikeshare Trips In Past Month
Percentage of Respondents who Reduced Use of Mode
Metrorail Bus Walk Drive a Car Taxi
1-2 trips 47% 38% 42% 41% 47%
3-5 trips 51% 45% 51% 49% 60%
6-10 trips 69% 53% 54% 50% 65%
11 or more trips 72% 64% 60% 55% 64%
Net reduction 25% 26% 18% 14% 17%
The results are similar for all mode groups; the share of respondents who reduced use of a non-biking mode since they joined Capital Bikeshare increases steadily as their bikeshare use increases. The change is most pronounced for Metrorail and bus. The differences are less dramatic for use of walk, driving a car, and taxi, suggesting that bikeshare is substituted less often for these modes.
Net Change in Use of Non-bike Modes by Vehicle Availability
It seems reasonable to expect that car-free respondents would have made different mode changes than did those who have a vehicle option. Figure 31 compares the “net reduction” in use of the five non-bike modes for respondents who have a personal vehicle available for regular travel with those who do not have a vehicle. In this chart the “net change” percentages for each mode are calculated as the percentages of respondents who said they reduced use of that mode since joining Capital Bikeshare minus the percentage who said they increased use of the mode. Both respondent subgroups show significant reduction in driving a car. Respondents with access to a personal vehicle show a greater net reduction (-56%) than do respondents with access to a vehicle (-42%). This is a reasonable result, since respondents who did not have a vehicle when they joined Cap-ital Bikeshare would have had limited vehicle use before joining. Conversely, respondents who do not have a vehicle regularly available for their travel show greater reductions in use of taxi, bus, Metrorail, and walking, although respondents who have a vehicle available also have substantial net reductions in these modes, indicating that some Capital Bikeshare trips replaced trips for which they otherwise would have used these other modes.

Capital Bikeshare 2012 Member Survey Report May 22, 2013
51
Figure 31 Net Change in Use of Car, Taxi, Bus, Metrorail, and Walk Since Joining Capital Bikeshare – by Vehicle
Available
(Vehicle available n = 1,362, No vehicle available n = 1,186) Statistical differences highlighted in red
Net Change in Use of Non-bike Modes by Home Locations
The mode use “net change” comparison shown in Figure 32 compares mode changes for respondents who live in the two jurisdictions where most Capital Bikeshare stations are located: Arlington County and the District of Columbia. Again, both groups of respondents have net reductions in use of all five modes. But District of Colum-bia respondents report much greater net reductions than do Arlington County respondents in their use of three modes: taxi (-62% in the District vs -51% in Arlington), bus (-54% in the District vs -36% in Ar-lington), and Metrorail (-60% in the District vs -43% in Arlington). Reductions in the use of walking and car are not statistically different for the two groups.
-100%
-80%
-60%
-40%
-20%
0%Drive a car Use a taxi Ride a bus Ride Metrorail Walk
-56% -55%
-45%
-54%
-44%-42%
-64%
-56% -58%
-50%
Vehicle available No vehicle available
-14% -9% -11% -4% -6% GAP
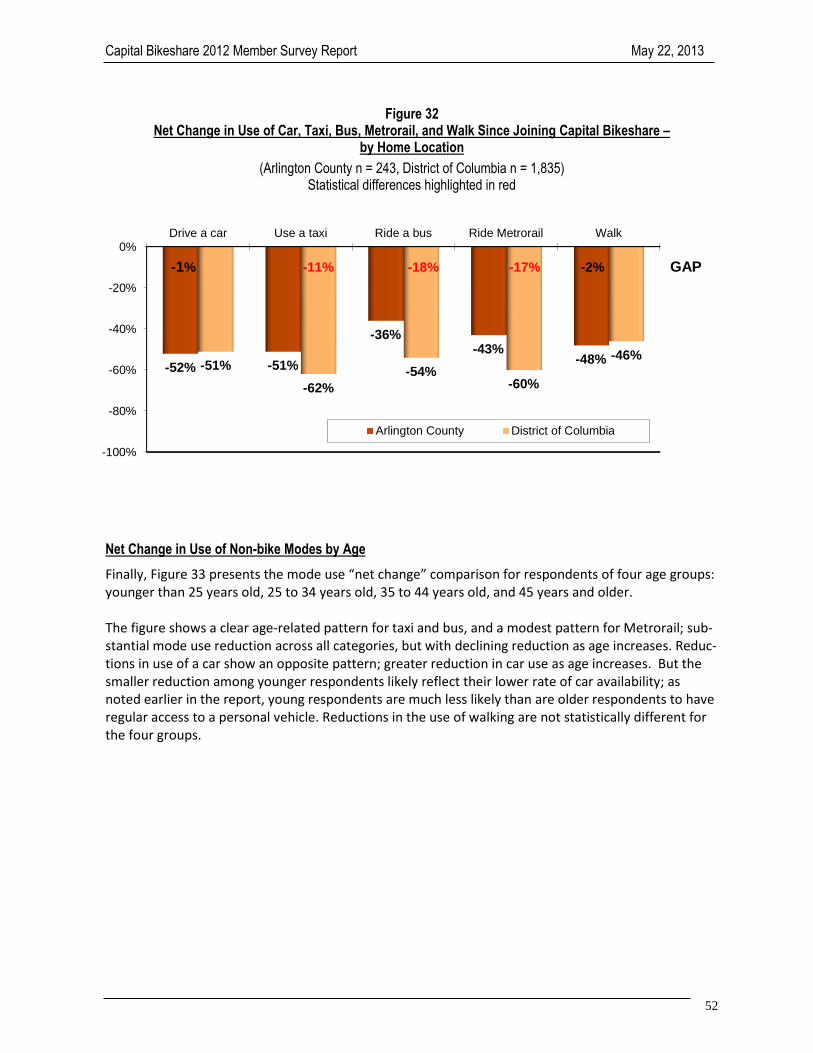
Capital Bikeshare 2012 Member Survey Report May 22, 2013
52
Figure 32 Net Change in Use of Car, Taxi, Bus, Metrorail, and Walk Since Joining Capital Bikeshare –
by Home Location
(Arlington County n = 243, District of Columbia n = 1,835) Statistical differences highlighted in red
Net Change in Use of Non-bike Modes by Age
Finally, Figure 33 presents the mode use “net change” comparison for respondents of four age groups: younger than 25 years old, 25 to 34 years old, 35 to 44 years old, and 45 years and older. The figure shows a clear age-related pattern for taxi and bus, and a modest pattern for Metrorail; sub-stantial mode use reduction across all categories, but with declining reduction as age increases. Reduc-tions in use of a car show an opposite pattern; greater reduction in car use as age increases. But the smaller reduction among younger respondents likely reflect their lower rate of car availability; as noted earlier in the report, young respondents are much less likely than are older respondents to have regular access to a personal vehicle. Reductions in the use of walking are not statistically different for the four groups.
-100%
-80%
-60%
-40%
-20%
0%Drive a car Use a taxi Ride a bus Ride Metrorail Walk
-52% -51%
-36%-43%
-48%-51%
-62%
-54%-60%
-46%
Arlington County District of Columbia
-1% -11% -18% -17% -2% GAP

Capital Bikeshare 2012 Member Survey Report May 22, 2013
53
Figure 33 Net Change in Use of Car, Taxi, Bus, Metrorail, and Walk Since Joining Capital Bikeshare – by Age
(Under 25 years n = 234, 25 - 34 n = 1,365, 35 – 44 n = 486, 45 and older n = 408)
Changes in Vehicle Ownership and Driving Miles Since Joining Capital Bikeshare
The previous section described the results of a qualitative question about Capital Bikeshare members’ change in use of driving a car since joining the program. The survey also included several questions to examine two quantitative measures of driving change: changes in auto ownership and change in the annual number of miles respondents drive since joining Capital Bikeshare.
Change in Household Vehicles
All respondents were asked if they sold or considered selling a personal household vehicle since they joined Capital Bikeshare. Figure 34 presents the results for this question.
Figure 34 Sold Personal Household Vehicles Since Joining Capital Bikeshare
(n = 2,926)
-100%
-80%
-60%
-40%
-20%
0%Drive a car Use a taxi Ride a bus Ride Metrorail Walk
-42%
-59% -61% -59%
-47%-48%
-62%
-54%-60%
-46%-51%
-59%
-44%-48% -46%
-56%-51%
-39%
-52%-47%
Under 25 years 25 - 34 35 - 44 45 years and older
0%
20%
40%
60%
80%
100%
No Considered sellingvehicle
Sold vehicle, butreplaced it
Sold vehicle, didnot replace it
86%
7% 2% 5%

Capital Bikeshare 2012 Member Survey Report May 22, 2013
54
Eighty-six percent of respondents said they had not made any changes or considered making changes in the number of vehicles in the household. Seven percent considered selling a vehicle but had not done so. Two percent did sell a vehicle since joining Capital Bikeshare, but said they replaced the vehi-cle with another, so didn’t reduce the number of household vehicles. The remaining 5% sold a vehicle and did not replace it, thus they reduced the total number of vehicles available to members of their households. Number of Household Vehicles by Sold Vehicle – Figure 35 presents the distribution of household vehi-cles at the time of the survey for respondents who sold a vehicle they did not replace (reduced HH ve-hicle) and those who did not make any change in the number of household vehicles. Respondents who reduced a household vehicle have a considerably smaller average number of vehicles in the household (0.67 vehicles), compared with 0.94 vehicles for respondents who did not made a change in the num-ber of household vehicles. Among respondents who reduced a household vehicle, 50% report that they now live in zero-vehicle households, indicating they sold their only vehicle. Another third (37%) shifted from a two-vehicle household to a one-vehicle household. The remaining 13% of “reduced vehicle” respondents still have two or more vehicles in the household. Figure 35 also shows the distribution of household vehicles for respondents who did not reduce a vehi-cle. As is clear, although the car-free percentage (34%) is still much higher than the regional average, it is considerably smaller than for respondents who reduced a vehicle. And the percentages of respond-ents who reported one, two, and three or more vehicles is higher than for the “reduced vehicle” re-spondents.
Figure 35 Current Number of Vehicles by Change in Household Vehicle
(Reduced HH vehicle n = 126; Did not reduce HH vehicle n = 2,755)
0%
20%
40%
60%
80%
100%
Reduced HH vehicles Did not reduce HH vehicles
50%
34%37%46%
9%15%
4% 5%
0 HH vehicles 1 HH vehicle 2 HH vehicle 3 or more HH vehicle
0.67 vehicle/HH 0.94 vehicle/HH

Capital Bikeshare 2012 Member Survey Report May 22, 2013
55
Change in Mode Use by Sold Vehicle – Respondents who reduced a household vehicle show greater “net reduction” in use of driving a car, compared with respondents who did not make a vehicle change. More than three-quarters (78%) of respondents who eliminated a vehicle report that they drive a car “less often” or “much less often,” compared with about half (48%) of respondents who did not eliminate a vehicle. These respondents show a corresponding net increase in bicycle use; 14% who eliminated a household vehicle report a net increase in bicycle use, compared with only 1% of re-spondents who did not eliminate a vehicle, suggesting they shifted some trips from car to bike. But in-terestingly, they did not show any significant increases in use of other modes, compared with respond-ents who had not changed the number of household vehicles. Importance of Capital Bikeshare in Encouraging Sale of Vehicle – Respondents who sold a vehicle that they didn’t replace or considered selling a vehicle were asked how important their membership in Cap-ital Bikeshare had been to this decision (Figure 36). Overall, about 81% of respondents said Capital Bikeshare had been at least a minor factor in the decision. A quarter (25%) said it was a major factor in combination with other factors, and 5% said it was the main factor.
Figure 36 Importance of Capital Bikeshare in Encouraging Sale of Vehicle
(n = 338)
When results for this question were examined separately for respondents who sold a vehicle and those who only considered selling a vehicle, however, the results were unexpected and perhaps coun-ter-intuitive (Figure 37). About 75% of respondents who actually sold a vehicle reported that Capital Bikeshare had been a factor in their decision, compared with 86% of those who only considered selling a vehicle. And respondents who considered but did not sell a vehicle rated it as a more important fac-tor than did those who actually sold a vehicle. These results suggest that Capital Bikeshare influences some members to eliminate vehicle ownership, but that most bikeshare members are influenced by a range of factors, with bikeshare playing a supporting role, rather than the primary role.
0%
20%
40%
60%
80%
100%
CB was not a factor CB minor factor CB a major factor CB the main factor
19%
51%
25%
5%

Capital Bikeshare 2012 Member Survey Report May 22, 2013
56
Figure 37 Importance of Capital Bikeshare in Encouraging Sale of Vehicle
(Sold vehicle n = 129, Considered selling vehicle n = 209)
Annual Miles Traveled by Driving
Respondent also were asked approximately how many miles they drove per month in the year before they joined Capital Bikeshare and how many miles they drive now. Before bikeshare, respondents drove an average of 150 miles per month, or about 1,805 miles annually. Since joining, the average driving miles fell to about 134 per month, or 1,607 per year. Figure 38 presents the distribution of respondents by their annual driving miles. Before bikeshare, 18% of respondents drove more than 2,500 miles per year. Now, 16% of respondents drive this far in a year.
Figure 38 Total Annual Vehicle Miles Driven Before and After Joining Capital Bikeshare
(Before Capital Bikeshare n = 2,880, With Capital Bikeshare n = 2,422)
0%
20%
40%
60%
80%
100%
1,000 miles orless
1,001 - 2,500miles
2,501- 5,000miles
5,001 - 7,500miles
7,501 - 10,000miles
More than10,000 miles
66%
15%6% 6%
2%4%
68%
15%6% 5% 2% 3%
Before CB Since Joining CB
More than 2,500 miles
Before CB = 18%
Since CB = 16%
0%
20%
40%
60%
80%
100%
Sold vehicle/did not replace Considered selling vehicle
25%14%
48%55%
22% 25%
5% 6%
CB was not a factor CB minor factor CB major factor CB main factor

Capital Bikeshare 2012 Member Survey Report May 22, 2013
57

Capital Bikeshare 2012 Member Survey Report May 22, 2013
58
Change in Annual Driving Miles
A quarter (26%) of respondents who reported their mileage before and with bikeshare reduced their driving miles (Figure 39). Fourteen percent reduced from one to 500 miles, 5% eliminated between 501 and 1,000, 4% reduced between 1,001 and 2,500, and 3% reduced more than 2,500 annual driving miles. Nine percent of respondents increased their annual driving miles, but these increases were modest, compared to decreases; 6% added between one and 500 miles and 3% percent increased mileage by more than 500 miles.
Figure 39 Change in Annual Vehicle Miles Driven Since Joining Capital Bikeshare
(n = 2,373)
Changes in Driving Miles by Various Groups of Respondents – Changes in driving miles are not uni-formly distributed across all respondents. Table 12 shows the percentages of various respondent groups who decreased driving miles, increased driving miles, and made no changes. The change in the number of driving miles after joining Capital Bikeshare appeared connected to:
Age – Older respondents are more likely than are young respondents to have reduced their driv-ing miles. Driving reductions are noted in all age groups, but only about 20% of respondents who are under 25 report a reduction, compared with at least 26% of older respondents.
Sex – A higher proportion of male respondents decreased driving miles (29% of men vs 21% of women). The difference in increased miles is not significant, thus female respondents are more likely to have maintained their driving miles.
Race / Ethnicity – The observed different in driving reduction by Non-white (28%) and White re-spondents (25%) is not statistically significant.
Number of Capital Bikeshare Trips in Past Month – Respondents who are frequent bikeshare us-ers are more likely to report reduced driving miles than are respondents who use bikeshare less often. Almost a third (32%) of respondents who made 11 or more bikeshare trips in the past
0%
20%
40%
60%
80%
100%
More than2,500 miles
1,001 -2,500 miles
501 - 1,000miles
1 - 500 miles No change 1 - 500 miles More than500 miles
3% 4% 5%14%
65%
6% 3%
Reduced driving miles = 26%
Increased driving miles = 9%
Reduced driving Increased driving

Capital Bikeshare 2012 Member Survey Report May 22, 2013
59
month reduced their annual driving miles compared with only about two in ten of those who made no trips or only one or two trips in the past month.
Table 12 Change in Annual Driving Miles Since Joining Bikeshare – By Age, Sex, Race / Ethnicity, and
Frequency of Bikeshare Use
Respondent Characteristic
Change in Annual Driving Miles
Reduced Miles
Increased Miles
Age
Less than 25 years old (n = 256) 20% 9%
25 – 34 years old (n =1,546) 26% 10%
35 – 44 years old (n = 596) 26% 9%
45 or older (n = 543) 28% 7%
Sex
Female (n = 1,309) 21% 10%
Male (n = 1,6519) 29% 9%
Race / Ethnicity
Non-white (n = 554) 28% 11%
White (n = 2,215) 25% 9%
Capital Bikeshare trips in Past Month
0 trips (n = 379) 20% 10%
1 – 2 trips (n = 532) 19% 8%
3 – 5 trips (n = 686) 24% 9%
6 – 10 trips (n = 557) 27% 12%
11 or more trips (n = 1,131) 32% 9%
(Statistical differences highlighted)
Impact of Driving Miles Changes Overall
On average, respondents who report both a current and pre-bikeshare mileage drove about 1,805 miles per year before bikeshare. At the time of the survey (with-bikeshare), respondents drove an av-erage of 1,607 per year, a reduction of about 198 miles annually.

Capital Bikeshare 2012 Member Survey Report May 22, 2013
60
When these survey results are applied to the estimated Capital Bikeshare member population in No-vember 2012, the month in which the survey was conducted, the results are as follows: Number of Capital Bikeshare members (November 2012) 22,205 Estimated annual VMT reduced per member 198
Estimated total annual VMT reduced 4,396,600 annual miles Contribution of Capital Bikeshare to Reduction in Driving – It is likely that not all of the 4.4 million driv-ing miles reduction is directly due to or influence by Capital Bikeshare. Respondents who said they de-creased their driving miles since joining Capital Bikeshare were asked to what extent Capital Bikeshare contributed to the change. Figure 40 presents the results for this question for all respondents and for those with and without regular access to a personal vehicle. Overall, 78% of respondents who reduced their driving miles indicated that bikeshare had been at least somewhat of a factor contributing to the reduction. Thirteen percent said that it was the main factor influencing their reduced driving and 29% said it was a major factor, in combination with other factors. About 36% said bikeshare was a minor factor, in combination with other factors. Two in ten (22%) said bikeshare had not been a factor at all.
Figure 40
Role of Capital Bikeshare in Contributing to Reduced Driving – Overall and by Vehicle Available
(Overall n = 1,106, Vehicle available n = 720, No vehicle available n = 386)
The results for bikeshare as a major or main influence are essentially the same for respondents who have a vehicle and those who do not, with 42% of those with a vehicle and 40% of those without a ve-hicle reporting bikeshare as a major or main factor influencing their driving reduction. But the figure clearly shows that bikeshare was at least somewhat influential for 84% of respondents with a vehicle,
0%
20%
40%
60%
80%
100%
Overall Vehicle available No vehicle available
22%16%
32%36%
39%
29%29% 30%27%
13% 12% 13%
Not a factor Minor factor, Major factor Main factor
Bikeshare was a factor
78% 84% 68%

Capital Bikeshare 2012 Member Survey Report May 22, 2013
61
compared with only 68% of those without a vehicle. Presumably, this is because many of those with-out a vehicle did not have one when they joined bikeshare.
Capital Bikeshare Members’ Cost Saving by Using Capital Bikeshare
One possible personal outcome of a members’ use of Capital Bikeshare would be to reduce his or her transportation costs. Capital Bikeshare service is free for the first 30 minutes of any trip, so trips that are shifted from public transit, taxi, or even personal vehicle would result in cost saving for the mem-ber. Respondents were asked how much money they thought Capital Bikeshare saves them weekly on their travel costs, compared to what they were spending before they joined. As illustrated in Figure 41, 87% of respondents who answered the question said they thought Capital Bikeshare saves them money. About two-thirds said they save between one dollar and $20 per week, 17% save between $21 and $40, and four percent save between $41 and $60. About 3% save more than $60. Across all respondents, the average weekly saving would be about $15.39, or about $800 over the course of the year. Not surprisingly, respondents who use bikeshare more often reported higher cost savings. Respondents who made at least 11 trips in the previous month reported an aver-age weekly saving of $21.63, for an annual total of $1,125.
Figure 41 Weekly Travel Cost Saving Since Joining Capital Bikeshare
(n = 2,752)
Collectively, the 22,205 Capital Bikeshare members in November 2012 are saving more than $17.7 mil-lion dollars each year.
Number of bikeshare members (November 2012) 22,205 Estimated annual cost saving per member $800
Estimated total annual cost saving $17,764,000 annually
0% 20% 40% 60% 80% 100%
$0 per week
$1 - $20 per week
$21 - $40 per week
$41 - $60 per week
More than $60
13%
63%
17%
4%
3%
Average weekly
saving $15.39

Capital Bikeshare 2012 Member Survey Report May 22, 2013
62
Work Travel of Bikeshare Users and Changes Since Joining Capital Bikeshare More than nine in ten (95%) respondents said they are employed. These respondents were asked about their current travel from home to work and about changes they might have made in their travel since they joined Capital Bikeshare.
Commute Distance to Work
Bikeshare members travel much shorter distances to work than do all commuters in the region. Figure 42 presents the distribution for bikeshare users and for commuters across the Washington metropoli-tan region. More than six in ten bikeshare survey respondents travel fewer than five miles to work and 40% travel fewer than three miles. Only about 18% travel 10 miles or more. On average, bikeshare sur-vey respondents travel 6.3 miles to work, one-way. This is statistically the same as the average dis-tance (6.2 miles) reported in the November 2011 Capital Bikeshare Survey.
Figure 42 Commute Distance – Bikeshare Users and All Commuters
(November 2012 Capital Bikeshare respondents n = 4,927, 2010 SOC All Commuters n = 5,533)
The figure also shows the distance distribution for all commuters in the region (2010 SOC survey). The bikeshare distance is dramatically different than than for all commuters in the region. Only 17% of all regional commuters travel five miles or fewer and 63% of all regional commuters travel 10 or more miles. The average commuter in the Washington metropolitan region travels 16.5 miles one-way to work, about 10 miles farther than the distance traveled by the average Capital Bikeshare respondent. Among bikeshare respondents, those who live in the District of Columbia travel shorter distances than do respondents who live in Arlington or in any other jurisdiction; 73% of District respondents commute fewer than five miles, while only 48% of Arlington residents have such a short trip. Young respondents also are more likely to have short commutes; 68% of respondents who are younger than 35 years
0%
20%
40%
60%
80%
100%
Less than 2miles
2 - 2.9 miles 3 - 4.9 miles 5 - 9.9 miles 10 - 19.9 miles 20+ miles
20% 20% 23%19%
11%7%5% 4%
8%
20%
29%34%
2012 Bikeshare All commuters (2010 SOC)
Less than 5 miles Bikeshare = 63%
All commuters = 17%
5 miles or more Bikeshare = 37%
All commuters = 83%

Capital Bikeshare 2012 Member Survey Report May 22, 2013
63
travel fewer than five miles to work, compared with 53% of respondents who are 45 years of age or older. Travel Mode Used to Get to Work
Mode as a Percentage of Weekly Commute Days – The survey asked respondents what type or types of transportation they use to get to work over the course of a “typical week.” Figure 43 presents com-mute mode split as a percentage of weekly work trips. The figure includes six traditional “on the road” mode groups for travel to job locations outside the home: transit (train/Metrorail/commuter rail and bus), bicycle, walk, carpool/vanpool, drive alone, and taxi. The figure also includes the mode share for telework. This is not actually a travel mode, but this figure includes it to show the percentage of weekly work trips that are eliminated through use of this work location option.
Figure 43 Commute Modes – Percentage of Weekly Trips
(n = 4,864)
The overwhelming majority (87%) of respondents’ work trips are made by a mode other than driving alone. Four in ten (41%) of trips are made by public transit (Metrorail, bus, or commuter rail) and 27% are bicycle trips. Approximately equal shares of trips are made by walking (12%) and driving alone (12%), 2% are carpool or vanpool trips, and 1% of trips are made by taxi. The remaining 5% of com-mute trips are eliminated through telework (work at home). “Primary” Commute Mode – Figure 44 displays a second format for commute mode split – the percentage of respondents who use each mode as their “primary” mode, that is, the mode they use most days during the
week. The results of this figure are closely aligned with the percentages of weekly commute trips, be-cause many respondents use their primary mode four or five days of the week. Nine in ten (88%) respondents primarily use a mode other than driving alone. Four in ten (41%) re-spondents travel to work most days by public transit (Metrorail, bus, or commuter rail) and 30% said
0% 20% 40% 60% 80% 100%
Taxi
Drive alone
Carpool/vanpool
Telework
Walk
Bicycle
Transit
1%
12%
2%
5%
12%
27%
41%
Alternative modes
87%

Capital Bikeshare 2012 Member Survey Report May 22, 2013
64
they primarily bicycle. Equal shares of respondents walk (12%) and drive alone (12%). About 2% either carpool or vanpool and the remaining 3% said they primarily telework (work at home).
Figure 44 Primary Commute Mode of Capital Bikeshare Survey Respondents
(n = 4,864)
These results are very similar to the results found in the 2011 CB survey. In 2012, 12% of respondents drive alone and the remaining 88% use an alternative mode, the same result as in 2011. Among alter-native mode users, the percentages who walk (2012 – 12%, 2011 – 12%), carpool/vanpool (2012 - 2%, 2011 - 3%), and telework (2012 – 3%, 2011 – 2%) show little change between 2011 and 2012. In 2012, the share of respondents with a primary mode of bicycle is higher (30%) compared with 2011 (23%) and the share who use public transit is lower (42%) than in 2011 (47%). Some of this difference could have been due to the way “primary mode” was defined in the two years. In 2011, respondents self-identified their primary mode by choosing one of the mode options provided. In 2012, primary mode was defined as the mode with the greatest number of days reported. For respondents who reported no clear dominant mode in 2012, that is they had two modes each with two days, the primary mode was defined in the order of: bicycle, transit, walk, carpool/vanpool, tele-work, drive alone, and taxi. About 15% of the respondents who were classified in 2012 as primary bike riders fell into this category, with only two days of bicycle use but no greater number of days using any other mode. Most of these respondents used transit to get to work on their non-bike days, so some of these respondents might have self-identified their primary mode as transit in the 2011 survey. Thus at least a portion of the apparent increase in bicycle use and decrease in transit use between 2011 and 2012 could be due to this change in definition. Primary Commute Mode for Capital Bikeshare Members vs All Regional Commuters – The 12% share of survey respondents who primarily drive alone to work is well below the drive alone mode share for all
Telework3%
Carpool/vanpool2%
Drive alone12%
Walk12%
Public transit41%
Bicycle30%

Capital Bikeshare 2012 Member Survey Report May 22, 2013
65
commuters in the Washington region. According to the 2010 State of Commute survey, over the entire region, about 65% of all commuters drive alone to work most days. Even accounting for the fact that the majority of bikeshare respondents live in Washington, Arlington County, or Montgomery County, the drive alone rate of bikeshare users is quite low. Figure 45 shows the drive alone rates by home area for bikeshare survey respondents and for all commuters in these three jurisdictions (2010 SOC). Only 9% of bikeshare survey respondents who lived in the District of Co-lumbia drive alone to work, compared to 40% of all commuters who live in the District. The disparities in drive alone rate are similarly striking for the two other jurisdictions that have measurable bikeshare respondents.
Figure 45 Drive Alone Mode Share – Bikeshare Respondents vs All Commuters by Home Location
(Bikeshare: DC n = 4,170, Arlington n = 568, Montgomery n = 218)
(2010 SOC survey: DC n =549, Arlington n = 563, Montgomery n = 561)
Commute Mode by When Joined Capital Bikeshare – A significantly higher share of early-adopter bikeshare members said they primarily bicycle to work, when compared with members who joined more recently; 35% who joined Capital Bikeshare during the first seven months of the program (August 2010 – March 2011) primarily bicycle to work, compared with 29% of respondents who joined during the rest of 2011 and 28% who joined during 2012 (Figure 46). By contrast, more recent members use transit at a slightly higher rate; 40% of the early adopters ride transit to work, compared with 43% of respondents who joined between April and December 2011 and 42% who joined in 2012. There are no differences among the three groups in the percentages of re-spondents who walk or drive to work. These results suggest that while early adopters of the bikeshare program were disproportionately bicyclists, the mode distribution has since stabilized and Capital Bikeshare is attracting an increased share of transit riders.
0%
20%
40%
60%
80%
100%
District of Columbia Arlington County Montgomery County
9%
21%15%
40%
55%66%
CaBi All commuters (2010 SOC)

Capital Bikeshare 2012 Member Survey Report May 22, 2013
66
0%
20%
40%
60%
80%
100%
Aug 2010 - Mar 2011 Apr - Dec 2011 Jan - Nov 2012
40% 43% 42%35%
29% 28%
11% 11% 12%10% 11% 12%
Public transit Bicycle Walk Drive alone
Figure 46 Primary Commute Mode of Bikeshare Respondents – by When Joined Capital Bikeshare
(Aug 2010 – Mar 2011 n = 1,600, Apr – Dec 2011 n = 1,825, Jan-Nov 2012 n = 2,590)
Commute Mode by Travel Distance – The distance that respondents travel to get to work also is a fac-tor in their primary commute mode (Figure 47). Walking (46%) and bicycle (33%) are the top choices of respondents who live less than two miles from work. Bicycling (44%) also is a common mode for re-spondents who live between two and 4.9 miles from work, but an equal share (43%) of respondents in this group ride public transit. More than six in ten (62%) respondents who travel between five and 9.9 miles to work choose transit; the remaining respondents in this distance group are divided between driving alone (33%) and bicycling (19%). Respondents who travel the longest distance, 10 miles or more, primarily use public transit (54%) or driving alone (32%).
Figure 47 Primary Commute Mode of Bikeshare Respondents – by Commute Distance
(Under 2 miles n = 1,010, 2 – 4.9 miles n = 2,076, 5 – 9.9 miles n = 949, 10 miles or more n = 893)
0%
20%
40%
60%
80%
100%
Under 2 miles 2 - 4.9 miles 5 - 9.9 miles 10 miles or more
33%
44%
19%
7%11%
43%
62%54%
46%
6%0% 0%
4% 5%
31% 32%
Bicycle Public transit Walk Drive alone

Capital Bikeshare 2012 Member Survey Report May 22, 2013
67
Bicycle Commuting by Demographic Characteristics – District of Columbia bikeshare members bicycle to work at a higher rate (34%) than do respondents who live in either Arlington County (21%) or Mont-gomery County (16%). Men are more likely than are women to bicycle to work; 33% of male respond-ents primarily bicycle, compared with 26% of female respondents. And a higher proportion of White respondents (31%) said bicycling is their primary commuting mode, while only 24% of Non-white re-spondents mentioned bicycling. Respondents bicycle to work at about the same rate, regardless of their age.
Commute Mode Changes in the Past Year
All Commute Mode Changes Made – One survey objective was to identify changes bikeshare users had made in their travel since joining Capital Bikeshare. The report already has discussed overall changes in mode use, annual driving miles, and vehicle availability. Employed respondents were asked if, in the past year, they had made any of five types of changes in how they get to work. Table 13 presents these results.
Table 13 Commute Mode Changes Reported in the Past Year
(Multiple responses permitted for types of changes)
Commute Changes 2012 CB Survey
(n = 4,864)
2011 CB Sur-vey
(n = 4,916)
No changes in commute 43% 43%
Change in commute 57% 57%
- Start bicycling to work / ride a bike more often 44% 44%
- Start riding transit to work / ride transit more often 11% 10%
- Start walking to work / walk more often 13% 10%
- Start teleworking / telework more often 8% 4%
- Start carpooling/vanpooling or carpool/vanpool more often 2% 1%
Almost six in ten (57%) employed respondents said they made at least one change in their commuting pattern. The largest share of respondent who made a change started bicycling to work or increased how often they bike to work (44%). About one in ten started walking or walk to work more often (13%) and 11% said they started or increased their use of public transit (Metrorail, bus, or commuter rail). Eight percent started teleworking or increased their telework days and 2% made a change to carpool or vanpool. Note that many respondents reported more than one change. Both the overall rate of change and the percentages of respondents who reported each type of change in the past year are nearly identical in the November 2012 survey to what was reported in the Novem-ber 2011 CB survey.

Capital Bikeshare 2012 Member Survey Report May 22, 2013
68
Commute Changes by Demographic Characteristics – As has been illustrated in many sections of this report, these results are not uniform across all member subgroups. Male and female respondents are equally likely to have made a commute change and to have made individual types of changes, but White respondents are slightly more likely to have made a bicycle change than are Non-white (26% White vs 22% Non-white). Commute changes also are more common among respondents who do not have a vehicle available; 46% who do not have a vehicle regularly available reported a commute change, compared with 39% who do have a vehicle. A higher share (50%) of respondents who live in the District of Columbia made at least one commute mode change, compared with respondents who live in Arlington (42%) or Montgomery (36%). And the additional change was entirely to bicycle; 29% of District-residence members made a change to bicy-cle, compared with 22% of Arlington residents and 10% of Montgomery residents. The most dramatic difference, as shown in Figure 48, is a distinct pattern of commute change by re-spondents’ age. Young respondents were more likely than were older respondents to make changes overall. And young respondents particularly made changes in higher numbers to bicycle. They made changes to transit and other alternative modes at about the same rate as did respondents in other age categories.
Figure 48 Commute Change in Past Year – by Age
(16-24 years n = 505, 25-34 n = 2,947, 35-44 n = 1,032, 45 and older n = 932)
0% 20% 40% 60% 80% 100%
No change
Change to otheralternative mode
Change to transit
Change to bicycle
66%
7%
6%
21%
59%
9%
7%
25%
56%
7%
7%
30%
45%
9%
7%
39%
16 - 24 years
25 - 34
35 - 44
45 years and older

Capital Bikeshare 2012 Member Survey Report May 22, 2013
69
Commute Changes by Frequency of Capital Bikeshare Use – The incidence of commute changes shows a marked pattern when analyzed by the frequency of bikeshare use. Figure 49 presents the percentages of respondents who made commute shifts to each of three mode groups, bicycle, transit, and “other alternative modes (carpool/vanpool, walk, telework) and the percentages who did not make a com-mute change. The figure illustrates very definitively that respondents who use bikeshare the most were much more likely to have made some type of commute mode change; 57% of respondents who made 16 or more bikeshare trips in the past month made a commute change, compared with only 32% of those who made two or fewer bikeshare trips.
Figure 49 Commute Change in Past Year – by Frequency of Bikeshare Use
(0-2 trips n = 1,570, 3-5 trips n = 1,293, 6-10 trips n = 1,031, 11-15 trips n = 710, 16 or more trips n = 1,375)
As is equally clear, respondents who used bikeshare frequently overwhelmingly made shifts to bicycle. Nearly half of respondents who made 16 or more bikeshare trips in the past month increased their use of bicycle for commuting, compared with 15% who made two or fewer bikeshare trips. The differences in shifts to transit and other alternative modes are about the same for different bikeshare use groups. Reported Change vs Observed Changes – Respondents were asked to check all the changes that they had made in the past year. To assess the impact of the changes on respondents’ typical travel, their
0% 20% 40% 60% 80% 100%
No change
Change to otheralternative mode
Change to transit
Change to bicycle
43%
5%
4%
48%
53%
7%
7%
33%
56%
8%
8%
28%
63%
10%
6%
21%
68%
9%
8%
15%
0-2 CB trips
3-5 CB trips
6-10 CB trips
11-15 CB trips
16 or more CB trips

Capital Bikeshare 2012 Member Survey Report May 22, 2013
70
current weekly travel was compared against the travel patterns they reported a year ago to determine the changes they actually had made that they had continued to the time of the survey. Table 14 com-pares the percentages of “reported change,” compared with the actual “observed” change.
Table 14 Reported Commute Mode Changes and Observed Commute Mode Changes in Past Year
(Multiple responses permitted for both reported and observed changes)
(n = 4,864)
Commute Changes Reported Change
Observed Changes
No changes in commute 43% 62%
Change in commute 57% 38%
- Start / increase bicycling 44% 31%
- Start / increase transit 11% 9%
- Start / increase walking 13% 7%
- Start / increase telework 8% 5%
- Start / increase carpool or vanpool 2% 1%
The observed change of 38% is considerably less than 57% of respondents who reported starting or increasing use of an alternative mode. This likely means that some respondents made a temporary change, that is, they tried using the mode, but stopped using it before the survey was conducted. Another possible explanation is that some respondents started or increased use of some modes to ac-cess another mode. The observed change in transit use (9%) was quite close to the reported change (11%). But the observed changes in biking and walking were both well below the reported changes. It appears that a sizeable share of these respondents could have been reporting increased use of bike and walk as access modes to transit; 37% of the respondents who said they increased biking use transit as their primary commute mode and 12% of the respondents who said they increased biking show an observed change to transit. So, for these respondents, bike use might have facilitated a shift to greater use of transit. Figure 50 shows the distribution of observed changes again, but this time showing for respondents who increased use of more than one mode only the most significant change, defined as the change with the greatest increase in days used. Of the 38% of respondents who had a continued change to an alternative mode, 25% primarily increased their bicycle use, 6% primarily made a change to public transit, 4% increased their walk days, and 3% percent made an “other” change to either car-pool/vanpool, or telework.

Capital Bikeshare 2012 Member Survey Report May 22, 2013
71
Figure 50 Continued Observed Commute Mode Change – Most Significant Change
(n = 4,864)
Previous Mode as a Percentage of Weekly Commute Days – Figure 51, on the following page, presents a comparison of the current weekly commute mode split with the weekly commute mode split at the time prior to the changes that respondents made in their commute travel. Before respondents made their commute changes, bicycling accounted for 15% of weekly commute trips, compared with 27% at the time of the survey. The increased bicycle use shifted commute trips primarily from transit, which dropped from 48% of weekly commute trips to 41%, and from driving alone/taxi, which fell from 17% of weekly commute trips to 13%. A small drop also was noted in walking trips, suggesting some com-muters shifted trips from this mode to biking. Vehicle Miles Traveled Reduced by Commute Changes – An earlier section of report showed a calcula-tion of the 4.4 million annual driving miles that bikeshare members eliminated since joining bikeshare. A similar calculation can be made for the vehicle miles eliminated by members’ commute mode shifts. Analysis of travel data for respondents who made a commute change shows they reduced an average of 1.12 vehicle trips per week per member. Their one-way travel distance to work is 4.7 miles, so each “commute change” respondent reduced about 5.3 miles per week (1.12 vehicle trips reduced x 4.7 miles per trip) or 265 vehicle miles per year (5.3 miles per week x 50 work weeks). When these survey results are applied to the estimated 21,095 employed Capital Bikeshare member population in November 2012, this results in a total annual commute VMT of 2.1 million miles, or about 48% of the total 4.4 million annual driving miles reduced:
Number of employed CB members (November 2012) 21,095 Estimated annual commute VMT reduced per member 265
Estimated total annual commute VMT reduced 2,124,200 annual miles
Estimated total annual VMT reduced by CB members 4,396,600 annual miles Commute VMT as a percentage of total VMT reduction 48%
No changes62%
Increased bike 25%
Increased transit
6%
Increased walk4%
Increased other alt mode
3%
Made any contin-ued change = 38%

Capital Bikeshare 2012 Member Survey Report May 22, 2013
72
Figure 51 Comparison of Current Modes and Previous Modes – Percentage of Weekly Trips
(n = 4,864)
Frequency of Capital Bikeshare for Work-Related Travel
Employed respondents were asked how many times they had used Capital Bikeshare in the past month to get to work or to travel to a work-related meeting. Figure 52 presents these results and the result for all Capital Bikeshare trips during the month.
Figure 52
Capital Bikeshare Trips Made in Past Month – All Trip Purposes and Work-Related Trips
(Work-related CB trips n = 2,814, All CB trips n = 5,979)
0%
20%
40%
60%
80%
100%
No trips 1-2 trips 3-5 trips 6-10 trips 11-15 trips More than 15trips
37%
21%14%
8% 5%14%11% 15%
22%17%
12%23%
Work-related trips All CB trips
0% 20% 40% 60% 80% 100%
Carpool/vanpool
Telework
Walk
Drive alone/taxi
Transit
Bicycle
2%
5%
12%
13%
41%
27%
2%
4%
14%
17%
48%
15%
Previous mode
Current mode
Decreased use
Increased use

Capital Bikeshare 2012 Member Survey Report May 22, 2013
73
More than six in ten (63%) employed respondents used Capital Bikeshare at least once in the past month for a work-related trip. By comparison, 89% of respondents made at least one bikeshare trip for any purpose in the past month. About a third (35%) of all respondents made between one and five work-related trips and 8% made between six and ten trips. Two in ten (19%) use bikeshare frequently for work-related trips, making 11 or more trips in the past month. Respondents who use Capital Bikeshare for work-related purposes made an average of 7.7 work-re-lated bikeshare trips in the past month. When averaged across all respondents, the average work-re-lated trips totaled about 3.6 per month, accounting for 42% of the total 8.6 trips per user reported for all trip purposes. 2012 Work-Related Use vs 2011 Use – The 63% rate of bikeshare use for work-related trips in the No-vember 2012 survey is slightly higher than the 57% noted in the 2011 bikeshare survey. The share of respondent who use bikeshare often also grew from 2011 to 2012. In 2012, 52% of respondents said they made six or more work-related bikeshare trips in the past month. In 2011, only 23% of respond-ents used bikeshare for work-related trips this frequently. Work-related Trip Frequency by Bikeshare Members’ Home Location – Frequent and infrequent bikeshare users are distributed across all demographic and program characteristic subgroups. But fre-quency differences are noted by respondents’ home and work locations (Table 15). Work-related bikeshare use is most frequent among respondents who live in the District of Columbia, and those who work in the District. This seems a reasonable outcome, considering that the majority of bikes and bike stations are located in that jurisdiction. Respondents who live in Arlington and Montgomery/Prince George's counties also noted high bikeshare use for work-related trips, but it’s likely that some of these respondents work in the District.
Table 15 Work-Related Capital Bikeshare Trips in Past Month by Respondents’ Home and Work Locations
Work-Related Capital Bikeshare Trips in Past Month
0 Trips 1 – 5 Trips
6 or More Trips
Home jurisdiction
- Arlington County, VA (n = 290) 47% 31% 22%
- District of Columbia (n = 2,025) 35% 36% 29%
- Montgomery / Prince George’s counties, MD (n = 143) 43% 35% 23%
Work jurisdiction
- Arlington County, VA (n = 240) 47% 36% 18%
- District of Columbia (n = 1,872) 30% 37% 33%
- Montgomery / Prince George’s counties, MD (n = 161) 70% 20% 10%
(Statistical differences highlighted)
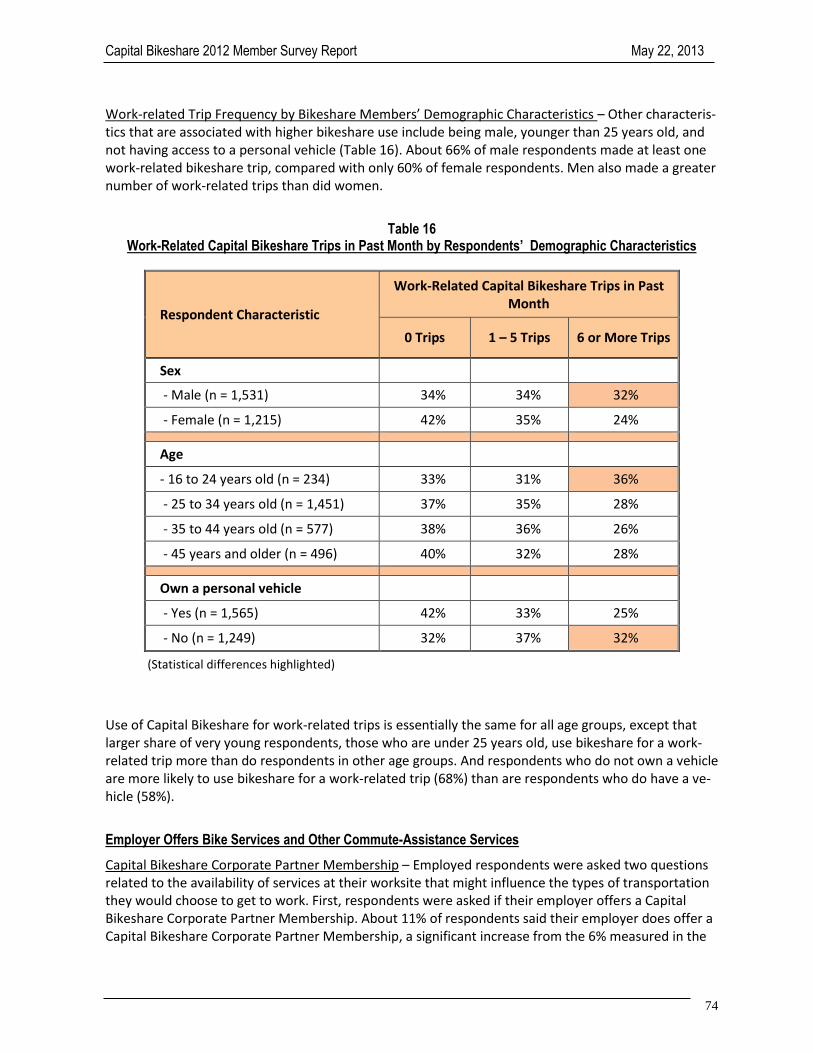
Capital Bikeshare 2012 Member Survey Report May 22, 2013
74
Work-related Trip Frequency by Bikeshare Members’ Demographic Characteristics – Other characteris-tics that are associated with higher bikeshare use include being male, younger than 25 years old, and not having access to a personal vehicle (Table 16). About 66% of male respondents made at least one work-related bikeshare trip, compared with only 60% of female respondents. Men also made a greater number of work-related trips than did women.
Table 16 Work-Related Capital Bikeshare Trips in Past Month by Respondents’ Demographic Characteristics
Respondent Characteristic
Work-Related Capital Bikeshare Trips in Past Month
0 Trips 1 – 5 Trips 6 or More Trips
Sex
- Male (n = 1,531) 34% 34% 32%
- Female (n = 1,215) 42% 35% 24%
Age
- 16 to 24 years old (n = 234) 33% 31% 36%
- 25 to 34 years old (n = 1,451) 37% 35% 28%
- 35 to 44 years old (n = 577) 38% 36% 26%
- 45 years and older (n = 496) 40% 32% 28%
Own a personal vehicle
- Yes (n = 1,565) 42% 33% 25%
- No (n = 1,249) 32% 37% 32%
(Statistical differences highlighted)
Use of Capital Bikeshare for work-related trips is essentially the same for all age groups, except that larger share of very young respondents, those who are under 25 years old, use bikeshare for a work-related trip more than do respondents in other age groups. And respondents who do not own a vehicle are more likely to use bikeshare for a work-related trip (68%) than are respondents who do have a ve-hicle (58%).
Employer Offers Bike Services and Other Commute-Assistance Services
Capital Bikeshare Corporate Partner Membership – Employed respondents were asked two questions related to the availability of services at their worksite that might influence the types of transportation they would choose to get to work. First, respondents were asked if their employer offers a Capital Bikeshare Corporate Partner Membership. About 11% of respondents said their employer does offer a Capital Bikeshare Corporate Partner Membership, a significant increase from the 6% measured in the

Capital Bikeshare 2012 Member Survey Report May 22, 2013
75
2011 survey. Three quarters (74%) said their employer does not offer a membership and 15% said they don’t know if membership is offered. Capital Bikeshare Corporate Memberships are most common among respondents who work in Arling-ton County and the District of Columbia. Two in ten (22%) respondents who work in Arlington and one in ten (11%) who work in the District report access to a Corporate Membership. Only 3% of respond-ents who work in other jurisdictions have access to a Corporate Membership. The Arlington percent-age represents a dramatic increase over the past year; in 2011, only 5% of respondents who worked in Arlington reported having access to the service. The 2012 District employee percentage is essentially the same as in 2011. Commute-Assistance Services – Respondents were next asked if their employer currently offers any of eight other commute-assistance services. Figure 53 presents these results, divided into services related to bicycle commuting and services related to other types of transportation.
Figure 53 Commute Services Offered by Employer
(n = 2,817)
Bicycle-Assistance Services – Fifty-five percent of all employed respondent report having access to at least one bike-support service. More than four in ten said their employers offer showers/personal
0% 20% 40% 60% 80% 100%
Zipcar membership
Alternative work schedule
Telework
Flextime
SmartBenefits transit / vanpool subsidy
Financial incentive / subidy for bicycling
CaBi Corporate Partner Membership
Bike racks / lockers
Showers / personal lockers
6%
36%
43%
44%
47%
9%
11%
43%
43%
Bicycle-Assistance Services
Non-bicycle Assistance Services

Capital Bikeshare 2012 Member Survey Report May 22, 2013
76
lockers (43%) or bike racks/lockers (43%). Nine percent said the employer offers a financial incen-tive/subsidy for employees who bicycle to work. Respondents who work in Arlington County and in the District of Columbia have greater access to bicy-cle services than do bikeshare respondents who live in other jurisdictions. As shown below, more than six in ten Arlington workers (62%) and District workers (60%) noted one or more bicycle services, com-pared with 47% of bikeshare survey respondents who work in other areas. But as also indicated below, bikeshare survey respondents are twice as likely to report access to bicy-cle services (55%) as are all commuters region-wide (26%) and more likely to have bicycle services than are other commuters in the jurisdictions where they work.
Bike Services Available
Capital Bikeshare 2010 SOC
Overall 55% 26%
Arlington Co., VA 62% 37%
District of Columbia 60% 35%
Montgomery / Prince George's Co., MD 47% 29%
Other areas 47% 19% Other Commute-Assistance Services – Figure 53 also shows the percentages of employers that offer non-bicycle commute-assistance services. About half (47%) said the employer offers a SmartBenefits transit or vanpool subsidy. Similar shares of respondents said telework (43%) and flextime (43%) are available to employees at the worksite. About a third (36%) have access to alternative work schedules. Six percent of respondents said their employer offers a Zipcar carshare program membership. Primary Commute Mode by Bicycle Services Available – Respondents who have access to bicycle-sup-port services bicycle to work at a higher rate than do respondents who do not have access to these services (Figure 54). A third (34%) of respondents who said bicycle services are available bicycle to work, compared with 27% of those who do not have bicycle services.

Capital Bikeshare 2012 Member Survey Report May 22, 2013
77
Figure 54 Primary Commute Mode of Bikeshare Respondents –
by Availability of Bicycle Services at Worksite
(Bicycle services available n = 1,516, Bicycle services not available n = 1,145)
Satisfaction with Bikeshare
The final section of the survey asked respondents to rate the quality of various features of Capital Bikeshare, to report problems that they had had in using Capital Bikeshare, and to offer suggestions for how Capital Bikeshare could be improved. These results are summarized below. Satisfaction with Bikeshare Features
Respondents were asked to rate their satisfaction with a set of individual Capital Bikeshare features. The ratings, ranging from a 1 (poor) to 5 (excellent) for each feature are shown in Figure 55. Note that the percentages exclude respondents who checked “don’t know” to a feature; since most of these re-spondents would not have used that feature, they could not comment on it. Don’t know responses ranged from about 6% to 22%, except for the call center; 57% of respondents had not used this ser-vice. Respondents give generally high marks to most bikeshare features. About seven in ten give ratings of 4 or 5 (Excellent) to the Capital Bikeshare website (75%), safety of stations (75%) mechanical repair of bikes (74%), call center (72%), and map at Capital Bikeshare stations (69%). Respondents are less satis-fied with nighttime lighting at stations; only 55% of respondents give a rating of 4 or 5 to this feature. The November 2012 survey satisfactions ratings for each feature are within a few percentage points of the ratings given in the 2011 survey.
0%
20%
40%
60%
80%
100%
Bicycle Public transit Walk Drive alone Other
34%43%
10% 10% 3%
27%
43%
11%13%
6%
Bike services available Bicycle services NOT available

Capital Bikeshare 2012 Member Survey Report May 22, 2013
78
Figure 55 Capital Bikeshare Ratings on Program Features
(Call center n = 1,406, Other features n = 2,292)
Ratings on these features are quite consistent across all demographic groups; there are no statistical differences by any of the following: when respondent joined Capital Bikeshare, income, employment status, work location, and vehicle available. The only notable statistical differences are as follows: Age – Differences are noted for four features, with older respondents giving higher ratings:
Nighttime lighting at stations – Six in ten (60%) of respondents who are 45 years of age or older give a 4 or 5 rating, compared with 55% who are between 25 and 44 and just 49% of those who are under 25.
Safety of stations – Older respondents also give higher ratings for this feature; 78% of respond-ents who are 45 years of age or older rate this positively, compared with 75% who are between 25 and 44 and 69% of respondents under 25.
Map at Capital Bikeshare Stations – Seven in ten (70%) of respondents who are between 25 and 44 and 73% of respondents 45 and older rate this feature a 4 or 5, while only 58% of respond-ents who are under 25 give a high rating.
0% 20% 40% 60% 80% 100%
Nighttime lighting at stations
Map at Capital Bikeshare station
Call center
Mechanical repair of bikes
Safety of stations
Capital bikeshare website
13%
9%
9%
5%
2%
5%
33%
23%
19%
21%
23%
20%
39%
37%
36%
47%
49%
46%
16%
31%
36%
26%
26%
29%
1 (Poor) - 2 3 4 5 (Excellent)

Capital Bikeshare 2012 Member Survey Report May 22, 2013
79
Capital Bikeshare Website – Eight in ten (79%) respondents 45 years and older give a 4 or 5 rat-ing, compared with 75% of respondents between 25 and 44 and 69% of respondents under 25 year old.
Sex – Differences are noted for four features, with women giving higher ratings for most features:
Capital Bikeshare website – Female respondents give more positive rating for this feature; 78% of women rate this feature a 4 or 5 rating, compared with 72% of men.
Mechanical repair of bikes – Three-quarters (76%) of female respondents give a 4 or 5 rating, compared with 72% of male respondents.
Call Center – A slightly higher percentage (74%) of women give a 4 or 5 rating, compared with 70% of male respondents.
Nighttime lighting at stations – This feature is rated more positively by men. Six in ten (59%) of male respondents give a 4 or 5 rating, compared with 52% of female respondents.
Race / Ethnicity – Differences by race / ethnicity are noted for one Capital Bikeshare feature, with White respondents giving higher rating than do Non-white:
Mechanical repair of bikes – Three-quarters (75%) of White respondents give a rating of 4 or 5, compared with 67% of Non-white respondents.
Frequency of Bikeshare Use – A difference ise noted for one feature, with frequent riders giving lower ratings:
Map at Capital Bikeshare Stations – Only 66% of respondents who made 11 or more bikeshare trips rate this feature a 4 or 5 rating, compared with 70% of Non-white respondents.
SpotCycle Smart Phone App
Capital Bikeshare offers numerous ways that members can obtain information about the service and manage their use of the service. The survey included one question asking respondents if they are aware of a smart phone app called SpotCycle, available for Android/BlackBerry/iPhones, with which members could locate Capital Bikeshare stations and learn if a bike was available at the station. A very large share (91%) of respondents said they are aware of the app and 79% have used it (Figure 56). Both awareness and use have grown slightly since the November 2011 survey. In the 2011 survey, 87% re-ported being aware of the app and 72% reported having used it.

Capital Bikeshare 2012 Member Survey Report May 22, 2013
80
Figure 56 Awareness and Use of SpotCycle
(n = 2,976)
Awareness and Use of SpotCycle Among Capital Bikeshare Subgroups – Respondents’ awareness of the app is related to how long they have been a Capital Bikeshare member. More than nine in ten (94%) respondents who joined Capital Bikeshare in 2010 or 2011 know about the app and 82% have used it, while only 87% of those who joined in 2012 know of the app and only 74% have used it. Respondents who live in the District of Columbia are both more likely to know about the app and more likely to have used it than are respondents who live elsewhere. More than nine in ten (93%) District residents know of the app and 82% have used it. By contrast, 85% of Arlington residents know of the app and 74% have used it. Both awareness and use are lower still outside of these two jurisdictions. Similarly, young respondents are more likely to know about the app and more likely to have used it than are older respondents. Ninety percent of respondents under 45 years old know of the app, com-pared with 83% of those 45 and older. And 83% of those under 45 have used the app, compared with just 61% of respondents 35 and older.
Bikeshare Service Problems / Issues
Finally, all respondents were asked if they had any problems with three particular elements of the Cap-ital Bikeshare service:
Trouble accessing a bike with the Capital Bikeshare membership key Mechanical issues with a bike Problems with Capital Bikeshare bike docks
Figure 57 shows the percentage of respondents who mentioned each possible situation. Six in ten (60%) respondents said they had not encountered any of the three issues since joining Capital Bikeshare. The remaining 40% said they had encountered at least one of the issues. About a quarter
Aware and used79%
Aware, not used12%
Not aware9%

Capital Bikeshare 2012 Member Survey Report May 22, 2013
81
(26%) said they had a mechanical issue with the bike. About two in ten said they had issues with a membership key (18%) or with a bike dock (17%). Figure 57 also presents the results for this question from the 2011 survey. The overall percentage of respondents who reported a problem was slightly lower in 2012 (40%) than in 2011 (43%). The inci-dence of mechanical issues with the bikes increased slightly, from 24% to 26%. But problems with both the membership key and with bike docks fell.
Figure 57 Incidence of Issues with Capital Bikeshare Service – 2011 Survey and 2012 Survey
(2011 n = 5,260, 2012 n = 3,731)
Details of Docking Problems – Respondents who said they had had a problem were asked to describe the problem. As shown below, the most common docking issue is that the dock did not properly ac-cept the bike when it was returned (46%) or did not register the bike and credit the user with the re-turn (19%). About 16% gave the opposite problem; the dock would not release a bike the respondent wanted to use.
Docking Problems
Dock did not lock bike when returned 46% Dock did not register returned bike 19% Dock would not release bike 16% All docks were occupied 5% No bikes were available to use 2%
Other 15%
Five percent reported that there was no space available to return the bike at the preferred location and 2% reported that the dock was empty, that is there were no bikes to use. These problems relate less to the operation of the dock and more to the need to balance the availability of bikes at various
0% 20% 40% 60% 80% 100%
Mechanical issues with bike
Issues with membership key
Issues with bike dock
No issues of any type
26%
18%
17%
60%
24%
25%
22%
57%
2012 CB Survey
2011 CB Survey

Capital Bikeshare 2012 Member Survey Report May 22, 2013
82
locations to meet demand by time of day. About 15% mentioned other general issues, such as “dock was broken,” “system was down,” “key didn’t work,” or another issue. Details of Bike Maintenance Issues – The most common issue with bike maintenance is with brakes; 32% of respondents who report a mechanical issue cite this issue. About two in ten respondents men-tion issues with seats or seatpost adjustment (24%) or with gears or shifting (2%). About 14% of those who report a bike maintenance problem note a problem with the bell and the same percentage said they had a flat tire or other tire problem, either while they were traveling or at the bike dock with the bike they wanted to use. Seven percent said they had some other problem with the tire or a wheel.
Bike Maintenance Issues
Brakes 32% Seat / seat post adjustment 24% Gears / shifting 22% Bell not working 14% Flat tire / low tire pressure 14% Other wheel issues 7% Other 15%
Issues Encountered by Respondent Characteristics – Two characteristics, in particular, are associated with the incidence of problems: when the respondent joined Capital Bikeshare and how often the re-spondent uses bikeshare. Problems Encountered by When Respondents Joined Capital Bikeshare – Figure 58 presents the per-centages of respondents who encountered any issue by when they joined Capital Bikeshare. The pat-tern is clear; respondents who joined in the early period of the program have encountered more prob-lems overall than have respondents who joined more recently. It’s reasonable to assume that the sys-tem has become more trouble-free, but some of the greater incidence of issues could reflect longer-term members’ greater exposure to the system.
Figure 58 Incidence of Any Issues with Capital Bikeshare Service – by When Joined Capital Bikeshare
(Aug 2010-Mar 2011 n = 874, Apr – June 2011 n = 521, Jul-Dec 2011 n = 455, Jan-Jun 2012 n = 667, Jul-Dec 2012 n = 812)
0%
20%
40%
60%
80%
100%
Aug 2010 - Mar2011
Apr - June 2011 July-Dec 2011 Jan-Jun 2012 Jul - Nov 2012
55% 52% 49%41%
31%

Capital Bikeshare 2012 Member Survey Report May 22, 2013
83
Al illustrated in Figure 59, problems with both the membership key and mechanical issues with bike have dropped more than have issues with bike docks. Only 14% of members who joined in 2012 have encountered a problem with a key, compared with 33% who joined in the first eight months of the program. And only a quarter of 2012 members have had a mechanical problem with a bike, compared with 39% who joined between August 2010 and March 2011. But issues with docks appear to have changed only slightly.
Figure 59 Incidence of Specific Issues with Capital Bikeshare Service – by When Joined Capital Bikeshare
(Aug 2010 – Mar 2011 n = 784, Apr – Dec 2011 n = 869, Jan - Nov 2012 n = 1,291)
Problems Encountered by Frequency of Capital Bikeshare Use – Not surprisingly, respondents also are more likely to say they encountered one or more of these issues if they are frequent bikeshare users. As indicated in Figure 60, more than half (53%) of respondents who made 11 or more Capital Bikeshare trips in the past month encountered a problem with the service, compared with 37% of respondents who made just one or two Capital Bikeshare trips in the past month. Frequent riders also encountered issues with each of the three bike system elements more often than did infrequent riders.
0%
20%
40%
60%
80%
100%
Issues with membership key Mechanical issues with bike Issues with bike dock
33%39%
23%27%37%
25%14%
25%18%
Aug 2010 - Mar 2011 Apr - Dec 2012 Jan - Nov 2012

Capital Bikeshare 2012 Member Survey Report May 22, 2013
84
Figure 60 Incidence of Issues with Capital Bikeshare Service – by Number of Capital Bikeshare Trips in Past Month
(1-2 trips n = 532, 3-10 trips n = 1,119, 11 or more trips n = 1,012)
Most Needed Capital Bikeshare Expansion
In the November 2011 CB survey, many of the comments provided by respondents for ways that Capi-tal Bikeshare could be improved focused on the need for system expansion. To assess the relative need for various types of expansion, the November 2012 survey included a question asking respond-ents for the “most needed expansion option.” Respondents were permitted to check up to two options from a list of six. The results to this question are shown in Figure 61. The most pressing expansion need appears to be for more docks at existing stations; 47% of respond-ents chose this option for greater access to bikes in popular bikeshare pick-up and drop-off locations. The second highest priority is for new stations in residential neighborhoods (43%), perhaps indicating a desire for greater access to bikeshare for short trips within a home neighborhood. About a third (36%) of respondents said they want expansion to areas that bikeshare doesn’t serve now (greater coverage) and a similar percentage (34%) indicated a need for expansion within the existing service area (greater infill or density of stations). Smaller percentages of respondents said they would like to see expansion in commercial and employment areas (23%) or near Metrorail (17%).
0%
20%
40%
60%
80%
100%
Any issues Issues with membershipkey
Mechanical issues withbike
Issues with bike dock
37%
19%25%
13%
46%
24%33%
20%
53%
26%
41%
30%
1-2 trips 3-10 trips 11 or more trips

Capital Bikeshare 2012 Member Survey Report May 22, 2013
85
Figure 61 Most Needed Capital Bikeshare Expansion Options
(n = 2,928, multiple responses permitted)
Expansion Priority by Home Location – Respondents who live in different jurisdictions indicated signifi-cantly different preferences for expansion (Table 17).
Table 17 Priority in Expansion Options by Home Location
Capital Bikeshare Expansion Options
Home Location
DC (n = 2,129)
Arlington (n = 297)
Other Locations (n = 326)
More docks at existing stations 52% 23% 36%
More stations in residential neighborhoods 44% 45% 32%
More stations in commercial / employment areas 22% 25% 29%
More stations Near Metrorail stations 14% 17% 27%
More stations in locations where CB operates now (greater density / infill)
38% 17% 23%
Expansion to areas where CB doesn’t operate now (greater coverage)
30% 56% 52%
(Statistical differences highlighted)
0% 20% 40% 60% 80% 100%
More docks at existing stations
More stations in residential neighborhoods
Expansion to areas CB doesn't operate now
Expansion to areas CB operates now
More stations in commercial/employment areas
More stations near Metrorail
Other
47%
43%
36%
34%
23%
17%
10%

Capital Bikeshare 2012 Member Survey Report May 22, 2013
86
Respondents who live in the District of Columbia indicate a strong preference for more docks at exist-ing stations, more docks in residential neighborhoods, and greater infill / density. Arlington resident respondents also want more stations in residential areas, but their greatest priority, overall is for ex-pansion to areas that are not currently served by bikeshare (greater coverage). Respondents who live outside these two areas express yet another preference. Like residents of Arlington, they want greater bikeshare coverage to areas not currently served, but they also would like more docks at existing sta-tions and more stations near Metrorail. This supports the role that bikeshare plays in facilitating mem-bers’ access to transit. Barriers to Bicycling in the Washington Metropolitan Region
Finally, the survey asked respondents if any of a list of possible issues are significant barriers to their bicycling in the Washington metropolitan region. Figure 62 shows the percentages who reported each barrier, with barriers grouped into four categories: bike paths/lanes, drivers, roads/traffic conditions, and availability of bike services.
Figure 62 Significant Barriers to Bicycling in the Washington Metropolitan Region
(n = 3,731)
0% 20% 40% 60% 80% 100%
Lack of dedicated bicycle lanes or paths
Bike paths/lanes don't connect to each other
Bike lanes on street are not separated from car traffic
Insufficient lighting on bike paths/lanes
Drivers are inconsiderate of bicyclists
Drivers are not aware of bicyclists
Too much car traffic on local roads
Road surface is poorly maintained
Car traffic moves too fast
Don't like to ride after dark
Terrain is too hilly
Not enough bike lockers or racks
No place to shower after riding to work
56%
44%
27%
11%
49%
39%
42%
34%
26%
20%
16%
22%
17%
Bike Paths / Lanes
Roads / Traffic
Drivers
Bike Services
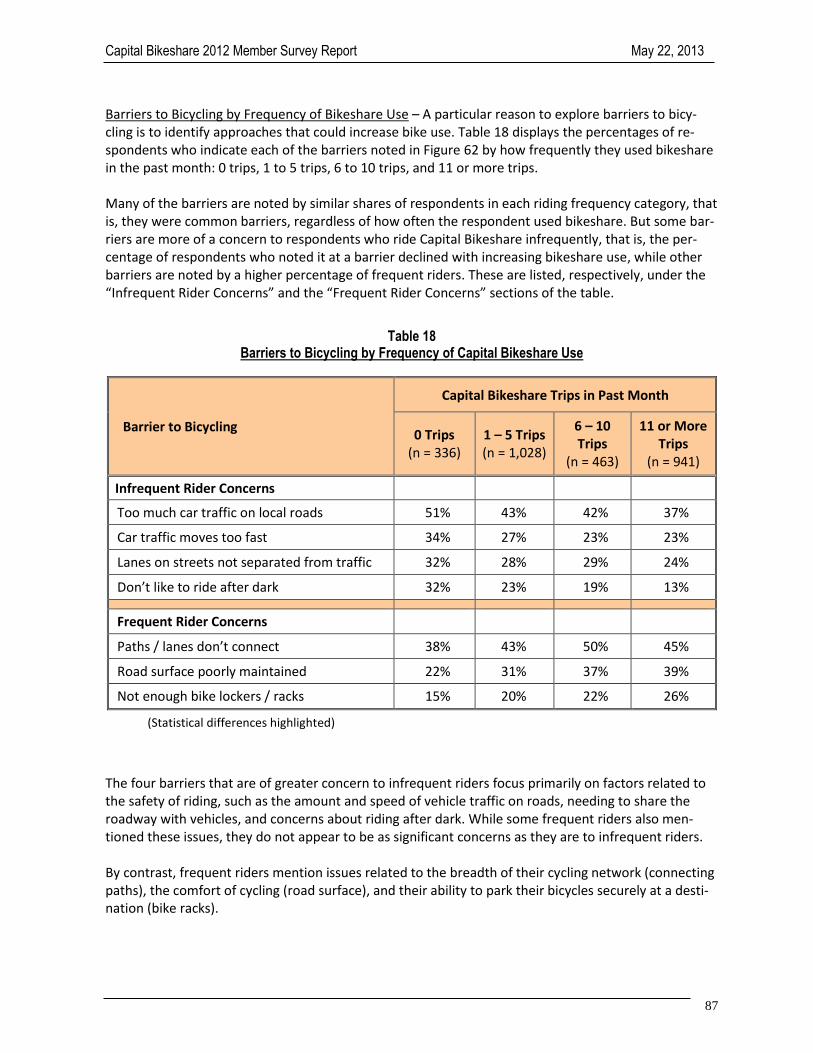
Capital Bikeshare 2012 Member Survey Report May 22, 2013
87
Barriers to Bicycling by Frequency of Bikeshare Use – A particular reason to explore barriers to bicy-cling is to identify approaches that could increase bike use. Table 18 displays the percentages of re-spondents who indicate each of the barriers noted in Figure 62 by how frequently they used bikeshare in the past month: 0 trips, 1 to 5 trips, 6 to 10 trips, and 11 or more trips. Many of the barriers are noted by similar shares of respondents in each riding frequency category, that is, they were common barriers, regardless of how often the respondent used bikeshare. But some bar-riers are more of a concern to respondents who ride Capital Bikeshare infrequently, that is, the per-centage of respondents who noted it at a barrier declined with increasing bikeshare use, while other barriers are noted by a higher percentage of frequent riders. These are listed, respectively, under the “Infrequent Rider Concerns” and the “Frequent Rider Concerns” sections of the table.
Table 18 Barriers to Bicycling by Frequency of Capital Bikeshare Use
Barrier to Bicycling
Capital Bikeshare Trips in Past Month
0 Trips (n = 336)
1 – 5 Trips (n = 1,028)
6 – 10 Trips
(n = 463)
11 or More Trips
(n = 941)
Infrequent Rider Concerns
Too much car traffic on local roads 51% 43% 42% 37%
Car traffic moves too fast 34% 27% 23% 23%
Lanes on streets not separated from traffic 32% 28% 29% 24%
Don’t like to ride after dark 32% 23% 19% 13%
Frequent Rider Concerns
Paths / lanes don’t connect 38% 43% 50% 45%
Road surface poorly maintained 22% 31% 37% 39%
Not enough bike lockers / racks 15% 20% 22% 26%
(Statistical differences highlighted)
The four barriers that are of greater concern to infrequent riders focus primarily on factors related to the safety of riding, such as the amount and speed of vehicle traffic on roads, needing to share the roadway with vehicles, and concerns about riding after dark. While some frequent riders also men-tioned these issues, they do not appear to be as significant concerns as they are to infrequent riders. By contrast, frequent riders mention issues related to the breadth of their cycling network (connecting paths), the comfort of cycling (road surface), and their ability to park their bicycles securely at a desti-nation (bike racks).

Capital Bikeshare 2012 Member Survey Report May 22, 2013
88
Barriers by Respondent Subgroups – Opinions about many of the barriers are consistent across re-spondent subgroups; there are no statistical differences by race/ethnicity, when respondent joined Capital Bikeshare, income, and employment status. The only notable statistical differences are de-scribed below. Home Location – Respondents report some differences in barriers by their home jurisdiction. Arlington residents are more concerned than are District residents about:
Too much traffic on local roads (50% of Arlington residents vs 40% of District residents) Don’t like to ride after dark (28% of Arlington residents vs 18% of District residents)
District residents are more concerned than Arlington residents about:
Road surface poorly maintained (37% of District residents vs 19% of Arlington residents) Not enough bike lockers and rack (23% of District resident vs 15% of Arlington residents)
Sex – Differences are noted for six barriers features, with women reporting greater concern for five of the barriers and men being more concerned about one barrier. A higher share of men note a concern with “not enough bike lockers or racks” (24% of men vs 19% of women). But women are more con-cerned with each of the following:
Lack of dedicated bicycle paths or lanes (60% of women vs 52% of men) Too much traffic on local roads (48% of women vs 36% of men) Car traffic moves to fast (29% of women vs 23% of men) Don’t like to ride after dark (29% of women) vs 13% of men)
Terrain too hilly (20% of women vs 13% of men) Age – Barriers also show some distinct patterns by respondents’ ages. In general older respondents are more concerned with:
Too much traffic on local roads (39% of under 35 years vs 46% of 35 or older) Car traffic moves to fast (24% of under 35 years vs 29% of 35 or older)
Don’t like to ride after dark (19% of under 45 years vs 29% of 45 or older)
Younger respondents are more concerned with:
Lack of dedicated bicycle paths or lanes (66% of under 35 years vs 52% of 35 or older)
No place to shower after riding to work (20% of under 35 years vs 12% of 35 or older) Terrain too hilly (19% of under 35 years vs 12% of 35 or older)

Capital Bikeshare 2012 Member Survey Report May 22, 2013
89
APPENDICES
Appendix A – Survey Questionnaire

APPENDIX A – SURVEY QUESTIONNAIRE
General Information
1 Are you currently a member of Capital Bikeshare? If so, what membership level are you? 1 Annual (SKIP TO Q5) 2 Monthly (SKIP TO Q5) 3 3 –day (SKIP TO Q5) 4 24-hour (SKIP to Q5) 5 No longer member/former member of Capital Bikeshare (CONTINUE TO Q2) 6 Never was a member / never joined Capital Bikeshare (SKIP TO Q3)
2 Why are you no longer a member of Capital Bikeshare? (SKIP TO END)
1 Riding Capital Bikeshare was too strenuous and I would prefer to drive or take public transit 2 Docks were not available when I needed them 3 Cost was too high, didn’t use enough to justify the cost 4 Bikes were not available when I needed them 5 Not convenient for traveling to my intended destination(s) 6 I bought my own bike and now I do not need to take Capital Bikeshare 7 Moved out of the area, moved to / starting working in area without bike docks, 8 Other _______________
3 I haven’t joined Capital Bikeshare because: (Please select any that apply)
1 I prefer to ride my own bike 2 I have health issues that prevent me from riding 3 I don’t know how to ride a bike 4 I don’t know how Capital Bikeshare works 5 The stations are not in locations that are useful to me 6 Riding a bike in the street seems too dangerous 7 I prefer to walk 8 I don’t have a bicycle helmet 9 I prefer to take a bus or train 10 I don’t have a credit card for registration 11 I would rather drive a car 12 Other _____________
4 I might try using Capital Bikeshare if: (please select any that apply) (SKIP TO END)
1 There was a station closer to my office or school 2 There was help for me to improve my bicycling skills 3 The cost to use Capital Bikeshare was lower 4 There was more bike lanes on the street 5 I knew more about how Capital Bikeshare worked 6 I felt safer riding a bike on the street 7 There was a station closer to my home 8 There were more off-street bike paths 9 There was a station closer to my bus or rail stop 10 There were stations near where I shop or do errands 11 Other __________
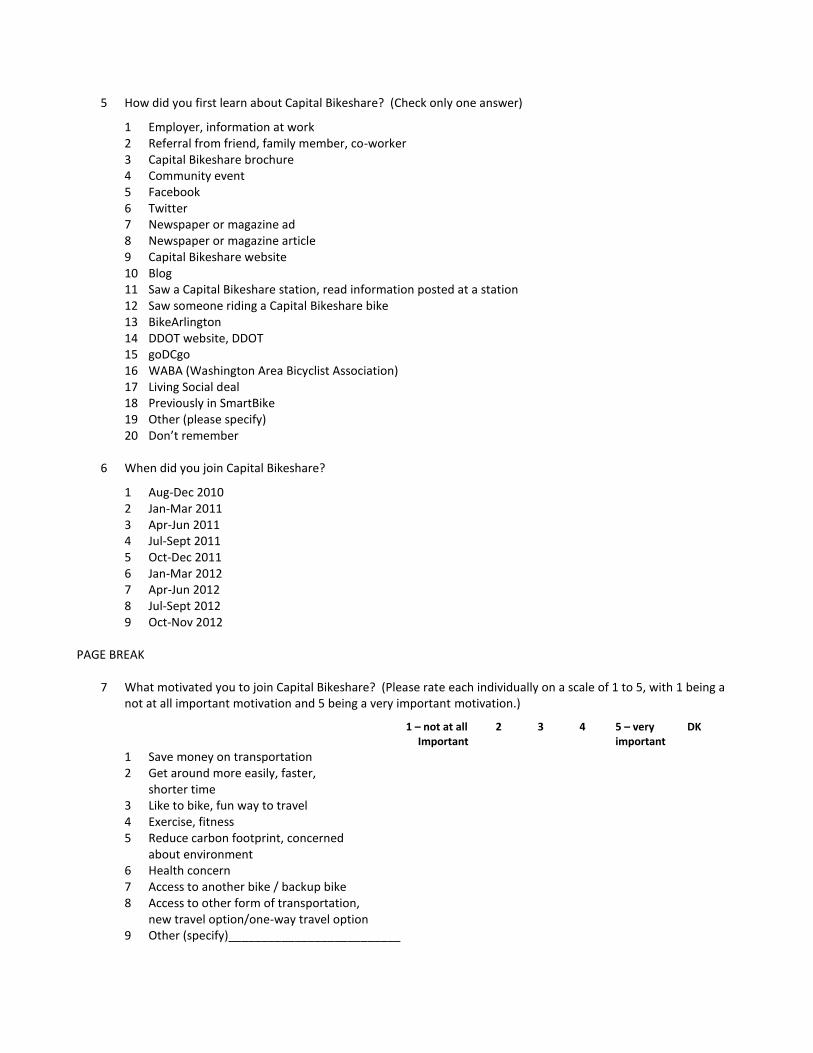
5 How did you first learn about Capital Bikeshare? (Check only one answer)
1 Employer, information at work 2 Referral from friend, family member, co-worker 3 Capital Bikeshare brochure 4 Community event 5 Facebook 6 Twitter 7 Newspaper or magazine ad 8 Newspaper or magazine article 9 Capital Bikeshare website 10 Blog 11 Saw a Capital Bikeshare station, read information posted at a station 12 Saw someone riding a Capital Bikeshare bike 13 BikeArlington 14 DDOT website, DDOT 15 goDCgo 16 WABA (Washington Area Bicyclist Association) 17 Living Social deal 18 Previously in SmartBike 19 Other (please specify) 20 Don’t remember
6 When did you join Capital Bikeshare?
1 Aug-Dec 2010 2 Jan-Mar 2011 3 Apr-Jun 2011 4 Jul-Sept 2011 5 Oct-Dec 2011 6 Jan-Mar 2012 7 Apr-Jun 2012 8 Jul-Sept 2012 9 Oct-Nov 2012
PAGE BREAK
7 What motivated you to join Capital Bikeshare? (Please rate each individually on a scale of 1 to 5, with 1 being a not at all important motivation and 5 being a very important motivation.)
1 – not at all 2 3 4 5 – very DK Important important
1 Save money on transportation 2 Get around more easily, faster,
shorter time 3 Like to bike, fun way to travel 4 Exercise, fitness 5 Reduce carbon footprint, concerned
about environment 6 Health concern 7 Access to another bike / backup bike 8 Access to other form of transportation,
new travel option/one-way travel option 9 Other (specify)__________________________

8 In the past month, about how many Capital Bikeshare trips did you make?
1 No trips (SKIP TO Q28) 2 1-2 trips 3 3-5 trips 4 6-10 trips 5 11-15 trips 6 16-25 trips 7 26-30 trips 8 More than 30 trips
PAGE BREAK
9 Of the Capital Bikeshare trips that you made last month, approximately how many started or ended at the fol-lowing public transit locations?
0 trips 1-2 trips 3-5 trips 6 -10 trips 11 or more trips 1 A Metrorail station ___ ___ ___ ___ ____ 2 A bus stop ___ ___ ___ ___ ____ 3 A MARC/VRE/AMTRAK station ___ ___ ___ ___ ____
10 What are the primary types of trips for which you use Capital Bikeshare? Please rate each individually on a scale of 1 to 5, with 1 meaning you “never use Capital Bikeshare” for this type of trip and 5 meaning you “very often use Capital Bikeshare.”
1 – never 2 3 4 5 – very use CB often use CB
1 Go to or from work ___ ___ ___ ___ ____ 2 Go to or from school ___ ___ ___ ___ ____ 3 Go to a meeting ___ ___ ___ ___ ____ 4 Social / entertainment / visit friends ___ ___ ___ ___ ____ 5 Restaurant, meal ___ ___ ___ ___ ____ 6 Exercise, recreation ___ ___ ___ ___ ____ 7 Shopping ___ ___ ___ ___ ____ 8 Errands, personal appointment ___ ___ ___ ___ ____
PAGE BREAK MOST RECENT CB TRIP
11 What was the primary purpose of your MOST RECENT Capital Bikeshare trip? (check only one)
1 Go to or from work 2 Go to or from school 3 Go to a meeting 4 Social / entertainment / visit friends 5 Restaurant, meal 6 Exercise, recreation, go to gym 7 Shopping 8 Errands, personal appointment 9 Go to or from Metrorail station, bus stop, train station 10 Other (specify) ___________________________________

12 On what day of the week did you make your most recent Capital Bikeshare trip? (check only one)
1 Weekday (Monday – Friday) 2 Saturday 3 Sunday 4 Don’t remember
13 On your most recent trip, where did you pick up the bike? (Please choose your pick-up location from the drop-down lists for each jurisdiction).
Alexandria 1 Alexandria – King Street 2 Alexandria – Old Town 3 Alexandria – other (please specify) _________________________
Arlington 4 Arlington County – Ballston / Virginia Square 5 Arlington County – Courthouse / Clarendon 6 Arlington County – Crystal City 7 Arlington County – Pentagon City 8 Arlington County – Rosslyn 9 Arlington County – other (please specify) ______________
District of Columbia 10 District of Columbia – Anacostia 11 District of Columbia – Capitol Hill 12 District of Columbia – Cleveland Park, Woodley 13 District of Columbia – Columbia Heights, Petworth, Mount Pleasant 14 District of Columbia – Downtown 15 District of Columbia – Dupont Circle / Adams Morgan / Logan Circle 16 District of Columbia – Georgetown/ Glover Park 17 District of Columbia – H Street corridor, NoMA 18 District of Columbia – National mall / Independence Av 19 District of Columbia – Navy Yard, SW Waterfront 20 District of Columbia – Penn Quarter / Chinatown 21 District of Columbia – Shaw, U Street 22 District of Columbia – Tenleytown, American University 23 District of Columbia – West end, George Washington University 24 District of Columbia – Bloomingdale / Brookland / Eckington 25 District of Columbia – other (please specify) ______________
Other location 26 Other (please specify) _________________

14 On your most recent trip, where did you drop off the bike? (Please choose your drop-off location from the drop-down lists for each jurisdiction).
Alexandria 1 Alexandria – King Street 2 Alexandria – Old Town 3 Alexandria – other (please specify) _________________________
Arlington 4 Arlington County – Ballston / Virginia Square 5 Arlington County – Courthouse / Clarendon 6 Arlington County – Crystal City 7 Arlington County – Pentagon City 8 Arlington County – Rosslyn 9 Arlington County – other (please specify) ______________
District of Columbia 10 District of Columbia – Anacostia 11 District of Columbia – Capitol Hill 12 District of Columbia – Cleveland Park, Woodley 13 District of Columbia – Columbia Heights, Petworth, Mount Pleasant 14 District of Columbia – Downtown 15 District of Columbia – Dupont Circle / Adams Morgan / Logan Circle 16 District of Columbia – Georgetown/ Glover Park 17 District of Columbia – H Street corridor, NoMA 18 District of Columbia – National mall / Independence Av 19 District of Columbia – Navy Yard, SW Waterfront 20 District of Columbia – Penn Quarter / Chinatown 21 District of Columbia – Shaw, U Street 22 District of Columbia – Tenleytown, American University 23 District of Columbia – West end, George Washington University 24 District of Columbia – Bloomingdale / Brookland / Eckington 25 District of Columbia – other (please specify) ______________
Other location 26 Other (please specify) _________________
15 For which reasons did you choose Capital Bikeshare for this particular trip, instead of another type of transporta-tion? (Check all that apply)
ROTATE RESPONSES 1 Too far to walk 2 No bus/train or bus/train inconvenient to that destination 3 No bus/train or bus/train inconvenient at that time of day 4 Don’t have a car 5 Don’t like to drive to that destination at that time of day 6 Parking is limited / expensive at that destination 7 Too much traffic around that destination 8 Friends wanted to bicycle 9 Wanted to get exercise 10 Bicycle is faster, easier to this destination 11 Bicycle is cheaper than other alternatives 12 Nice weather, wanted to be outside, just like biking 13 Don’t know 14 Other (please specify) _________________________________
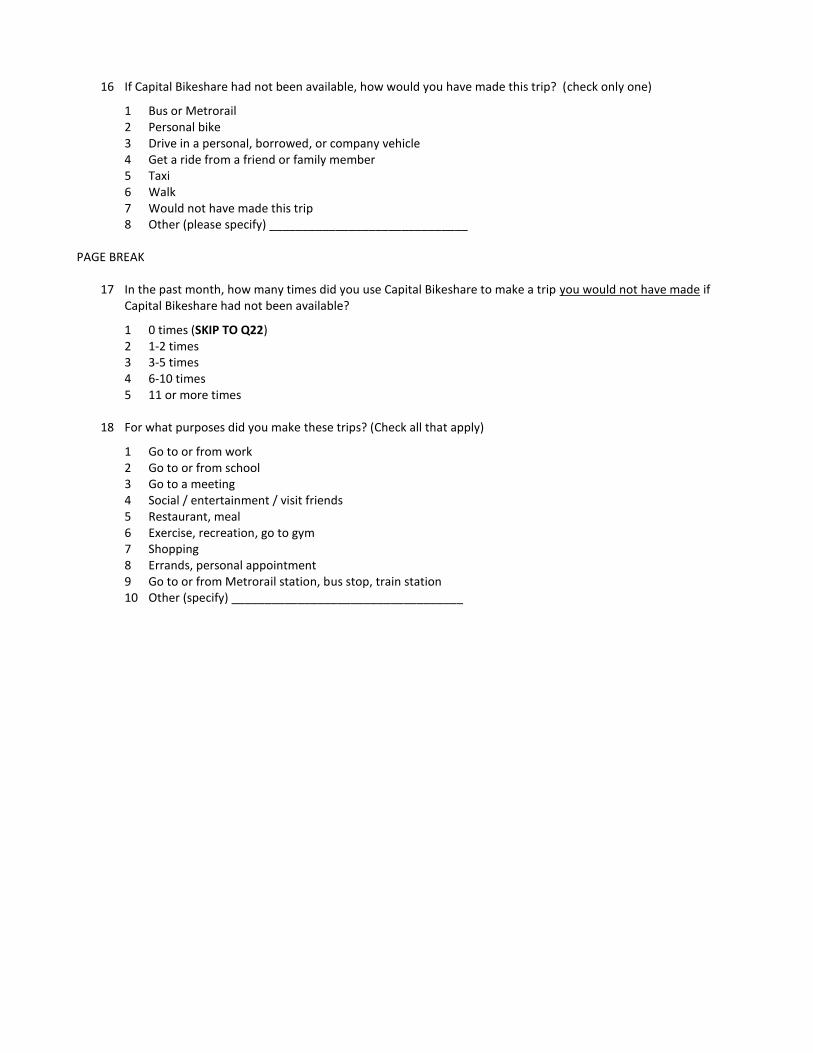
16 If Capital Bikeshare had not been available, how would you have made this trip? (check only one)
1 Bus or Metrorail 2 Personal bike 3 Drive in a personal, borrowed, or company vehicle 4 Get a ride from a friend or family member 5 Taxi 6 Walk 7 Would not have made this trip 8 Other (please specify) ______________________________
PAGE BREAK
17 In the past month, how many times did you use Capital Bikeshare to make a trip you would not have made if
Capital Bikeshare had not been available?
1 0 times (SKIP TO Q22) 2 1-2 times 3 3-5 times 4 6-10 times 5 11 or more times
18 For what purposes did you make these trips? (Check all that apply)
1 Go to or from work 2 Go to or from school 3 Go to a meeting 4 Social / entertainment / visit friends 5 Restaurant, meal 6 Exercise, recreation, go to gym 7 Shopping 8 Errands, personal appointment 9 Go to or from Metrorail station, bus stop, train station 10 Other (specify) ___________________________________

19 What were the destinations for these trips? (check all that apply)
Alexandria 1 Alexandria – King Street 2 Alexandria – Old Town 3 Alexandria – other (please specify) _________________________
Arlington 4 Arlington County – Ballston / Virginia Square 5 Arlington County – Courthouse / Clarendon 6 Arlington County – Crystal City 7 Arlington County – Pentagon City 8 Arlington County – Rosslyn 9 Arlington County – other (please specify) ______________
District of Columbia 10 District of Columbia – Anacostia 11 District of Columbia – Capitol Hill 12 District of Columbia – Cleveland Park, Woodley 13 District of Columbia – Columbia Heights, Petworth, Mount Pleasant 14 District of Columbia – Downtown 15 District of Columbia – Dupont Circle / Adams Morgan / Logan Circle 16 District of Columbia – Georgetown/ Glover Park 17 District of Columbia – H Street corridor, NoMA 18 District of Columbia – National mall / Independence Av 19 District of Columbia – Navy Yard, SW Waterfront 20 District of Columbia – Penn Quarter / Chinatown 21 District of Columbia – Shaw, U Street 22 District of Columbia – Tenleytown, American University 23 District of Columbia – West end, George Washington University 24 District of Columbia – Bloomingdale / Brookland / Eckington 25 District of Columbia – other (please specify) ______________
Other location 26 Other (please specify) _________________
20 Why would you not have made these trips without Capital Bikeshare? (check all that apply)
1 Too far to walk 2 No bus/train or bus/train inconvenient to that destination 3 No bus/train or bus/train inconvenient at that time of day 4 Don’t have a car 5 Don’t like to drive to that destination at that time of day 6 Parking is limited / expensive at that destination 7 Too much traffic around that destination 8 Friends wanted to bicycle 9 Wanted to get exercise 10 Bicycle is faster, easier to this destination 11 Bicycle is cheaper than other alternatives 12 Other (please specify) _________________________________ 19 Don’t know
PAGE BREAK

21 If a commercial / retail business, restaurant, or shop is easily accessible by Capital Bikeshare, does that access make you more or less likely to patronize that establishment?
1 Much less likely 2 Somewhat less likely 3 Not more likely or less likely 4 Somewhat more likely 5 Much more likely 6 Don’t know
PAGE BREAK
22 On a weekly basis, how much money do you think Capital Bikeshare saves you on your travel compared with
what you were spending before you joined?
1 $0 2 $1-20 3 $21-40 4 $41-60 5 More than $60 6 Don’t know
23 How often do you wear a helmet when you use Capital Bikeshare?
1 Never 2 Some of the time 3 Most of the time (SKIP TO Q27) 4 Always (SKIP to Q27) 5 LEFT BLANK (SKIP TO Q27)
PAGE BREAK
24 Why do you not typically wear a helmet when you ride? (check all that apply)
1 Not convenient 2 Too bulky 3 I don’t own one 4 I don’t have one with me at the time, spontaneous / unplanned trip 5 Don’t think I need it, feel safe enough without it, ride slowly, ride on paths 6 Personal preference, not cool 7 Don’t want to carry to my destination, too obvious to carry, too bulky 8 Messes up my hair 9 Feel safer without helmet, drivers are more careful 10 Other (please specify) ___________________

VEHICLE ACCESS AND USE
25 As a result of your use of Capital Bikeshare, do you use each of the following types of vehicles more often, less often, or about the same as before you joined Capital Bikeshare …?
Much Somewhat About Somewhat Much less often less often the same more often more often
1 Bus ___ ___ ___ ___ ____ 2 Metrorail ___ ___ ___ ___ ____ 3 Walk ___ ___ ___ ___ ____ 4 Taxi ___ ___ ___ ___ ____ 5 Bicycle (any bicycle) ___ ___ ___ ___ ____ 6 Drive car ___ ___ ___ ___ ____
26 Do you have any of the following vehicles available to you on a regular basis for your travel? (check all that ap-ply)
1 A personal bike (other than Capital Bikeshare) 2 A car, van, SUV, truck or other person vehicle 3 A motorscooter, motorbike, or motorcycle 4 A Zipcar or car2go membership
PAGE BREAK
27 Approximately how many miles do you drive per month now in the Washington metro region (including miles in vehicles you own, rent, or borrow)?
__________________ 28 During the year before you joined Capital Bikeshare, approximately how many miles per month did you drive on
average in the Washington metro region?
__________________ 29 If you have reduced your driving miles since you joined Capital Bikeshare, to what extent did Capital Bikeshare
contribute to the reduction?
1 Did not reduce driving miles 2 Capital Bikeshare was the main factor 3 Capital Bikeshare was a major factor, in combination with other things 4 Capital Bikeshare was a minor factor, in combination with other more important things 5 Capital Bikeshare was not a factor 9 Don’t know
PAGE BREAK
30 How many cars, trucks, vans, or other personal vehicles do you or other members of your household own or
lease now for household use?
__________________

31 Since you joined Capital Bikeshare, have you sold a personal household vehicle or considered selling a personal vehicle?
1 No, did not sell or consider selling vehicle (SKIP TO Q35) 2 Sold household vehicle, but I replaced it with another vehicle 3 Sold household vehicle and did NOT replace it 4 Considered selling personal vehicle
PAGE BREAK
32 To what extent did your membership in Capital Bikeshare contribute to your decision to sell or consider selling a personal vehicle?
1 Capital Bikeshare was the main factor 2 Capital Bikeshare was a major factor, in combination with other things 3 Capital Bikeshare was a minor factor, in combination with other more important things 4 Capital Bikeshare was not a factor 9 Don’t know
TRAVEL TO WORK
33 Are you currently employed, either full-time or part-time?
1 Yes, employed full-time 2 Yes, employed part-time 3 Not employed (SKIP TO Q44)
PAGE BREAK
34 About how many miles is it from your home to your usual work location? If more than one mile, please enter the distance in the box provided. Less than one mile _____________ miles
35 In a typical week, how many days do you use each of the following types of transportation to get to work? If you use more than one type on a single day, such as walk to a bus stop then ride a bus, report the type you use for the longest distance part of your trip.
Type of Transportation
Number of days per week used to get to work
(0 – 7) 1 Bicycle
2 Walk
3 Ride public transit (bus, Metrorail, or commuter train)
4 Drive alone
5 Ride in a carpool or vanpool
6 Taxi
7 Telework (count only days you work at home ALL DAY)

36 In the past year, did you make any of the following changes in how you travel TO WORK? (check all that apply)
1 Started riding a bike to work; ride a bike more often 2 Started walking to work; walk more often 3 Started riding public transit to work; ride transit more often 4 Started carpooling or vanpooling to work; carpool or vanpool more often 5 Started teleworking; telework more often 6 No changes (SKIP TO Q41)
PAGE BREAK
37 Before you made this change, how many days in a typical week did you use each of the following types of trans-portation to get to work?
Type of Transportation
Number of days per week used to get to work
(0 – 7) 1 Bicycle
2 Walk
3 Ride public transit (bus, Metrorail, or commuter train)
4 Drive alone
5 Ride in a carpool or vanpool
6 Taxi
7 Telework (count only days you work at home ALL DAY)
38 How much did Capital Bikeshare contribute to this change in how you travel to work?
1 Capital Bikeshare was the main factor 2 Capital Bikeshare was a major factor, in combination with other things 3 Capital Bikeshare was a minor factor, in combination with other more important things 4 Capital Bikeshare was not a factor 9 Don’t know
PAGE BREAK
39 In the past month, how many times did you use Capital Bikeshare to get to or from work or to travel to or from a work-related meeting?
1 0 2 1-2 times 3 3-5 times 4 6-10 times 5 11-15 times 6 More than 15 times
40 Does your employer offer a Capital Bikeshare Corporate Partner Membership?
1 No 2 Yes 3 Don’t know

41 Does your company currently offer any of the following employee benefits? (check all that apply)
1 Alternative work schedule 2 Flextime (flexible work start / end times) 3 Telework 4 Financial incentive or subsidy for employees who ride a bike to work 5 Bike racks or lockers 6 Showers or personal lockers 7 SmartBenefits transit / vanpool subsidy 8 Zipcar or car2go membership 9 Other
PAGE BREAK CUSTOMER SERVICE
42 How do you rate each of the following features of Capital Bikeshare? Please rate each on a scale of 1 to 5, where 1 is Poor and 5 is Excellent.
1 5 Don’t (Poor) 2 3 4 (Excellent) know 1 Map at Capital Bikeshare station 1 2 3 4 5 DK 2 Nighttime lighting at stations 1 2 3 4 5 DK 3 Safety of stations 1 2 3 4 5 DK 4 Capital Bikeshare website 1 2 3 4 5 DK 5 Mechanical repair of bikes 1 2 3 4 5 DK 6 Call center 1 2 3 4 5 DK
43 Have you had any problems accessing a bike with your Capital Bikeshare membership key?
1 No 2 Yes --- What problem did you have?_____________________________________________
44 Have you had any mechanical problems with retrieving or returning a bike to a Capital Bikeshare bike dock?
1 No 2 Yes --- What problem did you have?_____________________________________________
45 Have you had any mechanical issues with the bike?
1 No 2 Yes --- What problem did you have?_____________________________________________
46 Capital Bikeshare has an Android/Blackberry/iPhone app called SpotCycle that you can use to locate stations and
bike availability. Are you aware of the app and have you used it?
1 Aware of the app and HAVE USED it 2 Aware of the app, HAVE NOT USED it 3 Not aware of the app
PAGE BREAK

47 Which of the following are significant barriers to your bicycling in the Washington metro region? (Check up to five items).
1 Lack of dedicated bicycle lanes or paths 2 Bike paths / lanes don’t connect to each other 3 Too much car traffic on local roads 4 Car traffic moves too fast 5 Bike lanes on streets are not separated from car traffic 6 Road surface is poorly maintained 7 Insufficient lighting on bike paths or bike lanes 8 Drivers are not aware of bicyclists 9 Drivers are inconsiderate of bicyclists 10 Not enough bike lockers or racks 11 No place to shower after riding to work 12 Don’t like to ride after dark 13 Terrain is too hilly 14 Other _________________________________________
48 Which of the following Capital Bikeshare expansion options are most needed? (Check up to two options).
1 More docks/bikes at existing stations 2 More stations in residential neighborhoods 3 More stations in commercial / employment areas 4 More stations near Metrorail stations 5 More stations in areas where bikeshare operates now (greater density / infill) 6 Expansion to areas where bikeshare doesn’t operate now (greater coverage)
PAGE BREAK
TELL US ABOUT YOURSELF 49 What is your home Zip code?
____________________ 00000 Prefer not to answer
50 What is your zip code at work?
____________________ 99999 Not employed 00000 Prefer not to answer
51 Are you male or female?
1 Male 2 Female 3 Prefer not to answer
52 What is your age?
1 16 – 17 years old 2 18 - 24 3 25 - 34 4 35 - 44 5 45 - 54 6 55 - 64 7 65 years or older 8 Prefer not to answer

53 Approximately what was your total household income last year?
1 less than $10,000 2 $10,000 - $14,999 3 $15,000 - $24,999 4 $25,000 - $34,999 5 $350,000 - $49,999 6 $50,000 - $74,999 7 $75,000 - $99,999 8 $100,000 – $124,999 9 $125,000 - $149,999 10 $150,000 - $199,999 11 $200,000 or more 12 Prefer not to answer
PAGE BREAK
54 How many people reside in your household?
1 1 (Just myself) 2 2 3 3 4 4 or more
55 What is the highest level of education you have completed?
1 Less than high school 2 High school diploma /GED 3 Some college 4 2 year college degree 5 4 year college degree 6 Master’s degree 7 Doctoral degree 8 Prefer not to answer
56 Which of the following best describes your racial or ethnic background?
1 Asian/Pacific Islander 2 Black/African-American 3 Caucasian, White 4 Hispanic, Latino 5 Other/Multi-Racial 6 Prefer not to answer
57 Are you a full-time or part-time student?
1 Full-time student 2 Part-time student 3 Not a student 4 Prefer not to answer
58 What do you like best about using Capital Bikeshare bikes? 59 Do you have any suggestions to improve Capital Bikeshare?