global healthcare trends and outlook •the global pharmaceutical market: description and trends...
TRANSCRIPT

Copyright © 2016 QuintilesIMS. All rights reserved.
Global Healthcare
Trends and Outlook
Joint 23rd Medicines for Europe and
20th IGBA Annual conference
Lisbon June 15th 2017
Alan Sheppard
Principal, Thought Leadership

1
• The global pharmaceutical market: description and trends
• The global generic market trends
• Trends in new launches: innovator products and generic medicines
• Will the future generic medicines launches be sufficient to cope with the high costs of
new innovative medicines?
• Will future biosimilar launches balance the new high cost innovative medicines?
• Summary
Outline
2
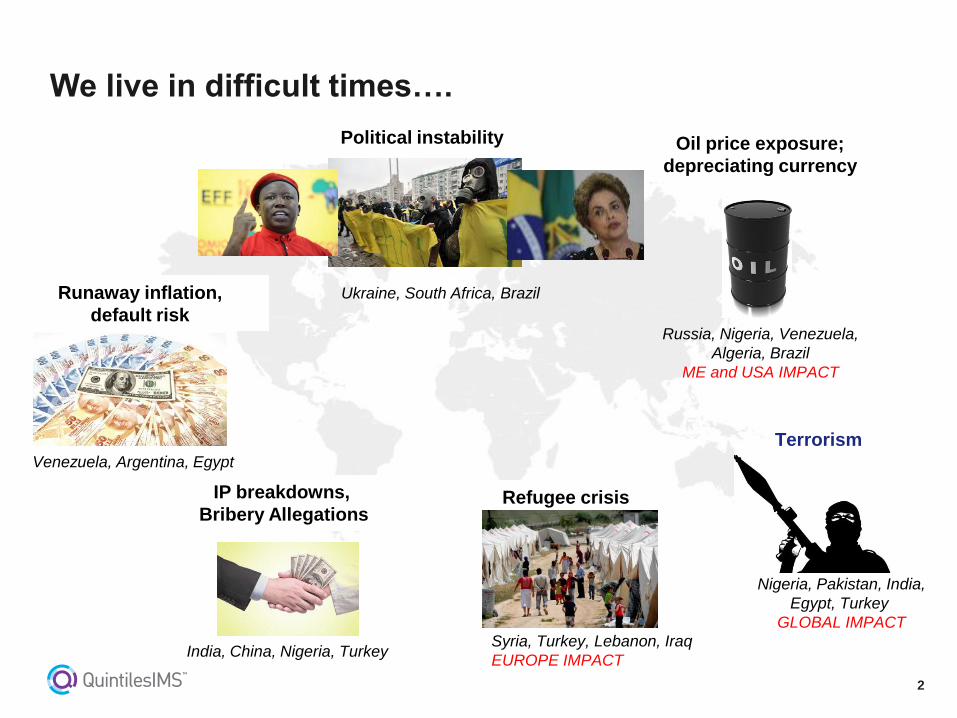
We live in difficult times….
Political instability
Ukraine, South Africa, Brazil
Oil price exposure;
depreciating currency
Russia, Nigeria, Venezuela,
Algeria, Brazil
ME and USA IMPACT
Runaway inflation,
default risk
Venezuela, Argentina, Egypt
IP breakdowns,
Bribery Allegations
India, China, Nigeria, Turkey Syria, Turkey, Lebanon, Iraq
EUROPE IMPACT
Refugee crisis
Terrorism
Nigeria, Pakistan, India,
Egypt, Turkey
GLOBAL IMPACT
3
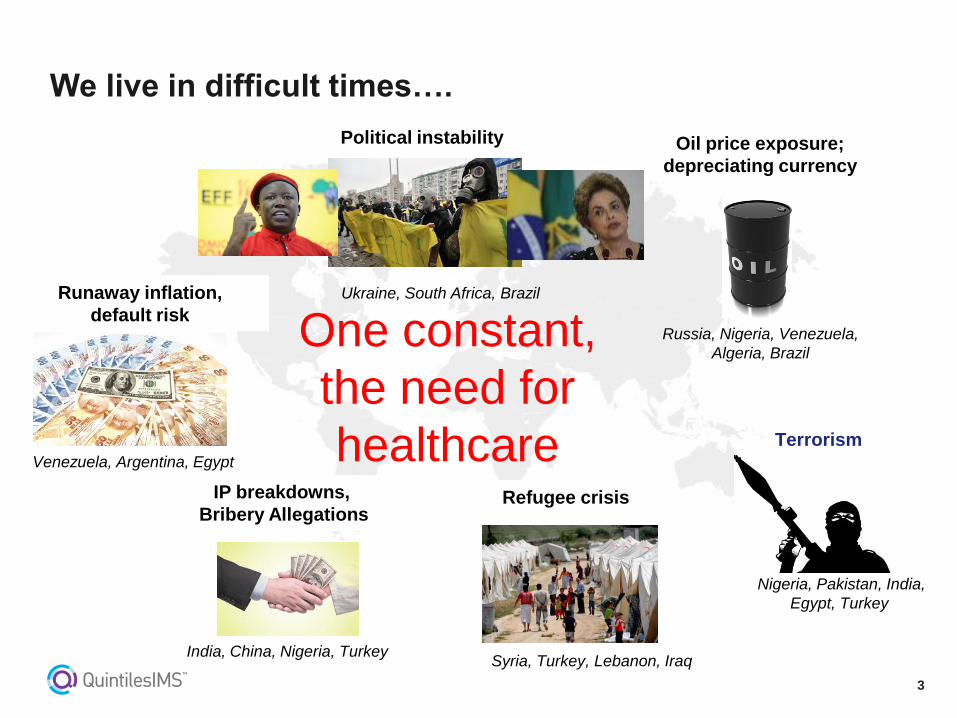
We live in difficult times….
Political instability
Ukraine, South Africa, Brazil
Oil price exposure;
depreciating currency
Russia, Nigeria, Venezuela,
Algeria, Brazil
Runaway inflation,
default risk
Venezuela, Argentina, Egypt
IP breakdowns,
Bribery Allegations
India, China, Nigeria, Turkey Syria, Turkey, Lebanon, Iraq
Refugee crisis
Terrorism
Nigeria, Pakistan, India,
Egypt, Turkey
One constant,
the need for
healthcare
4
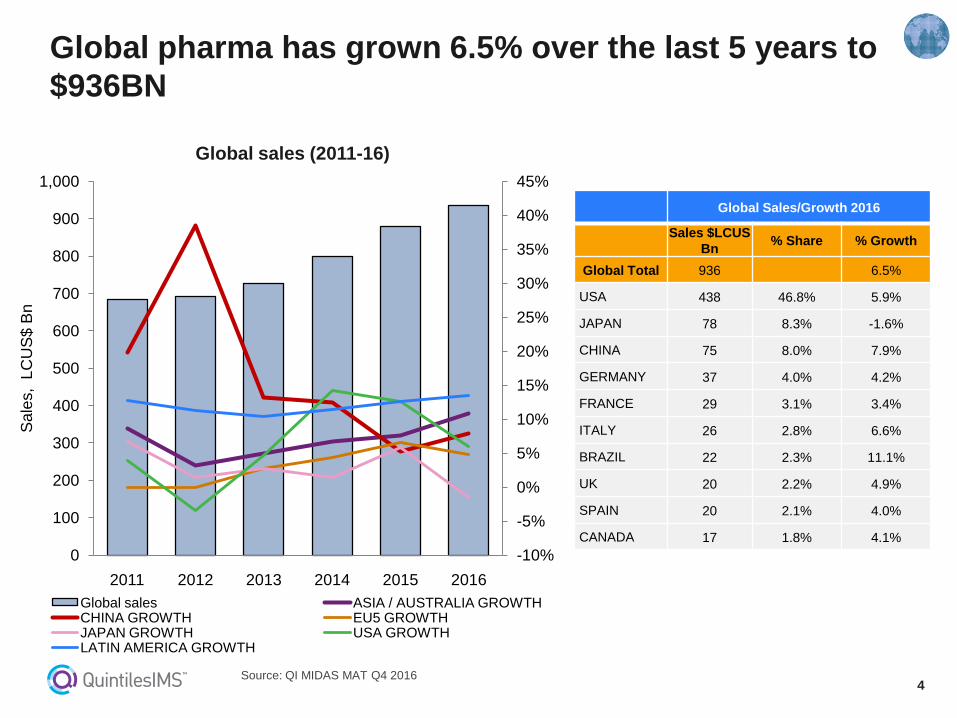
Global pharma has grown 6.5% over the last 5 years to
$936BN
Source: QI MIDAS MAT Q4 2016
-10%
-5%
0%
5%
10%
15%
20%
25%
30%
35%
40%
45%
0
100
200
300
400
500
600
700
800
900
1,000
2011 2012 2013 2014 2015 2016
Sa
les, L
CU
S$
Bn
Global sales ASIA / AUSTRALIA GROWTH CHINA GROWTH EU5 GROWTH JAPAN GROWTH USA GROWTH LATIN AMERICA GROWTH
Global sales (2011-16)
Gro
wth
Global Sales/Growth 2016
Sales $LCUS
Bn % Share % Growth
Global Total 936 6.5%
USA 438 46.8% 5.9%
JAPAN 78 8.3% -1.6%
CHINA 75 8.0% 7.9%
GERMANY 37 4.0% 4.2%
FRANCE 29 3.1% 3.4%
ITALY 26 2.8% 6.6%
BRAZIL 22 2.3% 11.1%
UK 20 2.2% 4.9%
SPAIN 20 2.1% 4.0%
CANADA 17 1.8% 4.1%
5
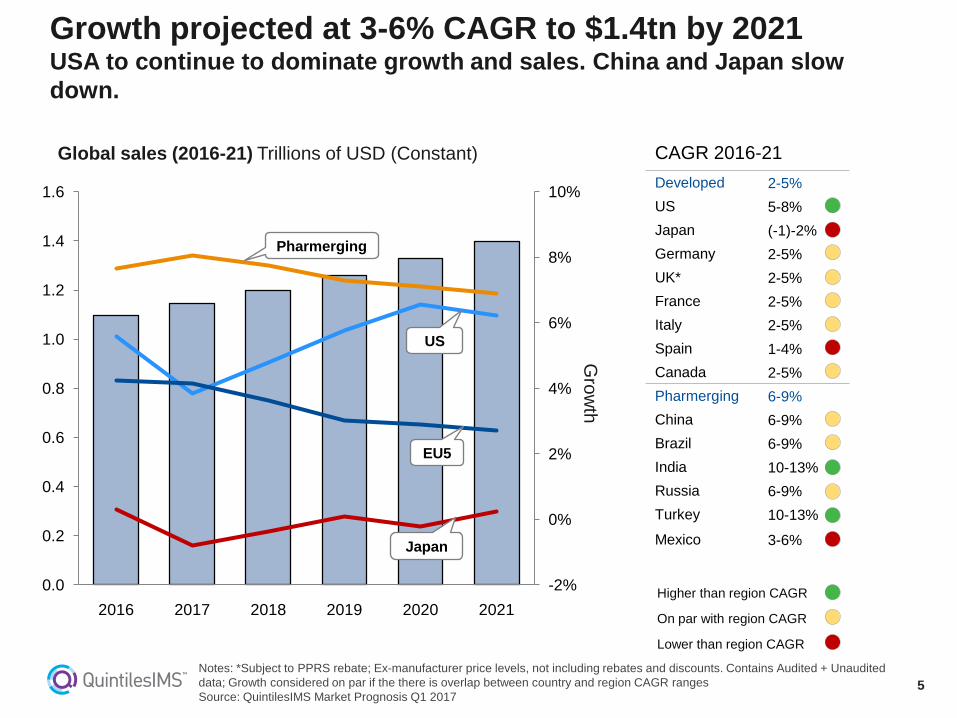
Growth projected at 3-6% CAGR to $1.4tn by 2021 USA to continue to dominate growth and sales. China and Japan slow
down.
Notes: *Subject to PPRS rebate; Ex-manufacturer price levels, not including rebates and discounts. Contains Audited + Unaudited
data; Growth considered on par if the there is overlap between country and region CAGR ranges
Source: QuintilesIMS Market Prognosis Q1 2017
Higher than region CAGR
On par with region CAGR
Lower than region CAGR
-2%
0%
2%
4%
6%
8%
10%
0.0
0.2
0.4
0.6
0.8
1.0
1.2
1.4
1.6
2016 2017 2018 2019 2020 2021
Global sales (2016-21) Trillions of USD (Constant)
EU5
US
Pharmerging
Japan
CAGR 2016-21
Developed 2-5%
US 5-8%
Japan (-1)-2%
Germany 2-5%
UK* 2-5%
France 2-5%
Italy 2-5%
Spain 1-4%
Canada 2-5%
Pharmerging 6-9%
China 6-9%
Brazil 6-9%
India 10-13%
Russia 6-9%
Turkey 10-13%
Mexico 3-6%
Gro
wth
6
-2
-1
0
1
2
3
4
5
6
7
8
-2 -1 0 1 2 3 4 5 6 7 8
Fore
ca
st G
row
th %
(C
AG
R 2
01
6-2
021)
Historic Growth % (CAGR 2011-2016)
Norway
Czech Republic
Ireland
Hungary
Denmark
Romania
Portugal
Sweden
Austria
Greece Netherlands Belgium
Switzerland
Poland
Spain
UK*
Italy
France
Germany
Finland
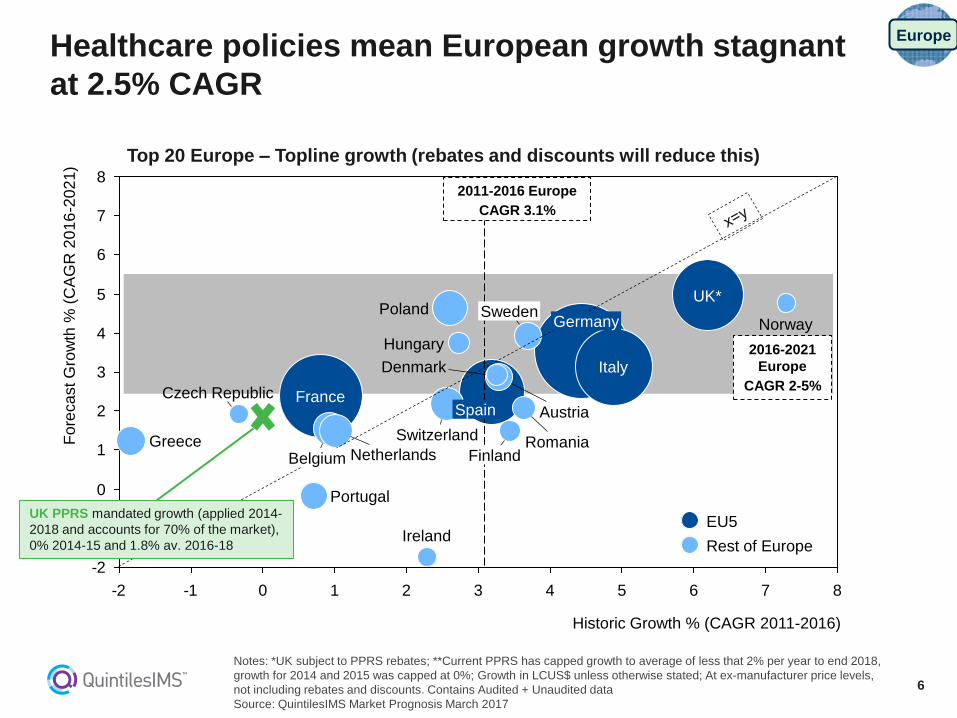
Healthcare policies mean European growth stagnant
at 2.5% CAGR
Notes: *UK subject to PPRS rebates; **Current PPRS has capped growth to average of less that 2% per year to end 2018,
growth for 2014 and 2015 was capped at 0%; Growth in LCUS$ unless otherwise stated; At ex-manufacturer price levels,
not including rebates and discounts. Contains Audited + Unaudited data
Source: QuintilesIMS Market Prognosis March 2017
Rest of Europe
EU5
Top 20 Europe – Topline growth (rebates and discounts will reduce this)
2011-2016 Europe
CAGR 3.1%
2016-2021
Europe
CAGR 2-5%
UK PPRS mandated growth (applied 2014-
2018 and accounts for 70% of the market),
0% 2014-15 and 1.8% av. 2016-18
Europe

7
1
2
3
4
5
6
7
8
9
10
11
12
13
14
2 4 6 8 10 12 14 16 18
Historic CAGR (2011-16)
Fore
ca
st C
AG
R (
20
16
-21
)
Kazakhstan Nigeria
Chile
South Africa
Bangladesh
Algeria
Philippines Colombia
Egypt
Vietnam
Pakistan
Indonesia
Poland
Saudi Arabia
Mexico
Turkey
Russia
India
Brazil
China
Wide dispersion in growth but CAGR falls to single
digits…China dominates but moderating
Notes: At ex-manufacturer price levels, not including rebates and discounts. Contains Audited and Unaudited data;
Argentina excluded due to hyperinflation
Source: QuintilesIMS Market Prognosis March 2017
BRICTM Pharmerging Tier 3
Bubble Size proportional to
2016 LCUS$ Sales
Top 20 Pharmerging Markets Forecast Growth Dynamics
Pharmerging Forecast
CAGR: 7.4%
Pharmerging Historic
CAGR: 10.8%
Pharmerging
$100bn
$20bn
$7bn
8
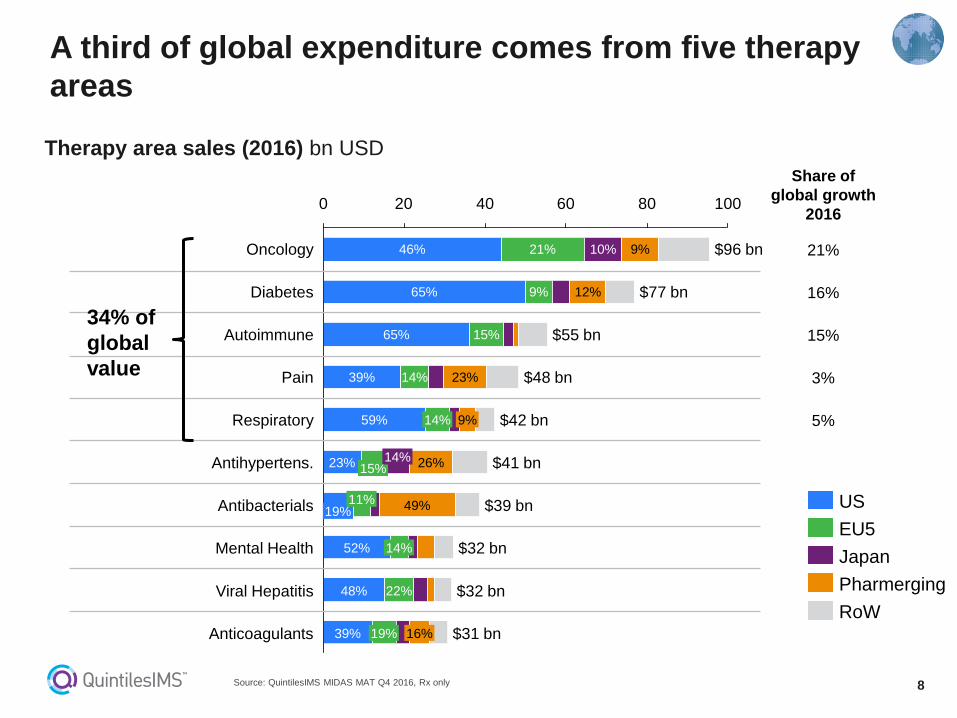
A third of global expenditure comes from five therapy
areas
Source: QuintilesIMS MIDAS MAT Q4 2016, Rx only
80 0 20 60 40 100
Pain
26%
65% $55 bn
9%
65%
$48 bn
10%
$77 bn
Oncology $96 bn
23%
46%
9%
39%
19% $39 bn
$41 bn
Antibacterials
Antihypertens.
12%
$32 bn
49% 11%
23%
52% 14%
$42 bn 59%
15%
Respiratory 9%
14%
Mental Health
Diabetes
19%
$32 bn
$31 bn Anticoagulants
21%
15%
Viral Hepatitis
14%
14%
Autoimmune
16%
48%
39%
22%
US
Pharmerging
Japan
EU5
RoW
Share of
global growth
2016
21%
16%
15%
3%
5%
34% of
global
value
Therapy area sales (2016) bn USD
9
Over 60% of global growth comes from just five TAs
Source: QuintilesIMS MIDAS MAT Q4 2016, Rx only
12 10 8 6 4 2 0 -2
1.4
Pain 1.6
Nervous System 1.7 73%
GI 1.7 59%
Respiratory 2.8 76%
HIV 3.0 86%
Anticoagulants 3.9 64%
Autoimmune 8.7 79% 10%
Diabetes 9.3 80%
Oncology 11.7 53% 21%
68%
145%
MS
-44% All Others
Pharmerging
Japan
EU5
US
Share of
global growth
2016
21%
16%
15%
7%
5%
5%
3%
3%
3%
3%
64% of
global
growth
Absolute one year growth 2016
(LCUS$ Bn)
Concentration has reduced
from the previous iteration (73%
in top 5 TAs) because we have
passed peak Hepatitis C
10
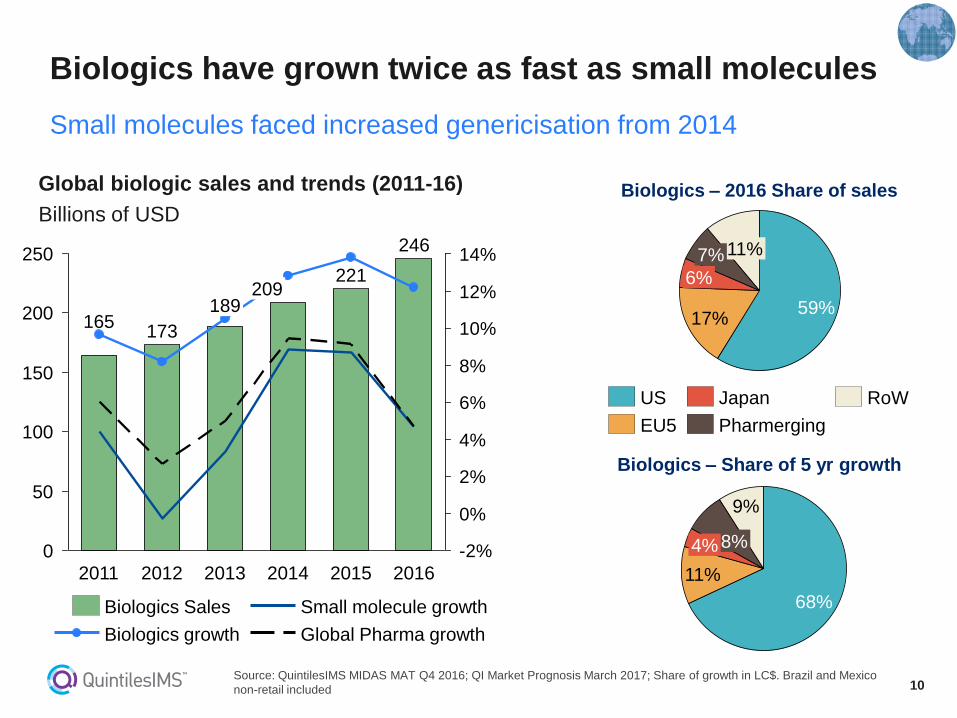
Biologics have grown twice as fast as small molecules
Small molecules faced increased genericisation from 2014
Source: QuintilesIMS MIDAS MAT Q4 2016; QI Market Prognosis March 2017; Share of growth in LC$. Brazil and Mexico
non-retail included
Global biologic sales and trends (2011-16)
Billions of USD Biologics – 2016 Share of sales
Biologics – Share of 5 yr growth
-2%
0%
2%
4%
6%
8%
10%
12%
14%
150
0
100
50
200
250
189
2012
246
209
2014 2013
221
2016 2015
173
2011
165
Global Pharma growth Biologics growth
Small molecule growth Biologics Sales
11%
59%
6%
7%
17%
8% 4%
11%
9%
68%
US
EU5
Japan RoW
Pharmerging
11
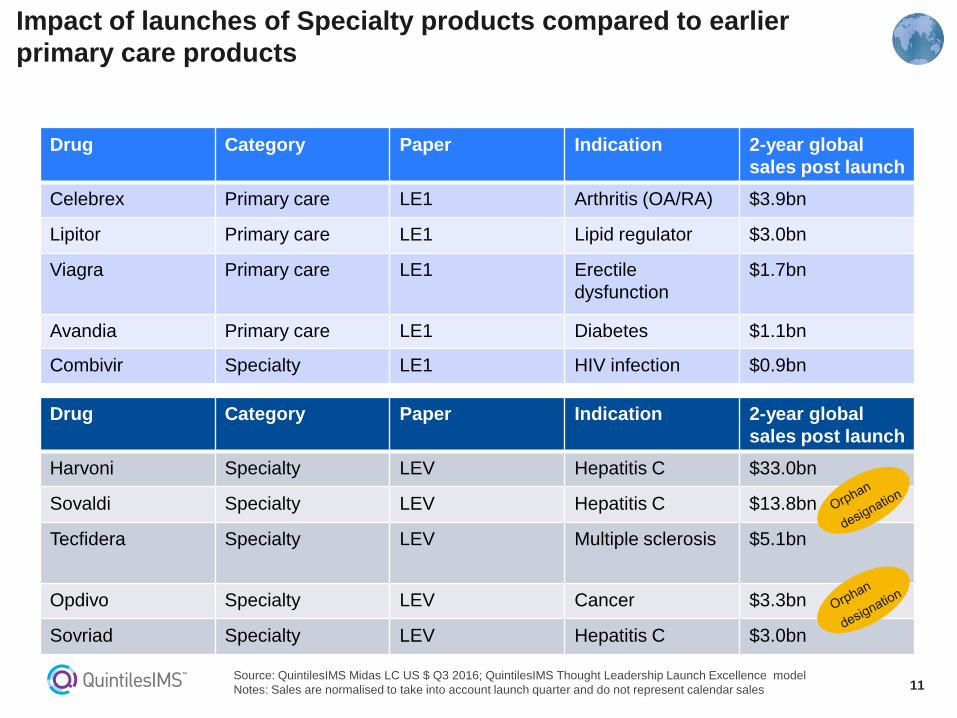
Drug Category Paper Indication 2-year global
sales post launch
Celebrex Primary care LE1 Arthritis (OA/RA) $3.9bn
Lipitor Primary care LE1 Lipid regulator $3.0bn
Viagra Primary care LE1 Erectile
dysfunction
$1.7bn
Avandia Primary care LE1 Diabetes $1.1bn
Combivir Specialty LE1 HIV infection $0.9bn
Impact of launches of Specialty products compared to earlier
primary care products
Source: QuintilesIMS Midas LC US $ Q3 2016; QuintilesIMS Thought Leadership Launch Excellence model
Notes: Sales are normalised to take into account launch quarter and do not represent calendar sales
Drug Category Paper Indication 2-year global
sales post launch
Harvoni Specialty LEV Hepatitis C $33.0bn
Sovaldi Specialty LEV Hepatitis C $13.8bn
Tecfidera Specialty LEV Multiple sclerosis $5.1bn
Opdivo Specialty LEV Cancer $3.3bn
Sovriad Specialty LEV Hepatitis C $3.0bn

12
• The global pharmaceutical market: description and trends
• The global generic market trends
• Trends in new launches: innovator products and generic medicines
• Will the future generic medicines launches be sufficient to cope with the high costs of
new innovative medicines?
• Will future biosimilar launches balance the new high cost innovative medicines?
• Summary
Outline
13
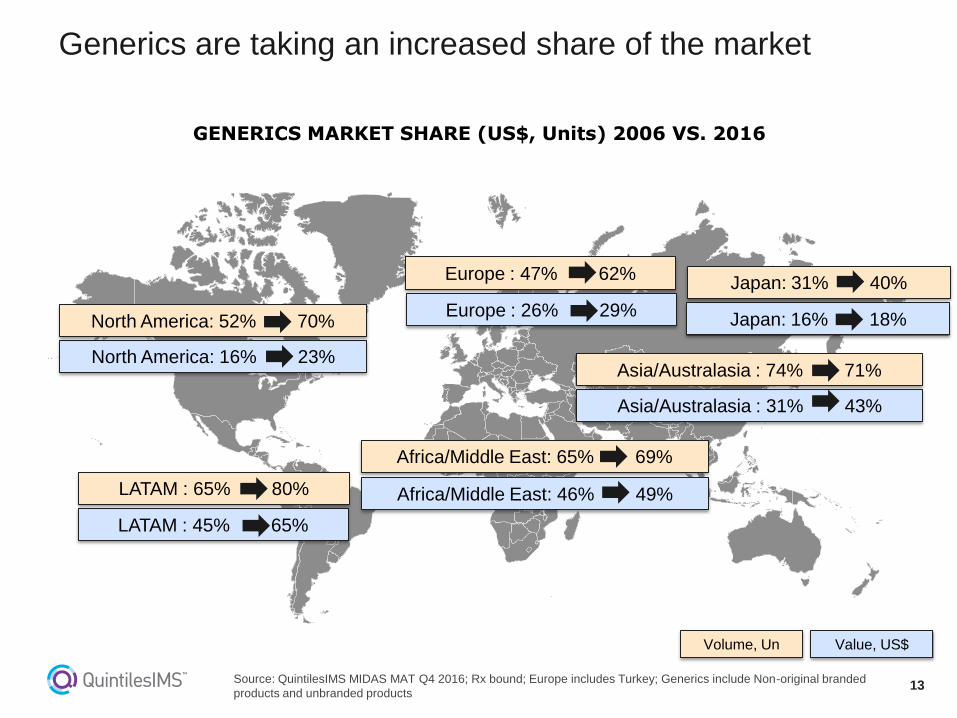
Generics are taking an increased share of the market
GENERICS MARKET SHARE (US$, Units) 2006 VS. 2016
LATAM : 45% 65%
Africa/Middle East: 46% 49%
Asia/Australasia : 31% 43%
Europe : 26% 29%
North America: 16% 23%
Japan: 16% 18%
Source: QuintilesIMS MIDAS MAT Q4 2016; Rx bound; Europe includes Turkey; Generics include Non-original branded
products and unbranded products
North America: 52% 70%
Europe : 47% 62% Japan: 31% 40%
Asia/Australasia : 74% 71%
Africa/Middle East: 65% 69%
LATAM : 65% 80%
Volume, Un Value, US$
14
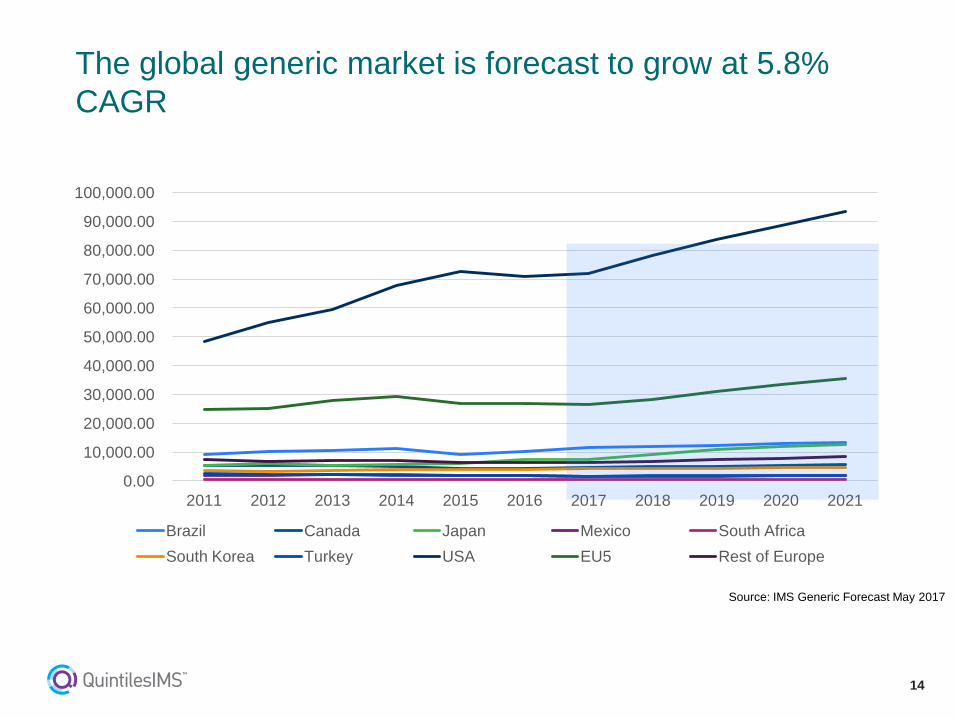
The global generic market is forecast to grow at 5.8%
CAGR
0.00
10,000.00
20,000.00
30,000.00
40,000.00
50,000.00
60,000.00
70,000.00
80,000.00
90,000.00
100,000.00
2011 2012 2013 2014 2015 2016 2017 2018 2019 2020 2021
Brazil Canada Japan Mexico South Africa
South Korea Turkey USA EU5 Rest of Europe
Source: IMS Generic Forecast May 2017
15
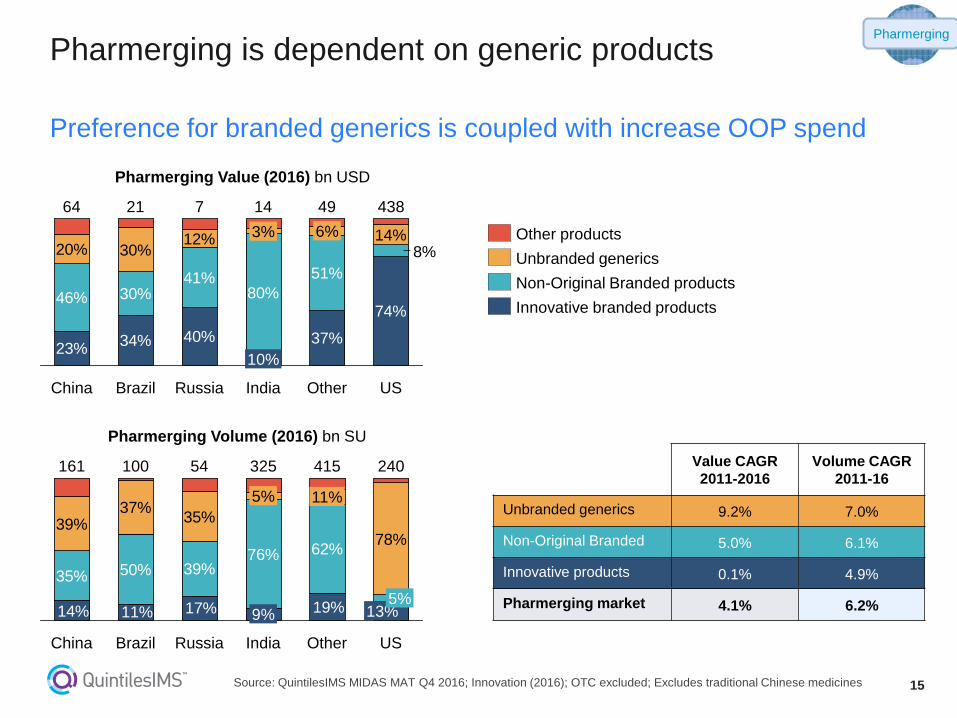
Preference for branded generics is coupled with increase OOP spend
Pharmerging is dependent on generic products
Source: QuintilesIMS MIDAS MAT Q4 2016; Innovation (2016); OTC excluded; Excludes traditional Chinese medicines
23%34% 40% 37%
74%46% 30%
41%
20% 30%12% 14%
80%
8%
51%
US
438
Other
49
6%
India
14
10%
3%
Russia
7
Brazil
21
China
64
Unbranded generics
Innovative branded products
Other products
Non-Original Branded products
35% 50% 39%76% 62%
39% 35%
78%
17% 19%11%14%
37%
Russia
161 415
China India
325
11%
Other
13%
240 54
5%
US
5%
100
9%
Brazil
Pharmerging
Value CAGR
2011-2016
Volume CAGR
2011-16
Unbranded generics 9.2% 7.0%
Non-Original Branded 5.0% 6.1%
Innovative products 0.1% 4.9%
Pharmerging market 4.1% 6.2%
Pharmerging Value (2016) bn USD
Pharmerging Volume (2016) bn SU
16
• Affordability
• Headroom in budgets for newer treatments
• Treatment guidelines
• Incentives/ budgets for prescribers
• Patient co-payments
• Earnings for pharmacist
• Products coming off patent
What is driving the generic market?
17
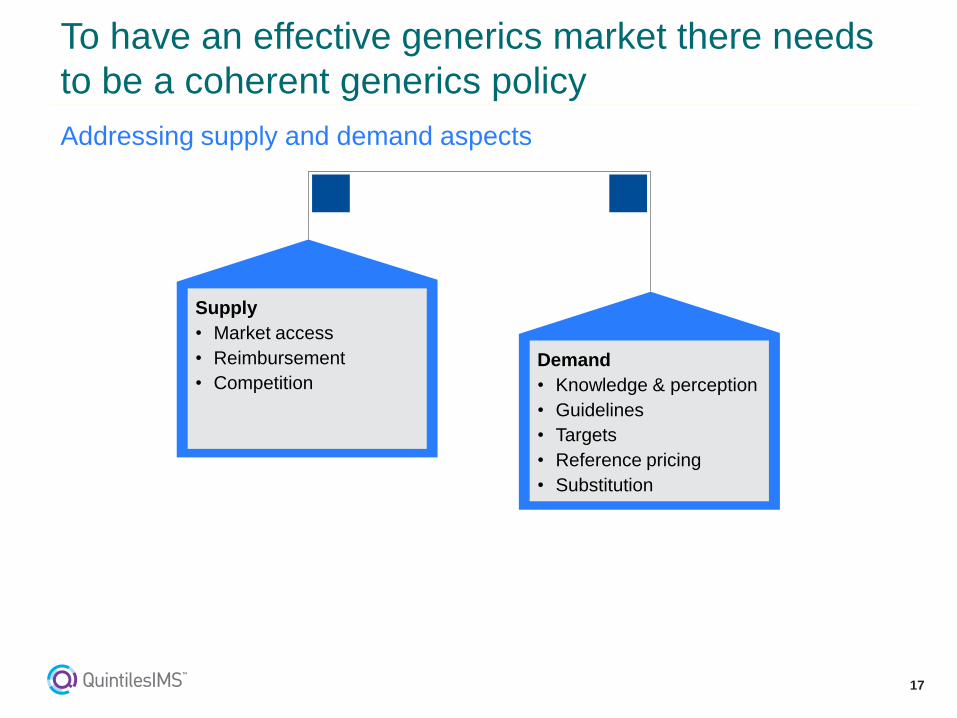
To have an effective generics market there needs
to be a coherent generics policy
Addressing supply and demand aspects
Supply
• Market access
• Reimbursement
• Competition
Demand
• Knowledge & perception
• Guidelines
• Targets
• Reference pricing
• Substitution
18
• The global pharmaceutical market: description and trends
• The global generic market trends
• Trends in new launches: innovator products and generic medicines
• Will the future generic medicines launches be sufficient to cope with the high costs of
new innovative medicines?
• Will future biosimilar launches balance the new high cost innovative medicines?
• Summary
Outline
19
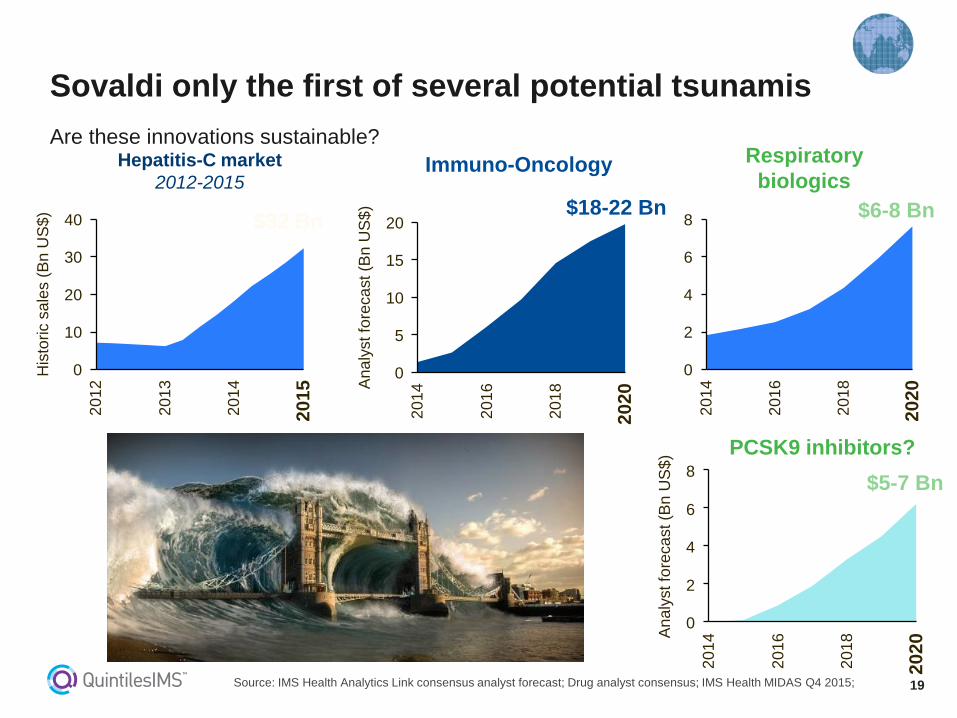
Are these innovations sustainable?
Sovaldi only the first of several potential tsunamis
Source: IMS Health Analytics Link consensus analyst forecast; Drug analyst consensus; IMS Health MIDAS Q4 2015;
20
15
10
5
0 A
na
lyst fo
reca
st (B
n U
S$
)
2020
20
18
20
16
20
14
$18-22 Bn
8
6
4
2
0
An
aly
st fo
reca
st (B
n U
S$
)
2020
20
18
20
16
20
14
$5-7 Bn
8
6
4
2
0
2020
20
18
20
16
20
14
$6-8 Bn
Immuno-Oncology Respiratory
biologics
PCSK9 inhibitors?
40
30
20
10
0 His
toric s
ale
s (
Bn
US
$)
2015
20
14
20
13
20
12
Hepatitis-C market
2012-2015
$32 Bn
20
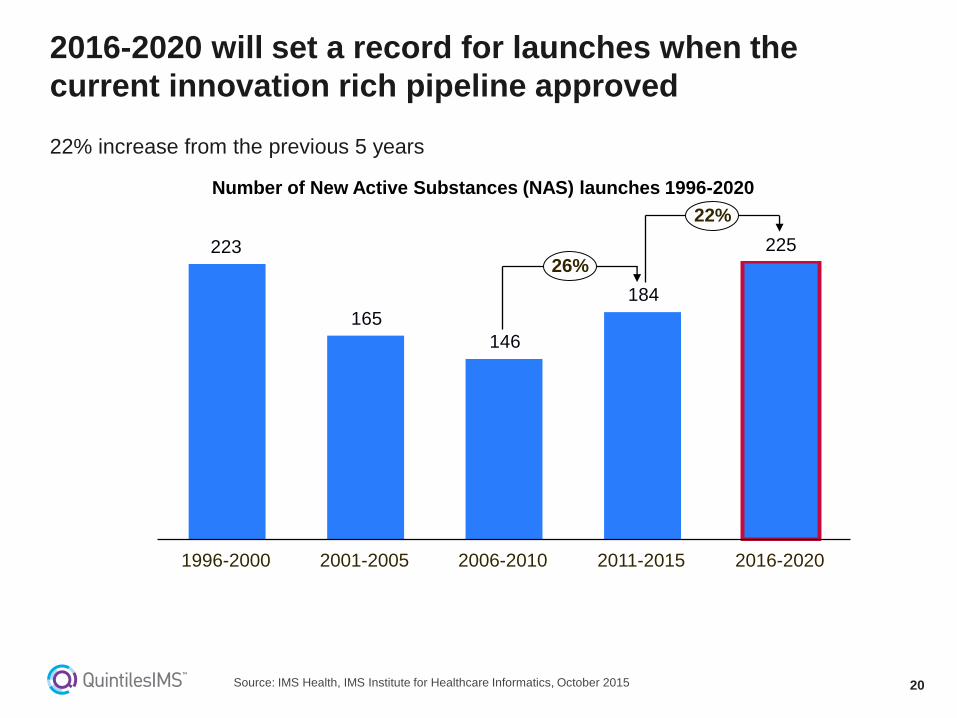
22% increase from the previous 5 years
2016-2020 will set a record for launches when the
current innovation rich pipeline approved
Source: IMS Health, IMS Institute for Healthcare Informatics, October 2015
Number of New Active Substances (NAS) launches 1996-2020
223
165
146
184
225 26%
22%
2016-2020 2011-2015 2006-2010 2001-2005 1996-2000
21
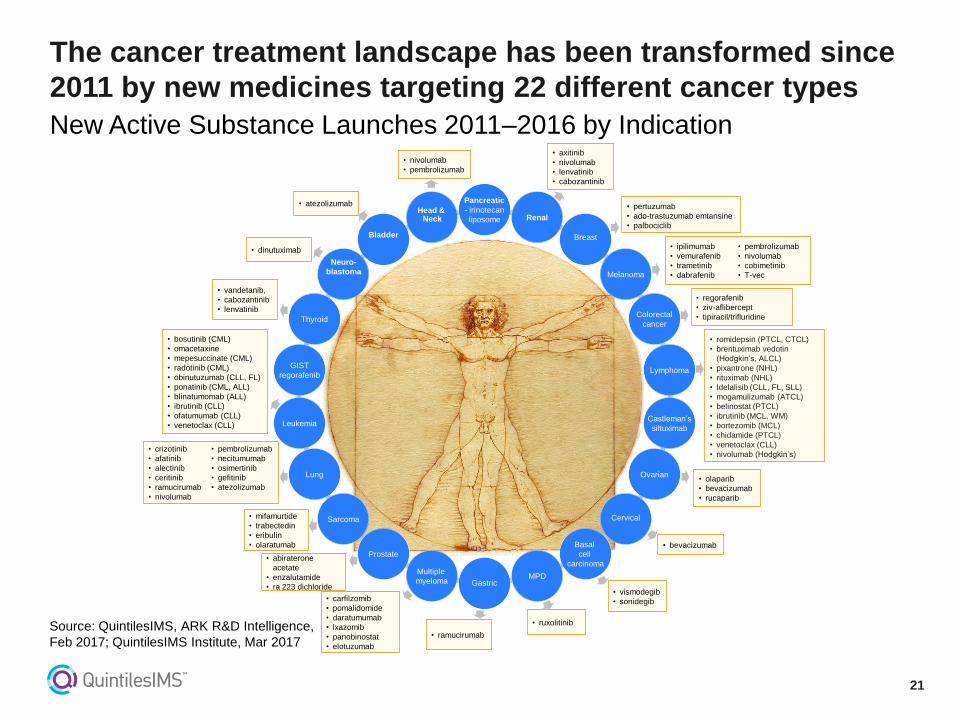
The cancer treatment landscape has been transformed since
2011 by new medicines targeting 22 different cancer types
New Active Substance Launches 2011–2016 by Indication
Pancreatic
- irinotecan
liposome
Neuro-
blastoma
Thyroid
GIST
regorafenib
Leukemia
Lung
Sarcoma
Prostate
Multiple
myeloma Gastric MPD
Basal
cell
carcinoma
Cervical
Ovarian
Castleman’s
siltuximab
Lymphoma
Colorectal
cancer
Melanoma
Breast
Renal
Bladder
Head & Neck
• axitinib
• nivolumab
• lenvatinib
• cabozantinib
• pertuzumab
• ado-trastuzumab emtansine
• palbociclib
• ipilimumab
• vemurafenib
• trametinib
• dabrafenib
• pembrolizumab
• nivolumab
• cobimetinib
• T-vec
• regorafenib
• ziv-aflibercept
• tipiracil/trifluridine
• romidepsin (PTCL, CTCL)
• brentuximab vedotin
(Hodgkin’s, ALCL)
• pixantrone (NHL)
• rituximab (NHL)
• Idelalisib (CLL, FL, SLL)
• mogamulizumab (ATCL)
• belinostat (PTCL)
• ibrutinib (MCL, WM)
• bortezomib (MCL)
• chidamide (PTCL)
• venetoclax (CLL)
• nivolumab (Hodgkin’s)
• olaparib
• bevacizumab
• rucaparib
• vismodegib
• sonidegib • carfilzomib
• pomalidomide
• daratumumab
• lxazomib
• panobinostat
• elotuzumab
• abiraterone
acetate
• enzalutamide
• ra 223 dichloride
• mifamurtide
• trabectedin
• eribulin
• olaratumab
• crizotinib
• afatinib
• alectinib
• ceritinib
• ramucirumab
• nivolumab
• pembrolizumab
• necitumumab
• osimertinib
• gefitinib
• atezolizumab
• bosutinib (CML)
• omacetaxine
• mepesuccinate (CML)
• radotinib (CML)
• obinutuzumab (CLL, FL)
• ponatinib (CML, ALL)
• blinatumomab (ALL)
• ibrutinib (CLL)
• ofatumumab (CLL)
• venetoclax (CLL)
• vandetanib,
• cabozantinib
• lenvatinib
• dinutuximab
• atezolizumab
• nivolumab
• pembrolizumab
• ramucirumab
• ruxolitinib
• bevacizumab
Source: QuintilesIMS, ARK R&D Intelligence,
Feb 2017; QuintilesIMS Institute, Mar 2017
22
3
2
2
1
4
6
1
CLL
Melanoma
Lung Cancer
Prostate Cancer
Breast Cancer
HER2 Hormonals Chemotherapy CDK
Others Immunotherapy EGFR ALK
BRAF Anti-CD Other small molecules
Over the last 20 years, therapy options for multiple tumor
types have increased significantly Number of Treatment Options over Time for Selected Tumors (1996–2016)
1996
Source: Drugs@FDA, Feb 2017; QuintilesIMS, ARK R&D Intelligence, Feb 2017; QuintilesIMS Institute, Mar 2017
1
6
4
2
1
7
1
7
2
2
2
4
9
4
3
1
8
2
9 1
1
1
1
7
3
1
4 3
4
4 3
2006 2016
23
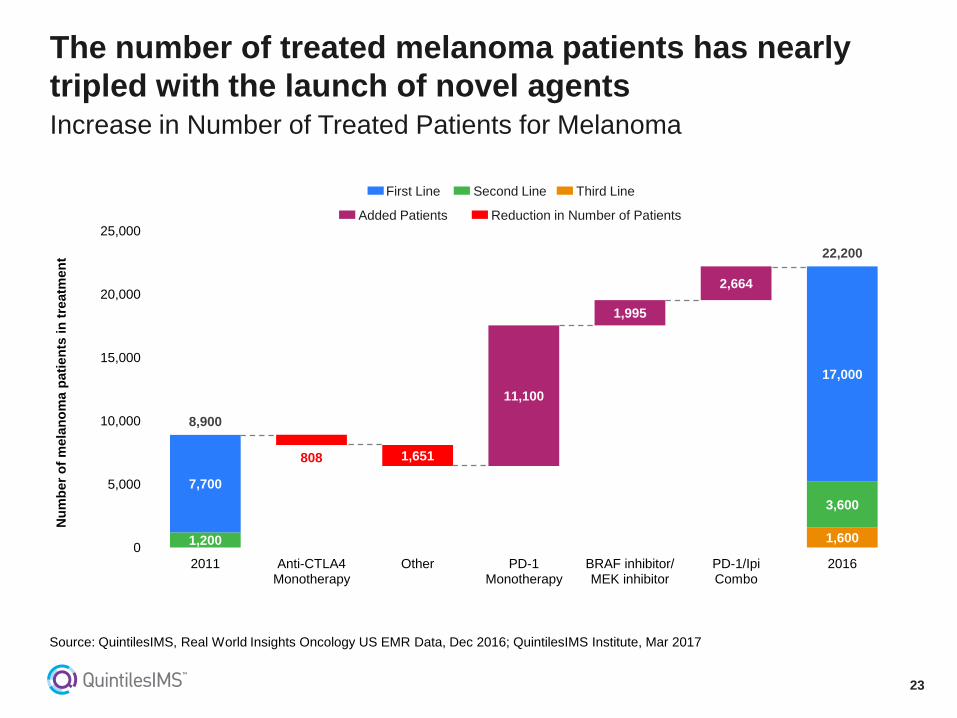
1,200
808 1,651
11,100
1,995
2,664
1,600
7,700
3,600
17,000
8,900
22,200
0
5,000
10,000
15,000
20,000
25,000
2011 Anti-CTLA4 Monotherapy
Other PD-1 Monotherapy
BRAF inhibitor/ MEK inhibitor
PD-1/Ipi Combo
2016
Nu
mb
er
of
mela
no
ma p
ati
en
ts i
n t
reatm
en
t The number of treated melanoma patients has nearly
tripled with the launch of novel agents Increase in Number of Treated Patients for Melanoma
Source: QuintilesIMS, Real World Insights Oncology US EMR Data, Dec 2016; QuintilesIMS Institute, Mar 2017
First Line Second Line Third Line
Added Patients Reduction in Number of Patients
24
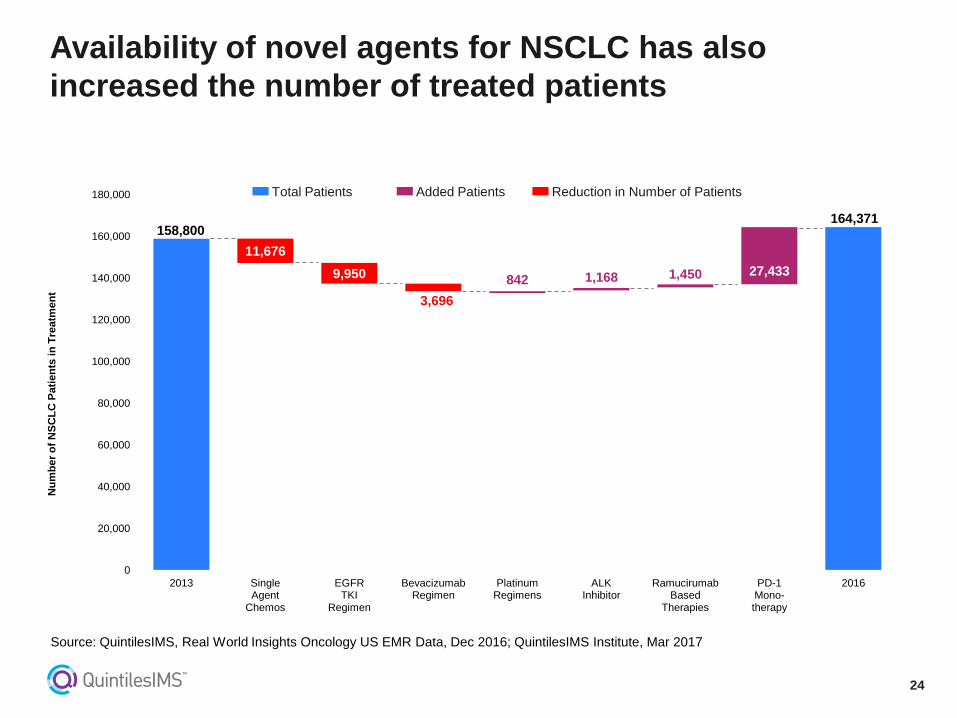
Availability of novel agents for NSCLC has also
increased the number of treated patients
158,800
11,676
9,950
3,696
842 1,168 1,450 27,433
164,371
0
20,000
40,000
60,000
80,000
100,000
120,000
140,000
160,000
180,000
2013 Single Agent
Chemos
EGFR TKI
Regimen
Bevacizumab Regimen
Platinum Regimens
ALK Inhibitor
Ramucirumab Based
Therapies
PD-1 Mono- therapy
2016
Nu
mb
er
of
NS
CL
C P
ati
en
ts in
Tre
atm
en
t
Added Patients Reduction in Number of Patients Total Patients
Source: QuintilesIMS, Real World Insights Oncology US EMR Data, Dec 2016; QuintilesIMS Institute, Mar 2017
25
The global R&D pipeline for oncology remains robust
with 631 unique molecules in late-phase development Global Late Phase Oncology Pipeline in 2016
Source: QuintilesIMS ARK R&D Intelligence, QuintilesIMS Institute, Dec 2016
39
139
453
391
191
79
544
Phase II
Phase III
Pre-Reg/ Registered
Late Phase Active Pipeline
Phase II Phase III Pre-Reg/Registered
Molecules in the Late Phase Pipeline: 631 Companies with a Late Phase Pipeline: 544
26
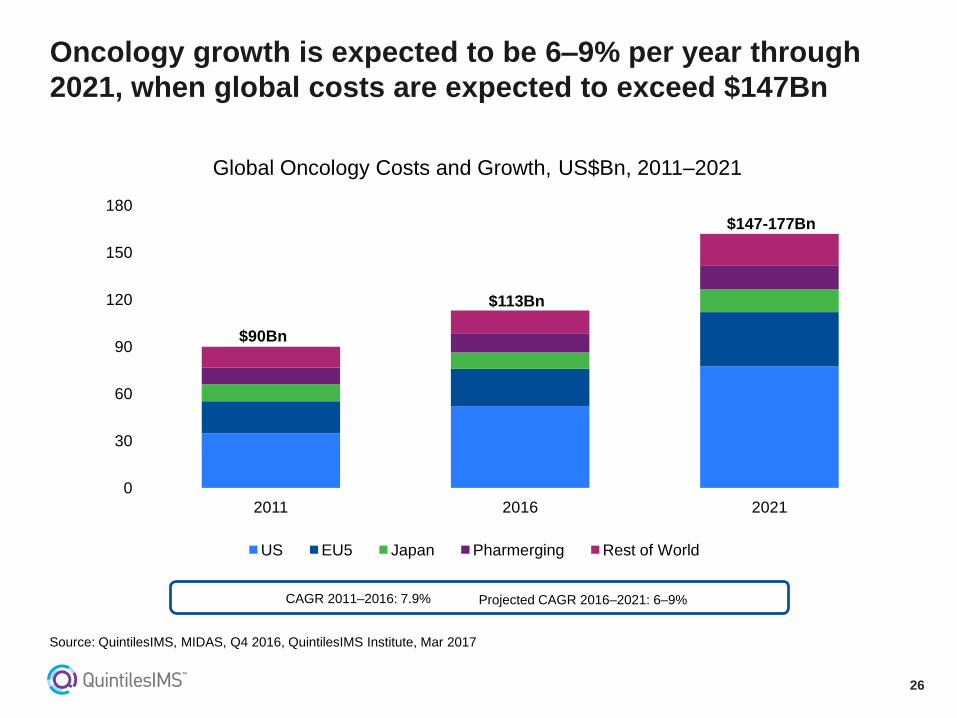
Oncology growth is expected to be 6–9% per year through
2021, when global costs are expected to exceed $147Bn
Global Oncology Costs and Growth, US$Bn, 2011–2021
0
30
60
90
120
150
180
2011 2016 2021
US EU5 Japan Pharmerging Rest of World
$90Bn
$113Bn
$147-177Bn
CAGR 2011–2016: 7.9% Projected CAGR 2016–2021: 6–9%
Source: QuintilesIMS, MIDAS, Q4 2016, QuintilesIMS Institute, Mar 2017
27
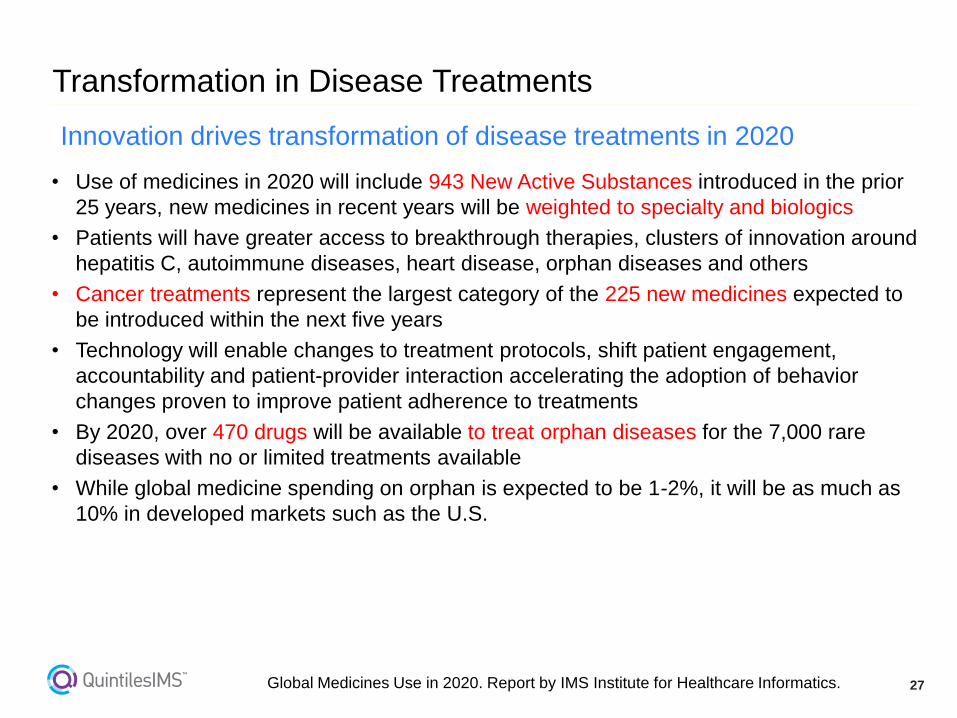
• Use of medicines in 2020 will include 943 New Active Substances introduced in the prior
25 years, new medicines in recent years will be weighted to specialty and biologics
• Patients will have greater access to breakthrough therapies, clusters of innovation around
hepatitis C, autoimmune diseases, heart disease, orphan diseases and others
• Cancer treatments represent the largest category of the 225 new medicines expected to
be introduced within the next five years
• Technology will enable changes to treatment protocols, shift patient engagement,
accountability and patient-provider interaction accelerating the adoption of behavior
changes proven to improve patient adherence to treatments
• By 2020, over 470 drugs will be available to treat orphan diseases for the 7,000 rare
diseases with no or limited treatments available
• While global medicine spending on orphan is expected to be 1-2%, it will be as much as
10% in developed markets such as the U.S.
Global Medicines Use in 2020. Report by IMS Institute for Healthcare Informatics.
Transformation in Disease Treatments
Innovation drives transformation of disease treatments in 2020
28
• The global pharmaceutical market: description and trends
• The global generic market trends
• Trends in new launches: innovator products and generic medicines
• Will the future generic medicines launches be sufficient to cope with the high
costs of new innovative medicines?
• Will future biosimilar launches balance the new high cost innovative medicines?
• Summary
Outline
29
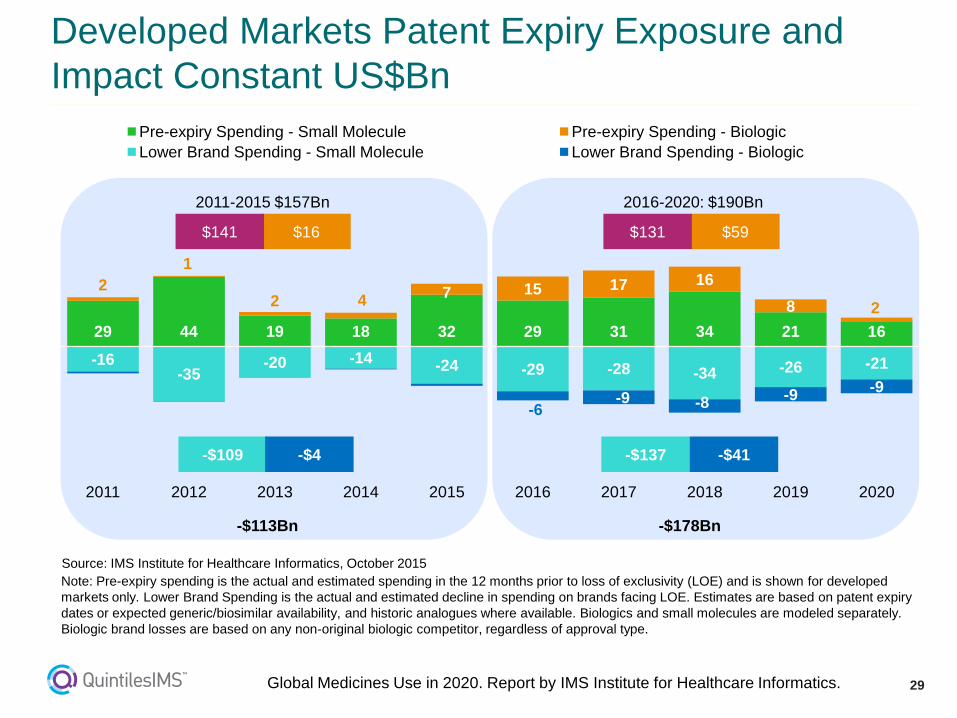
29 44 19 18 32 29 31 34 21 16
2
1
2 4 7 15 17 16
8 2
-16 -35
-20 -14 -24 -29 -28 -34 -26 -21
-6 -9 -8
-9 -9
2011 2012 2013 2014 2015 2016 2017 2018 2019 2020
Pre-expiry Spending - Small Molecule Pre-expiry Spending - Biologic
Lower Brand Spending - Small Molecule Lower Brand Spending - Biologic
Developed Markets Patent Expiry Exposure and
Impact Constant US$Bn
Source: IMS Institute for Healthcare Informatics, October 2015
$16 $59 $141 $131
-$109 -$137 -$4 -$41
2011-2015 $157Bn 2016-2020: $190Bn
-$113Bn -$178Bn
Note: Pre-expiry spending is the actual and estimated spending in the 12 months prior to loss of exclusivity (LOE) and is shown for developed
markets only. Lower Brand Spending is the actual and estimated decline in spending on brands facing LOE. Estimates are based on patent expiry
dates or expected generic/biosimilar availability, and historic analogues where available. Biologics and small molecules are modeled separately.
Biologic brand losses are based on any non-original biologic competitor, regardless of approval type.
Global Medicines Use in 2020. Report by IMS Institute for Healthcare Informatics.
30
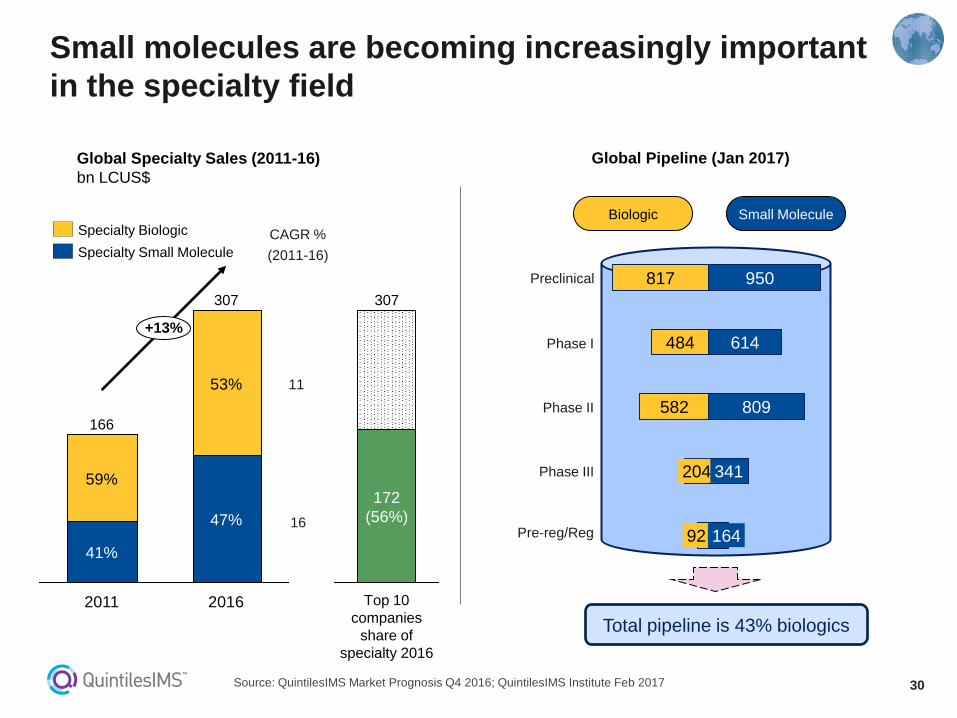
Small molecules are becoming increasingly important
in the specialty field
Source: QuintilesIMS Market Prognosis Q4 2016; QuintilesIMS Institute Feb 2017
Global Pipeline (Jan 2017)
92
204
582
484
817
164
341
809
614
950
Small Molecule Biologic
Pre-reg/Reg
Preclinical
Phase I
Phase II
Phase III
Global Specialty Sales (2011-16)
bn LCUS$
2016
307
+13%
166
41%
53%
2011
59%
47%
11
16
CAGR %
(2011-16)
Specialty Biologic
Specialty Small Molecule
Total pipeline is 43% biologics
Top 10
companies
share of
specialty 2016
172
(56%)
307

31
• The global pharmaceutical market: description and trends
• The global generic market trends
• Trends in new launches: innovator products and generic medicines
• Will the future generic medicines launches be sufficient to cope with the high costs of
new innovative medicines?
• Will future biosimilar launches balance the new high cost innovative medicines?
• Summary
Outline
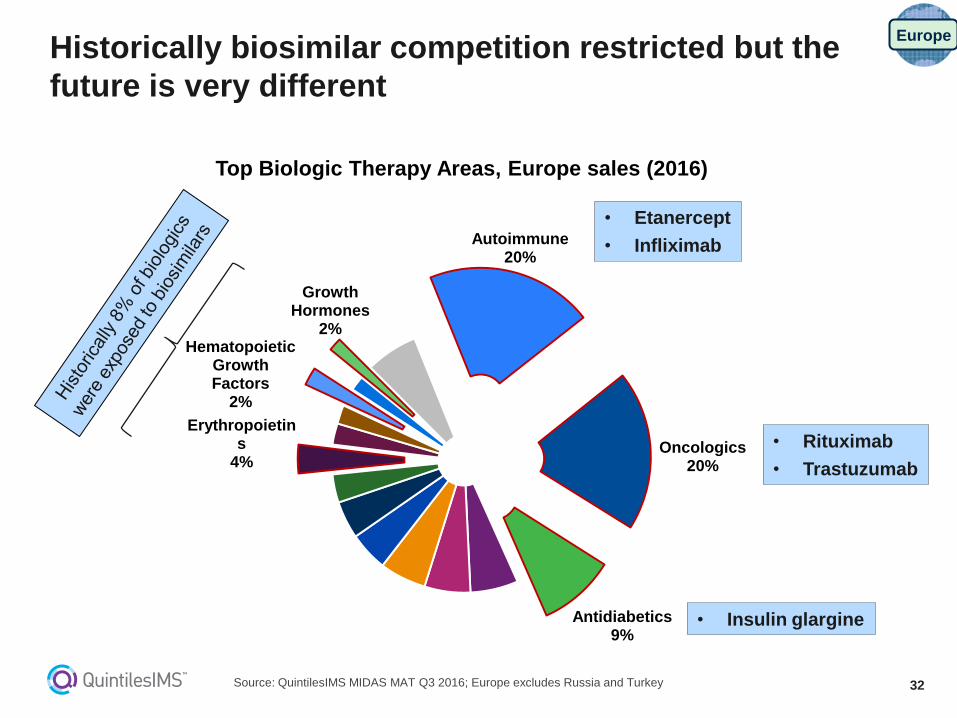
32
Historically biosimilar competition restricted but the
future is very different
Source: QuintilesIMS MIDAS MAT Q3 2016; Europe excludes Russia and Turkey
Autoimmune 20%
Oncologics 20%
Antidiabetics 9%
Erythropoietins
4%
Hematopoietic Growth Factors
2%
Growth Hormones
2%
• Rituximab
• Trastuzumab
• Etanercept
• Infliximab
• Insulin glargine
Top Biologic Therapy Areas, Europe sales (2016)
Europe
33
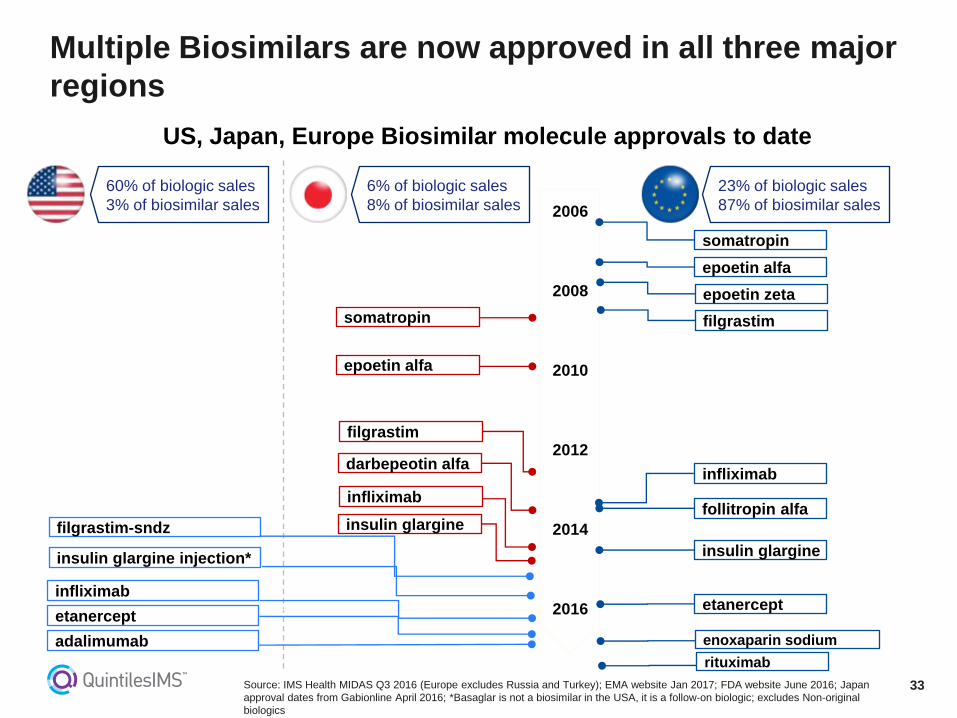
Multiple Biosimilars are now approved in all three major
regions
Source: IMS Health MIDAS Q3 2016 (Europe excludes Russia and Turkey); EMA website Jan 2017; FDA website June 2016; Japan
approval dates from Gabionline April 2016; *Basaglar is not a biosimilar in the USA, it is a follow-on biologic; excludes Non-original
biologics
2006
2008
2010
2012
2014
2016
insulin glargine
somatropin
epoetin alfa
epoetin zeta
filgrastim
infliximab
follitropin alfa
etanercept
filgrastim-sndz insulin glargine
infliximab
insulin glargine injection*
epoetin alfa
filgrastim
infliximab
darbepeotin alfa
somatropin
23% of biologic sales
87% of biosimilar sales
6% of biologic sales
8% of biosimilar sales
60% of biologic sales
3% of biosimilar sales
US, Japan, Europe Biosimilar molecule approvals to date
etanercept
adalimumab enoxaparin sodium
rituximab
34
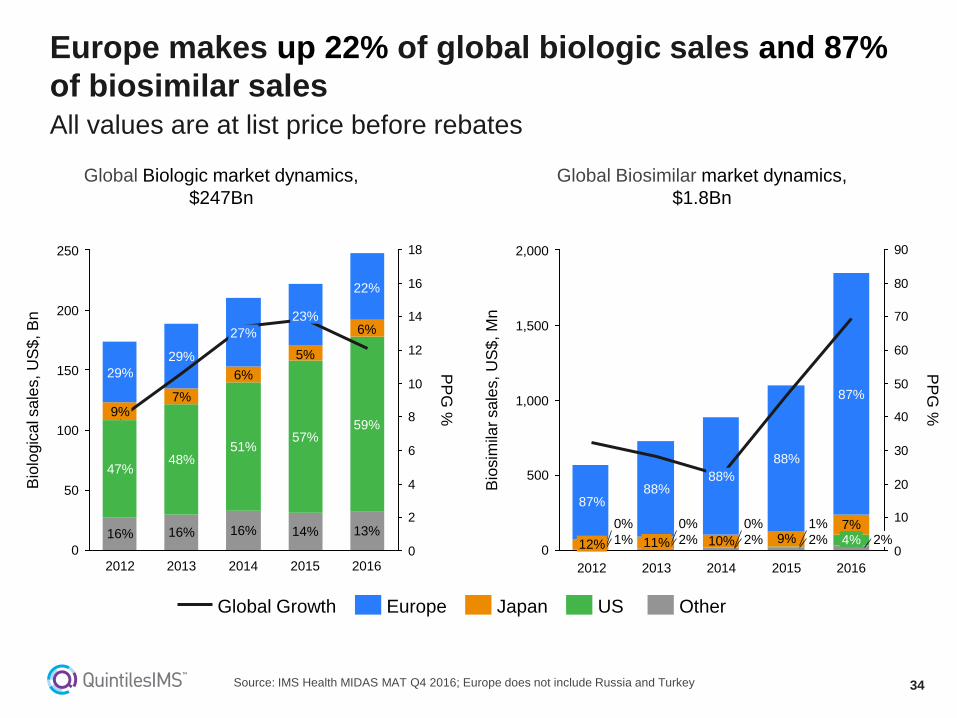
Europe makes up 22% of global biologic sales and 87%
of biosimilar sales All values are at list price before rebates
Source: IMS Health MIDAS MAT Q4 2016; Europe does not include Russia and Turkey
Global Biosimilar market dynamics,
$1.8Bn
Global Biologic market dynamics,
$247Bn
0
2
4
6
8
10
12
14
16
18
200
0
150
100
250
50
59%
6%
22%
2015
14%
57%
PP
G %
2016
13%
5%
23%
2014
16%
51%
6%
7%
29%
2012
16%
47%
9%
29%
27%
2013
16%
48%
Bio
logic
al s
ale
s, U
S$
, B
n
0
10
20
30
40
50
60
70
80
90
500
1,500
1,000
2,000
0
88%
2012
1%
0%
12%
87%
2013 2014
2%
0%
10%
88%
2%
0%
Bio
sim
ilar
sa
les, U
S$
, M
n
PP
G %
11% 9% 1%
2015
2%
88%
7% 4% 2%
2016
87%
Japan Europe US Global Growth Other
35
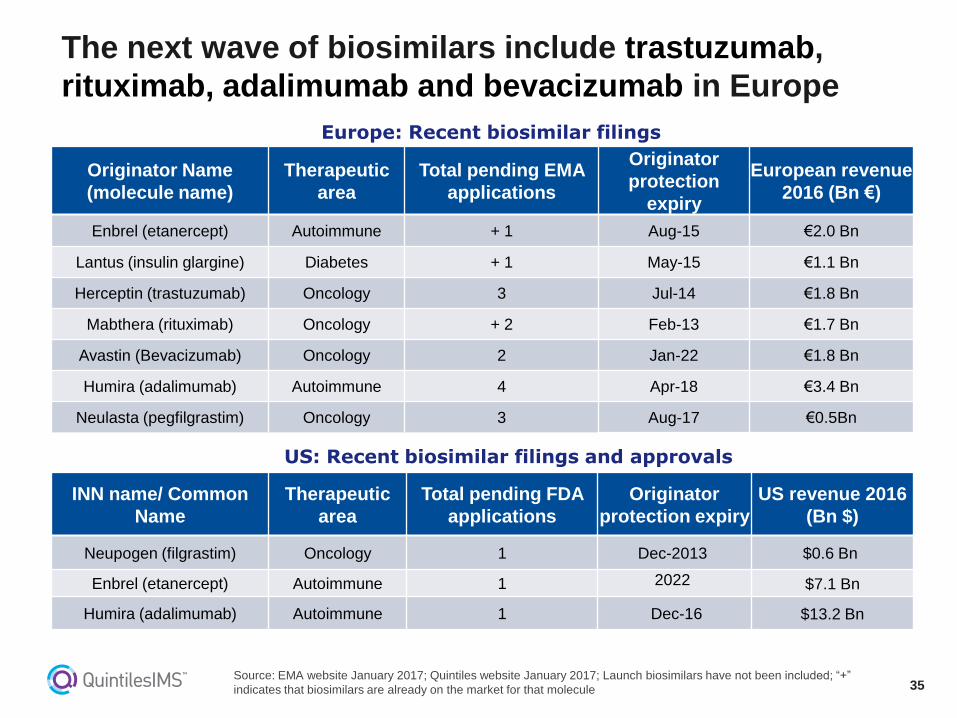
The next wave of biosimilars include trastuzumab,
rituximab, adalimumab and bevacizumab in Europe
Source: EMA website January 2017; Quintiles website January 2017; Launch biosimilars have not been included; “+”
indicates that biosimilars are already on the market for that molecule
Europe: Recent biosimilar filings
US: Recent biosimilar filings and approvals
Originator Name
(molecule name)
Therapeutic
area
Total pending EMA
applications
Originator
protection
expiry
European revenue
2016 (Bn €)
Enbrel (etanercept) Autoimmune + 1 Aug-15 €2.0 Bn
Lantus (insulin glargine) Diabetes + 1 May-15 €1.1 Bn
Herceptin (trastuzumab) Oncology 3 Jul-14 €1.8 Bn
Mabthera (rituximab) Oncology + 2 Feb-13 €1.7 Bn
Avastin (Bevacizumab) Oncology 2 Jan-22 €1.8 Bn
Humira (adalimumab) Autoimmune 4 Apr-18 €3.4 Bn
Neulasta (pegfilgrastim) Oncology 3 Aug-17 €0.5Bn
INN name/ Common
Name
Therapeutic
area
Total pending FDA
applications
Originator
protection expiry
US revenue 2016
(Bn $)
Neupogen (filgrastim) Oncology 1 Dec-2013 $0.6 Bn
Enbrel (etanercept) Autoimmune 1 2022 $7.1 Bn
Humira (adalimumab) Autoimmune 1 Dec-16 $13.2 Bn
36
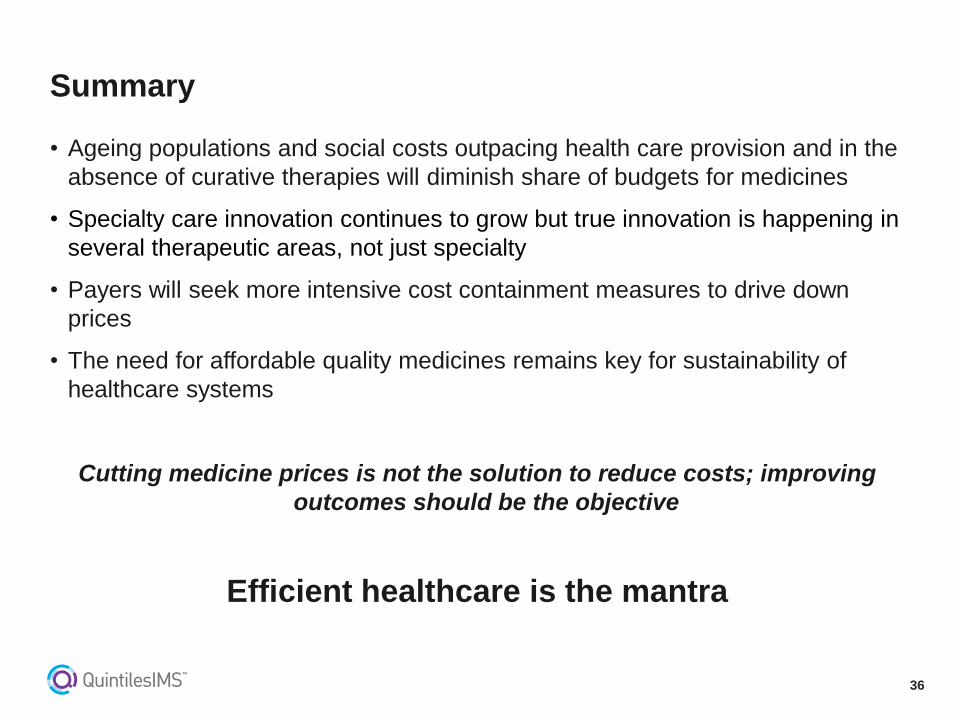
• Ageing populations and social costs outpacing health care provision and in the
absence of curative therapies will diminish share of budgets for medicines
• Specialty care innovation continues to grow but true innovation is happening in
several therapeutic areas, not just specialty
• Payers will seek more intensive cost containment measures to drive down
prices
• The need for affordable quality medicines remains key for sustainability of
healthcare systems
Cutting medicine prices is not the solution to reduce costs; improving
outcomes should be the objective
Efficient healthcare is the mantra
Summary