magnumold.magnum.co.in/magazinepdf/april 2010.pdf · · 2014-12-10with the end of march the...
TRANSCRIPT

D e c e m b e r April 2010
Magnum
1
Magnum ConnectIssue No. V April 2010
Monthly Magazine
Subscription :-Cover Price: Rs 30/-Annual Subscription (12 issues) : India Rs 300/-Overseas (Airmail) US$ 150(Cheque/D.D. drawn on Mumbai in favour of
Magnum Wealth Management Pvt. Ltd.Regd. Office :Mr. Piyush K. Upadhyay (Correspondent)Magnum ConnectD-13, Empire Mahal, 806, Dr. B. A. Road,Khodadad Circle, Dadar T.T.,Mumbai – 400 014.For General Enquiries Contact :+91-22-2415 8686E-mail : [email protected] : www.magnum.co.inPrinted at : HariOM Printers, Mumbai.
Dear Friends,
With the end of March the financial year has ended. Though the month was full of volatility, the markets managed splendid gains for the financial year. The rally that started after the budget is continuing undeterred and the foreign institutional investors are showing their enduring faith in the Indian markets. The Indian markets have emerged as the best performers among the BRIC nations as well as developed markets across the globe, by giving returns of about 115 per cent in the concluding fiscal. Overall, the month has been good for markets across the globe and not only the Indian indices but the US as well as some European and Asian markets are trading to their more than a year high. Though, theses indicators have fuelled concern that markets are continuously rising and might be heading for a correction, but the case might not be the same and the markets can scale new heights to pre-Lehman era.
India’s industrial production continued its upward journey and the Index of Industrial Production (IIP) registered a growth of 16.7% in the month of January, as compared with 17.6% in the previous month. Indian economy seems robust. Though, the Prime Minister Dr Manmohan Singh repeated that achieving the double digit growth rate would need the country doubling its investment in infrastructure over next five years. The government has set a target of raising infrastructure investment to 9% of the gross domestic product (GDP) by 2014 from 5% in 2008-09.
The Indian equity markets have presented a good opportunity and the FIIs are keeping their faith intact. The gains for the last fiscal have been broad-based and some of the sectors have performed exceptionally well and are showing great sign of recovery after a lull of recessionary phase. Aviation is one of the sectors that have begun to improve and the industry has seen strong rebound over the second half of FY10. We are covering the sector anticipating it to be a potential performer of the coming days.
Jayesh R. Dedhia(Director)
Magnum Group
This document has been prepared by M/s Magnum Wealth Management Pvt Ltd and is being distributed in India byM/s. Magnum Wealth Management Pvt Ltd a registered broker dealer. The information in the document has been compiled by the research department.
Due care has been taken in preparing the above document. However, this document is not, and should not be construed, as an offer to sell or solicitation to buy anysecurities. Any act of buying, selling or otherwise dealing in any securities referred to in this document shall be at investor’s sole risk and responsibility.
This document may not be reproduced, distributed or published, in whole or in part, without prior permission from the CompanyM/s. Magnum Wealth Management Pvt Ltd
Subject only to Mumbai jurisdiction
IndexCover Story Aviation..............................................................2 Economic Analysis ............................................5Equity
Company Research........................................... 8 Stock Update.................................................... 10Corporate News................................................ 11Market Snapshot............................................... 13
EconomyEconomy News................................................. 15
StatisticsDividend Yield..................................................17Sales................................................................18 High PE ........................................................... 19Low PE ............................................................ 20 Price Trend...................................................... 21
Mutual FundMutual Fund Analysis....................................... 22MF Scorecard................................................... 23
StudyNew Tax Slab: Beneficial or not ........................25Money Market ................................................... 28Yuan Appreciation.............................................. 30
CommodityCommodity Watch ........................................... 32
InsuranceLife Insurance .................................................. 34General Insurance ........................................... 35

D e c e m b e r April 2010
Magnum
2
Cover Story - Aviation
India has one of the fastest growing aviation industries in the world. With the liberalization of the Indian economy in early 1990s, aviation industry in India underwent a rapid transformation and saw strong growth in first decade of twenty-first century. From being primarily a government-monopoly, the industry is now dominated by private players which account for around 80% of the domestic market.
The global financial crisis that started in September 2008 and the following slowdown in world economy hit the aviation industry across the world. Indian carriers too had their share of troubles. But as the Indian economy recovered rapidly from the trough witnessed in the December quarter of 2008, demand for aviation industry too has begun to improve and the industry has seen strong rebound over the second half of FY10.
Industry Background India’s civil aviation industry was largely a government monopoly with Air India and Indian Airlines dominating Indian skies till early 1990s. However, the industry was, like many of its peers, increasingly deregulated under the liberalization drive the government of India launched in 1991. The entry of private players and rapid economic growth in post reform period precipitated the boom for domestic and international passenger carriers. The industry started growing rapidly in the last decade and domestic passenger traffic registered an average annual growth of more than 30% during FY03-FY08. Annual domestic passenger traffic increased from 14.5 million to nearly 45 million in the five years, making India home to one of the fastest growing aviation industries in the world.
Growth was also accompanied by substantial structural changes in the market. The one time monopolist, government run Indian Airlines was pushed to third position in the domestic business while the Jet Airways and Kingfisher took the first two slots. Together, the two companies with their low cost subsidiaries account for close to half of the domestic aviation market share.
With competition intensifying and costs beginning to rise, the year 2007 witnessed a host of consolidation activity. The two public airlines- Air India and Indian Airlines – were brought under one company namely National Aviation Company of India Ltd. The UB Group promoted Kingfisher bought majority stake in the low cost carrier Air Deccan, taking the parent company to inches behind the market leader Jet Airways which too had a little earlier taken over Sahara Airlines.
Current Scenario Fast track growth of aviation industry came to a halt over the 2008-09 fiscal. In the first half of the FY09 global
commodity rally and resulting surge in crude prices shattered the cost fundamentals of industry pushing the carriers deep into the red, even as air-traffic was still growing. The worst came in second half, as the global economic downturn hit the demand side of the industry. While the waning commodity rally opened doors to sharp decline in fuel prices and related costs, air-traffic numbers fell even more sharply and load factors dropped substantially and the industry suddenly started looking hugely over capacitated.
The carriers took a slew of cost cutting measures to counter the sharp downturn and rising losses. The industry grounded the spare capacity and initiated massive route rationalisation and was able to lower the cost of operations in a significant way.
Things started to improve slowly as the industry entered into FY10. With the Indian economy recovering rapidly riding on the fiscal and monetary stimulus packages, demand for aviation too started improving. Air-traffic numbers had turned back into positive by middle of calendar year 2009 and business atmosphere improved continuously in the second half of 2009. At present the industry is in a fast track recovery mode and with Indian economy rushing back towards the high growth trajectory witnessed in the pre-crisis period, things have started to look good for the aviation industry.
Domestic Scenario Air-traffic surges in H2-FY10 After going down for several months, air traffic started improving from June 2009 onwards. The recovery consolidated in next few months and the industry had a very good December quarter with domestic passenger traffic growing at 30% year-on-year to 12.5 million. Passenger loads in the quarter, which is generally considered a peak season, remained around the mid-seventies mark on an average, a breakeven point for most airlines.
64.7674.24
3.33 3.86
01020304050607080
(No.
of
Mill
ions
)
Apr-Feb 09 Apr-Feb 10 Feb--09 Feb--10
Domestic Air Traffic

D e c e m b e r April 2010
Magnum
3
Cover Story - Aviation
Air traffic continues to remain strong in 2010 as well with total passengers flying on domestic airlines registering a growth of 15.7% in the month of February 2010 to 38.63 lakh compared with 33.36 lakh passengers in the same month a year ago.
There was a decline in the traffic on monthly basis for second consecutive month though. The total number of passengers carried by domestic airlines in the month of January, 2010 was 40.87 lakh and that in December was 44.87 lakh. However, this was only expected as traditionally the Jan-March quarter is considered a lean season for air traffic.
On a cumulative basis, the number of passengers carried by domestic airlines in first two months of this year is 19% higher at 80.56 lakh, as against 67.61 lakh in the corresponding period of year 2009, a sign of the sustained recovery.
Cross-section trends Jet Airways continued to be the market leader with a share of 26.1% in the domestic segment. Kingfisher Airlines’ followed closely behind with a total market share of 22.7%. National carrier Air India ranked third with a share of 17.2%. Over the month under review, Jet and Kingfisher added 90 bps and 50 bps respectively to their market shares while the national carrier lost 80 bps in the share.
In the low-cost space, IndiGo has maintained it top position with a share of 14.9%. SpiceJet is placed second with a market share of 12%. Both the top players in no-frills category however lost market share by 30 and 20 bps respectively. The Mumbai-based budget carrier GoAir improved its share slightly to 5.5%. Paramount managed only a small market share of 1.6%.
Low cost carriers had gain a lot of share from the mainstream ones after the downturn begun and market
became extremely price sensitive. However, in the near term, as the Indian economy accelerates swiftly, and outlook strengthens, some correction in trend may be possible.
All the airlines kept a healthy seat factors keeping in mind the lean season. In the mainstream carriers, Kingfisher led the pack with 75.9% seat factor while Jet followed at second spot with 75%. National carrier had to contend with the last position here too at 72% load factor. In the low cost segment, Paramount remained on top with 85.2% load factor. IndiGo and SpiceJet had load factors of 83% and 81.1%.
Capacity trend shows strong revival As stated earlier, the problem of over capacity was dealt with aggressively by the industry with airlines grounding excess aircrafts and undertaking a lot of route rationalisation. The improvement in passenger traffic numbers witnessed over last 2-3 quarters however helped the industry push up volumes while cost control measures put in place.
The overall demand scenario improved significantly as the outlook of Indian economy improved and as a result, the industry that was cutting capacity till June 2009,
Market Share of Airlines (%) (Feb 2010) 1.6
22.7
26.114.9
5.5
12
17.2
Paramount
Kingfisher
Jet Airways
IndiGo
GoAir
SpiceJet
Air India
72
78
83
75 75.9
85.2
81.1
air I
ndia
Go
Air
Indi
Go
JetA
irway
s
King
fishe
r
Para
mou
nt
Spic
eJet
Load Factors of Airlines (Feb 2010)
ATF Prices in India
01000020000300004000050000600007000080000
Jan-0
5
Apr-
05
Jul-05
Oct-
05
Jan-0
6
Apr-
06
Jul-06
Oct-
06
Jan-0
7
Apr-
07
Jul-07
Oct-
07
Jan-0
8
Apr-
08
Jul-08
Oct-
08
Jan-0
9
Apr-
09
Jul-09
Oct-
09
Jan-1
0
Apr-
10
(Rs p
er
KL)

D e c e m b e r April 2010
Magnum
4
Cover Story - Aviation
started adding incremental capacity from July. In fact, an analysis of capacity as reflected in available seat per kilometre (ASKM ) and demand as reflected in revenue per seat per kilometre (or RPKM) shows that the airlines started increasing capacity right from July, a month after the demand growth came back into the positive territory, clearly indicating better utilisation of aircraft capacity. Over the December quarter the airlines kept a healthy capacity utilisation rate despite adding about 9% to their capacity as domestic traffic surged 29%.
The trend has continued into 2010. Although the growth rate of capacity and demand both slowed down in the current quarter, primarily due to Jan-March period being the leaner period for the aviation industry, both remains in the green territory, indicating continued expansion.
Fuel costs rise While the industry has been posting significant improvements in wake of rising demand and improving economic outlook, fuel cost, which makes for 40% of the total operational cost for aviation, has been raising some difficulties. After declining for almost all the second half of FY09, ATF prices started increasing rapidly in current fiscal and increased by around 40% from the low witnessed in February. Prices softened to some extent by start of 2010, but have again risen by 7.3% within last one month.
Nonetheless, ATF is still costing substantially below what it cost during the commodity rally in 2008. If the crude prices continue to hover in the range of $70-80 per barrel, ATF prices will remain comfortable for the airlines. It is only when the crude increases beyond the $85 or $90 mark that the jet fuel prices start pinching airlines too much. Also, with increasing demand, in wake of improving overall economic scenario, we expect the airlines to enjoy much better pricing power than what these had a year ago and therefore ATF prices do not seem to pose an immediate threat to carriers.
International Scenario Improves Aviation industry across the global had one of the worst years in 2009, although things started to improve towards the end of the year. According to the data compiled by the International Air Transport Association (IATA), scheduled air traffic worldwide fell by 3.5% Y/Y in 2009 which was the largest decline since the Second World War years.
In terms of demand, 2009 goes into the history books as the worst year the industry has ever seen as it lost 2.5
years of growth in passenger markets and 3.5 years of growth in the freight business.
However, things started to improve towards the end of 2009 with traffic beginning to improve at a good pace. The trend has continued in 2010 as well. According to the IATA, passenger demand was up 9.5% in February 2010 compared to same month a year ago while the cargo demand showed annual growth of 26.5%.
The association hailed the gains but added that February 2009 marked the bottom of the cycle for passenger traffic during the global economic recession and therefore some base effect is also being reflected in the growth. Nonetheless, IATA believes that the global aviation industry is moving in the right direction and in next few months it should be back to the pre-recession traffic levels.
Outlook Aviation industry has seen a strong recovery in recently months. While the fiscal 2008-09 was a disaster for the sector which recorded a year-on-year deceleration for the first time since 2002, passenger volumes started to improve since middle of 2009. By keeping capacity in check despite improvement in demand and riding on relatively stable fuel prices, airlines have been able to improve margins significantly.
As such, the tide seems to have finally turned for the industry. The industry that was struggling this time around last year on woes of overcapacity is now reporting a strong passenger growth. Riding on the improving condition, a number of carriers turned cash positive in the December quarter.
Load factors have been increasing in recent months and with overall improvement in economy we expect demand to continue remaining firm in coming quarters. Cost side too has remained within reasonable standards and although ATF prices have increased significantly from lows witnessed in February, they are still way below the peaks touched during the August 2008.
While there may be further upside in the cost as global economy recovers and crude prices firm up, the increased demand should provide added pricing power to offset increase in costs. As long as crude prices do not rally too much and the industry is able to stay away from temptations to add too many aircrafts in near term, consistent profitability could become a reality in next few quarters.

D e c e m b e r April 2010
Magnum
5
On Growth, Inflation and Monetary policy The process of monetary policy normalisation by the Reserve Bank of India (RBI) has started to gather momentum with a mid-cycle move that saw the Indian monetary authority raising its benchmark policy rates repo, the rate at which it infuses short term liquidity into the markets and reverse repo, the rate at which commercial banks park surplus liquidity with it, by 25 basis points (bps) each.
The move came as a surprise to many given that the RBI had itself stated after the January policy review that it would like to act only on planned policy reviews and not between them, as it would bring more transparency in monetary policy. It did however maintain that mid-cycle actions may still be taken if variables of the interest (mainly inflation and growth) took a significantly different trajectory than what it expects.
Industrial Growth India’s industrial production has showed strong growth in last few months riding on exceptional bullishness seen in the manufacturing activity. Following the RBI’s January policy review IIP data touched 20 year high of 17.6% for December (the data was released in February, after policy review by RBI). The figure was nearly repeated for January as well. Though, given the fact that the RBI had put its baseline projection for the full fiscal growth rate at 7.5%, it must have already factored in strong industrial growth. Nonetheless, such a huge numbers were certainly major upside surprise to both government and industry and both began to talk of possible over-hearting of the economy in near term if the accelerators were kept pressed.
In order to better understand the growth in industrial production, we have plotted the seasonally corrected monthly figures for last four years in Chart 2. A glance at the Chart makes it clear that after strong performance in FY07 and for most part of the FY08, growth in IIP started slowing down towards end of 2007-08 and turned very flat in FY09, even recording negative annual numbers in some of the months. The trend continued till May 2009, after which IIP growth suddenly picked up, and has maintained overall growth trend so far.
Further, the chart also shows that the strong growth is composed of both, actual growth and base effect. Since the IIP was flat last fiscal, even the months like July and November in current fiscal recorded growth when actually, on a sequential basis, the IIP was flat. January was another similar month, when actually the production was flat, but since there was no growth at all last year, even a relatively lower (332.3 for January against 334 for December) showed substantial growth when compared
Economic Analysis
Chart I: Industrial Production
-5
0
5
10
15
20
25
Feb-
-08
Apr--
08
Jun-
-08
Aug-
-08
Oct--
08
Dec-
-08
Feb-
-09
Apr--
09
Jun-
-09
Aug-
-09
Oct--
09
Dec-
-09
(% c
hang
e Y/Y
)
General Index
Manufacturing
Chart 2: Seasonaly Adjusted Movement in IIP (Base: 1993-94 = 100)
230240250260270280290300310320330
Apr May Jun Jul Aug Sep Oct Nov Dec Jan Feb Mar
FY07
FY08
FY09
FY10

D e c e m b e r April 2010
Magnum
6
with last year’s figure. Clearly, even if there is no growth in coming months, that is, even if the industrial production remains flat, annual growth numbers will be substantially strong. However, from June onwards, the index started growing strongly in 2009 and therefore growth numbers will start to normalize from June 2010 onwards.
Further, a possible downside to industrial growth may come in case interest rates go up and demand moderates on account of increase in cost of finance. However, banks have comfortable level of liquidity at present and despite increase in repo, interest rates are not likely to go up significantly for another quarter yet.
This becomes clearer from the LAF operations of the RBI. Banks have been parking close to Rs 70,000 with the central bank under the reverse repo window weeks prior to the RBI’s January policy review. After the review, liquidity declined, expectedly in wake of a 75 bps hike in the CRR and size of the reverse repo window declined to around Rs 35,000 crore.
Latest data from the RBI suggest that the LAF window has contracted further with very little liquidity being parked with RBI in last one week. This however is a reflection of the advance tax outgo and within couple of weeks, the figure should increase to around Rs 30,000 crore.
Inflation
Along with improving growth, inflation too has been rising fast and has already touched nearly 10% for the month of February, way ahead of RBI’s projection of 8.5% for end-March 2010. The statement of the central bank that announced the mid-cycle rate hikes in March had inflation written all over the pages. For some time, RBI as well as
policy-makers had been saying that food inflation was more of a supply side problem and cannot be fixed with monetary instruments. The central bank also made very clear in its last monetary policy statement that in its policy decisions, core inflation (generally defined as non-food manufacturing inflation), plays a key role.
What happened in last couple of months is that while food inflation remained stubbornly higher close to 17%, and only started somewhat softening in most recent weeks, the core inflation in the economy has been picking up sharply. This is also expected only, given the kind of surge in industrial growth numbers that has been seen since June 2009.
While the headline annual WPI inflation for February touched 9.9%, comfortably breaching the central bank’s baseline projection of 8.5% by end-March 2010 set out in the third quarter review, the non-food manufacturing inflation (weight: 52.2% in WPI), turned from negative (-0.4%) in November 2009, to marginally positive (0.7%) in December 2009 and rose sharply to 2.8% in January 2010 and further to 4.3% in February 2010. Fuel price inflation also surged from (-) 0.8% in November 2009 to 5.9% in December 2009 and further to 10.2% by February 2010. The full impact of auto fuel price hike implemented in the General budget for FY11 is yet to be factored in and with rising demand side pressures, it is very likely that the WPI inflation will move into the double digits levels in March 2010.
Going Forward As is the case with the industrial production, it has been argued in case of inflation too that there is a strong low
Economic Analysis
Chart 3: Liquidity under Repo (+) and Reverse Repo (-) operations of RBI
-200000
-150000
-100000
-50000
0
50000
100000
2-A
pr-0
85-
May
-08
7-Ju
n-08
10-J
ul-0
812
-Aug
-08
14-S
ep-0
817
-Oct
-08
19-N
ov-0
822
-Dec
-08
24-J
an-0
926
-Feb
-09
31-M
ar-0
93-
May
-09
5-Ju
n-09
8-Ju
l-09
10-A
ug-0
912
-Sep
-09
15-O
ct-0
917
-Nov
-09
20-D
ec-0
922
-Jan
-10
24-F
eb-1
029
-Mar
-10
(Rs
Cro
re)
Chart - 4 Inflation Scenario
-5
0
5
10
15
20
25
Feb
-06
Jun-
06
Oct
-06
Feb
-07
Jun-
07
Oct
-07
Feb
-08
Jun-
08
Oct
-08
Feb
-09
Jun-
09
Oct
-09
Feb
-10
(% c
hang
e y/
y)
Core
Food
Note: Core inflation used here is defined as non-food manufacturing inflation Food inflation here includes manufatured foods like sugar

D e c e m b e r April 2010
Magnum
7
base effect from last year. Therefore, it will be interesting to see as to what extent the computed inflation is being driven by the base effect and what is the actual increase in prices. We have plotted the wholesale price indices for the core and food sectors in charts 5 and 6. The charts show in case of core inflation, most of the increase witnessed in last few months has come from the base effect, as the index was steeply declining in the same months a year ago. On the other hand, in case of food inflation, the high inflation has largely been owing to sharp increase in prices, as the index has been increasing sharply in the current fiscal, with relatively smaller role of the base effect.
Further, it can be seen that the sharp increase in core inflation that has been seen in recent months should start moderating as the base effect will start waning. Since RBI gives much more weight to the core inflation while charting its monetary policy, the deceleration in pace of increase in core inflation may provide it greater room to adjust it policies in a more calibrated manner rather than
Economic Analysis
rushing through the policy rates cycles in an attempt to be ahead of the curve. However, one aspect that can still push core inflation despite waning of base effect is that the impact of fuel price hike implemented late in February will be largely witnessed in March when manufacturers pass on the increase in cost of production and distribution owing to higher fuel prices.
In this wake, we expect the RBI to continue the process of normalisation of monetary policy further in the April review. Another policy hike by 25 basis points (bps) seems certainly on cards as it would be very difficult for the RBI to leave rates untouched with double digit inflation figure in hands.
Increase in CRR however will depend on the liquidity scenario. Although the RBI would like to curtail the liquidity in the system further to address the concerns regarding inflationary expectations, it will also need a reasonable liquidity to smoothly conduct the huge government borrowing plan.
As discussed, the liquidity is likely to have dried up on account of advance tax outgo and is expected to improve to around Rs 30,000 crore. While this will give the RBI more space to go with another 25 bps hike in CRR, the RBI will be cautious to ensure reasonable liquidity in the banking system. Also, keeping in mind the front loaded borrowing calendar released by the government, the level of liquidity in the system may just be comfortable rather than excessive. As such, while repo and reverse repo move is quite likely in forthcoming April review from the central bank, hike in CRR is relatively less likely in current environment.
Overall, the RBI looks set to continue the normalisation of its policy stance going forward. However, this is not likely to have any significant impact on growth as interest rates are unlikely to pick up. Also, the strong growth witnessed in industrial production is partly being contributed by the low base effect and therefore the RBI is unlikely to significantly change its plans on calibrated exit from accommodative stance in wake of high industrial growth numbers. Finally, while inflation is partly being contributed by base effect, and the pace of price rise in food prices seems to be softening, increase in fuel prices in late February is likely to cause another significant jump in core inflation.
Chart 5 : Price Index for Core Group
165
170
175
180
185
190
195
200
205
Apr May Jun Jul Aug Sep Oct Nov Dec Jan Feb Mar
FY08
FY09
FY10
Chart 6 : Price Index for Food Items
190200210220230240250260270280
Apr May Jun Jul Aug Sep Oct Nov Dec Jan Feb Mar
FY08
FY09
FY10

D e c e m b e r April 2010
Magnum
8
Company Research
SpiceJet - Buy Investment Overview • SpiceJet reported a net profit of Rs 108.95 crore for the
December 2009 quarter against a net loss of Rs 17.96 crore for the Q3 of FY09.
• Being low-cost carrier the airline is set to grow at a higher pace compared to the full service carriers.
• The approval from DGCA to fly on international routes is going to benefit the company in a big way and will also boost its volumes going forward.
• The stock currently trades at 1.27x its EV/EBIDTA, a discount of 96% compared to Jet Airways, which trades at 32.96x its EV/EBIDTA.
Stock Data (as on 01/04/10)
Current Mkt Price (Rs.) 57.90
52 week High (Rs.) 64.40
52 week low (Rs.) 13.85
Mkt Cap (Rs. Cr.) 1400.50
Return in last one Month (%) -4.46
Share Holding Pattern(as on Dec,09) %
Total Promoter 12.89
Institutions 22.19
Non Institutions 64.92
Key Ratios
P/E 71.78
Price/Book(x) -3.45
Dividend Yield (%) 0.00
ROCE(%) 102.35
ROE(%) 0.00
Business Overview SpiceJet, promoted by Royal Airways, is India’s most preferred Low Fare Airline, delivering the lowest air fares with the highest consumer value.
The airline currently operates 129 daily flights to 18 destinations all over India, including Ahmedabad, Bangalore, Bagdogra (Darjeeling), Chennai, Coimbatore, Delhi, Guwahati, Goa, Hyderabad, Jammu, Jaipur, Kochi, Kolkata, Mumbai, Pune, Srinagar, Varanasi and Visakhapatnam. Its new generation fleet of 19 Boeing 737-800 / 737-900ER aircraft are backed by cutting edge technology and infrastructure to ensure the highest standards in safety and operating efficiency.
The company’s on-time performance is amongst the best in the country and coupled with a Technical Dispatch Reliability of 99.6%, makes it an airline with the least cancellations.
Its market share witnessed a significant increase despite no major capacity induction during the quarter ended December 31, 2009, moving up to 12.5% from 10.5% during the corresponding quarter of the last fiscal. The strong performance comes on the back of better aircraft utilization. SpiceJet consistently carried more passengers per departure than any of its competitors, which indicates customer preference in the airline’s favour.
Financial HealthThe airline’s net turned positive during the October-December 2009 quarter compared to the year ago period.
Net sales for the reporting quarter grew at 35.93% to Rs 642.08 crore from Rs 472.35 crore for the October-December 2008 quarter. Total income for the quarter under review stood at Rs 653.39 crore, up 23.75% over Rs 528.01 crore reported for the same quarter last fiscal.
Its profit before depreciation and tax (PBDT) increased to Rs 110.89 crore during the December 2009 quarter from Rs 3.76 crore for the December 2008 quarter, up 2849%. Operating profit margin for the quarter stood at 17.53%, up by whopping 1523 basis points (bps) compared to 2.30% recorded in the corresponding previous quarter.
For the nine months ended on December 31, 2009, the company posted a net profit of Rs 34 crore against a net loss of Rs 344.74 crore for the same period last fiscal. Turnaround in the bottom line was underpinned by 27% growth in the top line of the airline. Its net sales for the year to date period stood at Rs 1,615.93 crore as compared to Rs 1,272.72 crore for the corresponding period of FY09.
The airline’s PBDT for the Apr-Dec’2009 period including prior period adjustments turned positive to Rs 43.75 crore from a negative figure last fiscal. It posted a cash EPS (earnings per share) of 4.60 for the December 2009 quarter.
Latest Developments• SpiceJet is looking to induct nine more aircraft by 2012. It
plans to raise around $50-75 million to fund its expansion initiatives. Besides this, the company is also considering revising its fares upward by 10%.
Performance in the last year
05
1015202530354045
2-M
ar-0
9
2-A
pr-0
9
2-M
ay-0
9
2-Ju
n-09
2-Ju
l-09
2-A
ug-0
9
2-S
ep-0
9
2-O
ct-0
9
2-N
ov-0
9
2-D
ec-0
9
2-Ja
n-10
2-Fe
b-10
2-M
ar-1
0

D e c e m b e r April 2010
Magnum
9
Particulars Dec. Qtr-09 Dec. Qtr-08 Growth % FY08 FY07 Growth%Net Sales 642.09 472.35 35.93 1689.45 1294.99 30.46Total Income 653.39 528.01 23.75 1438.58 748.28 92.51Other Income 11.30 55.66 -79.69 124.09 143.59 -13.58PBT 108.95 1.95 5484.16 -330.47 -131.08 -152.10PAT 108.95 0.82 13202.44 -333.79 -133.51 -150.01EPS (Dil) 4.52 -0.71 - -5.55 -3.72 -
Company Research
• Debt-ridden Dubai World’s investment arm -- Istithmar World Capital -- exited the Delhi-based low cost air carrier in February 2010 by offloading its entire 13.4% stake in the latter through two block deals for a total consideration of Rs 160 crore.
• Recently, the airline introduced two direct sectors viz Ahmedabad-Kolkata and Kolkata-Hyderabad in its summer schedule for this year.
• It has received an in-principle approval from the Directorate General of Civil Aviation (DGCA) to launch flights on international routes. The company now awaits the Civil Aviation Ministry’s nod for the route allocation. The airline is likely to start overseas operations in June 2010.
Industry ScenarioIndian aviation industry, much like its global counterparts, had a difficult year in FY09. In the first half of the FY09 global commodity rally and resulting surge in crude prices shattered the cost fundamentals of industry pushing the carriers deep into the red, even as air-traffic was still growing. The worst came in second half, as the global economic downturn hit the demand side of the industry. While the waning commodity rally opened doors to sharp decline in fuel prices and related costs, air-traffic numbers fell even more sharply and load factors dropped substantially resulting in huge over-capacity in the industry.
However, things started to improve slowly as the industry entered into FY10. With the Indian economy recovering rapidly riding on the fiscal and monetary stimulus packages, demand for aviation too started improving. Air-traffic numbers had turned back into positive by middle of calendar year 2009 and business atmosphere improved continuously in the second half of FY10.
Aviation industry has seen a strong recovery in recent months. While the fiscal 2008-09 was a disaster for the sector which recorded a year-on-year deceleration for the first time since 2002, passenger volumes started to improve since middle of 2009. By Keeping capacity in check despite improvement in demand and riding on relatively stable fuel prices, airlines have been able to improve margins significantly.
As such, the tide seems to have finally turned for the industry. The industry that was struggling this time around last year on woes of overcapacity is now reporting a strong passenger
growth. Riding on the improving condition, a number of carriers turned cash positive in the December quarter.
While there may be further upside in the cost as global economy recovers and crude prices firm up, the increased demand should provide added pricing power to offset increase in costs. As long as crude prices do not rally too much and the industry is able stay away from temptations to add too many aircrafts in near term, consistent profitability could become a reality in next few quarters.
Investment RationaleThe overall demand in the domestic industry has been strong during the last 6 months. While industry demand was up 30% in the December 2009 quarter versus 2008, SpiceJet has seen a 55% rise in traffic in the same period. This clearly demonstrates that consumers have appreciated the airline’s service enhancements, improved connectivity, low cancellation rates and high on-time performance.
The seat factor of the airline stood at 82.1% and 81.3% during January and February, respectively which is one of the highest figures reported by the domestic air carriers.
SpiceJet is likely to commence its international operations in June 2010 with flights to - Kathmandu, Colombo and Dhaka. It has also received DGCA’s nod for flying on international routes.
The company is expected to take delivery of four new aircraft by the end of this year and three new planes by next year.( is looking to induct nine more aircraft by 2012, it plans to raise around $50-75 million to fund its expansion initiatives.)
Following the global economic slowdown, there has been clear shift of passengers from Full Service Carriers (FSCs) like Jet Airways, Kingfisher to Low-Cost Carriers (LCCs). LCCs have registered steepest increase in market share as compared to other airlines in the past few months.
At CMP of Rs 57.90, the stock is trading at an EV/EBIDTA of 1.27x, a huge discount of 96% compared to Jet Airways, which is currently trading at 32.96x its EV/EBIDTA. The nod from DGCA to SpiceJet to launch flights on international routes is going to be a big value booster for the stock considering the fact that it operates on low cost model and can offer discount of around 20% on tickets for foreign destinations compared to the FSCs. The scrip currently trades at a P/E multiple of 71.78x. We would recommend a BUY in the stock with a short-term price target of Rs 64.50 and a long-term price target of Rs 80.
(Rs. Cr.)
Standalone

D e c e m b e r April 2010
Magnum
10
Stock Update
F Kingfisher Airlines, a part of the UB Group - the brewery and liquor giant, is India’s first and only 5-Star airline and the only carrier to offer a premium first class service on domestic routes.
F Besides being the first and only airline in India to offer in-flight entertainment on every seat, it offers LIVE TV with 16 channels of live and exciting content.
F It operates 350 flights a day, connecting 70 cities, including seven international destinations. The airline has 67 aircraft -39 Airbus and 28 ATRs -and commands a market share of 22.7%.
F For the third quarter of FY10, the company had posted a net loss of Rs 419.96 crore as compared to Rs 413.39 crore for the year ago period. Net sales for the reporting quarter declined by 6.59% to Rs 1,352.46 crore from Rs 1,447.83 crore for the corresponding previous quarter.
F The airline has outlined plans to reduce its debt and has asked US-based consulting firm Seabury to draw up a five-year business plan to help restructure its operations and improve its performance.
F The company recently launched its first flight on New Delhi - London route and it will also be launching flights to four more international destinations out of New Delhi and three more international destinations out of Mumbai over the next couple of weeks.
F The new routes schedule include New Delhi - Hong Kong from April 7, New Delhi - Bangkok from April 17, New Delhi - Dubai & New Delhi - Kathmandu from April 24, Mumbai - Bangkok from April 7 and Mumbai - Dubai & Mumbai - Kathmandu from April 24.
F In 2008, the company had announced an alliance with Jet Airways to reduce operational cost, which has not yet materialised fully. Under the plan, the two airlines were to support each other in eight specific areas. They have already tied up for sharing of ground handling services, parts and airport equipments while the alliance for routes and customers sharing is yet to take off. Once the plan gets ground, it will be beneficial for both the airlines.
F Besides, it is likely to be benefited from recent launch of a new door-to-door express cargo delivery service -- Kingfisher Xpress.
Last Traded Price (as on 01/04/10) Rs 46.95Price target Rs 54.75Market cap. (Rs cr.) 1,24852 Week H/L 73.45/ 33.40Free Float 33%BSE code 532747
Kingfisher Airlines: Buy
F Jet Airways is one of the fastest growing airlines in the world. It currently operates a fleet of 89 aircraft, which includes 10 Boeing 777-300 ER aircraft, 12 Airbus A330-200 aircraft, 53 next generation Boeing 737-700/800/900 aircraft and 14 modern ATR 72-500 turboprop aircraft. With an average fleet age of 4.66 years, the airline has one of the youngest aircraft fleet in the world. The company along with Jet Lite in enjoys 26.1% market share, which is the highest among domestic carriers.
F The airline (including its all-economy, no-frills Jet Airways Konnect service) operates over 380 flights daily.
F Jet was the first private carrier to launch international operations after the government opened up international routes in 2003-04. At present, it flies to 20 international destinations.
F The company swung to a profit of Rs 105.80 crore during the quarter ended December 31, 2009 from a loss of Rs 214.18 crore in the same quarter of last fiscal. The last time profit crossed Rs 100 crore was in the March quarter of 2006. Total income for the quarter stood at Rs 2,936.42 crore, down 4.13% from Rs 3,063.07 crore in the corresponding previous quarter.
F Its operational margin or EBITDAR (Earnings Before Interest, Taxes, Depreciation, Amortization and Rent) for the latest quarter increased by 99.50% to Rs 713.6 crore from Rs.357.7 crore for the Q3 of FY09.
F Jet Airways initiative of introducing Jet Airways Konnect service in May 2009 contributed to its strong performance, registering average load factors of 75.9% for the quarter.
F It registered strong growth of 21.7% and 30.5% in its domestic and international operations, respectively in February 2010 against the same month last year. This was the fifth successive month of robust growth for the company.
F Its seat factor for international operations stood at 82% for the month under review. The airline has been sustaining its seat factor for its international operations at over 80% for five consecutive months.
F Going forward, the company is likely to benefit from its low cost operator -- Jet Lite -- and all-economy service -- Jet Airways Konnect -- as most of the passengers are preferring low cost carriers (LCCs) for air travel rather than full service carriers as seen in the past few months.
Last Traded Price (as on 01/04/10) Rs 472.65Price target Rs 525Market cap. (Rs cr.) 4,08052 Week H/L 605.95/ 165.00Free Float 20%BSE code 532617
Jet Airways: Buy
67%
12%
21%
Promoters Institutions Non-Institution
16%
4%
Promoters Institutions Non-Institution
80%

D e c e m b e r April 2010
Magnum
11
Corporate News
Bharti Airtel inks $10.7 billion deal with Zain Asia’s leading telecommunications service provider -- Bharti Airtel -- has entered into a legally binding definitive agreement with the Zain Group to acquire its African business based on an enterprise valuation of $10.7 billion. Under this deal, the company will acquire Zain’s African mobile services operations in 15 countries with a total customer base of over 42 million. Following this acquisition, the Indian telecom major will emerge as the world’s fifth-largest mobile phone operator by subscriber base with total customer count of 179 million in 18 countries. Besides, the company’s network will cover over 1.8 billion people - the second largest population coverage among telcos globally. Edelweiss Capital’s arm gets certificate of registration from NHB Edelweiss Capital’s wholly-owned subsidiary -- Edelweiss Housing Finance -- has received the certificate of registration from the National Housing Bank (NHB) to carry on the business of a housing finance institution.Recently, Edelweiss Securities and Edelweiss Investments & Finance, the subsidiaries of the company, entered into an agreement for acquiring 100% of the paid-up share capital of Anagram Capital (ACL) for a consideration of Rs 164 crore in an all-cash deal.Punj Lloyd to offload its entire holding in Pipavav Shipyard Punj Lloyd has decided to sell its entire stake in Pipavav Shipyard to SKIL Infrastructure and SKIL Shipyard Holding. The company currently holds 19.43% stake in Pipavav Shipyard.It has inked a share purchase agreement with SKIL Infrastructure and SKIL Shipyard Holding for the same. The stake will be sold in two tranches for a total consideration of around Rs 656.46 crore. Following completion of this deal, the acquirers will make an open offer for additional 20% stake in Pipavav.IDBI Bank’s subsidiary gets SEBI nod to start MF operations IDBI Bank’s wholly-owned subsidiary, IDBI Asset Management, has received final approval from market regulator Securities and Exchange Board of India (SEBI) to launch mutual fund (MF) operations. The AMC is planning to launch its products across the equity and fixed income category, soon. IDBI Bank already has an established presence through its wholly-owned subsidiaries in businesses like capital market operations, home finance, etc. Also, the bank has an established presence in the life Insurance business through its joint venture (JV) IDBI Fortis Life Insurance Company. The launch of the AMC for MF operations would further strengthen the group’s presence and is a step forward towards becoming a financial services
conglomerate.Bharti Airtel moves one step closer to clinch a deal with Zain Bharti Airtel has inched closer to acquire African operations of Zain as the latter’s board has given its nod for the said deal. The telecom major was in exclusive talks with Zain for the acquisition of its African unit -- Zain Africa BV -- based on an enterprise value of $10.7 billion.The deal will help Bharti to emerge as the seventh largest telecom player in the world by subscriber base. The combined entity will have revenues of around $13 billion and EBITDA of $5 billion. Recently, the company tied up $8.3 billion of funding for the said acquisition. A consortium of banks led by Standard Chartered and Barclays would lend it $7.5 billion and State Bank of India (SBI) another $1 billion, a so-called rupee loan.Power ministry rules out possibility of NTPC selling power in open market The power ministry has ruled out any possibility of allowing state-owned power major NTPC to sell power in the open market as it feels NTPC is already making profits and in case of any problem or a disaster-like situation that can occur in any state, and if they need power at that point of time, NTPC cannot expect them to buy it at market price.The government is of the view that NTPC should concentrate on other avenues in the power sector, such as wind and solar energy, rather than focusing on making profits through the selling of merchant power in the open market.AT&T acquires 8.7% stake in Tech Mahindra Mauritius-based Mahindra BT Investment Company has sold its 8.07% stake in IT major, Tech Mahindra to US-based communications firm AT&T for $34.5 million. AT&T purchased about 98.70 lakh shares of Tech Mahindra in an off-market deal by exercising a 2005 option agreement to buy a stake in the latter. As per agreement on May 10, 2005, AT&T had an options over 9.98 million Tech Mahindra’s shares, which were held by Mahindra-BT Investment Company. These options were vested over a period ending April 30, 2010, if the company achieved targeted revenues from AT&T companies.Marg, VirginiaTech University join hands to set up campus in India Infrastructure and real estate developer Marg has inked a memorandum of understanding (MoU) with Virginia Tech University, the largest university in the Commonwealth of Virginia, USA, for setting up a university campus in India.Virginia Tech will establish campus on a 30-acre site, which will focus on auto-transportation, nano-engineering, life sciences and bio-informatics areas. The programmes to be offered and students’ intake will be decided after the bill allowing foreign universities to set up subsidiary is passed

D e c e m b e r April 2010
Magnum
12
Corporate News
in Parliament.Tata Motors to set up heavy truck plant in Myanmar Auto major Tata Motors has decided to set up heavy truck plant at Magwe, Myanmar. The company has signed a turnkey contract with Myanmar Automobile & Diesel Industries (MADI), an enterprise under the government of Myanmar’s Ministry of Industry-2, for the same. The project will be funded by a Line of Credit from the government of India. The company will develop a highly flexible chassis & frame assembly line along with a cab manufacturing, painting & trimming set-up at the said plant. The capacity of the unit will be 1,000 vehicles per annum, which can be expanded to 5,000 vehicles.Sanghi Industries plans to set up cement plant in Kenya Sanghi Industries, part of the Sanghi Group, is planning to expand its footprint in Kenya as it has purchased land in Kenya to build a cement plant. The company is planning to build a 1.2-million tonne cement plant along with local partnership. It already had purchased 650 acres of land in Kenya along with its unnamed local partner.The first phase of production is expected to start in June and actual production is expected to begin by first quarter of 2012.ONGC & partners get GoI clearance to invest $2.181 billion in a giant oilfield in Venezuela The Government of India (GoI) has given its nod to Oil and Natural Gas Corporation (ONGC) and partners to invest $2.181 billion in a giant oilfield in Venezuela that will give energy deficient India 3.6 million tonnes a year of crude oil. ONGC Videsh, the overseas arm of the state explorer, will invest $1.333 billion between 2010 and 2015 as its share of spending in the 400,000 barrels per day ‘Carabobo-1’ project. Indian Oil Corporation (IOC) and Oil India will invest $454 million each in the project.The Cabinet Committee on Economic Affairs (CCEA) approved the investment by the Indian firms, which together hold 18% stake in the Carabobo-1 project. The project of the Orinoco extra-heavy oil belt of Venezuela would involve a total investment of close to $21 billion over 25 years.Reliance Industries forms JV with IMG to set up sports institute in India Reliance Industries (RIL) has formed equal joint venture with IMG, the world’s leading sports marketing and management company, to develop, market and manage sports and entertainment in India.The venture, IMG Reliance, will have similar complementary strategies to provide and manage world class infrastructure and coaching facilities in the country to unlock India’s sporting potential. To build sporting infrastructure, IMG Reliance will use special-purpose vehicles. It will also
replicate IMG’s facilities in other countries.Ashok Leyland to join Renault-Nissan to produce compact cars Commercial vehicle manufacturer, Ashok Leyland is in talks with Franco-Japanese auto alliance, Renault-Nissan, to produce a small passenger car. Nissan is planning to launch its compact car Micra by July this year and also plans to launch nine models of the car in India by 2012, while Renault is also looking to use Nissan’s small car platform for the Indian market.Japan’s Nissan Motor Company has tied up with Ashok Leyland for making light commercial vehicles and Renault has a joint venture with Mahindra and Mahindra (M&M) for manufacturing the passenger car, Logan.Godrej Consumer in pact with Tura Group Godrej Consumer Products, one of the leading players in the Indian FMCG market, has decided to acquire worldwide rights of Tura from the Tura Group. The company has executed an agreement for the same. Tura, a household name in many African markets, is a market-leading personal care company that manufactures and distributes a range of products including soaps, moisturising lotions and skin-toning creams. This acquisition will provide a strong platform to Godrej Consumer to introduce its portfolio in Nigeria and other Western African markets.TV Eighteen arm to sell its entire stake in Jobstreet.com India Television Eighteen India’s internet and mobile arm, Web18 has entered into an agreement to sell all its shares in Jobstreet.com India to JobStreet.com, Singapore on the basis of the net tangible assets value of Jobstreet.com India.The sale is in line with Web18’s long-term strategy of consolidating its operations. The sale will result in a non-operating exceptional expense arising out of disposal of long-term investment of around Rs 2.50 crore in the financials of Web18 for quarter ending March 31, 2010. Bharti Airtel forays into media and entertainment segment Bharti Airtel, one of Asia’s leading providers of telecommunications services, has entered into the media and entertainment segment with the launch of Airtel Digital Media Business. The move will help the company to offer content delivery solutions for the media and entertainment sector. The creation of digital media exchange offers the industry, a secure digital distribution capability across multiple media platforms. This ensures that content producers can have an integrated content delivery and aggregation platform that repackages content for all media formats. It will also help over 16,000 cinema halls across the country to offer high quality global viewing experience for consumers in India.

D e c e m b e r April 2010
Magnum
13
Market Snapshot
Markets make a splendid run for the final month of fiscalDomestic equity markets snapped the last month of financial year with splendid gains. The post budget euphoria continued for the whole month. For the month the benchmarks not only reclaimed their psychological levels but moved much higher to their fresh highs of last one and half year. The mood was jubilant throughout the month, not only at the domestic markets but across the globe and most of the world indices seem to be out of the recession era and trading at their one to one and half year high. The good economic reports from across the world kept the markets buzzing and supported to gain a new high. The 30 share BSE Sensex surged by 7.29% while the S&P CNX Nifty was up by 6.68% for the month. The FIIs remained a consistent buyer in the Indian markets retaining their faith after a good union budget. Though some cautiousness appeared in the beginning of the month as Union Finance Minister Pranab Mukherjee himself said that even though the economic scenario in the country had improved considerably over the last one year, the recovery was still not broad-based and to a large extent was being driven by the government’s stimulus measures. The gains were broad based and spread across the sectors though the Capital Goods, Metal, Banking, and Health Care were the sectors that garnered the maximum gains. PSU was the only sector that snapped the month on a negative note. The major reason being the lackluster response of another government offering of NMDC, after a dismal performance of NTPC and REC. The issue, which closed on March 12 (Friday), was subscribed 1.25 times when state-run Life Insurance Corporation of India (LIC) subscribed to around 80% of the issue at the lower end of the price band.
In a boost to the direct tax collections, government has collected Rs 2.78 lakh crore from direct taxes during the first 11 months of the current financial year from April till February. The total direct tax collections surged by 7.52% from the corresponding period of the previous fiscal, which stood at Rs 2.58 lakh crore. The finance ministry has set
the target of collecting Rs 3.87 lakh crore from direct taxes during the current financial year. The ministry is confident that it will be able to achieve the target, which was revised from Budget estimate of Rs 3.70 lakh crore. In order to meet this revised target, the government has to collect direct taxes to the tune of more than Rs 1 lakh crore during the month of March 2010.
India’s industrial production continued to show strong growth, riding on robust expansion rate from the manufacturing sector. According to the data released by the ministry of statistics and program implementation, Index of Industrial Production (IIP) registered a growth of 16.7% in the month of January, as compared with 17.6% in the previous month. The ministry has also revised the December IIP data upwards to 17.6% from 16.8% and April-January industrial growth was at 9.6% year-on-year compared to 3.3% during the corresponding period last fiscal year. The growth was broad-based except consumer non-durables, which witnessed a negative growth of 3.1% y-o-y compared to 4% during the same month last year. January manufacturing sector growth was at 17.9% against 1%. The mining segment advanced by 14.6% against 0.7 % a year ago. Similarly, electricity was at 5.6% versus 1.8%; basic goods grew at 10.7% versus -0.7%; capital goods segment expanded at 56.2% versus 15.9%; intermediate goods was at 21.3% versus -7.2%; consumer goods growth was at 4.2% versus 3.6% and consumer durable goods growth was at 31.6% versus 2.1%
• Sun Pharma was the top gainer of the Sensex for the month surging by well over 16%. The company received an approval from the US health regulator for generic version of anti-allergic product Prometh syrup. USFDA granted an approval to the company’s subsidiary for the syrup, Promethazine Hydrochloride and Codeine Phosphate Oral Syrup--is bioequivalent to Prometh. The medicine is used to treat symptoms caused by common cold, flu, allergies or other breathing problems.
• JP Associates the other top gainer of the index has recently commissioned its 21 MT extra capacity and expects to clock in a growth of 42% in FY10. The company is optimistic about its cement business and
BSE Sensex Monthly Gainers
Company Prev Price (March 2’10)
Last Price (April1’10)
Change (%)
Sun Pharmaceutical 1549.00 1800.90 16.26JP Associates 136.80 153.65 12.32Reliance Industries 983.60 1093.65 11.19HDFC Bank 1744.65 1939.05 11.14ITC 241.95 264.35 9.26
BSE Sensex movement for the month of March
16,200.00
16,400.0016,600.00
16,800.00
17,000.00
17,200.0017,400.00
17,600.00
17,800.00
2-M
ar-1
0
4-M
ar-1
0
6-M
ar-1
0
8-M
ar-1
0
10-M
ar-1
0
12-M
ar-1
0
14-M
ar-1
0
16-M
ar-1
0
18-M
ar-1
0
20-M
ar-1
0
22-M
ar-1
0
24-M
ar-1
0
26-M
ar-1
0
28-M
ar-1
0
30-M
ar-1
0
1-A
pr-1
0

D e c e m b e r April 2010
Magnum
14
Market Snapshot
expects to see a growth of 37% in FY11. The company got a breather after court granted stay on forfeiture of a security deposit of Rs 1.16 crore at the hands of Municipal Corporation of Chandigarh
• Reliance Industries the other major gainer of the Sensex was up by more than 11%. The company has formed an equal joint venture with IMG, the world’s leading sports marketing and management company, to develop, market and manage sports and entertainment in India. The venture, IMG Reliance, will have similar complementary strategies to provide and manage world class infrastructure and coaching facilities in the country to unlock India’s sporting potential. To build sporting infrastructure, IMG Reliance will use special-purpose vehicles. It will also replicate IMG’s facilities in other countries.
• Maruti Suzuki India was the top loser of the Sensex, the company has recently called back about one lakh A-Star cars to replace a faulty fuel pump part. This was the biggest recall by any auto maker in the Indian automobile industry till date. The company will replace the fuel pump part, which may result in fuel leakage, without charging anything to the customers. The auto major will share this cost with its Baroda-based vendor Banco Products. It had sold close to 1.5 lakh A-stars during April 2009 to January 2010 period. Out of this, around one lakh cars were exported to foreign countries.
• Tata Motors the other top loser of the index got a shocker during the month when German carmaker Daimler Chrysler AG offloaded its entire 5.34% stake in Tata Motors through block deals at around Rs 758 per share, at discount to the prevailing market price.
During the middle of the month the markets got an extra impetus with good advance tax numbers from the major corporate houses. The largest conglomerate Reliance Industries paid Rs 770 crore for the final quarter, up by 111%. ICICI Bank paid Rs 200 crore; Kotak Mahindra Bank paid RS 80 crore; Bank of Baroda paid Rs 250 crore; Dena Bank paid Rs 30 crore while Nabard paid Rs 150 crore. IT
companies too have paid higher tax for the quarter and the overall trend has been for a higher advance tax for the quarter.
The other supporting factor to the markets came with Global rating agency S&P revising the outlook on the sovereign credit rating of India to ‘stable’ from ‘negative’. The agency also reaffirmed the ‘BBB-’ long-term and ‘A-3’ short-term sovereign credit ratings on India. The revision stems from strong economic performance despite the global economic slowdown and the efforts towards fiscal consolidation reflected in the General Budget for FY11. The agency said that the revision in outlook reflected its view that India’s fiscal position could begin to recover and that the economy would remain on a strong growth path. The Chairman of the Prime Minister’s economic advisory council (EAC) said that the decision by S&P to raise the outlook of India’s sovereign rating would increase the confidence in Indian success story and thereby boost investment inflows into the country.
In the concluding part of the month the main indices scaled their two-month highs prompted by sustained buying from the foreign institutional investors (FIIs). The FIIs have pumped in more than Rs 17,000 crore in Indian equities since the start of this month. There were some jitters as well when Reserve bank of India (RBI) announced unexpectedly an increase of 25 basis points (bps) in its benchmark rates, repo - at which it infuses short term liquidity into the system and, reverse repo- the rate at which it sucks liquidity from the system, putting pressure on the rate sensitive sectors. Most economists were in fact expecting a rate hike, but not until the RBI’s scheduled policy meeting on April 20. The key reason behind the move, which forced the RBI to take a mid-cycle policy action, was clearly the surging inflation. Inflationary scenario has been becoming more difficult in recent months as the economic growth picked up sharply and pressure on capacities started to increase.
Some concern from the global front too emerged when the debt crisis in Europe worsened. Greece which was already reeling under pressure to opt austerity measures then suddenly Fitch Ratings lowered Portugal’s credit rating; it said the country’s recovery will be slower than others that use the euro. Finally Greece won a pledge of financial support from eurozone and IMF, though this program came with strict conditions and makes no money available right now for the country. Then even, the markets snapped the month and financial year with good gains, the Sensex and the Nifty clocked 80% and 74%, respectively during the year. The broader indices outperformed the main bourses by big margin in 2009-10. The BSE Mid-cap index soared 130% while the Small-cap index zoomed by whopping 162% in FY10.
BSE Sensex Monthly Losers
Company Prev Price (March 2’10)
Last Price (April1’10)
Change (%)
Maruti Suzuki India 1489.65 1390.70 -6.64
Tata Motors 797.10 775.90 -2.66
ONGC 1112.65 1084.95 -2.49
Hindustan Unilever 234.30 230.70 -1.54
BHEL 962.65 948.65 -1.45

D e c e m b e r April 2010
Magnum
15
Economy News
Government to clear real estate regulatory bill soon The government will be coming out with a real estate regulator bill within the current year, said the urban development minister Jaipal Reddy. Various agencies have been urging the government to have a regulator for the realty sector on the lines of Trai for telecom operators and RBI for banks. As the Indian real estate sector expands, a regulator has become necessary to protect the interest of the consumers as well as to ensure that companies do not follow policies that can be detrimental for the long run growth of the economy. The need became further clear after the sub-prime crisis that originated in property market of the US and hit the economies worldwide, generating the global economic downturn following events of September 2008.RBI says banks in good health; inflation and government borrowings key challenges India’s central bank, the Reserve Bank of India (RBI), on March 25, released its first ever Financial Stability Report (FSR) saying banks were adequately capitalized and could withstand stress. It nonetheless pointed out towards high inflation and the large government borrowings as key challenges. The RBI stated that the banking sector was in good health. RBI’s analysis revealed that the banks were well capitalized in terms of regulatory capital adequacy ratios, characterized with higher core capital and sustainable financial leverage and would be able to withstand unexpected systematic stress.Advance tax numbers for auto majors map the bullish trend in sales India’s auto makers have shown a strong growth in advance tax outgo, reflecting the impact of bullish sales that the sector has been witnessing in recent months. The industry has had a strong run in current fiscal with sales showing a ‘V’ shaped recovery form lows witnessed in December quarter of 2008. In fact, the recovery continued to become stronger with every passing quarter and the last few months have been the best in the history of the Indian auto industry. Most auto companies have achieved their best ever sales or export volumes in first two months of the calendar year 2010. Car sales were historical high in January and breached it again in February and commercial vehicle sales too have surged, riding on strong economic recovery and low base from last year.Government may relax foreign borrowing norms The finance ministry has said that external commercial borrowings (ECB) may be allowed to the infrastructure companies to boost the pace of core sector growth. The government had earlier allowed telecom companies, ahead of the third generation spectrum auction, to raise
foreign funds by refinancing their local loans.Union finance secretary Ashok Chawla said in this regard that while the refinancing of domestic debt through the ECBs was not allowed in general, policy makers will have to explore the mechanism to allow external funds to replace domestic funds.Commerce ministry recommends ban on FDI in cigarette manufacturing In a bid to limit the consumption of cigarette in the country, the commerce and industry ministry has urged the government to ban foreign direct investment (FDI) in cigarette manufacturing and allied products involving tobacco. The ministry has sent the recommendation in this regard to the government and the Union Cabinet is likely to take up the issue soon. Commerce and industry minister Anand Sharma had recently proclaimed that there is no justification for the government to allow FDI in the tobacco sector. India is a signatory to the World Health Organisation (WHO) sponsored ‘Framework Convention on Tobacco Control’ under which it is committed to limit tobacco cultivation and consumption in the country.Cement prices maintain upward trend Even as most analysts have been digging into the potential overcapacity in the cement industry, prices of the commodity continue to head northward. Cement prices have facing upward pressures since the start of calendar year 2010. In the month of January, upward movement to the tune of Rs 5-10 per 50 kg bag was witnessed and after the Budget, a hike of another Rs 10-12 has been seen. The Budget witnessed partial withdrawal of the fiscal stimulus through partial restoration of the excise cut that the government had implemented following the emergence of the global financial crisis in September 2008. The excise hike was obvious to be passed on to the consumers. However, overall increase in prices in March is more than double the impact of excise hike, clearly indicating producer friendly demand-supply equation for now.Government sees normal monsoon this year Amidst surging food price inflation on the back of a monsoon failure last year, the government has affirmed that normal monsoon is expected this year. However, the Met Department is yet to come out with its forecast for this year’s monsoon. Monsoon failure had hit the country’s farm output very badly and the country witnessed its worst drought situation in 37 years. As many as 317 districts were impacted on the back of scanty rainfall last year. The Centre is taking a slew of measures to offset any reoccurrence of food shortage in case of a monsoon failure. It is putting in place a plan to maximize kharif production irrespective of the monsoon scenario. It has asked all the state governments to be better prepared for any eventuality in the future.

D e c e m b e r April 2010
Magnum
16
Economy News
EGoM clears food security bill The Empowered Group of Ministers (EGoM), headed by finance minister Pranab Mukherjee, has cleared the draft Food Security Bill, which seeks to provide 25 kg of wheat or rice per month at the rate of Rs 3 per kg to every Below Poverty Line (BPL) family in the country.The EGoM also decided to recommend to the Cabinet an increase in the quantity of food grains for the 11.5 crore identified Above Poverty Line families (APL) through ration shops. There has been a lot of talk on surging food grain stocks with the government and experts have been urging for greater offload to ensure optimum utilisation and also dent the surging food inflation.RBI allows banks to invest in IDRs In a move to ensure that banks do not meet their capital adequacy requirement by issuing subordinated debt to one another, the Reserve Bank of India (RBI) has asked the Securities and Exchange Board of India (SEBI) to allow banks to invest in IDRs (Indian Depository Receipts). However, this investment will be a part of the overall cap on bank investment in bonds and equity issues of other banks. As per current norms, the cap is at 10% of the investing bank’s total capital. IDRs are India-listed securities issued against underlying equity shares of foreign companies. The modus operandi of IDRs is quite similar to that of GDRs (Global Depository Receipts) and ADRs (American Depository Receipts). Shares underlying the IDR will be deposited with an overseas custodian who will hold the shares on behalf of a domestic depository. Domestic holders of IDRs can also convert the receipts into equity shares after one year following prior approval from RBI.Government to award 17 port projects under PPP route The government is set to give a major boost to the country’s port infrastructure in the coming year with as many as 17 projects to be awarded under the public private partnership (PPP) window. The projects will help increase the capacity at the major ports and also reduce the logistic costs for exporters and importers. According to a government release, a majority of the projects to be awarded will be developed under the National Maritime Development Programme (NMDP). Indian traders have often sighted the issues faced at ports, which lead to avoidable delays and often impose a financial loss in them. While the government has been looking to bring in private investment in the sector, the pace of such initiatives has been rather slow.Union Cabinet clears foreign universities bill The Union Cabinet in mid-March cleared the Foreign Educational Institutions (Regulation of Entry and Operation) Bill, 2010, that will now be introduced in the lower house of Parliament when it meets after the break. The bill intends to allow foreign education providers to set
up campuses in the country and offer degrees, subject to regulatory clearances from respective agencies including the University Grants Commission (UGC) and the proposed National Commission for Higher Education and Research. The bill will not only clear way for foreign universities into the country but will also boost the domestic players in education sector. In fact some of the local players have been asking for the bill to be cleared soon as it will allow then to get into joint ventures with global players to deliver education and related services in India.Government likely to continue export ban, duty-free imports of pulses The Indian government is set to extend the ban on export of pulses, beyond March 2010 despite improved prospects of the rabi (winter sown) crop. It is also likely to continue the duty-free import of pulses for another year from March 31, 2010. Pulses have seen a sharp rise in prices on account of lower domestic production and increasing dependence on imports in the last fiscal. Although prices have softened somewhat recently owing to improved prospects of rabi crop and expected increase in pulses supply, these are still substantially higher compared to last year.India inks atomic energy deal with Russia; eyeing for greater economic ties In a boost to the energy sector, India and Russia have signed an inter-governmental Agreement on Cooperation in Atomic Energy. Moreover, both countries have agreed to a roadmap for construction of nuclear power plants. Both the countries have identified information technology and telecommunication as the focus areas of future economic cooperation. Prime Minister Manmohan Singh asserted that both the countries have agreed to strengthen cooperation in hydrocarbons through collaboration between the countries’ oil and gas companies. Agreements have been signed in areas of fertilisers and pharmaceuticals also.FIPB tightens norms for FDI in telecom, defence and security services In a move that will enhance scrutiny of Foreign Direct Investment (FDI) for sensitive sectors, the Foreign Investment Promotion Board (FIPB) has come out with a new set of norms for applicants. As per the proposed new rules, it would now be mandatory for foreign companies that wish to invest in telecom, defence and security services in India to provide details of all directors. According to the existing norms, it was a desirable criterion for the companies seeking FIPB approval and the norm was mandatory only for the telecommunications segment. Henceforth, this criterion would be mandatory for all applicants in these sectors while electronic filling of FIPB applications. Moreover, if the prospective company has Chinese or Hong Kong registrations or links, they are required to furnish details of all directors for all sectors.

D e c e m b e r April 2010
Magnum
17
Dividend Yield
Company NameYear End
Price(Rs.)
(01/04)
Yield(%)
EPS(Rs.)
FV PE
TTM 52-WkHigh(Rs.)
52-WkLow(Rs.)
Year End
NPRs. ml
EPS(Rs.)
PE
Varun Shipping Company Ltd. 200903 50.15 9.97 8.19 10 6.12 200912 196.04 1.31 38.38 70.40 43.40
EID-Parry (India) Ltd. 200903 343.15 5.83 80.37 2 4.27 200912 1942.30 22.49 15.26 419.00 144.15
SRF Ltd. 200903 203.20 5.07 26.91 10 7.55 200912 2199.41 36.35 5.59 224.55 75.25
Navneet Publications (India) Ltd. 200903 51.45 5.05 6.18 2 8.32 200912 696.10 2.92 17.61 54.85 18.40
UCO Bank Ltd 200903 57.30 1.75 10.15 10 5.65 200912 7500.46 13.65 4.20 64.75 25.15
Indian Overseas Bank Ltd 200903 92.20 4.88 24.34 10 3.79 200912 9018.86 16.55 5.57 141.00 46.55
HCL Infosystems Ltd. 200906 135.60 4.79 15.21 2 8.92 200912 2581.90 11.83 11.46 188.80 77.50
Karnataka Bank Ltd. 200903 125.85 4.77 21.93 10 5.74 200912 1761.65 13.15 9.57 174.35 67.65
Andhra Bank Ltd 200903 108.50 4.15 13.46 10 8.06 200912 10067.94 20.76 5.23 124.70 47.05
Uflex Ltd. 200903 96.55 4.14 16.09 10 6.00 200912 1194.49 18.37 5.25 111.65 59.00
Shipping Corpn. Of India Ltd. 200903 157.95 4.12 22.21 10 7.11 200912 4418.20 10.43 15.14 181.90 79.30
Allahabad Bank Ltd 200903 143.35 1.74 17.21 10 8.33 200912 12459.05 27.89 5.14 148.80 39.80
PSL Ltd. 200903 143.65 3.48 20.12 10 7.12 200912 780.99 14.61 9.83 188.40 79.25
Syndicate Bank Ltd 200903 86.35 3.47 17.49 10 4.94 200912 8517.53 16.32 5.29 105.40 49.95
Balrampur Chini Mills Ltd. 200909 88.15 3.40 8.82 1 9.99 200912 2517.66 9.74 9.05 167.30 55.30
Emco Ltd. 200903 82.95 1.69 9.03 2 9.19 200912 510.86 8.25 10.06 109.45 36.00
Graphite India Ltd. 200903 91.00 3.30 12.81 2 7.10 200912 2598.09 15.10 6.03 94.90 25.70
Alok Industries Ltd. 200903 22.75 3.30 9.56 10 2.38 200912 2105.50 2.67 8.51 29.50 12.61
Coromandel International Ltd. 200903 316.10 3.16 35.48 2 8.91 200912 3736.58 26.64 11.87 337.00 95.00
Bank Of Maharashtra Ltd 200903 50.05 3.00 8.71 10 5.75 200912 4378.38 10.17 4.92 58.00 21.70
Mastek Ltd. 200906 334.55 2.99 35.56 5 9.67 200912 803.16 29.81 11.22 462.00 125.15
Tata Investment Corpn. Ltd. 200903 502.40 2.99 54.06 10 9.29 200912 1944.76 47.03 10.68 561.70 238.25
Rolta India Ltd. 200906 181.55 1.65 23.12 10 7.85 200912 4262.94 26.45 6.86 210.00 63.00
Orient Paper & Inds. Ltd. 200903 51.70 2.90 10.37 1 4.99 200912 1586.70 8.23 6.28 61.25 25.35
Indian Bank Ltd 200903 175.50 2.85 28.98 10 6.25 200912 15391.02 35.81 4.90 195.70 84.05
Madras Cements Ltd. 200903 121.15 1.65 15.28 1 7.93 200912 3975.56 16.71 7.25 140.00 70.00
Akzo Nobel India Ltd. 200903 601.00 2.66 77.38 10 7.77 200912 1631.00 44.28 13.57 679.80 430.00
Corporation Bank Ltd 200903 480.20 2.60 62.24 10 7.72 200912 11184.13 77.97 6.16 515.00 180.00
City Union Bank Ltd. 200903 29.00 2.59 3.82 1 7.59 200912 1440.68 3.60 8.05 33.80 10.28
Jammu & Kashmir Bank Ltd. 200903 670.00 2.54 84.54 10 7.93 200912 4700.06 96.95 6.91 706.00 299.00
Tata Steel Ltd. 200903 652.25 2.45 71.20 10 9.36 200912 43438.10 48.96 13.32 737.00 214.00
Gujarat Fluorochemicals Ltd. 200903 144.40 2.42 30.96 1 4.66 200912 2533.76 23.07 6.26 189.40 68.50
Dena Bank Ltd 200903 79.35 1.51 14.74 10 5.38 200912 4853.52 16.92 4.69 93.00 32.75
Bank Of India Ltd 200903 346.40 2.31 57.14 10 6.05 200912 21235.26 40.43 8.57 474.70 205.30
India Cements Ltd. 200903 134.15 1.49 15.30 10 8.77 200912 4098.77 13.34 10.05 180.00 97.10
IDBI Bank Ltd 200903 115.80 2.16 11.85 10 9.77 200912 10263.89 14.16 8.18 140.00 43.60
State Bank Of Travancore Ltd 200903 620.20 2.10 121.57 10 5.10 200912 6590.76 131.82 4.71 673.00 225.10
Vijaya Bank Ltd 200903 47.95 2.09 6.05 10 7.93 200912 4786.20 11.04 4.34 58.75 24.10
Voltamp Transformers Ltd. 200903 856.65 1.46 113.47 10 7.55 200912 862.75 85.28 10.05 1050.00 339.50
Canara Bank Ltd 200903 412.90 1.94 50.55 10 8.17 200912 32372.40 78.96 5.23 441.50 158.50
JK Cement Ltd. 200903 181.45 1.93 20.36 10 8.91 200912 2418.71 34.59 5.25 201.50 41.00
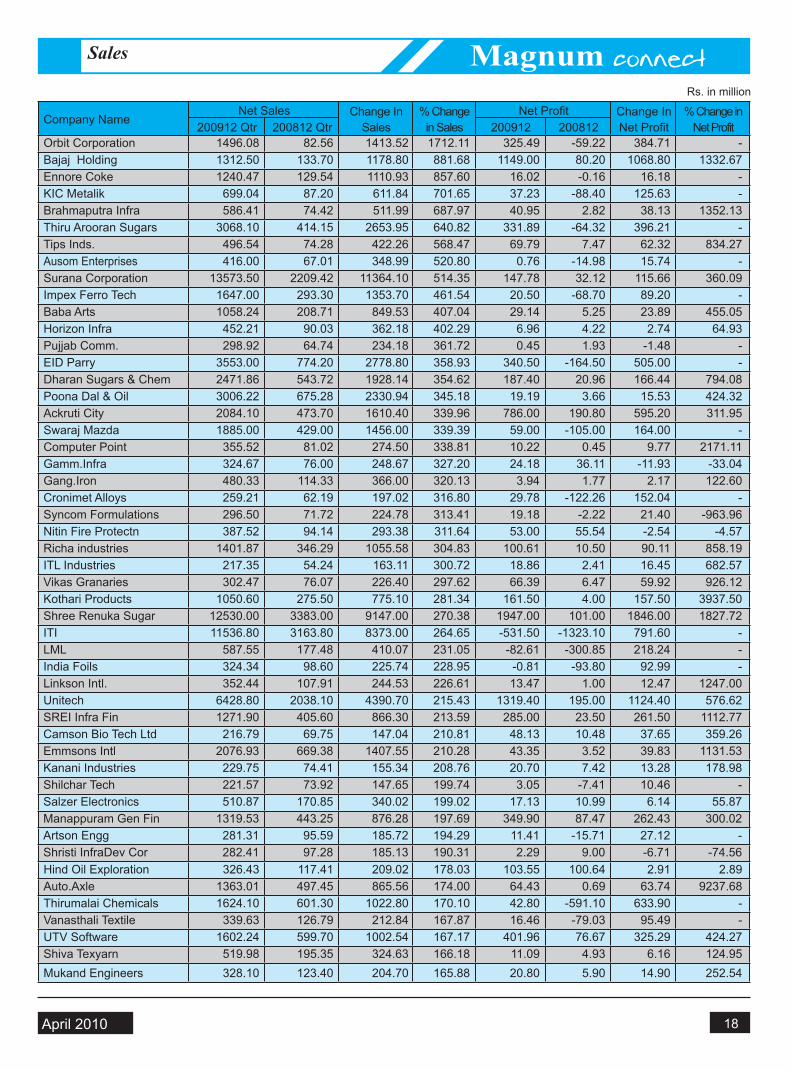
D e c e m b e r April 2010
Magnum
18
Sales
Company Name200912 Qtr 200812 Qtr
Change In Sales
% Change in Sales 200912 200812
Change In Net Profit
% Change in Net Profit
Orbit Corporation 1496.08 82.56 1413.52 1712.11 325.49 -59.22 384.71 -Bajaj Holding 1312.50 133.70 1178.80 881.68 1149.00 80.20 1068.80 1332.67Ennore Coke 1240.47 129.54 1110.93 857.60 16.02 -0.16 16.18 -KIC Metalik 699.04 87.20 611.84 701.65 37.23 -88.40 125.63 -Brahmaputra Infra 586.41 74.42 511.99 687.97 40.95 2.82 38.13 1352.13Thiru Arooran Sugars 3068.10 414.15 2653.95 640.82 331.89 -64.32 396.21 -Tips Inds. 496.54 74.28 422.26 568.47 69.79 7.47 62.32 834.27Ausom Enterprises 416.00 67.01 348.99 520.80 0.76 -14.98 15.74 -Surana Corporation 13573.50 2209.42 11364.10 514.35 147.78 32.12 115.66 360.09Impex Ferro Tech 1647.00 293.30 1353.70 461.54 20.50 -68.70 89.20 -Baba Arts 1058.24 208.71 849.53 407.04 29.14 5.25 23.89 455.05Horizon Infra 452.21 90.03 362.18 402.29 6.96 4.22 2.74 64.93Pujjab Comm. 298.92 64.74 234.18 361.72 0.45 1.93 -1.48 -EID Parry 3553.00 774.20 2778.80 358.93 340.50 -164.50 505.00 -Dharan Sugars & Chem 2471.86 543.72 1928.14 354.62 187.40 20.96 166.44 794.08Poona Dal & Oil 3006.22 675.28 2330.94 345.18 19.19 3.66 15.53 424.32Ackruti City 2084.10 473.70 1610.40 339.96 786.00 190.80 595.20 311.95Swaraj Mazda 1885.00 429.00 1456.00 339.39 59.00 -105.00 164.00 -Computer Point 355.52 81.02 274.50 338.81 10.22 0.45 9.77 2171.11Gamm.Infra 324.67 76.00 248.67 327.20 24.18 36.11 -11.93 -33.04Gang.Iron 480.33 114.33 366.00 320.13 3.94 1.77 2.17 122.60Cronimet Alloys 259.21 62.19 197.02 316.80 29.78 -122.26 152.04 -Syncom Formulations 296.50 71.72 224.78 313.41 19.18 -2.22 21.40 -963.96Nitin Fire Protectn 387.52 94.14 293.38 311.64 53.00 55.54 -2.54 -4.57Richa industries 1401.87 346.29 1055.58 304.83 100.61 10.50 90.11 858.19ITL Industries 217.35 54.24 163.11 300.72 18.86 2.41 16.45 682.57Vikas Granaries 302.47 76.07 226.40 297.62 66.39 6.47 59.92 926.12Kothari Products 1050.60 275.50 775.10 281.34 161.50 4.00 157.50 3937.50Shree Renuka Sugar 12530.00 3383.00 9147.00 270.38 1947.00 101.00 1846.00 1827.72ITI 11536.80 3163.80 8373.00 264.65 -531.50 -1323.10 791.60 -LML 587.55 177.48 410.07 231.05 -82.61 -300.85 218.24 -India Foils 324.34 98.60 225.74 228.95 -0.81 -93.80 92.99 -Linkson Intl. 352.44 107.91 244.53 226.61 13.47 1.00 12.47 1247.00Unitech 6428.80 2038.10 4390.70 215.43 1319.40 195.00 1124.40 576.62SREI Infra Fin 1271.90 405.60 866.30 213.59 285.00 23.50 261.50 1112.77Camson Bio Tech Ltd 216.79 69.75 147.04 210.81 48.13 10.48 37.65 359.26Emmsons Intl 2076.93 669.38 1407.55 210.28 43.35 3.52 39.83 1131.53Kanani Industries 229.75 74.41 155.34 208.76 20.70 7.42 13.28 178.98Shilchar Tech 221.57 73.92 147.65 199.74 3.05 -7.41 10.46 -Salzer Electronics 510.87 170.85 340.02 199.02 17.13 10.99 6.14 55.87Manappuram Gen Fin 1319.53 443.25 876.28 197.69 349.90 87.47 262.43 300.02Artson Engg 281.31 95.59 185.72 194.29 11.41 -15.71 27.12 -Shristi InfraDev Cor 282.41 97.28 185.13 190.31 2.29 9.00 -6.71 -74.56Hind Oil Exploration 326.43 117.41 209.02 178.03 103.55 100.64 2.91 2.89Auto.Axle 1363.01 497.45 865.56 174.00 64.43 0.69 63.74 9237.68Thirumalai Chemicals 1624.10 601.30 1022.80 170.10 42.80 -591.10 633.90 -Vanasthali Textile 339.63 126.79 212.84 167.87 16.46 -79.03 95.49 -UTV Software 1602.24 599.70 1002.54 167.17 401.96 76.67 325.29 424.27Shiva Texyarn 519.98 195.35 324.63 166.18 11.09 4.93 6.16 124.95Mukand Engineers 328.10 123.40 204.70 165.88 20.80 5.90 14.90 252.54
Rs. in million
Net Sales Net Profit

D e c e m b e r April 2010
Magnum
19
High PE
Company Name Year End Price (01/04) Rs. EPS FV PEJai Balaji Inds. Ltd. 200903 241.85 0.27 10 895.74JM Financial Ltd. 200903 38.25 0.11 1 359.94Entertainment Network (India) Ltd. 200903 208.90 0.61 10 341.94GVK Power & Infrastructure Ltd. 200903 44.90 0.15 1 300.65Kalyani Steels Ltd. 200903 224.45 0.76 10 296.39Jubilant FoodWorks Ltd. 200903 322.90 1.16 10 278.36Godrej Industries Ltd. 200903 148.10 0.58 1 255.34Max India Ltd. 200903 216.80 0.98 2 221.22Strides Arcolab Ltd. 200812 336.15 1.53 10 219.44Radico Khaitan Ltd. 200903 129.35 0.64 2 202.11Jai Corp Ltd. 200903 270.15 1.58 1 170.98Aptech Ltd. 200812 167.60 1.02 10 161.15IRB Infrastructure Developers Ltd 200903 260.60 1.73 10 151.01Reliance Natural Resources Ltd. 200903 63.60 0.43 5 147.91Reliance Power Ltd 200903 152.05 1.04 10 146.20Nirlon Ltd. 200903 67.75 0.50 10 135.50IVRCL Assets & Holdings Ltd 200903 178.70 1.34 10 133.52Karuturi Global Ltd 200903 17.90 0.11 1 127.86Future Capital Holdings Ltd 200903 186.05 1.47 10 126.97Edelweiss Capital Ltd 200903 438.70 3.52 5 124.78Kiri Dyes and Chemcials Ltd 200903 695.00 5.65 10 123.01Bajaj Finserv Ltd 200903 343.65 2.86 5 120.21Advanta India Ltd. 200812 620.15 5.85 10 106.01Kotak Mahindra Bank Ltd. 200903 746.90 7.99 10 93.36VIP Industries Ltd. 200903 263.55 3.29 10 83.67Firstsource Solutions Ltd. 200903 29.50 0.35 10 83.62Mindtree Ltd 200903 594.15 7.90 10 75.24United Breweries Ltd. 200903 191.95 2.60 1 73.83Zydus Wellness Ltd 200903 408.25 6.09 10 67.04Mundra Port & Special Economic Zone Ltd 200903 750.25 11.51 10 65.18Motherson Sumi Systems Ltd. 200903 127.55 1.96 1 65.08TVS Motor Company Ltd. 200903 82.90 1.31 1 63.35Assam Company India Ltd. 200812 20.80 0.33 1 63.03KSK Energy Ventures Ltd. 200903 188.50 2.99 10 62.96Aditya Birla Nuvo Ltd. 200903 902.45 14.46 10 62.41Sundram Fasteners Ltd. 200903 51.70 0.83 1 62.41UTV Software Communications Ltd. 200903 469.40 7.55 10 62.17DB Corp Ltd. 200903 251.25 4.06 10 61.86Hindustan Oil Exploration Company Ltd. 200903 247.40 4.10 10 60.34Jain Irrigation Systems Ltd. 200903 956.80 16.66 10 58.95Trent Ltd. 200903 806.25 13.70 10 58.86
EPS Earning Per Shares is calculated as Net Profit / Number of Equity Shares (Rs)FV Latest Face values of equity Shares (Rs)PE Market Price / Trailing Twelve Months Earning Per Shares

D e c e m b e r April 2010
Magnum
20
Low PE
EPS Earning Per Shares is calculated as Net Profit / Number of Equity Shares (Rs)FV Latest Face values of equity Shares (Rs)PE Market Price / Trailing Twelve Months Earning Per Shares
Company Name Year End Price (01/04) Rs. EPS FV PE
DB Realty Ltd. 200903 454.15 307.40 10 1.48
Cranes Software Intl. Ltd. 200903 17.40 9.80 2 1.78
Alok Industries Ltd. 200903 22.75 9.56 10 2.38
Great Eastern Shipping Company Ltd. 200903 294.90 90.27 10 3.24
Gujarat State Fertilizers & Chemicals Ltd. 200903 221.25 62.57 10 3.53
Indian Overseas Bank Ltd 200903 92.20 24.34 10 3.79
ICSA (India) Ltd. 200903 128.70 33.69 2 3.82
EID-Parry (India) Ltd. 200903 343.15 80.37 2 4.27
Kesoram Industries Ltd. 200903 381.55 83.83 10 4.55
Gujarat Fluorochemicals Ltd. 200903 144.40 30.96 1 4.66
Gujarat Alkalies & Chemicals Ltd. 200903 125.75 26.18 10 4.80
Syndicate Bank Ltd 200903 86.35 17.49 10 4.94
Orient Paper & Inds. Ltd. 200903 51.70 10.37 1 4.99
State Bank Of Travancore Ltd 200903 620.20 121.57 10 5.10
Dena Bank Ltd 200903 79.35 14.74 10 5.38
Bharati Shipyard Ltd. 200903 261.05 48.36 10 5.40
Geodesic Ltd. 200903 113.95 20.76 2 5.49
UCO Bank Ltd 200903 57.30 10.15 10 5.65
Karnataka Bank Ltd. 200903 125.85 21.93 10 5.74
Bank Of Maharashtra Ltd 200903 50.05 8.71 10 5.75
3I Infotech Ltd. 200903 78.75 14.12 10 5.78
Tamil Nadu Newsprint & Papers Ltd. 200903 91.15 15.52 10 5.87
IFCI Ltd. 200903 50.85 8.60 10 5.94
Uflex Ltd. 200903 96.55 16.09 10 6.00
Bank Of India Ltd 200903 346.40 57.14 10 6.05
Varun Shipping Company Ltd. 200903 50.15 8.19 10 6.12
Indian Bank Ltd 200903 175.50 28.98 10 6.25
Tanla Solutions Ltd. 200903 46.20 7.33 1 6.30
MIC Electronics Ltd. 200906 42.65 6.17 2 6.66
Deepak Fert. & Petrochemicals Corpn. Ltd. 200903 113.15 16.86 10 6.71
Nava Bharat Ventures Ltd. 200903 415.50 58.23 2 6.95

D e c e m b e r April 2010
Magnum
21
Price Trends
Date Price Rs.1-Apr-10 16400.002-Mar-10 16841.651-Feb-10 16364.002-Jan-10 16677.001-Dec-09 17955.003-Nov-09 16250.001-Oct-09 15650.001-Sep-09 15150.001-Aug-09 14866.651-Jul-09 14478.701-Jun-09 14963.752-May-09 14350.001-Apr-09 15150.00
Silver
Crude
Gold
Currency
Date Price Rs.1-Apr-10 27175.502-Mar-10 26187.201-Feb-10 25800.002-Jan-10 27050.001-Dec-09 29280.003-Nov-09 26400.001-Oct-09 26250.001-Sep-09 23980.401-Aug-09 22568.251-Jul-09 21879.001-Jun-09 23300.002-May-09 20988.001-Apr-09 21950.00
Date Price Rs1-Apr-10 44.801-Mar-10 46.021-Feb-10 46.174-Jan-10 46.291-Dec-09 46.182-Nov-09 47.091-Oct-09 47.861-Sep-09 49.073-Aug-09 47.431-Jul-09 47.771-Jun-09 46.781-May-09 49.681-Apr-09 50.56 Date Price $
1-Apr-10 83.761-Mar-10 78.701-Feb-10 74.434-Jan-10 81.511-Dec-09 78.372-Nov-09 78.041-Oct-09 69.931-Sep-09 68.853-Aug-09 71.651-Jul-09 69.281-Jun-09 67.721-May-09 53.291-Apr-09 47.57
0
2000
4000
6000
8000
10000
12000
14000
16000
18000
20000
1-Ap
r-09
1-M
ay-0
9
1-Ju
n-09
1-Ju
l-09
1-Au
g-09
1-Se
p-09
1-O
ct-0
9
1-No
v-09
1-De
c-09
1-Ja
n-10
1-Fe
b-10
1-M
ar-1
0
1-Ap
r-10
0
5000
10000
15000
20000
25000
30000
35000
1-Ap
r-09
1-M
ay-0
9
1-Ju
n-09
1-Ju
l-09
1-Au
g-09
1-Se
p-09
1-Oc
t-09
1-No
v-09
1-De
c-09
1-Ja
n-10
1-Fe
b-10
1-M
ar-1
0
1-Ap
r-10
41
42
43
44
45
46
47
48
49
50
51
1-Ap
r-09
1-M
ay-0
9
1-Ju
n-09
1-Ju
l-09
1-Au
g-09
1-Se
p-09
1-Oc
t-09
1-No
v-09
1-De
c-09
1-Ja
n-10
1-Fe
b-10
1-M
ar-1
0
1-Ap
r-10
0
10
20
30
40
50
60
70
80
90
1-Ap
r-09
1-M
ay-0
9
1-Ju
n-09
1-Ju
l-09
1-Au
g-09
1-Se
p-09
1-Oc
t-09
1-No
v-09
1-De
c-09
1-Ja
n-10
1-Fe
b-10
1-M
ar-1
0
1-Ap
r-10

D e c e m b e r April 2010
Magnum
22
Mutual Fund Analysis
Technologies with holding of 0.11%.OutlookICICI Prudential Dynamics plan is an Open-ended Equity - diversified scheme of ICICI Prudential Asset Management Company being managed by Sankaran Naren. This scheme is a diversified equity plan that follows the growth investment philosophy to invest in a portfolio of large, mid and small-cap stocks. It offers a portfolio of stocks selected through rigorous bottom-up fundamental analysis across market capitalizations on a diversified basis for long-term capital appreciation. This scheme has an added advantage as it has the agility, aimed at capturing upside opportunities in the market across market capitalizations but on the other side the plan has the ability to move into cash as the markets get overvalued to limit the downside. The fund has been a consistent performer since inception and is one of the top performing schemes in the equity diversified funds. The fund has given a good return of over 90% better than its category average. The scheme in its portfolio is carrying all the best performing companies of the large cap; though it constitutes mainly of the large cap but mid and small cap companies of repute too has been added to the portfolio. The portfolio turnover ratio of the scheme is 1.95 that means there has not been much churning in the allocation. Overall the fund seems to be a good bet.term equity investing in addition to helping you save tax.
Duration 1 Week % 1 Mth % 3 Mth % 6 Mth % 1 Year % 3 Year % 5 Year % Since Inc. %Scheme Return % 0.70 5.86 3.87 14.05 90.01 14.86 28.47 35.35Category Avg % 0.57 5.97 1.33 7.91 86.46 10.32 21.53 15.62
Market cap-wise Allocation StyleAverage Mkt Cap (Rs Cr) 60822.22Market Capitalization % of Portfolio Large 69.33Mid 12.16Small 4.84Note: Large-Cap = 5000 Crs. and above, Mid-Cap = 2000 Crs. to 5000 Crs. and Small-Cap = less than 2000 Crs
ICICI Dynamic (G)ICICI Prudential Dynamic (Growth) is an ICICI Prudential Asset Management Company managed open-ended, Equity - Diversified scheme.The fund was launched on November 12, 2002 and its current net asset as on February 28, 2010 was Rs 1928.89 crore. The benchmark index of the fund is S&P CNX Nifty and the custodian of the fund is HDFC Bank Limited.The current net asset value (NAV) of the fund as on April 1, 2010 was Rs 95.60; while the 52 week high NAV was Rs 95.60 on April 1, 2010 and the 52 week low NAV for the scheme was Rs 52.44 on April 6, 2009. The minimum investment to the fund is Rs 5000 and additional investments can be made in multiples of Rs 500.The investment objective of the fund is to invest primarily in equities and for defensive consideration in fixed income securities including money market instruments with the aim of generating capital appreciation. The actual percentage of investments will be decided after considering the prevailing market and economic conditions.The top five holdings of the fund are:
Industry-wise the fund has the maximum contribution of 13.04% from the Petroleum Products followed by Media & Entertainment with contribution of 8.24% and has contribution of 6.69% from Consumer non-Durables and 6.45% from banks.As far as market capitalization-wise companies are concerned, the scheme’s portfolio consists of 69.33% from Large-cap, 12.16% from Mid-cap and 4.84% from Small-cap companies.The fund has given a return of 35.35% since inception and a return of 90.01% in last one year, while the category average in the same period has been 15.62% and 86.46% respectively.As on February 28, 2009 the major companies included in the scheme were Punjab National Bank with holding of 1.38%, Cairn India with holding of 0.28%, Bajaj Finserv with a holding of 2.39%, while the major companies that have been excluded from the portfolio of the fund were Pidilite Industries with holding of 0.25% and Axis bank with a holding of 0.50% and Sterlite
Last one year NAV Graph
ICICI Dynamic (G)
Company RIL Bharti Airtel Infosys SBI
Cadila Health-
care% Holding 9.52 4.72 4.66 4.55 4.49
0.0000
20.0000
40.0000
60.0000
80.0000
100.0000
120.0000
31-Ma
r-09
30-Apr
-09
31-Ma
y-09
30-Jun
-09
31-Jul
-09
31-Aug
-09
30-Sep
-09
31-Oc
t-09
30-Nov
-09
31-Dec
-09
31-Jan
-10
28-Feb
-10
31-Ma
r-10

D e c e m b e r April 2010
Magnum
23
MF Scorecard
Scheme NameNAV(Rs.)
InceptionDate
Absolute % CAGR % AUM
(Rs. cr)1 M 3 M 6 M 1 Y 3 Y 5 Y Since
Inception
Equity - DiversifiedBirla SL India Opportunities(G) 52.21 21-Jan-95 15 7.01 3.65 13.40 126.02 1.41 13.69 11.49Birla SL Special Situations(G) 9.78 15-Jan-08 358 6.48 1.07 5.29 90.13 - - -0.98DSPBR Opportunities(G) 76.14 10-Apr-00 394 6.20 1.20 7.04 88.00 13.41 23.68 22.56Fidelity Equity(G) 30.85 19-Apr-05 1402 6.51 3.15 9.92 89.48 14.44 - 25.55ICICI Pru Dynamic(G) 95.27 18-Oct-02 1147 5.50 3.51 13.64 92.24 14.74 28.78 35.31Kotak Opportunities(G) 42.83 25-Aug-04 613 6.24 1.53 7.19 91.39 15.27 27.38 29.66SBI Magnum Comma(G) 24.24 25-Jul-05 343 5.07 1.08 12.59 89.97 19.00 - 20.80SBI Magnum Multicap(G) 17.83 16-Sep-05 351 6.19 0.62 7.54 84.58 6.83 - 13.59Reliance Equity Oppor-Ret(G) 31.09 7-Mar-05 1091 9.60 5.62 19.76 129.84 15.15 25.61 25.08Reliance Natural Resources(G) 10.12 30-Jan-08 3158 4.18 -3.10 1.86 64.47 - - 0.53
Equity - ELSSBirla SL Tax Relief '96(D) 80.89 29-Mar-96 889 6.45 0.23 7.12 109.93 11.74 22.86 32.63DSPBR Tax Saver(G) 15.65 26-Dec-06 490 7.92 4.49 10.97 99.03 17.69 - 14.72Fidelity Tax Advantage(G) 18.92 31-Jan-06 712 6.44 3.66 10.56 90.90 15.84 - 16.54Franklin India Taxshield(G) 186.91 10-Apr-99 391 7.04 4.94 13.63 91.30 15.82 22.44 30.56HDFC Long Term Adv(G) 119.06 27-Dec-00 522 6.24 2.65 9.98 101.09 11.29 20.13 30.66Principal Personal Tax saver(G) 90.41 1-Jan-96 595 5.61 0.21 6.08 91.83 10.96 19.16 25.94Reliance Tax Saver (ELSS)(G) 18.72 23-Aug-05 1240 6.33 2.85 12.99 92.75 12.08 - 14.59Sundaram Taxsaver(G) 41.14 31-Jan-05 624 4.46 -2.72 0.10 81.64 16.25 - 26.01
Equity - Large-capBirla SL Equity(G) 252.91 27-Aug-98 647 6.65 0.33 9.04 102.09 13.20 25.78 32.11Birla SL Frontline Equity(G) 80.76 30-Aug-02 1078 6.03 1.23 8.18 95.07 17.75 27.52 31.69DSPBR Equity(D) 46.67 15-Apr-97 1241 6.49 0.59 9.07 92.59 19.90 29.09 25.46DSPBR Top 100 Equity(G) 91.53 21-Feb-03 1273 5.67 0.44 5.55 75.60 18.32 27.94 36.54JM Large Cap(G) 17.29 9-Jun-04 2 3.80 -2.35 -4.57 48.29 0.79 8.36 9.88Kotak 30(G) 94.69 21-Dec-98 547 5.62 0.48 4.49 70.88 13.34 24.12 33.49Magnum Equity(D) 30.00 30-Nov-90 307 6.88 2.49 8.91 94.81 14.52 26.46 13.44Reliance Equity-Ret(G) 14.83 7-Mar-06 1204 2.83 -2.22 -0.86 59.63 10.31 - 10.16Reliance Vision-Ret(G) 252.08 7-Oct-95 1815 5.23 0.07 6.03 88.44 14.07 23.78 24.95Sundaram BNPP Growth(G) 84.70 15-Feb-97 64 5.18 -2.50 1.40 89.56 10.49 20.31 20.56
Equity - Mid-capBirla SL Midcap(G) 106.58 1-Oct-02 773 8.19 1.66 14.17 146.31 21.05 26.81 37.09ICICI Pru Emerging S.T.A.R.(G) 32.14 25-Sep-04 249 7.13 7.82 21.51 136.15 6.48 22.13 23.58JM Mid Cap(G) 25.12 9-Jun-04 7 5.65 -5.06 0.75 110.08 7.90 15.27 17.18Kotak Midcap(G) 22.45 28-Jan-05 58 8.19 4.57 14.02 109.62 5.25 17.32 16.92Reliance Growth-Ret(G) 439.20 7-Oct-95 3812 6.26 2.77 11.66 112.06 19.13 29.72 29.83Reliance Reg Savings-Equity(G) 28.62 10-Jun-05 1932 5.78 3.00 11.48 112.90 25.55 - 24.45Sundaram BNPP S.M.I.L.E(G) 30.94 21-Jan-05 289 5.53 -2.79 5.51 131.93 21.89 25.15 24.31Sundaram BNPP Select Midcap(G) 134.31 19-Jul-02 977 4.10 -0.51 10.36 139.49 15.92 28.82 40.10
Equity - Pharma & HCFranklin Pharma(G) 54.18 31-Mar-99 33 10.68 13.32 34.06 141.30 23.58 23.73 16.59Reliance Pharma(G) 48.74 26-May-04 132 12.55 10.88 35.64 154.12 35.13 32.00 31.10
Returns as of 31st March, 2010

D e c e m b e r April 2010
Magnum
24
MF Scorecard
Scheme NameNAV(Rs.)
InceptionDate
Absolute % CAGR % AUM
(Rs. cr)1 M 3 M 6 M 1 Y 3 Y 5 Y Since
Inception
Equity - Service IndsICICI Pru Services Inds(G) 16.34 18-Nov-05 192 6.66 2.45 8.86 99.03 2.98 - 11.90Principal Services Inds(G) 13.80 31-Jan-06 72 3.53 -0.36 2.07 80.87 7.97 - 8.04Tata Service Inds(G) 23.51 10-Mar-05 86 5.32 -1.11 3.28 119.87 7.06 - 18.41
Equity - Sensex Linked IndexFranklin India Index-BSE Sensex(G) 49.12 27-Aug-01 33 6.60 0.15 1.93 79.28 10.63 21.71 20.34HDFC Index-Sensex Plus(G) 205.31 10-Jul-02 56 5.02 0.00 3.34 83.85 13.67 23.70 27.11HDFC Index-Sensex(G) 145.65 10-Jul-02 62 6.34 -0.14 1.61 76.16 6.56 18.81 21.58UTI-SUNDER 550.58 11-Jul-03 2 6.56 1.06 3.42 73.22 11.98 21.82 26.56
Equity - Nifty Linked IndexBirla SL Index(G) 52.16 17-Sep-02 17 6.50 0.61 2.60 72.17 11.11 20.19 24.49SBI Magnum Index(G) 44.61 16-Jan-02 16 6.53 0.73 2.74 72.71 8.56 19.01 19.98Nifty BeES 526.20 18-Dec-01 408 6.60 0.89 3.25 74.16 11.78 21.94 22.99Reliance Banking ETF 963.23 30-May-08 13 8.36 4.68 7.12 130.34 - - 37.50
Balanced - Equity OrientedKotak Balance 21.90 25-Nov-99 67 4.77 0.53 6.00 58.64 11.72 19.11 18.24Sundaram BNPP Balanced(G) 44.34 25-May-00 14 3.54 -2.26 3.50 71.51 12.59 16.72 16.31
Balanced - Debt-OrientedHDFC Children's Gift - Savings 20.47 2-Feb-01 60 2.72 3.11 7.41 25.44 12.10 9.33 8.14ICICI Pru Child Care Plan-Study Plan 26.59 6-Aug-01 31 2.32 2.54 6.93 29.54 10.40 12.03 11.96
Commodities - GoldGold BeES 1611.46 23-Feb-07 761 -2.06 -2.41 4.18 7.46 19.29 - 19.25Kotak GOLD ETF 1610.14 4-Jul-07 126 -2.06 -2.40 5.18 7.14 - - 25.38DSPBR World Gold-Reg(G) 14.12 23-Aug-07 880 1.73 -6.08 -2.29 15.03 - - 14.16Reliance Gold ETF 1566.29 1-Nov-07 261 -2.04 -2.40 4.18 7.22 - - 19.65UTI-Gold ETF(G) 1610.13 16-Mar-07 308 -2.06 -2.41 4.22 7.29 - - 19.35
Liquid FundsBirla SL Cash Mgr-Ret(G) 22.45 14-May-98 27 0.36 0.91 1.90 4.33 6.81 6.58 7.04Birla SL Cash Plus-Ret(G) 24.50 13-Jun-97 128 0.37 0.88 1.76 3.97 6.71 6.53 7.25Kotak Liquid(G) 17.85 6-Oct-00 26 0.32 0.84 1.70 3.86 6.43 6.19 6.30LICMF Liquid(G) 16.86 13-Mar-02 3415 0.35 0.99 2.20 4.90 7.41 7.14 6.70Magnum InstaCash-Cash(G) 20.44 19-May-99 1181 0.33 0.92 1.79 4.03 6.70 6.55 6.80Reliance Liquid-Cash(G) 15.01 4-Dec-01 11 0.26 0.67 1.32 2.31 4.64 5.09 5.00UTI-Money Mkt(G) 2571.39 23-Apr-97 245 0.33 0.90 1.85 4.44 6.89 6.69 7.57
Monthly Income PlansBirla SL MIP II-Savings 5(G) 16.52 30-Apr-04 657 0.71 1.08 2.58 11.54 12.35 9.77 8.85Birla SL MIP II-Wealth 25(G) 16.86 30-Apr-04 95 2.06 1.02 4.17 24.25 8.18 9.18 9.23Birla SL MIP(G) 24.87 10-Nov-00 0 1.64 1.24 4.06 15.76 9.34 8.78 10.19Birla SL Monthly Income(G) 34.12 14-Jul-99 194 0.89 1.21 3.78 18.96 10.71 10.34 12.13L&T MIP(G) 18.79 1-Aug-98 9 1.22 0.62 2.22 12.62 12.30 10.17 4.56DSPBR Savings Mgr-Agg(G) 18.31 20-May-04 76 0.78 0.13 3.90 18.92 9.82 10.87 10.86ICICI Pru Income Multiplier(G) 18.27 5-Mar-04 202 2.39 1.86 3.47 25.41 8.26 10.90 10.43Magnum Income Plus-Savings(G) 10.80 22-Oct-03 2 0.36 1.25 2.13 2.38 0.74 1.15 1.20UTI-MIS(G) 18.67 11-Oct-02 162 1.53 1.62 5.06 17.56 10.73 9.61 8.72
Returns as of 31st March, 2010

D e c e m b e r April 2010
Magnum
25
How ‘Aam Admi’ will benefit from increase in tax slabs?
Income Tax is one of the hottest topics in the current scenario as the Finance Minister Pranab Mukherjee further increased the tax slabs for individual tax payers in the Union Budget 2010-11. But how it will benefit the ‘Aam Admi’? - is the question of the hour, for which one should consider situations before and after increase in the tax slabs.
Tax liability is the amount calculated as per applicable tax rates on a person’s income during a financial year if his total earnings exceed set limit of exemption. Income tax is a key source of revenue for the government. Income Tax Act, 1961 governs all tax related issues in India.
Current Income Tax Slabs
Income Slabs Tax Rates
Individual & HUF below age of 65 years
Woman below age of 65 years
Individual above age of 65 years
Income upto Rs.1,60,000
Income upto Rs.1,90,000
Income upto Rs.2,40,000
NIL
Rs.1,60,001 to Rs.3,00,000
Rs.1,90,001 to Rs.3,00,000
Rs.2,40,001 to Rs.3,00,000
10%
Rs.3,00,001 to Rs.5,00,000
Rs.3,00,001 to Rs.5,00,000
Rs.3,00,001 to Rs.5,00,000
20%
Above Rs.5,00,000
Above Rs.5,00,000
Above Rs.5,00,000
30%
New Income Tax SlabsIncome Slabs Tax
Rates
Individual & HUF below age of 65 years
Woman below age of 65 years
Individual above age of 65 years
Income upto Rs.1,60,000
Income upto Rs.1,90,000
Income upto Rs.2,40,000
NIL
Rs.1,60,001 to Rs.5,00,000
Rs.1,90,001 to Rs.5,00,000
Rs.2,40,001 to Rs.5,00,000
10%
Rs.5,00,001 to Rs.8,00,000
Rs.5,00,001 to Rs.8,00,000
Rs.5,00,001 to Rs.8,00,000
20%
Above Rs.8,00,000
Above Rs.8,00,000
Above Rs.8,00,000
30%
Note: (1) Highlighted points in the second table shows the changes proposed in the income tax slabs by the FM in the FY11 budget.
(2) HUF-Hindu Undivided Family
Education Cess: An additional surcharge called as ‘Education Cess’ is levied at the rate of 2% on the amount of Income tax and surcharge (if any) in all cases shall be levied.
Secondary and Higher Cess (S&H Cess): An additional surcharge, called the ‘Secondary and Higher Education Cess on income- tax’ at the rate of 1% of income-tax and surcharge (not including the “Education Cess on Income-tax”) in all cases shall be levied.
Other Proposals
• Deduction of an additional amount of Rs 20,000 allowed, over and above the existing limit of Rs 1 lakh on tax savings, for investment in long-term infrastructure bonds as notified by the Central Government.
• Besides contributions to health insurance schemes which are currently allowed as a deduction under the Income-tax Act, contributions to the Central Government Health Scheme also allowed as a deduction under the same provision.
Now let us see what will be the impact of this on an individual’s income.
Taxable income (Rs)
Tax -before budget (Rs)
Tax after budget (Rs)
Saving (Rs)
2,00,000 4,120 4,120 0
5,00,000 55,620 35,020 20,600
10,00,000 2,10,120 1,58,620 51,500
If a person is earning a taxable income of Rs 2,00,000 then his tax liability without considering the benefit of Section 80C of the Income Tax 1961 will be;
Up to 160,000 - Nil
Rs 40,000 (200,000-160,000) - Tax at 10% = Rs 4,000
Education Cess - 2% of Rs 4,000 = Rs 80
S&H Cess - 1% of Rs 4,000 = Rs 40
Total tax liability = Rs 4,120/-
Consider second example, a person is earning a taxable income of Rs 500,000
Before budget Up to 160,000 - Nil
Rs 140,000 Tax @ 10% = Rs 14,000
Rs 200,000 Tax @ 20% = Rs 40,000
New tax slabs: beneficial or not

D e c e m b e r April 2010
Magnum
26
Education Cess @ 2% of Rs 54,000 = Rs 1,080
S&H Cess @ 1% of Rs 54,000 = Rs 540
Total tax liability = Rs 55,620/-
After budgetUp to 160,000 - Nil
Rs 340,000 Tax @ 10% = Rs 34,000
Education Cess @ 2% of Rs 34,000 = Rs 680
S&H Cess @ 1% of Total tax Rs 34,000 = Rs 340
Total tax liability = Rs 35,020/-
This indicates that increase in tax slab from Rs 300,000 to Rs 500,000 will benefit the individuals who are earning taxable income of above Rs 300,000.
If a person is earning a taxable income of Rs 10,00,000 then his tax liability will be;
Before budgetUp to 160,000 - Nil
Rs 140,000 Tax @ 10% = Rs 14,000
Rs 200,000 Tax @ 20% = 40,000
Rs 500,000 Tax @ 30% = Rs 150,000
Education Cess @ 2% of Rs 204,000 = Rs 4,080
S&H Cess @ 1% of Rs 204,000 = Rs 2,040
Total tax liability = Rs 210,120/-
After budgetUp to 160,000 - Nil
Rs 340,000 Tax @ 10% = Rs 34,000
Rs 300,000 Tax @ 20% = 60,000
Rs 200,000 Tax @ 30% = Rs 60,000
Education Cess @ 2% of Rs 154,000 = Rs 3,080
S&H Cess @ 1% of Total tax Rs 154,000 = Rs 1,540
Total tax liability = Rs 158,620/-
Increase in tax slabs is going to benefit the individuals with income above Rs 500,000 as well. As per current rates an income tax assessee would have paid tax of Rs 210,120 on a taxable income of Rs 10,00,0000 while as per new tax slabs he will be required to pay tax of Rs 158,620. A handsome saving of Rs 51,500 on tax outgo.
Impact on woman assessees
Taxable income (Rs)
Tax -before budget (Rs)
Tax after budget (Rs)
Saving (Rs)
200000 1030 1030 0
500000 52530 31930 20600
1000000 207030 155530 51500
If a woman is earning a taxable income of Rs 2,00,000 then her tax liability without considering the benefit of Section 80C of the Income Tax 1961 will be;
Up to 190,000 - Nil
Rs 10,000 (200,000-190,000) - Tax at 10% = Rs 1,000
Education Cess - 2% of Rs 1,000 = Rs 20
S&H Cess - 1% of Rs 1,000 = Rs 10
Total tax liability = Rs 1,030/-
Consider second example, a woman is earning a taxable income of Rs 500,000
Before budget Up to 190,000 - Nil
Rs 110,000 Tax @ 10% = Rs 11,000
Rs 200,000 Tax @ 20% = Rs 40,000
Education Cess @ 2% of Rs 51,000 = Rs 1,020
S&H Cess @ 1% of Rs 51,000 = Rs 510
Total tax liability = Rs 52,530/-
After budgetUp to 190,000 - Nil
Rs 310,000 Tax @ 10% = Rs 31,000
Education Cess @ 2% of Rs 31,000 = Rs 620
S&H Cess @ 1% of Total tax Rs 31,000 = Rs 310
Total tax liability = Rs 31,930/-
Saving of Rs 20,600/-.
If a woman is earning a taxable income of Rs 10,00,000 then her tax liability will be;
Before budgetUp to 190,000 - Nil
Rs 110,000 Tax @ 10% = Rs 11,000
Rs 200,000 Tax @ 20% = Rs 40,000
New tax slabs: beneficial or not

D e c e m b e r April 2010
Magnum
27
Rs 500,000 Tax @ 30% = Rs 150,000
Education Cess @ 2% of Rs 201,000 = Rs 4,020
S&H Cess @ 1% of Rs 201,000 = Rs 2,010
Total tax liability = Rs 207,030/-
After budget Up to 190,000 - Nil
Rs 310,000 Tax @ 10% = Rs 31,000
Rs 300,000 Tax @ 20% = 60,000
Rs 200,000 Tax @ 30% = Rs 60,000
Education Cess @ 2% of Rs 151,000 = Rs 3,020
S&H Cess @ 1% of Total tax Rs 151,000 = Rs 1,510
Total tax liability = Rs 155,530/-
Saving of Rs 51,500/-.
Shifting focus to senior citizens. Let us now consider how they will be benefited from new tax slabs.
Taxable income (Rs)
Tax -before budget (Rs)
Tax after budget (Rs)
Saving (Rs)
200000 0 0 0
500000 47380 26780 20600
1000000 201880 150380 51500
First example
As income of senior citizens is exempted up to Rs 240,000, there will be no tax liability in the first scenario.
Second example
Before budgetUp to 240,000 - Nil
Rs 60,000 Tax @ 10% = Rs 6,000
Rs 200,000 Tax @ 20% = Rs 40,000
Education Cess @ 2% of Rs 46,000 = Rs 920
S&H Cess @ 1% of Rs 46,000 = Rs 460
Total tax liability = Rs 47,380/-
After budgetUp to 240,000 - Nil
Rs 260,000 Tax @ 10% = Rs 26,000
Education Cess @ 2% of Rs 26,000 = Rs 520
S&H Cess @ 1% of Total tax Rs 26,000 = Rs 260
Total tax liability = Rs 26,780/-
Saving of Rs 20,600/-.
Third Example
Before budget Up to 240,000 - Nil
Rs 60,000 Tax @ 10% = Rs 6,000
Rs 200,000 Tax @ 20% = Rs 40,000
Rs 500,000 Tax @ 30% = Rs 150,000
Education Cess @ 2% of Rs 196,000 = Rs 3,920
S&H Cess @ 1% of Rs 196,000 = Rs 1,960
Total tax liability = Rs 201,880/-
After budgetUp to 240,000 - Nil
Rs 260,000 Tax @ 10% = Rs 26,000
Rs 300,000 Tax @ 20% = 60,000
Rs 200,000 Tax @ 30% = Rs 60,000
Education Cess @ 2% of Rs 146,000 = Rs 2,920
S&H Cess @ 1% of Total tax Rs 146,000 = Rs 1,460
Total tax liability = Rs 150,380/-
Saving of Rs 51,500/-.
As can be seen from the above examples, the new tax slabs are going to benefit tax payers in a big-way. They will have more disposable income in their hands to spend on different things. The saving in tax is expected to boost spending and ease pressure from a vast Indian middle-class which is fighting double-digit food inflation from past couple of months. Meanwhile, widening of the tax brackets may result in a revenue loss of around Rs 26,000 crore for the Centre in a year. Though the FM has hedged the same with hike in indirect tax rates, it needs to be seen whether the government can keep its tall promises going forward. The government had set the direct tax collection target of Rs 4 lakh crore for FY10 while they may end up with total collections of Rs 3.70 lakh crore, a short fall of Rs 30,000 crore.
Overall new tax slabs will definitely bring sigh of relief for ‘aam admi’ in FY11. So start preparing a list of things you will love to buy with the extra savings and also begin tax planning early to avoid last minute rush.
New tax slabs: beneficial or not

D e c e m b e r April 2010
Magnum
28
Money market dynamics in IndiaFinancial markets are basically divided into two; viz. capital markets and money markets. While the need for long-term financing is met by the capital markets, money market deals with lending and borrowing of short term funds. In the post-1991 era, India has witnessed tremendous growth of the Indian money markets. Short-term funding needs of important sectors like industry, services and agriculture have been ably met by banking and other financial institutions. The RBI (Reserve Bank of India) is the regulatory body for the Indian money market. The decision of the government to allow private sector banks to operate has provided much needed healthy competition in the money markets, resulting in fair amount of improvement in their functioning.
Money market operations help banks in balancing any temporary mismatch of funds with them. The money market provides avenues to the players in the market to strike equilibrium between the surplus funds with the lenders and the requirement of funds for the borrowers. Money markets has emerged as one of the important policy tools with the government and the RBI to control the monetary policy, money supply, credit creation & control, inflation rate and overall economic policy of the country.
Weighted averages in the money marketsThe weighted average rates in the call-money market remained the highest during most part of this month, hovering around 3.50%. On some days in the second-half of March, call rates flared up to unusually high levels. On March 23, this year, call rates shoot up to 8.5% as some banks faced cash shortages ahead of a local holiday and cash outflows relating to the financial year ending. However, call rates are expected to normalize in the medium term. On the other hand, CBLO (Collateralised Borrowing and Lending Obligations) rates remained volatile during the said period. It is noteworthy that CBLO is a product of the Clearing Corporation of India Ltd (CCIL) through which bank and non-bank entities can lend or borrow funds to each other through the Negotiated Dealing System (NDS). Financial entities such as mutual funds, primary dealers, banks and insurance companies are participants in the CBLO market.
During the third quarter review of the monetary policy, the RBI had announced a 75 basis points hike in the CRR (Cash Reserve Ratio) keeping in view of the surging general price levels in the economy. Moreover, RBI again hiked the repo and reverse repo rates by 25 basis points
each after witnessing the February month inflation, which stood at 9.89%, much higher than its projected level of 8.5% for the current financial year. In addition, industrial output also expanded in double-digits for the fourth consecutive month and stood at 16.7% in January. The central bank is likely to tighten the liquidity scenario further by resorting to rate hikes in its policy rates during its scheduled monetary policy review on April 20.
Daily volumes in money marketsIn normal circumstances, the CBLO market has been the leading volume generator, which was no different for the month of March. The average volume on the CBLO market was also higher than that either in the call money or repo markets. These huge volumes that are generated in the CBLO market can be attributed to the active participation of mutual fund and insurance houses. The downward spikes in the graph can be attributed to the fact that repo markets remain closed on Saturdays and the rest two markets, call money and CBLO, also see relatively illiquid market on the last day of the week.
Money and Forex MarketsThe forex market is also closely linked with the Indian money markets through the process of covered interest arbitrage in which the forward premium acts as a
Money Market
Daily weighted average rates
00.5
11.5
22.5
33.5
44.5
24-F
eb-1
025
-Feb
-10
26-F
eb-1
02-
Mar
-10
3-M
ar-1
04-
Mar
-10
5-M
ar-1
06-
Mar
-10
8-M
ar-1
09-
Mar
-10
10-M
ar-1
011
-Mar
-10
12-M
ar-1
013
-Mar
-10
15-M
ar-1
017
-Mar
-10
18-M
ar-1
019
-Mar
-10
20-M
ar-1
022
-Mar
-10
23-M
ar-1
025
-Mar
-10
26-M
ar-1
027
-Mar
-10
Call Money Repo CBLO
Daily Volumes (Rs Crore)
0100002000030000400005000060000
24-F
eb-1
025
-Feb
-10
26-F
eb-1
02-
Mar
-10
3-M
ar-1
04-
Mar
-10
5-M
ar-1
06-
Mar
-10
8-M
ar-1
09-
Mar
-10
10-M
ar-1
011
-Mar
-10
12-M
ar-1
013
-Mar
-10
15-M
ar-1
017
-Mar
-10
18-M
ar-1
019
-Mar
-10
20-M
ar-1
022
-Mar
-10
23-M
ar-1
025
-Mar
-10
26-M
ar-1
027
-Mar
-10
0
20000
40000
60000
80000
100000
Call Money Repo CBLO (RHS)

D e c e m b e r April 2010
Magnum
29
bridge between the domestic and foreign interest rates. Fluctuation of the value of forex reserves in RBI’s forex kitty has been mainly caused due to the revaluation of non-dollar denominated foreign currency assets. India’s forex reserves have been hovering around $280 billion for the last six months. During the last one year, RBI’s forex kitty has been boosted by $30 billion reflecting the pace and depth of economic recovery after the global economic slowdown. Higher interest rates in the Indian money markets have attracted more overseas investors and as a result of which forex reserves have swollen up significantly over the years and this trend is likely to continue at least in the medium-term.
Benchmark Bond YieldsThe benchmark 6.35%-2020 bond yield was seen mostly fluctuating in tune with the US Treasury yields during the month of March this year. While the bond yields fluctuated in a tight range for the first-half of the month, the yields slipped in the second-half of the month. Bond yields had touched 8.02% on March 9, the highest since October 2008. Keeping in view the imminent policy rate hikes by RBI, bond yields are seen in the range of 8-8.5% in the coming months.
Government’s borrowing programme for H1 in FY11The government has announced the modus operandi of its borrowing programme for the first-half of 2010-11. It will sell 63% of its bond issuance (Rs 2.87 trillion) for the April-September period of FY11. As per finance ministry sources, the issuances would be a mix of instruments with maturities of 5-9 years, long-term bonds with tenors of 15 years and above, and floating rate bonds. The government will borrow more in a particular week or month if redemptions are more for that period.
The recent announcements are in tune with the hitherto observed trend, i.e. a front-loaded borrowing to allow space for private borrowing in the second-half of the financial year when the economy is expected to gain momentum. With this, the second-half borrowing is expected to be aggressive.
During his budget speech, the finance minister had announced that India’s gross borrowing in FY11 will be Rs 4.57 trillion, to fund the projected fiscal deficit of 5.5% during 2010-11.
Bottom-lineMoney markets play a major role in controlling liquidity in banking and non-banking institutions in the country. Higher rates in the money markets reduce the liquidity in the economy and can have a multiplier effect of reducing the economic activity in the system. On the other hand, relatively lesser rates increase the liquidity in the market and bring down the cost of capital substantially. Moreover, increase in liquidity also enhances investment activity and thereby scale up the total output and employment in the economy. This function also assists the RBI to control the overall money supply in the economy.
The Indian money markets could witness a tricky situation in the aftermath of RBI’s monetary policy review on April 20. Keeping in view the robust expansion of industrial output and surging headline inflation, RBI is most likely to hike policy rates by 25-50 basis points. During the second-half of March, banks are likely to face a liquidity crunch on the back of huge tax outflows. But at the same time, heavy government spending is likely to compensate for the same. The unusual spikes in call rates are likely to be normalized in the near-term and the overnight borrowing rates may settle down in the range of repo and reverse repo rates.
Money Market
6.35%-2020 bond yield and volume
020
4060
80100
120140
2-M
ar-
10
3-M
ar-
10
4-M
ar-
10
5-M
ar-
10
8-M
ar-
10
9-M
ar-
10
10-M
ar-
10
11-M
ar-
10
12-M
ar-
10
15-M
ar-
10
17-M
ar-
10
18-M
ar-
10
19-M
ar-
10
22-M
ar-
10
23-M
ar-
10
25-M
ar-
10
26-M
ar-
10
(Rs.
Bill
ion)
7.77.75
7.87.85
7.97.95
88.05
Volume 6.35%-2020 bond yield (RHS)
Forex Reserves
240000
250000
260000
270000
280000
290000
300000
310000
320000
4-A
pr-
08
4-J
un-0
8
4-A
ug-0
8
4-O
ct-
08
4-D
ec-0
8
4-F
eb-0
9
4-A
pr-
09
4-J
un-0
9
4-A
ug-0
9
4-O
ct-
09
4-D
ec-0
9
4-F
eb-1
0
(Mill
ion U
S $
)
(%)

D e c e m b e r April 2010
Magnum
30
China standing tall in yuan turf war with USThe recent global economic slowdown has opened several possibilities in the international trade arena. With almost all major economies on course to the path of economic recovery, each nation is seeking a pound of flesh from the other to showcase its supremacy. While the fear of double-dip recession is still haunting the developed countries including the US, developing countries are marching ahead with robust economic growth, led by China.
China and the US are once again at loggerheads regarding the yuan appreciation. Keeping the renminbi pegged to the dollar at an artificially low level, as claimed by Americans, China has been able to maintain its exports cheap and imports expensive. China revalued the yuan by 2.1% vis-à-vis the dollar in July 2005 and then let it climb nearly another 19% before calling a halt in July 2008 to help its exporters in the wake of the global financial crisis. Since 2008, calls for yuan appreciation have been increasing in number and intensity.
With the contentious issue of yuan appreciation failing to die down, China has taken the battle with the US to the next round, as it is not budging from its stand this time around. China is showcasing its shrinking trade surplus as a reason for its pegged currency. The administration of US President Barack Obama is threatening to label China a ‘currency manipulator’ next month and US lawmakers are warning of trade sanctions, unless China lets the yuan resume its ascent. Obama has asserted that a more market-oriented exchange rate will make an essential contribution to rebalancing the global economy.
Increasing US pressure on China has prompted the latter to term it as a form of ‘trade protectionism’. China has retorted that currency is a sovereign issue and should not be an issue to be discussed between two countries.
Economics of keeping currencies at artificially low levelsAn undervalued currency makes exports more competitive as every dollar earned fetches more in local currency. In the long-term, currencies of fast growing economies will generally tend to appreciate. In such cases, countries try to keep their currencies artificially at low levels in order to maintain their export competitiveness in international trade, since a currency appreciation would lead to less inflow of capital. With the onset of the global economic slump, this tendency has increased among many countries.
China’s persistent toughness holds tricky for USAlthough the latest figures show strong export growth and higher-than-expected inflation, Beijing is hardly showing any sign of buckling under the intense pressure from the US to appreciate the yuan. Head of China’s central bank, Zhou Xiaochuan had recently baffled Chinese policy makers by saying that keeping the yuan stable against the dollar was a ‘part of our package of policies for dealing with the global financial crisis’ from which China would exit ‘sooner or later’. However, he had not set any time-frame for such exit and also asserted that China would be cautious in this regard.
China’s trade balances have been on a declining spree since October 2009 and it may report a trade deficit of more than $8 billion in March, reflecting the faster growth of imports than exports. Exports accounted for a quarter of gross domestic product in 2009, down from a third in 2008.
Impact on US-China trade relationsUS exports to China were about $70 billion in 2009, unchanged from that of 2008. In a global economic slowdown, China was the third-biggest market for US exporters and it remains the fastest-growing one.
Yuan Appreciation
China's Balance of Trade
05
1015202530354045
Jan-0
8
Mar-0
8
May-0
8
Jul-0
8
Sep-0
8
Nov-0
8
Jan-0
9
Mar-0
9
May-0
9
Jul-0
9
Sep-0
9
Nov-0
9
Jan-1
0
(Billi
on $)
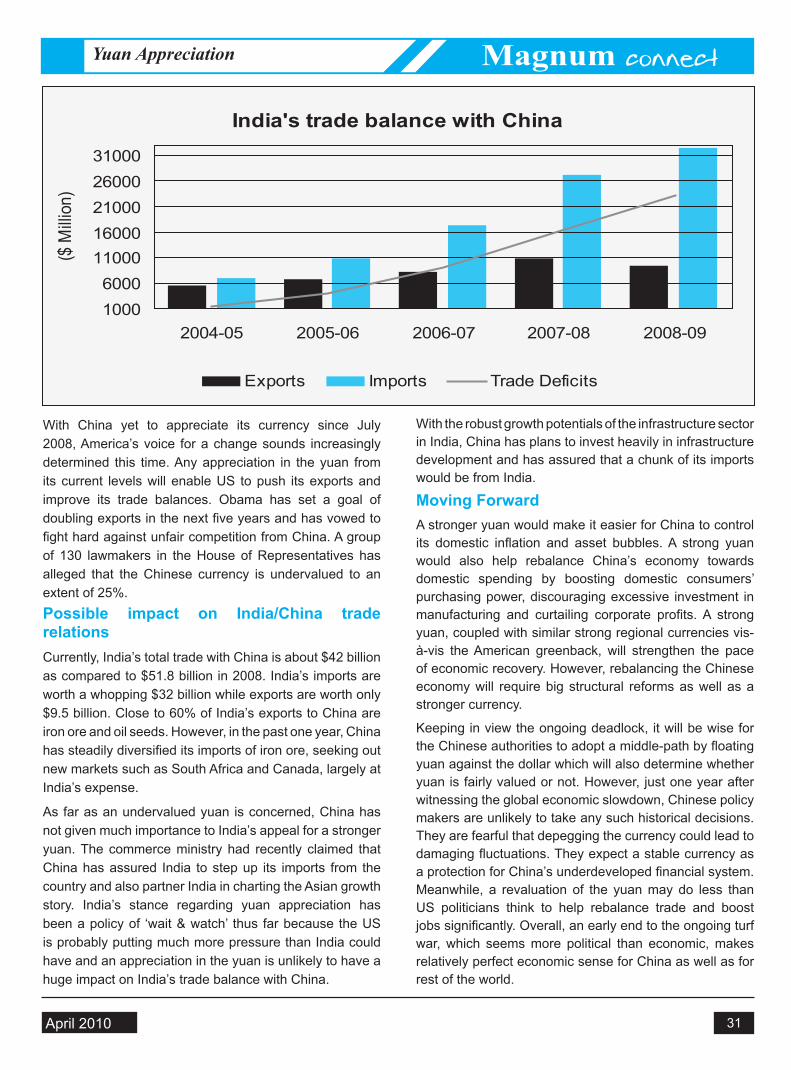
D e c e m b e r April 2010
Magnum
31
With China yet to appreciate its currency since July 2008, America’s voice for a change sounds increasingly determined this time. Any appreciation in the yuan from its current levels will enable US to push its exports and improve its trade balances. Obama has set a goal of doubling exports in the next five years and has vowed to fight hard against unfair competition from China. A group of 130 lawmakers in the House of Representatives has alleged that the Chinese currency is undervalued to an extent of 25%.Possible impact on India/China trade relationsCurrently, India’s total trade with China is about $42 billion as compared to $51.8 billion in 2008. India’s imports are worth a whopping $32 billion while exports are worth only $9.5 billion. Close to 60% of India’s exports to China are iron ore and oil seeds. However, in the past one year, China has steadily diversified its imports of iron ore, seeking out new markets such as South Africa and Canada, largely at India’s expense.
As far as an undervalued yuan is concerned, China has not given much importance to India’s appeal for a stronger yuan. The commerce ministry had recently claimed that China has assured India to step up its imports from the country and also partner India in charting the Asian growth story. India’s stance regarding yuan appreciation has been a policy of ‘wait & watch’ thus far because the US is probably putting much more pressure than India could have and an appreciation in the yuan is unlikely to have a huge impact on India’s trade balance with China.
With the robust growth potentials of the infrastructure sector in India, China has plans to invest heavily in infrastructure development and has assured that a chunk of its imports would be from India.
Moving ForwardA stronger yuan would make it easier for China to control its domestic inflation and asset bubbles. A strong yuan would also help rebalance China’s economy towards domestic spending by boosting domestic consumers’ purchasing power, discouraging excessive investment in manufacturing and curtailing corporate profits. A strong yuan, coupled with similar strong regional currencies vis-à-vis the American greenback, will strengthen the pace of economic recovery. However, rebalancing the Chinese economy will require big structural reforms as well as a stronger currency.
Keeping in view the ongoing deadlock, it will be wise for the Chinese authorities to adopt a middle-path by floating yuan against the dollar which will also determine whether yuan is fairly valued or not. However, just one year after witnessing the global economic slowdown, Chinese policy makers are unlikely to take any such historical decisions. They are fearful that depegging the currency could lead to damaging fluctuations. They expect a stable currency as a protection for China’s underdeveloped financial system. Meanwhile, a revaluation of the yuan may do less than US politicians think to help rebalance trade and boost jobs significantly. Overall, an early end to the ongoing turf war, which seems more political than economic, makes relatively perfect economic sense for China as well as for rest of the world.
Yuan Appreciation
India's trade balance with China
10006000
1100016000210002600031000
2004-05 2005-06 2006-07 2007-08 2008-09
($ M
illion
)
Exports Imports Trade Deficits

D e c e m b e r April 2010
Magnum
32
Commodity Watch
Iron ore prices may rise further Iron ore miners are enjoying the highest pricing power that they have seen anywhere in recent history. Spot prices for the 63.5% grade iron ore fines have in recent weeks risen to their highest point since the start of the global financial crisis, and there is still potential for further increase.
The latest boost has come from a deal by Vale of Brazil which not only saw sharp increase in contract price but also witnessed the scrapping of 40 year old annual review system in favour of quarterly contracts. Vale has reached agreements with Japanese steelmakers, such as Sumitomo Metal and Nippon Steel, to sell iron ore for the April-June quarter at $105 per tonne, which is nearly 90% above the last year’s contract prices.
The BHP has announced that it was no longer negotiating annual iron ore contracts with a significant number of Asian customers and will instead be going in setting prices for short-term basis, achieving a long held desire to sell ore at prices closer to spot prices rather than via annual fixed-price contracts.
What these developments suggest is that the iron ore market is changing swiftly after remaining subtle for most of the second half of twentieth century. Miners are expecting demand to remain strong amidst fast changing fundamentals, and prices therefore will continue witnessing upside pressures.
The price of the benchmark 63.5% fines has reached around $157 a tonne at Chinese ports and is likely to further rise to $170 a tonne in a month or so. Indian companies, which export nearly 100 million tonne iron ore annually, mostly to China, will gain substantially by the rising prices.
Another change that will help Indian shippers is that pricing will be henceforth on a landed price equivalent basis. This means the miner will pay the shipping costs to its customers, and India being closer to China will help exporters save on shipment costs and hence further raise their margins.
Natural rubber prices likely to remain strongNatural rubber prices have been increasing in India for last several months and are already at record highs. However, industry insiders are saying that strong demand, weather scenario and international demand-supply equation may push it further high.
Rubber prices in India slumped in second half of FY09, much in line with the rest of the world, as the global commodity rally collapsed and the world economy came in the grip of
economic downturn. However, prices started strengthening in India early in the FY10, much ahead of the global recovery, as demand from auto industry started improving and domestic supply scenario remained tight.
In the early months of FY10, prices in India ran ahead of global prices which remained subdued due to uncertain economic outlook. However, global prices soon rallied too as it became clear that demand-supply equation will continue favouring producers for a while.
In the last few months, rubber has been reaching record highs in India as the demand-supply gap increased. While rubber production during the first 11 months of the current fiscal (Apr- Feb 2010) has declined by 4.5% on annual basis, consumption of natural rubber has increased by 7% over the same period.
Total consumption of natural rubber in Apr- Feb 2010 period has increased to 853,065 tonne compared with 797,520 tonnes during the same period last fiscal. Within the month of February 2010, consumption increased by 8.3% to 77,500 tonne compared with same month last year as demand from automobile companies increased riding on a 35% jump in sales.
Going forward, while the demand is likely to remain strong, supply side is unlikely to improve quickly, indicating that rubber prices will remain bullish and may touch new highs in next few months. Supplies typically remain tighter relatively in summers and global stocks are already lower on account of decline in production in 2009.
According to the Association of Natural Rubber Producing Countries (ANRPC), total production of natural rubber in 2009 was down nearly 4.5% as output in four largest rubber producing countries including India went down. Although the ANRPC expects global production to be better in 2010, compared with 2009, the impact of such improvement on prices may not be felt before late into the summer season due to lower stocks presently.
Government may further tighten sugar stock limitIn a move aimed at bringing the price of sugar down, the government is contemplating to reduce further the stock limit of sugar for bulk users. The government had earlier imposed a sugar stock limit of 15 days on bulk users which was later tightened further to just 10 days.
Stock limit means that bulk users, such as soft drink and ice cream makers, cannot held the stocks more than what is needed to meet the requirements of time period specified

D e c e m b e r April 2010
Magnum
33
under stock limit. The government imposed stock limit after it felt that industrial users were hoarding sugar anticipating a rise in prices going forward.
It is understood that the Parliamentary Standing Committee on Finance had floated the suggestion that after assessing the overall demand-supply scenario, the government may further cut the stock limit to seven or five days which will help cut the retail prices by boosting supplies.
Another suggestion doing the rounds in food ministry is that industrial users be asked to procure all their requirement of the sweetener through imports. Bulk consumers account for about 60% of the country’s total sugar demand of around 23 million tonne. However, in case all the demand from bulk users is forced to shift to imports, prices can crash significantly, which may again distort the sugar supply scenario two year down the road.
As such, the government will be looking to rather use milder ways like keeping the stock limit low in order to keep plenty of supplies in retail markets. Already, as a result of the measures taken by the government and also on account of improved yields in Maharashtra and Uttar Pradesh, the two largest sugar producing states, prices have come down from Rs 45-47 per kg to around Rs 35 per kg.
However, this has yielded a new set of problems as most millers now contend that their sale price has dropped below the cost of production and large amounts of imports which were earlier planned are either being cancelled or being renegotiated. As a result, the government feels that millers will reduce imports which can lead to once again lower supply in domestic market and therefore bulk users might be forced to import part of the sugar requirement directly by further cutting stock limit.
Government’s rice procurement touches 242.7 lakh tonneNotwithstanding a failed monsoon last season, the government agencies have so far procured a total of 242.79 lakh tonne of rice in the current marketing season. As on 16th March 2010, total paddy procurement stood at 242.79 lakh tonne, down 2% compared with the total procurement on this date last year at 248.69 lakh tonne.
However, given that the monsoon rains were 20% deficient in the June-September 09 season and 50% of the cultivation area was declared to be facing drought like scenario, the procurement is reasonably strong. Also, there is the impact of high base effect as the previous year witnessed a record production and procurement of food grains.
The procurement process is still on and the government agencies are expecting that by the end of the season, the difference between current year’s procurement will be less than 2% of that from the previous year.
Looking at the state wise distribution, the largest contribution to the government purchase came from Punjab which contributed 92.68 lakh tonne followed by Andhra Pradesh at 33.35 lakh tonne, Chhattisgarh at 29.97 lakh tonne, Uttar Pradesh at 24.32 lakh tonne and Haryana at 18.13 lakh tonne.
Government not to allow export of wheatDespite a record wheat stockpiles and expected higher production this year, Food and Agriculture Minister Sharad Pawar on Thursday ruled out exporting surplus wheat lying in the warehouses. Indian government first banned the wheat export in 2007 and that has continued broadly till date.
Pawar said that rather than going for exports of the food grains, the governments will look at raising the allocation for above the poverty line families. Below poverty line families (BPL) are already entitled to food grains through the public distribution system. However, considering the soaring food inflation, the government has been looking to raise allocation for the identified above poverty line population as well.
The government was expected to take the call on exporting food grains in wake of rising stocks in a meeting of the empowered group of ministers headed by the finance minister Pranab Mukherjee, but the issue was postponed. “The issue (of exporting food grains) was to be taken at the EGoM meeting today, but it has been postponed,’ said Pawar.
The Indian government is sitting on huge stock of food grains, but exports of most commodities were banned late last year in wake of the poor monsoon and apprehensions of sharp decline in the summer crop harvest. However, later assessments have suggested that decline will be relatively moderate and the key grain growing region of northwest India, which also happened to be the worst affected from monsoon, will manage a near status quo in summer crop output.
This has resulted in some quarters calling for export of food grains where ever the stocks are substantially above the requisite buffer levels, as it would raise resources for procuring more food grains at home. However, such a decision could prove to be politically difficult, given the high food inflation. As such, the government is unlikely to allow export of wheat and probably other food grains too.
Commodity Watch

D e c e m b e r April 2010
Magnum
34
Reliance Life Highest NAV Guarantee PlanReliance Life Highest NAV Guarantee Plan is a unit linked insurance plan, which enables the policy-holder to enjoy good returns. It not only provides insurance protection but also introduces certainty to the investments. The objective of the fund is to offer guarantee of maturity value, in an equity oriented fund, at the highest NAV achieved during the tenure of the policy.
Benefits of the plan:It guarantees to get the highest NAV per unit ever achieved during the policy term at maturity
Liquidity through partial withdrawals
Flexibility to choose from - Regular & Single premium payment options
Flexibility to pay top-ups
A host of optional rider benefits to enhance protection cover
How does it works:The premiums paid, after deductions of Premium Allocation Charges are invested into the Highest NAV Guarantee Fund. The units are allocated depending on the price of units for the fund. The Mortality Charges for the sum assured (depending on the age at entry) and Policy Administration Charges are deducted through cancellation of units whereas the Fund Management Charge and Guarantee Charge is priced in the unit value. This plan offers a guarantee on maturity - equal to the number of units on date of maturity multiplied by the highest NAV during the policy term.
The objective of protecting the highest NAV shall be achieved by initially investing the entire corpus in equities and dynamically shifting between equities and fixed income securities depending on equity market movements. The allocation between equity and debt will be dynamically and continuously managed depending upon the prevalent market conditions, hence maintain the highest NAV level during that entire policy period.
Various Rider options, available under the plan1. Reliance New Major Surgical Benefit Rider: Provides
lump sum amount to cover surgical expenses from a list of 33 surgeries including Open Heart surgery, Kidney Transplant, Cornea transplantation, Transplant of Lungs and many more.
2. Reliance New Critical Conditions (25) Rider: Provides lump sum amount to take care of 25 critical conditions including Cancer, Heart Attack, Paralysis, Major Organ
transplant and many more.
3. Reliance Term Life Insurance Benefit Rider: Provides additional death benefit depending on the sum assured selected under the rider.
4. Reliance Accidental Death and Total and Permanent Disablement Rider: Provide additional death/disability benefit if the death/disability occurs as a result of an accident. Also, the Waiver of Premium benefit under the rider continues the plan in case of disability.
Basic Plan Minimum MaximumAge at Entry 30 days 65 years last birthdayAge at
Maturity
10 years last
birthday
75 years last birthday
Policy Term Fixed term of 10 yearsPremium
Paying Term
Regular Premium-Premium paying term EQUAL to Policy term
Minimum
Premium
(Regular)
Rs. 20,000/- under yearly mode,
Rs.10,000/- under half-yearly mode,
Rs. 5,000/- under quarterly mode and
Rs. 2,000/- under monthly mode.Minimum
Premium (Single)
Rs.30,000/-
Sum Assured limits under the plan:
a) Minimum Sum Assured: For Regular premium payment option, the minimum sum assured is 5 times of the Annualised premium.
For Single premium payment option, the minimum sum assured is 110% of the Single Premium amount.
b) Maximum Sum Assured: The maximum sum assured for Regular premium payment option depends on age at entry.
Age at entry (years-last birthday)
Maximum Sum Assured
30 days to 40 30 times of Annualised Premium41 to 45 20 times of Annualised Premium46 to 50 15 times of Annualised Premium51 to 55 10 times of Annualised Premium56 and above 5 times of Annualised Premium
The Maximum Sum Assured for Single premium payment option is stated below:
Age at entry (years-last birthday)
Maximum Sum Assured as multiples of Single Premium
30 days to 45 6 times of Single Premium46 and above 2 times of Single Premium
Life Insurance

D e c e m b e r April 2010
Magnum
35
General Insurance
Reliance Travel Care Insurance Policy for Students is a unique policy that helps student who are planning to study abroad with health insurance cover that meets the norms of the university as these are one of the necessary norms of the university .This policy offers a plan especially designed for student life abroad .Its prepares one to face any unforeseen circumstances.Eligibility:-The main eligibility criteria for this policy is that the people pursuing academic courses abroad should have a minimum age of 16 years and a maximum age of 35 years.Advantages of this Plan:-• Reliance Travel Care gives you protection to meet
the requirements of the University of One’s Choice. Students travelling to following International Universities have been insured by Reliance General Insurance.
• Policy tenure can coincide with the course duration up to 2 years
• Automatic extensions of Policy in case of medical emergency and evacuation (up to 30 days) and delay of common carrier (up to 7 days) beyond policy expiry.
• It has no Medical check-ups convenience.
• 24 Hour Emergency Cashless Services offered through Emergency.
• For students abroad the company also provides cover for a Bail Bond that pays the bail amount on behalf of the student, to the appropriate court/authority in case of a bail able offence.
• The policy will reimburse of the current course semester fee, if education abroad is interrupted on account of a medical condition.
• It also will cover the reimbursement of tuition fees, in case of injury resulting in death of the insured’s sponsor who pays the tuition fees to the institution abroad on behalf of the insured.
The following Add-on Benefits are available for Standard, Silver, Gold and Platinum plans:The policy covers the following:-1) Medical Expenses: - The plan will pay for in-patient
and out-patient hospitalization. It provides a daily allowance if hospitalization exceeds 2 days and covers dental expenses for acute anesthetic dental treatment caused by injury.
The plan also compensates one for emergency evacuation to India and covers the cost of repatriation of mortal remains.
2) Personal Accident: - In case of an accident, the policy provides compensation for death or permanent disability.
3) Accidental Death and Dismemberment-Common Carrier: - The policy provides compensation for death or permanent disability due to an accident on any flight, ship or other common carrier.
4) Personal Possession Contingencies:- This policy provides coverage against loss of passport by reimbursing the cost of obtaining a fresh or duplicate passport. In case of total loss of baggage by the common carrier, it provides compensation for the same.
Coverage Sum Insured (in USD) Deductibles
Treatment of Mental andNervous Disorders includingAlcohol and Drug Dependency
1000 Nil
Inpatient Hospitalization expensesrelated to Pregnancy/Child birth (After a waiting period of 10 months)
500 Nil
Medical Expenses for Intercollegiate sports injuries
Covered under the Medical Expensesincluding Transportation and Repatriation Benefit
Cancer Screening andMammographic Examinations
2500 Nil
Child Care Benefits 100 per day for a maximum of 10 days NilAdditional add on benefitsApplicable on a case-to-case basis and subject to specific approvalChiropractic Treatment 1000 NilPhysiotherapy 500 NilSkilled Nursing Facility 500 Nil

D e c e m b e r April 2010
Magnum
36
Plan Details:-Reliance Travel Care Insurance Policy
For StudentsCoverage Basic
(in USD)Standard(in USD)
Silver(in USD)
Gold(in USD)
Platinum(in USD)
Deductables(in USD)
Medical Expenses including
Transportation & Evacuation50,000 100,000 250,000 500,000 50
Dental Treatment 500 500 500 500 50Loss of Passport 100 100 100 200 200 25Total Loss of Checked baggage(per baggage maximum 50% andper item in baggage max 10%)
1000 1000 1000 1000 1000 100
Personal Accident 25,000 25,000 25,000 25,000 25,000 NilAccidental Death &Dismemberment- Common Carrier
2,500 2,500 2,500 2,500 Nil
Personal Liability 100000 100000 100000 150000 150000 200Study Interruption 1000 500 1000 5000 5000 50Bail Bond 10000 10000 10000 10000 10000 NilSponsor Protection 10000 10000 10000 10000 10000 Nil2 way Compassionate visit 7500 7500 7500 7500 7500 Nil
Exclusions:-Some of the major exclusions under the Policy for which the claim will not be valid for the insured are:-
• Travelling against the advice of a physician
• Receiving or are on a waiting list for specified medical treatment
• Travelling for the purpose of availing treatment
• Has received a terminal prognosis for a medical condition
General Insurance